Interactive Graphs from the SAS® System - Lex Jansen · 3 You can specify the GOPTION statement...
10
1 ABSTRACT An interactive graph is a dynamic graph interface that allows viewers interaction. The SAS System provides the following interactive features: By an ActiveX control – (pop-up data tips, drill-down links, and interactive menus) By a Java applet – (pop-up data tips, drill-down links, and interactive menus) By a Metaview applet – (data tips, drill-down links, or some interactivity such as zooming, panning, and slide shows). By Static Images – (data tips, and drill-down links, or animation). By Graphical Template Language(GTL) – (data tips). By ODS features of bookmarks and hyperlinks. This paper illustrates interactive graph features provided by the SAS System. The SAS version 9.1 products used in this paper are SAS BASE ® , SAS/STAT ® , and SAS/GRAPH ® on a PC Windows ® platform. INTRODUCTION The interactive graphs allow users interactions. The users interact directly with interactive graphs, mainly through the user interfaces. The user interfaces are controlled by using a mouse, buttons, and menus with buttons and keyboard. The interactive graphs provide the following desirable features: 1) It allows the graph reusable by interactive menus by user to change graphical properties, including modification of titles and axis. 2) The data tips feature allows user to pack extra relevant information on the graph. 3) It allows the links to subsequent graphs, maps or tables. 4) Zooming techniques are often used to change the object’s scale. Zoomable interfaces come in two types: a) Geometric zooming where the zoom scale is linear with the zoom multiplier, b) Semantic zooming where objects may change shape at different zoom levels. The semantic zooming is a distortion technique that displays a fisheye view to change object scale in a single view. By moving around and changing the scale, the user can get integrated context and focus of the large information space. 5) It produces slide show of static images. The SAS System implements several new technologies, such as Java applet and ActiveX control and others, to provide the following interactive features: By an ActiveX control – (pop-up data tips, drill-down links, and interactive menus) By a Java applet – (pop-up data tips, drill-down links, and interactive menus) By a Metaview applet – (data tips, drill-down links, or some interactivity such as zooming, panning, and slide shows). By Static Images – (data tips, and drill-down links, or animation). By Graphical Template Language (GTL) – (data tips). By ODS features of bookmarks and hyperlinks. The technologies used in the interactive features are: ActiveX control (Microsoft ® ) and Metaview Applet (Sun Microsystems ® ). Device SAS Product Features Supported ACTXIMG SAS/GRAPH ODS styles, pop-up data tips, and drill-down links, static graphics with no interactivity. JAVAIMG SAS/GRAPH ODS styles, static graphics with no interactivity. ACTIVEX SAS/GRAPH ODS styles, pop-up data tips, drill-down links, interactivity via pop-up menus JAVA SAS/GRAPH ODS style, pop-up data tips, drill-down links, interactive via pop-up menus. GIF,JPEG, SAS/GRAPH Pop-up data tips, drill-down links, static graphics with no interactivity Interactive Graphs from the SAS ® System Shi-Tao Yeh, GlaxoSmithKline, King of Prussia, PA. Data Presentation NESUG 18
Transcript of Interactive Graphs from the SAS® System - Lex Jansen · 3 You can specify the GOPTION statement...

1
ABSTRACT
An interactive graph is a dynamic graph interface that allows viewers interaction. The SAS System provides thefollowing interactive features:� By an ActiveX control – (pop-up data tips, drill-down links, and interactive menus)� By a Java applet – (pop-up data tips, drill-down links, and interactive menus)� By a Metaview applet – (data tips, drill-down links, or some interactivity such as zooming, panning, and
slide shows).� By Static Images – (data tips, and drill-down links, or animation).� By Graphical Template Language(GTL) – (data tips).� By ODS features of bookmarks and hyperlinks.
This paper illustrates interactive graph features provided by the SAS System.The SAS version 9.1 products used in this paper are SAS BASE®, SAS/STAT®, and SAS/GRAPH® on a PCWindows® platform.
INTRODUCTION
The interactive graphs allow users interactions. The users interact directly with interactive graphs, mainly throughthe user interfaces. The user interfaces are controlled by using a mouse, buttons, and menus with buttons andkeyboard. The interactive graphs provide the following desirable features: 1) It allows the graph reusable byinteractive menus by user to change graphical properties, including modification of titles and axis. 2) The datatips feature allows user to pack extra relevant information on the graph. 3) It allows the links to subsequentgraphs, maps or tables. 4) Zooming techniques are often used to change the object’s scale. Zoomableinterfaces come in two types: a) Geometric zooming where the zoom scale is linear with the zoom multiplier, b)Semantic zooming where objects may change shape at different zoom levels. The semantic zooming is adistortion technique that displays a fisheye view to change object scale in a single view. By moving around andchanging the scale, the user can get integrated context and focus of the large information space. 5) It producesslide show of static images.
The SAS System implements several new technologies, such as Java applet and ActiveX control and others, toprovide the following interactive features:� By an ActiveX control – (pop-up data tips, drill-down links, and interactive menus)� By a Java applet – (pop-up data tips, drill-down links, and interactive menus)� By a Metaview applet – (data tips, drill-down links, or some interactivity such as zooming, panning, and
slide shows).� By Static Images – (data tips, and drill-down links, or animation).� By Graphical Template Language (GTL) – (data tips).� By ODS features of bookmarks and hyperlinks.
The technologies used in the interactive features are: ActiveX control (Microsoft®) and Metaview Applet (SunMicrosystems®).
Device SAS Product Features SupportedACTXIMG SAS/GRAPH ODS styles, pop-up data tips, and drill-down links, static graphics with no
interactivity.JAVAIMG SAS/GRAPH ODS styles, static graphics with no interactivity.ACTIVEX SAS/GRAPH ODS styles, pop-up data tips, drill-down links, interactivity via pop-up menusJAVA SAS/GRAPH ODS style, pop-up data tips, drill-down links, interactive via pop-up menus.GIF,JPEG, SAS/GRAPH Pop-up data tips, drill-down links, static graphics with no interactivity
Interactive Graphs from the SAS® System
Shi-Tao Yeh, GlaxoSmithKline, King of Prussia, PA.
Data PresentationNESUG 18
2
PNGGIFANIM SAS/GRAPH Slide show of static images with no interactivityJAVAMETA SAS/GRAPH Pop-up data tips, drill-down links, some interactivity such as zooming, and slide
shows.DS2TREE,DS2CONST,DS2CSF
SAS/GRAPH Treeview diagrams, constellation diagrams, or critical success factor diagrams.
ODS facility Base SAS ODS styles, Bookmarks, HyperlinksGTL SAS/STAT Data tips
Table 1. Interactive Features Supported by Device
What does your audience require to view the presentation in addition to the browser? Table 2 demonstrates the additionalrequirements needed for a presentation generated with the ACTIVEX driver and the JAVAMETA driver.
Device Additional RequirementsACTIVEX The presentation must be viewed on a Windows system with the SAS ActiveX control
installed locally.GIF, JPEG, PNG,ACTXIMG, JAVAIMG,GIFANIM, ODS facility,GTL
None
JAVA The Java applet files must be installed locally, or on a server accessible by the clientmachine, and Java 1.4 plug-in must be installed on each client machine. On Windowssystems, the user is prompted to install the plug-in if it is not already installed. On othersystems, the plug-in can be installed from the Sun Microsystems site.
JAVAMETA The JAVA applet files must be installed locally or accessible by the client machine. TheJAVA plug-in is not required.
Table 2. Additional Requirements Needed to View the Presentation
This paper discusses interactive features provided by the SAS System. The data used for graphical illustrationpurpose throughout the paper are from the hypothetical clinical studies.
BY ACTIVEX CONTROL DEVICE DRIVER
The SAS/GRAPH ActiveX device provides the following interactive features: 1) ability to change graph typesfrom a two-dimensional chart to a three dimensional chart, 2) data tips, 3) rotate and zoom, 4) reassign variableroles, and modify axes, legends, colors, and text fonts. If your audience uses the Windows operatingenvironment and the Internet Explorer Web browser, the ActiveX Control might be preferable over a Java appletfrom a performance standpoint.
The SAS/GRAPH procedures and statements support the ActiveX Control device are listed below.
Procedure StatementsGPLOT PLOT, PLOT2, BUBBLE, BUBBLE2GCHART HBAR, HBAR3D, VBAR, VBAR3D, PIE, PIE3D, DONUTGCONTOUR PLOTGMAP CHORO, BLOCK, PRISMG3D PLOT, SCATTERGBARLINE BAR, PLOTGAREABAR HBAR, HBAR3D, VBAR, VBAR3DGRADAR CHART
Table 3. Procedures and Statements That Support ActiveX Control Device
Data PresentationNESUG 18

3
You can specify the GOPTION statement that generates ActiveX Control output.
goption dev=activex;
You can add data tips with the HTML= option. The following sample statement in the data step illustrates theconstruction of data text that will be shown in the data tips and depicts CHART statement with HTML=TIP option.
tip='ALT="N: ' || compress(round(n,1.)) || '0D'x ||'Mean: ' || compress(round(mean,.001)) || '0D'x ||'Max: ' || compress(round(max,.001)) || '0D'x ||'Min: ' || compress(round(min,.001)) || '0D'x ||'Median: ' || compress(round(median,.001)) || '0D'x ||'STDERR: ' || compress(round(stderr,.001)) || '0D'x ||'P99: ' || compress(round(p99,.001)) || '0D'x ||'P95: ' || compress(round(p95,.001)) || '0D'x ||'Q1: ' || compress(round(q1,.001)) || '0D'x ||'Q3: ' || compress(round(q3,.001)) ||'"';
proc gradar data=final;chart visit/freq=mchg
annotate=anno cstars=(blue red)staraxis=(axis1, axis1 ,axis1,axis1 ,axis1,axis1 ,axis1,axis1, axis1, axis1)starfill=(solid solid) starcircles=(.25 .75) wstars=(1 3)cstarcircles=blackhtml=tip name='aerad03.gif' overlay=rand1;
ActiveX Control Output Sample Data Tips from ActiveX Control Output
Drill-Down Menu Illustration Using Menu to Modify Graph Properties
Figure 1. Interactive Features from ActiveX Device
Data PresentationNESUG 18
4
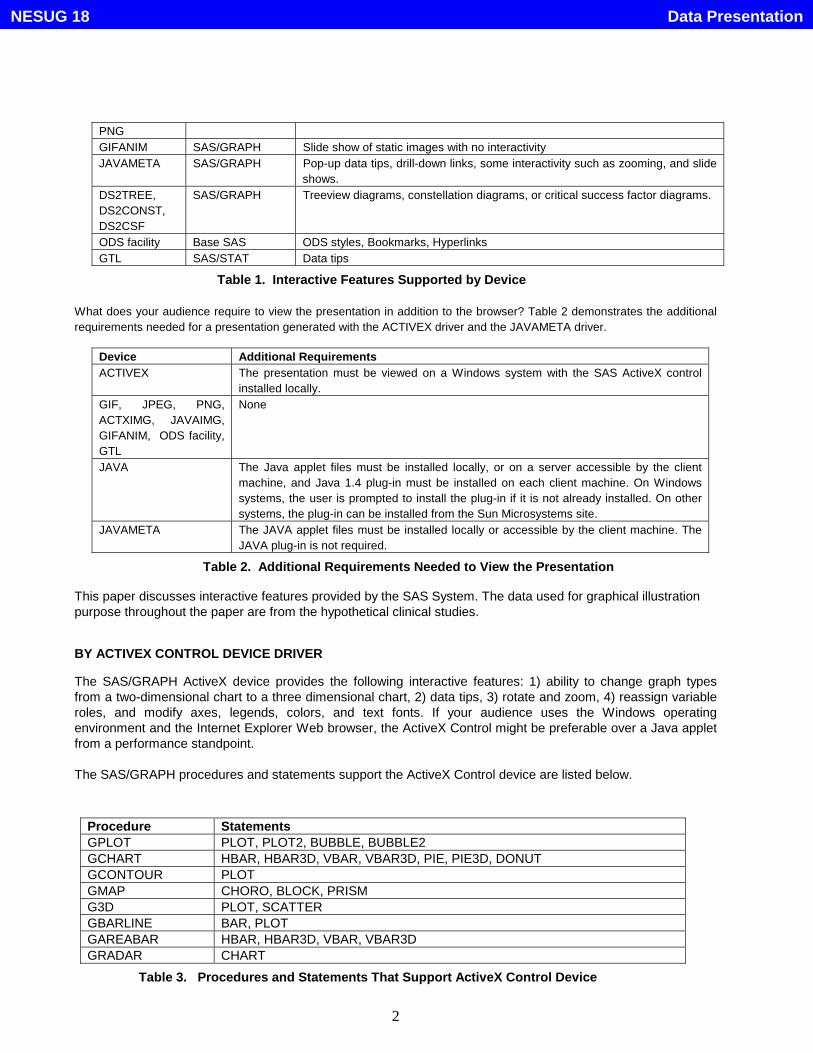
BY ACTXIMG DEVICE DRIVER
The SAS/GRAPH procedures support ActiveX device also support ACTXIMG device driver. A presentationproduced with ACTXIMG driver supports data tips and drill-down links for GCHART, GBARLINE, and GPLOToutput. You can use ODS styles with the ACTXIMG driver. You can use ODS and the ACTXIMG device driver tocreate a presentation that uses a PNG file that is identical in appearance to the image produced with theACTIVEX device driver.
Original Output from ACTXIMG Data Tips from ACTXIMG
Figure 2. Interactive Features from ACTXIMG Device
BY JAVA DEVICE DRIVE
The Java device driver produces interactive graphs that run in the Graph, Map, and Contour applets. The appletsenable users to interact with the output of the GCHART, GPLOT, G3D, GMAP, and GCONTOUR procedures.
The Java applets enable the user to display data values (data tips), to change the type of graph, to pan, rotate,and zoom, and to change colors, fonts, axes, legends, and variable roles.
You can enhance Java graphs by setting applet parameters and specifying ODS options. Applet parameters letyou configure drill-down and override default values in the user interface.
The following programming steps and SAS sample code generates output for the Graph Applet.
1. Use data steps to prepare and execute SAS procedure.2. Execute SAS procedure with specification of ODS output tables.3. Reset graphics options and specify Java device driver.
goptions reset=all device=java;
4. To conserve resources, close the default ODS output destination.
ods listing close;
5. Open an output file with specification of output file name.6. Execute SAS/GRAPH procedure.7. Close HTML file and reopen ODS listing destination.
Figure 3 demonstrayes the survival estimates from PROC, LIFETEST, and GPLOT with Java device to producethe following Kaplan-Meier interactive plot.
Data PresentationNESUG 18

5
Original Output Data Tips Feature
Drill-Down Menu - Main Drill-Down Menu – Style Editor I
Drill-Down Menu – Style Editor II Drill-Down Menu - Properties
Figure 3. Interactive Features from Java Device
BY JAVAMETA DEVICE DRIVE
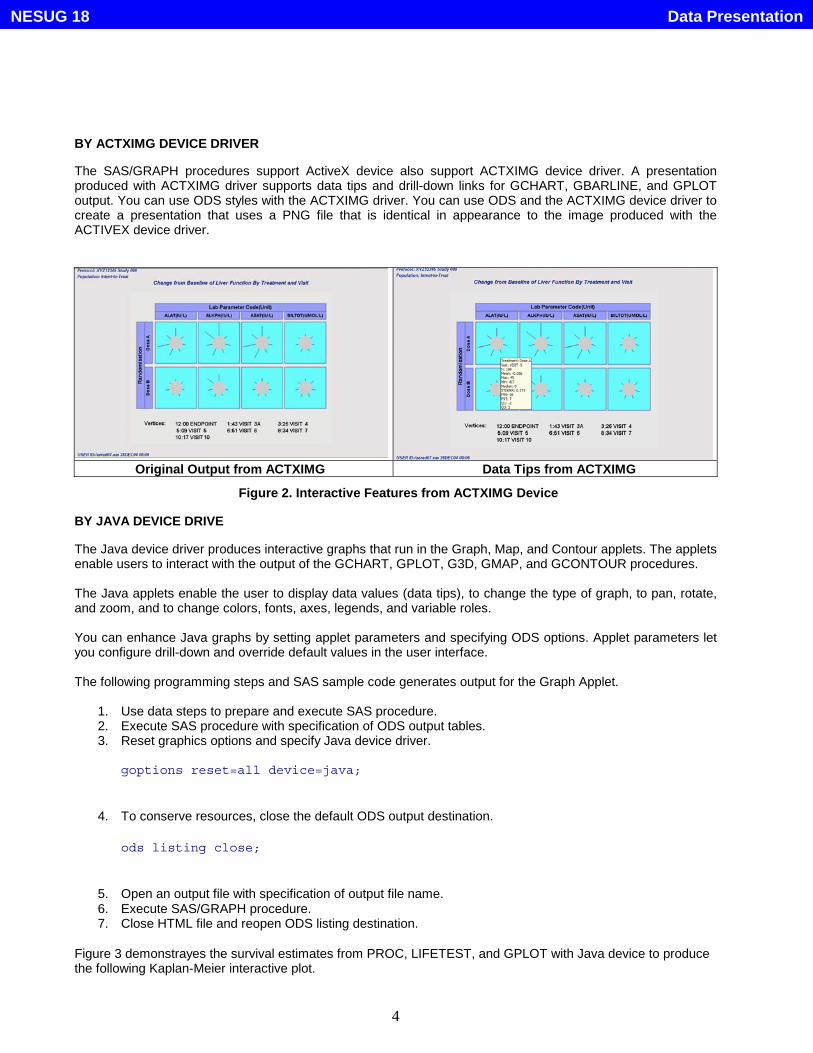
The SAS/GRAPH Javameta device uses the Metaview Applet to generate the output of SAS/GRAPHprocedures. The Metaview Applet provides the following interactive features: 1) embedded controls, 2) aprogrammable menu, 3) scrolling, 4) animation, 5) zooming, 6) data tips, and 7) drill-down capability. AnySAS/GRAPH procedure that produces metagraphics output can use the JAVAMETA device driver.
Figure 4 illustrates the output from GRADAR procedure with zooming feature.
Data PresentationNESUG 18
6
Original Output Zoom the Size to 109%
Figure 4. Interactive Features of JAVAMETA Device
BY DS2TREE MACRO
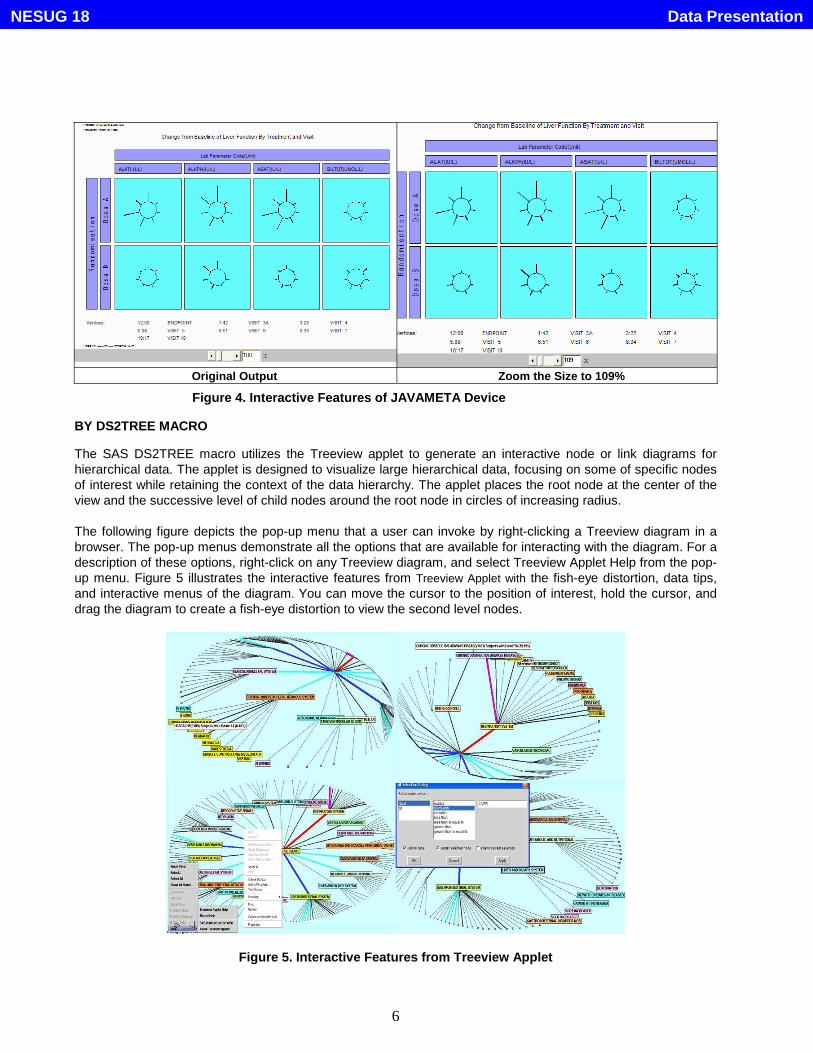
The SAS DS2TREE macro utilizes the Treeview applet to generate an interactive node or link diagrams forhierarchical data. The applet is designed to visualize large hierarchical data, focusing on some of specific nodesof interest while retaining the context of the data hierarchy. The applet places the root node at the center of theview and the successive level of child nodes around the root node in circles of increasing radius.
The following figure depicts the pop-up menu that a user can invoke by right-clicking a Treeview diagram in abrowser. The pop-up menus demonstrate all the options that are available for interacting with the diagram. For adescription of these options, right-click on any Treeview diagram, and select Treeview Applet Help from the pop-up menu. Figure 5 illustrates the interactive features from Treeview Applet with the fish-eye distortion, data tips,and interactive menus of the diagram. You can move the cursor to the position of interest, hold the cursor, anddrag the diagram to create a fish-eye distortion to view the second level nodes.
Figure 5. Interactive Features from Treeview Applet
Data PresentationNESUG 18

7
BY DS2CONST MACRO
The Constellation applet displays a node-link diagram. Each node can be linked to one or more other nodes.Unlike the Treeview applet, the Constellation applet does not required a hierarchical relationship between thenodes. Although it can be used to display hierarchical relationships, the Constellation applet does notautomatically place the root node at the center of the display.
The Constellation applet supports the following interactive features: 1) It allows zooming on the portion of thediagram that is in the center of the display, 2) You can click and drag the diagram to change the portion of thediagram, 3) It supports a pop-up menu that ahs several functions, such as highlighting specific links andsearching for specific nodes. 4) It permits hotspots links to Web sites or files. Figure 6 demonstrates theinteractive features from Constellation Applet.
Figure 6. Interactive Features from Constellation Applet
BY ODS FACILITY
Prior to Version 7, SAS output provided no way for you to parse its contents; retrieving the output from astatistical procedure would have been a challenging task. Beginning with Version 7, all SAS/STAT proceduresutilize the Output Delivery System (ODS) to manage their output. This includes managing the form the outputappears, as well as its organization and format. The default for SAS/STAT procedures is to produce the usualSAS listing file. However, by using the features of the ODS, you can make changes to the format andappearance of your SAS output. In particular, you can:
• display your output in different destinations, such as hypertext markup language (HTML) , Rich-Text-Format (RTF), or PDF format
• create SAS data sets directly from output tables• hyperlink to files, or locations• select or exclude individual output tables• customize the layout, format, and headers of your output• produce ODS statistical graphics as part of ODS output in SAS 9.1.
Data PresentationNESUG 18

8
The ODS destinations of RTF, PDF and HTML can produce a Table of Contents (TOC) for hyperlinking. Thetable of contents(TOC) is a list of the headings or topics in a document. You can use a TOC to get an overviewof the topics presented in a document or to quickly navigate to a topic. A bookmark is a feature that by recordingan address or reference, enable you to quickly return to that page, or file. It keeps your reference link, much likea bookmark in a book does. It is also a pointer points to a specific page or file. The syntax of bookmark is asfollows:
ods rtf bookmark="bookmark name";
%macro settoc(bkmkname=);toc='{\field {\*\fldinst HYPERLINK \\l "'||"&bkmkname"||'"}}';
pageno='{\field {\*\fldinst PAGEREF '||"&bkmkname"||'\\h}}';output;
%mend settoc;
Figure 7 depicts the hyperlink features from ODS TOC.
ODS Bookmarks Feature in RTF Format ODS Hyperlink Feature in RTF Format
Hyperlinks from TOC in RTF Format Hyperlinks from TOC in HTML formatFigure 7. Interactive Features from ODS Destinations
Data PresentationNESUG 18

9
BY GTL
SAS 9.1 includes an experimental feature, ODS Statistical Graphics (ODS Graphics for short), which introducesmore than 30 procedures in four SAS products. This new feature enables the procedures to create statisticalgraphs automatically as part of ODS output.
With simple ODS Graphics statements, a procedure creates graphs that are commonly needed for data analysis.The default ODS Graphics provide informative graphs with important statistics printed alongside. You cancustomize ODS Graphics to suit your needs.
ODS Graphics appearances are governed by the ODS Graphical Template Language (GTL). The modification ofODS Graphics can be made by three sources: 1) from the data set that is used for the procedure execution, 2)from changing the style template, and 3) from modification of the graph template.
There are several methods and tips to create customized ODS Graphics and how to modify system defaulttemplates or create stand along template. These methods focus in four topics: 1) A macro facility for users toeasily supply titles and footnotes, 2) Overlaying two ODS Graphics, 3) Modification of the ODS Graphicselements, and 4) Creating stand alone template.
Figure 8 illustrates the interactive data tips feature from PROC LIFETEST ODS Graphics. The output is producedby: 1) overlaying two ODS Graphics, 2) modifying style template, 3) adding customized titles and footnote, and 4) adding‘tips’ feature to default Graphics Template.
Figure 8. Interactive Data Tips Feature in ODS GTL
Data PresentationNESUG 18

10
CONCLUSION
The new technologies such as Java Applets and ActiveX Control are embedded and implemented in the SASsystem which enables the SAS system to generate interactive graphs.
The interactive features are: 1) embedded controls, 2) a programmable menu, 3) scrolling, 4) animation, 5)zooming and panning, 6) data tips, 7) drill-down capability, and 8) bookmarks and hyperlinks.
These features are very desirable and enable the user to: 1) change graph properties without rerunning the job,2) pack extract graphical element relevant information to the output, 3) link and navigate to relevant files and hotspots, 4) control the functionality of the drill-down menus, and 5) view the animation slide show..
REFERENCES
[1] SAS Institute Inc.,(2003): SAS OnlineDoc 9. , Cary NC. http://support.sas.com/91doc/docMainpage.jsp .
[2] Yeh, S.T.(2005): Using Interactive Treeview Diagrams for Clinical Adverse Experiences Records , Proceedings of theNorth East SAS Users Group 2005 Conference, Paper pos8 , September 2005.
[3] Yeh, S.T.(2005): Using RADAR Chart to Display Clinical Data , Proceedings of the North East SAS Users Group 2005Conference, Paper pos5, September 2005.
[4] Yeh, S.T.(2005): Customizing ODS Statistical Graphics , Proceedings of the 30th SAS Users Group InternationalConference, Paper 183-30, April 2005.
[5] Zdeb, M.(2005): Stretching the Bounds of SAS/GRAPH Software, Proceedings of the 30th SAS Users Group InternationalConference, Paper 137-30, April 2005.
[6] Zdeb, M.(2004): Pop-Ups, Drill-Downs, and Animation, Proceedings of the 29th SAS Users Group InternationalConference, Paper 090-29, May 2004.
TRADEMARKS
SAS is a registered trademark of SAS Institute Inc., Cary, NC, USA in the USA, and other countries.Microsoft is a registered trademark of Microsoft Corporation, in the USA and other countries.Sun Microsystems is a registered trademark of Sun Microsystems, Inc., in the USA, and other countries.� indicates USA registration.
AuthorShi-Tao Yeh, Ph. D.(610) 787-3856 (W)E-mail: [email protected]
Data PresentationNESUG 18