INTERACTIONS OF METALLIC SUBSTANCES AND ACIDIC …
74
INTERACTIONS OF METALLIC SUBSTANCES AND ACIDIC GROUND WATER IN THE NEW JERSEY COASTAL PLAIN By Julia L. Barringer U.S. GEOLOGICAL SURVEY Water-Resources Investigations Report 90-4095 Prepared in cooperation with the NEW JERSEY DEPARTMENT OF ENVIRONMENTAL PROTECTION AND ENERGY West Trenton, New Jersey 1994
Transcript of INTERACTIONS OF METALLIC SUBSTANCES AND ACIDIC …

INTERACTIONS OF METALLIC SUBSTANCES AND ACIDIC GROUND WATER
IN THE NEW JERSEY COASTAL PLAIN
By Julia L. Barringer
U.S. GEOLOGICAL SURVEY
Water-Resources Investigations Report 90-4095
Prepared in cooperation with the
NEW JERSEY DEPARTMENT OF ENVIRONMENTAL PROTECTION AND ENERGY
West Trenton, New Jersey 1994

U.S. DEPARTMENT OF THE INTERIOR
BRUCE BABBITT, Secretary
U.S.GEOLOGICAL SURVEY
Gordon P. Eaton, Director
For additional information write to:
District ChiefU.S. Geological SurveyMountain View Office Park810 Bear Tavern RoadSuite 206West Trenton, NJ 08628
Copies of this report can be purchased from:
U.S. Geological SurveyEarth Science Information CenterOpen-File Reports SectionBox 25286, MS 517Denver Federal CenterDenver, CO 80225

CONTENTS
PageAbstract............................................................. 1Introduction......................................................... 1
Purpose and scope ............................................... 8Ancillary-study logic and approach.............................. 8Previous investigations......................................... 9Acknowledgments................................................. 10
Methods.............................................................. 11Tap-water sampling and analysis ................................. 11Leaching experiments............................................ 13Analysis of pipe-scale deposits ................................. 16Measurement of corrosion rates .................................. 17
Interactions of metallic substances and acidic ground water.......... 19Metals in tap water............................................. 19Experimental leaching of metals ................................. 31Composition of pipe scale....................................... 52Corrosion rates ................................................. 55
Summary and conclusions .............................................. 55References cited. .................................................... 61Appendix A.--Equations for potential reactions and processes that
affect the pH of natural waters and that may be involved in thecorrosion 'process.................................................. 66
Appendix B.--Well-construction data.................................. 67
ILLUSTRATIONS
Figure 1. Diagrammatic sketch showing simplified oxidation and reduction reactions of iron in contact with ground water............................................... 3
2. Diagrammatic representation of a galvanic cell betweencopper pipe and lead/tin solder..................... 4
3. Map showing locations of areas of tap-water sampling, sources of natural waters for leaching experiments, and wells in which corrosion probes were installed.. 12
4. Photograph showing copper pipe with lead/tin solderedband used for leaching experiments .................. 14
5. Diagram showing the placement of corrosion probes andmeasurement of resistivity. ......................... 18
6. Graph showing Aggressive Index values plotted against concentrations of copper leached from plumbing in 10 houses in Franklinville. ......................... 25
7. Graph showing Aggressive Index values plotted against concentrations of zinc leached from plumbing in 10 houses in Franklinville............................. 27
8-10. Graphs showing Aggressive Index values plotted against concentrations of metals leached from plumbing in nine houses in Franklinville:
8. Copper ............................................. 289. Zinc ............................................... 29
10. Lead............................................... 30
111

ILLUSTRATIONS--Continued
Page11-13. Graphs showing copper concentrations in leachate from
copper pipe with lead/tin solder leached in closed containers, plotted as a function of Aggressive Index value for the leaching solution:
11. Leachate at 20 hours ............................... 3712. Leachate at 120 hours.............................. 3813. Leachate at 360 hours.............................. 39
14-16. Graphs showing lead concentrations in leachate fromcopper pipe with lead/tin solder leached in closed containers, plotted as a function of Aggressive Index value for the leaching solution:
14. Leachate at 20 hours............................... 4015. Leachate at 120 hours .............................. 4116. Leachate at 360 hours.............................. 42
17. Eh-pH diagrams for (a) copper, lead, manganese, nickel,gold, and silver, and (b) iron...................... 46
18. Eh-pH diagram for solid and dissolved forms of ironat 25 degrees Celsius and 1 atmosphere pressure..... 50
19. Photograph showing examples of discontinuous, rough iron oxide deposits, and smooth, continuous iron oxide deposits on the interior of two copper pipes.. 53
20. Corrosion rates for two carbon-steel probesand a copper probe.................................... 57
21. Photograph of two carbon-steel probes and a copperprobe............................................... 58
TABLES
Table 1. U.S. Environmental Protection Agency Primary andSecondary Maximum Contaminant Levels for selectedmetals.............................................. 6
2. Lead concentrations in standing tap water, pH measure ments, age of house, and presumed age of plumbing for 54 houses in Atlantic County, New Jersey, 1985-87............................................. 20
3. Selected water-quality data and Aggressive Index values for tap-water samples collected after standing overnight and after 15 minutes of flushing from 20 homes in Franklinville, Gloucester County........... 23
4. Selected water-quality data for ground water used inleaching experiments................................ 32
5.- Concentrations of selected constituents in leachate from column leaching experiments on copper pipe with lead/tin solder and tin/antimony solder........ 33
6. Concentrations of selected constituents in leachate from sealed-bottle leaching experiments on copper pipe with lead/tin solder........................... 36
7. Standard electrode potentials for selected substancesin acid solutions ................................... 44
iv

TABLES - - Continued
Page8. Concentrations of constituents in synthetic solutions
and leachate from sealed-bottle leaching experimentson copper pipe with lead/tin solder................. 48
9. Semiquantitative analyses of elements present in pipe- scale deposits...................................... 54
10. Selected water-quality characteristics for Mullica River basin wells in which corrosion probes were installed........................................... 56
v

CONVERSION FACTORS AND ABBREVIATIONS
Multiply
millimeter (mm) centimeter (cm) meter (m)
Temperature conversion formula:
By.
Length
0.039370.39373.281
To obtain
inch inch foot
Temperature in degrees Celsius (°C) is converted to degrees Fahrenheit (°F) by the equation °F = 1.8 °C + 32.
SYMBOLS FOR SELECTED CHEMICAL ELEMENTS
AluminumAntimonyCalciumCarbonChlorineCopperGold
AlSbCaCClCuAu
HydrogenIronLeadMagnesiumManganeseNickelNitrogen
HFePbMg Mn Ni N
SiliconSilverStrontiumSulfurTinZincZirconium
SiAgSrSSnZnZr
VI

INTERACTIONS OF METALLIC SUBSTANCES AND ACIDIC GROUND WATER IN THE NEW JERSEY COASTAL PLAIN
by Julia L. Barringer
ABSTRACT
Four ancillary studies were undertaken in support of an investigation into the extent and distribution of corrosive ground water in the Kirkwood- Cohansey aquifer system of southern New Jersey. The ancillary studies were (1) analysis of tap-water samples for metals and the acquisition of metal data from a county study, (2) leaching experiments in which copper pipe with various types of solder were exposed to a variety of ground-water types, (3) analysis of pipe-scale deposits on plumbing from houses with wells that tap the Kirkwood-Cohansey aquifer system, and (4) measurement of corrosion rates for carbon steel and copper exposed to shallow ground water from the Kirkwood- Cohansey aquifer system.
The results of the tap-water studies indicate that substantial concentrations of lead, copper, and zinc can leach from plumbing materials exposed to corrosive water from the Kirkwood-Cohansey aquifer system, and that leaching appears more pronounced during the summer than during the winter. The leaching experiments indicate that the corrosiveness of water, as estimated by the calculation of a corrosion index (the Aggressive Index), is related to the concentration of trace metals in the leachate. Further, although the leaching of lead-bearing solders produced lead concentrations in leachate above the Primary Drinking Water Criterion in effect at the time of the study (50 micrograms per liter), no potentially toxic levels of metals were leached from lead-free solders, although copper concentrations in some leachate samples were in excess of the Secondary Drinking Water Criterion of 1,000 micrograms per liter. Analyses of pipe-scale deposits indicate the formation of iron oxide coatings on some copper-pipe interiors exposed to untreated well water. Treated water from a public-supply system precipitated copper carbonate and copper chloride minerals. Corrosion rates measured for copper exposed to corrosive water from the Kirkwood-Cohansey aquifer system were slow (less than 0.0254 millimeters per year). Carbon-steel corrosion rates were faster; the fastest rate (0.229 millimeters per year) was measured in oxygen-saturated water.
INTRODUCTION
The leaching of metals from commonly used water-supply materials has been correlated with the occurrence of corrosive water in parts of Great Britain and the United States (Karalekas and others, 1976; O'Brien, 1976; Hoyt and others, 1978; Lovell and others, 1978; Matthew, 1981; Lassovsky, 1984; de Mora and Harrison, 1984; Maessen and others, 1985; Murrell, 1985; Kish and others, 1987). Materials used in most public-water-supply systems and home water- distribution systems, such as copper, lead, steel, cast iron, galvanized iron, and brass, are susceptible to corrosion. Metallic structures in contact with ground water, such as underground storage tanks, also are subject to corrosion.

Corrosion is defined as "the deterioration of a substance or its properties due to a reaction with its environment" (Singley and others, 1985, p. 6). In water-distribution systems, the environment for the metals is water, which can react both physically and chemically with the metallic components through or around which it passes. Physical action can assist chemical reactions in extracting metals from water-distribution systems and increasing concentrations of these substances in drinking-water supplies.
Pipe corrosion is enhanced where water flows at high velocity, particularly through elbows and joints. Erosion of the protective film of corrosion products on the pipe's inner surface can be caused by suspended particles, but also can result from rapidly flowing water removing poorly attached films or preventing their formation (Schock and Neff, 1982).
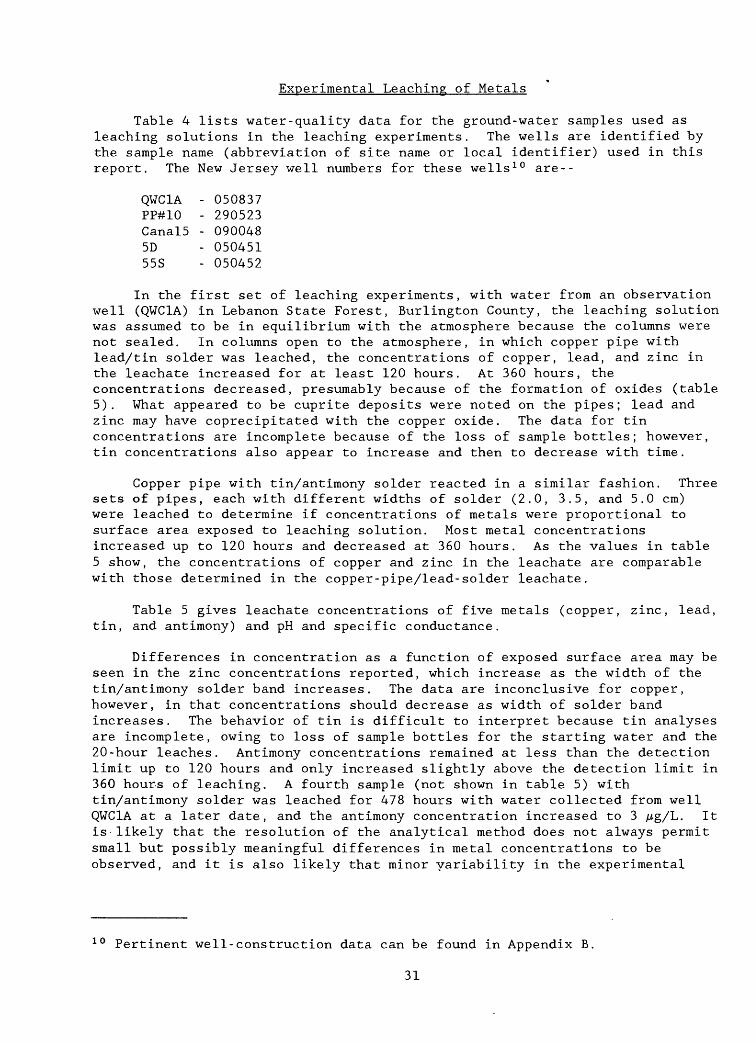
Metallic corrosion is an electrochemical process in which oxidation of a metal in its elemental form releases electrons, which are transferred in a conductive medium to reduce another substance. The site of oxidation is usually referred to as the anode, and site of reduction is called the cathode (Schock and Neff, 1982). In the oxidation-reduction (redox) reactions that characterize metallic corrosion, the medium for the flow of electrons typically is water, in which ions are present. The relative tendency for a metal to corrode is controlled by its electrode potential (Appendix A), which is really a measure of how easily the metal loses valence electrons, and by the redox state of the water. Figure 1 illustrates an example of the metallic corrosion process--iron in contact with ground water. In the diagram, the source of hydrogen ions (H ) is the dissociation of water in the reaction H2 0 -> H + OH . Fe°, which is elemental iron, loses two electrons (e ) to form Fe 2 . If the water is not acidic, Fe 2 reacts with water to produce ferrous hydroxide (Fe(OH) 2 ) and H . H is reduced and forms hydrogen gas (H2 ) at the cathode. In an oxidizing environment, Fe 2 is oxidized and reacts with water to form ferric hydroxide (Fe(OH) 3 ).
If two metals are in contact with one another, a galvanic cell can be set up in which one metal acts as an anode and the other as a cathode. The metal that is more easily oxidized is the anode; that metal oxidizes and dissolves. Because copper is less easily oxidized than many other metals, copper-bearing materials tend to act as cathodes, thus enhancing the dissolution of other metals acting as anodes (Schock and Neff, 1982). The diagram in figure 2 illustrates a galvanic cell between copper pipe and lead/tin solder (Barringer and others, 1993). For simplicity, reactions involving tin are ignored. Lead, which loses electrons more readily than copper, is oxidized, and lead ions (Pb 2 ) go into solution. Cupric ions (Cu2 ) are reduced and plate out as metallic copper on the solder, which is the anode.
For a redox reaction to occur, a substance that is an electron acceptor must participate in the reaction. In the case of metallic corrosion, the electron acceptor (or oxidizing agent) may be another metal; however, oxygen is the strongest oxidizing agent commonly found in nature (Krauskopf, 1967). Singley and others (1985, p. 161) state that, in potable-water environments, corrosion of copper is not thermodynamically possible in the total absence of

IRON PIPE
AQUIFER . MATERIALS
o -ANODECATHODE Fe° Fez*+2e2+
Fe(OH)2 +2H*
Fe(OH)3+3H+ +e
Figure 1.--Diagrammatic sketch showing simplified oxidation and reduction reactions of iron in contact with ground water.

LEAD/TIN SOLDER
LEAD/IONS
ANODE
Figure 2.--Diagrammatic representation of a galvanic cell between copper pipe and lead/tin solder.

oxygen. Experimental work indicates that the combination of dissolved carbon dioxide and oxygen in water enhances the corrosion of copper, but that neither dissolved gas strongly promotes corrosion in the absence o'f the other (Ives and Rawson, 1962a). The role of oxygen in the corrosion of lead is less clear, and it appears that some metals can be oxidized by agents such as nitrate (Singley and others, 1985).
A redox reaction comprises both oxidation and reduction reactions, and it can proceed only as fast as the slowest of the two linked reactions. The rate of metal corrosion is affected by a number of factors, among which the partial pressure of oxygen, pH, and temperature have been shown to be particularly important (Singley and others, 1985). In general, corrosion rates increase as partial pressure of oxygen increases and as water temperature increases. The formation of metal-oxide films also accelerates as partial pressure of oxygen increases. Therefore, if metal-oxide films coat available metal surfaces, the presence of these films may decrease the interactions between metal and water, and corrosion rates will diminish. The solubility of metals typically increases at lower pH values, and numerous studies, summarized in Singley and others (1985), have shown that corrosion generally proceeds more rapidly in low-pH solutions than in neutral solutions.
Although corrosion of metals commonly is treated as an inorganic process, there is strong evidence that bacteria can induce and accelerate corrosion in some materials. In studies of steel and iron corrosion, iron-oxidizing and sulfate-reducing bacteria have been shown to play a role in the corrosion process (Singley and others, 1985). Vecchioli and Giaimo (1972) found that sulfate-reducing bacteria in ground water increased corrosion rates for mild (low-carbon) steel. Corrosion may continue to occur because the bacteria "catalyze the combination of atomic hydrogen with sulfate ions," thus rapidly removing a protective layer of hydrogen gas generated at the cathode (Vecchioli and Giamo, 1972, p. B250).
Overall, a wide variety of studies have shown that corrosive water typically has low pH and small concentrations of alkalinity, so that the water is poorly buffered against changes in pH. Elevated concentrations of chloride and sulfate have been found to enhance the corrosiveness of water. If hardness concentrations are small, the formation of protective calcium carbonate deposits is not likely to occur. Oxygenated water tends to be particularly corrosive towards some metals, and the presence of certain bacteria may promote metallic corrosion.
Metallic corrosion has been extensively ,studied not only because of its economic impact on utilities, industry, and home plumbing but also because of its potential for affecting human health. Of the metals studied, lead is the primary concern because its detrimental effects on health, summarized by Patterson and O'Brien (1979) and Levin (1986), have been well known for years. In water-distribution systems, some lead enters drinking-water supplies through lead pipe that is still in service, but lead can also be leached from lead/tin solder used to join copper pipe. The use of solder containing lead was banned in New Jersey as of February 1987 (New Jersey Register, 1987).
At the time of this study, the U.S. Environmental Protection Agency (USEPA) had set the MCL (maximum contaminant level) for lead in public drinking water at 50 jug/L (micrograms per liter) (U.S. Environmental

Protection Agency, 1977). The New Jersey Primary Drinking Water Criterion for lead was'the same as the USEPA value (New Jersey Department of Environmental Protection, 1985). Recently, the USEPA has revised the regulations for lead in public water supplies, instituting a treatment technique action level that took effect in 1992. The treatment technique action level reduces the permissible concentration of lead in tap water. Table 1 lists USEPA primary and secondary MCLs, adopted as the New Jersey Primary and Secondary Drinking Water Criteria, for the metals evaluated in this study.
In a comprehensive study of lead in drinking water, the USEPA projected that, in 1988, approximately 42 million people using public water supplies could have been exposed to drinking water containing more than 20 /Jg/L of dissolved lead (Levin, 1986, p. 11-58). The estimate does not include those people whose drinking water comes from a domestic well; therefore, many New Jersey residents would not be included in the USEPA estimate. A study of the distribution of corrosive ground water in the New Jersey Coastal Plain indicates that most wells in the Kirkwood-Cohansey aquifer system yield water that is capable of leaching metals such as lead and copper from plumbing materials (Barringer and others, 1987; Barringer and others, 1993).
Table 1.--U.S. Environmental Protection Agency Primary and Secondary MaximumContaminant Levels for selected metals
[/jg/L, micrograms per liter; MCL, primary maximum contaminant level; SMCL, secondary maximum contaminant level; from U.S. Environmental
Protection Agency (1977)]
Constituent Standard (/jg/L) Regulation
LeadCopperZincIron
501,0005,000
300
MCL 1
SMCL 1SMCLSMCL
1 On June 7, 1991, the U.S. Environmental Protection Agency enacted new regulations, known as treatment technique action levels, limiting allowable concentrations of lead and copper in public water supplies. Beginning in 1992, public water purveyors must test water at the homeowner's tap. If more than 10 percent of the tap-water samples contain concentrations of lead greater than 15 parts per billion (or 15 /Jg/L) and/or concentrations of copper greater than 1,300 parts per billion, action must be taken to reduce the corrosiveness of the water (Federal Register, 1991). Although domestic well owners are not required to perform such tests, the treatment technique action levels for lead and copper can be used as guidance levels.

The calculation of one or more corrosion indices is a standard me£hpd for estimating the corrosiveness of water. A corrosion index is a "mathematical formula that is based on water chemistry. The majority of indices that have been developed are measures of the degree to which water is saturated with respect to calcium carbonate. The rationale for using a calcium carbonate saturation index evolved because it was observed that protective films of calcium carbonate, if deposited on metallic substrates, will shield the'-metal from further corrosion. The Langelier Saturation Index, the Ryznar Index, and the Aggressive Index are variants of a calcium carbonate saturation index. The Aggressive Index 1 was actually developed to estimate the corrosiveness of water with respect to asbestos-cement pipe, but it is really a simplification of the Langelier Saturation Index. Other variants of the Langelier Index are the Driving Force Index, the Momentary Excess Index, and the Casil Index (Singley, 1981).
As Rossum and Merrill (1983) and Singley (1981) point out, these indices do not accurately predict the corrosiveness of water in all cases; however, in a nationwide study, Millette and others (1980) found that the Aggressive Index gave an adequate estimate of the aggressiveness (corrosiveness) of water. Sharpe and DeWalle (1985) report a good correlation between the corrosiveness of cistern water as predicted by the Ryznar Index and standing tap-water copper concentrations. Correlations between the Ryznar-Index values and lead concentrations were not as good, however.
The Aggressive Index has been described as a rough approximation of the widely used Langelier Saturation Index (Rossum and Merrill, 1983). Values of the Langelier Saturation Index are negative for water undersaturated with respect to calcium carbonate, zero for saturation, and positive for supersaturation. Values for the Aggressive Index2 are intuitively less obvious because of its different formulation. The Aggressive Index value of 12 corresponds to zero in the Langelier Saturation Index; Aggressive Index values decrease as water becomes increasingly undersaturated and, therefore, more corrosive.
Both the Langelier Saturation Index and the Aggressive Index were calculated for water from wells tapping the Kirkwood-Cohansey aquifer system in New Jersey, but the Aggressive Index could be calculated for a greater - number of wells. The Langelier Saturation Index requires a temperature correction, and ground-water temperature data were lacking for a number of wells (Barringer and others, 1993).
The study reported here was done in cooperation with the New Jersey Department of Environmental Protection and Energy.
1 The Aggressive Index is described by the equation AI = pH + log (alkalinity x calcium hardness), where alkalinity and calcium hardness are expressed as equivalents of calcium carbonate.
2 Aggressive Index values of 12 or greater indicate noncorrosive water. Values between 10 and 12 indicate moderately corrosive water, and values less than 10 indicate highly corrosive water.
7

Purpose and Scope
This report presents and describes the results of several ancillary studies that were undertaken to support an investigation of the distribution of corrosive ground water in the New Jersey Coastal Plain (Barringer and others, 1993). These ancillary studies include: metal analyses of tap-water samples from homes with domestic wells in the New Jersey Coastal Plain; leaching experiments involving copper pipe and various types of solder; analyses of pipe-scale deposits from home plumbing in the New Jersey Coastal Plain; and the measurement of corrosion rates for copper and steel exposed to Coastal Plain water.
Metals data from tap-water analyses conducted by the Atlantic County Health Department are summarized, and tap-water data collected by the U.S. Geological Survey from 20 homes in Gloucester County are presented. The results of a series of leaching experiments, in which plumbing materials were exposed to ground water of different compositions for differing periods of time, are summarized and related to the results of the tap-water study. Finally, data from the analyses of pipe-scale deposits and the measurement of in situ corrosion rates are presented and discussed in light of the chemistry of ground water from the Kirkwood-Cohansey aquifer system and its interactions with metallic substances.
Ancillary-Study Logic and Approach
The ancillary studies reported here were undertaken to- provide answers to a number of questions that arose during the study of the distribution of corrosive ground water in the New Jersey Coastal Plain. The need for the distribution study was prompted by the discovery of elevated concentrations of lead and copper in drinking water from domestic wells in Ocean and Atlantic Counties (J. Preczewski and T. Hayes, New Jersey Department of Environmental Protection, written commun., 1983; Kish and others, 1987). The distribution study was carried out by mapping corrosion index values that were calculated from water-quality analyses for water from wells in the New Jersey Coastal Plain (Barringer and others, 1993; Barringer, 1989). Two major aquifer systems, the Kirkwood-Cohansey and the Potomac-Raritan-Magothy, were studied. Water from the most areally extensive unconfined aquifer system in New Jersey, the Kirkwood-Cohansey aquifer system, was found in most areas to be highly corrosive. Therefore, the ancillary studies focus on water from the Kirkwood- Cohansey aquifer system. The questions that arose during the course of the study may be summarized as follows:
1. Leaching of metals such as lead and copper from plumbing materials was linked to corrosive ground water from three communities in Ocean and Atlantic Counties (Kish and others, 1987). Could metal leaching be found in other areas of the Coastal Plain?
2. The corrosion index used most extensively in the distribution study was the Aggressive Index. Did this index adequately represent the corrosiveness of the water evaluated for that study?
3. If lead-free solder, rather than lead/tin solder, were used in water- distribution systems, which metals might leach from the lead-free solder?

4. Plumbing materials can be shielded from continuing corrosion when pipe-scale (mineral) deposits precipitate on pipe interiors. In some waters, calcium carbonate or iron carbonate is deposited. Given the acidic nature of ground water in the Kirkwood-Cohansey aquifer system, carbonate deposits were considered unlikely to form in plumbing used to distribute untreated ground water from this aquifer system. What types of deposits, if any, form on pipe interiors, and how effective are these deposits in shielding plumbing from further corrosion?
5. The study of various aspects of corrosive ground water in the New Jersey Coastal Plain tended to focus on the leaching of lead and copper and the entry of these metals into drinking water. Insofar as drinking-water supplies also may be adversely affected by toxic materials leaking from corroded storage tanks, the corrosion of steel was of interest. At what rate would steel corrode when exposed to acidic Coastal Plain ground water, and could this rate be compared to that for copper corrosion?
An attempt to answer these questions was made by conducting analyses of metals in standing and running tap water from homes with domestic wells in Gloucester County, and by obtaining any recently collected data for trace metals in tap water from Atlantic County. In addition, a series of leaching experiments was conducted in which various plumbing materials were exposed to natural waters from the Kirkwood-Cohansey aquifer system and to synthetic solutions. Mineralogical analyses of pipe-scale deposits were done on samples of Coastal Plain plumbing, and in situ corrosion rates were measured for steel and copper in three U.S. Geological Survey observation wells in the Kirkwood- Cohansey aquifer system.
Previous Investigations
Studies of corrosive water in Great Britain found a positive correlation between lead in plumbing systems, dissolved lead in tap water, and levels of lead in human blood (Parry, 1967; Crawford and Morris, 1967; Beattie and others, 1972; Addis and Moore, 1974; Moore and others, 1977). A survey of tap water in Great Britain found that, of the households sampled, 8 percent of the homes in England, 34 percent of the homes in Scotland, and 9 percent of the homes in Wales had drinking water with lead concentrations exceeding 50 ;ug/L (Matthew, 1981).
In Canada, standing tap water was found to contain concentrations of lead exceeding 50 ;ug/L in British Columbia (Wong and Berang, 1976) and in Nova Scotia (Maessen and others, 1985). In the United States, elevated concentrations of lead were found in the Boston area, Mass. (Karalekas and others, 1976), in Long Island, N.Y. (Murrell, 1985), in Carroll County, Md. (Lovell and others, 1978), in Chesterfield County, S.C. (Sandhu and others,1977), in Minnesota and Wisconsin (G.M. Annibal, Minnesota Department of Health, written commun., 1985; L.B. Landsness, Wisconsin Department of Natural Resources, written commun., 1985), and in Seattle, Wash. (Hoyt and others,1978). In New Jersey, elevated concentrations of lead in tap water were reported for Beachwood Borough, Ocean County (J. Preczewski and T. Hayes, N.J. Department of Environmental Protection, written commun., 1983), in Ocean and Atlantic Counties (Kish and others, 1987), and in Morris County (Benson and Klein, 1983). In some of the above studies, elevated concentrations of copper (greater than 1,000 ^g/L) also were reported.

The concentrations of lead in tap water have been shown to decrease as the age of the house increases (Murrell, 1985; Lassovsky, 1984; Lovell and others, 1978); however, leaching does continue for a number of years, as evidenced by the tap-water lead concentrations reported for a 25-year-old home in Pennsylvania (Pennsylvania State University Environmental Research Institute Newsletter, 1988). The work of two Penn State Forest Hydrology professors presented in that article also shows clearly that temperature plays an important role in determining the concentrations of lead that enter drinking water, because higher concentrations of lead were found in tap water sampled during the summer than water sampled during the winter.
Experimental studies have dealt with the thermodynamics and kinetics of copper corrosion (Ives and Rawson, 1962a; 1962c) and with the solubility of lead (Schock, 1980). Chemical modeling by Schock (1980) shows that, although the theoretical solubility of lead reaches a minimum between pH 7 and pH 11, its solubility increases at pH values greater than 11 as well as at pH values less than 7. In experiments examining the role of alkalinity in corrosion inhibition, Schock and Gardels (1983) concluded that, in the pH range from approximately 8 to 8.5, inorganic carbon concentrations of about 30 mg/L (milligrams per liter) as calcium carbonate were effective in inhibiting lead leaching; however, higher levels were not only less effective in inhibiting leaching of lead but also less effective in inhibiting leaching of copper and zinc. Schock and Gardels conclude that the solubility of these metals is controlled by the solubility of metal-carbonate complexes. They also point out that this finding has implications for public water utilities, as public water supplies commonly are treated to reduce corrosiveness by raising the pH and increasing the alkalinity of water for distribution.
Chlorine and chloride ions, as well as sulfate ion, have been shown to increase the corrosive action of water towards copper (Al-Kharafi and El- Tantawy, 1982; Atlas and others, 1982). Larson (1975) noted that chloride causes pitting corrosion of steel and found that increased bicarbonate alkalinity tended to offset the corrosiveness of chloride and sulfate.
Feigenbaum and others (1978) examined the mineralogy of scale layers in steel water mains and found zoning of several minerals, with goethite (FeO(OH)), magnetite (Fe 3 0 4 ), and siderite (FeC0 3 ) comprising inner layers and calcium carbonate (CaC0 3 ) comprising the outer layer. Other mineral phases that have been identified as films deposited on a copper substrate are cuprite (Cu2 0), malachite (Cu2 (OH) 2 C0 3 ), and atacamite (Cu2 Cl(OH) 3 ), the latter mineral apparently forming when chloride concentrations are sufficiently high (Ives and Rawson, 1962a; 1962b; 1962d).
Acknowledgments
The assistance of Donald Schneider (Gloucester County Health Department) in identifying the first group of homes in Franklinville for tap-water sampling is gratefully acknowledged. Thanks also are due to Susan Joyner for contacting the homeowners in the second group of houses sampled in Franklinville. Special thanks go to the homeowners who participated in the study and collected the tapwater samples. Debra Maher of the Atlantic County Health Department generously permitted us to use the data she had collected on lead in tap water in Atlantic County homes. Mr. Stanton, Northfield, Atlantic
10

County, and Mr. Williams, Browns Mills, Burlington County, kindly supplied samples of household plumbing for analysis of pipe-scale deposits.
METHODS
Tap-Water Sampling and Analysis
Twenty homes comprising two clusters in Franklinville, Gloucester County 3 , were selected for tap-water sampling (fig 3.). The ages of the homes ranged from 2 to 25 years. In one group of 2- to 4-year-old homes, 5 of the 10 homes had water-treatment systems. The samples from four of the homes with the water-treatment systems were collected with the treatment system in operation. Although several of the second group of 10 homes had water- treatment systems, the systems were previously disconnected or bypassed at the time of sampling. Samples from the first group of homes were collected on February 23, 1988. Samples from the second group of homes were collected on August 4, 1988.
The samples of tap water in Gloucester County were collected by the homeowner according to a protocol established by Karalekas and others (1978) and used in the previous U.S. Geological Survey study of tap water in Ocean and Atlantic Counties (Kish and others, 1987). The homeowners were instructed to use no water during the night and then to fill two bottles from the kitchen or bathroom cold-water tap with the first morning water. One sample bottle was an acid-rinsed 250-mL (milliliter) polyethylene bottle for metals determination, the other a deionized-water-rinsed 250-mL polyethylene bottle for pH and specific conductance determinations. After 15 minutes of running the water, a second set of three bottles was filled (one acid-rinsed bottle for metals determination and two deionized-water-rinsed bottles, one for pH and specific-conductance determinations and one for sulfate, chloride, and alkalinity determinations). The bottles were collected by U.S. Geological Survey personnel within about 2 hours of sampling, and the bottles for metals analysis were acidified with reagent-grade concentrated nitric acid to a pH of less than 2. 4
Samples from the first group of 10 homes were analyzed for metals by inductively coupled plasma spectrometry by the U.S. Geological Survey National Water-Quality Laboratory, Arvada, Colo. Samples from the second group of 10 homes were analyzed for trace metals by chelation-extraction followed by atomic absorption spectrometry. Alkalinity was determined by electrometric titration to a fixed end point, chloride was determined by colorimetry, and sulfate was determined by turbidimetry. The samples were subject to the quality-assurance procedures in effect at the time of analysis.
3 Well-construction data for these homes can be found in Appendix B.
4 An interval of 2 to 3 hours between time of sample collection and time of acidification was not considered to compromise the accuracy of metals analysis. Miller and others (1985) report that acidification of water samples could be delayed for as long as 14 days after collection with little effect on lead concentrations.
11

40°
39 (
75C
EXPLANATION
Area in which tap-water samples were collected by the Atlantic County \ Health Department \
_.\ \ State Forest boundary
74°
* Townships, borough, or town in which tap-water samples were collected, this report and Kish and others (1987)
o Well with corrosion probe
Well sampled for leaching experiments
N
PENNSYLVANIA
U; Q: «* £
«T -j
U; Q
ATLANTIC CITY
0 5 10 MILESI-0 51015 KILOMETERS
CANALS
Base from U.S. Geological Survey 1:250.000 quadrangles
Figure 3.--Locations of (1) areas of tap-water sampling, (2) sources ofnatural waters for leaching experiments, and (3) wells in which corrosion probes were installed.
12

As a result of the previous study of metals in tap water conducted by the U.S. Geological Survey in Galloway Township, Atlantic County (Kish and others, 1987), the Atlantic County Health Department undertook to expand the investigation to determine if metals were leaching from plumbing elsewhere in Atlantic County (fig.3). Tap-water samples were collected by Health Department personnel in the early morning (approximately 0500 hr to 0700 hr). Samples of standing tap water were collected, followed by samples of water after 2 minutes and 15 minutes of flushing. Measurements of pH were made at the time of sampling. The samples were analyzed for lead by laboratories certified by the New Jersey Department of Environmental Protection and Energy (Debra Maher, Atlantic County Health Department, written commun., 1987).
Leaching Experiments
Copper tubing with an inner diameter of 3.175 cm was cut to 38-cm lengths, and 3.5-cm bands of lead/tin5 solder and tin/antimony solder were applied to the outside of the pipe (fig. 4). An additional set of copper pipes with 2.0-cm and 5.0-cm bands of tin/antimony solder also were prepared. The pipes were cleaned with fine steel wool, degreased with methanol, scrubbed with tap water and detergent, and rinsed repeatedly with deionized water. The pipes were suspended in polyethylene graduated cylinders, and additional copper tubing (0.476-cm inner diameter) was added to increase the surface area of copper to the equivalent of approximately 2.25 m of typical household plumbing (1.27-cm inner diameter).
Each cylinder was filled with 2.0 L (liters) of water collected from a U.S. Geological Survey observation well (QWC1A) in Lebanon State Forest, Burlington County6 . This shallow well taps the Kirkwood-Cohansey aquifer system, where the pH of the water typically is 5.0 or less. The pipes (with lead/tin solder and with tin/antimony solder) were left suspended in the cylinders for 20, 120, and 360 hours. One tin/antimony-soldered pipe was leached for 478 hours. Because the cylinders were lightly covered with plastic film, but not sealed, it was presumed that the water reached equilibrium with the atmosphere. The temperature of the laboratory of the U.S. Geological Survey office, Trenton, N.J., was approximately 23 °C (degrees Celsius), and all subsequent experiments also were carried out at room temperature.
5 The lead/tin solder used also contained some zinc. Because concentrations of zinc frequently are measured in tap-water studies, it is presumed that lead/tin solders containing zinc are used in residential plumbing systems, although zinc also can derive from brass fittings.
6 Well-construction data for this well and others from which samples were collected for leaching experiments and corrosion-rate measurements can be found in Appendix B.
13

3 INCHES
T I T 0123 CENTIMETERS
Figure 4.--Copper pipe with lead/tin soldered band used for leaching experiments.
14

A second set of experiments also involved lead/tin-soldered pipes but did not include tin/antimony-soldered pipes. In these experiments, the pipes were cut into smaller pieces and placed in 2-L polyethylene bottles. Copper pipe with lead/tin solder (a 3.5-cm band) was exposed to water from five different wells that tap the Kirkwood-Cohansey aquifer system. The water samples were selected because they represent a range of AI values and, therefore, waters of different corrosiveness, as estimated by the calculated AI values. The pipes and waters were placed in the polyethylene bottles, which were sealed tightly and wrapped in aluminum foil to prevent photoreduction of iron and to minimize exchange of gases with the atmosphere. The five wells sampled included the previously sampled Burlington County well, a public-supply well in Point Pleasant Beach, Ocean County (sample PP#10), a U.S. Geological Survey observation well in Cape May County (sample CanalS), and two New Jersey State observation wells (samples 55S and 5D) in the Mullica River basin, Burlington County. (Locations of the wells are shown in fig. 3.) The CanalS sample was taken from a well that taps the confined Cohansey Sand in Cape May; the virtual absence of wells tapping water in the unconfined system with AI at or near 12 necessitated this choice.
The observation wells were pumped according to standard U.S. Geological Survey procedures, and the bottles were filled to overflowing and tightly capped. Water from the public-supply well was collected at a tap in the pumphouse and the bottles were filled to overflowing and tighly capped. Three of the water samples (QWC1A, PP#10, and CanalS) were leached for 20, 120, and 360 hours. The remaining two samples (55S and 5D) were leached for 120 hours.
Finally, two synthetic solutions were prepared, each with initial pH of 4.6. One solution contained 900 /Jg/L of iron, 2.0 mg/L of magnesium, 4.2 mg/L of chloride, and 5.6 mg/L of sulfate. The composition of the other solution was 2.9 mg/L of magnesium, 4.8 mg/L of chloride, and 6.0 mg/L of sulfate. Hydrochloric acid was used to decrease the pH of deionized water, magnesium was added as magnesium chloride and magnesium sulfate, and ferrous iron was added as ferrous chloride. The solutions were used to leach copper pipe with 3.5 cm of lead/tin solder for 21 hours in closed polyethylene bottles wrapped with aluminum foil. The two solutions were bubbled with nitrogen for 20 minutes, and the bottles were flushed with nitrogen before being filled. Two bottles each were filled with the iron-rich and iron-free solutions. A third bottle was filled with each solution after the solution had been exposed to the atmosphere for 20 minutes.
The pH and specific conductance of the leachate from all experiments was measured in the laboratory of the U.S. Geological Survey office, Trenton, N.J., at the time the samples were prepared for analysis. Eh measurements were attempted on several samples, but because of the malfunctioning of two electrodes, those data are not considered reliable and are not reported.
Duplicate samples were generated in each leaching experiment by repeating one randomly selected leaching time. The samples were prepared for analysis by filtering them through Nuclepore 7 filters with a pore size of 0.45 micrometers. Bottles for metals analysis were acid-rinsed, and the samples
7 The use of brand, trade, and firm names is for identification purposes only and does not constitute endorsement by the U.S. Geological Survey.
15

were acidified with nitric acid to pH less than 2. Bottles for analysis of other constituents were rinsed with leachate before being filled. Blanks of deionized water were run through the filter apparatus and submitted for analysis with the leachate samples.
A full chemical analysis (pH, alkalinity, major cations and anions, metals, nutrients, and dissolved organic carbon) was done for each of the starting natural waters in the experiments. Leachate from the first experiment (column leaches) was analyzed for major cations and metals only. In subsequent experiments, full chemical analyses were done for leachate from the final leach at 360 hours.
The analyses were done at the U.S. Geological Survey National Water- Quality Laboratory. Quality-assurance procedures were those in effect at the time of analysis. Metals were determined in all leachate samples by inductively coupled plasma spectrometry8 . Tin determinations were done on most samples by graphite-furnace atomic absorption spectrometry, an analytical technique that was used for these samples only. Because the tin determinations were not done by a standard technique in use by the laboratory at the time, data on precision are lacking. The method is believed to be accurate to approximately 0.5 //g/L (J.M. Schoen, U.S. Geological Survey, written conunun., 1987). Because of the loss of some sample bottles for tin determination, the entire set of samples was not analyzed for tin. Chloride concentrations were determined colorimetrically, and sulfate concentrations were determined by turbidimetry. Alkalinity determinations were made by electrometric titration to a fixed end point. Nutrients were determined by colorimetry, and dissolved organic carbon was determined by wet oxidation. The pH and specific conductances of these samples were determined both at the laboratory of the U.S. Geological Survey office, Trenton, N.J., and at the National Water-Quality Laboratory.
Analysis of Pipe-Scale Deposits
Samples of household plumbing were obtained from plumbers in Burlington and Atlantic Counties. Selected samples of pipe scale developed during the leaching experiments also were analyzed. The mineralogy of the pipe-scale deposits was determined by X-ray diffraction (XRD) at the Geologic Division of the U.S. Geological Survey, Reston, Va. Scale deposits were scraped from the interiors of the household plumbing and from the exteriors of the experimental pipes and were ground under acetone in an agate mortar. The ground sample was mixed with amyl acetate to form a slurry, which was applied to glass microscope slides. The slides were exposed to copper K-alpha radiation at a setting of 45 kilovolts and 20 milliamperes. The samples were scanned over a range of 50 to 15 degrees 2 theta. An energy-dispersive X-ray fluorescence spectroscopy (EDAX) scan of four samples also was done to provide a semiquantitative analysis of elemental composition.
8 The dissolved constituents determined by inductively coupled plasma spectrometry are reported as: calcium, magnesium, sodium, silica, barium, beryllium, cadmium, chromium, cobalt, copper, iron, lead, manganese, modlybdenum, nickel, silver, strontium, vanadium, zinc, and lithium.
16

Measurement of Corrosion Rates
Three shallow (6.4 to 10.7 m deep) New Jersey State observation wells in the Mullica River basin were selected for in situ measurements of the corrosion rates of water from the Kirkwood-Cohansey aquifer system. The wells are located in or near Wharton State Forest (fig. 3); all are in or adjacent to wooded areas. The three observation wells chosen for corrosion probe 9 installation were selected for three reasons: (1) the well casings were polyvinyl chloride, which is chemically inert with regard to metal leaching, (2) the corrosion probes could be monitored and the wells sampled at the convenience of Survey personnel, and (3) the water tapped by each of the wells had similar chemical characteristics.
The selection was limited because, of the 51 observation wells in the Mullica River Basin in Atlantic, Burlington, and Camden Counties, more than half were destroyed or severely damaged by vandals between 1978 and 1987. Three wells, Mullica 47S, Mullica 55S, and Mullica 48S, were found to be in good condition. A carbon-steel probe was installed in 55S on December 2, 1987, and a copper probe in 47S on the same date. The third well, 48S, yields water with high dissolved-oxygen concentrations; this well was not located until April 1, 1988, at which time a second carbon-steel probe was installed. The two wells for steel-probe installation were selected because the dissolved-oxygen content of the water differed substantially (less than 1 mg/L for 55S, greater than 10 mg/L for 48S) between the two wells, although other chemical characteristics generally were similar. Locations of the three wells are shown in fig. 3. Appendix B contains selected information on well construction.
The corrosion probes were installed in the wells at the center of the well screen (fig. 5). The resistance ratio of the probes was measured each month by Survey personnel using a model CK-3 portable corrosometer. The calibration of the instrument was checked at the time of each measurement. The measurements were converted to corrosion rates in mils per year (MPY) (1 mil = 0.0254 millimeter or 0.001 inch) by the equation--
Corrosion Rate (MPY) = A Dial Reading x 0.365 x probe span,A Time (days)
where the probe span is defined as "the useable thickness or life of the probe" (Rohrback Corporation, 1985, p. 12).
9 The corrosion probes, supplied by Rohrback Cosasco Systems for use with their CK-3 portable corrosometer, are electrical-resistance probes that can be connected to the measuring instrument (the corrosometer) by a waterproof cable. The corrosometer measures resistance ratios.
17

CORROSOMETER
WATERPROOF CABLE
CORROSION PROBE
t I
1
WELL CASING
11
1
1
I___J1
WELL SCREEN
NOT TO SCALE
Figure 5.--Diagram showing the placement of corrosion probes and measurement of resistivity.
18

INTERACTIONS OF METALLIC SUBSTANCES AND ACIDIC GROUND WATER
Metals in Tap Water
Tap-water samples were collected by the Atlantic County Health Department during 1985-87 and were analyzed for lead. These data, which are not subject to the same quality-assurance procedures as U.S. Geological Survey data, are reported here for comparison with the results of the U.S. Geological Survey tap-water studies and to extend our understanding of ground-water corrosiveness to a larger area of the New Jersey Coastal Plain.
Of 54 homes sampled by the Atlantic County Health Department, 29 (53.7 percent) were found to have lead concentrations in standing tap water that exceeded the New Jersey Drinking Water Criterion and USEPA MCL of 50 /ig/L (New Jersey Department of Environmental Protection, 1985; table 1, this report). The concentrations decreased typically to less than the Drinking Water Criterion in samples taken after running the water. The ages of the homes ranged from less than 1 year to 175 years. The age of the plumbing, however, is a more useful guide to the degree of leaching likely to take place, because any new metallic surfaces will undergo active leaching. Older plumbing can be coated with mineral deposits that inhibit leaching.
The Atlantic County Health Department determined when the most recent plumbing repairs, if any, had taken place for 50 of the 54 homes sampled. For the purpose of assessing the Atlantic County Health Department data, the age of the plumbing is assumed to be the same age as the house if no repairs were reported. The problems associated with this assumption are (1) imperfect knowledge on the part of the homeowner with regard to plumbing repairs, and (2) the extent to which plumbing was replaced is not known. Further, the lead data are reported with two detection limits--less than 50 /ig/L and less than 5 /zg/L. The median plumbing age is 3.25 years; thus, many of the houses sampled were relatively new or had recent plumbing repairs. Lead concentrations in standing tap water range from less than 5 /ig/L to 2,400 /ig/L. The median concentration is 57.5 /ig/L, which exceeds the New Jersey Primary Drinking Water Criterion of 50 /ig/L. Although lead concentrations less than 50 /zg/L were measured in standing tap water from 13 houses with plumbing less than 10 years old, lead concentrations in excess of 50 /ig/L were measured in 22 houses with plumbing less than 10 years old. Only four houses in which the lead concentrations exceeded 50 /ig/L had plumbing that was believed to be 10 years old or older.
The reported pH values range from 3.8 to 7.5 with a median value of 5.2. Interestingly, 230 /ig/L of lead was found in the standing tap-water sample from a house less than 1 year old in which the pH of the tap water was measured' at 7.1 (table 2). It appears, on the basis of these data, that leaching of fresh lead solder can take place even at neutral pH. The results of the study by Kish and others (1987) substantiate this observation.
The length of time the water stood in the plumbing before sampling was not recorded. Also, as is the case with virtually all tap-water studies, the length of pipe and number of soldered joints in each house is not known. Further analysis of the data is limited by the lack of information on the length of time over which leaching occurred and the surface area of metal exposed to the water; however, the data indicate that leaching of lead did
19
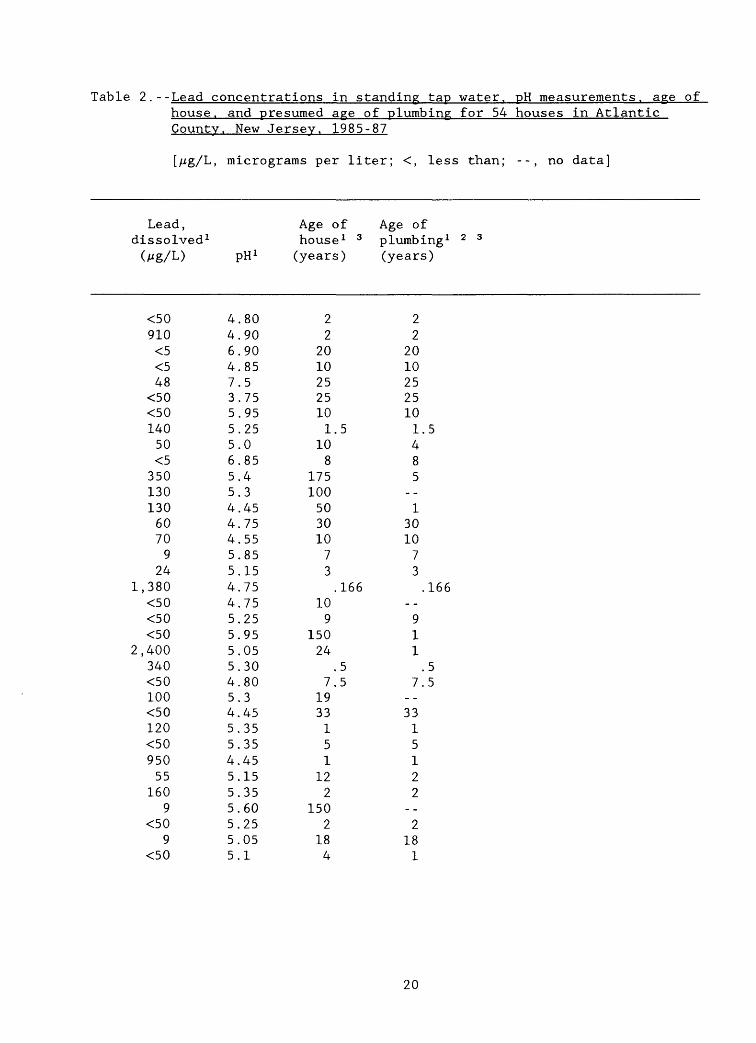
Table 2.--Lead concentrations in standing tap water. pH measurements, age ofhouse, and presumed age of plumbine for 54 houses in AtlanticCounty. New Jersey. 1985-87
[//g/L, micrograms per liter; <,
Lead, dissolved 1 (/zg/L) pH 1
<50910<5<548
<50<5014050<535013013060709
241,380<50<50<50
2,400340<50100<50120<5095055
1609
<509
<50
44647355565544455445555454554555555
.80
.90
.90
.85
.5
.75
.95
.25
.0
.85
.4
.3
.45
.75
.55
.85
.15
.75
.75
.25
.95
.05
.30
.80
.3
.45
.35
.35
.45
.15
.35
.60
.25
.05
.1
less than; --, no data]
Age of Age of house 1 3 plumbing 1 2 3
(years) (years)
22
20102525101.5
108
17510050301073.166
109
15024
.57.5
1933151
122
1502
184
22
20102525101.485
1301073
911
7.
3315122
2181
.5
,166
,55
20

Table 2.--Lead concentrations in standing tap water. pH measurements, age of house, and presumed age of plumbing for 54 houses in Atlantic County. New Jersey. 1985-87--continued
Lead, dissolved 1 (Aig/L) pH 1
156<5090
880490390<509080
340<50380200230<50<5060
<5070
4.3.5.5.5.5.4.4.4.4.5.5.6.7.4.6.5.6.6.
8585154515352580502085902180307007
Age of Age of house 1 3 plumbing 1 , 2 , 3
(years) (years)
29707
1031
20307.166
3013.5.833
12601083
357
1031
2022
213
12601083
.166
.5
.833
1 Data from Atlantic County Health Department.
2 Age of plumbing is presumed age based on homeowners' report of plumbing repairs. Presumed age is given as the age of the most recent repairs.
3 Age given as months has been converted to fraction of a year.
21

occur in a substantial number of Atlantic County homes and that age of plumbing is associated with the amount of lead leached.
Gloucester County was chosen as a site for tap-water sampling because ground water in the western, thinner part of the Kirkwood-Cohansey aquifer system appeared to be relatively less corrosive than the water in Atlantic County, judging from corrosion-index values calculated from water-quality data. Of the corrosion indices calculated, the AI was chosen to predict the corrosiveness of ground water because fewer parameters (pH, calcium hardness, and alkalinity) are required to calculate this index, whereas water-quality data required to calculate the widely used Langelier Saturation Index sometimes were lacking. The AI estimates the degree to which water is saturated with respect to calcium carbonate, and, indirectly, the degree to which water is corrosive. The assumption is that water saturated with respect to calcium carbonate is noncorrosive and that undersaturated water is corrosive, an assumption that appears to hold in many cases. An AI value of 12.0 is associated with saturation and indicates nonaggressive or noncorrosive water; values greater than 12.0 indicate supersaturation. AI values from 10.0 to 11.9 indicate moderately aggressive or corrosive water, and values less than 10.0 indicate highly aggressive or corrosive water (American Water Works Association, 1980). Table 3 lists selected water-quality data and AI values for tap-water samples from 20 homes in Franklinville, Gloucester County.
Water from the first group of 10 houses in Franklinville, Gloucester County, was sampled on February 23, 1988. Four of the houses were sampled with active in-line water-treatment systems (three pH modifiers, one water softener). Water samples collected after 15 minutes of running the water were assumed to reflect the chemistry of the ground water. The pH values measured from the 15-minute samples ranged from 4.6 to 8.3 with a median of 6.1; AI values ranged from 5.4 to 11.8 with a median of 8.1. The AI values for the homes with treatment systems ranged from 8.9 to 11.8. The houses were constructed by the same builder over a period of 2 years, and they were relatively similar in design; therefore, it could be assumed that the plumbing systems were roughly comparable in design.
According to information from the homeowners, 9 of 10 wells were constructed with polyvinyl chloride casing. The well for house 5 (Appendix B) had galvanized iron casing. The extremely large dissolved-iron concentrations in water from this well were believed to be due to bacterial action (Donald Schneider and William Atkinson, Gloucester County Health Department, oral conunun. , 1988) .
The highest copper concentrations were found in standing tap water from two of the newer homes; this indicates that age of plumbing, even on a small time scale, should not be ignored in analyzing tap-water data. In interpreting the results of the tap-water sampling, it is assumed that the concentration of metal (lead, copper, or zinc) measured in standing tap water minus the concentration of that metal measured in ground water (the 15-minute sample concentrations given in table 3) represents the amount leached from the plumbing over the time the water stood in the pipes. The scatter plot in figure 6 shows that the greatest amount of copper leached is associated with the lowest AI value (more corrosive water). Further, the smaller amounts of
22

Table 3.--Selected water-quality data and Aggressive Index (AI) values for tap-water samples collected after standing overnight and after 15 minutes of flushing from 20 homes in Franklinville. Gloucester County
[mg/L, milligrams per liter; Mg/L, micrograms per liter; <, less than; --, no data; Aggressive Index values less than 10, highly corrosive; 10 to 11.9, moderately corrosive; samples from houses 1- 10 collected February 23, 1988; samples from houses 11-20 collected August 4, 1988; metals in samples 1-10 analyzed by inductively coupled plasma spectrometry; metals in samples 11-20 analyzed by graphite furnace atomic absorption spectrometry; dissolved-lead values not shown for samples collected after 15 minutes flushing because all values were less than the minimum detection limit of 10 Mg/L for samples 1-10 and 5 Mg/L for samples 11-20]
Standing tap-water samples
Stan- dinga
House time number (hours)
i?2*
$455AC
6789
1011121314151617181920
7.258.337.759.256.505.008.505.677.177.425.497.257.33
72
8.508.178.077.758.338.00
PH
6.87.37.17.66.06.16.04.96.14.85.56.67.75.75.75.35.45.85.45.25.4
Iron, dis
solved
2051
350140
80,00072,000
58870
1,8001,1003,100
190<1030040
110480220560330180
Copper, Lead, dis- dis solved solved (Mg/L) (Mg/L)
7020
<1014032040
3,4002,100
2047050
1,0009,7004,5006,300
5001,4004,8003,7001,700
300
<10<10<10<10402040
<10<1020
<10< 569
40016
< 52035723371
Zinc , dis solved (Mg/L)
70142397
50017027036046
20057
260800900
3,40060
1,4006,6001,4001,600
120
23

tap-water samples collected afterminutes of flushing
Samples
Housenumber
xb2,3b455AC
6789
101112131415161718192020Ad
from 20 homesstanding overnight and after 15in Franklinville. Gloucester
County- -Continued
after 15 minutes of flushing
Alka linity (mg/L as
PH
6.7.7.8.6.6.5.5.6.4.5.6.5.5.6.5.5.5.5.4.4.5.
5203015116634305321990
CaC03 )
1745345426362.0
<110<110423452332132
Chloride, dis
solved(mg/L)
3122
1114121538
10141238
1412131313
.0
.7
.0
.8
.9
.1
.6
.2
.5
.2
.9
.4
Sulfate, dis solved(mg/L)
5.3.6.5.
139.4.4.
12215.
132.
<144.
16< .144.
<< '
5635
887
3
32
3
2
622
Iron, Copper, dis- dis solved solved(Aig/L) (Aig/L)
8141270940
78,00072,000
42240
1,900220
5,100340203080
12019014015095014030
<10<10<10110<10<1050
130<10<10<1060
35090
400250160709050
150110
Zinc, dis
solved(Aig/L)
12<324943
14131413377
201030
1305030
<1040807020
Aggres siveIndex
8.99.3
10.011.88.38.56.35.47.95.57.29.66.66.78.26.57.26.66.76.06.16.0
Length of time water stood in plumbing calculated from time water use ceased to time first water sample was collected, as reported by the homeowner.
House had an in-line water conditioner in service.
Tap water resampled on March 3, 1988.
Tap water resampled approximately 5 1/2 hours later on August 4, 1988.
24

4,
Q UJ
O< OC UJ UJ -I Koc 13UJ nr
3,000
O COU. ^ 2,000
Z O O O
< OOC 5
Z zUJ -oz o o
1,000
1 1 1 1 1 1 1 1 1 1 1 1 1 1 1 1 1 1 1 1 1 1 1 1 1 1 1 1 1 1 1 1 1 1 1 1 1 1 1 1
1 1 1 I 1 1 lAl 1 1 1
5 6 7 8 9 10
AGGRESSIVE INDEX VALUE
MORE CORROSIVE -*
1 1 1 1
11 12
Figure 6.--Aggressive Index (AI) values plotted against concentrations of copper leached from plumbing in 10 houses in Franklinville, Gloucester County, sampled February 23, 1988.
25

copper leached generally are associated with higher AI values (less corrosive water) . The same pattern may be seen in figure 7 , in which large amounts of zinc leached tend to be associated with low AI values. Spearman correlation coefficients for the relations between AI value and copper and AI value and zinc are -0.754 and -0.742, respectively, and are significant at the 0.01 level. The data for the amount of lead leached are not plotted, as all but three samples of standing tap water had lead concentrations below the detection limit of 10 Mg/L. Concentrations of lead above the detection limit were found in standing tap water from house 5 (40 jug/L) , house 6 (40 Mg/L) , and house 9 (20 jug/L) . None of the lead concentrations exceeded the MCL of 50
(0.05 mg/L).
Water from the second group of 10 houses in Franklinville was sampled on August 4, 1988. The ages of the houses ranged from 4 to 25 years. Plumbing had been extensively replaced in several houses, according to the homeowners , because of excessive corrosion. The amounts of metals leached at one house (house 13) are anomalously high because the water stood in the pipes for several days before sampling while the family was on vacation. The amount of copper leached was 4,410 Mg/L, and the amount of zinc leached was 870 /zg/L. Lead leaching was substantial- -394 Mg/L. Data for house 13 are not included in the subsequent figures .
Figures 8, 9, and 10 show that the AI value is a less good predictor of the extent of leaching for the second group of Franklinville homes than for the first group of homes. Spearman correlation coefficients of 0.251 for AI and copper, -0.361 for AI and lead, and 0.176 for AI and zinc are not significant. The larger range for the age of house, and presumably, for the age of plumbing, in this second group of homes compared to the first group of homes probably accounts for the lack of a strong correlation between metal leaching and corrosiveness of water as estimated by the AI .
Perhaps the most important difference between the first and second group of homes sampled is the magnitude of the leaching. The concentrations of metals in standing tap water and in the 15 -minute samples from the second group of homes are substantially higher than those reported for the first group of homes. The temperature of the water in the plumbing during the night could be responsible for the differences in metal concentrations in standing tap water, because the second group of homes was sampled in the late summer, whereas the first group was sampled in late winter. Metals typically are more soluble in warm water than in cold water. Metal concentrations in the 15- minute sample, however, also are higher for the second group of homes than for the first group. This difference between the 15 -minute samples is less likely to be related to ground-water temperatures because seasonal temperature differences probably are small in wells 15-18 m deep. The difference also could represent a fundamental difference in ground-water chemistry between the two sites. The second group of homes is located near an inactive landfill, which could be a source of copper and zinc to the ground water.
26

500
Q UJ
O DC< UJ 400UJ h-
N 0- 300u. 0O ^Z <
Q O 200
ao z
O O
100
_l 1 1 1 1 1 I 1 1 1 1 1 I 1 1 1 1 1
-
1 1 1 1 1 1 1 1 1 1 1 1 1 1 1 1 1 1
1 | 1 1 1 1 | IW I 1 | 1 1 1 1 | 1 1 1 1 | 1 1 1 1
-
-
-
-1 1 1 1 1 1 1 1 ,,, 1 1*1 1 1 1 1 1 1 1 1 , 1 1 *~
4 5 6 7 8 9 10 11
AGGRESSIVE INDEX VALUE
12
MORE CORROSIVE
Figure 7.--Aggressive Index (AI) values plotted against concentrations of zinc leached from plumbing in 10 houses in Franklinville, Gloucester County, sampled February 23, 1988.
27

O LU
O< CC LU LU
O CO
Z OO OP ccS o
Z zLU - O
Oo
IVJ.VW
9,000
8,000
7,000
6,000
5,000
4,000
3,000
2,000
1,000
O
_i i i i I i i i i I i i i i I i i i i I i i i
-
-
-
-
-
-
I
SECONDARY MAXIMUM*
~i i i i 1 i i i i 1 i 1 i i l*i i i i 1 i I i
i | i i i i | i i i i | i i i 1 . i i ._
-
-
I
-
-
-
CONTAMINANT LEVEL
i 1 i i i i 1 i i i i 1 i i i i 1 i i i i~
5 6 7 8 9 10 11
AGGRESSIVE INDEX VALUE
12
Figure 8.--Aggressive Index (AI) values plotted against concentrations of copper leached from plumbing in nine houses in Franklinville, Gloucester County, sampled August 4, 1988.
28

f ,UUU ~1 ni i i i i i i i TT I i i i i i i i i i TT i i i i i i I i i I i I i i I i i i i
Q LU
LU
6,000
5,000
O DC 2 U N °- 4,000
< DC3,000
UJ z 2,000
81,000
SECONDARY MAXIMUM CONTAMINANT LEVEL
I i i i i I i i i i Ui 1^,1 i I i i i i I i i i i I i i i i I i i i i I i i
3 4 5 6 7 8 9 10 11 12
AGGRESSIVE INDEX VALUE
MORE CORROSIVE -*
Figure 9.--Aggressive Index (AI) values plotted against concentrations of zinc leached from plumbing in nine houses in Franklinville, Gloucester County, sampled August 4, 1988.
29

oLLJIo oc< LLJLLJ H
9 *^ ^J
O ^
z cco o P o< cc£ z ^UJ Z0 -zoo
IUVS
90
80
70
60
50
40
30
20
10
n
_i i r i | i i i i | i
- I-
jjjj-
^-
I-
^-
-
-
I-
-
: i I i i 1 i I I i 1 i
I I I | I 1 I 1 | I 1 I I | I I I I | I i i I | i i i i | i I i i_
- Z
-
* ~ 1
^
MAXIMUM CONTAMINANT LEVEL -
^
* 1
-
0 I-
Ii i i 1 i i i i 1 i i i i 1 i i i i 1 i i i 1 i i i i 1 i i i i-
5 6 7 8 9 10
AGGRESSIVE INDEX VALUE
11 12
MORE CORROSIVE -*
Figure 10.--Aggressive Index (AI) values plotted against concentrations of lead leached from plumbing in nine houses in Franklinville, Gloucester County, sampled August 4, 1988.
30
Experimental Leaching of Metals
Table 4 lists water-quality data for the ground-water samples used as leaching solutions in the leaching experiments. The wells are identified by the sample name (abbreviation of site name or local identifier) used in this report. The New Jersey well numbers for these wells 10 are--
QWC1A - 050837PP#10 - 290523Canal5 - 0900485D - 05045155S - 050452
In the first set of leaching experiments, with water from an observation well (QWC1A) in Lebanon State Forest, Burlington County, the leaching solution was assumed to be in equilibrium with the atmosphere because the columns were not sealed. In columns open to the atmosphere, in which copper pipe with lead/tin solder was leached, the concentrations of copper, lead, and zinc in the leachate increased for at least 120 hours. At 360 hours, the concentrations decreased, presumably because of the formation of oxides (table 5). What appeared to be cuprite deposits were noted on the pipes; lead and zinc may have coprecipitated with the copper oxide. The data for tin concentrations are incomplete because of the loss of sample bottles; however, tin concentrations also appear to increase and then to decrease with time.
Copper pipe with tin/antimony solder reacted in a similar fashion. Three sets of pipes, each with different widths of solder (2.0, 3.5, and 5.0 cm) were leached to determine if concentrations of metals were proportional to surface area exposed to leaching solution. Most metal concentrations increased up to 120 hours and decreased at 360 hours. As the values in table 5 show, the concentrations of copper and zinc in the leachate are comparable with those determined in the copper-pipe/lead-solder leachate.
Table 5 gives leachate concentrations of five metals (copper, zinc, lead, tin, and antimony) and pH and specific conductance.
Differences in concentration as a function of exposed surface area may be seen in the zinc concentrations reported, which increase as the width of the tin/antimony solder band increases. The data are inconclusive for copper, however, in that concentrations should decrease as width of solder band increases. The behavior of tin is difficult to interpret because tin analyses are incomplete, owing to loss of sample bottles for the starting water and the 20-hour leaches. Antimony concentrations remained at less than the detection limit up to 120 hours and only increased slightly above the detection limit in 360 hours of leaching. A fourth sample (not shown in table 5) with tin/antimony solder was leached for 478 hours with water collected from well QWC1A at a later date, and the antimony concentration increased to 3 Mg/L. It is likely that the resolution of the analytical method does not always permit small but possibly meaningful differences in metal concentrations to be observed, and it is also likely that minor variability in the experimental
10 Pertinent well-construction data can be found in Appendix B.
31

Table 4.--Selected water-quality data for ground water used in leaching experiments
[mg/L, milligrams per liter; metal concentrations (copper, zinc, lead, and iron) for these samples may be found in table 5.]
Sample name PH
Calcium, Alka-dis- linitysolved (mg/L as(mg/L) CaCO )
Carbon,Chloride, Sulfate, organic, dis- dis- dis- Aggres solved solved (mg/L) (mg/L)
solved sive (mg/L) Index
COLUMN LEACHING EXPERIMENTS--OPEN TO ATMOSPHERE
QWC1A 5.2 1.2 2 3.6 9.4 1.2 6.0
SEALED BOTTLE EXPERIMENTS--CLOSED TO ATMOSPHERE
1.2 2 3.9 10 .7 5.6
53 12 230 12 4.0 9.7
19 119 15 3.6 1.2 11.5
.5 11 3.5 5.3 4.1 6.8
25 88 8.3 8.6 1.0 12.0
QWC1A
PP#10
CanalS
55S
5D
4.
6.
7.
5.
8.
8
5
7
6
2
32

Table 5 .- -Concentrations of selected constituents in leachate from column leaching experiments (open to atmosphere) on copper pipe with lead/tin solder and tin/antimony solder
[//g/L, micrograms per liter; mg/L, milligrams per liter; /iS/cm, micros iemens per centimeter; n.d., not done; <, less than]
Anti-Leach- Copper, Zinc, Lead, Tin, Iron, mony, Specific ing dis- dis- dis- dis- dis- dis- conduct- time solved solved solved solved solved solved pH ance(hours) (/ig/L) (/ig/L) (/ig/L) (Mg/L) (/*g/L) (/ig/L) (//S/cm)
QWC1A LEACHATE: COPPER PIPE WITH LEAD/TIN SOLDER--3.5 CM SOLDER BAND 1
020
120360
102,7005,8002,600
12129200150
2,0002,6001,500
n. d. n.d. 1.5 .5
520 <34
5.2 5.8 6.4 6.1
43465345
QWC1A LEACHATE: COPPER PIPE WITH TIN/ANTIMONY SOLDER--2.0-CM SOLDER BAND
020
120360
103,2004,0001,800
12828792 10
n.d. n. d. 7.5 3.5
<3 <3
5.2 5.8 6.1 5.8
43464841
QWC1A LEACHATE: COPPER PIPE WITH TIN/ANTIMONY SOLDER--3.5-CM SOLDER BAND
020
120360
103,1004,6002,100
12909697
<10 n.d.<10 n.d.10 4.5
<10 5.0
510<33
<1 5.2<1 5.8<1 6.21 6.0
43455041
1 Deionized water blanks collected from filter apparatus after filtering samples at 20 and 120 hours contained up to 10 //g/L of zinc. No other metals were above detection limits in the other deionized water blanks for this experiment.
33

Table 5.--Concentrations of selected constituents in leachate from column leaching experiments (open to atmosphere) on copper pipe with lead/tin solder and tin/antimony solder--continued
Anti-Leach- Copper, Zinc, Lead, Tin, Iron, mony, Specific ing dis- dis- dis- dis- dis- dis- conduct- time solved solved solved solved solved solved pH ance(hours) (/ig/L) (/ig/L) (/ig/L) (/ig/L) (/ig/L) (/ig/L) (/iS/cm)
QWC1A LEACHATE: COPPER PIPE WITH TIN/ANTIMONY SOLDER--5.0-CM SOLDER BAND
020
120360
103,3004,7001,300
1296
190129
10 n.d. n. d. 7.5 6.5
56
<3 3 6.0
43465041
34

environment may affect the degree to which leaching occurs. At a gross level, the experiment indicated that copper concentrations generally increased and then decreased with time; the decrease is probably due to the precipitation of copper oxides. Further, detectable amounts of antimony did not leach from tin/antimony solder over periods of a few days. This latter finding agrees with the results of a study of tin/antimony-solder leaching by Herrera and others (1982), who point out that, because tin is a more active metal than antimony, corrosion of tin is favored. As table 5 illustrates, the amount of tin leached at 120 and 360 hours was relatively small (3.5-7.5 /^g/L).
The second set of experiments, with copper pipe and lead/tin solder, involved closed containers. The AI values calculated for the water samples used to leach the pipe and solder ranged from 5.6 to 12.0, which indicate highly corrosive to noncorrosive water (a value of 12.0 indicates noncorrosive water). Copper concentrations increased in the leachate up to 20 hours for three samples (QWC1A, PP#10, and CanalS; table 6). For the highly corrosive water (QWC1A), copper concentrations continued to increase up to 360 hours. Copper concentrations increased in moderately corrosive water (CanalS) up to 120 hours and then decreased, whereas copper concentrations in water from PP#10, which was considered more corrosive than water from CanalS but less corrosive than water from QWC1A, decreased after 120 hours and apparently continued to decrease up to 360 hours. The contrasting behavior between copper in highly and moderately corrosive water probably is due, in part, to differences in initial pH and alkalinity. Undoubtedly, differences in Eh between waters also are important. Unfortunately, reliable Eh measurements could not be made because of electrode malfunctions.
Zinc concentrations, initially relatively large in water from QWC1A and CanalS, decreased over 20 hours of leaching and continued to decrease in CanalS leachate; however, zinc concentrations increased in QWC1A leachate at 120 hours and continued to increase until 360 hours. Zinc concentrations in PP#10 leachate increased until 120 hours and decreased thereafter (table 6). The variation in zinc concentrations for each leaching solution is not easily understood but may be related in part, to analytical precision; the initial solutions contained concentrations that were similar to the concentrations in the leachate in QWC1A and PP#10. Zinc is apparently present in the solder in small amounts; the data indicate that very little leaching of zinc occurred, although concentrations in leachate from QWC1A and 55S increased over the initial concentration.
The leaching experiments were done to determine whether the initial AI was a good measure of the corrosiveness of the water towards various metals. The data shown in figures 11-13 indicate that the AI is an adequate measure of the corro-siveness of natural waters towards copper in that the largest concentration of copper leached is associated with the lowest AI value, and the concentrations generally decrease as AI value increases. The data shown in figures 14-16, however, indicate that factors other than pH, alkalinity, and calcium hardness must be affecting the leaching of lead. The scope of the project did not permit a detailed investigation into the factors affecting lead leaching; nonetheless, the data gathered during the experiments give some insight into these factors.
35

Table 6.--Concentrat ions of selected constituents in leachate from sealed-bottle (closed to atmosphere) leaching experiments on copper pipe with lead/tin solder
micrograms per liter; /iS/cm, microsiemens per centimeter; n.d., not done; duplicate bottles containing copper pipe with lead/tin solder bands were leached for the same period of time for each set of samples; <, less than]
Leach ingtime(hours)
Copper, dissolved(M9/L)
Zinc, dissolvedU9/L)
Lead, dissolved(M9/D
Tin, dissolved(M9/D
Iron, dissolved(M9/D
Manganese, dissolved(M9/D
Alumi -num, dissolved pH(M9/L)
Alka linity
(mg/L asCaCOa)
Specific conductance(Ats/cm)
QWC1A LEACHATE
020120120360
2,1005,2005,2006,100
4022355344
10 <0.5 920 11
2,0002,1004,000
50 3 3
<3
4042434244
220 n.d. n.d. n.d. 20
4.85.45.55.6 5.9
2n.d. n.d. n.d. 12
4042484950
PP#10 LEACHATE
020
120360360
1601528413937
101,0004,0003,3003,200
<.5 8,900 3901.7
32 n.d. n.d.
1,700470
55
370360360370
n.d. n.d.
6.55.96.0 6.0 5.9
1213141414
799785782809800
CANALS LEACHATE
020 120a
120 360
509016050
3917 13 16 <3
<10 n.d.1,400 8.2
230 141,300 <.5
590 n.d.
62 4
41 <3 <3
1313131310
n.d. n.d. n.d.
7.7 6.3 6.7 6.9 7.6
119122122126126
280282287282280
55S LEACHATE 1
0120 1,200
<3
14 7,100n.d 18
6,9003,000
2922
160 n.d.
5.6 5.6
11 n.d.
3837
50 LEACHATE
0 120
<10 <3 380 <3
<10 n.d. 220 100 7.3 <3
53 49
<10 8.2 n.d. 6.6
88 n.d.
193 217
Lack of agreement between the duplicate samples leached for 120 hours appears to be the result of a poorly fitting cap on one bottle. The leachate from the second 120-hour leach listed, which had iron concentrations below the detection limit of 3 ^g/L, appears to have been affected by contact with the atmosphere.
Deionized-water blank collected from filter apparatus after filtering 120-hour leachate samples from 50 and 55S contained 20 /xg/L lead. No other metal concentrations were detected in the blank.
36

CC 8,000 UJI-
S 7.000
CO
O cc
O<UJ
ccLU 0. Q.O OU.OZO
DCI- Z LU OZo o
6,000
- 5,000 UJ
4.000
3.000
2.000
1,000
QWC1A
PP* 10 CANALSI .I . I
6 78 9 10
AGGRESSIVE INDEX VALUE
11 12
MORE CORROSIVE
Figure 11.--Copper concentrations in leachate from copper pipe with lead/tin solder leached for 20 hours in closed containers, plotted as a function of Aggressive Index value for the leaching solution.
37

UJ
CO
GC O O GC O
Z
GC
Q.
8LL O
Z O
UJ O
O
7.000
6,000
± 5,000
UJ
< 4,000 UJ
3,000
2.000
1,000
I . I
QWC1A
55S
5D-
PP*10 CANALS -_i__I__i ^ I__i__i w
6 78 9 10
AGGRESSIVE INDEX VALUE
11 12
MORE CORROSIVE -*
Figure 12.--Copper concentrations in leachate from copper pipe with lead/tin solder leached for 120 hours in closed containers, plotted as a function of Aggressive Index value for the leaching solution.
38

LU
J DC
CO
DC
DC O
a. O oLL OZ O
LU O
o o
8.000
7,000
6,000
± 5.000
LU
< 4,000 UJ
3.000
2,000
1.000
QWC1A
PP*10J u*_L
CANAL5-l
6 78 9 10
AGGRESSIVE INDEX VALUE
11 12
MORE CORROSIVE
Figure 13.--Copper concentrations in leachate from copper pipe with lead/tin solder leached for 360 hours in closed containers, plotted as a function of Aggressive Index value for the leaching solution.
39

8.000CC UJ
O
O O
7 - 000
6,000
DC UJ Q.CO5
DC CD O CC O5̂
5.000
UJ
O 4,000
UJ-J
§ 3.000UJ-Ju. OZ 2,000 O
1 .000
CANALS
QWC1A PP*10
6 7 8 9 10
AGGRESSIVE INDEX VALUE
11
MORE CORROSIVE
Figure 14.--Lead concentrations in leachate from copper pipe with lead/tin solder leached for 20 hours in closed containers, plotted as a function of Aggressive Index value for the leaching solution.
40

ccUJ
CC LU 0.CO
< DCOaDC
zUJ
UJ_JzO
UJ_JLL O
g !cDC
Z UJ O
O O
8,000
7,000
6,000
5.000
4,000
3.000
2.000
1.000
I ' I
55S
PP«MO
QWC1A
CANALS5D
6 78 9 10 AGGRESSIVE INDEX VALUE
11 12
MORE CORROSIVE -*
Figure 15.--Lead concentrations in leachate from copper pipe with lead/tin solder leached for 120 hours in closed containers, plotted as a function of Aggressive Index value for the leaching solution.
41

OC HI
0. CO
HI
Zo
oo o
8,000
7 - 000
g 6,000O OC O2 Z 5,000
HI
XO 4,000
HI_JZ
3.000
2,000
1,000
QWC1A
PP*10
CANALS
6 78 9 10
AGGRESSIVE INDEX VALUE
11 12
MORE CORROSIVE -*-
Figure 16.--Lead concentrations in leachate from copper pipe with lead/tin solder leached for 360 hours in closed containers, plotted as a function of Aggressive Index value for the leaching solution.
42

The experiments were designed, in large part, to test the viability of an initial AI value as a measure of corrosiveness, and it is the initial AI value that is plotted in figures 11-16; however, from the data for the different leaching times shown in table 6, it can be seen that the AI of a given solution undoubtedly changed during the period of leaching. Calcium concentrations and, therefore, calcium hardness, did not change during the periods of leaching. But the pH values listed in table 6 indicate that pH and, therefore, AI, changed during the 360 hours of leaching for QWC1A, PP#10, and Canal5, and during 120 hours of leaching for 5D. Alkalinity concentrations, where measured, changed as well. Although a consistent pattern of increasing alkalinity over the period of leaching is indicated, the pattern for pH is more variable. Because of the chemical complexity of the waters used as leaching solutions, a number of reactions are likely to have been taking place in solution, some of which would affect pH and alkalinity.
The reactions most pertinent to the leaching experiments involve oxidation and reduction of the various metals in the plumbing materials and metal ions in solution, precipitation of metal hydroxides or oxides, and reactions involving dissolved organic carbon (DOC). Also, as may be seen in the table of oxidation potentials (table 7), hydrogen ion (H ) can be reduced to hydrogen gas (H2 ) as zinc, tin, and lead are oxidized.
Clearly, lead and copper were oxidized, because concentrations in leachate increased over the initial concentrations during part, if not all, of the leaching period. A clue to some of the other reactions may be found in the variations in pH for the different leaching solutions (table 6). For PP#10 and Canal5, the initial pH decreased at the 20-hour leach and then increased gradually. The inital pH for 5D also had decreased at the 120-hour leach. Reactions that generate hydrogen ion, and therefore decrease pH, include the oxidation of Fe 2 and subsequent precipitation of ferric hydroxide and the complexation of metal ions by DOC or hydroxides (Appendix A).
Redox reactions involving nitrogen species, including the processes of nitrification and dentrification, also generate or consume hydrogen ion, thus decreasing or increasing the pH of natural waters (Appendix A). Nitrate concentrations in initial leaching solutions and in final leachates remained constant; ammonium ion (NH 4 ) concentrations in initial and final solutions tended to vary, however. It is not clear to what degree bacterial activity would be a factor in the leachate, as the elevated metal concentrations in the various leachates could be expected to kill bacteria.
As leaching proceeded, precipitation of metal oxides or hydroxides appears likely, as indicated by changes in the aqueous chemistry of the leachate and also by the presence of oxide films on some of the plumbing materials being leached. Aluminum concentrations were below the detection limit of 10 //g/L in most of the leaching solutions. In QWClA, a decrease in aluminum concentrations from 220 /ig/L in the initial solution to 20 ^g/L in the final solution (table 6) indicates that aluminum could have been removed from the aqueous phase. The data in table 6 demonstrate that manganese concentrations generally did not change significantly throughout the leaching period, and therefore it appears likely that manganese did not precipitate as an oxide or hydroxide. On the other hand, dissolved-iron concentrations did
43
Table 7.--Standard electrode potentials for selected substances in acid solutions
[Values given are for all substances at unit activity, temperature of 25 °C, and pressure of 1 atmosphere. The value of the electrode potential for each half-reaction is given relative to the H^-H half- reaction, which has been assigned the value of zero. The table is arranged with the strongest reducing agent at the top and the strongest oxidizing agent at the bottom. The half-reactions are written with the reduced form on the left and the oxidized form on the right. Data are taken from Krauskopf (1967) , Appendix IX. The IUPAC convention of writing half-reactions as reductions is not followed here because the emphasis in this report has been on the oxidation of various metals; therefore, the half-reactions are written in the opposite direction from some more current texts, such as Stumm and Morgan (1981).]
Half -reaction
Zn -> Zn2+ + 2e
Fe -+ Fe2+ + 2e
2+Sn -+ Sn
2H+
2e
Pb -> Pb 2+ + 2e
2e
Electrode potential (volts)
-0.76
- .44
- .14
- .13
.00
Sn2+ -+ Sn4+ + 2e
~ + ~ 2+Cu -> Cu + e
2 "
2+ Cu -+ Cu + 2e
8H 8e
Cu -+ Cu + e
Fe2+ -* Fe3+ + '
Fe2+ + 3 HO -+ Fe(OH) + 3H+ + e
Mn++ + 2H 0 -> MnO + 4H+ + 2e~
Pb2+ + 2H 0 -+ PbO + 4H+ + 2e"
+ .15
+ .16
+ .16
+ .34
+ .52
+ .77
+1.06
+1.23
+1.46
44

change substantially over the leaching periods. A plausible interpretation of the decrease of dissolved iron in solution is that Fe 2 was oxidized to Fe 3 and precipitated as a hydroxide. Some of the metal ions leached from the plumbing materials may have been adsorbed to the iron hydroxide.
Figure 17 shows Eh-pH diagrams from Krauskopf (1967, figures 9-2 and 9-3) for some of the predominant metals (copper, lead, and iron) in the leachate and in the natural waters used as leaching solutions. Activity of the Cu and Pb ions is 10 5 molar, which is similar to the concentrations of Cu and Pb found in leachate from the leaching experiments. Activity of the iron ions is 10 7 and 1 molar, which includes the range of iron concentrations found in the leaching solutions. In the Eh-pH range appropriate to the natural waters and leachate, copper ions (Cu and Cu2 ) are in equilibrium with metallic copper at low pH, and Cu2 remains in solution as pH increases. Copper oxides and hydroxides also are equilibrium phases in the pH range from approximately 5 to 8, which encompasses the pH range of the leachates. Lead ion (Pb 2 ) remains in solution, except under oxidizing conditions and relatively high pH, and ferrous iron (Fe 2 ) and ferric hydroxide (Fe(OH3 )) are equilibrium phases as well. The boundary between the fields for ferrous ion and ferric hydroxide can be seen to shift in response to the molar concentration of iron present.
It is not known if the dissolved constituents in the leachates and the mineral deposits on the plumbing materials were in chemical equilibrium; insofar as concentrations of metals changed over time in most leachate samples, it is likely that equilibrium generally was not achieved. Some of the phases indicated in the Eh-pH diagrams (fig. 17), however, appear to have been present.
The role of DOC in the leaching solutions is more difficult to assess. DOC in the water used for leaching ranged from 0.7 mg/L for QWC1A to 4.1 mg/L for 55S (table 4). Complexation with humic acids, an important component of dissolved organic matter, may keep certain metals in solution over a pH range of about 3 to 9 (Elder, 1988, p. 17). Humics can precipitate at pH less than 3, however, and remove metals from solution (Elder, 1988, p. 17). It is not known if acidification of the sample for metals analysis could have caused humics to precipitate; this could be a factor in the small concentrations of copper found in leachate from PP#10. However, copper concentrations are elevated in leachate from 55S, which contained the largest concentrations of DOC. (See tables 4 and 6.) Concentrations of DOC decreased in PP#10 leachate from 4.0 mg/L in the starting solution at zero hours to 1.0 mg/L in the final solution at 360 hours. Conversely, DOC concentrations increased in QWC1A leachate from 0.7 mg/L in the starting solution to 1.2 mg/L in the final solution at 360 hours. The change in DOC concentration in the QWC1A leachate is relatively small and may not reflect any geochemical process, but rather may represent analytical error. The change in DOC in the PP#10 leachate, however, is relatively large. Because the leachate samples were analyzed for constituents other than metals only at zero and 360 hours, it is not known if the differences in DOC noted above constitute a trend or are part of a more complex pattern.
Analyses of leachate from duplicate bottles indicate that results of the leaching experiments generally appear to be reproducible. The only exception is data from a CanalS bottle with an ill-fitting cap that permitted
45

0.6
-
1.4
1.2
1.0
0.8
0.6
0.4
a
0.2
0.0
-0.2
-0.4
-0.6
- Fe
B \
b
[Fe
++]=
l(r
7
_i_
_*
^ i
0 24
6
8 10
PH
12
14
Figu
re 17.--Eh-pH diagrams fo
r (a
) copper,
lead,
manganese,
nickel,
gold,
and
silver,
and (b
) iron.
(Dia
gram
s from Krauskopf, 1967,
reproduced
with permission.)

interaction between atmosphere and solution. In the leachate from this bottle, precipitation of a solid phase appeared to take place before precipitation occurred in the duplicate bottle; lower iron concentrations resulted in leachate from the bottle with the leaky cap.
Overall, the leaching experiments indicate that the AI value appears to be an adequate predictor of the severity of copper leaching. The results for lead leaching are less straightforward.
The third and final set of leaching experiments, with synthetic solutions as leaching solution, were undertaken to provide a simplified chemical system in which the role of dissolved iron with respect to metal leaching could be examined. The experiments were intended only to provide information that might be useful in the interpretation of previous leaching experiments and to indicate possible electrochemical relations for exploration in the future. The experiments were not expected to provide final answers. Previous leaching experiments involved natural waters, which differed with regard to many chemical constituents. The synthetic solutions were prepared with a minimum number of constituents and with pH and concentrations of chloride and sulfate as similar as possible. No carbonate was added, and alkalinity was expected to derive only from any dissolved carbon dioxide; hydroxyl ion was anticipated to be negligible. The concentrations of constituents and pH value were chosen to produce chemically simple solutions that were similar in some major constitutents to samples of corrosive water from the Kirkwood-Cohansey aquifer system. One solution was prepared with 900 //g/L of iron, added as iron II (from ferrous chloride); the other was prepared as an "iron-free" solution, with magnesium chloride. Trace amounts of iron were present, however, in the iron-free solution. Part of the experiment was performed under nitrogen to prevent oxidation of iron II by exposure to atmospheric oxygen. For each set of solutions, two metal samples were leached by solution kept under nitrogen, and one sample was leached by solution previously exposed to the atmosphere. The composition of the initial solutions and the leachates is presented in table 8.
The "iron-free" solution in contact with copper pipe and lead/tin solder essentially represented a four-metal system (copper, lead, tin, and zinc), whereas the iron-rich solution represented a five-metal system. Tin analyses were not done because the analytical equipment was not available at the time. Of the samples listed in table 8, those numbered 1 and 2 were the results of leaching with water bubbled with nitrogen to remove dissolved oxygen; the water was then exposed to the atmosphere in leachates numbered 3.
After 21 hours of leaching, pH increased from 4.6 to 5.3 or 5.4 in all samples. Magnesium and chloride concentrations did not vary throughout the period of leaching, except within the bounds of analytical error. Sulfate concentrations decreased in all samples during leaching, especially in samples 1 and 2, which had been maintained under nitrogen.
As anticipated, metal concentrations varied. Iron concentrations are smaller in the iron-rich leachates (1,2,and 3) than in the starting solution (0). The decrease in iron concentrations may indicate that some iron was oxidized from Fe 2 to Fe 3 and precipitated as a solid at some time during the 21-hour leaching period, despite the nitrogen atmosphere. This could occur if dissolved oxygen, which was not measured, had not been completely removed from
47

Table 8 .- -Concentrations of constituents in synthetic solutions and leachatefrom sealed-bottle leaching experiments on copper pipe with lead/tin solder
[mg/L, milligrams per liter; /^g/L, micrograms per liter; <, less than; samples 1 and 2 were leached by solutions under nitrogen, and samples 3 were leached by solutions exposed to atmosphere.]
Magne- Chlor-Sam- Leach- sium, Iron, Copper, Lead, Zinc, ide, Sulfate,pie ing dis- dis- dis- dis- dis- dis- dis-num- time pH solved solved solved solved solved solved solvedber (hours) (mg/L) (jug/L) (jug/L) (//g/L) (jug/L) (mg/L) (mg/L)
IRON-LEACH LEACHATE
0212121
0212121
4.65.45.35.4
2.01.92.02.0
900450480380
<10950
1,000720
<10860380
2,200
<3847630
MAGNESIUM-LEACH LEACHATE
4.6 2.9 35.3 2.8 135.4 2.8 75.4 2.9 21
390330590
7001,200
520
6120160100
4.2 4.24.24.3
4.8 4.84.84.9
5.64.95.0 5.2
6.05.65.75.8
48

the system by bubbling the solution with nitrogen. Alternatively, zinc could reduce iron. The lowest iron concentration was present in leachate 3, the initial solution of which had been exposed to the atmosphere.
Copper concentrations in leachate varied directly with ironconcentrations and were substantially smaller in the iron-free leachates than in the iron-rich leachates. Copper appears to leach more readily in the synthetic solutions in the presence of dissolved iron, which probably was in solution initially as Fe 2 . Copper concentrations in both sets of samples 1 and 2, which were intended as duplicate samples, are reasonably comparable. The concentrations of lead in the leachates contrasts with that of copper. In the duplicate samples (1 and 2), lead concentrations are not comparable. This may be because lead responds more readily to small variations in dissolved oxygen than does copper; lead is more easily oxidized than copper. (See table 7.) In the samples numbered 3 in which the solution was exposed to the atmosphere, lead concentrations were larger in the iron-rich solution than in the iron-free solution. Copper concentrations also were larger in the iron- rich sample 3 than in the iron-free sample 3.
Zinc concentrations were larger in the iron-free solutions than in the iron-rich solutions. In both samples numbered 3, zinc concentrations were smaller than in the two sets of samples kept under nitrogen (samples 1 and 2).
Overall, lead concentrations tended to vary inversely with iron concentrations in the synthetic solutions. Lead concentrations also varied inversely with copper concentrations. Copper is a less active metal than lead; therefore, oxidation of lead should result in reduction of copper and suppression of copper leaching, assuming a galvanic cell between the two metals. Zinc, the most easily oxidized metal in the experimental solution, was more easily dissolved in the iron-free solutions. The role of tin, unfortunately, could not be assessed in these solutions. Sulfate concentrations decreased slightly in all leachates.
In the absence of metallic iron, iron redox reactions in an aqueous system typically involve either Fe 2 and iron sulfide or Fe 3 and iron-III hydroxides in ionic or solid form, as illustrated in fig. 18 where the activity of sulfur species is 96 mg/L as sulfate ion (S0 4 2 ), carbon-dioxide- species activity is 61 mg/L as bicarbonate ion (HC0 3 ), and dissolved-iron activity is 56 /zg/L per liter. Although the sulfate concentration dropped from 5.6 mg/L in the initial iron-rich synthetic solution to approximately 5 mg/L in the subsequent leachates, it is not known if conditions were appropriate for the reduction of sulfate. Sulfate reduction would not occur if Fe 2 was oxidized, but could occur if zinc and lead were oxidized. The sulfate reduction reaction is, however, very slow unless bacterially mediated (Krauskopf, 1967). The synthetic solutions were undoubtedly not sterile, but it is not known what bacterial populations were present or whether the elevated metal concentrations could have proved lethal to the bacteria.
Although two sets of samples were bubbled with nitrogen and the leaching solutions were kept under nitrogen, it is possible that significant amounts of dissolved oxygen may have remained. Dissolved-oxygen concentrations were not measured because the apparatus design would have been more complex and expensive had an oxygen probe been installed. Additionally, the available field probes could not have accurately measured concentrations less than
49

CO
b §
LLJ
1.40
1.20
1.00
0.80
0.60
0.40
0.20
0.00
-0.20
-0.40
-0.60
-0.80
-1.00
Water oxidizedFeOH 2*
Fe(OH) +
Feu^^*
Water reduced
i I i I i I i6 8 10 12 14
PH
Figure 18.--Eh-pH diagram for solid and dissolved forms of iron at 25 degrees Celsius and 1 atmosphere pressure (From Hem, 1985, fig. 14, p. 80)
50

0.01 mg/L. Thus the atmospheres under which the leaching took place can only be known as relatively more or less oxygenated. Knowledge of the concentration of dissolved oxygen would be useful in interpreting the results of these experiments. If dissolved oxygen remained in solution, some iron may have been oxidized and precipitated as iron hydroxide. Which set or sets of redox reactions dominated during the 21 hours of leaching would be controlled by the kinetics of the reactions. Oxidation of iron II is a slow process below pH 6, although the process can be microbially mediated. Catalysts such as trace amounts of Cu2 can increase the reaction rate (Stumm and Morgan, 1981, p. 465). In the various leachates generated in this study, however, copper was generally not present in trace amounts.
The results of the experiments with synthetic solutions indicate that, even with chemical systems simpler than those of the natural waters investigated in this study, interpretation of the leachate concentrations and the reactions they represent is not easy. The addition of another metal (in this study, iron) that can participate in redox reactions has a significant effect on the amounts of the metals that leach from plumbing materials. The amount of iron that must be present to exert an influence on the corrosion process was not determined by these studies, but concentrations of 900 ^g/L were observed to have an effect.
The experiments indicate that, although the AI (based on pH, calcium hardness, and alkalinity) appears to be an adequate, if rather gross, measure of the corrosiveness of water from the Kirkwood-Cohansey aquifer system towards copper, it is somewhat erratic in estimating the corrosiveness of water with regard to lead. Further, concentrations of dissolved iron appear to play a role in the amounts of metals leached. Although not an unexpected result, the implications are important for understanding the corrosiveness of water from the Kirkwood-Cohansey aquifer system, in which dissolved iron can be present in concentrations in excess of 900 /*g/L (table 6). Concentrations of dissolved iron ranging from 1,000 to 5,000 /*g/L are not uncommon in relatively reducing waters, and concentrations as high as 27,000 /*g/L have been reported (Harriman and Sargent, 1985).
Dissolved organic carbon also undoubtedly plays a role in the amounts of metals that enter and remain in solution, and dissolved oxygen is clearly an important factor in the redox reactions that take place. The experimental results appear to indicate that lead leaching can be more responsive to differing concentrations of dissolved oxygen than is copper leaching. The role of sulfate in the leaching reactions is not well understood; however, sulfate appears to be involved in reactions, at least in the synthetic solutions. Small concentrations of chloride, such as those found in the synthetic solutions and all natural waters except PP#10, did not appear to enter into any reactions, inasmuch as the concentrations did not change. Chloride concentrations in PP#10 starting water and final leachate decreased by 10 mg/L, from 230 to 220 mg/L. Whether this represents the formation of metal chlorides or is merely analytical imprecision is not known. Chloride is known to cause pitting corrosion in metals (Singley, 1985, p. 16); to determine the effects of variability in concentrations of chloride in iron- rich and iron-free waters will require further investigation.
51

Composition of Pipe Scale
Pipe-scale deposits from copper pipe exposed to untreated water from domestic wells and to treated water from public supply wells were analyzed by XRD to determine the mineral phases present. In the samples analyzed 11 , the deposits formed on cold-water pipe interiors exposed to untreated water from the Kirkwood-Cohansey aquifer system are iron oxides. Geothite was detected as a crystalline phase in sample LINW, and gibbsite (hydrous aluminum oxide) also was tentatively identified. The texture of the iron-oxide coatings differed among the pipes examined. Discontinuous, roughly textured deposits were noted on one pipe (LINW), whereas a relatively smooth and continuous coating was noted on another (fig. 19). Copper pipe from a hot-water heater connection (samples ABS-H, ABS-C) was coated with a deposit of magnetite, a product of the reducing conditions typical of hot-water heating systems.
In contrast to the deposits associated with untreated water, the scale deposit formed on pipe carrying treated water (sample OCE) is composed of malachite (a copper carbonate) and para-atacamite (a copper chloride). The deposits formed on the copper pipes leached as part of the laboratory experiments appear to be copper oxides, which do not resemble the deposits found on plumbing samples, perhaps because the water used in most of the leaching experiments did not have high concentrations of dissolved iron (PP#10 was the exception). Further, the deposits on plumbing from Coastal Plain homes have built up over a number of years, whereas the experimental deposits formed in a matter of days. The EDAX scans of four samples yielded semiquan- titative compositions of the pipe scale (table 9), and the results indicate that copper, lead, and zinc either coprecipitate with iron oxide deposits or adsorb to the iron oxide. If copper, lead, and zinc formed separate mineral phases, they apparently constituted less than about 5 percent of the mineral phases present and thus were not detected in the XRD data. It appears more likely that lead, copper, and zinc are adsorbed to the iron oxide.
The results of visual inspection and the XRD analyses of the plumbing materials indicate that the iron oxide coatings that form on pipe interiors can be variable in texture and may consist of more than one mineral phase, as with sample LINW. According to the plumber who provided the sample, the plumbing was installed nearly 30 years ago (E.T. Stanton, Northfield, N.J., oral commun., 1987); however, the rough, discontinuous texture of the pipe scale may have been less effective in preventing leaching than the smoother texture of the deposit found on sample PRLA. The possible presence of gibbsite as a pipe-scale phase in sample LINW also indicates that the water passing through that plumbing system may have had elevated concentrations of aluminum as well as iron. Elevated aluminum concentrations (1,000 Mg/L or greater) in water from the Kirkwood-Cohansey aquifer system are common.
11 Samples are copper pipe from (a) Linwood, Atlantic County (LINW), dating from 1958; (b) hot-water heater in Absecon, Atlantic County (ABS-H, ABS-C), dating from 1978; (c) copper pipe carrying treated water from Ocean City, Atlantic County (OCE); (d) copper pipe from Presidential Lakes, Burlington County, dating from approximately 1978 (PRLA); and (e) leaching experiment using water from QWClA in Lebanon State Forest, Burlington County (4187).
52

PRLA
LINW
2_L
3 INCHES
3 CENTIMETERS
Figure 19.--Examples of discontinuous, rough iron oxide deposits (LINW), and smooth, continuous iron oxide deposits (PRLA) on the interior of two copper pipes.
53

Table 9.--Semiquantitative analyses of elements present in pipe-scale deposits
Sample 1 Major elements
LINW Fe, Al, Cu
ABS-H Fe, Cu
ABS-C Fe, Cu
Minor elements
Si, P, Zn, S
Mg, Si, Zn
Si, Al, S, Mg, Zn, Pb, Sn,
4187 Cu, Sn
Pb (100 to 500 parts per million)
Zn, Zr, Sr, Ni, Fe, Ca,Pb (100 to 500 parts per million)
1 Samples are copper pipe from (a) Linwood, Atlantic County (LINW), dating from 1958, (b) hot-water heater in Absecon, Atlantic County (ABS-H, ABS-C), dating from 1978, (c) leaching experiment using ground water from QWC1A in Lebanon State Forest, Burlington County (4187).
54

Corrosion Rates
The chemistry of water from the three observation wells in which corrosion probes were installed is similar in major ions, pH, and AI values, but is different in other ways. Selected water-quality characteristics are listed in table 10. A clear difference between water from 55S and 48S is seen in the dissolved-oxygen concentrations, which are larger in water from well 48S. Another related chemical difference is the concentration of dissolved iron, which is substantially larger in water from well 55S than in water from the other two wells.
Although the pH of water from 55S is slightly higher than the pH of water from 48S, the substantial difference in corrosion rates, shown in figure 20, is more likely because of the large difference in dissolved-oxygen concentrations rather than to the small difference in pH. Figure 21 shows the two carbon-steel probes, which were retrieved in September 1988. The probe from 55S is relatively clean, whereas the probe from 48S is encrusted with iron oxide. The condition of the probe from 48S attests to the importance of dissolved oxygen in the corrosion process. The increasing thickness with time of the iron oxide coating probably explains the decreasing corrosion rate for the 48S probe (fig. 20). The increasing rate shown for the 55S probe (fig. 20) is probably related to increasing water temperature through spring and summer (the wells were shallow and water temperatures varied seasonally). In a completely inorganic system, metal solubility tends to increase as temperature increases. Increasing temperature also is likely to result in increased bacterial activity, which can promote iron corrosion.
The corrosion rates for the copper probe, installed in well 47S, are much lower than those measured for the carbon-steel probes. The data for the 47S probe were not collected until March 1988 because the wellhead was buried by excavations for a new State Forest fire lane and could not be located and uncovered during January and February, when the ground was frozen. The dissolved-oxygen concentration and pH for water from 47S are similar to those in water from 48S. It is likely, therefore, that the differences in corrosion rates for copper in well 47S and carbon steel in 48S are attributable to the more active nature of iron with respect to copper--that is, iron loses electrons more readily than does copper in similar environments. The presence of bacteria also may enhance the corrosion of steel. The rates measured for copper and for carbon steel in well 55S would be considered to represent insignificant damage, whereas the rates measured for carbon steel in well 48S would be considered moderate (Barnes and Clarke, 1969, p. 4).
SUMMARY AND CONCLUSIONS
Four ancillary studies were undertaken in support of an investigation into the extent and distribution of corrosive ground water in the Kirkwood- Cohansey aquifer system. These studies were (1) analysis of metals in tap- water samples from homes with wells tapping the Kirkwood-Cohansey aquifer system, (2) leaching experiments in which copper pipe with measured amounts of various types of solder were exposed to natural and synthetic waters, (3) analysis of pipe-scale deposits on pipe interiors from plumbing systems conveying water from the Kirkwood-Cohansey aquifer system, and (4) measurement of corrosion rates by use of two carbon-steel probes and one copper probe installed in wells that tap the Kirkwood-Cohansey aquifer system.
55

Table 10.--Selected water-quality characteristics for Mullica River basin wells in which corrosion probes were installed
[mg/L, milligrams per liter; jug/L, micrograms per liter; <, less than]
Sitename 1
47S47S
55S55S
48S48S
Dateof
sampling
12/02/8709/06/88
12/02/8709/06/88
04/01/8809/06/88
pH
4.84.9
5.55.7
5.04.8
Oxygen,dissolved
(mg/L)
8.18.2
.12
.13
10.610.7
Iron,dissolved
(Mg/L)
420
7,4007,200
<39
AggressiveIndex
5.15.2
5.76.0
5.35.2
1 A copper probe was installed in 47S; carbon-steel probes were installed in 48S and 55S; water-quality samples were collected at installation and removal of probe.
2 New Jersey well numbers for the three wells are 47S, 050019; 48S, 050024; 55S, 050452.
56

DC< HI>DC UJ 0.
CO
10
8
UJ
WELL 48S (STEEL)
A WELL 55S (STEEL)
WELL 47S (COPPER)
JAN FEB MAR APR MAY JUNE JULY AUG SEPT OCT 1988
DATE OF SAMPLING
Figure 20.--Corrosion rates, in mils per year (0.0254 millimeters or 0.001inches per year), for two carbon-steel probes and a copper probe installed in Mullica River basin observation wells 48S, 55S, and 47S, respectively.
57

47S
55S
4SS
3 INCHES
I I I I0123 CENTIMETERS
Figure 21.--Two carbon-steel probes and a copper probe after retrieval from Mullica River basin observation wells.
58

The analyses of metals in tap-water samples showed that, in houses as old as 25 years, concentrations of copper, lead, and zinc in standing tap water were significantly larger than those in water after 15 minutes of flushing the plumbing system; however, metal concentrations typically were smaller than in houses 1 or 2 years old. These findings indicate that metals are leached from plumbing materials by acidic water from the Kirkwood-Cohansey aquifer system, but that, as plumbing ages and acquires a pipe-scale coating on its interior, leaching becomes less severe. Because the use of lead solder was banned in New Jersey in 1987, problems with lead leaching will ultimately diminish, but copper leaching will continue.
The results of the tap-water analyses also indicate that the Aggressive Index generally is an adequate predictor of the severity of metal leaching (particularly with respect to copper), and thus of the corrosiveness of ground water. Finally, the results of analyses of metals in tap water from two groups of homes in Franklinville, Gloucester County, may indicate that leaching of metals is more severe during the summer than during the winter. Similar results have been reported elsewhere.
The results of the leaching experiments with copper pipe and lead/tin solder indicated that lead and copper concentrations in leachate vary inversely with AI value. Although only three discrete time periods were investigated in the leaching experiments, precipitation of a solid phase occurred after 120 hours in a number of samples. Precipitation occurred more rapidly in samples exposed to the atmosphere than in many of the samples in closed bottles. The results of the leaching experiments generally confirmed the viability of the Aggressive Index as an adequate predictor of water corrosiveness. Although pH, alkalinity, calcium hardness, chloride, and sulfate have been shown by previous research to play an important role in the corrosion process, the results of the leaching experiments presented in this report indicate that redox reactions involving iron also may play a role in the leaching and removal from solution of metals such as copper, lead, and zinc. Given that water from the Kirkwood-Cohansey aquifer system can contain substantial concentrations of dissolved or colloidal iron, further investigation into the role of iron in water corrosiveness could prove informative.
Leaching experiments with copper pipe and a lead-free solder indicated that toxic metals such as antimony generally do not leach in detectable amounts. Small concentrations of antimony were detected in one sample leached for 480 hours (20 days).
Analyses of pipe-scale deposits on plumbing from homes in the New Jersey Coastal Plain indicate that iron oxide deposits form on the interiors of copper pipes carrying untreated water from the Kirkwood-Cohansey aquifer system, and that lead, copper, and zinc can coprecipitate with the iron or can adsorb to the iron oxide surface. Considerable variability in the deposits was noted in the few samples examined; deposits ranged from rough and discontinuous to smooth and continuous. The cause of the variability is not known. Deposits formed on pipe interiors exposed to treated water from public-supply wells were copper carbonate and copper chloride, which indicates that some copper leaching had occurred.
59

The measurement of corrosion rates for metals exposed to water from the Kirkwood-Cohansey aquifer system indicated that corrosion rates for copper were low. Rates for carbon steel ranged from low to moderate and appear to be related to dissolved-oxygen concentrations. Oxygenated waters seem to promote corrosion of carbon steel; the rates measured in oxygenated water were moderate, however.
Overall, the ancillary studies confirm the corrosiveness of ground water from the Kirkwood-Cohansey aquifer system, as estimated by the Agggressive Index, with regard to the leaching of copper, lead, and zinc. Although the corrosion rates measured for copper and carbon steel represented low to moderate damage, the highest rates measured indicate that a carbon steel pipe with walls approximately 3 mm thick would corrode through in about 20 years if the corrosion rate remained constant.
The role of bacteria in the corrosion process was considered, but investigation of bacterial action was difficult to implement. A further investigation into the role of bacteria and iron in the corrosion process could prove useful in delineating the corrosiveness of water from the Kirkwood-Cohansey aquifer system.
60

REFERENCES CITED
Addis, Gall, and Moore, M.R., 1974, Lead levels in the water of suburban Glasgow: Nature, v. 252, p. 120-121.
Al-Kharafi, F.M., and El-Tantawy, Y.A., 1982, Passivation of copper--role of some anions in the mechanism of film formation and breakdown: Corrosion Science, v. 22, no. 1, p. 1-12.
American Water Works Association, 1980, Standard for asbestos-cementdistribution pipe, 4 in. through 16 in. for water and other liquids: Denver, Colo., AWWA C400-80, 20 p.
Atlas, D., Coombs, J., and Zajicek, O.T., 1982, The corrosion of copper by chlorinated drinking waters: Water Research, v. 16, p. 693-698.
Barnes, Ivan, and Clarke, F.E., 1969, Chemical properties of ground water and their corrosion and encrustation effects on wells: U.S. Geological Survey Professional Paper 498-D, 58 p.
Barringer, J.L., 1989, Corrosive ground water in the New Jersey Coastal Plain: Abstracts with programs, 24th Annual Meeting, Northeastern Section, The Geological Society of America, v. 21, no. 2, February 1989, p. 3.
Barringer, J.L., Kish, G.R., and Velnich, A.J., 1993, Corrosiveness of ground water in the Kirkwood-Cohansey aquifer system of the New Jersey Coastal Plain: U.S. Geological Survey Water-Resources Investigations Report 90-4180, p. 79, pi. 1.
Barringer, J.L., Kish, G.R., and Macy, J.A., 1987, Evidence of corrosive ground water in the shallow aquifer system of the New Jersey Coastal Plain: Eos, Transactions, American Geophysical Union, v. 68, no. 16, p. 310.
Beattie, A.D., Devenay, W.T., Miller, A.R., and Goldberg, A., 1972,Environmental lead pollution in an urban soft-water area: British Medical Journal, v. 2, p. 491-493.
Benson, J.A., and Klein, Harvey, 1983, Lead in drinking water--investigation of a corrosive water supply: Journal of Environmental Health, v. 45, no. 4, p. 179-181.
Crawford, M.D., and Morris, J.N., 1967, Lead in drinking water: Lancet, November 18, v. 2, p. 1087-1088.
de Mora, S.J., and Harrison, R.M., 1984, Lead in tap water--contamination and chemistry: Chemistry in Britain, v. 20, no. 10, p. 900-906.
Elder, J.F., 1988, Metal biogeochemistry in surface-water systems a review of principles and concepts: U.S. Geological Survey Circular 1013, 43 p.
Federal Register, 1991, v. 56, no. 110, p. 26460.
61

REFERENCES CITED--Continued
Feigenbaum, C., Gal-Or, L. , and Yahalom, J., 1978, Microstrueture and chemical composition of natural scale layers: Journal of Corrosion, v. 34, no. 2, p. 65-70.
Harriman, D.A., and Sargent, B.P., 1985, Ground-water quality in east-central New Jersey, and a plan for sampling networks: U.S. Geological Survey Water-Resources Investigations Report 85-4243, 114 p.
Herrera, C.E., Ferguson, J.F., and Benjamin M.W., 1982, Evaluating thepotential for contaminating drinking water from the corrosion of tin- antimony solder: Journal of the American Water Works Association, v. 74, no. 7, p. 368-375.
Hoyt, B.P., Kirmeyer, G.J., and Courchene, J.E., 1978, Evaluation of home plumbing corrosion problems, in American Water Works Association Water Quality Technology Conference, 6th Louisville, Kentucky, 1978, Proceedings: Denver, Colo., American Water Works Association, p. 1-10.
Ives, D.J.G., and Rawson, A.E., 1962a, Copper corrosion; I. Thermodynamic aspects: Journal of the Electrochemical Society, v. 109, no. 6, p. 447-451.
____ 1962b, Copper corrosion; II. Kinetic studies: Journal of theElectrochemical Society, v. 109, no. 6, p. 452-457.
____ 1962c, Copper corrosion; III. Electrochemical theory of general corrosion: Journal of the Electrochemical Society, v. 109, no. 6, p. 458-462.
____ 1962d, Copper corrosion; IV. The effects of saline additions: Journal of the Electrochemical Society, v. 109, no. 6, p. 462-466.
Karalekas, P.C., Craun, G.F., Hammonds, A.F., Ryan, C.R., and Worth, D.J., 1976, Lead and other trace metals in drinking water in the Boston metropolitan area: Journal of New England Water Works Association, v. 90, p. 150-172.
Karlekas, P.C., Ryan, C.R., Larson, C.D., and Taylor, F.B., 1978, Alternative methods for controlling the corrosion of lead pipe: Journal of The New England Water Works Association, v. 92, p. 159-178.
Kish, G.R., Macy, J.A., and Mueller, R.J., 1987, Evidence of trace-metalleaching from plumbing materials exposed to acidic ground water in three areas of the New Jersey Coastal Plain: U.S. Geological Survey Water- Resources Investigations Report 87-4146, 19 p.
Krauskopf, K.B., 1967, Introduction to geochemistry: New York, McGraw-Hill, 721 p.
Larson, T.E., 1975, Corrosion by domestic waters: Illinois State Water Survey, Bulletin 59, 48 p.
62

REFERENCES CITED--Continued
Lassovszky, Peter, 1984, Effect on water quality from lead and nonlead solders in piping: Heating, Piping and Air Conditioning, October, p. 51-58.
Levin, Ronnie, 1986, Reducing lead in drinking water--a benefit analysis:U.S. Environmental Protection Agency, Draft Final Report USEPA-230-09-86- 019, 27 p.
Lovell, John, Isaac, Richard, and Singer, Ruth, 1978, Control of lead and copper in private water supplies, Carroll County, Maryland: Carroll County Health Department, 20 p.
Maessen, Odilia, Freedman, William, and McCurdy, Ross, 1985, Metalmobilization in home well water systems in Nova Scotia: Journal of American Water Works Association, June, p. 73-80.
Matthew, G.K., 1981, Lead in drinking water and health: The Science of the Total Environment, v. 18, p. 61-75.
Miller, R.G., Doerger, J.U., Kopfler, F.C., Stober, J., and Roberson, P.,1985, Influence of the time of acidification after sample collection on the preservation of drinking water for lead determination: Analytical Chemistry, v. 57, no. 6, p. 1020-1023.
Millette, J.R., Hammonds, A.F., Pansing, M.F., Hansen, E.G., and Clark, P.J., 1980, Aggressive water--Assessing the extent of the problem: Journal of the American Water Works Association, May, p. 262-266.
Moore, M.R., Meredith, P.A., Campbell, B.C., Goldberg, Abraham, and Pocock,S.J., 1977, Contribution of lead in drinking water to blood-lead: Lancet, September 24, v. 2, no. 8039, p. 661-662.
Murrell, N.E., 1985, Summary of impact of metallic solders on water quality, in Seminar on plumbing materials and drinking water quality, Cincinnati, Ohio, May 16, 1984, Proceedings: U.S. Environmental Protection Agency, USEPA/600/9-85/007, p. 59-73.
New Jersey Department of Environmental Protection, 1985, New Jersey SafeDrinking Water Act Regulations, N.J.A.C. 7:10-1.1 through 7.3: New Jersey Department of Environmental Protection, Bureau of Potable Water, January 1985, 22 p.
New Jersey Register, 1987, Uniform Construction Code, Plumbing Subcode:Monday, February 2, 1987, Cite 19, New Jersey Register 289, Community - Affairs (d).
O'Brien, J.E., 1976, Lead in Boston water its cause and prevention: Journal of New England Water Works Association, v. 90, p. 173-181.
Parry, W.H., 1967, Lead in drinking water: Lancet, December 2, v. 2, p. 1207- 1208.
63

REFERENCES CITED--Continued
Patterson, J.W., and O'Brien, J.E., 1979, Control of lead corrosion: Journal of the American Water Works Association, v. 71, no. 5, p. 264-271.
Pennsylvania State University Environmental Research Institute Newsletter, 1988, Lead in drinking water--a serious problem: Summer 1988, v. 19, no. 1, p. 3.
Rohrback Corporation, 1985, Model CK-3 Portable Corrosometer Corrosion Monitor User Manual CK-3 - 2.0 05085 TSB: Santa Fe Springs, Calif., Rohrback Cosasco Systems, 38 p.
Rossum, J.R., and Merrill, D.T., 1983, An evaluation of the calcium carbonate saturation indexes: Journal of the American Water Works Association, v. 75, no. 2, p. 95-100.
Sandhu, S.S., Warren, W.J., and Nelson, P., 1977, Inorganic contaminants in rural drinking waters: Journal of the American Water Works Association, April, p. 219-222.
Schock, M.R., 1980, Response of lead solubility to dissolved carbonate indrinking water: Journal of the American Water Works Association, v. 72, no. 12, p. 695-704.
Schock, M.R., and Neff, C.H., 1982, Chemical aspects of internal corrosion- theory, prediction and monitoring, in American Water Works Association Water Quality Technology Conference, 10th, Proceedings: Denver, Colo., v. 10, p. 361.
Schock, M.R., and Gardels, M.C., 1983, Plumbosolvency reduction by high pH and low carbonate-solubility relationships: Journal of the American Water Works Association, v.75, no. 2, p. 87-91.
Sharpe, W.E., and DeWalle, D.R., 1985, Potential health implications for acid precipitation, corrosion, and metals contamination of drinking water: Environmental Health Perspectives, v. 63, p. 71-78.
Singley, J.E., 1981, The search for a corrosion index: Journal of the American Water Works Association, v. 73, no. 11, p. 579-582.
Singley, J.E., Beaudet, B.A., Markey, P.H., DeBerry, D.W., Kidwell, J.R., andMalish, D.A., 1985, Corrosion prevention and control in water treatmentand supply systems: Park Ridge, N.J., Noyes Publications, 313 p.
Stumm, Werner, and Morgan, J.J., 1981, Aquatic Chemistry--an introductionemphasizing chemical equilibria in natural waters (2d ed.): New York, John Wiley and Sons, 780 p.
U.S. Environmental Protection Agency, 1977, National Interim Primary Drinking Water Regulations: EPA-570/9-76-003, 159 p.
Van Breeman, N., Mulder, J., and Driscoll, C.T., 1983, Acidification and alkalinization of soils: Plant and Soil, v. 75, p. 283-308.
64

REFERENCES CITED--Continued
Vecchioli, John, and Giaimo, A.A., 1972, Corrosion of well-casing and screen materials in water from the Magothy aquifer and in injected reclaimed water, Bay Park, Long Island, New York: U.S. Geological Survey Professional Paper 800-B, p. B247-B251.
Wong, C.S., and Berang, P., 1976, Contamination of tap water by lead pipe and solder: Bulletin of Environmental Contamination and Toxicology, v. 15, p. 530-534.
65

APPENDIX A
Equations for potential reactions and processes that affect the pH of natural waters and thatmay be Involved in the corrosion process
[NH, + , ammonium; 0-,, oxygen; NO,, nitrate; H?0, water; H+ , hydrogen ionj N? , nitrogen gas;L, organic ligand 6r OH ; M, metal; Ch,0, organic matter; CO,, carbon dioxfde; HCO, , bicarbonate;Fe, iron; OH, hydroxyl; SO^ , sulfate ion; H2S, hydrogen suffide]
Process
Nitrification
Denitrif ication
Complexation of metal ions by
Equation Reference 1
NH, + + 20, -» NO," + H,0 + 2H+ 2t c. s c.
5CH20 + /«N03 " + 4H+ - 5C02 + 2N2 + 7H 20 1
HL + M+ -> ML + H+ 2dissolved organic carbon or hydroxides
Microbial degradation of dissolved organic carbon
Metal-oxide dissolution
Iron redox
Sulfur redox
CH20 + 02 - C02 + H 20 - HC03 " + H
^ M ^ o + nH+ 2 Mn+ ^ H20
Fe2+ + 5
FeS
0 j Fe(OH)3 + 2H+
f_ Fe(OH)3 + SO^2 " 2H+
2H+ ^ HS + 20
1 References: 1, Stumm and Morgan (1981); 2, Van Breeman and others (1983).
66

APPENDIX B
Well Construction Data
Well-construction data 1 for wells supplying 20 houses in Franklinville, Gloucester County, New Jersey
[--, No data; -, approximately; galv., galvanized; St., stainless;PVC, polyvinyl chloride]
House number
12345 6789
1011121314151617181920
Depth of well (feet)
706060
60 655080605860
102
-4250
-75
-5555
Casing material
PVC
galv. iron PVC
PVC
Screen material
PVC
st. steel
PVC
Casing diameter (inches)
4
1 Data supplied by homeowner. Well casings for houses 2-4 and 7-10 are believed to be PVC, based on information from one homeowner who is considered a reliable source; however, no designation of casing material was given on forms filled out by homeowners for these houses.
67

APPENDIX B--Continued
Well-construction data for wells sampled for leaching solution waters and in which corrosion probes were installed
Sample Bottom of CasingWell Site name for screen Casing Screen diameter Sitenumber name report (feet) material 1 material (inches) use2
050019 Mullica 47S 47S 25 P050024 Mullica 48S 48S 35 P050451 Mullica 5D 5D 170 P050452 Mullica 55S 55S 21 P050837 QWC1A QWC1A 7.9 P090048 Canal 5 Canal5 252 P290523 PPBWD 10 PP#10 100
P P P P P P
22222
6,214,12
0 0 0 0 0 0 W
1 P, polyvinyl chloride (PVC).2 0, observation well; W, water withdrawal well.
A U.S. GOVERNMENT PRINTING OFFICE: 1994 512-300
68