Interactions Importance of Linker Region in Matrix ... · PDF fileImportance of Linker Region...
20
Importance of Linker Region in Matrix Metalloproteinase-1 Domain Interactions Warispreet Singh 1 , Gregg Fields 2,3,* , Christo Z Christov 1,* , and Tatyana G. Karabencheva Christova 1,* 1 Department of Applied Sciences, Faculty of Health and Life Sciences, Northumbria University, Newcastle upon Tyne, NE1 8ST, United Kingdom 2 Department of Chemistry & Biochemistry, Florida Atlantic University, Jupiter, FL 33458, USA 3 Department of Chemistry, The Scripps Research Institute/Scripps Florida, Jupiter, FL 33458, USA Correspondence and request for materials should be addressed to G.F. ([email protected]), T.K-C ([email protected]) or C.Z.C ([email protected]) Supplementary Information Table S1. The MD setup for the wild type MMP-1 and in silico modified linkers. # MD-setup Ions Timescale (nsec) Replica Runs 1 Wt-MMP-1 Cl - (10) 300 4 2 Apo MMP-1 Cl - (4) 100 2 3 MMP-1/MMP-13 Cl - (7) 100 2 4 MMP-1/MMP-14 Cl - (11) 100 2 5 Apo MMP-1/MMP-14 Cl - (5) 100 2 6 Collagen in water Cl - (6) 50 2 Table S2. The average RMSD and the RMSF of MMP-1 and linker variants. > 1.4 Å < 1.4 Å Enzyme Mean (Å) SD (Å) (%) (%) MMP-1 4.7 0.44 43.1 56.9 MMP-1/MMP-14 5.6 0.46 57.02 42.9 MMP-1/MMP-13 5.3 0.50 68.4 31.6 Table S3. Analysis of MMP-1 for 100 nsec trajectory. Name Mean (Å) S.D (Å) S.E.M MMP-1 4.7 0.44 0.00636 Run 1 5.2 0.45 0.00644 Run 2 5.5 0.46 0.00660 Run 3 5.1 0.39 0.00557 Averaged trajectory 5.1 0.38 0.00548 Electronic Supplementary Material (ESI) for RSC Advances. This journal is © The Royal Society of Chemistry 2016
Transcript of Interactions Importance of Linker Region in Matrix ... · PDF fileImportance of Linker Region...

Importance of Linker Region in Matrix Metalloproteinase-1 Domain Interactions
Warispreet Singh1, Gregg Fields2,3,*, Christo Z Christov1,*, and Tatyana G. Karabencheva Christova1,*
1Department of Applied Sciences, Faculty of Health and Life Sciences, Northumbria University, Newcastle upon Tyne, NE1 8ST, United Kingdom2Department of Chemistry & Biochemistry, Florida Atlantic University, Jupiter, FL 33458, USA3Department of Chemistry, The Scripps Research Institute/Scripps Florida, Jupiter, FL 33458, USACorrespondence and request for materials should be addressed to G.F. ([email protected]), T.K-C ([email protected]) or C.Z.C ([email protected])
Supplementary Information
Table S1. The MD setup for the wild type MMP-1 and in silico modified linkers.# MD-setup Ions Timescale (nsec) Replica Runs1 Wt-MMP-1 Cl- (10) 300 42 Apo MMP-1 Cl- (4) 100 23 MMP-1/MMP-13 Cl- (7) 100 24 MMP-1/MMP-14 Cl- (11) 100 25 Apo MMP-1/MMP-14 Cl- (5) 100 26 Collagen in water Cl- (6) 50 2
Table S2. The average RMSD and the RMSF of MMP-1 and linker variants.
> 1.4 Å < 1.4 ÅEnzyme Mean (Å) SD (Å)
(%) (%)
MMP-1 4.7 0.44 43.1 56.9
MMP-1/MMP-14 5.6 0.46 57.02 42.9
MMP-1/MMP-13 5.3 0.50 68.4 31.6
Table S3. Analysis of MMP-1 for 100 nsec trajectory.Name Mean (Å) S.D (Å) S.E.M
MMP-1 4.7 0.44 0.00636
Run 1 5.2 0.45 0.00644
Run 2 5.5 0.46 0.00660
Run 3 5.1 0.39 0.00557
Averaged trajectory 5.1 0.38 0.00548
Electronic Supplementary Material (ESI) for RSC Advances.This journal is © The Royal Society of Chemistry 2016
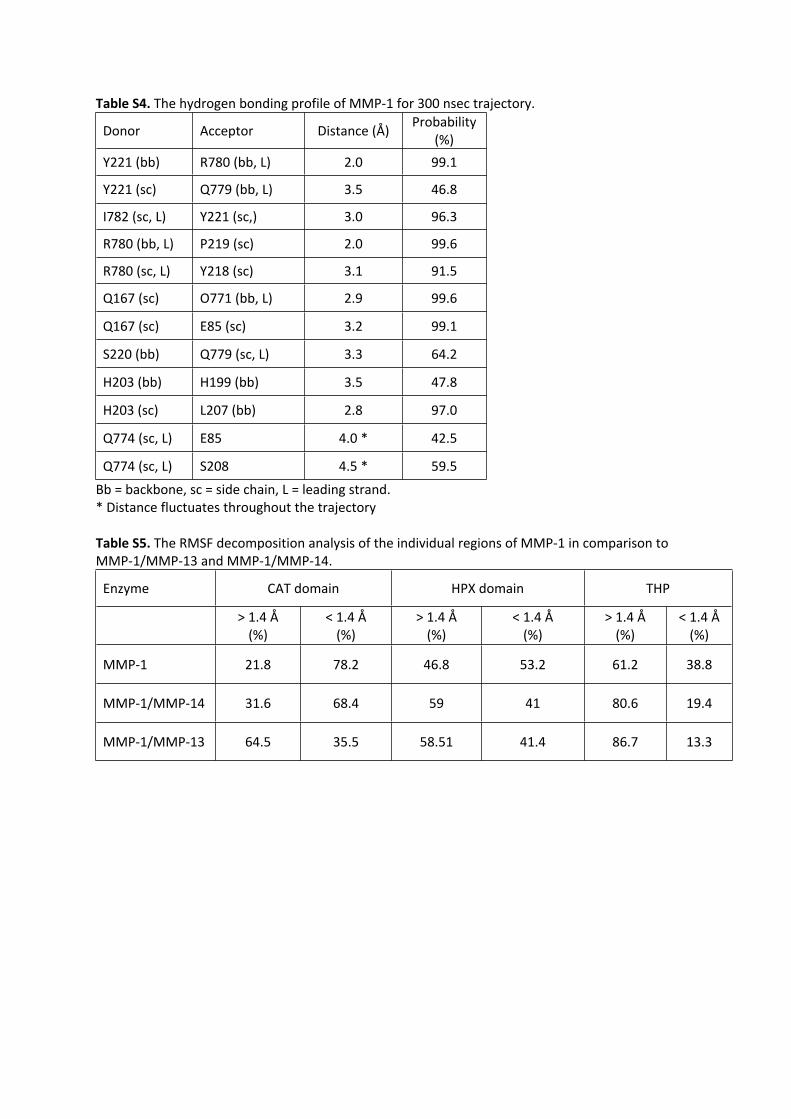
Table S4. The hydrogen bonding profile of MMP-1 for 300 nsec trajectory.
Donor Acceptor Distance (Å) Probability (%)
Y221 (bb) R780 (bb, L) 2.0 99.1
Y221 (sc) Q779 (bb, L) 3.5 46.8
I782 (sc, L) Y221 (sc,) 3.0 96.3
R780 (bb, L) P219 (sc) 2.0 99.6
R780 (sc, L) Y218 (sc) 3.1 91.5
Q167 (sc) O771 (bb, L) 2.9 99.6
Q167 (sc) E85 (sc) 3.2 99.1
S220 (bb) Q779 (sc, L) 3.3 64.2
H203 (bb) H199 (bb) 3.5 47.8
H203 (sc) L207 (bb) 2.8 97.0
Q774 (sc, L) E85 4.0 * 42.5
Q774 (sc, L) S208 4.5 * 59.5
Bb = backbone, sc = side chain, L = leading strand.* Distance fluctuates throughout the trajectory
Table S5. The RMSF decomposition analysis of the individual regions of MMP-1 in comparison to MMP-1/MMP-13 and MMP-1/MMP-14.
Enzyme CAT domain HPX domain THP
> 1.4 Å(%)
< 1.4 Å(%)
> 1.4 Å(%)
< 1.4 Å(%)
> 1.4 Å(%)
< 1.4 Å (%)
MMP-1 21.8 78.2 46.8 53.2 61.2 38.8
MMP-1/MMP-14 31.6 68.4 59 41 80.6 19.4
MMP-1/MMP-13 64.5 35.5 58.51 41.4 86.7 13.3
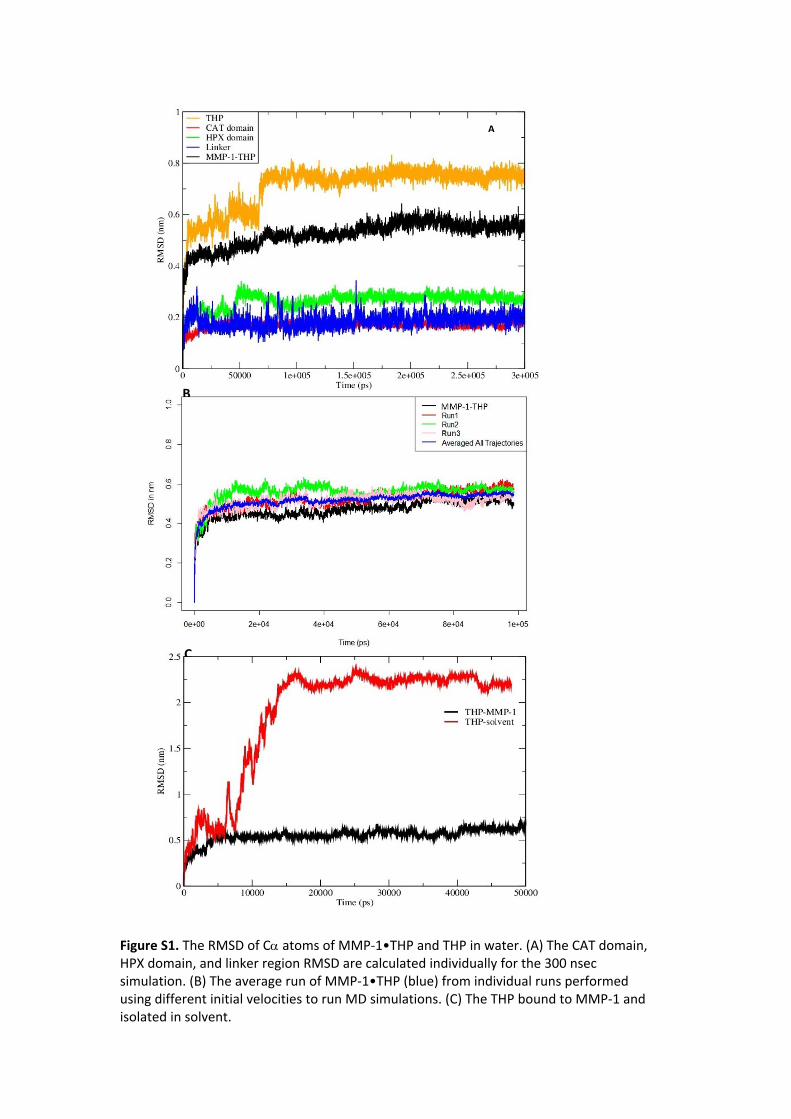
Figure S1. The RMSD of C atoms of MMP-1•THP and THP in water. (A) The CAT domain, HPX domain, and linker region RMSD are calculated individually for the 300 nsec simulation. (B) The average run of MMP-1•THP (blue) from individual runs performed using different initial velocities to run MD simulations. (C) The THP bound to MMP-1 and isolated in solvent.
A
B
C
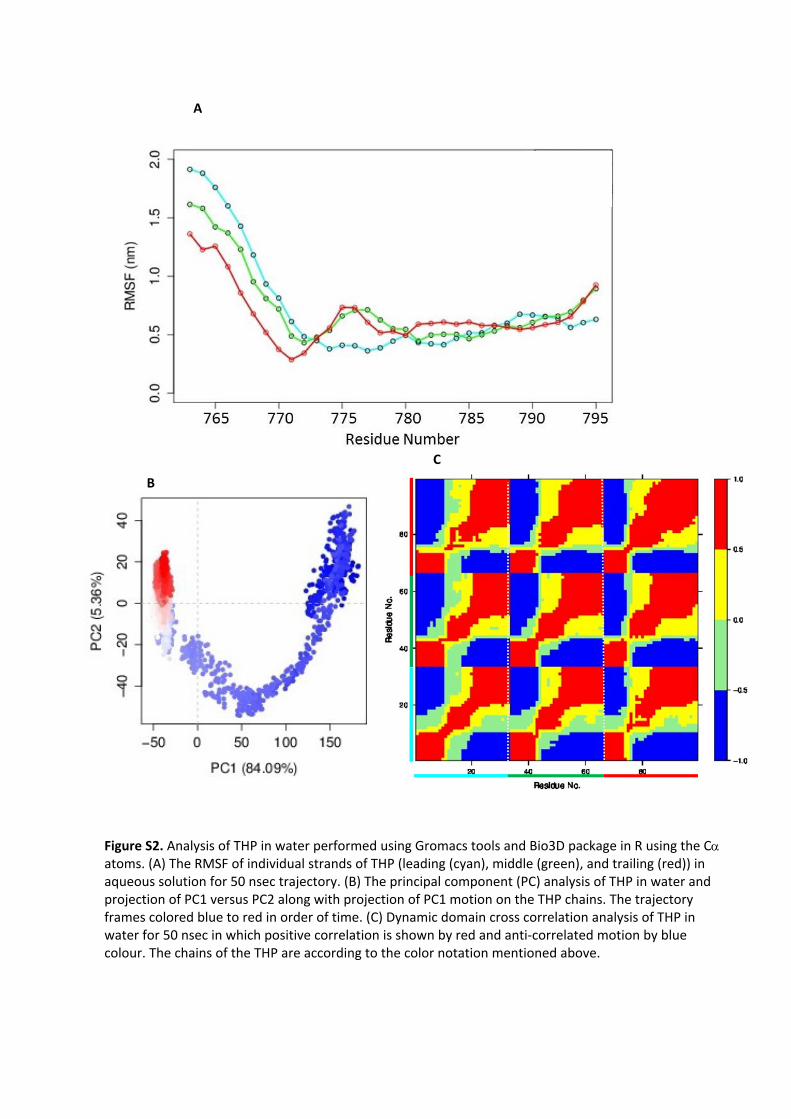
Figure S2. Analysis of THP in water performed using Gromacs tools and Bio3D package in R using the C atoms. (A) The RMSF of individual strands of THP (leading (cyan), middle (green), and trailing (red)) in aqueous solution for 50 nsec trajectory. (B) The principal component (PC) analysis of THP in water and projection of PC1 versus PC2 along with projection of PC1 motion on the THP chains. The trajectory frames colored blue to red in order of time. (C) Dynamic domain cross correlation analysis of THP in water for 50 nsec in which positive correlation is shown by red and anti-correlated motion by blue colour. The chains of the THP are according to the color notation mentioned above.
A
B
C
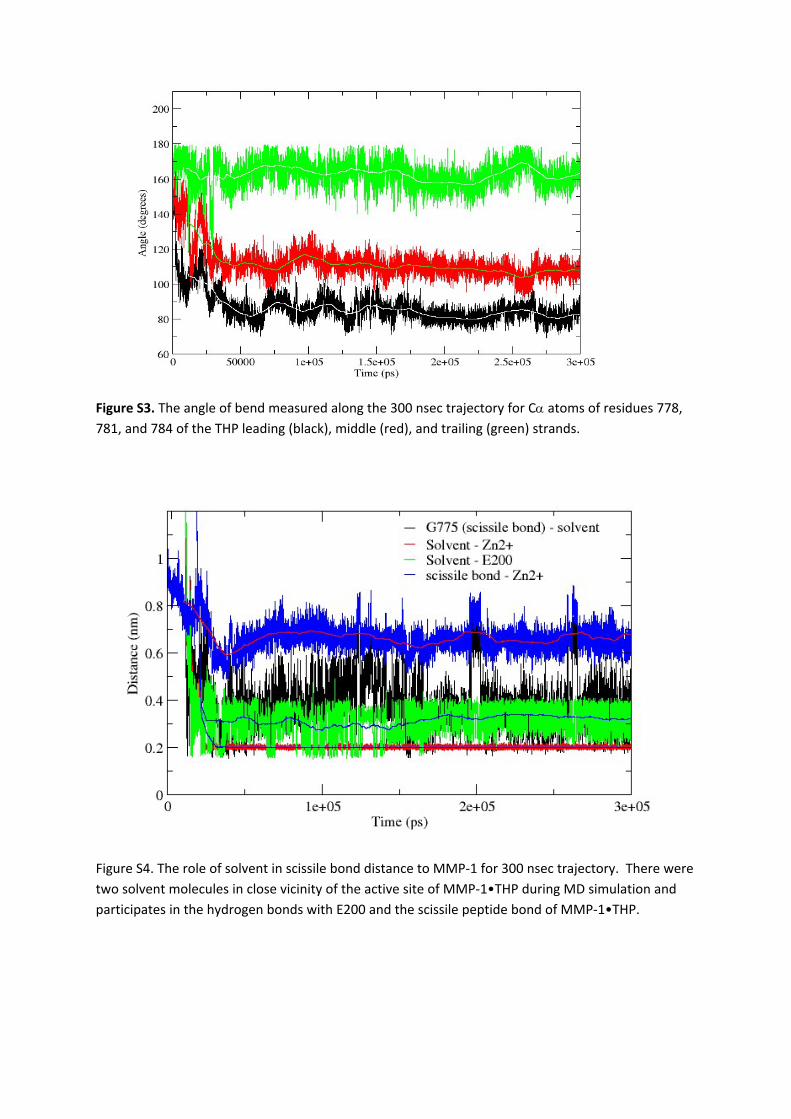
Figure S3. The angle of bend measured along the 300 nsec trajectory for C atoms of residues 778, 781, and 784 of the THP leading (black), middle (red), and trailing (green) strands.
Figure S4. The role of solvent in scissile bond distance to MMP-1 for 300 nsec trajectory. There were two solvent molecules in close vicinity of the active site of MMP-1•THP during MD simulation and participates in the hydrogen bonds with E200 and the scissile peptide bond of MMP-1•THP.
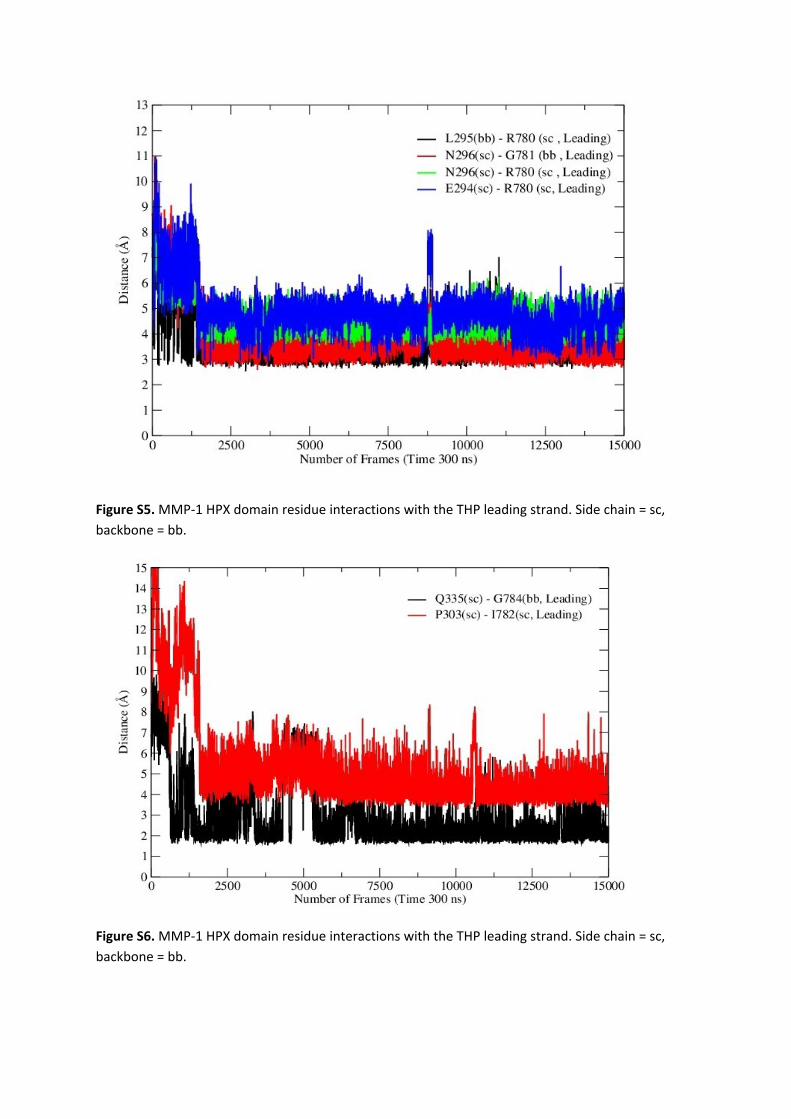
Figure S5. MMP-1 HPX domain residue interactions with the THP leading strand. Side chain = sc, backbone = bb.
Figure S6. MMP-1 HPX domain residue interactions with the THP leading strand. Side chain = sc, backbone = bb.
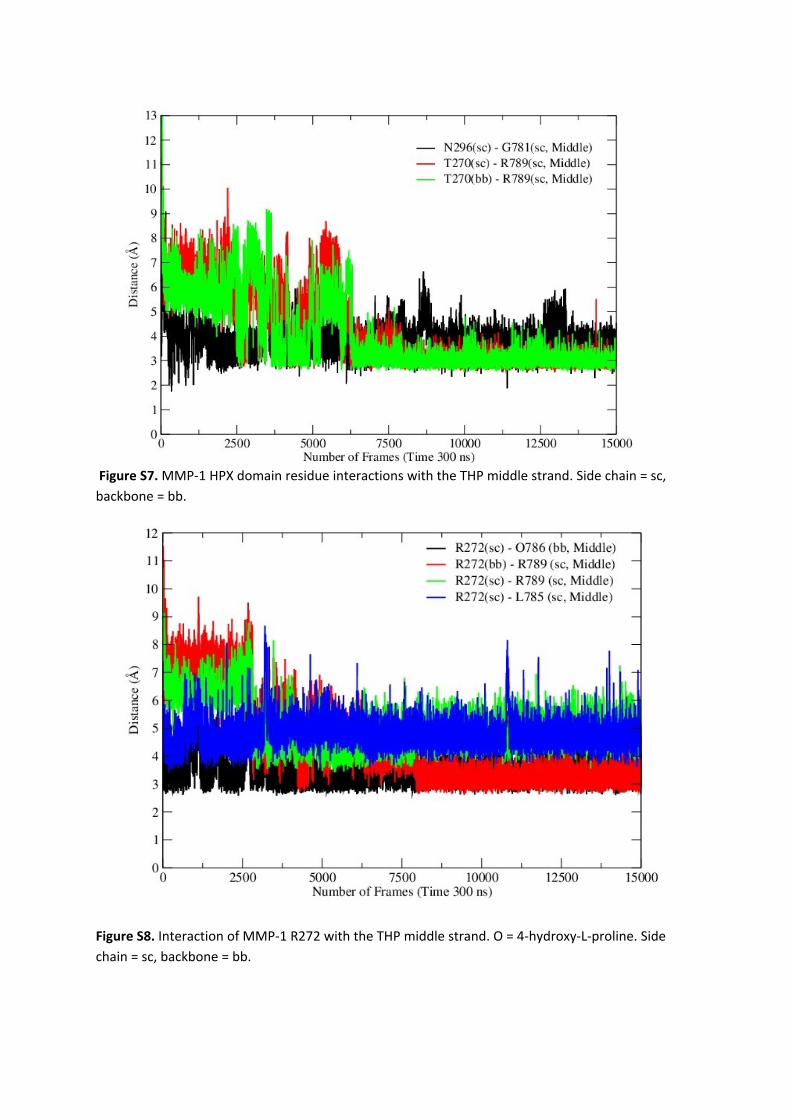
Figure S7. MMP-1 HPX domain residue interactions with the THP middle strand. Side chain = sc, backbone = bb.
Figure S8. Interaction of MMP-1 R272 with the THP middle strand. O = 4-hydroxy-L-proline. Side chain = sc, backbone = bb.

Figure S9. Interactions of MMP-1 CAT domain Y221 with the THP leading strand. Side chain = sc, backbone = bb.
Figure S10. The distance of the THP leading strand Q779 side chain to the S1 pocket of the MMP-1 CAT domain.
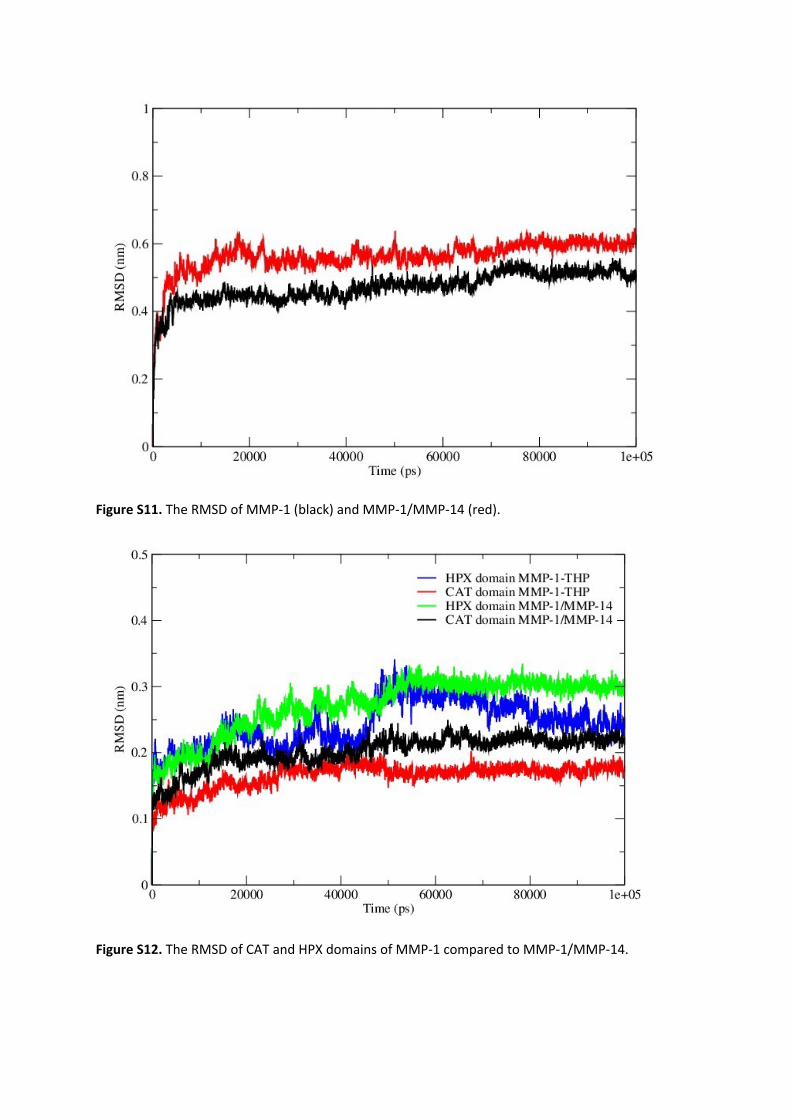
Figure S11. The RMSD of MMP-1 (black) and MMP-1/MMP-14 (red).
Figure S12. The RMSD of CAT and HPX domains of MMP-1 compared to MMP-1/MMP-14.
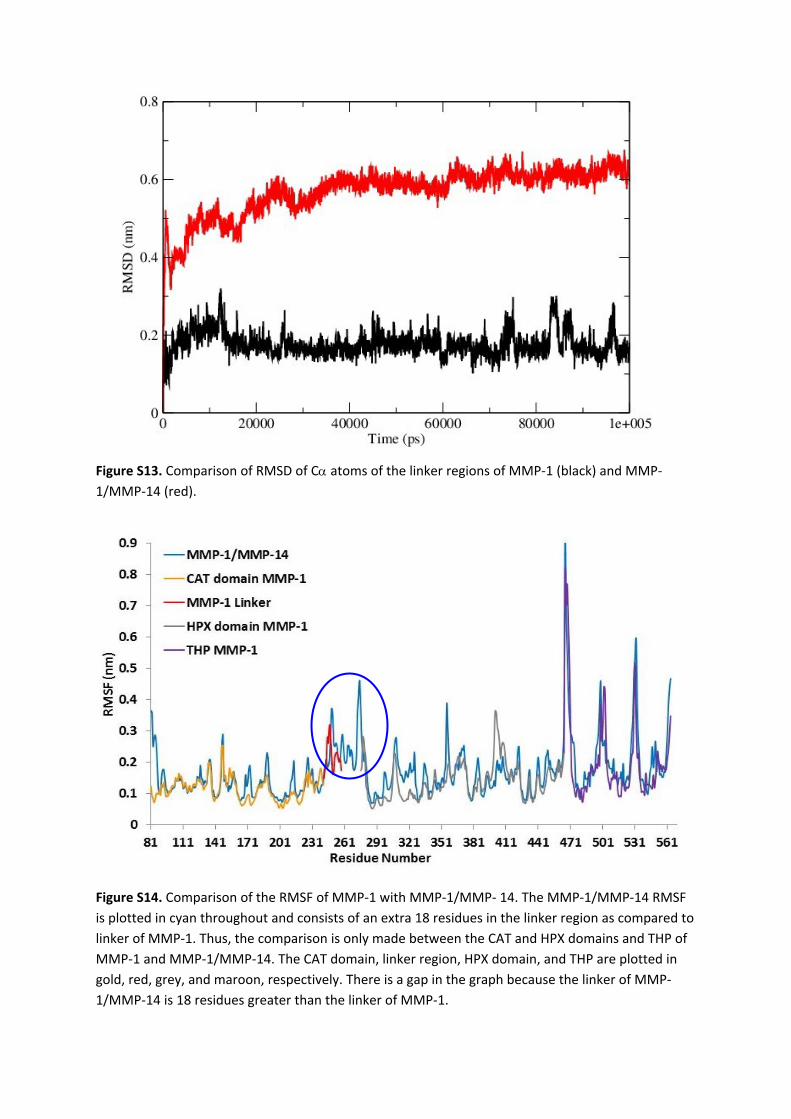
Figure S13. Comparison of RMSD of C atoms of the linker regions of MMP-1 (black) and MMP-1/MMP-14 (red).
Figure S14. Comparison of the RMSF of MMP-1 with MMP-1/MMP- 14. The MMP-1/MMP-14 RMSF is plotted in cyan throughout and consists of an extra 18 residues in the linker region as compared to linker of MMP-1. Thus, the comparison is only made between the CAT and HPX domains and THP of MMP-1 and MMP-1/MMP-14. The CAT domain, linker region, HPX domain, and THP are plotted in gold, red, grey, and maroon, respectively. There is a gap in the graph because the linker of MMP-1/MMP-14 is 18 residues greater than the linker of MMP-1.
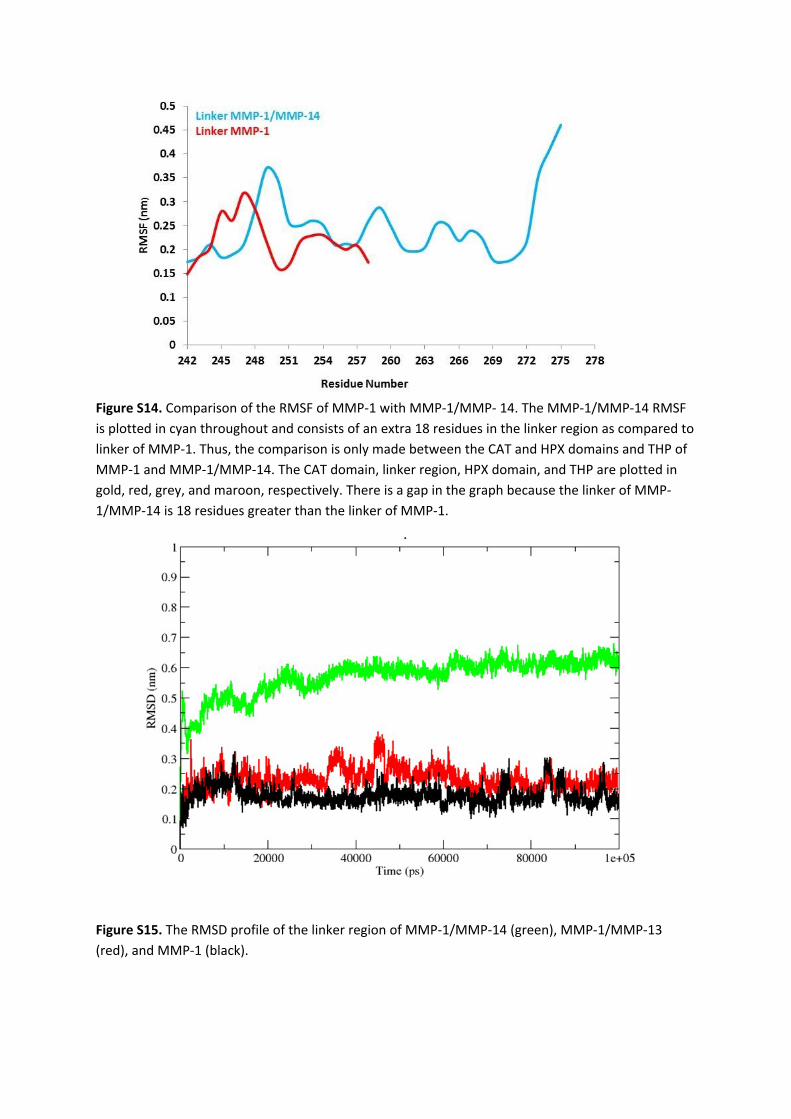
Figure S14. Comparison of the RMSF of MMP-1 with MMP-1/MMP- 14. The MMP-1/MMP-14 RMSF is plotted in cyan throughout and consists of an extra 18 residues in the linker region as compared to linker of MMP-1. Thus, the comparison is only made between the CAT and HPX domains and THP of MMP-1 and MMP-1/MMP-14. The CAT domain, linker region, HPX domain, and THP are plotted in gold, red, grey, and maroon, respectively. There is a gap in the graph because the linker of MMP-1/MMP-14 is 18 residues greater than the linker of MMP-1.
Figure S15. The RMSD profile of the linker region of MMP-1/MMP-14 (green), MMP-1/MMP-13 (red), and MMP-1 (black).
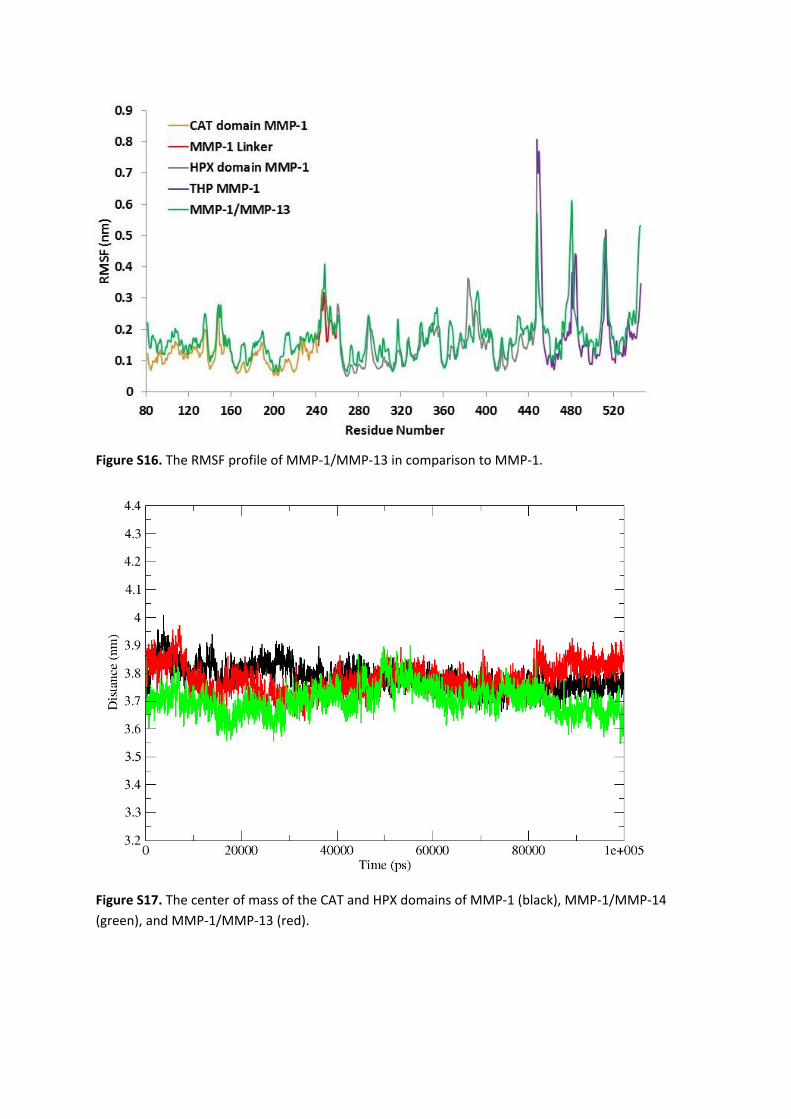
Figure S16. The RMSF profile of MMP-1/MMP-13 in comparison to MMP-1.
Figure S17. The center of mass of the CAT and HPX domains of MMP-1 (black), MMP-1/MMP-14 (green), and MMP-1/MMP-13 (red).
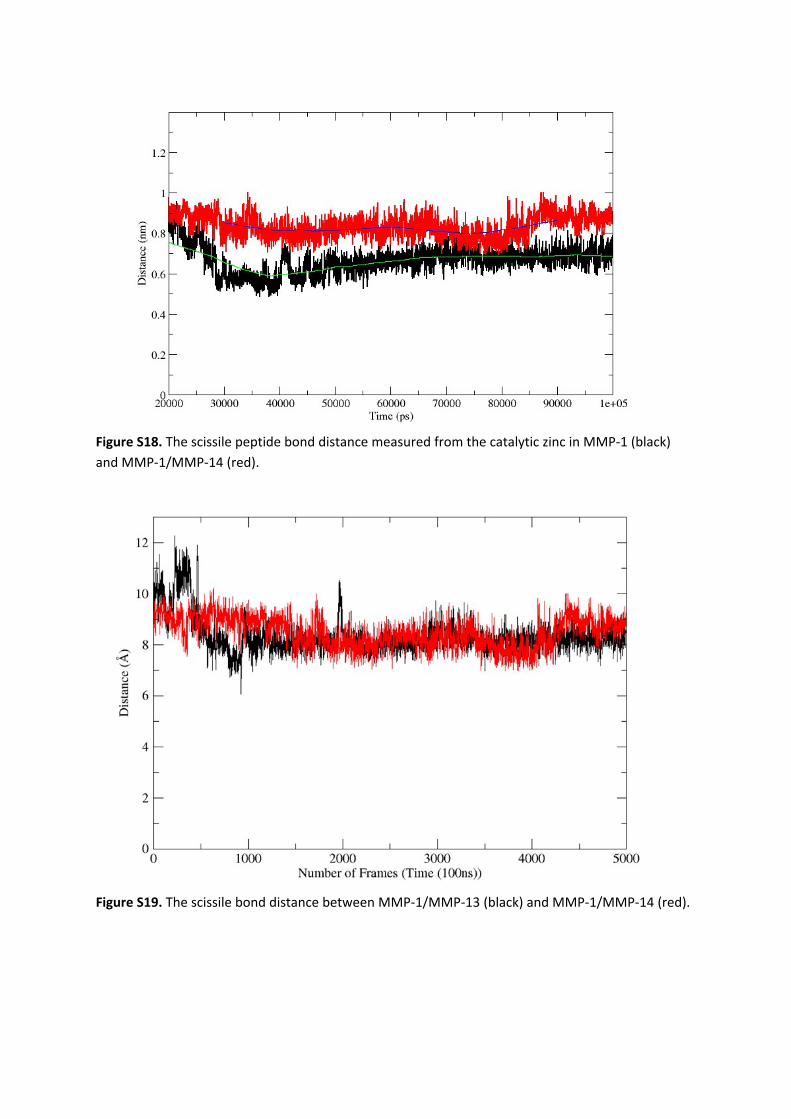
Figure S18. The scissile peptide bond distance measured from the catalytic zinc in MMP-1 (black) and MMP-1/MMP-14 (red).
Figure S19. The scissile bond distance between MMP-1/MMP-13 (black) and MMP-1/MMP-14 (red).
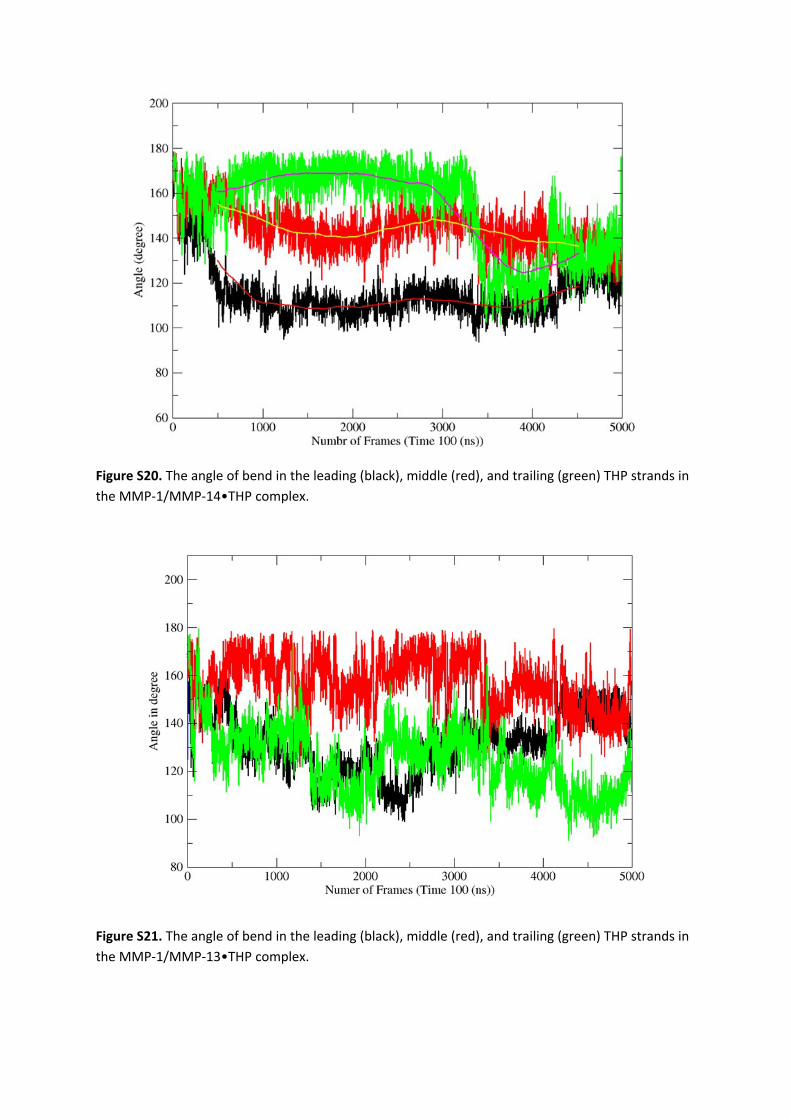
Figure S20. The angle of bend in the leading (black), middle (red), and trailing (green) THP strands in the MMP-1/MMP-14•THP complex.
Figure S21. The angle of bend in the leading (black), middle (red), and trailing (green) THP strands in the MMP-1/MMP-13•THP complex.

Figure S22. The interaction of the leading THP strand with the CAT domain of MMP-1/MMP-14 in comparison to MMP-1. Backbone = bb.

Figure S23. The interaction of the leading THP strand with the CAT domain of MMP-1/MMP-14 in comparison to MMP-1. Side chain = sc, backbone = bb.
Figure S24. The interaction of the leading THP strand with the CAT domain of MMP-1/MMP-14 in comparison to MMP-1. Side chain = sc, backbone = bb.
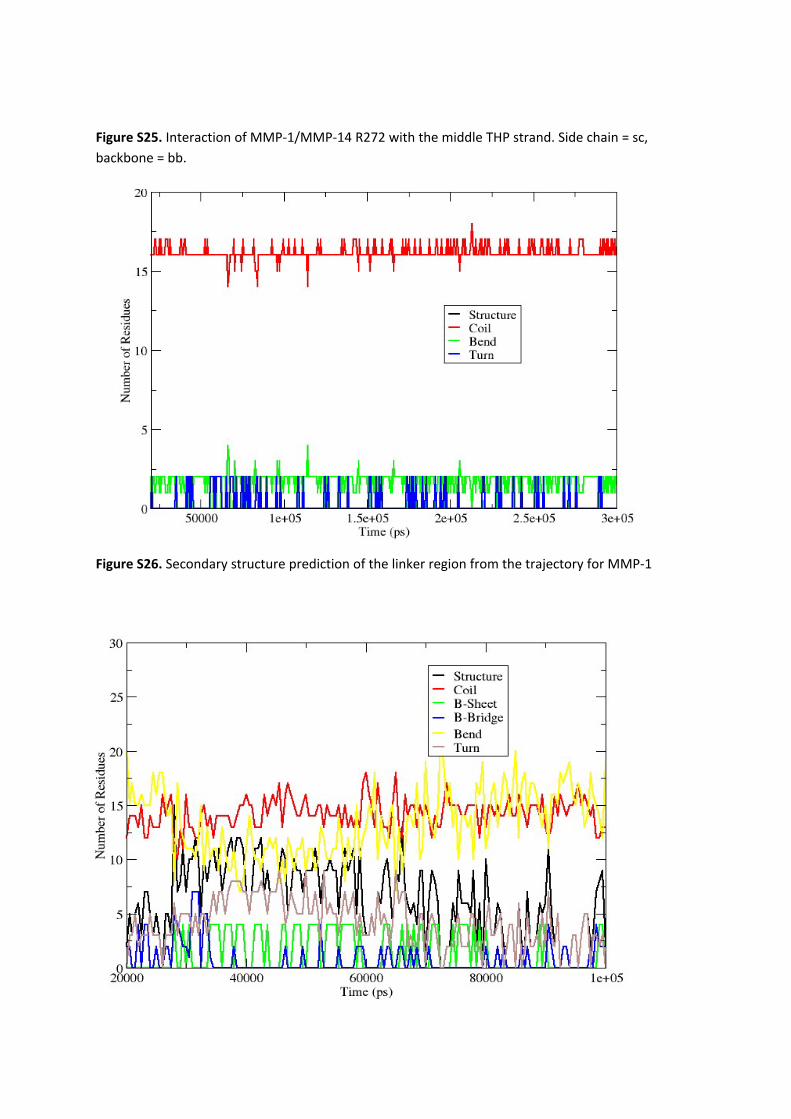
Figure S25. Interaction of MMP-1/MMP-14 R272 with the middle THP strand. Side chain = sc, backbone = bb.
Figure S26. Secondary structure prediction of the linker region from the trajectory for MMP-1

Figure S27. Secondary structure assessment of the linker region of MMP-1/MMP-14

Figure S28. The CAT domain interactions of MMP-1/MMP-13 with the THP. Side chain = sc, backbone = bb.
Figure S29. MMP-1/MMP-13 HPX domain interactions with the THP. Side chain = sc, backbone = bb.
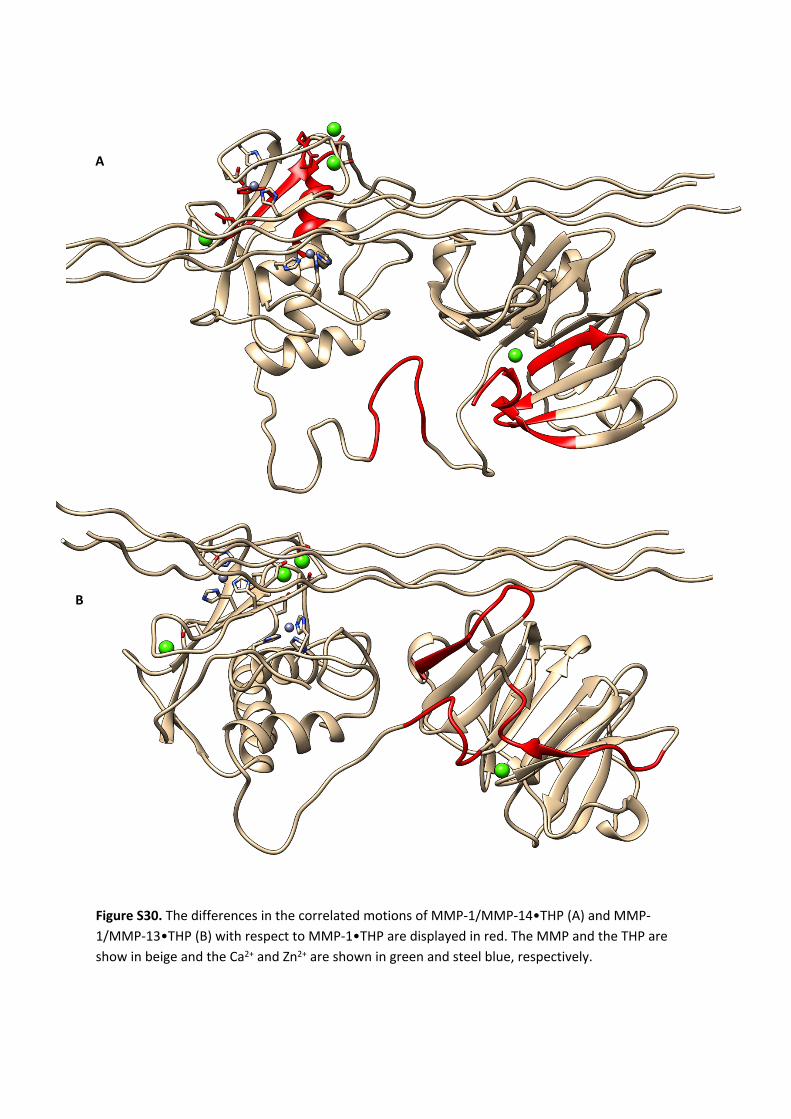
Figure S30. The differences in the correlated motions of MMP-1/MMP-14•THP (A) and MMP-1/MMP-13•THP (B) with respect to MMP-1•THP are displayed in red. The MMP and the THP are show in beige and the Ca2+ and Zn2+ are shown in green and steel blue, respectively.
A
B