INTERACTIONS BETWEEN N - Digital Library/67531/metadc31532/m2/1/high... · NAE Quantification ......
67
APPROVED: Kent D. Chapman, Major Professor Rebecca Dickstein, Committee Member Brian Ayre, Committee Member Arthur J. Goven, Chair of the Department of Biological Sciences James D. Meernik, Acting Dean of the Robert B. Toulouse School of Graduate Studies INTERACTIONS BETWEEN N-ACYLETHANOLAMINE METABOLISM AND ABSCISIC ACID SIGNALING IN Arabidopsis thaliana SEEDLINGS Matthew Q. Cotter, B.S. Thesis Prepared for the Degree of MASTER OF SCIENCE UNIVERSITY OF NORTH TEXAS August 2010
-
Upload
truongphuc -
Category
Documents
-
view
213 -
download
0
Transcript of INTERACTIONS BETWEEN N - Digital Library/67531/metadc31532/m2/1/high... · NAE Quantification ......

APPROVED: Kent D. Chapman, Major Professor Rebecca Dickstein, Committee
Member Brian Ayre, Committee Member Arthur J. Goven, Chair of the
Department of Biological Sciences
James D. Meernik, Acting Dean of the Robert B. Toulouse School of Graduate Studies
INTERACTIONS BETWEEN N-ACYLETHANOLAMINE METABOLISM AND
ABSCISIC ACID SIGNALING IN Arabidopsis thaliana SEEDLINGS
Matthew Q. Cotter, B.S.
Thesis Prepared for the Degree of
MASTER OF SCIENCE
UNIVERSITY OF NORTH TEXAS
August 2010

Cotter, Matthew Q. Interactions of N-Acylethanolamine Metabolism and Abscisic
Acid Signaling in Arabidopsis thaliana Seedlings. Master of Science (Biochemistry),
August 2010, 59 pp., 2 tables, 15 illustrations, references, 36 titles.
N-Acylethanolamines (NAEs) are endogenous plant lipids hydrolyzed by fatty
acid amide hydrolase (FAAH). When wildtype Arabidopsis thaliana seeds were
germinated and grown in exogenous NAE 12:0 (35 µM and above), growth was
severely reduced in a concentration dependent manner. Wildtype A. thaliana seeds
sown on exogenous abscisic acid (ABA) exhibited similar growth reduction to that seen
with NAE treatment. AtFAAH knockouts grew and developed similarly to WT, but
AtFAAH overexpressor lines show markedly enhanced sensitivity to ABA. When low
levels of NAE and ABA, which alone have very little effect on growth, were combined,
there was a dramatic reduction in seedling growth in all three genotypes, indicating a
synergistic interaction between ABA and NAE. Notably, this synergistic arrest of
seedling growth was partially reversed in the ABA insensitive mutant abi3-1, indicating
that a functional ABA signaling pathway is required for the full synergistic effect. This
synergistic growth arrest results in an increased accumulation of NAEs, but no
concomitant increase in ABA levels. The combined NAE and ABA treatment induced a
dose-dependent increase in ABI3 transcript levels, which was inversely related to
growth. The ABA responsive genes AtHVA22B and RD29B also had increased
expression in both NAE and ABA treatment. The abi3-1 mutant showed no expression
of ABI3 and AtHVA22B, but RD29B expression remained similar to wildtype seedlings,
suggesting an alternate mechanism for NAE and ABA interaction. Taken together,
these data suggest that NAE metabolism acts through ABI3-dependent and
independent pathways in the negative regulation of seedling development.

ii
Copyright 2010
by
Matthew Q. Cotter

iii
ACKNOWLEDGMENTS
I would like to thank Dr. Kent D. Chapman for his support and guidance as my
major professor. I would also like to thank my graduate committee, Dr. Rebecca
Dickstein and Dr. Brian Ayre for their assistance in my research. My appreciation goes
to Dr. Neal Teaster for laying the groundwork for this project and helping me get started
and to Dr. Aruna Kilaru for her constructive criticism and constant support for my work.
Finally, I have to thank all of the students and post-docs in the lab who have helped me
over the years.
As for my family, I am always grateful that they have supported me during my
many years, even though they still have no idea what I am doing.
This work was supported by a grant from the U.S. Department of Energy to
Elison Blancaflor and Kent Chapman (DE-FG02-05ER15647).

iv
TABLE OF CONTENTS
Page
ACKNOWLEDGMENTS .................................................................................................. iii LIST OF TABLES ............................................................................................................ v LIST OF ILLUSTRATIONS .............................................................................................. vi LIST OF ABBREVIATIONS ............................................................................................ vii Chapters
1. INTRODUCTION ....................................................................................... 1 Research Objectives ....................................................................... 7
2. MATERIALS AND METHODS ................................................................... 9
Plant Materials and Growth Assays ................................................ 9 NAE Quantification ........................................................................ 11 ABA Quantification ........................................................................ 11 FAAH Activity Assays .................................................................... 12 Quantitative Real Time RT-PCR ................................................... 13
3. RESULTS ................................................................................................ 15
Characterization of Combined NAE and ABA Effects on Seedlings ........................................................................................... 15
Endogenous NAE and ABA Content in Seedlings Treated with NAE and ABA ............................................................................. 28
Effects of Combined NAE and ABA Treatment on ABA-Regulated Gene Expression ................................................................ 35
4. DISCUSSION .......................................................................................... 43
REFERENCES .............................................................................................................. 54

v
LIST OF TABLES
Table 1: Genes and corresponding primers for quantitative RT-PCR analysis. ........... 14
Table 2: Effects of NAE 12:0 and/or ABA on Relative Transcript Levels of Selected
Genes in 10 Day Old Seedlings. ................................................................... 42
vi
LIST OF ILLUSTRATIONS
Figure 1: Synergistic effects of ABA and NAE on seedling growth. ................................ 4
Figure 2: Proposed interactions between ABA signaling and NAE metabolism. ............ 5
Figure 3: NAE Effects on Primary Root Length. ........................................................... 19
Figure 4: ABA Effects on Primary Root Length ............................................................ 21
Figure 5: NAE and ABA Effects on Cotyledon Area. .................................................... 23
Figure 6: Synergistic Effects of NAE and ABA on Primary Root Length ....................... 24
Figure 7: Synergistic Effects of NAE and ABA on Fresh Weight. ................................. 26
Figure 8: NAE profiles in seedlings grown in NAE and ABA. ....................................... 31
Figure 9: NAE 12:0 levels in seedlings grown in NAE and ABA. .................................. 32
Figure 10: Total NAE and ABA levels in seedlings grown in NAE and ABA. ................ 33
Figure 11: FAAH activity in the presence of ABA. ........................................................ 34
Figure 12: Impact of NAE Dose Dependent Inhibition of Seedling Growth on
ABI Signaling-related Transcript Levels. ....................................................... 38
Figure 13: Impact of ABA Dose Dependent Inhibition of Seedling Growth on
ABI Signaling-related Transcript Levels. ....................................................... 39
Figure 14: Impact of NAE and ABA Dose Dependent Inhibition of Seedling
Growth on ABI Signaling-related Transcript Levels. ...................................... 40
Figure 15: An intact ABA signaling pathway is required for synergistic growth arrest. . 41

vii
LIST OF ABBREVIATIONS
ABA Abscisic acid ABI ABA insensitve ABRC Arabidopsis Biological Resource Center ATEM1 Arabidopsis thaliana late embryogenesis abundant 1 AtFAAH Arabidopsis thaliana fatty acid amide hydrolase AtHVA22B Arabidopsis thaliana HVA22 homologue B BSA Bovine serum albumin BSTFA Bis(trimethylsilyl)trifluoro-acetamide DMSO Dimethyl sulfoxide EDTA Ethylenediaminetetraacetic acid EGTA Ethylene glycol tetraacetic acid faah FAAH knockout FFA Free fatty acid FW Fresh weight GC/MS Gas chromatography/mass spectrometry HPLC High performance liquid chromatography MAPK Mitogen-activated protein kinase MS Murashige and Skoog NAE N-acylethanolamine NAE 12:0 N-lauroylethanolamine NAE 14:0 N-myristoylethanolamine NAE 16:0 N-palmitoylethanolamine NAE 18:0 N-stearoylethanolamine NAE 18:1 N-oleoylethanolamine NAE 18:2 N-linoleoylethanolamine NAE 18:3 N-linolenoylethanolamine OE 35S::AtFAAH overexpressor PNP-A Plant natriuretic peptide-A RD29B Responsive to dessication 29B RT-PCR Reverse transcriptase-polymerase chain reaction SYBR Synergy Brands, Inc. TLC Thin layer chromatography WT Wild type WT (Col) Wild type, Columbia ecotype WT (Ler) Wild type, Landsberg erecta ecotype
1
CHAPTER 1
INTRODUCTION
N-Acylethanolamines (NAEs) are bioactive lipids thought to play a role in
seedling development (Chapman, 2004; Kilaru et al., 2007). The highest NAE levels
are found in desiccated seeds and are, in part, hydrolyzed during germination by fatty
acid amide hydrolase (FAAH) (Shrestha et al., 2002; Shrestha et al., 2003). This is
thought to allow for synchronized cell expansion and growth in germinating seeds and
young seedlings (Blancaflor et al., 2003). When exogenous NAE is added to the
seedlings, primary root length is significantly reduced and the roots exhibit swollen tips,
indicative of a perturbation in cell expansion (Blancaflor et al., 2003; Motes et al., 2005).
NAE metabolism mutants have been developed to study the effects of NAE on seedling
growth. When AtFAAH is overexpressed, seeds are theoretically able to remove NAEs
more rapidly and the seedlings grow more rapidly (Wang et al., 2006) and can grow in
exogenous NAE (Wang et al., 2006; Teaster et al., 2007). When AtFAAH is not
expressed (by T-DNA disruption), seeds cannot hydrolyze exogenous NAE as rapidly,
and seedling growth is severely inhibited (Wang et al., 2006). It is clear from these
studies that FAAH expression influences NAE metabolism in Arabidopsis seedlings.
The reduction in early seedling growth mediated by exogenous NAE is similar to
that caused by the plant hormone abscisic acid (ABA) (Teaster et al., 2007). ABA
functions as a repressor of germination and aids in modulating seedling growth
(Finkelstein et al., 2002; Lopez-Molina et al., 2002; Cutler et al., 2009). Activation of the
ABA signaling pathway leads to either immediate cellular changes such as the release
of intracellular calcium, nitric oxide, sphingolipids or increases in reactive oxygen

2
species (Coursol et al., 2003; Bright et al., 2006; Chai et al., 2006) or to changes in
gene expression (Rock, 2000; Finkelstein et al., 2002; Cutler et al., 2009). Addition of
ABA to germinated seeds inhibits seedling growth, leading to reduced root length and
smaller overall seedling size (Finkelstein et al., 2002). Under normal seed germination
and postgerminative seedling growth, levels of ABA decrease (Finkelstein et al., 2002),
in a pattern similar to the reduction in NAE levels (Teaster et al., 2007). The growth
responses of seedlings toward ABA are similar to those toward NAEs, and the levels of
both of these negative growth regulators are reduced during the course of normal
seedling growth. It is therefore possible that NAE metabolism may interact with ABA
signaling to produce changes in seedling growth.
Prior work with seedlings grown on solid media has supported the hypothesis
that there is an interaction between NAE metabolism and ABA signaling (Motes et al.,
2006; Teaster et al., 2007). Low levels of N-lauroylethanolamine (NAE 12:0) (10 μM)
and low levels of ABA (0.1 μM) alone have little inhibitory effect on wildtype seedling
growth (Fig. 1B, 1C). However, the combination of NAE 12:0 and ABA substantially
reduces seedling growth (Fig. 1D, 1E), suggesting that the two compounds act together
synergistically to reduce seedling growth. It is possible that ABA is operating to
modulate NAE metabolism to either produce more NAE or reduce FAAH activity.
Alternatively, NAE may interact with the ABA signaling pathway to potentiate its action.
Additionally, this synergistic inhibition of growth is enhanced in seedlings
overexpressing AtFAAH (OE2), and diminished in the AtFAAH knockout line (Salk
095108) (Fig. 1B-E). These effects are similar to those seen in seedlings grown in
liquid media (Teaster et al., 2007). In liquid media (1/2 strength Murashige and Skoog
3
(MS)), wild-type seedlings grown separately in 0.1 μM ABA and 10 μM NAE 12:0 have
slightly shortened roots and smaller cotyledons. However, when the ABA and NAE are
added together, seedling growth is severely reduced, similar to observations on solid
media. Also, the FAAH overexpressor shows the same heightened sensitivity to ABA in
liquid media as it does in solid media. While the use of solid media provides a simple
method for quantifying different growth parameters, it is difficult to produce enough
tissue for further analysis, so the similarities in growth response under both conditions
will support examination of gene expression, enzyme activity and metabolite changes.

4
Figure 1: Synergistic effects of ABA and NAE on seedling growth.
(A), (B), (C) and (D) 10 day old wild type, FAAH T-DNA insertion mutant (Salk 095108)
and FAAH overexpressor (OE2) seedlings grown in solidified (0.5X MS) media with (A)
solvent only (0.025% DMSO), (B) 10 µM NAE 12:0, (C) 0.1 µM (+)ABA and (D) both 10
µM NAE and 0.1 µM (+)ABA.
(E) Primary root lengths of 10 day old seedlings grown in indicated treatment.
Measurements are mean and standard deviation (n>30) from seedlings grown together.
A C
B D
Solv
ent C
ontro
l
WT
(Col
)
NAE
and
ABA
0.
1 µM
ABA
10 µ
M N
AE
faah
OE
WT
(Col
)
faah
OE
E
1 cm

5
There are several possible mechanisms by which NAEs may interact with ABA.
These mechanisms are summarized in Figure 2 (Teaster et al., 2007). The first is that
added NAEs may increase endogenous ABA levels, or added ABA may increase
endogenous NAE levels. Previous work has shown that exogenous application of ABA
has no appreciable effect on overall NAE content in wild type plants, although the
composition of the NAE pool is slightly altered by ABA in that unsaturated NAE species
are slightly higher (Teaster et al., 2007). In addition, treatment with exogenous NAE
12:0 has no effect on overall ABA levels in wild type plants (Teaster et al., 2007).
Because the NAE profile changes when seedlings are grown in ABA, the contributions
of the interaction between ABA levels and NAE metabolism to the synergistic effect
must be further characterized.
Figure 2: Proposed interactions between ABA signaling and NAE metabolism.
NAE metabolism is shown on the left and ABA signaling is shown on the right (modified
from Teaster, et.al., 2007).
ABA-responsive Genes (e.g., AtHVA22B, RD29B)
? ?
?

6
A second potential mechanism for NAE and ABA interaction is that ABA may
influence NAE metabolism, changing rates of NAE degradation and/or synthesis. NAEs
are formed from N-acylphosphatidylethanolamines (NAPEs) by phospholipase D and
are removed by both a FAAH pathway to produce free fatty acids and a lipoxygenase
pathway, producing oxylipins (Chapman, 2004). It is possible that ABA modulates one
of these pathways to change the NAE levels. As indicated in Figure 1, the use of FAAH
knockouts and overexpressors indicate that adjusting FAAH levels can have a large
impact on the synergistic effect, suggesting that this is a possible mechanism for the
synergism. ABA may change the activity of FAAH, causing changes in levels of specific
NAE species and NAE profiles, without changing overall levels of NAE. Wild type
seedlings have been shown to have significantly higher levels of unsaturated NAEs than
saturated NAEs (Teaster et al., 2007). There is also some evidence that FAAH
interacts with ABA signaling independent of FAAH amidohydrolase activity (Kim et al.,
2009). Seedlings with an overexpressed catalytically inactive FAAH still demonstrate
hypersensitivity to exogenous ABA. This would suggest that ABA signaling can interact
with the FAAH protein itself, without altering NAE levels. The effects of NAE and ABA
on the FAAH mediated removal of NAEs can be tested using the available FAAH
knockouts and overexpressors.
Finally, NAE or FAAH may interact with ABA through modifications of the ABA
signaling pathway. NAE may promote the ABA signal cascade that leads to changes in
expression of ABA responsive genes. There is evidence that adding NAE promotes the
ABA signaling pathway and that mutations in ABA signaling genes are partially tolerant
to NAE treatment (Teaster et al., 2007), indicating that NAE can activate the ABA

7
pathway without directly influencing ABA levels. However, it is not known how this
interaction with the ABA signaling pathway occurs. NAEs may be directly interacting
with the ABA signaling pathway, through the protein phosphatases ABI1 or 2, or the
ABA-regulated transcription factors ABI3 or 5, it may be interacting with the ABA
signaling secondary messengers such as Ca2+
Research Objectives
The main purpose of this research was to investigate the potential mechanism or
mechanisms for the interactions between NAE and ABA in Arabidopsis seeds and
seedlings. To address this goal, three specific objectives were implemented:
1. Quantify the combined effects of NAE and ABA on seeds and seedling growth
2. Determine the effects of combined NAE and ABA treatments on FAAH activity, NAE
levels, and ABA levels
3. Determine the effects of combined NAE and ABA on gene expression.
or inositol triphosphate (Webb et al.,
2001; Finkelstein et al., 2002), or it may be interacting with the ABA receptor to activate
the signaling pathway (Melcher et al., 2009) or through interaction with PLD alpha and
impact on phosphatidic acid (PA) levels, a known modulator of ABI signaling machinery
(Mishra et al., 2006).
For the first objective, the effects of NAE and ABA, both separately and together,
were examined in seedlings. While these treatments are known to cause decreased
primary root elongation in 10 day old seedlings (Fig. 1), the effects had not been well
characterized for other growth parameters, such as hypocotyl length and fresh weight.
In addition, the effects of NAE and ABA on ABA signaling mutants were also studied.
For the second objective, these effects were further characterized by looking at changes

8
in NAE and ABA levels. This was used to determine whether the growth effects are
influenced by ABA through the modulation of NAE profiles by changing FAAH activity.
For the third objective, the effects of NAE and ABA on ABA responsive genes, NAE
responsive genes and genes that are not responsive to either was studied. This helped
to determine if the interaction between NAE and ABA is occurring through a change in
gene expression.

9
CHAPTER 2
MATERIALS AND METHODS
Plant Materials and Growth Assays
The ABI mutant abi3-1 (CS24), faah T-DNA insertion mutant (Salk_095108), and
their corresponding parental ecotypes Landsberg erecta (Ler-0) and Columbia (Col)
were obtained from the Arabidopsis Biological Resource Center (ABRC). In addition,
35S::AtFAAH overexpressor lines were provided by Elison Blancaflor at the Samuel R.
Noble Foundation (Ardmore, OK) (Wang et al., 2006). Plants were propagated in soil
for seed production and grown in growth rooms at 22°C with a 16 h light (~50 µmol·m-
2·s-1), 8 h dark cycle. For germination and growth experiments, seeds were surface-
sterilized with 95% ethanol followed by 30% bleach with 0.1% Tween-20 for 3 minutes
each and rinsed several times with sterile, deionized water. Seeds were stratified for 3
days at 4°C in the dark and grown in either liquid nutrient media (0.5X Murashige and
Skoog salts containing 1% sucrose) or solid nutrient media (0.5X MS salts with 1%
sucrose and 0.8% phytagel) as previously described (Wang et al., 2006). Germination
and growth occurred in a controlled environment room with a 16 h light (~60 µmol·m-2·s-
1), 8 h dark cycle at 20 to 22°C. Seedlings grown on plates were oriented ~30° from
vertical to allow roots to grow into media and facilitate reproducible measurements of
root elongation. Primary root length was measured at 10 days after imbibition for a
minimum of 30 seedlings from images of plants on plates using ImageJ (available at
http://rsbweb.nih.gov/ij/; developed by Wayne Rasband, National Institutes of Health,
Bethesda, MD). Cotyledon area was measured 10 days after imbibition by removing
cotyledons from 30-40 plants, pressing them flat using a microscope slide, and

10
measuring area with ImageJ. Liquid cultured seedlings were incubated with shaking
(~75 rpm) and growth was quantified 10 days after imbibition as fresh weight
accumulation after collection with a Buchner funnel and rinsing three times with
deionized water to remove exogenous NAE and ABA from the seedlings. ABA and/or
NAEs were added from concentrated stocks, dissolved in DMSO, to the appropriate
final concentrations after media was allowed to cool to 50°C. Untreated controls
contained equivalent final concentrations of DMSO solvent alone, ranging from 0.01 to
0.05%. Concentrations of exogenous ABA (Calbiochem-Novabiochem Corp., catalogue
#100111) were calculated based on the active cis-isomer, although the ABA used
includes an equimolar concentration of the inactive trans-isomer. N-
lauroylethanolamine (NAE 12:0) was synthesized by Dr. Kent Chapman according to
(Devane et al., 1992). NAE 12:0 was analyzed by isotope-dilution mass spectrometry
for purity and was found to have no contamination from other NAE species. NAE and
ABA were both added to media at the beginning of the experiment and were not
continuously replaced. To determine if the combined effect of NAE and ABA was
additive, synergistic or antagonistic, the expected response from a combination of NAE
and ABA was calculated (Colby, 1967). Growth parameters for each treatment were
converted to percent of control values. The expected values for an additive response is
calculated by the equation Expected % of control = ( % of control in treatment A * % of
control in treatment B ) / 100. If the actual percent of control for the combined treatment
is lower than the expected value, the combination is synergistic; if higher, the
combination is antagonistic.

11
NAE Quantification
NAE was quantified by isotope-dilution mass spectrometry (Venables et al.,
2005). NAEs were extracted from ~50-100 mg of plant tissue using a BioSpec Mini-
Beadbeater (BioSpec, Catalogue #693) into 70°C 2-propanol to inactivate endogenous
phospholipases (Chapman et al., 1999). For quantification, 50 µL of 1 ppm deuterated
NAE (d4-NAE 16:0 and d4-NAE 20:1) internal standards were added. Total lipids were
extracted into chloroform, filtered, and fractionated by normal-phase HPLC. Enriched
NAE fractions were collected, dried under N2 and derivatized in 50 µL of
bis(trimethylsilyl)trifluoro-acetamide (BSTFA) at 55°C for 30 minutes. The derivatized
samples were dried and taken up in 50 µL hexanes for analysis by GC/MS.
Endogenous NAEs were quantified against the internal deuterated standards and
calculated in ng·g-1
ABA Quantification
FW.
ABA was quantified by isotope-dilution mass spectrometry (Wang et al., 2001).
ABA was extracted from ~300 mg of plant tissue using a Biospec Mini-Beadbeater
(BioSpec, Catalogue #693) into 30 mM imidazole buffer (pH 7) in 70% 2-propanol.
Deuterated D2-ABA (100 ng) was added as a quantitative standard and the samples
were extracted overnight at 4°C and centrifuged. The supernatant was combined with
three consecutive extractions (1 ml 100% 2-propanol each) and reduced under N2 in a
dry bath at 70°C to ~1 ml. This aqueous phase was diluted and prepurified on NH2-
columns (Discovery, Catalogue #52637-U) primed with methanol, 5% acetic acid, and
water. After sample application, the columns were washed with hexane and methanol
and eluted with 3 ml 5% acetic acid in 75% methanol. The eluant was dried and taken

12
up in 36% methanol and purified by HPLC as described previously (Wang et al., 2001).
The ABA fraction was collected, dried, methylated with 0.5 ml of ethereal diazomethane
for 5 minutes, dried under N2, and taken up in 50 µL of ethyl acetate. The methylated
samples were analyzed by GC/MS. The relative abundance of representative
fragments for ABA (m/z 190/194) was used for quantification. The data were calculated
in ng·g-1
FAAH Activity Assays
FW for seedlings and seeds.
Total proteins were extracted from seeds by grinding ~150-200 mg of seeds with
liquid nitrogen, mortar and pestle. Proteins were solubilized on ice in 4 ml of
homogenization buffer (10 mM KCl, 1 mM EDTA, 1mM EGTA, 1 mM MgCl2, 400 mM
sucrose, and 100 mM potassium phosphate, at pH 7.2) and 0.4 mM DDM. Protein
content was estimated using BSA as standard according to Bradford (Bradford, 1976).
About 20 µg of protein extract was reacted with 250 µM [14C]NAE 12:0 (20,000 dpm) in
bis-tris propane buffer (pH 9.0) for 4 hours at 30°C, in the presence or absence of ABA.
Lipids were extracted as previously described (Shrestha et al., 2002). Briefly, the
reaction was stopped by incubating the reaction mixture with 70°C 2-propanol for 30
minutes. Lipids were extracted into chloroform overnight at 4°C. Phase separation was
induced by adding 1 M KCl, and the aqueous layer was aspirated off. The organic layer
was washed twice with 1 M KCl and once with ultrapure water (MilliQ-plus UF). The
organic phase was collected and dried under N2. Lipids were separated by TLC
(hexane:ethyl acetate:methanol, 12:8:1; v/v). Identification and quantification of
radiolabeled lipids were performed by radiometric scanning (Bioscan AR-2000 Imaging

13
Scanner). FAAH activities were calculated and reported as µmol substrate consumed
per hour.
Quantitative Real Time RT-PCR
Total RNA was isolated from seed and seedling samples using the Qiagen
RNeasy Plant Mini Kit (Qiagen, catalogue #74904). RNA was quantified and evaluated
for purity by UV spectroscopy and agarose gel electrophoresis (Mehra, 1996).
Quantification of mRNA transcripts by quantitative RT-PCR were performed with a
Smart Cycler II (Cepheid) instrument using a real-time one-step assay system (Takara
Bio) with SYBR Green 1 dye. For the following genes, the gene specific primer pairs
given in Table 1 were used: ABI3 (At3g24650), AtHVA22B (At5g62490), PNP-A
(At2g18660), AtFAAH (At5g64440), RD29B (At5g62490), and ATEM1 (At3g51810). All
primers were designed to span one intron to distinguish cDNA amplification from
genomic DNA contamination. Relative transcript levels in all samples were normalized
using 18S rRNA as a constitutively expressed internal control, with intron-spanning
primers (F) 5'-TCCTAGTAAGCGCGAGTCATCA-3' and
(R) 5'-CGAACACTTCACCGGATCAT-3' (Rider et al., 2003). Quantitative RT-PCR
reactions were performed in duplicate with 0.2 µg of total RNA and 0.5 µL of 10 µM
gene-specific primers in each 25 µL reaction. The reaction mix was subjected to the
following RT-PCR conditions: 42°C for 15 minutes, one cycle; 95°C for 2 minutes, one
cycle; 94°C for 10 s, 58°C for 25 s (read cycle), 72°C for 20 s. The number of cycles
and annealing temperature were experimentally determined for each set of gene-
specific primers. RT-PCR products were examined by gel electrophoresis and by
melting curve analysis (60 to 95°C at 0.2°C/s) to rule out anomalous amplification

14
products. The 2-ΔΔCT cycle threshold (CT) method was used to calculate relative
changes in transcript levels determined from quantitative real-time RT-PCR (Livak and
Schmittgen, 2001). The data were analyzed using the equation ΔΔCT=(CT, Target-CT,
18S)Treated-(CT, Target-CT, 18S)Not Treated, where "Treated" refers to samples treated with ABA
and/or NAE and "Not Treated" refers to samples treated with solvent alone. The fold
difference between treated and not treated was then calculated using the equation 2-
ΔΔCT
Table 1: Genes and corresponding primers for quantitative RT-PCR analysis.
. These values were then normalized to the appropriate wild-type solvent control.
The normalized values from replicate samples were then averaged together.
Gene Description Primers ABI3 ABA transcription
factor (F)5‘-GAGCTGGCTCAGCTTCTGCTATG-3’ (R) 5‘-AGGCCAAAACCTGTAGCGCATGTTC-3’
AtHVA22B ABA responsive gene
(F) 5’-CATCGCTGGACCTGCATTA C-3’ (R) 5’-GGATATAATGGGATCCATTCGAGG-‘3
PNP-A Expansin-related gene
(F) 5’-CCTACACTAGGTCTGCGTG-3’ (R) 5’-GATAACCCGAAAAGCGT-3’
AtFAAH Fatty acid amide hydrolase
(F) 5’-CCATCTCAAGAACCGGAGCATG-3’ (R) 5’-GGTGTTGGAGGCTTGTCATAGC-3’
RD29B ABA responsive gene
(F) 5'-CATAAAGGTGGAGAAGCTGGAGTA-3' (R) 5'-CCTCCAAATCTTGCCGGAGAATTC-3'
ATEM1 ABA responsive gene
(F) 5'-CTGAAGGAAGAAGCAAGGGAG-3' (R) 5'-TCCATCGTACTGAGTCCTCCTTTAC-3'

15
CHAPTER 3
RESULTS
Characterization of Combined NAE and ABA Effects on Seedlings
To identify the effects of NAE 12:0 on seedling growth, growth studies of FAAH
metabolism mutants and ABA signaling mutants were conducted with exogenously
applied NAE 12:0 (Figure 3). In the absence of NAE 12:0, primary root length is similar
for all genotypes (Figure 3A). At low levels (10 µM) of applied NAE (Figure 3B), there is
no significant difference in primary root length between the FAAH metabolism mutants
(faah and OE) and wild type (WT (Col)), nor is there a significant difference between an
ABA signaling mutant (abi3-1) and WT (Ler). At concentrations of NAE 12:0 above 15
µM, the FAAH knockout seedlings have severely reduced primary roots (Figure 3C, 3D,
3E) compared to wild type, while seedlings overexpressing FAAH are able to continue
growing at least as well as WT (Col). At these higher concentrations, abi3-1 has similar
primary root lengths to WT (Ler). The dose-dependent reduction in primary root length
for all genotypes is shown in Figure 3F.
To identify the effects of ABA on seedling growth, growth studies of FAAH
metabolism mutants and ABA signaling mutants were conducted with exogenously
applied ABA (Figure 4). In the absence of ABA, primary root length is similar for all
genotypes (Figure 4A), with abi3-1 having slightly reduced primary roots. Upon
treatment with ABA, FAAH OE demonstrates a hypersensitive reduction in primary root
length, while faah demonstrates reduced sensitivity to ABA growth inhibition (Figure 4B,
4C). At high levels of ABA (Figure 4D), no genotype shows primary root elongation
except abi3-1, which is able to produce roots that are ~75% as long as the untreated

16
roots. The dose-dependent reduction in primary root length for all genotypes is
quantified in Figure 4E.
To identify other effects of NAE and ABA on seedlings, cotyledon area was
measured in 14-day old seedlings (Figure 5). When treated with NAE 12:0, faah again
showed a hypersensitive reduction cotyledon area and OE shows tolerance (Figure 5A).
At 20 µM NAE, faah cotyledon area is significantly less (p<0.001) than WT (Col), while
FAAH OE cotyledon area is significantly more (p<0.001) than WT. When treated with
ABA, OE showed the hypersensitive reduction seen in primary root length while faah
showed tolerance (Figure 5B). At 0.25 µM ABA, faah had significantly (p<0.001) larger
cotyledons than wild type, while cotyledon area in OE becomes significantly (p<0.001)
smaller at 0.05 µM ABA. Cotyledon area was not used for further experiments due to
the difficulty in obtaining measurements in seedlings grown in liquid culture.
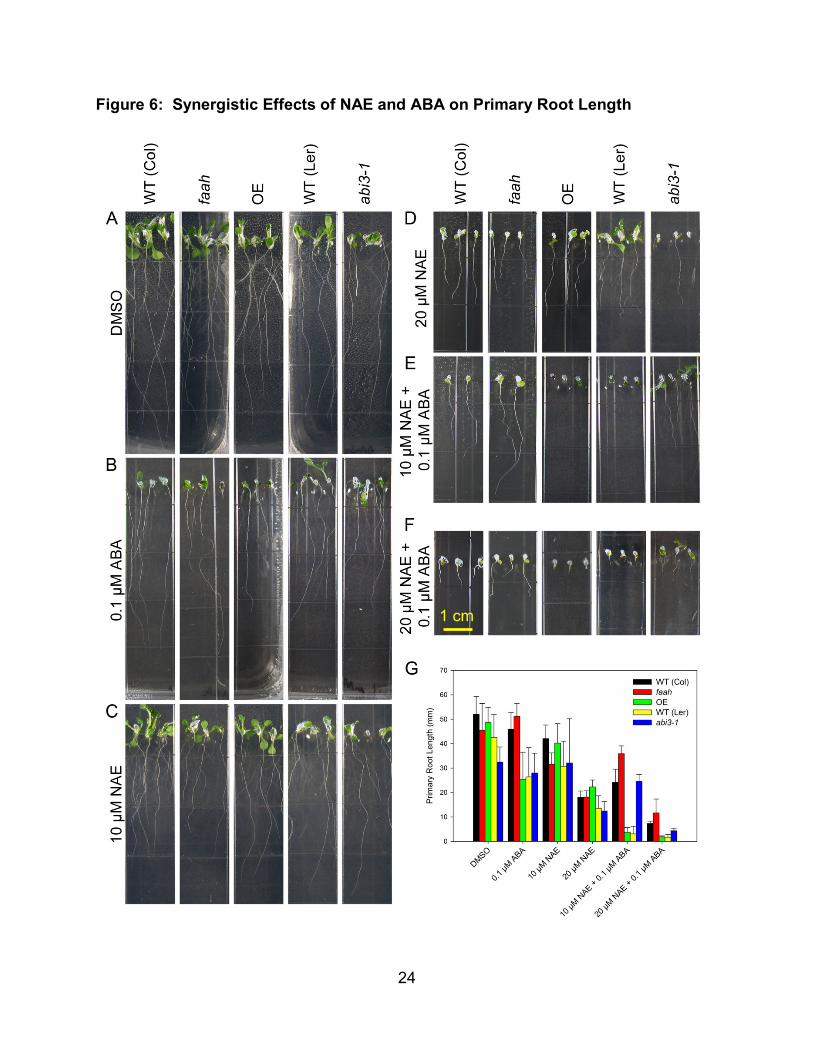
After quantifying the effects of NAE and ABA separately on seedling growth, the
effects of both together were studied (Figure 6). A low level of ABA (0.1 µM), which had
little effect on wild type seedling growth (Figure 4B, 5B), was used in combination with
different levels of NAE 12:0 (10 µM and 20 µM). These levels were also low enough to
not have a severe effect on wild type growth (Figure 3B, 3D, 4A). When added
together, NAE and ABA severely reduced primary root length in wild type seedlings
(Figure 6E, 6F). Using the primary root length differences in each single treatment and
in the combined NAE and ABA treatment, the type of interaction between NAE and ABA
was calculated. The primary root length of wild type seedlings in 10 µM NAE was 78%
of the length in solvent control and was 58% the length in 0.1 µM ABA. If the
combination of NAE and ABA was completely additive, the expected percent of control

17
in the combined treatment would be ((58% * 78%) / 100) = 45.6%. The measured
percent of control in the combined treatment of 10 µM NAE and 0.1 µM ABA is 16.8%.
At 20 µM NAE and 0.1 µM ABA, the expected percent of control is calculated to be
15.9%, while the measured value is 3.3%. These lower values are indicative of
treatment synergism. The faah seedlings were less sensitive (had longer primary roots)
to these synergistic inhibitory effects while the FAAH OE were more sensitive (had
shorter primary roots). In addition, primary root length in abi3-1 was significantly
(p<0.001) higher in the combined treatments (Figure 6F, 6G), suggesting that an intact
ABA signaling pathway is required for the synergistic inhibition of growth. While the
abi3-1 line did have longer roots, a more qualitative indicator of the abi3-1 insensitivity
to the synergistic effect is the much larger cotyledons of abi3-1 seedlings as compared
to WT (Ler). The 20 µM NAE + 0.1 µM ABA treatment was used for subsequent
experiments because it exhibited a stronger synergistic effect, while also showing clear
differences between the FAAH metabolism mutants.
For subsequent experiments seedlings were grown in liquid culture to produce
larger quantities of tissues for analyses. Primary root length and cotyledon area are
difficult to measure in liquid-grown seedlings. For these liquid cultures, total fresh
weight was used to quantify changes in growth due to NAE and ABA synergism.
Seedlings were grown in liquid media, harvested and weighed. Synergistic effects can
be identified qualitatively by examining the overall morphology of seedlings (Figure 7A).
The FAAH metabolism mutants showed the much shorter primary roots and reduced
cotyledons in combined treatments when grown in liquid media, while abi3-1 showed
tolerance to the combined treatments. Measurements of fresh weight confirmed the

18
resistance of OE and the hypersensitivity of faah to added NAE (Figure 7B).
Conversely, overall growth of faah showed the reduced sensitivity to ABA while OE
showed only a slight sensitivity to ABA, less than what was seen previously for primary
root lengths of seedlings grown in plates (Figure 4).

19
Figure 3: NAE Effects on Primary Root Length.
1 cm

20
Figure 3: NAE Effects on Primary Root Length.
(A) - (E) Representative images of 10 day old seedlings used for primary root length
measurements. Seedlings were grown continuously in 0.02% DMSO or increasing
concentrations of NAE 12:0, as indicated.
(F) Quantitative measurements of primary root length of 10 day old seedlings grown in
increasing concentrations of NAE 12:0. Measurements are mean and standard
deviation (n>30) from one experimental set of plates.

21
Figure 4: ABA Effects on Primary Root Length
1 cm

22
Figure 4: ABA Effects on Primary Root Length
(A) - (E) Representative images of 10 day old seedlings used for primary root length
measurements. Seedlings were grown continuously in 0.02% DMSO or increasing
concentrations of (+) ABA, as indicated.
(F) Quantitative measurements of primary root length of 10 day old seedlings grown in
increasing concentrations of (+) ABA. Measurements are mean and standard deviation
(n>30) from two different sets of growth experiments: one with WT (Col) background
seedlings and one with WT (Ler) background seedlings.

23
Figure 5: NAE and ABA Effects on Cotyledon Area.
(A) Quantitative measurements of cotyledon area from 14 day old seedlings grown in
0.02% DMSO or increasing concentrations of NAE 12:0, as indicated.
(B) Quantitative measurements of cotyledon area from 14 day old seedlings grown in
0.02% DMSO or increasing concentration of (+) ABA, as indicated. Measurements are
mean and standard deviation (n>50) from seedlings grown together in one experiment.
24
Figure 6: Synergistic Effects of NAE and ABA on Primary Root Length
1 cm

25
Figure 6: Synergistic Effects of NAE and ABA on Primary Root Length
(A) - (F) Representative images of 10 day old seedlings used for primary root length
measurements. Seedlings were grown in NAE 12:0, (+) ABA or both, as indicated.
(G) Quantitative measurements of primary root length of 10 day old seedlings grown in
NAE 12:0, (+) ABA or both. Measurements are mean and standard deviation (n>30)
from one complete experiment.

26
Figure 7: Synergistic Effects of NAE and ABA on Fresh Weight.

27
Figure 7: Synergistic Effects of NAE and ABA on Fresh Weight.
(A) Representative images of total fresh weight of 10 day old seedlings grown in NAE
12:0, (+) ABA or both, as indicated.
(B) Quantitative measurements of fresh weight of 10 day old seedlings grown in NAE
12:0, (+) ABA or both. Measurements are mean and standard deviation (n>30) from
one complete experiment.

28
Endogenous NAE and ABA Content in Seedlings Treated with NAE and ABA
The effects of NAE and ABA exposure, individually and combined, on
endogenous NAE levels were quantified using isotope-dilution mass spectrometry
(Figure 8). FAAH metabolism mutants showed different NAE profiles in the various
treatments. The faah seedlings had very high levels of NAE 14:0 (up to ~4000 ng/g
FW) in NAE 12:0 treatment compared to wild type seedlings (Figure 8B). To determine
whether these high levels of NAE 14:0 were due to contamination of the NAE 12:0
solution, samples of NAE 12:0 were analyzed by GC/MS. The NAE 12:0 solution had
no other NAE species, and specifically had no NAE 14:0. In addition, NAE 18:2 was
much higher in NAE 12:0 treated faah than in WT. The amounts of other NAE species
were similar to WT (Figure 8A). The FAAH OE seedlings had much lower levels of all
NAE species when treated with NAE or ABA (Figure 8C). In the combined treatment,
however, OE had an NAE profile similar to WT. The ABA signaling mutant abi3-1
showed higher levels of all NAE species compared to WT (Ler) when untreated (Figure
8D, 8E). When treated with NAE 12:0 or ABA, levels of all NAE species were lower in
the abi3-1 seedlings. However, the NAE levels were only slightly increased in the
combined treatment, similar to the FAAH metabolism mutants. Levels of all NAE
species were much higher in WT (Ler) seedlings in the combined treatment. These
seedlings also had the lowest growth in the combined treatment (Figure 6). All NAE
species were lower in seedlings than in desiccated seeds (Figure 8F). However, with
the exception of high levels of NAE 14:0 in faah and higher levels of NAE 18:2 in abi3-1,
the NAE profiles, or the relative amounts of each NAE species, were similar between
seeds and seedlings, especially those grown in the combined NAE and ABA treatment.

29
NAE 12:0 amounts were excluded from the above NAE profiles due to extremely
high levels in NAE 12:0 treated seedlings (Figure 9), as might be expected. These
levels were 50-100 times higher than any other NAE species. The faah seedlings had
the highest levels of NAE 12:0 when treated with NAE 12:0, while FAAH OE had the
lowest levels, confirming that FAAH can metabolize exogenously applied NAE. In all
genotypes except the FAAH overexpressors, NAE 12:0 levels were much higher in the
combined treatment, suggesting that perhaps the absolute endogenous levels of NAE
are not solely responsible for the differences in growth in seedlings treated with ABA or
combinations of NAE and ABA.
The overall NAE levels (not including NAE 12:0) in seedlings also differed by
genotype. In untreated seedlings, abi3-1 had the highest levels of NAE while FAAH OE
had the lowest (Figure 10A). Upon treatment with NAE 12:0, total NAE levels increased
in faah and WT (Ler), remained the same in WT (Col) and were slightly reduced in abi3-
1. FAAH OE seedlings were able to completely metabolize NAEs in the NAE 12:0
treatment. A similar pattern was also seen in ABA treated seedlings. In the combined
treatment, NAE levels were greatly increased in all genotypes. The faah and WT (Ler)
seedlings had the highest levels, while WT (Col), OE and abi3-1 all had similar levels.
When NAE levels in seedlings were compared to total NAE levels in seeds a significant
change in levels was seen (Figure 10B). Of the FAAH metabolism mutants, faah had
the highest level of NAE in seeds and WT and OE had similar levels. In the ABA
signaling mutant, seed levels of NAE were slightly higher than WT (Ler).
ABA levels also were measured using isotope-dilution mass spectrometry. Total
ABA levels in seedlings differed greatly between the different genotypes (Figure 10C).

30
The FAAH metabolism mutants had similar levels of ABA in untreated and NAE 12:0
treated seedlings. In ABA treated seedlings, levels of endogenous ABA increased for
the three genotypes; however, the levels of ABA in faah were significantly (p<0.001)
higher than in WT or OE. This was also true of the combined treatment. The ABA
signaling mutant abi3-1 had lower levels of ABA in NAE 12:0 treated seedlings, but the
levels increased greatly in ABA and combined treatment seedlings. ABA levels in the
abi3-1 seedlings remained significantly lower (p>0.01) than WT (Ler) in all treatments.
To determine if the change in NAE profiles in ABA treated seedlings was due to
interactions between ABA and FAAH, FAAH amidohydrolase activity was measured in
the presence of ABA. Treatment with high levels (5 µM ABA) had no effect on the
endogenous amidohydrolase activity in total protein extracts from WT seeds (Figure
11A, 11B). The reaction rates of the FAAH metabolism mutant protein extracts showed
the expected profile, with no FAAH activity in the FAAH knockouts (faah) and very high
activity in the FAAH overexpressor (OE). These rates were not affected by either low
levels or high levels of ABA (Figure 11C). The ABA signaling mutant had a slightly
higher FAAH activity than WT (Ler). This rate was also not affected by the addition of
ABA.

31
Figure 8: NAE profiles in seedlings grown in NAE and ABA.
(A), (B), (C), (D), (E) and (F) Quantification of NAE 14:0, 16:0, 18:0, 18:3, 18:2 and
18:1 levels by isotope-dilution mass spectrometry in 10 day old (A) WT (Col), (B) faah,
(C) OE, (D) WT (Ler), and (E) abi3-1 seedlings and (F) desiccated seeds.

32
Figure 9: NAE 12:0 levels in seedlings grown in NAE and ABA.
Quantification of NAE 12:0 levels by isotope-dilution mass spectrometry in 10 day old
seedlings treated with 0.05% DMSO, 20 µM NAE 12:0, 0.1 µM ABA or both NAE and
ABA.

33
Figure 10: Total NAE and ABA levels in seedlings grown in NAE and ABA.
(A) Quantification of NAE from 10 day old seedlings grown in 0.05% solvent control, 10
µM NAE, 0.1 µM ABA or a combination of NAE and ABA. Sum of NAE 14:0, 16:0, 18:0,
18:3, 18:2, and 18:1 species. * p<0.05 compared to wild-type.
(B) Quantification of NAE from desiccated seeds by isotope-dilution mass
spectrometry. Sum of NAE 12:0, 14:0, 16:0, 18:0, 18:3, 18:2, and 18:1 species.
(C) Quantification of ABA from 10 day old seedlings grown in 0.05% solvent control, 10
µM NAE, 0.1 µM ABA or a combination of NAE and ABA. * p<0.05 compared to wild-
type.
(D) Quantification of ABA from desiccated seeds by isotope-dilution mass
spectrometry. * p<0.05 compared to wild-type.
* * * * *
*
*
*
* *

34
Figure 11: FAAH activity in the presence of ABA.
(A) and (B) Characterization of FAAH amidohydrolase activity in WT seeds (A) without
ABA and (B) with 5 µM ABA.
(C) Quantification of FAAH amidohydrolase activity in seed protein extracts in the
absence and presence of ABA.

35
Effects of Combined NAE and ABA Treatment on ABA-Regulated Gene
Expression
The effects of NAE treatment on ABA regulated gene expression were
characterized by semi-quantitative real time RT-PCR on FAAH metabolism mutant
seedlings grown in various concentrations of NAE 12:0 (Figure 12). Seedlings grown
for analysis showed the appropriate NAE dose dependent reduction of growth, including
the hypersensitivity of faah and the insensitivity of FAAH OE (Figure 12A). Three ABA-
regulated genes were previously identified: ABI3, AtHVA22B and RD29B (Teaster et al.,
2007). ABI3 transcript was present in all three genotypes at all times, but levels
increased with increasing levels of NAE 12:0. At 35 and 50 µM NAE, levels were much
higher (Figure 12B). AtHVA22B and RD29B transcript levels were very low in low levels
of NAE (10 and 20 µM) but were greatly increased in higher levels (35 and 50 µM NAE).
The faah seedlings had higher levels of both AtHVA22B and RD29B at all levels of NAE
while the FAAH OE had much lower levels of both genes even at 35 and 50 µM NAE.
The effects of ABA treatment on transcript levels of the same three genes was
also characterized (Figure 13). Again, seedlings grown for analysis showed the
appropriate dose ABA dose dependent reduction in growth, including hypersensitivity of
FAAH OE (Figure 13A). Levels of ABI3 transcript were lower in faah seedlings and
higher in OE seedlings compared to WT at all levels of ABA treatment (Figure 13B).
Levels of AtHVA22B were slightly higher in faah seedlings (appearing at 0.1 µM ABA)
and slightly lower in OE seedlings. Levels of RD29B in faah were similar to WT (seen
at all levels of ABA) but were much lower in OE seedlings (not apparent until treated
with 0.1 µM or more ABA).
36
The effects of the combined treatments on these three gene transcript levels
were also characterized (Figure 14). The growth of seedlings used for analysis was
similar to previous seedlings grown in NAE and ABA, including hypersensitive faah
seedlings and slightly resistant OE seedlings (Figure 14A). Transcript levels of all three
genes were increased in the combined treatment in the three genotypes (Figure 14B).
ABI3 levels in all three genotypes were similar in both ABA treatment and in the
combined treatment. In wild type seedlings, the levels of RD29B in the combined
treatment was also similar to levels of ABA treatment alone (Table 2). The levels of
AtHVA22B in the combined treatment was slightly higher than in the ABA treatment
alone in WT seedlings (Table 2). In faah seedlings, AtHVA22B and RD29B levels were
much higher in the combined treatment than in ABA alone (Table 2). In the OE
seedlings, levels of AtHVA22B were much higher in the combined treatment but the
levels of RD29B were only slightly higher than in the ABA treatment (Table 2).
The combined NAE and ABA reduction in seedling growth could be occurring
through the ABA signaling pathway, so the effects of synergism on ABA-dependent
gene transcripts in ABA-signaling mutants were characterized (Figure 15). The
synergistic effect was not present in the seedlings used for this study, as expected
(Figure 15A). The abi3-1 mutant had no ABI3 transcript, as expected (Figure 15B). It
also showed no induction of the ABA-regulated gene AtHVA22B. However, another
ABA-regulated gene, RD29B, did show an increase in transcript when treated with ABA
and in the combined treatment. The levels of transcript were slightly lower in the
combined treatment than in the ABA treatment.

37
Relative gene transcript levels were measured by quantitative real time RT-PCR
for the combined treatment (Table 2). FAAH showed no substantial change in transcript
levels in NAE, ABA or combined treatment. The ABA responsive genes AtHVA22B,
RD29B and ATEM1 all showed higher transcript levels in ABA and combined
treatments, except AtHVA22B in the abi3-1 mutants, which exhibited very little increase
in transcript levels. An NAE responsive gene PNP-A showed slight increases in
transcript levels in WT (Col) and FAAH OE seedlings when treated with NAE, but levels
were much higher in faah seedlings. In addition, ABA treatment slightly lowers levels of
PNP-A in all three genotypes. In the ABA signaling mutant abi3-1, levels are not
responsive to NAE treatment, but drop severely in ABA treament.

38
Figure 12: Impact of NAE Dose Dependent Inhibition of Seedling Growth on ABI
Signaling-related Transcript Levels.
(A) Representative images of 10-d-old seedlings at increasing concentrations of NAE
12:0 exhibit the tolerance of the FAAH overexpressor and the sensitivity of the FAAH
knockout. (Contributed by Dr. Neal Teaster)
(B) Agarose gel analysis of RT-PCR using gene specific primers to analyze gene
expression in 10-d-old seedlings (treated with increasing concentrations of NAE 12:0).
ABI3 was run for 40 cycles, AtHVA22B and RD29B for 22 cycles and 18S for 25 cycles.

39
Figure 13: Impact of ABA Dose Dependent Inhibition of Seedling Growth on ABI
Signaling-related Transcript Levels.
(A) Representative images of 10-d-old seedlings at increasing concentrations of ABA
exhibit the tolerance of the FAAH knockout and the sensitivity of the FAAH
overexpressor.
(B) Agarose gel analysis of RT-PCR using gene specific primers to analyze gene
expression in 10-d-old seedlings (treated with increasing concentrations of (+) ABA).
ABI3 was run for 40 cycles, AtHVA22B and RD29B for 22 cycles and 18S for 25 cycles.

40
Figure 14: Impact of NAE and ABA Dose Dependent Inhibition of Seedling
Growth on ABI Signaling-related Transcript Levels.
(A) Representative images of 10-d-old seedlings grown in NAE 12:0 and ABA exhibit
the tolerance of the FAAH overexpressor and the sensitivity of the FAAH knockout.
(B) Agarose gel analysis of RT-PCR using gene specific primers to analyze gene
expression in 10-d-old seedlings (treated with 20 µM NAE, 0.1 µM ABA or NAE + ABA).
ABI3 was run for 40 cycles, AtHVA22B and RD29B for 22 cycles and 18S for 25 cycles.

41
Figure 15: An intact ABA signaling pathway is required for synergistic growth
arrest.
(A) Representative images of 10d-old seedlings grown in NAE 12:0, ABA or NAE +
ABA.
(B) Agarose gel analysis of RT-PCR using gene specific primers to analyze gene
expression in 10-d-old seedlings (treated with 20 µM NAE, 0.1 µM ABA or a
combination of both NAE + ABA). ABI3 was run for 40 cycles, AtHVA22B and RD29B
for 22 cycles and 18S for 25 cycles.

42
FAAH AtHVA22B RD29B ATEM1 PNP-A WT faah OE WT faah OE WT faah OE WT faah OE WT faah OE DMSO 1.0 - 8.6 1.0 0.5 1.8 1.0 0.3 2.6 1.0 0.5 0.9 1.0 1.3 9.2 20 µM NAE 0.7 - 7.0 0.8 1.6 0.7 1.4 2.5 0.5 0.9 1.2 1.9 7.4 21.5 7.0 0.1 µM ABA 0.4 - 3.8 48.8 24.5 82.2 91.0 63.3 358 7.5 4.3 23.9 0.2 0.3 0.5 20 µM NAE + 0.1 µM ABA 0.3 - 6.0 109 134 167 140 188 474 14.1 22.9 25.5 2.3 1.4 2.5
FAAH AtHVA22B RD29B ATEM1 PNP-A Ler abi3-1 Ler abi3-1 Ler abi3-1 Ler abi3-1 Ler abi3-1 DMSO 1.0 0.7 1.0 0.8 1.0 2.3 1.0 0.5 1.0 11.7 20 uM NAE 2.7 1.2 0.6 1.0 3.4 2.2 0.9 1.5 0.4 2.0 0.1 uM ABA 1.8 1.4 34.4 5.1 114.3 92.9 12.9 6.9 0.0 1.2 20 uM NAE + 0.1 uM ABA 1.5 1.4 135.9 4.6 261.9 123.4 18.8 1.3 0.1 0.6
Table 2: Effects of NAE 12:0 and/or ABA on Relative Transcript Levels of Selected Genes in 10 Day Old
Seedlings.
(A) Changes in gene transcript levels in 10 day old WT (Col) (WT), FAAH knockout (faah) and FAAH overexpressor (OE)
seedlings shown as average fold change relative to WT DMSO for each gene (n=3).
(B) Changes in gene transcript levels in 10 day old WT (Ler) and ABI3 knockout (abi3-1) seedlings shown as average
fold change relative to WT (Ler) DMSO for each gene (n=3).
A
B
43
CHAPTER 4
DISCUSSION
Previous studies have shown that Arabidopsis thaliana seeds germinated and
grown in N-lauroylethanolamine (NAE 12:0) display a severe reduction in growth
(Blancaflor et al., 2003; Motes et al., 2005). However, the mechanism of this NAE-
induced growth reduction is unknown. The similarities in growth defects between NAE
and ABA treated seedlings suggested a similar mechanism between the two (Teaster et
al., 2007). The evidence presented here suggests NAE-induced growth arrest occurs
primarily through an ABA-regulated pathway, although it can also occur through an
ABA-independent mechanism that it currently unknown. In addition, my thesis work
provides clues for the further elucidation of the mechanism of NAE-induced growth
arrest.
Evidence presented here demonstrates that the interaction between NAE and
ABA does not occur through modulating levels of either NAE or ABA. ABA levels did
not significantly increase in the combined NAE and ABA treatment, even when growth
was severely reduced, as in the FAAH overexpressor line (Figure 10C). The levels of
ABA in the abi3-1 seedlings were higher in the combined treatment as compared to the
control, but this is likely due to a combination of higher levels in seeds and the ABA
treatment added to the seedlings. Total NAE levels were higher in the combined
treatment for the faah and WT (Ler) seedlings (Figure 10A). In order for seedlings to
grow normally, it is postulated that the high levels of NAE found in seeds must be
depleted (Blancaflor et al., 2003; Teaster et al., 2007). The faah seedlings are less
capable of removing the NAEs, so they exhibit slower growth. In addition, the levels of

44
NAE 14:0 were much higher than in wild-type seedlings. The significance of this
elevated NAE 14:0 is unknown, but this remains an interesting alteration in NAE profiles
that should be followed up in future studies. This extra NAE 14:0 is not due to
contamination of the NAE 12:0 used to treat seedlings, so it must be produced
endogenously. One possible reason for this accumulation is that the seedlings are
attempting to remove the extra NAE 12:0 by elongating the NAE 12:0 through an
unknown mechanism. It is also possible that NAE 14:0 may play a protective role in
seedling development that is currently unknown. Seedlings could be increasing the
amount of NAE 14:0 from NAE14:0-PE in an attempt to alleviate the NAE 12:0 induced
stress. The WT (Ler) seedlings also grew poorly in the combined treatment and the
NAE levels remained high in those seedlings, suggesting some possible ecotype
differences in NAE-induced inhibition of seedling growth. The pattern of the different
NAE levels in seedlings did not differ significantly from the pattern in seeds (Figure 8F).
The levels are much lower in seedlings than in seeds, but the overall pattern remained
similar, except for the much higher levels of NAE 14:0 in the FAAH knockout seedlings.
Because total NAE levels and NAE profiles do not change significantly in the combined
NAE and ABA treatment, it is unlikely that the mechanism of NAE-induced growth arrest
is through modulation of NAE levels.
There are several limitations in using NAE 12:0 in these experiments. The NAE
12:0 levels typically found in Arabidopsis is 40-80 ng/g fresh weight in seeds and 60-
100 ng/g fresh weight in seedlings (Wang et al., 2006). The amount of NAE 12:0 added
in the combined NAE and ABA treatment (20 µM NAE and 0.1 µM ABA) is 4.8 µg/g of
media, 100 times more than typically found in plants. These high levels of NAE 12:0

45
are likely capable of causing other pleiotropic effects beyond any effects on NAE and
ABA signaling. NAE 12:0 has been shown to be a potent inhibitor of lipoxygenase
(LOX), which is normally able to remove high levels of unsaturated NAEs
(Keereetaweep et al., 2010). When LOX activity is inhibited, plants have higher levels
of unsaturated NAEs (especially NAE 18:2 and NAE 18:3). In addition, NAE 12:0 was
able to block wound-induced formation of jasmonic acid. This would suggest that NAE
12:0 is able to interact with other stress response pathways to inhibit growth. Another
limitation of using NAE 12:0 is that it can be removed from the media by the seedlings.
NAE 12:0 levels in media with WT seedlings grown in a starting concentration of 50 µM
NAE 12:0 is reduced to 45 µM by 6 days after sowing seeds in the media and 0.5 µM by
12 days (Teaster, 2009). In the experiments presented here, NAE 12:0 is not
replenished in the media. However, NAE 12:0 has less of an effect on seedling growth
after 5 days (Teaster et al., 2007). Because levels remain high in media up to that time,
it is unlikely that the lower levels at 10 days would have much of an effect on growth.
To eliminate the possibility of the effects of NAE 12:0 removal from the media, it may be
necessary to repeat these experiments in media that is refreshed every 3-5 days with
new media and NAE.
Exogenous application of NAE and ABA apparently inhibit seedling growth in a
similar overall manner. Wild-type seedlings grown in NAE 12:0 showed a dose-
dependent reduction in primary root length, similar to the reduction in seedlings grown
in ABA (Figure 3). At low levels of NAE and ABA, there was little reduction in growth,
but at higher levels, root length was greatly reduced (Figures 3 and 4). The FAAH
overexpressor showed a hypersensitive response to ABA and the FAAH knockout had a

46
slight tolerance toward exogenous ABA. When low levels of both NAE and ABA are
added together, seedlings demonstrate a synergistic response that is greater than the
sum of the reduction in growth in either compound separately (Figure 6). The pattern of
growth reduction in seedlings treated with low levels of both NAE and ABA was similar
to the reduction in growth seen in ABA-treated seedlings (Figure 4), suggesting that the
effect of ABA on growth arrest is dominant over any NAE effects on growth arrest.
Perhaps NAE helps to modulate ABA responses in seedling growth arrest, but this
interaction requires further investigation.
The reduction of seedling growth can be associated with changes in gene
expression at the molecular level by observing the levels of ABI3 transcripts in the
seedlings. When seedlings developed normally, the level of ABI3 transcripts in tissues
was low. When seedling growth was reduced, the ABI3 transcript levels were high
(Figures 12-14). While this inverse association between ABI3 transcript levels and
growth had been suggested in previous work (Teaster et al., 2007), the evidence
presented here demonstrates this effect more clearly. In the combined NAE and ABA
treatment, where seedlings were unable to grow, the levels of ABI3 transcript were
much higher (Figure 14). In addition, ABI3 regulated genes (AtHVA22B and RD29B)
showed a similar pattern of increased levels at lower growth. The changes in
expression of these ABA-regulated genes were much higher than changes in
expression of an NAE-regulated gene PNP-A (Table 2). It is unknown whether high
levels of ABI3 inhibited seedling growth or whether inhibiting seedling growth resulted in
higher ABI3 levels. Previous work indicates that ABI3 levels increase over time in NAE
treated seedlings (Teaster et al., 2007). This increase begins at 5 days after sowing in

47
liquid media, which is before differences in growth can be measured. This would
suggest that ABI3 transcript levels increase first, which in turn leads to inhibition of
seedling growth, but this needs to be further examined. Regardless of which occurs
first, it is evident that ABI3 plays an important role in seedling growth arrest and that
both NAE metabolism and ABA application can influence the overall transcript levels of
this important transcriptional regulator. This is further evidence of the importance of the
ABA-induced growth arrest mechanism in the combined NAE and ABA treatments.
The ABA signaling pathway plays an important role in NAE-induced growth
arrest, as demonstrated by the requirement for an intact ABA signaling pathway for the
synergistic reduction in growth from combined low levels of NAE and ABA (Figures 6
and 7). When the ABA signaling pathway was disrupted, as in the ABI3 knockout
seedlings, there was no synergistic reduction in growth by NAE and ABA (Figure 6).
This was also previously observed for other ABA signaling mutants abi1, abi2, abi4 and
abi5 (Teaster et al., 2007). There was also no increase in the ABA-regulated
AtHVA22B gene transcripts in the combined treatment (Figure 15). All of these proteins
have been previously identified as part of the secondary dormancy pathway that was
discovered by Chua and coworkers (Lopez-Molina et al., 2002; Lois et al., 2003).
Secondary dormancy refers to the ability of Arabidopsis seedlings that have already
passed the primary dormancy stage, and have germinated, to halt growth in unfavorable
conditions. This secondary dormancy pathway is especially important in early seedling
development, when abiotic stress perception is key to survival. In addition, NAE 12:0
has been found to only induce growth arrest within a similar narrow window during early
seedling development (Teaster et al., 2007). When low levels of ABA and NAE are
48
combined in this early developmental stage, it is possible these two compounds both
activate the secondary dormancy mechanism, operating through ABI3, inhibiting
seedling growth. Altogether, these data provide strong evidence that an intact ABA
signaling pathway is required for NAE-induced growth arrest.
Although the ABA signaling pathway appears to play a major role in NAE-
induced growth arrest, NAE 12:0 also appeared to induce seedling growth arrest
through an ABA-independent mechanism since growth of abi3-1 seedlings was inhibited
at higher levels of NAE (Figure 3). If NAE 12:0 was capable of inducing growth arrest
only through the ABA signaling pathway, the abi3-1 seedlings would be expected to
grow normally in exogenous NAE. Instead, abi3-1 seedlings have a 50% reduction in
primary root length compared to WT (Ler) (Figure 3F). The observed growth reduction
in abi3-1 seedlings treated with NAE was also associated with lower levels of the ABA-
regulated gene AtHVA22B compared to untreated seedlings (Figure 15). This
demonstrates that NAE can inhibit growth somewhat independent of the normal ABA
response pathway. However, this inhibition is not as strong as that seen when the ABA-
signaling pathway is intact. While AtHVA22B showed very low levels of transcipt in
abi3-1 seedlings, RD29B had much higher expression in ABA and NAE treated
seedlings as compared to untreated seedlings (Table 2). RD29B is a general drought
response gene that is strongly regulated by the ABI3 transcription factor (Nakashima et
al., 2006), but can be activated independently of ABA through MAPK mechanisms (Hua
et al., 2006). This suggests that NAE partially functions through a different pathway that
is partly, but not entirely, dependent on ABA.

49
In the combined NAE and ABA treatment, the hypersensitive reduction in growth
seen in the FAAH OE seedlings is counter-intuitive. If NAE induced growth arrest
through both the ABI3-dependent and -independent mechanisms equally, it would be
expected that because FAAH OE seedlings can remove NAE, they should have similar
growth in the combined treatment as they do when grown in ABA alone. The opposite
would be expected of the faah KO seedlings - they have higher levels of NAE, so they
would be expected to be more sensitive to the combined treatment. However, this is
not what was observed; instead, the FAAH OE seedlings are more sensitive and the
faah knockout seedlings are less sensitive. There are several possible explanations for
these results. The first is that the NAE levels are not as important in the NAE-induced
growth arrest as the levels of FAAH protein itself. There is some evidence that FAAH
itself can directly interact with ABA signaling, independent of its catalytic activity (Kim et
al., 2009). When seedlings with overexpressed catalytically inactive FAAH are grown in
the presence of ABA, they are unable to grow. This suggests that FAAH is able to
interact with ABA signaling independent of its amidohydrolase activity. The mechanism
of this interaction between ABA and FAAH is not yet known. It is also possible that the
NAE-induced growth arrest occurs early in seedling development, when NAE levels are
still high in the media and have not yet been reduced by FAAH (Teaster, 2009). In this
case, it is the initial level of NAE 12:0 that is responsible for the reduction in growth, and
the removal of NAE is not as important for allowing seedling growth. Because the
FAAH overexpressor seedlings are hypersensitive to ABA, it is possible that the high
levels of NAE 12:0 present during germination and early seedling development interact
50
with the ABA-signaling pathway to increase this hypersensitive reduction in growth in
the combined NAE and ABA treatment.
A complicating factor in the comparison between seedlings in the WT (Col) and
WT (Ler) background is the different growth rates of the various Arabidopsis ecotypes
(Beemster et al., 2002). Landsberg erecta seedlings, in general, grow slower than the
Columbia ecotype, but eventually plants grow larger. Seedlings in the Ler background,
including the abi3-1 seedlings, would therefore also be expected to grow more slowly,
possibly obscuring the insensitivity of ABI3 mutants to the combined NAE and ABA
treatment. In order to remove these complications, the effects of NAE and ABA on
abi3-1 seedlings needs to be repeated with ABI3 knockout seeds in the Columbia
background. This is expected to result in an increased observed tolerance to the
combined effects of NAE and ABA compared to the WT (Col) seedlings. It should be
noted, however, that previous work with ABI knockout seedlings in the WT (Col)
background, abi4-1, did demonstrate tolerance to the combined NAE and ABA
treatment (Teaster et al., 2007). It is therefore unlikely that ecotypic differences would
account for the observed growth differences.
Although ecotype growth differences are unlikely to account for the changes in
growth in NAE treatment, the elevated levels of NAE and ABA in the WT (Ler) seedlings
could be due to differences between the two ecotypes. NAE levels in WT (Ler)
seedlings treated with NAE and ABA combined are 10 times higher than in WT (Col)
seedlings. ABA levels are 5 times higher than in WT (Col) (Figure 10). The Landsberg
erecta ecotype is characterized by a mutation in ERECTA, a leucine-rich repeat
receptor-like Ser/Thr kinase (Torii et al., 1996). ERECTA has been identified as a

51
pleiotropic regulator of developmental and physiological processes (van Zanten et al.,
2009). It is possible that the elevated levels of NAE and ABA in the WT (Ler) seedlings
is related to the ERECTA mutation, and is not due to the growth reduction when
seedlings are grown in NAE and ABA. One way to test this is to quantify the effects of
exogenous NAE and ABA on endogenous levels in ERECTA mutants in the Columbia
background. If the levels of NAE and ABA are also elevated in these mutants, it is likely
that ERECTA itself is responsible for differences in NAE and ABA levels in WT (Ler)
seedlings. If levels do not increase, the differences are likely due to an increased
sensitivity of the WT (Ler) seedlings to exogenous NAE and ABA.
Future experiments should focus on understanding exactly how NAE interacts
with ABA. The first step should be to complete work to identify how FAAH interacts with
ABA. Because NAE and ABA levels do not change dramatically in NAE or ABA
treatment, the interaction is likely to take place downstream of the production of NAE
and ABA. Because of this, the mutants for the ABA receptor, especially PYL1
(Miyazono et al., 2009), should be tested for NAE sensitivity. If NAE functions through
this receptor (upstream of the ABI genes), there should be no reduction in growth when
treated with high levels of NAE. There is also some evidence that FAAH itself can
directly interact with ABA signaling, independent of its catalytic activity (Kim et al.,
2009). This interaction could explain why FAAH overexpressors are hypersensitive to
ABA and the combined NAE and ABA treatment, even though ABA does not alter FAAH
amidohydrolase activity (Figure 11). The mechanism of this interaction between ABA
and FAAH is also not yet known and needs to be further characterized.

52
In addition to working on how NAE interacts with the ABA signaling pathway, the
ABA-independent mechanism of NAE-induced growth arrest needs to be investigated
more thoroughly. It is possible NAE functions independently of ABA signaling by
modulating levels of secondary messengers or other signaling pathways. The effects of
NAE on secondary messenger levels, especially changes to calcium levels and reactive
oxygen species, should be studied. ABA has been shown to induce both of these
(Bright et al., 2006; Chai et al., 2006), so if NAE also induces one or more of these
secondary messengers the combined levels could greatly impact growth. NAE could
also function to inhibit seedling growth by modulating any of the many MAP kinase
pathways found in Arabidopsis (Hua et al., 2006; Fiil et al., 2009; Andreasson and Ellis,
2010). These various MAPK pathways play important roles in seedling development
and response to stress. Microarray data on NAE 12:0 treated seedlings did not identify
any known MAPK genes with significantly altered expression compared to DMSO
treated seedlings (Teaster et al., 2007). However, this does not necessarily indicate
that NAE 12:0 does not interact with any MAPKs. Several genes that do interact
strongly with different MAPKs were up-regulated in NAE treatment, including RD29B.
NAE could be interacting with these other signaling mechanisms to induce growth
arrest. Understanding these interactions would likely help not only in determining how
ABA-dependent NAE-induced growth occurs, but also in identifying how NAE can
induce growth arrest independent of ABA.
In summary, NAE can induce seedling growth arrest through ABA-signaling
pathway-dependent and -independent mechanisms. The strong reduction in growth in
seedlings treated with both NAE 12:0 and ABA suggests that NAEs, which are relatively

53
minor lipids in Arabidopsis, may play a more significant role in early seedling
development than previously thought. In addition, this interaction with an important
phytohormone, ABA, illustrates the complex connections between components in plant
development which still need to be identified and characterized. Overall, identifying the
mechanism of NAE-induced growth arrest could help shed light on other general
mechanisms of arresting seedling growth in the early stages of development as a
physiological response to unfavorable environmental conditions.

54
REFERENCES
Andreasson, E., and Ellis, B. (2010). Convergence and specificity in the Arabidopsis
MAPK nexus. Trends Plant Sci 15, 106-113.
Beemster, G.T.S., De Vusser, K., De Tavernier, E., De Bock, K., and Inze, D. (2002).
Variation in growth rate between Arabidopsis ecotypes is correlated with cell
division and A-type cyclin-dependent kinase activity. Plant Physiol. 129, 854-864.
Blancaflor, E.B., Hou, G., and Chapman, K.D. (2003). Elevated levels of N-
lauroylethanolamine, an endogenous constituent of desiccated seeds, disrupt
normal root development in Arabidopsis thaliana seedlings. Planta 217, 206-217.
Bradford, M.M. (1976). A rapid and sensitive method for the quantitation of microgram
quantities of protein utilizing the principle of protein-dye binding. Anal Biochem
72, 248-254.
Bright, J., Desikan, R., Hancock, J.T., Weir, I.S., and Neill, S.J. (2006). ABA-induced
NO generation and stomatal closure in Arabidopsis are dependent on H2O2
synthesis. Plant J 45, 113-122.
Chai, M.-F., Wei, P.-C., Chen, Q.-J., An, R., Chen, J., Yang, S., and Wang, X.-C.
(2006). NADK3, a novel cytoplasmic source of NADPH, is required under
conditions of oxidative stress and modulates abscisic acid responses in
Arabidopsis. Plant J 47, 665-674.
Chapman, K.D. (2004). Occurrence, metabolism, and prospective functions of N-
acylethanolamines in plants. Prog Lipid Res 43, 302-327.

55
Chapman, K.D., Venables, B., Markovic, R., Blair Jr, R.W., and Bettinger, C. (1999).
N-Acylethanolamines in seeds. Quantification of molecular species and their
degradation upon imbibition. Plant Physiol 120, 1157-1164.
Colby, S.R. (1967). Calculating synergistic and antagonistic responses of herbicide
combinations. Weeds 15, 20-22.
Coursol, S., Fan, L.-M., Le Stunff, H., Spiegel, S., Gilroy, S., and Assmann, S.M.
(2003). Sphingolipid signalling in Arabidopsis guard cells involves heterotrimeric
G proteins. Nature (London) 423, 651-654.
Cutler, S.R., Rodriguez, P.L., Finkelstein, R.R., and Abrams, S.R. (2009). Abscisic
acid: Emergence of a core signaling network. Annu Rev Plant Physiol Plant Mol
Biol.
Devane, W.A., Hanus, L., Breuer, A., Pertwee, R.G., Stevenson, L.A., Griffin, G.,
Gibson, D., Mandelbaum, A., Etinger, A., and Mechoulam, R. (1992). Isolation
and structure of a brain constituent that binds to the cannabinoid receptor.
Science 258, 1946-1949.
Fiil, B.K., Petersen, K., Petersen, M., and Mundy, J. (2009). Gene regulation by MAP
kinase cascades. Curr Opin Plant Biol 12, 615-621.
Finkelstein, R.R., Gampala, S.S.L., and Rock, C.D. (2002). Abscisic acid signaling in
seeds and seedlings. Plant Cell 14, S15.
Hua, Z.-M., Yang, X., and Fromm, M.E. (2006). Activation of the NaCl- and drought-
induced RD29A and RD29B promoters by constitutively active Arabidopsis
MAPKK or MAPK proteins. Plant Cell Environ 29, 1761-1770.

56
Keereetaweep, J., Kilaru, A., Feussner, I., Venables, B.J., and Chapman, K.D.
(2010). Lauroylethanolamide is a potent competitive inhibitor of lipoxygenase
activity. FEBS Lett In Press, Corrected Proof.
Kilaru, A., Blancaflor, F.B., Venables, B.J., Tripathy, S., Mysore, K.S., and
Chapman, K.D. (2007). The N-acylethanolamine-mediated regulatory pathway in
plants. Chem Biodivers 4, 1933-1955.
Kim, S.-C., Kang, L., Nagaraj, S., Blancaflor, E.B., Mysore, K.S., and Chapman,
K.D. (2009). Mutations in Arabidopsis fatty acid amide hydrolase reveal that
catalytic activity influences growth but not sensitivity to abscisic acid or
pathogens. J Biol Chem 284, 34065-34074.
Livak, K.J., and Schmittgen, T.D. (2001). Analysis of relative gene expression data
using real-time quantitative PCR and the 2-[Delta][Delta]CT method. Methods 25,
402-408.
Lois, L.M., Lima, C.D., and Chua, N.-H. (2003). Small ubiquitin-like modifier modulates
abscisic acid signaling in Arabidopsis. Plant Cell 15, 1347-1359.
Lopez-Molina, L., Mongrand, S., McLachlin, D.T., Chait, B.T., and Chua, N.H.
(2002). ABI5 acts downstream of ABI3 to execute an ABA-dependent growth
arrest during germination. Plant J 32, 317-328.
Mehra, M. (1996). RNA isolation from cells and tissues. (Wiley-Liss, Inc.; Wiley-Liss,
Ltd.).
Melcher, K., Ng, L.-M., Zhou, X.E., Soon, F.-F., Xu, Y., Suino-Powell, K.M., Park, S.-
Y., Weiner, J.J., Fujii, H., Chinnusamy, V., Kovach, A., Li, J., Wang, Y., Li, J.,
Peterson, F.C., Jensen, D.R., Yong, E.-L., Volkman, B.F., Cutler, S.R., Zhu,

57
J.-K., and Xu, H.E. (2009). A gate-latch-lock mechanism for hormone signalling
by abscisic acid receptors. Nature 462, 602-608.
Mishra, G., Zhang, W.H., Deng, F., Zhao, J., and Wang, X.M. (2006). A bifurcating
pathway directs abscisic acid effects on stomatal closure and opening in
Arabidopsis. Science 312, 264-266.
Miyazono, K.-i., Miyakawa, T., Sawano, Y., Kubota, K., Kang, H.-J., Asano, A.,
Miyauchi, Y., Takahashi, M., Zhi, Y., Fujita, Y., Yoshida, T., Kodaira, K.-S.,
Yamaguchi-Shinozaki, K., and Tanokura, M. (2009). Structural basis of
abscisic acid signalling. Nature 462, 609-614.
Motes, C.M., Cotter, M.Q., Wang, Y.S., Chapman, K.D., and Blancaflor, E.B. (2006).
Synergistic effects of N-acylethanolamine (NAE) and abscisic acid (ABA) on
Arabidopsis seed germination and seeedling growth. In SS-ASPB Annual
Meeting 2006 (Daytona Beach, FL).
Motes, C.M., Pechter, P., Yoo, C.M., Wang, Y.-S., Chapman, K.D., and Blancaflor,
E.B. (2005). Differential effects of two phospholipase D inhibitors, 1-butanol and
N-acylethanolamine, on in vivo cytoskeletal organization and Arabidopsis
seedling growth. Protoplasma 226, 109.
Nakashima, K., Fujita, Y., Katsura, K., Maruyama, K., Narusaka, Y., Seki, M.,
Shinozaki, K., and Yamaguchi-Shinozaki, K. (2006). Transcriptional regulation
of ABI3-and ABA-responsive genes including RD29B and RD29A in seeds,
germinating embryos, and seedlings of Arabidopsis. Plant Mol Biol 60, 51-68.

58
Rider, S.D., Jr., Henderson, J.T., Jerome, R.E., Edenberg, H.J., Romero-Severson,
J., and Ogas, J. (2003). Coordinate repression of regulators of embryonic
identity by PICKLE during germination in Arabidopsis. Plant J 35, 33-43.
Rock, C.D. (2000). Tansley Review No. 120. Pathways to abscisic acid-regulated gene
expression. New Phytol 148, 357-396.
Shrestha, R., Dixon, R.A., and Chapman, K.D. (2003). Molecular identification of a
functional homologue of the mammalian fatty acid amide hydrolase in
Arabidopsis thaliana. J Biol Chem 278, 34990-34997.
Shrestha, R., Noordermeer, M.A., van der Stelt, M., Veldink, G.A., and Chapman,
K.D. (2002). N-Acylethanolamines are metabolized by lipoxygenase and
amidohydrolase in competing pathways during cottonseed imbibition. Plant
Physiol 130, 391-401.
Teaster, N.D. (2009). A regulatory role for N-acylethanolamine metabolism in
Arabidopsis thaliana seeds and seedlings. In Biological Sciences (Denton:
University of North Texas).
Teaster, N.D., Motes, C.M., Tang, Y., Wiant, W.C., Cotter, M.Q., Wang, Y.-S., Kilaru,
A., Venables, B.J., Hasenstein, K.H., Gonzalez, G., Blancaflor, E.B., and
Chapman, K.D. (2007). N-Acylethanolamine metabolism interacts with abscisic
acid signaling in Arabidopsis thaliana seedlings. Plant Cell 19, 2454-2469.
Torii, K.U., Mitsukawa, N., Oosumi, T., Matsuura, Y., Yokayama, R., Whittier, R.F.,
and Komeda, Y. (1996). The Arabidopsis ERECTA gene encodes a putative
receptor protein kinase with extracellular leucine-rich repeats. Plant Cell 8, 735-
746.

59
van Zanten, M., Snoek, L.B., Proveniers, M.C.G., and Peeters, A.J.M. (2009). The
many functions of ERECTA. Trends Plant Sci 14, 214-218.
Venables, B.J., Waggoner, C.A., and Chapman, K.D. (2005). N-acylethanolamines in
seeds of selected legumes. Phytochem 66, 1913-1918.
Wang, Y., Mopper, S., and Hasenstein, K.H. (2001). Effects of salinity on endogenous
aba, iaa, ja, and a in Iris hexagona. J Chem Ecol 27, 327.
Wang, Y.S., Shrestha, R., Kilaru, A., Wiant, W., Venables, B.J., Chapman, K.D., and
Blancaflor, E.B. (2006). Manipulation of Arabidopsis fatty acid amide hydrolase
expression modifies plant growth and sensitivity to N-acylethanolamines. Proc
Natl Acad Sci U S A 103, 12197-12202.
Webb, A.A.R., Larman, M.G., Montgomery, L.T., Taylor, J.E., and Hetherington,
A.M. (2001). The role of calcium in ABA-induced gene expression and stomatal
movements. Plant J 26, 351-362.