Interaction of Capillary and Tissue Force ins the Cat...
12
348 CIRCULATION RESEARCH VOL. 39, No. 3, SEPTEMBER 1976 low frequency stimulation. Arch Int Pharmacodyn Thcr 171: 185-197, 1968 27. Kirpekar SM, Prat JC, Wakade AR: Effect of calcium on'the relation- ship between frequency of stimulation and release of noradrcnaline from the perfused spleen of the cat. Naunyn Schmiedcbcrgs Arch Pharma- col 287: 205-212, 1975 28. Hliggendal J, Johansson B, Jonason J, Ljung B: Correlation between noradrenaline release and effector response to nerve stimulation in rat portal vein in vitro Ada Physiol Scand suppl 349: 17-32. 1970 29. McCulloch MW, Bcvan JA, Su C: Effects of phenoxybcnzamine and norepincphrinc on transmitter release in the pulmonary artery of the rabbit. Blood Vessels 12: 122-133, 1975 30. Hughes J: Evaluation of mechanisms controlling the release and inactiva- tion of the adrenergic transmitter in the rabbit portal vein and was de- ferens. Br J Pharmacol 44: 472-491, 1972 31. StjUrne L: Frequency dependence of dual negative feedback control of secretion of sympathetic ncurotransmittcr in guinea-pig vas deferens. Br J Pharmacol 49: 358-360, 1973 32. Yamaguchi N, de Champlain J, Nadeau R: Correlation between the response of the heart to sympathetic stimulation and the release of en- dogenous catecholamines into the coronary sinus of the dog. Circ Res 36: 662-668, 1975 33. Gillis CN, Schneider FH Frequency-dependent potcntiation by various drugs of the chronotropic response of isolated cat atria to sympathetic nerve stimulation. Br J Pharmacol 30: 541-553 1967 34. Stja"rne L: Rate limiting factors in sympathetic neurotransmittcr secre- tion Acta Physiol Scand 93: 220-227, 1975 35 Burnstock B, Holman ME. Kuriyama H Facilitation of transmission from autonomic nerve to smooth muscle of guinea-pig vas deferens. J Physiol (Lond) 172: 31-49, 1964 36. Vizi ES. Somogyi GT, Hadhazy P, Knoll J: Effect of duration and frequency of stimulation on the pre-synaptic inhibition by o-adreno- reccptor stimulation of the adrenergic transmission Naunyn Schmicde- bergs Arch Pharmacol 280: 79-91, 1973 37. Starke K: Influence of extracellular noradrenaline on the stimulation- evoked secretion of noradrenalinc from sympathetic nerves: evidence for an a-rcceptor-mediated feed-back inhibition of noradrenaline re- lease. Naunyn Schmiedebergs Arch Pharmacol 275: 11-23, 1972 Interaction of Capillary and Tissue Forces in the Cat Small Intestine NICHOLAS A. MORTILLARO, PH.D., AND AUBREY E. TAYLOR, PH.D. SUMMARY We measured steady state capillary hydrostatic pressure (P c .i). plasma and lymph protein concentrations, lymph and blood flow, and capillary filtration coefficients in an in situ loop of cat small intestine at venous outflow pressures (P v ) of 0, 5, 10, 15, 20, 25, and 30 mm Hg. The data were used to calculate colloid osmotic pressure of lymph and plasma, interstitial fluid pressure (P T ), pre- and postcapillary resistances, and a tissue pressure-volume curve of the intestinal interstitium. When P v was derated from 0 to 30 mm Hg, lymph protein concentration decreased from 3.8 to 1.9 g/100 ml (representing a change in colloid osmotic pressure of 6.2 mm Hg), lymph flow increased 7-fold (or an equivalent imbalance in Starling forces of 43 mm Hg), and the calculated P T increased from - 1 . 8 to +5.3. Because lymph flow draining the loop decreased during the determination of P c , at venous pressures between 15 and 30 mm Hg, the corresponding calculated P T may be in error by 1-2 mm Hg. The tissue pressure-volume relationship calculated from the data indicates that the intestinal interstitial volume expands nonlioearly and this expansion is characterized by two distinctly different compliant components: (1) tissue compliance is low at P v between 0 and 15 mm Hg (0.4 ml/mm Hg), and (2) at P v greater than 15 mm Hg the tissue compliance is relatively high (4 ml/mm Hg). We found that when P v was elevated from 0 to 15 mm Hg, increases in P T are the major tissue adjustments that oppose the increased filtration pressures. Furthermore, at P v of 20-30 mm Hg, tissue protein concentration decreases, lymph flow relative to the filtration coefficient | A P m op) increases and, to a much lesser extent, P T increases. Finally, the com- bination of these changes in tissue force at high filtration pressures represent a maximum tissue edema "safety factor" of 10 mm Hg; further increases in filtration pressures result in large volume move- ments into the intestinal lumen. STARLING PROPOSED, in 1896, 1 that the rate and direction of fluid exchange across the capillary membrane was a function of the capillary hydrostatic pressure (P c ) and the plasma colloid osmotic pressure (JTPL). PC determined nitration and T PL was responsible for absorption. Starling's concept was later extended to include the hydrostatic pressure (P T ) and colloid osmotic pressure (jr T ) of the interstitium, the pressure head driving the lymph [effective capillary filtration pressure (AP DR0P )], and the- physical properties of the capillary membrane. 2 3 Under normal From the Department of Physiology and Biophysics, University of Mississippi Medical Center, Jackson, Mississippi. Supported by Grant HL 15680 from the National Heart and Lung Institute and performed during Dr. Mortillaro's tenure as an NIH postdoc- toral fellow. Dr. Mortillaro's present address is- Department of Physiology, College of Medicine, University of South Alabama, Mobile, Alabama 36688. A preliminary report of this work was presented at the 1973 Fall Meeting of the American Physiological Society, Rochester, New York. Original manuscript received March 20. 1974: accepted for publication May 12, 1976. conditions these forces are in a steady state with a small net filtration resulting in a low resting lymph flow. When this steady state is disturbed, an increase in net filtration or absorption is observed, and over a period of time the capillary bed and tissue spaces attain a new steady state in which the tissue is not gaining or losing weight. 4 ' This new steady state is achieved by the readjustment of the Starling forces in a direction to oppose the increases in filtration or absorption forces. Pappenheimer and Soto-Rivera 3 indirectly measured the tissue forces, tissue colloid osmotic pressure, and tissue fluid pressure in an isolated hindlimb preparation. They found that the isogravimetric pressure, which is equal to the sum of the other Starling forces, jr PL , in, and P T , was equal to jr PL - 2 (mm Hg); this finding indicates that P T and TT were very small in their preparation. Any major increase in capillary pressure would result in continuous filtration into the interstitium without any apparent adjustment of Starling forces to oppose filtration. In fact, these authors used the by guest on June 25, 2018 http://circres.ahajournals.org/ Downloaded from
Transcript of Interaction of Capillary and Tissue Force ins the Cat...

348 CIRCULATION RESEARCH VOL. 39, No. 3, SEPTEMBER 1976
low frequency stimulation. Arch Int Pharmacodyn Thcr 171: 185-197,1968
27. Kirpekar SM, Prat JC, Wakade AR: Effect of calcium on'the relation-ship between frequency of stimulation and release of noradrcnaline fromthe perfused spleen of the cat. Naunyn Schmiedcbcrgs Arch Pharma-col 287: 205-212, 1975
28. Hliggendal J, Johansson B, Jonason J, Ljung B: Correlation betweennoradrenaline release and effector response to nerve stimulation in ratportal vein in vitro Ada Physiol Scand suppl 349: 17-32. 1970
29. McCulloch MW, Bcvan JA, Su C: Effects of phenoxybcnzamine andnorepincphrinc on transmitter release in the pulmonary artery of therabbit. Blood Vessels 12: 122-133, 1975
30. Hughes J: Evaluation of mechanisms controlling the release and inactiva-tion of the adrenergic transmitter in the rabbit portal vein and was de-ferens. Br J Pharmacol 44: 472-491, 1972
31. StjUrne L: Frequency dependence of dual negative feedback control ofsecretion of sympathetic ncurotransmittcr in guinea-pig vas deferens.Br J Pharmacol 49: 358-360, 1973
32. Yamaguchi N, de Champlain J, Nadeau R: Correlation between the
response of the heart to sympathetic stimulation and the release of en-dogenous catecholamines into the coronary sinus of the dog. Circ Res36: 662-668, 1975
33. Gillis CN, Schneider FH Frequency-dependent potcntiation by variousdrugs of the chronotropic response of isolated cat atria to sympatheticnerve stimulation. Br J Pharmacol 30: 541-553 1967
34. Stja"rne L: Rate limiting factors in sympathetic neurotransmittcr secre-tion Acta Physiol Scand 93: 220-227, 1975
35 Burnstock B, Holman ME. Kuriyama H Facilitation of transmissionfrom autonomic nerve to smooth muscle of guinea-pig vas deferens. JPhysiol (Lond) 172: 31-49, 1964
36. Vizi ES. Somogyi GT, Hadhazy P, Knoll J: Effect of duration andfrequency of stimulation on the pre-synaptic inhibition by o-adreno-reccptor stimulation of the adrenergic transmission Naunyn Schmicde-bergs Arch Pharmacol 280: 79-91, 1973
37. Starke K: Influence of extracellular noradrenaline on the stimulation-evoked secretion of noradrenalinc from sympathetic nerves: evidencefor an a-rcceptor-mediated feed-back inhibition of noradrenaline re-lease. Naunyn Schmiedebergs Arch Pharmacol 275: 11-23, 1972
Interaction of Capillary and Tissue Forces in the CatSmall Intestine
NICHOLAS A. MORTILLARO, P H . D . , AND AUBREY E. TAYLOR, P H . D .
SUMMARY We measured steady state capillary hydrostaticpressure (Pc.i). plasma and lymph protein concentrations, lymph andblood flow, and capillary filtration coefficients in an in situ loop ofcat small intestine at venous outflow pressures (Pv) of 0, 5, 10, 15, 20,25, and 30 mm Hg. The data were used to calculate colloid osmoticpressure of lymph and plasma, interstitial fluid pressure (PT), pre-and postcapillary resistances, and a tissue pressure-volume curve ofthe intestinal interstitium. When Pv was derated from 0 to 30 mmHg, lymph protein concentration decreased from 3.8 to 1.9 g/100 ml(representing a change in colloid osmotic pressure of 6.2 mm Hg),lymph flow increased 7-fold (or an equivalent imbalance in Starlingforces of 43 mm Hg), and the calculated PT increased from - 1 . 8 to+5.3. Because lymph flow draining the loop decreased during thedetermination of P c , at venous pressures between 15 and 30 mm Hg,the corresponding calculated PT may be in error by 1-2 mm Hg. The
tissue pressure-volume relationship calculated from the data indicatesthat the intestinal interstitial volume expands nonlioearly and thisexpansion is characterized by two distinctly different compliantcomponents: (1) tissue compliance is low at P v between 0 and 15 mmHg (0.4 ml/mm Hg), and (2) at Pv greater than 15 mm Hg the tissuecompliance is relatively high (4 ml/mm Hg). We found that whenPv was elevated from 0 to 15 mm Hg, increases in PT are the majortissue adjustments that oppose the increased filtration pressures.Furthermore, at Pv of 20-30 mm Hg, tissue protein concentrationdecreases, lymph flow relative to the filtration coefficient |AP m op)increases and, to a much lesser extent, PT increases. Finally, the com-bination of these changes in tissue force at high filtration pressuresrepresent a maximum tissue edema "safety factor" of 10 mm Hg;further increases in filtration pressures result in large volume move-ments into the intestinal lumen.
STARLING PROPOSED, in 1896,1 that the rate and
direction of fluid exchange across the capillary membrane
was a function of the capillary hydrostatic pressure (Pc) and
the plasma colloid osmotic pressure (JTPL). PC determined
nitration and T P L was responsible for absorption. Starling's
concept was later extended to include the hydrostatic
pressure (PT) and colloid osmotic pressure (jrT) of the
interstitium, the pressure head driving the lymph [effective
capillary filtration pressure (APDR0P)], and the- physical
properties of the capillary membrane.2 3 Under normal
From the Department of Physiology and Biophysics, University ofMississippi Medical Center, Jackson, Mississippi.
Supported by Grant HL 15680 from the National Heart and LungInstitute and performed during Dr. Mortillaro's tenure as an NIH postdoc-toral fellow. Dr. Mortillaro's present address is- Department of Physiology,College of Medicine, University of South Alabama, Mobile, Alabama 36688.
A preliminary report of this work was presented at the 1973 Fall Meetingof the American Physiological Society, Rochester, New York.
Original manuscript received March 20. 1974: accepted for publicationMay 12, 1976.
conditions these forces are in a steady state with a small net
filtration resulting in a low resting lymph flow. When this
steady state is disturbed, an increase in net filtration or
absorption is observed, and over a period of time the
capillary bed and tissue spaces attain a new steady state in
which the tissue is not gaining or losing weight.4' This new
steady state is achieved by the readjustment of the Starling
forces in a direction to oppose the increases in filtration or
absorption forces.
Pappenheimer and Soto-Rivera3 indirectly measured the
tissue forces, tissue colloid osmotic pressure, and tissue fluid
pressure in an isolated hindlimb preparation. They found
that the isogravimetric pressure, which is equal to the sum of
the other Starling forces, jrPL, in, and PT, was equal to jrPL
- 2 (mm Hg); this finding indicates that PT and TT were very
small in their preparation. Any major increase in capillary
pressure would result in continuous filtration into the
interstitium without any apparent adjustment of Starling
forces to oppose filtration. In fact, these authors used the
by guest on June 25, 2018http://circres.ahajournals.org/
Dow
nloaded from

INTESTINAL TISSUE AND LYMPHATIC FORCES/A/or//7/aro and Taylor 349
continuous nitration phase of weight gain curves to charac-terize the filtration properties of the capillary membrane.
Johnson and Hanson5 measured the isogravimetric capil-lary pressure in an isolated intestinal preparation and foundthat it was approximately equal to TTPL - 7.4 (mm Hg), at anormal venous outflow pressure. The relatively low intesti-nal isogravimetric capillary pressure was interpreted by theauthors to reflect a normally high interstitial colloid osmoticpressure, but recent developments indicate that a negativeinterstitial fluid pressure also might explain their findings.7
Also, in the absence of lymphatic drainage, tissue colloidosmotic pressure could become elevated because of proteinleakage into the interstitium, and this would result in a smallisogravimetric pressure.
Because of the large difference between isogravimetriccapillary hydrostatic pressure and 7rPL, intestinal prepara-tions will attain isogravimetric states at several venousoutflow pressures, e.g., 0, 5, 10, and 18 mm Hg.' "Wallentin,6 using an indirect method, concluded that inter-stitial fluid pressure changes constitute the major tissueforce adjustment that opposes the increased capillary hydro-static pressure caused by elevating venous pressures. How-ever, Johnson* 9 suggested that interstitial proteins weredecreased as a result of dilution of tissue proteins by aprotein-poor capillary filtrate, and this resulted in a reducedinterstitial colloid osmotic pressure. The proposal thatreduced tissue colloid osmotic pressure was the majorcompensatory change in the tissues was further strengthenedby the observation that interstitial fluid pressure, measuredby inserting a needle directly into the tissues, remainedessentially unchanged over a wide range of capillary hydro-static pressures. One major difficulty in attempting toresolve this controversy is that in the isogravimetric studiesmentioned above there was no lymph flow draining thepreparations; this could markedly effect the experimentalresults.
In an attempt to settle this controversy, the followingexperiments were designed either to measure or calculate, inan in situ intestinal preparation with intact lymph flow, therelative interaction of the forces involved in the Starlingequilibrium at the capillary-tissue interfaces that resultedfrom sustained increases in venous outflow pressure. Wehave measured simultaneously for each intestinal prepara-tion: isovolumetric capillary hydrostatic pressure, plasmaand lymph protein concentration, both lymph and bloodflow, arterial and venous outflow pressure, the capillaryfiltration coefficient, and changes in tissue fluid volume asvenous outflow pressures were elevated from 0 to 5, 10, 15,20, or 30 mm Hg. It should be emphasized that intestinalpreparations used yield information only in terms of changesin the overall intestinal parameters measured or calculated(average or functional tissue and capillary parameters) anddo not allow interpretations of the direction or magnitude(or both) of changes in the Starling forces of each individualtissue compartment of the intestine such as mucosa, mus-cularis, etc.
Methods
SURGICAL PROCEDURE
Female cats weighing 2-3 kg were anesthetized withsodium pentobarbital, intraperitoneally (ip), 30 mg/kg;
supplementary doses were given intravenously (iv) asrequired. Each cat was partially fasted (as explained underDetermination of Lymph Flow) for a period of 24 hoursprior to the experiment. A tracheal cannula was inserted.The greater omentum, spleen, stomach, large intestine, andmost of the small intestine were surgically extirpatedthrough a midline abdominal incision. A loop of ileumweighing 10-30 g and with intact innervation and lymphaticdrainage was isolated and autoperfused by the intactmesenteric artery. The cat's body temperature was moni-tored with a glass thermometer inserted orally and main-tained at 37°C by a heating pad placed beneath the cat. Inaddition, an overhead heating lamp also was used tomaintain a constant body temperature. All exposed tissuewas moistened with saline-soaked gauze and covered with aplastic sheet. Atropine, I mg/kg, and heparin, 200 USP/kg,were administered iv.
DETERMINATION OF BLOOD FLOW
A large cannula was inserted into the superior mesentericvein and the venous outflow was passed through a silicone(Dow Corning 200), fluid-filled drop chamber onto whichwas mounted a photoelectric cell (Fig. 1). The signal fromthe cell was used to drive an Impulse flowmeter."' Afterpassage through the drop chamber, blood was returnedto the cat by a cannula inserted into the right external jugu-lar vein. Heparinized blood from a donor cat killed just be-fore the transfusion was used to fill all tubing of the extra-corporeal blood now circuit. Also, additional blood wasadded to the system in order to maintain the cat's arterialpressure, which at times was susceptible to changes result-ing from blood losses during the course of the experimentalprocedure.
, PHOTOCELL
TO FLOWMETER
LlDROP CHAMBER
LYMPH COLLECTINGPIPETTE
TO RECORDER
TO RECOROER
RESERVOIR
FIGURE I Diagram illustrating the experimental arrangementused to continuously measure intestinal blood and lymph /lows,changes in intestinal volume, systemic arterial pressure, andintestinal venous outflow pressure.
by guest on June 25, 2018http://circres.ahajournals.org/
Dow
nloaded from
350 CIRCULATION RESEARCH VOL. 39, No. 3, SEPTEMBER 1976
DETERMINATION OF LYMPH FLOW
Visual identification of the lymphatic vessels of theintestine was made possible by feeding the cats a mixture ofmilk and cream at approximately 6 to 12 hours beforesurgery. This procedure had the advantage of clearlymarking the large downstream lymphatic vessels found inthe mesenteric pedicle and thereby facilitating their cannula-tion. With the aid of a dissecting microscope a cannula wasinserted into the large lymphatic vessel emerging from themesenteric pedicle. Entrance into the vessel was made at apoint between the pedicle and the site where the vesseldrained into the superior mesenteric lymph node. Thedetermination of lymph flow was made by allowing lymph toflow out through the cannula and into a calibrated pipette (1ml, full scale). The pipette was positioned horizontally andat the level of the intestinal segment under study. Becausethe greater part of the small intestine had been removed, webelieve that the lymph flow measured in this manner reflectsnear-total lymph flow from the ileal segment.
DETERMINATION OF ARTERIAL AND VENOUSOUTFLOW PRESSURE
Arterial pressure was obtained from a cannula insertedinto a femoral artery and measured by a Statham trans-ducer (P23Ac). Large vein pressure in the intestinal loopwas measured through a T-connector inserted into the ve-nous outflow circuit immediately distal to the superiormesenteric vein. The T-connector and associated pressuretransducer (Statham P23Bc) were positioned at heart level.The desired large vein pressure of the intestine was set byadjusting the height of the drop chamber.
DETERMINATION OF CHANGES ININTESTINAL VOLUME
The intact intestinal loop was placed in a triangular Luciteplethysmograph. The mesenteric pedicle was passed througha closely fitting opening at the proximal end of theplethysmograph. The opening was sealed with a plasticizedhydrocarbon gel (Plastibase, Squibb), and a cover wasplaced over the top and firmly attached to the base. Arubber gasket placed between the cover and base ensuredthat a proper seal was achieved. Extreme care was taken toavoid compression of the mesenteric pedicle because thiswould disturb the blood and lymph flow draining theenclosed ileal segment. The sealed plethysmograph wasconnected with a short length of Tygon tubing to a Lucitereservoir of large radius. The reservoir had a large diameterso that no excessive back pressure would build up duringelevations of venous pressure (A.H. Goodman, unpublishedobservations). The reservoir was suspended from a precali-brated force-displacement transducer (Grass, FT IOC); boththe reservoir and the plethysmograph were filled withTyrode's solution and positioned at heart level of the supinecat. In several experiments, when intestinal loops were to besubjected to venous pressures of 25 mm Hg or more, theends of the intestinal loop were mounted on inlet portslocated on each side of the plethysmograph. This procedureallowed secretory fluids to drain out of the intestinal lumen,thereby avoiding the accumulation of such fluid, which couldinfluence the measurement of tissue volume.
DETERMINATION OF CAPILLARY FILTRATIONCOEFFICIENT
Johnson and Hanson' used the isogravimetric techniqueto study changes in blood volume in the dog intestine duringperturbations in venous outflow pressure and plotted therecorded weight changes against time on a semilogarithmicscale. They found the resulting curve to have two distinctslopes, an initial rapid phase followed by a more prolongedslow phase. The rapid phase was interpreted to be due tovenous distention, and the slower, more prolonged phasecorresponded to capillary filtration. Wallentin* used anisotope method to determine changes in blood volume andreported similar findings. In our present study we deter-mined the capillary filtration coefficient by measuring theslope of the volume gain during the initial 30 seconds of theslow phase; this gave a value for the initial filtration rate per100 g of tissue. Dividing this by the changes in capillaryhydrostatic pressure yields a value for the capillary filtrationcoefficient. The change in capillary pressure was calculatedfrom the data obtained during determination of meanhydrostatic capillary pressure (see below).
DETERMINATION OF MEAN HYDROSTATICCAPILLARY PRESSURE
Mean capillary hydrostatic pressure was determined bythe zero-flow isovolumetric method, a modification of thezero-flow isogravimetric method previously used by Johnsonand Hanson.8 After an isovolumetric state at the desiredvenous outflow pressure had been established, flow into theintestinal segment was occluded by a clamp placed aroundthe superior mesenteric artery. The drop chamber then wasraised to a height at which the organ was neither losing norgaining volume. The venous outflow pressure, measured atthe zero-flow isovolumetric state, was taken as the meancapillary hydrostatic pressure existing immediately prior tothe arterial occlusion.
DETERMINATION OF PLASMA AND LYMPH COLLOIDPRESSURES
Venous blood and lymph of the intestinal segment weresampled periodically. Protein concentration of both lymphand plasma was read directly from a refractometer (TSmeter, American Optical). Values for protein concentrationwere converted to pressure (mm Hg) according to the cubicequation given by Landis and Pappenheimer.2 In a fewearlier experiments colloid osmotic pressure was measuredwith the Prather type osmometer." The calculated valueswere not statistically different from that measured by theosmometer, and because of the close correlation between thetwo methods, plasma and lymph colloid osmotic pressurewas determined solely by refractometry in all later experi-ments.
EXPERIMENTAL PROTOCOL
After extracorporeal venous blood and lymph flow hadbeen established the intestinal loop was placed into theplethysmograph and the large vein outflow pressure was setat zero to establish a control measurement of each parame-ter (Fig. 2). The system was allowed to attain an isovolumet-ric state and lymph flow was measured by observing the
by guest on June 25, 2018http://circres.ahajournals.org/
Dow
nloaded from

INTESTINAL TISSUE AND LYMPHATIC FORCES/Morlillaro and Taylor 351
8OD S
•o E
060 080 110 .150 .170 200 .210 .220 220 220 <jL(ml/mjn/IOOg)
22 5 23D 230 234 239 240 240 242 24.4 24.4 TT̂ , (mmHfl)
8.0 7.5 6.9 7.0 6.5 6.5 6O 55 5.4 5J TTL (mmHg)
50
25
15
10
20,
10u- . 5 0 ,
a? E 1
20 25 30
TIME (MINUTES)
35 4 0
/oft
45
FIGURE 2 A: response of the cat in-
testine to a stepwise elevation in ve-nous outflow pressure (Pv), shown herefrom 0 to 20 mm Hg. Intestinal vol-ume change is biphasic, an initial rapidphase caused by an increase resultingfrom filtration reaching a new isovolu-metric state at about 30 to 35 minutes.Closed circles indicate 5-minule inter-vals during which lymph flow wasmeasured. At the end of each interval,samples of intestinal venous blood andlymph were taken and colloid osmoticpressure determined. B' results ofzero-flow isovolumelric techniqueused to determine mean capillary hy-drostatic pressure. Pa - aherial pres-sure; QB = blood flow.
advance of lymph through the calibrated pipette during5-minute intervals. At the end of each 5-minute period,intestinal venous blood and lymph were sampled and colloidosmotic pressure was determined as described above. Duringthis period of measurement, and for the remainder of theexperiment, continuous recording of arterial and venousoutflow pressure, intestinal blood flow, and changes inintestinal volume were made with a polygraph recorder(Grass model 7B).
After a control period had been established at Pv = 0 mmHg the venous outflow pressure was rapidly raised to either5, 10, 15, 20, 25, or 30 mm Hg and allowed to remain at thatlevel for the entire course of the experiment. Lymph flowwas continuously measured during 5-minute intervals afterthe system seemed to be in an isovolumetric state, and at theend of each period samples of intestinal venous blood andlymph were taken to determine protein concentration. Asteady state after the volume transient was defined as one inwhich (1) the intestinal segment had reached a new isovolu-metric state as measured by plethysmography, and (2)lymph flow and protein concentration were constant asdetermined by values for three consecutive 5-minute inter-vals during the new isovolumetric state. Depending on thepreset venous outflow pressure, an interval of up to 90minutes was required to attain new steady state conditions.Generally, the higher the venous outflow pressure, the longerwas the time required to attain a new steady state. Meancapillary hydrostatic pressure then was determined byfollowing the zero-flow isovolumetric procedure outlinedabove. Each cat served as its own control. The total numberof cats was 35, and they were grouped as follows: 35 at
venous outflow pressure of 0 mm Hg (control), four at 5 mmHg, four at 10 mm Hg, seven at 15 mm Hg, ten at 20 mmHg, five at 25 mm Hg, and six at 30 mm Hg. In addition,blood from 35 donor cats was used to fill the extracorporealblood flow circuit.
Results
A summary of all measured and calculated steady statevalues of intestinal parameters obtained from the presentstudy are given in Table 1. All values given within the textand Table I are the mean ± standard error of the mean.
MEAN CAPILLARY HYDROSTATIC PRESSURE (PC1)
At a preset venous outflow pressure of 0 mm Hg, thesteady state mean capillary hydrostatic pressure, as deter-mined by the zero-flow isovolumetric method, averaged 9.9± 0.3 mm Hg. Elevation of venous outflow pressure resultedin an increased capillary pressure, such that a venousoutflow pressure of 30 mm Hg yielded a capillary pressureof 30.6 ± 0.4 mm Hg. A straight line estimate of theincrease in capillary pressure determined by linear regres-sion analysis yields a linear equation of Pc,, = 9.3 + 0.69Pv. This finding indicates that 69% of the increment in ve-nous pressure is transmitted to the capillary beds and is inagreement with earlier determinations of intestinal capillarypressure. *• *
BLOOD FLOW (0B), PRECAPILLARY RESISTANCE (RA),AND POSTCAPILLARY RESISTANCE <RV)
Intestinal blood flow progressively decreased during ele-vations of venous outflow pressures from 0 up to and
by guest on June 25, 2018http://circres.ahajournals.org/
Dow
nloaded from

352 CIRCULATION RESEARCH VOL. 39, No. 3, SEPTEMBER 1976
TABLE 1 Intestinal Parameters at Different Venous Outflow Pressures (Pv)
Pv (mm Hg)
0
128.6(3.8)9.9
(0.3)-1 .8(0.1)3.8
(0.1) '10.8(0.3)6.4
(0.3)22.4(0.9)0.1
(0.01)31.8(2.5)0.048
(0.007)0.560
—
—3.7
(0.3)0.31
(0.02)
5
130.9(5.6)12.6(0.4)
-0.1(0.1)3.7
(0.1)10.4(0.4)6.5
(0.4)22.9(1.4)0.2
(0.04)30.4(5.1)0.065
(0.012)0.405
(0.045)1.0
(0.1)3.9
(0.7)0.25
(0.04)
10
131.4(5.9)15.5(0.5)1.8
(0.1)3.6
(0.3)10.0(0.8)6.6
(0 4)23.4(13)0.3
(0.12)27.6(2.7)0 075
(0.031)0 249
(0.040)2.0
(0.1)4.2
(0.4)0.20
(0.02)
15
Intestinal parameters127.9
(4.7)18.9(0.4)3.4
(0.3)3.5
(0.4)97
(1.0)6.7
(0.5)24.0(1.8)
1.2(0.37)23.2(3.7)0 189
(0.058)0.162
(0.029)2.7
(0.3)4.7
(0.7)0.17
(0.03)
20
132.6(3.9)23.1(0.4)4.5
(0.2)3.0
(0.3)8.0
(0.7)6.8
(0.3)24.5(0.9)2.1
(0.39)19.9(1.9)0 258
(0.048)0.122
(0.024)4.6
(0.9)55
(0.5)0.16
(0.02)
25
128.3(6.7)27.3(0.6)5.3
(0.3)2.5
(0.4)6.4
(0.9)6.9
(0.4)25.1(1.6)3.3
(1.25)15.3(3.4)0.324
(0.123)0.097
(0.028)7.9
(0.8-)6.6
(0.5)0.15
(0.03)
30
122.2(3.1)30.6(0.4)5.3
(0.4)1.9
(0.3)4.6
(0.8)7.0
(0.5)25.6(1.9)4.3
(0.95)13.1(1.8)0.358
(0.079)0.083
(0.018)16.7(1.1)7.0
(0.9)0.04
(0.01)
PA (mm Hg)
Pc., (mm Hg)
P T (mmHg) <
[Prot]L(g/100ml)
TL(mm Hg) '
[Prot]PL(g/100ml)
TPL(mm Hg)*
0 L / K F C ( m m H g)
QB (ml/min per 100 g)
QL (ml/min per lOOg)
Kr.c (ml/min permm Hg x 100g)f
AV (ml/100g)t
RA [mm Hg/(ml/min) x 100 g]
Rv [mm Hg/(ml/min) x 100 g]
35 10
Results are expressed as mean (± SE). For identification of abbreviations, sec the text.* Colloid osmotic pressure was converted from protein concentration according to the equation given by Landis and Pappenheimer:' r - 2.1c + 0 16c" +
0.009c', where c - protein concentration (g/100 ml). PT was calculated using the resulting values for TL and xPL (see lex!)tThe value for K,.c at «P , of 0 mm Hg was obtained by straight line extrapolation using the values for K, c at a Pv of 5 and 10 mm Hg.X AV was calculated using the slow component of the weight transient following calculation of Kr.c-
including 30 mm Hg. Mean control blood flow averaged31.8 ± 2.5 ml/min per 100 g at a venous outflow pressure of0 mm Hg, and 13.1 ± 1.8 at 30 mm Hg. Resistance wascalculated from the following relationships:
RA = (PA - P C . V O B , and Rv = (Pc., - P V ) / 0 B . (1)
Calculated mean resistance values showed a progressiveincrease in precapillary resistance (1.9 x RA at Pv = 0 mmHg), along with a progressive decrease in postcapillaryresistance (0.013 x Rv at Pv = 0 mm Hg) as Pv was in-creased to 30 mm Hg. The overall result was an increase intotal resistance of the intestinal vasculature at venouspressure of 30 mm Hg that was approximately 2-fold thatmeasured at a venous pressure of 0 mm Hg. This increase invascular resistance plus the decrease in pressure headbetween artery and vein resulted in a progressive decrease inblood flow over the range of venous outflow pressures.
CAPILLARY FILTRATION COEFFICIENT (Krc)
A decrease in mean capillary filtration coefficient wasseen over the entire range of venous outflow pressureelevations. The incremental decrease in capillary filtrationcoefficient was greatest at low venous outflow pressures,
whereas precapillary resistance changes were minimal. Incontrast, greater changes in precapillary resistance occurredat high venous outflow pressures, whereas changes in thecapillary filtration coefficient were minimal. For example, achange in venous outflow pressure from 5 to 10 mm Hgdecreased the capillary filtration coefficient by 0.156 ml/min per mm Hg per 100 g, whereas precapillary resistanceincreased by 0.3 mm Hg/(ml/min) per 100 g. As venousoutflow pressure was increased from 20 to 25 mm Hg thecalculated capillary filtration coefficient decreased by only0.025 ml/min per mm Hg per 100 g, whereas precapillaryresistance increased by 1.1 mm Hg/(ml/min) per 100 g.
LYMPH FLOW (0L)
Mean steady state lymph flow progressively increasedover the entire range of venous outflow pressures andappeared to approach a plateau value at the higher venousoutflow pressures used in this study (25 and 30 mm Hg).Changes in lymph flow were minimal at the lower venousoutflow pressures but a rapid change in lymph flow occurredin the range of venous pressures between 10 and 20 mm Hg.The largest lymph flow was observed at Pv = 30 mm Hg andwas approximately 7 times the lymph flow measured atPv = 0 mm Hg.
by guest on June 25, 2018http://circres.ahajournals.org/
Dow
nloaded from
INTESTINAL TISSUE AND LYMPHATIC FORCES/Mortillaro and Taylor 353
PLASMA <TPL) AND LYMPH (xL) COLLOID OSMOTICPRESSURE
There was a small but steady increase in plasma colloidosmotic pressure over the entire range of venous outflowpressures that reached a maximum change of 3.2 mm Hg ata venous outflow pressure of 30 mm Hg. Lymph colloidosmotic pressure decreased by 6.2 mm Hg over the samevenous outflow pressure range, indicating a significantreduction in tissue protein concentration.
INTERSTITIAL FLUID PRESSURE <PT) ANDTISSUE COMPLIANCE
Mean steady state interstitial fluid pressure was calcu-lated at each different venous pressure level with thefollowing equation, which assumes that the reflection coeffi-cient of the plasma proteins = 1.0:
Jv.c = KF.c(Pc + JTT - S-PL - PT)(ml/min per 100 g) (2)
where Jv.c is the capillary nitrate. Assuming that the tissuecolloid osmotic pressure can be equated to lymph colloidosmotic pressure, that is xL = JTT; and that during a steadystate Jv,c = QL, Equation 2 can be rearranged to yield therelationship between PT, the Starling forces, and lymphflow.
PT = (Pc + *L - ITPL - 0 L / K F . C ) (mm Hg). (3)
Calculated tissue pressure is - 1.8 mm Hg at zero venouspressure and increases to +1.8 mm Hg at a venous outflowpressure of 10 mm Hg. The PT calculated at Pv = 0 mayindicate dehydration of the tissues because of the lowcapillary pressure; therefore we believe that a value of + 1 to+ 2 mm Hg is more representative of normal interstitial fluidpressure. At higher venous pressures, PT increases moreslowly. This indicates that the compliance of the tissue (seeFig. 4B and Discussion) is not linear.
Discussion
CALCULATION OF EFFECTIVE CAPILLARY FILTRATIONPRESSURE
The contribution of the lymphatic system to the regula-tion of interstitial volume is determined not only by itsability to remove proteins from the tissue spaces but also byhow much fluid volume can be removed by the lymphaticsystem relative to the filtration coefficient of the filteringvessels. Renal physiologists have considered a parameter,similar to the lymph flow factor, to describe glomerularfiltration forces and have termed this imbalance in Starlingforces across the glomerulus as the effective glomerularpressure. " We will use the term effective capillary filtrationpressure (APDROP) to discuss the same principle in theintestinal microcirculation—that is, the pressure imbalancein the Starling forces that causes fluid to filter across theexchange vessels and form lymph. If lymph flow is large andthe filtration coefficient small, then the effective filtrationpressure can be very significant. However, if the filtrationcoefficient is large (similar to those measured in ourpreparation at low venous pressures), then lymph flow mustbe quite large for any significant imbalance in Starlingforces to exist across the capillary wall.
The following equation was used to calculate the effectivecapillary filtration pressure at each venous pressure for acondition of zero volume change in the isolated intestinalpreparation:
QL = Jv.c = K-F C(APDROP)>
or,
APDROP = Q L / K F . C
(4)
(5)
where QL is lymph flow and Jv.c is capillary filtration whichmust be formed by pressure filtration. In calculating APDROPtwo parameters must be determined accurately: (I) The totallymph flow draining an organ must be measured. We believethat near-total lymph flow was collected in our preparationwith no contributions from other beds because the intestinalsegment was totally isolated and all remaining intestinalstructures had been surgically removed. (2) KF c must bedetermined for each lymph flow state. The measurement ofKF c has recently been criticized by Friedman,13 whocontends that the KF c measured by classic methods overes-timates the true capillary filtration coefficient of the bed.Johnson and Hanson1* and Wallentin6 have demonstratedthat the slow phase of either the weight or volume transient,seen after venous pressure elevation, represents filtration offluid out of the capillaries into the interstitium. Johnsonmeasured the concentration of plasma proteins in venousblood and related this to observed changes in organ weight,and Wallentin used radioisotopes to separate the vascularand filtration components of the weight gain curves. Bothinvestigators found that, following venous pressure eleva-tion, the rapid phase of the weight gain of an organrepresents vascular filling and that the slow phase representscapillary filtration. Friedman has not applied his technique,one that consists of constantly monitoring colloid osmoticpressure of the venous outflow, to an isolated intestinalpreparation.
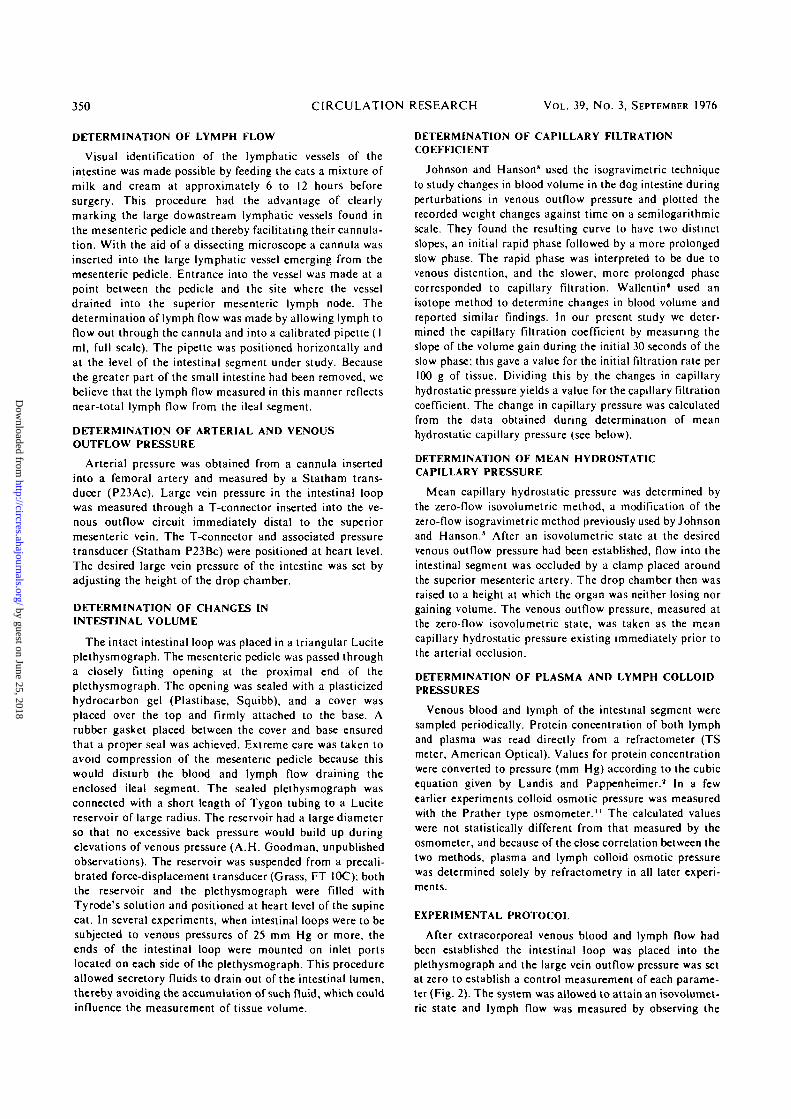
There is no reason why his technique, if applied to anintestinal preparation, should yield results different fromthat of Johnson, since both approaches are very similar.Table 2 shows computed values for APDROP f°r variousfiltration coefficients. When the filtration coefficient isassumed to remain high, as shown in the first row of Table 2,then the imbalance in Starling forces can only be small. Thelast row in Table 2 shows calculated values for APDROP for a
TABLE 2 Calculation of Effective Capillary FiltrationPressures (^PUHDH) at Different Filtration Coefficients
0.4050.2490.1620.1220.0970.083
5
0.160.250.400.540.690.79
10
K,.c0.190.300.490.610.780.90
Pv (mm Hg)
15
(ml/mm per0.470.761.131.551.952.20
20
mm Hg x0.641.041.602.102.683.10
25
100 g)0.801.302.002.653.353.90
30
0.891.442.202.903.704J0
Lymph flows measured at each venous pressure (Pv) were used to estimateAPDROP.
by guest on June 25, 2018http://circres.ahajournals.org/
Dow
nloaded from
354 CIRCULATION RESEARCH VOL. 39, No. 3, SEPTEMBER 1976
small filtration coefficient that is actually equal to thatcalculated at a venous outflow pressure of 30 mm Hg (thiswould more closely represent the argument of overestimat-ing KFC)- APDROP is larger at the lower venous outflowpressures and becomes a significant force at Pv - 15 mmHg. The diagonal arrangement of the boldface valuesrepresents data obtained from this study for which thecalculated filtration coefficient decreased with increasingPv. An overestimation of KF.c causes a smaller calculatedAPDROP, and if the true value for KFC were smaller, asargued by Friedman, this would only increase the magnitudeof APDROP a t lower venous outflow pressures. In contrast, ifKF c were overestimated at all levels of Pv, then lymph flowcould be a much more important factor than indicated byour study. Even with the smallest KFc, APDROP would notbecome large until venous outflow pressures are elevated tolevels that substantially increase lymph flow.
The changes in the calculated APDROP at higher venousoutflow pressures demonstrates the importance of themyogenic reflex (Bayliss effect) in protecting the smallintestine against sudden increases of venous outflow pres-sures. If the filtration coefficient remained high at increasedvenous pressures, then the lymphatics could not provide anysignificant safety factor and the intestine would becomeedematous even at the lower venous pressures. In fact,because decreases in Ke c occur at increased venous pres-sures, then APDROP would increase even if lymph flowremained constant. The present data do not allow anevaluation of the problems associated with measuring KF,C-However, we believe that published data strongly supportJohnson's and Wallentin's concept that the measured KF,Cdoes reflect the filtration coefficient of the perfused vascularbed of the small intestine with the following exceptions:Small errors might be associated with the calculationbecause filtration could occur during the early vascularfilling phase also, or alternatively, vascular filling due tostress relaxation could occur during that portion of theweight gain curve at which KF c values were measured.14
The maximum APDROP measured in our preparation wasonly 4 mm Hg and occurred at a venous pressure of 30mm Hg.
CALCULATION OF FORCE IMBALANCE FOR EACHISO VOLUMETRIC STATE
Table 1 demonstrates for each isovolumetric state, thatPc.i * a-pi.; therefore, a net imbalance of forces always existsacross the capillary wall. This imbalance in force must bedue to alterations in JTT or PT, or in both, since APDROP isonly 4 mm Hg at the highest venous pressures used in thisstudy. Table 1 shows calculation^ of PT using Equation 3.The calculated value of PT is negative at Pv below about 7mm Hg and increases to positive values at higher Pv. Thiscomputation of PT for our experimental preparation iscomplicated by two questions: (1) What happens to lymphflow during the isogravimetric measuring procedure? (2)Does lymph actually reflect tissue fluid protein concentra-tions?
Reference to Table I and Table 2 shows that the problemsassociated with measuring Pc.i cannot be significant atvalues of Pv < 15 mm Hg relative to lymph flow changes
because APDROP < 1 rnm Hg. However, at values of Pv
greater than 15, because APDROP increases from about 1 to4 mm Hg, if lymph flow changes during the isovolumetricdetermination of Pc,i, then the calculated PT will be inerror.
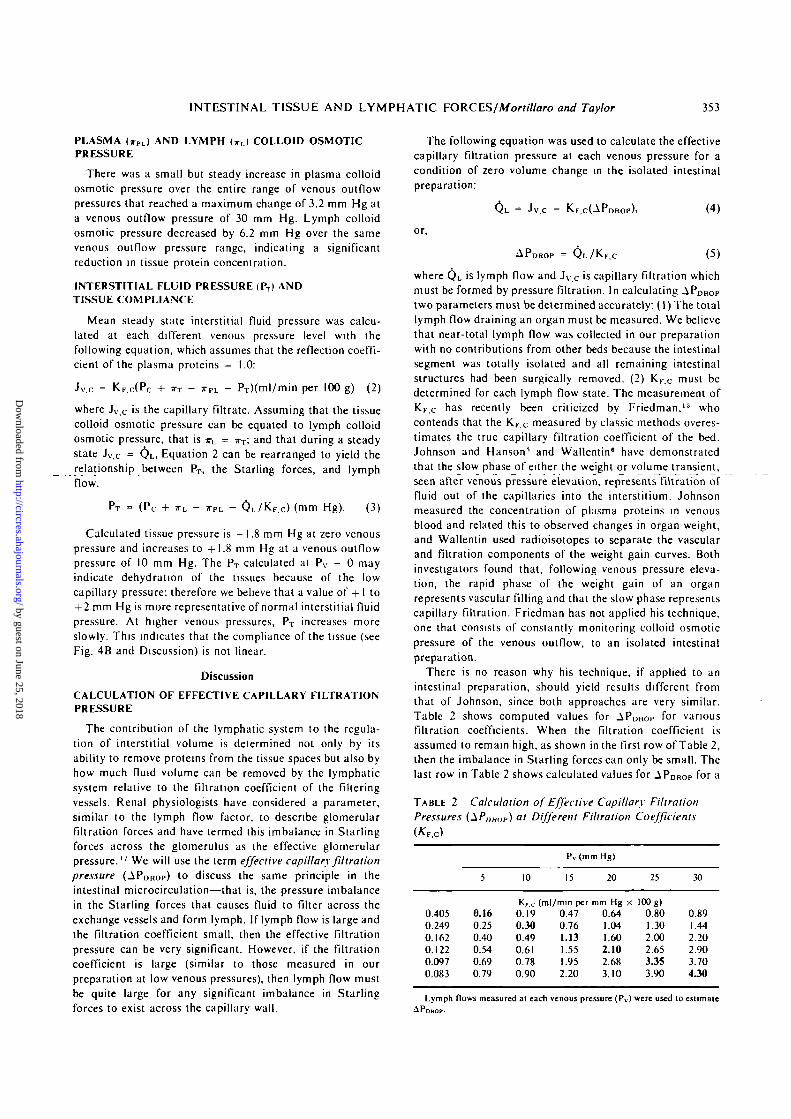
For the data in Table I, Pc.i was determined assumingthat lymph flow was not altered by the experimentalprocedure. Because this could constitute a problem whendetermining Pc ,, another series of intestinal preparationswas investigated and lymph flow was determined during the10-minute interval after clamping the arterial inflow andelevating Pv. Figure 3 demonstrates the effect on measuredlymph flow of determining Pc,i by zero-flow procedures. AtPv »= 30 mm Hg, lymph flow decreased to about xh thesteady state values during the zero-flow procedure, and asimilar result was observed at Pv = 25 mm Hg. However, atPv = 20 mm Hg, lymph flow fell very dramatically duringthe first minute and approached a value of zero after 3minutes. At Pv = 15, lymph flow would sometimes decreaseto zero immediately after the determination of Pc.i. Similarresults were obtained at the same venous pressures in sevenother intestinal preparations. Why lymph flow decreases orceases during the measurement of Pc,i is unclear at thepresent time; perhaps arterial pulsations are necessary for
25
V^AA
TIME (minuttt) TIME ( minutes)8 9
FIGURE 3 Plot of lymph flow during the measurement of capillaryhydrostatic pressure (Pc,,). The venous outflow pressure (Pv) waselevated and lymph flow was measured until a steady state wasattained. Then the arterial inflow was clamped and venous outflowpressure was elevated. Lymph flow was measured at l-minuteintervals. The solid line represents the control lymph flow measure-ments and the dotted lines represent measurements made during theisovolumelric procedure. At Pv of 30 and 25 mm Hg, lymph flowdecreased to about Vi control values during the procedure. At Pv of20 mm Hg the lymph flow decreased to zero after 3 minutes, and atPv of15 mm Hg, lymph flow decreased to zero by the end of the 1st
by guest on June 25, 2018http://circres.ahajournals.org/
Dow
nloaded from

INTESTINAL TISSUE AND LYMPHATIC FORCES/Mortillaro and Taylor 355
maximum lymph propulsion. Whatever the reason, the erroris not great and amounts maximally to only 2 mm Hg at Pv
= 20. 25, and 30 mm Hg. Since APDROp is small at Pv < 20mm Hg, then even with cessation of lymph flow, a calcula-tion of force balance in this pressure range is not in seriouserror. However, for any preparation with intact lymph flow,the determination of Pc.i constitutes a problem, especially ifAPDROP is large.
Johnson and Richardson M recently have calculated theforce imbalance for a dog intestinal preparation and alsomeasured tissue pressure by direct needle puncture atdifferent values for Pv. Brace et al.'" have recently measuredneedle pressures in normal subcutaneous tissue and obtainedaverage values of -4.8 ± 1.0 (SD). After expansion of thetissues by intravenous infusion of large volumes, the needlepressures averaged -4 .9 ± 1.0 (n = 10), a value whichis not different from the control. If the needle was clearedby injecting minute amounts of fluid through it, the mea-sured pressures were similar to those obtained by otherswho used wicks and implanted capsules (see Guyton et al.17
for a complete discussion of tissue pressure). The techniqueof direct needle puncture does not appear to provide tissuepressure values that follow changes in hydration of sub-cutaneous tissue without modifications such as small fluidinfusions. Johnson's measurements of pressure changedslightly as Pv was increased from 0 to 15 mm Hg, but not toany significant degree; this finding is very similar to themeasurements made in subcutaneous tissue by Brace, et al.
Because Johnson and Richardson15 did not observe anychange in tissue pressure, but there was a large imbalancebetween the Starling forces, they assumed that H-L overesti-mated jrT. This force imbalance also could be due to tissuepressure and does not necessarily reflect a concentratingability of the lymphatic system. Table 3 presents a compari-son of the force imbalance (calculated using AF = Pc -TPL + WL) between our data (AF^r) and that of Johnson andRichardson (AFm).
At each value of Pv, the imbalance of forces in eachpreparation is quite different, since the values of Johnsonand Richardson are usually greater. At Pv = 20, 25, and 30,the force imbalance in our preparation becomes large and issimilar to the data of Johnson and Richardson for lower Pv
TABLE 3 Comparisons of Force Imbalance Calculationfrom Johnson and Richardson" (\FJR) and Our Data
Pv
05
1015202530
Pc, (JR)
9.812.816.119.1
Pc, (MT)
9.912.615.518.423.127.330.6
- iF J B
+ 3.6+ 7.2+ 7.5+6.0
AFKT
-1.7-0.1+ 2.1+4.6+6.6+8.6(7.0)+9.6(7.3)
JR - Johnson and Richardson:" M T - Mortillaro and Taylor (presentstudy): Pv - venous outflow pressure: P c , - capillary hydrostatic pressure
IF was calculated using: - IF - Pc - ( T H . - T L ) .- ^ F M T was calculated assuming that the lymph flow factor was not
present during the measurement of Pc ,. Values in parentheses are correctedfor lymph flows observed during the determination of the isovolumctriccapillary pressure.
values. At the present time it is unclear why the values arenot comparable at Pv < 15. Perhaps this discrepancy is aresult of a species difference or a difference in the state oftissue hydration between the different preparations. We findthat only a small amount of filtered volume is necessary toincrease AFMT from -1.7 to 4.6 (2.7 ml/ 100 g) mm Hg:
therefore, the Johnson and Richardson higher values of AFmay reflect a slightly edematous preparation. If the lymphflow safety factor is high for the dog intestinal preparation(APDROP) at low Pv, this would explain the differences be-tween the preparations. Finally, the tissues must be in asteady state not only with respect to interstitial volume butalso with respect to lymph flow and protein concentrationsin order to calculate the imbalance in Starling forces. Ourcalculations of force imbalance were made during thisdefined steady state and it is not clear if Johnson andRichardson used the same steady state criteria.
ESTIMATION OF PT
Since it is well known that intestine begins to "secrete" ifserosal pressures are elevated to 3-6 mm Hg above mucosalpressure, then we must be overestimating PT at high Pv
values.18'2' Since our preparation "secreted" at Pv equal to25 mm Hg, we believe that PT should be approximately 3-6mm Hg at this pressure. Because filtration is occurring intothe intestine, this fluid plus lymph fluid must be passingacross the capillary wall, i.e., the imbalance in Starlingforces across the capillary - APD R OP,L + APDROP,M, where L
and M refer to lymph and mucosa. Since calculated PT isapproximately 7.0 (assuming APDROP - Vfe maximumcalculation) at Pv > 20 mm Hg, we probably haveoverestimated PT at high venous pressures. In fact, it mayactually decrease to values below that observed at Pv = 20mm Hg because of the movement of fluid into the intestinallumen.
Rusznyak et a l ." have suggested that the protein concen-tration of lymph is higher than the protein concentration ofthe interstitium. However, several experimental findings donot support the concept of a protein-concentrating mecha-nism in the lymphatic system. Taylor et a l . " reported thatsamples of fluid obtained from subcutaneously implantedcapsules contained protein in concentrations not signifi-cantly different from lymph fluid draining the same tissuearea. More important, we have observed a very closecorrelation between the volume of fluid filtered from thevascular compartment into the interstitial spaces and thedilution of interstitial protein as measured in the lymph fluidat the higher venous pressures. Over the range of venouspressures from 5 to 20 mm Hg, the intestinal volumeincreased 3.6 ml/100 gm while lymph protein concentrationdecreased from 3.7 to 3.0 gm per cent. If one assumes aninterstitial fluid volume for the intestine of 15 ml/lOOgm, ata normal portal pressure of 10 mm Hg, the calculated valuesof absolute fluid volumes at venous pressures of 5 and 20mm Hg are 14 and 17.6 ml/100 g. Multiplication of thelymphatic protein concentration at 5 mm Hg by 14 ml yieldsa value of 0.518 g/100 g for total tissue protein. Division ofthe total protein by the tissue volume at 20 mm Hg venouspressure, 17.6 ml, yields a concentration of 2.9 g/100 ml ascompared to the measured value of 3.0 g/100 ml. Thus it
by guest on June 25, 2018http://circres.ahajournals.org/
Dow
nloaded from

356 CIRCULATION RESEARCH VOL. 39, No. 3, SEPTEMBER 1976
would appear that at the high pressure ranges the lymphaticsdo not concentrate the lymphatic fluid. The values are sodifferent at the lower values for P v that it is highly unlikelythat a concentrating mechanism exists, because this wouldonly increase the calculated differences in AF.
One may argue that other factors possibly could lead tocalculations of tissue pressures in our in situ intestinalpreparation that are not related to normal physiologicalvalues: (1) If the preparation was in an edematous state dueto surgery, etc., then the interstitial fluid pressure would bepositive. (2) Absorption of fluid across the serosa from theTyrode's solution surrounding the intestine in the plethys-mograph could cause accumulation of tissue fluid andinfluence the PT calculation. It is difficult to see hownegative pressures could be calculated for the low venouspressures if either of these problems had been present in ourpreparation. If fluid had entered the serosal membrane, thenthe amount of fluid should be minimal, since the serosalsurface area is extremely small relative to the capillaryfiltration area. (3) When PT is calculated using 5rPL, TTLI PCJ.and APDHOP. a certain error is introduced because of thecombined variances of each measured parameter. This errorcan be estimated from the data in Table I, assuming that thestandard deviation of the calculated PT is equal to
O 3 10 IS 20 23 JOPv ( mmHg)
31
iZo2 23-1 23
VO
LU
ME
1
13-
13-
B.
) J
-2 -I 0 *l +2 «3 «4 «3 «6PT(mmHg )
FIGURE 4 A: plot of the rise in interstitial fluid pressure (PT)resulting from the stepwise increase in intestinal venous outflowpressure (Pv). B: the derived pressure-volume curve of the intestine.Solid line was calculated assuming that effective capillary filtrationpressure (APDROp) did not change during the isovolumelric mea-surement of capillary hydrostatic pressure (Pc.t )• The dotted linewas calculated assuming that APDROP changed by the maximumamount during the Pc, measurement. Note that the shape of thecurves are similar, indicating that the compliance of the tissue in-creases 10-fold at Pv greater than 20 (compliance was 0.4 ml/mmHg for Pv < 15 mm Hg and increased to 4 ml I mm Hg at higherPvl
where a refers to the variance of each measured parameterused in the calculation of PT. When this variance calculationwas applied to the data in Table 1 used to calculate PT, allvalues of calculated tissue pressure were significantly differ-ent from the zero venous pressure values (unpaired Mest)with the exception of Pv = 5 mm Hg (0.10 > P > 0.05).The majority of the variance in PT was due to the variabilityof TTPL, and if the preparations had been less variable withrespect to this parameter, then all calculations of PT wouldhave been statistically different. (4) PT was calculatedassuming that the reflection coefficient of the plasmaproteins (rrc) was equal to 1.0. We could estimate theeffective osmotic pressure from our data assuming that themaximum decrease in tissue plasma proteins (seen at venouspressure of 30 mm Hg), represents the capillary filtrate.Howevor, this calculation of <rc may represent a minimalrather than a maximal value, since the capillary may becomemore leaky at elevated venous pressures and tissue proteinswill actually be increased because of inward filtration acrossthe mucosal membrane of a protein poor filtrate." Sincea value for <xc of 0.73 can be calculated from our data atvenous pressure of 30 mm Hg, we are quite confident thatthe value of <TC of proteins for our preparation is close to 1.0at venous pressures below 25-30 mm Hg.
It appears from these studies that the interstitial fluidpressure at normal portal pressures is positive and cancontribute 6-7 mm Hg pressure to oppose filtration whenvenous pressure is elevated from 0 to 30 mm Hg. Therelationship between Pv and calculated PT is shown in Figure4A.
PRESSURE-VOLUME CURVE
Figure 4B is a pressure-volume curve calculated assumingthat PT was equal to the imbalance in forces across the
capillary (solid curve). The dotted curve was calculatedassuming that APDROP changed maximally (the correctedimbalance in force) during the determination of PCj. Theshape of the pressure-volume curve shown in Figure 4suggests many similarities between intestinal and subcu-taneous tissue relative to the structure and dynamics of theinterstitial spaces.24 Briefly, the interstitial spaces containmucopolysaccharides, mainly hyaluronic acid, which arecross-linked to collagen fibers and thus form a gel-like net-work. The state of hydration of the mucopolysaccharidesis a determinant of the interstitial fluid pressure. Interstitialfluid pressure was found to be negative as determined bythe implanted capsule method" and the wick method" insubcutaneous, muscle, and lung tissues. When the intersti-tial fluid pressure is negative, small increases in interstitialvolume cause a rapid increase in the interstitial fluid pres-sure. When the pressure rises to 0 mm Hg (atmospheric),there is an inflection in the pressure-volume curve andlarge increases in interstitial fluid volume are necessary toincrease interstitial fluid pressure only slightly. Grangeret al.2< suggest that the point of inflection is related to thedisruption of the mucopolysaccharide-collagen cross-link-ages caused by the imbibition of fluid beyond the gel'ssaturation point. The increased compliance of the tissue gelreduces the effectiveness of further increases in interstitialfluid pressure in counteracting the accumulation of inter-stitial fluid.
In our study, the point of inflection for the intestine doesnot occur at an interstitial fluid pressure of 0 mm Hg, butinstead at approximately 3.5-6 mm Hg. This suggests that agreater number of mucopolysaccharide collagen cross-link-ages may exist in the intestine and thus require a greaterpressure before disruption occurs. The normal interstitial
by guest on June 25, 2018http://circres.ahajournals.org/
Dow
nloaded from

INTESTINAL TISSUE AND LYMPHATIC FORCES/Mortillaro and Taylor 357
fluid pressure of 1.8 mm Hg indicates that the hydration ofthe intestinal interstitium is relatively greater than that ofthe subcutaneous tissue. Since the intestine moves largequantities of fluid (8 liters/day), it seems reasonable thatthis tissue normally would be more hydrated than, say,subcutaneous tissue.
INTERACTION OF TISSUE AND CAPILLARY FORCES
As Pv was increased from 0 to 15 mm Hg, tissue pressureincreased from 1.8 to 3.4, tissue colloids decreased from 10.8to 9.7, and APDKOP changed by about 1 mm Hg. The totalincrease in capillary pressure over this same range was 9 mmHg and the change of a-PL was 1.6. This yields a net changein filtration force of 7.4 mm Hg which was counterbalancedby a change at 5.2 mm Hg in tissue pressure, 1 mm Hg intissue colloid osmotic pressure and 1 mm Hg by the in-creased lymph flow. Even with the possible errors involvedin our calculation of PT, it appears that, in this lower rangeof capillary pressures, PT provides the major alteration inthe Starling forces that opposes increased filtration pres-sures.
As Pv was increased from 15 to 30 mm Hg, Pc , increasedby 11.7 mm Hg and the calculated tissue pressure changedfrom 3.4 to 5.3 (Table 1), lymph protein decreased from 9.7to 4.6 mm Hg, and 7rPL increased from 24.0 to 25.6 mm Hg.The change in net filtration pressure was 10.1 mm Hg and7TL decreased by 5.1 mm Hg, tissue pressure increased by 2mm Hg, and APDROP increased by 1-3 mm Hg. Over thisrange, the changes in Starling forces that oppose filtrationare equally divided between changes in tissue colloid pres-sure and increases in tissue pressure plus APDROp.
These findings (summarized in Fig. 5) are in agreementwith Wallentin's argument' because tissue pressure appears
(27) (56) (9 0) (132) (174) (207)
FIGURE 5 This figure represents the changes in tissue forces[colloid osmotic pressure of lymph (AxL), and calculated interstitialfluid pressure (&PT)], changes in capillary forces [plasma colloidosmotic pressure (4r , [ ) ] , and increase in the lymphatic safetyfactor (AFDROP). "S venous pressure was increased from 0 to either5, 10, 15, 20, 25, or SO mm Hg. The values in parentheses representthe changes in capillary pressure (A/'c.i) over the different venouspressure ranges. Note that change in tissue pressure provides themajor tissue force changes at low venous pressure. AI higher venouspressures both tissue pressure changes and increases in tissuecolloids provide counterbalancing forces.
to provide the major force that opposes increases infiltration forces at Pv less than 15 mm Hg. At higher venouspressures, the decrease in tissue colloids provides 50'% of theforce that tends to oppose filtration, i.e., at high venouspressures, washout of tissue proteins provides the majorforce opposing filtration forces.
EDEMA SAFETY FACTOR
The edema safety factor has been defined as the changesin Starling forces that oppose increases in filtrationforces17 " and thus act as a mechanism to keep the tissues ina more dehydrated state. The tissue edema safety factorshould be calculated assuming a normal Pv of 10 mm Hg,since the tissues are dehydrated at lower venous pressures.We have defined the edema safety factor in the Pv range of10-20 mm Hg, because the compliance of the tissuesincreases abruptly at Pv = 20 mm Hg, and the tissue factorsno longer can prevent large increases in tissue fluid volumebeyond this point even for small elevations of Pc. In the Pv
range of 10-20 mm Hg, irL decreases by 2.3 mm Hg, APDROpincreases by 1-2 mm Hg, and tissue pressure increases by2-3 mm Hg. Thus capillary filtration forces can be alteredby only approximately 6 mm Hg above the normal range ofcapillary pressures before the intestinal tissues begin to swellrapidly. In addition, the tissue forces can change by anadditional 4 mm Hg before there is movement of fluid intothe intestinal lumen.
Acknowledgments
We thank Pamela Collins for her expert technical assistance, Dr LeifHorn for the loan of an impulse flowmetcr and Dr. Harris Granger for hisconstructive comments concerning this manuscript.
References
1. Starling EH On the absorption of fluid from the connective tissue spaces.J Physiol (Lond) 19: 312-326, 1896
2. Landis EM, Pappenheimer JR. Exchange of substances through thecapillary walls. In Handbook of Physiology, section 2, Circulation, volII, edited by WF Hamilton, P Dow Washington, D.C , AmericanPhysiological Society, 1963, pp 961-1034
3. Pappenheimer JR, Soto-Rivcra A Effective osmotic pressure of theplasma proteins and other quantities associated with the capillarycirculation in the hindlimbs of cats and dogs Am J Physiol 152:471-491,1948
4. Johnson PC, Hanson KM Relation between venous pressure and bloodvolume in the intestine. Am J Physiol 204: 31-34, 1963
5. Johnson PC, Hanson KM: Capillary filtration in the small intestine ofthe dog. Circ Res 19: 766-773, 1966
6. Wallentin I: Importance of tissue pressure for the fluid equilibriumbetween the vascular and interstitial compartments in the small intestine.Acta Physiol Scand 68: 304-315, 1966
7. Guyton AC' A concept of negative interstitial pressure based on pressuresin implanted capsules. Circ Res 12: 399-414, 1963
8. Johnson PC: Effect of venous pressure on mean capillary pressure andvascular resistance in the intestine. Circ Res 16: 294-300, 1965
9. Johnson PC: Origin, localization, and homeostatic significance ofautoregulation in the intestine Circ Res 15 (suppl I): 225-232, 1964
10. Horn L, Rose A: A solid-state impulse flowmeter. Microvasc Res 2:268-272, 1970
11. Prather JW, Gaar KA, Guyton AC: Direct continuous recording ofplasma colloid osmotic pressure of whole blood. J Appl Physiol 24:602-605, 1968
12. Renkin EM, Gilmorc JP: Glomcrular nitration. In Handbook ofPhysiology, section 8, Renal Physiology, edited by J Orloff, RWBerliner. Washington, D.C , American Physiological Society, 1973, pp185-248
13. Friedman JJ: A modified colloid osmotic transducer for the determina-tion of transcapillary fluid movement. Microvasc Res 5: 222-227, 1973
by guest on June 25, 2018http://circres.ahajournals.org/
Dow
nloaded from

358 CIRCULATION RESEARCH VOL. 39, No. 3, SEPTEMBER 1976
14. Taylor AE, Gaar KA: Calculation of equivalent pore radii of thepulmonary capillary and alveolar membranes. Rev Argent Angiol 3:25-40, 1969
15 Johnson PC, Richardson DR: The influence of venous pressure onfiltration forces in the intestine Microvasc Res 7: 296-306, 1974
16 Brace RA, Guyton AC, Taylor AE: Recvaluation of the needle methodfor measuring interstitial fluid pressure. Am J Physiol 229: 603-607,1975
17. Guyton AC, Granger HJ, Taylor AE Interstitial fluid pressure. PhysiolRev 51: 527-563, 1971
18. Yablonski ME: A study of the physiological mechanisms of theproduction of intestinal secretion by elevated venous pressure. Doctoraldissertation, University of Minnesota School of Medicine, 1973
19 Duffy PA: The relationship between intestinal capillary dynamics andmucosal volume flow. Doctoral dissertation. University of MississippiSchool of Medicine, 1972
20. Wilson TH: A modified method for study of intestinal absorption in
vitro J Appl Physiol 9: 137-140, 195621. Hakim AA, Lifson N: Effects of pressure on water and solute transport
by dog intestinal mucosa in vitro. Am J Physiol 216: 276-284, 196922. Rusznyak I, FokJi M, Szabo G. Lymphatics and lymph circulation. In
Physiology and Pathology, ed 2, chapter 8, Absorption and LymphCapillaries. Oxford, Pergamon Press, 1967, pp 418 474
23 Taylor AE, Gibson WH, Granger HJ, Guyton AC: The interaction be-tween intracapillary and tissue forces in the overall regulation of inter-stitial fluid volume. Lymphology 6: 192-208, 1973
24. Guyton AC Interstitial fluid pressure II. Pressure-volume curves ofinterstitial space. Circ Res 16: 452-640, 1965
25. Scholander PF, Hargens AR, Miller SL Negative pressure in theinterstitial fluid of animals. Science 161: 321-328, 1968
26. Granger HJ, Goodman AH, Jajosky PG Regulation of the microcircula-tion In Regulation and Control in Physiological Systems, edited by ASIberall, and AC Guyton. Pittsburgh, Instruments Society of America,1973, pp 110-118
Transcapillary Escape Rate of Albumin and RightAtrial Pressure in Chronic Congestive Heart Failure
before and after Treatment
BIRGER HESSE, M.D., HANS-HENRIK PARVING, M.D., HENRIK LUND-JACOBSEN, M.D., AND
IVAN NOER, M.D.
SUMMARY The transcapillary escape rate of albumin(TERalb), i.e., tbe fraction of intravascular mass of albumin thatpasses to the extravascular space per unit of time, was determinedfrom tbe disappearance of intravenously injected "M-labeled humanserum albumin during the first 60 minutes after injection in 10 sub-jects with chronic right heart failure. The investigation was repeatedafter sodium and water depletion. Before treatment TERalb wassignificantly elevated (mean 8 3 ± 1.6% (SD)/hour, in comparison to
values for normal subjects (mean 5.4 ± 1.1%/hour, P < 0.001). Withtreatment TER.,b decreased significantly (mean 5.9 ± 1.2%/hour,P < 0.01). Right atrial pressure decreased from an average of 10mm Hg to 6 mm Hg during treatment. A statistically significant,positive correlation was found between TERalb and right atrialpressure [r - 0.77, P < 0.001). Our results best can be explainedby increased filtration, mainly through the venous end of the micro-vasculature, due to the increased venous pressure in heart failure.
THE FINDING of a normal or low protein concentration inedema fluid from subjects with congestive heart failure(CHF) has led to the conclusion that the protein permeabil-ity of the capillaries is normal or reduced and thus of noimportance in relation to the formation of cardiac edema.1- 2
However, the use of qualitative, nonkinetic methods to studya dynamic process, viz., the escape of proteins from plasmainto the interstitial fluid, is highly questionable.3 Kineticmethods have yielded conflicting results concerning themicrovascular -protein permeability in CHF; some havefound a decreased permeability,* some a normal permeabil-ity,* and others have reported a markedly elevated proteinpermeability.'- 7 Recently we found the transcapillary escaperate of albumin (TER.,b), the fraction of intravascular massof albumin that passes to the extravascular space per unit oftime, to be significantly increased and this change to beaccompanied by increases in central venous pressure duringacute plasma volume expansion in man.' This condition
From the Department of Medicine B and A, Rigshospitalet, University ofCopenhagen, and the Departments of Clinical Physiology, Bispebjerg andFrcdenksbcrg Hospitals, Copenhagen, Denmark.
Received December 19, 1975; accepted for publication April 29, 1976.
simulates heart failure because intravascular volume isenlarged and filling pressures of the ventricles are elevated.
The aim of the present study was to measure the trans-capillary escape rate of albumin before and after diuretictreatment of subjects with right heart failure.
Methods
The study comprises 10 patients with chronic heart failurereferred for hemodynamic investigation. Clinical data arepresented in Table 1. All patients except patient 3 were onmaintenance treatment with digoxin. Five (patients 1, 5, 6,8, and 10) received thiazide diuretics at the time ofadmission. For two of the patients (nos. 5 and 6) the diuretictherapy was stopped I week before the first investigation.Then a potent diuretic (bumetanide, 2 mg daily) was givenand the second investigation was carried out after I or 2weeks when the patients no longer were losing weight. Allthe patients had clinical signs of right-sided failure with liverenlargement and intermittent or constant peripheral edema.Three patients (nos. 1, 3, and 8) had gross edema and ascitesat the time of their first examinatiion. No patient but no. 7had hypertension. None had diabetes mellitus or any major
by guest on June 25, 2018http://circres.ahajournals.org/
Dow
nloaded from

N A Mortillaro and A E TaylorInteraction of capillary and tissue forces in the cat small intestine.
Print ISSN: 0009-7330. Online ISSN: 1524-4571 Copyright © 1976 American Heart Association, Inc. All rights reserved.is published by the American Heart Association, 7272 Greenville Avenue, Dallas, TX 75231Circulation Research
doi: 10.1161/01.RES.39.3.3481976;39:348-358Circ Res.
http://circres.ahajournals.org/content/39/3/348World Wide Web at:
The online version of this article, along with updated information and services, is located on the
http://circres.ahajournals.org//subscriptions/
is online at: Circulation Research Information about subscribing to Subscriptions:
http://www.lww.com/reprints Information about reprints can be found online at: Reprints:
document. Permissions and Rights Question and Answer about this process is available in the
located, click Request Permissions in the middle column of the Web page under Services. Further informationEditorial Office. Once the online version of the published article for which permission is being requested is
can be obtained via RightsLink, a service of the Copyright Clearance Center, not theCirculation Research Requests for permissions to reproduce figures, tables, or portions of articles originally published inPermissions:
by guest on June 25, 2018http://circres.ahajournals.org/
Dow
nloaded from