Interaction between Powered Two-Wheeler Accidents and ... · 3.5.1. Methodology – Italian Data...
198
2-BE-SAFE 2 -WHEELER BE HAVIOUR AND SAFE TY Grant Agreement number: 218703 Funding Scheme: Collaborative project small scale Start date of the contract: 01/01/2009 Project website address: www.2besafe.eu Interaction between Powered Two-Wheeler Accidents and Infrastructure Confidentiality level: public Deliverable 1.2 Status: final version Date: 17/05/2010 Author: Peter Saleh, AIT Austrian Institute of Technology Project Coordinator: Stephane Laporte Europe Recherche Transport c/o INRETS [email protected] Téléphone: 04.78.65.68.16
-
Upload
hoangnguyet -
Category
Documents
-
view
212 -
download
0
Transcript of Interaction between Powered Two-Wheeler Accidents and ... · 3.5.1. Methodology – Italian Data...

2-BE-SAFE 2-WHEELER BEHAVIOUR AND SAFETY
Grant Agreement number: 218703
Funding Scheme: Collaborative project small scale
Start date of the contract: 01/01/2009
Project website address: www.2besafe.eu
Interaction between Powered Two-Wheeler Accidents and Infrastructure
Confidentiality level: public
Deliverable 1.2
Status: final version
Date: 17/05/2010
Author: Peter Saleh, AIT Austrian Institute of Technology
Project Coordinator:
Stephane Laporte
Europe Recherche Transport
c/o INRETS
Téléphone: 04.78.65.68.16

2-BE-SAFE D2 Road infrastructure and road safety for PTW
Authors
Name Company
Peter Saleh AIT
John Golias NTUA
George Yannis
Eleni Vlahogianni
Panagiotis Papantoniou
Javier Diez
Dan Basacik
Mark Chattington
Alistaire Weare
Niccolò Baldanzini
David Grassi
Andreas Hegewald
Dirk Ebersbach
NTUA
NTUA
NTUA
CIDAUT
TRL
TRL
TRL
UNIFI
UNIFI
BAST
TUD
Amendments
Date of Issue Description
06/11/2009 First draft
04/12/2009 Second draft
05/01/2010 Internal Review
27/01/2010 Third draft
19/03/2010 Official review
17/05/2010 Final Version
Applicable Documents
Description
None
Acknowledgements
Description
Thanks a lot to all A1.2 partners for their efforts and fruitful inputs to this document! It was a pleasure to work with you all. Special thanks to Jiri Ambros and Darina Havlickova from CDV and José Carvalhais from FMH/UTL for their constructive comments within the review procedure.

2-BE-SAFE D2 Road infrastructure and road safety for PTW
Document ID: 2BES_WP1_D2_RIandRSforPTW_Final.doc 1
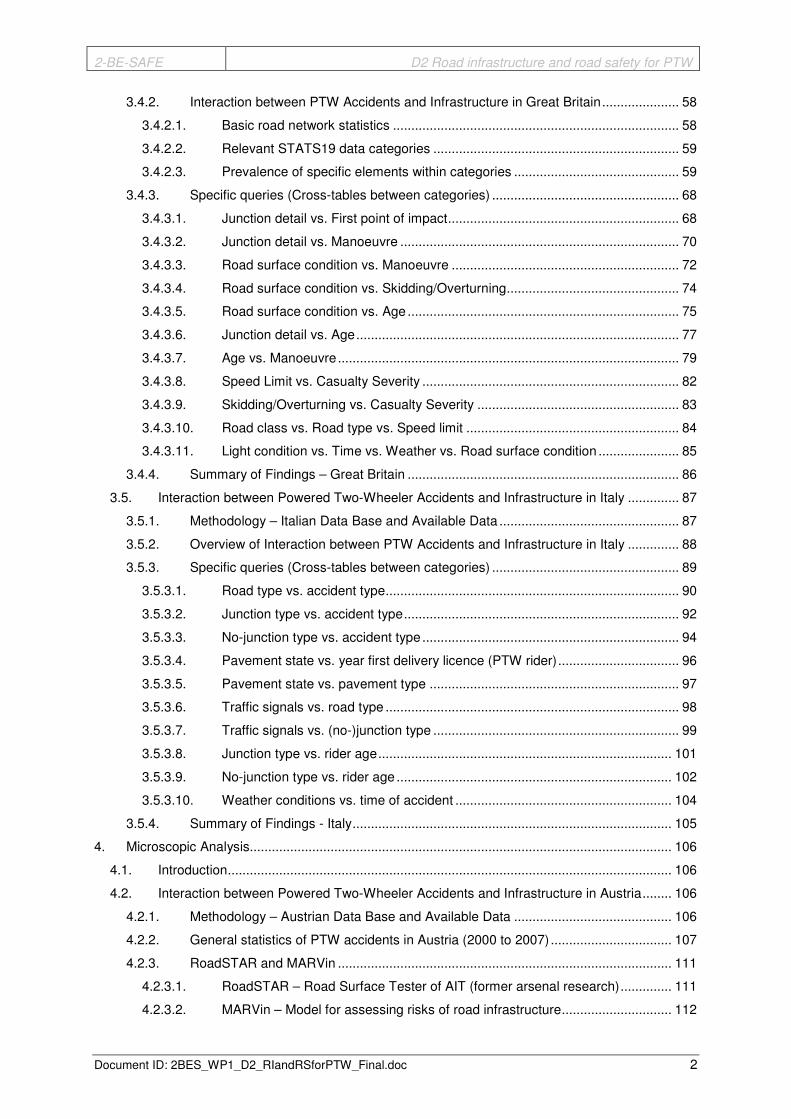
Table of contents
1. Introduction and Methodology ...................................................................................................... 13
2. State of the Art .............................................................................................................................. 14
2.1. Main PTW accident factors regarding infrastructure............................................................ 14
2.1.1. Type of area ................................................................................................................ 14
2.1.2. Road geometry and roadside installations .................................................................. 14
2.1.3. Lighting and Visibility ................................................................................................... 18
2.1.4. Type of collision........................................................................................................... 18
2.1.5. Junction Type .............................................................................................................. 19
2.1.6. Pavement surface condition ........................................................................................ 19
2.1.7. Type of vehicle and vehicle characteristics ................................................................. 20
2.2. Summary of Findings ........................................................................................................... 21
3. Macroscopic Analysis ................................................................................................................... 22
3.1. Introduction........................................................................................................................... 22
3.2. Interaction between Powered Two-Wheeler Accidents and Infrastructure in Greece ......... 23
3.2.1. Methodology – Greek Data Base and Available Data................................................. 23
3.2.2. Interaction between Moped Accidents and Infrastructure in Greece .......................... 23
3.2.2.1. Type of Accident by Carriageway type ............................................................... 23
3.2.2.2. Type of Accident by Junction type...................................................................... 26
3.2.2.3. Type of Accident by Road Geometry.................................................................. 28
3.2.2.4. Type of Accident by Pavement Conditions......................................................... 30
3.2.3. Interaction between Motorcycle Accidents and Infrastructure in Greece.................... 31
3.2.3.1. Type of Accident by Carriageway type ............................................................... 31
3.2.3.2. Type of Accident by Junction type...................................................................... 33
3.2.3.3. Type of Accident by Road Geometry.................................................................. 35
3.2.3.4. Type of Accident by Pavement Conditions......................................................... 37
3.2.4. Comparison of Moped and Motorcycle Accidents in Greece ...................................... 38
3.2.5. Summary of Findings - Greece ................................................................................... 41
3.3. Interaction between Powered Two-Wheeler Accidents and Infrastructure in Spain............ 43
3.3.1. Methodology – Spanish Data Base and Available Data.............................................. 43
3.3.2. Overview of Interaction between PTW Accidents and Infrastructure in Spain............ 43
3.3.3. Analysis of the most frequent type of collisions .......................................................... 45
3.3.3.1. Front-to-side accidents ....................................................................................... 45
3.3.3.2. Run-off-road accidents ....................................................................................... 46
3.3.3.3. Rear-end accidents............................................................................................. 48
3.3.4. Specific queries (Cross-tables between categories) ................................................... 49
3.3.5. Summary of Findings – Spain ..................................................................................... 56
3.4. Interaction between Powered Two-Wheeler Accidents and Infrastructure in Great Britain. 57
3.4.1. Methodology – British Data Base and Available Data................................................. 57
2-BE-SAFE D2 Road infrastructure and road safety for PTW
Document ID: 2BES_WP1_D2_RIandRSforPTW_Final.doc 2
3.4.2. Interaction between PTW Accidents and Infrastructure in Great Britain..................... 58
3.4.2.1. Basic road network statistics .............................................................................. 58
3.4.2.2. Relevant STATS19 data categories ................................................................... 59
3.4.2.3. Prevalence of specific elements within categories ............................................. 59
3.4.3. Specific queries (Cross-tables between categories) ................................................... 68
3.4.3.1. Junction detail vs. First point of impact............................................................... 68
3.4.3.2. Junction detail vs. Manoeuvre ............................................................................ 70
3.4.3.3. Road surface condition vs. Manoeuvre .............................................................. 72
3.4.3.4. Road surface condition vs. Skidding/Overturning............................................... 74
3.4.3.5. Road surface condition vs. Age .......................................................................... 75
3.4.3.6. Junction detail vs. Age........................................................................................ 77
3.4.3.7. Age vs. Manoeuvre............................................................................................. 79
3.4.3.8. Speed Limit vs. Casualty Severity ...................................................................... 82
3.4.3.9. Skidding/Overturning vs. Casualty Severity ....................................................... 83
3.4.3.10. Road class vs. Road type vs. Speed limit .......................................................... 84
3.4.3.11. Light condition vs. Time vs. Weather vs. Road surface condition ...................... 85
3.4.4. Summary of Findings – Great Britain .......................................................................... 86
3.5. Interaction between Powered Two-Wheeler Accidents and Infrastructure in Italy .............. 87
3.5.1. Methodology – Italian Data Base and Available Data ................................................. 87
3.5.2. Overview of Interaction between PTW Accidents and Infrastructure in Italy .............. 88
3.5.3. Specific queries (Cross-tables between categories) ................................................... 89
3.5.3.1. Road type vs. accident type................................................................................ 90
3.5.3.2. Junction type vs. accident type........................................................................... 92
3.5.3.3. No-junction type vs. accident type...................................................................... 94
3.5.3.4. Pavement state vs. year first delivery licence (PTW rider)................................. 96
3.5.3.5. Pavement state vs. pavement type .................................................................... 97
3.5.3.6. Traffic signals vs. road type ................................................................................ 98
3.5.3.7. Traffic signals vs. (no-)junction type ................................................................... 99
3.5.3.8. Junction type vs. rider age................................................................................ 101
3.5.3.9. No-junction type vs. rider age ........................................................................... 102
3.5.3.10. Weather conditions vs. time of accident ........................................................... 104
3.5.4. Summary of Findings - Italy....................................................................................... 105
4. Microscopic Analysis................................................................................................................... 106
4.1. Introduction......................................................................................................................... 106
4.2. Interaction between Powered Two-Wheeler Accidents and Infrastructure in Austria........ 106
4.2.1. Methodology – Austrian Data Base and Available Data ........................................... 106
4.2.2. General statistics of PTW accidents in Austria (2000 to 2007) ................................. 107
4.2.3. RoadSTAR and MARVin ........................................................................................... 111
4.2.3.1. RoadSTAR – Road Surface Tester of AIT (former arsenal research).............. 111
4.2.3.2. MARVin – Model for assessing risks of road infrastructure.............................. 112

2-BE-SAFE D2 Road infrastructure and road safety for PTW
Document ID: 2BES_WP1_D2_RIandRSforPTW_Final.doc 3
4.2.4. Analyses of PTW accidents vs. RoadSTAR data in Austria...................................... 114
4.2.4.1. Analytic procedure ............................................................................................ 114
4.2.4.2. Longitudinal gradient [s].................................................................................... 115
4.2.4.3. Crossfall [q] ....................................................................................................... 116
4.2.4.4. Skid resistance [µ] ............................................................................................ 116
4.2.4.5. Longitudinal evenness [IRI] .............................................................................. 117
4.2.4.6. Texture [MPD]................................................................................................... 117
4.2.4.7. Rut depth [ts] ..................................................................................................... 118
4.2.4.8. Theoretical water [tw]......................................................................................... 119
4.2.5. Analyses of radii relations on PTW accident sites in Austria .................................... 120
4.2.5.1. Analytic procedure ............................................................................................ 120
4.2.5.2. Findings based on radii relations (MARVin queries based on given templates) …………………………………………………………………………………………121
4.2.6. Analyses based on radii relations on road sections in the Austrian federal roads network ……………………………………………………………………………………………….122
4.2.6.1. Selected road sections ..................................................................................... 123
4.2.6.2. Summary of Key Findings (all selected road sections) .................................... 137
4.2.7. Conclusions for the microscopic analysis in Austria ................................................. 141
4.3. Interaction between Powered Two-Wheeler Accidents and Infrastructure in Spain.......... 142
4.3.1. Methodology – Spanish Data Base and Available Data............................................ 142
4.3.2. Descriptive analysis of DIANA database................................................................... 142
4.3.3. Specific queries (cross-tables between categories).................................................. 145
4.3.3.1. Accident away from junctions ........................................................................... 145
4.3.3.2. Accident at intersections................................................................................... 154
4.3.4. Conclusions for the microscopic analysis in Spain ................................................... 157
4.4. Interaction between Powered Two-Wheeler Accidents and Infrastructure in Germany .... 158
4.4.1. Methodology – German Data Base and Available Data............................................ 158
4.4.1. Influence of the ADT of powered two-wheelers on the density of injury motorcycle crashes ……………………………………………………………………………………………….158
4.4.2. Influence of road infrastructure parameters on injury motorcycle crashes ............... 160
4.4.2.1. Curvature Change Rate.................................................................................... 163
4.4.2.2. Road surface condition ..................................................................................... 164
4.4.3. Influence of road surface condition on injury motorcycle driving crashes................. 165
4.4.3.1. Longitudinal unevenness – general unevenness ............................................. 165
4.4.3.2. Transverse unevenness – rut depth and theoretical water depth .................... 167
4.4.3.3. Friction – friction value...................................................................................... 168
4.4.3.4. Substance – Network cracks, flick posts and accumulation of bituminous binder …………………………………………………………………………………………169
4.4.3.5. Overall value ..................................................................................................... 171
4.4.4. Conclusions for the microscopic analysis in Germany.............................................. 172
5. Synopsis of Trends and Risk Factors......................................................................................... 173

2-BE-SAFE D2 Road infrastructure and road safety for PTW
Document ID: 2BES_WP1_D2_RIandRSforPTW_Final.doc 4
6. Conclusions ................................................................................................................................ 175
7. References.................................................................................................................................. 176
8. Annex (AIT, Microscopic Analysis) ............................................................................................. 179
8.1. Results of analyses based on the radii relations (See chapter 4.2.5.)..................................... 179
8.2. Radii tulips of all road sections (PTW accidents) in both driving directions (See chapter 4.2.6.)......................................................................................................................................................... 183
8.3. Radii tulips of all road sections (all other accidents) in both directions (See chapter 4.2.6.) .. 190
2-BE-SAFE D2 Road infrastructure and road safety for PTW
Document ID: 2BES_WP1_D2_RIandRSforPTW_Final.doc 5
List of figures
Figure 1: Moped and motorcycle fatalities with respect to area and carriageway type, Greece 2005-2007. ......... 38
Figure 2: Moped and motorcycle fatalities with respect to area and junction type, Greece 2005-2007. ................ 39
Figure 3: Moped and motorcycle fatalities with respect to area and road geometry, Greece 2005-2007. ............. 40
Figure 4: PTW accident victims (n=157.169 injured motorcyclists), Spain 2005-2007. ......................................... 43
Figure 5: Type of collision. Inside urban area (n=71.751), Spain 2005-2007. ....................................................... 44
Figure 6: Type of collisions on express roads and motorways, Spain 2005-2007. ................................................ 44
Figure 7: Front-to-side accidents, Type of junction inside urban areas and on express roads, Spain 2005-2007. 45
Figure 8: Front-to-side accidents, Traffic control in junctions inside urban areas and on express roads, Spain 2005-2007. .................................................................................................................................................... 45
Figure 9: Run-off-road accidents, road design, Spain 2005-2007. ........................................................................ 46
Figure 10: Run-off-road accidents, road surface condition, Spain 2005-2007. ...................................................... 46
Figure 11: Run-off-road accidents, carriageway width on express roads (n=5353), Spain 2005-2007.................. 47
Figure 12: Run-off-road accidents, shoulder width on express roads (n=5353), Spain 2005-2007. ...................... 47
Figure 13: Rear-end accidents, inside and outside urban areas vs. intersections, Spain 2005-2007.................... 48
Figure 14: Rear-end accidents, inside and outside urban areas vs. traffic control, Spain 2005-2007. .................. 48
Figure 15: Junction detail vs. First point of impact (percentage figures in graph), UK 2005-2007. ........................ 69
Figure 16: Road surface condition (dry, wet/damp) vs. Manoeuvre (percentage figures in graph), UK 2005-2007....................................................................................................................................................................... 73
Figure 17: Road surface condition vs. Skidding/overturning (percentage figures in graph), UK 2005-2007.......... 75
Figure 18: Road surface condition (dry, wet/damp) vs. Age (percentage figures in graph), UK 2005-2007. ......... 76
Figure 19: Junction detail vs. Age (percentage figures in graph), UK 2005-2007.................................................. 78
Figure 20: Age vs. Manoeuvre (percentage figures in graph), UK 2005-2007....................................................... 81
Figure 21: Speed Limit vs. Casualty Severity (percentage figures in graph), UK 2005-2007. ............................... 82
Figure 22: Skidding/overturning vs. Casualty Severity (percentage figures in graph), UK 2005-2007................... 83
Figure 23: Road class vs. Road type vs. Speed limit, UK 2005-2007.................................................................... 84
Figure 24: Light condition vs. Time vs. Weather vs. Road surface condition, UK 2005-2007................................ 85
Figure 25: PTW accidents by road type, Italy 2005-2007. ..................................................................................... 88
Figure 26: PTW accidents by intersection, Italy 2005-2007................................................................................... 88
Figure 27: PTW accidents by pavement state, Italy 2005-2007............................................................................. 89
Figure 28: PTW accidents by weather condition, Italy 2005-2007. ........................................................................ 89
Figure 29: PTW accidents by accident type, Italy 2005-2007................................................................................ 90
Figure 30: Severity index*100 for accidents categorised according to road type and traffic signals, Italy 2005-2007............................................................................................................................................................... 98
Figure 31: Weather conditions vs. time of accident (accidents), Italy 2005-2007. ............................................... 104
Figure 32: Weather conditions vs. time of accident (severity index*100), Italy 2005-2007. ................................. 104
Figure 33: Stock of PTW and the rate of PTWs depending on total stock, Austria 2000-2007. ........................... 107
Figure 34: Killed and injured PTW riders, Austria 2000-2007. ............................................................................. 108
Figure 35: Rate of PTW accidents in relation to accident types, Austria 2000-2007. .......................................... 109
Figure 36: Rate of PTW accidents in relation to Engine power, Austria 2000-2007. ........................................... 110
Figure 37: RoadSTAR1 (left) and the new RoadSTAR2 (right). .......................................................................... 112
Figure 38: Illustrations of combined road infrastructure data and accident data.................................................. 112
2-BE-SAFE D2 Road infrastructure and road safety for PTW
Document ID: 2BES_WP1_D2_RIandRSforPTW_Final.doc 6
Figure 39: Results of the MARVin Similarity Search (Curvature) plus template (red line). .................................. 113
Figure 40: Explanation of Mean Profile Depth MPD. ........................................................................................... 118
Figure 41: Rut depth ts below 2m bar................................................................................................................... 118
Figure 42: Theoretical water depth tw. ................................................................................................................. 119
Figure 43: Correlation between radius 1 and radius 2 – so-called “Radii Tulip”................................................... 120
Figure 44: Schematic template for MARVin query - Curvature (1/R). .................................................................. 121
Figure 45: Description for the positioning of PTW accident (or other accidents) in radii relation. ........................ 122
Figure 46: Road section B20 “Türnitz - Annaberg”. ............................................................................................. 123
Figure 47: Result of analysed radii relations at “Türnitz - Annaberg”................................................................... 124
Figure 48: Road section B20 “Reith – Mitterbach a. Erlaufsee”........................................................................... 125
Figure 49: Result of analysed radii relations at “Reith – Mitterbach a. Erlaufsee”. .............................................. 126
Figure 50: Road section B27 “L134 (Klostertal) – Hirschwang a.d. Rax”............................................................. 127
Figure 51: Result of analysed radii relation at “L134 (Klostertal) – Hirschwang a.d. Rax”. .................................. 128
Figure 52: Road section B72. .............................................................................................................................. 129
Figure 53: Result of analysed radii relation at “St. Kathrein a. Hauenstein - Krieglach”. ..................................... 130
Figure 54: Road section B95 - “Reichenau - Turracherhöhe”. ............................................................................. 131
Figure 55: Result of analysed radii relation at “Reichenau - Turracherhöhe”....................................................... 132
Figure 56: Road section B127 - “Rottenegg - Lacken”. ....................................................................................... 133
Figure 57: Result of analysed radii relation at “Rottenegg - Lacken”. .................................................................. 134
Figure 58: Road section B164 - “Bischofshofen – Mühlbach am Hochkönig”. ..................................................... 135
Figure 59: Result of analysed radii relation at “Bischofshofen – Mühlbach a. Hochkönig”. ................................. 136
Figure 60: PTW accidents vs. single radius (20 – 100m)..................................................................................... 138
Figure 61: PTW accidents vs. single radius (150 – 1200m)................................................................................. 139
Figure 62: PTW accidents vs. radii relations; increasing km................................................................................ 139
Figure 63: PTW accidents vs. radii relations; decreasing km. ............................................................................. 140
Figure 64: Type of road (n=67 PTW accidents). .................................................................................................. 142
Figure 65: Severity associated to express roads (n=51 PTW accidents)............................................................. 143
Figure 66: Typology of accidents (n=67 motorcycle accidents). .......................................................................... 143
Figure 67: Type of intersection (n=67 accidents)................................................................................................. 144
Figure 68: Barrier location and curve orientation (n=14 accidents). .................................................................... 150
Figure 69: Curve Radius (n=14 accidents). ......................................................................................................... 150
Figure 70: Position of impact (n=14 accidents).................................................................................................... 151
Figure 71: Impact angle (n=14 accidents). .......................................................................................................... 151
Figure 72: Impact speed (n=14 accidents). ......................................................................................................... 151
Figure 73: Test impact conditions........................................................................................................................ 151
Figure 74: Type of accident (n=16)...................................................................................................................... 153
Figure 75: Severity by Type of accident (n=8 accidents). .................................................................................... 155
Figure 76: Traffic control (n=11 accidents). ......................................................................................................... 156
Figure 77: ADT of powered two-wheelers and number of investigated road sections in Bavaria. ....................... 159
Figure 78: Relationship between the ADT of powered two-wheelers and the density of injury motorcycle crashes..................................................................................................................................................................... 160
Figure 79: Share of motorcycle crashes with personal injuries of any personal injury crash on rural roads in 2006..................................................................................................................................................................... 161

2-BE-SAFE D2 Road infrastructure and road safety for PTW
Document ID: 2BES_WP1_D2_RIandRSforPTW_Final.doc 7
Figure 80: Measurement vehicle of the Dresden University of Technology......................................................... 162
Figure 81: Curvature change rate........................................................................................................................ 163
Figure 82: Overall value of road surface condition. ............................................................................................. 164
Figure 83: General Unevenness (road surface wave and pothole)...................................................................... 166
Figure 84: General unevenness. ......................................................................................................................... 166
Figure 85: Transverse Unevenness (ruts). .......................................................................................................... 167
Figure 86: Rut depth............................................................................................................................................ 167
Figure 87: Theoretical water depth. ..................................................................................................................... 167
Figure 88: Friction value. ..................................................................................................................................... 168
Figure 89: Substance parameter (Network cracks, flick posts, accumulation of bituminous binder).................... 169
Figure 90: Network cracks. .................................................................................................................................. 170
Figure 91: Flick posts. ......................................................................................................................................... 170
Figure 92: Overall value....................................................................................................................................... 171
Figure 93: Radii tulip of road section B20 “Türnitz – Annaberg” – PTW accidents. ............................................. 183
Figure 94: Radii tulip of road section B20 “Reith – Mitterbach a. Erlaufsee” – PTW accidents............................ 184
Figure 95: Radii tulip of road section B27 – PTW accidents................................................................................ 185
Figure 96: Radii tulip of road section B72 – PTW accidents................................................................................ 186
Figure 97: Radii tulip of road section B95 – PTW accidents................................................................................ 187
Figure 98: Radii tulip of road section B127 – PTW accidents.............................................................................. 188
Figure 99: Radii tulip of road section B164 – PTW accidents.............................................................................. 189
Figure 100: Radii tulip of road section B20 “Türnitz – Annaberg” – all other accidents. ...................................... 190
Figure 101: Radii tulip of road section B20 “Reith – Mitterbach a. Erlaufsee” – all other accidents..................... 191
Figure 102: Radii tulip of road section B27 – all other accidents. ........................................................................ 192
Figure 103: Radii tulip of road section B72 – all other accidents. ........................................................................ 193
Figure 104: Radii tulip of road section B95 – all other accidents. ........................................................................ 194
Figure 105: Radii tulip of road section B127 – all other accidents. ...................................................................... 195
Figure 106: Radii tulip of road section B164 – all other accidents. ...................................................................... 196

2-BE-SAFE D2 Road infrastructure and road safety for PTW
Document ID: 2BES_WP1_D2_RIandRSforPTW_Final.doc 8
List of tables
Table 1: Accidents between mopeds and moving vehicles with respect to carriageway and collision type, Greece 2005-2007. .................................................................................................................................................... 24
Table 2: Accidents between mopeds and pedestrians with respect to carriageway type, Greece 2005-2007....... 24
Table 3: Accidents between mopeds and stationary vehicles or obstacles with respect to carriageway and collision with stationary object type, Greece 2005-2007................................................................................ 25
Table 4: Mopeds accidents (single vehicle accidents) with respect to carriageway, Greece 2005-2007............... 25
Table 5: Accidents between mopeds and moving vehicles with respect to carriageway and junction type, Greece 2005-2007. .................................................................................................................................................... 26
Table 6: Accidents between mopeds and pedestrians with respect to junction type, Greece 2005-2007.............. 26
Table 7: Percentage of accidents between mopeds and stationary objects with respect to junction and collision type, Greece 2005-2007. ............................................................................................................................... 27
Table 8: Single moped accidents with respect to junction type, Greece 2005-2007.............................................. 27
Table 9: Mopeds accidents with respect to junction type and age of persons in moped, Greece 2005-2007........ 27
Table 10: Mopeds accidents with other moving vehicles with respect to collision type, Greece 2005-2007.......... 28
Table 11: Moped accidents between mopeds and pedestrians with respect to road geometry characteristics, Greece 2005-2007......................................................................................................................................... 28
Table 12: Percentage of accidents between mopeds and stationary vehicles or obstacles with respect to collision type at different road geometry characteristics, Greece 2005-2007. ............................................................. 29
Table 13: Single mopeds accidents with respect to road geometry characteristics, Greece 2005-2007. ............. 29
Table 14: Mopeds accidents with respect to pavement conditions, Greece 2005-2007. ....................................... 30
Table 15: Mopeds accidents with respect to pavement conditions and pavement type, Greece 2005-2007......... 30
Table 16: Accidents between motorcycles and moving vehicles with respect to carriageway and collision type, Greece 2005-2007......................................................................................................................................... 31
Table 17: Accidents between motorcycles and pedestrians with respect to carriageway type, Greece 2005-2007....................................................................................................................................................................... 31
Table 18: Accidents between motorcycles and stationary vehicles or obstacles with respect to carriageway and collision type, Greece 2005-2007. ................................................................................................................. 32
Table 19: Motorcycles accidents (without collision) with respect to carriageway type, Greece 2005-2007. .......... 32
Table 20: Accidents between motorcycles and moving vehicles with respect to junction type and collision type, Greece 2005-2007......................................................................................................................................... 33
Table 21: Accidents between motorcycles and pedestrians with respect to junction type, Greece 2005-2007. .... 33
Table 22: Percentage of accidents between motorcycles and stationary vehicles or obstacles with respect to junction and collision type, Greece 2005-2007. ............................................................................................. 34
Table 23: Single motorcycle accidents with respect to junction type, Greece 2005-2007. .................................... 34
Table 24: Motorcycles accidents with respect to junction type and age of persons in moped, Greece 2005-2007....................................................................................................................................................................... 34
Table 25: Motorcycles accidents with other moving vehicles with respect to collision type and road geometry characteristics, Greece 2005-2007................................................................................................................ 35
Table 26: Motorcycles accidents between motorcycles and pedestrians with respect to road geometry characteristics, Greece 2005-2007................................................................................................................ 35
Table 27: Percentage of accidents between motorcycles and stationary vehicles or obstacles with respect to collision type at different road geometry characteristics, Greece 2005-2007................................................. 36
Table 28: Motorcycles accidents (without collision) with respect to road geometry characteristics, Greece 2005-2007............................................................................................................................................................... 36
Table 29: Motorcycle accidents with respect to pavement conditions, Greece 2005-2007.................................... 37
Table 30: Motorcycle accidents with respect to pavement conditions and pavement type, Greece 2005-2007. ... 37

2-BE-SAFE D2 Road infrastructure and road safety for PTW
Document ID: 2BES_WP1_D2_RIandRSforPTW_Final.doc 9
Table 31: Moped and Motorcycle total fatalities and injuries with respect to carriageway type, Greece 2005-2007....................................................................................................................................................................... 38
Table 32: Moped and Motorcycle total fatalities and injuries with respect to junction type, Greece 2005-2007..... 39
Table 33: Moped and Motorcycle total fatalities and injuries with respect to road geometry, Greece 2005-2007.. 40
Table 34: Cross-table – accident type (between moving vehicles) vs. number of directions, Spain 2005-2007.... 49
Table 35: Cross-table – accident type (between moving vehicles and a pedestrian) vs. number of directions, Spain 2005-2007. .......................................................................................................................................... 49
Table 36: Cross-table – accident type (between moving vehicles and a stationary one or other) vs. number of directions, Spain 2005-2007. ......................................................................................................................... 50
Table 37: Cross-table – accident type (between moving vehicles) vs. junction type, Spain 2005-2007. ............... 51
Table 38: Cross-table – accident type (between moving vehicles and a pedestrian) vs. junction type, Spain 2005-2007............................................................................................................................................................... 51
Table 39: Cross-table – accident type (between moving vehicles and a stationary one or other) vs. junction type (part 1), Spain 2005-2007.............................................................................................................................. 52
Table 40: Cross-table – accident type (between moving vehicles and a stationary one or other) vs. junction type (part 2), Spain 2005-2007.............................................................................................................................. 52
Table 41: Cross-table – accident type (between moving vehicles) vs. non-junction type, Spain 2005-2007. ........ 53
Table 42: Cross-table – accident type (between moving vehicles and a pedestrian) vs. non-junction type, Spain 2005-2007. .................................................................................................................................................... 53
Table 43: Cross-table – accident type (between moving vehicles and a stationary one or other) vs. non-junction type (part 1), Spain 2005-2007. ..................................................................................................................... 54
Table 44: Cross-table – accident type (between moving vehicles and a stationary one or other) vs. non-junction type (part 2), Spain 2005-2007. ..................................................................................................................... 54
Table 45: Cross-tables – severity data vs. junction type, non-junction type and number of directions, Spain 2005-2007............................................................................................................................................................... 55
Table 46: Basic summary of the UK road network................................................................................................. 58
Table 47: Time of day query, UK 2005-2007......................................................................................................... 60
Table 48: Road class query, UK 2005-2007. ......................................................................................................... 60
Table 49: Road type query, UK 2005-2007. .......................................................................................................... 61
Table 50: Speed limit query, UK 2005-2007. ......................................................................................................... 61
Table 51: Junction detail query, UK 2005-2007..................................................................................................... 62
Table 52: Light conditions query, UK 2005-2007................................................................................................... 62
Table 53: Weather query, UK 2005-2007. ............................................................................................................. 63
Table 54: Road surface conditions query, UK 2005-2007. .................................................................................... 63
Table 55: Manoeuvre query, UK 2005-2007.......................................................................................................... 64
Table 56: Skidding and overturning query, UK 2005-2007. ................................................................................... 64
Table 57: Hit object in carriageway query, UK 2005-2007..................................................................................... 65
Table 58: Hit object off carriageway query, UK 2005-2007. .................................................................................. 66
Table 59: First point of impact query, UK 2005-2007. ........................................................................................... 66
Table 60: Age of rider query, UK 2005-2007. ........................................................................................................ 67
Table 61: Severity of casualty query, UK 2005-2007............................................................................................. 67
Table 62: Junction detail vs. First point of impact (actual count values), UK 2005-2007. ...................................... 68
Table 63: Junction detail vs. First point of impact (percentage), UK 2005-2007.................................................... 69
Table 64: Junction detail vs. Manoeuvre (actual count values), UK 2005-2007. ................................................... 71
Table 65: Junction detail vs. Manoeuvre (percentage), UK 2005-2007. ................................................................ 71
Table 66: Road surface condition vs. Manoeuvre (actual count values), UK 2005-2007....................................... 72

2-BE-SAFE D2 Road infrastructure and road safety for PTW
Document ID: 2BES_WP1_D2_RIandRSforPTW_Final.doc 10
Table 67: Road surface condition vs. Manoeuvre (percentage), UK 2005-2007. .................................................. 73
Table 68: Road surface condition vs. Skidding/overturning (actual count values), UK 2005-2007. ....................... 74
Table 69: Road surface condition vs. Skidding/overturning (percentage), UK 2005-2007..................................... 74
Table 70: Road surface condition vs. Age (actual count values), UK 2005-2007. ................................................. 75
Table 71: Road surface condition vs. Age (percentage), UK 2005-2007............................................................... 76
Table 72: Junction detail vs. Age (actual count values), UK 2005-2007................................................................ 77
Table 73: Junction detail vs. Age (percentage), UK 2005-2007............................................................................. 78
Table 74: Age vs. Manoeuvre (actual count values), UK 2005-2007..................................................................... 79
Table 75: Age vs. Manoeuvre (percentage), excluding “going ahead other”, UK 2005-2007. ............................... 80
Table 76: Speed Limit vs. Casualty Severity (actual count values), UK 2005-2007. ............................................. 82
Table 77: Speed Limit vs. Casualty Severity (percentage), UK 2005-2007. .......................................................... 82
Table 78: Skidding/overturning vs. Casualty Severity (actual count values), UK 2005-2007................................. 83
Table 79: Skidding/overturning vs. Casualty Severity (percentage), UK 2005-2007. ............................................ 83
Table 80: Road class vs. Road type vs. Speed limit, UK 2005-2007..................................................................... 84
Table 81: Light condition vs. Time vs. Weather vs. Road surface condition, UK 2005-2007................................. 85
Table 82: Road type vs. accident type – actual count values (accidents), Italy 2005-2007. .................................. 91
Table 83: Road type vs. accident type – actual count values (deaths), Italy 2005-2007. ...................................... 91
Table 84: Road type vs. accident type – actual count values (injured), Italy 2005-2007. ...................................... 91
Table 85: Road type vs. accident type – severity index*100, Italy 2005-2007....................................................... 92
Table 86: Junction type vs. accident type – actual count values (accidents), Italy 2005-2007. ............................. 92
Table 87: Junction type vs. accident type – actual count values (deaths), Italy 2005-2007................................... 93
Table 88: Junction type vs. accident type – actual count values (injured), Italy 2005-2007................................... 93
Table 89: Junction type vs. accident type – severity index*100, Italy 2005-2007. ................................................. 93
Table 90: No-Junction type vs. accident type – actual count values (accidents), Italy 2005-2007......................... 94
Table 91: No-Junction type vs. accident type – actual count values (deaths), Italy 2005-2007. ............................ 94
Table 92: No-Junction type vs. accident type – actual count values (injured), Italy 2005-2007. ............................ 95
Table 93: No-Junction type vs. accident type – severity index*100, Italy 2005-2007. ........................................... 95
Table 94: Pavement state vs. year first delivery licence – actual count values (accidents), Italy 2005-2007. ....... 96
Table 95: Pavement state vs. year first delivery licence – actual count values (deaths), Italy 2005-2007............. 96
Table 96: Pavement state vs. year first delivery licence – actual count values (injured), Italy 2005-2007............. 96
Table 97: Pavement state vs. year first delivery licence – severity index*100, Italy 2005-2007. ........................... 97
Table 98: Pavement state vs. pavement type; death, injured,severity index*100, Italy 2005-2007. ...................... 97
Table 99: Traffic signals vs. road type; death, injured, severity index*100, Italy 2005-2007.................................. 98
Table 100: Traffic signals vs. (no-)junction type; death, injured, severity index*100, Italy 2005-2007. .................. 99
Table 101: Junction type vs. rider age – actual count values (accidents), Italy 2005-2007. ................................ 101
Table 102: Junction type vs. rider age – actual count values (deaths), Italy 2005-2007...................................... 101
Table 103: Junction type vs. rider age – actual count values (injured), Italy 2005-2007...................................... 101
Table 104: Junction type vs. rider age– severity index*100, Italy 2005-2007. .................................................... 102
Table 105: No-Junction type vs. rider age – actual count values (accidents), Italy 2005-2007. .......................... 102
Table 106: No-Junction type vs. rider age – actual count values (deaths), Italy 2005-2007................................ 103
Table 107: No-Junction type vs. rider age – actual count values (injured), Italy 2005-2007................................ 103
Table 108: No-Junction type vs. rider age– severity index*100, Italy 2005-2007. ............................................... 103
Table 109: Accident based criteria for MARVin query. ........................................................................................ 114

2-BE-SAFE D2 Road infrastructure and road safety for PTW
Document ID: 2BES_WP1_D2_RIandRSforPTW_Final.doc 11
Table 110: Accident victims based criteria for MARVin query. ............................................................................ 114
Table 111: PTW accidents vs. Longitudinal gradient........................................................................................... 115
Table 112: PTW accidents vs. Crossfall. ............................................................................................................. 116
Table 113: PTW accidents vs. Skid resistance.................................................................................................... 116
Table 114: PTW accidents vs. Longitudinal evenness IRI. .................................................................................. 117
Table 115: PTW accidents vs. Texture MPD. ...................................................................................................... 117
Table 116: PTW accidents vs. rut depth ts........................................................................................................... 118
Table 117: PTW accidents vs. theoretical water depth tw. ................................................................................... 119
Table 118: General information about road section B20 “Türnitz - Annaberg”..................................................... 123
Table 119: General information about road section B20 “Reith – Mitterbach a. Erlaufsee”. ................................ 125
Table 120: General information about road section B27. .................................................................................... 127
Table 121: General information about road section B72. .................................................................................... 129
Table 122: General information about road section B95. .................................................................................... 131
Table 123: General information about road section B127. .................................................................................. 133
Table 124: General information about road section B164. .................................................................................. 135
Table 125: Summary of all road sections. ........................................................................................................... 137
Table 126: Injury severity (n=80 riders and motorcycle passengers)................................................................... 144
Table 127: Accidents occurred away from junction. Type of accident by Driving speed (n=29). ......................... 145
Table 128: Accidents occurred away from junction. Curve radius by Driving speed (n=29). ............................... 146
Table 129: Accidents occurred away from junction. Curve radius by Rollover on carriageway (n=29)................ 146
Table 130: Accidents occurred away from junction. Crossfall by Rollover on carriageway (n=29). ..................... 147
Table 131: Accidents away from junction. Rollover on carriageway by radius and speed (n=29). ...................... 147
Table 132: Accidents away from junction. Rollover on carriageway by crossfall and speed (n=29). ................... 148
Table 133: Run-off-road accident hitting an object on carriageway. Severity by Type of object (n=9 riders and motorcycle passengers)............................................................................................................................... 149
Table 134: Run-off road hitting an object off carriageway. Severity by Type of object (n=32 riders and motorcycle passengers)................................................................................................................................................. 149
Table 135: Safety barrier collisions. Severity of accidents (n=14). ..................................................................... 152
Table 136: Safety barrier collisions. Severity by rollover on carriageway and impact speed (n=14) ................... 152
Table 137: Type of accident by severity (n=16). ................................................................................................. 153
Table 138: Approach speed by Driving speed and Speed limit. (n=16).............................................................. 154
Table 139: Approach speed by Speed limit (n=8)............................................................................................... 155
Table 140: Comparison of safe and unsafe road sections................................................................................... 162
Table 141: Radii relation “good range”. ............................................................................................................... 179
Table 142: Radii relation “moderate range”. ........................................................................................................ 180
Table 143: Radii relation “inappropriate range”. .................................................................................................. 181

2-BE-SAFE D2 Road infrastructure and road safety for PTW
Document ID: 2BES_WP1_D2_RIandRSforPTW_Final.doc 12
Executive summary
Traffic safety as a challenge to reduce accidents, injuries and fatalities is still an important social problem in spite of the wide introduction of sophisticated safety measures to the road user, the vehicle and the infrastructure. One of many factors that are likely to contribute to an increase in road transport safety risks includes the increasing number of vulnerable road users, such as motorcyclists.
The aim of the reported work within the 2-BE-SAFE project, WP1, was to highlight the potential influence of the road infrastructure characteristics on the motorcycle accident risk.
As a usual starting point of many research works, a literature review to specify the actual State of the Art, took place. The results have shown that a lot of questions are not completely answered – especially the influence of specific road condition parameters together with alignment types and road geometry on powered two-wheelers (PTW) accident types. A comparison of country specific analyses has not been found. Most of the results who define the State of the Art are very general, but gave fruitful hints for the design of the studies conducted and reported on the following pages.
The first step of investigation was the macroscopic analysis of each single partner (country). Results from each participant country (Greece, Spain, Italy, Great Britain) on risk factors regarding the junction types, the road area types, the most critical accident types share many common points and are often comparable. Other potential risk factors show trends, which differ in each country – like the basic accident data itself. This unique comparison of possible infrastructure risk assessment also reflects also an obviously differing rider’s philosophy (different motives to ride a motorcycle – urban/interurban rate of mileage, motorcycling for fun and to substitute the passenger car).
In the final stage of the project, a more in-depth view on the PTW accident event and the road section, where cashes occurred, has been accomplished. Microscopic analyses on specific physical values of road condition characteristics as well as detailed information on the trace parameters were correlated with PTW accidents. Parameters measured by special devices and/or in-depth accident data of the accidents are used to fulfil the aim finding risk factors regarding the road infrastructure. Unique data correlations show trends of potentially risky crash circumstances regarding the surface characteristic and e.g. curve radii classes. In-depth analyses reveal the negative effects of impacting a road restraint system. Participating countries are Spain, Germany and Austria.
Even similarities in risk factors and obvious trends of critical road infrastructure are explored in that European survey; it also proves that the issue of motorcycle is much more complex than often thought. European wide solutions to decrease PTW accidents by making the road infrastructure “motorcycle friendly”, self-explaining and forgiving needs an in-depth understanding of the vehicle-road-interaction and its dynamics. A strong connection of road types, the mileage per year and the purposes of the rides are also feasible, in order to understand the motives of motorcyclists using a specific route. Especially the microscopic analyses of specific road sections has shown a strong need for further research regarding the interaction between motorcycle tyres and road surface condition.
Characteristics of PTW accidents spots are in some points comparable within the European context, but other black spots specifications are even in one country unique – statistically insignificant, but highly dangerous.
With that kind of studies within that task a unique comparison of risk factors depending on road infrastructure factors could be shown.

2-BE-SAFE D2 Road infrastructure and road safety for PTW
Document ID: 2BES_WP1_D2_RIandRSforPTW_Final.doc 13
1. Introduction and Methodology
Motorcycle safety and accidentology needs an overall view on all possible crash-causal factors. Within this activity of WP1 in the 2-BE-SAFE project, one specific issue is addressed – the possible correlation of infrastructure (risk) factors and PTW accidents.
Do road surface characteristics, condition, alignment parameters, as well as road installations influence the PTW crash risk?
Literature reviews and the identification of the State of the Art, together with in-depth accident analyses and further investigation tools (risk assessment software) are done in order to verify potential infrastructure risk factors.
Three main sub activities can be identified:
• Within the first sub activity, a selective overview of the existing (or under examination) PTW safety guidelines and their influences on road design will take place, and links with other projects will be identified, as well as relevant documents produced by related working groups (e.g., at EU/CEN level) will also be considered. This analysis will define the current trends on road infrastructure issues in the PTW domain.
• The second sub activity involves a macro-analysis of the role of the road infrastructure (type of area or road, junction type, curvature etc) on PTW accidents. Data extracted from national accident databases (Greece, Spain, United Kingdom, Italy) will be analysed to identify the accident causation factors and potentially review accident site characteristics (primary road infrastructure parameters).
• Within the third sub activity, analysis at a micro-level will be performed to identify the critical characteristics of road infrastructure that constitute PTW risk factors. Data from accident databases and road geometry data (Austria, Germany and Spain) and appropriate software tools (MARVin, RoadVIEW) will be employed to conduct this detailed analysis. Similarities of road design elements and surface conditions (various curve radii, curvature, crossfall in road sections, type of pavement, skid resistance, texture etc.) and the combination of these data at accident locations will be determined as well as typical crash-causal-combinations.

2-BE-SAFE D2 Road infrastructure and road safety for PTW
Document ID: 2BES_WP1_D2_RIandRSforPTW_Final.doc 14
2. State of the Art
The main objective of 2-BE-SAFE WP1, Task 1.2 is to investigate which road infrastructure elements (road design elements and road surface parameters) have an influence on PTW accidents. Within the first activity, a selective overview of the existing PTW safety guidelines, projects and papers and their influence on road design is required. The consulted sources vary from public studies performed by governments to reports of different European research studies.
2.1. Main PTW accident factors regarding infrastructure
2.1.1. Type of area
A significant number of projects and papers related to the influence of infrastructure elements to the PTWs behaviour can be traced in literature. However, the papers concerning PTW safety are much fewer. One of the major influential characteristics of PTW accidents interaction to infrastructure is the type of area. MAIDS (ACEM, 2003) reports that most of the accidents (72%) take place in an urban area and approximately 25% take place in a rural area. Pearson and Whittington (2001) also state that approximately 70% of motorcycle injuries occur on local area roads in Australia. ASSING (2002), a German study on the general development of accidents involving motorcycles using individual data of the official accident statistics concerning accidents involving injury to persons in which at least one motorcycle (lights motorcycle, motorcycle or moped) was involved, reveal that the highest degree of seriousness is to be found on roads outside built-up areas. Furthermore, the crash severity depends on the location. Because most crashes at intersections happen inside urban areas where the speed is generally lower than outside urban areas, the crash severity is also much lower at these locations (ASSING, 2002). By contrast the percentage of crashes in curves is much higher outside urban areas. Bridges can be problematic for motorcyclists. Issues develop if they are placed on bends or if they have a surface friction lower than that of the approach road (e.g. concrete or wood after an asphalt road) (NPRA, 2004).
SPORNER (2006) analyses the main aspects and the particular risks for accidents on rural roads in cooperation with TÜV Bayern and some police stations within the federal states of Bavaria and North Rhine Westphalia. For the first time a global view on vehicle/driving behaviour and layout of roads is presented: If only one of the derived risk elements appears it may be harmless, but in combination with others it can finally cause an accident. The study includes analytical investigated samples concerning the focal reasons that caused the accident, as well as a list of typical distinctive features due to the layout of the roads.
2.1.2. Road geometry and roadside installations
A serious consideration in PTW safety is the influence of road geometry, roadside installations, such as barriers, posts and so on, as well as the markings. Miller (1997) reports that graveled (rather than sealed) road shoulders, slippery road markings, slippery manhole covers/steel plates and uneven road surfaces are considered a danger to motorcyclists. Miller (1997) suggests that kerbs should be marked or painted with fluorescent material to ensure that they are more conspicuous in low light conditions.
According to an in-depth study concerning safety situations in Germany, crests in the vicinity of curves and intersections, a high bendiness and high gradients are characteristics of roads with a high proportion of motorcycle crashes (Kühn, 2008)
Gerlach (2007), analyzed data for road sections in which accidents occurred and compared with sections where no accidents happened. This analysis by comparison provided the most important results of the project. It was possible to show that at road sections in which a) the angle changing throughout the entire section is more than 200gon/km, b) a maximum of 15 changes in the road direction per km occur, c) at least 50% of the roads are straight and d) the road section is longer than

2-BE-SAFE D2 Road infrastructure and road safety for PTW
Document ID: 2BES_WP1_D2_RIandRSforPTW_Final.doc 15
2.0km there is a higher risk potential for motorcyclists compared to the average potential for risk on comparative road sections.
Gerlach (2007) also emphasizes that 18% out of 595 motorcycle crashes (only crash type: driving accident) occurred at crash sites, where the crossfall did not match the requirement of driving dynamics (superelevation in the inner curve). However, these “negative” crossfalls mostly had a superelevation much below 2.5%. Furthermore it could be shown, that the recommended maximum crossfall of 8.0% was exceeded in some cases.
One particular analysis concerning the gradient comes up with the following result: the number of motorcycle casualties on road sections with a descending gradient between 4.0% and 10.0% is higher than on road sections with an ascending gradient lower than 4.0%. Accordingly a descending gradient has a strong effect on motorcycle safety (Gerlach, 2007).
An analysis which combines the effects of crossfall, gradient and direction of curve pointed out, that most motorcycles crashes happen in left curves with descending gradient followed by right curves with descending gradient. Furthermore it could be found, that especially in left curves with descending gradient, a negative crossfall is a major problem (Gerlach, 2007).
Due to the fact, that 78% of the investigated motorcycles crashes happen on roads with a bendiness of more than 200gon/km (60% of investigated routes), it could be proven, that the bendiness of a road is a very important criterion from the safety point of view (Gerlach, 2007).
MAIDS report (ACEM, 2003) identified the contributing factors for each accident case study reported. Considering a roadway design defect as a condition which presented a danger for PTW riders (such as failure to install signs, built-in obstructions, curve with decreasing radius or inadequate distance to merge lines), data indicated that roadway design defects were present in 57 cases (6,2%) along the PTW pre-crash path, but did not contribute to the causation of the accident in 47% of those cases.
A roadway maintenance defect was reported in 146 cases (15,8%), being a primary or contributing factor in 25 cases (17,1% of cases involving a roadway maintenance defect). Weather made no contribution to the accident causation in 92,7% of the total number of cases, while there were 18 cases (2%) in which weather was identified as the primary contributing factor and weather was also reported to contribute to accident causation in 42 cases (4,6% of all cases).
Motorcycle Action Group - MAG (2005) underlines that the major cause of injury when a rider comes into contact with a crash barrier is exposed posts. Several solutions have been developed; one system most widely used today involves the fitment of a secondary rail to the existing barrier. Following several motorcycle accidents (including fatalities) at the A2070 Cloverleaf Junction in Kent, the Highways Agency identified the German ‘BikeGuard’ system as best suited to improve rider safety. Analysis of accident statistics since this was introduced has shown that “no personal injury accidents have occurred”.
In relation to infrastructure elements, Elliot et al. (2003) made the following points:
• Parallel longitudinal grooves in the road surface (for example, to avoid aquaplaning) can also induce instability.
• While travelling on a road with markings on the path of travel, a potential leaning angle of 45 degrees on dry tarmac can be reduced to 40 degrees on dry road markings, and reduced further to 25 degrees on wet markings.
• Crossing profiled (markings running in a direction other than parallel to the direction of travel) road markings causes “strong steering impulses leading to deviations of about 100mm” from the motorcycle’s track. Furthermore, road markings cause surface water retention, and can increase the possibility of aquaplaning.
Road markings, manholes and cattle grids can be more slippery than the road surface, especially when wet (NPRA 2004). Moreover, riding is affected by the presence of surveillance cameras; not-at-fault crash involvement at intersection is reduced in such a setting (Haque et al., 2009). Some concern has been expressed over the potential for Vehicle Restraint Systems (VRS) to cause injury to motorcyclists. The following assertions are made (MacDonald, 2002):
• The current standards and specifications for roadside hardware, and the systems themselves, are not designed to take into account impact by motorcyclists.

2-BE-SAFE D2 Road infrastructure and road safety for PTW
Document ID: 2BES_WP1_D2_RIandRSforPTW_Final.doc 16
• The current European Standard is not necessarily applied to minor roads;
• There is a distinction between a safety fence and a safety barrier. The former consists of poles supporting one or more horizontal elements, whereas the latter tend to have a continuous surface.
• Safety barriers are generally not considered to present the same type of hazard to motorcyclists as fences.
Gibson and Benetatos (2000) examined New South Wales fatal motorcycle crash records from 1998/1999, identifying three crash scenarios involving crash barriers:
• Motorcyclist is thrown into the air prior to impacting with the barrier;
• Motorcyclist separates from their bike and slides along the road before striking the barrier; • Motorcyclist strikes the barrier whilst still on the bike.
They also concluded that the majority of fatal impacts were at a relatively shallow angle (<45°). The perceived risk of impacting a concrete barrier is less within this angle range compared to an impact with a barrier post from a w-beam or wire rope barrier. Morgan and Ogden (1999) suggest that impact forces are not as severe when colliding with a large surface area at a shallow attack angle. Gibson and Benetatos (2000) and Duncan et al., (2000) therefore argue that hitting an exposed post can result in more severe injuries. Impacts with guardrail posts reportedly cause injuries that are five times more severe than those from an average motorcycle accident. ATSB (2000) examined any evidence or information regarding the safety implications of wire rope safety barriers. Concerning the use of road safety barrier systems, the study underlines that road safety barriers are an important and effective road safety measure. Motorcycle representatives argue that little consideration is given to the installation of barriers which are safe for all road users, and that the needs of motorcyclists are “largely ignored” in this matter. As accident reporting is not detailed enough to quantify the safety issue, they claim wire rope fences result in “unquantified trauma”. ATSB (2000) recommended concrete barriers, and argued that when maintenance costs are taken into account, these can be a more economically viable option. Furthermore, they recommend that vehicle rollovers can be prevented by the use of ‘F profile’ concrete barriers, providing an overall beneficial solution. On the other hand, the ATSB’s view was that wire rope safety barriers are “not currently a motorcycle safety problem”, given only one recorded motorcycle casualty and no fatalities involving a wire rope safety barrier. Furthermore, they state that although motorcycle riders only make up 0.5% of road traffic, that the authorities do have an obligation to address their safety issues. However, without evidence, they could not remove a measure which has safety benefits for other road users. In view of APROSYS (2006) task concerning of impacts of motorcyclists into infrastructure, a review of existing literature on motorcycle-infrastructure interaction showed that collisions with an obstacle occur in 4,2% to 19,7% of motorcycle accidents depending on the area. Roadside barriers are involved in 2,4% to 4% of all PTW fatalities, constituting a particular hazard to PTW riders. The typical barrier impact location is a curve, and in about half of the cases the rider impacts in upright position. In spite of this fact, research is mainly focused on the other half, involving a sliding impact position. Several countermeasures have been developed to reduce the injuries of the riders involved in this sliding impact position, such as a continuous additional rail mounted on roadside barriers.
As a result of an in-depth databases analysis it was concluded that roadside barriers impact occurred under small angles at high speeds, mostly causing injuries to head and lower extremities (APROSYS, 2006). Considering metal barrier impacts, the rail seems to be hit more often than the post. Trees and poles impacts are at least equally hazardous to PTW riders than barrier impacts. MAG’s position in relation to safety barriers in the UK is summarized below (Motorcycle Action Group - MAG 2006):
• In 2003, there were 109 slight, serious or fatal motorcycle casualties where the rider hit the
central barrier.

2-BE-SAFE D2 Road infrastructure and road safety for PTW
Document ID: 2BES_WP1_D2_RIandRSforPTW_Final.doc 17
• There were 144 collisions where the rider struck the near or offside crash barrier.
• From 1999 to 2003, there were 1271 motorcycle casualties involving a collision with a central, near or offside barrier. These collisions resulted in 142 fatalities.
• In 2003, 5.2% of all fatalities were crash barrier impacts. The paper points towards computer simulations and tests which reportedly indicate that “injuries will be severe if a rider hits the cables or exposed supporting posts of vehicle restraint systems” (MAG, 2006). MAG’s position in the paper is that vehicle restraint systems are designed with the majority of road users in mind, and that motorcyclists “are not given sufficient consideration”. MAG suggests that vehicle restraint systems should be designed and tested for motorcycle safety, as well as for the safety of other road users. When striking barriers, studies indicated that the dummy experienced more rapid deceleration/load when colliding with a steel barrier than a concrete barrier. Nevertheless, the research suggests that the deceleration during both would have resulted in severe or life threatening injuries (Berg et al., 2005). When the rider impacted with a steel barrier in an upright position, the crash tests showed that the dummy slid alongside and onto the barrier. Contact and snagging with parts of the barrier would have led to severe injuries in this instance. The rider was not decelerated by the concrete barrier, and although the measured dummy loads did not indicate a risk of life-threatening injury. Kinetic energy was not dissipated, and this increases the risk of being deflected into oncoming traffic (Berg et al., 2005). The results obtained from the simulated concrete barrier tests indicate that motorcyclists impacting in an upright position will experience low deceleration and sustain survivable injuries, unless they are catapulted over the barrier and strike the objects around which the barriers were built (Berg et al., 2005). The results on the simulated wire rope barrier tests showed that (Berg et al., 2005):
• Riders are unlikely to clear these types of barriers. They are likely to get caught and decelerate very quickly;
• The wires are likely to guide the motorcycle into posts and lead to heavy impacts, increasing the risk of severe injury to the rider.
Impact with crash barriers/safety fences can result in serious injures for motorcyclists. There are today several means for improving the safety performance of existing barriers/fences in order to make them friendlier for motorcyclists. In particular, crash barriers which allow the rider to slide along the surface of the barrier without hitting any objects that concentrate the collision energy seem to lessen the risk of injury. Although, at the moment, it is not possible to estimate how large the reduction in injury severity will be when crash barriers are modified, it is no doubt that this measure will result in some reduction of injury severity. It is recommended that effort made to improve barriers/fences located on sharp curves or on motorcycle accident black spots should be given priority. Finally Ulleberg (2003) conclude that it is also important to focus on the road side area on locations where there are no fences/barriers, particularly by removing objects in the road side area which the motorcyclists may hit in run-off-road accidents.
Regarding guardrail crashes, Gabler (2007) examined the Fatality Analysis Reporting System (FARS) database to identify guardrail crash trends in cases where a fatality has occurred. The primary results of the study were as follows:
• In 2005, for the first time, the number of motorcycles suffered more fatalities than car passengers or any other vehicle type involved in a collision with a guardrail;
• Motorcycles compose only 2% of the vehicle fleet in the US, but account for 42% of fatalities involving a guardrail;
• Over two thirds of motorcyclists fatally injured in guardrail crashes were wearing a helmet;
2-BE-SAFE D2 Road infrastructure and road safety for PTW
Document ID: 2BES_WP1_D2_RIandRSforPTW_Final.doc 18
• Approximately one in eight motorcyclists who were struck by a guardrail were fatally injured; a fatality risk over 80 times higher than for car occupants involved in a collision with a guardrail.
In Germany, in 1986 and 1987, 15% of motorcycle fatalities involved crashes with guardrails (Koch and Brendicke, 1988). The solutions proposed by Brailly (1998) were the use of a shield on barriers to protect the rider from the upright sections of barrier. The study suggested introducing a ‘safety zone’ on barriers using this method of ‘modesty rails’, particularly on curves with a radius of less than 250m. The German solution has been to re-design the post and use an energy absorbing material.
2.1.3. Lighting and Visibility
A significant concern in PTW safety is visibility. Poor visibility (horizontal curvature, vertical curvature, darkness) is responsible for increased motorcycle injury severity (Savolainen and Mannering, 2007). Poor sightline visibility and rider/bike conspicuity are likely to contribute to motorcycle accidents at intersections (NPRA 2004). Moreover, riding in darkness without street lighting was related to severe motorcyclists’ injury (de Lapparent, 2006, Pai and Saleh, 2007, 2008). Motorcyclists are found to be more vulnerable during night time at both intersections and expressways (Haque et al. 2009). Injuries resulting from early morning riding, in general, appear to be the most severe, especially in junctions controlled by stop, and give-way signs and markings (Pai and Saleh 2007). DGT (2007) aimed to obtain the main PTW accident scenarios and to identify their causes and consequences in a well-defined sampling area, i.e. the non-urban roads of the Spanish road network. The study focused on fatal accidents involving at least one motorcycle (rider or the occupant killed as a result of the accident) during the year 2007. The study shows that most of the accidents occur with enough lighting, good weather conditions and good roadway surface condition. Approximately three out four fatal accidents are located in conventional roads. Run-off accidents were reported in 60% of all cases, being the most frequent type of fatal accident. Roadside elements were found to be particularly hazards to motorcycle riders, since these elements were impacted in approximately 35% of all fatal accidents. Within accidents including roadside elements, metal barrier collisions were reported in 18% of all cases. Motorcyclists often experience reduced visibility when wearing glasses, visors or wind shields (NPRA, 2004). Dew can build up quickly on motorcyclists’ visors, windshields and glasses when entering a tunnel.
2.1.4. Type of collision
Concerning the type of collision, a French study (Brailly, 1998) concluded that the rate of fatal injuries per collision is five times higher than the national average if the rider strikes a barrier. Collisions with barriers account for 8% of all motorcycle fatalities and 13% of fatalities on rural roads.
At-fault crashes on expressways are found to increase when riding in the median lane, with higher engine capacity and when riding with a pillion passenger (Haque et al., 2009).
Head-on collisions with other vehicles while negotiating a curve make up 6% of person injury accidents, and 13% of fatal accidents (NPRA 2004). Collisions with stationary objects result in more severe injuries (Quddus et al., 2002; Lin et al., 2003; Keng, 2005; Savolaine and Mannering, 2007). Motorcyclists were more injurious while motorcycles were overtaking their collision partners and while vehicles made a turn (Pai and Saleh, 2008).
For collisions at intersections between cars and motorcycles the car drivers are usually at fault. A possible explanation for this is that the car drivers do not "see" motorcycles, either because the shape and colour of motorcycles make them blend with the background and hard to see or the car drivers have a strong set to just notice other cars making them overlook motorcycles even though they are clearly visible (Glad, 2001).

2-BE-SAFE D2 Road infrastructure and road safety for PTW
Document ID: 2BES_WP1_D2_RIandRSforPTW_Final.doc 19
2.1.5. Junction Type
Junction type is a significant influential factor of PTW safety. Hurt et al. (1981) and de Lapparent (2006) note that the probability that a severe/fatal accident occurs at intersections is higher than the same probability at non intersections. The most common of accident has been found to be the right of way violation (ROWV), where a vehicle pulls out from a side road onto a main carriageway into the path of an approaching motorcycle (Hurt et al., 1981; Haworth et al., 2005; de Lapparent, 2006; Crundall et al., 2008). Pai and Saleh (2007, 2008) provide an extensive study on the interaction of junction type and motorcycle injury severity. In brief, the influential factors to motorcyclist injury severity at uncontrolled junctions are: elderly rider, greater engine size of motorcycle, riding in early morning, on weekend and under fine weather; street lights unlit; riding on uncongested road; collisions with bus/coach or HGV. In the case of signalized intersection, identified critical parameters are the following: heavier engine size of motorcycle; collisions with bus/coach or HGV; riding under fine weather and on non built-up road; and type of collision. Regarding interactions of junction type with gender and age, it has been reported that male riders, given an accident has occurred, were more likely to be severely injured at signalized than at unsignalized junctions (Pai and Saleh, 2007). Moreover, teenaged riders were more prone to be severely injured than those aged 20–59 in accidents where stop, give-way signs or markings controlled the junctions, in contrast to findings regarding accidents at uncontrolled junctions (Pai and Saleh 2007). Collisions where older driver vehicles were making a turn and colliding with motorcycles appeared mostly in unsignalized junctions (Pai and Saleh, 2008). Intersection accidents account for 30% of person injury accidents, and 17% of fatal accidents. These types of accidents are more prevalent in ‘moped’ users. In 87% of such accidents it was the motorists’ obligation to give way, whereas in 13%, it was the motorcyclist who should have yielded. This would suggest that driver behaviour is the main factor in intersection accidents (NPRA, 2004). Unsafe speed greatly affects injury severity (Branas and Knudson, 2001; Savolainen and Mannering, 2007); the effect of speeding is intensified at unsignalized junctions (Pai and Saleh, 2007). More than half of motorcycle crashes with personal injury occur at intersections respectively t-junctions including entrances and exits (ASSING, 2002). However, these crashes are characterised by a relatively low severity (ASSING, 2002). The crash severity is much higher for crashes in curves, especially in combination with slopes.
2.1.6. Pavement surface condition
On the pavement surface conditions, Shankar et al. (1996) emphasize on pavement surface and type of highway impact on sideswipe collisions between motorcycles and other motorized vehicles at junctions. Wet pavement surface is found to cause at-fault motorcycle accidents at non-intersections (Haque et al., 2009). However, Savolainen and Mannering (2007) suggest that in certain circumstances, risks could be mitigated by motorcyclists; for example, riding on wet pavement conditions, near intersections. ASSING (2002) reports that in Germany during 1999, 83% of all motorcycle crashes occurred on dry road surfaces. In comparison the percentage of all crashes with personal injury on dry road surfaces was only 66%. This difference could be explained by the fact that most motorcyclists use their bikes only during fair weather conditions In the PTW accident analysis conducted in MAIDS (ACEM, 2003), roadway was found to be dry and free of defect in 84,7% of all accidents, while roadway was found to be wet in 7,9% in all collected cases. Road surface defects were present in 30% of cases. Bitumen used in the repair of road surfaces have much lower skid resistance than for wet tarmac causing steering problems when riders cross wet bitumen, particularly whilst leaning or braking in an upright position Elliot et al. (2003).

2-BE-SAFE D2 Road infrastructure and road safety for PTW
Document ID: 2BES_WP1_D2_RIandRSforPTW_Final.doc 20
A well known problem caused by an insufficient stiffness of a motorcycle frame is deterioration of the stability (Brorsson and Ifver, 1984). Serious injuries have been reported caused by motorcycles which suddenly begin to wobble or weave. Road surface actively contributed to 15% of crashes examined by the Victorian Motorcycle case control study (Haworth et al., 1997). The authors suggested that the important factors in these collisions were:
• Surface grip;
• Surface irregularities and potholes;
• Loose materials;
• Patch repairs;
• Road markings. Pearson and Whittington (2001), state that motorcycles are very sensitive to changes in friction level between the road surface and tires.
2.1.7. Type of vehicle and vehicle characteristics
Type of vehicle and vehicle characteristics has an important role on PTW accidents. Greater motorcycle engine size and motorcycle speed resulted in higher injury severity levels regardless of the control measure adopted (Shankar et al., 1996; Quddus et al., 2002; Langley et al., 2000; Lin et al., 2003; Harrison and Christie, 2005; de Lapparent, 2006; Pai and Saleh, 2007). Moreover, collisions with heavier vehicles result in more severe injuries (Quddus et al., 2002; Lin et al., 2003; Keng, 2005; Pai and Saleh, 2007).
Ulleberg (2003) conclude that there are no studies based on real accidents estimating the preventive effect of ABS-brakes on motorcycles. Moreover, studies demonstrate that the use of daytime running lights reduces the number of accidents which involve a collision with another vehicle. It is expected that additional measures improve motorcycle conspicuity (e.g. fluorescents clothing, additional beams or the use of high beam in daylight) can result in a further reduction in daytime collision accidents. There is, however, a need for further studies in order to estimate the effects of such additional measures. Collision tests indicate that leg protectors may reduce the severity of leg injuries, but increase the risk of head, chest and neck injuries. Tests demonstrate that an airbag can be effective, especially in cases where the motorcycle collides into the side of a car. The airbag may, however, increase the risk of head injuries in some cases. It is uncertain whether the airbag can cause neck injuries while inflating.

2-BE-SAFE D2 Road infrastructure and road safety for PTW
Document ID: 2BES_WP1_D2_RIandRSforPTW_Final.doc 21
2.2. Summary of Findings
The main objective of the Sate of the Art report is to highlight which road infrastructure elements (road design elements, road surface parameters, roadside obstacles, road furniture,…) have an influence on PTW accidents. A selective overview of the existing PTW safety guidelines, projects and papers and their influence on road design has been done.
The consulted sources vary from public studies performed by governments to reports of different European research studies.
Even most of the PTW accidents occur with enough lighting, good weather conditions and good roadway surface condition the summary of all cited reports, project papers and guidelines give an overview on road infrastructure related risk factors. From the literature overview, the most relevant risk factors are:
• Roadway design defects (e.g. failure in road construction, disharmonic trace geometry, curvature, unevenness, potholes);
• Roadway maintenance defects;
• Road surface condition (e.g. problems on wet roads, slippery bitumen on hot asphalt, poor skid resistance);
• Collision with road side barriers in a run-off accident (very high fatality rate);
• Critical curve radii (curve radii relations);
• “Negative” crossfall (crossfall does not match the requirement of driving dynamics);
• Combined effect of crossfall, gradient and direction of curve (most motorcycles crashes happen in left curves with descending gradient followed by right curves with descending gradient; in left curves with descending gradient, a negative crossfall is a major problem);
• Intersections (poor sightline visibility and rider/bike conspicuity are likely to contribute to motorcycle accidents at intersections);
• Road markings, manhole covers and cattle guards;
• Poor visibility and speeding are a common multiplicator of infrastructure related accident risk.
A core problem of identifying significant correlations between road infrastructure parameters and accident information is the lack of relevant data. Another reason of not having more detailed investigations on this research question is that official motorcycle accident reports - and the media coverage of motorcycle accidents - do not always give all the facts. When a motorist violates a give way sign and hits a motorcyclist, a common explanation is that the rider was speeding, or that the rider was impossible to see, which is now recognised as ‘inattentional blindness’, while in single vehicle crashes, when a rider loses control on a curve, a common explanation is that he was speeding. In-depth studies or specific accident simulations including the road infrastructure (virtual road) are very rare.
2-BE-SAFE D2 Road infrastructure and road safety for PTW
Document ID: 2BES_WP1_D2_RIandRSforPTW_Final.doc 22
3. Macroscopic Analysis
3.1. Introduction
Most European countries have experienced a systematic increase in the diffusion of Powered Two-Wheelers (PTWs) as an alternative or complementary mean of undertaking personal transport. Scooters, mopeds and motorbikes are now a common sight on all categories of roads, their popularity having considerably increased, especially within the urban environment, due to a number of factors.
The popularity of PTWs requires that infrastructure needs to be built, maintained and upgraded taking into consideration the different needs of these types of users. The often terrible consequences of accidents involving PTWs are a constant reminder that, much too often, infrastructure is not designed to ensure the maximum possible levels of safety for motorcycle and moped riders.
The 2-BE-SAFE project and its work package 1 intend to provide an understanding of the link between riders or drivers and road environment characteristics (road infrastructure and weather conditions) that constitute risk to PTWs, on road safety.
Activity 1.2 within WP1 has been planned to specifically identify the influence of road infrastructure elements on PTW accidents, using accident statistics from national databases for macro-analyses and specific software-tools and in-depth data for micro-analyses. The aim is to identify the influence of road infrastructure characteristics (e.g. road types, junction types, road surface condition, road geometry, etc.) that constitute risk factors for PTWs.
This report refers to the first level of analysis that encompasses the macroscopic analysis of the interactions between mopeds and motorcycles and road infrastructure characteristics using data from the Greek, Spanish, British and Italian accident database. Data extracted from national accident databases have been analysed to identify the accident causation factors and potentially review accident site characteristics (primary road infrastructure parameters). The results are promising and useful for the other 2-BE-SAFE work packages to focus on their objectives, although the differences in the national databases are evident (but they cannot be eliminated).
This report provides the deliverable in respect of this activity and is structured as follows: each country’s analysis is a single part of the report, the first chapter of each national report briefly describes the methodology and data specifications utilized in the analyses of PTW accident data, followed by the specific analyses and queries.
The basic sets of queries are in all single report parts (for each country) similar and comparable, even though the layout and wording is slightly different. Due to the different analyses tools and especially of the different data sets. All partners involved in the macro-analyses work used moped und motorcycle accidents in the surveys, the Greek queries are presented separately for each mode whereas the other partners provided them together as PTW accidents.
Regarding the identification of real risk factors (risk assessments) a critical point is that there is no exposure data for any of the data bases. In order to use the absolute accident numbers to assess risk trends, some weighting factors are included in the analyses. For example the query of the road condition was compared with the ratio of rainy days in the specific country.
Each partner delivered also some specific queries and data comparisons within their data analysis in order to figure out some “extra benefits” to fulfill the requested task.
Each country’s part closes with a list of key findings – which is finally summarized at the end of the report as a merged conclusion.

2-BE-SAFE D2 Road infrastructure and road safety for PTW
Document ID: 2BES_WP1_D2_RIandRSforPTW_Final.doc 23
3.2. Interaction between Powered Two-Wheeler Accidents and Infrastructure in Greece
3.2.1. Methodology – Greek Data Base and Available Data
Data from the Greek National database with disaggregate road accident data are used in this research. Information for each accident is collected by the Police and coded by the National Statistical Service of Greece. The System for ANalysis of TRaffic Accidents (SANTRA) developed by NTUA uses this national data file (DTPE 2002). This database contains all injury accidents, the related casualties, and the drivers involved for the period 1985 - 2007 (466.912 Injury Accidents and 1.073.162 Persons). The dataset used in this research includes all mopeds and motorcycle accidents reported for the period 2005 -2007 that account for 49.858% of the total accidents (24.147 of 48.432), cross-classified by type of area (inside and outside urban areas), junction type and other variables (SANTRA, 2007).
Further analyses will focus on both mopeds and motorcycles, as well as inside and outside urban areas in order to reveal differences and similarities between different types of PTW.
3.2.2. Interaction between Moped Accidents and Infrastructure in Greece
During the period 2005-2007, 2.421 moped accidents and 21.897 motorcycle accidents were observed. PTW accidents accounted for 51% of the total accidents observed in Greece. The following sections are dedicated to interactions between mopeds and road infrastructure with respect to accident type, area type, carriageway type, junction type, collision type, road geometry characteristics, pavement state and conditions, as well as combinations of the above. The next chapter refers to similar analysis of motorcycle accidents. Finally, moped and motorcycle fatalities are contrasted in a comparative framework with respect to carriageway type, junction type and road geometry.
3.2.2.1. Type of Accident by Carriageway type
Three types of moped accidents are considered:
• Accident between moped and other moving vehicles (mopeds, motorcycles, passenger cars and so on)
• Accident between moped and a pedestrian
• Accident between moped and a stationary vehicle or other object
The above accident types are examined with respect to the number of ways (directions) and carriageways; based on Greece national accident datasets three categories are identified:
• One way (one carriageway): One-way carriageways with one or more lanes. Entrance/exit roads also are considered.
• One way (two carriageways): Dual-carriageway roads with a minimum of two lanes in each direction, often separated by a median.
• Two ways: Single carriageway with at least one lane in each way (direction).
Four types of collision are considered: (a) Head-on, (b) Lateral (Head-on side), (c) At angle (Side) and (d) Rear end (Nose to tail). Table 1 provides the number and percentage of the total number of moped accidents with moving vehicles with respect to the collision type, as well as the carriageway type. As can be observed more than 1.500 moped accidents with other moving vehicles inside urban areas were observed in Greece, and this accounts for the 88% of the total number of moped accidents with moving vehicles observed in Greece (Table 1).
Most accidents occur on single carriageways with at least one lane in each way (direction) on both urban and interurban area (Table 1). On single carriageways with at least one lane in each way (direction), 70% of the accidents observed inside urban areas are lateral collisions, while, on one-way carriageways with one or more lanes, lateral crashes account for the 73% of the accidents in urban areas. For accidents outside urban areas, the percentages for lateral collisions in single carriages with

2-BE-SAFE D2 Road infrastructure and road safety for PTW
Document ID: 2BES_WP1_D2_RIandRSforPTW_Final.doc 24
at least one lane in each way and one-way carriageways with one or more lanes are 48% and 75% respectively. In total, lateral collisions account for 68% of crashes inside urban areas and the 47% of crashes outside urban areas. The proportion of rear end and head-on collisions outside urban areas is around twice the proportion inside urban areas. At angle crashes account for 20% and 26% in dual-carriageway roads with a minimum of two lanes in each direction, often separated by a median, inside and outside urban areas respectively.
Table 1: Accidents between mopeds and moving vehicles with respect to carriageway and collision type, Greece 2005-2007.
Collision Type
Carriageway Type
Head-on Lateral At angle Rear end Total
ONE (one carriage way) 1% 73% 17% 9% 300
ONE (two carriage way) 3% 59% 20% 17% 297
TWO 11% 70% 12% 8% 934 inside
urba
n area
Total 7% 68% 14% 10% 1.531
ONE (one carriage way) 0% 75% 0% 25% 4
ONE (two carriage way) 5% 37% 26% 32% 19
TWO 16% 48% 10% 27% 179 Outside
urba
n area
Total 14% 47% 11% 27% 202
Total 142 1142 240 208 1.733
Table 2 depicts the accidents between mopeds and pedestrians with respect to carriageway type. It is observed that, inside urban areas, 57% of crashes occur on single carriageways with at least one lane in each way (direction); outside urban areas, this percentage rises to 88% (although the numbers are small). Moreover, in one-way carriageways with one or more lanes, 24% of accidents account for accident between mopeds and pedestrians; no pedestrian accidents were reported outside urban areas on one-way carriageways with one or more lanes between 2005 and 2007.
Table 2: Accidents between mopeds and pedestrians with respect to carriageway type, Greece 2005-2007.
Carriageway Accidents %
ONE (one carriage way) 45 24%
ONE (two carriage way) 35 19%
TWO 106 57%
inside
urban
area
Total 186
ONE (one carriage way) 0 0%
ONE (two carriage way) 1 12%
TWO 7 88% outside
urba
n area
Total 8
Total 388
In Table 3, accidents and percentages of accidents between mopeds and stationary objects are presented considering both collision type and carriageway type. As can be observed, in total 46% of the accidents between stationary objects and mopeds are in urban areas, while the same type of accident with stationary element account for the 87% of the total accidents with stationary elements observed outside urban areas. Moreover, a high percentage of accidents in urban areas refer to collision with a parked vehicle (33%). Outside urban areas, the majority of moped accidents occur with an obstacle. The percentage of collisions with slow moving vehicles is around 6% in outside urban areas.
A more thorough look at the figures in Table 3 shows that in urban areas, 34% of accidents that occur on one-way carriageways with one or more lanes are collisions with a vehicle slowing/stopping/stationary, while the proportion is 33% on dual-carriageway roads with a minimum of two lanes in each direction, often separated by a median. Collision with an obstacle account for 32%

2-BE-SAFE D2 Road infrastructure and road safety for PTW
Document ID: 2BES_WP1_D2_RIandRSforPTW_Final.doc 25
of accidents with stationary elements in one-way carriageways with one or more lanes and the 43% in dual-carriageway roads with a minimum of two lanes in each direction, often separated by a median.
On single carriageway with at least one lane in each way (direction), 53% of accidents observed inside urban areas are related to collisions with an obstacle, while the same percentage rises to 87% for crashes observed outside urban areas.
Table 3: Accidents between mopeds and stationary vehicles or obstacles with respect to carriageway and collision with stationary object type, Greece 2005-2007.
Carriageway Type Collision with a vehicle
slowing/stopping/stationary Collision with a parked vehicle
Collision with an obstacle
Collision with a train
Total
ONE (one carriage way) 34% 34% 32% 0% 38
ONE (two carriage way) 33% 24% 43% 0% 21
TWO 10% 35% 53% 2% 91
inside
urban
area
Total 19% 33% 46% 1% 150
ONE (one carriage way) 0% 0% 0% 0% 0
ONE (two carriage way) 0% 0% 100% 0% 1
TWO 7% 7% 87% 0% 15 outside
urba
n area
Total 6% 6% 88% 0% 16
Total 30 51 83 2 166
Moreover, in outside urban areas no accidents with stationary objects were observed in the period 2005-2007 in one-way carriageways with one or more lanes. On dual-carriageway roads with a minimum of two lanes in each direction, often separated by a median, the only accident was a collision with an obstacle.
Table 4 depicts the number of moped accidents occurring without any kind of collision with respect to the carriageway type. Skidding is separated out in the tables as it is systematically observed in moped accidents both inside and outside urban areas. These accidents are much more frequent in single carriageway with at least one lane in each way (direction) [TWO] than on other road types.
Table 4: Mopeds accidents (single vehicle accidents) with respect to carriageway, Greece 2005-2007.
Carriageway Running off-road (skidding) % Other Total
ONE (one carriage way) 33 87% 5 38
ONE (two carriage way) 39 100% 0 39
TWO 140 91% 14 154
inside
urban
area
Total 212 92% 19 231
ONE (one carriage way) 5 100% 0 5
ONE (two carriage way) 2 68% 1 3
TWO 86 98% 2 88 outside
urba
n area
Total 93 97% 3 96
Total 305 22 327
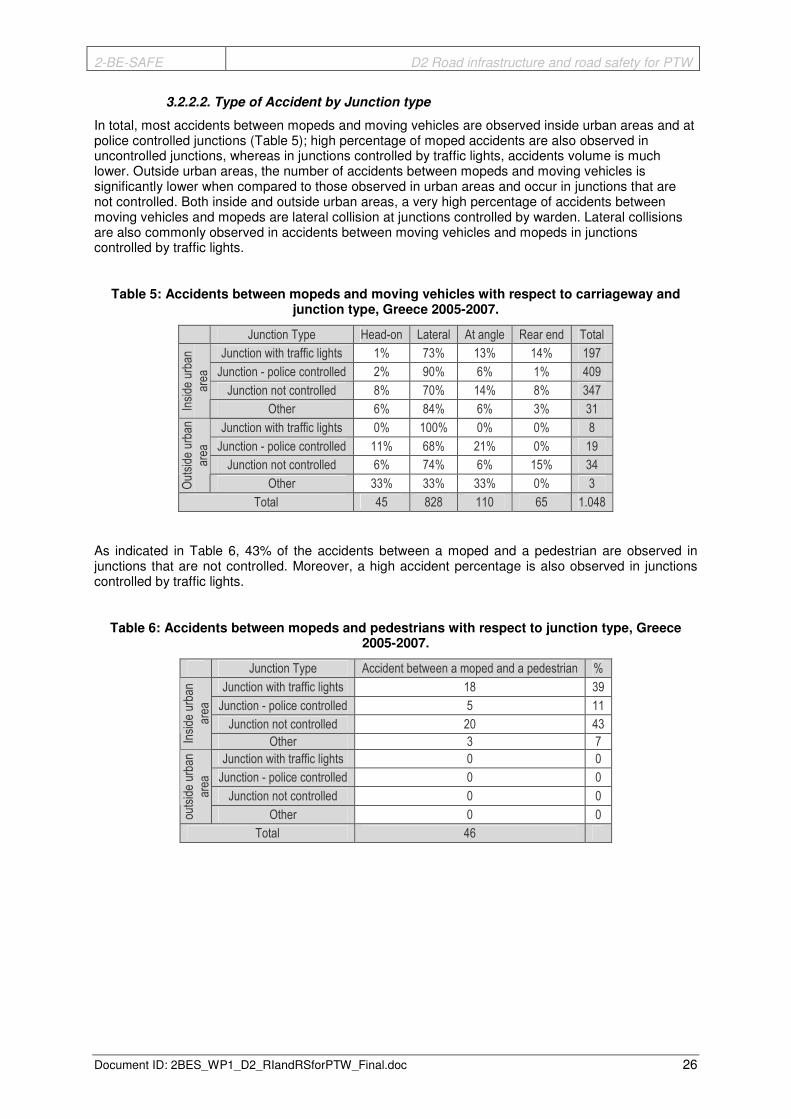
2-BE-SAFE D2 Road infrastructure and road safety for PTW
Document ID: 2BES_WP1_D2_RIandRSforPTW_Final.doc 26
3.2.2.2. Type of Accident by Junction type
In total, most accidents between mopeds and moving vehicles are observed inside urban areas and at police controlled junctions (Table 5); high percentage of moped accidents are also observed in uncontrolled junctions, whereas in junctions controlled by traffic lights, accidents volume is much lower. Outside urban areas, the number of accidents between mopeds and moving vehicles is significantly lower when compared to those observed in urban areas and occur in junctions that are not controlled. Both inside and outside urban areas, a very high percentage of accidents between moving vehicles and mopeds are lateral collision at junctions controlled by warden. Lateral collisions are also commonly observed in accidents between moving vehicles and mopeds in junctions controlled by traffic lights.
Table 5: Accidents between mopeds and moving vehicles with respect to carriageway and junction type, Greece 2005-2007.
Junction Type Head-on Lateral At angle Rear end Total
Junction with traffic lights 1% 73% 13% 14% 197
Junction - police controlled 2% 90% 6% 1% 409
Junction not controlled 8% 70% 14% 8% 347
Inside
urban
area
Other 6% 84% 6% 3% 31
Junction with traffic lights 0% 100% 0% 0% 8
Junction - police controlled 11% 68% 21% 0% 19
Junction not controlled 6% 74% 6% 15% 34
Outside
urban
area
Other 33% 33% 33% 0% 3
Total 45 828 110 65 1.048
As indicated in Table 6, 43% of the accidents between a moped and a pedestrian are observed in junctions that are not controlled. Moreover, a high accident percentage is also observed in junctions controlled by traffic lights.
Table 6: Accidents between mopeds and pedestrians with respect to junction type, Greece 2005-2007.
Junction Type Accident between a moped and a pedestrian %
Junction with traffic lights 18 39
Junction - police controlled 5 11
Junction not controlled 20 43
Inside
urban
area
Other 3 7
Junction with traffic lights 0 0
Junction - police controlled 0 0
Junction not controlled 0 0
outside urba
n
area
Other 0 0
Total 46

2-BE-SAFE D2 Road infrastructure and road safety for PTW
Document ID: 2BES_WP1_D2_RIandRSforPTW_Final.doc 27
Most moped collisions with an obstacle are observed at uncontrolled junctions inside urban areas (Table 7). Interestingly, only one moped accident with stationary objects outside urban areas was observed in the period 2005-2007 in Greece.
Table 7: Percentage of accidents between mopeds and stationary objects with respect to junction and collision type, Greece 2005-2007.
Collision with Stationary Element
Junction Type Collision with a vehicle
slowing/stopping/ stationary Collision with a parked vehicle
Collision with an obstacle
Collision with a train
Total
Junction with traffic lights 33% 33% 33% 0% 6
Junction - police controlled 50% 25% 25% 0% 8
Junction not controlled 9% 36% 55% 0% 22
Inside
urban
area
Other 0% 100% 0% 0% 1
Junction with traffic lights 0% 0% 0% 0% 0
Junction - police controlled 0% 0% 0% 0% 0
Junction not controlled 0% 0% 100% 0% 1
Outside
urban
area
Other 0% 0% 0% 0% 0
Total 8 13 17 0 38
As can be observed in Table 8, running off road single moped accidents are mostly observed in urban areas at uncontrolled junctions. Moreover, as seen in Table 9, a higher proportion of younger moped users between 15 and 34 years were involved in moped accidents. Outside urban areas, 50% of accidents involving mopeds involve persons of age between 25 and 34 years old at junctions controlled by traffic lights.
Table 8: Single moped accidents with respect to junction type, Greece 2005-2007.
Junction Type Running off-road (skidding) other Total
Junction with traffic lights 100% 0% 7
Junction - police controlled 100% 0% 7
Junction not controlled 93% 7% 29
Inside
urban
area
Other 100% 0% 2
Junction with traffic lights 0% 100% 4
Junction - police controlled 0% 100% 0
Junction not controlled 14% 86% 7 outside
urba
n area
Other 0% 100% 7
Total 49
Table 9: Mopeds accidents with respect to junction type and age of persons in moped, Greece 2005-2007.
Age of Persons on Moped
Junction Type
Unknown 15-24 25-34 35-44 45-54 55-64 65+ Total
Junction with traffic lights 7% 26% 24% 17% 12% 7% 6% 164
Junction - police controlled 7% 27% 20% 16% 12% 7% 11% 330
Junction not controlled 9% 28% 23% 17% 9% 8% 7% 310
Inside
urban
area
Other 7% 17% 23% 23% 10% 7% 13% 30
Junction with traffic lights 8% 17% 50% 8% 17% 0% 0% 12
Junction - police controlled 0% 20% 20% 30% 5% 0% 25% 20
Junction not controlled 6% 26% 17% 23% 6% 6% 17% 35 outside
urba
n area
Other 0% 29% 29% 0% 29% 14% 0% 7
Total 68 240 201 157 95 63 84 908
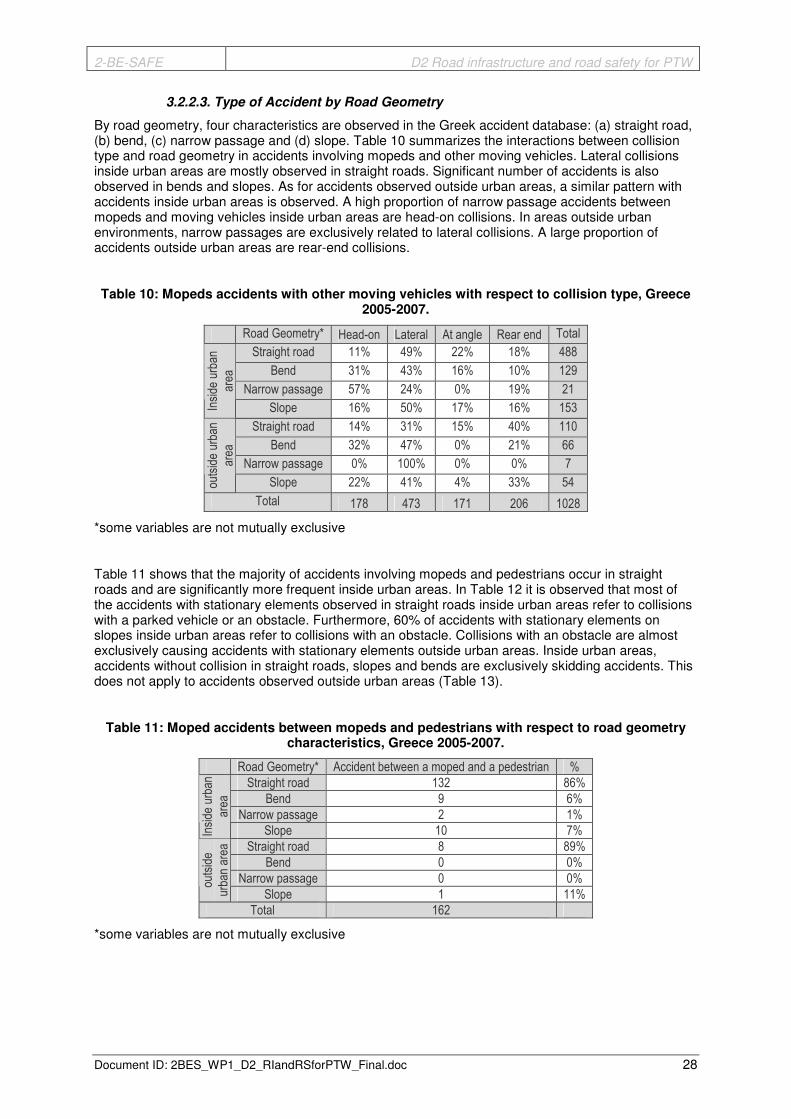
2-BE-SAFE D2 Road infrastructure and road safety for PTW
Document ID: 2BES_WP1_D2_RIandRSforPTW_Final.doc 28
3.2.2.3. Type of Accident by Road Geometry
By road geometry, four characteristics are observed in the Greek accident database: (a) straight road, (b) bend, (c) narrow passage and (d) slope. Table 10 summarizes the interactions between collision type and road geometry in accidents involving mopeds and other moving vehicles. Lateral collisions inside urban areas are mostly observed in straight roads. Significant number of accidents is also observed in bends and slopes. As for accidents observed outside urban areas, a similar pattern with accidents inside urban areas is observed. A high proportion of narrow passage accidents between mopeds and moving vehicles inside urban areas are head-on collisions. In areas outside urban environments, narrow passages are exclusively related to lateral collisions. A large proportion of accidents outside urban areas are rear-end collisions.
Table 10: Mopeds accidents with other moving vehicles with respect to collision type, Greece 2005-2007.
Road Geometry* Head-on Lateral At angle Rear end Total
Straight road 11% 49% 22% 18% 488
Bend 31% 43% 16% 10% 129
Narrow passage 57% 24% 0% 19% 21
Inside
urban
area
Slope 16% 50% 17% 16% 153
Straight road 14% 31% 15% 40% 110
Bend 32% 47% 0% 21% 66
Narrow passage 0% 100% 0% 0% 7
outside urba
n
area
Slope 22% 41% 4% 33% 54
Total 178 473 171 206 1028
*some variables are not mutually exclusive
Table 11 shows that the majority of accidents involving mopeds and pedestrians occur in straight roads and are significantly more frequent inside urban areas. In Table 12 it is observed that most of the accidents with stationary elements observed in straight roads inside urban areas refer to collisions with a parked vehicle or an obstacle. Furthermore, 60% of accidents with stationary elements on slopes inside urban areas refer to collisions with an obstacle. Collisions with an obstacle are almost exclusively causing accidents with stationary elements outside urban areas. Inside urban areas, accidents without collision in straight roads, slopes and bends are exclusively skidding accidents. This does not apply to accidents observed outside urban areas (Table 13).
Table 11: Moped accidents between mopeds and pedestrians with respect to road geometry characteristics, Greece 2005-2007.
Road Geometry* Accident between a moped and a pedestrian %
Straight road 132 86%
Bend 9 6%
Narrow passage 2 1%
Inside
urban
area
Slope 10 7%
Straight road 8 89%
Bend 0 0%
Narrow passage 0 0% outside
urba
n area
Slope 1 11%
Total 162
*some variables are not mutually exclusive

2-BE-SAFE D2 Road infrastructure and road safety for PTW
Document ID: 2BES_WP1_D2_RIandRSforPTW_Final.doc 29
Table 12: Percentage of accidents between mopeds and stationary vehicles or obstacles with respect to collision type at different road geometry characteristics, Greece 2005-2007.
Collision with Stationary Element
Road Geometry* Collision with a vehicle
slowing/stopping/ stationary Collision with a parked vehicle
Collision with an obstacle
Collision with a train
Total
Straight road 23% 36% 38% 2% 99
Bend 0% 0% 100% 0% 17
Narrow passage 25% 38% 38% 0% 8
Inside
urban
area
Slope 12% 28% 60% 0% 25
Straight road 9% 9% 82% 0% 11
Bend 0% 0% 100% 0% 6
Narrow passage 0% 0% 0% 0% 0 outside
urba
n area
Slope 0% 0% 100% 0% 6
Total 29 47 94 2 172
*some variables are not mutually exclusive
Table 13: Single mopeds accidents with respect to road geometry characteristics, Greece 2005-2007.
Road Geometry* running off-road (skidding) other total
Straight road 100% 0% 7
Bend 100% 0% 7
Narrow passage 93% 7% 29
Inside
urban
area
Slope 100% 0% 2
Straight road 0% 100% 4
Bend 0% 100% 0
Narrow passage 14% 86% 7 outside
urba
n area
Slope 0% 100% 7
Total 356 24 380
*some variables are not mutually exclusive
Moreover, the majority of running-off accidents in urban areas is observed in narrow passages (Table 13). Outside urban areas, the largest proportion of running-off accidents is observed in both narrow passages and slopes.
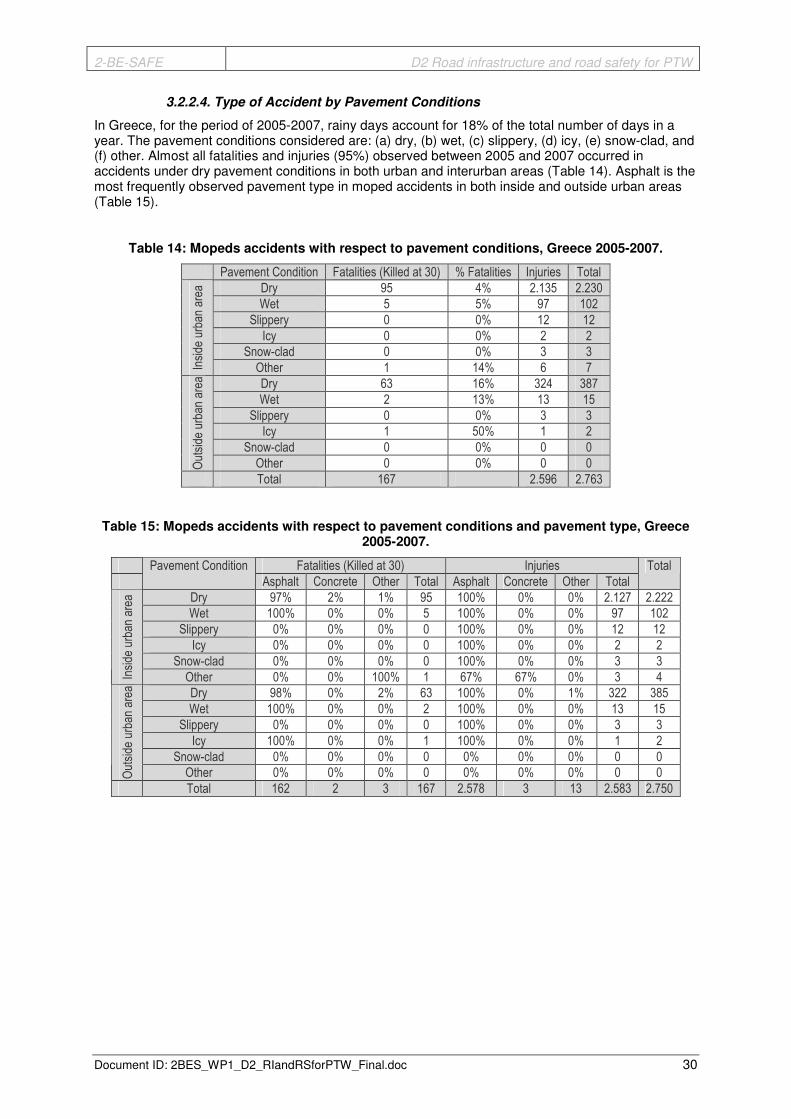
2-BE-SAFE D2 Road infrastructure and road safety for PTW
Document ID: 2BES_WP1_D2_RIandRSforPTW_Final.doc 30
3.2.2.4. Type of Accident by Pavement Conditions
In Greece, for the period of 2005-2007, rainy days account for 18% of the total number of days in a year. The pavement conditions considered are: (a) dry, (b) wet, (c) slippery, (d) icy, (e) snow-clad, and (f) other. Almost all fatalities and injuries (95%) observed between 2005 and 2007 occurred in accidents under dry pavement conditions in both urban and interurban areas (Table 14). Asphalt is the most frequently observed pavement type in moped accidents in both inside and outside urban areas (Table 15).
Table 14: Mopeds accidents with respect to pavement conditions, Greece 2005-2007.
Pavement Condition Fatalities (Killed at 30) % Fatalities Injuries Total
Dry 95 4% 2.135 2.230
Wet 5 5% 97 102
Slippery 0 0% 12 12
Icy 0 0% 2 2
Snow-clad 0 0% 3 3
Inside
urban
area
Other 1 14% 6 7
Dry 63 16% 324 387
Wet 2 13% 13 15
Slippery 0 0% 3 3
Icy 1 50% 1 2
Snow-clad 0 0% 0 0
Outside
urban
area
Other 0 0% 0 0
Total 167 2.596 2.763
Table 15: Mopeds accidents with respect to pavement conditions and pavement type, Greece 2005-2007.
Fatalities (Killed at 30) Injuries
Pavement Condition
Asphalt Concrete Other Total Asphalt Concrete Other Total
Total
Dry 97% 2% 1% 95 100% 0% 0% 2.127 2.222
Wet 100% 0% 0% 5 100% 0% 0% 97 102
Slippery 0% 0% 0% 0 100% 0% 0% 12 12
Icy 0% 0% 0% 0 100% 0% 0% 2 2
Snow-clad 0% 0% 0% 0 100% 0% 0% 3 3
Inside
urban
area
Other 0% 0% 100% 1 67% 67% 0% 3 4
Dry 98% 0% 2% 63 100% 0% 1% 322 385
Wet 100% 0% 0% 2 100% 0% 0% 13 15
Slippery 0% 0% 0% 0 100% 0% 0% 3 3
Icy 100% 0% 0% 1 100% 0% 0% 1 2
Snow-clad 0% 0% 0% 0 0% 0% 0% 0 0
Outside
urban
area
Other 0% 0% 0% 0 0% 0% 0% 0 0
Total 162 2 3 167 2.578 3 13 2.583 2.750

2-BE-SAFE D2 Road infrastructure and road safety for PTW
Document ID: 2BES_WP1_D2_RIandRSforPTW_Final.doc 31
3.2.3. Interaction between Motorcycle Accidents and Infrastructure in Greece
3.2.3.1. Type of Accident by Carriageway type
Table 16 provides the percentage of the total number of motorcycle accidents with moving vehicles with respect to the collision type, as well as the carriageway type. As can be observed, more than 14.500 motorcycle accidents with other moving vehicles inside urban areas were observed in Greece and that accounts for 90% of the total number of motorcycle accidents with moving vehicles observed in Greece (Table 16).
From the total number of accidents, more than 9% of accidents on single carriageway with at least one lane in each way (direction) are head on collisions, regardless of the type of area (Table 16). In single carriageways with at least one lane in each way (direction), 68% of the accidents observed inside urban areas are lateral collisions, while 69% of the accidents are observed in one-way carriageways with one or more lanes. For accidents outside urban areas, the percentages for lateral collisions in single carriages with at least one lane in each way and one-way carriageways with one or more lanes are 46% and 43% respectively. Moreover, the proportions of rear end and head-on collisions are significantly greater outside urban areas when compared to accidents inside urban areas. Angle crashes make up the 25% and 29% of accidents on dual-carriageway roads with a minimum of two lanes in each direction, often separated by a median inside and outside urban areas respectively.
In total, lateral collisions account for the 65% of crashes inside urban areas and the 45% of crashes outside urban areas. These figures are lower than the case of moped accidents with moving vehicles.
Table 16: Accidents between motorcycles and moving vehicles with respect to carriageway and collision type, Greece 2005-2007.
Collision Type
Carriageway Type
Head-on Lateral At angle Rear end Total
ONE (one carriage way) 3% 69% 19% 9% 2.949
ONE (two carriage way) 2% 56% 25% 17% 3.958
TWO 9% 68% 14% 8% 7.635 inside
urba
n area
Total 6% 65% 18% 11% 14.542
ONE (one carriage way) 23% 43% 20% 14% 35
ONE (two carriage way) 3% 42% 29% 26% 198
TWO 13% 46% 17% 24% 1.313 Outside
urba
n area
Total 12% 45% 19% 24% 1.546
Total 1.011 10.165 2.958 1.954 16.088
Table 17 depicts the accidents between motorcycles and pedestrians with respect to carriageway and collision type. It is observed that, inside urban areas, 46% of crashes occur on single carriageways with at least one lane in each way (direction); outside urban areas, this percentage rises to 84%.
Moreover, 22% of accidents on one-way carriageways with one or more lanes account for accident between motorcycles and pedestrians; a small percent of pedestrian accidents are observed outside urban areas in one-way carriageways with one or more lanes.
Table 17: Accidents between motorcycles and pedestrians with respect to carriageway type, Greece 2005-2007.
Carriageway Type Accidents %
ONE (one carriage way) 445 22%
ONE (two carriage way) 645 32%
TWO 941 46%
inside
urban
area
total 2.031
ONE (one carriage way) 1 2%
ONE (two carriage way) 8 15%
TWO 46 84% outside
urba
n area
Total 55
Total 2.086
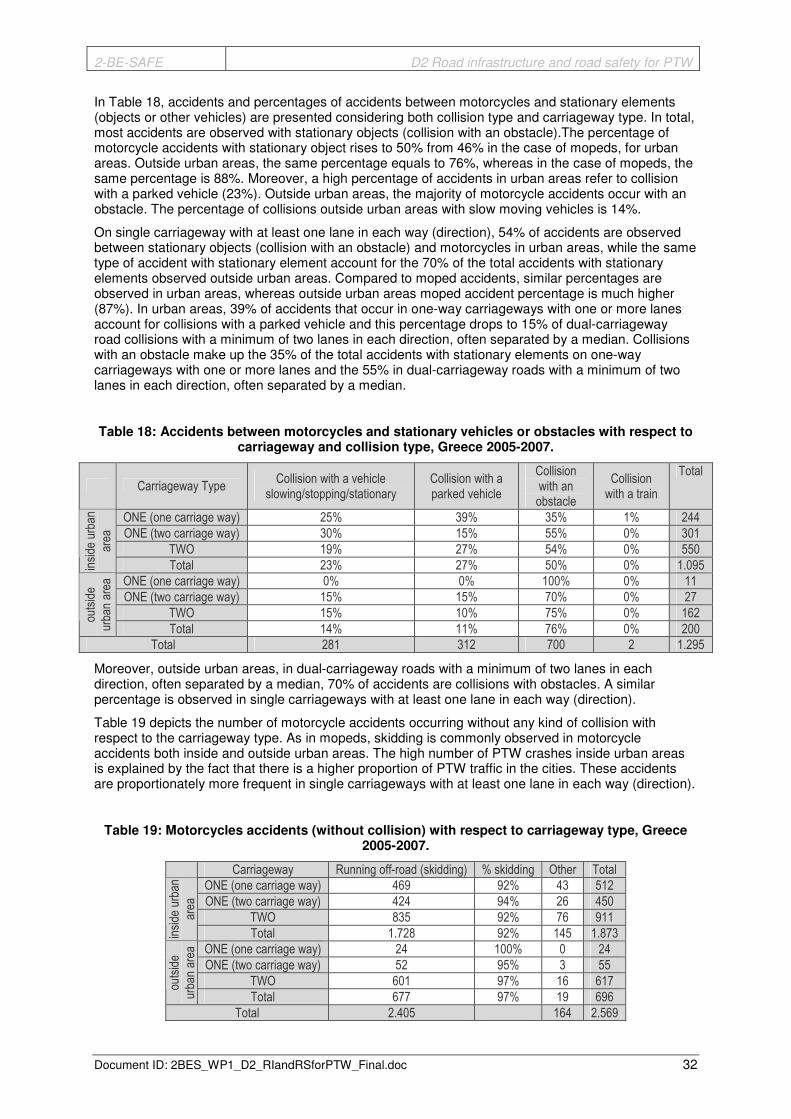
2-BE-SAFE D2 Road infrastructure and road safety for PTW
Document ID: 2BES_WP1_D2_RIandRSforPTW_Final.doc 32
In Table 18, accidents and percentages of accidents between motorcycles and stationary elements (objects or other vehicles) are presented considering both collision type and carriageway type. In total, most accidents are observed with stationary objects (collision with an obstacle).The percentage of motorcycle accidents with stationary object rises to 50% from 46% in the case of mopeds, for urban areas. Outside urban areas, the same percentage equals to 76%, whereas in the case of mopeds, the same percentage is 88%. Moreover, a high percentage of accidents in urban areas refer to collision with a parked vehicle (23%). Outside urban areas, the majority of motorcycle accidents occur with an obstacle. The percentage of collisions outside urban areas with slow moving vehicles is 14%.
On single carriageway with at least one lane in each way (direction), 54% of accidents are observed between stationary objects (collision with an obstacle) and motorcycles in urban areas, while the same type of accident with stationary element account for the 70% of the total accidents with stationary elements observed outside urban areas. Compared to moped accidents, similar percentages are observed in urban areas, whereas outside urban areas moped accident percentage is much higher (87%). In urban areas, 39% of accidents that occur in one-way carriageways with one or more lanes account for collisions with a parked vehicle and this percentage drops to 15% of dual-carriageway road collisions with a minimum of two lanes in each direction, often separated by a median. Collisions with an obstacle make up the 35% of the total accidents with stationary elements on one-way carriageways with one or more lanes and the 55% in dual-carriageway roads with a minimum of two lanes in each direction, often separated by a median.
Table 18: Accidents between motorcycles and stationary vehicles or obstacles with respect to carriageway and collision type, Greece 2005-2007.
Carriageway Type Collision with a vehicle
slowing/stopping/stationary Collision with a parked vehicle
Collision with an obstacle
Collision with a train
Total
ONE (one carriage way) 25% 39% 35% 1% 244
ONE (two carriage way) 30% 15% 55% 0% 301
TWO 19% 27% 54% 0% 550
inside
urban
area
Total 23% 27% 50% 0% 1.095
ONE (one carriage way) 0% 0% 100% 0% 11
ONE (two carriage way) 15% 15% 70% 0% 27
TWO 15% 10% 75% 0% 162 outside
urba
n area
Total 14% 11% 76% 0% 200
Total 281 312 700 2 1.295
Moreover, outside urban areas, in dual-carriageway roads with a minimum of two lanes in each direction, often separated by a median, 70% of accidents are collisions with obstacles. A similar percentage is observed in single carriageways with at least one lane in each way (direction).
Table 19 depicts the number of motorcycle accidents occurring without any kind of collision with respect to the carriageway type. As in mopeds, skidding is commonly observed in motorcycle accidents both inside and outside urban areas. The high number of PTW crashes inside urban areas is explained by the fact that there is a higher proportion of PTW traffic in the cities. These accidents are proportionately more frequent in single carriageways with at least one lane in each way (direction).
Table 19: Motorcycles accidents (without collision) with respect to carriageway type, Greece 2005-2007.
Carriageway Running off-road (skidding) % skidding Other Total
ONE (one carriage way) 469 92% 43 512
ONE (two carriage way) 424 94% 26 450
TWO 835 92% 76 911
inside
urban
area
Total 1.728 92% 145 1.873
ONE (one carriage way) 24 100% 0 24
ONE (two carriage way) 52 95% 3 55
TWO 601 97% 16 617 outside
urba
n area
Total 677 97% 19 696
Total 2.405 164 2.569

2-BE-SAFE D2 Road infrastructure and road safety for PTW
Document ID: 2BES_WP1_D2_RIandRSforPTW_Final.doc 33
3.2.3.2. Type of Accident by Junction type
In total, a majority of accidents between motorcycles and moving vehicles, as in the case of mopeds, are observed inside urban areas and at police controlled or not controlled junctions (Table 20). Outside urban areas the number of accidents involving motorcycles is significantly lower and they occur at junctions that are not controlled. Both inside and outside urban areas, a very high percentage of accidents between moving vehicles and motorcycles refer to lateral collisions at police controlled junctions. Lateral collisions are frequently observed in accidents between moving vehicles and motorcycles in junctions controlled by traffic lights and other situations.
Inside urban areas, as indicated in Table 21, 54% of the accidents between a motorcycle and a pedestrian are observed in junctions that are not controlled. A high accident percentage is also observed in junctions controlled by traffic lights. Outside urban areas, accidents between a motorcycle and a pedestrian are observed in junctions that are not controlled account for the 86% of the total accidents observed between motorcycles and pedestrians (Table 21) although the total number of accidents between pedestrians outside urban areas is small.
Table 20: Accidents between motorcycles and moving vehicles with respect to junction type and collision type, Greece 2005-2007.
Junction Type Head-on Lateral At angle Rear end Total
Junction with traffic lights 3% 70% 19% 9% 2.374
Junction - police controlled 2% 88% 8% 2% 3.152
Junction not controlled 6% 67% 18% 9% 3.100
Inside
urban
area
Other 7% 73% 12% 7% 181
Junction with traffic lights 5% 64% 16% 15% 55
Junction - police controlled 2% 87% 7% 4% 92
Junction not controlled 8% 64% 17% 11% 158
outside urba
n
area
Other 4% 70% 4% 22% 23
Total 337 6.876 1.323 599 9.135
Table 21: Accidents between motorcycles and pedestrians with respect to junction type, Greece 2005-2007.
Junction Type accident between a moped and a pedestrian %
Junction with traffic lights 251 39%
Junction - police controlled 26 4%
Junction not controlled 347 54%
Inside
urban
area
Other 16 3%
Junction with traffic lights 1 14%
Junction - police controlled 0 0%
Junction not controlled 6 86%
outside urba
n
area
Other 0 0%
Total 647
Most motorcycle accidents accounting for collisions with an obstacle are observed in uncontrolled junctions inside urban areas (Table 22). The number of motorcycle accidents with stationary elements outside urban areas is significantly lower than accidents occurring inside urban areas for the period 2005-2007 in Greece.
As can be observed in Table 23 as in the case of mopeds, the majority of single motorcycle accident inside urban areas are running off road accidents. The opposite occurs outside urban areas.
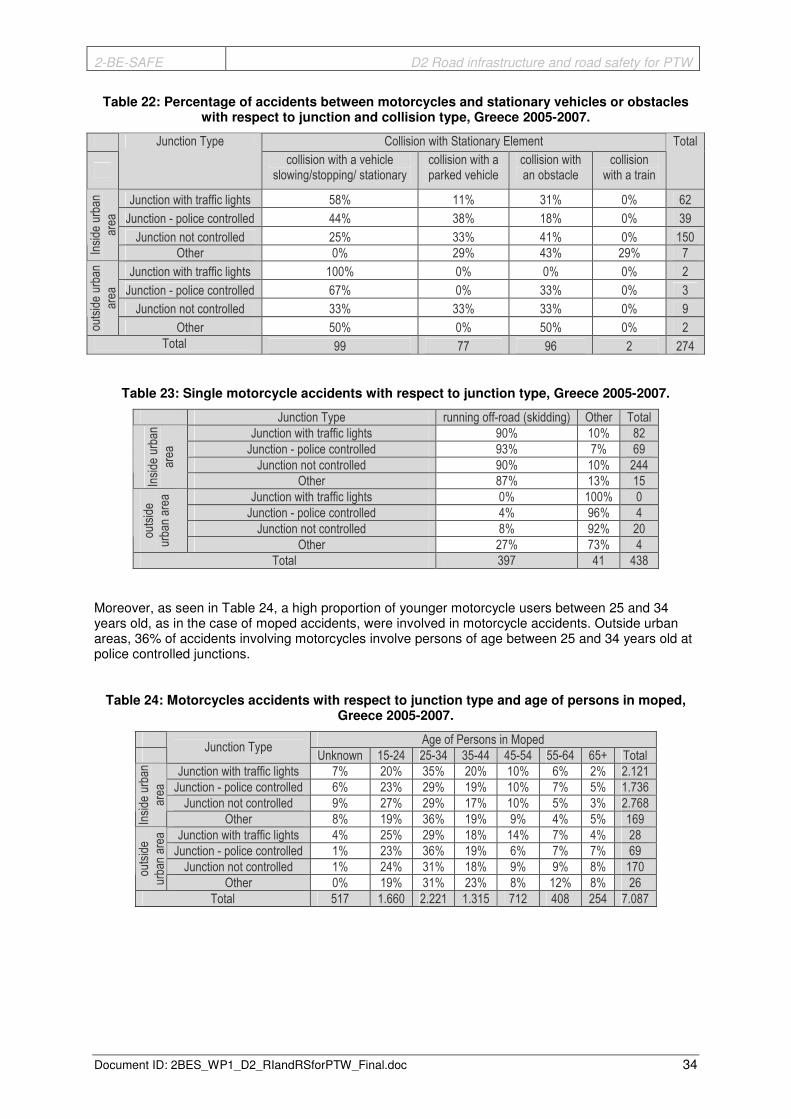
2-BE-SAFE D2 Road infrastructure and road safety for PTW
Document ID: 2BES_WP1_D2_RIandRSforPTW_Final.doc 34
Table 22: Percentage of accidents between motorcycles and stationary vehicles or obstacles with respect to junction and collision type, Greece 2005-2007.
Collision with Stationary Element
Junction Type
collision with a vehicle slowing/stopping/ stationary
collision with a parked vehicle
collision with an obstacle
collision with a train
Total
Junction with traffic lights 58% 11% 31% 0% 62
Junction - police controlled 44% 38% 18% 0% 39
Junction not controlled 25% 33% 41% 0% 150
Inside
urban
area
Other 0% 29% 43% 29% 7
Junction with traffic lights 100% 0% 0% 0% 2
Junction - police controlled 67% 0% 33% 0% 3
Junction not controlled 33% 33% 33% 0% 9
outside urba
n
area
Other 50% 0% 50% 0% 2
Total 99 77 96 2 274
Table 23: Single motorcycle accidents with respect to junction type, Greece 2005-2007.
Junction Type running off-road (skidding) Other Total
Junction with traffic lights 90% 10% 82
Junction - police controlled 93% 7% 69
Junction not controlled 90% 10% 244
Inside
urban
area
Other 87% 13% 15
Junction with traffic lights 0% 100% 0
Junction - police controlled 4% 96% 4
Junction not controlled 8% 92% 20 outside
urba
n area
Other 27% 73% 4
Total 397 41 438
Moreover, as seen in Table 24, a high proportion of younger motorcycle users between 25 and 34 years old, as in the case of moped accidents, were involved in motorcycle accidents. Outside urban areas, 36% of accidents involving motorcycles involve persons of age between 25 and 34 years old at police controlled junctions.
Table 24: Motorcycles accidents with respect to junction type and age of persons in moped, Greece 2005-2007.
Age of Persons in Moped
Junction Type
Unknown 15-24 25-34 35-44 45-54 55-64 65+ Total
Junction with traffic lights 7% 20% 35% 20% 10% 6% 2% 2.121
Junction - police controlled 6% 23% 29% 19% 10% 7% 5% 1.736
Junction not controlled 9% 27% 29% 17% 10% 5% 3% 2.768
Inside
urban
area
Other 8% 19% 36% 19% 9% 4% 5% 169
Junction with traffic lights 4% 25% 29% 18% 14% 7% 4% 28
Junction - police controlled 1% 23% 36% 19% 6% 7% 7% 69
Junction not controlled 1% 24% 31% 18% 9% 9% 8% 170 outside
urba
n area
Other 0% 19% 31% 23% 8% 12% 8% 26
Total 517 1.660 2.221 1.315 712 408 254 7.087

2-BE-SAFE D2 Road infrastructure and road safety for PTW
Document ID: 2BES_WP1_D2_RIandRSforPTW_Final.doc 35
3.2.3.3. Type of Accident by Road Geometry
Table 25 summarizes the interactions between collision type and road geometry in accidents involving motorcycles and other moving vehicles. Inside urban areas, on straight roads, the majority of collisions are lateral ones. Lateral collisions inside urban areas are mostly observed in straight roads; in urban areas lateral collisions account for the 50% of the total accidents observed in straight roads. Significant number of accidents is also observed in bends and slopes. As for accidents observed outside urban areas, a similar pattern with accidents inside urban areas is observed. Moreover, 28% of narrow passage accidents between motorcycles and moving vehicles inside urban areas are head-on collision. In areas outside urban environments, narrow passages are also strongly related to lateral collisions.
Table 25: Motorcycles accidents with other moving vehicles with respect to collision type and road geometry characteristics, Greece 2005-2007.
Road Geometry* Head-on Lateral At angle Rear end Total
Straight road 8% 50% 24% 18% 5.183
Bend 20% 43% 25% 11% 541
Narrow passage 28% 42% 18% 12% 93
Inside
urban
area
Slope 15% 51% 19% 15% 583
Straight road 9% 37% 21% 33% 881
Bend 26% 42% 18% 14% 333
Narrow passage 38% 43% 10% 10% 21 outside
urba
n area
Slope 15% 38% 24% 22% 221
*some variables are not mutually exclusive
Table 26 shows that the majority of accidents involving motorcycles and pedestrians occur in straight roads and are significantly more frequent inside urban areas. In both areas, apart from straight roads, significant percentages of accidents are traced in road bends and slopes.
In Table 27 it is observed that most of the accidents with stationary elements observed in straight roads inside urban areas refer to collisions with an obstacle. 61% of accidents with stationary elements at slopes inside urban areas refer to collisions with an obstacle. Many of the accidents with stationary elements, outside urban areas are collisions with an obstacle. Skidding is almost exclusively observed in accidents without collision regardless of geometry. This applies to accidents observed both inside and outside urban areas (Table 28). Motorcycle accidents without collision, outside urban areas, differ from those of mopeds, in that the latter are not related to skidding.
Table 26: Motorcycles accidents between motorcycles and pedestrians with respect to road geometry characteristics, Greece 2005-2007.
Road Geometry* Accident between a motorcycles and a pedestrians %
Straight road 1.339 89%
Bend 51 3%
Narrow passage 12 1%
Inside
urban
area
Slope 105 7%
Straight road 40 69%
Bend 8 14%
Narrow passage 1 2% outside
urba
n area
Slope 9 16%
Total 1.565
*some variables are not mutually exclusive

2-BE-SAFE D2 Road infrastructure and road safety for PTW
Document ID: 2BES_WP1_D2_RIandRSforPTW_Final.doc 36
Table 27: Percentage of accidents between motorcycles and stationary vehicles or obstacles with respect to collision type at different road geometry characteristics, Greece 2005-2007.
Collision with Stationary Element
Road Geometry* Collision with a vehicle
slowing/stopping/ stationary Collision with a parked vehicle
Collision with an obstacle
Collision with a train
total
Straight road 24% 29% 48% 0% 645
Bend 4% 17% 79% 0% 192
Narrow passage 9% 18% 73% 0% 22
Inside
urban
area
Slope 18% 20% 61% 0% 98
Straight road 20% 14% 67% 0% 87
Bend 3% 6% 90% 0% 94
Narrow passage 0% 0% 0% 0% 4 outside
urba
n area
Slope 7% 11% 83% 0% 46
Total 205 264 719 0 1.188
*some variables are not mutually exclusive
Table 28: Motorcycles accidents (without collision) with respect to road geometry characteristics, Greece 2005-2007.
Road Geometry* Running off-road (skidding) Other Total
Straight road 90% 10% 966
Bend 97% 3% 345
Narrow passage 93% 7% 28
Inside
urban
area
Slope 94% 6% 195
Straight road 98% 2% 330
Bend 92% 8% 346
Narrow passage 100% 0% 21 outside
urba
n area
Slope 97% 3% 202
Total 2.295 138 2.433
*some variables are not mutually exclusive
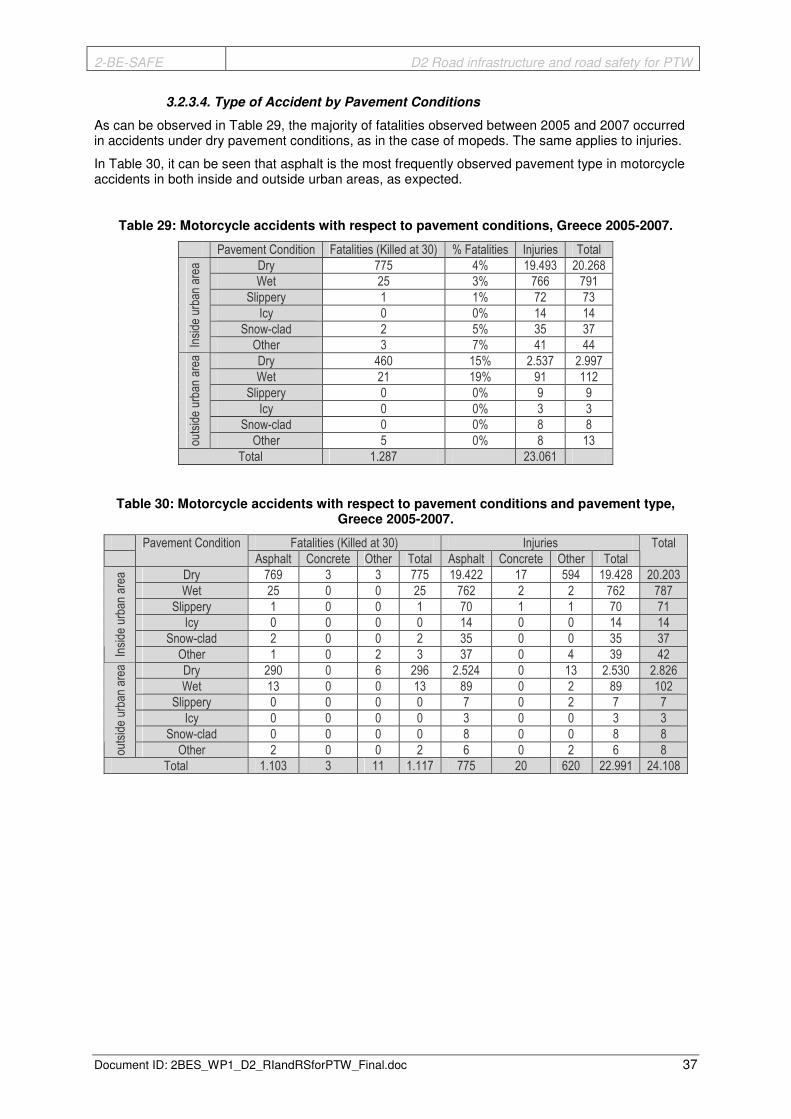
2-BE-SAFE D2 Road infrastructure and road safety for PTW
Document ID: 2BES_WP1_D2_RIandRSforPTW_Final.doc 37
3.2.3.4. Type of Accident by Pavement Conditions
As can be observed in Table 29, the majority of fatalities observed between 2005 and 2007 occurred in accidents under dry pavement conditions, as in the case of mopeds. The same applies to injuries.
In Table 30, it can be seen that asphalt is the most frequently observed pavement type in motorcycle accidents in both inside and outside urban areas, as expected.
Table 29: Motorcycle accidents with respect to pavement conditions, Greece 2005-2007.
Pavement Condition Fatalities (Killed at 30) % Fatalities Injuries Total
Dry 775 4% 19.493 20.268
Wet 25 3% 766 791
Slippery 1 1% 72 73
Icy 0 0% 14 14
Snow-clad 2 5% 35 37
Inside
urban
area
Other 3 7% 41 44
Dry 460 15% 2.537 2.997
Wet 21 19% 91 112
Slippery 0 0% 9 9
Icy 0 0% 3 3
Snow-clad 0 0% 8 8
outside urba
n area
Other 5 0% 8 13
Total 1.287 23.061
Table 30: Motorcycle accidents with respect to pavement conditions and pavement type, Greece 2005-2007.
Fatalities (Killed at 30) Injuries
Pavement Condition
Asphalt Concrete Other Total Asphalt Concrete Other Total
Total
Dry 769 3 3 775 19.422 17 594 19.428 20.203
Wet 25 0 0 25 762 2 2 762 787
Slippery 1 0 0 1 70 1 1 70 71
Icy 0 0 0 0 14 0 0 14 14
Snow-clad 2 0 0 2 35 0 0 35 37
Inside
urban
area
Other 1 0 2 3 37 0 4 39 42
Dry 290 0 6 296 2.524 0 13 2.530 2.826
Wet 13 0 0 13 89 0 2 89 102
Slippery 0 0 0 0 7 0 2 7 7
Icy 0 0 0 0 3 0 0 3 3
Snow-clad 0 0 0 0 8 0 0 8 8
outside urba
n area
Other 2 0 0 2 6 0 2 6 8
Total 1.103 3 11 1.117 775 20 620 22.991 24.108
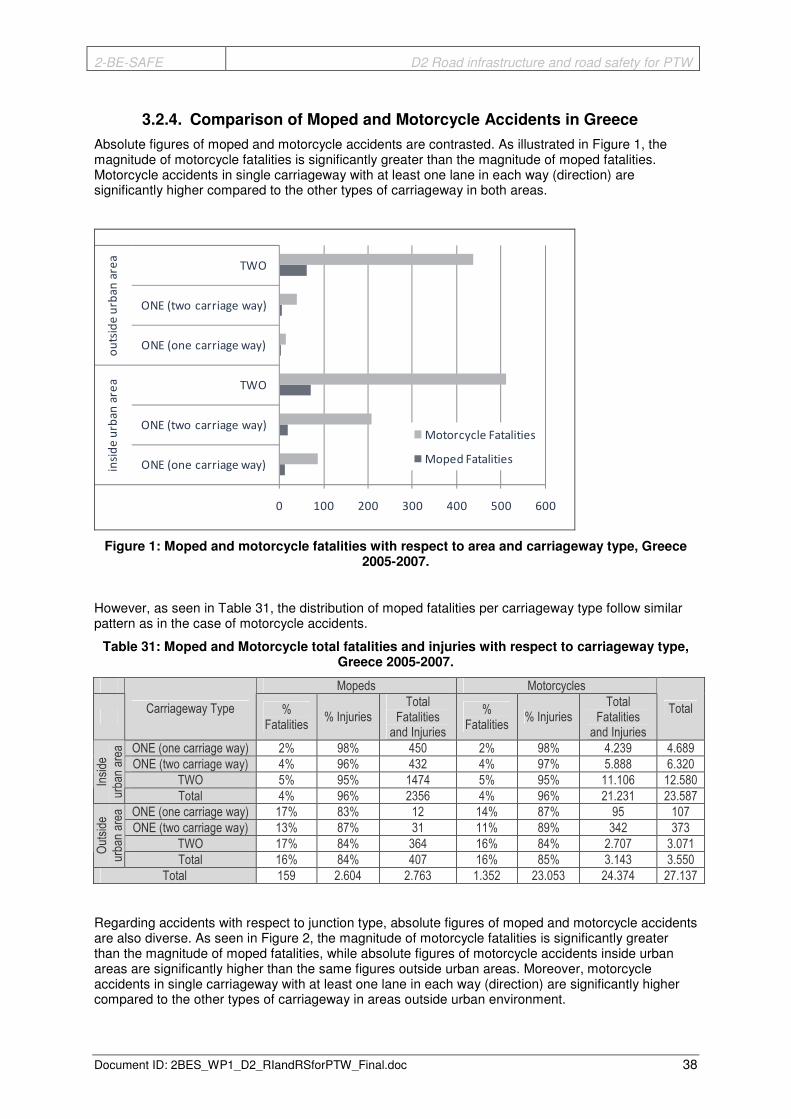
2-BE-SAFE D2 Road infrastructure and road safety for PTW
Document ID: 2BES_WP1_D2_RIandRSforPTW_Final.doc 38
3.2.4. Comparison of Moped and Motorcycle Accidents in Greece
Absolute figures of moped and motorcycle accidents are contrasted. As illustrated in Figure 1, the magnitude of motorcycle fatalities is significantly greater than the magnitude of moped fatalities. Motorcycle accidents in single carriageway with at least one lane in each way (direction) are significantly higher compared to the other types of carriageway in both areas.
0 100 200 300 400 500 600
ONE (one carriage way)
ONE (two carriage way)
TWO
ONE (one carriage way)
ONE (two carriage way)
TWO
insi
de
urb
an
are
ao
uts
ide
urb
an
are
a
Motorcycle Fatalities
Moped Fatalities
Figure 1: Moped and motorcycle fatalities with respect to area and carriageway type, Greece 2005-2007.
However, as seen in Table 31, the distribution of moped fatalities per carriageway type follow similar pattern as in the case of motorcycle accidents.
Table 31: Moped and Motorcycle total fatalities and injuries with respect to carriageway type, Greece 2005-2007.
Mopeds Motorcycles
Carriageway Type %
Fatalities % Injuries
Total Fatalities
and Injuries
% Fatalities
% Injuries Total
Fatalities and Injuries
Total
ONE (one carriage way) 2% 98% 450 2% 98% 4.239 4.689
ONE (two carriage way) 4% 96% 432 4% 97% 5.888 6.320
TWO 5% 95% 1474 5% 95% 11.106 12.580 Inside
urba
n area
Total 4% 96% 2356 4% 96% 21.231 23.587
ONE (one carriage way) 17% 83% 12 14% 87% 95 107
ONE (two carriage way) 13% 87% 31 11% 89% 342 373
TWO 17% 84% 364 16% 84% 2.707 3.071 Outside
urba
n area
Total 16% 84% 407 16% 85% 3.143 3.550
Total 159 2.604 2.763 1.352 23.053 24.374 27.137
Regarding accidents with respect to junction type, absolute figures of moped and motorcycle accidents are also diverse. As seen in Figure 2, the magnitude of motorcycle fatalities is significantly greater than the magnitude of moped fatalities, while absolute figures of motorcycle accidents inside urban areas are significantly higher than the same figures outside urban areas. Moreover, motorcycle accidents in single carriageway with at least one lane in each way (direction) are significantly higher compared to the other types of carriageway in areas outside urban environment.

2-BE-SAFE D2 Road infrastructure and road safety for PTW
Document ID: 2BES_WP1_D2_RIandRSforPTW_Final.doc 39
0 20 40 60 80 100 120
junction indicated by a traffic light
junction indicated by a warden
Junction non indicated
other
junction with traffic lights
junction - police controlled
Junction not controlled
other
insi
de
urb
an
are
ao
uts
ide
urb
an
are
a Motorcycle Fatalities
Moped Fatalities
Figure 2: Moped and motorcycle fatalities with respect to area and junction type, Greece 2005-2007.
Moreover, at not controlled junctions outside urban areas, similar percentages for fatalities and injuries are observed for motorcycles and mopeds; the accident severity is similar for mopeds and motorcycles at junctions outside urban areas that are not controlled (Table 32).
Table 32: Moped and Motorcycle total fatalities and injuries with respect to junction type, Greece 2005-2007.
Mopeds Motorcycles
Junction Type
% Fatalities
% Injuries Total
Fatalities and Injuries
% Fatalities
% Injuries Total
Fatalities and Injuries
Total
Junction with traffic lights 2% 98% 248 2% 98% 3.123 3.371
Junction - police controlled 3% 97% 501 2% 98% 3.840 4.341
Junction not controlled 3% 97% 477 3% 97% 4.145 4.622 Inside
urba
n area
Other 6% 94% 51 3% 97% 256 307
Junction with traffic lights 8% 92% 12 8% 92% 70 82
Junction - police controlled 4% 96% 23 10% 90% 129 152
Junction not controlled 20% 80% 49 17% 84% 240 289 Outside
urba
n area
Other 0% 100% 4 16% 84% 36 40
Total 50 1.315 1.365 311 11.528 11.839 13.204
The magnitude of motorcycle fatalities is significantly greater than the magnitude of moped fatalities in hump or narrow passages in both urban and outside urban areas. Motorcycle fatalities are greater in bends inside urban areas when compared to moped fatalities (Figure 3).
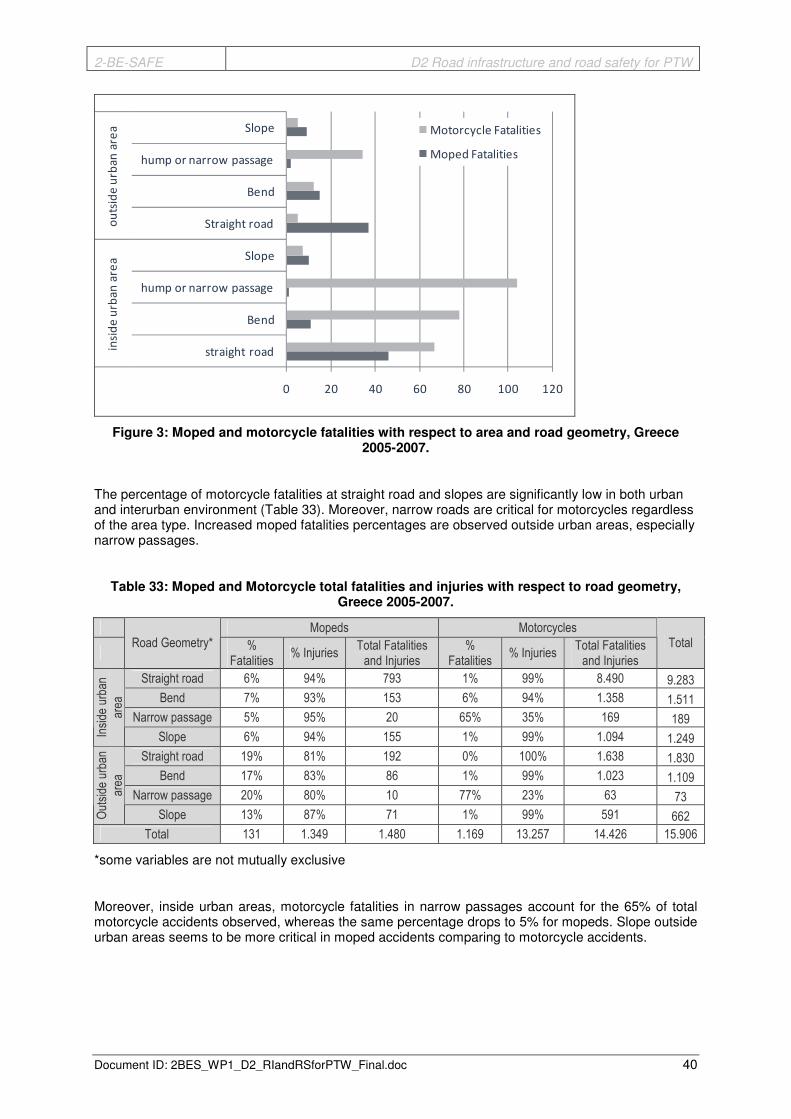
2-BE-SAFE D2 Road infrastructure and road safety for PTW
Document ID: 2BES_WP1_D2_RIandRSforPTW_Final.doc 40
0 20 40 60 80 100 120
straight road
Bend
hump or narrow passage
Slope
Straight road
Bend
hump or narrow passage
Slope
insi
de
urb
an
are
ao
uts
ide
urb
an
are
a Motorcycle Fatalities
Moped Fatalities
Figure 3: Moped and motorcycle fatalities with respect to area and road geometry, Greece 2005-2007.
The percentage of motorcycle fatalities at straight road and slopes are significantly low in both urban and interurban environment (Table 33). Moreover, narrow roads are critical for motorcycles regardless of the area type. Increased moped fatalities percentages are observed outside urban areas, especially narrow passages.
Table 33: Moped and Motorcycle total fatalities and injuries with respect to road geometry, Greece 2005-2007.
Mopeds Motorcycles
Road Geometry* %
Fatalities % Injuries
Total Fatalities and Injuries
% Fatalities
% Injuries Total Fatalities and Injuries
Total
Straight road 6% 94% 793 1% 99% 8.490 9.283
Bend 7% 93% 153 6% 94% 1.358 1.511
Narrow passage 5% 95% 20 65% 35% 169 189
Inside
urban
area
Slope 6% 94% 155 1% 99% 1.094 1.249
Straight road 19% 81% 192 0% 100% 1.638 1.830
Bend 17% 83% 86 1% 99% 1.023 1.109
Narrow passage 20% 80% 10 77% 23% 63 73
Outside
urban
area
Slope 13% 87% 71 1% 99% 591 662
Total 131 1.349 1.480 1.169 13.257 14.426 15.906
*some variables are not mutually exclusive
Moreover, inside urban areas, motorcycle fatalities in narrow passages account for the 65% of total motorcycle accidents observed, whereas the same percentage drops to 5% for mopeds. Slope outside urban areas seems to be more critical in moped accidents comparing to motorcycle accidents.

2-BE-SAFE D2 Road infrastructure and road safety for PTW
Document ID: 2BES_WP1_D2_RIandRSforPTW_Final.doc 41
3.2.5. Summary of Findings - Greece
More than 1.500 moped accidents with other moving vehicles inside urban areas were observed in Greece that account for the 88% of the total number of moped accidents with moving vehicles observed in Greece. The most prevailing remarks are the following:
• Lateral collisions account for the 68% of crashes inside urban areas and the 47% of crashes outside urban areas. Rear end and head-on collisions are proportionately twice as common outside urban areas when compared to accidents inside urban areas.
• For collisions between mopeds and pedestrians, inside urban areas, 57% of crashes occur is single carriageways with at least one lane in each way (direction); for outside urban areas, this percentage rises to 88% (although the numbers are small).
• In total, 46% of accidents between stationary objects and mopeds in urban areas are collisions with an obstacle, similarly for outside urban areas the majority of moped accidents occur with an obstacle.
• In total, most accidents between mopeds and moving vehicles are observed inside urban areas and at junctions controlled by police. Outside urban areas, the number of accidents between mopeds and moving vehicles is significantly lower and the majority occurs at junctions that are not controlled.
• Most moped collisions with an obstacle are observed in uncontrolled junctions inside urban areas.
• Proportionately more of younger moped users between 15 and 34 years old are involved in accidents than other age groups. Outside urban areas, 50% of accidents at junctions with traffic lights involving mopeds involve persons of age between 25 and 34 years old.
• Lateral collisions inside and outside urban areas are mostly observed in straight roads. In areas outside urban environments, narrow passages are exclusively related to lateral collisions.
• 60% of accidents with stationary objects/vehicles at slopes inside urban areas refer to collisions with an obstacle.
Regarding motorcycles in Greece, more than 14.500 motorcycle accidents with other moving vehicles inside urban areas were observed accounting for the 90% of the total number of motorcycle accidents with moving vehicles observed in Greece. Some remarks made are the following:
• Inside urban areas on single carriageways with at least one lane in each way (direction), 69% of the accidents are lateral collisions, while 68% of the motorcycle accidents on one-way carriageways with one or more lanes are lateral collisions.
• Rear end and head-on collisions are proportionately more common outside urban areas when compared to accidents inside urban areas.
• Lateral collisions account for 65% of motorcycle crashes inside urban areas and 45% of crashes outside urban areas. Lateral collisions are frequently observed in accidents between moving vehicles and motorcycles in junctions controlled by traffic lights.
• The majority of motorcycle accidents with a stationary element occur with an obstacle. In urban areas, 39% of accidents on one-way carriageways with one or more lanes account for collisions with a parked vehicle. Most motorcycle accidents which are collisions with an obstacle are observed in uncontrolled junctions inside urban areas.
• Most accidents between motorcycles and moving vehicles are observed inside urban areas and at junctions controlled by police. Outside urban areas, the number of accidents between motorcycles and moving vehicles is significantly lower and occur more often on junctions that are not controlled.
• 54% of the accidents inside urban areas between a motorcycle and a pedestrian are observed in junctions that are not controlled. The majority of accidents involving motorcycles and pedestrians occur in straight roads and are significantly more frequent inside urban areas.

2-BE-SAFE D2 Road infrastructure and road safety for PTW
Document ID: 2BES_WP1_D2_RIandRSforPTW_Final.doc 42
• A higher number of younger motorcycle users between 25 and 34 years old are involved in accidents. Outside urban areas, 36% of accidents involving motorcycles at junctions controlled by warden involve persons of age between 25 and 34 years old.
• Accidents are mostly observed on straight roads regardless of the road geometry. Moreover, critical factors seem to be bends and slopes.
• Over a quarter of narrow passage accidents inside urban areas between motorcycles and moving vehicles are head-on collisions.
• Most of the motorcycle accidents in straight roads and at slope, at a bend and in narrow passage inside urban areas refer to collisions with an obstacle.
Finally, by contrasting moped and motorcycles accidents, the following are revealed:
• The magnitude of motorcycle fatalities is significantly greater than the magnitude of moped fatalities.
• The percentage of moped fatalities per carriageway type follow similar pattern to motorcycle fatalities.
• The percentage of motorcycle fatalities at junctions controlled by police are more than double comparing to similar moped accidents outside urban areas.
• The percentage of motorcycle fatalities at straight road and slopes are low in both urban and interurban environment and lower than the moped fatalities.
• Narrow roads are significantly more critical for motorcycles than mopeds regardless of the area type.
• Injuries and fatalities in accidents involving a PTW are mostly observed in dry weather conditions
• Skidding is systematically observed in PTW accidents both inside and outside urban areas
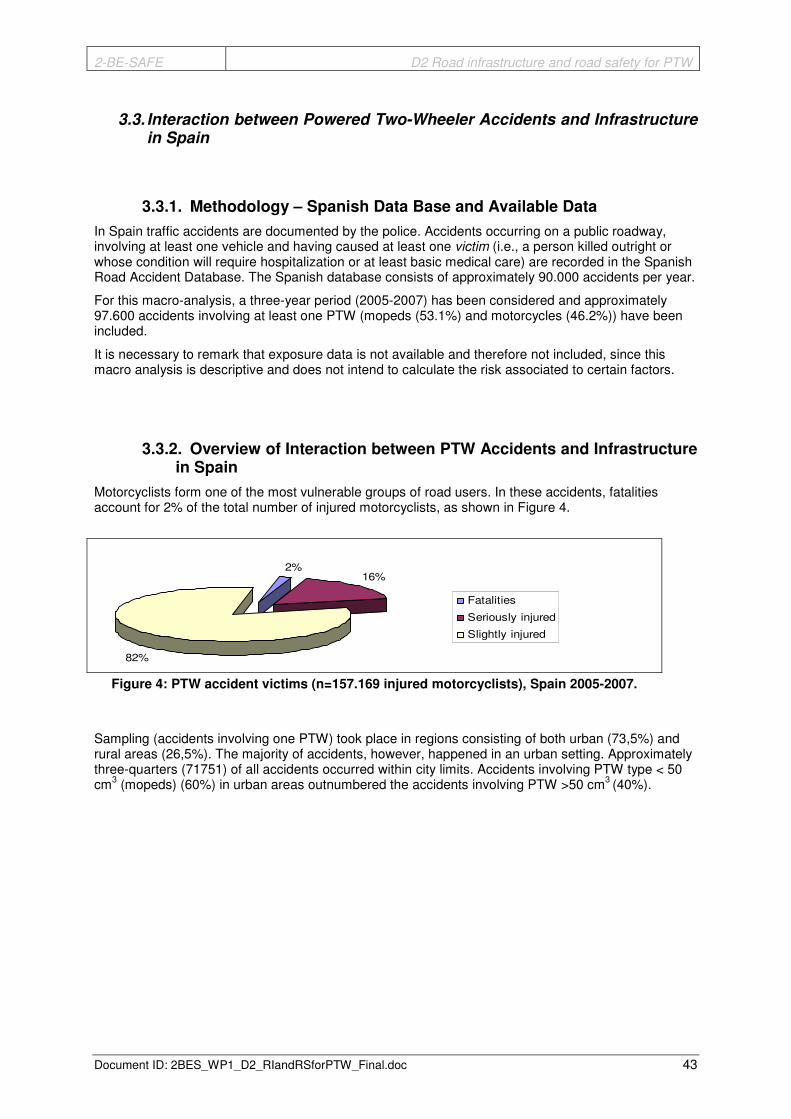
2-BE-SAFE D2 Road infrastructure and road safety for PTW
Document ID: 2BES_WP1_D2_RIandRSforPTW_Final.doc 43
3.3. Interaction between Powered Two-Wheeler Accidents and Infrastructure in Spain
3.3.1. Methodology – Spanish Data Base and Available Data
In Spain traffic accidents are documented by the police. Accidents occurring on a public roadway, involving at least one vehicle and having caused at least one victim (i.e., a person killed outright or whose condition will require hospitalization or at least basic medical care) are recorded in the Spanish Road Accident Database. The Spanish database consists of approximately 90.000 accidents per year.
For this macro-analysis, a three-year period (2005-2007) has been considered and approximately 97.600 accidents involving at least one PTW (mopeds (53.1%) and motorcycles (46.2%)) have been included.
It is necessary to remark that exposure data is not available and therefore not included, since this macro analysis is descriptive and does not intend to calculate the risk associated to certain factors.
3.3.2. Overview of Interaction between PTW Accidents and Infrastructure in Spain
Motorcyclists form one of the most vulnerable groups of road users. In these accidents, fatalities account for 2% of the total number of injured motorcyclists, as shown in Figure 4.
2%16%
82%
Fatalities
Seriously injured
Slightly injured
Figure 4: PTW accident victims (n=157.169 injured motorcyclists), Spain 2005-2007.
Sampling (accidents involving one PTW) took place in regions consisting of both urban (73,5%) and rural areas (26,5%). The majority of accidents, however, happened in an urban setting. Approximately three-quarters (71751) of all accidents occurred within city limits. Accidents involving PTW type < 50 cm3 (mopeds) (60%) in urban areas outnumbered the accidents involving PTW >50 cm3 (40%).

2-BE-SAFE D2 Road infrastructure and road safety for PTW
Document ID: 2BES_WP1_D2_RIandRSforPTW_Final.doc 44
3%
38%
15%13%
1%
2%
6%
6%
0%
5%11%
Head on
Front to side
At angle, sidewipe
Rear end
SVC, parked vehicle
SVC, obstacle
Pedestrian
Run off the road
Precipitation
Rollover on carriageway
Other
Figure 5: Type of collision. Inside urban area (n=71.751), Spain 2005-2007.
Analysing inside urban accidents’ typology, front to side is the most frequent type of collision accounting for almost 40% of all accidents (see Figure 5).
Considering only outside urban accidents and differentiating between motorways and express roads, the following figures are obtained:
5%
27%
12%1%
24%
1%
8%7%
3%1%
11%
1% 8%
15%
22%
1%
3%
21%
0%
12%
16%
1%
Head on
Front to side
At angle, sidewipe
Rear end
SVC, parked vehicle
SVC, obstacle
Pedestrian
Run off the road
Precipitation
Rollover on carriageway
Other
Type of collision. Express roads. (n=21809)
Type of collision. Motorways. (n=4042)
Figure 6: Type of collisions on express roads and motorways, Spain 2005-2007.
As the figures show (Figure 6), run-off-road and front-to-side accounted for half of the accidents in express roads, while rear-end and run-off-road are the most frequent type of collisions in motorways (43%).
Front to side, run-off-road and rear-end were the most frequent type of collisions representing almost 60% of the accidents. For this reason, the macro-analysis will be focused on these accident types.
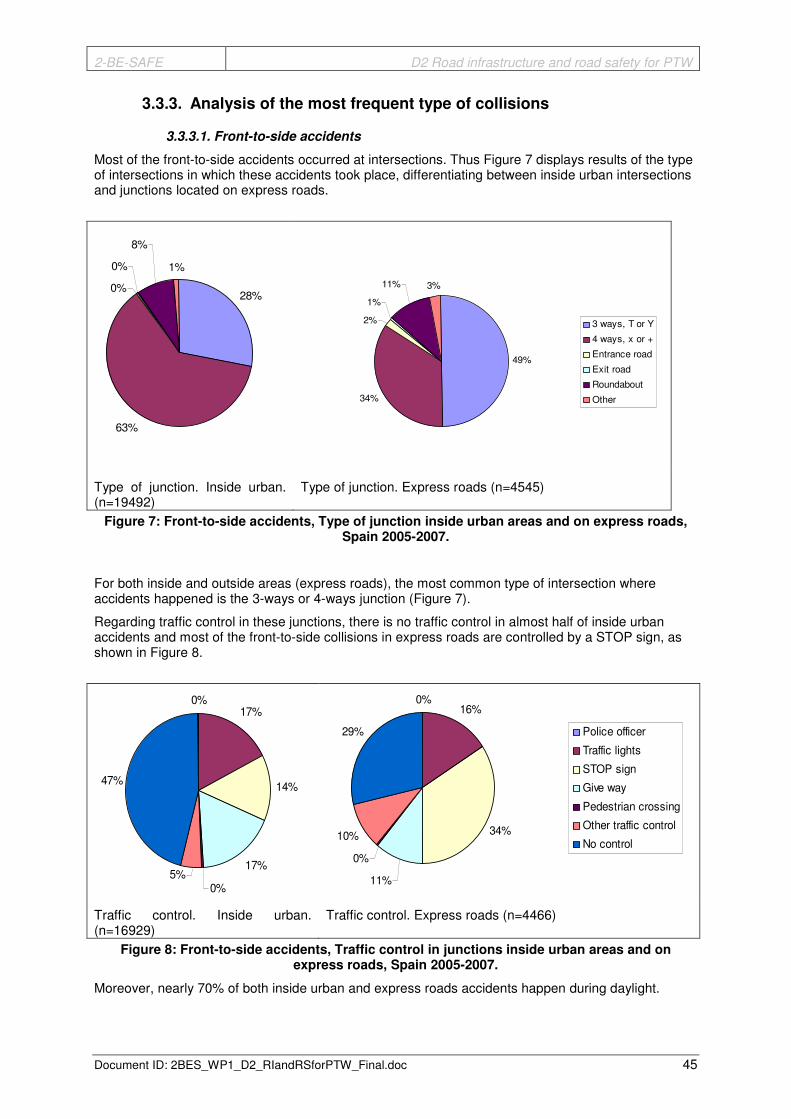
2-BE-SAFE D2 Road infrastructure and road safety for PTW
Document ID: 2BES_WP1_D2_RIandRSforPTW_Final.doc 45
3.3.3. Analysis of the most frequent type of collisions
3.3.3.1. Front-to-side accidents
Most of the front-to-side accidents occurred at intersections. Thus Figure 7 displays results of the type of intersections in which these accidents took place, differentiating between inside urban intersections and junctions located on express roads.
28%
63%
0%
0%
8%
1%
49%
34%
2%
1%
11% 3%
3 ways, T or Y
4 ways, x or +
Entrance road
Exit road
Roundabout
Other
Type of junction. Inside urban. (n=19492)
Type of junction. Express roads (n=4545)
Figure 7: Front-to-side accidents, Type of junction inside urban areas and on express roads, Spain 2005-2007.
For both inside and outside areas (express roads), the most common type of intersection where accidents happened is the 3-ways or 4-ways junction (Figure 7).
Regarding traffic control in these junctions, there is no traffic control in almost half of inside urban accidents and most of the front-to-side collisions in express roads are controlled by a STOP sign, as shown in Figure 8.
0%17%
14%
17%
0%5%
47%
0%16%
34%
11%
0%
10%
29% Police officer
Traffic lights
STOP sign
Give way
Pedestrian crossing
Other traffic control
No control
Traffic control. Inside urban. (n=16929)
Traffic control. Express roads (n=4466)
Figure 8: Front-to-side accidents, Traffic control in junctions inside urban areas and on express roads, Spain 2005-2007.
Moreover, nearly 70% of both inside urban and express roads accidents happen during daylight.

2-BE-SAFE D2 Road infrastructure and road safety for PTW
Document ID: 2BES_WP1_D2_RIandRSforPTW_Final.doc 46
3.3.3.2. Run-off-road accidents
Run-off-road is the most frequent type of collision of the outside urban accidents. More than one third of these accidents took place on straight roads (Figure 9).
41%
59%
35%
65%
Straight road
Bend
Motorway (n=798) Express road (n=5353)
Figure 9: Run-off-road accidents, road design, Spain 2005-2007.
There is neither data regarding the orientation of the bends nor data about bend radius.
Although road surface condition could be a contributing factor especially for PTW vehicles, the road surface was dry in more than 90% of all run-off-road accidents (Figure 10).
90%
1% 1%0%
1%7%
93%
4%1%
0% 2%0%
Normal
Wet
Dirty, Greasy
Frozen
Oily
Other
Motorway (n=798) Express road (n=5353)
Figure 10: Run-off-road accidents, road surface condition, Spain 2005-2007.
Like front-to-side accidents, more than 70% run-off-road accidents happening both on motorways and express roads occurred during daylight.
Increasing carriageway and shoulder width could be a recommendable counter measure to minimise the effects of a possible loss of control of a vehicle. Thus, it is interesting to analyse these widths in express roads where there is more variability than in motorways.
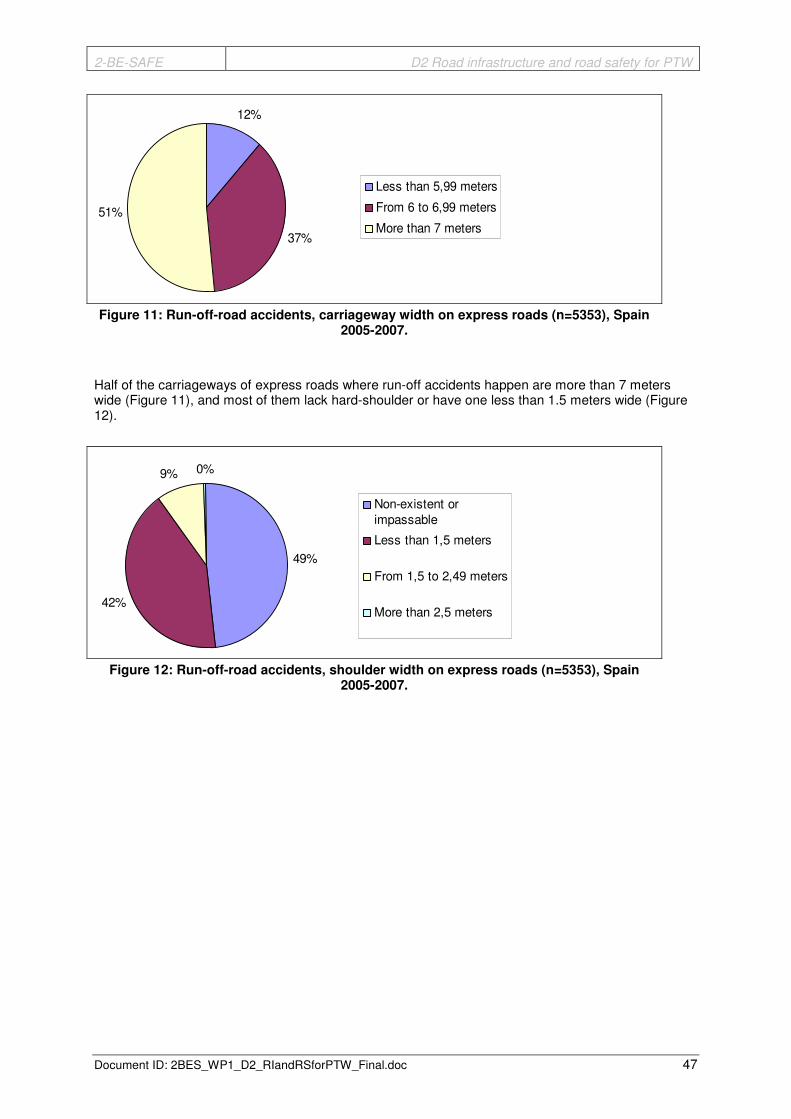
2-BE-SAFE D2 Road infrastructure and road safety for PTW
Document ID: 2BES_WP1_D2_RIandRSforPTW_Final.doc 47
12%
37%
51%
Less than 5,99 meters
From 6 to 6,99 meters
More than 7 meters
Figure 11: Run-off-road accidents, carriageway width on express roads (n=5353), Spain
2005-2007.
Half of the carriageways of express roads where run-off accidents happen are more than 7 meters wide (Figure 11), and most of them lack hard-shoulder or have one less than 1.5 meters wide (Figure 12).
49%
42%
9% 0%
Non-existent orimpassable
Less than 1,5 meters
From 1,5 to 2,49 meters
More than 2,5 meters
Figure 12: Run-off-road accidents, shoulder width on express roads (n=5353), Spain
2005-2007.

2-BE-SAFE D2 Road infrastructure and road safety for PTW
Document ID: 2BES_WP1_D2_RIandRSforPTW_Final.doc 48
3.3.3.3. Rear-end accidents
Regarding the accident location, approximately 30% of both inside and outside urban rear-end collisions occurred at intersections (Figure 13).
28%
72%
30%
70%
At intersection
Out of intersection
Outside urban area (n=2689) Inside urban area (n=9163)
Figure 13: Rear-end accidents, inside and outside urban areas vs. intersections, Spain 2005-2007.
Analysing traffic control in these intersections, nearly 30% of inside urban rear-end accidents located at intersections are controlled by traffic lights, and half of them have no control. 40% of outside urban rear-end accidents that occurred at intersections are controlled by STOP or GIVE WAY signs (Figure 14).
0%
5%
19%
21%
0%12%
43%
0%
28%
5%
8%
1%8%
50%
Police officer
Traffic lights
STOP sign
Give way
Pedestrian crossing
Other traffic control
No control
Outside urban area (n=734) Inside urban area (n=2673)
Figure 14: Rear-end accidents, inside and outside urban areas vs. traffic control, Spain 2005-2007.

2-BE-SAFE D2 Road infrastructure and road safety for PTW
Document ID: 2BES_WP1_D2_RIandRSforPTW_Final.doc 49
3.3.4. Specific queries (Cross-tables between categories)
Also, some specific queries are presented in order to get a possible connection between PTW accidents and infrastructure parameters.
The following cross-tables (Table 34, Table 35 and Table 36) show where specific types of accidents occurred regarding the number of ways (directions) and carriageways. It is necessary to explain the criteria used to make the queries:
• One way (one carriageway): One-way carriageways with one or more lanes. Entrance/exit roads also are considered.
• One way (two carriageways): Dual-carriageway roads with a minimum of two lanes in each direction, frequently separated by a median.
• Two ways: Single carriageway with at least one lane in each way (direction).
• More: Rest of roads.
Table 34: Cross-table – accident type (between moving vehicles) vs. number of directions, Spain 2005-2007.
accident type (between moving vehicles)
head-on head-on side side crash nose to tail crash
ONE
(one carriageway)
157
(0,16%)
3289
(3,37%)
1320
(1,35%)
945
(0,97%)
ONE
(two carriageway)
124
(0,13%)
2408
(2,47%)
1740
(1,78%)
2130
(2,18%)
TWO 2902
(2,97%)
21435
(21,96%)
9510
(9,74%)
7241
(7,42%)
Nu
mb
er
of
dir
ecti
on
s
MORE 281
(0,29%)
5984
(6,13%)
832
(0,85%)
1949
(2,00%)
Table 35: Cross-table – accident type (between moving vehicles and a pedestrian) vs. number
of directions, Spain 2005-2007.
accident type
(between a moving vehicle and a pedestrian)
ONE
(one carriageway)
602
(0,62%)
ONE
(two carriageway)
440
(0,45%)
TWO 3218
(3,30%)
Nu
mb
er
of
dir
ecti
on
s
MORE 759
(0,78%)

2-BE-SAFE D2 Road infrastructure and road safety for PTW
Document ID: 2BES_WP1_D2_RIandRSforPTW_Final.doc 50
Table 36: Cross-table – accident type (between moving vehicles and a stationary one or other) vs. number of directions, Spain 2005-2007.
accident type
(between a moving vehicle and a stationary one or other)
Collision with a parked vehicle
Collision with an obstacle on carriageway
ONE
(one carriageway)
137
(0,14%)
101
(0,10%)
ONE
(two carriageway)
133
(0,14%)
278
(0,28%)
TWO 441
(0,45%)
908
(0,28%)
Nu
mb
er
of
dir
ecti
on
s
MORE 64
(0,07%)
368
(0,38%)
accident type
(between a moving vehicle and a stationary one or other)
Running-off road (skidding) Falling out of the vehicle
ONE
(one carriageway)
559
(0,57%)
540
(0,55%)
ONE
(two carriageway)
1713
(1,76%)
1010
(1,03%)
TWO 8757
(8,97%)
4445
(4,55%)
Nu
mb
er
of
dir
ecti
on
s
MORE 729
(0,75%)
331
(0,34%)
Concerning the accident location, it is interesting to differentiate between accidents which occur at intersections and accidents which occur out of intersections (Table 37 to Table 40 and Table 41 to Table 44), analysing e.g. the type of junction and the traffic control (junctions), or the road alignment (non-junction).
Percentages are always over totals (accidents, casualties, fatalities) and two different baselines are used (regarding junction/not junction; number of carriageways and directions).

2-BE-SAFE D2 Road infrastructure and road safety for PTW
Document ID: 2BES_WP1_D2_RIandRSforPTW_Final.doc 51
Table 37: Cross-table – accident type (between moving vehicles) vs. junction type, Spain 2005-2007.
accident type (between moving vehicles)
head-on head-on side side crash nose to tail crash
Cross road (X or +) 480
(0,49%)
13896
(14,24%)
3556
(3,64%)
1524
(1,56%)
T or Y junction 773
(0,79%)
7919
(8,11%)
2055
(2,11%)
1251
(2,11%)
Ju
ncti
on
Roundabout 51
(0,05%)
2146
(2,20%)
1009
(1,03%)
506
(0,52%)
accident type (between moving vehicles)
head-on head-on side side crash nose to tail crash
Junction indicated by a traffic light
184
(0,19%)
3789
(3,88%)
1349
(1,38%)
817
(0,84%)
Junction indicated by a warden
4
(0,00%)
33
(0,03%)
11
(0,01%)
2
(<0,01%)
Ju
ncti
on
Junction non indicated 607
(0,62%)
9201
(9,43%)
3480
(3,57%)
1674
(1,72%)
Table 38: Cross-table – accident type (between moving vehicles and a pedestrian) vs. junction type, Spain 2005-2007.
accident type
(between a moving vehicle and a pedestrian)
Cross road (X or +) 920 (0,94%)
T or Y junction 415 (0,43%)
Ju
ncti
on
Roundabout 72 (0,07%)
accident type
(between a moving vehicle and a pedestrian)
Junction indicated by a traffic light
377 (0,39%)
Junction indicated by a warden
5 (0,00%)
Ju
ncti
on
Junction non indicated 738 (0,76%)

2-BE-SAFE D2 Road infrastructure and road safety for PTW
Document ID: 2BES_WP1_D2_RIandRSforPTW_Final.doc 52
Table 39: Cross-table – accident type (between moving vehicles and a stationary one or other) vs. junction type (part 1), Spain 2005-2007.
accident type
(between a moving vehicle and a stationary one or other)
Collision with a parked vehicle
Collision with an obstacle on carriageway
Cross road (X or +) 40 (0,04%) 119 (0,12%)
T or Y junction 49 (0,05%) 107 (0,11%)
Ju
ncti
on
Roundabout 14 (0,1%) 67 (0,07%)
accident type
(between a moving vehicle and a stationary one or other)
Collision with a parked vehicle
Collision with an obstacle on carriageway
Junction indicated by a traffic light
17 (0,02%) 36 (0,04%)
Junction indicated by a warden
0 0
Ju
ncti
on
Junction non indicated 55 (0,06%) 133 (0,14%)
Table 40: Cross-table – accident type (between moving vehicles and a stationary one or other) vs. junction type (part 2), Spain 2005-2007.
accident type
(between a moving vehicle and a stationary one or other)
Running-off road (skidding) Falling out of the vehicle
Cross road (X or +) 801 (0,82%) 672 (0,69%)
T or Y junction 656 (0,67%) 618 (0,63%)
Ju
ncti
on
Roundabout 605 (0,62%) 676 (0,69%)
accident type
(between a moving vehicle and a stationary one or other)
Running-off road (skidding) Falling out of the vehicle
Junction indicated by a traffic light
319 (0,33%) 267 (0,27%)
Junction indicated by a warden
1 (0,00%) 4 (0,00%)
Ju
ncti
on
Junction non indicated 2228 (2,28%) 870 (0,89%)

2-BE-SAFE D2 Road infrastructure and road safety for PTW
Document ID: 2BES_WP1_D2_RIandRSforPTW_Final.doc 53
Table 41: Cross-table – accident type (between moving vehicles) vs. non-junction type, Spain 2005-2007.
accident type (between moving vehicles)
head-on head-on side side crash nose to tail crash
Straight road 1104
(1,13%)
7531
(7,72%)
5616
(5,75%)
8031
(8,23%)
No
n-J
un
cti
on
Bend 994
(1,02%)
1032
(1,06%)
773
(0,79%)
647
(0,66%)
accident type (between moving vehicles)
head-on head-on side side crash nose to tail crash
Hump 29
(0,03%)
23
(0,02%)
12
(0,01%)
24
(0,02%)
Narrow passage 22
(0,02%)
15
(0,02%)
16
(0,02%)
6
(0,01%)
No
n-J
un
cti
on
Slope 38
(0,04%)
38
(0,04%)
17
(0,02%)
13
(0,01%)
Table 42: Cross-table – accident type (between moving vehicles and a pedestrian) vs. non-
junction type, Spain 2005-2007.
accident type
(between a moving vehicle and a pedestrian)
Straight road 3311
(3,39%)
No
n-J
un
cti
on
Bend 218
(0,22%)
accident type
(between a moving vehicle and a pedestrian)
Hump 4
(0,00%)
Narrow passage 6
(0,01%)
No
n-J
un
cti
on
Slope 10
(0,01%)

2-BE-SAFE D2 Road infrastructure and road safety for PTW
Document ID: 2BES_WP1_D2_RIandRSforPTW_Final.doc 54
Table 43: Cross-table – accident type (between moving vehicles and a stationary one or other) vs. non-junction type (part 1), Spain 2005-2007.
accident type
(between a moving vehicle and a stationary one or other)
Collision with a parked vehicle
Collision with an obstacle on carriageway
Straight road 541 (0,55%) 1048 (1,07%)
No
n-
Ju
ncti
on
Bend 120 (0,12%) 270 (0,27%)
accident type
(between a moving vehicle and a stationary one or other)
Collision with a parked vehicle
Collision with an obstacle on carriageway
Hump 4 (0,00%) 8 (0,01%)
Narrow passage 4 (0,00%) 9 (0,01%)
No
n-J
un
cti
on
Slope 1 (0,00%) 17 (0,02%)
Table 44: Cross-table – accident type (between moving vehicles and a stationary one or other) vs. non-junction type (part 2), Spain 2005-2007.
accident type
(between a moving vehicle and a stationary one or other)
Running-off road (skidding) Falling out of the vehicle
Straight road 4340 (4,45%) 3147 (3,22%)
No
n-
Ju
ncti
on
Bend 4575 (4,68%) 1058 (1,08%)
accident type
(between a moving vehicle and a stationary one or other)
Running-off road (skidding) Falling out of the vehicle
Hump 26 (0,03%) 2 (0,00%)
Narrow passage 49 (0,05%) 3 (0,00%)
No
n-J
un
cti
on
Slope 93 (0,1%) 3 (0,00%)

2-BE-SAFE D2 Road infrastructure and road safety for PTW
Document ID: 2BES_WP1_D2_RIandRSforPTW_Final.doc 55
Finally, severity data for different situations are presented in the following table (Table 45):
Table 45: Cross-tables – severity data vs. junction type, non-junction type and number of
directions, Spain 2005-2007.
Summary involved in accident
Total of fatalities Total injured people
Cross road (X or +) 226
(0,19%)
29172
(24,58%)
T or Y junction 263
(0,22%)
17769
(14,97%)
Ju
ncti
on
Roundabout 62
(0,05%)
6583
(5,55%)
Summary involved in accident
Total of fatalities Total injured people
Straight road 690
(0,58%)
47842
(40,31%)
No
n-J
un
cti
on
Bend 818
(0,69%)
12765
(10,76%)
Summary involved in accident
Total of fatalities Total injured people
ONE
(one carriageway)
63
(0,05%)
9813
(8,27%)
ONE
(two carriageway)
401
(0,34%)
13285
(11,19%)
TWO 1481
(1,25%)
77529
(65,33%)
Nu
mb
er
of
dir
ecti
on
s
MORE 191
(0,16%)
15912
(13,41%)

2-BE-SAFE D2 Road infrastructure and road safety for PTW
Document ID: 2BES_WP1_D2_RIandRSforPTW_Final.doc 56
As general conclusions, accidents which happened in dual-carriageway roads were much more severe than the accidents which occurred in single carriageway roads with only one way of circulation, since the difference between the numbers of accidents in both roads is not proportional to the huge difference between the numbers of fatalities.
Front-to-side accidents generally took place at intersections. Considering just three types of junctions (Crossroads, T or Y junctions, and roundabout), front-to-side accidents happened more frequently at crossroads (58%), followed by “T or Y” junctions (33%) and finally by roundabouts (9%). The death toll associated to both type of 3-way junctions is similar, despite of the higher number of victims associated to crossroads.
Concerning out-of-intersection accidents, even though the number of accidents which occurred in straight section of roads was higher than the number of accidents which happened in bends, the first ones presented a lower number of fatalities.
3.3.5. Summary of Findings – Spain
• Front-to side, run-off-road and rear-end represent nearly 60% of all accidents.
• Inside urban accidents account for three quarters of all accidents.
• Road surface is dry in more than 90% of run-off-road accidents.
• For front-to-side collisions, 3-ways intersections (T or Y) and 4-ways intersections (X or +) are the
most frequent type of junctions in outside urban and inside urban areas respectively.
• Carriageways are wider than 7 meters in half of all run-off-road accidents.
• Carriageways lack hard shoulders in half of all run-off-road accidents.
• Approximately 30% of rear-end accidents occur at intersections, mostly without traffic control.
• Accidents which happen in dual carriageway roads are the most severe, considering the
number of fatalities with regard to the number of accidents.
• Cross-roads are the most frequent type of intersection where accidents occur and
consequently account for the majority of victims registered at intersections.
• Cross roads and “T or Y” junctions have a similar number of fatalities associated, despite of
the higher number of victims registered in crossroads.
• Even though the number of accidents which occur in straight sections of roads is higher than
the number of accidents which happen in bends, the first ones present a lower number of
fatalities.
2-BE-SAFE D2 Road infrastructure and road safety for PTW
Document ID: 2BES_WP1_D2_RIandRSforPTW_Final.doc 57
3.4. Interaction between Powered Two-Wheeler Accidents and Infrastructure in Great Britain
3.4.1. Methodology – British Data Base and Available Data
This report provides the deliverable in respect of the activity 1.2, comprising the analysis of the GB road accident database, STATS19. The objective of this activity is to investigate which road infrastructure elements (road design elements and road surface parameters) have an influence on PTW accidents.
STATS19 (Department for Transport - DfT, 2008) contains details of all reported personal injury road accidents for GB. It incorporates huge amounts of data relating to multiple variables for each incident. All incidents relating to PTWs from years 2005-2007 were analysed with the aim of identifying accident trends with respect to infrastructure elements. There are incident records of 74.562 PTWs on the database within these years, which can be broken down further into motorbike types:
• 50cc and under 14737 (19.8%)
• Over 50cc and up to 125cc 20215 (27.1%)
• Over 125cc and up to 500cc 8183 (11.0%)
• Over 500cc 31427 (42.1%)
Firstly, relevant infrastructure-related data categories were identified from the STATS19 database. An initial high level analysis was conducted on each of these to identify which infrastructure elements are the most prevalent within the accident data.
The data categories were then analysed to a more in-depth level by cross-tabulating between various different factors to identify trends and relationships. For example, a table could be produced with ‘types of junction’ as row headers and ‘objects hit in carriageway’ as column headers. Each square within the table would show the number of cases fulfilling both criteria. This would therefore provide an indication of which combinations of these two factors were more prevalent in the accident statistics. A number of these cross-tables were produced, each intended to analyse different infrastructure-related elements.

2-BE-SAFE D2 Road infrastructure and road safety for PTW
Document ID: 2BES_WP1_D2_RIandRSforPTW_Final.doc 58
3.4.2. Interaction between PTW Accidents and Infrastructure in Great Britain
3.4.2.1. Basic road network statistics
To provide a basis for drawing conclusions from the tables in the following sections, below is a basic summary of the UK road network (Table 46 - figures taken from Dft, 2009):
Table 46: Basic summary of the UK road network.
Road Class Urban (km) Rural (km) Total (km)
Motorway & A(M) - 3,559 3,559
A 11,106 35,586 46,692
B 5,476 24,685 30,161
C 10,992 73,582 84,574
Unclassified 114,450 115,032 229,482
Total 142,024 252,444 394,468
Glossary for Road Class
Motorway: Public road with dual carriageways and at least two lanes each way, though usually three and sometimes four. Interchanges are grade separated. The carriageways are separated by a central barrier or central reservation. No crossing is permitted and no stopping is permitted unless in an emergency (a hard shoulder is usually provided for this purpose). Entry is prohibited for pedestrians, animals, pedal cycles, mopeds, agricultural vehicles and learner drivers. The maximum permitted speed is 70 mph.
A(M) Road: As motorway
A Road: A roads are any other major routes not falling under Motorway classification. They will typically be single carriageway but not always and may sometimes reach motorway standard. Speed limits range from 30-70 mph. The key distinguishing feature from lower categories is their importance as a major travel corridor. Classification is however unrelated to road width or quality.
B Road: These are typically local routes with lower traffic densities than A roads and are typically not more than 15 miles long. Speed limits will typically range from 30-60 mph. Again, classification is unrelated to road width or quality.
C Road: C roads are generally minor local roads with low traffic densities relative to higher classifications, although in urban areas this may still represent high traffic flows. Speed limits will typically range from 20-60 mph.
Unclassified road: Any road not assigned a classification from the above listing.

2-BE-SAFE D2 Road infrastructure and road safety for PTW
Document ID: 2BES_WP1_D2_RIandRSforPTW_Final.doc 59
3.4.2.2. Relevant STATS19 data categories
The following categories were identified as being relevant for the analysis (either by being directly related to infrastructure elements, or indirectly related - representing a potential influencing factor on rider interactions with infrastructure elements or measure of the accident type).
Reference numbers are taken directly from STATS19:
Attendant circumstances variables:
• 1.9 Time
• 1.12 Road class
• 1.14 Road type
• 1.15 Speed limit
• 1.16 Junction detail
• 1.21 Light conditions
• 1.22 Weather
• 1.23 Road surface conditions
Vehicle variables:
• 2.7 Manoeuvre
• 2.11 Skidding and overturning
• 2.12 Hit object in carriageway
• 2.14 Hit object off carriageway
• 2.16 First point of impact
• 2.22 Age of rider
Casualty variables:
• 3.9 Severity of casualty
3.4.2.3. Prevalence of specific elements within categories
It should be noted that the following tables are all compiled from the same data and should in theory all give the same total figure in terms of either vehicle count or incident count (74.562). In fact the totals vary to a slight degree due to some data being omitted. This is the case where the data was not recorded within the database or was entered as ‘unknown’. The discrepancies between the totals are however minimal and are not considered to have a significant effect on the validity of the figures. It will also be noted that each table has values highlighted in red, orange and yellow. This is simply intended to highlight the three highest incident/vehicle counts respectively.
Some data are also ‘greyed out’ in the tables. This is where data categories are non-descript and therefore do not tie in with the other categories for meaningful comparison. For example, categories of ‘other’ or ‘unknown’ are greyed out.
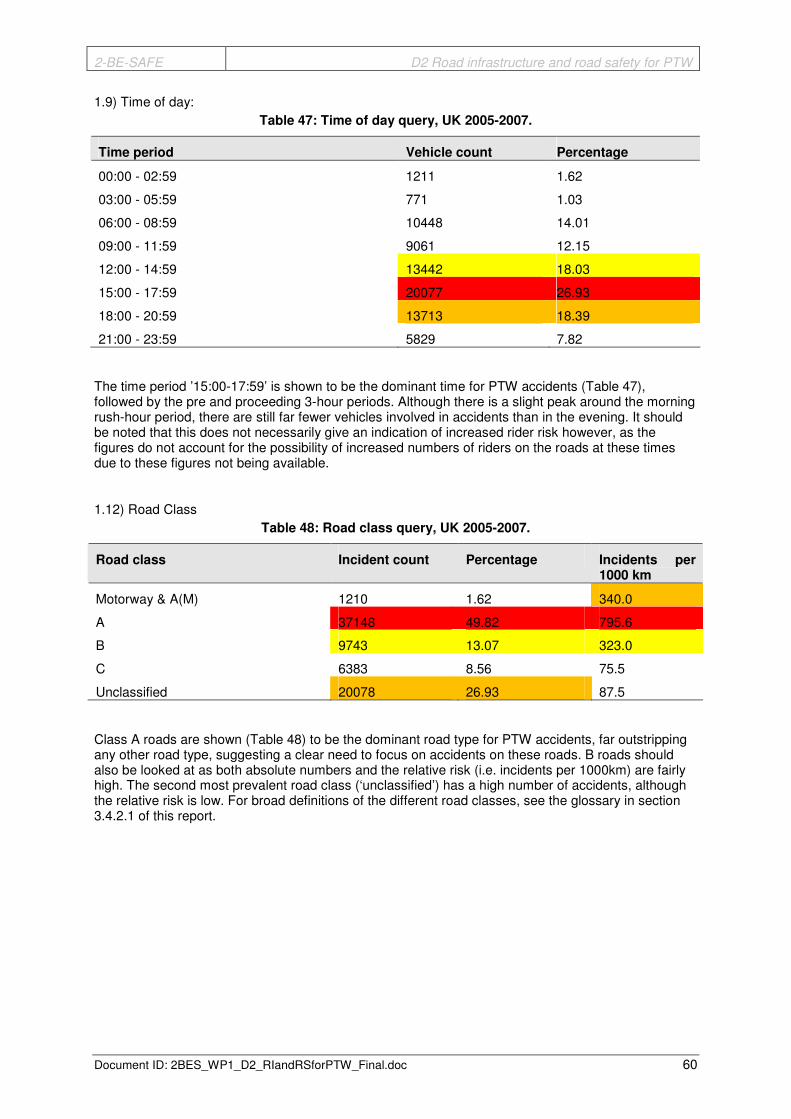
2-BE-SAFE D2 Road infrastructure and road safety for PTW
Document ID: 2BES_WP1_D2_RIandRSforPTW_Final.doc 60
1.9) Time of day: Table 47: Time of day query, UK 2005-2007.
Time period Vehicle count Percentage
00:00 - 02:59 1211 1.62
03:00 - 05:59 771 1.03
06:00 - 08:59 10448 14.01
09:00 - 11:59 9061 12.15
12:00 - 14:59 13442 18.03
15:00 - 17:59 20077 26.93
18:00 - 20:59 13713 18.39
21:00 - 23:59 5829 7.82
The time period ’15:00-17:59’ is shown to be the dominant time for PTW accidents (Table 47), followed by the pre and proceeding 3-hour periods. Although there is a slight peak around the morning rush-hour period, there are still far fewer vehicles involved in accidents than in the evening. It should be noted that this does not necessarily give an indication of increased rider risk however, as the figures do not account for the possibility of increased numbers of riders on the roads at these times due to these figures not being available.
1.12) Road Class Table 48: Road class query, UK 2005-2007.
Road class Incident count Percentage Incidents per 1000 km
Motorway & A(M) 1210 1.62 340.0
A 37148 49.82 795.6
B 9743 13.07 323.0
C 6383 8.56 75.5
Unclassified 20078 26.93 87.5
Class A roads are shown (Table 48) to be the dominant road type for PTW accidents, far outstripping any other road type, suggesting a clear need to focus on accidents on these roads. B roads should also be looked at as both absolute numbers and the relative risk (i.e. incidents per 1000km) are fairly high. The second most prevalent road class (‘unclassified’) has a high number of accidents, although the relative risk is low. For broad definitions of the different road classes, see the glossary in section 3.4.2.1 of this report.

2-BE-SAFE D2 Road infrastructure and road safety for PTW
Document ID: 2BES_WP1_D2_RIandRSforPTW_Final.doc 61
1.14) Road type Table 49: Road type query, UK 2005-2007.
Road type Incident count Percentage
Roundabout 5689 7.63
One way street 1297 1.74
Dual carriageway 7957 10.67
Single carriageway 58652 78.66
Slip road 533 0.71
Unknown 434 0.58
The figures (Table 49) show that single carriageway roads dominate the accident statistics and are by far the most common road type for PTW accidents. Note – a slip road is a short stretch of road that allows either entry or exit to/from a dual carriageway, without crossing any other traffic stream.
1.15) Speed limit Table 50: Speed limit query, UK 2005-2007.
Speed limit Incident count Percentage
20 302 0.41
30 49434 66.30
40 6422 8.61
50 2098 2.81
60 13327 17.87
70 2978 3.99
Table 50 shows the high proportion of accidents in 30 mph areas shows that accidents are most likely to occur in built up areas. It would therefore be prudent to focus on accidents in these areas. Accidents on national speed limit roads are a distant second in terms of numbers, but still more than double the next category. An analysis of accident severity related to speed limit is provided in section 3.4.3 of the report.
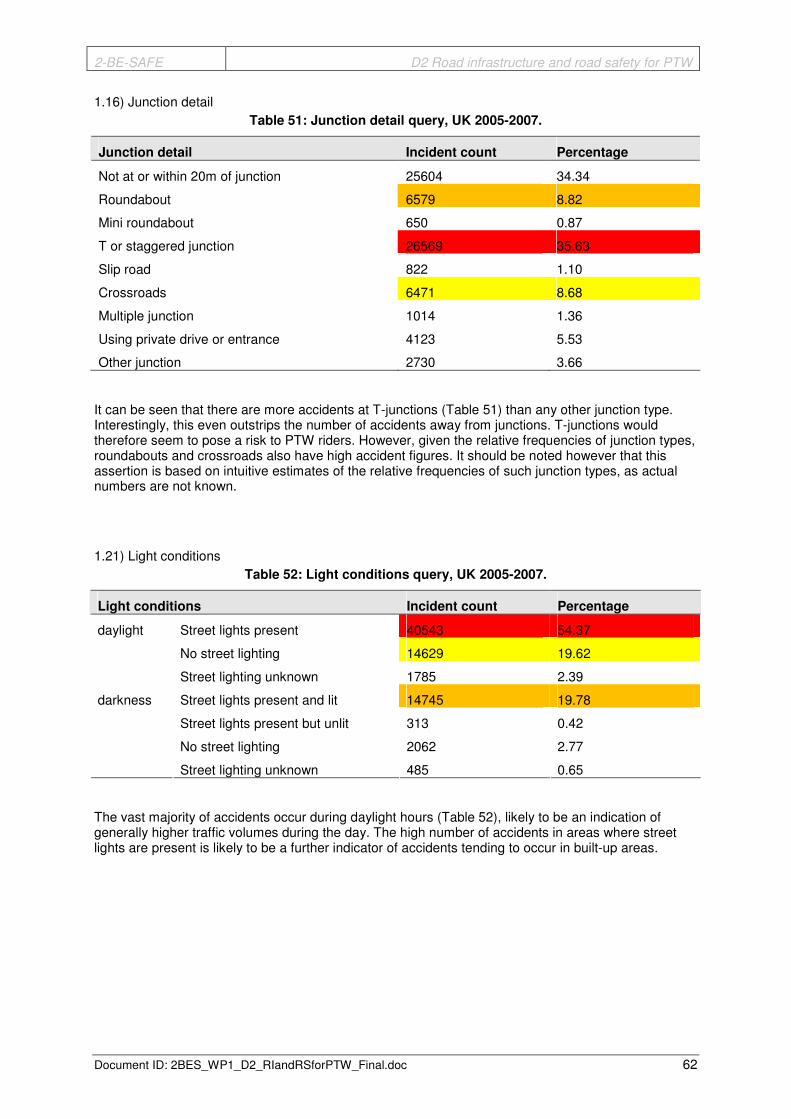
2-BE-SAFE D2 Road infrastructure and road safety for PTW
Document ID: 2BES_WP1_D2_RIandRSforPTW_Final.doc 62
1.16) Junction detail Table 51: Junction detail query, UK 2005-2007.
Junction detail Incident count Percentage
Not at or within 20m of junction 25604 34.34
Roundabout 6579 8.82
Mini roundabout 650 0.87
T or staggered junction 26569 35.63
Slip road 822 1.10
Crossroads 6471 8.68
Multiple junction 1014 1.36
Using private drive or entrance 4123 5.53
Other junction 2730 3.66
It can be seen that there are more accidents at T-junctions (Table 51) than any other junction type. Interestingly, this even outstrips the number of accidents away from junctions. T-junctions would therefore seem to pose a risk to PTW riders. However, given the relative frequencies of junction types, roundabouts and crossroads also have high accident figures. It should be noted however that this assertion is based on intuitive estimates of the relative frequencies of such junction types, as actual numbers are not known.
1.21) Light conditions Table 52: Light conditions query, UK 2005-2007.
Light conditions Incident count Percentage
Street lights present 40543 54.37
No street lighting 14629 19.62
daylight
Street lighting unknown 1785 2.39
Street lights present and lit 14745 19.78
Street lights present but unlit 313 0.42
No street lighting 2062 2.77
darkness
Street lighting unknown 485 0.65
The vast majority of accidents occur during daylight hours (Table 52), likely to be an indication of generally higher traffic volumes during the day. The high number of accidents in areas where street lights are present is likely to be a further indicator of accidents tending to occur in built-up areas.
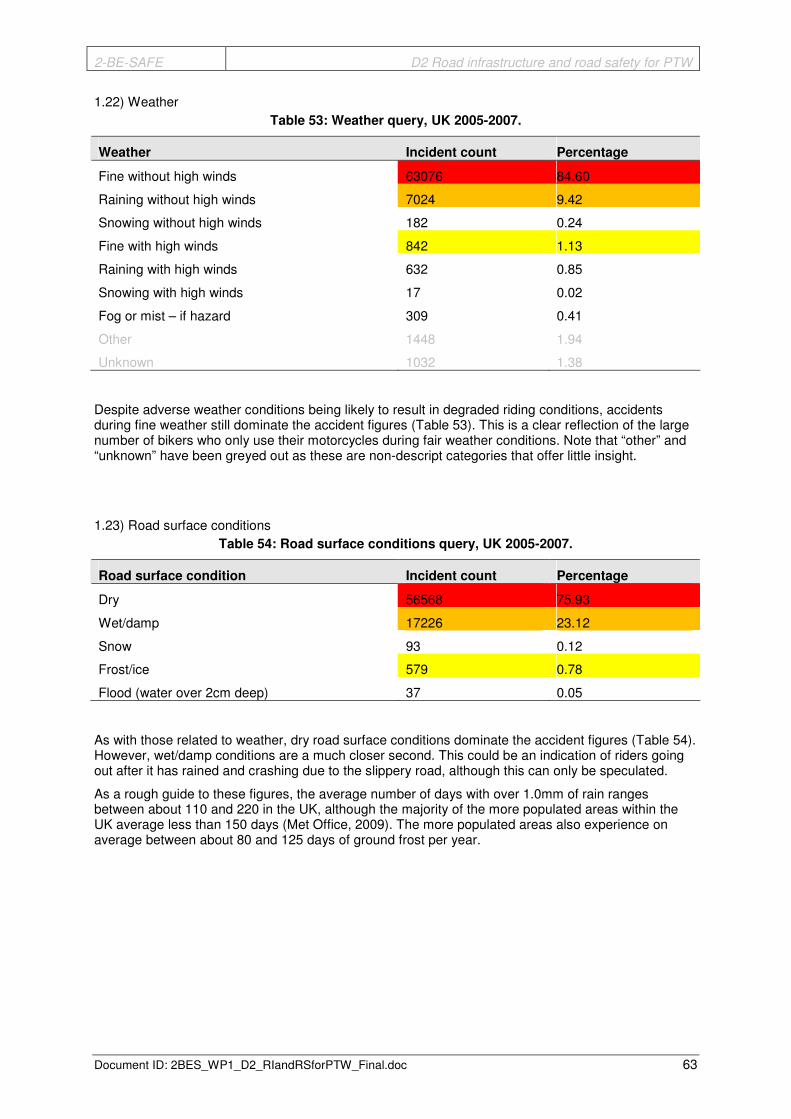
2-BE-SAFE D2 Road infrastructure and road safety for PTW
Document ID: 2BES_WP1_D2_RIandRSforPTW_Final.doc 63
1.22) Weather Table 53: Weather query, UK 2005-2007.
Weather Incident count Percentage
Fine without high winds 63076 84.60
Raining without high winds 7024 9.42
Snowing without high winds 182 0.24
Fine with high winds 842 1.13
Raining with high winds 632 0.85
Snowing with high winds 17 0.02
Fog or mist – if hazard 309 0.41
Other 1448 1.94
Unknown 1032 1.38
Despite adverse weather conditions being likely to result in degraded riding conditions, accidents during fine weather still dominate the accident figures (Table 53). This is a clear reflection of the large number of bikers who only use their motorcycles during fair weather conditions. Note that “other” and “unknown” have been greyed out as these are non-descript categories that offer little insight.
1.23) Road surface conditions Table 54: Road surface conditions query, UK 2005-2007.
Road surface condition Incident count Percentage
Dry 56568 75.93
Wet/damp 17226 23.12
Snow 93 0.12
Frost/ice 579 0.78
Flood (water over 2cm deep) 37 0.05
As with those related to weather, dry road surface conditions dominate the accident figures (Table 54). However, wet/damp conditions are a much closer second. This could be an indication of riders going out after it has rained and crashing due to the slippery road, although this can only be speculated.
As a rough guide to these figures, the average number of days with over 1.0mm of rain ranges between about 110 and 220 in the UK, although the majority of the more populated areas within the UK average less than 150 days (Met Office, 2009). The more populated areas also experience on average between about 80 and 125 days of ground frost per year.

2-BE-SAFE D2 Road infrastructure and road safety for PTW
Document ID: 2BES_WP1_D2_RIandRSforPTW_Final.doc 64
2.7) Manoeuvre Table 55: Manoeuvre query, UK 2005-2007.
Manoeuvre Vehicle count Percentage
Reversing 80 0.11
Parked 233 0.31
Waiting to go ahead but held up 1881 2.52
Slowing or stopping 3383 4.54
Moving off 1204 1.62
U turn 211 0.28
Turning left 1654 2.22
Waiting to turn left 204 0.27
Turning right 2924 3.92
Waiting to turn right 461 0.62
Changing lane to left 326 0.44
Changing lane to right 404 0.54
Overtaking moving vehicle on its offside 6175 8.28
Overtaking stationary vehicle on its offside 3230 4.33
Overtaking on nearside 1293 1.73
Going ahead left hand bend 4644 6.23
Going ahead right hand bend 3969 5.32
Going ahead other 42265 56.70
‘Going ahead other’ is by far the dominant manoeuvre in the figures (Table 55). However, this is a non-descript category and may simply be an easy choice to default to at a scene. With this category removed, ‘overtaking a moving vehicle’ and ‘going ahead on bends’ stand out. These are higher speed manoeuvres.
2.11) Skidding and overturning
Table 56: Skidding and overturning query, UK 2005-2007.
Skidding and overturning Vehicle count Percentage
No skidding or overturning 54758 73.44
Skidded 15369 20.61
Skidded and overturned 2607 3.50
Overturned 1823 2.45
Table 56 shows that riders tend to remain upright, although these primarily represent the less serious accidents. A cross-tabulation of skidding/overturning with accident severity is included in the report.

2-BE-SAFE D2 Road infrastructure and road safety for PTW
Document ID: 2BES_WP1_D2_RIandRSforPTW_Final.doc 65
2.12) Hit object in carriageway
Table 57: Hit object in carriageway query, UK 2005-2007.
Object hit in carriageway Vehicle count Percentage
None 70235 94.20
Previous accident 13 0.02
Roadworks 51 0.07
Parked vehicle 955 1.28
Bridge – roof 6 0.01
Bridge – side 17 0.02
Bollard/refuge 376 0.50
Open door of vehicle 109 0.15
Central island of roundabout 103 0.14
Kerb 1997 2.68
Other object 413 0.55
Any animal (except ridden horse) 283 0.38
In the vast majority of PTW accidents, riders avoid hitting carriageway objects (Table 57). Where an object is hit this is usually the kerb, with parked vehicles posing a stand-out hazard too. The number of accidents involving bollards or refuges is noticeably smaller, however the relatively low abundance of these (compared to kerbs or parked vehicles) suggest they may represent a greater hazard at any given location where they are present. Overall the low figures suggest that, whilst being a potentially important issue, it may not be practical to focus on objects in carriageway within the naturalistic riding study of the 2-BE-SAFE project.
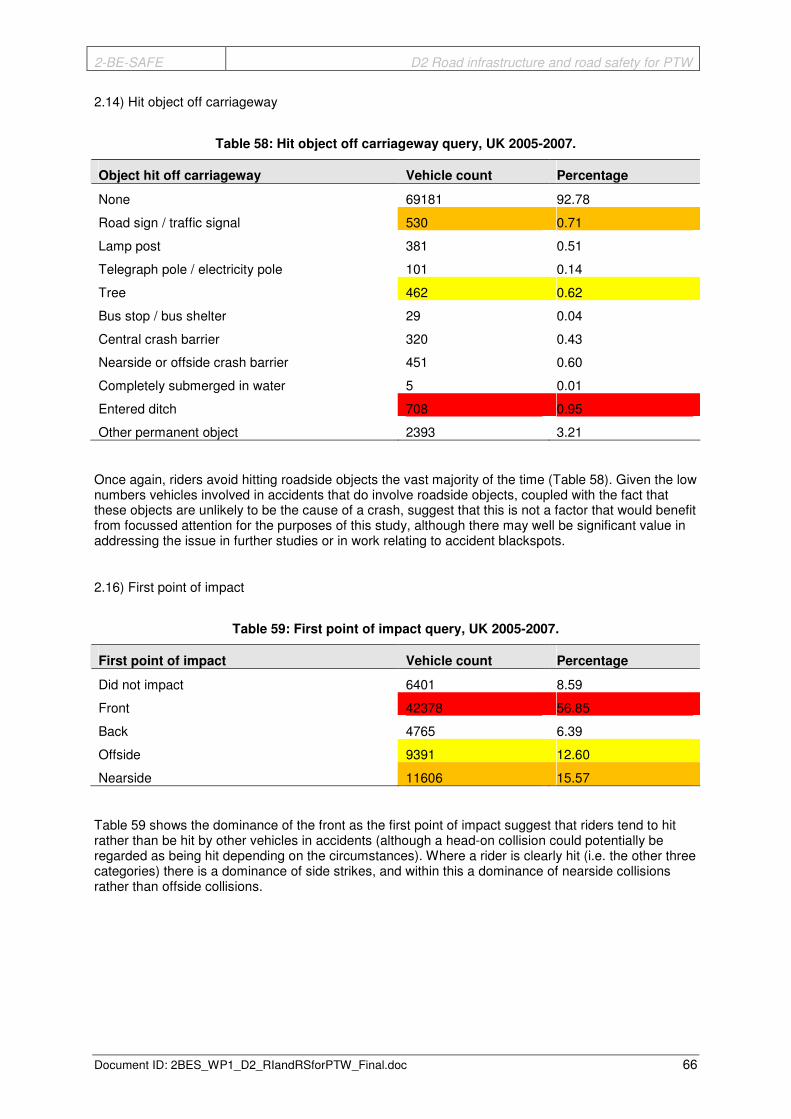
2-BE-SAFE D2 Road infrastructure and road safety for PTW
Document ID: 2BES_WP1_D2_RIandRSforPTW_Final.doc 66
2.14) Hit object off carriageway
Table 58: Hit object off carriageway query, UK 2005-2007.
Object hit off carriageway Vehicle count Percentage
None 69181 92.78
Road sign / traffic signal 530 0.71
Lamp post 381 0.51
Telegraph pole / electricity pole 101 0.14
Tree 462 0.62
Bus stop / bus shelter 29 0.04
Central crash barrier 320 0.43
Nearside or offside crash barrier 451 0.60
Completely submerged in water 5 0.01
Entered ditch 708 0.95
Other permanent object 2393 3.21
Once again, riders avoid hitting roadside objects the vast majority of the time (Table 58). Given the low numbers vehicles involved in accidents that do involve roadside objects, coupled with the fact that these objects are unlikely to be the cause of a crash, suggest that this is not a factor that would benefit from focussed attention for the purposes of this study, although there may well be significant value in addressing the issue in further studies or in work relating to accident blackspots.
2.16) First point of impact
Table 59: First point of impact query, UK 2005-2007.
First point of impact Vehicle count Percentage
Did not impact 6401 8.59
Front 42378 56.85
Back 4765 6.39
Offside 9391 12.60
Nearside 11606 15.57
Table 59 shows the dominance of the front as the first point of impact suggest that riders tend to hit rather than be hit by other vehicles in accidents (although a head-on collision could potentially be regarded as being hit depending on the circumstances). Where a rider is clearly hit (i.e. the other three categories) there is a dominance of side strikes, and within this a dominance of nearside collisions rather than offside collisions.

2-BE-SAFE D2 Road infrastructure and road safety for PTW
Document ID: 2BES_WP1_D2_RIandRSforPTW_Final.doc 67
2.22) Age of rider Table 60: Age of rider query, UK 2005-2007.
Vehicle count split Age group
Up to 50cc 51-125cc 126-500cc 501cc & over Total Count
16 5880 737 92 53 6762
17 2623 2431 287 148 5489
18 767 1875 358 238 3238
19 454 1410 289 345 2498
20 293 1080 300 400 2073
16-20 10017 7533 1326 1184 20060
21-25 935 3289 1090 3410 8724
26-30 663 2236 924 3852 7675
31-35 532 1739 873 4541 7685
36-40 455 1456 904 5390 8205
41-45 344 975 872 4854 7045
46-50 225 644 580 3242 4691
51-55 171 409 406 1982 2968
56-60 163 363 282 1268 2076
61+ 198 359 331 787 1675
Unknown 1034 1212 595 917 3758
Young riders dominate the accident statistics (Table 60). Numbers clearly tend to reduce with age, although there is a slight peak at 36-40, possibly due to an increase in numbers of people taking up or coming back into motorcycling as they approach middle age. However, young riders are clearly the group most at risk.
3.9) Severity of casualty
Table 61: Severity of casualty query, UK 2005-2007.
Incident severity Casualty count Percentage
Fatal 1722 2.3
Severe 17457 23.4
Slight 49822 66.8
No injury 5561 7.5
Motorcycle accidents result in only slight injuries the majority of the time, but severe injuries still make up nearly a quarter of riders involved in incidents (Table 61).

2-BE-SAFE D2 Road infrastructure and road safety for PTW
Document ID: 2BES_WP1_D2_RIandRSforPTW_Final.doc 68
3.4.3. Specific queries (Cross-tables between categories)
This section of the report aims to look deeper by producing cross tables between the proceeding individual data tables; thus revealing how such data categories relate to each other. However, cross table comparisons could be made between almost any two different factors, giving many possible combinations. The following are those considered to be (potentially) the most revealing. All comparisons involve an ‘attendant circumstance variable’ paired with a ‘vehicle / casualty variable’.
The results from each cross-tabulation are presented in one or more of three possible ways: 1. A cross-table showing the actual count values of incidents falling into each category. In the
interest of keeping the tables legible, rows or columns are sometimes omitted if they contain only low values.
2. A cross-table showing the count values converted into percentage. Percentages are in relation to columns rather than rows (thus the total percentages for each column will add up to 100). These tables therefore show the relative frequency of the row header categories within each column header category.
3. The same percentage data as 2 but in graph form.
All tables are colour-coded to the following format. Where a value (or values) clearly stand(s) out from the rest, this is shaded red. The next top 5 values are shaded orange and the remaining 5 from the top 10 are shaded yellow. Any values not relevant (i.e. representing a category such as ‘other’) are greyed out or the column / row omitted.
3.4.3.1. Junction detail vs. First point of impact
1.16 Junction detail
0. not at or within 20m of junction
1. roundabout
2. mini roundabout
3. T or staggered junction
5. slip road
6. crossroads
7. multiple junction
8. using private drive or entrance
9. other junction
Table 62: Junction detail vs. First point of impact (actual count values), UK 2005-2007.
Junction detail
First point of impact 0 1 2 3 5 6 7 8 9
Did not impact 2772 643 48 1865 89 467 76 200 241
Front 14140 2366 337 16402 344 3805 562 2840 1582
Back 1372 985 71 1386 81 412 92 151 215
Offside 3556 979 64 2925 158 890 129 374 316
Nearside 3757 1601 129 3985 150 895 155 558 376

2-BE-SAFE D2 Road infrastructure and road safety for PTW
Document ID: 2BES_WP1_D2_RIandRSforPTW_Final.doc 69
Table 63: Junction detail vs. First point of impact (percentage), UK 2005-2007.
Junction detail
First point of impact 0 1 2 3 5 6 7 8 9
Did not impact 10.8 9.8 7.4 7.0 10.8 7.2 7.5 4.9 8.8
Front 55.2 36.0 51.9 61.7 41.8 58.8 55.4 68.9 57.9
Back 5.4 15.0 10.9 5.2 9.9 6.4 9.1 3.7 7.9
Offside 13.9 14.9 9.9 11.0 19.2 13.8 12.7 9.1 11.6
Nearside 14.7 24.4 19.9 15.0 18.2 13.8 15.3 13.5 13.8
Figure 15: Junction detail vs. First point of impact (percentage figures in graph), UK 2005-2007.
It is likely that the first point of impact for a motorcyclist will be linked to the manoeuvre they are conducting at the time and their location. The above cross-tabs are intended to explore such a possible relationship (Table 62, Table 63 and Figure 15).
The percentage figures show that, proportionally:
• A head-on impact is more likely at a private drive or entrance or at a T-junction, and less likely at a roundabout or a slip road
• An off-side impact is more likely at a slip road and less likely at a private entrance or mini roundabout
• A nearside impact is more likely at a roundabout or mini roundabout and less likely at a crossroads or private drive
In absolute terms however, it is clear that the vast majority of accidents occur either at a T-junction or away from any kind of junction. Head-on collisions dominate the figures for both.
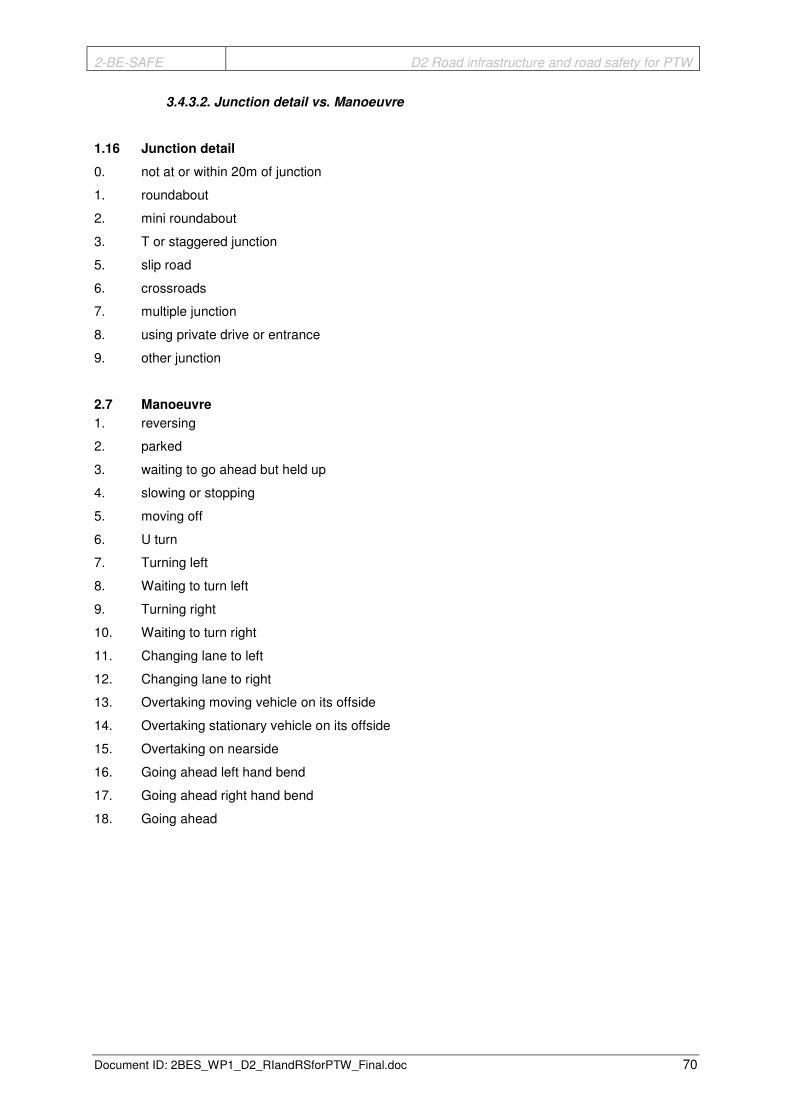
2-BE-SAFE D2 Road infrastructure and road safety for PTW
Document ID: 2BES_WP1_D2_RIandRSforPTW_Final.doc 70
3.4.3.2. Junction detail vs. Manoeuvre
1.16 Junction detail
0. not at or within 20m of junction
1. roundabout
2. mini roundabout
3. T or staggered junction
5. slip road
6. crossroads
7. multiple junction
8. using private drive or entrance
9. other junction
2.7 Manoeuvre
1. reversing
2. parked
3. waiting to go ahead but held up
4. slowing or stopping
5. moving off
6. U turn
7. Turning left
8. Waiting to turn left
9. Turning right
10. Waiting to turn right
11. Changing lane to left
12. Changing lane to right
13. Overtaking moving vehicle on its offside
14. Overtaking stationary vehicle on its offside
15. Overtaking on nearside
16. Going ahead left hand bend
17. Going ahead right hand bend
18. Going ahead
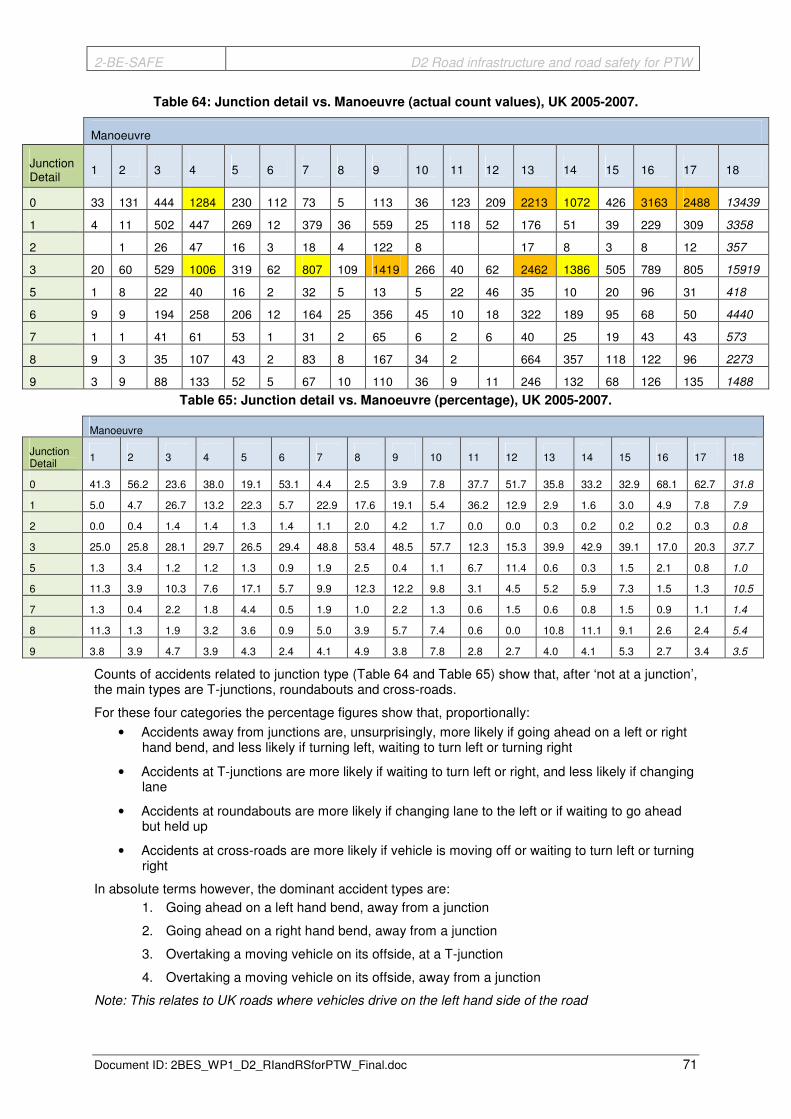
2-BE-SAFE D2 Road infrastructure and road safety for PTW
Document ID: 2BES_WP1_D2_RIandRSforPTW_Final.doc 71
Table 64: Junction detail vs. Manoeuvre (actual count values), UK 2005-2007.
Manoeuvre
Junction Detail
1 2 3 4 5 6 7 8 9 10 11 12 13 14 15 16 17 18
0 33 131 444 1284 230 112 73 5 113 36 123 209 2213 1072 426 3163 2488 13439
1 4 11 502 447 269 12 379 36 559 25 118 52 176 51 39 229 309 3358
2 1 26 47 16 3 18 4 122 8 17 8 3 8 12 357
3 20 60 529 1006 319 62 807 109 1419 266 40 62 2462 1386 505 789 805 15919
5 1 8 22 40 16 2 32 5 13 5 22 46 35 10 20 96 31 418
6 9 9 194 258 206 12 164 25 356 45 10 18 322 189 95 68 50 4440
7 1 1 41 61 53 1 31 2 65 6 2 6 40 25 19 43 43 573
8 9 3 35 107 43 2 83 8 167 34 2 664 357 118 122 96 2273
9 3 9 88 133 52 5 67 10 110 36 9 11 246 132 68 126 135 1488
Table 65: Junction detail vs. Manoeuvre (percentage), UK 2005-2007.
Manoeuvre
Junction Detail
1 2 3 4 5 6 7 8 9 10 11 12 13 14 15 16 17 18
0 41.3 56.2 23.6 38.0 19.1 53.1 4.4 2.5 3.9 7.8 37.7 51.7 35.8 33.2 32.9 68.1 62.7 31.8
1 5.0 4.7 26.7 13.2 22.3 5.7 22.9 17.6 19.1 5.4 36.2 12.9 2.9 1.6 3.0 4.9 7.8 7.9
2 0.0 0.4 1.4 1.4 1.3 1.4 1.1 2.0 4.2 1.7 0.0 0.0 0.3 0.2 0.2 0.2 0.3 0.8
3 25.0 25.8 28.1 29.7 26.5 29.4 48.8 53.4 48.5 57.7 12.3 15.3 39.9 42.9 39.1 17.0 20.3 37.7
5 1.3 3.4 1.2 1.2 1.3 0.9 1.9 2.5 0.4 1.1 6.7 11.4 0.6 0.3 1.5 2.1 0.8 1.0
6 11.3 3.9 10.3 7.6 17.1 5.7 9.9 12.3 12.2 9.8 3.1 4.5 5.2 5.9 7.3 1.5 1.3 10.5
7 1.3 0.4 2.2 1.8 4.4 0.5 1.9 1.0 2.2 1.3 0.6 1.5 0.6 0.8 1.5 0.9 1.1 1.4
8 11.3 1.3 1.9 3.2 3.6 0.9 5.0 3.9 5.7 7.4 0.6 0.0 10.8 11.1 9.1 2.6 2.4 5.4
9 3.8 3.9 4.7 3.9 4.3 2.4 4.1 4.9 3.8 7.8 2.8 2.7 4.0 4.1 5.3 2.7 3.4 3.5
Counts of accidents related to junction type (Table 64 and Table 65) show that, after ‘not at a junction’, the main types are T-junctions, roundabouts and cross-roads.
For these four categories the percentage figures show that, proportionally:
• Accidents away from junctions are, unsurprisingly, more likely if going ahead on a left or right hand bend, and less likely if turning left, waiting to turn left or turning right
• Accidents at T-junctions are more likely if waiting to turn left or right, and less likely if changing lane
• Accidents at roundabouts are more likely if changing lane to the left or if waiting to go ahead but held up
• Accidents at cross-roads are more likely if vehicle is moving off or waiting to turn left or turning right
In absolute terms however, the dominant accident types are: 1. Going ahead on a left hand bend, away from a junction
2. Going ahead on a right hand bend, away from a junction
3. Overtaking a moving vehicle on its offside, at a T-junction
4. Overtaking a moving vehicle on its offside, away from a junction
Note: This relates to UK roads where vehicles drive on the left hand side of the road

2-BE-SAFE D2 Road infrastructure and road safety for PTW
Document ID: 2BES_WP1_D2_RIandRSforPTW_Final.doc 72
3.4.3.3. Road surface condition vs. Manoeuvre
1.23 Road surface condition
1. dry
2. wet/damp
3. snow
4. frost/ice
5. flood (water surface over 3 cm deep)
2.7 Manoeuvre
1. reversing
2. parked
3. waiting to go ahead but held up
4. slowing or stopping
5. moving off
6. U turn
7. Turning left
8. Waiting to turn left
9. Turning right
10. Waiting to turn right
11. Changing lane to left
12. Changing lane to right
13. Overtaking moving vehicle on its offside
14. Overtaking stationary vehicle on its offside
15. Overtaking on nearside
16. Going ahead left hand bend
17. Going ahead right hand bend
18. Going ahead other
Table 66: Road surface condition vs. Manoeuvre (actual count values), UK 2005-2007.
Manoeuvre
Road surface condition
1 2 3 4 5 6 7 8 9 10 11 12 13 14 15 16 17 18
1 60 189 1460 2261 931 169 1233 151 2185 330 260 326 5051 2473 1059 3695 3039 31684
2 20 41 403 1052 263 41 395 51 695 128 64 75 1098 724 228 899 875 10166
3 1 1 7 1 4 6 1 3 3 1 1 5 59
4 2 10 56 8 1 20 2 30 1 2 2 21 23 4 40 46 311
5 1 5 2 1 1 4 2 21

2-BE-SAFE D2 Road infrastructure and road safety for PTW
Document ID: 2BES_WP1_D2_RIandRSforPTW_Final.doc 73
Table 67: Road surface condition vs. Manoeuvre (percentage), UK 2005-2007.
Manoeuvre
Road surface condition
1 2 3 4 5 6 7 8 9 10 11 12 13 14 15 16 17 18
1 75.0 81.1 77.9 66.9 77.4 80.1 74.6 74.0 74.9 71.6 79.8 80.9 81.8 76.7 82.0 79.7 76.6 75.0
2 25.0 17.6 21.5 31.1 21.9 19.4 23.9 25.0 23.8 27.8 19.6 18.6 17.8 22.5 17.6 19.4 22.1 24.1
3 0.0 0.4 0.1 0.2 0.1 0.0 0.2 0.0 0.2 0.2 0.0 0.0 0.0 0.1 0.1 0.0 0.1 0.1
4 0.0 0.9 0.5 1.7 0.7 0.5 1.2 1.0 1.0 0.2 0.6 0.5 0.3 0.7 0.3 0.9 1.2 0.7
5 0.0 0.0 0.1 0.1 0.0 0.0 0.0 0.0 0.1 0.2 0.0 0.0 0.0 0.0 0.0 0.1 0.1 0.0
Figure 16: Road surface condition (dry, wet/damp) vs. Manoeuvre (percentage figures in
graph), UK 2005-2007.
The percentage values show that snow, frost and flood conditions account for less than 1% of all accidents within each category of manoeuvre. The graph therefore ignores these conditions and shows only the percentages for dry and wet/damp conditions.
Notably, the figures (Table 66, Table 67 and Figure 16) show that certain manoeuvres are, proportionally, more likely to be linked to an accident when wet road conditions are present than dry road conditions. In descending order the top ones are:
1. Slowing or stopping
2. Waiting to turn right
3. Waiting to turn left
4. Reversing
5. Going ahead other
6. Turning left
7. Turning right
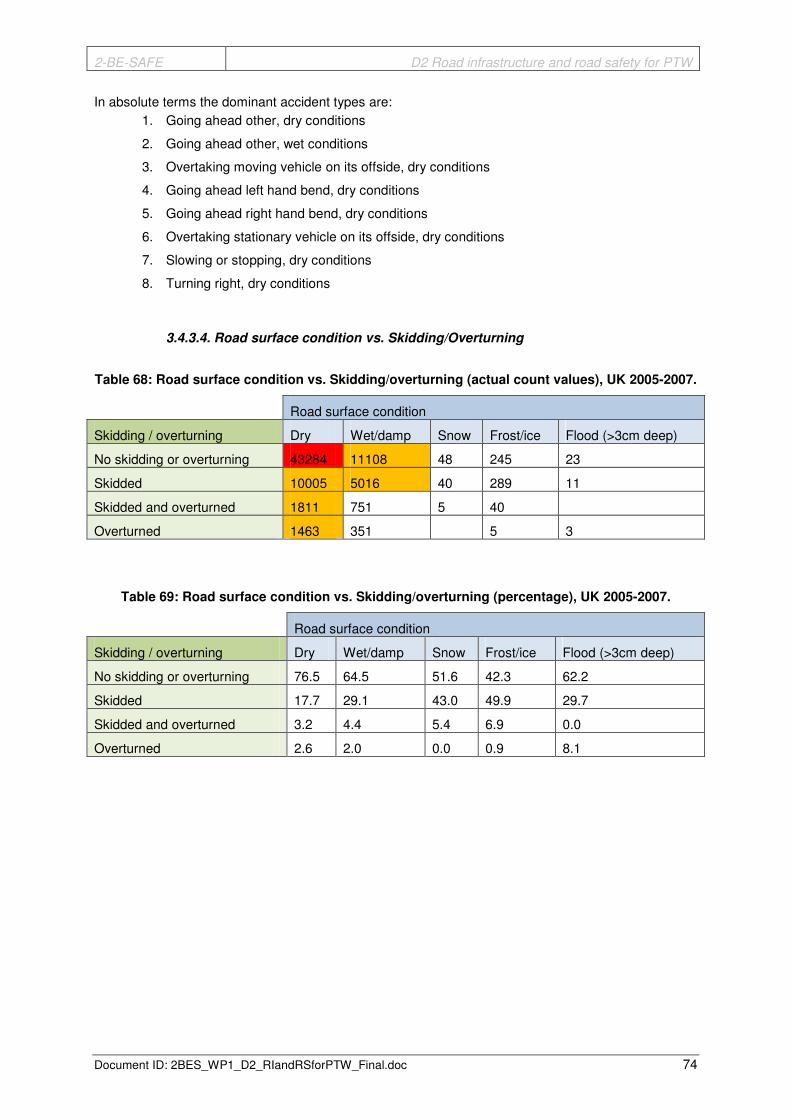
2-BE-SAFE D2 Road infrastructure and road safety for PTW
Document ID: 2BES_WP1_D2_RIandRSforPTW_Final.doc 74
In absolute terms the dominant accident types are: 1. Going ahead other, dry conditions
2. Going ahead other, wet conditions
3. Overtaking moving vehicle on its offside, dry conditions
4. Going ahead left hand bend, dry conditions
5. Going ahead right hand bend, dry conditions
6. Overtaking stationary vehicle on its offside, dry conditions
7. Slowing or stopping, dry conditions
8. Turning right, dry conditions
3.4.3.4. Road surface condition vs. Skidding/Overturning
Table 68: Road surface condition vs. Skidding/overturning (actual count values), UK 2005-2007.
Road surface condition
Skidding / overturning Dry Wet/damp Snow Frost/ice Flood (>3cm deep)
No skidding or overturning 43284 11108 48 245 23
Skidded 10005 5016 40 289 11
Skidded and overturned 1811 751 5 40
Overturned 1463 351 5 3
Table 69: Road surface condition vs. Skidding/overturning (percentage), UK 2005-2007.
Road surface condition
Skidding / overturning Dry Wet/damp Snow Frost/ice Flood (>3cm deep)
No skidding or overturning 76.5 64.5 51.6 42.3 62.2
Skidded 17.7 29.1 43.0 49.9 29.7
Skidded and overturned 3.2 4.4 5.4 6.9 0.0
Overturned 2.6 2.0 0.0 0.9 8.1

2-BE-SAFE D2 Road infrastructure and road safety for PTW
Document ID: 2BES_WP1_D2_RIandRSforPTW_Final.doc 75
Figure 17: Road surface condition vs. Skidding/overturning (percentage figures in graph), UK
2005-2007.
The results from the figures (Table 68, Table 69 and Figure 17) are what would be expected intuitively, but the clear relationship between the two factors is interesting to see. As road conditions deteriorate, skidding is much more likely as part of an accident. Compared to dry conditions, riders are over 1.6 times more likely to skid when the road is wet and over 2.8 times more likely when the ground is frosty. The likelihood of overturning also increases with deteriorating road surface condition, but to a lesser degree.
In absolute terms it is clear that no skidding (both in the dry and wet), and skidding in the dry are the most common conditions for accidents.
3.4.3.5. Road surface condition vs. Age
Table 70: Road surface condition vs. Age (actual count values), UK 2005-2007.
Road surface condition
16 17 18 19 20 16-20 21-25
26-30
31-35
36-40
41-45
46-50
51-55
56-60
61+
Dry 4748 3806 2293 1787 1493 14127 6622 5956 5971 6352 5515 3670 2295 1608 1347
Wet/damp 1922 1612 909 681 561 5685 2004 1653 1634 1765 1472 988 639 449 320
Snow 11 7 4 5 1 28 10 12 8 14 5 2 5 3
Frost/ice 70 56 28 22 16 192 75 46 57 71 44 27 27 15 8
Flood 4 3 2 1 1 11 4 3 6 1 6 3 1

2-BE-SAFE D2 Road infrastructure and road safety for PTW
Document ID: 2BES_WP1_D2_RIandRSforPTW_Final.doc 76
Table 71: Road surface condition vs. Age (percentage), UK 2005-2007.
Age
Road surface condition
16 17 18 19 20 21-25
26-30
31-35
36-40
41-45
46-50
51-55
56-60 61+
Dry 70.3 69.4 70.9 71.6 72.1 76.0 77.7 77.8 77.4 78.3 78.3 77.4 77.5 80.4
Wet/damp 28.5 29.4 28.1 27.3 27.1 23.0 21.6 21.3 21.5 20.9 21.1 21.5 21.6 19.1
Snow 0.2 0.1 0.1 0.2 0.0 0.1 0.2 0.1 0.2 0.1 0.0 0.2 0.1 0.0
Frost/ice 1.0 1.0 0.9 0.9 0.8 0.9 0.6 0.7 0.9 0.6 0.6 0.9 0.7 0.5
Flood 0.1 0.1 0.1 0.0 0.0 0.0 0.0 0.1 0.0 0.1 0.1 0.0 0.0 0.0
Figure 18: Road surface condition (dry, wet/damp) vs. Age (percentage figures in graph), UK
2005-2007.
The results (Table 70, Table 71 and Figure 18) suggest that younger riders are more susceptible to adverse road surface conditions, although it could be that they ride more often in wet conditions than older drivers. Accidents related to wet road conditions make up a higher percentage of accidents for younger drivers, with this percentage generally reducing as riders age, roughly stabilising as riders reach their mid to late 20’s. It is not clear whether this is related to age or length of riding experience.
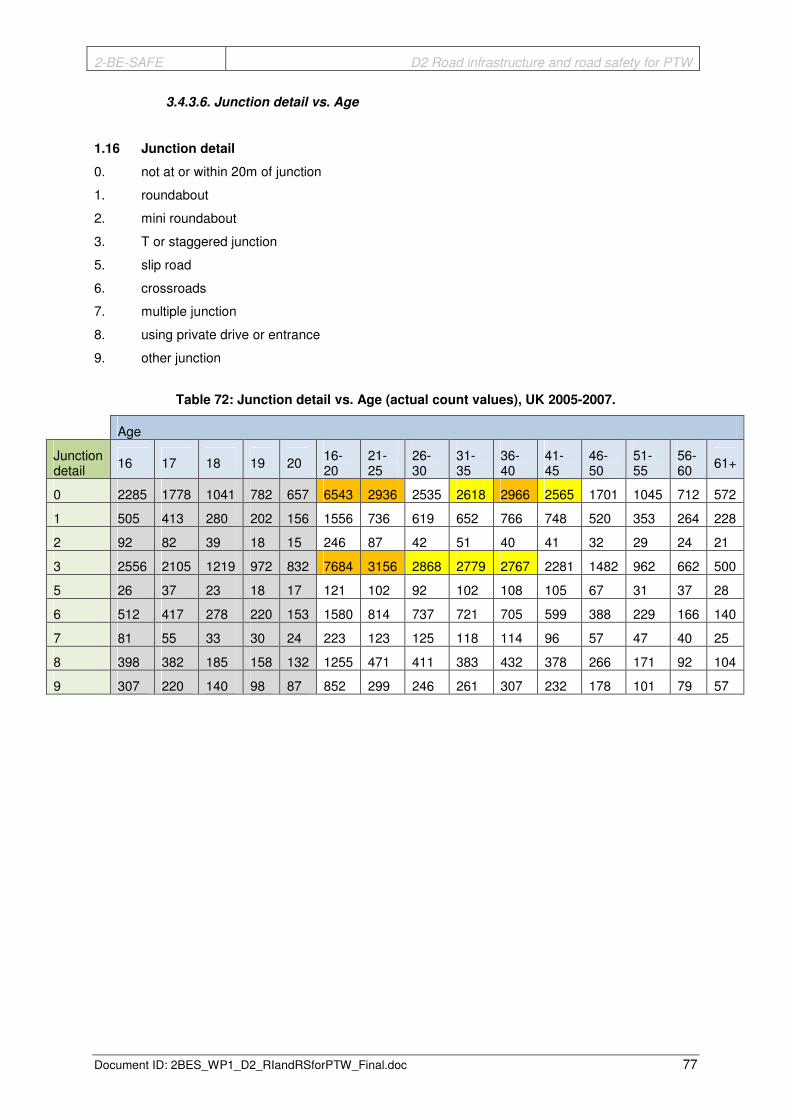
2-BE-SAFE D2 Road infrastructure and road safety for PTW
Document ID: 2BES_WP1_D2_RIandRSforPTW_Final.doc 77
3.4.3.6. Junction detail vs. Age
1.16 Junction detail
0. not at or within 20m of junction
1. roundabout
2. mini roundabout
3. T or staggered junction
5. slip road
6. crossroads
7. multiple junction
8. using private drive or entrance
9. other junction
Table 72: Junction detail vs. Age (actual count values), UK 2005-2007.
Age
Junction detail 16 17 18 19 20
16-20
21-25
26-30
31-35
36-40
41-45
46-50
51-55
56-60 61+
0 2285 1778 1041 782 657 6543 2936 2535 2618 2966 2565 1701 1045 712 572
1 505 413 280 202 156 1556 736 619 652 766 748 520 353 264 228
2 92 82 39 18 15 246 87 42 51 40 41 32 29 24 21
3 2556 2105 1219 972 832 7684 3156 2868 2779 2767 2281 1482 962 662 500
5 26 37 23 18 17 121 102 92 102 108 105 67 31 37 28
6 512 417 278 220 153 1580 814 737 721 705 599 388 229 166 140
7 81 55 33 30 24 223 123 125 118 114 96 57 47 40 25
8 398 382 185 158 132 1255 471 411 383 432 378 266 171 92 104
9 307 220 140 98 87 852 299 246 261 307 232 178 101 79 57
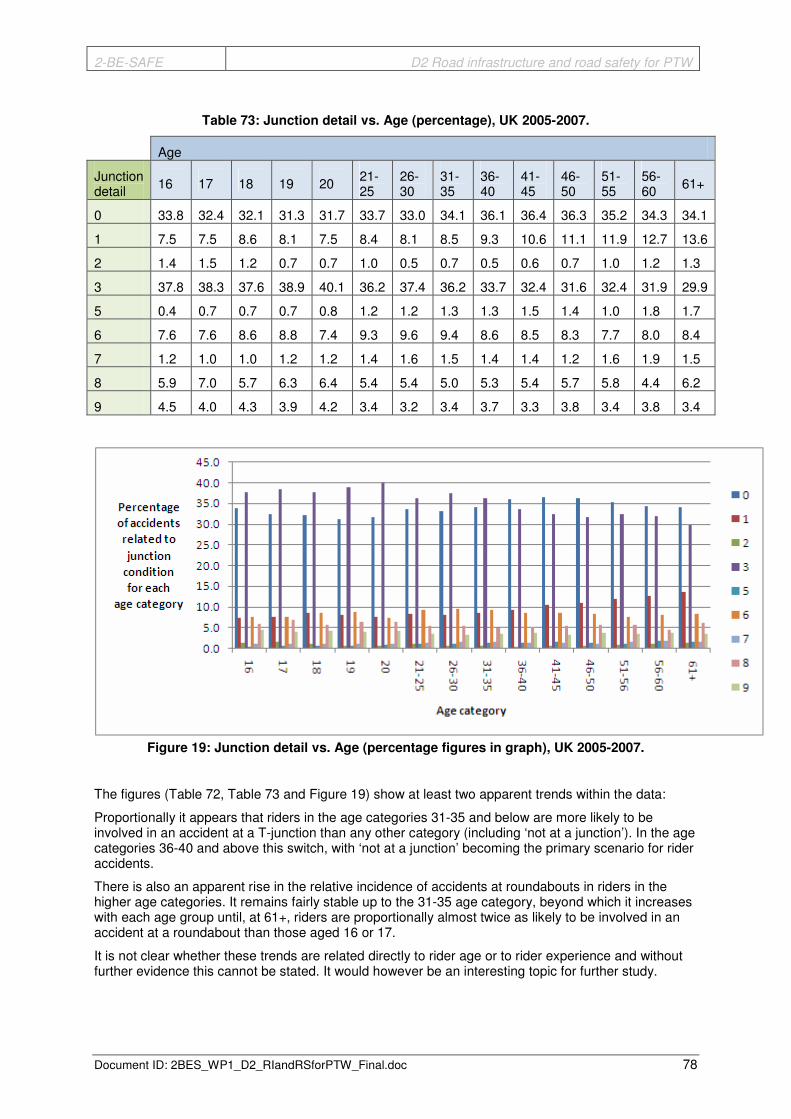
2-BE-SAFE D2 Road infrastructure and road safety for PTW
Document ID: 2BES_WP1_D2_RIandRSforPTW_Final.doc 78
Table 73: Junction detail vs. Age (percentage), UK 2005-2007.
Age
Junction detail 16 17 18 19 20
21-25
26-30
31-35
36-40
41-45
46-50
51-55
56-60 61+
0 33.8 32.4 32.1 31.3 31.7 33.7 33.0 34.1 36.1 36.4 36.3 35.2 34.3 34.1
1 7.5 7.5 8.6 8.1 7.5 8.4 8.1 8.5 9.3 10.6 11.1 11.9 12.7 13.6
2 1.4 1.5 1.2 0.7 0.7 1.0 0.5 0.7 0.5 0.6 0.7 1.0 1.2 1.3
3 37.8 38.3 37.6 38.9 40.1 36.2 37.4 36.2 33.7 32.4 31.6 32.4 31.9 29.9
5 0.4 0.7 0.7 0.7 0.8 1.2 1.2 1.3 1.3 1.5 1.4 1.0 1.8 1.7
6 7.6 7.6 8.6 8.8 7.4 9.3 9.6 9.4 8.6 8.5 8.3 7.7 8.0 8.4
7 1.2 1.0 1.0 1.2 1.2 1.4 1.6 1.5 1.4 1.4 1.2 1.6 1.9 1.5
8 5.9 7.0 5.7 6.3 6.4 5.4 5.4 5.0 5.3 5.4 5.7 5.8 4.4 6.2
9 4.5 4.0 4.3 3.9 4.2 3.4 3.2 3.4 3.7 3.3 3.8 3.4 3.8 3.4
Figure 19: Junction detail vs. Age (percentage figures in graph), UK 2005-2007.
The figures (Table 72, Table 73 and Figure 19) show at least two apparent trends within the data:
Proportionally it appears that riders in the age categories 31-35 and below are more likely to be involved in an accident at a T-junction than any other category (including ‘not at a junction’). In the age categories 36-40 and above this switch, with ‘not at a junction’ becoming the primary scenario for rider accidents.
There is also an apparent rise in the relative incidence of accidents at roundabouts in riders in the higher age categories. It remains fairly stable up to the 31-35 age category, beyond which it increases with each age group until, at 61+, riders are proportionally almost twice as likely to be involved in an accident at a roundabout than those aged 16 or 17.
It is not clear whether these trends are related directly to rider age or to rider experience and without further evidence this cannot be stated. It would however be an interesting topic for further study.

2-BE-SAFE D2 Road infrastructure and road safety for PTW
Document ID: 2BES_WP1_D2_RIandRSforPTW_Final.doc 79
3.4.3.7. Age vs. Manoeuvre
2.7 Manoeuvre
1. reversing
2. parked
3. waiting to go ahead but held up
4. slowing or stopping
5. moving off
6. U turn
7. Turning left
8. Waiting to turn left
9. Turning right
10. Waiting to turn right
11. Changing lane to left
12. Changing lane to right
13. Overtaking moving vehicle on its offside
14. Overtaking stationary vehicle on its offside
15. Overtaking on nearside
16. Going ahead left hand bend
17. Going ahead right hand bend
18. Going ahead other
Table 74: Age vs. Manoeuvre (actual count values), UK 2005-2007.
Age
Manoeuvre 16 17 18 19 20 16-20 21-25 26-30 31-35 36-40 41-45 46-50 51-55 56-60 61+
1 9 4 3 3 1 20 4 13 9 6 7 5 2 3 1
2 17 12 6 3 1 39 11 19 14 27 20 22 8 14 8
3 125 107 40 38 37 347 172 199 192 242 228 209 118 58 69
4 368 287 158 121 80 1014 374 316 306 348 321 244 164 99 92
5 120 86 53 27 32 318 122 107 103 138 126 82 47 42 41
6 37 19 10 3 1 70 19 20 16 17 24 8 8 6 5
7 199 121 83 55 43 501 167 173 162 121 136 112 58 51 46
8 10 9 5 2 4 30 18 27 30 31 20 13 10 7 11
9 398 264 161 113 89 1025 319 239 251 261 232 124 110 87 94
10 77 43 17 8 3 148 43 38 46 55 54 20 21 16 10
11 17 6 13 9 5 50 46 32 34 40 52 21 17 15 8
12 28 19 8 4 10 69 49 50 52 50 42 29 14 11 18
13 377 405 283 193 167 1425 791 711 738 718 640 397 258 147 103
14 304 253 138 125 81 901 394 357 338 356 298 172 120 88 57

2-BE-SAFE D2 Road infrastructure and road safety for PTW
Document ID: 2BES_WP1_D2_RIandRSforPTW_Final.doc 80
15 95 94 44 45 29 307 161 166 161 134 124 81 35 31 13
16 302 260 161 143 119 985 566 482 519 614 527 351 228 143 108
17 308 262 167 130 113 980 489 379 440 485 403 292 175 132 96
18 3969 3236 1888 1476 1258 11827 4979 4346 4273 4561 3791 2508 1574 1126 893
Table 75: Age vs. Manoeuvre (percentage), excluding “going ahead other”, UK 2005-2007.
Age
Manoeuvre 16 17 18 19 20 21-25
26-30
31-35
36-40
41-45
46-50
51-55
56-60
61+
1 0.3 0.2 0.2 0.3 0.1 0.1 0.4 0.3 0.2 0.2 0.2 0.1 0.3 0.1
2 0.6 0.5 0.4 0.3 0.1 0.3 0.6 0.4 0.7 0.6 1.0 0.6 1.5 1.0
3 4.5 4.8 3.0 3.7 4.5 4.6 6.0 5.6 6.6 7.0 9.6 8.5 6.1 8.8
4 13.2 12.7 11.7 11.8 9.8 10.0 9.5 9.0 9.6 9.9 11.2 11.8 10.4 11.8
5 4.3 3.8 3.9 2.6 3.9 3.3 3.2 3.0 3.8 3.9 3.8 3.4 4.4 5.3
6 1.3 0.8 0.7 0.3 0.1 0.5 0.6 0.5 0.5 0.7 0.4 0.6 0.6 0.6
7 7.1 5.4 6.1 5.4 5.3 4.5 5.2 4.7 3.3 4.2 5.1 4.2 5.4 5.9
8 0.4 0.4 0.4 0.2 0.5 0.5 0.8 0.9 0.9 0.6 0.6 0.7 0.7 1.4
9 14.3 11.7 11.9 11.1 10.9 8.5 7.2 7.4 7.2 7.1 5.7 7.9 9.2 12.1
10 2.8 1.9 1.3 0.8 0.4 1.1 1.1 1.3 1.5 1.7 0.9 1.5 1.7 1.3
11 0.6 0.3 1.0 0.9 0.6 1.2 1.0 1.0 1.1 1.6 1.0 1.2 1.6 1.0
12 1.0 0.8 0.6 0.4 1.2 1.3 1.5 1.5 1.4 1.3 1.3 1.0 1.2 2.3
13 13.5 18.0 21.0 18.9 20.5 21.1 21.4 21.6 19.7 19.7 18.2 18.5 15.5 13.2
14 10.9 11.2 10.2 12.2 9.9 10.5 10.7 9.9 9.8 9.2 7.9 8.6 9.3 7.3
15 3.4 4.2 3.3 4.4 3.6 4.3 5.0 4.7 3.7 3.8 3.7 2.5 3.3 1.7
16 10.8 11.6 11.9 14.0 14.6 15.1 14.5 15.2 16.9 16.2 16.1 16.4 15.1 13.8
17 11.0 11.6 12.4 12.7 13.9 13.1 11.4 12.9 13.3 12.4 13.4 12.6 13.9 12.3

2-BE-SAFE D2 Road infrastructure and road safety for PTW
Document ID: 2BES_WP1_D2_RIandRSforPTW_Final.doc 81
Figure 20: Age vs. Manoeuvre (percentage figures in graph), UK 2005-2007.
The data do not appear to show any clear relationships between ages and manoeuvre (Table 74, Table 75 and Figure 20). There do seem to be some systematic variations within the data, but further analysis will be required to determine if these are statistically significant.
Of the 18 manoeuvre categories, there are three which stand out as showing the greatest variability with respect to rider age (9, 13 & 16), see Figure 20. These are also among the most numerous of manoeuvres in terms of accident which adds further interest.
Turning right appears to feature in a steadily reducing proportion of accidents as age group increases (roughly 14% of accidents among 16 year olds but under 6% among 46-50 year olds). Above 50 however the rate increases, reaching a rate similar to under 20’s in the 61 and over age category.
Overtaking a moving vehicle on its offside is a manoeuvre that is prominent in accidents involving the young and early middle aged (although interestingly not so much for 16 year olds, speculation is that the low powered scooters available to 16 year olds are less often presented with overtaking opportunities). In the middle aged and upwards age categories this manoeuvre drops off in terms of accident involvement rate. Finally, accidents when going ahead on a left hand bend appear to be most prominent in the upper middle age categories. Rates show a general increase from younger to older categories, with a broad peak between the ages of 36 to 55. Once again, the rate begins to drop off in the oldest age categories.

2-BE-SAFE D2 Road infrastructure and road safety for PTW
Document ID: 2BES_WP1_D2_RIandRSforPTW_Final.doc 82
3.4.3.8. Speed Limit vs. Casualty Severity
Table 76: Speed Limit vs. Casualty Severity (actual count values), UK 2005-2007.
Speed Limit
Casualty Severity 20 30 40 50 60 70
Fatal 5 431 194 91 862 139
Severe 58 9449 1653 610 4742 944
Slight 190 35150 4274 1299 7157 1752
No injury 49 4404 301 98 566 143
Table 77: Speed Limit vs. Casualty Severity (percentage), UK 2005-2007.
Speed Limit
Casualty Severity 20 30 40 50 60 70
Fatal 1.66 0.87 3.02 4.34 6.47 4.67
Severe 19.21 19.11 25.74 29.08 35.58 31.70
Slight 62.91 71.10 66.55 61.92 53.70 58.83
No injury 16.23 8.91 4.69 4.67 4.25 4.80
Figure 21: Speed Limit vs. Casualty Severity (percentage figures in graph), UK 2005-2007.
Despite accidents in 30 mph speed limit areas being by far the most common, the data (Table 76, Table 77 and Figure 21) show that this is offset slightly by the fact that as speed limit increases, accidents tend to involve a higher proportion of serious injury or death to riders. Interestingly, this trend peaks on 60 mph roads, with a reduction in serious or fatal injuries on 70 mph roads. It is possible that this is due in part to 70 mph roads being exclusively dual-carriageway and therefore effectively ruling out the opportunity for head-on collisions.

2-BE-SAFE D2 Road infrastructure and road safety for PTW
Document ID: 2BES_WP1_D2_RIandRSforPTW_Final.doc 83
3.4.3.9. Skidding/Overturning vs. Casualty Severity
Table 78: Skidding/overturning vs. Casualty Severity (actual count values), UK 2005-2007.
Skidding/Overturning
Casualty Severity No skidding or overturning
Skidded Skidded & overturned
Overturned
Fatal 887 625 149 61
Severe 11609 4338 876 630
Slight 37319 9922 1505 1075
No injury 4943 484 77 57
Table 79: Skidding/overturning vs. Casualty Severity (percentage), UK 2005-2007.
Skidding/Overturning
Casualty Severity No skidding or overturning
Skidded Skidded & overturned
Overturned
Fatal 1.62 4.07 5.72 3.35
Severe 21.20 28.23 33.60 34.56
Slight 68.15 64.56 57.73 58.97
No injury 9.03 3.15 2.95 3.13
Figure 22: Skidding/overturning vs. Casualty Severity (percentage figures in graph), UK 2005-
2007.
It is clear from the data (Table 78, Table 79 and Figure 22) that PTW accidents tend to be more severe if skidding or overturning of the bike is involved, with a higher proportion of fatal or serious injuries. Overturning appears to be particularly linked to an increase in the proportion of serious injuries.

2-BE-SAFE D2 Road infrastructure and road safety for PTW
Document ID: 2BES_WP1_D2_RIandRSforPTW_Final.doc 84
3.4.3.10. Road class vs. Road type vs. Speed limit
Figure 23: Road class vs. Road type vs. Speed limit, UK 2005-2007.
Figure 23 and Table 80 show the top 12 most common infrastructure factor combinations by number of incidents (those with over 1000 incidents). Note that this refers to absolute frequency only and does not take exposure into account.
Table 80: Road class vs. Road type vs. Speed limit, UK 2005-2007.
Infrastructure category code
Road class Road type Speed limit
1 A Single carriageway 30
2 Unclassified Single carriageway 30
3 A Single carriageway 60
4 B Single carriageway 30
5 C Single carriageway 30
6 B Single carriageway 60
7 A Single carriageway 40
8 A Dual carriageway 30
9 Unclassified Single carriageway 60
10 A Roundabout 30
11 A Dual carriageway 40
12 C Single carriageway 60
In addition to the previous cross tabulations, some additional cross-tabulations were compiled to compare larger numbers of factors. Road class, road type and speed limit were regarded to relate to very similar elements, each being intrinsic to the road infrastructure. The above table therefore gives an overall hierarchy of dominant roads infrastructure factors in PTW accidents in GB.
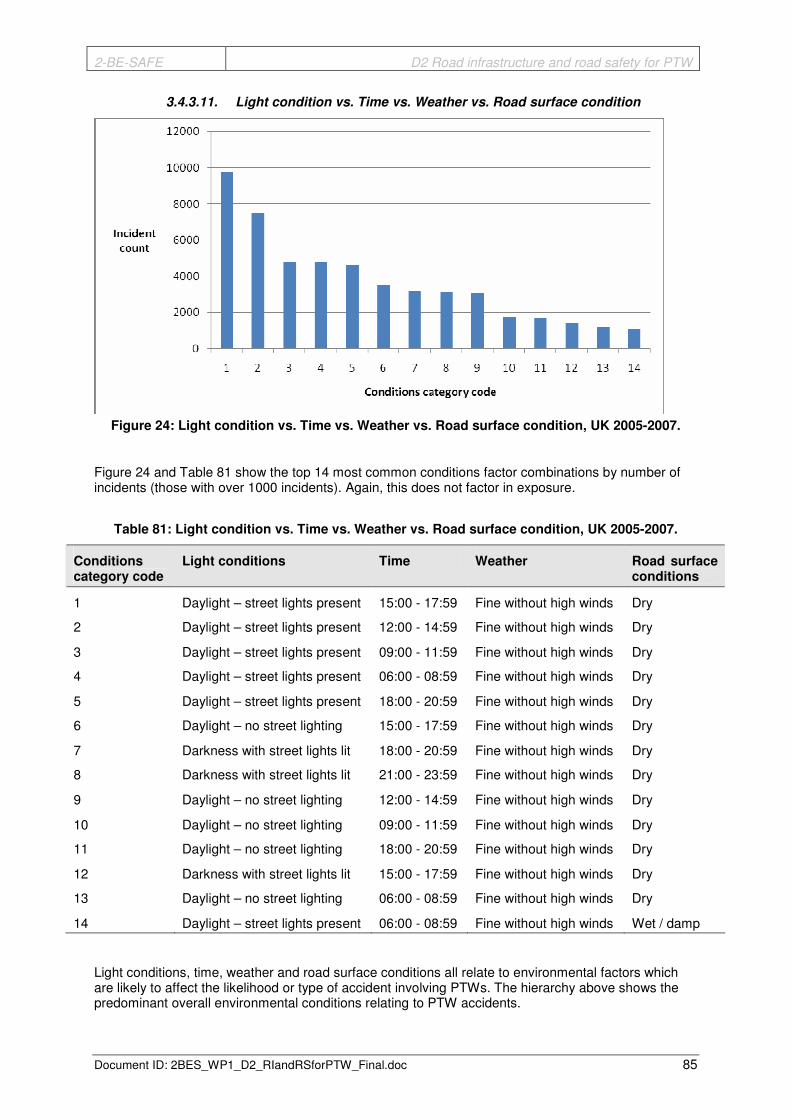
2-BE-SAFE D2 Road infrastructure and road safety for PTW
Document ID: 2BES_WP1_D2_RIandRSforPTW_Final.doc 85
3.4.3.11. Light condition vs. Time vs. Weather vs. Road surface condition
Figure 24: Light condition vs. Time vs. Weather vs. Road surface condition, UK 2005-2007.
Figure 24 and Table 81 show the top 14 most common conditions factor combinations by number of incidents (those with over 1000 incidents). Again, this does not factor in exposure.
Table 81: Light condition vs. Time vs. Weather vs. Road surface condition, UK 2005-2007.
Conditions category code
Light conditions Time Weather Road surface conditions
1 Daylight – street lights present 15:00 - 17:59 Fine without high winds Dry
2 Daylight – street lights present 12:00 - 14:59 Fine without high winds Dry
3 Daylight – street lights present 09:00 - 11:59 Fine without high winds Dry
4 Daylight – street lights present 06:00 - 08:59 Fine without high winds Dry
5 Daylight – street lights present 18:00 - 20:59 Fine without high winds Dry
6 Daylight – no street lighting 15:00 - 17:59 Fine without high winds Dry
7 Darkness with street lights lit 18:00 - 20:59 Fine without high winds Dry
8 Darkness with street lights lit 21:00 - 23:59 Fine without high winds Dry
9 Daylight – no street lighting 12:00 - 14:59 Fine without high winds Dry
10 Daylight – no street lighting 09:00 - 11:59 Fine without high winds Dry
11 Daylight – no street lighting 18:00 - 20:59 Fine without high winds Dry
12 Darkness with street lights lit 15:00 - 17:59 Fine without high winds Dry
13 Daylight – no street lighting 06:00 - 08:59 Fine without high winds Dry
14 Daylight – street lights present 06:00 - 08:59 Fine without high winds Wet / damp
Light conditions, time, weather and road surface conditions all relate to environmental factors which are likely to affect the likelihood or type of accident involving PTWs. The hierarchy above shows the predominant overall environmental conditions relating to PTW accidents.

2-BE-SAFE D2 Road infrastructure and road safety for PTW
Document ID: 2BES_WP1_D2_RIandRSforPTW_Final.doc 86
3.4.4. Summary of Findings – Great Britain
Within this report the STATS19 accident data were looked at in different ways providing various levels of complexity. At the highest level, simple frequency counts for the different accident measures showed which were the most common within the data.
Delving deeper, cross-tabulations between pairs of these measures provided similar frequency counts, but also yielded information on how factors related to each other, as well as giving an indication of the relative frequencies of accident types for specific infrastructure elements. In this way, not only did the analysis reveal the most frequent accident types overall, but also which infrastructure elements were more prone to particular types of incident. It is hoped that these data will prove useful in helping to determine the reasons for accidents and therefore how best to prevent them.
The final level of analysis combined multiple factors to identify on overall hierarchy of accident variables related to infrastructure. It is hoped that this hierarchy will allow researchers to identify which combinations of infrastructure elements are most frequently involved in PTW accidents and therefore to target these in later work packages of the project. This should allow the study to target those accident types most frequently represented in the accident statistics, at the minimum cost.
The following is a summary of the key findings:
• A roads are by far the most common road class for collisions by motorcyclists in the UK, making up almost half of all incidents, and with an ‘incident per 1000 km’ rate of over double that in second place.
• Almost 85% of accidents occur during fine weather without high winds, and over 75% with dry road surface conditions.
• Only just under 6% of accidents involve a carriageway object (not including a moving vehicle) being hit.
• The majority of accidents involve a frontal impact, i.e. the motorcycle hitting a vehicle/object rather than being hit by another vehicle.
• Young riders are proportionally more likely to have an accident when the road is wet/damp than older riders.
• Up to their early to mid thirties the most likely location for riders to have an accident is at a T-junction. Above this age, the most likely location to have an accident is away from any form of road junction. Older riders are also proportionally more likely to have an accident at a roundabout than younger riders.
• By far the most common combinations of infrastructure features in motorbike accidents are either A or unclassified roads, single carriageway and 30 mph speed limit.
• Prevailing conditions will, for the vast majority of the time, be during daylight hours with fine, dry weather and low winds.
2-BE-SAFE D2 Road infrastructure and road safety for PTW
Document ID: 2BES_WP1_D2_RIandRSforPTW_Final.doc 87
3.5. Interaction between Powered Two-Wheeler Accidents and Infrastructure in Italy
3.5.1. Methodology – Italian Data Base and Available Data
In Italy traffic accidents are documented by public authorities (ISTAT). Accidents included in the national database must have occurred on a public roadway and involved at least one injured person. However since their public authorities are not systematically informed of all the accidents, their presence is guaranteed only whenever the presence of an ambulance for medical assistance is required. In fact in this case there is an exchange of information between the medical care network and the public authorities, while there is no guarantee of their presence at the accident scene if the injured person can move autonomously to the hospital.
Base for statistical analysis: The following analysis was performed using data extracted from the Italian national database, years 2005-2007. In this period 261.475 accidents involving at least one PTW (moped – 10.7901; 41.3% –, motorcycle or scooter – 15.3574; 58.7% –) were registered.
An aggregate data analysis was performed for all the PTW types since the attention was mainly concentrated on the link between accidents and road infrastructure, which is the general aim of activity 1.2. For each query the following information was extracted:
• number of accidents;
• total deaths;
• total injured.
In addition the severity index parameter, defined as the number of deaths over the number of deaths plus injured people, was computed.
The following database fields were considered relevant for the analysis: • road type (one carriageway – single way; one carriageway – two ways; two carriageways;
more than two carriageways);
• accident type;
• (no-)junction type;
• pavement type;
• pavement state;
• age first delivery license (PTW rider);
• information on traffic signals;
• PTW rider’s age;
• weather condition;
• time of the accident.
The following cross tables were created to analyse the data more in detail: • road type vs. accident type;
• (no-)junction type vs. accident type;
• pavement state vs. year first delivery licence (PTW rider);
• pavement state vs. pavement type;
• information on traffic signals vs. road type;
• information on traffic signals vs. (no-)junction type;
• (no-)junction type vs. PTW rider’s age;
• weather condition vs. time of the accident.

2-BE-SAFE D2 Road infrastructure and road safety for PTW
Document ID: 2BES_WP1_D2_RIandRSforPTW_Final.doc 88
3.5.2. Overview of Interaction between PTW Accidents and Infrastructure in Italy
The majority of PTW accidents (68%) happen on roads with one carriageway and two ways (Figure 25), while the number of accident is equally distributed over junctions/no-junctions (Figure 26). The majority of accidents are on dry roads (89%), while minor percentages on wet road (9%) and slippery (2%) and the other conditions have no relevance (Figure 27). Regarding the weather conditions, the majority of accidents occur with clear weather (89%) and only a minority with rain (5%), (Figure 28). In order to read the latter data, the average number of days with over 1.0mm of rain, ranges between 153 and 77 in Italy (Climatological data by national environmental information system: SCIA system of the APAT, 2009). The range is restricted to 138 – 77 if the more mountainous regions of the country are eliminated, which include scarcely populated areas.
Figure 25: PTW accidents by road type, Italy 2005-2007.
Figure 26: PTW accidents by intersection, Italy 2005-2007.
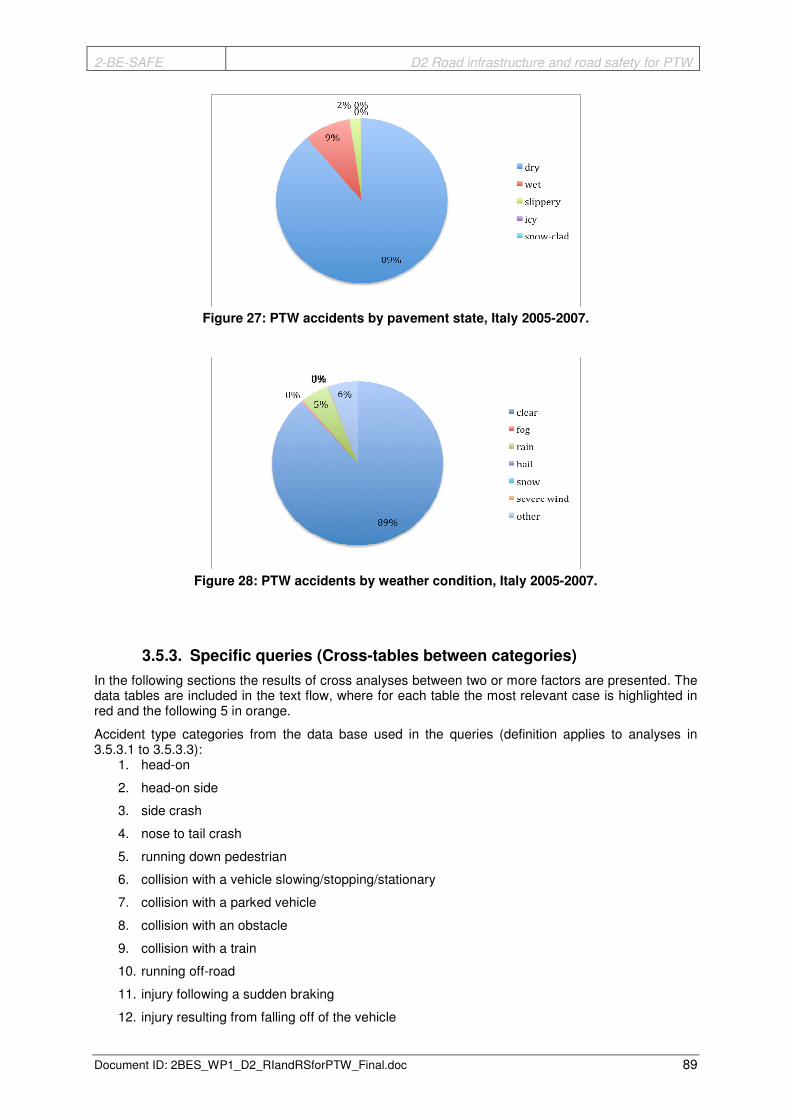
2-BE-SAFE D2 Road infrastructure and road safety for PTW
Document ID: 2BES_WP1_D2_RIandRSforPTW_Final.doc 89
Figure 27: PTW accidents by pavement state, Italy 2005-2007.
Figure 28: PTW accidents by weather condition, Italy 2005-2007.
3.5.3. Specific queries (Cross-tables between categories)
In the following sections the results of cross analyses between two or more factors are presented. The data tables are included in the text flow, where for each table the most relevant case is highlighted in red and the following 5 in orange.
Accident type categories from the data base used in the queries (definition applies to analyses in 3.5.3.1 to 3.5.3.3):
1. head-on
2. head-on side
3. side crash
4. nose to tail crash
5. running down pedestrian
6. collision with a vehicle slowing/stopping/stationary
7. collision with a parked vehicle
8. collision with an obstacle
9. collision with a train
10. running off-road
11. injury following a sudden braking
12. injury resulting from falling off of the vehicle
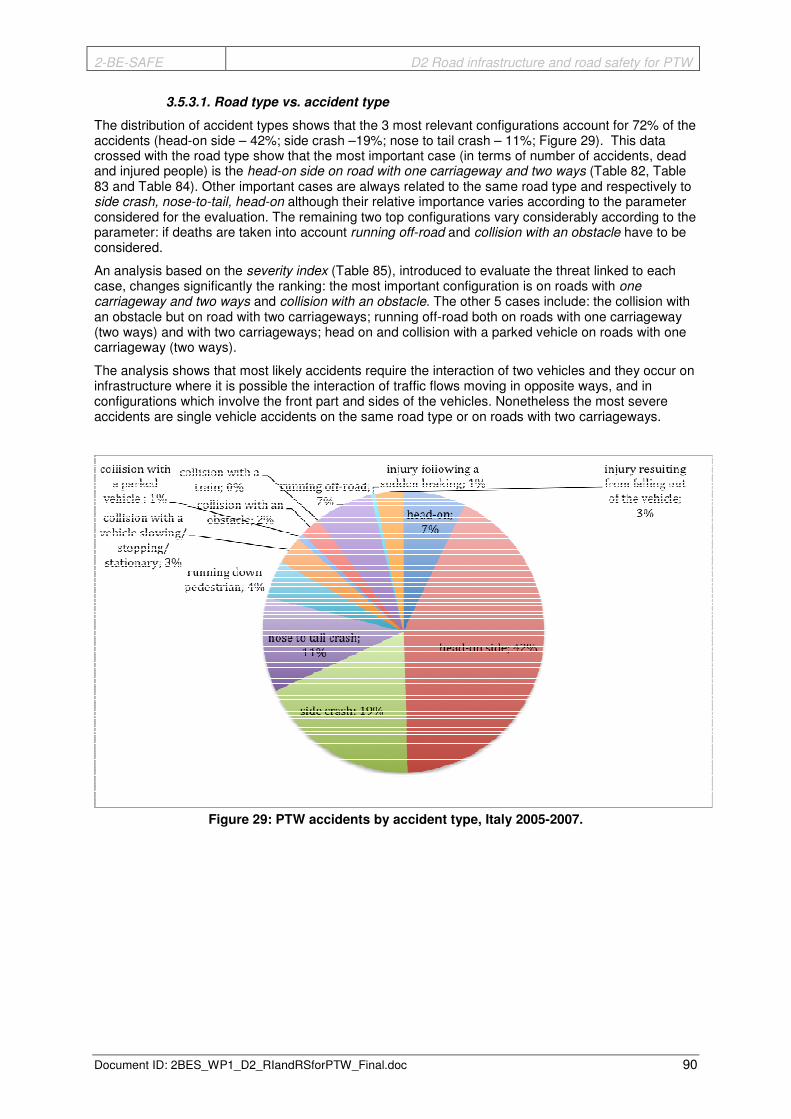
2-BE-SAFE D2 Road infrastructure and road safety for PTW
Document ID: 2BES_WP1_D2_RIandRSforPTW_Final.doc 90
3.5.3.1. Road type vs. accident type
The distribution of accident types shows that the 3 most relevant configurations account for 72% of the accidents (head-on side – 42%; side crash –19%; nose to tail crash – 11%; Figure 29). This data crossed with the road type show that the most important case (in terms of number of accidents, dead and injured people) is the head-on side on road with one carriageway and two ways (Table 82, Table 83 and Table 84). Other important cases are always related to the same road type and respectively to side crash, nose-to-tail, head-on although their relative importance varies according to the parameter considered for the evaluation. The remaining two top configurations vary considerably according to the parameter: if deaths are taken into account running off-road and collision with an obstacle have to be considered.
An analysis based on the severity index (Table 85), introduced to evaluate the threat linked to each case, changes significantly the ranking: the most important configuration is on roads with one carriageway and two ways and collision with an obstacle. The other 5 cases include: the collision with an obstacle but on road with two carriageways; running off-road both on roads with one carriageway (two ways) and with two carriageways; head on and collision with a parked vehicle on roads with one carriageway (two ways).
The analysis shows that most likely accidents require the interaction of two vehicles and they occur on infrastructure where it is possible the interaction of traffic flows moving in opposite ways, and in configurations which involve the front part and sides of the vehicles. Nonetheless the most severe accidents are single vehicle accidents on the same road type or on roads with two carriageways.
Figure 29: PTW accidents by accident type, Italy 2005-2007.

2-BE-SAFE D2 Road infrastructure and road safety for PTW
Document ID: 2BES_WP1_D2_RIandRSforPTW_Final.doc 91
Table 82: Road type vs. accident type – actual count values (accidents), Italy 2005-2007.
accident type
1 2 3 4 5 6 7 8 9 10 11 12
One
carriageway
(one way) 2098 17230 9975 4771 2281 2075 527 1337 0 3081 266 1905
One
carriageway
(two ways) 15469 80378 30049 18096 7195 4835 1024 3590 5 11038 830 5212
Two
carriageways 966 10037 6921 4555 1199 1216 243 1029 0 2690 213 1048
road type
More than two
carriageways 227 3084 1647 886 618 410 51 249 0 607 42 270
Table 83: Road type vs. accident type – actual count values (deaths), Italy 2005-2007.
accident type
1 2 3 4 5 6 7 8 9 10 11 12
One
carriageway
(one way) 25 102 48 27 33 20 11 23 0 43 0 8
One
carriageway
(two ways) 758 1497 330 289 182 91 34 230 0 518 10 88
Two
carriageways 28 135 56 77 37 18 7 44 0 105 0 20
road type
More than two
carriageways 5 31 9 3 22 3 0 4 0 5 0 2
Table 84: Road type vs. accident type – actual count values (injured), Italy 2005-2007.
accident type
1 2 3 4 5 6 7 8 9 10 11 12
One
carriageway
(one way) 2451 20541 11464 5740 3168 2391 548 1425 0 3305 281 2047
One
carriageway
(two ways) 19021 94867 34807 21982 10359 5576 1075 3655 5 11390 884 5476
Two
carriageways 1154 11873 8000 5633 1726 1434 260 1072 0 2863 228 1128
road type
More than two
carriageways 283 3656 1848 1080 953 481 55 258 0 626 42 293

2-BE-SAFE D2 Road infrastructure and road safety for PTW
Document ID: 2BES_WP1_D2_RIandRSforPTW_Final.doc 92
Table 85: Road type vs. accident type – severity index*100, Italy 2005-2007.
accident type
1 2 3 4 5 6 7 8 9 10 11 12
One
carriageway
(one way) 1,01 0,49 0,42 0,47 1,03 0,83 1,97 1,59 - 1,28 0,00 0,39
One
carriageway
(two ways) 3,83 1,55 0,94 1,30 1,73 1,61 3,07 5,92 0,00 4,35 1,12 1,58
Two
carriageways 2,37 1,12 0,70 1,35 2,10 1,24 2,62 3,94 - 3,54 0,00 1,74
road type
More than two
carriageways 1,74 0,84 0,48 0,28 2,26 0,62 0,00 1,53 - 0,79 0,00 0,68
3.5.3.2. Junction type vs. accident type
The results indicate that the most relevant cases occur at cross roads and indicated junction (with or without traffic lights) for the most frequent accident types (Table 86, Table 87 and Table 88). In terms of absolute values the most important case is always accident at a cross road / head-on side. These figures indicate that roundabouts should be preferred to intersect traffic flows, since they are associated both to a low number of accidents and to low severity index, although quite common both in urban and extra urban areas. On the contrary crossroads and indicated junctions are highly dangerous for riders and thus they should be a preferred data to study interactions among vehicles and PTWs.
If the severity index is considered the most relevant accident cases involve level crossing (3 out of 6 cases), but the numerical relevance is extremely low (Table 89). The remaining high severity cases are: junction not indicated / collision with a parked vehicle; roundabout both collision with an obstacle and running-off road. In this analysis the severity index identifies accident cases with a very low number of recorded accidents, which limits the validity of the most dangerous scenarios.
Table 86: Junction type vs. accident type – actual count values (accidents), Italy 2005-2007.
accident type
1 2 3 4 5 6 7 8 9 10 11 12
cross road 4841 38445 11115 4807 1162 841 114 486 0 1144 176 881
roundabout 329 3261 1825 721 125 132 18 208 0 714 40 400
junction indicated 2639 20686 5487 2631 544 482 75 225 0 1083 91 379
junction indicated
by a traffic light or
warden 1269 9907 3969 1991 645 610 22 295 0 975 86 344
junction not
indicated 723 4167 1370 539 110 101 26 48 0 175 24 71
Junction
level crossing 12 33 14 15 3 3 1 11 5 11 0 6

2-BE-SAFE D2 Road infrastructure and road safety for PTW
Document ID: 2BES_WP1_D2_RIandRSforPTW_Final.doc 93
Table 87: Junction type vs. accident type – actual count values (deaths), Italy 2005-2007.
accident type
1 2 3 4 5 6 7 8 9 10 11 12
cross road 137 478 107 51 19 12 3 15 0 18 1 5
roundabout 8 32 7 8 0 0 0 12 0 30 1 1
junction indicated 106 399 55 44 17 5 1 4 0 13 0 1
junction indicated by
a traffic light or
warden 24 104 24 10 10 1 1 1 0 4 0 1
junction not
indicated 14 66 9 6 3 2 3 1 0 5 0 1
Junction
level crossing 1 2 0 0 0 0 0 4 0 0 0 0
Table 88: Junction type vs. accident type – actual count values (injured), Italy 2005-2007.
accident type
1 2 3 4 5 6 7 8 9 10 11 12
cross road 5794 45847 12995 5876 1576 995 125 514 0 1207 184 951
roundabout 373 3674 2009 812 160 152 18 213 0 733 39 425
junction indicated 3095 23944 6263 3187 771 549 79 231 0 1129 96 394
junction indicated
by a traffic light or
warden 1536 11852 4490 2413 960 692 24 302 0 1005 90 364
junction not
indicated 851 4958 1617 650 161 118 27 51 0 183 24 81
Junction
level crossing 15 39 16 23 4 3 2 7 5 13 0 6
Table 89: Junction type vs. accident type – severity index*100, Italy 2005-2007.
accident type
1 2 3 4 5 6 7 8 9 10 11 12
cross road 2,31 1,03 0,82 0,86 1,19 1,19 2,34 2,84 - 1,47 0,54 0,52
roundabout 2,10 0,86 0,35 0,98 0,00 0,00 0,00 5,33 - 3,93 2,50 0,23
junction indicated 3,31 1,64 0,87 1,36 2,16 0,90 1,25 1,70 - 1,14 0,00 0,25
junction indicated by
a traffic light or
warden 1,54 0,87 0,53 0,41 1,03 0,14 4,00 0,33 - 0,40 0,00 0,27
junction not
indicated 1,62 1,31 0,55 0,91 1,83 1,67 10,00 1,92 - 2,66 0,00 1,22
Junction
level crossing 6,25 4,88 0,00 0,00 0,00 0,00 0,00 36,36 0,00 0,00 - 0,00
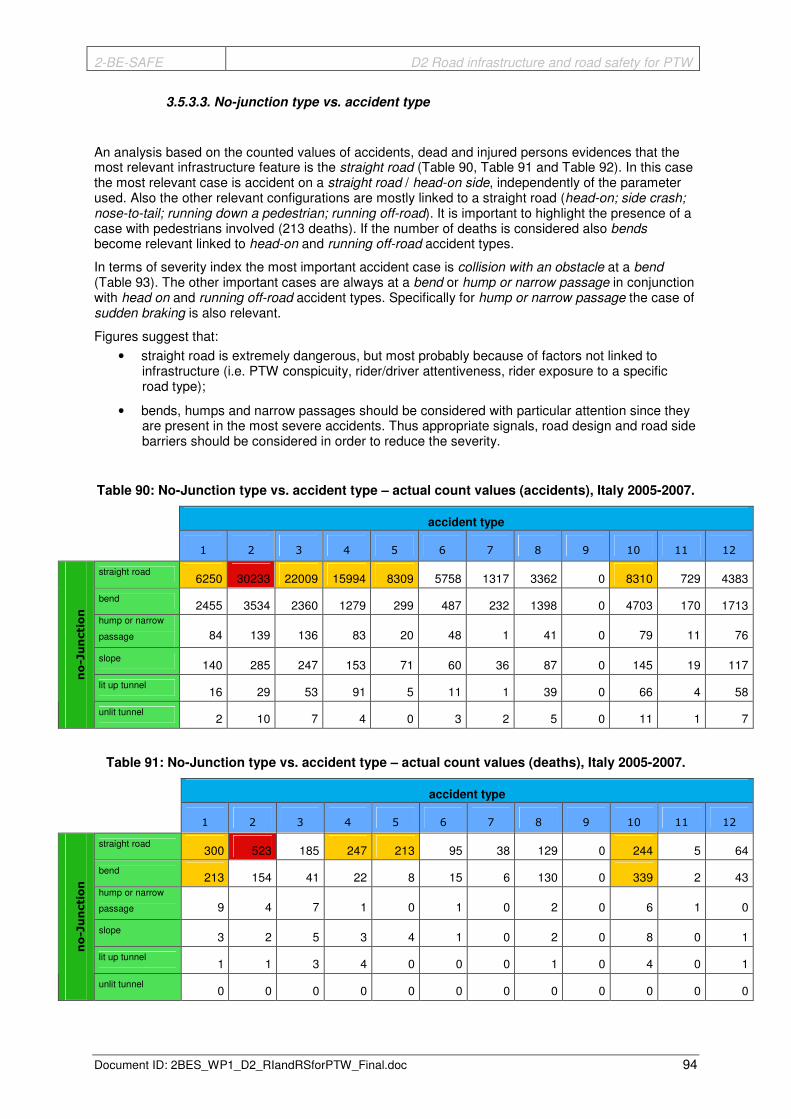
2-BE-SAFE D2 Road infrastructure and road safety for PTW
Document ID: 2BES_WP1_D2_RIandRSforPTW_Final.doc 94
3.5.3.3. No-junction type vs. accident type
An analysis based on the counted values of accidents, dead and injured persons evidences that the most relevant infrastructure feature is the straight road (Table 90, Table 91 and Table 92). In this case the most relevant case is accident on a straight road / head-on side, independently of the parameter used. Also the other relevant configurations are mostly linked to a straight road (head-on; side crash; nose-to-tail; running down a pedestrian; running off-road). It is important to highlight the presence of a case with pedestrians involved (213 deaths). If the number of deaths is considered also bends become relevant linked to head-on and running off-road accident types.
In terms of severity index the most important accident case is collision with an obstacle at a bend (Table 93). The other important cases are always at a bend or hump or narrow passage in conjunction with head on and running off-road accident types. Specifically for hump or narrow passage the case of sudden braking is also relevant.
Figures suggest that:
• straight road is extremely dangerous, but most probably because of factors not linked to infrastructure (i.e. PTW conspicuity, rider/driver attentiveness, rider exposure to a specific road type);
• bends, humps and narrow passages should be considered with particular attention since they are present in the most severe accidents. Thus appropriate signals, road design and road side barriers should be considered in order to reduce the severity.
Table 90: No-Junction type vs. accident type – actual count values (accidents), Italy 2005-2007.
accident type
1 2 3 4 5 6 7 8 9 10 11 12
straight road 6250 30233 22009 15994 8309 5758 1317 3362 0 8310 729 4383
bend 2455 3534 2360 1279 299 487 232 1398 0 4703 170 1713
hump or narrow
passage 84 139 136 83 20 48 1 41 0 79 11 76
slope 140 285 247 153 71 60 36 87 0 145 19 117
lit up tunnel 16 29 53 91 5 11 1 39 0 66 4 58
no-Junction
unlit tunnel 2 10 7 4 0 3 2 5 0 11 1 7
Table 91: No-Junction type vs. accident type – actual count values (deaths), Italy 2005-2007.
accident type
1 2 3 4 5 6 7 8 9 10 11 12
straight road 300 523 185 247 213 95 38 129 0 244 5 64
bend 213 154 41 22 8 15 6 130 0 339 2 43
hump or narrow
passage 9 4 7 1 0 1 0 2 0 6 1 0
slope 3 2 5 3 4 1 0 2 0 8 0 1
lit up tunnel 1 1 3 4 0 0 0 1 0 4 0 1
no-Junction
unlit tunnel 0 0 0 0 0 0 0 0 0 0 0 0

2-BE-SAFE D2 Road infrastructure and road safety for PTW
Document ID: 2BES_WP1_D2_RIandRSforPTW_Final.doc 95
Table 92: No-Junction type vs. accident type – actual count values (injured), Italy 2005-2007.
accident type
1 2 3 4 5 6 7 8 9 10 11 12
straight road 7729 35691 25456 19392 11951 6663 1372 3502 0 8720 777 4621
bend 3235 4353 2764 1665 479 573 249 1405 0 4879 188 1830
hump or narrow
passage 101 168 155 102 34 50 1 43 0 80 11 82
slope 154 349 281 189 102 69 38 98 0 152 21 120
lit up tunnel 23 47 63 119 8 14 1 39 0 69 4 62
no-Junction
unlit tunnel 3 15 10 7 0 4 2 5 0 14 1 8
Table 93: No-Junction type vs. accident type – severity index*100, Italy 2005-2007.
accident type
1 2 3 4 5 6 7 8 9 10 11 12
straight road 3,74 1,44 0,72 1,26 1,75 1,41 2,70 3,55 - 2,72 0,64 1,37
bend 6,18 3,42 1,46 1,30 1,64 2,55 2,35 8,47 - 6,50 1,05 2,30
hump or narrow
passage 8,18 2,33 4,32 0,97 0,00 1,96 0,00 4,44 - 6,98 8,33 0,00
slope 1,91 0,57 1,75 1,56 3,77 1,43 0,00 2,00 - 5,00 0,00 0,83
lit up tunnel 4,17 2,08 4,55 3,25 0,00 0,00 0,00 2,50 - 5,48 0,00 1,59
no-Junction
unlit tunnel 0,00 0,00 0,00 0,00 - 0,00 0,00 0,00 - 0,00 0,00 0,00

2-BE-SAFE D2 Road infrastructure and road safety for PTW
Document ID: 2BES_WP1_D2_RIandRSforPTW_Final.doc 96
3.5.3.4. Pavement state vs. year first delivery licence (PTW rider)
As evidenced in section 3.5.2 the majority of accidents occur on dry pavement and just secondarily on wet pavement. When cross tabled with the delivery year of the driving licence it appears clearly that experience (experience is assumed proportional to the time passed since the delivery of the driving license) plays a major role for the number of accidents, dead and injured persons (Table 94, Table 95 and Table 96). In fact the most relevant case is on dry pavement with riders having less than 10 years of experience. A different picture can be observed when the severity is analysed. In this case all the pavement state indicate that most severe accidents involve more experienced riders (the oldest ranges must be considered carefully since there is a low number of accidents reported; Table 97).
Table 94: Pavement state vs. year first delivery licence – actual count values (accidents), Italy 2005-2007.
year first delivery licence - PTW rider
1931-1940
1941-1950
1951-1960
1961-1970
1971-1980
1981-1990
1991-2000
2001-2010
dry 17 23 78 1579 7308 23447 34638 102606
wet 2 5 4 135 736 2431 3429 10225
slippery 0 0 0 32 184 637 913 2145
icy 0 0 0 1 10 50 66 166
Pavement state
snow-clad 0 0 0 1 5 20 28 53
Table 95: Pavement state vs. year first delivery licence – actual count values (deaths), Italy 2005-2007.
year first delivery licence - PTW rider
1931-1940
1941-1950
1951-1960
1961-1970
1971-1980
1981-1990
1991-2000
2001-2010
dry 0 2 4 39 148 459 770 1939
wet 0 0 0 4 11 20 42 112
slippery 0 0 0 2 2 2 9 15
icy 0 0 0 0 0 2 1 0
Pavement state
snow-clad 0 0 0 0 0 0 1 0
Table 96: Pavement state vs. year first delivery licence – actual count values (injured), Italy 2005-2007.
year first delivery licence - PTW rider
1931-1940
1941-1950
1951-1960
1961-1970
1971-1980
1981-1990
1991-2000
2001-2010
dry 20 27 86 1794 8451 27144 40380 122184
wet 2 6 6 161 821 2753 3878 11701
slippery 0 0 0 34 204 739 1018 2510
icy 0 0 0 1 10 51 72 173
Pavement state
snow-clad 0 0 0 3 6 22 27 56

2-BE-SAFE D2 Road infrastructure and road safety for PTW
Document ID: 2BES_WP1_D2_RIandRSforPTW_Final.doc 97
Table 97: Pavement state vs. year first delivery licence – severity index*100, Italy 2005-2007.
year first delivery licence - PTW rider
1931-1940
1941-1950
1951-1960
1961-1970
1971-1980
1981-1990
1991-2000
2001-2010
dry 0,00 6,90 4,44 2,13 1,72 1,66 1,87 1,56
wet 0,00 0,00 0,00 2,42 1,32 0,72 1,07 0,95
slippery - - - 5,56 0,97 0,27 0,88 0,59
icy - - - 0,00 0,00 3,77 1,37 0,00
Pavement state
snow-clad - - - 0,00 0,00 0,00 3,57 0,00
3.5.3.5. Pavement state vs. pavement type
The analysis adds to the previous numerical relevance of dry / wet / slippery pavement state, the information on the pavement type as well as the severity index. Data in Table 98 show that:
• with the same pavement type, the accident severity decreases passing from dry to wet to slippery conditions. These results have to be probably ascribed to the fact that in wet and slippery conditions the rider is more aware of the risk and thus rides more carefully;
• for the two most relevant pavement state (dry and wet) the severity index in the case of uneven paved road is higher than for paved road, which demonstrates an influence of the pavement type on the accident outcome.
Table 98: Pavement state vs. pavement type; death, injured,severity index*100, Italy 2005-2007.
summary involved in accident
Pavement type total deaths
until 24 hours by accident
total deaths between the 2nd and 30th
day by accident
total deaths total injured severity index
paved road 3851 701 4552 272061 1,65
uneven paved road 49 9 58 2282 2,48
dry
unpaved road 10 0 10 458 2,14
paved road 247 60 307 26029 1,17
uneven paved road 4 0 4 262 1,50
wet
unpaved road 2 0 2 57 3,39
paved road 28 5 33 5272 0,62
uneven paved road 0 0 0 245 0,00
slippery
unpaved road 6 0 6 65 8,45
paved road 4 0 4 473 0,84
uneven paved road 0 0 0 10 0,00
icy
unpaved road 0 0 0 0 -
paved road 1 1 2 189 1,05
uneven paved road 0 0 0 0 -
Pavement state
snow-clad
unpaved road 0 0 0 1 0,00
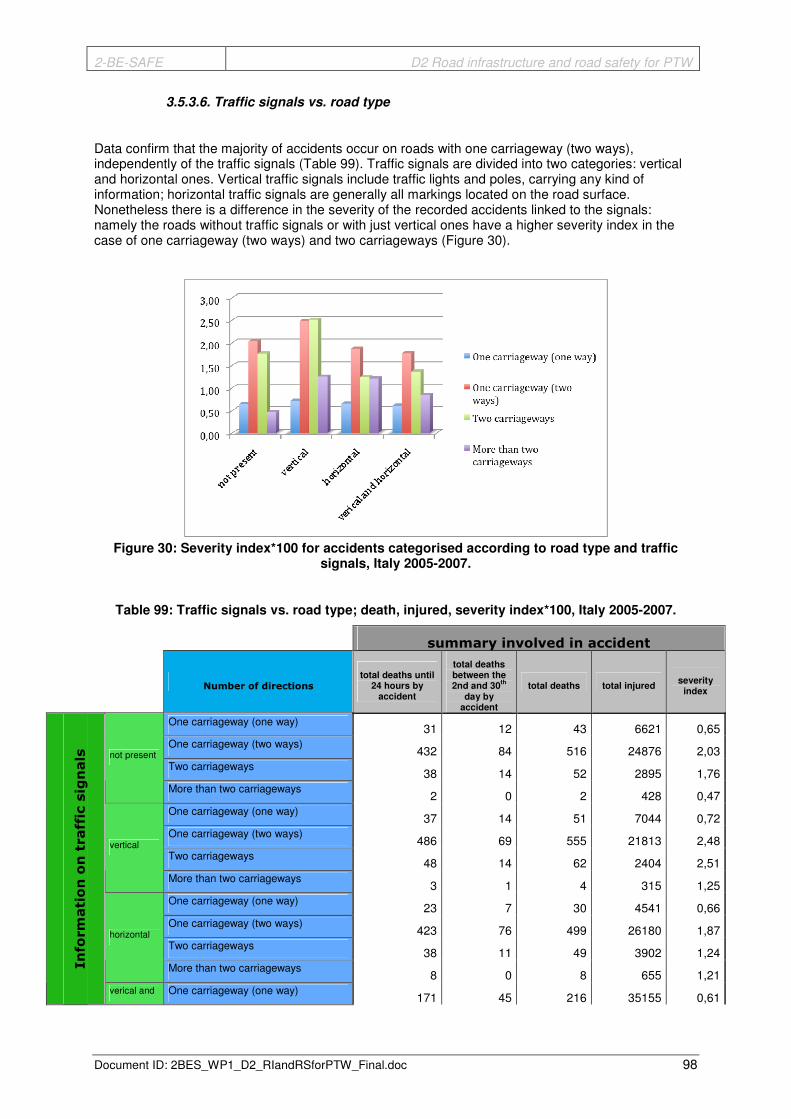
2-BE-SAFE D2 Road infrastructure and road safety for PTW
Document ID: 2BES_WP1_D2_RIandRSforPTW_Final.doc 98
3.5.3.6. Traffic signals vs. road type
Data confirm that the majority of accidents occur on roads with one carriageway (two ways), independently of the traffic signals (Table 99). Traffic signals are divided into two categories: vertical and horizontal ones. Vertical traffic signals include traffic lights and poles, carrying any kind of information; horizontal traffic signals are generally all markings located on the road surface. Nonetheless there is a difference in the severity of the recorded accidents linked to the signals: namely the roads without traffic signals or with just vertical ones have a higher severity index in the case of one carriageway (two ways) and two carriageways (Figure 30).
Figure 30: Severity index*100 for accidents categorised according to road type and traffic
signals, Italy 2005-2007.
Table 99: Traffic signals vs. road type; death, injured, severity index*100, Italy 2005-2007.
summary involved in accident
Number of directions total deaths until
24 hours by accident
total deaths between the 2nd and 30
th
day by accident
total deaths total injured severity
index
One carriageway (one way) 31 12 43 6621 0,65
One carriageway (two ways) 432 84 516 24876 2,03
Two carriageways 38 14 52 2895 1,76
not present
More than two carriageways 2 0 2 428 0,47
One carriageway (one way) 37 14 51 7044 0,72
One carriageway (two ways) 486 69 555 21813 2,48
Two carriageways 48 14 62 2404 2,51
vertical
More than two carriageways 3 1 4 315 1,25
One carriageway (one way) 23 7 30 4541 0,66
One carriageway (two ways) 423 76 499 26180 1,87
Two carriageways 38 11 49 3902 1,24
horizontal
More than two carriageways 8 0 8 655 1,21
Information on traffic signals
verical and One carriageway (one way) 171 45 216 35155 0,61

2-BE-SAFE D2 Road infrastructure and road safety for PTW
Document ID: 2BES_WP1_D2_RIandRSforPTW_Final.doc 99
One carriageway (two ways) 2109 348 2457 136228 1,77
Two carriageways 295 69 364 26170 1,37
horizontal
More than two carriageways 58 12 70 8177 0,85
3.5.3.7. Traffic signals vs. (no-)junction type
Data demonstrate that, whenever traffic signals are in place, they have little influence on the most dangerous accidents (Table 100). In fact in the case of a junction accidents occur more frequently at cross roads unless when there are no signals (in this case the most relevant is junction not indicated). In case of no-junction they always occur on a straight road, while the most dangerous situation is at bends (except in the case of vertical ones which is hump or narrow passage).
Thus it can be concluded that:
• all junctions should be indicated, since the absence of traffic signals increases the severity of the accident, most probably since the rider is not prepared to look for other vehicles or to adapt its vehicle speed;
• traffic signals at bends should be improved since they do not contribute to a reduction in the severity of accidents. Possible suggestions could include adding information relevant to riders (e.g. curve shape), as traffic signals are mostly conceived for other vehicle drivers.
Table 100: Traffic signals vs. (no-)junction type; death, injured, severity index*100, Italy 2005-
2007.
summary involved in accident
total deaths until 24
hours by accident
total deaths
between the 2nd and 30th day by
accident
total deaths
total injured
severity index
cross road 50 16 66 6704 0,97
roundabout 3 0 3 316 0,94
junction indicated 0 0 0 0 -
junction indicated by a traffic light or warden
0 0 0 0 -
junction not indicated 89 21 110 8721 1,25
junction
level crossing 0 0 0 4 0,00
straight road 227 59 286 15409 1,82
bend 125 12 137 3207 4,10
hump or narrow passage 1 0 1 105 0,94
slope 8 2 10 303 3,19
lit up tunnel 0 0 0 40 0,00
not present
no-junction
unlit tunnel 0 0 0 11 0,00
cross road 112 21 133 10839 1,21
roundabout 11 4 15 739 1,99
Information on traffic signals
vertical
junction
junction indicated 62 18 80 4221 1,86
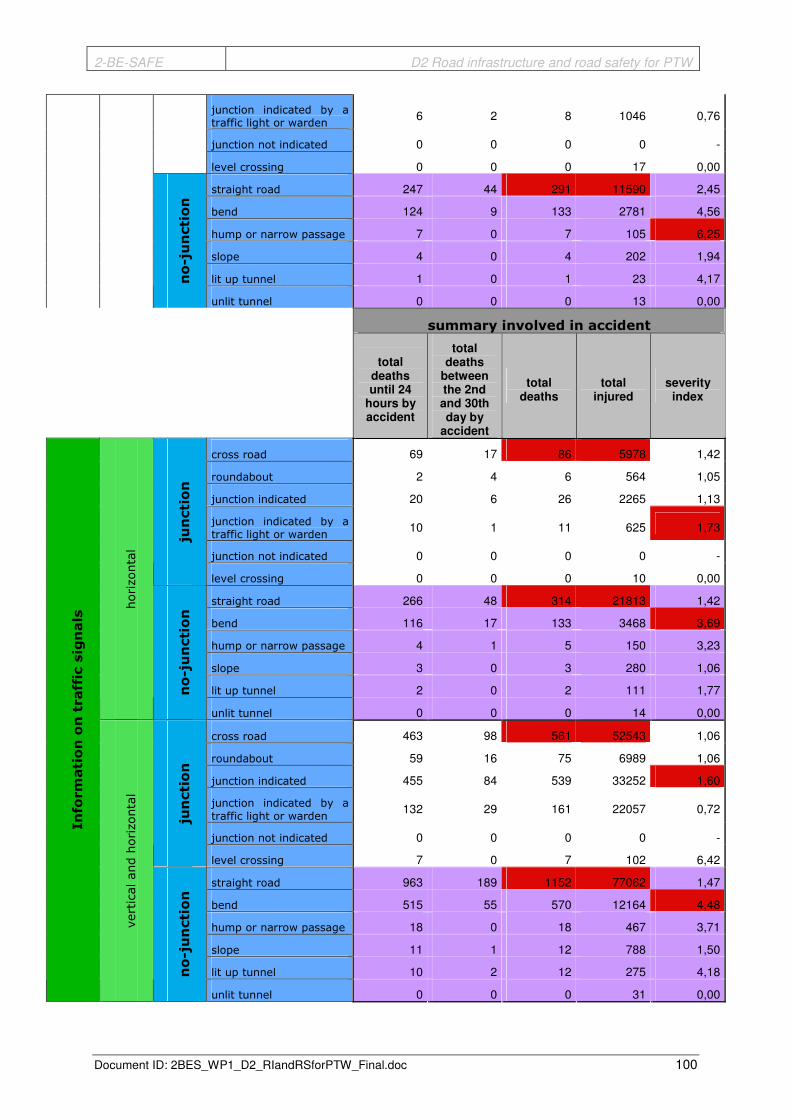
2-BE-SAFE D2 Road infrastructure and road safety for PTW
Document ID: 2BES_WP1_D2_RIandRSforPTW_Final.doc 100
junction indicated by a traffic light or warden
6 2 8 1046 0,76
junction not indicated 0 0 0 0 -
level crossing 0 0 0 17 0,00
straight road 247 44 291 11590 2,45
bend 124 9 133 2781 4,56
hump or narrow passage 7 0 7 105 6,25
slope 4 0 4 202 1,94
lit up tunnel 1 0 1 23 4,17
no-junction
unlit tunnel 0 0 0 13 0,00
summary involved in accident
total deaths until 24
hours by accident
total deaths
between the 2nd and 30th day by
accident
total deaths
total injured
severity index
cross road 69 17 86 5978 1,42
roundabout 2 4 6 564 1,05
junction indicated 20 6 26 2265 1,13
junction indicated by a traffic light or warden
10 1 11 625 1,73
junction not indicated 0 0 0 0 -
junction
level crossing 0 0 0 10 0,00
straight road 266 48 314 21813 1,42
bend 116 17 133 3468 3,69
hump or narrow passage 4 1 5 150 3,23
slope 3 0 3 280 1,06
lit up tunnel 2 0 2 111 1,77
horizontal
no-junction
unlit tunnel 0 0 0 14 0,00
cross road 463 98 561 52543 1,06
roundabout 59 16 75 6989 1,06
junction indicated 455 84 539 33252 1,60
junction indicated by a
traffic light or warden 132 29 161 22057 0,72
junction not indicated 0 0 0 0 -
junction
level crossing 7 0 7 102 6,42
straight road 963 189 1152 77062 1,47
bend 515 55 570 12164 4,48
hump or narrow passage 18 0 18 467 3,71
slope 11 1 12 788 1,50
lit up tunnel 10 2 12 275 4,18
Information on traffic signals
vertical and horizontal
no-junction
unlit tunnel 0 0 0 31 0,00

2-BE-SAFE D2 Road infrastructure and road safety for PTW
Document ID: 2BES_WP1_D2_RIandRSforPTW_Final.doc 101
3.5.3.8. Junction type vs. rider age
The analysis identifies the age range 21-30 years old as the most critical linked with cross road (Table 101, Table 102 and Table 103). The other top 5 configurations are 14-17, 31-40 and 41-50 always for cross road together with 21-30 and 31-40 for junction indicated. The analysis of severity index does not provide relevant indications since the cases with the highest index values have little statistical importance because of the low number of recorded cases (Table 104).
Table 101: Junction type vs. rider age – actual count values (accidents), Italy 2005-2007.
PTW rider age
14-17 18-20 21-30 31-40 41-50 51-60 61-70 71-80 81-90
cross road 11191 6606 15731 13549 8260 3869 1710 869 211
roundabout 1126 690 1773 1841 1170 594 264 136 31
junction indicated 5072 3168 8781 7948 4937 2217 995 489 107
junction indicated by a traffic light or
warden 1897 1677 5390 5492 3210 1437 510 164 39
junction not indicated 1385 792 1749 1565 975 445 188 95 23
Junction
level crossing 12 13 31 32 10 11 1 2 0
Table 102: Junction type vs. rider age – actual count values (deaths), Italy 2005-2007.
PTW rider age
14-17 18-20 21-30 31-40 41-50 51-60 61-70 71-80 81-90
cross road 106 51 218 188 111 55 39 31 16
roundabout 9 1 29 28 12 10 8 2 0
junction indicated 51 36 191 155 101 48 26 24 10
junction indicated by a traffic light or
warden 6 16 62 45 18 15 6 4 5
junction not indicated 11 10 36 29 9 7 3 3 0
Junction
level crossing 0 2 2 2 1 0 0 0 0
Table 103: Junction type vs. rider age – actual count values (injured), Italy 2005-2007.
PTW rider age
14-17 18-20 21-30 31-40 41-50 51-60 61-70 71-80 81-90
cross road 13843 8150 18886 15719 9503 4459 1879 961 226
roundabout 1268 783 1997 2008 1286 652 272 140 32
junction indicated 6031 3764 10312 9108 5562 2502 1084 527 117
junction indicated by a traffic light or
warden 2364 2098 6435 6367 3678 1648 566 180 39
junction not indicated 1698 991 2078 1801 1137 508 205 110 27
Junction
level crossing 12 14 36 35 14 17 1 2 0
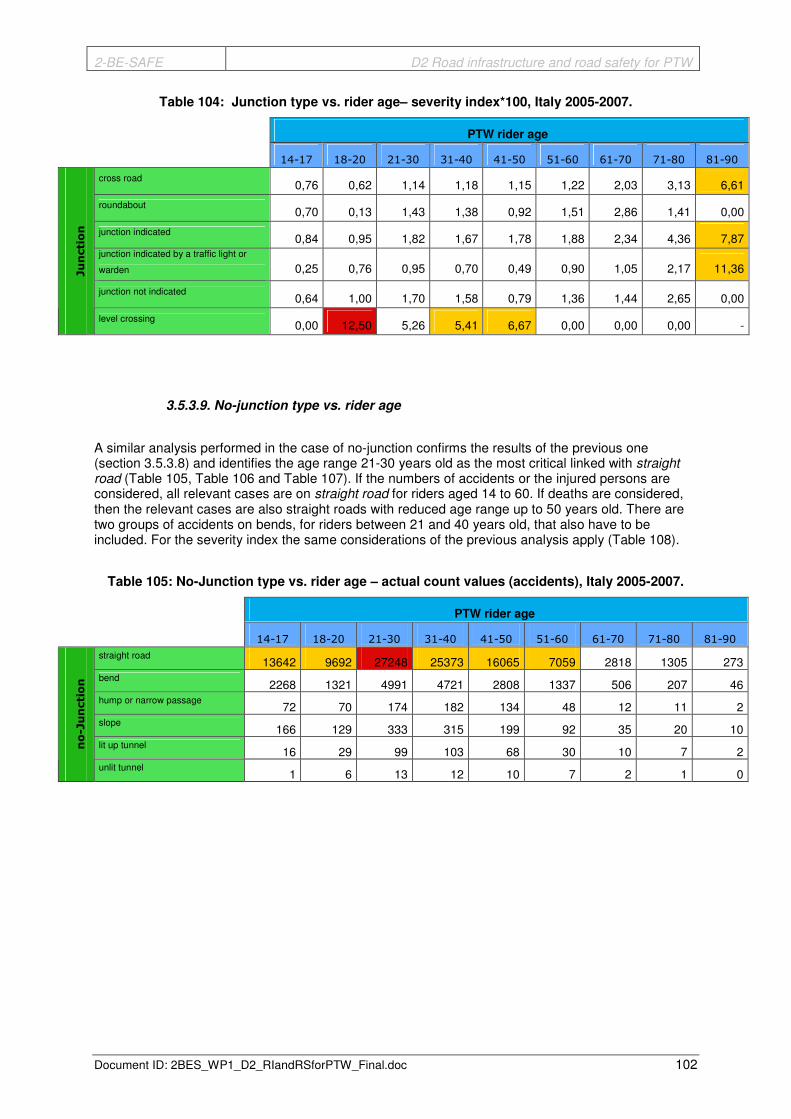
2-BE-SAFE D2 Road infrastructure and road safety for PTW
Document ID: 2BES_WP1_D2_RIandRSforPTW_Final.doc 102
Table 104: Junction type vs. rider age– severity index*100, Italy 2005-2007.
PTW rider age
14-17 18-20 21-30 31-40 41-50 51-60 61-70 71-80 81-90
cross road 0,76 0,62 1,14 1,18 1,15 1,22 2,03 3,13 6,61
roundabout 0,70 0,13 1,43 1,38 0,92 1,51 2,86 1,41 0,00
junction indicated 0,84 0,95 1,82 1,67 1,78 1,88 2,34 4,36 7,87
junction indicated by a traffic light or
warden 0,25 0,76 0,95 0,70 0,49 0,90 1,05 2,17 11,36
junction not indicated 0,64 1,00 1,70 1,58 0,79 1,36 1,44 2,65 0,00
Junction
level crossing 0,00 12,50 5,26 5,41 6,67 0,00 0,00 0,00 -
3.5.3.9. No-junction type vs. rider age
A similar analysis performed in the case of no-junction confirms the results of the previous one (section 3.5.3.8) and identifies the age range 21-30 years old as the most critical linked with straight road (Table 105, Table 106 and Table 107). If the numbers of accidents or the injured persons are considered, all relevant cases are on straight road for riders aged 14 to 60. If deaths are considered, then the relevant cases are also straight roads with reduced age range up to 50 years old. There are two groups of accidents on bends, for riders between 21 and 40 years old, that also have to be included. For the severity index the same considerations of the previous analysis apply (Table 108).
Table 105: No-Junction type vs. rider age – actual count values (accidents), Italy 2005-2007.
PTW rider age
14-17 18-20 21-30 31-40 41-50 51-60 61-70 71-80 81-90
straight road 13642 9692 27248 25373 16065 7059 2818 1305 273
bend 2268 1321 4991 4721 2808 1337 506 207 46
hump or narrow passage 72 70 174 182 134 48 12 11 2
slope 166 129 333 315 199 92 35 20 10
lit up tunnel 16 29 99 103 68 30 10 7 2
no-Junction
unlit tunnel 1 6 13 12 10 7 2 1 0

2-BE-SAFE D2 Road infrastructure and road safety for PTW
Document ID: 2BES_WP1_D2_RIandRSforPTW_Final.doc 103
Table 106: No-Junction type vs. rider age – actual count values (deaths), Italy 2005-2007.
PTW rider age
14-17 18-20 21-30 31-40 41-50 51-60 61-70 71-80 81-90
straight road 186 135 602 487 297 124 61 54 18
bend 73 44 280 314 136 57 30 12 6
hump or narrow passage 1 0 10 7 5 1 0 4 0
slope 2 3 10 5 4 1 1 1 0
lit up tunnel 0 1 5 4 1 1 2 0 0 n
o-Junction
unlit tunnel 0 0 0 0 0 0 0 0 0
Table 107: No-Junction type vs. rider age – actual count values (injured), Italy 2005-2007.
PTW rider age
14-17 18-20 21-30 31-40 41-50 51-60 61-70 71-80 81-90
straight road 16649 12036 32546 29354 18572 8145 3138 1435 288
bend 2726 1584 5834 5371 3200 1547 549 253 49
hump or narrow passage 80 85 204 204 159 57 12 10 2
slope 191 161 380 356 237 108 39 21 10
lit up tunnel 16 36 121 132 85 32 9 7 2 n
o-Junction
unlit tunnel 1 8 18 14 13 9 2 4 0
Table 108: No-Junction type vs. rider age– severity index*100, Italy 2005-2007.
PTW rider age
14-17 18-20 21-30 31-40 41-50 51-60 61-70 71-80 81-90
straight road 1,10 1,11 1,82 1,63 1,57 1,50 1,91 3,63 5,88
bend 2,61 2,70 4,58 5,52 4,08 3,55 5,18 4,53 10,91
hump or narrow passage 1,23 0,00 4,67 3,32 3,05 1,72 0,00 28,57 0,00
slope 1,04 1,83 2,56 1,39 1,66 0,92 2,50 4,55 0,00
lit up tunnel 0,00 2,70 3,97 2,94 1,16 3,03 18,18 0,00 0,00 n
o-Junction
unlit tunnel 0,00 0,00 0,00 0,00 0,00 0,00 0,00 0,00 -
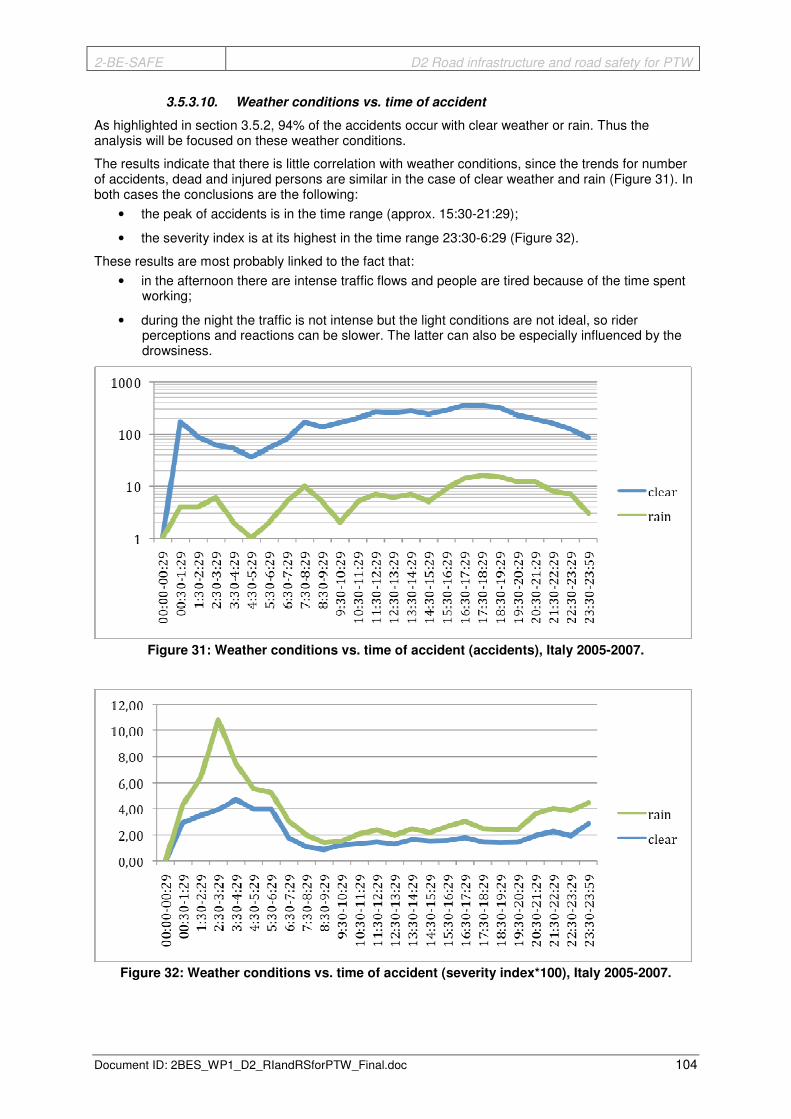
2-BE-SAFE D2 Road infrastructure and road safety for PTW
Document ID: 2BES_WP1_D2_RIandRSforPTW_Final.doc 104
3.5.3.10. Weather conditions vs. time of accident
As highlighted in section 3.5.2, 94% of the accidents occur with clear weather or rain. Thus the analysis will be focused on these weather conditions.
The results indicate that there is little correlation with weather conditions, since the trends for number of accidents, dead and injured persons are similar in the case of clear weather and rain (Figure 31). In both cases the conclusions are the following:
• the peak of accidents is in the time range (approx. 15:30-21:29);
• the severity index is at its highest in the time range 23:30-6:29 (Figure 32).
These results are most probably linked to the fact that:
• in the afternoon there are intense traffic flows and people are tired because of the time spent working;
• during the night the traffic is not intense but the light conditions are not ideal, so rider perceptions and reactions can be slower. The latter can also be especially influenced by the drowsiness.
Figure 31: Weather conditions vs. time of accident (accidents), Italy 2005-2007.
Figure 32: Weather conditions vs. time of accident (severity index*100), Italy 2005-2007.
2-BE-SAFE D2 Road infrastructure and road safety for PTW
Document ID: 2BES_WP1_D2_RIandRSforPTW_Final.doc 105
3.5.4. Summary of Findings - Italy
The Italian national database (ISTAT) was investigated to determine possible interactions between PTW accidents and road infrastructure. The analysis was performed with the queries defined in activity 1.2. The following conclusions can be derived:
• roads with one carriageway and two ways have the highest number of accidents;
• taking into account the accident type, the most relevant accident case is head-on side on road
with one carriageway and two ways, but the most severe is one carriageway and two ways
and collision with an obstacle;
• crossing junction type with accident type the most relevant case is head-on side at cross
roads;
• in case of no-junction the most relevant case is head-on side on straight road;
• the majority of accidents occur on dry roads (89%) and the largest share involves riders who
received the driving licence during the last decade. The number of accidents decreases with
an increase in the length of time since the driving licence was delivered;
• a joint analysis of pavement state and type, shows that accidents on wet and slippery roads
are less severe than on dry roads (with the same pavement type), while uneven paved roads
increase the accident severity;
• roads without traffic signals or with just vertical ones have an higher severity index in the case
of one carriageway (two ways) and two carriageways;
• no relevant correlation was found between traffic signals and (no-)junction type;
• riders 21-30 years old are more often involved in accidents; the most dangerous accident
cases for this age group are at cross road and on a straight road;
• there is no correlation between weather conditions and the time of the accident, but the latter
parameter is significant since the majority of accidents occur in the 15:30-21:29 range, but the
most severe ones in the 23:30-6:29 range.

2-BE-SAFE D2 Road infrastructure and road safety for PTW
Document ID: 2BES_WP1_D2_RIandRSforPTW_Final.doc 106
4. Microscopic Analysis
4.1. Introduction
Within the third sub-activity in activity 1.2, analysis at a micro-level will be performed to identify the critical characteristics of road infrastructure that constitute PTW risk factors.
In-depth data from accident databases and road geometry data (Austria, Germany and Spain) and appropriate software tools (MARVin, RoadVIEW) have been employed and used to conduct this detailed analysis. The software tools allow correlating road measurement data together with PTW accident data.
Similarities of road design elements and surface conditions (various curve radii, radii relations, curvature, crossfall in road sections, type of pavement, skid resistance, texture etc.) and the combination of these data at accident locations will be determined as well as typical crash-causal-circumstances.
The Spanish databank DIANA delivers lots of gathered in-depth accident information, which lead to unique analyses shown in chapter 4.3. The studies carried out in Germany (BASt, data by TU Dresden) and Austria (AIT) use measured road surface data. Descriptions on the measurement parameters and the specific devices are included in the report.
The microscopic analyses should prove in a higher detail the possible critical combinations of road infrastructure influences on PTW accident risks. A closer look at the parameters and factors of road surface characteristics is considered.
4.2. Interaction between Powered Two-Wheeler Accidents and Infrastructure in Austria
4.2.1. Methodology – Austrian Data Base and Available Data
The following report shows the outputs of the analysis of the Austrian data with MARVin software tools. MARVin is the acronym for “Model for Assessing Risks of Road Infrastructure”, in German “Modell zur Abschätzung des Risikopotenzials von Verkehrsinfrastruktur”. The methodology of MARVin is described later in the text.
The analyses in this report are focusing on measurement data of road condition and road geometry in combination with Powered Two-Wheeler (PTW) accidents.
PTW means in this report all motorcycles, which can be allocated in one of the following groups:
• Motorcycles with engine power less than 25 kW (33HP); relation Weight / Engine power max. 0.16 kW / kg.
• Motorcycles with more than 25 kW engine power.
Moped accidents are not included, because of the fact that the infrastructure data are just gathered at rural roads, outside urban areas. Moped accident hotspots in Austria are mainly located in urban areas, where the influence of road infrastructure especially on the vehicle dynamics is insignificant.
The analyses are based on the annual accident statistic of the years 2000 to 2007, based on the data of Statistik Austria. The correlation between PTW accidents of these years (N=10.558) with measured data by the device “RoadSTAR” (actual data) is done by a connection of the data sets via accident location (GPS signal and map matching).
Especially, the curve radius is in the focus of attention, due to the fact that the most severe PTW accidents occur in or after curves. The first step of analysis is based on relations by radii – most of them in double bends, just a few in oval curve combinations. The base hypothesis indicates a dependency of the radii relation and the event of accident (accident type), in the following ways:
• Straight lane following by a curve
• Curve with large radius following by a curve with smaller radius
• Curve with small radius following by a curve with larger radius (probably uncritical)

2-BE-SAFE D2 Road infrastructure and road safety for PTW
Document ID: 2BES_WP1_D2_RIandRSforPTW_Final.doc 107
The analysis procedure of the whole work was as follows:
• General statistics for the years 2000 to 2007
• National analyses of PTW accidents in context with infrastructure data
• Analyses based on the relation of radii in road sections, where PTW crashes occur
• Analyses based on specific motorcycle routes (sections in the federal roads network)
4.2.2. General statistics of PTW accidents in Austria (2000 to 2007)
Figure 33 shows the development of PTW in Austria in the years 2000 till 2007. The increase of PTW in Austria amounts 24%, this correspond a number of nearly 68.000 PTW in the analysed 8 years. Similar to the raising of PTW’s in Austria is the increasing rate PTW’s relating to the whole stock of powered vehicles in Austria.
Stock of PTW and the rate of total stock
200000
225000
250000
275000
300000
325000
350000
Years
Nu
mb
er
of
PT
W
0
2
4
6
8
10
Ra
te o
f P
TW
of
tota
l s
toc
k [
%]
Stock of PTW 278118 294843 290490 302157 310729 319852 330807 345491
rate of PTW 4,9 4,9 5,2 5,4 5,6 5,7 5,8 5,9
2000 2001 2002 2003 2004 2005 2006 2007
Figure 33: Stock of PTW and the rate of PTWs depending on total stock, Austria 2000-2007.

2-BE-SAFE D2 Road infrastructure and road safety for PTW
Document ID: 2BES_WP1_D2_RIandRSforPTW_Final.doc 108
Accident severity in the years 2000 - 2007killed and injured PTW riders
3000
3500
4000
Years
Nu
mb
er
of
inju
red
PT
W
rid
ers
60
70
80
90
100
110
120
Nu
mb
er
of
kille
d P
TW
rid
ers
injured PTW riders 3765 3564 3348 3744 3442 3367 3587 3587
killed PTW riders 112 107 89 109 98 98 95 96
2000 2001 2002 2003 2004 2005 2006 2007
Figure 34: Killed and injured PTW riders, Austria 2000-2007.
Although the stock of PTWs in Austria is still growing, the trend of injured or killed PTW riders is slightly decreasing (showed in Figure 34).
This depends on a variety of facts:
• Number of travelled kilometres is decreasing
• Improved technology concerning motorcycles (ABS…)
• Improved driving education
• Improved drivers protection equipment
• Risk awareness of drivers is increasing
Nevertheless the absolute number of injured and killed people is still on a too high level; about 14% of all fatalities on Austrian roads are motorcyclists. Regarding the average mileage of a motorcycle per year, which is about one third of the average mileage of a passenger car, the 14% gets another weight.

2-BE-SAFE D2 Road infrastructure and road safety for PTW
Document ID: 2BES_WP1_D2_RIandRSforPTW_Final.doc 109
PTW accidents vs. accidents types 2000 - 2007N=10558
0,00%
10,00%
20,00%
30,00%
40,00%
50,00%
Accident types
Ra
te o
f P
TW
ac
cid
en
ts t
o t
ota
l
nu
mb
ers
of
ac
cid
en
t [%
]
Rate 32,78% 18,75% 10,51% 11,67% 8,07% 3,58% 10,49% 0,60% 1,13% 2,42%
0 1 2 3 4 5 6 7 8 9
Figure 35: Rate of PTW accidents in relation to accident types, Austria 2000-2007.
The accident data are classified in 10 different accident types and in specified subtypes of particular type. Figure 35 shows the distribution of the found 10.558 PTW accidents in accident type classes. In specific analyses it was figured out that especially run-off accidents (within accident type 0) in and after curves have a very high absolute number and also fatality rate. A reason for that is the driving manoeuvre itself, the braking in curves and the fact of very often fixed crash barriers on the sides of the rural roads.
The separate classes represent the following attributes of accident events:
• 0 = Accident with one involved participant (Single vehicle accident) • 1 = Accident with two or more involved vehicles in similar direction of traffic • 2 = Accident with two or more involved vehicles in opposite direction of traffic • 3 = Accident while turning in similar direction of traffic • 4 = Accidents while left turning between turning and straight driving vehicle • 5 = Orthogonal collision with two or more involved vehicles at crossroads (Accidents
between vehicles, which are driving on two different ways and no turning at crossroads) • 6 = Orthogonal collision with two or more involved and turning vehicles at crossroads • 7 = Accidents with stopped or parked vehicles • 8 = Accidents with pedestrians • 9 = Diverse accident with two or more involved participants

2-BE-SAFE D2 Road infrastructure and road safety for PTW
Document ID: 2BES_WP1_D2_RIandRSforPTW_Final.doc 110
PTW accidents vs. Engine power 2000 - 2007N = 13811
0,00%
10,00%
20,00%
30,00%
40,00%
50,00%
Engine Power [kW]
Rate
of P
TW
accid
en
ts to
to
tal
nu
mb
ers
of accid
en
t [%
]
Rate 5,29% 4,54% 2,79% 4,09% 4,95% 3,99% 12,56% 9,46% 10,78% 9,97% 17,21% 6,18% 3,24% 2,87% 1,02% 0,83% 0,20% 0,01%
undocumente
d1 - 10 11 - 15 16 - 20 21 - 25 26 - 30 31 - 40 41 - 50 51 - 60 61 - 70 71 - 80 81 - 90
91 - 100
101 - 110
111 - 120
121 - 130
131 - 140
141 - 150
Figure 36: Rate of PTW accidents in relation to Engine power, Austria 2000-2007.
Figure 36 shows the ratios of the engine power of the participated PTWs. 13.811 motorcycles (active motorcycle riders in 10.588 PTW accidents) were figured out in the query. The local maximum is with 17% at PTWs with an engine power of 71 to 89 kW, followed by 31 to 40 kW.
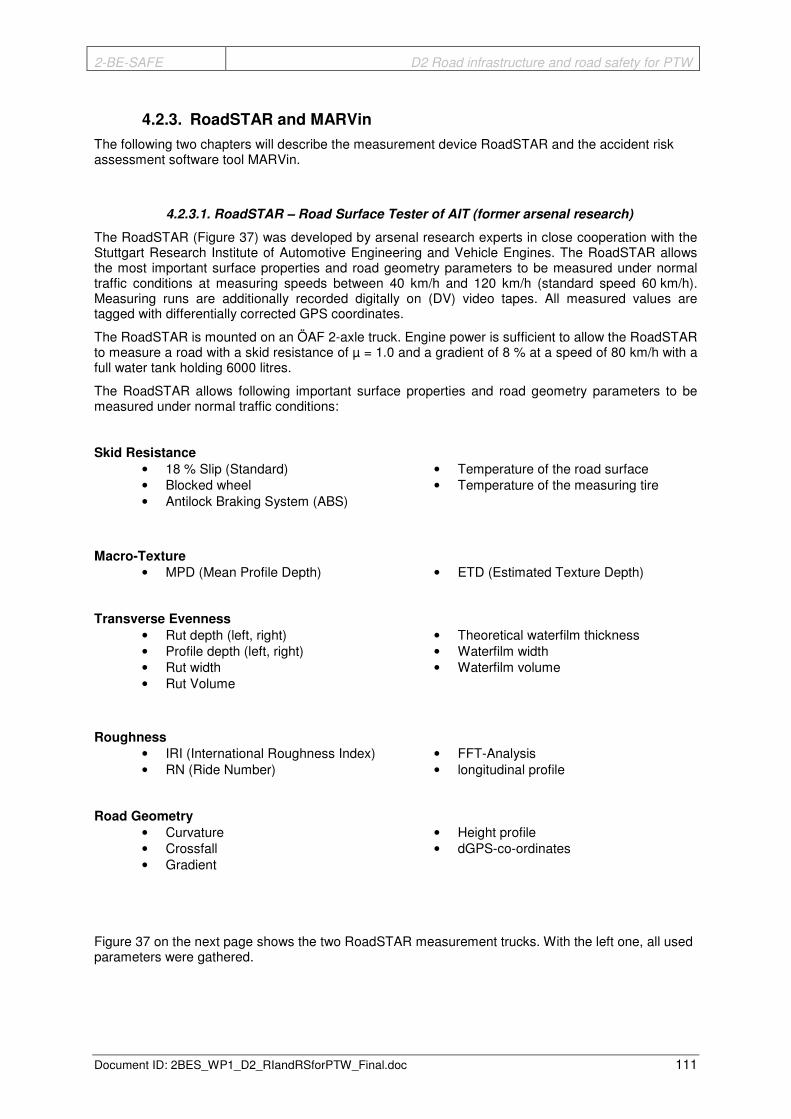
2-BE-SAFE D2 Road infrastructure and road safety for PTW
Document ID: 2BES_WP1_D2_RIandRSforPTW_Final.doc 111
4.2.3. RoadSTAR and MARVin
The following two chapters will describe the measurement device RoadSTAR and the accident risk assessment software tool MARVin.
4.2.3.1. RoadSTAR – Road Surface Tester of AIT (former arsenal research)
The RoadSTAR (Figure 37) was developed by arsenal research experts in close cooperation with the Stuttgart Research Institute of Automotive Engineering and Vehicle Engines. The RoadSTAR allows the most important surface properties and road geometry parameters to be measured under normal traffic conditions at measuring speeds between 40 km/h and 120 km/h (standard speed 60 km/h). Measuring runs are additionally recorded digitally on (DV) video tapes. All measured values are tagged with differentially corrected GPS coordinates.
The RoadSTAR is mounted on an ÖAF 2-axle truck. Engine power is sufficient to allow the RoadSTAR to measure a road with a skid resistance of µ = 1.0 and a gradient of 8 % at a speed of 80 km/h with a full water tank holding 6000 litres.
The RoadSTAR allows following important surface properties and road geometry parameters to be measured under normal traffic conditions:
Skid Resistance
• 18 % Slip (Standard) • Temperature of the road surface • Blocked wheel • Temperature of the measuring tire • Antilock Braking System (ABS)
Macro-Texture
• MPD (Mean Profile Depth) • ETD (Estimated Texture Depth)
Transverse Evenness
• Rut depth (left, right) • Theoretical waterfilm thickness • Profile depth (left, right) • Waterfilm width • Rut width • Waterfilm volume • Rut Volume
Roughness
• IRI (International Roughness Index) • FFT-Analysis • RN (Ride Number) • longitudinal profile
Road Geometry
• Curvature • Height profile • Crossfall • dGPS-co-ordinates • Gradient
Figure 37 on the next page shows the two RoadSTAR measurement trucks. With the left one, all used parameters were gathered.
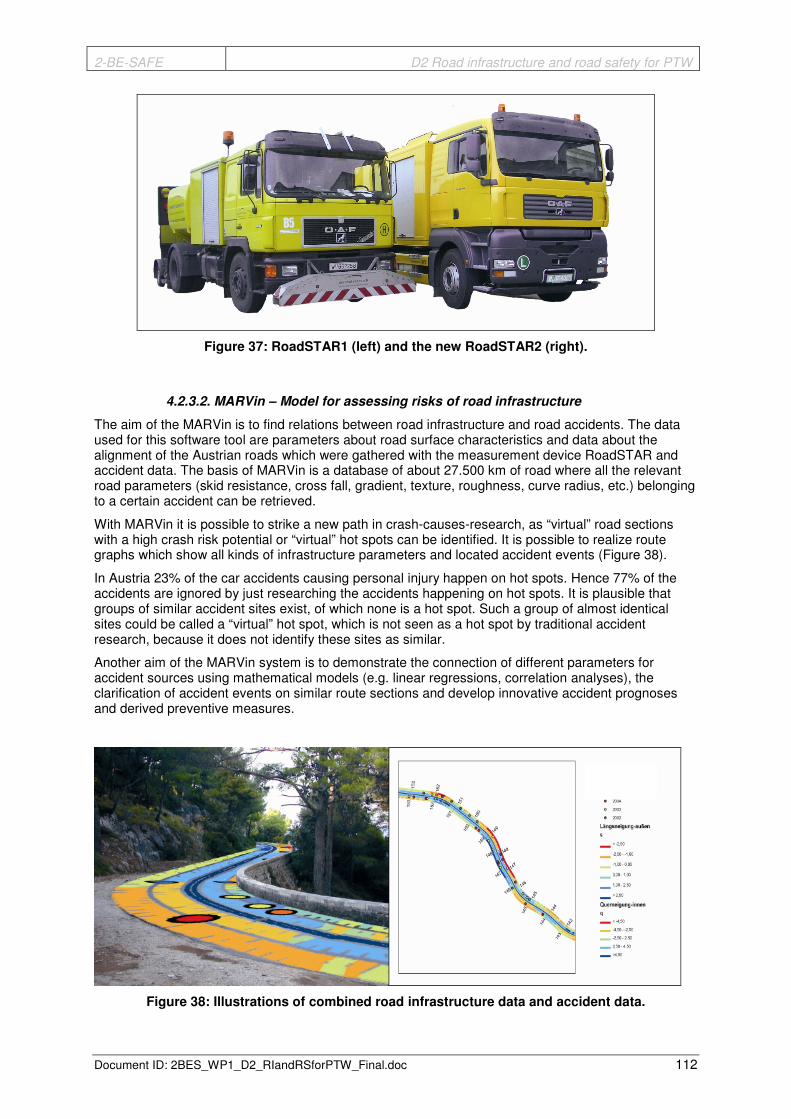
2-BE-SAFE D2 Road infrastructure and road safety for PTW
Document ID: 2BES_WP1_D2_RIandRSforPTW_Final.doc 112
Figure 37: RoadSTAR1 (left) and the new RoadSTAR2 (right).
4.2.3.2. MARVin – Model for assessing risks of road infrastructure
The aim of the MARVin is to find relations between road infrastructure and road accidents. The data used for this software tool are parameters about road surface characteristics and data about the alignment of the Austrian roads which were gathered with the measurement device RoadSTAR and accident data. The basis of MARVin is a database of about 27.500 km of road where all the relevant road parameters (skid resistance, cross fall, gradient, texture, roughness, curve radius, etc.) belonging to a certain accident can be retrieved.
With MARVin it is possible to strike a new path in crash-causes-research, as “virtual” road sections with a high crash risk potential or “virtual” hot spots can be identified. It is possible to realize route graphs which show all kinds of infrastructure parameters and located accident events (Figure 38).
In Austria 23% of the car accidents causing personal injury happen on hot spots. Hence 77% of the accidents are ignored by just researching the accidents happening on hot spots. It is plausible that groups of similar accident sites exist, of which none is a hot spot. Such a group of almost identical sites could be called a “virtual” hot spot, which is not seen as a hot spot by traditional accident research, because it does not identify these sites as similar.
Another aim of the MARVin system is to demonstrate the connection of different parameters for accident sources using mathematical models (e.g. linear regressions, correlation analyses), the clarification of accident events on similar route sections and develop innovative accident prognoses and derived preventive measures.
Figure 38: Illustrations of combined road infrastructure data and accident data.
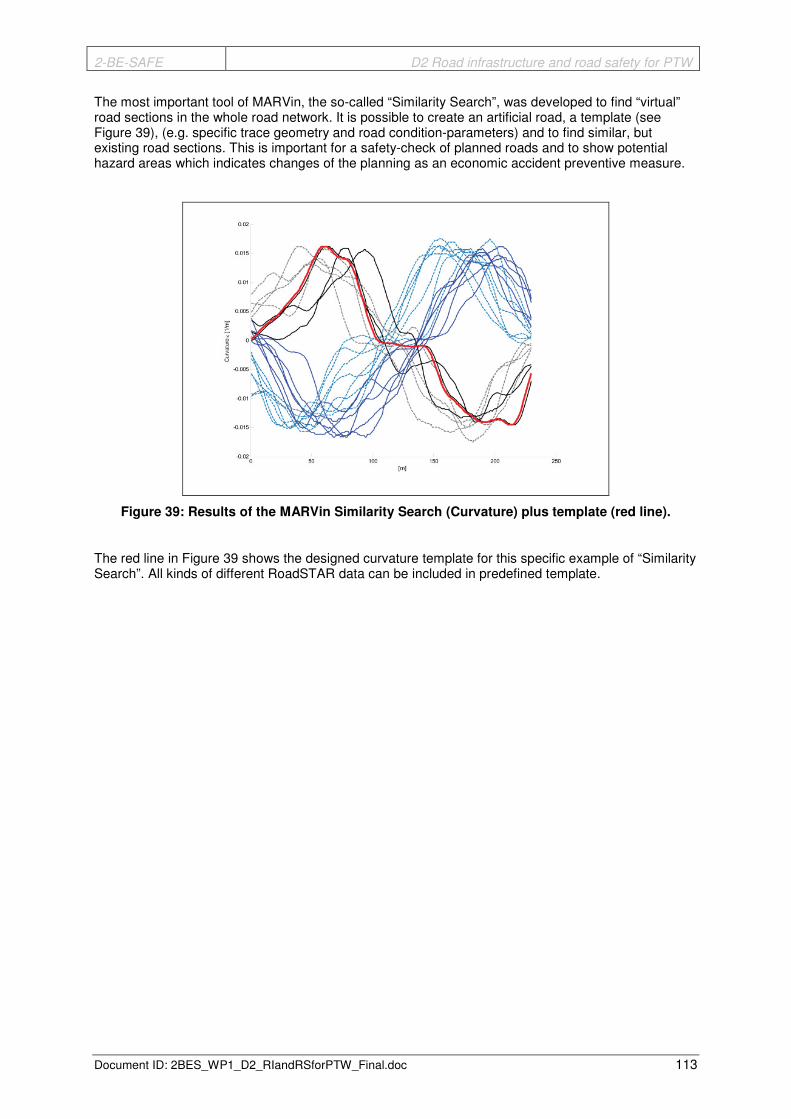
2-BE-SAFE D2 Road infrastructure and road safety for PTW
Document ID: 2BES_WP1_D2_RIandRSforPTW_Final.doc 113
The most important tool of MARVin, the so-called “Similarity Search”, was developed to find “virtual” road sections in the whole road network. It is possible to create an artificial road, a template (see Figure 39), (e.g. specific trace geometry and road condition-parameters) and to find similar, but existing road sections. This is important for a safety-check of planned roads and to show potential hazard areas which indicates changes of the planning as an economic accident preventive measure.
Figure 39: Results of the MARVin Similarity Search (Curvature) plus template (red line).
The red line in Figure 39 shows the designed curvature template for this specific example of “Similarity Search”. All kinds of different RoadSTAR data can be included in predefined template.
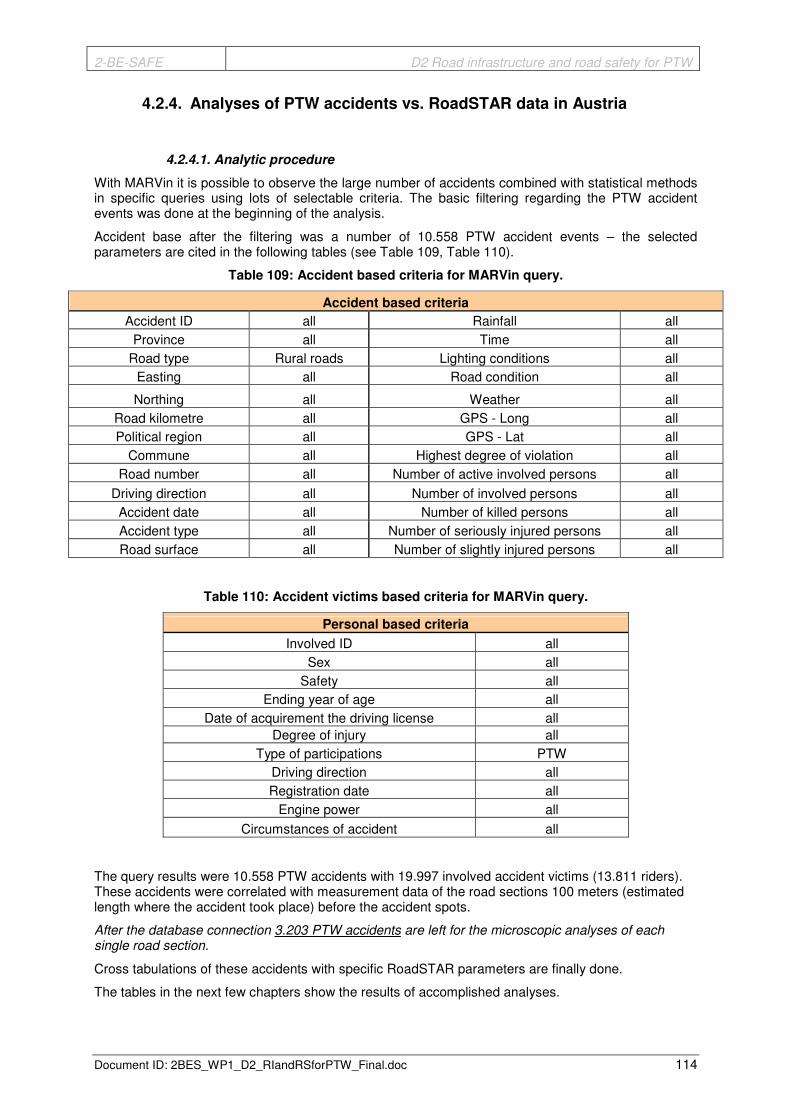
2-BE-SAFE D2 Road infrastructure and road safety for PTW
Document ID: 2BES_WP1_D2_RIandRSforPTW_Final.doc 114
4.2.4. Analyses of PTW accidents vs. RoadSTAR data in Austria
4.2.4.1. Analytic procedure
With MARVin it is possible to observe the large number of accidents combined with statistical methods in specific queries using lots of selectable criteria. The basic filtering regarding the PTW accident events was done at the beginning of the analysis.
Accident base after the filtering was a number of 10.558 PTW accident events – the selected parameters are cited in the following tables (see Table 109, Table 110).
Table 109: Accident based criteria for MARVin query.
Accident based criteria
Accident ID all Rainfall all Province all Time all
Road type Rural roads Lighting conditions all Easting all Road condition all
Northing all Weather all Road kilometre all GPS - Long all Political region all GPS - Lat all
Commune all Highest degree of violation all Road number all Number of active involved persons all
Driving direction all Number of involved persons all Accident date all Number of killed persons all Accident type all Number of seriously injured persons all Road surface all Number of slightly injured persons all
Table 110: Accident victims based criteria for MARVin query.
Personal based criteria
Involved ID all Sex all
Safety all Ending year of age all
Date of acquirement the driving license all Degree of injury all
Type of participations PTW Driving direction all Registration date all
Engine power all
Circumstances of accident all
The query results were 10.558 PTW accidents with 19.997 involved accident victims (13.811 riders). These accidents were correlated with measurement data of the road sections 100 meters (estimated length where the accident took place) before the accident spots.
After the database connection 3.203 PTW accidents are left for the microscopic analyses of each single road section.
Cross tabulations of these accidents with specific RoadSTAR parameters are finally done.
The tables in the next few chapters show the results of accomplished analyses.

2-BE-SAFE D2 Road infrastructure and road safety for PTW
Document ID: 2BES_WP1_D2_RIandRSforPTW_Final.doc 115
Declaration for reading the tables:
• Category = Classification of quality in classes
• Number of PTW accidents = Number of accidents allocated to the different categories
• Rate of PTW accidents = Rate of accidents to the sum of allocated PTW accidents
• Occurrence of condition classes = Occurrence of road condition in Austria. Detected in a measurement campaign 2001 - 2002 for 10.000 km of rural roads.
• The quality classes (from very good to very poor) were defined by RVS 13.01.15 (FSV Austria, Austrian direction for road construction, 2006). The classes within this directive are basically defined for A-level roads (motorways), in many cases suitable also for the rural roads, but sometimes maybe considered as inappropriate. No specific quality classes are defined for rural roads in Austria.
4.2.4.2. Longitudinal gradient [s]
Table 111: PTW accidents vs. Longitudinal gradient.
Category Longitudinal gradient absolute
[%] Number of PTW accidents Rate of PTW
accidents
1 1 1330 41,72% 2 2 708 22,21% 3 3 381 11,95% 4 4 200 6,27% 5 5 150 4,71% 6 6 133 4,17% 7 7 100 3,14% 8 8 71 2,23% 9 9 41 1,29% 10 10 30 0,94% 11 > 10 44 1,38%
sum 3188 100,00%
not known 15
The longitudinal gradient (see Table 111) is the slope of the gradient in driving direction. The absolute gradient does not differentiate between decline and inclination. Most of the accidents happen on nearly plane road sections. Rations for the gathered data in the whole road network are not available. But it can be estimated that most of the built roads are nearly planar.

2-BE-SAFE D2 Road infrastructure and road safety for PTW
Document ID: 2BES_WP1_D2_RIandRSforPTW_Final.doc 116
4.2.4.3. Crossfall [q]
Table 112: PTW accidents vs. Crossfall.
Category Transversal gradient absolute
[%] Number of PTW accidents Rate of PTW
accidents
1 1 160 5,02% 2 2 718 22,52% 3 3 939 29,45% 4 4 782 24,53% 5 5 352 11,04% 6 6 157 4,92% 7 7 57 1,79% 8 8 17 0,53% 9 9 3 0,09% 10 10 2 0,06% 11 > 10 1 0,03%
sum 3188 100,00%
not known 15
The crossfall of a road surface is the inclination in transversal axes of the road and perform task of driving dynamics and drainage of the road surface. In the Austrian road construction directives the crossfall is defined as 2.5% for straight roads to optimise the drainage, in curves and all changes of curve directions the crossfall can be lower or higher than 2.5%. The Table 112 above shows that the most PTW crashes occur on roads with an gradient around 2.5%.
4.2.4.4. Skid resistance [µ]
Table 113: PTW accidents vs. Skid resistance.
Category Quality Classes Skid resistance µ [-]
Number of PTW accidents
Rate of PTW accidents
Occurrence of conditions
classes
1 very good µ > 0,75 1711 53,77% 57,60% 2 good 0,75 ≥ µ > 0,59 985 30,96% 27,05% 3 average 0,59 ≥ µ > 0,45 342 10,75% 10,75% 4 poor 0,45 ≥ µ > 0,38 91 2,86% 2,67% 5 very poor µ ≤ 0,38 53 1,67% 1,93%
sum 3182 100,00% 100,00%
not known 21
The skid resistance of a road surface means the property to develop friction between the tire and road surface. Table 113 shows PTW accidents related to skid resistance. More than 53% of all accidents on rural or inter urban roads happen on sections with very good road condition quality.
Also the occurrence of the measured skid resistance data in the whole net and the relative numbers can not change this fact. The background for the quality classes and a new Austrian model is shown a publication by Maurer (2007).
2-BE-SAFE D2 Road infrastructure and road safety for PTW
Document ID: 2BES_WP1_D2_RIandRSforPTW_Final.doc 117
4.2.4.5. Longitudinal evenness [IRI]
Table 114: PTW accidents vs. Longitudinal evenness IRI.
Category Quality Classes
Longitudinal evenness IRI [m/km]
Number of PTW accidents
Rate of PTW accidents
Occurrence of conditions
classes
1 very good 0,0 ≤ IRI < 1,0 88 2,77% 5,38% 2 good 1,0 ≤ IRI < 1,8 975 30,66% 38,48% 3 average 1,8 ≤ IRI < 3,0 1298 40,82% 34,85% 4 poor 3,0 ≤ IRI < 4,5 591 18,58% 14,36% 5 very poor IRI ≥ 4,5 228 7,17% 6,93%
sum 3180 100,00% 100,00%
not known 23
The International Roughness Index (IRI) is a parameter to describe the evenness in longitudinal driving direction. IRI describes the unevenness of a road surface as a relative velocity between an unsprung and full sprung mass of a virtual suspension in meters per kilometre. Detailed research work in the IRI has been done by Spielhofer et al. (2008).
Table 114 shows that most of the accidents happen in areas of good and average. Also the occurrence of the measured IRI data in the whole net and the relative numbers can not change this fact. But the trend shows that critical IRI values have higher rates at road section where PTW crashes occurred.
4.2.4.6. Texture [MPD]
Table 115: PTW accidents vs. Texture MPD.
Category Quality Classes Texture MPD [mm]
Number of PTW accidents
Rate of PTW accidents
Occurrence of conditions
classes
1 very good MPD > 0,8 314 10,23% 14,07% 2 good 0,8 ≥ MPD > 0,7 164 5,34% 6,39% 3 average 0,7 ≥ MPD > 0,6 278 9,06% 10,05% 4 poor 0,6 ≥ MPD > 0,3 1802 58,70% 55,39% 5 very poor MPD ≤ 0,3 512 16,68% 14,11%
sum 3070 100,00% 100,00%
not known 133
The Mean Profile Depth (MPD) means the form of a road surface (see Figure 40). MPD does not depend only on the manufactured material but also on process during the manufacture. Additional to the named parameters, texture also changed in course of time. This affect depend on the weather and on the traffic flow.
The results of analysis concerning texture and PTW accidents are shown in Table 115. Most of the accidents happen in category “poor”, more than 58% of the PTW accidents are allocated to this quality class. This class is also largest category at the occurrence of the measured data in the whole net. This means that the most parts of Austrian rural roads are in bad texture condition – or the quality classes are not well divided.
Also the occurrence of the measured MPD data in the whole net and the relative numbers can not change this fact. The interesting outputs of the queries regarding skid resistance and texture give an important link to the possible risk factors for the driving dynamics of PTWs. It seems that influence of the texture and its effect of toothing between tyre rubber and asphalt or concrete surfaces are more significant at accident sites, than the friction values (skid resistance) of the infrastructure. These thesis need further in-depth research in terms of driving manoeuvres – side forces in curves, acceleration and deceleration tests.
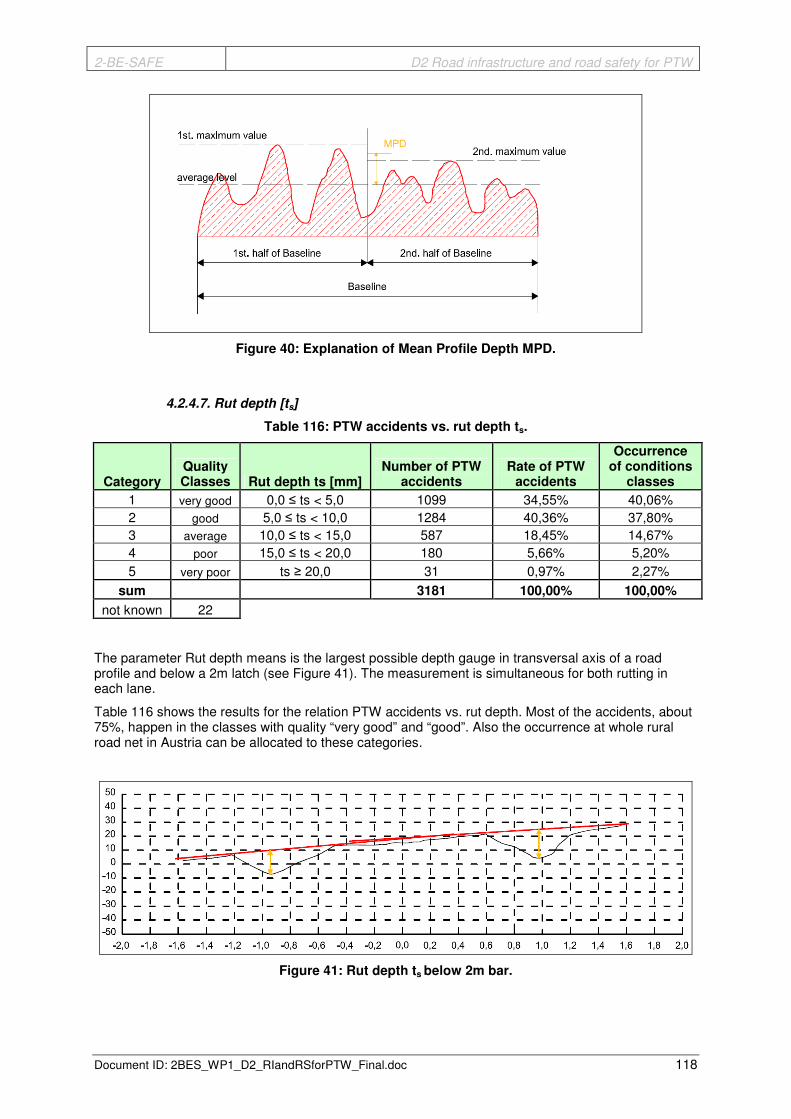
2-BE-SAFE D2 Road infrastructure and road safety for PTW
Document ID: 2BES_WP1_D2_RIandRSforPTW_Final.doc 118
Figure 40: Explanation of Mean Profile Depth MPD.
4.2.4.7. Rut depth [ts]
Table 116: PTW accidents vs. rut depth ts.
Category Quality Classes Rut depth ts [mm]
Number of PTW accidents
Rate of PTW accidents
Occurrence of conditions
classes
1 very good 0,0 ≤ ts < 5,0 1099 34,55% 40,06% 2 good 5,0 ≤ ts < 10,0 1284 40,36% 37,80% 3 average 10,0 ≤ ts < 15,0 587 18,45% 14,67% 4 poor 15,0 ≤ ts < 20,0 180 5,66% 5,20% 5 very poor ts ≥ 20,0 31 0,97% 2,27%
sum 3181 100,00% 100,00%
not known 22
The parameter Rut depth means is the largest possible depth gauge in transversal axis of a road profile and below a 2m latch (see Figure 41). The measurement is simultaneous for both rutting in each lane.
Table 116 shows the results for the relation PTW accidents vs. rut depth. Most of the accidents, about 75%, happen in the classes with quality “very good” and “good”. Also the occurrence at whole rural road net in Austria can be allocated to these categories.
Figure 41: Rut depth ts below 2m bar.

2-BE-SAFE D2 Road infrastructure and road safety for PTW
Document ID: 2BES_WP1_D2_RIandRSforPTW_Final.doc 119
4.2.4.8. Theoretical water [tw]
Table 117: PTW accidents vs. theoretical water depth tw.
Category Quality Classes
Theor. waterdepth tw [mm]
Number of PTW accidents
Rate of PTW accidents
Occurrence of conditions
classes
1 very good 0,0 ≤ tw < 1,0 315 9,90% 73,69% 2 good 1,0 ≤ tw < 2,5 1618 50,86% 12,05% 3 average 2,5 ≤ tw < 4,0 760 23,89% 3,44% 4 poor 4,0 ≤ tw < 6,0 226 7,10% 4,44% 5 very poor tw ≥ 6,0 262 8,24% 6,36%
sum 3181 100,00% 100,00%
not known 22
The theoretical water depth indicates the maximum depth of water accumulation in the left and right rutting, which is theoretical possible (see Figure 42). This parameter is dependent on crossfall at profile of roads. In the case of very low crossfall, water can be accumulated in rutting and thus can yield a threat to road safety caused by aquaplaning.
Figure 42: Theoretical water depth tw.
Table 117 shows the results of relation PTW accidents and theoretical water depth. Most of the accidents are situated in category 2, quality “good”. Maybe the quality class “good” is not well adapted depending on the PTW crash risk? This questions needs to be answered in further research work.
Greater significations have the PTW accidents in quality class “average”. Nearly 24% of the accidents are allocated to this category, but only 3.44% of the measured data of the whole rural road net in Austria correspondent with this category.
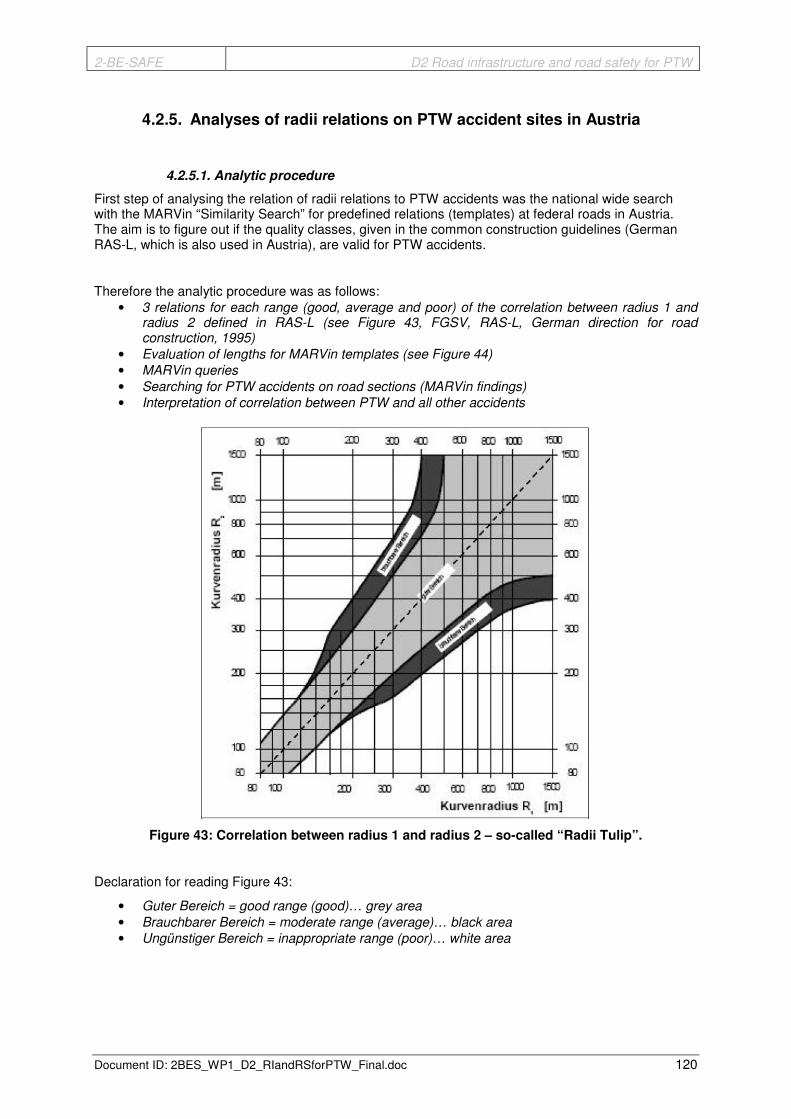
2-BE-SAFE D2 Road infrastructure and road safety for PTW
Document ID: 2BES_WP1_D2_RIandRSforPTW_Final.doc 120
4.2.5. Analyses of radii relations on PTW accident sites in Austria
4.2.5.1. Analytic procedure
First step of analysing the relation of radii relations to PTW accidents was the national wide search with the MARVin “Similarity Search” for predefined relations (templates) at federal roads in Austria. The aim is to figure out if the quality classes, given in the common construction guidelines (German RAS-L, which is also used in Austria), are valid for PTW accidents.
Therefore the analytic procedure was as follows: • 3 relations for each range (good, average and poor) of the correlation between radius 1 and
radius 2 defined in RAS-L (see Figure 43, FGSV, RAS-L, German direction for road construction, 1995)
• Evaluation of lengths for MARVin templates (see Figure 44)
• MARVin queries
• Searching for PTW accidents on road sections (MARVin findings)
• Interpretation of correlation between PTW and all other accidents
Figure 43: Correlation between radius 1 and radius 2 – so-called “Radii Tulip”.
Declaration for reading Figure 43:
• Guter Bereich = good range (good)… grey area
• Brauchbarer Bereich = moderate range (average)… black area
• Ungünstiger Bereich = inappropriate range (poor)… white area

2-BE-SAFE D2 Road infrastructure and road safety for PTW
Document ID: 2BES_WP1_D2_RIandRSforPTW_Final.doc 121
Declaration for reading Figure 44:
• L1 ….. 25 % of circumference of first radius
• L2 ….. Clothoid first radius
• L3 ….. Clothoid second radius
• L4 ….. 30% of circumference of second radius
Figure 44: Schematic template for MARVin query - Curvature (1/R).
Example:
R1 = 100m R2 = 300m L1 = circumference * 0.25 ≈ 157m L4 = circumference * 0.30 ≈ 565m
L2, L3 = calculated with Table 2 of RVS 03.03.23 (Austrian direction for road construction, FSV, 2004)
4.2.5.2. Findings based on radii relations (MARVin queries based on given templates)
The results of analysis based on defined radii relations in Austria are enclosed at the end of the report (see Annex). The selected templates for the similarity search were: R1/R2 – 100/100, 200/200, 300/300; 100/150, 160/250, 200/300; 50/150, 100/200, 100/300.
Many of road sections have been found with the MARVin similarity search module. This means that the detected road sections are according to the randomized MARVin template.
PTW accidents could be allocated to these located road sections. But the significance of these results is not given. There are no detectable differences between the defined quality classes and the PTW accidents.
The reasons are the approach itself and the missing of necessary data: • Because of missing data relating to traffic flow and distribution to different traffic participants
(exposure data and modal split is not available), the link between PTW accidents to all accidents is not clear. A significant PTW accident risk can not be identified with this analysis methodology – also because the “non-accidents” can not be included in the analyses in a comparable way.
• To tackle some aspects of this failure it is necessary to analyse defined road sections, where the traffic flow is approximately constant. In this case of nearly similar traffic flows, there is no larger arterial road existing or any other federal roads crossing. The radii relations on the complete single section are comparable, because the relative accident risk regarding the constant exposure (even there are no absolute numbers) is defined.
• The variation of queries, caused by the 9 predefined construction of the template is limited. Further analyses with this method need much more templates to be checked.
• The assumption of radii ranges till 300m is justified by the annual PTW accident statistic, but it causes problems, especially when PTW accidents occur in curves following after a straight road section. These combinations were not covered by the similarity search approach.
• These arguments are the reason for the next analysis step, to choose defined road sections, with an estimated higher motorcycle exposure (motorcycle routes).

2-BE-SAFE D2 Road infrastructure and road safety for PTW
Document ID: 2BES_WP1_D2_RIandRSforPTW_Final.doc 122
4.2.6. Analyses based on radii relations on road sections in the Austrian federal roads network
The reason for the choice of seven defined road sections at typical motorcycles routes is, that the traffic flow inside the sections is nearly constant, also the modal split. The exposure of motorcycles is relatively high on these specific sections in Austria. Another advantage of this kind of investigation is, that also road sections with no registered accidents are analysed in a comparable way, so the risk assessments are more appropriate and significant.
The analysis procedure was the following:
• Searching for defined road sections
• Query of PTW accidents at different road sections from 2000 to 2007
• Identification of radii [m] and radii relations on the whole section
• Positioning of PTW accidents in map
• Allocation of PTW accident or no-accident to radii relation
• Inscription of PTW accidents or no-accident in “Radii Tulip” (see Figure 43)
• Query of all other accidents at all road sections
• Positioning of other accidents in map
• Allocation of other accidents and no-accidents to radii relation
• Inscription of other accidents and no-accidents in “Radii Tulip” A critical point within these queries was, that just for 140 of 172 in detail analysed and located accidents, the direction of travel could be allocated. The road sections have been checked in both directions (increasing and decreasing km). The detailed outputs (figures of the radii tulips, were the accidents and no-accidents are drawn in) of the specific inspections and the results for other vehicles accidents are enclosed in the Annex of the report.
Figure 45 shows the description of allocation PTW and all other accidents to radii relation. The scene of accident is always situated in radius 2. The background for this conclusion is that an accident, especially PTW accident, starts to happen some meters before the actual spot of the crash event.
Figure 45: Description for the positioning of PTW accident (or other accidents) in radii relation.
For the recording of PTW accidents and all other accidents in the radii tulips, all accidents are checked on their accident types and driving directions. Accidents with no defined driving direction are filtered out and eliminated, also accidents with mistakes (e.g. impossible accident type) in the data base in some cases.
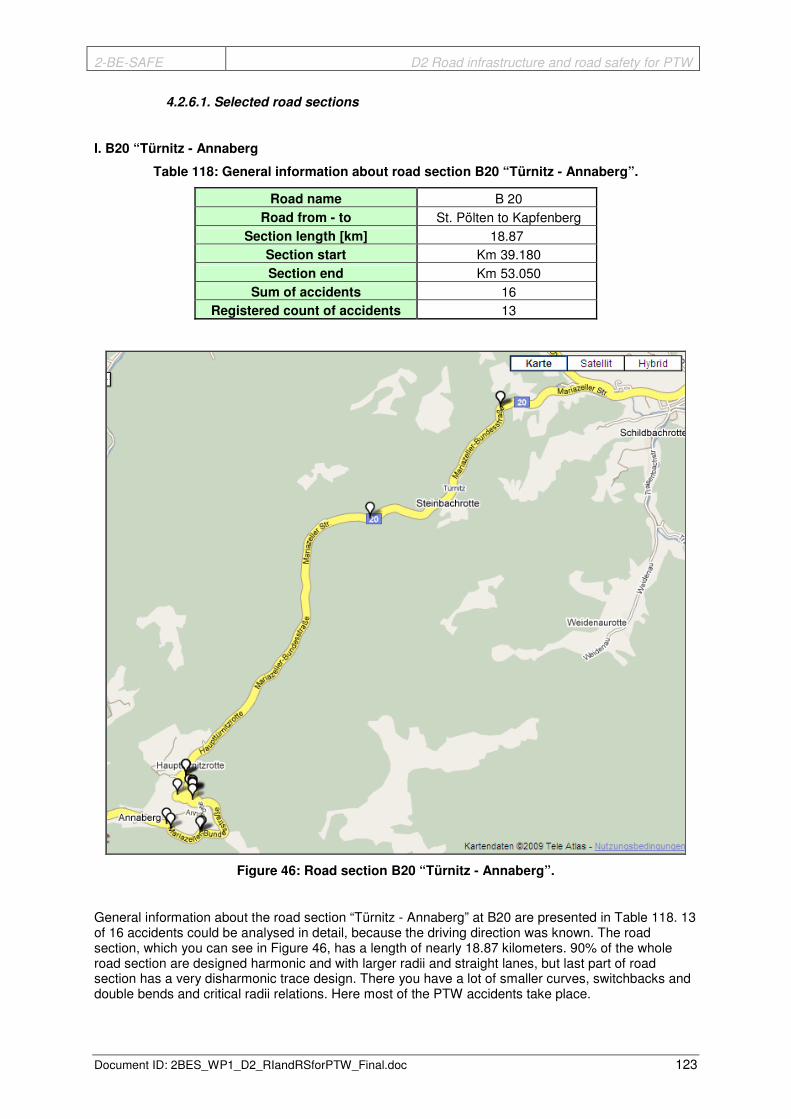
2-BE-SAFE D2 Road infrastructure and road safety for PTW
Document ID: 2BES_WP1_D2_RIandRSforPTW_Final.doc 123
4.2.6.1. Selected road sections
I. B20 “Türnitz - Annaberg
Table 118: General information about road section B20 “Türnitz - Annaberg”.
Road name B 20 Road from - to St. Pölten to Kapfenberg
Section length [km] 18.87 Section start Km 39.180 Section end Km 53.050
Sum of accidents 16 Registered count of accidents 13
Figure 46: Road section B20 “Türnitz - Annaberg”.
General information about the road section “Türnitz - Annaberg” at B20 are presented in Table 118. 13 of 16 accidents could be analysed in detail, because the driving direction was known. The road section, which you can see in Figure 46, has a length of nearly 18.87 kilometers. 90% of the whole road section are designed harmonic and with larger radii and straight lanes, but last part of road section has a very disharmonic trace design. There you have a lot of smaller curves, switchbacks and double bends and critical radii relations. Here most of the PTW accidents take place.
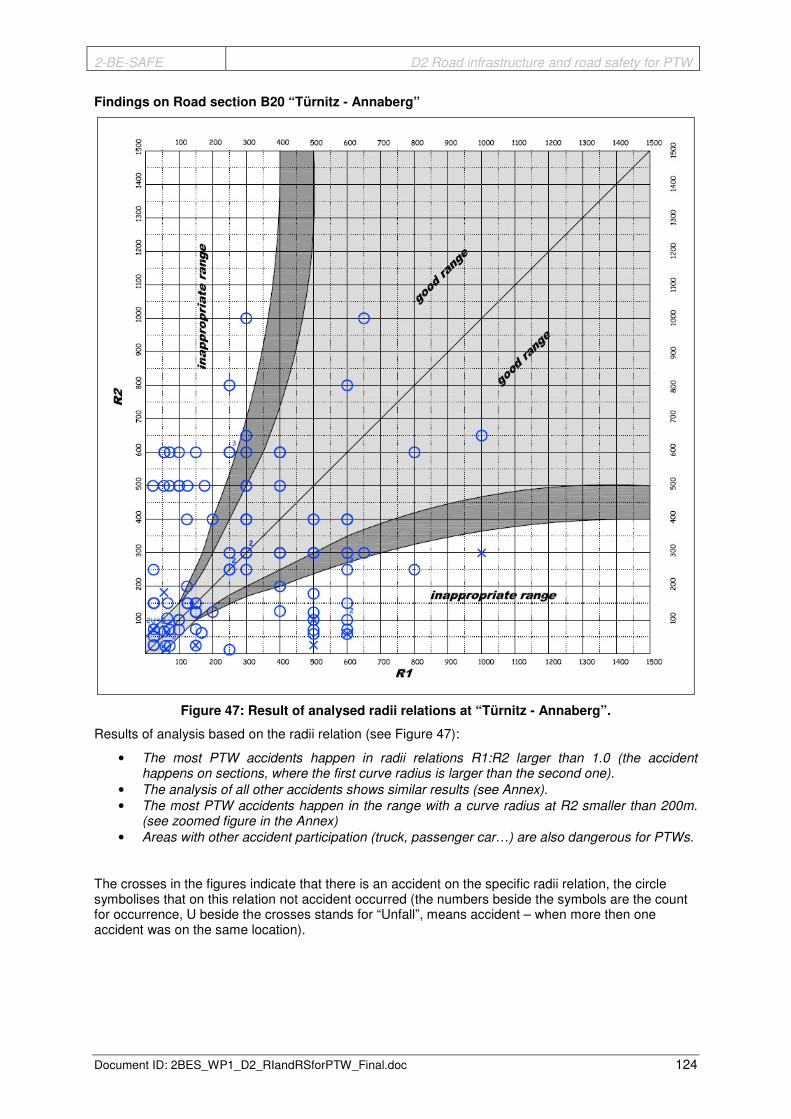
2-BE-SAFE D2 Road infrastructure and road safety for PTW
Document ID: 2BES_WP1_D2_RIandRSforPTW_Final.doc 124
Findings on Road section B20 “Türnitz - Annaberg”
Figure 47: Result of analysed radii relations at “Türnitz - Annaberg”.
Results of analysis based on the radii relation (see Figure 47):
• The most PTW accidents happen in radii relations R1:R2 larger than 1.0 (the accident happens on sections, where the first curve radius is larger than the second one).
• The analysis of all other accidents shows similar results (see Annex).
• The most PTW accidents happen in the range with a curve radius at R2 smaller than 200m. (see zoomed figure in the Annex)
• Areas with other accident participation (truck, passenger car…) are also dangerous for PTWs.
The crosses in the figures indicate that there is an accident on the specific radii relation, the circle symbolises that on this relation not accident occurred (the numbers beside the symbols are the count for occurrence, U beside the crosses stands for “Unfall”, means accident – when more then one accident was on the same location).
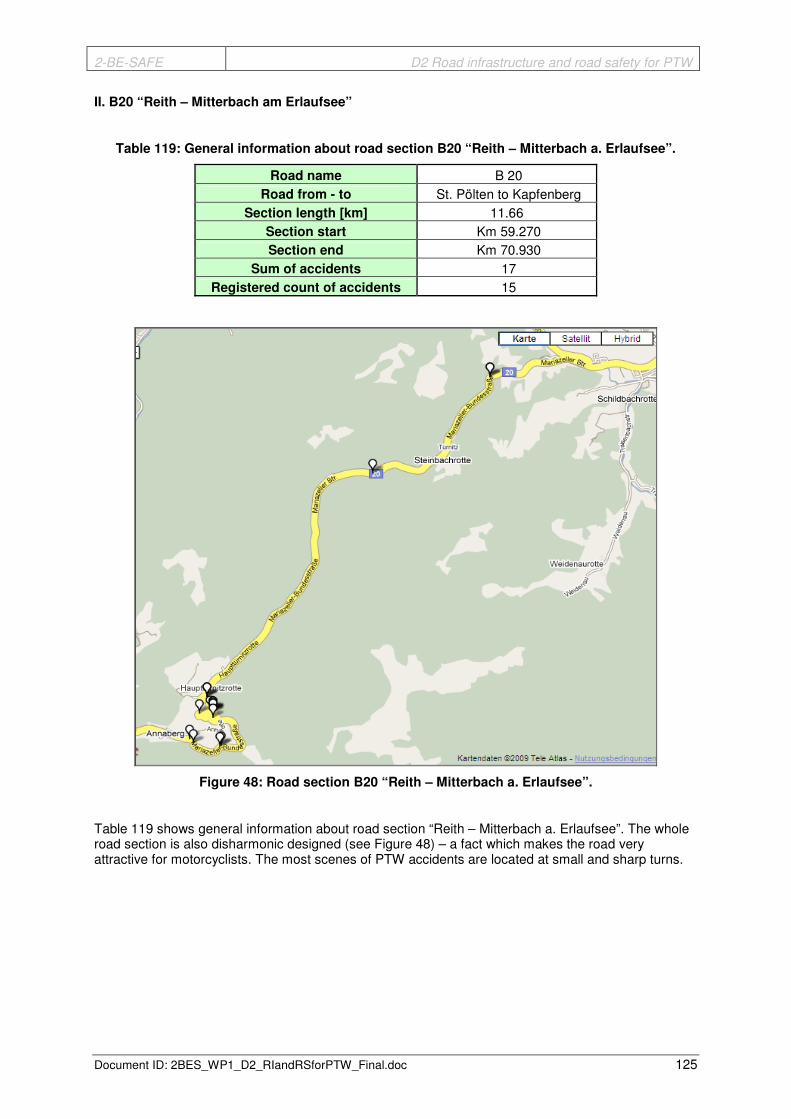
2-BE-SAFE D2 Road infrastructure and road safety for PTW
Document ID: 2BES_WP1_D2_RIandRSforPTW_Final.doc 125
II. B20 “Reith – Mitterbach am Erlaufsee”
Table 119: General information about road section B20 “Reith – Mitterbach a. Erlaufsee”.
Road name B 20 Road from - to St. Pölten to Kapfenberg
Section length [km] 11.66 Section start Km 59.270 Section end Km 70.930
Sum of accidents 17 Registered count of accidents 15
Figure 48: Road section B20 “Reith – Mitterbach a. Erlaufsee”.
Table 119 shows general information about road section “Reith – Mitterbach a. Erlaufsee”. The whole road section is also disharmonic designed (see Figure 48) – a fact which makes the road very attractive for motorcyclists. The most scenes of PTW accidents are located at small and sharp turns.

2-BE-SAFE D2 Road infrastructure and road safety for PTW
Document ID: 2BES_WP1_D2_RIandRSforPTW_Final.doc 126
Findings on Road section B20 “Reith – Mitterbach a. Erlaufsee”
Figure 49: Result of analysed radii relations at “Reith – Mitterbach a. Erlaufsee”.
Results of analysis based on the radii relation (see Figure 49):
• A lot of PTW accidents in the range of R1 = 100m and R2 = 100m – this very good relation probably allows too high speeds. (see zoomed figure in the Annex)
• The same results show the analysis of all other accident participations.
• The most PTW accidents happen in radii relations R1:R2 larger than 1.0
• The most PTW accidents happen in the range, with a curve radius R2 smaller than 200m.

2-BE-SAFE D2 Road infrastructure and road safety for PTW
Document ID: 2BES_WP1_D2_RIandRSforPTW_Final.doc 127
III. B27 “L134 (Klostertal) – Hirschwang an der Rax“
Table 120: General information about road section B27.
Road name B 27 Road from - to Rohr i. Gebirge to Gloggnitz
Section length [km] 14.82 Section start Km 11.200 Section end Km 26.020
Sum of accidents 43 Registered count of accidents 39
Figure 50: Road section B27 “L134 (Klostertal) – Hirschwang a.d. Rax”.
Road section “L134 (Klostertal) – Hirschwang a.d. Rax” is the section with the most PTW accidents, compared to the other six road sections. Table 120 shows general information about this road section. The alignment of road is constructed nearly harmonic; without very sharp curves. The PTW accidents are situated along the whole road section. Although, the road section is nearly constant designed, there are also some sites with an accumulation of PTW accidents, situated at curves with smaller radii.

2-BE-SAFE D2 Road infrastructure and road safety for PTW
Document ID: 2BES_WP1_D2_RIandRSforPTW_Final.doc 128
Findings on Road section B27 “L134 (Klostertal) – Hirschwang a.d. Rax”
Figure 51: Result of analysed radii relation at “L134 (Klostertal) – Hirschwang a.d. Rax”.
Results of analysis based on the radii relation (see Figure 51):
• The most PTW accidents occure in radii relations R1:R2 larger than 1.0
• But there also exist PTW accidents with a radii relation smaller than 1.0 (the second radius is larger then the first one).
• Areas with other accident participation (truck, passenger car…) are also dangerous for PTWs.
• The most PTW accidents happen in the range with a curve radius R2 smaller than 200m.

2-BE-SAFE D2 Road infrastructure and road safety for PTW
Document ID: 2BES_WP1_D2_RIandRSforPTW_Final.doc 129
IV. B72 “St. Kathrein am Hauenstein – Krieglach“
Table 121: General information about road section B72.
Road name B 72 Road from - to Graz to Krieglach
Section length [km] 12.80 Section start Km 71.800 Section end Km 84.600
Sum of accidents 16 Registered count of accidents 11
Figure 52: Road section B72.
Table 121 shows general information about the road section “St. Kathrein a. Hauenstein - Krieglach”. The alignment of road is harmonic with some longer nearly straight passages. The PTW accidents are evenly distributed along the whole road section. Figure 52 shows the map of road section with the located accident spots.
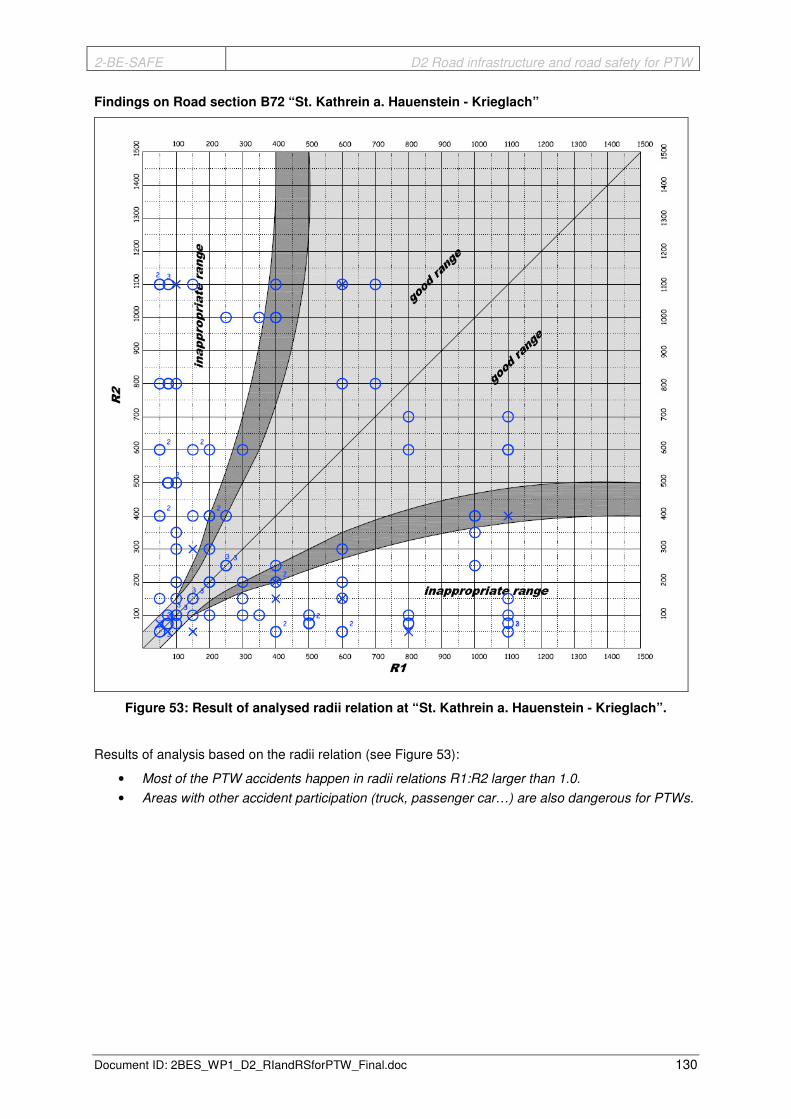
2-BE-SAFE D2 Road infrastructure and road safety for PTW
Document ID: 2BES_WP1_D2_RIandRSforPTW_Final.doc 130
Findings on Road section B72 “St. Kathrein a. Hauenstein - Krieglach”
Figure 53: Result of analysed radii relation at “St. Kathrein a. Hauenstein - Krieglach”.
Results of analysis based on the radii relation (see Figure 53):
• Most of the PTW accidents happen in radii relations R1:R2 larger than 1.0.
• Areas with other accident participation (truck, passenger car…) are also dangerous for PTWs.
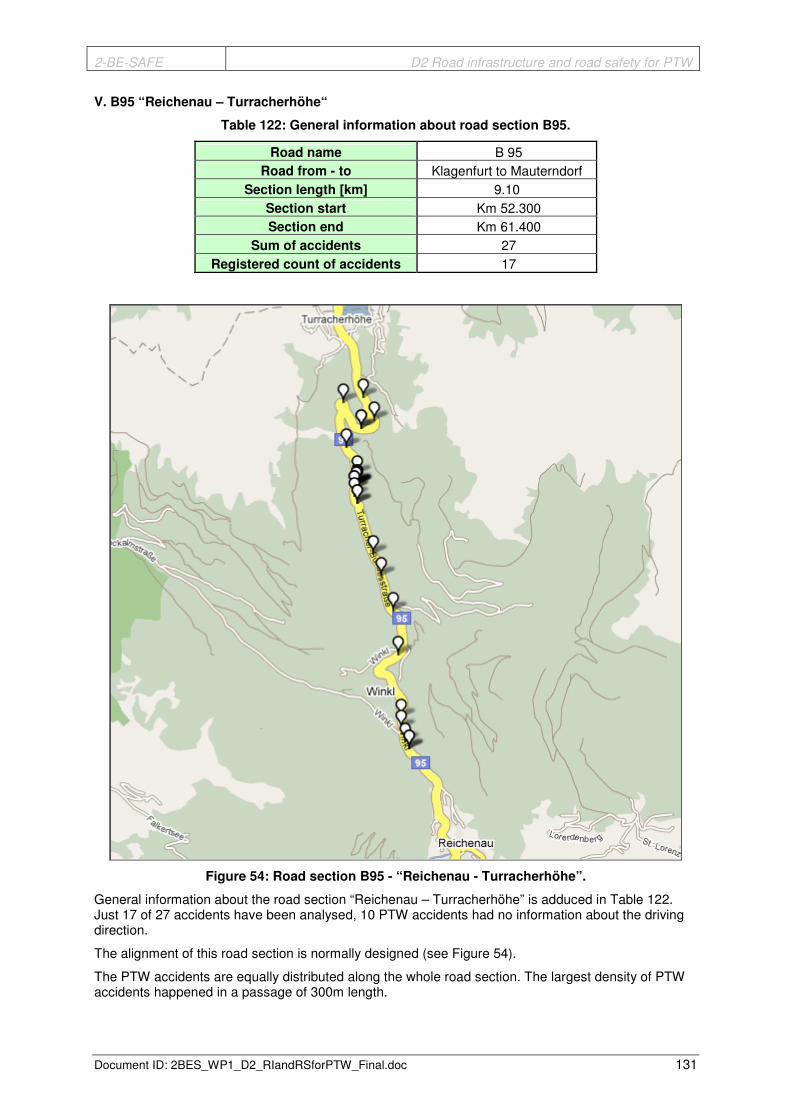
2-BE-SAFE D2 Road infrastructure and road safety for PTW
Document ID: 2BES_WP1_D2_RIandRSforPTW_Final.doc 131
V. B95 “Reichenau – Turracherhöhe“
Table 122: General information about road section B95.
Road name B 95 Road from - to Klagenfurt to Mauterndorf
Section length [km] 9.10 Section start Km 52.300 Section end Km 61.400
Sum of accidents 27 Registered count of accidents 17
Figure 54: Road section B95 - “Reichenau - Turracherhöhe”.
General information about the road section “Reichenau – Turracherhöhe” is adduced in Table 122. Just 17 of 27 accidents have been analysed, 10 PTW accidents had no information about the driving direction.
The alignment of this road section is normally designed (see Figure 54).
The PTW accidents are equally distributed along the whole road section. The largest density of PTW accidents happened in a passage of 300m length.

2-BE-SAFE D2 Road infrastructure and road safety for PTW
Document ID: 2BES_WP1_D2_RIandRSforPTW_Final.doc 132
Findings on Road section B95 “Reichenau - Turracherhöhe”
Figure 55: Result of analysed radii relation at “Reichenau - Turracherhöhe”.
Results of analysis based on the radii relation (see Figure 55):
• The most PTW accidents happen in radii relations R1:R2 larger than 1.0.
• There are also PTW accidents in good range.
• Areas with other accident participations are not so dangerous for PTWs. Other road sections show a higher correlation between PTW and other accident participations.
• Especially of interest is the range between 0 and 200m.

2-BE-SAFE D2 Road infrastructure and road safety for PTW
Document ID: 2BES_WP1_D2_RIandRSforPTW_Final.doc 133
VI. B127 “Rottenegg – Lacken“
Table 123: General information about road section B127.
Road name B 127 Road from - to Linz to Rohrbach
Section length [km] 4.49 Section start Km 15.800 Section end Km 20.290
Sum of accidents 13 Registered count of accidents 9
Figure 56: Road section B127 - “Rottenegg - Lacken”.
The shortest road section of the seven selected ones is on B127. General information about the road section “Rottenegg - Lacken” is presented in Table 123. The map is shown in Figure 56.
Although this road section is not the longest there is a very interesting hot spot identified. 8 of the 9 PTW accidents are located inside of a 460m passage.

2-BE-SAFE D2 Road infrastructure and road safety for PTW
Document ID: 2BES_WP1_D2_RIandRSforPTW_Final.doc 134
Findings on Road section B127 “Rottenegg - Lacken”
Figure 57: Result of analysed radii relation at “Rottenegg - Lacken”.
Results of analysis based on the radii relation (see Figure 57):
• The most PTW accidents happen in radii relations R1:R2 larger than 1.0.
• The most PTW accidents happen in the range, with a curve radius R2 smaller than 200m.
• Noticeable is the radii relation 1.0 with R1 = 100m and R2 = 100m. 6 of the 9 registered crashes occur on a single part with this relation (4 respectively 2 in each direction)
• The statement of “other accidents areas are also dangerous for PTWs” does not apply for this road section.

2-BE-SAFE D2 Road infrastructure and road safety for PTW
Document ID: 2BES_WP1_D2_RIandRSforPTW_Final.doc 135
VII. B164 “Bischofshofen – Mühlbach am Hochkönig“
Table 124: General information about road section B164.
Road name B 164 Road from - to Bischofshofen to St. Johann i. Tirol
Section length [km] 8.30 Section start Km 0.500 Section end Km 8.800
Sum of accidents 40 Registered count of accidents 36
Figure 58: Road section B164 - “Bischofshofen – Mühlbach am Hochkönig”.
The map of road section “Bischofshofen – Mühlbach a. Hochkönig” is shown in Figure 58. Table 124 shows general information about the road section.
This road section is the one with the second highest account of PTW accidents. The geometry of the trace seems to be harmonic. The accidents are equally distributed along the whole road section length.
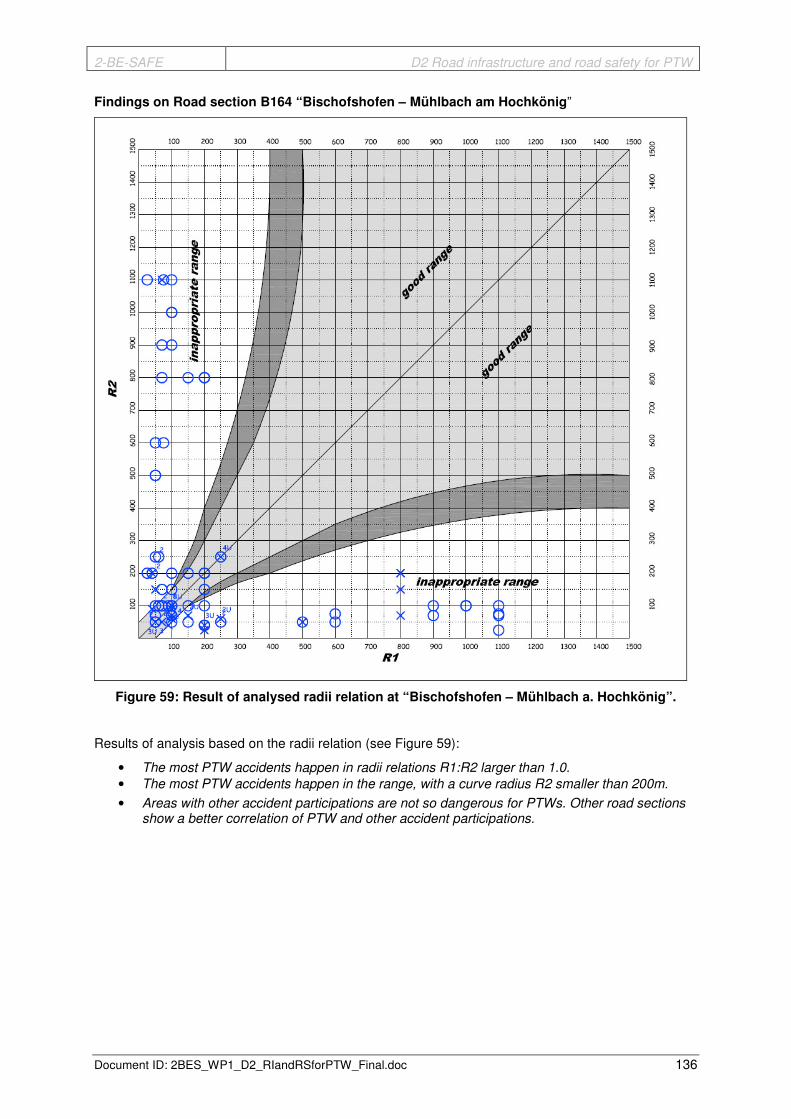
2-BE-SAFE D2 Road infrastructure and road safety for PTW
Document ID: 2BES_WP1_D2_RIandRSforPTW_Final.doc 136
Findings on Road section B164 “Bischofshofen – Mühlbach am Hochkönig”
Figure 59: Result of analysed radii relation at “Bischofshofen – Mühlbach a. Hochkönig”.
Results of analysis based on the radii relation (see Figure 59):
• The most PTW accidents happen in radii relations R1:R2 larger than 1.0.
• The most PTW accidents happen in the range, with a curve radius R2 smaller than 200m.
• Areas with other accident participations are not so dangerous for PTWs. Other road sections show a better correlation of PTW and other accident participations.

2-BE-SAFE D2 Road infrastructure and road safety for PTW
Document ID: 2BES_WP1_D2_RIandRSforPTW_Final.doc 137
4.2.6.2. Summary of Key Findings (all selected road sections)
172 PTW accidents were found on all seven road section.
140 PTW accidents are registered for the analyses of radii relations.
Table 125: Summary of all road sections.
B* Road Section Length
[km] Length [m] Number of PTW
accidents
B 20 Türnitz - Annaberg 13,87 13870 16 B 20 Reith - Mitterbach a. Erlaufsee 11,66 11660 17 B 27 L134 - Hirschwang a.d. Rax 14,82 14820 43 B 72 St. Kathrein - Krieglach 12,80 12800 16 B 95 Reichenau - Turracherhöhe 9,10 9100 27
B 127 Rottenegg - Lacken 4,49 4490 13 B 164 Bischofshofen - Mühlbach a. Hochkönig 8,30 8300 40
PTW riders
B* Road Section killed severe injured slight injured
B 20 Türnitz - Annaberg 1 7 8 B 20 Reith - Mitterbach a. Erlaufsee 0 8 8 B 27 L134 - Hirschwang a.d. Rax 1 63 18 B 72 St. Kathrein - Krieglach 0 29 10 B 95 Reichenau - Turracherhöhe 0 31 11
B 127 Rottenegg - Lacken 1 29 14 B 164 Bischofshofen - Mühlbach a. Hochkönig 1 22 20
Economic costs of PTW accidents
B* Road Section
Accident density Entire road
section /km /km *a
B 20 Türnitz - Annaberg 0,144 € 1.425.300 € 102.761,36 € 12.845,17 B 20 Reith - Mitterbach a. Erlaufsee 0,182 € 472.800 € 40.548,89 € 5.068,61 B 27 L134 - Hirschwang a.d. Rax 0,363 € 4.523.300 € 305.215,92 € 38.151,99 B 72 St. Kathrein - Krieglach 0,156 € 1.626.500 € 127.070,31 € 15.883,79 B 95 Reichenau - Turracherhöhe 0,371 € 1.740.100 € 191.219,78 € 23.902,47
B 127 Rottenegg - Lacken 0,362 € 2.651.900 € 590.623,61 € 73.827,95 B 164 Bischofshofen - Mühlbach a. Hochkönig 0,602 € 2.298.000 € 276.867,47 € 34.608,43
In terms of economic costs of PTW accidents, Table 125 shows the summary of all seven road sections. The rates for the economic costs are 1.007 Mio € for a fatal injured, 56.000 € for a severe injured victim and 4.600 € for a slight injured rider. Following parameters are calculated for each road section:
� Length of road section � Number of PTW accidents � Numbers of killed, severely injured and slightly injured PTW riders � Accident density = Number of PTW accidents / (length * years) � Economic costs for:
� The entire road section � Per kilometre � Per kilometre and year
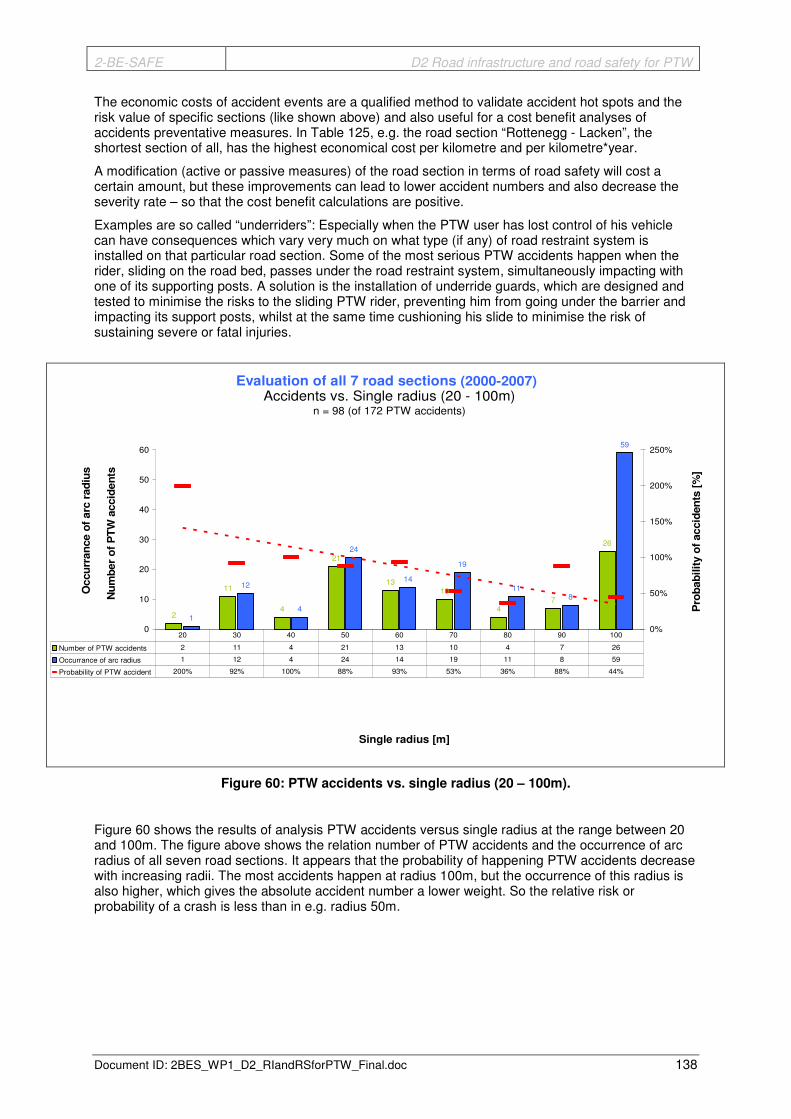
2-BE-SAFE D2 Road infrastructure and road safety for PTW
Document ID: 2BES_WP1_D2_RIandRSforPTW_Final.doc 138
The economic costs of accident events are a qualified method to validate accident hot spots and the risk value of specific sections (like shown above) and also useful for a cost benefit analyses of accidents preventative measures. In Table 125, e.g. the road section “Rottenegg - Lacken”, the shortest section of all, has the highest economical cost per kilometre and per kilometre*year.
A modification (active or passive measures) of the road section in terms of road safety will cost a certain amount, but these improvements can lead to lower accident numbers and also decrease the severity rate – so that the cost benefit calculations are positive.
Examples are so called “underriders”: Especially when the PTW user has lost control of his vehicle can have consequences which vary very much on what type (if any) of road restraint system is installed on that particular road section. Some of the most serious PTW accidents happen when the rider, sliding on the road bed, passes under the road restraint system, simultaneously impacting with one of its supporting posts. A solution is the installation of underride guards, which are designed and tested to minimise the risks to the sliding PTW rider, preventing him from going under the barrier and impacting its support posts, whilst at the same time cushioning his slide to minimise the risk of sustaining severe or fatal injuries.
2
11
4
21
1310
47
26
1
12
4
24
14
19
118
59
0
10
20
30
40
50
60
0%
50%
100%
150%
200%
250%
Number of PTW accidents 2 11 4 21 13 10 4 7 26
Occurrance of arc radius 1 12 4 24 14 19 11 8 59
Probability of PTW accident 200% 92% 100% 88% 93% 53% 36% 88% 44%
20 30 40 50 60 70 80 90 100
Accidents vs. Single radius (20 - 100m)n = 98 (of 172 PTW accidents)
Nu
mb
er
of
PT
W a
ccid
en
ts
Occu
rran
ce o
f arc
rad
ius
Single radius [m]
Evaluation of all 7 road sections (2000-2007)
Pro
bab
ilit
y o
f accid
en
ts [
%]
Figure 60: PTW accidents vs. single radius (20 – 100m).
Figure 60 shows the results of analysis PTW accidents versus single radius at the range between 20 and 100m. The figure above shows the relation number of PTW accidents and the occurrence of arc radius of all seven road sections. It appears that the probability of happening PTW accidents decrease with increasing radii. The most accidents happen at radius 100m, but the occurrence of this radius is also higher, which gives the absolute accident number a lower weight. So the relative risk or probability of a crash is less than in e.g. radius 50m.

2-BE-SAFE D2 Road infrastructure and road safety for PTW
Document ID: 2BES_WP1_D2_RIandRSforPTW_Final.doc 139
1412
8
2 2
5
1 20
8
0 0 0
5
0 0 0 0 0
8
0
7
34
22
1614
7
20
1
18
0
28
0 0 0
15
0 0 0 0 0
14
0
7
0
10
20
30
40
50
60
-10%
10%
30%
50%
70%
90%
110%
Number of PTW accidents 14 12 8 2 2 5 1 2 0 8 0 0 0 5 0 0 0 0 0 8 0 7
Occurrance of arc radius 34 22 16 14 7 20 1 18 0 28 0 0 0 15 0 0 0 0 0 14 0 7
Probability of PTW accident 41% 55% 50% 14% 29% 25% 100% 11% 0% 29% 0% 0% 0% 33% 0% 0% 0% 0% 0% 57% 0% 100%
150 200 250 300 350 400 450 500 550 600 650 700 750 800 850 900 950 1000 1050 1100 1150 1200
Single radius [m]
Nu
mb
er
of
PT
W a
cc
ide
nts
Occ
urr
an
ce o
f a
rc r
ad
ius
Accidents vs. Single radius (150 - 1200m)n = 74 (of 172 PTW accidents)
Evaluation of all 7 road sections (2000-2007)
Pro
bab
ilit
y o
f ac
cid
en
ts [
%]
Figure 61: PTW accidents vs. single radius (150 – 1200m).
Figure 61 shows similar results in terms of single radius, but for the range of 150 to 1200m.
The probability of happening PTW accidents also decrease with increasing radius.
0
200
400
600
800
1000
1200
1400
0,01 0,10 1,00 10,00 100,00
R1
R2
Evaluation of all 7 road sections (2000-2007)
Accidents vs. Radii relation; direction km - increasingn = 85 (of 140 PTW accidents)
Radii relation R1/R2
R1
, R
2
Relation R1/R2 >1Relation R1/R2
Figure 62: PTW accidents vs. radii relations; increasing km.

2-BE-SAFE D2 Road infrastructure and road safety for PTW
Document ID: 2BES_WP1_D2_RIandRSforPTW_Final.doc 140
In order to figure out any other possible influences of curve radii and their relations on PTW accidents, specific cross tabulations of the relation itself with the single radii have been carried out.
In this second part of analyses the following results are shown in Figure 62. It presents the correlation of R1 and R2 to the relation R1 divided by R2. A ratio larger than 1.0 means that, the accident occurs in smaller radius, followed after a larger one and vice versa for a ratio smaller than 1.0. Figure 62 shows all PTW accidents of all road sections in increasing driving direction.
It is apparent that the most PTW accidents are situated at relations higher than 1.0 and in a range “R2” smaller than 200m (see green ellipse).
0
200
400
600
800
1000
1200
1400
0,01 0,10 1,00 10,00 100,00
R1
R2
Radii relation R1/R2
R1
, R
2
Relation R1/R2 >1Relation R1/R2
Evaluation of all 7 road sections (2000-2007)
Accidents vs. Radii relation; direction km - decreasingn = 55 (of 140 PTW accidents)
Figure 63: PTW accidents vs. radii relations; decreasing km.
Figure 63 shows all PTW accidents of all seven road sections in decreasing driving direction. Also the most PTW accidents are situated at radii relation higher than 1.0 (see magenta ellipse) and inside a range of R2 smaller than 200m.

2-BE-SAFE D2 Road infrastructure and road safety for PTW
Document ID: 2BES_WP1_D2_RIandRSforPTW_Final.doc 141
4.2.7. Conclusions for the microscopic analysis in Austria
Road safety in general and especially regarding PTW accidents are the aim for all European members, in respect to reach the goal of halving the accident numbers on European roads. The facts of raising PTW riders in Austria, the increasing rate of registered PTWs and therefore the critical numbers of crashes and injured people needs an improvement of road safety measures for motorcyclists.
In this research report, a microscopic view on possible crash causes of PTW accidents, based on the interaction of PTW accident and road infrastructure, have been carried out. The road infrastructure input data are measurement parameters of high quality, regarding the road surface characteristics and road geometry elements.
Several analyses of different correlations between road surface condition and trace parameters together with localised PTW accident events show the following results.
Crashes in bends are the most severe ones on federal roads in Austria. Especially the investigation of radii relation gives interesting outputs. A significant correlation between PTW accidents and the relation of following curve radii was detected. Primarily curves with small radius have a higher accident rate.
Main results of this analysis are shown in the following key findings: � A radii relation larger than 1.0 is more dangerous than a relation smaller than 1.0. � In terms of single radius the results show that the probability of an occurring PTW accident
decreases with increasing radius. � The most accidents happen in relation with R2 smaller than 200m. � Mainly the relation of curve with large radius, or a straight lane following by a curve with
smaller radius are more dangerous than others. � The statement that areas with other accident participation (truck, passenger car…) are also
dangerous for PTWs is highlighted in many parts of the analyses.
The analysis in terms of other road geometry parameters and road condition characteristics, measured by the device RoadSTAR, shows the following results:
� In terms of longitudinal gradient the most PTW accidents happen at 1 to 2 %. � In terms of crossfall the most accidents happen at a range between 2 and 4 %. � In terms of skid resistance the most PTW accidents happen at quality classes “very good”
(µ > 0.75) and “good” (0.75 ≥ µ > 0.59). � With reference to the parameter IRI for longitudinal evenness, the most PTW accidents
happen at quality classes “average” (1.8 ≤ IRI < 3.0) and “good“(1.0 ≤ IRI < 1.8). � The results of analysis regarding to parameter MPD for the texture, the most accidents
happen in quality class “poor” (0.6 ≥ MPD > 0.3). � In terms of rut depth the most PTW accidents happen in “good” (5.0 ≤ ts < 10.0) and “very
good” (0.0 ≤ ts < 5.0).
� With reference to theoretical water depth the most PTW accidents happen at quality classes “good” (0.0 ≤ tw < 1.0).
As those results show first trends in specific correlation of road alignment characteristics to PTW accident, further research questions have to focus on PTW accident types (like run-off crashes in curves) and the usage of vehicle-infrastructure-interaction-simulation to survey the combined approach of influencing road condition and geometry data.
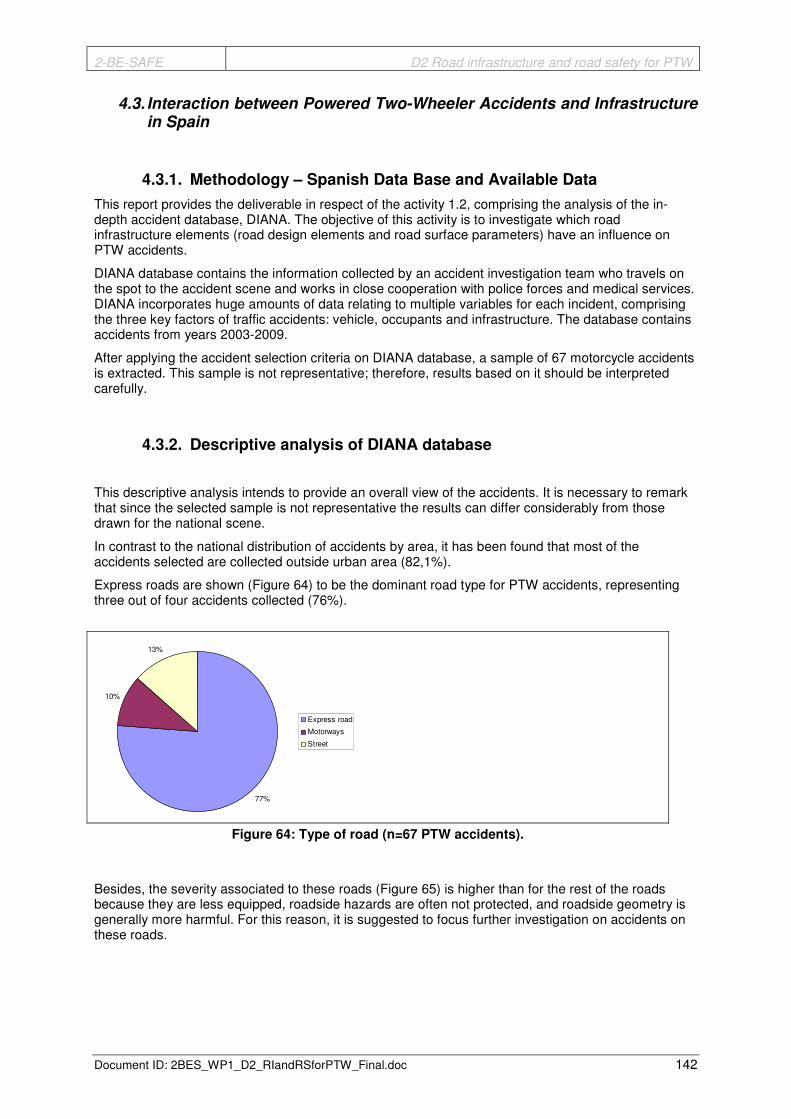
2-BE-SAFE D2 Road infrastructure and road safety for PTW
Document ID: 2BES_WP1_D2_RIandRSforPTW_Final.doc 142
4.3. Interaction between Powered Two-Wheeler Accidents and Infrastructure in Spain
4.3.1. Methodology – Spanish Data Base and Available Data
This report provides the deliverable in respect of the activity 1.2, comprising the analysis of the in-depth accident database, DIANA. The objective of this activity is to investigate which road infrastructure elements (road design elements and road surface parameters) have an influence on PTW accidents.
DIANA database contains the information collected by an accident investigation team who travels on the spot to the accident scene and works in close cooperation with police forces and medical services. DIANA incorporates huge amounts of data relating to multiple variables for each incident, comprising the three key factors of traffic accidents: vehicle, occupants and infrastructure. The database contains accidents from years 2003-2009.
After applying the accident selection criteria on DIANA database, a sample of 67 motorcycle accidents is extracted. This sample is not representative; therefore, results based on it should be interpreted carefully.
4.3.2. Descriptive analysis of DIANA database
This descriptive analysis intends to provide an overall view of the accidents. It is necessary to remark that since the selected sample is not representative the results can differ considerably from those drawn for the national scene.
In contrast to the national distribution of accidents by area, it has been found that most of the accidents selected are collected outside urban area (82,1%).
Express roads are shown (Figure 64) to be the dominant road type for PTW accidents, representing three out of four accidents collected (76%).
77%
10%
13%
Express road
Motorways
Street
Figure 64: Type of road (n=67 PTW accidents).
Besides, the severity associated to these roads (Figure 65) is higher than for the rest of the roads because they are less equipped, roadside hazards are often not protected, and roadside geometry is generally more harmful. For this reason, it is suggested to focus further investigation on accidents on these roads.

2-BE-SAFE D2 Road infrastructure and road safety for PTW
Document ID: 2BES_WP1_D2_RIandRSforPTW_Final.doc 143
38%
37%
25%
Fatal
Serious
Slight
Figure 65: Severity associated to express roads (n=51 PTW accidents).
The vast majority of accidents occur during daylight hours and good weather conditions, likely to be an indication of generally higher traffic volumes during the day and without adverse conditions. As with those related to weather, dry conditions dominate (86,6%) the accident figures.
Figure 66 shows the dominance of run-off-road accidents, representing more than half of the accidents. Front-to-side collisions account for more than 20% of all accidents selected.
7%
22%
3%
4%
23%
21%
10%
10% Head on
Front to side
Sideswipe
Rear end
Run-off the road, collision withobstacle
Run-off the road, guardrailimpact
Run-off the road
Rollover on carriageway
Figure 66: Typology of accidents (n=67 motorcycle accidents).
Related to the dominance of run-off-road accidents, the selected accidents are more likely to occur at bends (55%) than on straight roads (45%). Considering only run-off-road accidents, more than 80% of these accidents occur at bends.

2-BE-SAFE D2 Road infrastructure and road safety for PTW
Document ID: 2BES_WP1_D2_RIandRSforPTW_Final.doc 144
12%
4%
10%
1%
73%
3 ways, T or Y
4 ways, X or +
Roundabout
Slip road
Not applicable
Figure 67: Type of intersection (n=67 accidents).
Almost three quarters of the accidents are located away from junctions (Figure 67). Those no-junction accidents are more likely to occur at bends (67%) than on straight roads. Among the accidents occurred at junctions, the most common type of intersection is the “3 ways, T or Y” (44%), and roundabouts are the second most prevalent type (37%).
Considering only riders and PTW passengers in the analysis of injuries severity (Table 126), it has been found that the severity associated to the sample of accidents selected (28,8% fatalities, 38,8% seriously injured) is considerably higher than the one obtained for the national accidents involving PTW’s (2% fatalities, 16% seriously injured).
Table 126: Injury severity (n=80 riders and motorcycle passengers).
Injury severity Casualty count Percentage (%)
Fatal 23 28,8
Seriously injured 31 38,8
Slightly injured 22 27,4
No injury 4 5

2-BE-SAFE D2 Road infrastructure and road safety for PTW
Document ID: 2BES_WP1_D2_RIandRSforPTW_Final.doc 145
4.3.3. Specific queries (cross-tables between categories)
Cross table comparisons could be made between almost any two different factors, giving many possible combinations. The queries presented in the following intended to detect the most revealing factors related to infrastructure, with the aim of identifying possible countermeasures focused on the mitigation of the consequences of the accidents. In order to evaluate these factors related to infrastructure, two different analyses have been carried out separating the cases occurred at intersections and those away from intersections.
4.3.3.1. Accident away from junctions
Among these accidents it is necessary to differentiate between two situations regarding the road alignment:
• Accidents at bends (67%)
• Accidents in straight sections of road (33%)
A) Accidents at bends.
Most of the accidents collected occurred at left hand bends (72%). PTW accidents are more likely to occur at left hand bands because it is easier for the motorcyclist to survey a right hand turn. For a better navigation through the curve, the motorcyclist fixes his eyes along the line of the inner curve to a point on the horizon. In right hand turns, the course of the PTW also lies in the inner curve. Therefore possible hazards such as potholes or other unevenness lie in the field of vision of the motorcyclist. In left hand turns the eyes of the motorcyclist are also fixed on the inner curve. The course he follows, however, lies in the outer curve and therefore possible hazards do not appear immediately in his field of vision.
It is also remarkable that three out of four accidents located at bend occurred at roads with descendent gradient and without hard shoulder or with impassable shoulder. Thus, a prevalent situation among these accidents is ‘run-off road at a left hand bend with descendent gradient along a road without shoulders or with impassable shoulders’.
• Type of accident by Driving Speed
Table 127: Accidents occurred away from junction. Type of accident by Driving speed (n=29).
Driving Speed (km/h)
30<Speed<60 60<Speed<90 90<Speed<120 Speed>120 Total Head on 0
(0%) 2 (7%)
1 (3,5%)
0 (0%)
3 (10%)
Run-off the road, collision with obstacle
0 (0%)
2 (7%)
3 (10,5%)
1 (3,5%)
6 (21%)
Run-off the road, guardrail impact
0 (0%)
6 (21%)
8 (28%)
0 (0%)
14 (49%)
Run-off the road 1 (3,5%)
1 (3,5%)
1 (3,5%)
0 (0%)
4 (10%)
Type of accident
Rollover on carriageway
0 (0%)
1 (3,5%)
2 (7%)
0 (0%)
3 (10%)
Total 1 (3,5%)
12 (41%)
15 (52%)
1 (3,5%)
29 (100%)

2-BE-SAFE D2 Road infrastructure and road safety for PTW
Document ID: 2BES_WP1_D2_RIandRSforPTW_Final.doc 146
Table 127 shows that almost half of the accidents are run-off-road accidents involving a roadside barrier and that the driving speed of the motorcycles in these accidents is likely to be higher than 90 km/h. Since the severity associated to these impacts is generally fairly high, it has been considered necessary to analyse this specific type of accident more deeply.
• Curve radius by Driving Speed
According to Table 128, most of the accidents collected occurred on roads with a curvature radius below 70 meters and at driving speeds between 60 and 120 km/h. Accidents on roads with a curvature radius above 300 meters are not observed at driving speeds below 90 km/h.
Table 128: Accidents occurred away from junction. Curve radius by Driving speed (n=29).
Driving speed
30<Speed<60 60<Speed<90 90<Speed<120 Speed>120 Total R<70 1
(3,5%) 8 (28%)
9 (31%)
0 (0%)
18 (62,5%)
70<R<150 0 (0%)
3 (10,5%)
3 (10,5%)
0 (0%)
6 (20%)
150<R<300 0 (0%)
1 (3,5%)
1 (3,5%)
1 (3,5%)
3 10,5%)
Radius
R>300 0 (0%)
0 (0%)
2 (7%)
0 (0%)
2 (7%)
Total 1 (3,5%)
12 (42%)
15 (51%)
1 (3,5%)
29 (100%)
• “Curve radius by Rollover on carriageway” and “Crossfall by Rollover on carriageway”
Within PTW accidents involving infrastructure elements, there are two different situations which need to be evaluated separately in order to determine possible countermeasures for each. It is necessary to differentiate between accidents where the PTW impacts the barrier or roadside object whilst the rider is still operating the vehicle (upright position) and the situation where rider and vehicle have become separated beforehand and are both sliding along the surface (sliding position) towards the obstacle.
Thus, it has been considered necessary to evaluate the influence of the road geometry on the dynamics (two situations defined previously) of the PTW accidents.
Table 129: Accidents occurred away from junction. Curve radius by Rollover on carriageway
(n=29).
Rollover on carriageway before collision
No Yes Total R<70 14
(48%) 4 (14%)
18 (62%)
70<R<150 3 (10,5%)
3 (10,5%)
6 (21%)
150<R<300 2 (7%)
1 (3,5%)
3 (10%)
Curve Radius
R>300 1 (3,5%)
1 (3,5%)
2 (7%)
Total 20 (69%) 9 (31%) 29 (100%)

2-BE-SAFE D2 Road infrastructure and road safety for PTW
Document ID: 2BES_WP1_D2_RIandRSforPTW_Final.doc 147
Table 130: Accidents occurred away from junction. Crossfall by Rollover on carriageway (n=29).
Rollover on carriageway before collision
No Yes Total Crossfall < 2% 6
(23%) 2 (8%)
8 (31%)
2% < Crossfall < 4% 5 (19%)
1 (4%)
6 (23%)
4% < Crossfall < 6% 4 (15%)
3 (11,5%)
7 (26,5%)
Crossfall
6% < Crossfall < 8% 2 (8%)
3 (11,5%)
5 (19,5%)
Total 17 (65%)
9 (35%)
26 (100%)
As an overall conclusion, riders are almost twice as likely to impact in an upright position as in a sliding position.
Table 129 and Table 130 show that crossfall of road appears to be a relevant infrastructure factor since higher values of crossfall result in fewer run-off road accidents. Nevertheless, rollovers on carriageway do not occur less frequently at higher values of crossfall of the road. Regarding the curve radius, sliding impacts after rollovers on carriageway are not more frequent at decreasing values of radius, so neither crossfall nor radius are determining factors by themselves on the dynamics of PTW single accidents.
As these factors are not found to be determining by themselves, further analyses are needed to identify which combination of factors are most revealing. Thus, “Driving speed” has been introduced into the following tables in order to evaluate its influence on the two infrastructure factors previously analyzed.
Table 131: Accidents away from junction. Rollover on carriageway by radius and speed (n=29).
Curve Radius Rollover on carriageway R<70 70<R<150 150<R<300 R>300 Total
30<Speed<60 1 (3,5%)
0 (0%)
0 (0%)
0 (0%)
1 (3,5%)
60<Speed<90 6 (21%)
2 (7%)
1 (3,5%)
0 (0%)
9 (31,5%)
Driving speed
90<Speed<120 7 (24%)
1 (3,5%)
1 (3,5%)
1 (3,5%)
10 (34,5%)
No
Total 14 (48,5%)
3 (10,5%)
2 (7%)
1 (3,5%)
20 (68,5%)
60<Speed<90 2 (7%)
1 (3,5%)
0 (0%)
0 (0%)
3 (10,5%)
90<Speed<120 2 (7%)
2 (7%)
0 (0%)
1 (3,5%)
5 (17,5%)
Driving speed
Speed>120 0 (0%)
0 (0%)
1 (3,5%)
0 (0%)
1 (3,5%)
Yes
Total 4 (14%)
3 (10,5%)
1 (3,5%)
1 (3,5%)
9 (31,5%)
The most prevalent situation is a “rider who travelled along a curved section of road (R=70 meters) at speeds between 90 and 120 km/h impacting in an upright position” (Table 131). In the case of riders who rolled over on the carriageway before the collision, the most common values of driving speeds and radius curve are above 60 km/h and below 150 meters respectively.

2-BE-SAFE D2 Road infrastructure and road safety for PTW
Document ID: 2BES_WP1_D2_RIandRSforPTW_Final.doc 148
Table 132: Accidents away from junction. Rollover on carriageway by crossfall and speed
(n=29).
Driving Speed Rollover on carriageway before collision 30<Speed<60 60<Speed<90 90<Speed<120 Speed>120 Total
Crossfall < 2% 0 (0%)
2 (9%)
4 (17%)
6 (26%)
2% < Crossfall < 4% 1 (4%)
2 (9%)
1 (4%)
4 (18%)
4% < Crossfall < 6% 0 (0%)
2 (9%)
1 (4%)
3 (13%)
Crossfall
6% < Crossfall < 8% 0 (0%)
1 (4%)
1 (4%)
2 (9%)
No
Total 1 (4%)
7 (31%)
7 (31%)
15 (66%)
Crossfall < 2%
1 (4%)
1 (4%)
0 (0%)
2 (8%)
2% < Crossfall < 4%
0 (0%)
0 (0%)
1 (4%)
1 (4%)
4% < Crossfall < 6%
0 (0%)
2 (9%)
0 (0%)
2 (9%)
Crossfall
6% < Crossfall < 8%
2 (9%)
1 (4%)
0 (0%)
3 (13%)
Yes
Total
3 (13%)
4 (17%)
1 (4%)
8 (34%)
As shown in Table 132, the most frequent situation is a “rider impacting in an upright position who travelled along a curved section of road (crossfall < 2%) at speeds between 90 and 120 km/h”. For riders who slide along the road surface before impacting the object (rollover on carriageway), the most common values of driving speeds and crossfall are above 60 km/h and 4% respectively. In accordance with the previous tables, it could be stated that accidents are more likely to occur at higher speeds and lower values of curve radius, although in the vast majority of the accidents the rider impacts in an upright position. Therefore, probably the most frequent situation among run-off-road accidents is “riders who travel at inappropriately high speeds relative to their forward visibility and perceive the real geometry of the road when they are inside the curve (some curves have not a predictable geometry) but they are not able to moderate the speed and negotiate the curve properly; consequently, they run off the road keeping an upright position”. Thus, the accidents could be attributed to a prevalence of a perception failure of the riders, and probably to significant collision avoidance problems.
• Severity by Type of object hit in carriageway
In Table 133, it can be seen that a kerb was hit in every fatal accident in which an object was hit in carriageway, collected in DIANA database. These kerbs were placed mainly in roundabouts within outside urban settings, so impact speeds are higher than those registered in urban settings (traffic lights). The huge fatality rate associated to kerb impacts could be due to this fact; anyway this cross sectional element could be identified as a safety hazard mainly if its design is potentially harmful. Therefore, further analyses on “safety kerbs” should be undertaken (low rise, bevelled edges…).
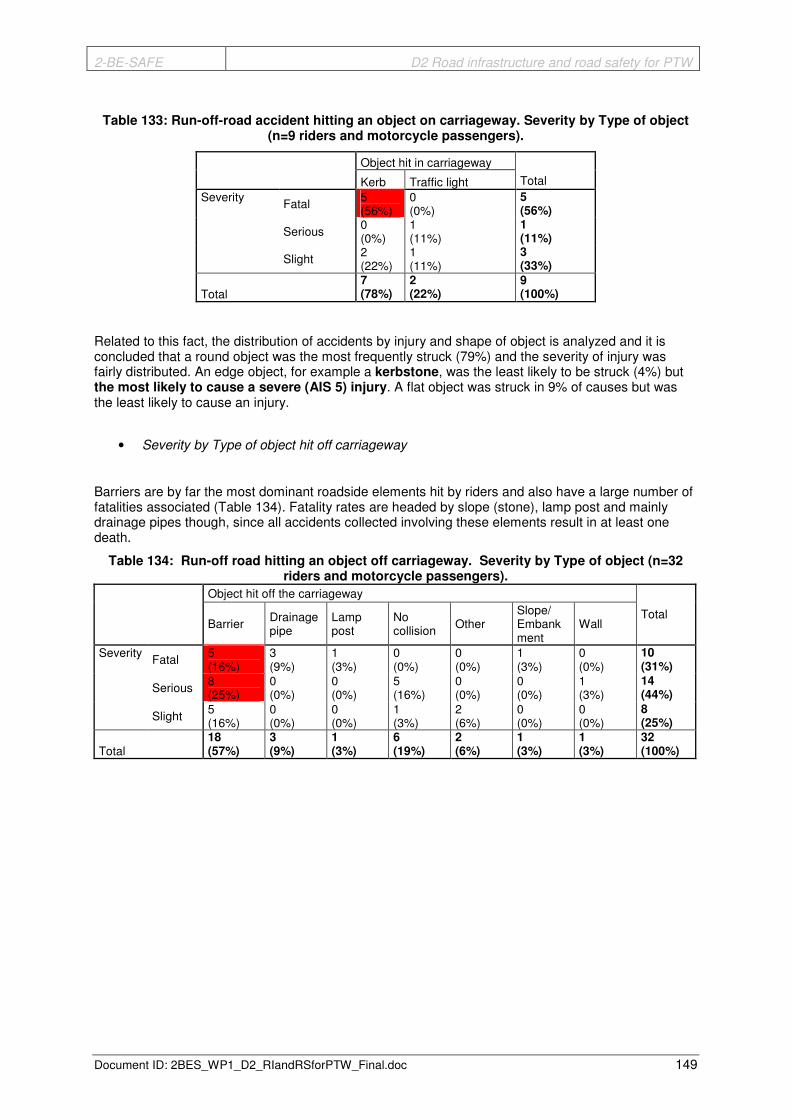
2-BE-SAFE D2 Road infrastructure and road safety for PTW
Document ID: 2BES_WP1_D2_RIandRSforPTW_Final.doc 149
Table 133: Run-off-road accident hitting an object on carriageway. Severity by Type of object
(n=9 riders and motorcycle passengers).
Object hit in carriageway
Kerb Traffic light Total
Fatal 5 (56%)
0 (0%)
5 (56%)
Serious 0 (0%)
1 (11%)
1 (11%)
Severity
Slight 2 (22%)
1 (11%)
3 (33%)
Total 7 (78%)
2 (22%)
9 (100%)
Related to this fact, the distribution of accidents by injury and shape of object is analyzed and it is concluded that a round object was the most frequently struck (79%) and the severity of injury was fairly distributed. An edge object, for example a kerbstone, was the least likely to be struck (4%) but the most likely to cause a severe (AIS 5) injury. A flat object was struck in 9% of causes but was the least likely to cause an injury.
• Severity by Type of object hit off carriageway
Barriers are by far the most dominant roadside elements hit by riders and also have a large number of fatalities associated (Table 134). Fatality rates are headed by slope (stone), lamp post and mainly drainage pipes though, since all accidents collected involving these elements result in at least one death.
Table 134: Run-off road hitting an object off carriageway. Severity by Type of object (n=32 riders and motorcycle passengers).
Object hit off the carriageway
Barrier
Drainage pipe
Lamp post
No collision
Other Slope/ Embankment
Wall Total
Fatal 5 (16%)
3 (9%)
1 (3%)
0 (0%)
0 (0%)
1 (3%)
0 (0%)
10 (31%)
Serious 8 (25%)
0 (0%)
0 (0%)
5 (16%)
0 (0%)
0 (0%)
1 (3%)
14 (44%)
Severity
Slight 5 (16%)
0 (0%)
0 (0%)
1 (3%)
2 (6%)
0 (0%)
0 (0%)
8 (25%)
Total 18 (57%)
3 (9%)
1 (3%)
6 (19%)
2 (6%)
1 (3%)
1 (3%)
32 (100%)

2-BE-SAFE D2 Road infrastructure and road safety for PTW
Document ID: 2BES_WP1_D2_RIandRSforPTW_Final.doc 150
• SAFETY BARRIER IMPACTS
As mentioned previously, it has been considered essential to study the interaction between riders and safety barriers separately. The following figures give an overall view of the accidents involving these elements.
0
2
4
6
8
10
12
Other carriageway,right shoulder
Same carriageway, leftshoulder
Same carriageway,Median
Same carriageway,right shoulder
86%
14%
Left
Right
Figure 68: Barrier location and curve orientation (n=14 accidents).
Figure 68: Barrier location and curve orientation (n=14 accidents) Figure 68 shows that the most prevalent situation is a loss of control of the rider along a left hand bend and a subsequent collision into a safety barrier located in the right roadside of the carriageway.
69%
23%
8%
R<70
70<R<150
R>300
Figure 69: Curve Radius (n=14 accidents).
Almost 70% of accidents involving roadside barriers occurred at bends with radius below 70 meters (Figure 69).
The following figures show that the vast majority of riders impact in an upright position (64%; Figure 70) and in 79% the impact angle is below 20º (Figure 71).

2-BE-SAFE D2 Road infrastructure and road safety for PTW
Document ID: 2BES_WP1_D2_RIandRSforPTW_Final.doc 151
64%
36%
Upright position
Slidding position
Figure 70: Position of impact (n=14 accidents).
79%
14%
7%
Impact angle<20º
20º<Impact angle<30º
Impact angle>30º
Figure 71: Impact angle (n=14 accidents).
Most of the accidents occur in the impact speed range between 30 and 60 km/h (Figure 72), and the impact speed average is around 55 km/h.
15%
54%
31% Speed<30
30<Speed<60
60<Speed<90
Figure 72: Impact speed (n=14 accidents).
The UNE 135900 standard specifies performance requirements and defines levels in passive safety terms intended to reduce the severity of injury to the riders of motorcycles impacting into motorcyclist protection systems installed along roadside barriers. Test methods for determining the level of performance under various conditions of impact are given. In summary, test conditions defined in the standard are shown in Figure 73.
Figure 73: Test impact conditions.
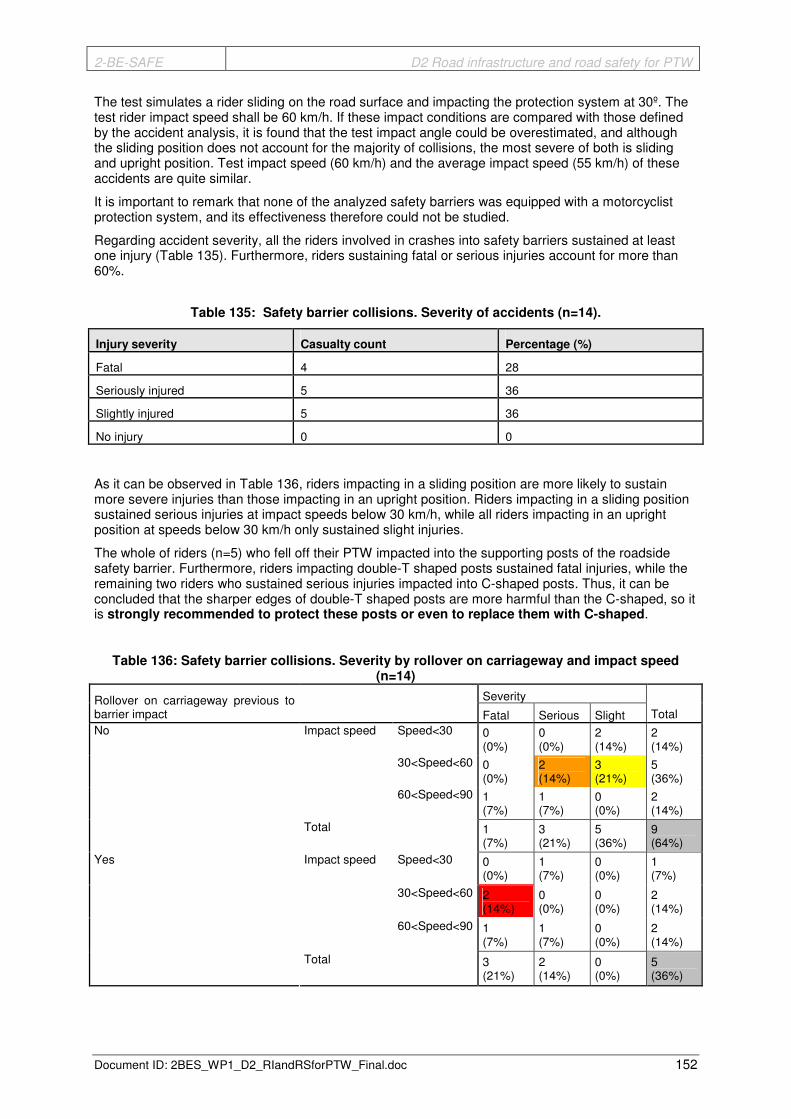
2-BE-SAFE D2 Road infrastructure and road safety for PTW
Document ID: 2BES_WP1_D2_RIandRSforPTW_Final.doc 152
The test simulates a rider sliding on the road surface and impacting the protection system at 30º. The test rider impact speed shall be 60 km/h. If these impact conditions are compared with those defined by the accident analysis, it is found that the test impact angle could be overestimated, and although the sliding position does not account for the majority of collisions, the most severe of both is sliding and upright position. Test impact speed (60 km/h) and the average impact speed (55 km/h) of these accidents are quite similar.
It is important to remark that none of the analyzed safety barriers was equipped with a motorcyclist protection system, and its effectiveness therefore could not be studied.
Regarding accident severity, all the riders involved in crashes into safety barriers sustained at least one injury (Table 135). Furthermore, riders sustaining fatal or serious injuries account for more than 60%.
Table 135: Safety barrier collisions. Severity of accidents (n=14).
Injury severity Casualty count Percentage (%)
Fatal 4 28
Seriously injured 5 36
Slightly injured 5 36
No injury 0 0
As it can be observed in Table 136, riders impacting in a sliding position are more likely to sustain more severe injuries than those impacting in an upright position. Riders impacting in a sliding position sustained serious injuries at impact speeds below 30 km/h, while all riders impacting in an upright position at speeds below 30 km/h only sustained slight injuries.
The whole of riders (n=5) who fell off their PTW impacted into the supporting posts of the roadside safety barrier. Furthermore, riders impacting double-T shaped posts sustained fatal injuries, while the remaining two riders who sustained serious injuries impacted into C-shaped posts. Thus, it can be concluded that the sharper edges of double-T shaped posts are more harmful than the C-shaped, so it is strongly recommended to protect these posts or even to replace them with C-shaped.
Table 136: Safety barrier collisions. Severity by rollover on carriageway and impact speed (n=14)
Severity Rollover on carriageway previous to barrier impact Fatal Serious Slight Total
Speed<30 0 (0%)
0 (0%)
2 (14%)
2 (14%)
30<Speed<60 0 (0%)
2 (14%)
3 (21%)
5 (36%)
Impact speed
60<Speed<90 1 (7%)
1 (7%)
0 (0%)
2 (14%)
No
Total 1 (7%)
3 (21%)
5 (36%)
9 (64%)
Speed<30 0 (0%)
1 (7%)
0 (0%)
1 (7%)
30<Speed<60 2 (14%)
0 (0%)
0 (0%)
2 (14%)
Impact speed
60<Speed<90 1 (7%)
1 (7%)
0 (0%)
2 (14%)
Yes
Total 3 (21%)
2 (14%)
0 (0%)
5 (36%)

2-BE-SAFE D2 Road infrastructure and road safety for PTW
Document ID: 2BES_WP1_D2_RIandRSforPTW_Final.doc 153
B) Accidents in straight sections of roads.
Most of the accidents (65%) collected in straight sections were motor vehicle collisions between a passenger car and a PTW. Almost half of accidents occurred at darkness suggesting a problem of visibility.
35%
65%
Single vehicle accidents
Vehicle collisions
Figure 74: Type of accident (n=16).
Head on and front to side accidents are the most severe accident types (100% of fatal accidents), and all single vehicle accidents (run-off road, rollover, etc.) resulted in slight injured people, except for one serious accident. Thus, it could be concluded that single vehicle accidents occurred at bends are more likely to result in fatal or seriously injured people than those occurred at straight sections of road.
Table 137: Type of accident by severity (n=16).
Severity
Fatal Serious Slight Total Head on 2
(12,5%) 0 (0%)
0 (0%)
2 (12,5%)
Front to side 2 (12,5%)
2 (12,5%)
1 (6,25%)
5 (31,25%)
Rear end 0 (0%)
0 (0%)
2 (12,5%)
2 (12,5%)
Sideswipe 0 (0%)
1 (6,25%)
0 (0%)
1 (6,25%)
Run-off the road, collision with obstacle
0 (0%)
0 (0%)
2 (12,5%)
2 (12,5%)
Run-off the road, guardrail impact 0 (0%)
0 (0%)
1 (6,25%)
1 (6,25%)
Run-off the road 0 (0%)
1 (6,25%)
0 (0%)
1 (6,25%)
Type of accident
Rollover on carriageway 0 (0%)
0 (0%)
2 (12,5%)
2 (12,5%)
Total 4 (25%)
4 (25%)
8 (50%)
16 (100%)
PTW front-to-side accidents usually do not occur in straight sections away from junctions. Three of the registered accidents occurred after a wrong manoeuvre of drivers of the passenger cars when they were leaving a parking place (inside urban) and did not notice the presence of the PTW. The remaining two front-to-side accidents occurred outside urban areas, one of them after the driver had lost the control of his vehicle and went into the opposite lane, and the other one after the rider had made a wrong U-turn at low speed.

2-BE-SAFE D2 Road infrastructure and road safety for PTW
Document ID: 2BES_WP1_D2_RIandRSforPTW_Final.doc 154
Regarding single vehicle accidents (run-off road and rollover), the road markings induced instability in half of them (n=3), and the lack of maintenance of the road (road works) was the cause of one accident. Thus, it could be stated that road surface condition was a relevant factor in these accidents, and particularly road marking is identified as a potential hazard to PTW users.
Table 138: Approach speed by Driving speed and Speed limit. (n=16)
Type of accident
Speed limit
Driving Speed Head on
Front to side
Sideswipe Rear end
Run-off the road, collision with obstacle
Run-off the road, guardrail impact
Run-off the road
Rollover on carriageway
Total
30 30<Speed<60 1 1 45 30<Speed<60 1 1 1 3
30<Speed<60 1 1 1 3 50
90<Speed<120 2 2 80 60<Speed<90 1 1
Speed<30 1 1 90
90<Speed<120 1 1 2 60<Speed<90 1 1 100
Speed>120 1 1 120 Speed>120 1 1
Speed excess is registered in half of the accidents, but it is not identified as a primary contributing factor or main cause of the accident in any of them.
4.3.3.2. Accident at intersections
Among these accidents it is necessary to differentiate between two situations regarding the number of vehicles involved:
• Single vehicle accident. Run-off the road or rollover on carriageway of motorcycles at intersections.
• Collisions involving two vehicles (at least one motorcycle).
A) Single vehicle accidents
The most frequent type of intersection where accidents occurred is a roundabout (7 out of 8), and just one of them is located inside an urban setting. Among these accidents, a problem of perception/ conspicuity of the junction (roundabout) could be detected, since 70% of these accidents occurred without daylight conditions.
• Severity by Type of intersection
As it is shown in Figure 75, all fatal accidents collected occurred at roundabouts. The object most frequently hit among these fatal accidents (3 out of 4) was the kerbstone of the roundabouts. The object hit in the remaining accident was a lamp post located inside the roundabout, after the vehicle had impacted with the kerbstone.

2-BE-SAFE D2 Road infrastructure and road safety for PTW
Document ID: 2BES_WP1_D2_RIandRSforPTW_Final.doc 155
0
1
2
3
4
Fatal Serious Slight
Roundabout
Slip road
Figure 75: Severity by Type of accident (n=8 accidents).
• Approach speed by Speed limit
According to Table 139, approaching speeds to junctions are clearly over speed limit in all accidents, except for those involving mopeds (n=2) which rolled over on the carriageway.
Table 139: Approach speed by Speed limit (n=8).
Speed limit Approach speed
40 km/h 50 km/h
30<Speed<60 2 (25%)
0 (0%)
60<Speed<90 1 (12,5%)
1 (12,5%)
90<Speed<120 2 (25%)
0 (0%)
Speed>120 2 (25%)
0 (0%)
It is remarkable that all the junctions were equipped properly. Road signs located at junctions complied with national regulations and recommendations, showing good levels of retroreflectance and visibility. Therefore, it could be stated that road signing was completely adequate and consequently it could not be considered as a contributing factor.

2-BE-SAFE D2 Road infrastructure and road safety for PTW
Document ID: 2BES_WP1_D2_RIandRSforPTW_Final.doc 156
B) Collisions involving two vehicles.
Figure 76 represents the distribution of traffic control at junctions. The most frequent types are traffic lights (37%) and not controlled intersections (27%).
18%
37%
9%
27%
9%
Not applicable
Traffic light
Markings
No control
Stop sign
Figure 76: Traffic control (n=11 accidents).
Five of all riders were responsible for the accident, while drivers resulted to be responsible for six accidents. Traffic control violation was reported in three accidents (driver n=3, rider n=1), failure to give way (driver n=1, rider n=3) was the cause of three accidents and an improper turn was reported in two accidents (driver n=2). Speed excess was registered in 4 accidents (driver n=2, rider n=2).
Visibility was impaired in just one accident due to vegetation, and a low conspicuity was also present in another accident (at night) due to the rider’s misuse of the dipped headlights.
Lack of visibility at the junction was present in just one of the accidents. The visibility was impaired due to vegetation, and the moped moved off from a path (no control, and not paved) at left roadside. The passenger car travelled over speed limit and could not avoid the collision with the moped.
Although it was not a junction controlled, it is recommended to properly maintain the visibility at all intersections removing or displacing those elements which reduce it.
As drivers stated, in many cases they not noticed the PTW. Therefore, it is also recommended to increase the conspicuity of riders using reflective clothing, white or light coloured helmets, and daytime headlights.

2-BE-SAFE D2 Road infrastructure and road safety for PTW
Document ID: 2BES_WP1_D2_RIandRSforPTW_Final.doc 157
4.3.4. Conclusions for the microscopic analysis in Spain
Within this report the DIANA accident data was analysed in different ways, providing valuable information on several factors underlying PTW accidents. The aim of this report is to identify which are the most relevant factors related to infrastructure involved in the accidents involving this specific type of users.
The following is a summary of the key findings:
• Weather is not identified as a common primary contributing factor.
• Absence of traffic signs and impaired visibility are not detected as relevant factors.
• Run-off-road accidents involving PTW are more likely to occur in left hand bends than in right hand bends.
• A prevalent situation among accidents at curves is the ‘run-off road at a left hand bend with descendent gradient along a road without shoulders or with impassable shoulders’.
• Regarding run-off-road accidents, riders are almost twice as likely to impact in an upright position as in a sliding position.
• Not-predictable road geometry is identified as a relevant factor. Improving good forward visibility and the use of indication signs could improve the anticipation of the ongoing road geometry by the riders.
• Crossfall and curve radius are considered as relevant factors in combination with approach speed of the PTW.
• The kerbstone is identified as a potential safety hazard. It is proposed to conduct further “safety design” studies.
• The severity of injuries sustained by riders impacting roadside barriers without motorcyclist protection system (continuous additional rail) has been found to be extremely high.
• The main cause of death after roadside barrier impacts is the collision with exposed posts.
• The sharper edges of double-T shaped posts are more harmful than the C-shaped, and consequently are more likely to result in severe or fatal injuries. Therefore, it is strongly recommended to protect these posts or even to replace them with C-shaped.
• Among the accidents involving a roadside barrier, the vast majority of riders impact in an upright position and with impact angles below 20º. This fact shows the importance of clear zones which are free of obstacles behind the roadside barrier, in order to avoid possible collisions with them in case that rider cross over the guardrail system.
• Accidents which occurred in straight road sections are less likely to result in fatal or seriously injured people than those occurred at bends.
• Slippery road marking are identified as potential hazards, because they have lower skid resistance than the road surface.
• Speed excess is not identified as a primary contributing factor among accidents located at straight roads.
• Roundabouts are identified as a potentially hazardous type of intersection. Most of the accidents collected in these junctions occurred without daylight conditions so it could be suggested that kerbs should be painted with the aim of raising their conspicuity.
• Approaching speeds to junctions are frequently above the speed limit.
• A problem of conspicuity is detected among accidents occurred at junctions. Therefore it is recommendable to increase the conspicuity of riders using reflective clothing, white or brightly coloured helmets, and daytime headlights.

2-BE-SAFE D2 Road infrastructure and road safety for PTW
Document ID: 2BES_WP1_D2_RIandRSforPTW_Final.doc 158
4.4. Interaction between Powered Two-Wheeler Accidents and Infrastructure in Germany
4.4.1. Methodology – German Data Base and Available Data
According to the official road crash statistics there were 327,984 injury crashes in Germany in 2006, 10% (32,933) thereof involving a powered two-wheeler. Of these 32,933 crashes 63% (20,692) occurred on urban roads, 34% (11,296) on rural roads (roads outside urban areas without motorways) and, 3% (945) on motorways. Overall, 793 powered two-wheeler users (riders and passengers) were killed in a crash, 25% (201) of them on an urban road, 69% (544) on a rural road, and 6% (48) on a motorway. These figures clearly indicate that the majority of powered two-wheeler crashes occur on urban roads; these crashes, however, are characterised by a relatively low crash severity. In contrast, the relatively fewer powered two-wheeler crashes on rural roads are characterized by a high crash severity. Against this background, this study focuses on powered two-wheeler crashes on rural roads.
This study considered only motorcycle crashes. Crashes of mopeds, motor-assisted bicycles and bicycles fitted with an auxiliary motor with an engine capacity not exceeding 50 cc (maximum design speed not exceeding 50 km/h) were not taken into account. The main reason for excluding these categories of powered two-wheelers is the fact that their maximum speed is much lower than the speed limit on rural roads of 100 km/h. For this reason, these categories were involved in less crashes (also because of their low mileage) and in different crash types than motorcycles.
Since we know that there is a very high number of unreported motorcycle crashes with material damage only (especially single motorcycle crashes), solely motorcycle crashes with personal injury were considered.
Therefore, this investigation focuses exclusively on injury motorcycle crashes on rural roads.
This investigation is divided into three parts. Within the first part, the relationship between the density of injury motorcycle crashes and the average daily traffic (ADT) of powered two-wheelers was investigated. As data base for this part served the 2005 road traffic census data and the crash data of injury motorcycle crashes on rural federal trunk and state roads in the federal state of Bavaria from 2002 to 2006.
The second part concentrated on the relationship between crashes, where the motorcyclist lost control of his bike and various infrastructure parameters. Therefore, investigation sections with approximately the same ADT of powered two-wheeler, but different crash situation (safe sections with no crashes versus unsafe sections with more than three crashes of the aforementioned type), were selected in three different regions. Using a measurement vehicle of the Dresden University of Technology relevant road infrastructure parameters were recorded for these selected road sections.
The aim of the third part was taking an in-depth look at the influence of the road surface condition on injury motorcycle crashes on rural trunk roads in the federal state of North Rhine-Westphalia. For this investigation, road surface condition data and crash data from 2003 has been used.
4.4.1. Influence of the ADT of powered two-wheelers on the density of injury motorcycle crashes
It is already known that there is a strong relationship between the ADT and the crash density. Whether there is also a strong relationship between the ADT of powered two-wheelers and the density of injury motorcycle crashes had to be proven. For this reason, the data of the 2005 road traffic census and data of injury motorcycle crashes on rural federal trunk and state roads in Bavaria between 2002 and 2006 was used for such analysis. Since the traffic census data did not differentiate between different types of powered two-wheeler, it was not possible to determine the relationship between the ADT of motorcycles and the density of injury motorcycle crashes. However, as the officially registered number of scooter and moped crashes is extremely low due to their low mileage on these kinds of roads, it is legitimate to compare the ADT of powered two-wheelers with the density of injury motorcycle crashes.
Overall, for 3,403 sections of rural federal trunk and state roads in Bavaria information on the ADT of powered two-wheelers was available. On 822 of these 3,403 sections there was at least one

2-BE-SAFE D2 Road infrastructure and road safety for PTW
Document ID: 2BES_WP1_D2_RIandRSforPTW_Final.doc 159
motorcycle crash involving personal injury. As the consideration of road section without a motorcycle crash involving personal injury have only a negligible influence on the relationship between the density of injury motorcycle crashes and the ADT of powered two-wheeler, but the result can be shown clearly without them, the following investigation was restricted to these 822 road sections.
Due to the fact that for road sections with an ADT above 500 motorcycles per day meaningful grouping for the subsequent investigation was impossible, road sections with an ADT above 500 powered two-wheelers per 24 h were not included (this applies to 10 road sections). The following investigation was therefore restricted to 812 road sections (mean section length: 3,900 m).
Figure 77: ADT of powered two-wheelers and number of investigated road sections in Bavaria.
The number of sections as a function of 5 ADT classes with a uniform class width is shown in Figure 77. As can be seen the majority of road sections have an ADT between 101 and 200 powered two-wheelers per 24h (39%). By contrast, road sections with an above average ADT between 401 and 500 powered two-wheelers per 24h have a much smaller proportion (4%).
In the next step, the crash density was calculated for all 812 road sections. The crash density is a unit which expresses the relationship between crash occurrence and the examined length in kilometers of a road. Figure 78 shows the relationship between the ADT of powered two-wheelers and the density of injury motorcycle crashes as a box and whisker plot.
A box and whisker plot is a convenient way of graphically depicting groups of numerical data. The bottom and top of the red box are the 25th and 75th percentile (the lower and upper quartiles), and the black line near the middle of the box is always the 50th percentile (the median). The ends of the whiskers represent in this case the lowest datum still within 1.5 interquartile range of the lower quartile, and the highest datum still within 1.5 interquartile range of the upper quartile. Any data not included between the whiskers is plotted as an outlier with a dot or plotted as an extreme outlier with a star.

2-BE-SAFE D2 Road infrastructure and road safety for PTW
Document ID: 2BES_WP1_D2_RIandRSforPTW_Final.doc 160
median75 percentileth
25 percentileth
1,5 IQR(upper fence)
1,5 IQR(lower fence)
3 IQR
3 IQR
IQR
Figure 78: Relationship between the ADT of powered two-wheelers and the density of injury motorcycle crashes.
In Figure 78 it becomes particularly evident that with an increasing ADT of powered two-wheelers, the density of injury motorcycle crashes also increases. This context is clearly, shown by the median. The density of injury motorcycle crashes on road sections with an ADT between 1 and 100 powered two-wheelers per day is about 0.1 injury motorcycle crashes per year and km, whereas the density of injury motorcycle crashes on road sections with an ADT between 401 and 500 powered two-wheelers per day is slightly above 0.2 injury motorcycle crashes per year and km. Thus the crash density on heavily loaded sections is about twice as high as on the weak loaded sections.
The crash density of injury motorcycle crashes is crucially dependent on the ADT of powered two wheelers. The information on the ADT of powered two-wheelers is therefore necessary within the following road section related investigation of a possible relationship between road infrastructure parameters and single injury motorcycle crashes.
4.4.2. Influence of road infrastructure parameters on injury motorcycle crashes
Which infrastructure parameters have an impact on injury motorcycle crashes can best be shown in a comparison of safe road sections (no single injury motorcycle crashes) with unsafe road sections (many single injury motorcycle crashes). For example, if the unsafe road section is characterised by a bad road surface condition, which is on the safe road section is not the case, it is possible that crashes happen due to that particular characteristic.
Different possible investigation areas with a high proportion of motorcycle crashes were analysed using a map of Germany, which illustrates the share of injury motorcycle crashes of any injury crash on rural roads in 2006 (see Figure 79 – red indicates a proportion of more than 20%). According to the map, there is a particularly high proportion of injury motorcycle crashes in the federal states of North Rhine-Westphalia, Rhineland-Palatinate and Bavaria. This is because there are extensive mountainous areas in these federal states, which are particularly attractive to motorcyclists. For this reason the further investigation is limited to rural roads in the federal states of North Rhine-Westphalia, Rhineland-Palatinate and Bavaria.
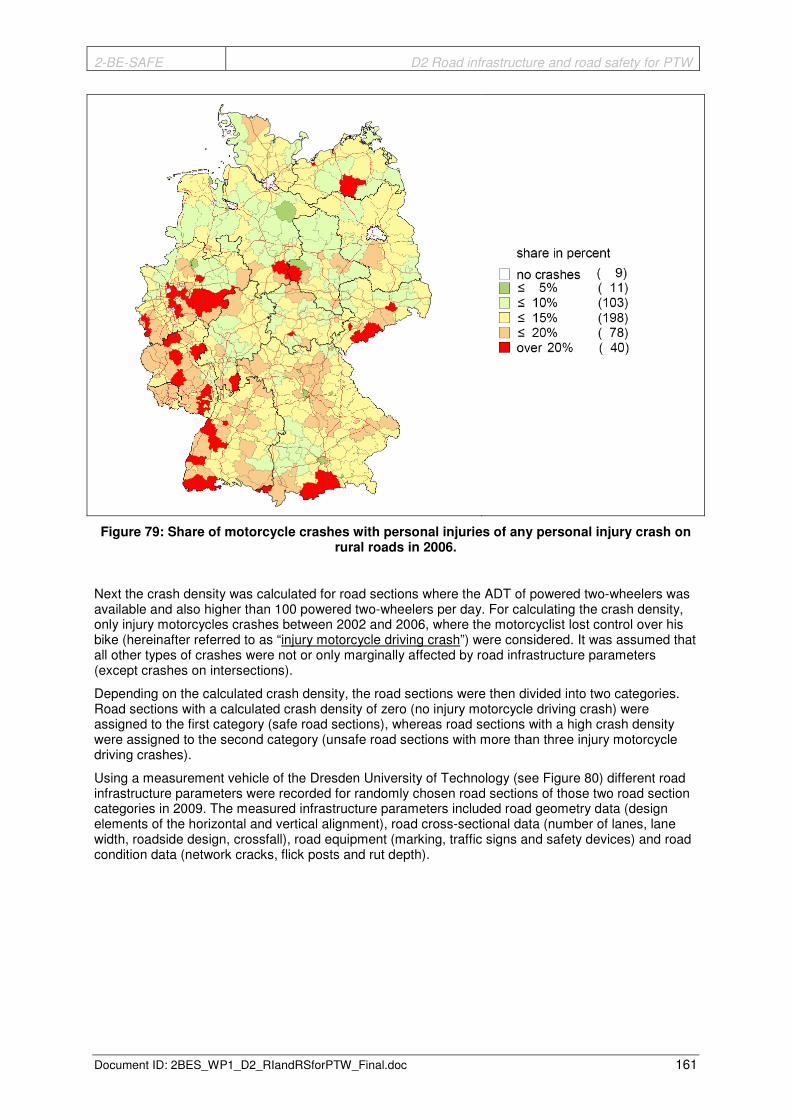
2-BE-SAFE D2 Road infrastructure and road safety for PTW
Document ID: 2BES_WP1_D2_RIandRSforPTW_Final.doc 161
Figure 79: Share of motorcycle crashes with personal injuries of any personal injury crash on rural roads in 2006.
Next the crash density was calculated for road sections where the ADT of powered two-wheelers was available and also higher than 100 powered two-wheelers per day. For calculating the crash density, only injury motorcycles crashes between 2002 and 2006, where the motorcyclist lost control over his bike (hereinafter referred to as “injury motorcycle driving crash”) were considered. It was assumed that all other types of crashes were not or only marginally affected by road infrastructure parameters (except crashes on intersections).
Depending on the calculated crash density, the road sections were then divided into two categories. Road sections with a calculated crash density of zero (no injury motorcycle driving crash) were assigned to the first category (safe road sections), whereas road sections with a high crash density were assigned to the second category (unsafe road sections with more than three injury motorcycle driving crashes).
Using a measurement vehicle of the Dresden University of Technology (see Figure 80) different road infrastructure parameters were recorded for randomly chosen road sections of those two road section categories in 2009. The measured infrastructure parameters included road geometry data (design elements of the horizontal and vertical alignment), road cross-sectional data (number of lanes, lane width, roadside design, crossfall), road equipment (marking, traffic signs and safety devices) and road condition data (network cracks, flick posts and rut depth).
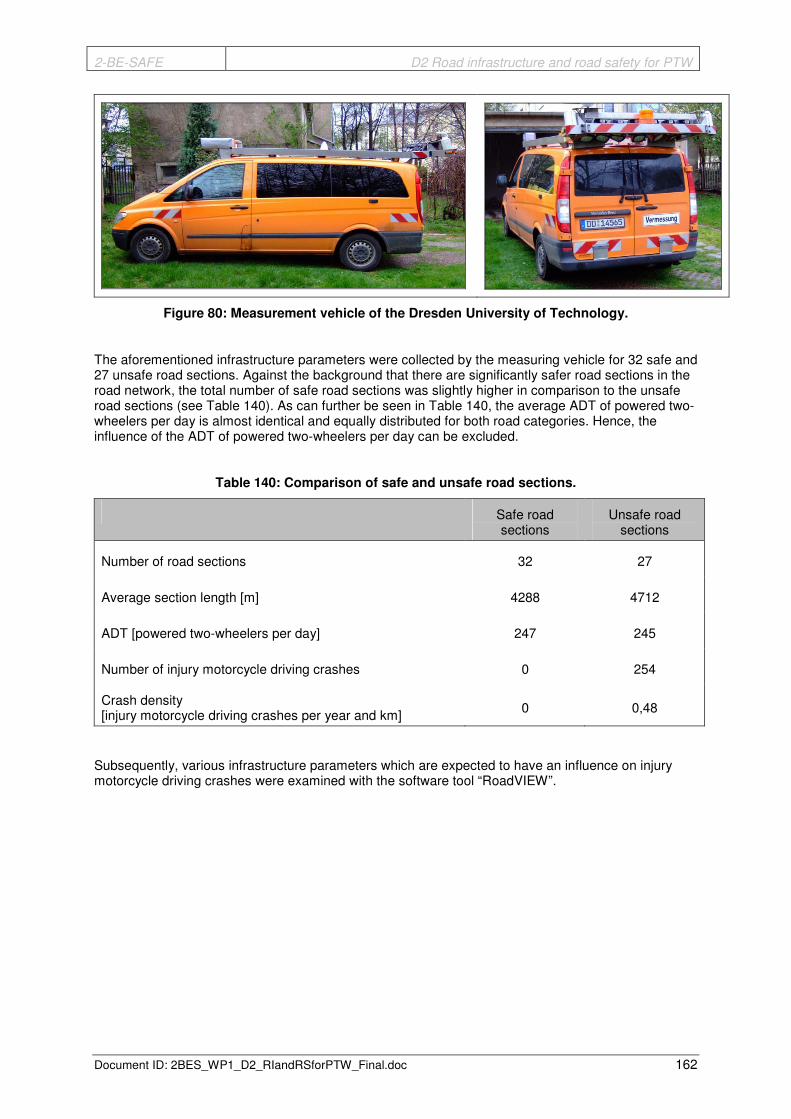
2-BE-SAFE D2 Road infrastructure and road safety for PTW
Document ID: 2BES_WP1_D2_RIandRSforPTW_Final.doc 162
Figure 80: Measurement vehicle of the Dresden University of Technology.
The aforementioned infrastructure parameters were collected by the measuring vehicle for 32 safe and 27 unsafe road sections. Against the background that there are significantly safer road sections in the road network, the total number of safe road sections was slightly higher in comparison to the unsafe road sections (see Table 140). As can further be seen in Table 140, the average ADT of powered two-wheelers per day is almost identical and equally distributed for both road categories. Hence, the influence of the ADT of powered two-wheelers per day can be excluded.
Table 140: Comparison of safe and unsafe road sections.
Safe road sections
Unsafe road sections
Number of road sections 32 27
Average section length [m] 4288 4712
ADT [powered two-wheelers per day] 247 245
Number of injury motorcycle driving crashes 0 254
Crash density [injury motorcycle driving crashes per year and km] 0 0,48
Subsequently, various infrastructure parameters which are expected to have an influence on injury motorcycle driving crashes were examined with the software tool “RoadVIEW”.

2-BE-SAFE D2 Road infrastructure and road safety for PTW
Document ID: 2BES_WP1_D2_RIandRSforPTW_Final.doc 163
4.4.2.1. Curvature Change Rate
Figure 79 already shows that the share of injury motorcycle crashes of any injury crash on rural roads is particularly high in mountainous regions. In mountainous areas, the alignment of the roads is generally strongly adapted to the landscape. Due to this fact, it is expected, that the curvature change rate has a significant influence on motorcycle crashes.
The curvature change rate is defined as follows: The curvature change rate is the sum of angle changes in the curve divided by the length of the road section. The sum of absolute angle changes consists here of the angle changes from the circular and the transition curve.
median75 percentileth
25 percentileth
1,5 IQR(upper fence)
1,5 IQR(lower fence)
3 IQR
3 IQR
IQR
Figure 81: Curvature change rate.
Figure 81 shows that the curvature change rate [gon/km] is higher on unsafe road sections than on safe road sections. On safe road sections the curvature change rate is approximately 70 gon/km (median) whereas with over 300 gon/km (median) the curvature change rate on unsafe road sections is more than fourfold. This means that the curvature change rate and thus the vertical alignment have an influence on injury motorcycle driving crashes.
In this context, the alignment just before and at the crash scene of injury motorcycle driving crashes was investigated. As a result it was found that the vast majority of these crashes occurred in curves. These curves are usually characterized by very small curve radii (< 50 m). Moreover, they are usually in sections with a bad radii relation (unbalanced ratio of successive radii or radii on adjacent straight).
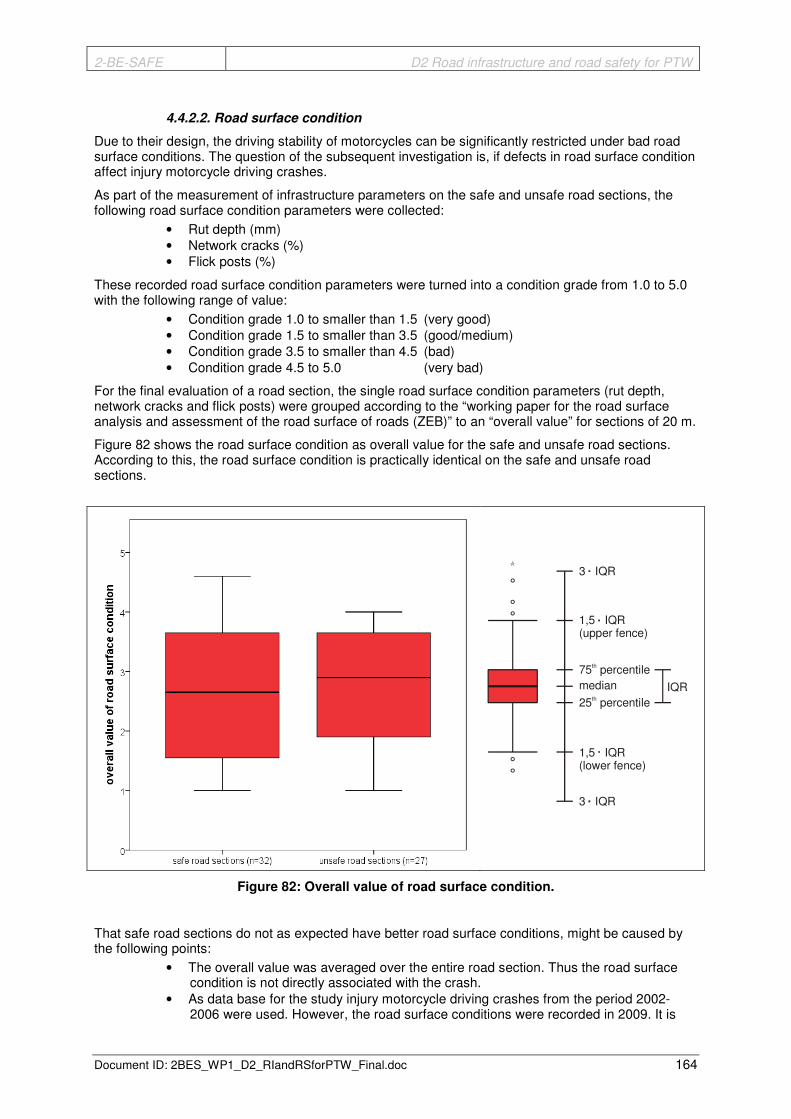
2-BE-SAFE D2 Road infrastructure and road safety for PTW
Document ID: 2BES_WP1_D2_RIandRSforPTW_Final.doc 164
4.4.2.2. Road surface condition
Due to their design, the driving stability of motorcycles can be significantly restricted under bad road surface conditions. The question of the subsequent investigation is, if defects in road surface condition affect injury motorcycle driving crashes.
As part of the measurement of infrastructure parameters on the safe and unsafe road sections, the following road surface condition parameters were collected:
• Rut depth (mm) • Network cracks (%) • Flick posts (%)
These recorded road surface condition parameters were turned into a condition grade from 1.0 to 5.0 with the following range of value:
• Condition grade 1.0 to smaller than 1.5 (very good) • Condition grade 1.5 to smaller than 3.5 (good/medium) • Condition grade 3.5 to smaller than 4.5 (bad) • Condition grade 4.5 to 5.0 (very bad)
For the final evaluation of a road section, the single road surface condition parameters (rut depth, network cracks and flick posts) were grouped according to the “working paper for the road surface analysis and assessment of the road surface of roads (ZEB)” to an “overall value” for sections of 20 m.
Figure 82 shows the road surface condition as overall value for the safe and unsafe road sections. According to this, the road surface condition is practically identical on the safe and unsafe road sections.
median75 percentileth
25 percentileth
1,5 IQR(upper fence)
1,5 IQR(lower fence)
3 IQR
3 IQR
IQR
Figure 82: Overall value of road surface condition.
That safe road sections do not as expected have better road surface conditions, might be caused by the following points:
• The overall value was averaged over the entire road section. Thus the road surface condition is not directly associated with the crash.
• As data base for the study injury motorcycle driving crashes from the period 2002-2006 were used. However, the road surface conditions were recorded in 2009. It is

2-BE-SAFE D2 Road infrastructure and road safety for PTW
Document ID: 2BES_WP1_D2_RIandRSforPTW_Final.doc 165
assumed that the road surface conditions from the year 2009 differ from the road surface conditions between 2002 and 2006.
Due to these circumstances and against the background that the measurement vehicle of Dresden University of Technology could not record all road surface condition parameter according to ZEB (e.g. skid resistance), the next chapter will be investigating the influence of different road surface condition parameters on road safety of motorcyclists in detail.
4.4.3. Influence of road surface condition on injury motorcycle driving crashes
In Germany, the road surface condition parameters general unevenness, ruts, friction, network cracks, flick posts and other surface damages are measured on the federal roads every four years. Beside these relevant road surface condition parameters additional characterising parameters (e.g. accumulations of binder) are recorded. The road surface condition parameters are collected by fast moving measurement vehicles and assigned to the road network system.
In the process of road surface assessment, the road condition parameters, which have been determined from condition data collected locally with physical dimensions, are first converted into normalized non-dimensional condition grades for sections with a regular length of 100 meters and then as part of a value synthesis linked to different sub goals values and an total value. The rating of condition values follows the range of value as described in chapter 4.4.2.2.
As part of the subsequent investigation, the relevant road surface condition data of the federal rural roads (no motorways) in North Rhine-Westphalia from 2003 were directly linked to the data of injury motorcycle driving crashes of the same year. Since the crash is caused ahead of the final position of the bike or the rider, the road surface condition parameter of the preceding 100 meters section has been linked to the crash. A total of 106 injury motorcycle driving crashes could be linked with road surface parameters. To assess the road surface conditions at the crash scene, the road surface condition parameters of a large part of the federal rural road network (no motorways) in North Rhine-Westphalia (total of 2107 sections á 100 meters) were used as a comparison.
4.4.3.1. Longitudinal unevenness – general unevenness
The longitudinal evenness indicates the compliance of the actual shape of the surface layer (actual surface) with the shape of the projected surface layer (target surface) in longitudinal direction (parallel to the road axis). Unevenness in longitudinal direction is geometrical irregularities of the road surface in form of height deviations from the planned shape of the surface layer, which are not part of the texture.
Unevenness in longitudinal direction may affect driving safety due to reduced frictional connection of dynamic variation of wheel forces. Also, the rider fitness and comfort may be reduced due to vertical accelerations.
The longitudinal unevenness is measured on the right-hand lane of each directional carriageway. A rigid measuring beam is installed under the vehicle and decoupled from it, in the rolling track of the right-hand wheels. Five triangulation laser sensors are attached to this beam which constantly scans the distance to the road surface.
From the parameter group "longitudinal unevenness" 3 different condition parameters (general unevenness, single obstacles and periodic unevenness) are determined. Of these 3 condition parameters, however, the general unevenness is the only one relevant for the calculation of the overall value. For this reason, only the general unevenness has been examined here.

2-BE-SAFE D2 Road infrastructure and road safety for PTW
Document ID: 2BES_WP1_D2_RIandRSforPTW_Final.doc 166
Figure 83: General Unevenness (road surface wave and pothole).
Figure 83 shows examples for general unevenness which can occur as road surface waves as well as potholes (separation of parts of the road surface due to traffic, weathering, or weather influence).
median75 percentileth
25 percentileth
1,5 IQR(upper fence)
1,5 IQR(lower fence)
3 IQR
3 IQR
IQR
Figure 84: General unevenness.
As shown in Figure 84, the actual condition grade of the general unevenness in the road network is much lower than at crash scenes. The median of the actual condition grade in the road network is still in the very good range (smaller 1.5), in contrast to a good/medium range (around 2.5) at the crash scene. This means that the actual condition grade of the general unevenness at the crash scene is much worse than is the case in the road network. Therefore, the deficits concerning the general unevenness have an impact on injury motorcycle driving crashes.
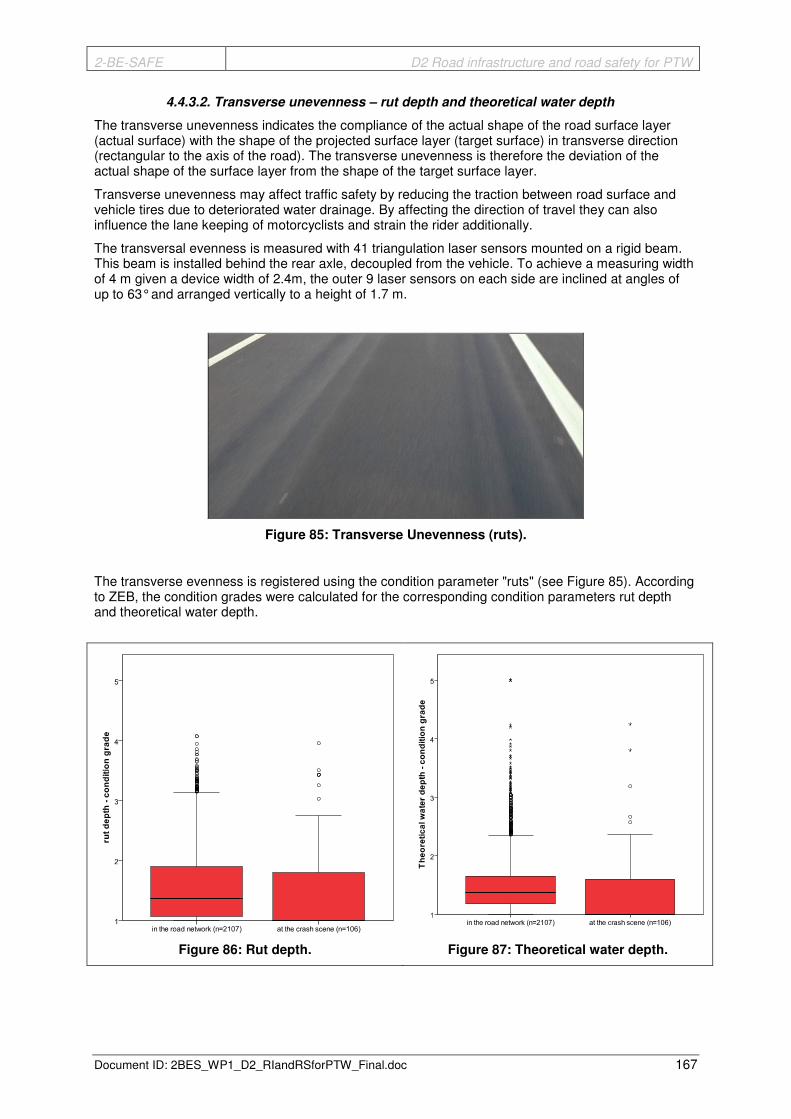
2-BE-SAFE D2 Road infrastructure and road safety for PTW
Document ID: 2BES_WP1_D2_RIandRSforPTW_Final.doc 167
4.4.3.2. Transverse unevenness – rut depth and theoretical water depth
The transverse unevenness indicates the compliance of the actual shape of the road surface layer (actual surface) with the shape of the projected surface layer (target surface) in transverse direction (rectangular to the axis of the road). The transverse unevenness is therefore the deviation of the actual shape of the surface layer from the shape of the target surface layer.
Transverse unevenness may affect traffic safety by reducing the traction between road surface and vehicle tires due to deteriorated water drainage. By affecting the direction of travel they can also influence the lane keeping of motorcyclists and strain the rider additionally.
The transversal evenness is measured with 41 triangulation laser sensors mounted on a rigid beam. This beam is installed behind the rear axle, decoupled from the vehicle. To achieve a measuring width of 4 m given a device width of 2.4m, the outer 9 laser sensors on each side are inclined at angles of up to 63° and arranged vertically to a height of 1.7 m.
Figure 85: Transverse Unevenness (ruts).
The transverse evenness is registered using the condition parameter "ruts" (see Figure 85). According to ZEB, the condition grades were calculated for the corresponding condition parameters rut depth and theoretical water depth.
Figure 86: Rut depth.
Figure 87: Theoretical water depth.

2-BE-SAFE D2 Road infrastructure and road safety for PTW
Document ID: 2BES_WP1_D2_RIandRSforPTW_Final.doc 168
The rut depth is determined by the largest possible depth gauge in transversal axis of a road profile below a 2 meters latch. All possible positions are investigated to find the maximum depth gauge for the right and left half of lane.
Figure 86 shows that the median of the actual condition grade rut depth is in a very good range (smaller than 1.5) both in the road network and at the crash scenes. At the crash scenes the median is even below the condition grade of 1. This means that ruts were not present at more than 50% of crash scenes. Against the background that the median of the condition grade rut depth in the road network is above the value 1, it can be concluded, that deficits concerning the rut depth have no influence on injury motorcycle driving crashes.
The theoretical water depth is determined on the basis of the possible theoretical accumulation of water in a rut. Figure 87 shows the actual condition grade for the theoretical water depth. The result is comparable to the result of the actual condition grade of rut depth. Accordingly, an influence of deficits concerning the theoretical water depth can be excluded in injury motorcycle driving crashes.
That deficits regarding both, the rut depth as well as the theoretical water depth have no influence on injury motorcycle driving crashes, may possibly be due to the fact that these two parameters are generally in a very good range on road sections of federal rural roads.
4.4.3.3. Friction – friction value
Friction characterises the effect texture and material composition of the road surface have on the traction between motorcycle tires and roadway under defined conditions. Friction forces for the acceleration, deceleration and lane keeping of a motorcycle are transferred through the road surfaces. By measuring the skid resistance coefficient between a measuring wheel and a wetted road surface of the right wheel tracks friction is recorded.
We already know that friction has an influence on driving safety and that there is a direct connection with the crash rate under wet conditions.
median75 percentileth
25 percentileth
1,5 IQR(upper fence)
1,5 IQR(lower fence)
3 IQR
3 IQR
IQR
Figure 88: Friction value.
Figure 88 shows the results of the friction value. According to this, the friction value is practically identical at the crash scene and in the road network.

2-BE-SAFE D2 Road infrastructure and road safety for PTW
Document ID: 2BES_WP1_D2_RIandRSforPTW_Final.doc 169
The friction value at the crash scene is not, as could be expected, significantly worse than in the road network. A possible reason is that the friction may have a critical influence only under wet conditions. The overall motorcycle crash statistics shows that the share of motorcycle crashes under wet conditions is very small. The reason is that most motorcyclists try to avoid riding under bad weather conditions.
4.4.3.4. Substance – Network cracks, flick posts and accumulation of bituminous binder
The condition characteristic "substance” (surface profile) indicates visible structural road surface damages of the pavement. The condition parameters of the road surface are recorded on the basis of technical video components. The assessment is based on a surface grid, which has a size of 1/3 of the lane width in transverse direction and a size of 1 metre in the longitudinal direction. The occurrence of corresponding damage is recorded for each grid. This process is then used to determine the average relative frequency of damages.
Figure 89: Substance parameter (Network cracks, flick posts, accumulation of bituminous binder).
Condition parameters recorded are single cracks, network cracks, flick posts, potholes and accumulations of bituminous binder. Since only network cracks and flick posts are relevant for the calculation of the overall value, only these condition parameters were analysed. However, it is also believed that accumulations of binder may have an influence on injury motorcycle driving crashes. For this reason, this condition parameter was also investigated.

2-BE-SAFE D2 Road infrastructure and road safety for PTW
Document ID: 2BES_WP1_D2_RIandRSforPTW_Final.doc 170
Figure 90: Network cracks.
Figure 91: Flick posts.
Figure 90 and Figure 91 show the condition grade of network cracks and flick posts. The median of the two condition parameters at the crash scene is below the state value of 1, in case of the flick posts even below the 75th percentile. In comparison, the median in the road network is just above 1. This means that network cracks and flick posts have no detectable influence on injury motorcycle driving crashes.
The accumulation of bituminous binders on the road surface could only be detected on a few sections in the road network, however, not at any crash scene. Accumulations of bituminous binder increase the stopping distance and reduce the maximum sloping position in curves. Because of these characteristics, accumulations of bituminous binder expose a high crash potential for motorcyclists.

2-BE-SAFE D2 Road infrastructure and road safety for PTW
Document ID: 2BES_WP1_D2_RIandRSforPTW_Final.doc 171
4.4.3.5. Overall value
The individual condition grades (general unevenness, rut depth, theoretical water depth, friction value, network cracks and flick posts) are combined in a value synthesis to two so-called sub values. The two sub goals road safety and traffic ability are summarized in a utility value (first sub value), which should characterise the quality of service for the road user. The second sub value is the substance value, which is calculated on the basis of the condition characteristic substance (surface profile). The overall value is equal to the poorer of the two sub values.
median75 percentileth
25 percentileth
1,5 IQR(upper fence)
1,5 IQR(lower fence)
3 IQR
3 IQR
IQR
Figure 92: Overall value.
Figure 92 shows the overall value of road surface condition in the road network and at the crash scene. It becomes obvious that the median of the overall value in the road network is much lower and therefore better than at the crash scene. The median in the road network is at just above 2.5 in the good range (1.5 to 3.5), however, at the crash scene the median at just above 3.5 is already in a bad area (3.5 to 4.5). This means that the overall value for road surface condition at the crash scene is much worse than is the case for the road network. The overall value and hence the road surface condition has therefore an influence on injury motorcycle driving crashes.
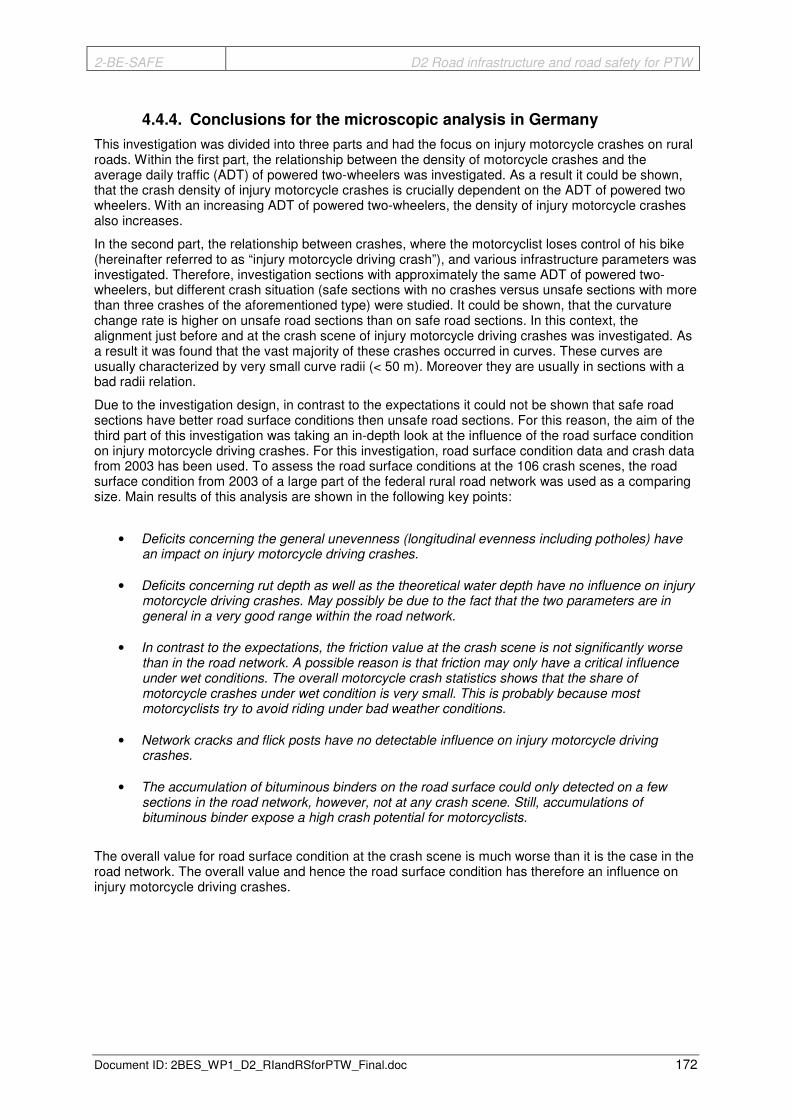
2-BE-SAFE D2 Road infrastructure and road safety for PTW
Document ID: 2BES_WP1_D2_RIandRSforPTW_Final.doc 172
4.4.4. Conclusions for the microscopic analysis in Germany
This investigation was divided into three parts and had the focus on injury motorcycle crashes on rural roads. Within the first part, the relationship between the density of motorcycle crashes and the average daily traffic (ADT) of powered two-wheelers was investigated. As a result it could be shown, that the crash density of injury motorcycle crashes is crucially dependent on the ADT of powered two wheelers. With an increasing ADT of powered two-wheelers, the density of injury motorcycle crashes also increases.
In the second part, the relationship between crashes, where the motorcyclist loses control of his bike (hereinafter referred to as “injury motorcycle driving crash”), and various infrastructure parameters was investigated. Therefore, investigation sections with approximately the same ADT of powered two-wheelers, but different crash situation (safe sections with no crashes versus unsafe sections with more than three crashes of the aforementioned type) were studied. It could be shown, that the curvature change rate is higher on unsafe road sections than on safe road sections. In this context, the alignment just before and at the crash scene of injury motorcycle driving crashes was investigated. As a result it was found that the vast majority of these crashes occurred in curves. These curves are usually characterized by very small curve radii (< 50 m). Moreover they are usually in sections with a bad radii relation.
Due to the investigation design, in contrast to the expectations it could not be shown that safe road sections have better road surface conditions then unsafe road sections. For this reason, the aim of the third part of this investigation was taking an in-depth look at the influence of the road surface condition on injury motorcycle driving crashes. For this investigation, road surface condition data and crash data from 2003 has been used. To assess the road surface conditions at the 106 crash scenes, the road surface condition from 2003 of a large part of the federal rural road network was used as a comparing size. Main results of this analysis are shown in the following key points:
• Deficits concerning the general unevenness (longitudinal evenness including potholes) have an impact on injury motorcycle driving crashes.
• Deficits concerning rut depth as well as the theoretical water depth have no influence on injury motorcycle driving crashes. May possibly be due to the fact that the two parameters are in general in a very good range within the road network.
• In contrast to the expectations, the friction value at the crash scene is not significantly worse than in the road network. A possible reason is that friction may only have a critical influence under wet conditions. The overall motorcycle crash statistics shows that the share of motorcycle crashes under wet condition is very small. This is probably because most motorcyclists try to avoid riding under bad weather conditions.
• Network cracks and flick posts have no detectable influence on injury motorcycle driving crashes.
• The accumulation of bituminous binders on the road surface could only detected on a few sections in the road network, however, not at any crash scene. Still, accumulations of bituminous binder expose a high crash potential for motorcyclists.
The overall value for road surface condition at the crash scene is much worse than it is the case in the road network. The overall value and hence the road surface condition has therefore an influence on injury motorcycle driving crashes.

2-BE-SAFE D2 Road infrastructure and road safety for PTW
Document ID: 2BES_WP1_D2_RIandRSforPTW_Final.doc 173
5. Synopsis of Trends and Risk Factors
This chapter gives a short overview on the key results of the studies shown above; it is listing and describing the most critical trends and factors for PTW riders regarding the influences of road infrastructure. Results of the macroscopic analyses can mostly be interpreted as risk trends; outputs of the microscopic analyses can be seen as risk factors.
The macroscopic analyses have shown that a critical factor influencing PTW safety is the type of area (inside or outside urban areas). Results from Greece indicate that a significantly high percentage of both moped (88%) and motorcycle accidents (90%) occur inside urban areas. Moreover, rear end and head-on collisions are proportionately more common outside urban areas when compared to accidents inside urban areas. In Spain, PTW accidents inside urban areas account for three quarters of all accidents. UK results pointed that almost half of all incidents are reported in major travel corridors that may or may not reach motorway standards with speed limits ranging from 30 to 70 km/h.
The studies also revealed carriageway type as a determinant in PTW safety. Greece reports that, for collisions between mopeds and pedestrians, inside urban areas, almost half of crashes occur in single carriageways with at least one lane in each way (direction); for outside urban areas, this percentage rises to 88% (although the numbers are small). Inside urban areas on single carriageways with at least one lane in each way (direction), 69% of the accidents are lateral collisions, while 68% of the motorcycle accidents on one-way carriageways with one or more lanes are lateral collisions. In Spain, in half of all run-off-road accidents, carriageways are wider than 7 meters and lack hard shoulders. Spain also showed that accidents which happen in dual carriageway roads are the most severe, considering the number of fatalities with regard to the number of accidents. UK indicates that, by far, the most common combinations of infrastructure features in motorbike accidents are either A or unclassified roads, single carriageway and 30 mph speed limit. Italy reports that roads with one carriageway and two ways have the highest number of accidents.
Road Installations and stationary objects are found to be critical in PTW safety. Greece reported that 60% of moped accidents with stationary objects/vehicles occur at slopes inside urban areas. A similar percentage exists for motorcycle. The results were similar to Italian data. Moreover, most moped collisions with an vehicle in Greek road network are observed in uncontrolled junctions inside urban areas. Interestingly, in UK, only just under 6% of accidents involve a carriageway object (not including a moving vehicle) being hit. The majority of accidents involve a frontal impact, i.e. the motorcycle hitting a vehicle/object rather than being hit by another vehicle.
Pavement surface conditions have been proven to be critical in PTW safety especially when interacting with off-road accident type, riders’ age and experience. Results from Greece show that, regardless from the type of area, PTW accidents are significantly increased during fine weather and dry pavement conditions. Spain reports dry road surface in more than 90% of run-off-road accidents. In UK, young riders are proportionally more likely to have an accident when the road is wet/damp than older riders. Moreover, prevailing conditions will, for the vast majority of the time, be during daylight hours with fine, dry weather and low winds. Finally, results from Italy demonstrate that the majority of accidents occur on dry roads (89%) and the largest share involves riders who received the driving license during the last decade; the number of accidents decreases with an increase in the length of time since the driving license has been made. Moreover, analysis on Italian data showed that accidents on wet and slippery roads are less severe than on dry roads (with the same pavement type) while uneven paved roads increase the accident severity.
Regarding weather conditions in the time of accident, in almost all countries, injuries and fatalities in accidents involving PTWs are mostly observed in dry weather conditions. Italy reports no correlation between weather conditions and the time of the accident, but the latter parameter is significant since the majority of accidents occur in the 15:30-21:29 range, but the most severe ones in the 23:30-6:29 range.UK reports that almost 85% of accidents occur during fine weather without high winds, and over 75% with dry road surface conditions.
Junction type was found to be critical in all countries examined. Greece reports that the percentage of motorcycle fatalities at junctions controlled by police are more than double comparing to similar moped accidents outside urban areas. In Spain, most fatal accidents occurred on Cross-roads and “T or Y”

2-BE-SAFE D2 Road infrastructure and road safety for PTW
Document ID: 2BES_WP1_D2_RIandRSforPTW_Final.doc 174
junctions and approximately 30% of rear-end accidents occur at intersections, mostly without traffic control. UK, on the relation of age with junction type, reported that up to their early to mid thirties the most likely location for riders to have an accident is at a T-junction. Moreover, older riders are also proportionally more likely to have an accident at a roundabout than younger riders. Finally, in Italy, the most relevant accident case is head-on side at cross roads, whereas, in case of no-junction the most relevant case is head-on side on straight road. Moreover, Italy reports higher accidents severity index in the case of one carriageway (two ways) and two carriageways for roads without traffic signs.
A critical risk factor was found to be the geometry specifications. In Greece, the percentage of motorcycle fatalities at straight road and slopes are low in both urban and interurban environment and lower than the moped fatalities. Moreover, narrow roads are found to be significantly more critical for motorcycles than mopeds regardless of the area type. Spain reports that, even though the number of accidents which occur in straight sections of roads is higher than the number of accidents which happen in bends, the first ones present a lower number of fatalities. Italy, combining age with geometry, suggests that 21-30 years old riders are more often involved in accidents; the most dangerous accident cases for this age group are at cross road and on a straight road.
Regarding the findings of the microscopic analyses, it could be shown that a radii relation bigger than 1.0 (coming form a larger radius to a smaller one) is more dangerous than a relation lower than 1.0. In general the in-depth investigation proves that most of the crashes occurring in curves happen in radii smaller than 200m. Black spots for passenger cars tend to be risky areas for PTW riders. Crossfall and curve radius are considered as relevant factors in combination with approach speed of the PTW. Run-off-road accidents involving PTW are more likely to occur in left hand bends than in right hand bends.
Risk factors for motorcyclists are road sections with a high curvature change rate. A comparison of safe sections with no crashes and unsafe sections with more than three injury motorcycle driving crashes shows, that the curvature change rate is higher on unsafe road sections than on safe road sections. This means that with an increasing curvature change rate the number of motorcycle crashes also increases. Other risk factors are an unbalanced ratio of successive radii or radii on adjacent straight (bad radii relation) as well as very small curve radii.
The results of analysis in Austria regarding to texture parameter MPD (Mean Profile Depth), show that the most accidents happen in quality class “poor”. Deficits concerning the general unevenness (longitudinal evenness and potholes) have an impact on PTW accidents (results of the survey in Germany). Examples for general unevenness are road surface waves as well as potholes (separation of parts of the road surface due to traffic, weathering, or weather influence). In contrast network cracks and flick posts are no risk factors for motorcyclists.
The friction value at the accident scene is not as expected significantly worse than in the road network. A possible reason is that the friction may have a critical influence under wet conditions only. The overall motorcycle crash statistics shows that share of motorcycle crashes under wet condition is very low. The reason for that is that most motorcyclists try to avoid riding under bad weather conditions. In terms of skid resistance values (µ) the most PTW accidents happen at quality classes “very good” (µ > 0.75) and “good” (0.75 ≥ µ > 0.59). Slippery road marking are identified as potential hazards, because they have lower skid resistance than the road surface.
The accumulation of bituminous binders and ruts could only be detected on a few sections in the road network, however, not at any crash site. Still, accumulations of bituminous binder and ruts expose a risk factor for motorcyclists.
Not-predictable road geometry is identified as a relevant factor. Improving good forward visibility and the use of indication signs could improve the anticipation of the ongoing road geometry by the riders.
The overall value for road surface condition at the crash scene is much worse than this is the case of the general road network. The overall quality value and hence the road surface condition has therefore an influence on injury motorcycle driving crashes.
2-BE-SAFE D2 Road infrastructure and road safety for PTW
Document ID: 2BES_WP1_D2_RIandRSforPTW_Final.doc 175
6. Conclusions
It is hoped that the results of the macro-analyses within Activity 1.2 will allow researchers to identify which combinations of infrastructure elements are most frequently involved in PTW accidents and therefore to target these in later work packages of the 2-BE-SAFE project. This should allow the study to target those accident types most frequently represented in the accident statistics, at the minimum cost.
The very often terrible consequences of accidents involving PTWs are a constant reminder that, much too often, infrastructure is not designed to ensure the maximum possible levels of safety for motorcycles and mopeds. There is hence a need to propose innovative solutions and to implement the already existing ones so that PTWs enjoy increasing levels of safety on European infrastructure. Europe is starting to take note of the problem, with European Commission Vice-President Antonio Tajani stating that “the problem of motorcycles must be tackled head on, as it represents 17% of deaths on the road” (II European Road Safety Day, Paris 13 October 2008).
The key findings of the analyses in Greece, Spain, Great Britain and Italy show that most of the basic risk factors (trends) regarding road infrastructure are in some points comparable. However lots of critical factors are specific for single countries, because of their rider’s habits and behaviour which will be studied within the 2-BE-SAFE project. Also road networks have different qualities in the participating countries. Disharmonic traces and sudden changes of the surface characteristics (road condition and/or road condition) lead to a higher risk potential for PTW safety.
Preventing loss of control of a PTW and mitigating the consequences of the possible accidents are two areas where infrastructure has a key role to play. Through better roads it is possible to avoid altogether accidents that would otherwise cause serious injuries on PTW riders. Also training and awareness of critical factors (especially situations at specific junction types or risky trace geometry of curves) for riders are useful preventative measures.
An in-depth view on the PTW accident events, a so-called microscopic analysis, is the final stage within that activity.
The Spanish database (DIANA) beside two software tools (RoadVIEW and MARVin), checking the German and Austrian PTW crash sites, have been used to investigate detailed correlation of infrastructure parameters and the crash risk. Measurement data of road surface characteristics have been used in the queries. The results show that a closer look to parameter combinations (e.g. curve radii, crossfall, texture, unevenness and skid resistance) is feasible.
The results of the microscopic analyses are better comparable than the ones of the macroscopic studies. It is the matter of facts, due to different national data bases, varying definitions of crash circumstances and especially different driver’s mentalities.
Future Research:
Surprising outcomes beside the core risk factors, shown in chapter 5, lead to new requests for further research which has to include exposure data. Without exposure data it is difficult to define real risks – that information should be available for all road safety researchers. The influence of skid resistance has to be discussed in future PTW safety research from another point of view, as it is expected that the macro texture of the road surface have an higher impact on PTW safety. Specifically a survey regarding risk multiplication due to the occurrence of several critical characteristics at the same area is needed.
Detailed analysis with simulation tools (vehicle-infrastructure-interaction simulation), as well as incorporation of data gathered in naturalistic driving studies, should take place in coming PTW related research projects.

2-BE-SAFE D2 Road infrastructure and road safety for PTW
Document ID: 2BES_WP1_D2_RIandRSforPTW_Final.doc 176
7. References
ACEM - Association des Constructeurs Europeens de Motorcycles (2003), MAIDS - Motorcycle Accident in-depth Study, July, Brussels.
APROSYS (2006). SP4 D413. Report on accident scenarios for motorcycle-mororcyclist-infrastructure interaction. State-of-the art. Future research guidelines. SP4 D413.
Assing (2002): Schwerpunkte des Unfallgeschehens von Motorradfahrern [Main aspects of motorcycle accidents], Berichte der Bundesanstalt für Straßenwesen, Schriftenreihe „Mensch und Sicherheit“, Heft M 137, Bergisch Gladbach.
ATSB (2000), Review of Wire Rope Safety Barriers: Working Party Report, Australian Transport Safety Bureau, Canberra, June.
Berg, F. A., Rucker, P., Gartner, M., Konig, J., Grzebieta, R., and Zou, R., Motorcycle Impacts into Roadside Barriers – Real World Accident Studies, Crash Tests, and Simulations Carried out in Germany and Australia, 19th ESV, Washington, DC, 2005.
Berg J., Forward S. and Holgersson S. (2008). Young moped drivers – a study of risk taking and methods used by the police to reduce trimming, Report 631, VTI.
Brailly (1998) Studie von Motorradunfällen mit Stahlleitplankenanprall. Safety environment future II: proceedings of the 1998 International Motorcycle Conference, IfZ Forschungshefte Zweiradsicherheit No. 8, p. 387-401
Branas, C.C. and Knudson, M.M. (2001). Helmet use laws and motorcycle rider death rates, Accid. Anal. Prevention, 33, 641–648.
Brorrson B., Ifver J.; Wobbing in modern motorcycles, Accid Anal Prev, 16: 451 – 456, 1984
Crundall et al. 2008. Does attention move or spread during mental curve tracing? Perception & Psychophysics, 70, 2, 373-388.
De Lapparent, M. (2006). Empirical Bayesian analysis of accident severity for motorcyclists in large French urban areas, Accident Analysis and Prevention, 38 (2), 260-268.
Department for Transport (2008). Road casualties Great Britain: 2007, the Casualty Report. London: The Stationery Office.
Department for transport (2009), Road lengths in Great Britain by local authority and road class: 2005-2008 http://www.dft.gov.uk/pgr/statistics/datatablespublications/roadstraffic/roadlengths/.
DGT (Dirección General de Tráfico, España). (2007) Estudio de accidentes con implicación de motocicletas en España. (Motorcycle accident analysis study).
Duncan, C Corben , C B Truedsson, B N Tingvall, N C C (2000) CR 201: Motorcycle and Safety Barrier Crash-Testing: Feasibility Study, Monash University Accident Research Centre.
Elliott, M A, Baughan C J, Broughton J, Chinn B, Grayson G B, Knowles J, Smith L R AND and Simpson H (2003), Motorcycle safety: a scoping study, TRL Report TRL581, UK.
ERF, European Union Road Federation; IRF, Brussels Programme Centre of the International Road Federation, Discussion Paper – Road Infrastructure Safety of Powered Two-Wheelers, February 2009.
Gabler H. C. (2007). The risk of fatality in motorcycle crashes with roadside barriers, Paper Number 07-0474, Virginia Tech, US.

2-BE-SAFE D2 Road infrastructure and road safety for PTW
Document ID: 2BES_WP1_D2_RIandRSforPTW_Final.doc 177
Gerlach, O. (2007). Schutzeinrichtungen am Fahrbahnrand kritischer Streckenabschnitte für Motoradfahrer [Measures for the enhancement of safety of motorcyclists at the edge of carriageways on critical road sections], Berichte der Bundesanstalt für Straßenwesen, Schriftenreihe „Verkehrstechnik“, Heft V 152, Bergisch Gladbach.
Gibson, T. and Benetatos, E., Motorcycles and Crash Barriers, NSW Motorcycle Council Report, 2000.
Glad, A. (2001). Blendingseffekter av fjernlys på motorsykler i dagslys (Glare effects of high beam on motorcycles in daylight). Oslo : Transportökonomisk institutt TÖI, http://www.toi.no/getfile.php/Publikasjoner/T%D8I%20rapporter/2001/521-2001/.
Haque MD. M., Chin H. C. and Huang H. (2009). Modeling fault among motorcyclists involved in crashes, Accident Analysis and Prevention, forthcoming.
Harrison, W. A., Christie, R.; Exposure survey of motorcyclists in New South Wales, Acc Anal Prev, 2005
Haworth, N. and Mulvihill, C., (2005). Review of Motorcycle Licensing and Training. Monash University Accident Research Center, Victoria, Australia.
Hurt, H.H., Ouellet, J.V., Thom, D.R., (1981). Motorcycle Accident Cause Factors and Identification of Countermeasures, Final Report to National Highway Traffic Safety Administration, U.S. Department of Transportation.
Keng, S.H. Helmet use and motorcycle fatalities in Taiwan, Accid. Anal. Prev. 37 (2005), pp. 349–355.
KfV (2003): „Unfallstatistik 2002“. Kuratorium für Verkehrssicherheit , Vienna 2003.
Koch and Brendicke (1988), Motorcycle Accidents with guardrails. Institut für Zweiradsicherheit.
Kühn (2008), Analyse des Motorradunfallgeschehens [Analysis of motorcycle crashes], GDV, Germany
Langley J., Mullin B., Jackson R., Norton R.; Motorcycle engine size and risk of moderate to fatal injury from a motorcycle crash. Accid Anal Prev. 2000 Sep; 32(5): 659 - 663
Lin, M.R., Chang, S.H., Pai, L. and ., Keyl, P.M., (2003). A longitudinal study of risk factors for motorcycle crashes among junior college students in Taiwan. Accident Analysis and Prevention 35, 243–252.
Maurer P. (2007): „Aspekte der Fahrbahngriffigkeit und ihr Einfluss auf erreichbare Pkw-Bremsverzögerungen“. Straßenforschungsauftrag Nr. 3.304 des Bundesministerium für Verkehr, Innovation und Technologie BMVIT. Vienna 2007
McDonald M (2002). Motorcyclists and Roadside Safety hardware, Presented at the A2A04 Summer meeting, 21-24 July, CA, US.
Met Office (2009) http://www.metoffice.gov.uk/climate/uk/averages/ukmapavge.html#.
Miller (1997), Motorcycle road safety, Report (Murdoch University. Institute for Research into Safety & Transport); no. 118.
Morgan and Ogden (1999), Treatment of crash location. Austroads Project RS.G.5 draft report
Motorcycle Action Group (MAG), (2005). Motorcycle Friendly Crash Barriers.
Motorcycle Action Group (MAG), (2006). Vehicle Restraint Systems; Safety Fences, Crash Barriers, Motorcyclists, Version 1.4

2-BE-SAFE D2 Road infrastructure and road safety for PTW
Document ID: 2BES_WP1_D2_RIandRSforPTW_Final.doc 178
National Technical University of Athens / Department of Transportation Planning and Engineering [NTUA/DPTE]. (2002). Development of a system for the analysis of road accidents data - Final Report. Greece: Ministry of Transport and Communications.
NPRA - Statens vegvesen (Norwegian Public Roads Administration) (2004). Handbook 245e: MC Safety – Design and Operation of Roads and Traffic Systems.
Pai, C.-W. and Saleh, W. (2007). An analysis of motorcyclist injury severity under various traffic control measures at three-legged junctions in the UK Safety Science 45 832–847.
Pai, C.-W. and Saleh, W. (2008). Exploring motorcyclist injury severity in approach-turn collisions at T-junctions: Focusing on the effects of driver's failure to yield and junction control measures, Accident Analysis & Prevention, 40(2), 479-486.
Pearson R. And Whittington B. (2001). Motorcycle Riders Association Western Australia, Motorcycles and the Road environment Road Safety: Gearing Up for the Future. August, Perth, WA.
Pearson R. And Whittington B. (2001). Motorcycle Riders Association Western Australia, Motorcycles and the Road environment Road Safety: Gearing Up for the Future. August, Perth, WA.
Quddus, M.A., Noland, R.B. and Chin, H.C., ''An analysis of motorcyle injury and vehicle damage severity using Ordered Probit models'', Journal of Safety Research, 33(4), 2002, pp. 445-462.
RAS-L (1995): „Richtlinie für die Anlagen von Straßen - Linienführung“. Forschungsgemeinschaft für Straße und Verkehrswesen FGSV, Köln 1995.
RVS 13.01.15 (2006): „Bauliche Straßenerhaltung“. Österreichische. Forschungsgemeinschaft Straße – Schiene – Verkehr FSV, 2004
Santra (2007). National Technical University of Athens / Department of Transportation Planning and Engineering, Athens, Greece.
Savolainen, P. and Mannering F. (2007). Probabilistic models of motorcyclists’ injury severities in single- and multi-vehicle crashes, Accident Analysis and Prevention 39, 955–963.
Shankar V., Mannering F.L. and Barfield W. (1996). Statistical analysis of accident severity on rural freeways, Accident Analysis & Prevention 28(3), 391–401.
Shankar, V., Mannering, F. and Barfield, W. (1995). Effect of roadway geometrics and environmental factors on rural freeway accident frequencies. Accident Analysis & Prevention, 27, 371-389.
Spielhofer R. et al. (2008): „Straßenforschung – Entwicklung eines Parameters zur Beurteilung der Längsebenheit“. arsenal research, Wien 2008
Sporner (2006). Risiken beim Motorradfahren – Spezielle Einflussgrößen durch Straßenführung und Umfeld [Motor Cycle Accidents – Particular risks due to layout of roads and environment], Institut für Zweiradsicherheit, Forschungsheft Nr. 12, Tagungsband der 6. Internationalen Motorradkonferenz, Essen.
Ulleberg, P. (2003). Motorcykelsäkerhet - en litteraturstudie och meta-analys (Motorcycle safety- a literature review and meta-analysis). Oslo : Transportökonomisk institutt TÖI report 681, 2003 http://www.vv.se/filer/41498/motorcykelsakerhet.pdf.

2-BE-SAFE D2 Road infrastructure and road safety for PTW
Document ID: 2BES_WP1_D2_RIandRSforPTW_Final.doc 179
8. Annex (AIT, Microscopic Analysis)
8.1. Results of analyses based on the radii relations (See chapter 4.2.5.)
Table 141: Radii relation “good range”.
Road section
Radii relation
Road number
PTW accidents
Sum of accidents
Rate [%] from to
B20 1 2 50,00 80647 81060 B216 0 2 0,00 3454 3041 B20 0 2 0,00 121985 122398 B154 1 2 50,00 26864 27277 B24 1 1 100,00 6588 6175 B198 2 2 100,00 21277 21690 B216 0 2 0,00 4743 4355 B99 4 5 80,00 42443 42030 B72 0 1 0,00 61392 60979 B138 2 2 100,00 82119 82542 B56 0 1 0,00 49406 49819 sum 11 22 50,00 - -
100/
100
B50 1 3 33,33 123943 124722 B72 1 8 12,50 43762 42984 B37 1 9 11,11 30165 30944 B310 2 9 22,22 20397 21176 B171 1 27 3,70 104409 105188 B130 0 2 0,00 11056 10273 B119 0 0 0,00 39224 38445 B20 1 4 25,00 32439 33215 B126 1 2 50,00 31190 31969 B30 0 1 0,00 58838 58054 B130 0 1 0,00 10596 9813 sum 8 66 12,12 - -
200/
200
B119 0 0 0,00 42595 41453 B141 2 12 16,67 15704 16849 B119 0 0 0,00 41710 40577 B154 1 12 8,33 10979 12116 B50 3 13 23,08 98819 99959 B54 0 6 0,00 69214 68064 B31 1 3 33,33 25558 26694 B210 0 2 0,00 15830 14693 B54 1 5 20,00 90164 89017 B311 1 18 5,56 38722 39851 B198 1 3 33,33 63137 64283 B34 1 5 20,00 13357 14495 B310 2 19 10,53 20139 21271 sum 13 98 13,27 - -
300/
300

2-BE-SAFE D2 Road infrastructure and road safety for PTW
Document ID: 2BES_WP1_D2_RIandRSforPTW_Final.doc 180
Table 142: Radii relation “moderate range”.
Road section Radii
relation Road
number PTW
accidents Sum of
accidents Rate [%] from to
B193 3 4 75,00 27819 28333 B198 2 2 100,00 21251 21765 B20 1 4 25,00 121894 122405 B181 1 7 14,29 3047 3561 B138 1 4 25,00 49299 49813 B21 1 2 50,00 82795 83302 B158 0 5 0,00 9683 10197 B162 0 4 0,00 13637 14150 B56 1 1 100,00 40875 41408 B78 1 2 50,00 38147 38661 B145 0 3 0,00 85821 85307 B156 0 5 0,00 45619 46133 B95 1 3 33,33 90257 89748 B154 1 2 50,00 26739 27245 B24 1 1 100,00 6638 6124 B56 0 0 0,00 28679 29193 B38 1 3 33,33 140382 140896 B158 1 5 20,00 10073 10587 Sum 16 57 28,07 - -
100/
150
B50 0 0 0,00 123193 124002 B126 0 7 0,00 16757 17578 B50 1 2 50,00 123953 124764 B170 0 13 0,00 6557 7372 B130 0 1 0,00 10479 9664 B20 1 2 50,00 32505 33313 B1 0 6 0,00 2059 2870 B31 1 2 50,00 38581 39392 B30 0 0 0,00 58798 57982 B158 4 13 30,77 9903 10705 B37 1 10 10,00 30122 30933 B310 2 10 20,00 20243 21054 B119 1 2 50,00 47297 46492 B72 1 8 12,50 43802 42992 B38 0 0 0,00 84303 85114 B70 3 7 42,86 114656 113845 B20 1 4 25,00 98140 98955 B119 0 0 0,00 39224 38413 B61 0 1 0,00 8235 9048 Sum 16 88 18,18 - -
160/
250
B130 0 0 0,00 10549 9571 B310 2 17 11,76 20132 21104 B50 0 0 0,00 123140 124112 B54 0 6 0,00 69046 68059 B154 1 12 8,33 11119 12093 B70 0 12 0,00 33944 32969 B119 0 0 0,00 42654 41666
200/
300
B115 1 4 25,00 145257 144285

2-BE-SAFE D2 Road infrastructure and road safety for PTW
Document ID: 2BES_WP1_D2_RIandRSforPTW_Final.doc 181
B37 1 10 10,00 29991 30973 B119 0 0 0,00 39294 38320 B82 1 6 16,67 29266 30239 B31 1 2 50,00 38508 39482 B141 2 10 20,00 15767 16749 B41 0 1 0,00 32790 31765 B80 0 5 0,00 11637 12610 B119 0 0 0,00 41790 40820 B6 0 14 0,00 19908 20877 B50 1 3 33,33 123833 124807 B143 1 3 33,33 27476 28455 Sum 11 105 10,48 - -
Table 143: Radii relation “inappropriate range”.
Road section
Radii relation
Road number
PTW accidents
Sum of accidents
Rate [%] from to
B20 4 5 80,00 63609 64028 B70 0 0 0,00 64839 64415 B152 1 2 50,00 24999 24575 B64 3 6 50,00 35994 36418 B36 0 8 0,00 62815 63239 B72 1 1 100,00 49524 49100 B45 0 1 0,00 35836 36249 B72 1 5 20,00 48589 48163 B193 0 1 0,00 36501 36925 B86 0 0 0,00 2777 2353 B200 0 8 0,00 13429 13853 B20 1 1 100,00 53557 53982 B99 0 0 0,00 78847 78423 B69 0 1 0,00 3463 3039 B20 0 0 0,00 63747 64166 B56 0 0 0,00 3492 3916 B27 1 2 50,00 22988 22564 B171 1 4 25,00 157160 157588 B70 0 0 0,00 60265 59841 B182 1 6 16,67 28142 28566 Sum 14 51 27,45 - -
50/1
50
B21 1 2 50,00 82707 83312 B200 0 3 0,00 23740 24353 B158 2 10 20,00 10053 10656 B56 0 0 0,00 28649 29261 B20 0 4 0,00 121506 122118 B69 1 1 100,00 17111 16504 B70 1 1 100,00 111748 111136 B38 2 4 50,00 24822 25438 B145 0 3 0,00 85841 85229 B1 0 5 0,00 2139 2751 B78 2 3 66,67 38089 38701
100/
200
B40 0 5 0,00 30231 29615

2-BE-SAFE D2 Road infrastructure and road safety for PTW
Document ID: 2BES_WP1_D2_RIandRSforPTW_Final.doc 182
B119 0 1 0,00 60071 59459 B193 8 9 88,89 27739 28351 B69 3 5 60,00 14151 13537 B30 1 2 50,00 74745 74133 B166 0 3 0,00 32946 33558 B20 0 0 0,00 32655 33264 B30 0 0 0,00 58758 58141 B188 0 3 0,00 2079 2691 Sum 21 64 32,81 - -
B40 0 5 0,00 30435 29625 B215 1 1 100,00 11041 10232 B40 0 5 0,00 30906 30100 B200 0 7 0,00 28517 29323 B21 1 2 50,00 82543 83342 B122 0 29 0,00 29016 28201 B215 0 2 0,00 9164 8357 B38 3 5 60,00 24668 25478 B126 0 7 0,00 16767 17583 B1 0 6 0,00 2089 2895
B200 2 7 28,57 23646 24453 B11 0 23 0,00 12121 12924 B188 0 6 0,00 1405 2211 B50 1 6 16,67 125799 126610 B36 0 2 0,00 42704 43512 B136 0 1 0,00 22099 22905 B132 0 0 0,00 4520 5330 B197 2 11 18,18 2566 3393 B30 1 5 20,00 75373 74569 B120 0 12 0,00 17316 16505 Sum 11 142 7,75 - -
100/
300

2-BE-SAFE D2 Road infrastructure and road safety for PTW
Document ID: 2BES_WP1_D2_RIandRSforPTW_Final.doc 183
8.2. Radii tulips of all road sections (PTW accidents) in both driving directions (See chapter 4.2.6.)
Figure 93: Radii tulip of road section B20 “Türnitz – Annaberg” – PTW accidents.

2-BE-SAFE D2 Road infrastructure and road safety for PTW
Document ID: 2BES_WP1_D2_RIandRSforPTW_Final.doc 184
Figure 94: Radii tulip of road section B20 “Reith – Mitterbach a. Erlaufsee” – PTW accidents.

2-BE-SAFE D2 Road infrastructure and road safety for PTW
Document ID: 2BES_WP1_D2_RIandRSforPTW_Final.doc 185
Figure 95: Radii tulip of road section B27 – PTW accidents.

2-BE-SAFE D2 Road infrastructure and road safety for PTW
Document ID: 2BES_WP1_D2_RIandRSforPTW_Final.doc 186
Figure 96: Radii tulip of road section B72 – PTW accidents.

2-BE-SAFE D2 Road infrastructure and road safety for PTW
Document ID: 2BES_WP1_D2_RIandRSforPTW_Final.doc 187
Figure 97: Radii tulip of road section B95 – PTW accidents.

2-BE-SAFE D2 Road infrastructure and road safety for PTW
Document ID: 2BES_WP1_D2_RIandRSforPTW_Final.doc 188
Figure 98: Radii tulip of road section B127 – PTW accidents.

2-BE-SAFE D2 Road infrastructure and road safety for PTW
Document ID: 2BES_WP1_D2_RIandRSforPTW_Final.doc 189
Figure 99: Radii tulip of road section B164 – PTW accidents.

2-BE-SAFE D2 Road infrastructure and road safety for PTW
Document ID: 2BES_WP1_D2_RIandRSforPTW_Final.doc 190
8.3. Radii tulips of all road sections (all other accidents) in both directions (See chapter 4.2.6.)
Figure 100: Radii tulip of road section B20 “Türnitz – Annaberg” – all other accidents.

2-BE-SAFE D2 Road infrastructure and road safety for PTW
Document ID: 2BES_WP1_D2_RIandRSforPTW_Final.doc 191
Figure 101: Radii tulip of road section B20 “Reith – Mitterbach a. Erlaufsee” – all other accidents.
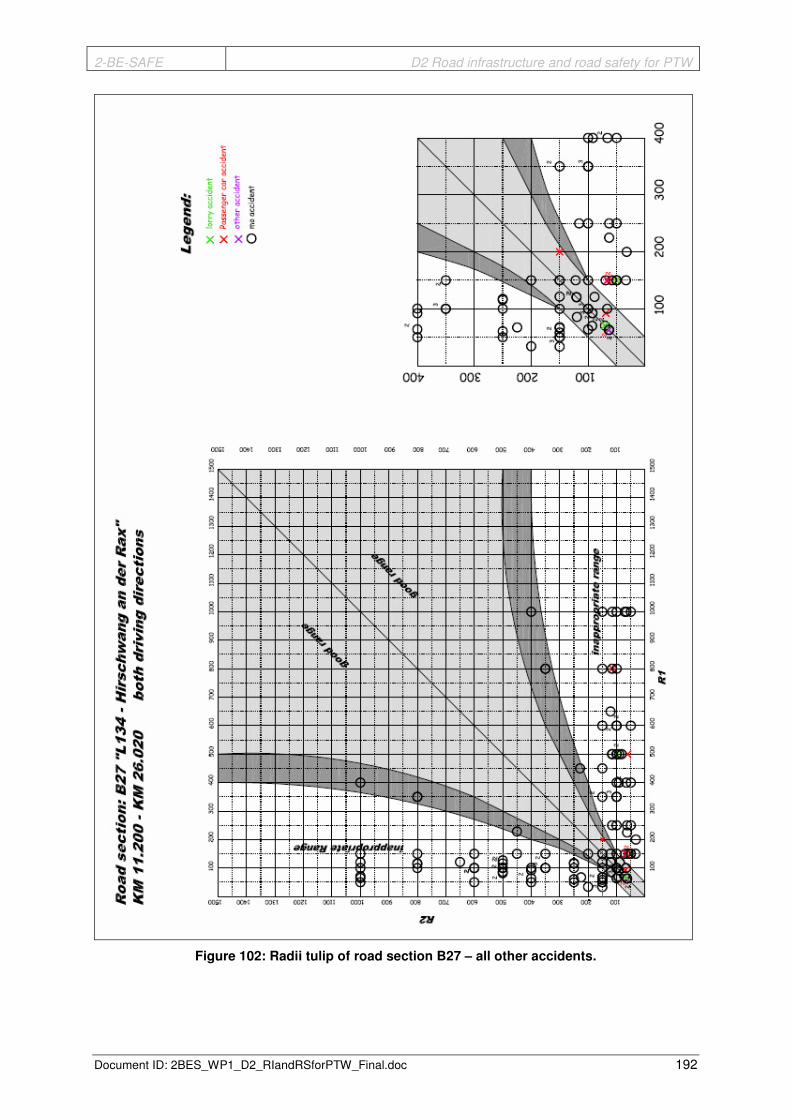
2-BE-SAFE D2 Road infrastructure and road safety for PTW
Document ID: 2BES_WP1_D2_RIandRSforPTW_Final.doc 192
Figure 102: Radii tulip of road section B27 – all other accidents.
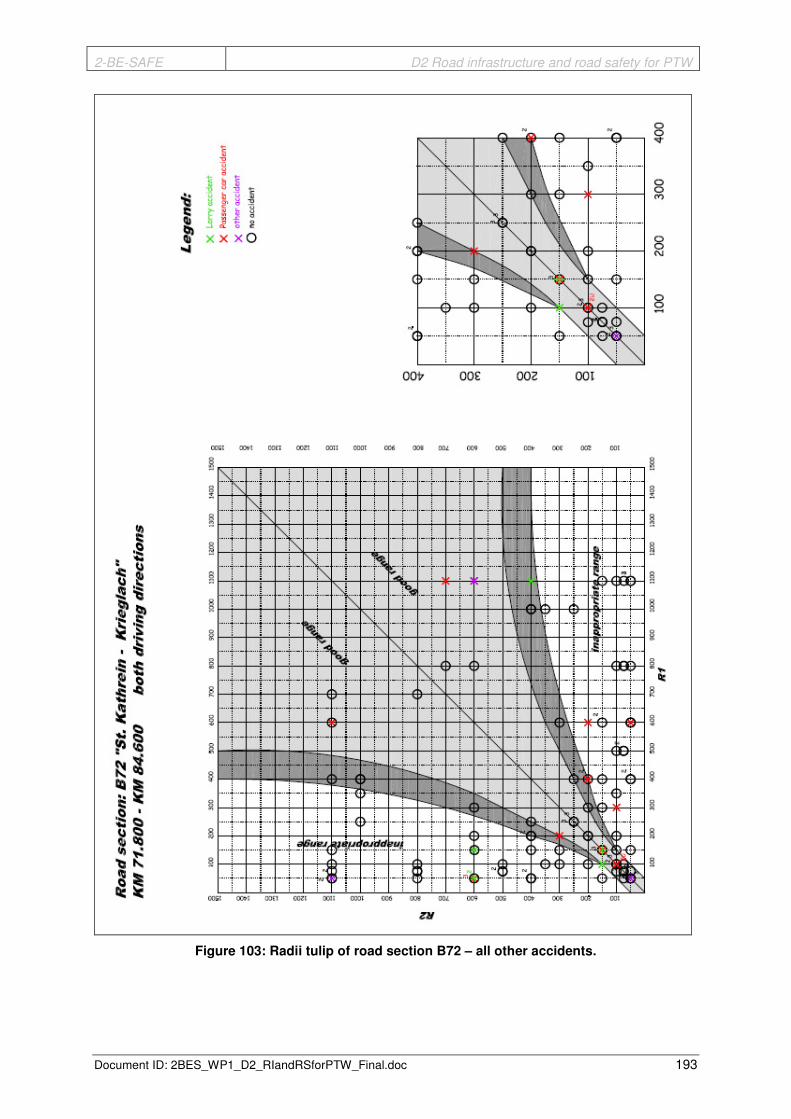
2-BE-SAFE D2 Road infrastructure and road safety for PTW
Document ID: 2BES_WP1_D2_RIandRSforPTW_Final.doc 193
Figure 103: Radii tulip of road section B72 – all other accidents.

2-BE-SAFE D2 Road infrastructure and road safety for PTW
Document ID: 2BES_WP1_D2_RIandRSforPTW_Final.doc 194
Figure 104: Radii tulip of road section B95 – all other accidents.

2-BE-SAFE D2 Road infrastructure and road safety for PTW
Document ID: 2BES_WP1_D2_RIandRSforPTW_Final.doc 195
Figure 105: Radii tulip of road section B127 – all other accidents.
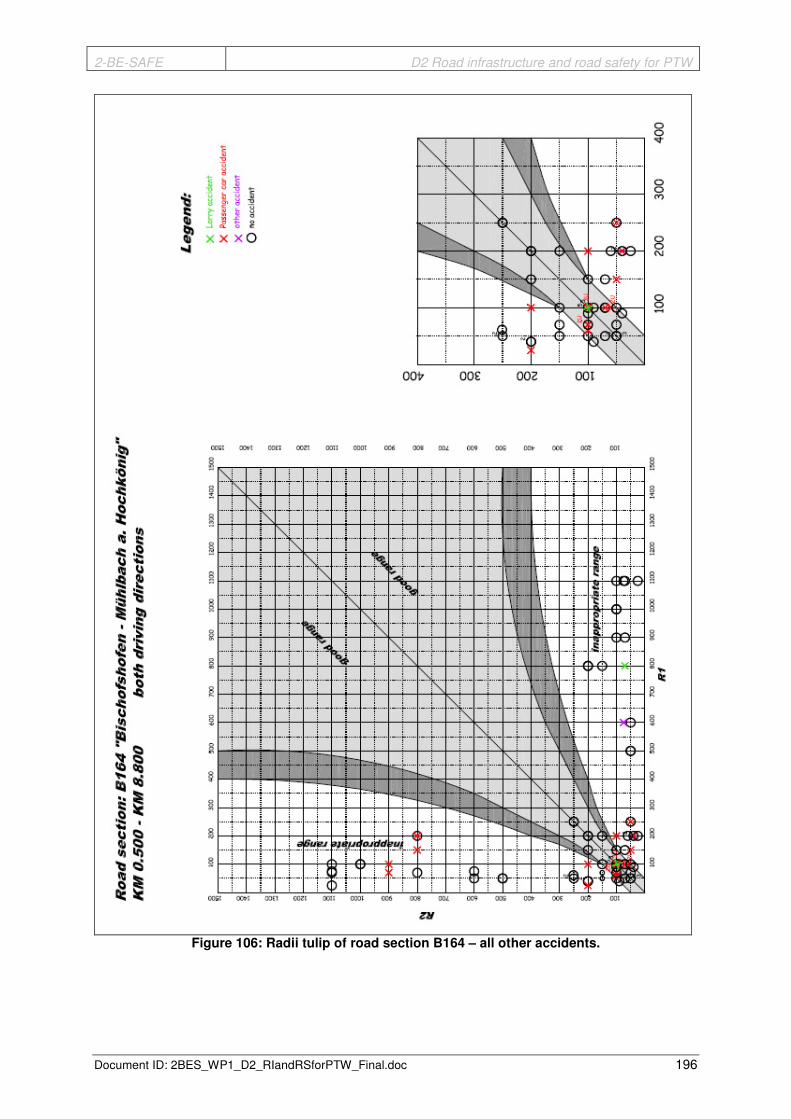
2-BE-SAFE D2 Road infrastructure and road safety for PTW
Document ID: 2BES_WP1_D2_RIandRSforPTW_Final.doc 196
Figure 106: Radii tulip of road section B164 – all other accidents.