Inter-comparison of Operational Wave Forecasting …. 10th...10th int. workshop on wave hindcasting...
34
10th int. workshop on wave hindcasting and forecasting Slide 1 Inter-comparison of Operational Wave Forecasting Systems Jean-Raymond Bidlot , European Centre for Medium range Weather Forecasts (ECMWF), Jian-Guo Li , the Met Office, UK, (MO), Paul Wittmann , Fleet Numerical Meteorology and Oceanography Centre, USA, (FNMOC), Manon Fauchon , Meteorological Service of Canada, Canada, (MSC), Hsuan Chen , National Centers for Environmental Prediction, USA, (NCEP), Jean–Michel Lefèvre , Météo France, France, (MF), Thomas Bruns , Deutscher Wetterdienst, Germany, (DWD), Diana Greenslade , Bureau of Meteorology, Australia, (BoM), Fabrice Ardhuin , Service Hydrographique et Océanographique de la Marine, France, (SHOM) Nadao Kohno , Japan Meteorological Agency, Japan, (JMA), Sanwook Park , Korea Meteorological Administration, Republic of Korea, (KMA), Marta Gomez , Puertos del Estado, Spain (PRTOS).
Transcript of Inter-comparison of Operational Wave Forecasting …. 10th...10th int. workshop on wave hindcasting...
10th int. workshop on wave hindcasting and forecasting Slide 1
Inter-comparison of
Operational Wave Forecasting Systems
Jean-Raymond Bidlot, European Centre for Medium range Weather Forecasts (ECMWF),Jian-Guo Li, the Met Office, UK, (MO),
Paul Wittmann, Fleet Numerical Meteorology and Oceanography Centre, USA, (FNMOC),Manon Fauchon, Meteorological Service of Canada, Canada, (MSC),
Hsuan Chen, National Centers for Environmental Prediction, USA, (NCEP),Jean–Michel Lefèvre, Météo France, France, (MF),
Thomas Bruns, Deutscher Wetterdienst, Germany, (DWD),Diana Greenslade, Bureau of Meteorology, Australia, (BoM),
Fabrice Ardhuin, Service Hydrographique et Océanographique de la Marine, France, (SHOM)Nadao Kohno, Japan Meteorological Agency, Japan, (JMA),
Sanwook Park, Korea Meteorological Administration, Republic of Korea, (KMA),Marta Gomez, Puertos del Estado, Spain (PRTOS).
10th int. workshop on wave hindcasting and forecasting Slide 2
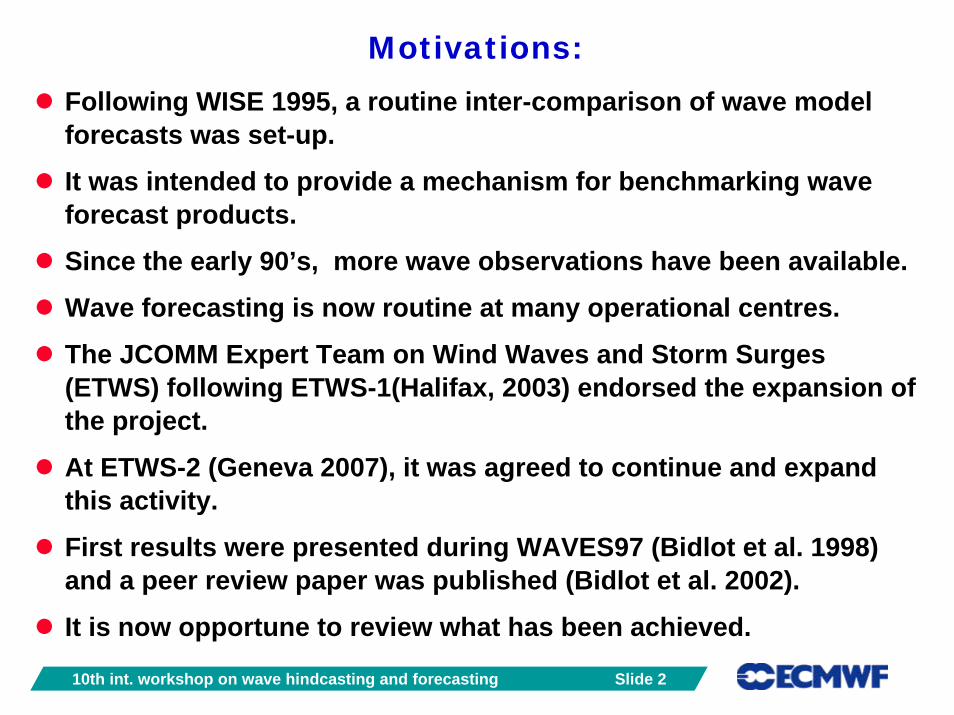
Motivations:Following WISE 1995, a routine inter-comparison of wave model forecasts was set-up.
It was intended to provide a mechanism for benchmarking wave forecast products.
Since the early 90’s, more wave observations have been available.
Wave forecasting is now routine at many operational centres.
The JCOMM Expert Team on Wind Waves and Storm Surges (ETWS) following ETWS-1(Halifax, 2003) endorsed the expansion of the project.
At ETWS-2 (Geneva 2007), it was agreed to continue and expand this activity.
First results were presented during WAVES97 (Bidlot et al. 1998) and a peer review paper was published (Bidlot et al. 2002).
It is now opportune to review what has been achieved.
10th int. workshop on wave hindcasting and forecasting Slide 3
Methodology:
Each month, model data (analysis and forecasts) are exchanged for a set of prescribed locations where wave and wind observations are made.A simple ASCII format is used.The data sets are combined at ECMWF and quality controlled in-situ observations of wind speed and direction, wave height and wave period are added to the data set.The combined data sets are made available to all participants.Summary plots and tables are also produced at ECMWF.A technical report is available at:http://www.wmo.ch/pages/prog/amp/mmop/documents/Jcomm-TR/J-TR-30/J-TR-30.pdf
10th int. workshop on wave hindcasting and forecasting Slide 4
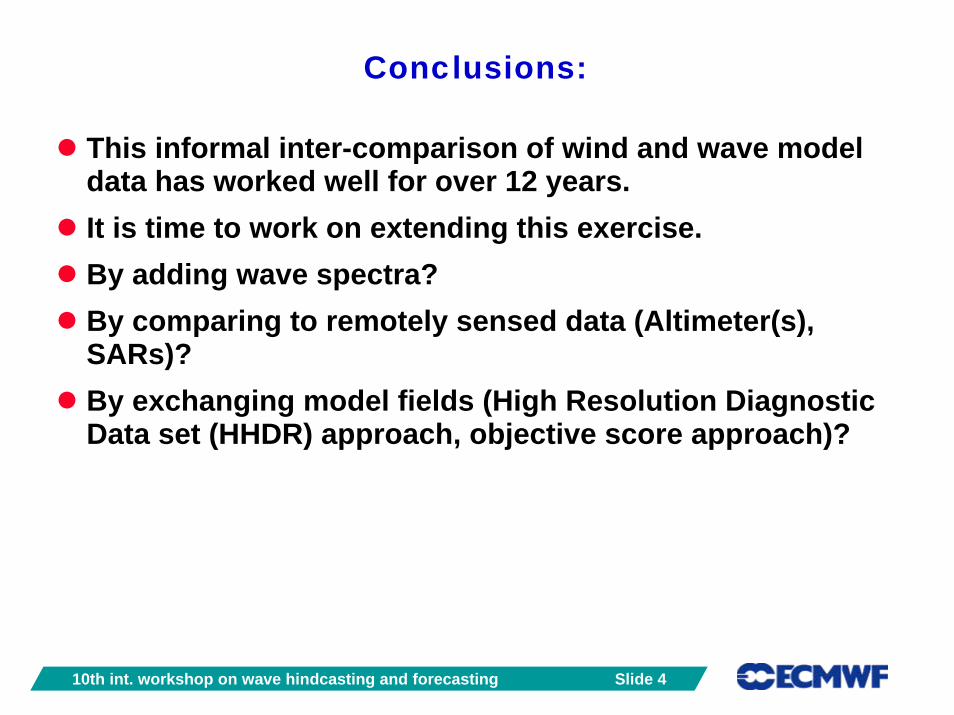
Conclusions:
This informal inter-comparison of wind and wave model data has worked well for over 12 years.It is time to work on extending this exercise.By adding wave spectra?By comparing to remotely sensed data (Altimeter(s), SARs)?By exchanging model fields (High Resolution Diagnostic Data set (HHDR) approach, objective score approach)?
10th int. workshop on wave hindcasting and forecasting Slide 5
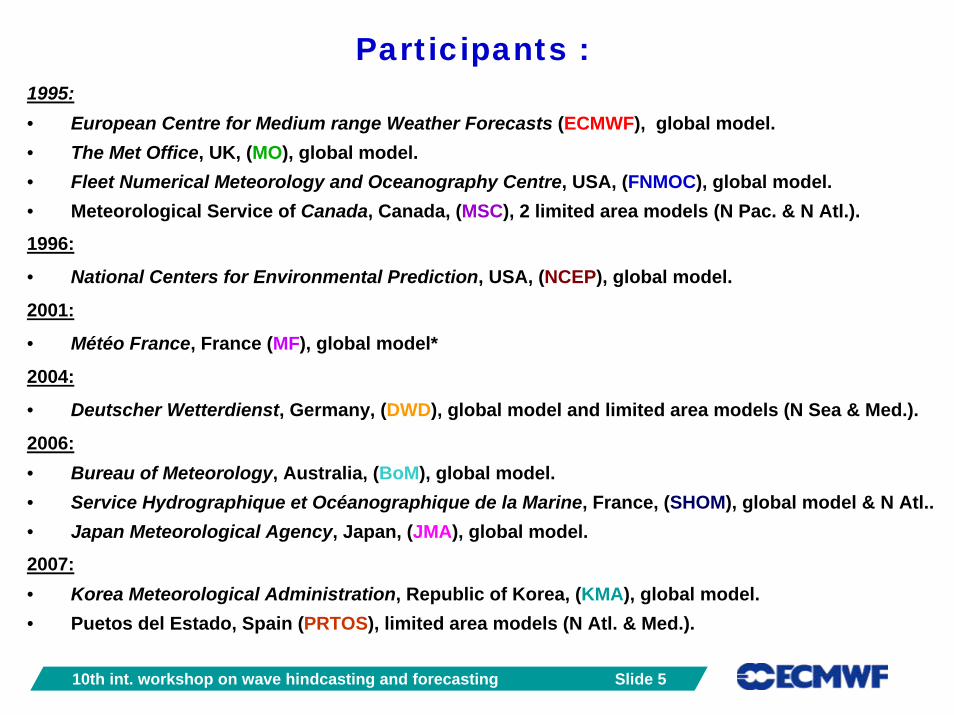
Participants :1995:• European Centre for Medium range Weather Forecasts (ECMWF), global model.• The Met Office, UK, (MO), global model.• Fleet Numerical Meteorology and Oceanography Centre, USA, (FNMOC), global model.• Meteorological Service of Canada, Canada, (MSC), 2 limited area models (N Pac. & N Atl.).
1996:
• National Centers for Environmental Prediction, USA, (NCEP), global model.
2001:
• Météo France, France (MF), global model*
2004:
• Deutscher Wetterdienst, Germany, (DWD), global model and limited area models (N Sea & Med.).
2006:• Bureau of Meteorology, Australia, (BoM), global model.• Service Hydrographique et Océanographique de la Marine, France, (SHOM), global model & N Atl..• Japan Meteorological Agency, Japan, (JMA), global model.
2007:• Korea Meteorological Administration, Republic of Korea, (KMA), global model.• Puetos del Estado, Spain (PRTOS), limited area models (N Atl. & Med.).
10th int. workshop on wave hindcasting and forecasting Slide 6
40°S 40°S
30°S30°S
20°S 20°S
10°S10°S
0° 0°
10°N10°N
20°N 20°N
30°N30°N
40°N 40°N
50°N50°N
60°N 60°N
70°N70°N
20°W
20°W 0°
0° 20°E
20°E 40°E
40°E 60°E
60°E 80°E
80°E 100°E
100°E 120°E
120°E 140°E
140°E 160°E
160°E 180°
180° 160°W
160°W 140°W
140°W 120°W
120°W 100°W
100°W 80°W
80°W 60°W
60°W
1996
40°S 40°S
30°S30°S
20°S 20°S
10°S10°S
0° 0°
10°N10°N
20°N 20°N
30°N30°N
40°N 40°N
50°N50°N
60°N 60°N
70°N70°N
20°W
20°W 0°
0° 20°E
20°E 40°E
40°E 60°E
60°E 80°E
80°E 100°E
100°E 120°E
120°E 140°E
140°E 160°E
160°E 180°
180° 160°W
160°W 140°W
140°W 120°W
120°W 100°W
100°W 80°W
80°W 60°W
60°W
2002
40°S 40°S
30°S30°S
20°S 20°S
10°S10°S
0° 0°
10°N10°N
20°N 20°N
30°N30°N
40°N 40°N
50°N50°N
60°N 60°N
70°N70°N
20°W
20°W 0°
0° 20°E
20°E 40°E
40°E 60°E
60°E 80°E
80°E 100°E
100°E 120°E
120°E 140°E
140°E 160°E
160°E 180°
180° 160°W
160°W 140°W
140°W 120°W
120°W 100°W
100°W 80°W
80°W 60°W
60°W
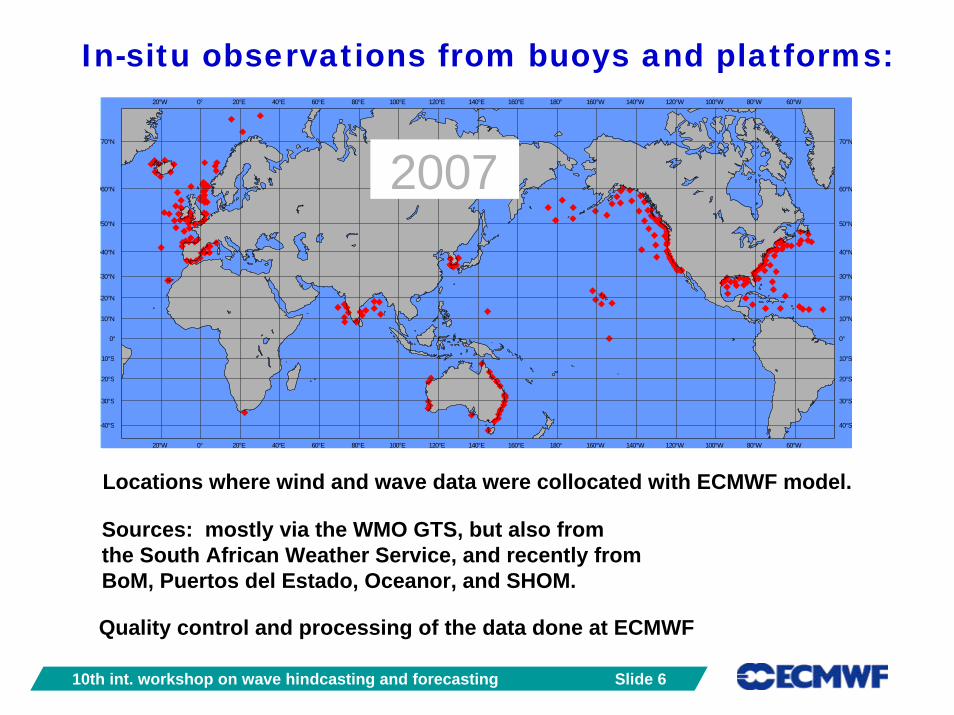
2007
In-situ observations from buoys and platforms:
Locations where wind and wave data were collocated with ECMWF model.
Quality control and processing of the data done at ECMWF
Sources: mostly via the WMO GTS, but also fromthe South African Weather Service, and recently fromBoM, Puertos del Estado, Oceanor, and SHOM.
10th int. workshop on wave hindcasting and forecasting Slide 7
70°S70°S
60°S 60°S
50°S50°S
40°S 40°S
30°S30°S
20°S 20°S
10°S10°S
0° 0°
10°N10°N
20°N 20°N
30°N30°N
40°N 40°N
50°N50°N
60°N 60°N
70°N70°N
160°W
160°W 140°W
140°W 120°W
120°W 100°W
100°W 80°W
80°W 60°W
60°W 40°W
40°W 20°W
20°W 0°
0° 20°E
20°E 40°E
40°E 60°E
60°E 80°E
80°E 100°E
100°E 120°E
120°E 140°E
140°E 160°E
160°E
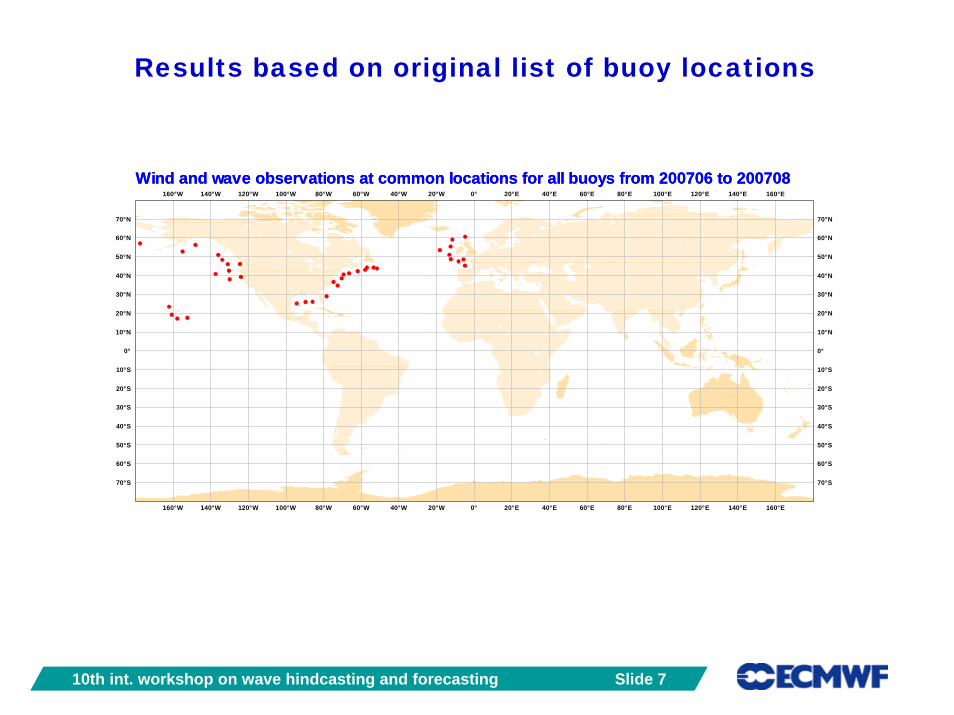
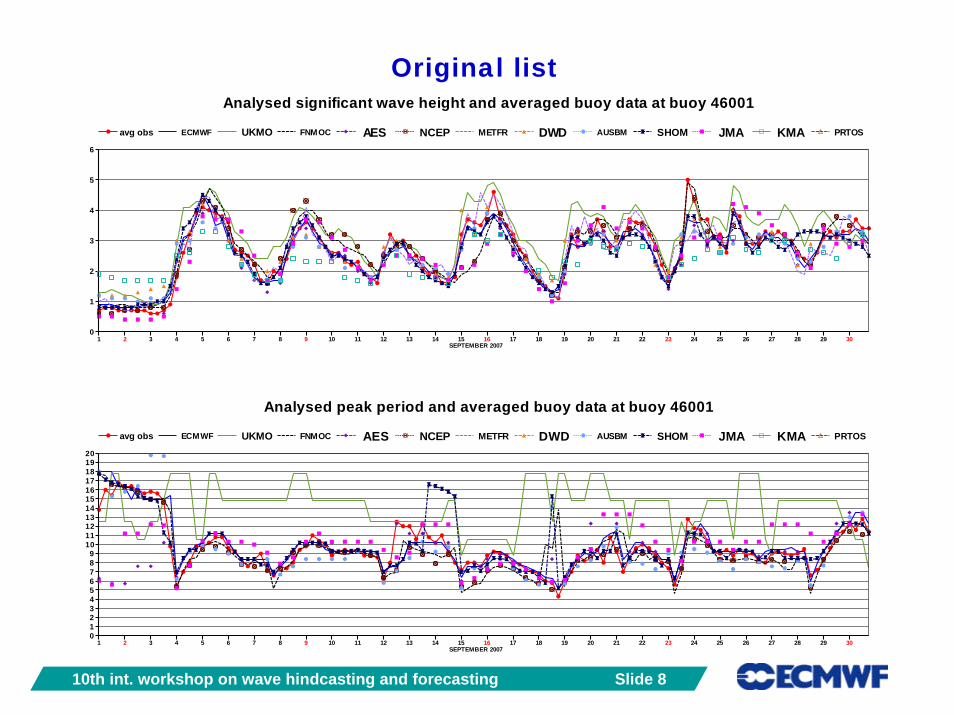
Wind and wave observations at common locations for all buoys from 200706 to 200708Wind and wave observations at common locations for all buoys from 200706 to 200708
Results based on original list of buoy locations
10th int. workshop on wave hindcasting and forecasting Slide 8
Original list
1SEPTEMBER 2007
2 3 4 5 6 7 8 9 10 11 12 13 14 15 16 17 18 19 20 21 22 23 24 25 26 27 28 29 300
1
2
3
4
5
6
Analysed significant wave height and averaged buoy data at buoy 46001
avg obs ECMWF UKMO FNMOC AES NCEP METFR DWD AUSBM SHOM JMA KMA PRTOS
1SEPTEMBER 2007
2 3 4 5 6 7 8 9 10 11 12 13 14 15 16 17 18 19 20 21 22 23 24 25 26 27 28 29 300123456789
1011121314151617181920
Analysed peak period and averaged buoy data at buoy 46001
avg obs ECMWF UKMO FNMOC AES NCEP METFR DWD AUSBM SHOM JMA KMA PRTOS
10th int. workshop on wave hindcasting and forecasting Slide 9
0 1 2 3 4 5common data only, fc from 0 and 12Z for 0706 to 0708
04.89.6
14.419.2
2428.833.638.443.2
48
S.I.
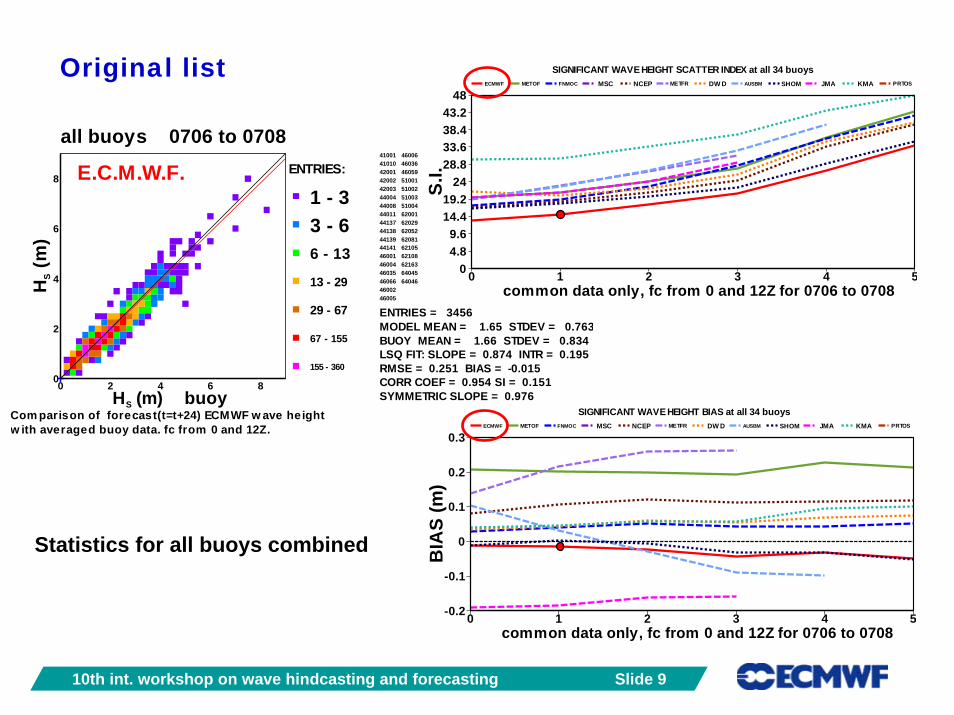
SIGNIFICANT WAVE HEIGHT SCATTER INDEX at all 34 buoysECMWF METOF FNMOC MSC NCEP METFR DW D AUSBM SHOM JMA KMA PRTOS
0 1 2 3 4 5common data only, fc from 0 and 12Z for 0706 to 0708
-0.2
-0.1
0
0.1
0.2
0.3B
IAS
(m)
SIGNIFICANT WAVE HEIGHT BIAS at all 34 buoysECMWF METOF FNMOC MSC NCEP METFR DW D AUSBM SHOM JMA KMA PRTOS
all buoys 0706 to 0708
0 2 4 6 8HS (m) buoy
0
2
4
6
8
HS (
m)
E.C.M.W.F.
w ith averaged buoy data. fc from 0 and 12Z.Com parison of forecast(t=t+24) ECMWF w ave height
ENTRIES:
1 - 33 - 66 - 13
13 - 29
29 - 67
67 - 155
155 - 360
410014101042001420024200344004440084401144137441384413944141460014600446035460664600246005
46006460364605951001510025100351004620016202962052620816210562108621636404564046
SYMMETRIC SLOPE = 0.976CORR COEF = 0.954 SI = 0.151RMSE = 0.251 BIAS = -0.015LSQ FIT: SLOPE = 0.874 INTR = 0.195BUOY MEAN = 1.66 STDEV = 0.834MODEL MEAN = 1.65 STDEV = 0.763ENTRIES = 3456
Original list
Statistics for all buoys combined
10th int. workshop on wave hindcasting and forecasting Slide 10
0 1 2 3 4 5common data only, fc from 0 and 12Z for 0706 to 0708
04.89.6
14.419.2
2428.833.638.443.2
48
S.I.
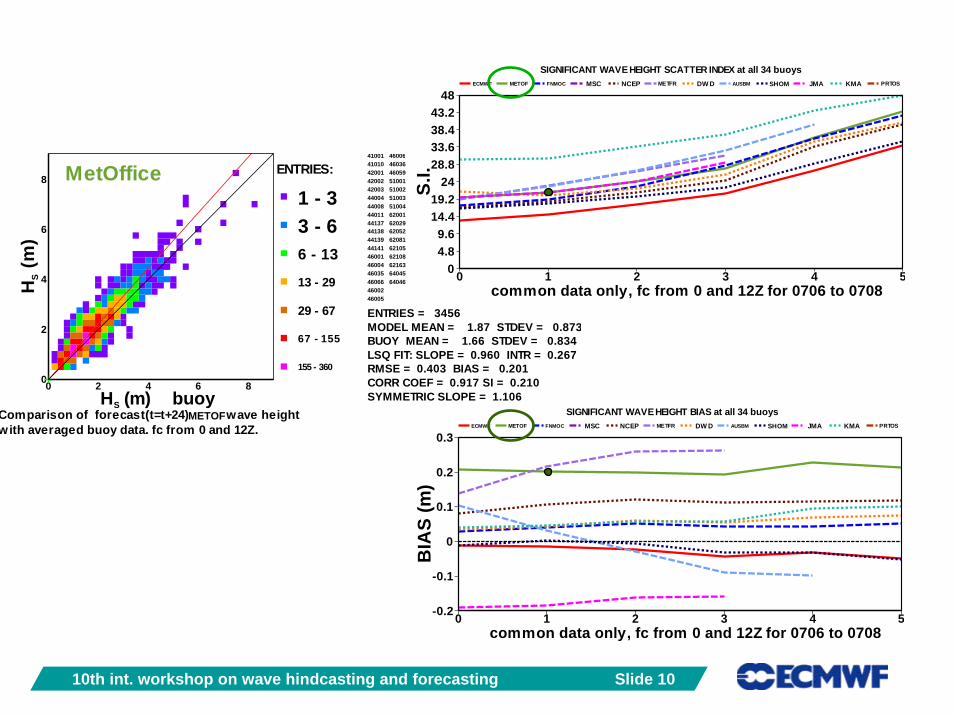
SIGNIFICANT WAVE HEIGHT SCATTER INDEX at all 34 buoysECMWF METOF FNMOC MSC NCEP METFR DW D AUSBM SHOM JMA KMA PRTOS
0 1 2 3 4 5common data only, fc from 0 and 12Z for 0706 to 0708
-0.2
-0.1
0
0.1
0.2
0.3B
IAS
(m)
SIGNIFICANT WAVE HEIGHT BIAS at all 34 buoysECMWF METOF FNMOC MSC NCEP METFR DW D AUSBM SHOM JMA KMA PRTOS
0 2 4 6 8HS (m) buoy
0
2
4
6
8
HS (m
)
MetOffice
with averaged buoy data. fc from 0 and 12Z.Comparison of forecast(t=t+24) NCEP wave height
ENTRIES:
1 - 33 - 66 - 13
13 - 29
29 - 67
67 - 155
155 - 360
410014101042001420024200344004440084401144137441384413944141460014600446035460664600246005
46006460364605951001510025100351004620016202962052620816210562108621636404564046
SYMMETRIC SLOPE = 1.106CORR COEF = 0.917 SI = 0.210RMSE = 0.403 BIAS = 0.201LSQ FIT: SLOPE = 0.960 INTR = 0.267BUOY MEAN = 1.66 STDEV = 0.834MODEL MEAN = 1.87 STDEV = 0.873ENTRIES = 3456
METOF
10th int. workshop on wave hindcasting and forecasting Slide 11
0 2 4 6 8HS (m) buoy
0
2
4
6
8
HS (m
)
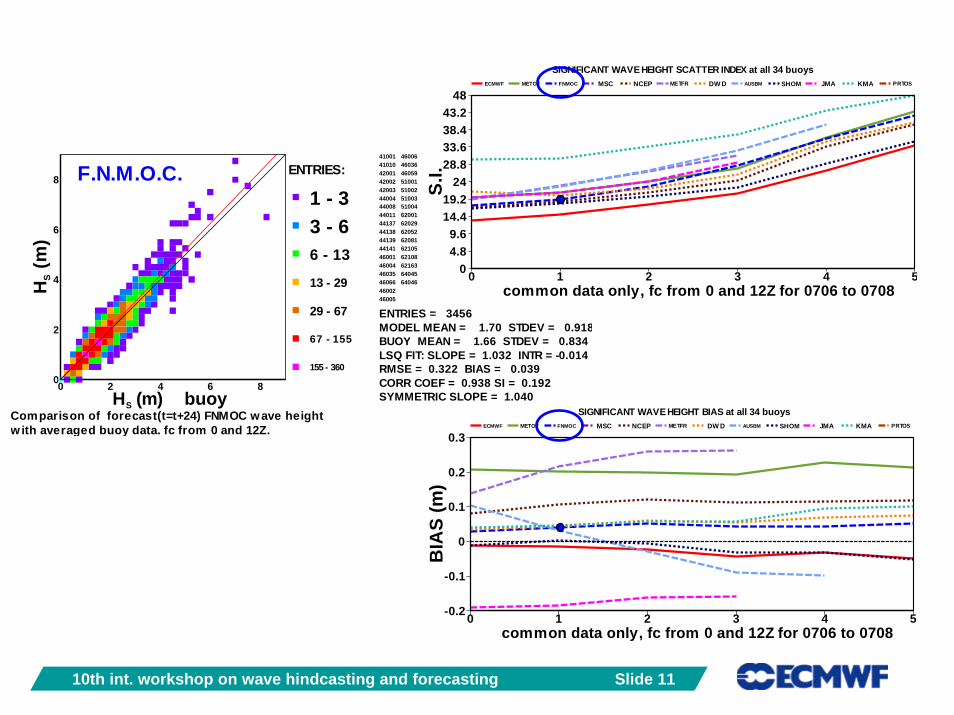
F.N.M.O.C.
w ith averaged buoy data. fc from 0 and 12Z.Comparison of forecast(t=t+24) FNMOC w ave height
ENTRIES:
1 - 33 - 66 - 13
13 - 29
29 - 67
67 - 155
155 - 360
410014101042001420024200344004440084401144137441384413944141460014600446035460664600246005
46006460364605951001510025100351004620016202962052620816210562108621636404564046
SYMMETRIC SLOPE = 1.040CORR COEF = 0.938 SI = 0.192RMSE = 0.322 BIAS = 0.039LSQ FIT: SLOPE = 1.032 INTR = -0.014BUOY MEAN = 1.66 STDEV = 0.834MODEL MEAN = 1.70 STDEV = 0.918ENTRIES = 3456
0 1 2 3 4 5common data only, fc from 0 and 12Z for 0706 to 0708
04.89.6
14.419.2
2428.833.638.443.2
48
S.I.
SIGNIFICANT WAVE HEIGHT SCATTER INDEX at all 34 buoysECMWF METOF FNMOC MSC NCEP METFR DW D AUSBM SHOM JMA KMA PRTOS
0 1 2 3 4 5common data only, fc from 0 and 12Z for 0706 to 0708
-0.2
-0.1
0
0.1
0.2
0.3B
IAS
(m)
SIGNIFICANT WAVE HEIGHT BIAS at all 34 buoysECMWF METOF FNMOC MSC NCEP METFR DW D AUSBM SHOM JMA KMA PRTOS
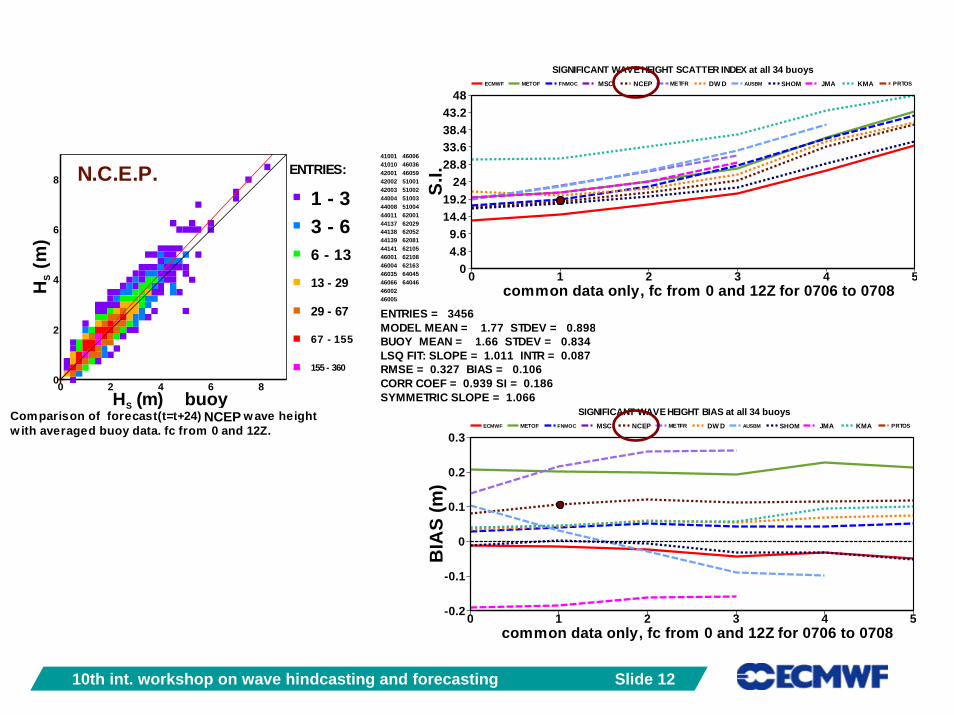
10th int. workshop on wave hindcasting and forecasting Slide 12
0 1 2 3 4 5common data only, fc from 0 and 12Z for 0706 to 0708
04.89.6
14.419.2
2428.833.638.443.2
48
S.I.
SIGNIFICANT WAVE HEIGHT SCATTER INDEX at all 34 buoysECMWF METOF FNMOC MSC NCEP METFR DW D AUSBM SHOM JMA KMA PRTOS
0 1 2 3 4 5common data only, fc from 0 and 12Z for 0706 to 0708
-0.2
-0.1
0
0.1
0.2
0.3B
IAS
(m)
SIGNIFICANT WAVE HEIGHT BIAS at all 34 buoysECMWF METOF FNMOC MSC NCEP METFR DW D AUSBM SHOM JMA KMA PRTOS
0 2 4 6 8HS (m) buoy
0
2
4
6
8
HS (m
)
N.C.E.P.
w ith averaged buoy data. fc from 0 and 12Z.Comparison of forecast(t=t+24) UKMO w ave height
ENTRIES:
1 - 33 - 66 - 13
13 - 29
29 - 67
67 - 155
155 - 360
410014101042001420024200344004440084401144137441384413944141460014600446035460664600246005
46006460364605951001510025100351004620016202962052620816210562108621636404564046
SYMMETRIC SLOPE = 1.066CORR COEF = 0.939 SI = 0.186RMSE = 0.327 BIAS = 0.106LSQ FIT: SLOPE = 1.011 INTR = 0.087BUOY MEAN = 1.66 STDEV = 0.834MODEL MEAN = 1.77 STDEV = 0.898ENTRIES = 3456
NCEP
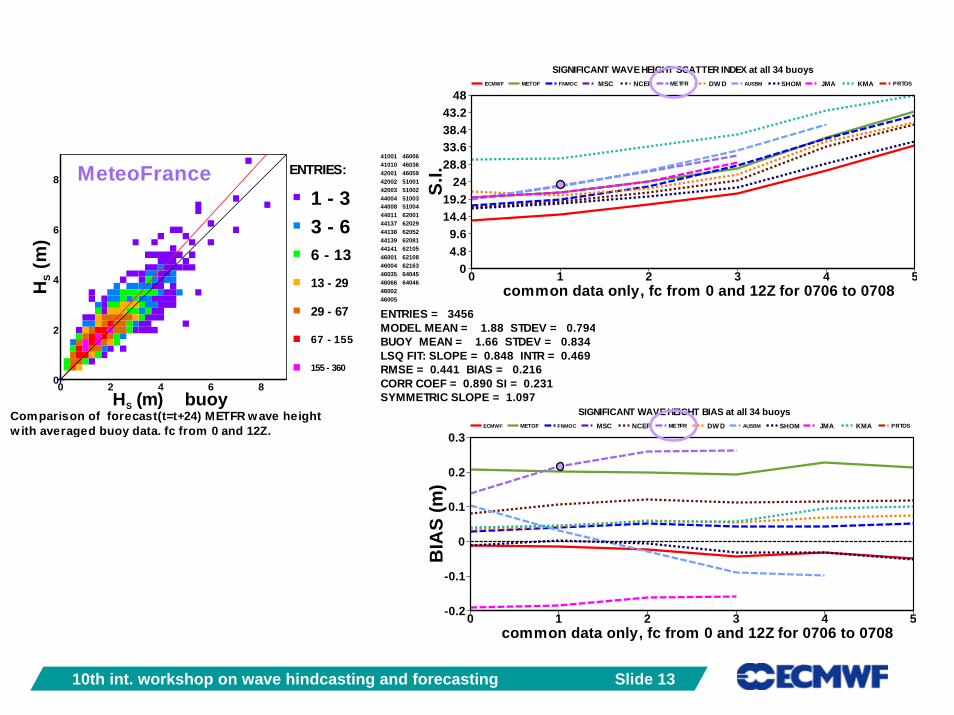
10th int. workshop on wave hindcasting and forecasting Slide 13
0 2 4 6 8HS (m) buoy
0
2
4
6
8
HS (m
)
MeteoFrance
w ith averaged buoy data. fc from 0 and 12Z.Comparison of forecast(t=t+24) METFR w ave height
ENTRIES:
1 - 33 - 66 - 13
13 - 29
29 - 67
67 - 155
155 - 360
410014101042001420024200344004440084401144137441384413944141460014600446035460664600246005
46006460364605951001510025100351004620016202962052620816210562108621636404564046
SYMMETRIC SLOPE = 1.097CORR COEF = 0.890 SI = 0.231RMSE = 0.441 BIAS = 0.216LSQ FIT: SLOPE = 0.848 INTR = 0.469BUOY MEAN = 1.66 STDEV = 0.834MODEL MEAN = 1.88 STDEV = 0.794ENTRIES = 3456
0 1 2 3 4 5common data only, fc from 0 and 12Z for 0706 to 0708
04.89.6
14.419.2
2428.833.638.443.2
48
S.I.
SIGNIFICANT WAVE HEIGHT SCATTER INDEX at all 34 buoysECMWF METOF FNMOC MSC NCEP METFR DW D AUSBM SHOM JMA KMA PRTOS
0 1 2 3 4 5common data only, fc from 0 and 12Z for 0706 to 0708
-0.2
-0.1
0
0.1
0.2
0.3B
IAS
(m)
SIGNIFICANT WAVE HEIGHT BIAS at all 34 buoysECMWF METOF FNMOC MSC NCEP METFR DW D AUSBM SHOM JMA KMA PRTOS
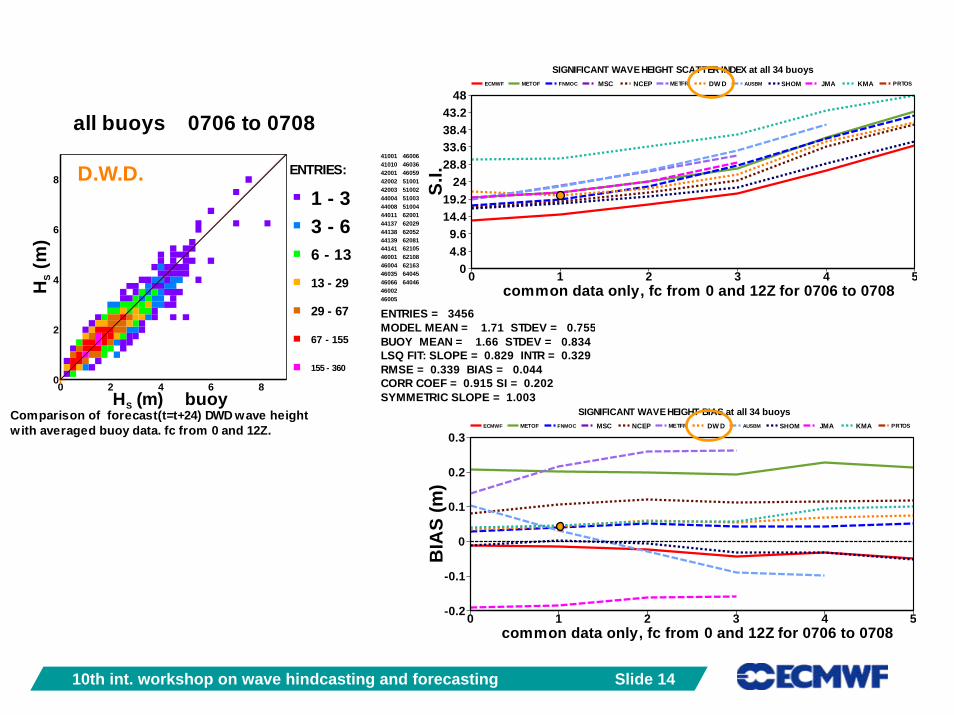
10th int. workshop on wave hindcasting and forecasting Slide 14
all buoys 0706 to 0708
0 2 4 6 8HS (m) buoy
0
2
4
6
8
HS (
m)
D.W.D.
with averaged buoy data. fc from 0 and 12Z.Comparison of forecast(t=t+24) DWD wave height
ENTRIES:
1 - 33 - 66 - 13
13 - 29
29 - 67
67 - 155
155 - 360
410014101042001420024200344004440084401144137441384413944141460014600446035460664600246005
46006460364605951001510025100351004620016202962052620816210562108621636404564046
SYMMETRIC SLOPE = 1.003CORR COEF = 0.915 SI = 0.202RMSE = 0.339 BIAS = 0.044LSQ FIT: SLOPE = 0.829 INTR = 0.329BUOY MEAN = 1.66 STDEV = 0.834MODEL MEAN = 1.71 STDEV = 0.755ENTRIES = 3456
0 1 2 3 4 5common data only, fc from 0 and 12Z for 0706 to 0708
04.89.6
14.419.2
2428.833.638.443.2
48
S.I.
SIGNIFICANT WAVE HEIGHT SCATTER INDEX at all 34 buoysECMWF METOF FNMOC MSC NCEP METFR DW D AUSBM SHOM JMA KMA PRTOS
0 1 2 3 4 5common data only, fc from 0 and 12Z for 0706 to 0708
-0.2
-0.1
0
0.1
0.2
0.3B
IAS
(m)
SIGNIFICANT WAVE HEIGHT BIAS at all 34 buoysECMWF METOF FNMOC MSC NCEP METFR DW D AUSBM SHOM JMA KMA PRTOS
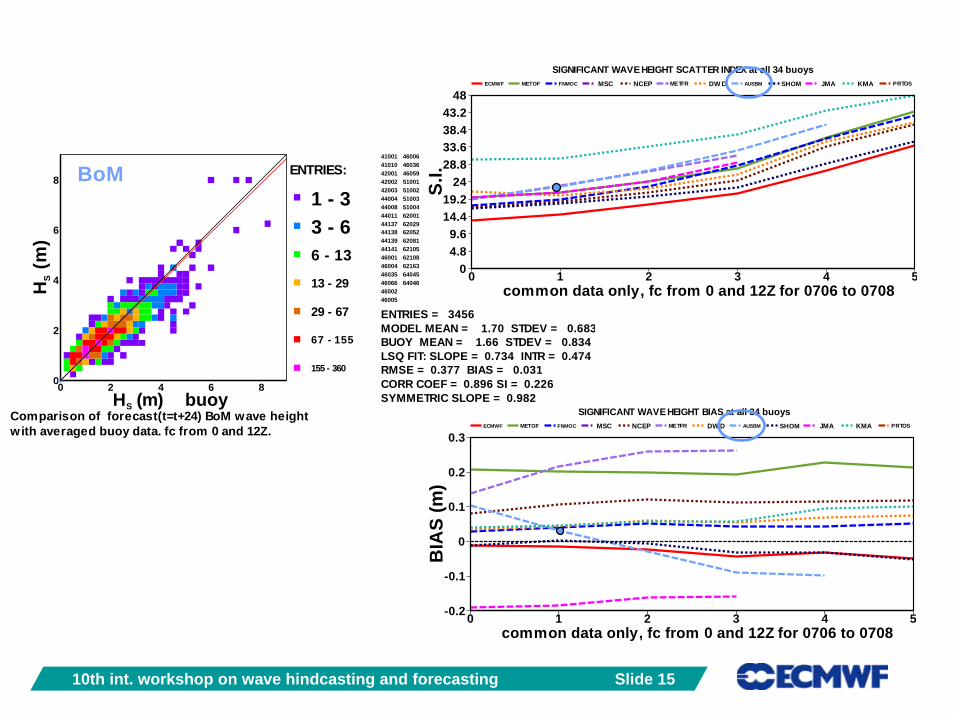
10th int. workshop on wave hindcasting and forecasting Slide 15
0 2 4 6 8HS (m) buoy
0
2
4
6
8
HS (m
)
BoM
with averaged buoy data. fc from 0 and 12Z.Comparison of forecast(t=t+24) BoM wave height
ENTRIES:
1 - 33 - 66 - 13
13 - 29
29 - 67
67 - 155
155 - 360
410014101042001420024200344004440084401144137441384413944141460014600446035460664600246005
46006460364605951001510025100351004620016202962052620816210562108621636404564046
SYMMETRIC SLOPE = 0.982CORR COEF = 0.896 SI = 0.226RMSE = 0.377 BIAS = 0.031LSQ FIT: SLOPE = 0.734 INTR = 0.474BUOY MEAN = 1.66 STDEV = 0.834MODEL MEAN = 1.70 STDEV = 0.683ENTRIES = 3456
0 1 2 3 4 5common data only, fc from 0 and 12Z for 0706 to 0708
04.89.6
14.419.2
2428.833.638.443.2
48
S.I.
SIGNIFICANT WAVE HEIGHT SCATTER INDEX at all 34 buoysECMWF METOF FNMOC MSC NCEP METFR DW D AUSBM SHOM JMA KMA PRTOS
0 1 2 3 4 5common data only, fc from 0 and 12Z for 0706 to 0708
-0.2
-0.1
0
0.1
0.2
0.3B
IAS
(m)
SIGNIFICANT WAVE HEIGHT BIAS at all 34 buoysECMWF METOF FNMOC MSC NCEP METFR DW D AUSBM SHOM JMA KMA PRTOS
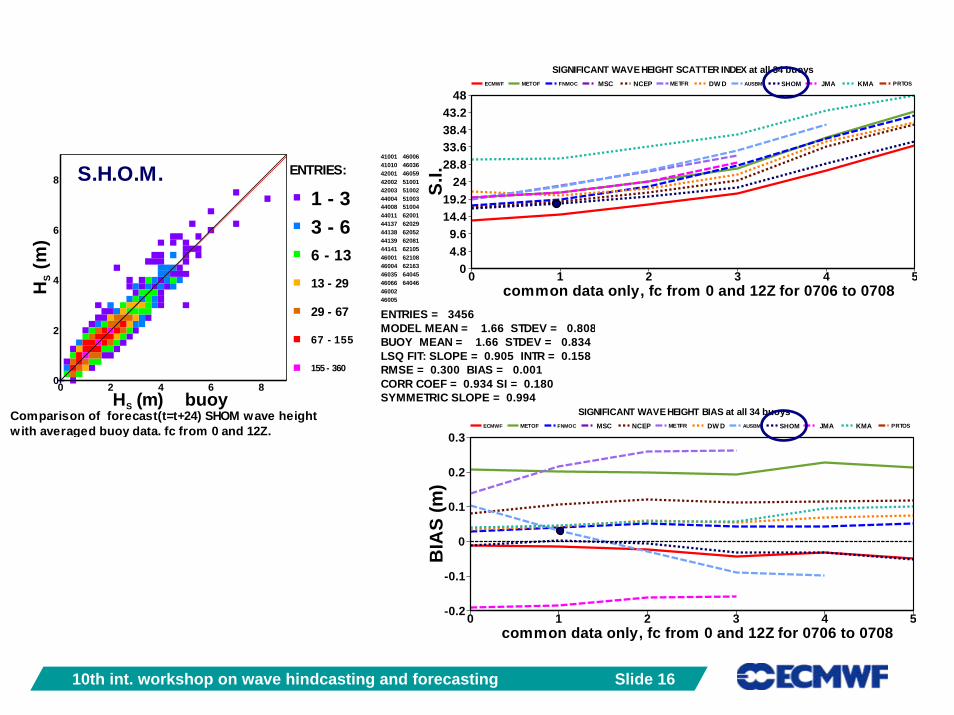
10th int. workshop on wave hindcasting and forecasting Slide 16
0 2 4 6 8HS (m) buoy
0
2
4
6
8
HS (m
)
S.H.O.M.
with averaged buoy data. fc from 0 and 12Z.Comparison of forecast(t=t+24) SHOM wave height
ENTRIES:
1 - 33 - 66 - 13
13 - 29
29 - 67
67 - 155
155 - 360
410014101042001420024200344004440084401144137441384413944141460014600446035460664600246005
46006460364605951001510025100351004620016202962052620816210562108621636404564046
SYMMETRIC SLOPE = 0.994CORR COEF = 0.934 SI = 0.180RMSE = 0.300 BIAS = 0.001LSQ FIT: SLOPE = 0.905 INTR = 0.158BUOY MEAN = 1.66 STDEV = 0.834MODEL MEAN = 1.66 STDEV = 0.808ENTRIES = 3456
0 1 2 3 4 5common data only, fc from 0 and 12Z for 0706 to 0708
04.89.6
14.419.2
2428.833.638.443.2
48
S.I.
SIGNIFICANT WAVE HEIGHT SCATTER INDEX at all 34 buoysECMWF METOF FNMOC MSC NCEP METFR DW D AUSBM SHOM JMA KMA PRTOS
0 1 2 3 4 5common data only, fc from 0 and 12Z for 0706 to 0708
-0.2
-0.1
0
0.1
0.2
0.3B
IAS
(m)
SIGNIFICANT WAVE HEIGHT BIAS at all 34 buoysECMWF METOF FNMOC MSC NCEP METFR DW D AUSBM SHOM JMA KMA PRTOS
10th int. workshop on wave hindcasting and forecasting Slide 17
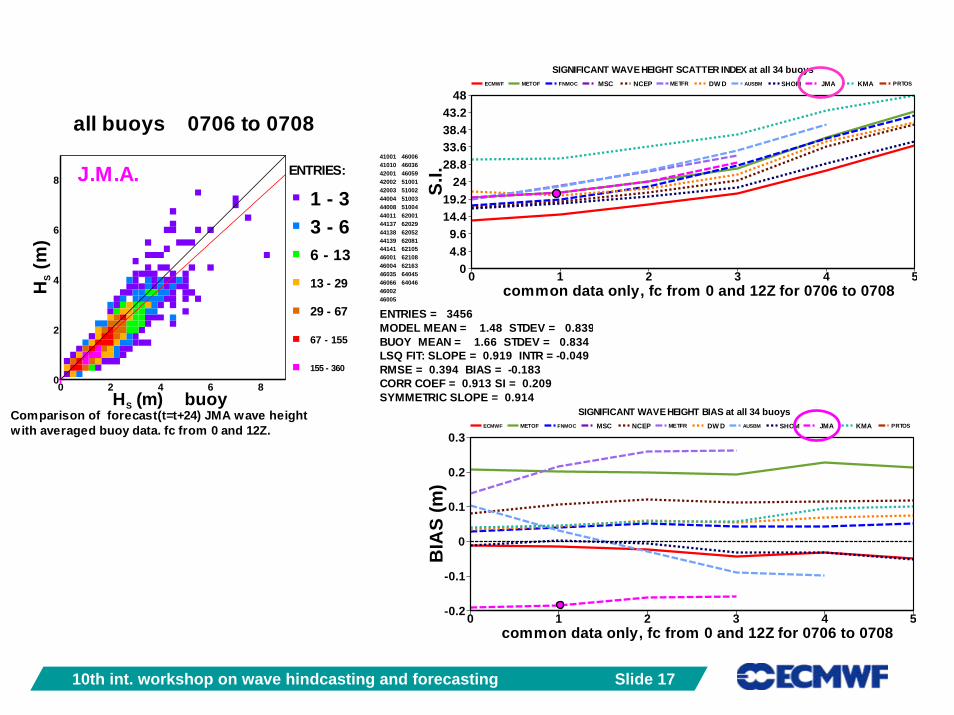
all buoys 0706 to 0708
0 2 4 6 8HS (m) buoy
0
2
4
6
8
HS (
m)
J.M.A.
with averaged buoy data. fc from 0 and 12Z.Comparison of forecast(t=t+24) JMA wave height
ENTRIES:
1 - 33 - 66 - 13
13 - 29
29 - 67
67 - 155
155 - 360
410014101042001420024200344004440084401144137441384413944141460014600446035460664600246005
46006460364605951001510025100351004620016202962052620816210562108621636404564046
SYMMETRIC SLOPE = 0.914CORR COEF = 0.913 SI = 0.209RMSE = 0.394 BIAS = -0.183LSQ FIT: SLOPE = 0.919 INTR = -0.049BUOY MEAN = 1.66 STDEV = 0.834MODEL MEAN = 1.48 STDEV = 0.839ENTRIES = 3456
0 1 2 3 4 5common data only, fc from 0 and 12Z for 0706 to 0708
04.89.6
14.419.2
2428.833.638.443.2
48
S.I.
SIGNIFICANT WAVE HEIGHT SCATTER INDEX at all 34 buoysECMWF METOF FNMOC MSC NCEP METFR DW D AUSBM SHOM JMA KMA PRTOS
0 1 2 3 4 5common data only, fc from 0 and 12Z for 0706 to 0708
-0.2
-0.1
0
0.1
0.2
0.3B
IAS
(m)
SIGNIFICANT WAVE HEIGHT BIAS at all 34 buoysECMWF METOF FNMOC MSC NCEP METFR DW D AUSBM SHOM JMA KMA PRTOS
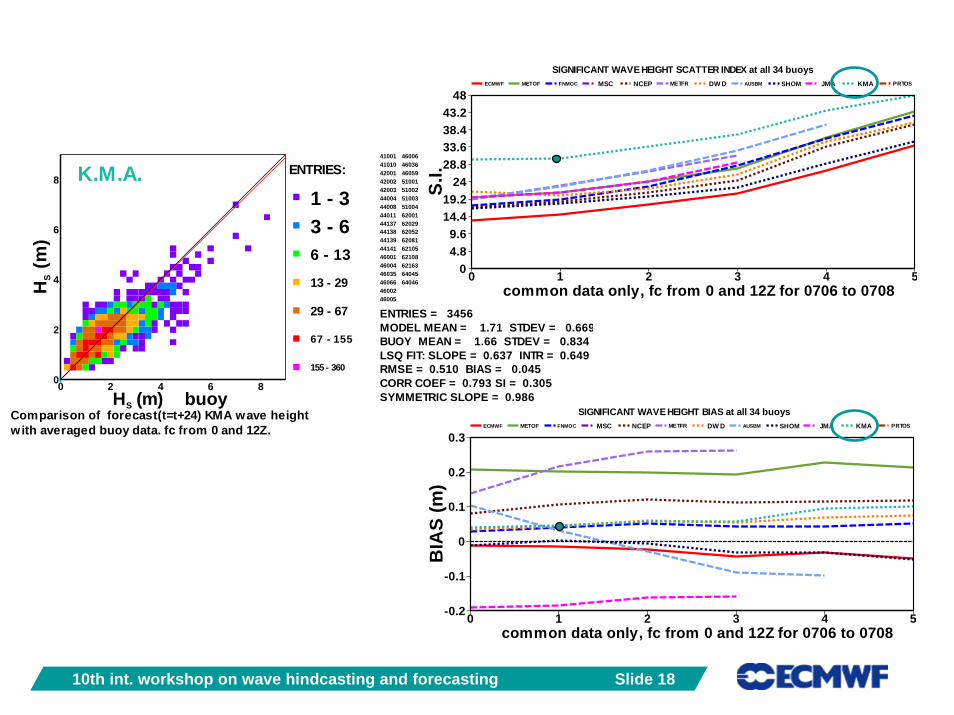
10th int. workshop on wave hindcasting and forecasting Slide 18
0 2 4 6 8HS (m) buoy
0
2
4
6
8
HS (m
)
K.M.A.
with averaged buoy data. fc from 0 and 12Z.Comparison of forecast(t=t+24) KMA wave height
ENTRIES:
1 - 33 - 66 - 13
13 - 29
29 - 67
67 - 155
155 - 360
410014101042001420024200344004440084401144137441384413944141460014600446035460664600246005
46006460364605951001510025100351004620016202962052620816210562108621636404564046
SYMMETRIC SLOPE = 0.986CORR COEF = 0.793 SI = 0.305RMSE = 0.510 BIAS = 0.045LSQ FIT: SLOPE = 0.637 INTR = 0.649BUOY MEAN = 1.66 STDEV = 0.834MODEL MEAN = 1.71 STDEV = 0.669ENTRIES = 3456
0 1 2 3 4 5common data only, fc from 0 and 12Z for 0706 to 0708
04.89.6
14.419.2
2428.833.638.443.2
48
S.I.
SIGNIFICANT WAVE HEIGHT SCATTER INDEX at all 34 buoysECMWF METOF FNMOC MSC NCEP METFR DW D AUSBM SHOM JMA KMA PRTOS
0 1 2 3 4 5common data only, fc from 0 and 12Z for 0706 to 0708
-0.2
-0.1
0
0.1
0.2
0.3B
IAS
(m)
SIGNIFICANT WAVE HEIGHT BIAS at all 34 buoysECMWF METOF FNMOC MSC NCEP METFR DW D AUSBM SHOM JMA KMA PRTOS
10th int. workshop on wave hindcasting and forecasting Slide 19
2004 2005 2006 2007months (median of the running averages)
12
15
18
21
24
27
30
33
36
39
42
45SI
(%
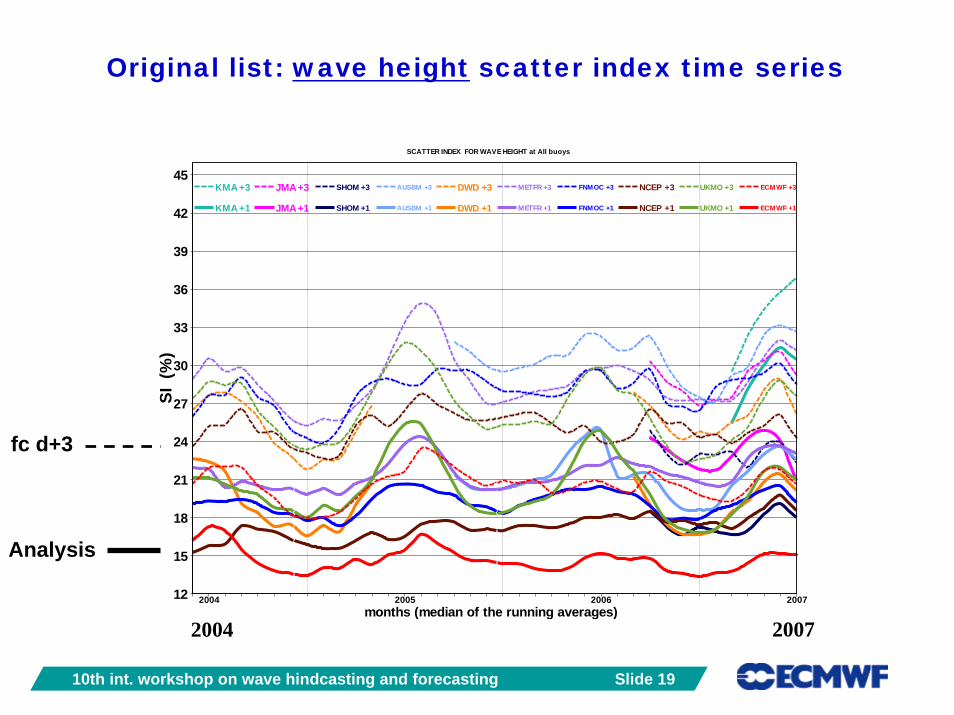
)SCATTER INDEX FOR WAVE HEIGHT at All buoys
KMA +3
KMA +1
JMA +3
JMA +1
SHOM +3
SHOM +1
AUSBM +3
AUSBM +1
DWD +3
DWD +1
METFR +3
METFR +1
FNMOC +3
FNMOC +1
NCEP +3
NCEP +1
UKMO +3
UKMO +1
ECMWF +3
ECMWF +1
Original list: wave height scatter index time series
Analysis
fc d+3
2004 2007
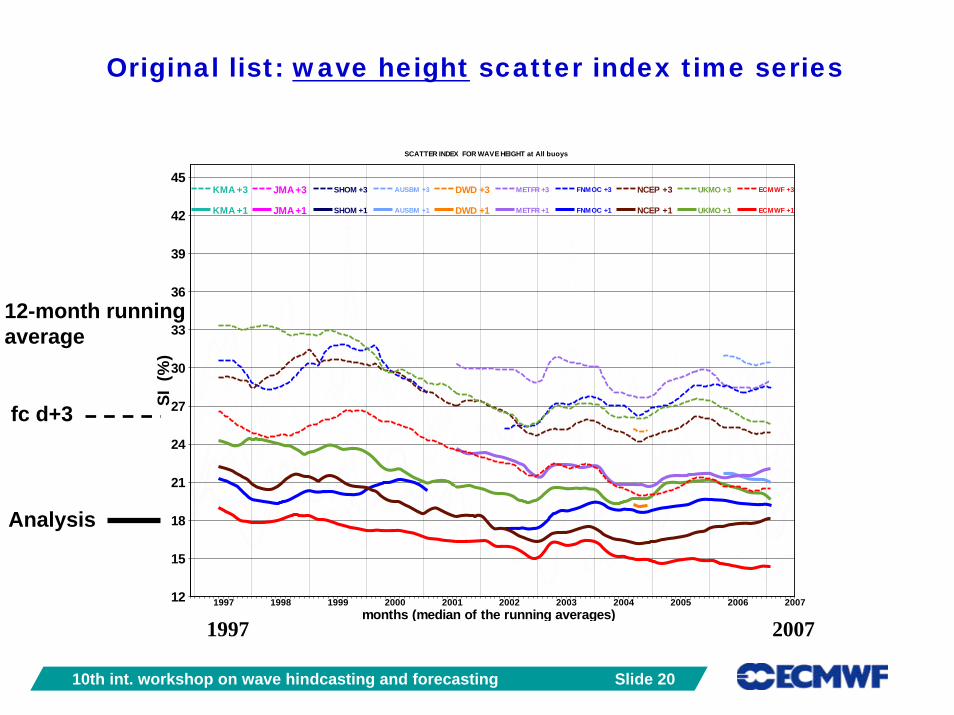
10th int. workshop on wave hindcasting and forecasting Slide 20
1997 1998 1999 2000 2001 2002 2003 2004 2005 2006 2007months (median of the running averages)
12
15
18
21
24
27
30
33
36
39
42
45SI
(%
)SCATTER INDEX FOR WAVE HEIGHT at All buoys
KMA +3
KMA +1
JMA +3
JMA +1
SHOM +3
SHOM +1
AUSBM +3
AUSBM +1
DWD +3
DWD +1
METFR +3
METFR +1
FNMOC +3
FNMOC +1
NCEP +3
NCEP +1
UKMO +3
UKMO +1
ECMWF +3
ECMWF +1
Original list: wave height scatter index time series
Analysis
fc d+3
12-month runningaverage
20071997
10th int. workshop on wave hindcasting and forecasting Slide 21
1997 1998 1999 2000 2001 2002 2003 2004 2005 2006 2007months (median of the running averages)
16
18
20
22
24
26
28
30
32
34
36
38
40
42
44
46
48
50SI
(%
)SCATTER INDEX FOR WIND SPEED (anemometer height corrected) at All buoys
KMA +3
KMA +1
JMA +3
JMA +1
SHOM +3
SHOM +1
AUSBM +3
AUSBM +1
DWD +3
DWD +1
METFR +3
METFR +1
FNMOC +3
FNMOC +1
NCEP +3
NCEP +1
UKMO +3
UKMO +1
ECMWF +3
ECMWF +1
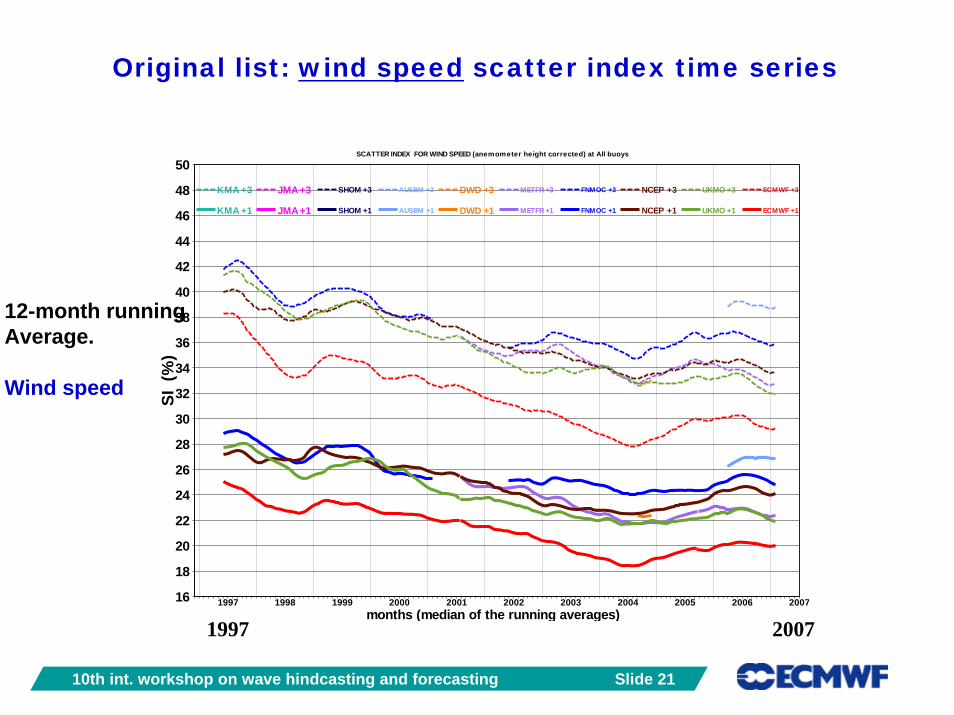
Original list: wind speed scatter index time series
12-month runningAverage.
Wind speed
20071997
10th int. workshop on wave hindcasting and forecasting Slide 22
1997 1998 1999 2000 2001 2002 2003 2004 2005 2006 2007months (median of the running averages)
121416182022242628303234363840424446485052
SI (
%)
SCATTER INDEX FOR PEAK PERIOD at All buoys
KMA +3
KMA +1
JMA +3
JMA +1
SHOM +3
SHOM +1
AUSBM +3
AUSBM +1
DWD +3
DWD +1
METFR +3
METFR +1
FNMOC +3
FNMOC +1
NCEP +3
NCEP +1
UKMO +3
UKMO +1
ECMWF +3
ECMWF +1
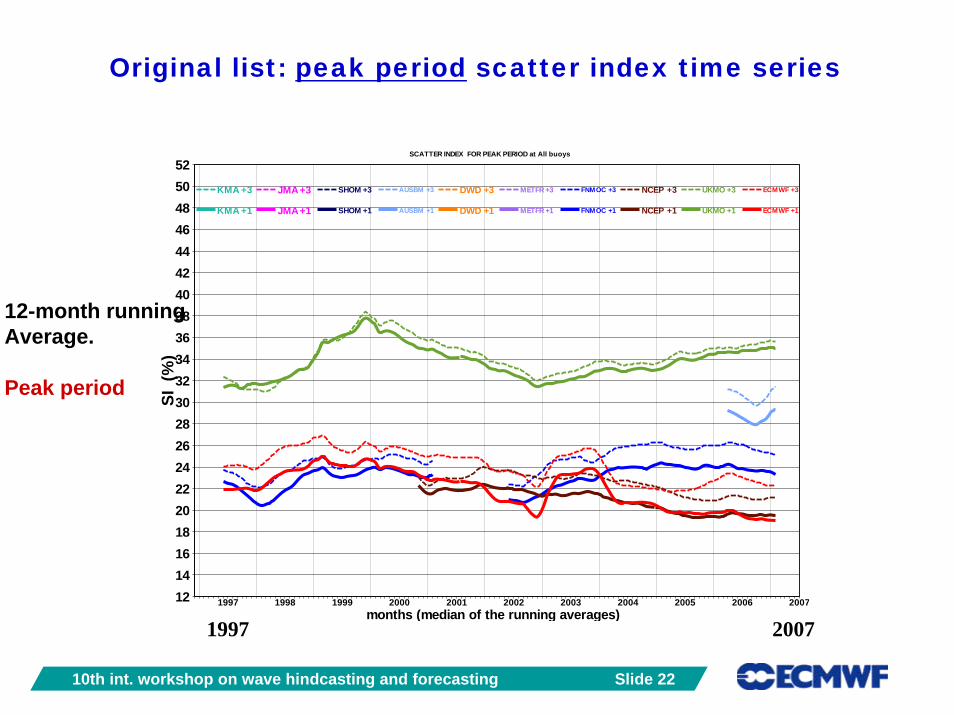
Original list: peak period scatter index time series
12-month runningAverage.
Peak period
20071997
10th int. workshop on wave hindcasting and forecasting Slide 23
32°N32°N33°N 33°N
34°N34°N35°N 35°N
36°N36°N37°N 37°N
38°N38°N39°N 39°N
40°N40°N41°N 41°N
42°N42°N43°N 43°N
44°N44°N45°N 45°N
46°N46°N47°N 47°N
48°N48°N49°N 49°N
50°N50°N51°N 51°N
52°N52°N53°N 53°N
54°N54°N55°N 55°N
56°N56°N57°N 57°N
58°N58°N59°N 59°N
60°N60°N61°N 61°N
178°E
178°E 180°
180°
176°W
176°W
172°W
172°W
168°W
168°W
164°W
164°W
160°W
160°W
156°W
156°W
152°W
152°W
148°W
148°W
144°W
144°W
140°W
140°W
136°W
136°W
132°W
132°W
128°W
128°W
124°W
124°W
120°W
120°W
116°W
116°W
1
2
3
4
567
8
9
10
11
12
13
14
15
16
1718
19
2021
22
46001 40 40 40 Gulf of Alaska 46002 123 152 152 US West Coast,Oregon 46004 180 171 171 Canada West Coast, Middle Nomad 46005 180 180 180 US North-West Coast, W Astoria 46006 34 28 28 US West Coast, SW Astoria 46013 146 179 179 US South-West Coast, Bodega 46014 100 100 100 US South-West Coast, Point Arena 46023 180 180 180 US South-West Coast, Point Arguello 46029 163 180 180 US West Coast, Columbia River Bar 46035 6 6 6 Bering Sea 46036 180 177 177 Canada West Coast, South Nomad
46042 179 178 178 US South-West Coast, Monterey 46050 180 180 180 US West Coast, Yaquina Bay 46059 180 180 180 US West Coast, California 46066 180 180 180 Gulf of Alaska, S Aleutians 46083 165 167 167 Gulf of Alaska, Fairw eather Grounds 46132 154 154 154 Canada West Coast, South Brooks 46147 180 180 180 Canada West Coast, South Moresby 46205 170 161 161 Canada West Coast, W. Dixon Entrance 46206 152 152 152 Canada West Coast, La Perouse Bank 46207 157 157 157 Canada West Coast, East Dellw ood 46208 178 175 175 Canada West Coast, West Moresby
1 2 3 4 5 6 7 8 9 10 11
12 13 14 15 16 17 18 19 20 21 22
Number of common observations for North East Pacific buoys (NEPAC) from 200706 to 200708 (wind, Hs, Tp)
26°N26°N
27°N 27°N
28°N28°N
29°N 29°N
30°N30°N
31°N 31°N
32°N32°N
33°N 33°N
34°N34°N
35°N 35°N
36°N36°N
37°N 37°N
38°N38°N
39°N 39°N
40°N40°N
41°N 41°N
42°N42°N
43°N 43°N
44°N44°N
45°N 45°N
46°N46°N
47°N 47°N
48°N48°N
49°N 49°N
50°N50°N
94°W
94°W 92°W
92°W 90°W
90°W 88°W
88°W 86°W
86°W 84°W
84°W 82°W
82°W 80°W
80°W 78°W
78°W 76°W
76°W 74°W
74°W 72°W
72°W 70°W
70°W 68°W
68°W 66°W
66°W 64°W
64°W 62°W
62°W 60°W
60°W 58°W
58°W 56°W
56°W 54°W
54°W 52°W
52°W 50°W
50°W 48°W
48°W 46°W
46°W 44°W
44°W 42°W
42°W 40°W
40°W
1
2
3
4
5
67
8
9
1011
1213 1415
1617
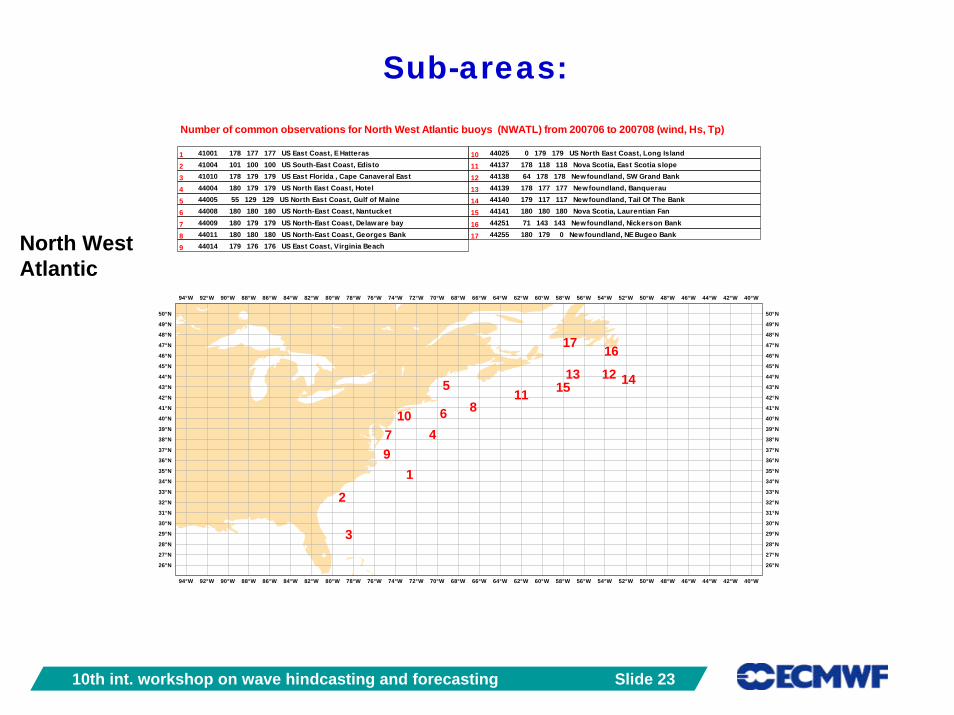
41001 178 177 177 US East Coast, E Hatteras 41004 101 100 100 US South-East Coast, Edisto 41010 178 179 179 US East Florida , Cape Canaveral East 44004 180 179 179 US North East Coast, Hotel 44005 55 129 129 US North East Coast, Gulf of Maine 44008 180 180 180 US North-East Coast, Nantucket 44009 180 179 179 US North-East Coast, Delaw are bay 44011 180 180 180 US North-East Coast, Georges Bank 44014 179 176 176 US East Coast, Virginia Beach
44025 0 179 179 US North East Coast, Long Island 44137 178 118 118 Nova Scotia, East Scotia slope 44138 64 178 178 New foundland, SW Grand Bank 44139 178 177 177 New foundland, Banquerau 44140 179 117 117 New foundland, Tail Of The Bank 44141 180 180 180 Nova Scotia, Laurentian Fan 44251 71 143 143 New foundland, Nickerson Bank 44255 180 179 0 New foundland, NE Bugeo Bank
1 2 3 4 5 6 7 8 9
10 11 12 13 14 15 16 17
Number of common observations for North West Atlantic buoys (NWATL) from 200706 to 200708 (wind, Hs, Tp)
North EastPacificNorth WestAtlantic
Sub-areas:
10th int. workshop on wave hindcasting and forecasting Slide 24
2002 2003 2004 2005 2006 2007months (median of the running averages)
10
12
14
16
18
20
22
24
26
28
30
32
34
36
38SI
(%
)SCATTER INDEX FOR WAVE HEIGHT at North East Pacific buoys
SHOM t+048
SHOM t+000
AUSBM t+048
AUSBM t+000
DWD t+048
DWD t+000
MSC t+048
MSC t+000
FNMOC t+048
FNMOC t+000
ECMWF t+048
ECMWF t+000
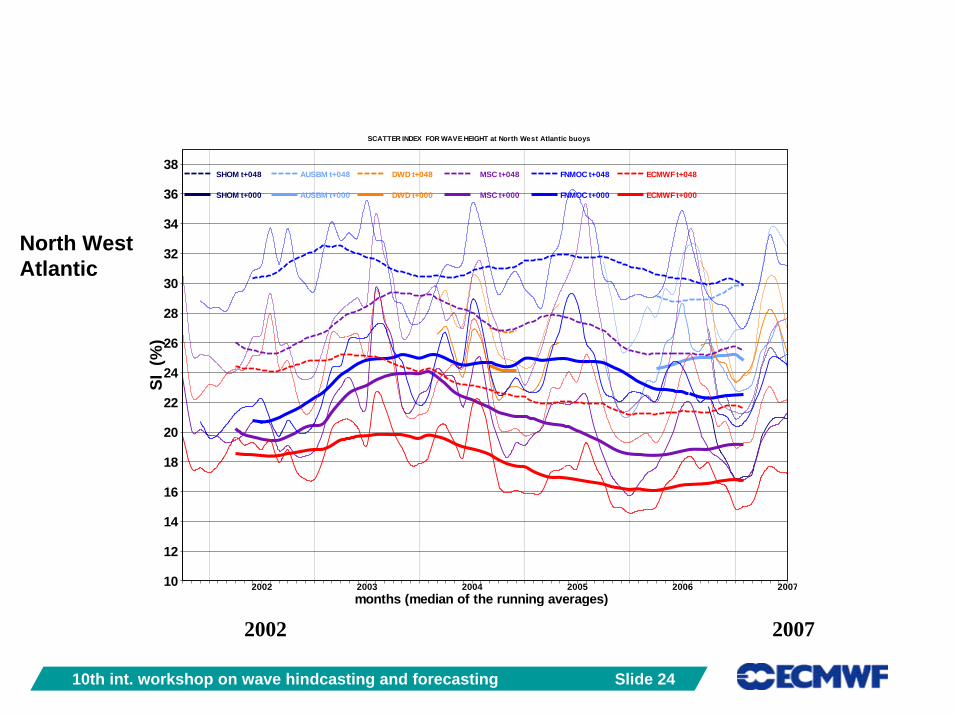
2002 2003 2004 2005 2006 2007months (median of the running averages)
10
12
14
16
18
20
22
24
26
28
30
32
34
36
38SI
(%
)SCATTER INDEX FOR WAVE HEIGHT at North West Atlantic buoys
SHOM t+048
SHOM t+000
AUSBM t+048
AUSBM t+000
DWD t+048
DWD t+000
MSC t+048
MSC t+000
FNMOC t+048
FNMOC t+000
ECMWF t+048
ECMWF t+000
North EastPacificNorth WestAtlantic
20072002
10th int. workshop on wave hindcasting and forecasting Slide 25
37°N37°N
38°N 38°N
39°N39°N
40°N 40°N
41°N41°N
42°N 42°N
43°N43°N
44°N 44°N
45°N45°N
46°N 46°N
47°N47°N
48°N 48°N
49°N49°N
50°N 50°N
51°N51°N
52°N 52°N
53°N53°N
54°N 54°N
55°N55°N
56°N 56°N
57°N57°N
58°N 58°N
59°N59°N
60°N 60°N
61°N61°N
38°W
38°W 36°W
36°W 34°W
34°W 32°W
32°W 30°W
30°W 28°W
28°W 26°W
26°W 24°W
24°W 22°W
22°W 20°W
20°W 18°W
18°W 16°W
16°W 14°W
14°W 12°W
12°W 10°W
10°W 8°W
8°W 6°W
6°W 4°W
4°W 2°W
2°W 0°
0° 2°E
2°E 4°E
4°E 6°E
6°E 8°E
8°E 10°E
10°E 12°E
12°E 14°E
14°E
123
4 5
6
7
8910
1112
13
14
15
16
17
18
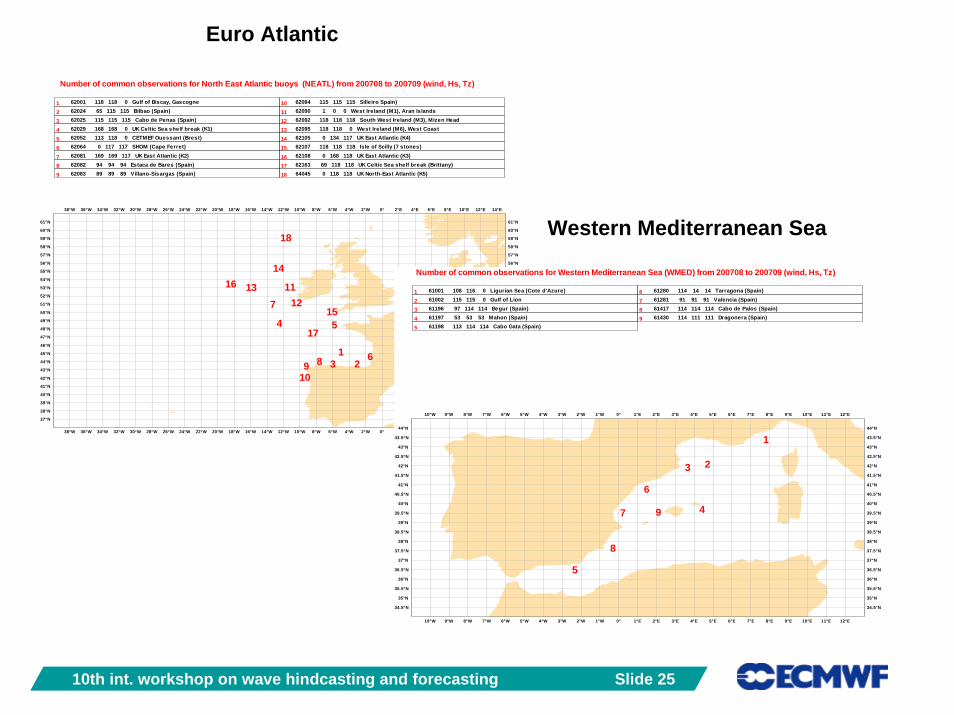
62001 118 118 0 Gulf of Biscay, Gascogne 62024 65 115 115 Bilbao (Spain) 62025 115 115 115 Cabo de Penas (Spain) 62029 168 168 0 UK Celtic Sea shelf break (K1) 62052 113 118 0 CETMEF Ouessant (Brest) 62064 0 117 117 SHOM (Cape Ferret) 62081 169 169 117 UK East Atlantic (K2) 62082 94 94 94 Estaca de Bares (Spain) 62083 89 89 89 Villano-Sisargas (Spain)
62084 115 115 115 Silleiro Spain) 62090 1 0 0 West Ireland (M1), Aran Islands 62092 118 118 118 South West Ireland (M3), Mizen Head 62095 118 118 0 West Ireland (M6), West Coast 62105 0 134 117 UK East Atlantic (K4) 62107 118 118 118 Isle of Scilly (7 stones) 62108 0 168 118 UK East Atlantic (K3) 62163 69 118 118 UK Celtic Sea shelf break (Brittany) 64045 0 118 118 UK North-East Atlantic (K5)
1 2 3 4 5 6 7 8 9
10 11 12 13 14 15 16 17 18
Number of common observations for North East Atlantic buoys (NEATL) from 200708 to 200709 (wind, Hs, Tz)
34.5°N34.5°N
35°N 35°N
35.5°N35.5°N
36°N 36°N
36.5°N36.5°N
37°N 37°N
37.5°N37.5°N
38°N 38°N
38.5°N38.5°N
39°N 39°N
39.5°N39.5°N
40°N 40°N
40.5°N40.5°N
41°N 41°N
41.5°N41.5°N
42°N 42°N
42.5°N42.5°N
43°N 43°N
43.5°N43.5°N
44°N 44°N
10°W
10°W 9°W
9°W 8°W
8°W 7°W
7°W 6°W
6°W 5°W
5°W 4°W
4°W 3°W
3°W 2°W
2°W 1°W
1°W 0°
0° 1°E
1°E 2°E
2°E 3°E
3°E 4°E
4°E 5°E
5°E 6°E
6°E 7°E
7°E 8°E
8°E 9°E
9°E 10°E
10°E 11°E
11°E 12°E
12°E
1
23
4
5
6
7
8
9
61001 108 116 0 Ligurian Sea (Cote d'Azure) 61002 115 115 0 Gulf of Lion 61196 97 114 114 Begur (Spain) 61197 53 53 53 Mahon (Spain) 61198 113 114 114 Cabo Gata (Spain)
61280 114 14 14 Tarragona (Spain) 61281 91 91 91 Valencia (Spain) 61417 114 114 114 Cabo de Palos (Spain) 61430 114 111 111 Dragonera (Spain)
1 2 3 4 5
6 7 8 9
Number of common observations for Western Mediterranean Sea (WMED) from 200708 to 200709 (wind, Hs, Tz)
Euro Atlantic
Western Mediterranean Sea
10th int. workshop on wave hindcasting and forecasting Slide 26
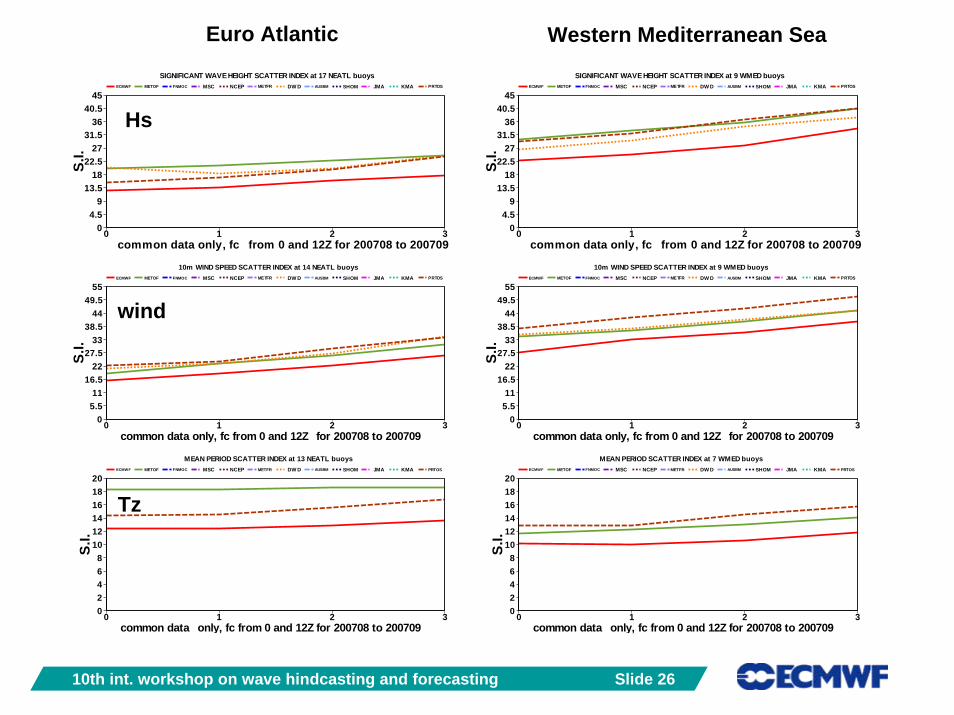
0 1 2 3common data only, fc�from 0 and 12Z for 200708 to 200709
04.5
913.5
1822.5
2731.5
3640.5
45S.
I.SIGNIFICANT WAVE HEIGHT SCATTER INDEX at 17 NEATL buoys
ECMWF METOF FNMOC MSC NCEP METFR DW D AUSBM SHOM JMA KMA PRTOS
0 1 2 3common data only, fc from 0 and 12Z�for 200708 to 200709
05.511
16.522
27.533
38.544
49.555
S.I.
10m WIND SPEED SCATTER INDEX at 14 NEATL buoysECMWF METOF FNMOC MSC NCEP METFR DW D AUSBM SHOM JMA KMA PRTOS
0 1 2 3common data�only, fc from 0 and 12Z for 200708 to 200709
02468
101214161820
S.I.
MEAN PERIOD SCATTER INDEX at 13 NEATL buoysECMWF METOF FNMOC MSC NCEP METFR DW D AUSBM SHOM JMA KMA PRTOS
0 1 2 3common data only, fc�from 0 and 12Z for 200708 to 200709
04.5
913.5
1822.5
2731.5
3640.5
45
S.I.
SIGNIFICANT WAVE HEIGHT SCATTER INDEX at 9 WMED buoysECMWF METOF FNMOC MSC NCEP METFR DW D AUSBM SHOM JMA KMA PRTOS
0 1 2 3common data only, fc from 0 and 12Z�for 200708 to 200709
05.511
16.522
27.533
38.544
49.555
S.I.
10m WIND SPEED SCATTER INDEX at 9 WMED buoysECMWF METOF FNMOC MSC NCEP METFR DW D AUSBM SHOM JMA KMA PRTOS
0 1 2 3common data�only, fc from 0 and 12Z for 200708 to 200709
02468
101214161820
S.I.
MEAN PERIOD SCATTER INDEX at 7 WMED buoysECMWF METOF FNMOC MSC NCEP METFR DW D AUSBM SHOM JMA KMA PRTOS
Euro Atlantic Western Mediterranean Sea
Hs
wind
Tz
10th int. workshop on wave hindcasting and forecasting Slide 27
70°S70°S
60°S 60°S
50°S50°S
40°S 40°S
30°S30°S
20°S 20°S
10°S10°S
0° 0°
10°N10°N
20°N 20°N
30°N30°N
40°N 40°N
50°N50°N
60°N 60°N
70°N70°N
160°W
160°W 140°W
140°W 120°W
120°W 100°W
100°W 80°W
80°W 60°W
60°W 40°W
40°W 20°W
20°W 0°
0° 20°E
20°E 40°E
40°E 60°E
60°E 80°E
80°E 100°E
100°E 120°E
120°E 140°E
140°E 160°E
160°E
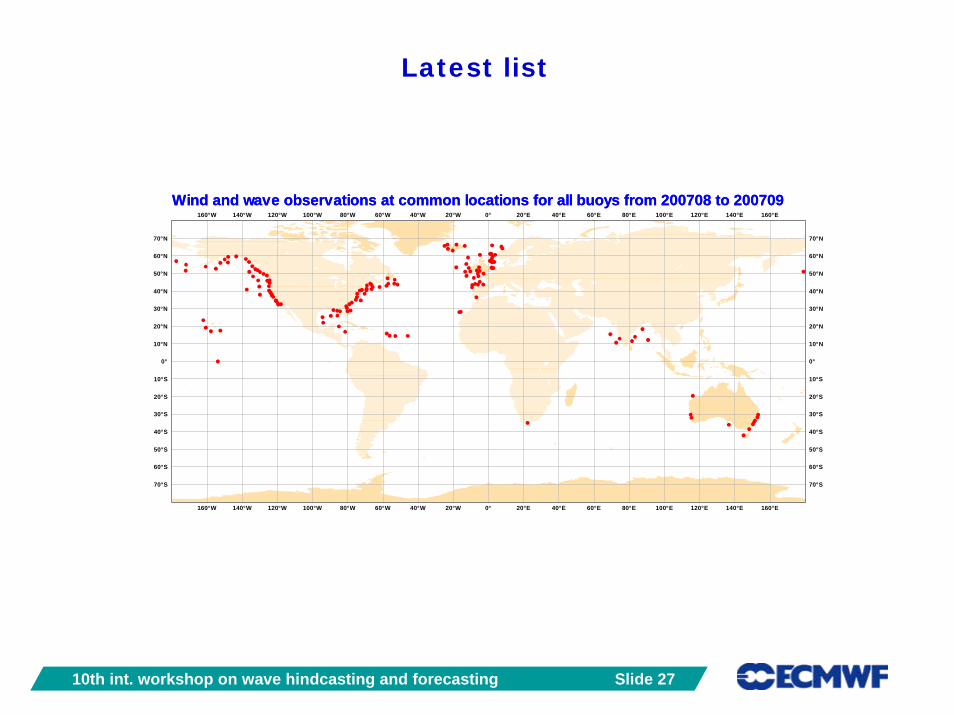
Wind and wave observations at common locations for all buoys from 200708 to 200709Wind and wave observations at common locations for all buoys from 200708 to 200709
Latest list
10th int. workshop on wave hindcasting and forecasting Slide 28
0 0.1 0.2 0.3 0.4
Frequency (Hz)0
100
200
300
400
E(f)
(m2 s)
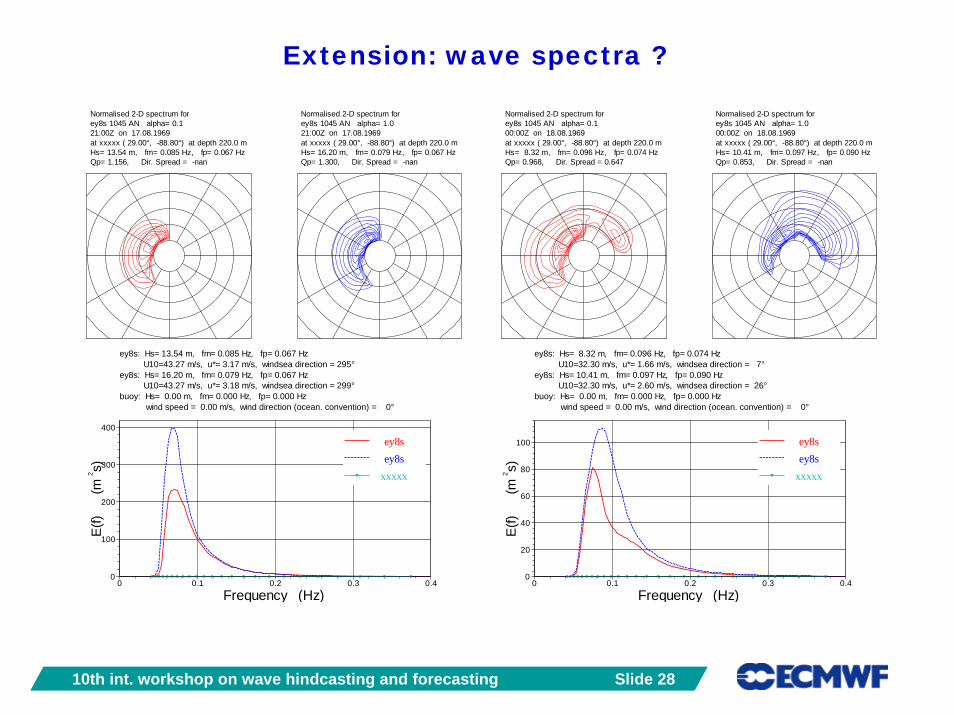
wind speed = 0.00 m/s, wind direction (ocean. convention) = 0°buoy: Hs= 0.00 m, fm= 0.000 Hz, fp= 0.000 Hz U10=43.27 m/s, u*= 3.18 m/s, windsea direction = 299°ey8s: Hs= 16.20 m, fm= 0.079 Hz, fp= 0.067 Hz U10=43.27 m/s, u*= 3.17 m/s, windsea direction = 295°ey8s: Hs= 13.54 m, fm= 0.085 Hz, fp= 0.067 Hz
Qp= 1.156, Dir. Spread = -nanHs= 13.54 m, fm= 0.085 Hz, fp= 0.067 Hzat xxxxx ( 29.00°, -88.80°) at depth 220.0 m21:00Z on 17.08.1969ey8s 1045 AN alpha= 0.1Normalised 2-D spectrum for
Qp= 1.300, Dir. Spread = -nanHs= 16.20 m, fm= 0.079 Hz, fp= 0.067 Hzat xxxxx ( 29.00°, -88.80°) at depth 220.0 m21:00Z on 17.08.1969ey8s 1045 AN alpha= 1.0Normalised 2-D spectrum for
ey8sey8s
xxxxx
0 0.1 0.2 0.3 0.4
Frequency (Hz)0
20
40
60
80
100
E(f)
(m2 s)
wind speed = 0.00 m/s, wind direction (ocean. convention) = 0°buoy: Hs= 0.00 m, fm= 0.000 Hz, fp= 0.000 Hz U10=32.30 m/s, u*= 2.60 m/s, windsea direction = 26°ey8s: Hs= 10.41 m, fm= 0.097 Hz, fp= 0.090 Hz U10=32.30 m/s, u*= 1.66 m/s, windsea direction = 7°ey8s: Hs= 8.32 m, fm= 0.096 Hz, fp= 0.074 Hz
Qp= 0.968, Dir. Spread = 0.647Hs= 8.32 m, fm= 0.096 Hz, fp= 0.074 Hzat xxxxx ( 29.00°, -88.80°) at depth 220.0 m00:00Z on 18.08.1969ey8s 1045 AN alpha= 0.1Normalised 2-D spectrum for
Qp= 0.853, Dir. Spread = -nanHs= 10.41 m, fm= 0.097 Hz, fp= 0.090 Hzat xxxxx ( 29.00°, -88.80°) at depth 220.0 m00:00Z on 18.08.1969ey8s 1045 AN alpha= 1.0Normalised 2-D spectrum for
ey8sey8s
xxxxx
Extension: wave spectra ?
10th int. workshop on wave hindcasting and forecasting Slide 29
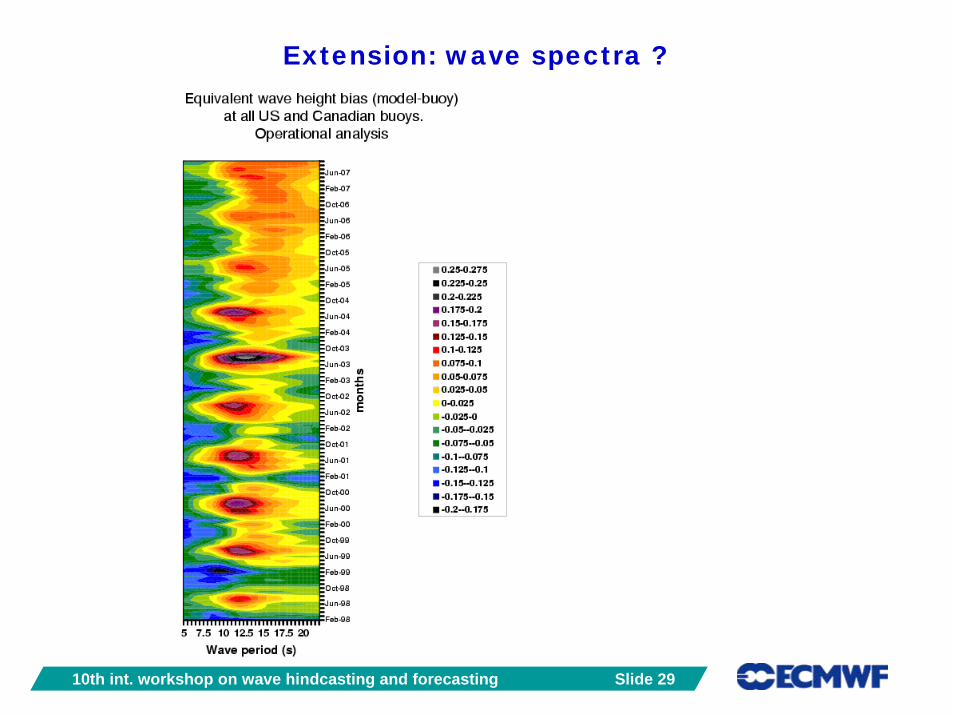
Extension: wave spectra ?
10th int. workshop on wave hindcasting and forecasting Slide 30
75°S75°S70°S 70°S
65°S65°S60°S 60°S
55°S55°S50°S 50°S
45°S45°S40°S 40°S
35°S35°S30°S 30°S
25°S25°S20°S 20°S
15°S15°S10°S 10°S
5°S5°S0° 0°
5°N5°N10°N 10°N
15°N15°N20°N 20°N
25°N25°N30°N 30°N
35°N35°N40°N 40°N
45°N45°N50°N 50°N
55°N55°N60°N 60°N
65°N65°N70°N 70°N
75°N75°N
10°E
10°E 20°E
20°E 30°E
30°E 40°E
40°E 50°E
50°E 60°E
60°E 70°E
70°E 80°E
80°E 90°E
90°E
110°E
110°E
130°E
130°E
150°E
150°E
170°E
170°E 180°
180°
160°W
160°W
140°W
140°W
120°W
120°W
100°W
100°W
80°W
80°W
60°W
60°W
40°W
40°W
20°W
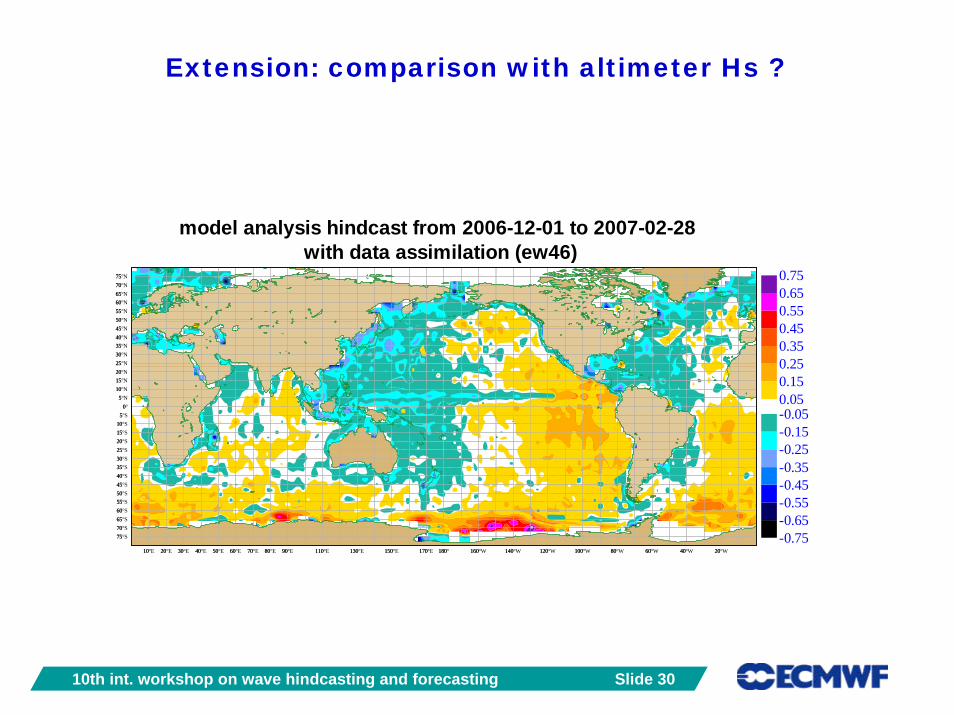
20°Wwithout data assimilation (ew3d)
model analysis hindcast from 2006-12-01 to 2007-02-28
-0.75-0.65-0.55-0.45-0.35-0.25-0.15-0.050.050.150.250.350.450.550.650.75
757570 70
656560 60
555550 50
454540 40
353530 30
252520 20
151510 10
550 0
5510 10
151520 20
252530 30
353540 40
454550 50
555560 60
656570 70
7575
10
10 20
20 30
30 40
40 50
50 60
60 70
70 80
80 90
90
110
110
130
130
150
150
170
170 180
180
160
160
140
140
120
120
100
100
80
80
60
60
40
40
20
20with data assimilation (ew46)
model analysis hindcast from 2006-12-01 to 2007-02-28
-0.75-0.65-0.55-0.45-0.35-0.25-0.15-0.050.050.150.250.350.450.550.650.75
Extension: comparison with altimeter Hs ?
10th int. workshop on wave hindcasting and forecasting Slide 31
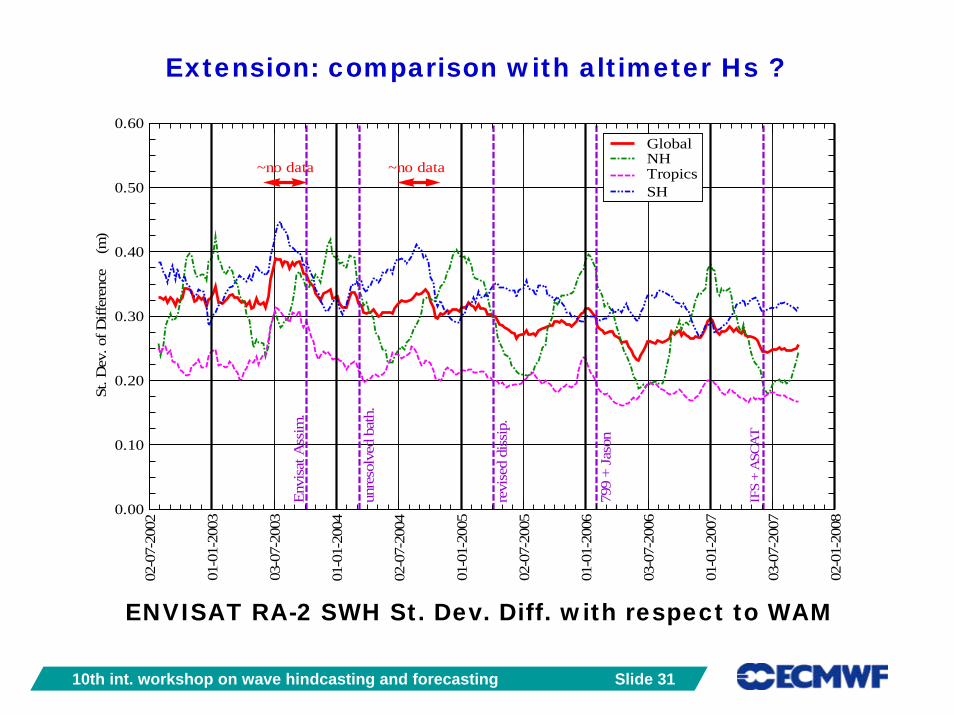
ENVISAT RA-2 SWH St. Dev. Diff. with respect to WAM
Envi
sat A
ssim
.
unre
solv
ed b
ath.
revi
sed
diss
ip.
799
+ Ja
son
IFS
+ A
SCA
T
02-0
7-20
02
01-0
1-20
03
03-0
7-20
03
01-0
1-20
04
02-0
7-20
04
01-0
1-20
05
02-0
7-20
05
01-0
1-20
06
03-0
7-20
06
01-0
1-20
07
03-0
7-20
07
02-0
1-20
08
0.00
0.10
0.20
0.30
0.40
0.50
0.60St
. Dev
. of D
iffer
ence
(m
)
GlobalNHTropicsSH
~no data ~no data
Extension: comparison with altimeter Hs ?
10th int. workshop on wave hindcasting and forecasting Slide 32
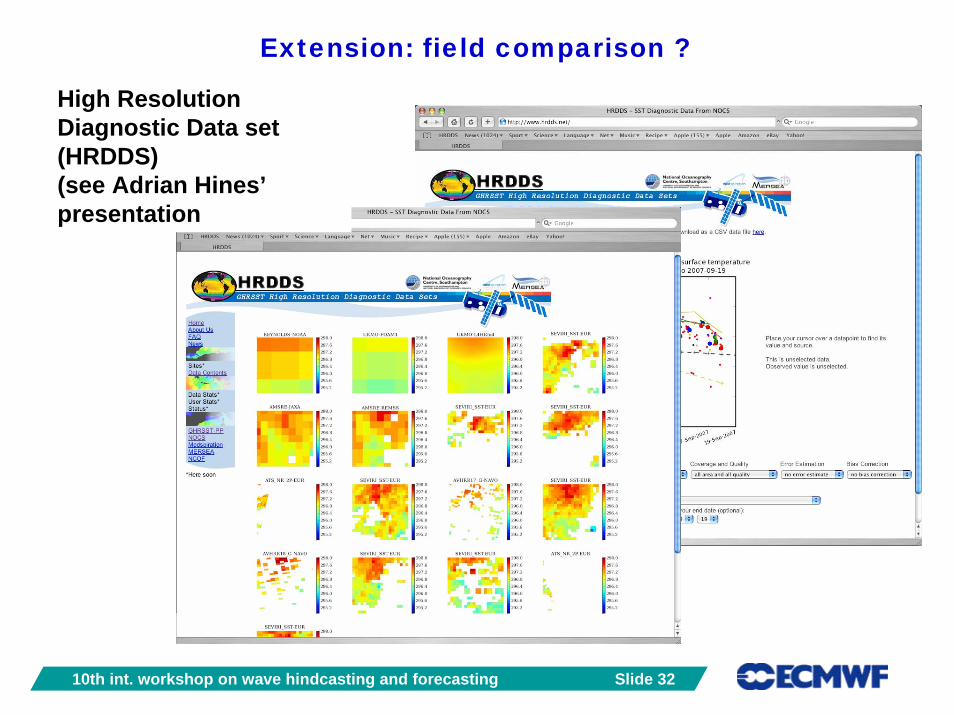
Extension: field comparison ?
High Resolution Diagnostic Data set(HRDDS)(see Adrian Hines’presentation
10th int. workshop on wave hindcasting and forecasting Slide 33
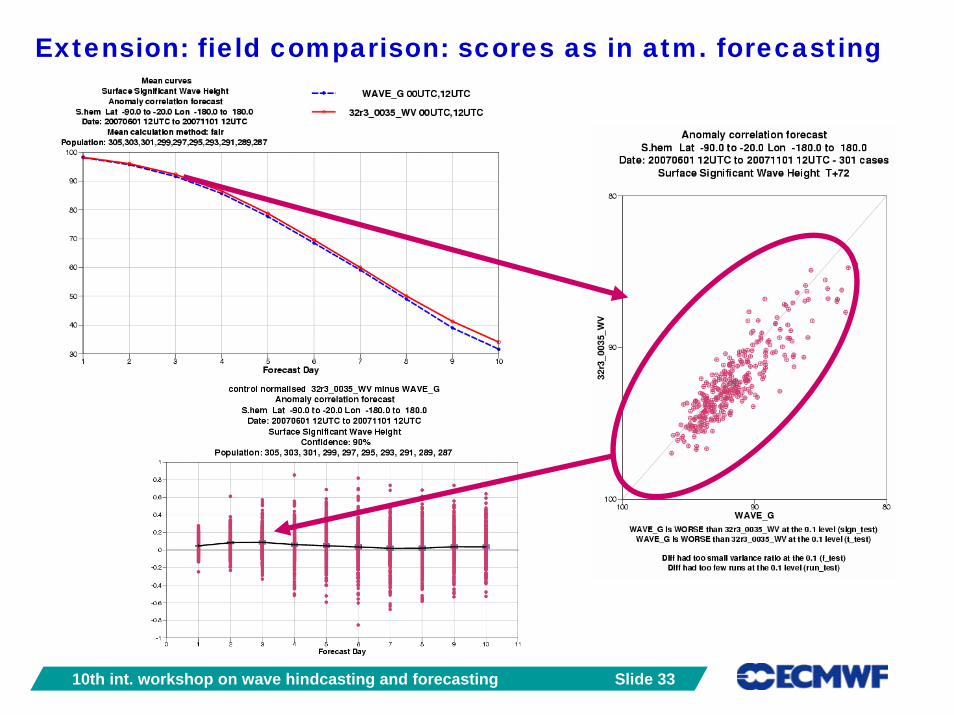
Extension: field comparison: scores as in atm. forecasting
10th int. workshop on wave hindcasting and forecasting Slide 34
Conclusions:
This informal inter-comparison of wind and wave model data has worked well for over 12 years.It is time to work on extending this exercise.By adding wave spectra?By comparing to remotely sensed data (Altimeter(s), SARs)?By exchanging model fields (HHDR approach, objective score approach)?


![Short Term Load Forecasting Using Optimized Neural Network …ieomsociety.org/IEOM_Orlnado_2015/papers/227.pdf · 2016-02-10 · [6] Nader S. Moharari, Atif S. Debs, "An Artificial](https://static.fdocuments.in/doc/165x107/5f0a0e3d7e708231d429ccd1/short-term-load-forecasting-using-optimized-neural-network-2016-02-10-6-nader.jpg)