Standard Data Analysis - Calibration ChemStation – Level 1 - Training.

1
Inter-calibration study of surface salinity measurements taken during the Salinity Processes in the Upper Ocean Regional Study (SPURS).
Kurt Baker, Vincent Varamo, Frederick Bingham, Xiaoyan Qi
Center for Marine Science, University of North Carolina at Wilmington
Salinity Processes in the Upper Ocean Regional Study technical report
May 27, 2014
Abstract The SPURS (Salinity Processes in the Upper Ocean Regional Study) project is an international effort to understand the region of sea surface salinity maximum in the North Atlantic Ocean. This effort combines the use of a wide range of salinity measurement devices, from shipboard and autonomous underwater vehicles, to Lagrangian drifters and floats. Due to the large amount of equipment used, it is impractical (if not impossible), to routinely recover and calibrate many of the instruments. The inter-calibration detailed in this report acts to verify the accuracy of measurements taken by comparing the sea surface salinities from multiple instruments at a given time, within a given radius. In this study, we define an encounter between instruments as an approach of 2 hours or less, and a distance of 10km or less. We use this criterion to inter-compare 120 different ocean salinity sensing devices. As a result, it is found that the data produced by the SPURS project is of high quality, with 94.9% of the 12476 encounters falling within 0.1psu and 99.5% of the encounters within 0.5psu. Introduction SPURS (Salinity Processes in the Upper Ocean Regional Study; http://spurs.jpl.nasa.gov/SPURS/) is an oceanographic field experiment which took place in the subtropical North Atlantic in 2012-2013. The area of study is (15-30°N, 30-45°W), with an intensive study area near the central flux mooring at about (25°N, 38°W). Its purpose is to understand the processes that create and maintain the subtropical horizontal salinity maximum and the surface salinity balance in general. The SPURS in situ dataset is comprised of research vessel ancillary instruments, semi-autonomous gliders, profiling floats, moored buoys, drifting buoys, ship-based profiles, microstructure measurements, volunteer observing ship data, etc. Table 1 contains an overview of the instruments examined in this report.
In order to ensure that the data collected during SPURS is of the highest quality, the various in situ observing assets need compared with each other and calibrated to known standards.

2
Instrument Type PI Type Sampling for IC
Waveglider Fratantoni AV 1 hr
Seaglider Lee AUV 1-2 sec (at surface ~every 6 hr)
Float Riser Lagrangian Profile ~10 days
WHOI Mooring Farrar Stationary 1 hr
Prawler Kessler Profile ~6 hr
Knorr TSG Schmitt Shipboard 1 min
Knorr CTD Schmitt Shipboard Profile Thalassa TSG Reverdin Shipboard 6 min
Endeavor TSG Schmitt Shipboard 5 sec (sub-sampled to 5 min)
Endeavor CTD Schmitt Shipboard Profile Sarmiento TSG Font Shipboard 6 sec (sub-sampled to 5 min)
Sarmiento CTD Font Shipboard Profile SEASOAR Font Towed Profiler 1Hz
Drifter Centurioni Lagrangian 30 min - 2 hr Table 1: List of instruments used for the IC report along with PI, type, and sampling records for each instrument type.
In normal measurements of salinity on board a ship, instrument salinities are compared to seawater samples whose values are measured using a salinometer. The salinometer is calibrated using standard seawater which is the calibration standard accepted in the oceanographic community. For some instruments, moorings for example, this calibration step can be performed before deployment and after recovery, and assuming linear drift. However, this drift is not always linear, and any intermediate calibration will be helpful in maintaining the quality of the data. For drifting or floating instruments it is not possible to bring the instrument aboard after recovery, as the instrument is usually not recovered after its lifetime is complete. Thus, SPURS included a large number of salinity sensors that need to be calibrated in situ, or compared with other instruments that are. As the experiment progressed, instruments came into proximity with each other by serendipity or design, and could be cross-compared. We have developed a database of SPURS instrument encounters which we will call the intercalibration (IC) dataset. The idea here is to make sure that there are enough encounters to ensure that the instruments are properly compared with each other
Methods The IC dataset was derived from all available SPURS salinity data, including measurements from all previously mentioned instruments. For the purpose of IC, only those salinity measurements taken within the top 8m of the water column were used. The components of salinity, latitude, longitude, instrument name, instrument type, and date were recorded in the total dataset and arranged chronologically. Before the IC table was created, a few minor edits were performed on the data. The thermosalinograph (TSG) from the Endeavor, Sarmiento, and Knorr cruises and the Seagliders added an enormous amount of measurements as they were sampled every 5-10 seconds; these were sub-sampled to every minute. The WHOI Mooring was sub-sampled to every five minutes and the Drifter data was reduced to
3
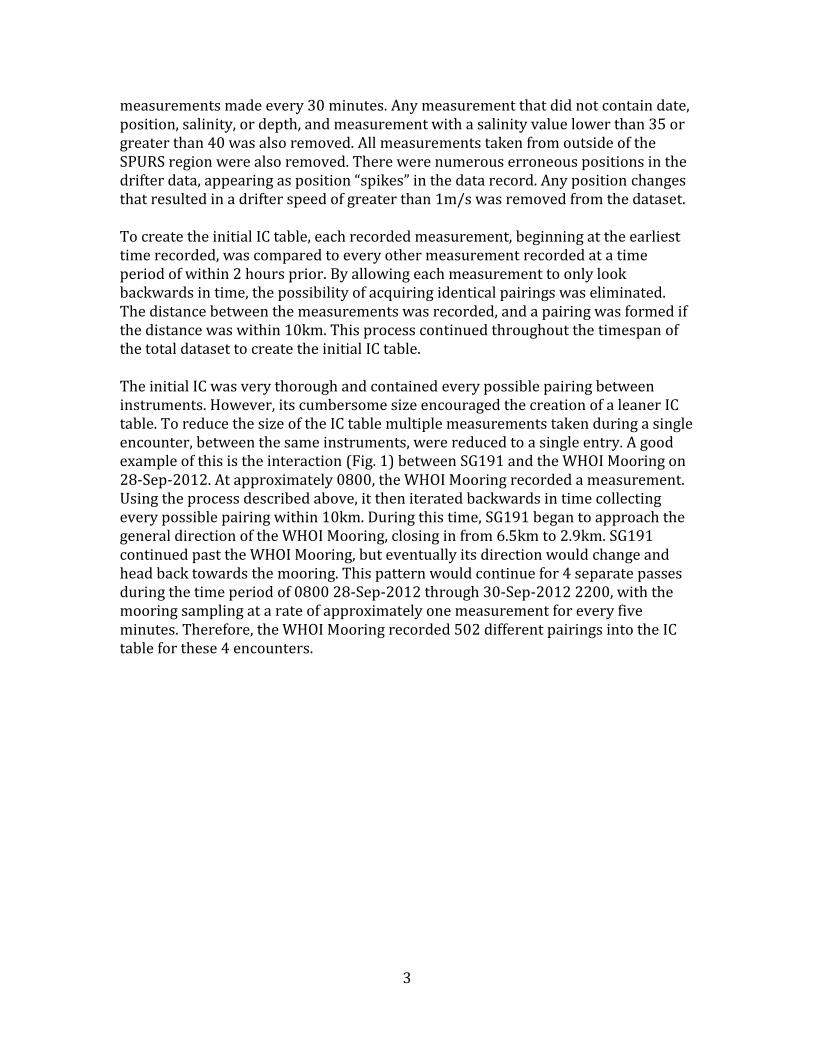
measurements made every 30 minutes. Any measurement that did not contain date, position, salinity, or depth, and measurement with a salinity value lower than 35 or greater than 40 was also removed. All measurements taken from outside of the SPURS region were also removed. There were numerous erroneous positions in the drifter data, appearing as position “spikes” in the data record. Any position changes that resulted in a drifter speed of greater than 1m/s was removed from the dataset. To create the initial IC table, each recorded measurement, beginning at the earliest time recorded, was compared to every other measurement recorded at a time period of within 2 hours prior. By allowing each measurement to only look backwards in time, the possibility of acquiring identical pairings was eliminated. The distance between the measurements was recorded, and a pairing was formed if the distance was within 10km. This process continued throughout the timespan of the total dataset to create the initial IC table. The initial IC was very thorough and contained every possible pairing between instruments. However, its cumbersome size encouraged the creation of a leaner IC table. To reduce the size of the IC table multiple measurements taken during a single encounter, between the same instruments, were reduced to a single entry. A good example of this is the interaction (Fig. 1) between SG191 and the WHOI Mooring on 28-Sep-2012. At approximately 0800, the WHOI Mooring recorded a measurement. Using the process described above, it then iterated backwards in time collecting every possible pairing within 10km. During this time, SG191 began to approach the general direction of the WHOI Mooring, closing in from 6.5km to 2.9km. SG191 continued past the WHOI Mooring, but eventually its direction would change and head back towards the mooring. This pattern would continue for 4 separate passes during the time period of 0800 28-Sep-2012 through 30-Sep-2012 2200, with the mooring sampling at a rate of approximately one measurement for every five minutes. Therefore, the WHOI Mooring recorded 502 different pairings into the IC table for these 4 encounters.
4
Figure 1
Figure 1: Sample plot of data collected over a 3-day span. Instruments are identified by type as shown in the legend and their difference in distance is represented by the red line.
To reduce these extra encounters, the final IC table was restricted to include only a single pairing for such multiple encounters. This single pairing was chosen to be the measurement taken at the shortest distance between the 2 instruments. For multiple encounters where both objects were stationary during the elapsed time, the single measurement that was closest in time was chosen to represent the encounter (Fig. 1). In doing this, the IC table was reduced from 1054385 encounters to 12476 over the course of a year and a half (21-Aug-2012 through 12-Feb-2014). By creating the IC table in this fashion, it was determined that the sign value for salinity difference is random and arbitrary for the purpose of IC dataset analysis. Therefore, all salinity difference evaluations performed used the absolute value of the salinity difference for encounters, . The sign is not arbitrary, however, for evaluation of individual instruments, and all evaluations on individual instruments (located in the attached appendix) use the true salinity difference values, .
09/28 09/29 09/30 10/0137.35
37.4
37.45
37.5
37.55
37.6
37.65
37.7
37.75S
alin
ity
WHOI Mooring
SG191
09/28 09/29 09/30 10/012.5
3
3.5
4
4.5
5
5.5
6
6.5
Dis
tance
(km
)
Sample SSS for SPURS Inter-calibration
Encounter
#1
Encounter
#2
Encounter
#3
Encounter
#4

5
Results The encounters are not evenly distributed in space or time, as there are large clusters of encounters corresponding to the timeframes of the Knorr, Sarmiento, and Endeavor cruises, as can be seen in Figure 2. The encounter activity following the spring cruises remained at elevated levels for about a month and then began to gradually fall off. This is due to the additional drifters deployed by the spring cruises.
Figure 2
Figure 2: Number of encounters per day during the scope of SPURS from 21-Aug-2012 through 12-Feb-2014. The time is marked every 45 days and labeled on the horizontal axis, while the number of encounters for each day is on the vertical axis. 2 separate peaks are identified: 27-Sep-2012, near the end of the Knorr cruise, and 08-Apr-2013, toward the end of the Endeavor/Sarmiento cruise.
The IC table is dominated by drifter encounters. Of the 12476 total encounters, 9611 (approximately 77%) contain a drifter as one or both of the matching pairs. Following the drifters are the moorings, wave gliders and cruise instruments. The stationary nature of the mooring and the programmed paths of the gliders appear to
0
50
100
150
200
250
21-A
ug-2
012
05-O
ct-2
012
19-N
ov-2
012
03-J
an-2
013
17-F
eb-2
013
03-A
pr-2
013
18-M
ay-2
013
02-J
ul-2
013
16-A
ug-2
013
30-S
ep-2
013
14-N
ov-2
013
29-D
ec-2
013
12-F
eb-2
014
29-M
ar-2
014
Num
be
r of en
cou
ters
Number of SPURS encounters by day, 21-Aug-2012 to 22-Apr-2014
08-Apr-2013
27-Sep-2012

6
be a limiting factor in the amount of encounters by these instruments. As the drifters wander their way around the SPURS site, they are often in close proximity with other drifters for an extended period of time. This allows for a large number of encounters. Sea gliders however, are designed to cut a path through the site on a regular basis, allowing them to only pick up random encounters as they surface. Figure 3 shows the number of encounters by instrument type for the IC study and
Figure 3
Figure 3: Number of encounters by instrument type. The number of encounters for each instrument is shown on the vertical axis as well as at the top of each bar. Note, the total number of encounters here is 44699, as each encounter involved two instruments. In other words, the numbers presented can either indicate the identity of one or both of the instruments involved in each encounter.
Table 2 gives an instrument-by-instrument breakdown of all encounters. To avoid confusion, TSG includes all cruise TSG data. This makes it possible for TSG-TSG encounters (such as Sarmiento-Endeavor).
0
2000
4000
6000
8000
10000
Drif
ter
Float
Sea
glider
Wav
eglid
er
Moo
ring
TSGCTD
Sea
soar
Inter-Calibration encounters by type
num
be
r o
f e
nco
un
ters
9611
76
684
1708 1858 1708
79 18

7
Sea
Glider Wave Glider
Float Salinity Drifter
Mooring CTD
Station
SEA-SOAR
TSG
Sea Glider 20 178 7 101 300 9 2 67
Wave Glider
615 16 316 438 7 0 138
Float
1 38 8 1 0 5
Salinity Drifter
8491 181 17 0 467
Mooring 0 17 5 909
CTD Station 0 0 28
SEASOAR 0 11
TSG 83
Glider
Table 2: Distribution of encounters by instrument type.
Distance dependency was also considered during the IC study. By separating the dataset into distinct distances, there is a direct relationship between distance and . As the distance between paired instruments decreases, their becomes smaller. This relationship is noticeable at both large (5-10km) and short (< 5km) distances. Figures 4 and 5 show the change in variability while adjusting the distance parameter; both of these plots look strikingly similar.

8
Figure 4
Figure 4: Multiple bar plots for instrument separations of 0-10km in the IC dataset. Each bar represents the proportion of encounters for a given range (0.025psu) of to the total number of occurrences. All occurrences resulting in greater than 0.25psu are represented in the outermost bar. The colors, and the corresponding texts, distinguish instrument separation during an encounter. The mean, median, standard deviation and root mean square (RMS) are for
0 0.025 0.05 0.075 0.1 0.125 0.15 0.175 0.2 0.225 0.250
0.1
0.2
0.3
0.4
0.5
0.6
0.7
0.8
0.9
1
Absolute Salinity Difference
Pro
po
rtio
n o
f E
ncou
nte
rsVarying Distance (0-10km) Encounter Salinity Difference Histogram
Total Encounters: 5753Mean: 0.04Median: 0.02StDev: 0.094RMS: 0.1
Total Encounters: 3922Mean: 0.035Median: 0.013StDev: 0.11RMS: 0.12
Total Encounters: 2801Mean: 0.026Median: 0.01StDev: 0.052RMS: 0.058
5-10km from instrument
2-5km from instrument
< 2km from instrument

9
Figure 5
Figure 5: Multiple bar plots for instrument separations of 0-5km in the IC dataset. Each bar represents the proportion of encounters for a given range (0.025psu) of to the total number of occurrences. All occurrences resulting in greater than 0.25psu are represented in the outermost bar. The colors, and the corresponding texts, distinguish instrument separation during an encounter. The mean, median, standard deviation and RMS are for
While time dependency for the dataset was also considered, there did not appear to be any substantial relationship between time and . Therefore these results were not included in the report. For the entire IC dataset, a mean of 0.035 and median of 0.017 are produced. Additionally, the standard deviation is 0.093 and the root mean square is 0.099. The histogram of the entire dataset can be seen in figure 6. For this data, 82.3% of all encounters result in 0.05psu and 94.9% of all encounters are included when 0.1psu. The average distance for all encounters is 4.7 km.
0 0.025 0.05 0.075 0.1 0.125 0.15 0.175 0.2 0.225 0.250
0.1
0.2
0.3
0.4
0.5
0.6
0.7
0.8
0.9
1
Absolute Salinity Difference
Pro
po
rtio
n o
f E
ncou
nte
rs
Varying Distance (0-5km) Encounter Salinity Difference Histogram
Total Encounters: 2527Mean: 0.038Median: 0.014StDev: 0.12RMS: 0.13
Total Encounters: 2488Mean: 0.028Median: 0.011StDev: 0.072RMS: 0.077
Total Encounters: 1708Mean: 0.026Median: 0.01StDev: 0.052RMS: 0.058
3-5km from instrument
1-3km from instrument
< 1km from instrument

10
Figure 6
Figure 6: Histogram of all 28334 encounters for the IC study. Each bar represents the proportion of encounters for a given range (0.025psu) of to the total number of occurrences. All occurrences resulting in 0.25psu are represented in the outermost bar. The mean, median, standard deviation and root mean square are for .
Extreme outliers for the dataset were also considered. It is noticed that the variance, standard deviation, and RMS values for figures 4-6 seem significantly larger than they should be given the shape of the distributions. This is due of the presence of a small number of larger outliers. As can be seen in Figure 7, there are multiple salinity recordings well above and below normally expected salinity values from this region. While an attempt was made to remove erroneous measurements by eliminating all values outside of 35-40psu, any measurement inside of that range made it into the report. While these outliers certainly have an affect upon the statistics of the dataset, the vast majority of the data fall within expected values. For example, by removing all encounters that fall within the outermost box of Figure 6, the RMS for the dataset is reduced from 0.099 to 0.072.
0 0.025 0.05 0.075 0.1 0.125 0.15 0.175 0.2 0.225 0.250
0.1
0.2
0.3
0.4
0.5
0.6
0.7
Pro
po
rtio
n o
f E
ncou
nte
rs
Absolute Salinity Difference
All Encounters Histogram
Total Encounters: 12476Mean: 0.035Median: 0.017StDev: 0.093RMS: 0.099

11
Figure 7
Figure 7: Scatterplot of salinity values for each encountering pair in the IC dataset. The horizontal axis gives the salinity value for the 1st paired instrument, and the vertical axis gives the salinity value for the 2nd paired instrument. Paired salinities are color-coded based on their resulting salinity difference as shown in the legend.
To remedy these poor salinity measurements and their subsequent IC pairings we turn our attention back to the initial IC dataset. Looking through the entire dataset we find each encounter that results in a |∆S|> 0.1psu and focus in on the two instruments involved. For each instrument we find all of its encounters within ± 12 hours, while removing any pairings with the other instrument in question, and find the mean ∆S for the instrument during this time period. After comparing these two values we are able to remove the data entry for an instrument if it’s mean |∆S|> 0.1psu and the other instrument’s mean |∆S|< 0.1psu. Table 3 compares some of the statistics from the original and the newly adjusted IC dataset.
35 35.5 36 36.5 37 37.5 38 38.5 39 39.5 40
35
35.5
36
36.5
37
37.5
38
38.5
39
39.5
40
Paired instrument 1 salinity value
Pair
ed
instr
um
en
t 2 s
alin
ity v
alu
e
Total instrument scatterplot of salinity encounters
sal dif > 1psu30 encounters0.2% of total
0.5psu < sal dif < 1psu39 encounters0.3% of total
sal dif < 0.5psu12407 encounters99.4% of total

12
Before After
Initial IC Dataset 1054385 1018560
Final IC Dataset 12476 12366
Mean |∆S| .035 .031
STD |∆S| .093 .069
RMS |∆S| .099 .076
Table 3: Compares IC dataset statistics before and after the removal of salinity measurements deemed unusable from the method described above. The mean, standard deviation, and root mean square are taken from the before and after final IC dataset.
While this method indeed strengthens the quality of measurements included, it is still not able to remove all of the poor IC pairings. Either from one or both of the instruments not having any other encounters within that 12 hour window or both of their mean falls below 0.1psu during that time period, which inhibits us from deciphering which instrument may be recording a bad salinity measurement. Conclusions The sea surface salinity measurements recorded throughout the duration of SPURS appear to be of high quality. Even with noted erroneous measurements, the overall mean and standard deviation shows a healthy dataset that should be of good use to SPURS PIs. An appendix to this report has been attached consisting of an individual inter-calibration report for each of the 120 instruments. For those instruments with the largest amount of variation, additional comments are included. While time (from 0-2hr) did not play a major role in affecting salinity difference, distance certainly did. Although decreasing the distance between instruments reduces the sample size, the resulting dataset appears to be more robust due to the decreasing standard deviation of the small distance datasets. The IC table is dominated by salinity drifter encounters, with 77% of the encounters containing at least one drifter. Many of the encounters are between two drifters, with a total of 68.1% of the entire dataset being drifter-drifter encounters. Although somewhat unexpected due to the dispersive nature of the drifters, this is a desirable situation. As the gliders and moorings can be recovered and re-calibrated (unless lost or damaged), and floats can be calibrated against the deeper layers where they spend much of their time, the drifters will remain at sea for the entirety of their lives. This makes in situ calibration all the more valuable to verify the validity of their data.