INTER-AMERICAN TROPICAL TUNA COMMISSION COMISIÓN ... · inter-american tropical tuna commission...
63
ISSN: 0074-0993 INTER-AMERICAN TROPICAL TUNA COMMISSION COMISIÓN INTERAMERICANA DEL ATÚN TROPICAL Bulletin—Boletín Vol. 24, No. 2 HORIZONTAL MOVEMENTS OF BIGEYE TUNA (THUNNUS OBESUS) IN THE EASTERN PACIFIC OCEAN, AS DETERMINED FROM CONVENTIONAL AND ARCHIVAL TAGGING EXPERIMENTS INITIATED DURING 2000-2005 DESPLAZAMIENTOS HORIZONTALES DE ATUNES PATUDO (THUNNUS OBESUS) EN EL OCÉANO PACÍFICO ORIENTAL, DETERMINADOS A PARTIR DE EXPERIMENTOS CON MARCAS CONVENCIONALES Y ARCHIVADORAS INICIADOS DURANTE 2000-2005 by—por Kurt M. Schaefer and—y Daniel W. Fuller La Jolla, California, USA 2009
Transcript of INTER-AMERICAN TROPICAL TUNA COMMISSION COMISIÓN ... · inter-american tropical tuna commission...
ISSN: 0074-0993
INTER-AMERICAN TROPICAL TUNA COMMISSION COMISIÓN INTERAMERICANA DEL ATÚN TROPICAL
Bulletin—Boletín
Vol. 24, No. 2
HORIZONTAL MOVEMENTS OF BIGEYE TUNA (THUNNUS OBESUS) IN THE EASTERN PACIFIC OCEAN, AS DETERMINED FROM
CONVENTIONAL AND ARCHIVAL TAGGING EXPERIMENTS INITIATED DURING 2000-2005
DESPLAZAMIENTOS HORIZONTALES DE ATUNES PATUDO (THUNNUS
OBESUS) EN EL OCÉANO PACÍFICO ORIENTAL, DETERMINADOS A PARTIR DE EXPERIMENTOS CON MARCAS CONVENCIONALES Y
ARCHIVADORAS INICIADOS DURANTE 2000-2005
by—por
Kurt M. Schaefer and—y Daniel W. Fuller
La Jolla, California, USA 2009

The Inter-American Tropical Tuna Commission (IATTC) operates under the authority and direction of a convention originally entered into by Costa Rica and the United States. The convention, which came into force in 1950, is open to adherence by other governments whose nationals fish for tropical tunas in the eastern Pacific Ocean. Under this provision Panama adhered in 1953, Ecuador in 1961, Mexico in 1964, Canada in 1968, Japan in 1970, France and Nicaragua in 1973, Vanuatu in 1990, Venezuela in 1992, El Salvador in 1997, Guatemala in 2000, Peru in 2002, Spain in 2003, the Republic of Korea in 2005, and Colombia in 2007. Canada withdrew from the Commission in 1984. Additional information about the IATTC and its publi-cations can be found on the inside back cover of this report.
La Comisión Interamericana del Atún Tropical (CIAT) funciona bajo la autoridad y dirección de una convención establecida originalmente por Costa Rica y los Estados Uni-dos. La Convención, vigente desde 1950, está abierta a la afiliación de otros gobiernos cuyos ciudadanos pescan atu-nes en el Océano Pacífico oriental. Bajo esta estipulación, Panamá se afilió en 1953, Ecuador en 1961, México en 1964, Canadá en 1968, Japón en 1970, Francia y Nicaragua en 1973, Vanuatu en 1990, Venezuela en 1991, El Salvador en 1997, Guatemala en 2000, Perú en 2002, España en 2003, la República de Corea en 2005, y Colombia en 2007. Ca-nadá se retiró de la Comisión en 1984. Información adicional sobre la CIAT y sus publicacio-nes puede ser encontrada en la parte interna posterior de la cubierta de este informe.
COMMISSIONERS—COMISIONADOS
COLOMBIA FRANCE—FRANCIA PERÚ Yadir Salazar Mejía Marie-Sophie Dufau-Richet Gladys Cárdenas Quintana Vladimir Puentes Christiane Laurent-Monpetit Alfonso Miranda Eyzaguirre José Alfredo Ramos Jonathan Lemeunier Doris Sotomayor Yalan Carlos Robles Michel Sallenave Jorge Vértiz Calderón COSTA RICA GUATEMALA REPUBLIC OF KOREA—
Bernal Alberto Chavarría Valverde Fraterno Diaz Monge REPÚBLICA DE COREA Asdrubal Vásquez Nuñez Rómulo Dimas Chiguk Ahn Carlos Villalobos Sole Gramajo Lima Il Jeong Jeong Jeongseok Park ECUADOR JAPAN—JAPÓN Jimmy Martínez Ortiz Yutaka Aoki USA—EE.UU. Ramón Montaño Cruz Masahiro Ishikawa Robert Fletcher Guillermo Morán Velásquez Shingo Ota Rodney McInnis Luis Torres Navarrete Patrick Rose MÉXICO EL SALVADOR Marío Aguilar Sanchez VANUATU Manuel Calvo Benivides Miguel Ángel Cisneros Mata Christophe Emelee Manuel Ferín Oliva Ramón Corral Ávila Roy Mickey Joy Sonia Salaverría Michel Dreyfus León Dimitri Malvirlani José Emilio Suadi Hasbun Laurent Parenté NICARAGUA ESPAÑA—SPAIN Steadman Fagoth Müller VENEZUELA Rafael Centenera Ulecia Julio César Guevara Alvin Delgado Fernando Curcio Ruigómez Danilo Rosales Pichardo Gilberto Gimenez Samuel J. Juárez Casado Armando Segura Espinoza Nancy Tablante PANAMÁ María Patricia Díaz Arnulfo Franco Rodríguez Panagiotis Lymberopulos George Novey
_________________________
DIRECTOR
Dr. Guillermo A. Compeán
HEADQUARTERS AND MAIN LABORATORY—OFICINA Y LABORATORIO PRINCIPAL 8604 La Jolla Shores Drive
La Jolla, California 92037-1508, USA www.iattc.org

INTER-AMERICAN TROPICAL TUNA COMMISSION COMISIÓN INTERAMERICANA DEL ATÚN TROPICAL
Bulletin—Boletín
Vol. 24, No. 2
HORIZONTAL MOVEMENTS OF BIGEYE TUNA (THUNNUS OBESUS) IN THE EASTERN PACIFIC OCEAN, AS DETERMINED FROM
CONVENTIONAL AND ARCHIVAL TAGGING EXPERIMENTS INITIATED DURING 2000-2005
DESPLAZAMIENTOS HORIZONTALES DE ATUNES PATUDO (THUNNUS
OBESUS) EN EL OCÉANO PACÍFICO ORIENTAL, DETERMINADOS A PARTIR DE EXPERIMENTOS CON MARCAS CONVENCIONALES Y ARCHIVADORAS
INICIADOS DURANTE 2000-2005
by—por
Kurt M. Schaefer and—y Daniel W. Fuller
LLaa JJoollllaa,, CCaalliiffoorrnniiaa,, UUSSAA 2009

SCHAEFER AND FULLER
190
CCOONNTTEENNTTSS——IINNDDIICCEE
CONTENTS—INDICE
ENGLISH VERSION—VERSIÓN EN INGLES
Page
ABSTRACT............................................................................................................................................................................................ 191 INTRODUCTION .................................................................................................................................................................................. 191 MATERIALS AND METHODS ........................................................................................................................................................... 192 RESULTS................................................................................................................................................................................................ 194 DISCUSSION ......................................................................................................................................................................................... 196 ACKNOWLEDGEMENTS.................................................................................................................................................................... 199
_______________
FIGURES—FIGURAS ................................................................................ 201 _______________
TABLES—TABLAS .................................................................................. 225 _______________________
VERSIÓN EN ESPAÑOL--SPANISH VERSION Página
RESUMEN.............................................................................................................................................................................................. 236 INTRODUCCIÓN .................................................................................................................................................................................. 236 MATERIALES Y MÉTODOS............................................................................................................................................................... 237 RESULTADOS....................................................................................................................................................................................... 239 DISCUSIÓN ........................................................................................................................................................................................... 242 RECONOCIMIENTOS .......................................................................................................................................................................... 246
_______________
LITERATURE CITED—BIBLIOGRAFÍA CITADA ...................................................... 247

HORIZONTAL MOVEMENTS OF BIGEYE TUNA (THUNNUS OBESUS) IN THE EASTERN PACIFIC OCEAN, AS DETERMINED FROM CONVENTIONAL AND ARCHIVAL TAGGING EXPERIMENTS INITIATED DURING
2000-2005
by
Kurt M. Schaefer and Daniel W. Fuller
ABSTRACT
A total of 19,471 bigeye tuna were captured, tagged, and released in the equatorial eastern Pacific Ocean, during March to May of 2000 and 2002-2005. Of the 19,148 dart tags and 323 geolocating archival tags deployed, 8,263 (43.2%) and 163 (50.5%), respectively, were returned. Times at liberty ranged from 1.7 to 2,291 d ( x = 169, SE = 1.8). Linear displacements, from release to recapture positions, ranged from 0 to 7093 km ( x = 560, SE = 7.8). Of the 6,692 bigeye at liberty for 30 d or longer, 95% were recaptured within 1,894 km of their release positions. The primary directional sector of the linear displacements was 255° to 300°, comprising 43.5% of the observations. An unscented Kalman filter (UKF) model with sea-surface temperature measurements inte-grated was used to process 98 archival tag data sets from bigeye at liberty for 30 d or longer, in order to obtain improved estimates of geographic positions, most probable tracks, and movement parameters. The median parameter estimates from the UKF model for errors in longitude (σx) and latitude (σy) were 0.27° and 2.34°, for directed movements (u and v) were 1.25 nm/d and 0.35 nm/d, and for dispersive movement (D) was 465 nm2/d. The 95% and 50% utilization distributions, based on 11,585 positions for the combined 98 bigeye archival tag data sets, were 1,326,325 km2 and 60,667 km2, respectively, and were centered between about 3°N and 5°S and 90°W and 105°W. Based on the archival tag data there are differences in the spatial patterns of movements by year of deploy-ment and fish age or size. These data clearly indicate that bigeye exhibit restricted movements, with regional fidelity to this area of high biological productivity. The tagging data from this study and others also indicate the very low level of mixing between the eastern and western Pacific, but do confirm there is some mixing of fish between these areas and almost certainly mixing within and between overlapping areas defined by 2,000 km radii across the Pacific.
INTRODUCTION
Bigeye tuna (Thunnus obesus) inhabit tropical and subtropical oceanic waters throughout the world, except the Mediterra-nean Sea (Collette and Nauen, 1983). Bigeye are captured in the eastern Pacific Ocean (EPO) by longliners operating from about 40°N to 20°S and by purse seiners from about 5°N to 15°S (Miyabe and Bayliff, 1998; Anonymous, 2008). Since 1994, as a result of fishing effort directed at tunas associated with fish-aggregating devices (FADs), purse-seine catches of bigeye in the EPO have increased significantly, while those of longliners have decreased significantly, creating uncertainty about the sustainability of recent levels of exploitation (Anonymous, 2004; Aires-da-Silva and Maunder, 2009) .
Understanding the spatial dynamics, habitat utilization, and population structure of bigeye in the Pacific Ocean, including the level of mixing between the EPO and the western and central Pacific Ocean (WCPO) is paramount for stock assessments and management considerations. Tag release and recapture experiments, utilizing conventional dart tags (DTs), conducted for several species of tunas in various areas of the world’s oceans, have provided valuable information on movements and population structure (Hunter et al., 1986; Bayliff, 1993). In recent years, tuna-tagging experiments, utilizing geolocating archival tags (ATs) have pro-vided significant data toward understanding the spatial dynamics, habitat utilization, and population structure for those species in-vestigated (Arnold and Dewar, 2001; Gunn and Block, 2001; Block, 2005).
Movements of bigeye inferred from tagging experiments utilizing DTs in the western Pacific Ocean (WPO) (Hampton and Gunn, 1998; Hampton and Williams, 2005) and Hawaii (Itano and Holland, 2000) indicate that, although there are some linear dis-placements in excess of 1,852 km, more than 80% of recaptures occurred within 370 km of the locations of release. The movement paths for bigeye in the EPO (Schaefer and Fuller, 2002) and WPO (Clear et al., 2005) derived from filtered AT data indicated that the area utilized was restricted primarily to within 1,852 km of the release locations. Results from both conventional and archival tagging studies of bigeye indicate restricted movements and regional fidelity, with very limited mixing among the eastern, central, and western Pacific Ocean.
The objectives of this investigation are to elucidate the horizontal movements, spatial dynamics, and habitat utilization of bigeye tagged and released with DTs and ATs during 2000-2005 in the equatorial EPO (EEPO). Linear movements and dispersion, based on PDT release and recapture data, along with the movement parameters, paths, and utilization distributions derived from

SCHAEFER AND FULLER
192
recovered AT data sets, are evaluated. The results obtained have direct implications for consideration within-stock assessments and resource management applications for bigeye in the Pacific Ocean.
MATERIALS AND METHODS
Tag releases
Bigeye associated with Tropical Atmosphere-Ocean (TAO) moorings, the tagging vessel, and drifting FADs, were cap-tured, tagged, and released in the EEPO between 3°N and 5°S, and 95º and 97°W, during March to May of 2000 and 2002 through 2005. Tagging was conducted on the chartered MV Her Grace, a 17.7-m, 99-gross ton, United States west-coast-style live-bait pole-and-line vessel. Fish were captured for tagging using lift poles (one- and two-pole outfits), handline gear, and rods and reels during the day and night. When fishing with lift poles, the live bait used for chumming was the anchoveta (Cetengraulis mysticetus) cap-tured in the Gulf of Panama. The terminal tackle attached to the monofilament line on the handline and the rod-and-reel setups was primarily 8-ounce chrome metal jigs, some with green glow paint on one surface. Most of the tagging was done by the authors, but a few other individuals also tagged tunas during these experiments under the supervision of the authors. Tuna with obvious damage to the gills or eyes, or exhibiting severe bleeding, were rejected for tagging in most instances.
Dart tags
Fish were tagged with one or two serially-numbered 12.5-cm yellow DTs manufactured by Hallprint Pty, Ltd., Victor Harbor, South Australia, using tubular stainless steel applicators. Tags were inserted, on either side of the fish, into the dorsal mus-culature with the barbed heads passing between the pterygiophores below the base of the second dorsal fin. A request that the finder report the recapture of the fish and informing him or her that there was a reward for the return of the tag was printed in Spanish on these tags. Most fish less than about 1 m in length were measured and tagged in aluminum cradles, lined with high-density foam padding, with 1-cm graduations marked on a smooth liner, mounted on the stern coaming of the vessel directly behind the fishing racks. There were four tagging stations, each with an aluminum cradle. Methods similar to those used in this study for tagging tunas with DTs are described by Bayliff and Holland (1986). Some fish larger than about 1.2 m in length, captured with two-pole outfits, were tagged in the water alongside the fishing racks, and the lengths were estimated, rather than measured. Fish larger than about 1 m in length, captured primarily at night using handline or rod-and-reel gear, were landed with heavy-duty long-handled aluminum-frame nets (75-cm inside diameter), hung with knotless webbing, onto a mat of high-density foam with a smooth liner. Those fish were measured to the nearest millimeter with a caliper. Tag release information, including date and time, fishing location, fishing gear type, tagging station, species, length, tag type and number(s) were recorded, using cassette tape recorders held in plexiglass cases suspended around the necks of taggers. Following tagging events, the release data recorded on tapes were transcribed to paper forms aboard the vessel, usually within 24 h of a tagging event.
An extensive international publicity campaign intended to inform captains and crews of purse-seine and longline vessels, cannery managers and workers, and unloaders of purse-seine vessels about the tagging project and subsequent rewards for the return of tags was initiated in January 2000. Reward posters and flyers were widely distributed at the major tuna fishing ports at that time and in subsequent years prior to tagging cruises. The reward for the return of the dart tags was US$5 for each tag. In addition, at the end of each year following a tagging cruise a drawing was held for the awarding of five prizes of US$1,000 each. Each tag returned entitled the finder one chance to win the drawing.
Archival tags
The ATs deployed in 2000 were model Mk7 and in 2002 model Mk9, both manufactured by Wildlife Computers, Red-mond, Washington, USA. The archival tags deployed in 2003, 2004, and 2005 were model Mk9, and the LTD_2310 manufactured by Lotek Wireless, Inc., St. John’s, Newfoundland, Canada. Information describing some specifications and performance of the Mk9 and LTD_2310 ATs is presented by Schaefer and Fuller (2006a). The configuration for each of the ATs deployed was designed for implantation into the peritoneal cavity of the fish, with the light and temperature sensor stalk protruding outside the fish through an incision in the abdominal wall. A label, printed in Spanish, with information about reporting the recovery of the tag and the associ-ated reward (US$500) was encased in the main body of the instruments. The tags were programmed to store depth (pressure), ambi-ent and internal temperatures, and light-level data in memory every 4 minutes for the Mk7 tags deployed in 2000, and every 1 min-ute for the Mk9 and LTD_2310 tags deployed in 2002-2005. The materials and methods used for tagging and releasing bigeye with archival tags are described by Schaefer and Fuller (2002).

HORIZONTAL MOVEMENTS OF BIGEYE TUNA 193
Tag recoveries
Most recoveries of DTs and ATs were made during or following the process of purse-seine vessels unloading while in port, but there were also some recoveries aboard purse-seine and longline vessels at sea. Observers of the IATTC or national pro-grams were aboard most of the trips of purse-seine vessels during which tagged tunas were recaptured, providing verification of recapture information based on their records. The primary recapture information requested by IATTC personnel from finders of DTs or ATs is the recapture date and location, vessel name and type, and the length of the fish. However, many of the tags are recovered by unloaders of purse-seine vessels, and the information commonly provided is the date the tag was found, along with the vessel name and the number of the storage well in which the fish was found. From that information, along with observer records for that trip, it is normally possible to derive reasonable recapture dates and locations for most tags. Additional information on handling tag recoveries and relevant recapture data is given by Bayliff and Holland (1986).
All data on bigeye tagged during the 2000 and 2002-2005 tagging cruises for which DTs and ATs were recovered through 2007 are used in this study.
Data processing
A Microsoft Access database was created in early 2000, specifically to process all tag release and return information from these experiments. A unique field included in this database, is the degree of reliability for each of the values associated with the release and recapture information. This database has numerous custom functions built in for converting positions reported as de-grees, minutes, and seconds to decimal degrees, and calculating distances, directions, and times at liberty. It is also related to the IATTC observer database for gathering ancillary information about the set in which the tagged fish was recovered. Queries are writ-ten to extract release and recapture information from the database in required formats for use in other software packages. Two of the primary packages are Microsoft Excel for statistical analyses and the Environmental Systems Research Institute (ESRI) ArcView for mapping and spatial analyses.
Dart tags
As discussed previously, information provided for DTs found at sea is verified against observer or vessel logbook records to ensure accuracy. For DTs found during unloading and processing of tunas the same records are used to determine most probable recapture date and position based on the information provided by the finder. This is typically based on the storage well in which the tagged fish was reportedly encountered.
Archival tags
Archival tag recapture date is determined directly from the time series data downloaded from the tag. Utilizing this date of recapture and the vessel name provided by the finder, recapture position is determined from the observer or vessel logbook records.
Data from recovered archival tags were downloaded, decoded, and initially processed, using software provided by the tag manufacturers. Position estimates provided from the tag manufacturer’s proprietary software were based on ambient light-level data, with times of sunrise and sunset used to calculate longitude from the time of local noon, and latitude from the local day length (Hill, 1994; Ekstrom, 2004). The raw light-based geolocations obtained for latitude were highly variable and unreliable around the time of the equinoxes due to the nearly constant day length at all latitudes. The crepuscular descending and ascending behavior of bigeye creates further difficulties for estimation of reliable light-based geolocations (Schaefer and Fuller, 2002). Daily sea-surface tempera-tures (SSTs) recorded by the tags matched to SSTs from remote sensing have been shown to significantly improve estimates of lati-tude (Teo et al., 2004; Clear et al., 2005; Domeier et al., 2005; Nielsen et al., 2006).
The unscented Kalman filter model (UKF) (Lam et al., 2008), with SST measurements integrated, was used to obtain im-proved estimates of geographic positions, most probable tracks, and movement parameters. The UKF model, a state-space model in which the transition equation describes the movements, is very similar to the Kalman filter model, with SST measurements inte-grated, described by Nielsen et al. (2006). The UKF model is a better model for handling non-linearities, and also has the advantage that every model parameter is handled within a statistical framework. The UKF model can also utilize remotely-sensed SST data of various spatial resolutions, and automatically estimates the amount of smoothing required for the SST field. The UKF model param-eterizes movement as a biased random walk, with the movement partitioned into directed (u and v) and dispersive (D) movements. The model also estimates the geolocation errors as the longitude (σx) and average latitude (σy) standard deviations.

SCHAEFER AND FULLER
194
Daily SST values derived from the archival tag data were calculated with an algorithm utilizing the ambient temperatures from time series data. Temperatures from all depths less than 5 m were used, unless there were no values less than 5 m for an indi-vidual day, at which point the depth would increase at 1-m intervals. This stepwise increase in depth would continue to a maximum of 8 m, after which an SST estimate was not calculated. The mean of all such temperature values, for each day, was calculated and considered to be the estimate of SST.
Two satellite-derived SST products were acquired and utilized in the UKF model. Initially the NCEP Reynolds Optimally Interpolated 8-d SST composite product with 1º area resolution (accuracy of 0.5° to 0.7ºC), derived from Advanced Very High Res-olution Radiometer (AVHRR) Pathfinder data and in situ measurements of SST (Reynolds and Smith, 1994), was used to obtain model parameters. Those parameters were then used as starting points to rerun the UKF model, using the finer-scale NOAA AVHRR Global Area Coverage (GAC) 8-d SST composite product with 0.1° area resolution (accuracy of 0.3º to 0.5ºC) (Vazquez et al., 1998) to obtain the final estimates of most probable tracks and movement parameters.
Each set of position estimates along the most probable track for individual bigeye, derived from the UKF model, was inte-grated into a Geographic Information System (GIS). The ArcView GIS program and the Animal Movement Analyst Extension (AMAE) (Hooge and Eichenlaub, 1997; Hooge, et al., 2001) were used for spatial analyses of the data sets. This includes the total distance along individual movement paths, mean speed, mean squared distance (MSD) from the center of activity, and the linearity of the path. The MSD and linearity values are measures of the dispersive and directed movements, respectively. We have also esti-mated the dispersion for each movement path relative to time, from the MSD value. The fixed kernel home range model in the AMAE, using the least-squares cross-validation smoothing function, was used to assess probabilistic home ranges of fish. The 95% and 50% utilization distributions (UDs) (probability contours) were chosen to describe the areas probably utilized (95%) and the probable core areas (50%) of activity, respectively, for individual fish. The 95% and 50% UDs were also computed for all fish ag-gregated within years, and quarterly for all years combined, to evaluate annual and seasonal variability in horizontal habitat.
RESULTS
Releases and recoveries of dart tags
The numbers of releases and returns of DTs, by year and time at liberty, are given in Table 1.
All bigeye tagged and released were located and captured while in association with FADs or moored Tropical Atmos-phere-Ocean (TAO) buoys and subsequently after transferring the associated aggregations to that of the drifting vessel.
The percentages of returns for the releases of each year are quite similar except for the fish released in 2000, which may be related to the lesser number of releases and greater lengths of the tagged fish. The high percentage of returns of DTs released in 2003, within 30 d at liberty, are attributable to recaptures by purse-seine vessels of 1,445 fish, 515 of which were recaptured in asso-ciation with the TAO buoy moored at 2°S-95°W, after 10 to 23 days at liberty (DAL). An additional 930 tagged bigeye were recap-tured in association with the TAO buoy moored at 2°N-95°W, after 12 to 61 DAL.
To date 8,426 bigeye have been recaptured, 8,349 (99.1%) by purse-seine vessels, 40 (0.5%) by longline vessels, 10 (0.1%) by the tagging vessel, and 27 (0.3%) by undetermined gear types.
Length distributions of releases by year
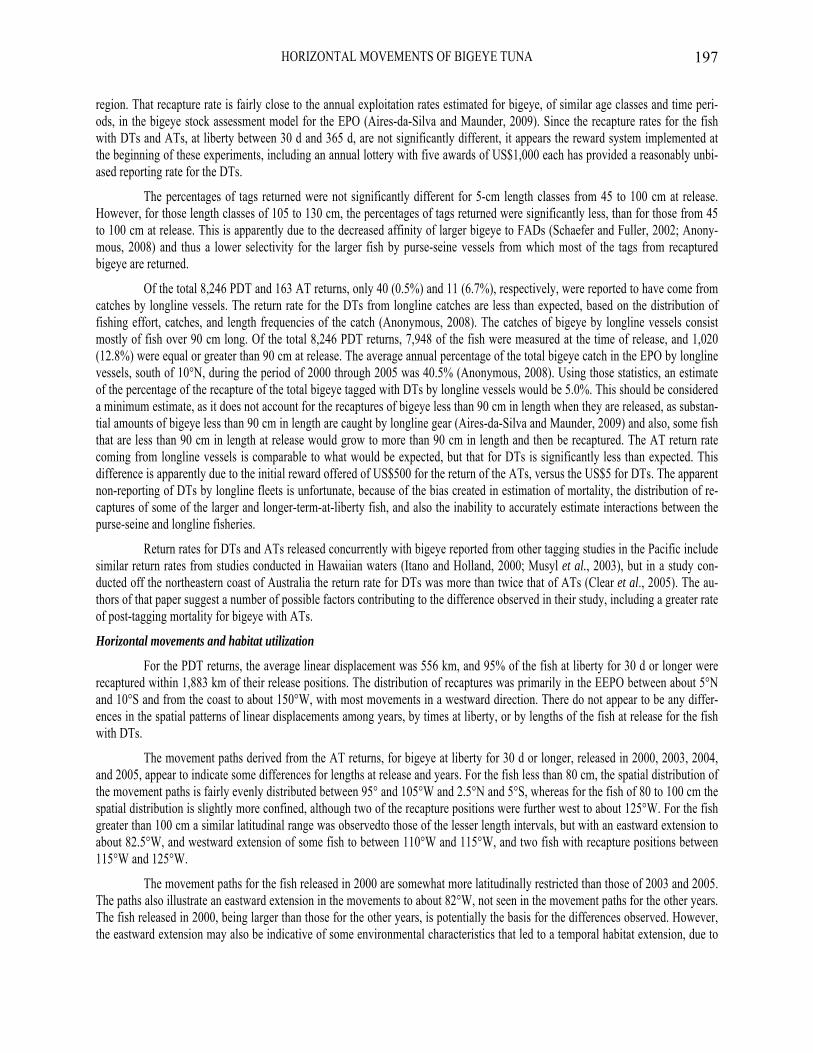
The length-frequency distributions of bigeye released with DTs are given in Figure 1. The average size was greatest, by far, in 2000, and in 2002 and 2005 was considerably less than in 2003 and 2004.
Times at liberty and linear displacements
The times at liberty, linear displacements, and recapture positions for those fish with DTs returned are shown by year(s) of release in Figures 2a-f and descriptive statistics given in Table 2. The average times at liberty ranged from 138 d for fish released in 2002 to 253 d for those released in 2000. The average linear displacements ranged from 459 km for those fish released in 2003 to 966 km for those released in 2005. The primary direction of movement in all years was westward.
For all tag returns the fish with the greatest DAL (2291 d) was recaptured by a longline vessel 2,735 km and 276° from the release position. The fish with the greatest linear displacement (7093 km) was also recaptured by a longline vessel, 284° of the release position after 696 DAL. The distribution of recaptures by 1-degree areas ranges from the most easterly position of 13.28S 77.32W to the most westerly position of 11.78N 157.98W, and from the most northerly position of 11.78N 157.98W to the most

HORIZONTAL MOVEMENTS OF BIGEYE TUNA 195
southerly position of 17.65S 95.12W (Figure 2f C). Of the 6,692 bigeye with greater than 30 DAL, 95% were recaptured within 1,884 km of the release position. The primary directional sector of the linear displacements was 240° to 285°, comprising 43.4% of the observations.
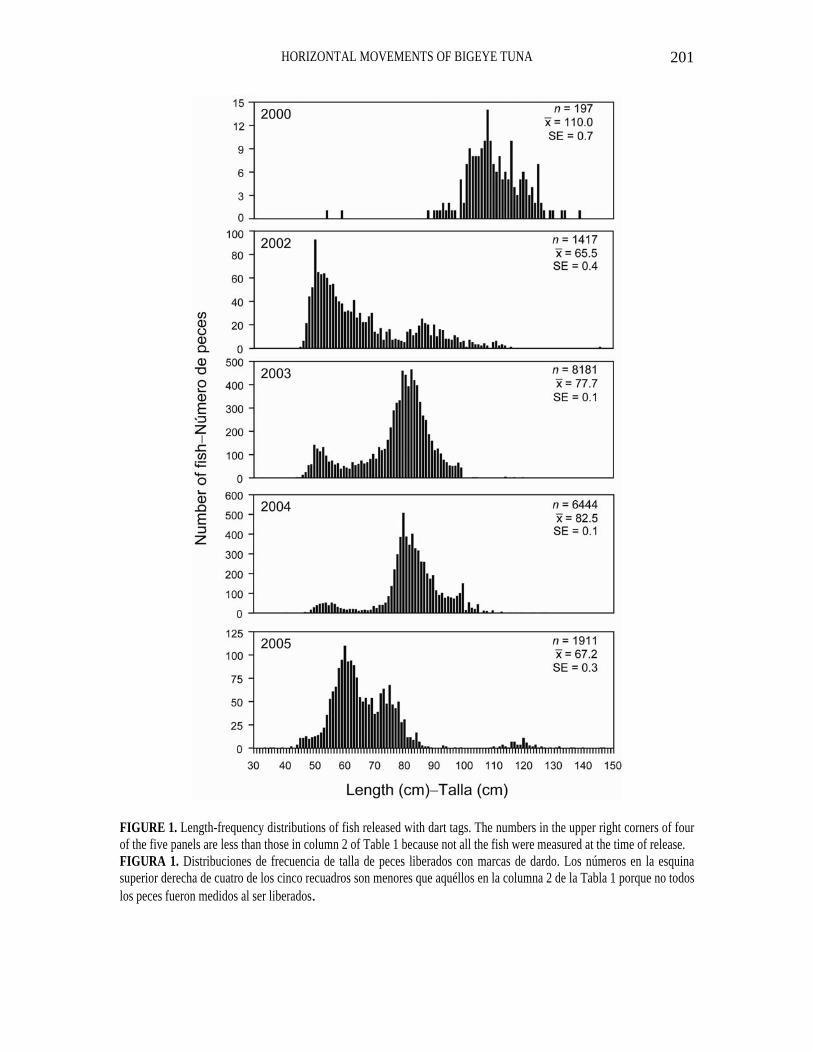
The percentages of all fish recaptured, with their tags returned, within each 5-cm length class at release (Figure 3), indi-cates a fairly consistent 40 to 50 percent for fish to about 100 cm length, but then a rather sharp decline to an average of 24 percent for fish of between 105 and 120 cm, followed by another decline to an average of 12 percent for fish of between 125 and 130 cm. The linear displacements, by times at liberty, for all fish with acceptable recapture information (Figure 4) indicates a significant correlation (r = 0.21, P < 0.05). There does appear to be a pattern indicating most fish remain within 1,852 km of their release posi-tions for up to 600 d at liberty, and that the few linear displacements out to 5,556 km are reached within 200 d at liberty. A plot of the frequency of linear displacements for all fish (Figure 5) indicates a peak at less than 370 km, with a curvilinear decline flattening out at about 2,222 km, and few recaptures at distances greater than 1,852 km.
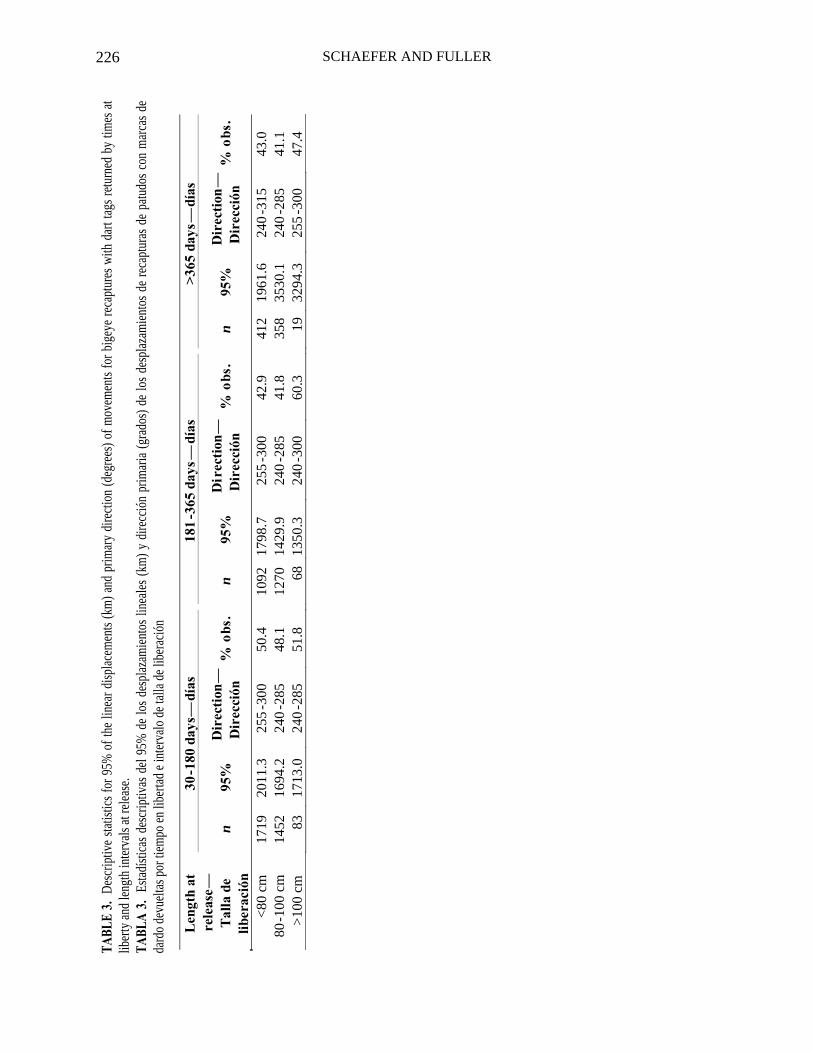
The linear displacements and recapture positions, for those fish with DTs returned, are shown by times at liberty and length intervals at release in Figures 6a-c and descriptive statistics given in Table 3. There appears to be a pattern regarding the lin-ear displacements by length intervals and times at liberty, since fish greater than 80 cm at liberty for more than 365 d show signifi-cantly greater linear displacements than the fish less than 80 cm and those greater than 80 cm at liberty for less than 365 d. The pri-mary direction of movement for all length intervals and times at liberty was westward.
The frequency distributions of linear displacements for fish less than 80 cm, 80 to 100 cm, and greater than 100 cm, recap-tured after 30 to 180 d, 181-365 d, and greater than 365 d (Figures 7a-c), are similar, with the primary modes occurring at less than 1000 km and few observations at greater than 2000 km.
Releases and recoveries of archival tags
The numbers of releases and returns of ATs by year and time at liberty are given in Table 4. The percentages of returns for 2000 and 2002 were significantly less than those for 2003 to 2005, possibly because of the greater average size of the tagged fish in 2000 and lesser average size in 2002 (Figure 8). The high percentage of returns of ATs released in 2003 within 30 d at liberty is attributable to 28 recaptures by a purse-seine vessel and 10 recaptures by the tagging vessel. All 38 fish were recaptured in associa-tion with the TAO buoy moored at 1.98S 95.18W, after 9 to 23 DAL. An additional 3 bigeye with ATs were recaptured in associa-tion with the TAO buoy moored at the 2.00N 95.33W, after 13 to 18 DAL.
Of the 163 bigeye with ATs reported to have been recaptured, 142 (87.1%) were recaptured by purse-seine vessels, 11 (6.7%) by longline vessels, and 10 (6.2%) by the tagging vessel.
Length distributions of releases by year
The length-frequency distributions of bigeye released with ATs by year are given in Figure 8.
Times at liberty
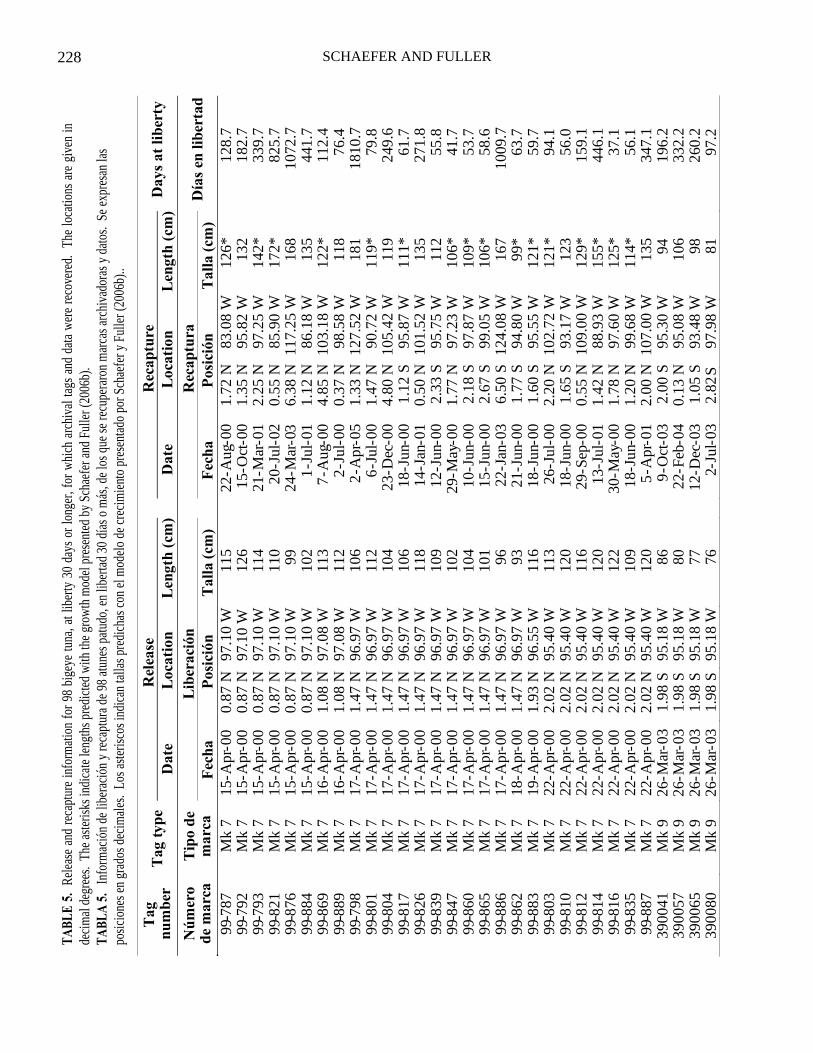
Release and recapture information for 98 bigeye at liberty for 30 d or longer from which AT data were recovered is given in Table 5. The times at liberty ranged from 31 to 2,291 d ( x = 258.4, SE = 35.5). For the releases in 2000, the longest period at liberty was 2,291 d, and the fish was recovered by a longline vessel 2,735 km and 276° of the release position. For the releases in 2003 the longest period at liberty was 1,574 d, and the fish was recovered by a artisanal longline vessel 167 km and 64° of the re-lease position. For the releases in 2004 the a longest period at liberty was 598 d, and the fish was recovered by a purse-seine vessel 526 km and 267° of the release position. For the releases in 2005 the longest period at liberty was 426 d, and the fish was recaptured by a purse-seine vessel 4.5 km and 180° of the release position, at the same TAO mooring where it was released.
Movement paths, model parameters, and spatial statistics
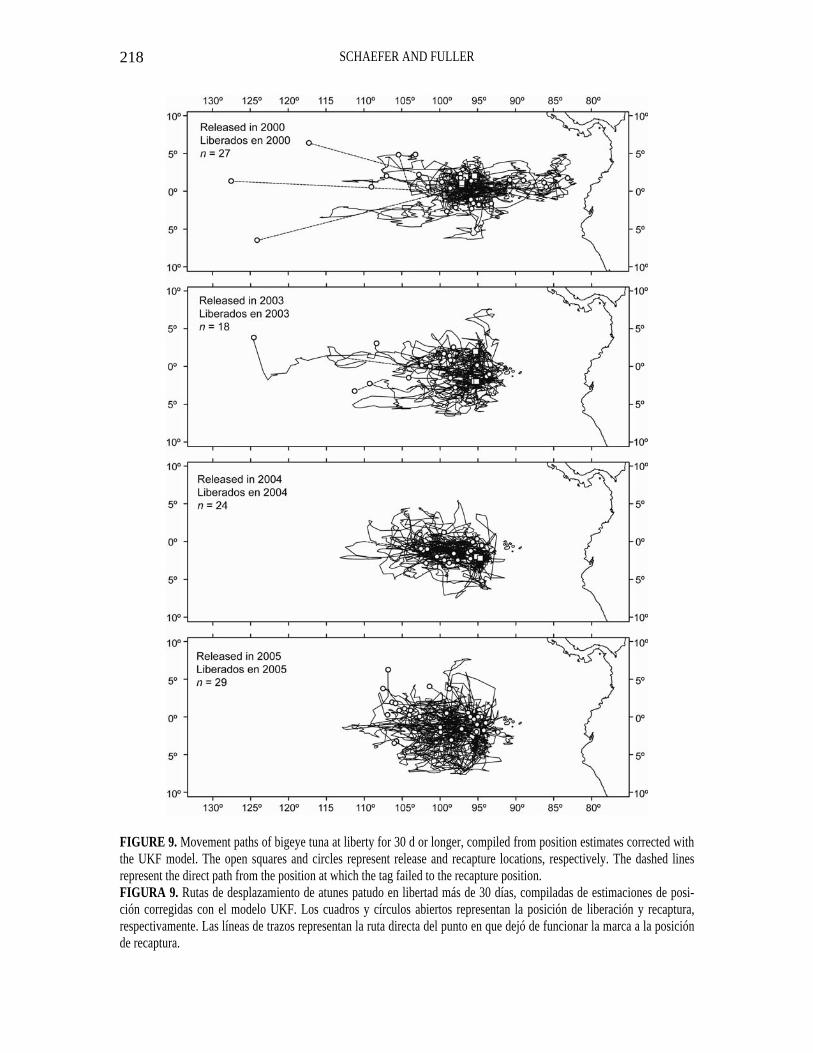
The compiled movement paths for bigeye, at liberty for 30 d or longer, released in 2000, 2003, 2004, and 2005, are shown in Figure 9. The tags deployed in 2002 failed to record any data. The latitudinal movements were confined mostly between 5°N to 5°S, except for releases in 2005, which showed considerable movement to about 7°S. The longitudinal movements were confined mostly between 90°W to 110°W, except for releases in 2000, for which there was some movement as far east as about 83°W and for releases in 2000 and 2003 as far west as about 125°W.

SCHAEFER AND FULLER
196
The parameter estimates from the UKF model for errors in longitude (σx) and latitude (σy), directed movements (u and v) and dispersive movement (D) are summarized by year and for all deployments in Table 6. The estimated eastward (u) and northward (v) directed movement parameters for 2000 are small negative values, unlike those for the other years. The dispersive movement parameters (D) are similar for most years except considerably less than that for 2005.
The percentage of days for which positions were estimated along movement paths from the total days the tag was work-ing, total distance along movement paths, speed along movement paths, linearity, MSD, MSD per month, and the 95% and 50% utilization distributions are given for each fish, and the means for all deployments by year in Table 7. The mean speeds along the movement paths are similar for all years except 2005, for which the mean speed was greater. The mean MSD per month is lowest for 2004 and highest for 2005.
The 95% and 50% UDs compiled for annual periods from the UKF position estimates, for bigeye at liberty 30 d or longer, are shown in Figure 10. The 95% and 50% UDs are greatest for the period April 2000 to March 2001 of 1,593,610 km2 and 256,592 km2, respectively, and least for the period April 2004 to March 2005 of 733,054 km2 and 35,700 km2, respectively.
The movement paths for the bigeye, at liberty for 30 d or longer, released in 2000, 2003, 2004, and 2005, compiled by length class intervals, are shown in Figure 11. For the fish greater than 100 cm in length, a latitudinal range similar to those of the lesser length intervals is observed, but with an eastward extension to about 83°W, and westward extension of 4 fish to between 110°W and 115°W, and 2 fish with recapture positions about 125°W.
The 95% and 50% UDs compiled from the UKF position estimates for all bigeye at liberty for 30 d or longer, by quarter and throughout the year, are shown in Figure 12. The 95% and 50% UDs for the April to June period are more confined than the other quarterly periods because of the limited times at liberty following most releases in April and May (Table 5). The 95% and 50% UDs for the 98 fish (11,585 positions) throughout the year of 1,326,325 km2 and 60,667 km2, respectively, centered between about 3°N and 5°S and 90°W and 105°W clearly illustrate a regionally-restricted horizontal habitat.
The recapture positions for all bigeye releases with DTs and ATs (n = 8,334) along with the outline of the 95% UD from the UKF model position estimates from the AT data overlaid, illustrate the core area with the greatest density of all recapture posi-tions and that probably used by most of the fish, and also the distribution of recaptures outside the core area (Figure 13). There are relatively few recapture positions west of 110°W (4.6%), east of 90°W (2.4%), north of 5°N (1.0%), or south of 5°S (2.7%).
The daily SST observations estimated from the data from the 98 archival tags listed in Table 5 indicate a range of 17.0°C to 31.5°C, with 95% of the observations between 19.5°C and 28.0°C (Figure 14). This indicates that the movement paths observed for fish in this region of the equatorial EPO are most likely influenced by these lower and upper SSTs.
Pacific-wide long-distance movements
The long-distance (>1,852 km) linear displacements of bigeye in the Pacific Ocean from all known tag release and recap-ture positions are shown in Figure 15. The results from tagging in these other areas of the WCPO show similarities to those in this study, with limited numbers of bigeye undertaking long-distance movements. These data clearly indicate the very low level of mix-ing between the eastern and western Pacific, but confirm that there is some mixing of fish between these areas and almost certainly considerable mixing within and between overlapping areas defined by 2,000 km radii across the Pacific.
DISCUSSION
The results obtained in this study, based on relatively large numbers of recoveries of DTs and ATs, over a period of sev-eral years, are informative regarding an understanding of the horizontal movements and population structure of bigeye in the EEPO. The results indicate that horizontal movements of bigeye in this region are limited almost entirely to within about 2,000 km of re-lease locations. Movements of bigeye inferred from deployments and recoveries of DTs in the WCPO (Hampton and Gunn, 1998; Itano and Holland, 2000; Hampton and Williams, 2005), and those from ATs in the western Pacific (Clear et al., 2005) also strongly suggest relatively restricted horizontal movements and regional fidelity to geographically confined areas.
Tag recoveries
The overall return rates for bigeye tagged with DTs (43.1%) and ATs (50.5%) in this study are quite high. The return rates for fish at liberty for 30 d or longer to 365 d, with DTs (30.1%) and ATs (31.0%) are very similar. Assuming that reporting rates are about 100%, a recapture rate of 30% may be representative of the annual exploitation rate of bigeye by purse-seine fisheries in this
HORIZONTAL MOVEMENTS OF BIGEYE TUNA 197
region. That recapture rate is fairly close to the annual exploitation rates estimated for bigeye, of similar age classes and time peri-ods, in the bigeye stock assessment model for the EPO (Aires-da-Silva and Maunder, 2009). Since the recapture rates for the fish with DTs and ATs, at liberty between 30 d and 365 d, are not significantly different, it appears the reward system implemented at the beginning of these experiments, including an annual lottery with five awards of US$1,000 each has provided a reasonably unbi-ased reporting rate for the DTs.
The percentages of tags returned were not significantly different for 5-cm length classes from 45 to 100 cm at release. However, for those length classes of 105 to 130 cm, the percentages of tags returned were significantly less, than for those from 45 to 100 cm at release. This is apparently due to the decreased affinity of larger bigeye to FADs (Schaefer and Fuller, 2002; Anony-mous, 2008) and thus a lower selectivity for the larger fish by purse-seine vessels from which most of the tags from recaptured bigeye are returned.
Of the total 8,246 PDT and 163 AT returns, only 40 (0.5%) and 11 (6.7%), respectively, were reported to have come from catches by longline vessels. The return rate for the DTs from longline catches are less than expected, based on the distribution of fishing effort, catches, and length frequencies of the catch (Anonymous, 2008). The catches of bigeye by longline vessels consist mostly of fish over 90 cm long. Of the total 8,246 PDT returns, 7,948 of the fish were measured at the time of release, and 1,020 (12.8%) were equal or greater than 90 cm at release. The average annual percentage of the total bigeye catch in the EPO by longline vessels, south of 10°N, during the period of 2000 through 2005 was 40.5% (Anonymous, 2008). Using those statistics, an estimate of the percentage of the recapture of the total bigeye tagged with DTs by longline vessels would be 5.0%. This should be considered a minimum estimate, as it does not account for the recaptures of bigeye less than 90 cm in length when they are released, as substan-tial amounts of bigeye less than 90 cm in length are caught by longline gear (Aires-da-Silva and Maunder, 2009) and also, some fish that are less than 90 cm in length at release would grow to more than 90 cm in length and then be recaptured. The AT return rate coming from longline vessels is comparable to what would be expected, but that for DTs is significantly less than expected. This difference is apparently due to the initial reward offered of US$500 for the return of the ATs, versus the US$5 for DTs. The apparent non-reporting of DTs by longline fleets is unfortunate, because of the bias created in estimation of mortality, the distribution of re-captures of some of the larger and longer-term-at-liberty fish, and also the inability to accurately estimate interactions between the purse-seine and longline fisheries.
Return rates for DTs and ATs released concurrently with bigeye reported from other tagging studies in the Pacific include similar return rates from studies conducted in Hawaiian waters (Itano and Holland, 2000; Musyl et al., 2003), but in a study con-ducted off the northeastern coast of Australia the return rate for DTs was more than twice that of ATs (Clear et al., 2005). The au-thors of that paper suggest a number of possible factors contributing to the difference observed in their study, including a greater rate of post-tagging mortality for bigeye with ATs.
Horizontal movements and habitat utilization
For the PDT returns, the average linear displacement was 556 km, and 95% of the fish at liberty for 30 d or longer were recaptured within 1,883 km of their release positions. The distribution of recaptures was primarily in the EEPO between about 5°N and 10°S and from the coast to about 150°W, with most movements in a westward direction. There do not appear to be any differ-ences in the spatial patterns of linear displacements among years, by times at liberty, or by lengths of the fish at release for the fish with DTs.
The movement paths derived from the AT returns, for bigeye at liberty for 30 d or longer, released in 2000, 2003, 2004, and 2005, appear to indicate some differences for lengths at release and years. For the fish less than 80 cm, the spatial distribution of the movement paths is fairly evenly distributed between 95° and 105°W and 2.5°N and 5°S, whereas for the fish of 80 to 100 cm the spatial distribution is slightly more confined, although two of the recapture positions were further west to about 125°W. For the fish greater than 100 cm a similar latitudinal range was observedto those of the lesser length intervals, but with an eastward extension to about 82.5°W, and westward extension of some fish to between 110°W and 115°W, and two fish with recapture positions between 115°W and 125°W.
The movement paths for the fish released in 2000 are somewhat more latitudinally restricted than those of 2003 and 2005. The paths also illustrate an eastward extension in the movements to about 82°W, not seen in the movement paths for the other years. The fish released in 2000, being larger than those for the other years, is potentially the basis for the differences observed. However, the eastward extension may also be indicative of some environmental characteristics that led to a temporal habitat extension, due to

SCHAEFER AND FULLER
198
some unknown desirable physical and/or biological oceanographic features. This difference in annual horizontal habitat utilization is also well illustrated in the 95% UD of the fish during the April 2000 to March 2001 period, from that of the other annual periods, with the eastward extension from about 90°W to about 82°W. The 95% and 50% UDs of the fish for the April 2004 to March 2005 period were also more confined than those for the other three years. Sibert et al. (2006) reported that Atlantic bluefin tuna (Thunnus thynnus) dispersal patterns, based on AT data, also appear to be age or size dependent and exhibited annual variation, presumably linked to oceanographic variability.
It appears that from the large numbers of deployments and recoveries of DTs in this study, along with the high-quality re-capture information obtained mostly from observer records, a reasonable reconstruction of the dispersion of the tagged fish can be obtained. However, the supplementary information of movement paths and parameters obtained from analyses of the AT data is extremely valuable and should be integrated with PDT data for evaluations of population level movements and mixing rates then incorporated into stock assessment models (Sibert and Fournier, 2001). Several different methods have been used for incorporating tagging data into tuna stock assessment models in recent years, and currently evaluations of the most appropriate methods are being undertaken by various organizations (Maunder, 2007). Deployments of ATs should be considered in tuna tagging experimental de-signs along with large deployments of DTs, but cost-benefit analyses should include expected AT return rates within the area, based on results of recent tagging experiments with DTs.
There is apparently no reason why bigeye tagged in this study would need to move from the region for reproduction, since spawning of bigeye has been shown to take place in the eastern and central Pacific Ocean between about 15°N and 15°S and be-tween about 105°W and 175°W, during most months of the year in which the SSTs exceeded about 24°C (Schaefer et al., 2005). The estimated length and age at which 50% of bigeye females were determined to be mature in the eastern and central Pacific was 135 cm and 3.4 y (Schaefer et al., 2005; Schaefer and Fuller, 2006b). Most of the bigeye tagged in this study were probably imma-ture, at the time, but there were numerous recaptures of fish in the EEPO that were larger and older than the length and age at which 50% of the females would be expected to be mature and reproductively active.
The 95% UD of 1,326,325 km2 for the 98 bigeye with ATs at liberty for 30 d or longer, was centered between about 3°N and 5°S and 90°W and 105°W, indicating regional fidelity for bigeye to this area. The greatest-density 10° area observed in the av-erage annual purse-seine catch distribution for bigeye during 1997-2006 is 5°N to 5°S and 95°W to 105°W (Anonymous, 2008: Figure A-3a), which overlaps with the 95% UD derived for the 98 bigeye with ATs.
Habitat requirements for the residence of a large biomass of bigeye, undoubtedly includes high forage concentrations. The oceanography of the area primarily utilized by the 98 bigeye is a very dynamic and highly-productive equatorial upwelling region. This results from the cooler waters of the Peru Current flowing northward and then flowing westward as the equatorial cold tongue of the south equatorial current (Fiedler and Tally, 2006). Advection of the cooler water from the Peru Current and equatorial upwell-ing generate high nutrient concentrations in this specific region, leading to high concentrations of surface chlorophyll and phyto-plankton biomass throughout the year (Pennington et al., 2006) and high zooplankton abundance (Fernandez-Alamo and Farber-Lorda, 2006). During the multivessel EASTROPAC survey cruises, which included investigations of the kinds and abundance of fish larvae (Ahlstrom, 1971; 1972), it was determined that myctophids and gonostomatids, small mesopelagic fish, were abundant throughout the year within the area of the EEPO utilized by tagged bigeye in this study.
High concentration of food are obviously an important environmental factor in the fine-scale distribution and abundance of bigeye, and appear to be one of the primary factors contributing to the observed regional fidelity in this study. Blunt (1960) re-ported that cephalopods and mesopelagic fish were the major components in the diet of bigeye in the EEPO. Squids occurred in 70 percent of the stomachs and contributed to over 60 percent of the volume of food. Mesopelagic fish and cephalopods, along with crustaceans, are the primary components of the vertically migrating deep-scattering layer (DSL), observed throughout the Pacific Ocean (Tont, 1976). Bigeye have adapted some anatomical, morphological, and physiological characteristics that enable them to efficiently forage on prey items within the DSL at night, within the mixed layer, and during the day, at depths of around 300 m (Schaefer, 1999; Schaefer and Fuller, 2002).
Movement parameters
Combining the light-based geolocation estimates with those for SSTs from the 98 bigeye archival tag data sets within the UKF movement model (Lam et al., 2008) has proved to be extremely useful for reconstructing the most probable paths of the tagged bigeye, and obtaining movement parameter estimates. Sibert and Fournier (2001) introduced the state-space statistical model incor-

HORIZONTAL MOVEMENTS OF BIGEYE TUNA 199
porating the Kalman filter to estimate a most probable path and movement parameters. That model was extended by incorporating SST data measured by the archival tag and matching it to SST data from remote sensing sources (Nielsen et al., 2006).
The estimated eastward (u) and northward (v) directed movement parameters obtained from the UKF model for each of the 98 bigeye most probable movement paths were all close to zero. The estimated dispersive movement parameter (D), mean speed along the movement paths, and the mean MSD per month were all considerably greater for the fish released in 2005 than the values for the fish released in 2000, 2003, and 2004. These differences appear to be related to the behavior of the smaller fish released in 2005 (Figures 8 and 11) and not related to annual variability in the environment. The spatial statistics D and MSD/month, appear to be useful and practical statistics describing diffusion, and may be appropriate to include in stock assessment models that have the capacity for movement dynamics.
The eastward (u) and northward (v) directed movement parameters for Atlantic bluefin tuna, estimated from AT data processed with a Kalman filter model, were also close to zero, and the estimates of the non-directed movement parameter D were highly variable, with annual medians ranging from 155 to 317 (Sibert et al., 2006). Although Atlantic bluefin exhibit highly-migratory behavior and wide-ranging dispersal patterns throughout their lives (Block et al., 2005), the median annual DAL in the study by Sibert et al. (2006) were limited from 147 to 215 d, and all the reported and estimated positions occurred in a fairly con-fined area of the northwest Atlantic (Sibert et al., 2006). Thus, it is not surprising that the estimated D values from that study for Atlantic bluefin are less than those for bigeye (Table 6), which do not exhibit highly-migratory behavior.
Population structure
The results of the bigeye tagging experiments from this study, utilizing DTs and ATs, indicate that bigeye in the EEPO have restricted movements, resulting in limited mixing among adjacent areas greater than 1,852 km from their release locations. Movements of bigeye inferred from tagging experiments using DTs in the western Pacific (Hampton and Gunn, 1998; Clear et al., 2005; Hampton and Williams, 2005) and Hawaii (Itano and Holland, 2000) indicate that, although there are some long-distance linear displacements, most are restricted to within 1,852 km of release locations, even after substantial periods at liberty. Movements of bigeye based on a tagging experiment conducted in the Coral Sea, off the north-east coast of Australia, for which 17 ATs were returned after times at liberty of 47 to 1,441 d, with a mean time at liberty of 578 d, indicated that the fish were largely resident in the Coral Sea during their time at liberty, although two of the fish made substantial east-west cyclical move-ments (Clear et al., 2005).
Similar results, indicating restricted movements and regional fidelity, have been reported from analyses of tagging data for yellowfin tuna released with DTs in the EPO (Joseph et al., 1964; Bayliff, 1979), experiments in Hawaii (Itano and Holland, 2000), and from three experiments in the WCPO (Sibert and Hampton, 2003), and also from experiments with yellowfin released with ATs in the EPO (Schaefer et al., 2007).
The results of the present bigeye tagging study and those from other areas of the Pacific indicate that the degree of mixing is quite low between the EPO and the WCPO. The lack of mixing by bigeye across the Pacific has apparently resulted in some geo-graphic variation in life history characteristics, including differences in growth and maturity schedules among fish of the eastern and western Pacific (Schaefer et al., 2005; Schaefer and Fuller, 2006b). Since there is no evidence of genetic differentiation of bigeye in the Pacific (Grewe and Hampton, 1998) these phenotypic differences are apparently the result of isolation-by-distance and environ-mental variation.
The findings of this study suggest the need for regional stock assessments of bigeye in the Pacific Ocean to be based on spatial models that include bigeye movement dynamics, since assumptions about complete mixing over large regional areas are unrealistic, and would lead to serious biases and inappropriate management advice. Furthermore, the spatial stratification within regional and/or Pacific-wide assessments of bigeye should be of scientifically-valid dimensions, and incorporate within such strata geographically–specific fishing mortality rates, life history characteristics, and movement dynamics, including diffusion rates. There is a need for expanding the distribution of bigeye tag deployments in the Pacific, in both longitude and latitude, to obtain a better understanding of the geographic variability in movements and the potential mixing among areas.
ACKNOWLEDGEMENTS
This research was made possible through financial contributions by the Japan Fisheries Agency and the Taiwan Fisheries Agency. We are grateful for invaluable advice by A. Parker and D. Stephenson on the dynamics of FAD fishing. We are thankful to

SCHAEFER AND FULLER
200
Captain B. Blocker and his crews aboard the MV Her Grace for their superb efforts in fishing and tagging operations. We appre-ciate the assistance provided by C. Sepulveda during the 2003 tagging cruise. We are indebted to vessel owners, captains, fish-ermen, unloaders, and industry representatives for returning recovered tags. Thanks also to IATTC field office personnel for their efforts in recovering tags and recapture information. Special thanks is extended to T. Lam, A. Nielsen, and J. Sibert for making the program UKF available, and providing invaluable advice and assistance. Thanks also to J. Hampton (OFP/SPC), D. Itano (PFRP), and T. Matsumoto (NRIFSFRL), for providing the data for long-distance bigeye movements from tagging experi-ments in the WCPO. We also wish to thank W. Bayliff, A. Aires-Da-Silva, and three anonymous reviewers for constructive comments on drafts of the manuscript.
HORIZONTAL MOVEMENTS OF BIGEYE TUNA
201
FIGURE 1. Length-frequency distributions of fish released with dart tags. The numbers in the upper right corners of four of the five panels are less than those in column 2 of Table 1 because not all the fish were measured at the time of release. FIGURA 1. Distribuciones de frecuencia de talla de peces liberados con marcas de dardo. Los números en la esquina superior derecha de cuatro de los cinco recuadros son menores que aquéllos en la columna 2 de la Tabla 1 porque no todos los peces fueron medidos al ser liberados.

SCHAEFER AND FULLER 202
FIGURE 2a. Tag recaptures (n = 57) by time at liberty (A), linear displacement (B) and 1-degree areas (C) for fish re-leased in 2000 at liberty for 30 d or longer (n = 46). Release positions: 3°N 97°W, 2°N 97°W, 1°N 97°W, 2°N 95°W. FIGURA 2a. Recapturas de marcas (n = 57) por meses en libertad (A), desplazamiento lineal (B), y áreas de 1 grado (C) de todos los peces liberados en 2000 en libertad 30 días o más (n = 46). Posiciones de liberación: 3°N 97°O, 2°N 97°O, 1°N 97°O, 2°N 95°O.

HORIZONTAL MOVEMENTS OF BIGEYE TUNA
203
FIGURE 2b. Tag recaptures (n = 581) by time at liberty (A), linear displacement (B), and 1-degree areas (C) for fish released in 2002 at liberty for 30 d or longer (n = 542). Release positions: 5°S 95°W, 2°S 95°W, 0° 95°W, 2°N 95°W. FIGURA 2b. Recapturas de marcas (n = 581) por meses en libertad (A), desplazamiento lineal (B), y áreas de 1 grado (C) de todos los peces liberados en 2002 en 30 días o más (n = 542). Posiciones de liberación: 5°S 95°O, 2°S 95°O, 0° 95°O, 2°N 95°O.

SCHAEFER AND FULLER 204
FIGURE 2c. Tag recaptures (n = 4068) by time at liberty (A), linear displacement (B), and 1-degree areas (C) for fish released in 2003 at liberty for 30 d or longer (n = 2537). Release positions: 2°S 95°W, 2°N 95°W, 3°N 95°W. FIGURA 2c. Recapturas de marcas (n = 4068) por meses en libertad (A), desplazamiento lineal (B), y áreas de 1 grado (C) de todos los peces liberados en 2003 en 30 días o más (n = 2536). Posiciones de liberación: 2°S 95°O, 2°N 95°O, 3°N 95°O.

HORIZONTAL MOVEMENTS OF BIGEYE TUNA
205
FIGURE 2d. Tag recaptures (n = 2822) by time at liberty (A), linear displacement (B), and 1-degree areas (C) for fish released in 2004 at liberty for 30 d or longer (n = 2767). Release positions: 2°S 95°W, 0° 95°W, 2°N 95°W. FIGURA 2d. Recapturas de marcas (n = 2822) por meses en libertad (A), desplazamiento lineal (B), y áreas de 1 grado (C) de todos los peces liberados en 2004 en 30 días o más (n = 2795). Posiciones de liberación: 2°S 95°O, 0° 95°O, 2°N 95°O.

SCHAEFER AND FULLER 206
FIGURE 2e. Tag recaptures (n = 844) by time at liberty (A), linear displacement (B), and 1-degree areas (C) for fish released in 2005 at liberty for 30 d or longer (n = 790). Release positions: 5° S 95° W, 2° S 95° W. FIGURA 2e. Recapturas de marcas (n = 844) por meses en libertad (A), desplazamiento lineal (B), y áreas de 1 grado (C) de todos los peces liberados en 2005 en 30 días o más (n = 790). Posiciones de liberación: 5°S 95°O, 2°S 95°O.

HORIZONTAL MOVEMENTS OF BIGEYE TUNA
207
FIGURE 2f. Tag recaptures (n = 8409) by time at liberty (A), linear displacement (B), and 1-degree areas (C) for fish released in 2000-2005 at liberty for 30 d or longer (n = 6730). Release positions: 5°S 95°W, 2°S 95°W, 0° 95°W, 2°N 95°W, 3°N 95°W, 3°N 97°W, 2°N 97°W, 1°N 97°W. FIGURA 2f. Recapturas de marcas (n = 8409) por meses en libertad (A), desplazamiento lineal (B), y áreas de 1 grado (C) de todos los peces liberados en 2000-2005 30 días o más (n = 6730). Posiciones de liberación: 5°S 95°W, 2°S 95°W, 0° 95°W, 2°N 95°W, 3°N 95°W, 3°N 97°W, 2°N 97°W, 1°N 97°W.
SCHAEFER AND FULLER 208
FIGURE 3. Percent of tagged bigeye tuna returned (n = 8198) within each length class at release. FIGURA 3. Porcentaje de atunes patudo marcados devueltos (n = 8198) en cada clase de talla de liberación.

HORIZONTAL MOVEMENTS OF BIGEYE TUNA
209
FIGURE 4. Linear displacement for time at liberty of 8,333 bigeye tuna recaptures. FIGURA 4. Desplazamiento lineal por tiempo en libertad de 8,333 recapturas de atún patudo.

SCHAEFER AND FULLER 210
FIGURE 5. Distribution of recaptures for 8,333 bigeye tuna, by linear displacement. FIGURA 5. Distribución de las recapturas de 8,333 de atún patudo, por desplazamiento lineal.

HORIZONTAL MOVEMENTS OF BIGEYE TUNA
211
FIGURE 6a. Locations of recaptures (1-degree areas) for fish at liberty from 30 to 180 days. Release positions: 5°S 95°W, 2°S 95°W, 0° 95°W, 2°N 95°W, 3°N 95°W. FIGURA 6a. Posiciones de recaptura (áreas de 1 grado) de peces en libertad entre 30 y 180 días. Posiciones de liberación: 5°S 95°O, 2°S 95°O, 0° 95°O, 2°N 95°W, 3°N 95°O.

SCHAEFER AND FULLER 212
FIGURE 6b. Locations of recaptures (1-degree areas) for fish at liberty from 181 to 365 days. Release positions: 2°S 95°W, 0° 95°W, 2°N 95°W, 1°N 97°W, 2°N 97°W. FIGURA 6b. Posiciones de recaptura (áreas de 1 grado) de peces en libertad entre 181 y 365 días. Posiciones de liberación: 2°S 95°O, 0° 95°O, 2°N 95°O, 1°N 97°O, 2°N 97°O.

HORIZONTAL MOVEMENTS OF BIGEYE TUNA
213
FIGURE 6c. Locations of recaptures (1-degree areas) for fish at liberty for more than 365 days. Release positions: 2°S 95°W, 0° 95°W, 2°N 95°W, 1°N 97°W, 2°N 97°W. FIGURA 6c. Posiciones de recaptura (áreas de 1 grado) de peces en libertad más de 365 días. Posiciones de liberación: 5°S 95°O, 2°S 95°O, 0° 95°O, 2°N 95°W, 3°N 95°O.

SCHAEFER AND FULLER 214
FIGURE 7a. Linear displacements of bigeye tuna less than 80 cm at release. FIGURA 7a. Desplazamientos lineales de atunes patudo de menos de 80 cm de talla de liberación.

HORIZONTAL MOVEMENTS OF BIGEYE TUNA
215
FIGURE 7b. Linear displacements of bigeye tuna 80 to 100 cm at release. FIGURA 7b. Desplazamientos lineales de atunes patudo de entre 80 y 100 cm de talla de liberación.

SCHAEFER AND FULLER 216
FIGURE 7c. Linear displacements of bigeye tuna greater than 100 cm at release. FIGURA 7c. Desplazamientos lineales de atunes patudo de más de 100 cm de talla de liberación.

HORIZONTAL MOVEMENTS OF BIGEYE TUNA
217
FIGURE 8. Length-frequency distributions of bigeye tuna released with archival tags. FIGURA 8. Distribuciones de frecuencia de talla de atunes patudo liberados con marcas archivadoras.
SCHAEFER AND FULLER 218
FIGURE 9. Movement paths of bigeye tuna at liberty for 30 d or longer, compiled from position estimates corrected with the UKF model. The open squares and circles represent release and recapture locations, respectively. The dashed lines represent the direct path from the position at which the tag failed to the recapture position. FIGURA 9. Rutas de desplazamiento de atunes patudo en libertad más de 30 días, compiladas de estimaciones de posi-ción corregidas con el modelo UKF. Los cuadros y círculos abiertos representan la posición de liberación y recaptura, respectivamente. Las líneas de trazos representan la ruta directa del punto en que dejó de funcionar la marca a la posición de recaptura.

HORIZONTAL MOVEMENTS OF BIGEYE TUNA
219
FIGURE 10. The 95% (grey area) and 50% (black area) utilization distributions compiled from the UKF corrected posi-tion estimates, for bigeye tuna at liberty for 30 d or longer. FIGURA 10. Distribuciones de utilización de 95% (área gris) y 50% (área negra) de patudo en libertad 30 días o más, compiladas de estimaciones de posición corregidas con el modelo UKF.

SCHAEFER AND FULLER 220
FIGURE 11. Compiled movement paths from UKF corrected position estimates for bigeye tuna at liberty for 30 d or longer in 2000, 2003, 2004, and 2005. Dashed lines represent the direct paths from the point which a tag failed to the re-capture position. FIGURA 11. Rutas de desplazamiento de atunes patudo en libertad 30 días o más en 2000, 2003, 2004, y 2005, compila-das de estimaciones de posición corregidas con el modelo UKF. Las líneas de trazos representan la ruta directa del punto en que dejó de funcionar la marca a la posición de recaptura.

HORIZONTAL MOVEMENTS OF BIGEYE TUNA
221
FIGURE 12. The 95% (grey area) and 50% (black area) utilization distributions compiled from UKF corrected position estimates for all bigeye at liberty for 30 d or longer. FIGURA 12. Distribuciones de utilización de 95% (área gris) y 50% (área negra) de patudo en libertad 30 días o más, compiladas de estimaciones de posición corregidas con el modelo UKF.

SCHAEFER AND FULLER
222
FIG
UR
E 13
. Dar
t and
arc
hiva
l tag
reca
ptur
e po
sitio
ns (g
rey
circ
les)
and
the
95%
util
izat
ion
distr
ibut
ion
(bla
ck c
onto
ur li
ne) f
rom
the
UK
F co
rrect
ed p
ositi
on e
stim
ates
for a
ll ar
chiv
al ta
gs.
FIG
UR
A 1
3. P
osic
ione
s de
reca
ptur
a de
mar
cas c
onve
ncio
nale
s y a
rchi
vado
ras (
punt
os g
rises
) y la
dist
ribuc
ión
de u
tiliz
ació
n de
95%
(con
torn
o ne
gro)
de
toda
s las
mar
cas a
rchi
-va
dora
s, de
las e
stim
acio
nes d
e po
sició
n co
rregi
das c
on el
mod
elo
UK
F.

HORIZONTAL MOVEMENTS OF BIGEYE TUNA
223
FIG
UR
E 14
. Dai
ly S
ST o
bser
vatio
ns fr
om 9
8 ar
chiv
al ta
gs.
FIG
UR
A 1
4. O
bser
vaci
ones
dia
rias d
e la
TSM
de
98 m
arca
s arc
hiva
dora
s.

SCHAEFER AND FULLER
224
FI
GU
RE
15. L
ong-
dista
nce
(>1,
852
km) m
ovem
ents
of ta
gged
big
eye
tuna
in th
e Pa
cific
Oce
an.
FIG
UR
A 1
5. D
espl
azam
ient
os a
gra
n di
stanc
ia (>
1,85
2 km
) en
el O
céan
o Pa
cífic
o po
r atu
nes p
atud
o m
arca
dos.
HORIZONTAL MOVEMENTS OF BIGEYE TUNA
225
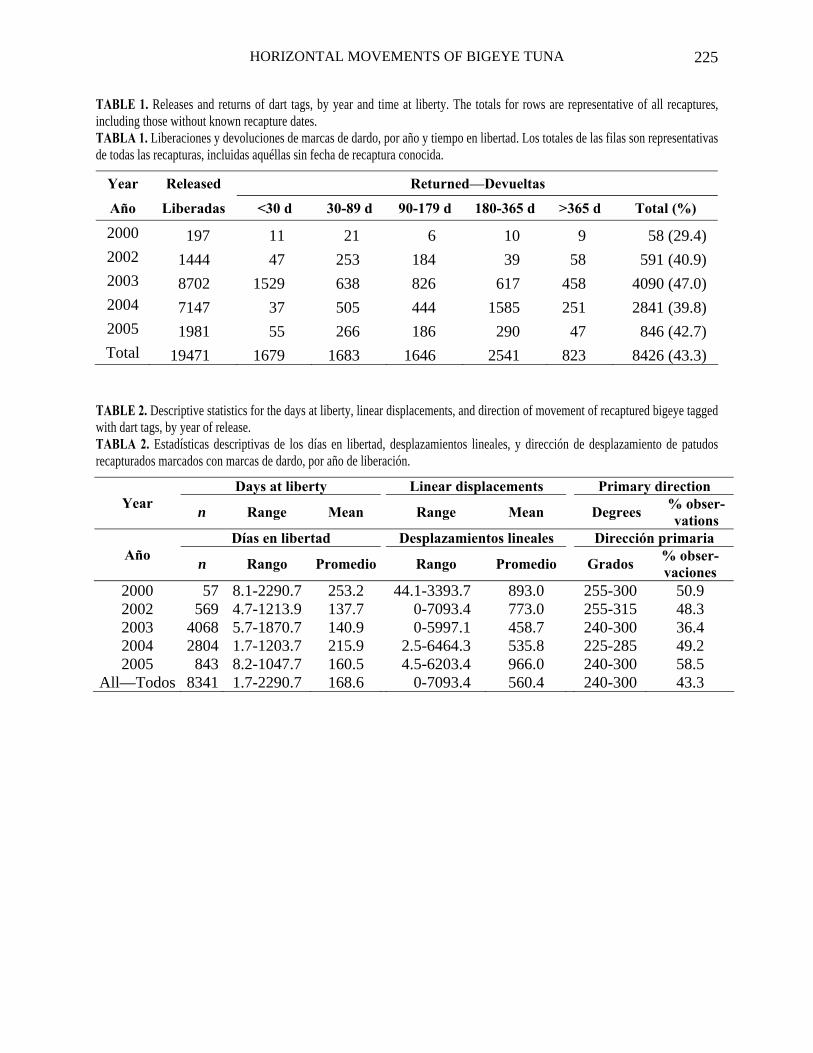
TABLE 1. Releases and returns of dart tags, by year and time at liberty. The totals for rows are representative of all recaptures, including those without known recapture dates. TABLA 1. Liberaciones y devoluciones de marcas de dardo, por año y tiempo en libertad. Los totales de las filas son representativas de todas las recapturas, incluidas aquéllas sin fecha de recaptura conocida.
Year Released Returned—Devueltas
Año Liberadas <30 d 30-89 d 90-179 d 180-365 d >365 d Total (%)
2000 197 11 21 6 10 9 58 (29.4) 2002 1444 47 253 184 39 58 591 (40.9) 2003 8702 1529 638 826 617 458 4090 (47.0) 2004 7147 37 505 444 1585 251 2841 (39.8) 2005 1981 55 266 186 290 47 846 (42.7) Total 19471 1679 1683 1646 2541 823 8426 (43.3)
TABLE 2. Descriptive statistics for the days at liberty, linear displacements, and direction of movement of recaptured bigeye tagged with dart tags, by year of release. TABLA 2. Estadísticas descriptivas de los días en libertad, desplazamientos lineales, y dirección de desplazamiento de patudos recapturados marcados con marcas de dardo, por año de liberación.
Days at liberty Linear displacements Primary direction Year
n Range Mean Range Mean Degrees % obser-vations
Días en libertad Desplazamientos lineales Dirección primaria Año
n Rango Promedio Rango Promedio Grados % obser-vaciones
2000 57 8.1-2290.7 253.2 44.1-3393.7 893.0 255-300 50.9 2002 569 4.7-1213.9 137.7 0-7093.4 773.0 255-315 48.3 2003 4068 5.7-1870.7 140.9 0-5997.1 458.7 240-300 36.4 2004 2804 1.7-1203.7 215.9 2.5-6464.3 535.8 225-285 49.2 2005 843 8.2-1047.7 160.5 4.5-6203.4 966.0 240-300 58.5
All—Todos 8341 1.7-2290.7 168.6 0-7093.4 560.4 240-300 43.3
SCHAEFER AND FULLER
226
30-1
80da
ys—
días
181
-365
days
—dí
as>
365
days
—dí
asL
engt
h at
rele
ase—
Tal
lade
libe
raci
ónn
95%
Dir
ecti
onD
irec
ción
%o
bs.
n95
%D
irec
tion
Dir
ecci
ón%
obs
.n
95%
Dir
ecti
onD
irec
ción
%o
bs.
<80
cm17
1920
11.3
255
-300
50.4
1092
1798
.725
5-3
0042
.941
219
61.6
240
-315
43.0
80-1
00cm
1452
1694
.224
0-2
8548
.112
7014
29.9
240
-285
41.8
358
3530
.124
0-2
8541
.1>
100
cm83
1713
.024
0-2
8551
.868
1350
.324
0-3
0060
.319
3294
.325
5-3
0047
.4
——
—
TABL
E 3.
Des
crip
tive
statis
tics
for 9
5% o
f the
line
ar d
ispla
cem
ents
(km
) and
prim
ary
dire
ctio
n (d
egre
es) o
f mov
emen
ts fo
r big
eye
reca
ptur
es w
ith d
art t
ags
retu
rned
by
times
at
liber
ty a
nd le
ngth
inte
rval
s at r
elea
se.
TABL
A 3
. Es
tadí
stica
s de
scrip
tivas
del
95%
de
los
desp
laza
mie
ntos
line
ales
(km
) y d
irecc
ión
prim
aria
(gra
dos)
de
los
desp
laza
mie
ntos
de
reca
ptur
as d
e pa
tudo
s co
n m
arca
s de
da
rdo
devu
elta
s por
tiem
po e
n lib
erta
d e
inte
rval
o de
talla
de l
iber
ació
n

HORIZONTAL MOVEMENTS OF BIGEYE TUNA
227
TABLE 4. Releases and returns of archival tags, by year and time at liberty. TABLA 4. Liberaciones y devoluciones de marcas archivadoras, por año y tiempo en libertad.
Returned—Devueltas Year Año
Released—Liberadas <30 d 30-89 d 90-179 d 180-365 d >365 d Total (%)
2000 96 5 14 4 5 8 36 (37.5)
2002 26 1 2 4 1 0 8 (30.8)
2003 90 38 2 6 6 3 55 (61.1)
2004 58 3 4 8 12 5 32 (55.2)
2005 53 0 10 8 14 1 33 (62.3)
Total 323 47 32 30 38 16 163 (50.5)
SCHAEFER AND FULLER
228
Rel
ease
Rec
aptu
reT
agnu
mbe
rT
agty
peD
ate
Loc
atio
nL
engt
h (c
m)
Dat
eL
ocat
ion
Len
gth
(cm
)D
ays
at li
bert
y
Lib
erac
ión
Rec
aptu
raN
úmer
ode
mar
caT
ipo
dem
arca
Fec
haP
osic
ión
Tal
la (
cm)
Fec
haP
osic
ión
Tal
la (
cm)
Día
s en
libe
rtad
99-7
87M
k 7
15-A
pr-0
00.
87 N
97.1
0 W
115
22-A
ug-0
01.
72 N
83.0
8 W
126*
128.
799
-792
Mk
715
-Apr
-00
0.87
N97
.10
W12
615
-Oct
-00
1.35
N95
.82
W13
218
2.7
99-7
93M
k 7
15-A
pr-0
00.
87 N
97.1
0 W
114
21-M
ar-0
12.
25 N
97.2
5 W
142*
339.
799
-821
Mk
715
-Apr
-00
0.87
N97
.10
W11
020
-Jul
-02
0.55
N85
.90
W17
2*82
5.7
99-8
76M
k 7
15-A
pr-0
00.
87 N
97.1
0 W
99
24-M
ar-0
36.
38 N
117.
25 W
168
1072
.799
-884
Mk
715
-Apr
-00
0.87
N97
.10
W10
21-
Jul-
011.
12 N
86.1
8 W
135
441.
799
-869
Mk
716
-Apr
-00
1.08
N97
.08
W11
37-
Aug
-00
4.85
N10
3.18
W12
2*11
2.4
99-8
89M
k 7
16-A
pr-0
01.
08 N
97.0
8 W
112
2-Ju
l-00
0.37
N98
.58
W11
876
.499
-798
Mk
717
-Apr
-00
1.47
N96
.97
W10
62-
Apr
-05
1.33
N12
7.52
W18
118
10.7
99-8
01M
k 7
17-A
pr-0
01.
47 N
96.9
7 W
112
6-Ju
l-00
1.47
N90
.72
W11
9*79
.899
-804
Mk
717
-Apr
-00
1.47
N96
.97
W10
423
-Dec
-00
4.80
N10
5.42
W11
924
9.6
99-8
17M
k 7
17-A
pr-0
01.
47 N
96.9
7 W
106
18-J
un-0
01.
12 S
95.8
7 W
111*
61.7
99-8
26M
k 7
17-A
pr-0
01.
47 N
96.9
7 W
118
14-J
an-0
10.
50 N
101.
52 W
135
271.
899
-839
Mk
717
-Apr
-00
1.47
N96
.97
W10
912
-Jun
-00
2.33
S95
.75
W11
255
.899
-847
Mk
717
-Apr
-00
1.47
N96
.97
W10
229
-May
-00
1.77
N97
.23
W10
6*41
.799
-860
Mk
717
-Apr
-00
1.47
N96
.97
W10
410
-Jun
-00
2.18
S97
.87
W10
9*53
.799
-865
Mk
717
-Apr
-00
1.47
N96
.97
W10
115
-Jun
-00
2.67
S99
.05
W10
6*58
.699
-886
Mk
717
-Apr
-00
1.47
N96
.97
W 9
622
-Jan
-03
6.50
S12
4.08
W16
710
09.7
99-8
62M
k 7
18-A
pr-0
01.
47 N
96.9
7 W
93
21-J
un-0
01.
77 S
94.8
0 W
99*
63.7
99-8
83M
k 7
19-A
pr-0
01.
93 N
96.5
5 W
116
18-J
un-0
01.
60 S
95.5
5 W
121*
59.7
99-8
03M
k 7
22-A
pr-0
02.
02 N
95.4
0 W
113
26-J
ul-0
02.
20 N
102.
72 W
121*
94.1
99-8
10M
k 7
22-A
pr-0
02.
02 N
95.4
0 W
120
18-J
un-0
01.
65 S
93.1
7 W
123
56.0
99-8
12M
k 7
22-A
pr-0
02.
02 N
95.4
0 W
116
29-S
ep-0
00.
55 N
109.
00 W
129*
159.
199
-814
Mk
722
-Apr
-00
2.02
N95
.40
W12
013
-Jul
-01
1.42
N88
.93
W15
5*44
6.1
99-8
16M
k 7
22-A
pr-0
02.
02 N
95.4
0 W
122
30-M
ay-0
01.
78 N
97.6
0 W
125*
37.1
99-8
35M
k 7
22-A
pr-0
02.
02 N
95.4
0 W
109
18-J
un-0
01.
20 N
99.6
8 W
114*
56.1
99-8
87M
k 7
22-A
pr-0
02.
02 N
95.4
0 W
120
5-A
pr-0
12.
00 N
107.
00 W
135
347.
139
0041
Mk
926
-Mar
-03
1.98
S95
.18
W 8
69-
Oct
-03
2.00
S95
.30
W94
196.
239
0057
Mk
926
-Mar
-03
1.98
S95
.18
W 8
022
-Feb
-04
0.13
N95
.08
W10
633
2.2
3900
65M
k 9
26-M
ar-0
31.
98 S
95.1
8 W
77
12-D
ec-0
31.
05 S
93.4
8 W
98
260.
239
0080
Mk
926
-Mar
-03
1.98
S95
.18
W 7
6
2-J
ul-0
32.
82S
97.9
8 W
81
97.2
TABL
E 5.
Rel
ease
and
reca
ptur
e in
form
atio
n fo
r 98
bige
ye tu
na, a
t lib
erty
30
days
or l
onge
r, fo
r whi
ch a
rchi
val t
ags
and
data
wer
e re
cove
red.
The
loca
tions
are
giv
en in
de
cim
al d
egre
es.
The
aste
risks
indi
cate
leng
ths p
redi
cted
with
the
grow
th m
odel
pre
sent
ed b
y Sc
haef
er a
nd F
ulle
r (20
06b)
. TA
BLA
5.
Info
rmac
ión
de li
bera
ción
y re
capt
ura
de 9
8 at
unes
pat
udo,
en
liber
tad
30 d
ías o
más
, de l
os q
ue se
recu
pera
ron
mar
cas a
rchi
vado
ras y
dat
os.
Se e
xpre
san
las
posic
ione
s en
grad
os d
ecim
ales
. Lo
s aste
risco
s ind
ican
talla
s pre
dich
as c
on e
l mod
elo
de c
reci
mie
nto
pres
enta
do p
or S
chae
fer y
Ful
ler (
2006
b)..

HORIZONTAL MOVEMENTS OF BIGEYE TUNA
229
TABL
E 5.
(co
ntin
ued)
TA
BLA
5.
(con
tinua
ción
)
Rel
ease
Rec
aptu
reT
agnu
mbe
rT
agty
peD
ate
Loc
atio
nL
engt
h (c
m)
Dat
eL
ocat
ion
Len
gth
(cm
)D
ays
at li
bert
y
Lib
erac
ión
Rec
aptu
raN
úmer
ode
mar
caT
ipo
dem
arca
Fec
haP
osic
ión
Tal
la (
cm)
Fec
haP
osic
ión
Tal
la (
cm)
Día
s en
libe
rtad
1116
LT
D 2
310
4-A
pr-0
31.
98 S
95.1
8 W
69
7-
Oct
-04
1.42
N98
.72
W11
955
1.2
3900
60M
k 9
4-A
pr-0
31.
98 S
95.1
8 W
121
27-
Jul-
071.
33 S
93.8
3 W
190
1574
.239
0061
Mk
94-
Apr
-03
1.98
S95
.18
W 8
3 8
-Nov
-03
3.05
N10
8.37
W10
021
7.2
3900
95M
k 9
4-A
pr-0
31.
98 S
95.1
8 W
77
30-
Jul-
031.
68 N
99.4
7 W
87
116.
211
07L
TD
231
06-
Apr
-03
1.98
S95
.18
W11
915
-Nov
-03
1.52
S98
.62
W 1
37*
222.
111
13L
TD
231
09-
Apr
-03
1.98
S95
.18
W11
5 8
-Nov
-03
1.50
S10
4.12
W12
821
2.1
1110
LT
D 2
310
12-A
pr-0
31.
98 S
95.1
8 W
100
18-J
un-0
30.
15 N
102.
40 W
106
*66
.211
02L
TD
231
013
-Apr
-03
1.98
S95
.18
W10
130
-Apr
-05
3.82
N12
4.57
W15
574
7.2
3900
52M
k 9
6-M
ay-0
32.
00 N
95.3
3 W
81
23-A
ug-0
3 0
.01
N10
1.33
W 8
910
8.1
3900
56M
k 9
6-M
ay-0
32.
00 N
95.3
3 W
88
9-A
ug-0
30.
80 N
98.6
2 W
91
94.1
3900
69M
k 9
6-M
ay-0
32.
00 N
95.3
3 W
82
18-S
ep-0
32.
27 S
109.
28 W
92
134.
139
0072
Mk
96-
May
-03
2.00
N95
.33
W 9
023
-Sep
-03
3.27
S11
1.27
W10
213
9.1
1105
LT
D 2
310
11-M
ay-0
32.
00 N
95.3
3 W
109
28-
Jul-
032.
53 N
98.2
2 W
111
77.2
1100
LT
D 2
310
6-M
ay-0
41.
98 S
95.1
7 W
57
7-Ju
n-04
0.33
N95
.08
W 5
831
.211
11L
TD
231
06-
May
-04
1.98
S95
.17
W 8
820
-Nov
-04
2.87
S10
1.83
W10
819
7.2
2318
LT
D 2
310
6-M
ay-0
41.
98 S
95.1
7 W
54
19-J
un-0
42.
57 S
96.1
7 W
59*
43.2
1082
LT
D 2
310
7-M
ay-0
41.
98 S
95.1
7 W
88
12-F
eb-0
51.
20 N
99.4
7 W
114
280.
211
07L
TD
231
07-
May
-04
1.98
S95
.17
W 8
927
-Aug
-04
1.47
S96
.28
W 9
711
1.2
2308
LT
D 2
310
7-M
ay-0
41.
98 S
95.1
7 W
88
19-J
un-0
42.
57 S
96.1
7 W
88
42.2
2313
LT
D 2
310
7-M
ay-0
41.
98 S
95.1
7 W
83
26-D
ec-0
40.
52 S
94.7
8 W
104
232.
223
26L
TD
231
07-
May
-04
1.98
S95
.17
W 8
720
-Oct
-04
1.25
S95
.93
W10
016
5.2
2540
LT
D 2
310
7-M
ay-0
41.
98 S
95.1
7 W
123
4-Fe
b-05
1.17
S10
2.22
W 1
44*
272.
225
41L
TD
231
07-
May
-04
1.98
S95
.17
W 8
825
-Nov
-04
2.00
S10
0.40
W10
620
1.2
1103
LT
D 2
310
8-M
ay-0
41.
98 S
95.1
7 W
87
22-O
ct-0
42.
53 S
96.0
2 W
102
*16
6.2
1117
LT
D 2
310
8-M
ay-0
41.
98 S
95.1
7 W
87
18-O
ct-0
42.
47 S
97.6
3 W
100
162.
223
25L
TD
231
08-
May
-04
1.98
S95
.17
W 8
429
-Sep
-04
0.93
N10
2.67
W 9
614
3.2
2332
LT
D 2
310
8-M
ay-0
41.
98 S
95.1
7 W
87
23-N
ov-0
40.
95 S
102.
22 W
105
198.
239
0057
Mk
98-
May
-04
1.98
S95
.17
W 9
723
-Nov
-04
0.95
S10
2.50
W 1
14*
198.
239
0041
Mk
910
-May
-04
2.2
S94
.7 W
95
30-D
ec-0
52.
47 S
99.4
3 W
142
598.
239
0045
Mk
910
-May
-04
2.2
S94
.7 W
95
13-N
ov-0
42.
70 S
99.4
2 W
112
186.
239
0055
Mk
910
-May
-04
2.2
S94
.7 W
85
19-J
un-0
42.
57 S
96.1
7 W
88
39.2
3900
63M
k 9
10-M
ay-0
42.
2 S
94.7
W 8
725
-Oct
-04
2.85
S98
.78
W 9
416
7.2
3900
70M
k 9
10-M
ay-0
42.
2 S
94.7
W 9
520
-Oct
-04
2.28
S95
.98
W 1
0816
2.2
3900
72M
k 9
10-M
ay-0
42.
2 S
94.7
W 8
730
-Dec
-05
2.47
S99
.43
W 1
37*
598.
239
0075
Mk
910
-May
-04
2.2
S94
.7 W
878-
Dec
-04
0.53
S94
.48
W 1
06*
211.
2

SCHAEFER AND FULLER
230
TABL
E 5.
(co
ntin
ued)
TA
BLA
5.
(con
tinua
ción
)
Rel
ease
Rec
aptu
reT
agnu
mbe
rT
agty
peD
ate
Loc
atio
nL
engt
h (c
m)
Dat
eL
ocat
ion
Len
gth
(cm
)D
ays
at li
bert
y
Lib
erac
ión
Rec
aptu
raN
úmer
ode
mar
caT
ipo
dem
arca
Fec
haP
osic
ión
Tal
la (
cm)
Fec
haP
osic
ión
Tal
la (
cm)
Día
s en
libe
rtad
3900
98M
k 9
10-M
ay-0
42.
2 S
94.7
W 8
625
-Nov
-04
1.00
S10
1.68
W 1
0419
8.2
3900
100
Mk
910
-May
-04
2.2
S94
.7 W
85
28-D
ec-0
40.
07 S
95.6
7 W
104
231.
210
82L
TD
231
014
-Apr
-05
1.94
S95
.18
W 6
04-
Jul-
053.
23 S
105.
75 W
65
80.2
1100
LT
D 2
310
14-A
pr-0
51.
94 S
95.1
8 W
67
25-J
ul-0
51.
78 S
94.2
0 W
74
101.
211
03L
TD
231
014
-Apr
-05
1.94
S95
.18 W
73
17-J
un-0
50.
05 N
102.
70 W
7
9*63
.211
11L
TD
231
014
-Apr
-05
1.94
S95
.18
W 7
98-
Feb-
060.
02 N
94.5
3 W
103
299.
223
12L
TD
231
014
-Apr
-05
1.94
S95
.18
W 7
320
-Jun
-05
0.85
N10
5.37
W
80*
66.2
2325
LT
D 2
310
14-A
pr-0
51.
94 S
95.1
8 W
7328
-Oct
-05
1.18
N10
3.72
W
92*
196.
223
30L
TD
231
014
-Apr
-05
1.94
S95
.18
W 7
615
-Jul
-05
0.25
N10
4.03
W 8
691
.225
41L
TD
231
014
-Apr
-05
1.94
S95
.18
W 7
711
-Dec
-05
1.93
N10
6.32
W 9
724
0.2
2633
LT
D 2
310
14-A
pr-0
51.
94 S
95.1
8 W
99
8-Ju
n-05
3.75
N10
7.52
W10
154
.240
10L
TD
231
014
-Apr
-05
1.94
S95
.18
W 7
429
-Jul
-05
4.03
N10
1.37
W
84*
105.
240
19L
TD
231
014
-Apr
-05
1.94
S95
.18
W 6
515
-Jul
-05
1.58
S97
.15
W 7
375
.240
30L
TD
231
014
-Apr
-05
1.94
S95
.18
W 7
826
-Jun
-05
0.02
N96
.00
W 8
872
.240
70L
TD
231
014
-Apr
-05
1.94
S95
.18
W 8
021
-Nov
-05
0.78
S93
.95
W 1
00*
220.
240
92L
TD
231
014
-Apr
-05
1.94
S95
.18
W 6
98-
Aug
-05
3.72
N98
.73
W 8
111
5.2
4100
LT
D 2
310
14-A
pr-0
51.
94 S
95.1
8 W
67
8-Ju
n-05
3.75
N10
7.52
W
73*
54.2
3900
70M
k 9
14-A
pr-0
51.
94 S
95.1
8 W
64
1-N
ov-0
56.
25 N
106.
85 W
77
200.
239
0075
Mk
914
-Apr
-05
1.94
S95
.18
W 7
815
-Jun
-06
1.98
S95
.18
W11
042
6.2
3900
45M
k 9
14-A
pr-0
51.
94 S
95.1
8 W
63
4-Ju
l-05
0.48
N99
.12
W
71*
80.2
4009
LT
D 2
310
15-A
pr-0
51.
94 S
95.1
8 W
74
25-J
ul-0
51.
78 S
94.2
0 W
81
100.
240
16L
TD
231
015
-Apr
-05
1.94
S95
.18
W 6
323
-Nov
-05
0.55
N96
.27
W
7922
1.2
4023
LT
D 2
310
15-A
pr-0
51.
94 S
95.1
8 W
78
20-N
ov-0
51.
37 S
99.9
5 W
9
8*21
8.2
4026
LTD
231
015
-Apr
-05
1.94
S95
.18
W 7
624
-Feb
-06
2.03
S99
.90
W 1
05*
314.
240
35L
TD
231
015
-Apr
-05
1.94
S95
.18
W 7
811
-Apr
-06
2.00
S92
.35
W11
136
0.2
4036
LT
D 2
310
15-A
pr-0
51.
94 S
95.1
8 W
77
27-M
ay-0
53.
07 S
98.5
0 W
8
1*41
.240
38L
TD
231
015
-Apr
-05
1.94
S95
.18
W 6
014
-Oct
-05
0.27
N10
6.90
W
78*
181.
249
0915
Mk
915
-Apr
-05
1.94
S95
.18
W 7
914
-Oct
-05
0.32
S95
.50
W
9018
1.2
4909
16M
k 9
15-A
pr-0
51.
94 S
95.1
8 W
76
22-J
un-0
50.
87 N
104.
12 W
8
2*67
.259
0053
Mk
915
-Apr
-05
1.94
S95
.18
W 7
727
-Nov
-05
1.00
S95
.08
W
98*
225.
259
0054
Mk
915
-Apr
-05
1.94
S95
.18
W 7
718
-Jul
-05
0.85
N10
3.88
W
8693
.2

HORIZONTAL MOVEMENTS OF BIGEYE TUNA
231
Yea
r
Añ
o
σx
(deg
rees
)
σx
(gra
dos
)
σy
(deg
rees
)
σy
(gra
dos
)
u(n
m/d
)
u(m
n/d)
v (n
m/d
)
v(m
n/d)
D (
nm
2/d
)
D(m
n2/d
)
2000
Med
ian
Med
iana
0.19
2.54
-0.1
5-0
.81
398.
15
2000
Ran
geR
ango
0.00
001-
0.43
0.77
-7.0
4-6
.82
-4.9
6-1
5.27
-5.0
919
3.81
-115
7.40
2003
Med
ian
Med
iana
0.40
2.45
2.63
0.69
465.
69
2003
Ran
geR
ango
0.00
001-
1.14
0.55
-7.4
3-0
.35
-6.9
1-5
.81-
11.6
415
8.00
-103
6.15
2004
Med
ian
Med
iana
0.36
2.07
1.35
0.34
410.
39
2004
Ran
geR
ango
0.00
002-
1.71
0.20
-4.9
4-3
.94
-10.
44-3
.69
-8.4
338
.33-
1307
.10
2005
Med
ian
Med
iana
0.2
62.
502.
262.
0268
5.10
2005
Ran
geR
ango
0.00
001-
1.20
0.45
-19.
67-2
.68
-13.
97-1
2.43
-8.0
618
0.92
-125
3.96
Tot
alM
edia
nM
edia
na0.
272.
341.
250.
3546
4.59
Tot
alR
ange
Ran
go0.
0000
1-1.
710.
20-1
9.67
-6.8
2-1
3.97
-15.
27-1
1.64
38.3
4-1
307.
10
— — — — — — — — — —
TABL
E 6.
Par
amet
er e
stim
ates
from
the
unsc
ente
d K
alm
an fi
lter m
odel
, by
year
of r
elea
se, f
or th
e fis
h lis
ted
in T
able
5.
TABL
A 6
. Es
timac
ione
s de
pará
met
ros d
el m
odel
o U
KF
(uns
cent
ed K
alm
an fi
lter)
, por
año
de l
iber
ació
n, p
ara
los p
eces
en
la T
abla
5.

SCHAEFER AND FULLER
232
Tag
num
ber
n%
Dis
tan
ce(k
m)
xsp
eed
(km
/d)
Lin
eari
tyM
SD
(km
104 )
MSD
/Mon
th95
%U
D(k
m2 )
50%
UD
(km
2 )N
úm
ero
de
mar
can
%D
ista
nci
a(k
m)
xve
loci
dad
(km
/d)
Lin
eali
dad
DM
C(k
m10
4 )D
MC
/Mes
95%
DU
(km
2 )50
%D
U(k
m2 )
99-7
8711
689
.135
21.8
27.3
0.45
41.1
9.6
9181
54.7
1031
25.0
99-7
9215
684
.775
48.0
41.2
0.03
16.2
2.7
6889
83.9
1412
50.2
99-7
9316
998
.283
22.9
46.9
0.02
7.9
1.4
4543
85.1
5811
5.5
99-8
2127
381
.094
80.5
24.7
0.02
7.2
0.6
3491
99.4
4041
9.7
99-8
7625
396
.513
474.
541
.70.
0311
.81.
472
4810
.312
4245
.899
-884
160
50.3
7823
.622
.10.
058.
00.
843
5175
.211
5386
.299
-869
107
93.8
5844
.051
.70.
1419
.85.
380
8940
.112
4428
.199
-889
6684
.443
66.1
56.7
0.04
7.2
2.8
4629
90.4
8728
0.7
99-7
9825
793
.820
361.
063
.40.
1999
.511
.028
4623
1.2
4227
53.5
99-8
0171
87.5
3889
.648
.60.
1716
.26.
149
8828
.171
271.
999
-804
164
93.7
6214
.932
.50.
1318
.43.
250
3892
.256
703.
499
-817
5485
.514
20.0
22.9
0.23
3.8
1.8
1572
34.6
3184
0.9
99-8
2622
582
.715
885.
058
.40.
0335
.13.
910
3178
0.5
9348
2.9
99-8
3954
96.4
2696
.148
.10.
162.
11.
113
5364
.811
894.
799
-847
4310
0.0
1147
.027
.30.
091.
00.
772
990.
372
06.4
99-8
6055
100.
020
24.6
37.5
0.20
3.3
1.8
1505
30.4
2830
399
-865
5083
.128
72.2
48.7
0.18
3.7
1.9
2292
20.5
3827
1.4
99-8
8612
263
.810
933.
242
.80.
036.
41.
050
2852
.314
8535
.999
-862
3857
.813
36.1
20.9
0.30
1.9
0.9
9437
6.4
1494
7.7
99-8
8351
83.3
1470
.424
.50.
251.
60.
898
475.
719
288.
399
-803
7678
.942
42.8
44.7
0.19
11.4
3.6
5145
66.3
6541
8.2
99-8
1045
77.2
1998
.235
.10.
242.
31.
213
2231
.719
784.
2
TA
BLE
7. S
patia
l sta
tistic
s for
98
bige
ye tu
na, a
t lib
erty
for 3
0 da
ys o
r lon
ger,
base
d on
pos
ition
esti
mat
es fr
om th
e un
scen
ted
Kal
man
filte
r mod
el.
n is
the
tota
l num
ber o
f pos
i-tio
n es
timat
es in
the
data
set a
nd %
is th
e pe
rcen
tage
of p
ositi
ons f
rom
the
com
plet
e re
cord
. D
istan
ce is
the
tota
l dist
ance
trav
eled
, per
dat
aset
. Li
near
ity is
the
ratio
of t
he d
istan
ce
betw
een
the
data
set e
ndpo
ints
and
the
tota
l dist
ance
trav
eled
. M
SD is
the
mea
n sq
uare
d di
stanc
e fro
m th
e ce
nter
of a
ctiv
ity. M
SD/M
onth
is th
e M
SD v
alue
div
ided
by
the
time
the
tag
func
tione
d, re
pres
enta
tive
of d
isper
sion.
UD
is th
e ut
iliza
tion
distr
ibut
ion
for t
he 9
5% a
nd 5
0% p
roba
bilit
y le
vels,
repo
rted
as a
rea i
n km
2 .
TABL
A 7
. Es
tadí
stica
s esp
acia
les d
e 98
atu
nes p
atud
o, e
n lib
erta
d 30
día
s o m
ás, b
asad
as e
n es
timac
ione
s de
posic
ión
del m
odel
o U
KF
(uns
cent
ed K
alm
an fi
lter)
. n
es e
l núm
ero
tota
l de
estim
acio
nes
de p
osic
ión
en e
l con
junt
o de
dat
os y
% e
s el
por
cent
aje
de p
osic
ione
s de
l reg
istro
com
plet
o. D
istan
cia
es la
dist
anci
a to
tal v
iaja
da, p
or c
onju
nto
de d
atos
. Li
neal
idad
es
la r
azón
de
la d
istan
cia
entre
los
extre
mos
del
con
junt
o de
dat
os y
la d
istan
cia
tota
l via
jada
. D
MC
es la
dist
anci
a m
edia
cua
drad
a de
sde
el c
entro
de
activ
idad
. D
MC/
Mes
es e
l val
or d
e D
MC
divi
dido
por
el t
iem
po d
e fu
ncio
nam
ient
o de
la m
arca
, rep
rese
ntat
ivo
de la
disp
ersió
n. D
U e
s la
distr
ibuc
ión
de la
util
izac
ión
para
los n
ivel
es d
e pr
o-ba
bilid
ad d
e 95%
y 5
0%, e
xpre
sado
s com
o ár
ea e
n km
2 .

HORIZONTAL MOVEMENTS OF BIGEYE TUNA
233
Tag
num
ber
n%
Dis
tan
ce(k
m)
xsp
eed
(km
/d)
Lin
eari
tyM
SD
(km
104 )
MS
D/M
onth
95%
UD
(km
2 )50
%U
D(k
m2 )
Nú
mer
od
em
arca
n%
Dis
tan
cia
(km
)x
velo
cida
d(k
m/d
)L
inea
lid
adD
MC
(km
104 )
DM
C/M
es95
%D
U(k
m2 )
50%
DU
(km
2 )
99-8
1213
684
.465
82.0
41.1
0.25
44.0
8.3
1208
842.
524
9721
.399
-814
163
84.9
8120
.339
.70.
036.
71.
036
9403
.044
213.
899
-816
3794
.716
27.4
42.8
0.23
2.5
2.0
1197
97.7
1613
7.4
99-8
3553
93.0
2201
.738
.60.
287.
74.
124
7750
.344
824.
399
-887
128
43.2
1074
8.2
36.3
0.05
15.9
1.6
7070
42.5
1180
50.1
2000
Mea
n-
Pro
med
io11
683
.861
53.8
39.5
0.15
14.9
3.0
5357
05.6
8507
0.4
3900
4113
166
.081
22.9
41.2
0.01
7.9
1.2
5125
38.5
6277
3.5
3900
5723
670
.912
758.
938
.30.
0223
.92.
213
3612
9.2
1002
20.7
3900
6519
474
.385
14.0
32.6
0.02
6.8
0.8
3445
66.9
7294
1.5
3900
8088
89.8
2289
.523
.40.
1437
.711
.516
6050
.417
244.
311
1631
957
.716
551.
729
.90.
0313
.70.
774
5219
.362
820.
439
0060
183
100.
096
40.4
52.7
0.21
52.2
8.6
1602
670.
033
1279
.339
0061
156
72.9
7273
.433
.40.
2122
.23.
176
0927
.094
042.
439
0095
9984
.643
45.1
37.1
0.15
3.2
0.8
1289
46.9
1358
6.6
1107
165
74.0
5999
.126
.90.
065.
20.
720
7014
.628
513.
111
1317
783
.168
01.0
31.9
0.15
13.7
1.9
4770
39.4
7944
3.2
1110
4477
.221
06.5
31.4
0.40
4.4
1.9
2285
28.4
4828
1.7
1102
357
47.7
2217
2.5
29.6
0.15
53.9
2.2
1538
354.
327
2379
.639
0052
8577
.476
99.8
70.6
0.09
16.1
4.4
8568
62.3
6551
1.8
3900
5663
66.3
4360
.845
.90.
097.
72.
445
6886
.559
048.
339
0069
107
79.3
6861
.850
.80.
2532
.87.
399
5969
.616
0091
.139
0072
9970
.768
51.6
48.9
0.24
24.1
5.2
7858
41.7
1388
22.4
1105
3241
.011
74.1
15.1
0.27
1.8
0.7
9947
4.3
1978
7.6
2003
Mea
n-
Pro
med
io14
972
.578
54.3
37.6
0.15
19.3
3.3
6613
54.1
9569
3.4
1100
3093
.840
0.7
12.5
0.69
1.1
1.0
3186
1.4
3827
.111
1113
065
.666
99.5
33.8
0.11
6.1
0.9
3162
91.4
4066
5.2
2318
4397
.765
5.5
14.9
0.18
0.4
0.3
2358
1.0
2581
.410
8213
748
.873
80.3
26.3
0.09
16.1
1.7
7433
38.4
5123
7.6
1107
5145
.541
42.5
37.0
0.04
10.9
2.9
3321
17.1
3149
1.8
2308
4310
0.0
1228
.928
.60.
101.
10.
854
412.
875
51.2
TA
BLE
7. (
cont
inue
d)
TABL
A 7
. (c
ontin
uaci
ón)
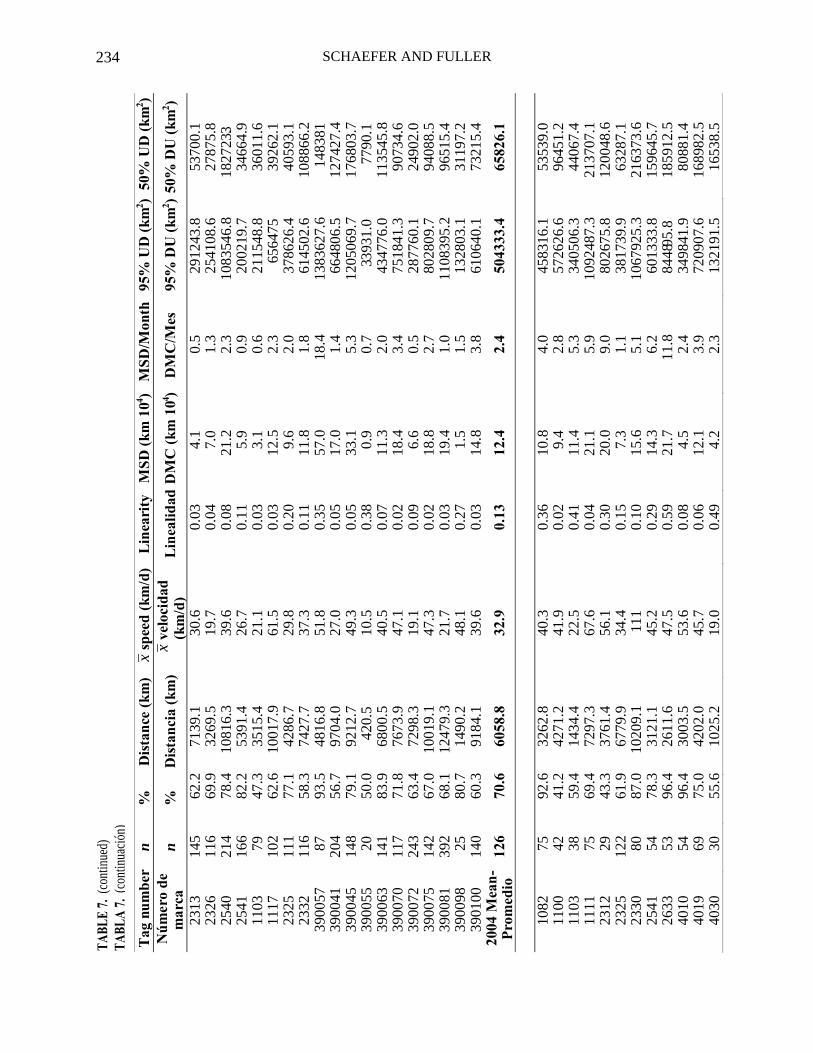
SCHAEFER AND FULLER
234
Tag
num
ber
n%
Dis
tan
ce(k
m)
xsp
eed
(km
/d)
Lin
eari
tyM
SD
(km
104 )
MS
D/M
onth
95%
UD
(km
2 )50
%U
D(k
m2 )
Nú
mer
od
em
arca
n%
Dis
tan
cia
(km
)x
velo
cida
d(k
m/d
)L
inea
lid
adD
MC
(km
104 )
DM
C/M
es95
%D
U(k
m2 )
50%
DU
(km
2 )
2313
145
62.2
7139
.130
.60.
034.
10.
529
1243
.853
700.
123
2611
669
.932
69.5
19.7
0.04
7.0
1.3
2541
08.6
2787
5.8
2540
214
78.4
1081
6.3
39.6
0.08
21.2
2.3
1083
546.
818
2723
.325
4116
682
.253
91.4
26.7
0.11
5.9
0.9
2002
19.7
3466
4.9
1103
7947
.335
15.4
21.1
0.03
3.1
0.6
2115
48.8
3601
1.6
1117
102
62.6
1001
7.9
61.5
0.03
12.5
2.3
6564
7539
262.
123
2511
177
.142
86.7
29.8
0.20
9.6
2.0
3786
26.4
4059
3.1
2332
116
58.3
7427
.737
.30.
1111
.81.
861
4502
.610
8866
.239
0057
8793
.548
16.8
51.8
0.35
57.0
18.4
1383
627.
614
8381
3900
4120
456
.797
04.0
27.0
0.05
17.0
1.4
6648
06.5
1274
27.4
3900
4514
879
.192
12.7
49.3
0.05
33.1
5.3
1205
069.
717
6803
.739
0055
2050
.042
0.5
10.5
0.38
0.9
0.7
3393
1.0
7790
.139
0063
141
83.9
6800
.540
.50.
0711
.32.
043
4776
.011
3545
.839
0070
117
71.8
7673
.947
.10.
0218
.43.
475
1841
.390
734.
639
0072
243
63.4
7298
.319
.10.
096.
60.
528
7760
.124
902.
039
0075
142
67.0
1001
9.1
47.3
0.02
18.8
2.7
8028
09.7
9408
8.5
3900
8139
268
.112
479.
321
.70.
0319
.41.
011
0839
5.2
9651
5.4
3900
9825
80.7
1490
.248
.10.
271.
51.
513
2803
.131
197.
239
0100
140
60.3
9184
.139
.60.
0314
.83.
861
0640
.173
215.
420
04M
ean
-P
rom
edio
126
70.6
6058
.832
.90.
1312
.42.
450
4333
.465
826.
1
1082
7592
.632
62.8
40.3
0.36
10.8
4.0
4583
16.1
5353
9.0
1100
4241
.242
71.2
41.9
0.02
9.4
2.8
5726
26.6
9645
1.2
1103
3859
.414
34.4
22.5
0.41
11.4
5.3
3405
06.3
4406
7.4
1111
7569
.472
97.3
67.6
0.04
21.1
5.9
1092
487.
321
3707
.123
1229
43.3
3761
.456
.10.
3020
.09.
080
2675
.812
0048
.623
2512
261
.967
79.9
34.4
0.15
7.3
1.1
3817
39.9
6328
7.1
2330
8087
.010
209.
111
10.
1015
.65.
110
6792
5.3
2163
73.6
2541
5478
.331
21.1
45.2
0.29
14.3
6.2
6013
33.8
1596
45.7
2633
5396
.426
11.6
47.5
0.59
21.7
11.8
8448
95.8
1859
12.5
4010
5496
.430
03.5
53.6
0.08
4.5
2.4
3498
41.9
8088
1.4
4019
6975
.042
02.0
45.7
0.06
12.1
3.9
7209
07.6
1689
82.5
4030
3055
.610
25.2
19.0
0.49
4.2
2.3
1321
91.5
1653
8.5
TA
BLE
7. (
cont
inue
d)
TABL
A 7
. (c
ontin
uaci
ón)

HORIZONTAL MOVEMENTS OF BIGEYE TUNA
235
Tag
num
ber
n%
Dis
tan
ce(k
m)
xsp
eed
(km
/d)
Lin
eari
tyM
SD
(km
104 )
MS
D/M
onth
95%
UD
(km
2 )50
%U
D(k
m2 )
Nú
mer
od
em
arca
n%
Dis
tan
cia
(km
)x
velo
cida
d(k
m/d
)L
inea
lid
adD
MC
(km
104 )
DM
C/M
es95
%D
U(k
m2 )
50%
DU
(km
2 )
4070
181
81.9
1088
7.5
49.3
0.03
21.8
3.0
8597
83.8
7221
8.7
4092
9682
.855
78.8
48.1
0.15
31.3
8.1
1401
861.
526
2948
.341
0053
96.4
2558
.446
.50.
6127
.715
.181
1669
.797
195.
939
0045
6377
.831
83.2
39.3
0.16
3.4
1.3
2217
85.1
4540
4.3
3900
7016
079
.611
332
56.4
0.14
34.8
5.2
1378
700.
527
0550
.439
0075
311
72.8
2121
3.9
49.7
0.00
11.4
0.8
7547
45.9
7727
9.2
4009
8988
.153
11.5
52.6
0.03
14.8
4.4
7406
25.3
1151
59.1
4016
204
91.9
1258
6.9
56.7
0.02
18.8
2.5
1224
356.
113
6973
.940
2317
981
.772
70.1
33.2
0.08
18.4
2.5
6510
85.7
9812
3.3
4026
6078
.941
43.0
54.5
0.12
9.0
3.6
4548
45.4
3604
0.4
4035
5552
.454
67.5
29.7
0.05
12.6
3.6
7101
42.1
8802
2.2
4036
3583
.322
22.7
52.9
0.17
3.9
2.8
1813
34.2
1907
6.6
4038
141
77.5
8504
.146
.70.
1612
.22.
057
5471
.349
639.
849
0915
9150
.012
480.0
68.6
0.02
18.7
3.1
1147
047.
620
7071
.049
0916
6189
.729
87.1
43.9
0.34
12.2
5.4
4239
84.7
3746
5.5
5900
5320
590
.717
912.
179
.20.
0126
.33.
511
7835
3.5
1508
52.9
5900
5478
83.0
6551
.769
.70.
1638
.712
.314
3721
4.5
2978
16.6
2005
Mea
n-
Pro
med
io96
76.4
6592
.150
.40.
1816
.24.
874
2015
.712
0043
.9
TA
BLE
7. (
cont
inue
d)
TABL
A 7
. (c
ontin
uaci
ón)

DESPLAZAMIENTOS HORIZONTALES DE ATUNES PATUDO (THUNNUS OBESUS) EN EL OCÉANO PACÍFICO ORIENTAL, DETERMINADOS A PARTIR DE EXPERIMENTOS CON MARCAS CONVENCIONALES Y
ARCHIVADORAS INICIADOS DURANTE 2000-2005
por
Kurt M. Schaefer y Daniel W. Fuller
RESUMEN
Un total de 19,471 atunes patudo fueron capturados, marcados, y liberados, en el Océano Pacífico oriental ecuatorial, du-rante marzo a mayo de 2000 y de 2002 a 2005. De las 19,148 marcas de dardo y 323 marcas archivadoras geolocalizadoras aplica-das, 8,263 (43.2%) y 163 (50.5%), respectivamente, fueron devueltas. Los tiempos en libertad variaron de 1.7 a 2,291 d ( x = 169, SE = 1.8). Los desplazamientos lineales, desde la posición de liberación hasta la de recaptura, variaron de 0 a 7093 km ( x = 560, SE = 7.8). De los 6,692 patudos en libertad 30 d o más, el 95% fue recapturado a menos de 1,894 km de su posición de liberación. El sector direccional primario de los desplazamientos lineales fue 255° a 300°, que incluyó el 43.5% de las observaciones. Se usó un modelo UKF (unscented Kalman filter) con mediciones de la temperatura superficial del mar integradas para procesar 98 conjuntos de datos de marcas archivadoras de patudos en libertad 30 d o más, a fin de obtener estimaciones mejoradas de las posiciones ge-ográficas, las rutas más probables, y los parámetros de desplazamiento. Las estimaciones medianas de los parámetros del modelo UKF de los errores de longitud (σx) y latitud (σy) fueron 0.27° y 2.34°, de los desplazamientos dirigidos (u y v) 1.25 mn/d y 0.35 mn/d, y de los desplazamientos dispersivos (D) 465 mn2/d. Las distribuciones de utilización de 95% y 50%, con base en 11,585 posiciones de los 98 conjuntos de datos de patudo de marcas archivadoras combinadas, fueron 1,326,325 km2 y 60,667 km2, respec-tivamente, y estuvieron centradas entre aproximadamente 3°N y 5°S y 90°O y 105°O. A partir de los datos de las marcas archivado-ras, existen diferencias en los patrones espaciales de los desplazamientos por año de aplicación y edad o tamaño del pez. Estos datos indican claramente que el patudo muestra desplazamientos limitados, con fidelidad regional a esta área de alta productividad bio-lógica. Los datos de marcado del presente estudio y otros indican asimismo el muy bajo nivel de mezcla entre el Pacífico oriental y occidental, pero confirman que ocurre cierta mezcla de peces entre estas áreas y casi seguramente mezcla dentro de y entre las áreas traslapadas definidas por radios de 2,000 km en el Pacífico.
INTRODUCCIÓN
El atún patudo (Thunnus obesus) vive en aguas oceánicas tropicales y subtropicales en todo el mundo, excepto el Mar Mediterráneo (Collette y Nauen, 1983). Es capturado en el Océano Pacífico oriental (OPO) por buques de palangre que faenan entre aproximadamente 40°N y 20°S y por buques de cerco entre aproximadamente 5°N y 15°S (Miyabe y Bayliff, 1998; Anónimo, 2008). Desde 1994, como consecuencia del esfuerzo de pesca dirigido hacia atunes asociados con dispositivos agregadores de peces (plantados), las capturas de patudo con red de cerco han aumentado significativamente, mientras que las capturas de patudo con palangre en el OPO han disminuido de forma importante, creando incertidumbre acerca de la sustentabilidad de los niveles recientes de explotación (Anónimo, 2004; Aires-da-Silva y Maunder, 2009).
Un conocimiento de la dinámica espacial, utilización de hábitat, y estructura de la población de patudo en el Océano Pací-fico, incluido el nivel de mezcla entre el OPO y el Océano Pacífico occidental y central (WCPO) es primordial para la evaluación de las poblaciones y las consideraciones de gestión. Experimentos de liberación y recaptura de marcas, en los que se usaron marcas de dardo convencionales, realizadas para varias especies de atunes en varias áreas de los océanos del mundo, han producido informa-ción valiosa sobre los desplazamientos y la estructura de las poblaciones (Hunter et al., 1986; Bayliff, 1993). En los últimos años, experimentos de marcado con marcas archivadoras geolocalizadoras (marcas archivadoras) han arrojado datos importantes para los conocimientos de la dinámica espacial, utilización de hábitat, y estructura de la poblaciones de las especies investigadas (Arnold y Dewar, 2001; Gunn y Block, 2001; Block, 2005).
Los desplazamientos de patudos inferidos de experimentos de marcado con marcas de dardo en el Océano Pacífico occi-dental (WPO) (Hampton y Gunn, 1998; Hampton y Williams, 2005) y Hawai (Itano y Holland, 2000) indican que, aunque hay algu-nos desplazamientos lineales de más de 1,852 km, más del 80% de la recapturas ocurren a menos de 370 km del punto de liberación. Las rutas de desplazamiento de patudos en el Pacífico oriental (Schaefer y Fuller, 2002) y occidental (Clear et al., 2005) derivados de datos de marcas archivadoras filtrados indican que el área utilizada estuvo limitada principalmente a menos de 1,852 km del pun-to de liberación. Los resultados de estudios de marcado de patudo con marcas convencionales y archivadoras indican desplazamien-tos limitados y fidelidad regional, con una mezcla limitada entre el Océano Pacífico oriental, central, y occidental.

DESPLAZAMIENTOS HORIZONTALS DE ATUNES PATUDO 237
Los objetivos de la presente investigación son elucidar los desplazamientos horizontales, la dinámica espacial, y la utiliza-ción de hábitat de patudos marcados y liberados con marcas de dardo y marcas archivadoras durante 2000-2005 en el OPO ecuato-rial. Se evalúan los desplazamientos lineales y la dispersión, a partir de datos de liberación y recaptura de marcas de dardo, junto con los parámetros y las rutas de desplazamiento, y las distribuciones de utilización derivados de conjuntos de datos derivados de marcas archivadoras. Los resultados obtenidos tienen implicaciones directas para consideración en las evaluaciones de las poblaciones y aplicaciones de gestión de recursos de patudo en el Océano Pacífico.
MATERIALES Y MÉTODOS
Liberaciones de marcas
Patudo asociados con boyas del Tropical Atmosphere-Ocean (TAO), el buque de marcado, y plantados que flotan a la de-riva, fueron capturados, marcados, y liberados en el OPO ecuatorial entre 3°N y 5°S, y 95º y 97°O, durante marzo a mayo de 2000 y 2002 a 2005. El marcado fue realizado en el buque fletado Her Grace, un buque cañero de cebo vivo de 17.7-m y 99 toneladas bru-tas, estilo costa oeste de Estados Unidos. Los peces fueron capturados para el marcado con cañas levantadoras (equipos de una y de dos cañas), líneas de mano, y caña y carrete de día y de noche. Al pescar con cañas levantadoras, se usaron como cebo vivo ancho-vetas (Cetengraulis mysticetus) capturadas en el Golfo de Panamá. El equipo terminal sujetado al sedal de monofilamento en las líneas de mano y las cañas y carretes fue principalmente cucharillas de metal cromado de 8 onzas, algunas con pintura fluorescente verde en una superficie. Casi todo el marcado fue realizado por los autores, pero unos pocos otros individuos también marcaron atunes durante estos experimentos bajo la supervisión de los autores. Los atunes con lesiones evidentes de las branquias o los ojos, o que sangraron profusamente, fueron rechazados para el marcado en la mayoría de los casos.
Marcas de dardo
Los peces fueron marcados con una o dos marcas de dardo amarillas de 12.5 cm numeradas en serie, fabricadas por Hall-print Pty, Ltd. de Victor Harbor (Australia del Sur) con aplicadores tubulares de acero inoxidable. Las marcas fueron insertadas, en ambos lados del pez, en la musculatura dorsal, pasando la lengüeta entre los pterigóforos debajo de la base de la segunda aleta dor-sal. En las marcas estaba impresa en español una solicitud que se reportara la recaptura de los peces y la información que se pagaría una recompensa por la devolución de la marca. La mayoría de los peces de menos de 1 m de talla fueron medidos y marcados en cunas de aluminio, acolchadas con espuma de alta densidad y con graduaciones de 1 cm marcadas en un forro liso, montado en la brazola de popa del buque directamente detrás de las plataformas de pesca. Hubo cuatro estaciones de marcado, cada una con una cuna de aluminio. Bayliff y Holland (1986) describen métodos similares a aquéllos usados en el presente estudio para marcar atunes con marcas de dardo. Algunos peces de más de 1.2 m de talla, capturados con dos cañas, fueron marcados en el agua al lado de las plataformas de pesca, y las tallas fueron estimadas en lugar de medidas. Los peces de más de 1 m de talla, capturados principalmente de noche con línea de mano o caña y carrete, fueron subidos a bordo con salabardos con marco de aluminio y mango largo, de 75 cm de diámetro interior, con malla sin nudos, en una estera de espuma de alta densidad con un forro liso. Esos peces fueron medidos con piederrey al milímetro más cercano. La información de las liberaciones de marcas, incluidas la fecha y hora, posición, tipo de arte, estación de marcado, especie, talla, tipo de marca y número(s) fuero registrada, usando grabadoras de cinta en casete en estu-ches de plexiglás colgados del cuello de los marcadores. Después de un evento de marcado, los datos de liberación registrados en las cintas fueron transcritos a formularios a papel en el buque, generalmente en un plazo de 24 horas.
En enero de 2000 se inició una extensa campaña publicitaria internacional destinada a informar a los capitanes y tripulan-tes de los buques de cerco y de palangre, los gerentes y empleados de las plantas envasadoras, y descargadores de los buques de cerco del proyecto de marcado y las recompensas subsiguientes por la devolución de marcas. Pancartas y folletos sobre las recom-pensas fueron ampliamente distribuidos en los principales puertos atuneros en ese momento y en años subsiguientes antes de los cruceros de marcado. La recompensa por las marcas de dardo fue US$5 por marca. Además, al fin de cada año después de un cruce-ro de marcado se hizo un sorteo para cinco premios de US$ 1.000 cada uno. Con cada marca devuelta se tiene una posibilidad de ganar el sorteo.
Marcas archivadoras
Las marcas archivadoras usadas en 2000 fueron modelos Mk7 y en 2002 modelos Mk9, ambos fabricados por Wildlife Computers en Redmond, Washington (EE.UU.). Las marcas usadas en 2003, 2004, y 2005 fueron modelos Mk9, y la LTD_2310, fabricada por Lotek Wireless, Inc. en St. John’s, Terranova (Canadá). Schaefer y Fuller (2006a) presentan información sobre las especificaciones y funcionamiento de las marcas Mk9 y LTD_2310. La configuración de cada una de estas marcas fue diseñada para
SCHAEFER Y FULLER 238
implantación en la cavidad peritoneal del pez, con la caña del sensor de luz y temperatura al exterior del pez, pasando por una inci-sión en la pared abdominal. En la sección principal del instrumento se incluyó una etiqueta, impresa en español, con información sobre cómo reportar la recuperación del mismo y la recompensa asociada (US$ 500). Las marcas fueron programadas para registrar y almacenar en la memoria datos de profundidad (presión), temperatura ambiental e interna, y nivel de luz cada 4 minutos en el caso de las marcas Mk7 usadas en 2000, y cada minuto en el caso de las marcas Mk9 y LTD_2310 usadas en 2002-2005. Schaefer y Fu-ller (2002) describen los materiales y métodos usados para marcar y liberar patudos con marcas archivadoras.
Recuperaciones de marcas
La mayoría de las recuperaciones de marcas de dardo y archivadoras ocurrieron durante o después del proceso de des-cargar los buques de cerco en puerto, pero ocurrieron también algunas a bordo de buques de cerco y de palangre en el mar. En la mayoría de los viajes de los buques de cerco en los fueron recapturados atunes marcados hubo un observador de la CIAT o de un programa nacional a bordo, permitiendo así verificar la información de recaptura a partir de sus registros. La principal informa-ción de recaptura solicitada por los técnicos de la CIAT de los que encuentran marcas de dardo o archivadoras es la fecha y posi-ción de recaptura, el nombre y tipo del buque, y la talla del pez, pero muchas de las marcas son recuperadas por los descargado-res de los buques de cerco, y la información comúnmente provista es la fecha en la que se encontró la marca, junto con el nom-bre del buque y el número de la bodega en la que fue encontrado el pescado. A partir de esa información, junto con los registros del observador del viaje en cuestión, es normalmente posible derivar fechas y posiciones razonables para la mayoría de las mar-cas. En Bayliff y Holland (1986) se presenta información adicional sobre cómo tratar las recuperaciones de marcas y los datos de recaptura pertinentes.
En el presente estudio se usan todos los datos de patudos marcados durante los cruceros de 2000 y 2002-2005 cuyas mar-cas fueron recuperadas hasta el fin de 2007.
Procesamiento de datos
A principios de 200 fue creada una base de datos con Microsoft Access, específicamente para procesar toda la infor-mación de liberaciones y devoluciones de marcas de estos experimentos. Un campo único incluido en esta base de datos es el grado de fiabilidad de cada uno de los valores asociados con la información de liberación y recaptura. Esta base de datos incluye numerosas funciones especiales para convertir posiciones reportadas en grados, minutos, y segundos en grados decimales, y para calcular distancias, direcciones, y tiempos en libertad. Está también relacionado con la base de datos de observadores de la CIAT para obtener información auxiliar sobre el lance en el cual el pez marcado fue recuperado. Se escriben las interrogaciones para extraer de la base de datos información de liberación y recaptura en el formato requerido para usar con otro software. Dos de los programas principales son Microsoft Excel para análisis estadísticos y ArcView, del Environmental Systems Research Institute, para mapeo y análisis espaciales.
Marcas de dardo
Tal como se comentó previamente, la información provista para las marcas de dardo encontradas en el mar es verificada con los registros del observador o del cuaderno de bitácora del buque para asegurar que sean exactos. En el caso de las marcas de dardo encontradas durante la descarga y procesamiento de los atunes, se usan los mismos registros para determinar la fecha y posi-ción de recaptura más probables, con base en la información proporcionada por la persona que la encontró. Esto se basa típicamente en la bodega en la cual se reportó que el pez marcado fue encontrado.
Marcas archivadoras
La fecha de recaptura de las marcas archivadoras es determinada directamente de los datos de serie de tiempo descargados de la marca. Con esta fecha de recaptura y el nombre del buque reportado por la persona que encontró la marca, se determina la posición de recaptura a partir de los registros del observador o de la bitácora del buque.
Los datos de las marcas archivadoras recuperadas fueron descargadas, descodificadas, y sometidos a un procesamiento inicial, usando software provisto por los fabricantes de las marcas. Las estimaciones de posición arrojadas por este software se basa-ron en datos de nivel de luz ambiental, usando las horas de salida y puesta del sol para calcular la longitud a partir de la hora del mediodía local, y la latitud a partir de la duración del día local (Hill, 1994; Ekstrom, 2004). Las posiciones geográficas de latitud no procesadas basadas en luz fueron altamente variables y poco fiables alrededor de los equinoccios debido a la duración casi constante del día en todas las latitudes. El comportamiento crepuscular de descenso y ascenso del patudo crea dificultades adicionales para la

DESPLAZAMIENTOS HORIZONTALS DE ATUNES PATUDO 239
estimación de geoposiciones fiables basadas en luz (Schaefer y Fuller, 2002). Se ha mostrado que las temperaturas de la superficie del mar (TSM) registradas por las marcas ajustadas a TSM de sensores remotos mejoran significativamente las estimaciones de latitud (Teo et al., 2004; Clear et al., 2005; Domeier et al., 2005; Nielsen et al., 2006).
Se usó un modelo UKF (unscented Kalman filter) (Lam et al., 2008), con mediciones de la TSM integradas para obtener estimaciones mejoradas de las posiciones geográficas, las rutas más probables, y los parámetros de desplazamiento. El modelo UKF, un modelo de estado-espacio en el cual la ecuación de transición describe los desplazamientos, es muy similar al modelo de filtro de Kalman, con mediciones de TSM integradas, descrito por Nielsen et al. (2006). El modelo UKF es mejor para tratar las no linealida-des, y tiene también la ventaja de que cada parámetro del modelo es tratado en un marco estadístico. Puede también utilizar datos de TSM de sensores remotos de varias resoluciones espaciales, y estima automáticamente el grado de suavización necesario para el campo de TSM. Parametriza el desplazamiento como trayecto aleatorio sesgado, con el desplazamiento dividido en desplazamientos dirigidos (u y v) y dispersivos (D). Estima también los errores de reoposición como desviaciones estándar de las longitud (σx) y lati-tud promedio (σy).
Los valores diarios de TSM derivados de los datos de marcas archivadoras fueron calculados con un algoritmo que usa las temperaturas ambientales de datos de series de tiempo. Se usaron las temperaturas de todas las profundidades de menos de 5 m, a menos que no hubiese valores de menos de 5 m de un día individual, en cual momento la profundidad aumentaría a intervalos de 1 m. Este incremento por pasos en la profundidad continuaría hasta un máximo de 8 m, tras lo cual no se calculó una estimación de la TSM. El promedio de todos estos valores de temperatura, para cada día, fue calculado y considerado como la estimación de la TSM.
Dos productos de TSM derivados de satélites fueron obtenidos y utilizados en el modelo UKF. Inicialmente se usó el pro-ducto compuesto NCEP Reynolds Optimally Interpolated 8-d SST con resolución de área de 1° (exactitud de 0.5° a 0.7ºC), derivado de datos de Advanced Very High Resolution Radiometer (AVHRR) Pathfinder y mediciones en situ de TSM (Reynolds y Smith, 1994), para obtener los parámetros del modelo. Estos parámetros fueron entonces usados como puntos de partida para ejecutar de nuevo el modelo UKF, usando el producto compuesto de escala más fina NOAA AVHRR Global Area Coverage (GAC) 8-d SST con resolución de área de 0.1° (exactitud de 0.3º a 0.5ºC) (Vázquez et al., 1998) para obtener las estimaciones finales de las rutas más probables y los parámetros de desplazamiento.
Cada conjunto de estimaciones de posición a lo largo de la ruta más probable para patudos individuales, derivado del mo-delo UKF, fue integrado en un Sistema de Información Geográfica (SIG). El programa GIS de ArcView y el Animal Movement Analyst Extension (AMAE) (Hooge y Eichenlaub, 1997; Hooge, et al., 2001) fueron usados para análisis espaciales de los conjuntos de datos. Esto incluye la distancia total a lo largo de rutas de desplazamiento individuales, velocidad media, distancia cuadrada me-dia (DCM) del centro de actividad, y la linealidad de la ruta. Los valores de DCM y la linealidad son medidas de los desplazamien-tos dispersivos y dirigidos, respectivamente. Estimamos también la dispersión para cada ruta de desplazamiento relativa a tiempo, a partir del valor de DCM. Se usó el modelo de zona base de núcleo fijo en el AMAE, con la función de suavización de validación cruzada de cuadrados mínimos, para evaluar la zona base probabilista de los peces. Las distribuciones de utilización de 95% y 50% (contornos de probabilidad) fueron elegidas para describir las áreas probablemente utilizadas (95%) y las zonas núcleo (50%) de actividad, respectivamente, para peces individuales. Las distribuciones de utilización de 95% y 50% fueron asimismo computadas para todos los peces agregados dentro de años, y por trimestre para todos los años combinados, a fin de evaluar la variabilidad anual y estacional del hábitat horizontal.
RESULTADOS
Liberaciones y recuperaciones de marcas de dardo
En la Tabla 1 se detalla el número de liberaciones y devoluciones de marcas de dardo, por año y tiempo en libertad.
Todos los patudos marcados y liberados fueron localizados y capturados mientras se encontraban asociados con plantados o con boyas Tropical Atmosphere-Ocean (TAO) y subsecuentemente después de trasladar las agregaciones asociadas a aquélla del buque, que iba a la deriva.
Los porcentajes de devoluciones de las liberaciones de cada año son bastante similares excepto en el caso de los peces liberados en 2000, que podría estar relacionado con el menor número de liberaciones y las tallas mayores de los peces marcados. El alto porcentaje de devoluciones de marcas de dardo liberadas en 2003, con menos de 30 d en libertad, es atribuible a las recapturas por buques de cerco de 1,445 peces, 515 de los cuales fueron recapturados en asociación con la boya TAO anclada en 2°S-95°O, al

SCHAEFER Y FULLER 240
cabo de 10 a 23 días en libertad. Fueron recapturados 930 patudos marcados adicionales en asociación con la boya TAO anclada en 2°N-95°O, al cabo de 12 a 61 días en libertad.
Hasta la fecha han sido recapturados 8,426 patudos, 8,34 (99.1%) por buques de cerco, 40 (0.5%) por buques de palangre, 10 (0.1%) por el buque de marcado, y 27 (0.3%) por tipos de arte no determinados.
Distribuciones de tallas de liberación por año
En la Figura 1 se presentan las distribuciones de frecuencia de talla de los patudos liberados con marcas de dardo. El ta-maño promedio fue máximo en 2000, por mucho, y en 2002 y 2005 fue considerablemente menor que en 2003 y 2004.
Tiempos en libertad y desplazamientos lineales
En las Figuras 2a-f se ilustran, por año de liberación, los tiempos en libertad, desplazamientos lineales, y posiciones de re-captura de los peces con marcas de dardo devueltas y en la Tabla 2 las estadísticas descriptivas correspondientes. El tiempo en liber-tad varió de 138 d en el caso de los peces liberados en 2002 a 253 d en el caso de aquéllos liberados en 2000. El desplazamiento lineal promedio varió de 459 km en el caso de los peces liberados en 2003 a 966 km en el caso de aquéllos liberados en 2005. La dirección primaria de los desplazamientos en todos los años fue hacia el oeste.
De todas las marcas devueltas, el pez con el mayor número de días en libertad (2291 d) fue recapturado por un buque de palangre a 2,735 km y 276° de la posición de liberación. El pez con el mayor desplazamiento lineal (7093 km) fue asimismo recap-turado por un buque de palangre, a 284° de la posición de liberación, al cabo de 696 días en libertad. La distribución de recapturas por áreas de 1 grado varía de la posición más oriental de 13.28°S 77.32°O a la más occidental de 11.78°N 157.98°O, y de la posición más norteña de 11.78°N 157.98°O a la posición más sureña de 17.65°S 95.12°O (Figura 2f C). De los 6,692 patudos con más de 30 días en libertad, el 95% fue recapturado a menos de 1,884 km de la posición de liberación. El sector direccional primario de los desplazamientos lineales fue de 240° a 285°, formando el 43.4% de las observaciones.
Los porcentajes de todos los peces recapturados, con sus marcas devueltas, en cada clase de talla de 5 cm de liberación (Figura 3), indica un 40 a 50 por ciento bastante constante para los peces de hasta unos 100 cm de talla, pero luego una disminución brusca a un promedio del 24 por ciento de los peces de entre 105 y 120 cm, seguida por otra disminución a un promedio de 12 por ciento para los peces de entre 125 y 130 cm. Los desplazamientos lineales por tiempo en libertad de todos los peces con información de recaptura aceptable (Figura 4) indica una correlación significativa (r = 0.21, P < 0.05). No parece existir un patrón indicando que la mayoría de los peces permanecen a menos de 1,852 km de su posición de liberación hasta unos 600 d en libertad, y que los pocos desplazamientos lineales hasta 5,556 km son alcanzados a menos de 200 d en libertad. Un gráfico de la frecuencia de los desplaza-mientos lineales de todos los peces (Figura 5) indica un pico a menos de 370 km, con una disminución curvilineal que se aplana en aproximadamente 2,222 km, y pocas recapturas a distancias de más de 1,852 km.
En las Figuras 6a-c se ilustran, por tiempo en libertad e intervalo de talla de liberación, los desplazamientos lineales y po-siciones de recaptura de aquellos peces con marcas de dardo devueltas y en la Tabla 3 las estadísticas descriptivas correspondientes. Parece existir un patrón con respecto a los desplazamientos lineales por intervalo de talla y tiempo en libertad, ya que los peces de más de 80 cm en libertad más de 365 d muestran desplazamientos lineales significativamente mayores que aquéllos de menos y de más de 80 cm en libertad menos de 365 d. La dirección primaria de desplazamiento de todos los intervalos de talla y tiempos en libertad fue hacia el oeste.
El tiempo en libertad varió de 138 d en el caso de los peces liberados en 2002 a 253 d en el caso de aquéllos liberados en 2000. El desplazamiento lineal promedio varió de 459 km en el caso de los peces liberados en 2003 a 966 km en el caso de aquéllos liberados en 2005. La dirección primaria de los desplazamientos en todos los años fue hacia el oeste.
Las distribuciones de frecuencia de los desplazamientos lineales de los peces de menos de 80 cm, de 80 a 100 cm, y de más de 100 cm, recapturados al cabo de 30 a 180 d, 181-365 d, y más de 365 d (Figuras 7a-c), son similares, con modas primarias en menos de 1000 km y pocas observaciones a más de 2000 km.
Liberaciones y recuperaciones de marcas archivadoras
En la Tabla 4 se detalla el número de liberaciones y devoluciones de marcas archivadoras por año y tiempo en libertad. El porcentaje de devoluciones de 2000 y 2002 fue significativamente menor que aquél de 2003 a 2005, debido posiblemente al mayor tamaño medio de los peces marcados en 2000 y el tamaño medio menor en 2002 (Figura 8). El alto porcentaje de de marcas archiva-
DESPLAZAMIENTOS HORIZONTALS DE ATUNES PATUDO 241
doras liberadas en 2003 devueltas al cabo de menos de 30 d en libertad es atribuible a 28 recapturas por un buque de cerco y 10 re-capturas por el buque de marcado. Todos estos 38 peces fueron recapturados en asociación con la boya TAO anclada en 1.98S 95.18O, al cabo de 9 a 23 días en libertad. Tres patudos adicionales con marcas archivadoras fueron recapturados en asociación con la boya TAO anclada en 2.00N 95.33O, al cabo de 13 a 18 días en libertad.
De los 163 patudos con marcas archivadoras reportados como recapturados, 142 (87.1%) fueron recapturados por buques de cerco, 11 (6.7%) por buques de palangre, y 10 (6.2%) por el buque de marcado.
Distribuciones de talla de las liberaciones por año
En la Figura 8 se ilustran las distribuciones de frecuencia de talla de los patudos liberados con marcas archivadoras, por año.
Tiempos en libertad
En la Tabla 5 se presenta información de liberación y recaptura de 98 patudos en libertad 30 d o más de los que se recupe-raron datos de marcas archivadoras. Los tiempos en libertad oscilaron entre 31 y 2,291 d ( x = 258.4, SE = 35.5). En el caso de las liberaciones en 2000, el mayor período en libertad fue 2,291 d, y el pez fue recuperado por un buque de palangre a 2,735 km y 276° de la posición de liberación. En el caso de las liberaciones en 2003, el mayor período en libertad fue 1,574.2 d, y el pez fue recupe-rado por un buque de palangre artesanal a 167 km y 64° de la posición de liberación. En el caso de las liberaciones en 2004, el ma-yor período en libertad fue 598 d, y el pez fue recuperado por un buque de cerco a 526 km y 267° de la posición de liberación. En el caso de las liberaciones en 2005, el mayor período en libertad fue 426 d, y el pez fue recuperado por un buque de cerco a 4.5 km y 180° de la posición de liberación, en la misma boya TAO donde fue liberado.
Rutas de desplazamiento, parámetros del modelo, y estadísticas espaciales
En la Figura 9 se ilustran las rutas de desplazamiento compiladas de patudos, en libertad 30 d o más, liberados en 2000, 2003, 2004, y 2005. Las marcas aplicadas en 2002 no registraron ningún dato. Los desplazamientos latitudinales estuvieron limita-dos principalmente entre 5°N y 5°S, excepto las liberaciones en 2005, que mostraron un desplazamiento considerable hasta aproxi-madamente 7°S. Los desplazamientos longitudinales estuvieron limitados principalmente entre 90°O y 110°O, excepto las liberacio-nes en 2000, que mostraron cierto desplazamiento al este hasta aproximadamente 83°O y al oeste en el caso de las liberaciones en 2000 y 2003 hasta aproximadamente 125°O.
En la Tabla 6 se resumen por año y para todas las aplicaciones las estimaciones de los parámetros del modelo UKF de errores en longitud (σx) y latitud (σy), desplazamientos dirigidos (u y v) y desplazamientos dispersivos (D). Los parámetros de des-plazamiento dirigido estimado al este (u) y al norte (v) de 2000 son valores negativos pequeños, a diferencia de aquéllos de los otros años. Los parámetros de desplazamiento dispersivo (D) son similares para la mayoría de los años excepto considerablemente meno-res que aquél de 2005.
El porcentaje de días para los cuales se estimaron posiciones a lo largo de las rutas de desplazamiento a partir del total de días en los que la marca funcionó, distancia total a lo largo de las rutas de desplazamiento, velocidad a lo largo de las rutas de des-plazamiento, linealidad, DCM, DCM por mes, y las distribuciones de utilización de 95% y 50% son presentados para cada pez, y los promedios de todas las aplicaciones por año en la Tabla 7. Las velocidades medias a lo largo de las rutas de desplazamiento son similares en todos los años excepto 2005, en cuando fue mayor. La DMC media mensual es mínima en 2004 y máxima en 2005.
En la Figura 10 se ilustran las distribuciones de utilización de 95% y 50% compiladas para períodos anuales a partir de las estimaciones de posición de UKF, para patudos en libertad 30 días o más. Las distribuciones de utilización de 95% y 50% son máximas para el período de abril de 2000 a marzo de 2001 de 1,593,610 km2 y 256,592 km2, respectivamente, y mínimas para el período de abril de 2004 a marzo de 2005 de 733,054 km2 y 35,700 km2, respectivamente.
En la Figura 11 se ilustran las rutas de desplazamiento de los patudos, en libertad 30 d o más, liberados en 2000, 2003, 2004, y 2005, compiladas por intervalos de clase de talla. Para los 33 peces de más de 100 cm de talla se observa una gama latitudi-nal similar a aquéllas de los intervalos de talla menores, pero con una extensión al este hasta aproximadamente 83°O, y extensión al oeste de 4 peces a entre 110°O y 115°O, y 2 peces con posiciones de recaptura en aproximadamente 125°O.
En la Figura 12 se ilustran las distribuciones de utilización de 95% y 50% compiladas a partir de las estimaciones de posi-ción de UKF, para patudos en libertad 30 días o más, por trimestre y durante todo el año. Las distribuciones de utilización de 95% y
SCHAEFER Y FULLER 242
50% correspondientes al período de abril a junio están más confinadas que los otros períodos trimestrales debido a los tiempos en libertad limitados después de la mayoría de las liberaciones en abril y mayo (Tabla 5). Las distribuciones de utilización de 95% y 50% de los 98 peces (11,585 posiciones) durante el año entero de 1,326,325 km2 y 60,667 km2, respectivamente, centradas entre aproximadamente 3°N y 5°S y 90°O y 105°O ilustran claramente un hábitat horizontal regionalmente limitado.
Las posiciones de recaptura de todas las liberaciones de patudos con marcas de dardo y marcas archivadoras (n = 8,334) junto con el contorno de la distribución de utilización de 95% a partir de estimaciones de posición del modelo UKF de los datos de marcas archivadoras superpuestos, ilustran el área núcleo con la mayor densidad de todas las posiciones de recaptura y aquélla usada probablemente por la mayoría de los peces, así como la distribución de las recapturas fuera del área núcleo (Figura 13). Hay relativamente pocas posiciones de recaptura al oeste de 110°O (4.6%), al este de 90°O (2.4%), al norte de 5°N (1.0%), y al sur de 5°S (2.7%).
Las observaciones diarias de las TSM estimadas a partir de los datos de las 98 marcas archivadoras detalladas en la Tabla 5 indican una gama de 17.0°C a 31.5°C, con el 95% de las observaciones entre 19.5°C y 28.0°C (Figura 14). Esto indica que estas TSM máximas y mínimas influyen muy probablemente en las rutas de desplazamiento observadas de los peces en esta región del OPO ecuatorial.
Desplazamientos a larga distancia en todo el Pacífico
En la Figura 15 se ilustran los desplazamientos lineales a larga distancia (>1,852 km) de patudo en el Océano Pacífico de todas las posiciones conocidas de liberación y recaptura de marcas. Los resultados del marcado en estas otras áreas del Pacífico central y occidental muestran similitudes con aquéllos del presente estudio, con números limitados de patudos que emprenden des-plazamientos a larga distancia. Estos datos indican claramente el muy bajo nivel de mezcla entre el Pacífico oriental y occidental, pero confirman que ocurre cierta mezcla de peces entre estas áreas y casi seguramente una mezcla considerable dentro de y entre áreas superpuestas definidas por radios de 2.000 km a través del Pacífico.
DISCUSIÓN
Los resultados obtenidos en el presente estudio, basados en números relativamente grandes de recuperaciones de marcas de dardo y marcas archivadoras, durante un período de varios años, son informativos con respecto a un conocimiento de los despla-zamientos horizontales y la estructura de la población de patudo en el OPO ecuatorial. Los resultados indican que los desplazamien-tos horizontales del patudo en esta región están limitados casi completamente a aproximadamente 2.000 km del punto de liberación. Los desplazamientos de patudo inferidos de aplicaciones y recuperaciones de marcas de dardo en el Pacífico occidental y central (Hampton y Gunn, 1998; Itano y Holland, 2000; Hampton y Williams, 2005), y aquéllos de marcas archivadoras en el Pacífico occi-dental (Clear et al., 2005) asimismo sugieren con fuerza desplazamientos horizontales relativamente limitados y fidelidad regional a áreas geográficamente confinadas.
Recuperaciones de marcas
Las tasas generales de devolución de patudos marcados con marcas de dardo (43.1%) y marcas archivadoras (50.5%) en el presente estudio son bastante elevadas. Las tasas de devolución de peces en libertad 30 d a más a 365 d, con marcas de dardo (30.1%) y marcas archivadoras (31.0%) son muy similares. Suponiendo que el 100% de las marcas recuperadas son devueltas, una tasa de recaptura de 30% podría ser representativa de la tasa anual de explotación de patudo por las pesquerías de cerco en esta re-gión. Esa tasa de recaptura es bastante cercana a las tasas anuales de explotación estimadas para el patudo, de clases de edad y per-íodos de tiempo similares, en el modelo de evaluación de la población de patudo del OPO (Aires-da-Silva y Maunder, 2009). En virtud de que las tasas de recaptura de los peces con marcas de dardo y marcas archivadoras, en libertad entre 30 d y 365 d, no son significativamente diferentes, parece que el sistema de recompensas puesto en marcha al principio de estos experimentos, incluida una lotería anual con cinco premios de US$1,000 cada uno ha resultado en una tasa de informe razonablemente insesgada para las marcas de dardo.
El porcentaje de marcas devueltas no fue significativamente diferente entre las clases de talla de 5 cm desde 45 y 100 cm en el momento de liberación. Sin embargo, en el caso de esas clases de talla de 105 a 130 cm, los porcentajes de marcas de-vueltas fueron significativamente menores, que en el caso de aquéllas de entre 45 y 100 cm en el momento de liberación. Esto se debe aparentemente a la menor afinidad de los patudos grandes a los plantados (Schaefer y Fuller, 2002; Anónimo, 2008) y por

DESPLAZAMIENTOS HORIZONTALS DE ATUNES PATUDO 243
ende una menor selectividad de los peces grandes por buques de cerco de los que la mayoría de las marcas de patudos recaptura-dos es devuelta.
Del total de 8,246 marcas de dardo y 163 marcas archivadoras devueltas, se reportó que solamente 40 (0.5%) y 11 (6.7%), respectivamente, provinieron de capturas por buques de palangre. La tasa de devolución de las marcas de dardo de las capturas de palangre es menor que la esperada, a partir de la distribución del esfuerzo de pesca, las capturas, y las frecuencias de talla de la cap-tura (Anónimo, 2008). Las capturas de patudo por buques de palangre consisten principalmente en peces de más de 90 cm de talla. Del total de 8,246 recuperaciones de marcas de dardo, 7,948 de los peces fueron medidos en el momento de liberación, y 1,020 (12.8%) fueron de 90 cm o más en ese momento. El porcentaje anual medio de la captura total de patudo en el OPO por buques de palangre, al sur de 10°N, durante el período de 2000-2005 fue 40.5% (Anónimo, 2008). Usando esas estadísticas, una estimación del porcentaje de la recaptura del total de patudos marcados con marcas de dardo por buques de palangre sería 5.0%. Esto debería ser considerado una estimación mínima, ya que no toma en cuenta las recapturas de patudo de menos de 90 cm en el momento de libe-ración, ya que cantidades sustanciales de patudo de menos de esta talla son capturadas con palangre (Aires-da-Silva y Maunder, 2009), y además, algunos peces de menos de esta talla al ser liberados crecerían a más de 90 cm de talla antes de ser recapturados. La tasa de devolución de marcas archivadoras procedentes de buques de palangre es comparable con lo que se esperaría, pero aqué-lla de las marcas de dardo es significativamente menos que lo esperado. Esta diferencia se debe aparentemente a la recompensa ini-cial ofrecida de US$500 por la devolución de las marcas archivadoras, contra los US$5 por las marcas de dardo. Es desafortunado que aparentemente las flotas de palangre no reporten las marcas de dardo, por el sesgo creado en la estimación de mortalidad, la distribución de las recapturas de algunos de los peces más grandes y con mayor tiempo en libertad, y también por la incapacidad de estimar con exactitud las interacciones entre las pesquerías de de cerco y de palangre.
Las tasas de devolución de marcas de dardo y marcas archivadoras liberadas concurrentemente con patudos reportadas de otros estudios de marcado en el Pacífico incluyen tasas de devolución similares de estudios realizados en aguas hawaianas (Itano y Holland, 2000; Musyl et al., 2003), pero en un estudio realizado frente a la costa noreste de Australia la tasa de devolución de las marcas de dardo fue más que dos veces aquélla de las marcas archivadoras (Clear et al., 2005). Los autores de ese trabajo sugieren varios factores posibles que pudieran haber contribuido a la diferencia observada en su estudio, incluida una mayor tasa de mortali-dad después del marcado de los patudos con marcas archivadoras.
Desplazamientos horizontales y utilización de hábitat
En el caso de las devoluciones de marcas de dardo, el desplazamiento lineal medio fue 556 km, y el 95% de los peces en libertad 30 d o más fue recapturado a menos de 1,883 km de su posición de liberación. La distribución de las recapturas fue princi-palmente en el OPO ecuatorial entre aproximadamente 5°N y 10°S y desde la costa hasta aproximadamente 150°O, con la mayoría de los desplazamientos en dirección oeste. No parecen existir diferencias en los patrones espaciales de los desplazamientos lineales entre años, por tiempo en libertad, o por talla de los peces en el momento de liberación en el caso de los peces con marcas de dardo.
Las rutas de desplazamiento derivadas de las devoluciones de marcas archivadoras, para los patudos en libertad 30 d o más, liberados en 2000, 2003, 2004, y 2005, parecen indicar ciertas diferencias para talla de liberación y año. Para los peces de me-nos de 80 cm, la distribución espacial de las rutas de desplazamiento está distribuida de forma bastante uniforme entre 95° y 105°O y 2.5°N y 5°S, mientras que para los peces de 80 a 100 cm la distribución espacial está ligeramente más confinada, aunque dos de las posiciones recaptura estuvieron más al oeste hasta aproximadamente 125°O. En el caso de los peces de más de 100 cm se ob-servó una distribución latitudinal similar a aquéllos de los intervalos de talla menores talla, pero con una extensión al este hasta aproximadamente 82.5°O, y una extensión al oeste de algunos peces hasta entre 110°O y 115°O, y dos peces con posiciones de re-captura entre 115°O y 125°O.
Las rutas de desplazamiento de los peces liberados en 2000 son algo más limitadas latitudinalmente que aquéllas de 2003 y 2005. Las rutas ilustran también una extensión al este en los desplazamientos hasta aproximadamente 82°O, no observada en las rutas de desplazamiento de los otros años. Los peces liberados en 2000, siendo más grandes que aquéllos de los otros años, es poten-cialmente la base de las diferencias observadas. Sin embargo, la extensión al este podría también ser indicativa de algunas caracterís-ticas ambientales que condujeron a una extensión temporal del hábitat, debido a ciertas características oceanográficas físicas y/o biológicas deseables desconocidas. Esta diferencia en la utilización anual de hábitat horizontal está también bien ilustrada en la dis-tribución de utilización de 95% de los peces durante el período de abril de 2000 a marzo de 2001, de aquélla de los otros períodos anuales, con la extensión al este desde aproximadamente 90°O hasta aproximadamente 82°O. Las distribuciones de utilización de 95% y 50% de los peces correspondientes al período de abril de 2004 a marzo de 2005 fueron asimismo más confinadas que aqué-

SCHAEFER Y FULLER 244
llas de los tres otros años. Sibert et al. (2006) informaron que los patrones de dispersión del atún aleta azul del Atlántico (Thunnus thynnus), basados en datos de marcas archivadoras, parecen también depender de la edad o la talla, y mostraron una variación anual, vinculada presuntamente de la variabilidad oceanográfica.
Parece que a partir del gran número de aplicaciones y recuperaciones de marcas de dardo en el presente estudio, junto con la alta calidad de la información de recaptura obtenida principalmente de los registros de los observadores, se puede obtener una reconstrucción razonable de la dispersión de los peces marcados. No obstante, la información auxiliar de las rutas de desplazamiento y parámetros obtenida de análisis de los datos de las marcas archivadoras es extremadamente valiosa y debería ser integrada con los datos de las marcas de dardo para evaluaciones de desplazamientos y tasas de mezcla a nivel de población y luego incorporada en los modelos de evaluación de poblaciones (Sibert y Fournier, 2001). Se han usado varios métodos diferentes para incorporar datos de marcado en los modelos de evaluación de poblaciones en los últimos años, y actualmente varias organizaciones están evaluando los métodos más apropiados (Maunder, 2007). Las aplicaciones de marcas archivadoras deberían ser consideradas en el diseño de experimentos de marcado de atunes junto con grandes aplicaciones de marcas de dardo, pero los análisis de costo-beneficio deberían incluir las tasas esperadas de devolución de marcas archivadoras en el área, con base en los resultados de experimentos recientes de marcado con marcas de dardo.
No existe aparentemente ninguna razón para que los patudos marcados en el presente estudio necesiten trasladarse de la región para reproducirse, ya que se ha demostrado que el desove de patudo tiene lugar en el Océano Pacífico central y oriental entre aproximadamente 15°N y 15°S y entre aproximadamente 105°O y 175°O, durante la mayoría de los meses del año en lo que la TSM supera aproximadamente 24°C (Schaefer et al., 2005). La talla y edad estimadas a las cuales se determinó que el 50% de las hembras de patudo eran maduras en el Pacífico central y oriental fueron 135 cm y 3.4 años (Schaefer et al., 2005; Schaefer y Fuller, 2006b). La mayoría de los patudos marcados en el presente estudio eran probablemente inmaduros, en ese momento, pero hubo numerosas recapturas de peces en el OPO ecuatorial que fueron de mayor talla y edad que aquéllas en las que se esperaría que el 50% de las hembras fuesen maduras y reproductivamente activas.
La distribución de utilización de 95% de 1,326,325 km2 para los 98 patudos con marcas archivadoras en libertad 30 d o más, estuvo centrada entre aproximadamente 3°N y 5°S y 90°O y 105°O, lo cual indica fidelidad regional del patudo a esta área. El área de 10° con la mayor densidad observada en la distribución anual media de la captura de cerco de patudo durante 1997-2006 es 5°N a 5°S y 95°O a 105°O (Anónimo, 2008: Figura A-3a), la cual se sobrepone con la distribución de utilización de 95% derivada de los 98 patudos con marcas archivadoras.
Los requisitos de hábitat para la residencia de una gran biomasa de patudo, indudablemente incluye altas concentraciones de alimento. La oceanografía del área utilizada principalmente por los 98 patudos es una región ecuatorial de afloramiento muy di-námica y altamente productiva. Esta resulta de que las aguas más frías de la Corriente de Perú fluyan al norte y luego al oeste como la lengua ecuatorial fría de la corriente ecuatorial del sur (Fiedler y Tally, 2006). La advección del agua más fría de la Corriente de Perú y el afloramiento ecuatorial generan altas concentraciones de nutrientes en esta región específica, llevando a altas concentra-ciones de biomasa de clorofila y fitoplancton de superficie durante todo el año (Pennington et al., 2006) y alta abundancia de zoo-plancton (Fernandez-Alamo y Farber-Lorda, 2006). Durante los cruceros de investigación EASTROPAC con múltiples buques, los que incluyeron investigaciones de los tipos de peces larvales y su abundancia (Ahlstrom, 1971; 1972), se determinó que los mictófi-dos y gonostomátidos, pequeños peces mesopelágicos, abundaban durante todo el año en el área del OPO ecuatorial utilizado por los patudos marcados en el presente estudio.
Altas concentraciones de alimento son evidentemente un factor ambiental importante en la distribución y abundancia de patudo a escala fina, y parece ser uno de los factores primarios que contribuyen a la fidelidad regional observada en el presen-te estudio. Blunt (1960) reportó que los cefalópodos y peces mesopelágicos eran los componentes más importantes en la dieta del patudo en el OPO ecuatorial. Hubo calamares en el 70 por ciento de los estómagos y contribuyeron a más del 60 por ciento del volumen de alimento. Los peces mesopelágicos y cefalópodos, junto con crustáceos, son los componentes primarios de la capa de dispersión profunda que migra verticalmente, observada en todo el Océano Pacífico (Tont, 1976). Los patudo han adaptado ciertas características anatómicas, morfológicas, y fisiológicas que les permiten alimentarse eficazmente de presas en la capa de dispersión profunda de noche, en la capa de mezcla, y durante el día, a profundidades de aproximadamente 300 m (Schaefer, 1999; Schaefer y Fuller, 2002).

DESPLAZAMIENTOS HORIZONTALS DE ATUNES PATUDO 245
Parámetros de desplazamiento
La combinación en el modelo UKF de desplazamiento (Lam et al., 2008) de las estimaciones de geolocación basadas en luz con aquéllas de TSM de los conjuntos de datos de marcas archivadoras de los 98 patudos ha probado ser extremadamente útil para reconstruir las rutas más probables de los patudos marcados, y obtener estimaciones de los parámetros de desplazamiento. Si-bert y Fournier (2001) introdujeron el modelo estadístico de estado-espacio que incorpora el filtro de Kalman para estimar una ruta más probable y parámetros de desplazamiento. Ese modelo fue extendido mediante la incorporación de datos de TSM medidos por las marcas archivadoras y la comparación de los mismos con datos de TSM de fuentes de sensores remotos (Nielsen et al., 2006).
Los parámetros estimados de desplazamiento dirigidos al este (u) y al norte (v) obtenidos del modelo UKF para las rutas de desplazamiento más probables para cada uno de los 98 patudos fueron todos cercanos a cero. El parámetro estimado de despla-zamiento dispersivo (D), la velocidad promedio a lo largo de las rutas de desplazamiento, y el DCM promedio por mes fueron todos considerablemente mayores para los peces liberados en 2005 que los valores para los peces liberados en 2000, 2003, y 2004. Estas diferencias parecen estar relacionados con el comportamiento de los peces más pequeños liberados en 2005 (Figuras 8 y 11) y no relacionados con la variabilidad en el medio ambiente. Las estadísticas espaciales D y DCM/mes, parecen ser estadísticas útiles y prácticas descriptivas de la difusión, y podrían ser apropiadas para inclusión en modelos de evaluación de poblaciones que tienen la capacidad de dinámica de desplazamiento.
Los parámetros de desplazamiento dirigido al este (u) y al norte (v) correspondientes al atún aleta azul del Atlántico, esti-mados a partir de datos de marcas archivadoras procesados con un modelo de filtro de Kalman, fueron asimismo cercanos a cero, y las estimaciones del parámetro de desplazamiento no dirigido D fueron altamente variable, con medianas anuales de entre 155 y 317 (Sibert et al., 2006). Aunque el aleta azul del Atlántico muestra un comportamiento altamente migratorio y patrones de dispersión muy amplia durante toda la vida (Block et al., 2005), la mediana anual de días en libertad en el estudio de Sibert et al. (2006) estuvo limitada a entre 147 y 215 d, y todas las posiciones reportadas y estimadas estuvieron situadas en un área bastante confinada del Atlántico noroeste (Sibert et al., 2006). Por lo tanto, no es sorprendente que los valores estimados de D para el aleta azul de ese estudio son menores que aquéllos del patudo (Tabla 6), que no muestra comportamiento altamente migratorio.
Estructura de la población
Los resultados de los experimentos de marcado de patudo del presente estudio, utilizando marcas de dardo y marcas ar-chivadoras, indican que el patudo en el OPO ecuatorial tiene desplazamientos limitados, resultando en mezcla limitada entre áreas adyacentes a más de 1,852 km de su punto de liberación. Los desplazamientos de patudo inferidos de experimentos de marcado con marcas de dardo en el Pacífico occidental (Hampton y Gunn, 1998; Clear et al., 2005; Hampton y Williams, 2005) y Hawai (Itano y Holland, 2000) indican que, aunque hubo algunos desplazamientos lineales de larga distancia, la mayoría es limitada a menos de 1,852 km del punto de liberación, aun al cabo de períodos sustanciales en libertad. Los desplazamientos de patudos basados en un experimento de marcado realizado en el Mar de Coral, frente a la costa noreste de Australia, del cual 17 marcas archivadoras fueron devueltas al cabo de tiempos en libertad de entre 47 y 1,441 d, con un tiempo en libertad promedio de 578 d, indican que los peces fueron en gran medida residentes en el Mar de Coral durante su time en libertad, aunque dos de los peces realizaron desplazamientos cíclicos sustanciales de este a oeste (Clear et al., 2005).
Han sido reportados resultados similares, que indican desplazamientos limitados y fidelidad regional, de análisis de datos de marcado de atunes aleta amarilla liberados con marcas de dardo en el OPO (Joseph et al., 1964; Bayliff, 1979), experimentos en Hawai (Itano y Holland, 2000), y de tres experimentos en el Pacífico occidental y central (Sibert y Hampton, 2003), y también de experimentos con aletas amarillas liberados con marcas archivadoras en el OPO (Schaefer et al., 2007).
Los resultados del presente estudio de marcado de patudo y aquéllos de otras áreas del Pacífico indican que el grado de mezcla es bastante bajo entre el OPO y el Pacífico central y occidental. La falta de mezcla por el patudo a través del Pacífico ha resultado aparentemente en cierta variación geográfica en las características del ciclo vital, incluidas diferencias en los calendarios de crecimiento y madurez entre los peces del Pacífico oriental y occidental (Schaefer et al., 2005; Schaefer y Fuller, 2006b). Ya que no existe evidencia de diferenciación genética de patudo en el Pacífico (Grewe y Hampton, 1998), estas diferencias fenotípicas son aparentemente el resultado de aislamiento por distancia y variación ambiental.
Las conclusiones del presente estudio sugieren la necesidad de que las evaluaciones regionales de la población de patudo en el Océano Pacífico estén basadas en modelos espaciales que incluyan la dinámica de los desplazamientos del patudo, ya que su-puestos de mezcla completa en áreas regionales grandes no son realistas, y conducirían a graves sesgos y asesoramiento de ordena-

SCHAEFER Y FULLER 246
ción no apropiado. Además, la estratificación espacial dentro de las evaluaciones de patudo regionales y/o del Pacífico entero deber-ía ser de dimensiones científicamente válidas, e incorporar en los estratos tasas de mortalidad por pesca, características del ciclo vital, y una dinámica de desplazamiento que incluya tasas de difusión geográficamente específicas. Existe la necesidad de ampliar la distribución de las aplicaciones de marcas en el patudo en el Pacífico, tanto en longitud como en latitud, a fin de obtener un mejor conocimiento de la variabilidad geográfica en los desplazamientos y la mezcla potencial entre áreas.
RECONOCIMIENTOS
Esta investigación fue posibilitada por contribuciones financieras por la Japan Fisheries Agency y la Taiwan Fisheries Agency. Agradecemos el asesoramiento inestimable de A. Parker y D. Stephenson sobre la dinámica de la pesca sobre plantados. Agradecemos al capitán B. Blocker y sus tripulaciones a bordo del BM Her Grace sus estupendos esfuerzos en las operaciones de pesca y marcado. Apreciamos la ayuda prestada por C. Sepulveda durante el crucero de marcado de 2003. Estamos muy agradecidos a los armadores y capitanes de buques, pescadores, estibadores, y representantes de la industria por sus devoluciones de marcas re-cuperadas. Gracias también al personal de las oficinas regionales de la CIAT por sus esfuerzos en la recuperación de marcas e in-formación de recaptura. Se extiende un agradecimiento especial a T. Lam, A. Nielsen, y J. Sibert por poner el UKF a nuestra dispo-sición, y por su valioso asesoramiento y ayuda. Gracias también a J. Hampton (OFP/SPC), D. Itano (PFRP), y T. Matsumoto (NRIFSFRL), por los datos de desplazamientos de patudos a grandes distancias de experimentos de marcado en el Pacífico occiden-tal y central. Deseamos asimismo agradecer a W. Bayliff, A. Aires-Da-Silva, y tres revisores anónimos por sus comentarios cons-tructivos sobre los borradores del manuscrito.

DESPLAZAMIENTOS HORIZONTALS DE ATUNES PATUDO 247
LITERATURE CITED—LITERATURA CITADA
Ahlstrom, E.H. 1971. Kinds and abundance of fish larvae in the eastern tropical Pacific, based on collections made on EAS-TROPAC I. U.S. Nat. Mar. Fish. Ser., Fish. Bull., 69(1): 3-77.
Ahlstrom, E.H. 1972. Kinds and abundance of fish larvae in the eastern tropical Pacific on the second multivessel EASTROPAC survey, and observations on the annual cycle of larval abundance. U.S. Nat. Mar. Fish. Ser., Fish. Bull., 70(4): 1153-1242.
Aires-da-Silva, A. and M.N. Maunder. 2009. Status of bigeye tuna in the eastern Pacific Ocean in 2007. Inter-Amer. Trop. Tuna Comm., Stock Assess. Rept., 9: in press.
Anonymous. 2004. Annual Report of the Inter-American Tropical Tuna Commission, 2002: 149 pp. Anonymous. 2008. Tunas and billfishes in the eastern Pacific Ocean in 2007. Fishery Status Report 6. Inter-Amer. Trop. Tuna
Comm.: 140 pp. Arnold, G., and H. Dewar. 2001. Electronic tags in marine fisheries research: a 30-year perspective. In: Sibert, J.R., Nielsen, J.L.
(eds) Electronic tagging and tracking in marine fisheries. Kluwer, Dordrecht, The Netherlands: 7-64. Bayliff, W.H. 1979. Migrations of yellowfin tuna in the eastern Pacific Ocean as determined from tagging experiments initiated
during 1968-1974. Inter-Amer. Trop. Tuna Comm., Bull. 17(6): 445-506. Bayliff, W.H. 1993. An indexed bibliography of papers on tagging of tunas and billfishes. Inter-Amer. Trop. Tuna Comm., Spec.
Rept. 8: 91 pp. Bayliff, W.H., and K.N. Holland. 1986. Materials and methods for tagging tunas and billfishes, recovering the tags, and handling the
recapture data. FAO, Fish. Tech. Pap., 279: 36 pp. Block, B.A. 2005. Physiological ecology in the 21st century: Advancements in biologging science. Integr. Comp. Biol. 45(2): 305-
320. Block, B.A., S.L.H. Teo, A. Walli, A. Boustany, M.J.W. Stokesbury, C.J. Farwell, K.C. Weng, H. Dewar, and T.D. Williams. 2005.
Electronic tagging and population structure of Atlantic bluefin tuna. Nature 434:1121-1127. Blunt, C.E., Jr. 1960. Observations on the food habits of longline caught bigeye and yellowfin tuna from the tropical eastern Pacific
1955-1956. Calif. Fish Game, 46(1): 69-80. Clear, N.P., K. Evans, J.S. Gunn, S. Bestley, K. Hartmann, and T. Patterson. 2005. Movement of bigeye tuna (Thunnus obesus)
determined from archival tag light-levels and sea surface temperatures. In: Migration and habitat preferences of bigeye tuna, Thunnus obesus, on the east coast of Australia. CSIRO Report FRPC 1999/109: 19-46.
Collette, B.B. and C.E. Nauen. 1983. Scombrids of the world. An annotated and illustrated catalogue of tunas, mackerels, bonitos and related species known to date. FAO Fish. Synop. 125 (2): 137 pp.
Domeier, M.L., D. Kiefer, N. Nasby-Lucas, A. Wagschal, and F. O’Brien. 2005. Tracking Pacific bluefin tuna (Thunnus thynnus orientalis) in the northeastern Pacific with an automated algorithm that estimates latitude by matching sea-surface-temperature data from satellites with temperature data from tags on fish. U.S. Nat. Mar. Fish. Ser., Fish. Bull., 103(2): 292-306.
Ekstrom, P.A. 2004. An advance in geolocation by light. In: Naito Y (ed) Memoirs of the National Institute of Polar Research, Spe-cial Issue. National Institute of Polar Research, Tokyo: 210-226.
Fernandez-Alamo, M.A. and J. Farber-Lorda. 2006. Zooplankton and oceanography of the eastern tropical Pacific: A review. Prog. Ocean. 69(2-4): 318-359.
Fiedler, P.C. and L.D. Talley. 2006. Hydrography of the eastern tropical Pacific: A review. Prog. Ocean. 69(2-4): 143-180. Grewe, P.M. and J. Hampton. 1998. An assessment of bigeye (Thunnus obesus) population structure in the Pacific Ocean, based on
mitochondrial DNA and DNA microsatellite analysis. University of Hawaii, Joint Institute for Marine and Atmospheric Research Contribution 98-320, 29 p.
Gunn, J. and B. Block. 2001. Advances in acoustic, archival, and satellite tagging of tunas. In: Tuna physiology, ecology, and evolu-tion. B.A. Block and E.D. Stevens (eds) San Diego (California): Academic Press: 167-224.
Hampton, J. and J. Gunn. 1998. Exploitation and movements of yellowfin tuna (Thunnus albacares) and bigeye tuna (T. obesus) tagged in the north-western Coral Sea. Mar. Freshwater Res., 49(6): 475-489.
Hampton, J. and P. Williams. 2005. A description of tag-recapture data for bigeye tuna (Thunnus obesus) in the western and central Pacific Ocean. Inter. Comm. Conser. Atlan. Tunas, Coll. Vol. Sci. Pap., 57(2): 85-93.
Hill, R.D. 1994. Theory of geolocation by light levels. In: Le Boeuf BJ, Laws RM (eds) Elephant Seals: Population Ecology, Behav-ior, and Physiology. University of California Press, Berkley: 227-236.

SCHAEFER Y FULLER 248
Hooge, P.N. and B. Eichenlaub. 1997. Animal movement extension to arcview, version 2.04. Alaska Biological Science Center, US Geological Survey, Anchorage, AK. http://www.absc.usgs.gov/glba/gistools.
Hooge, P.N., W. Eichenlaub, and E.K. Solomon. 2001. Using GIS to analyze animal movements in the marine environment. In Kruse, G. H., Bez N., Booth A., Dorn M. W., Hills S., Lipcius R. N., Pelletier D., Roy C., Smith S. J., and Witherell, D., (Eds.), Spatial Processes and Management of Marine Populations. University of Alaska Sea Grant, P.O. Box 755040, Fairbanks, AK 99775-5040.
Hunter, J.R., A.W. Argue, W.H. Bayliff, A.E. Dizon, A. Fonteneau, D. Goodman, and G.R. Seckel. 1986. The dynamics of tuna movements: an evaluation of past and future research. FAO Fish. Tech. Pap., 277: 78 p.
Itano, D.G. and K.N. Holland. 2000. Movement and vulnerability of bigeye (Thunnus obesus) and yellowfin tuna (Thunnus alba-cares) in relation to FADs and natural aggregation points. Aquat. Living Res., 13(4): 213-223.
Joseph, J., F.G. Alverson, B.D. Fink, and E.B. Davidoff. 1964. A review of the population structure of yellowfin tuna, Thunnus albacares, in the eastern Pacific Ocean. Inter-Amer. Trop. Tuna Comm., Bull. 9(2): 53-112.
Lam, C.H., A. Nielsen, and J. Sibert. 2008. Improving light and temperature based geolocation by unscented Kalman filtering. Fish. Res. 91(1): 15-25.
Maunder, M.N. 2007. Workshop on Using Tagging Data for Fisheries Stock Assessment and Management Strategies. La Jolla, Cali-fornia, USA, October 16-19, 2007. http://www.iattc.org/PDFFiles2/Tagging-WS-Oct-2007-Report-ENG.pdf.
Miyabe, N., and W.H. Bayliff. 1998. A review of information on the biology, fisheries, and stock assessment of bigeye tuna, Thun-nus obsesus, in the Pacific Ocean. Inter-Amer. Trop. Tuna Comm., Spec. Rept., 9: 129-170.
Musyl, M.K., R.W. Brill, C.H. Boggs, D.S. Curran, T.K. Kazama, and M.P. Seki. 2003. Vertical movements of bigeye tuna (Thun-nus obesus) associated with islands, buoys, and seamounts near the main Hawaiian Islands from archival tagging data. Fish. Oceanogr. 12(3): 152-169.
Nielsen, A., K.A. Bigelow, M.K. Musyl, and J.R. Sibert. 2006. Improving light-based geolocation by including sea surface temperature. Fish. Oceanogr. 15(4): 314-325.
Pennington, J.T., K.L. Mahoney, V.S. Kuwahara, D.D. Kolber, R. Calienes, and F.P. Chavez. 2006. Primary production in the eastern tropical Pacific: A review. Prog. Ocean. 69(2-4): 285-317.
Reynolds, R.W. and T.M. Smith. 1994. Improved global sea surface temperature analyses using optimal interpolation. J. Clim. 7: 929-948.
Schaefer, K.M. 1999. Comparative study of some morphological features of yellowfin (Thunnus albacares) and bigeye (Thunnus obesus) tunas. Inter-Amer. Trop. Tuna Comm., Bull., 21(7): 489-525.
Schaefer, K.M. and D.W. Fuller. 2002. Movements, behavior, and habitat selection of bigeye tuna (Thunnus obesus) in the eastern equatorial Pacific, ascertained through archival tags. U.S. Nat. Mar. Fish. Ser., Fish. Bull., 100(4): 765-788.
Schaefer, K.M., D.W. Fuller, and N. Miyabe. 2005. Reproductive biology of bigeye tuna (Thunnus obesus) in the eastern and central Pacific Ocean. Inter-Amer. Trop. Tuna Comm., Bull., 23(1): 1-31.
Schaefer, K.M. and D.W. Fuller. 2006a. Comparative performance of current-generation geolocating archival tags. Jour. Mar. Tech. Soc. 40(1): 15-28.
Schaefer, K.M. and D.W. Fuller. 2006b. Estimates of age and growth of bigeye tuna (Thunnus obesus) in the eastern Pacific Ocean, based on otolith increments and tagging data. Inter-Amer. Trop. Tuna Comm., Bull., 23(2): 32-76.
Schaefer, K.M., D.W. Fuller, and B.A. Block. 2007. Movements, behavior, and habitat utilization of yellowfin tuna (Thunnus alba-cares) in the northeastern Pacific Ocean, ascertained through archival tag data. Mar. Biol. 152(3): 503-525.
Sibert, J.R. and D.A. Fournier. 2001. Possible models for combining tracking data with conventional tagging data. In J. Sibert and J. Nielsen, (Eds.), Electronic tagging and tracking in marine fisheries. Kluwer Academic Publs., Dordrecht, The Nether-lands: 443-456.
Sibert, J. and J. Hampton. 2003. Mobility of tropical tunas and the implications for fisheries management. Mar. Pol., 27(1): 87-95. Sibert, J.R., M. E. Lutcavage, A. Nielsen, R. W. Brill, and S. G. Wilson. 2006. Interannual variation in large-scale movement of
Atlantic bluefin tuna (Thunnus thynnus) determined from pop-up satellite archival tags. Can. J. Fish. Aquat. Sci. 63(10): 2154-2166.
Teo, S.L.H., A. Boustany, S. Blackwell, A. Walli, K.C. Weng, and B.A. Block. 2004. Validation of geolocation estimates based on light level and sea surface temperature from electronic tags. Mar. Ecol. Prog. Ser., 283: 81-98.
Tont, S.A. 1976. Deep scattering layers: patterns in the Pacific. Rep. Calif. Coop. Ocean. Fish. Invest. 18: 112-117. Vazquez, J., K. Perry, and K. Kilpatrick. 1998. NOAA/NASA AVHRR Oceans Pathfinder Sea Surface Temperature Data Set User’s
Reference Manual, Version 4.0. 10 April 1998. Pasadena, CA: Jet Propulsion Laboratory. JPL Publication D-14070.

The IATTC's responsibilities are met with two programs, the Tuna-Billfish Program and the Tuna-Dolphin Program. The principal responsibilities of the Tuna-Billfish Program are (1) to study the biology of the tunas and related species of the eastern Pacific Ocean to estimate the effects that fishing and natural factors have on their abundance, (2) to recommend appropriate conservation measures so that the stocks of fish can be maintained at levels that will afford maximum sustainable catches, and (3) to collect in-formation on compliance with Commission resolutions. The principal responsibilities of the Tuna-Dolphin Pro-gram are (1) to monitor the abundance of dolphins and their mortality incidental to purse-seine fishing in the eastern Pacific Ocean, (2) to study the causes of mor-tality of dolphins during fishing operations and promote the use of fishing techniques and equipment that minimize these mortalities, (3) to study the effects of different modes of fishing on the various fish and other animals of the pelagic ecosystem, and (4) to provide a Secretariat for the International Dolphin Conservation Program. An important part of the work of the IATTC is the prompt publication and wide distribution of its research results. The Commission publishes its results in its Bul-letin, Special Report, and Data Report series, all of which are issued on an irregular basis, and its Stock Assessment Reports and Fishery Status Reports, which are published annually. The Commission also publishes Annual Reports and Quarterly Reports, which include policy actions of the Commission, information on the fishery, and re-views of the year's or quarter's work carried out by the staff. The Annual Reports also contain financial state-ments and a roster of the IATTC staff. Additional information on the IATTC’s pub-lications can be found in its web site.
La CIAT cumple sus obligaciones mediante dos programas, el Programa Atún-Picudo y el Programa Atún-Delfín. Las responsabilidades principales del pri-mero son (1) estudiar la biología de los atunes y especies afines en el Océano Pacífico oriental a fin de determinar los efectos de la pesca y los factores naturales sobre su abundancia, (2) recomendar medidas apropiadas de conservación para permitir mantener los stocks de peces a niveles que brinden las capturas máximas sostenibles, (3) reunir información sobre el cumplimiento de las resoluciones de la Comisión. Las responsabilidades principales del segundo son (1) dar seguimiento a la abundancia de los delfines y la mor-talidad de los mismos incidental a la pesca con red de cerco en el Océano Pacífico oriental, (2) estudiar las causas de la mortalidad de delfines durante las operaciones de pesca y fomentar el uso de técnicas y aparejo de pesca que reduzcan dicha mortalidad almínimo, (3) estudiar los efectos de distintas mor-talidades de pesca sobre los varios peces y otros animales del ecosistema pelágico, (4) proporcionar la Secretaría para el Programa Internacional para la Conservación de los Delfines. La pronta publicación y amplia distribución de los resultados de investigación forman un aspecto im-portante de las labores de la Comisión, la cual publica los resultados en su serie de Boletines, Informes Especiales, e Informes de Datos, publicados a in-tervalos irregulares, y sus Informes de Evaluación de Stocks y Informes de la Situación de la Pesquería, publicados anualmente. La Comisión publica también Informes Anuales e Informes Trimestrales; éstos incluyen información so-bre las labores de la Comisión, la pesquería, y las investigaciones realizadas en el año o trimestre correspondiente. Los Informes Anuales incluyen tam-bién un resumen financiero y una lista del personal de la CIAT. En el sitio de internet de la CIAT se presenta información adicional sobre estas publicaciones.
Inter-American Tropical Tuna Commission Comisión Interamericana del Atún Tropical
8604 La Jolla Shores Drive La Jolla, California 92037-1508, U.S.A.
www.iattc.org