INTENDED LEARNING OUTCOMES - Edo University Iyamho · INTENDED LEARNING OUTCOMES ... Acid base...
52
COURSE CODE: CHM 221 COURSE TITLE: Introductory Analytical Chemistry NUMBER OF UNITS: 2 Units COURSE DURATION: Two hours per week COURSE LECTURER: ABEL INOBEME INTENDED LEARNING OUTCOMES At the end of this course, students should be able to: 1. Explain the concept of titrimetric analysis 2. List the various types of titration 3. Differentiate between precipitation and potentiometric titration 4. Select appropriate titrimetric methods for relevant analysis 5. Apply relevant titrimetric methods in analysis 6. Treat data obtained from acid-base reactions equilibria COURSE DETAILS: Week 1-2: Introduction to Titrimetric analysis: Acid-base titration, concept of indicators and choices of indicators. Week 3-4 Redox titration: introduction to redox titration; the concept of iodometry and iodimetry. Week 5-6: Introduction to complexometric titration: concept of chilometry, Titration Selectivity, Masking and Demasking Agents. Week 7-8: Principles of potentiometric titration; End point determination in potentiometric titration Week 9-10 Precipitation titration and Acid base equilibria Week 11-12: Revision RESOURCES • Lecturer’s Office Hours: • Mr. Inobeme, A. Mondays-Wednesday, 2:00-4:00pm. • Course lecture Notes: http://www.edouniversity.edu.ng/oer/chemdept/chm221.pdf • Books: Analytical Chemistry by Gary D. Christian, Hardcover: 848 pages Publisher: Wiley; 6th edition Fundamentals of Analytical Chemistry by Douglas A. Skoog, Donald M. West, F. James Holler, Stanley R. Crouch, Hardcover: 992 pages, Publisher: Brooks Cole
Transcript of INTENDED LEARNING OUTCOMES - Edo University Iyamho · INTENDED LEARNING OUTCOMES ... Acid base...
COURSE CODE: CHM 221
COURSE TITLE: Introductory Analytical Chemistry
NUMBER OF UNITS: 2 Units
COURSE DURATION: Two hours per week
COURSE LECTURER: ABEL INOBEME
INTENDED LEARNING OUTCOMES
At the end of this course, students should be able to:
1. Explain the concept of titrimetric analysis
2. List the various types of titration
3. Differentiate between precipitation and potentiometric titration
4. Select appropriate titrimetric methods for relevant analysis
5. Apply relevant titrimetric methods in analysis
6. Treat data obtained from acid-base reactions equilibria
COURSE DETAILS:
Week 1-2: Introduction to Titrimetric analysis: Acid-base titration, concept of indicators and
choices of indicators.
Week 3-4 Redox titration: introduction to redox titration; the concept of iodometry and
iodimetry.
Week 5-6: Introduction to complexometric titration: concept of chilometry, Titration
Selectivity, Masking and Demasking Agents.
Week 7-8: Principles of potentiometric titration; End point determination in potentiometric
titration
Week 9-10 Precipitation titration and Acid base equilibria
Week 11-12: Revision
RESOURCES
• Lecturer’s Office Hours:
• Mr. Inobeme, A. Mondays-Wednesday, 2:00-4:00pm.
• Course lecture Notes: http://www.edouniversity.edu.ng/oer/chemdept/chm221.pdf
• Books:
Analytical Chemistry by Gary D. Christian, Hardcover: 848 pages Publisher: Wiley; 6th
edition
Fundamentals of Analytical Chemistry by Douglas A. Skoog, Donald M. West, F. James
Holler, Stanley R. Crouch, Hardcover: 992 pages, Publisher: Brooks Cole
OJ
Stamp

Schaum's Outline of Analytical Chemistry by Adon A Gordus, Paperback: 256 pages,
Publisher: McGraw-Hill
Project Exercises:
• Homeworks and Project: 30% of final grade.
• Exams:
• Final, comprehensive (according to university schedule): 70% of final grade
Assignments & Grading
• Academic Honesty: individualised assignments should be done and submitted accordingly.
• For group exercises, all the group members must be actively involved.
• For collaborative works, the names of group members alongside their contributions should
be clearly stated.
Introductory Analytical chemistry by Abel Inobeme is licensed under a Creative Commons Attribution-NonCommercial-ShareAlike 4.0 International License
PREAMBLE
Acid- Base Titrations
Acid base titrations are examples of volumetric analysis, a technique in which one solution
is used to analyse another. The solution used to carry out the analysis is called the titrant and
is delivered from a device called a burette, which measures the volume accurately. The point
in the titration at which enough titrant has been added to react exactly with the substance
being determined is called equivalence point, or the stoichiometric point. This point is often
marked by the change in colour of a chemical called an indicator.
The following requirements must be met for a titration to be successful:
The concentration of the titrant must be known. Such a titrant is called a standard
solution.
The exact reaction between the titrant and substance being analysed must be known.
The stoichiometry point must be known. An indicator that changes colour at, or very
near the stoichiometric point is often used.
The volume of titrant required to reach the stoichiometric point must be known as
accurately as possible.

The point at which the indicator changes colour is called endpoint. The goal is to choose an
indicator whose end point coincides with the equivalence point.
Precautions in Volumetric Analysis
The following precautions should be observed in order to ensure precision and accuracy
in readings during titration experiments:
1. The burette should be rinsed with the acid solution to be used during the titration. This is
to prevent diluting the solution with the remains of the water used for rinsing. The pipette
should also be rinsed with alkali so as to avoid diluting the alkali solution.
2. The conical flask should not be rinsed with the alkali solution to avoid increase in the
volume of the alkali.
3. Air bubbles should not be trapped in the burette or pipette. The presence of air bubble
will result in a decrease in the volume of the solution.
4. The funnel should be removed from the top of the burette before adjusting the volume of
the solution in the burette to the starting mark. This is because the presence of funnel
during this process will result in increase in volume due to drains or drops from funnel.
5. Do not blow the last drop at the tip of the pipette to avoid using more volume than the
pipette was made to deliver.
6. The burette should be position vertically so as to avoid error due to pararax when taking
readings.
7. A maximum of two to three drops of indicator should be used so as to ensure a sharp end
point.
8. A white background (e.g. tile) should be used in order to prevent overshooting the
endpoint.
Guidelines for Reporting Volumetric Analysis
The following are areas in practical chemistry where students lost marks in volumetric
analysis:
i. Reading burette to one decimal place instead of two
ii. Using non-concordant values for averaging
iii. Putting down of titre values without showing how they are arrived at ( i. e initial
and final burette readings not recorded)

iv. Arithmetic errors: errors of subtraction, addition and multiplication
v. Use of wrong units or no units at all
vi. Inconsistently reading burette to the nearest whole number (one decimal place)
vii. Answering of questions in pencil
Primary Standard
A substance is said to a primary standard if it possesses the following characteristics:
1. Has a known high degree of purity
2. Readily dissolve in water
3. Has relatively large molar mass
4. Does not decompose easily in its solid state or as a solution
5. Non hygroscopic, and
6. Reacts in a predictable way
Examples of primary standard substances are ethanedioc acid dehydrate (H2C2O4.2H2O),
anhydrous sodium trioxocarbonate (IV) (Na2CO3), potassium hydrogen phthalate(C8H4O4 )
benzoic acid (C6H5COOH), potassium and KIO3.
Secondary Standard
A substance is said to be a secondary standard if it cannot be obtained at a high state of purity
hence not suitable for the preparation of a standard solution. Examples are sodium hydroxide
(NaOH), tetraoxosulphate (VI) acid etc.
Secondary standard substances have certain limitations that make them unsuitable for
preparing a standard solution. Some properties responsible for such limitations are:
i. Absorption of moisture from the atmosphere (hygroscopy and deliquisence) e.g
H2SO4 and NaOH.
ii. Volatility (e.g HNO3 and HCl) and variation in concentration on exposure to air.
iii. Poor solubility in water or any other solvent for the solution e.g Ca(OH)2
Question 2

Give one reason each, why the following substance cannot be used as primary standard:
H2SO4, NaOH, HNO3, hydrated Na2CO3, KMnO4 and FeCl2
Example 1
Calculate the volume of concentrated tetraoxosulphate (VI) acid that is needed to prepare
8dm3 of 0.05moldm-3 solution of the compound from the stock. Given
Specific gravity of H2SO4 = 1.84gcm-3
% purity of acid =97%
Molar mass = 98gmol-1
Answer:
Step1: calculate the stock bottle concentration of the acid
1cm3 weighs 1.84g
1000cm3 weighs 1000 × 1.84/1 = 1840g
Since 100g of the concentrated acid contains 97g of pure acid
1840g contains 1840 × 97/100 =1784.8gdm-3 of pure acid
Molar conc. = mass conc. /molar mass = 18.21M
Alternative method for step 1:
C = 10pd/M
C = 10 ×97 × 1.84/ 98 = 18.21M

Step 2: Apply dilution formula
C1V1=C2V2
C1= 18.21M V1=? C2=0. 05M V2=8dm3
V1 = 0.05 × 8 / 18.21 = 0.0219dm3 i.e 21.90cm3
(H2SO4 =98gmol-1)
PH SCALE
This is a scale that is used for expressing the acidity or alkalinity of a solution. The acidity of
a solution depends on the concentration of hydrogen ions (H+) in it.
Measuring pH
The hydrogen ion concentration of a solution can be measured using any of the following:
i. Universal indicator: it is prepared from a mixture of dyes that change colour
with hydrogen ion concentration. It measures precisely to the nearest whole
number
ii. PH meter: this is more precise in the measurement of pH. It has an electrode
which gives rise to a voltage that is directly proportional to hydrogen ion
concentration of the solution it is dipped.
Indicators
An indicator is an organic substance, usually weak organic acid or base that changes colour
with change in the pH of solution. Indicators show end point of titration generally by a
change in the colour of the solution.
When the reaction between two solutions is completed, then the slight excess of one solution
is revealed by the colour change in the solution.
Choice of Indicators
Different types of indicators are available for acid base titration. No single indicator is
suitable for the titration of all the categories of acid and base. The choice of indicator depends
on the strength of the acid and base.
The colour change of the indicator should be near the equivalence point (stoichiometric
point) of the reaction.
Suitable indicators for acid-base titrations
Choices of indicators
Strength of acid and base Suitable indicator
Weak acid and weak base (e.g CH3COOH and
NH4OH)
No suitable indicator for this
titration.
Strong acid and strong base (e.g H2SO4 and KOH) Any indicator
Weak acid and strong base (e.g CH3COOH and
NaOH)
Phenolphthalein
Weak base and strong acid(NH4OH and HCl) Methyl orange
Colours of indicators in different media
Indicator Colour in acidic
medium
Colour in basic
medium
Colour at end
point
pH
range
Methyl Orange Red Yellow Orange 3.1-4.4
Methyl Red Red Yellow Red 4.4-6.3

Litmus Red Blue Pink 5.0-8.0
Bromothymol
Blue
Yellow Blue Green 6.0-7.6
Phenolphthalein Colourless Red (or pink) Pink 7.0-9.5
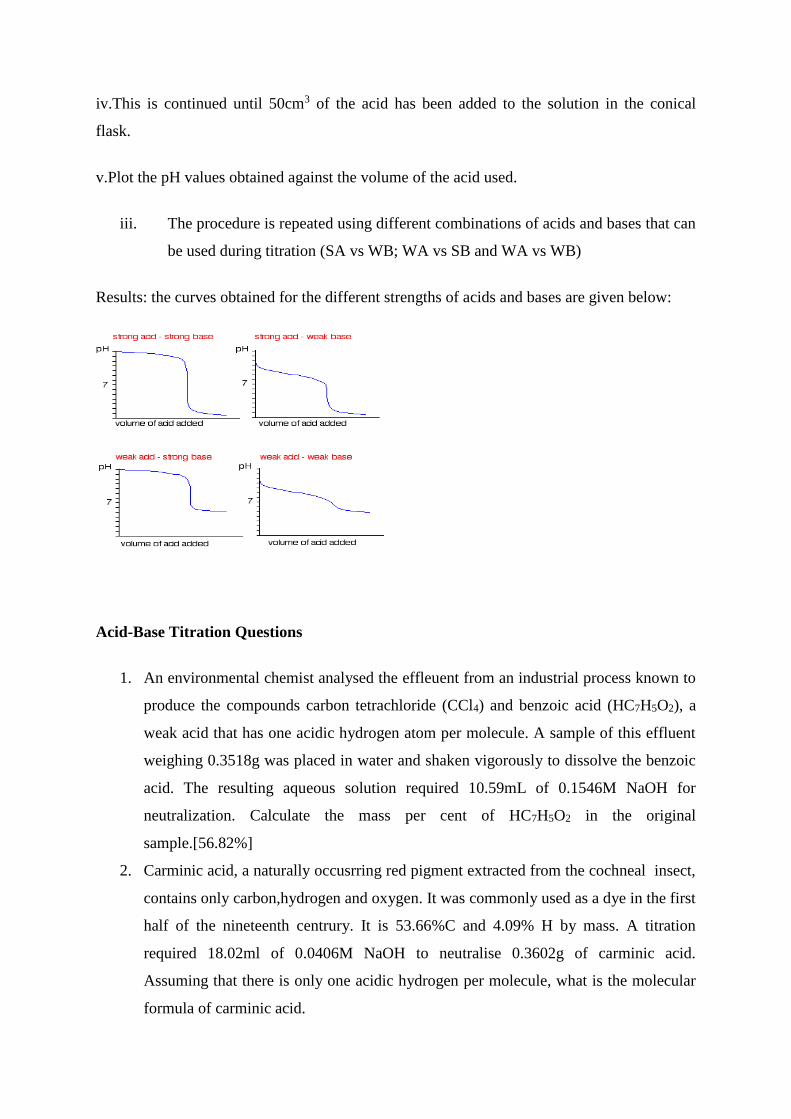
Titration Curves
A titration curve is obtained by plotting the pH data obtained during a titration against the
volume of acid or alkaline added. All acid titration curves follow the same basic shapes.The
strength of acids and bases determine the variation in pH during a titration.
Titration curve for strong acid and strong base (e.g HCl and NaOH)
The pH only falls slightly until quite near the equivalence point. Then there is a really steep
plunge.
Titration curve for strong acid and weak base (e.g HCl and NH4OH)
For this titration, the equivalence point is now somewhat acidic (a bit less than pH 5),
because pure ammonium chloride formed at the end point is not neutral (hydrolysis).
However, the equivalence point still falls on the steepest bit of the curve.

Titration curve for Weak Acids and Strong bases (e.g ethanoic acid and NaOH)
Once the equivalence point is passed, a buffer solution containing sodium ethanoate and
ethanoic acid is obtained. This resists any large fall in pH.
Weak acid and weak base
This curve is characterised a point called ‘point of inflection’. There is no any steep on the
graph. The absence of steep shows that it is difficult to carry out a titration between a weak
acid and a weak base.
Experiment:
Aim: To study the variation of pH during acid-base titration
Reagents/materials: conical flask, burette, universal indicator, 0.1 HCl and 0.1 NaOH.
Procedure:
i.pipette 25.00cm3 of the 0.1M NaOH into the conical flask and add three drops of the
universal indicator and take the pH of the solution.
ii. Fill the burette with the 0.1M HCl provided and add 1cm3 at a time into the alkali in the
flask.
iii.Record the pH of the solution after the addition of each drop of the acid. Shake the flask
after each addition.
iv.This is continued until 50cm3 of the acid has been added to the solution in the conical
flask.
v.Plot the pH values obtained against the volume of the acid used.
iii. The procedure is repeated using different combinations of acids and bases that can
be used during titration (SA vs WB; WA vs SB and WA vs WB)
Results: the curves obtained for the different strengths of acids and bases are given below:
Acid-Base Titration Questions
1. An environmental chemist analysed the effleuent from an industrial process known to
produce the compounds carbon tetrachloride (CCl4) and benzoic acid (HC7H5O2), a
weak acid that has one acidic hydrogen atom per molecule. A sample of this effluent
weighing 0.3518g was placed in water and shaken vigorously to dissolve the benzoic
acid. The resulting aqueous solution required 10.59mL of 0.1546M NaOH for
neutralization. Calculate the mass per cent of HC7H5O2 in the original
sample.[56.82%]
2. Carminic acid, a naturally occusrring red pigment extracted from the cochneal insect,
contains only carbon,hydrogen and oxygen. It was commonly used as a dye in the first
half of the nineteenth centrury. It is 53.66%C and 4.09% H by mass. A titration
required 18.02ml of 0.0406M NaOH to neutralise 0.3602g of carminic acid.
Assuming that there is only one acidic hydrogen per molecule, what is the molecular
formula of carminic acid.

3. A 2.20g sample of an unknown acid (empirical formula = C3H4O3) is dissolved in
1.0L of water. A titration required 25.0ml of 0.500M NaOH to react completely with
all the acid present. Assuming that the unknown acid has one acidic proton per
molecule, what is the molecular formula of the unknown acid?
Types of Titrations
There are four main types of volumetric analysis. The classification is based on the nature of
the reaction involved in the process.
Titration Chemical to be
analysed
Reagents Indicator
Acid/base Acid or base Alkali or acid pH indicator
Redox Oxidizing or
reducing agent
Reducing or
oxidizing agent
Self-indicating or
redox indicators
Complexometric Metal ions that form
complexes
Complexing agent Metal ion indicator
Precipitation Ion that form salts
that are insoluble
Compound
containing the other
ion needed to form
the insoluble salt
Conductivity
measurement
Equivalence point
This is also known as the stoichiometric point. It is the point when equivalent of the acid
and base have reacted. It is the point where the titration should actually end. It is however a
theoretical point.
Endpoint
The end point is the visual point that signals the end of titration. It is the point during titration
at which the colour of the indicator changes. It is the point when titration ends in practice. It

occurs very closely to the equivalent point. Thus end point is related to, but not same as the
equivalent point.
COMPLEXOMETRIC TITRATION
Introduction
The technique involves titrating metal ions with a complexing agent or chelating agent
(Ligand) and is commonly referred to as complexometric titration. This method is based on
the analytical application of a complexation reaction. In this method, a simple ion is
transformed into a complex ion and the equivalence point is determined by using metal
indicators or electrometrically.
Various other names such as chilometric titrations, chilometry, chilatometric titrations
and EDTA titrations have been used to describe this method.
All these terms refer to same analytical method and they have resulted from the use of EDTA
(Ethylene diamine tetra acetic acid) and other chilons. These chilons react with metal ions to
form a special type of complex known as chelate.

Metal ions in solution are always solvated, i.e. a definite number of solvent molecules
(usually 2, 4 or 6) are firmly bound to the metal ion. However, these bound solvent molecules
are replaced by other solvent molecules or ions during the formation of a metal complex or
metal co-ordination compound.
The molecules or ions which displace the solvent molecules are called Ligands. Ligands or
complexing agents or chelating agents can be any electron donating entity, which has the
ability to bind to the metal ion and produce a complex ion. An example of a complexation
reaction between Cu (II) ion and four ammonium molecules in an aqueous solution may be
expressed by the following equation:
Chelate Compound or Chelate
Complexes involving simple ligands, i.e., those forming only one bond are described as co-
ordination compound. A complex of a metal ion with 2 or more groups on a multidentate
ligand is called a chelate or a chelate compound. There is no fundamental difference
between co-ordination compound and a chelate compound except that in a chelate compound,
ring influence the stability of compound. Thus, a chelate can be described as a heterocyclic
ring structure in which a metal atom is a member of ring. The stability of a chelate is usually
much greater than that of corresponding unidentate metal complex.

Titration Selectivity, Masking and Demasking Agents
EDTA is a very unselective reagent because it complexes with numerous doubly, triply and
quadruply charged cations. When a solution containing two cations which complex with
EDTA is titrated without the addition of a complex-forming indicator, and if a titration error
of 0.1% is permissible, then the ratio of the stability constants of the EDTA complexes of the
two metals M and N must be such that KM/KN ≥ 106 if N is not to interfere with the titration
of M. strictly, of course, the constants KM and KN considered in the above expression should
be the apparent stability constants of the complexes. If the complex-forming indicators are
used, then for a similar titration error KM/KN ≥ 108.
The following procedures will help to increase the selectivity:
i. Use of masking and demasking agents
ii. pH control.
iii. Use of selective metal indicators.
iv. Classical separation
v. Solvent extraction
vi. Removal of anions
vii. Kinetic masking
Use of masking and de-masking agents
Masking agents act either by precipitation or by formation of complexes more stable than
the interfering ion-EDTA complex.
a) Masking by Precipitation: Many heavy metals e.g.- Co, Cu and Pb, can be separated
either in the form of insoluble sulphides using Sodium sulphide, or as insoluble complexes
using thioacetamide. These are filtered, decomposed and titrated with disodium EDTA. Other

common precipitating agents are sulphate for Pb and Ba, oxalate for Ca and Pb, fluoride for
Ca, Mg and Pb, ferrocyanide for Zn and Cu, and 8-hydroxy quinoline for many heavy metals.
Thioglycerol (CH2SH.CHOH.CH2OH) is used to mask Cu by precipitation in the assay of
lotions containing Cu and Zn.
b) Masking by Complex formation: Masking agents form more stable complexes with the
interfering metal ions. The most important aspect is that the masking agent must not form
complexes with the metal ion under analysis. The different masking agents used are enlisted
below:
Ammonium fluoride will mask aluminium, iron and titanium by complex formation.
Ascorbic acid is a convenient reducing agent for iron(III) which is then masked by
complexing as the very stable hexacyanoferrate(II) complex. This latter is more stable
and less intensely coloured than the hexacyanoferrate(III) complex.
Dimercaprol (2,3-Dimercaptopropanol); (CH2SH.CHSH.CH2OH). Cations of
mercury, cadmium, zinc, arsenic, tin, lead and bismuth react with dimercaprol in
weakly acidic solution to form precipitates which are soluble in alkaline solution.
Question: Applying the concept of selective masking and demasking in complexometry,
explain how the concentration of Cu, Cd and Ca in a sample of water can be analysed using
EDTA.
Example of using masking and demasking agents in complexometry is the analysis of 3
metals, Cu, Cd and Ca The following method of analysis is followed:
i. Direct titration of the mixture with the EDTA gives the sum of the 3 metals.
ii. Cu and Cd may be masked with the addition of cyanide to the solution, leaving
only Ca ion.

iii. When formaldehyde or chloral hydrate is added to the cyanide containing mixture,
only Ca is demasked and the EDTA titrates the sum of Ca and Cd. In this manner
the concentration of three ions is determined by three individual titrations.
1. An alloy of chromel containing Ni, Fe, and Cr was analyzed by a complexation
titration using EDTA as the titrant. A 0.7176-g sample of the alloy was dissolved in
HNO3 and diluted to 250 mL in a volumetric flask. A 50.00-mL aliquot of the sample,

treated with pyrophosphate to mask the Fe and Cr, required 26.14 mL of 0.05831 M
EDTA to reach the murexide end point. A second 50.00-mL aliquot was treated with
hexamethylenetetramine to mask the Cr. Titrating with 0.05831 M EDTA required
35.43 mL to reach the murexide end point. Finally, a third 50.00-mL aliquot was
treated with 50.00 mL of 0.05831 M EDTA, and back titrated to the murexide end
point with 6.21 mL of 0.06316 M Cu2+. Report the weight percents of Ni, Fe, and Cr
in the alloy.
Solution
The stoichiometry between EDTA and each metal ion is 1:1. For each of the three titrations,
therefore, we can easily equate the moles of EDTA to the moles of metal ions that are
titrated.
Titration 1: moles Ni = moles EDTA
Titration 2: moles Ni + moles Fe = moles EDTA
Titration 3: moles Ni + moles Fe + moles Cr + moles Cu = moles EDTA
Step 1: % composition of Ni2+
Amount of EDTA= 26.14×0.05831/1000 = 0.001524moles
EDTA:Ni2+ = 1:1
Amount of Ni2+ = 0.001524
Mass of Ni = 0.001524 × 58.69 = 0.08944g
Mass of Ni in 250cm3 of aliquot = 0.08944 × 250 /50 = 0.447g
% of Ni2+ = 0.447/0.7176 × 100 = 62.29%

Step 2: % of Fe2+
Amount of EDTA = 0.0583 × 35.43/1000 = 0.0020655moles
Since only Cr is masked,
Amount of EDTA = amount of Fe2+ + amount of Ni2+ = 0.0020655 moles
But amount of Ni = 0.001524 moles (from step 1)
Amount of Fe 2+= 0.0020655 – 0.001524 = 0.0005415 moles
Mass of Fe2+ = 0.0005415 × 55.847 = 0.03024g
Mass of Fe2+ in 250cm3 aliquot = 0.03024 × 250/50 = 0.151g
% of Fe2+ = 0.151/0.7176 × 100 = 21.04%
Step 3
Amount of EDTA = 0.05831 × 50/1000 = 0.0029155moles
moles Ni + moles Fe + moles Cr + moles Cu = moles EDTA
but mole of Cu is 6.21 × 0.06316/1000 = 0.0003922moles
moles of Cr = moles of EDTA - moles Ni -moles Fe -moles Cu = 0,0004578moles
mass of Cr = 0.0004578 × 51.99 = 0.0238g
mass of Cr in 250cm3 aliquot = 0.0238 × 250/50 = 0.1190g
% of Cr = 0.1190/0.7176 × 100 =
Chemistry and Properties of EDTA

Ethylenediaminetetraacetic acid, or EDTA, is an aminocarboxylic acid. EDTA, which is
shown below in its fully deprotonated form, is a Lewis acid with six binding sites—four
negatively charged carboxylate groups and two tertiary amino groups—that can donate six
pairs of electrons to a metal ion. The resulting metal–ligand complex, in which EDTA forms
a cage-like structure around the metal ion, is very stable. The actual number of coordination
sites depends on the size of the metal ion; however, all metal–EDTA complexes have a 1:1
stoichiometry.
Metal–ED TA Formation Constants
To illustrate the formation of a metal–EDTA complex, let’s consider the reaction between
Cd2+ and EDTA
Cd2+(aq)+Y4−
(aq) ⇌ CdY2−(aq)
where Y4– is a shorthand notation for the fully deprotonated form of EDTA shown. Because
the reaction’s formation constant

Kf=[CdY2−]/[Cd2+][Y4−]=2.9×1016
is large, its equilibrium position lies far to the right.
Selecting and Evaluating the End point
The equivalence point of a complexation titration occurs when we react stoichiometrically
equivalent amounts of titrand and titrant. As is the case with acid–base titrations, we estimate
the equivalence point of a complexation titration using an experimental end point. A variety
of methods are available for locating the end point, including indicators and sensors that
respond to a change in the solution conditions.
Finding the End point with an Indicator
Most indicators for complexation titrations are organic dyes—known as metallochromic
indicators—that form stable complexes with metal ions. The indicator, Inm–, is added to the
titrand’s solution where it forms a stable complex with the metal ion, MInn–. As we add
EDTA it reacts first with free metal ions, and then displaces the indicator from MInn–.
MInn−+Y4−→MY2−+Inm−
Selected mettalochromic indicators
Application of complexometric titration in inorganic quantitative analysis
Complexation titrimetry continues to be listed as a standard method for the determination of
hardness, Ca2+, CN–, and Cl– in waters and wastewaters. The determination of Ca2+ is
complicated by the presence of Mg2+, which also reacts with EDTA. To prevent an
interference the pH is adjusted to 12–13, precipitating Mg2+ as Mg(OH)2. Titrating with
EDTA using murexide or Eriochrome Blue Black R as the indicator gives the concentration
of Ca2+.
Cyanide is determined at concentrations greater than 1 mg/L by making the sample alkaline
with NaOH and titrating with a standard solution of AgNO3, forming the soluble Ag(CN)2–
complex. The end point is determined using p-dimethylaminobenzalrhodamine as an
indicator, with the solution turning from a yellow to a salmon color in the presence of excess
Ag+.
Chloride is determined by titrating with Hg(NO3)2, forming HgCl2(aq). The sample is
acidified to a pH of 2.3–3.8 and diphenylcarbazone, which forms a colored complex with
excess Hg2+, serves as the indicator. A pH indicator—xylene cyanol FF—is added to ensure
that the pH is within the desired range. The initial solution is a greenish blue, and the titration
is carried out to a purple end point.
Question: write briefly on the application of complexometric analysis in the quantitative
determination of Ca2+ ion in waste water sample from a paint industry, in the presence of
interfering Mg2+ ion.
Questions:
2. The concentration of Cl– in a 100.0-mL sample of water from a freshwater aquifer
was tested for the encroachment of sea water by titrating with 0.0516 M Hg(NO3)2.
The sample was acidified and titrated to the diphenylcarbazone end point, requiring
6.18 mL of the titrant. Report the concentration of Cl–, in mg/L, in the aquifer.[ Cl =
35.5 Ans: 0.0226g/L or 226mg/L]
Solution:
Hg(NO3)2 + 2Cl- → HgCl2 + 2NO3-
No of moles of Hg2+ = 0.051 × 6.18/1000 = 0.0003188
No of moles of Cl- = 2 × 0.0003188 = 0.0006376
Molarity of Cl- = 0.0006376 × 1000/100 = 0.0006377
Mass conc of Cl- = 0.0006377 × 35.5 = 0.226g/L or 226mg/L
3. A 0.4482-g sample of impure NaCN is titrated with 0.1018 M AgNO3, requiring
39.68 mL to reach the end point. Report the purity of the sample as %w/w NaCN.
4. A 100.0-mL sample is analyzed for hardness and requires 23.63 mL of 0.0109 M
EDTA. Report the sample’s hardness as mg CaCO3/L.
POTENTIOMETRIC TITRATION
General Principle A typical cell for potentiometric analysis consists of a reference electrode, an indicator
electrode and a salt bridge. This cell can be represented as
A reference electrode, (Eref):
This is a half-cell having a known potential that remains constant at constant temperature and
independent of the composition of the analyte solution. The reference electrode is always
treated as the left-hand electrode in potentiometric measurements. Calomel electrodes and
silver/silver chloride electrodes are types of reference electrodes.
Indicator electrode
Thishas a potential that varies with variations in the concentration of an analyte. Most
indicator electrodes used in potentiometry are selective in their responses. Metallic indicator
electrode and membrane electrodes are types of indicator electrodes.
Salt bridge
The third component of a potentiometric cell is a salt bridge that prevents the components of
the analyte solution from mixing with those reference electrode. A potential develops across
the liquid junctions at each end of the salt bridge. The junctions potential across the salt
bridge, Ej, is small enough to be neglected.
The potential of the cell is given by the equation;
Ecell= Eind – Eref + Ej
Potentiometric Titrations
An analyte can be determined by means of a titration, and the change in its concentration
monitored by measurement of the solution potential. This is known as a potentiometric
titration.
Potentiometric titrations involve the measurement of the potential of a suitable indicator
electrode with respect to a reference electrode as a function of titrant volume. Potentiometric
titrations provide more reliable data than data from titrations that use chemical indicators and
are particularly useful with coloured or turbid solutions and for detecting the presence of
unsuspected species. We are only interested in identifying the endpoint volume of the
titration by the change in voltage from one volume addition to the next. Figure 2.1 shows the
typical shape of a potentiometric titration curve.

Features of the titration curve
• The wave-like shape occurs because of the rapid change in voltage around the endpoint of
the reaction.
• The endpoint break is the large change in voltage around the endpoint
• The endpoint break should be as large as possible to improve accuracy of detection: this is
done by choosing the titrant carefully.
• The endpoint volume is defined as the volume half-way up the endpoint break
• The voltage values before the endpoint are due to the analyte
• The voltage values after the endpoint are due to the titrant
A typical set up for potentiometric titrations is given in figure below. Titration involves
measuring and recording the cell potential (in units of millivolts or pH) after each addition of
titrant. The titrant is added in large increments at the outset and in smaller and smaller
increments as the end point is approached ( as indicated by larger changes in response per
unit volume). Sufficient time must be allowed for the attainment of equilibrium after each

addition of the reagent by continuous stirring. For this a magnetic stirrer with a stirring
magnet bar is used.
Fig. 2: Apparatus for potentiometric titration
Potentiometric titrations can be classified as precipitation titrations, complex formation
titrations, neutralization titrations and oxidation/reduction titrations.
End-Point Detection with Potentiometric Titrations
Several methods can be used to determine the end point of potentiometric titrations. The most
straight forward one involves a direct plot of potential as a function of reagent volume, as a
Figure 3.

Fig 3. Titration curve
The midpoint in the steeply rising portion of the curve is estimated visually and taken as the
end point. The point atwhich the slope becomes greatest is defined as the equivalence point.
Experimentally, this means thevolume half way up the endpoint break.
To determine this graphically, plot the graph manually on graph paper or by computer, using
gridlines to simulate graph paper. Extend lines from the two flat parts of the graph and then
determinethe half-way distance between them. Draw a line across to where it intersects with
the graph to findthe endpoint volume.
Problems with the graphical method include:
i. Buffer regions not being flat or parallel, making the measurement of the half-way
point difficult
ii. Manual plotting of graphs is very subjective and therefore inconsistent

iii. Plotting of graphs using a spread sheet and printing on plain paper (even with
gridlines) requires knowledge of the program and is less accurate than on real
graph paper. Therefore, a mathematical method, known as the first derivative
method has been developed to avoid the need to use a graph. It is quicker, totally
consistent and relatively simple.
The second approach to end-point detection is to plot the derivative curves:
1. Plotting first derivative curve by calculating the change in potential or pH per unit volume
of titrant (that is, ΔE/ΔV or ΔpH/ΔV). A plot of ΔE/ΔV or ΔpH/ΔV as a function of
corresponding reagent volume produces a curve with a maximum that corresponds to the
point of inflection (Figure 4).
Figure 4: First derivative plot

2. Plotting the second derivative curve by calculating change in potential-change or pH –
change per volume change. Then their ratios, Δ2E/ΔV2 or Δ2pH/ΔV2 values, are plotted
aganist corresponding volume of the titrant. As shown in Figure 5, the data changes sign from
(+) to (-) at the inflection point. Second derivative curve gives the end point more precisely.
Fig. 5: Second derivative plot
Why choose potentiometric titration?
• Background colour – the colour of the sample (eg red wine) is too great to be able to see
anindicator change colour
• Correct indicator not known – if the sample is of unknown composition, then the correct
indicatorto accurately determine the endpoint cannot be identified; however, after the

potentiometrictitration is done, the correct indicator can be chosen for further analyses of that
sample type.
• Solution is too dilute – indicator titrations are not particularly sensitive, i.e. they cannot
accuratelydetect endpoints for analytes below about 0.01 M; potentiometric methods can do
better than that
Practice questions
1) What are the function(s) of reference electrode?
2) Write the working principle of calomel and silver/silver chloride reference electrodes?
3) Draw the apparatus for a potentiometric titration and name the each component? Explain
their functions.
4) How is end point determination performed in potentiometric titrations?
REDOX TITRATION
Oxidation-reduction reactions are commonly used as a basis for volumetric analytical
procedures. For example, a reducing substance can be titrated with a solution of strong
oxidizing agent, or vice versa. Three of the most frequently used oxidizing agents are
aqueous solution of potassium permanganate (KMnO4), potassium dichromate (K2Cr2O7),
and cerium hydrogen sulphate (Ce(HSO4)4).
Use of KMnO4
The strong oxidizing agent (MnO4-) can undergo several different reactions. The reaction that
occurs in acidic solution is the one most commonly used:
MnO4-(aq) + 8H+ + 5e- → Mn2+ + 4H2O

Permanganate has the advantage of being its own indicator (self-indicating). The MnO4- ion
is intensely purple, and the Mn2+ is almost colourless. As long as some reducing agent
remains in the solution being titrated, the solution remains colourless (assuming all other
species present are colourless), since the purple MnO4- ion being added is converted to the
essentially colourless Mn2+ ion. However, when all the reducing agent has been consumed,
the next drop of permangate titrant will turn the solution being titrated light purple (pink).
Thus the endpoint occurs approximately one drop beyond the stoichiometric point (the actual
point at which all the reducing agents have been consumed.
Volumetric analysed based on titration with reducing or oxidizing agents are very useful for
many determination. They may be performed using visual indicators or by measuring the
potentials with an appropriate indicating electrode to construct a potentiometric titration
curve.
The calculation in volumetric analysis requires that the balanced reaction be known. The
balancing of redox reactions is necessary and should be revised.
Question:
Iron ores often involve a mixture of oxides and contain both Fe2+ and Fe3+ ions. Such an ore
can be analysed for its iron content by dissolving it in acidic solution. A sample of iron ore
weighing 0.3500g was dissolved in acidic solution, and all the iron was reduced to Fe2+. The
resulting solution was titrated with a 1.6x10⁻²M KMnO4 solution. The titration required
41.56mL of the permanganate solution to reach the light purple (pink) end point. Determine
the mass percent of iron in the ore. [53.74%]

IODIMETRY
Iodine is a moderately strong oxidizing agent and can be used to titrate reducing agents.
Titrations with I2 are called iodimetric methods.
In iodimetry, the titrant is I2 and the analyte is a reducing agent. The end point is detected by
the appearance of the blue starch-iodine colour.
These titrations are usually performed in neutral or mildly alkaline (pH 8) to weakly acid
solutions. If the pH is too alkaline, I2 will disproportionate to hypoiodate and iodide:
I2 + 2OH- → IO- + I- +H2O
There are three reasons for keepingthe solution from becoming strongly acidic.
i. The starch used for the end point detection tends to hydrolyze or decompose in
strong acid, thus affecting the end point.
ii. The I- produced in the reaction tends to be oxidized by dissolved oxygen in acid
solution.
4I- + O2 + 4H+ → 2I2 + 2H2O
Because I2 is not a strong oxidizing agent, the number of reducing agents that can be titrated
is limited. Nevertheless, several examples exist, and the moderate oxidizing power of I2
makes it a more selective titrant than the strong oxidizing agents. Some of the commonly
determined substances include: H2S, Sn2+, As (III) etc
Although high purity I2 can be obtained by sublimation, iodine solution is usually
standardized against a primary standard reducing agent such as As2O3.
Iodine has a low solubility in water but the complex I3- is very soluble so iodine solutions are
prepared by dissolving I2 in a concentrated solution of potassium iodide:
I2 + I- → I3-
Therefore, I3- is the actual species used in the titration.
IODOMETRY
In iodometry, the analyte is an oxidizing agent that reacts with I- to form I2. The I2 is titrated
with thiosulphate, using disappearance of the starch-iodine colour for the end point.
When an excess of iodide is added to a solution of an oxidizing agent, I2 is produced in an
amount equivalent to the oxidizing agent present. This I2can, therefore, be titrated with a
reducing agent, and the result will be the same as if the oxidizing agent were titrated directly.
The titrating agent used is sodium thiosulphate.
Analysis of an oxidizing agent in this way is called an iodometric method. Consider, for
example, the determination of dichromate:
Cr2O72- + 6I- (excess) + 14H+ → 2Cr3+ + 3I2 + 7H2O
I2 + 2S2O32- → 2I- + S4O6
-
Each Cr2O72- produces 3I2, which in turn react with 6S2O3
2-, the number of moles of Cr2O72-
are equal to one sixth the number of moles of S2O32- used in the titration.
Iodate can be determined iodometrically:
IO3- + 5I- + 6H+ → 3I + 3H2O
Each IO3- produces 3I2, which again react with 6S2O3
2- and the moles of IO3- are obtained by
multiplying the moles of S2O32- used in the titration by 1/6., IO3
-, BrO3- etc.
Substances that can be determined iodometrically include: MnO4-, Cr2O72-

Questions:
1. A 0.200g sample containing copper is analysed iodmetrically. Copper(II) is reduced
to copper (I) by iodide:
2Cu2+ + 4I- → 2CuI + I2
What is the per cent copper in the sample if 20.0ml of 0.100M Na2S2O3 is required for
titration of the liberated I2?
Solution:
Number of moles of Na2S2O3 = 0.100 × 20.0/1000 = 0.002 moles
I2 + 2S2O32- → 2I- + S4O6
-
1 : 2
0.01 : 0.02
2Cu2+ + 4I- → 2CuI + I2
0.02 0.01
Moles = mass/atomic mass
0.02 = m/63.5 m= 0.127g
%Cu = 0.127/0.200 × 100 = 63.5%
Question 2

A solution of Na2S2O3 is standardized iodometrically against 0.1262g high purity KBrO3,
requiring 44.97 ml Na2S2O3. What is the molarity of the Na2S2O3? [KBrO3 = 167gmol-1]
Given the reaction equations:
BrO3- + 6I- + 6H+ → Br- + 3I2 + 3H2O
3I2 + 6S2O32- → 6I- + 3S4O6
2-
Solution:
Amount of KBrO3 = 0.1262/167.01 =0.0007556moles
From equation 1:
1BrO3- : 3I2
0.0007556moles : 0.0022669moles
From equation 2:
3I2 : 6 S2O32-
0.0022669moles : 0.004533 moles
0.004533= M×44.97/1000
M = 0.10081mol/dm3

PRACTICE QUESTIONS
Question 3
30.00cm3 of bleach was added to excess iodide ions in dilute H2SO4 (aq). Bleach contains ClO-
ions. This reaction takes place
ClO- + 2I- + 2H2 → Cl- + I2 + H2O
The iodine formed is titrated against 0.2M sodium thiosulphate solution according to the
equation:
2S2O32- + I2 → 2I- + S4O6
2-
Given that 24.30cm3 of the sodium thiosulphate solution was required:
Find the concentration of ClO- ions in bleach.
Solution:
Moles of S2O32- =
𝐶 × 𝑉
1000 =
0.200 × 24.30
1000 = 4.86× 10⁻³ moles
The mole ratio of S2O32- to I2 is 2:1,
Hence the amount of I2 = 𝑎𝑚𝑜𝑢𝑛𝑡 𝑜𝑓 𝑆2𝑂3
2
Amount of I2 = 4.86× 10⁻³
2 = 2.43×10⁻³ moles
From the first equation, the ratio of ClO- to I2 is 1:1
Hence amount of ClO- = amount of I2
Amount of ClO- = 2.43×10⁻³moles

Concentration = 𝑎𝑚𝑜𝑢𝑛𝑡 × 1000
𝑣𝑜𝑙𝑢𝑚𝑒 =
2.43× 10−3× 1000
30 = 0.081M
Question 4
A sample of bronze was analysed to find the % of Cu it contained. 0.500g of Bronze was
reacted with HNO3 to give Cu2+ solution. The solution was neutralised and reacted with
Iodide ion to produce I2. This was titrated with 0.200M sodium thiosulphate. Given that
22.40cm3 of the sodium thiosulphate was required. Calculate
i. Mass of Cu
ii. % of Cu in the bronze
Answer:
Cu(s) → Cu2+ + 2e- I (Cu(s) in the bronze is converted to Cu2+ on
reaction with nitric acid)
2Cu2+ + 4I- → 2CuI + I2 II
2S2O32- + I2 → 2I- + S4O6
2- III
Amount of S2O42- =
𝑐𝑜𝑛𝑐𝑒𝑛𝑡𝑟𝑎𝑡𝑖𝑜𝑛 × 𝑣𝑜𝑙𝑢𝑚𝑒
1000 =
0.200 × 22.40
1000 = 4.48 ×10⁻³moles
Amount of Cu = Amount of S2O42-
(Since S2O32- :I2 is 2:1 from equation III and Cu2+ : I2 is also 2:1 from equation II)
Amount of Cu = 4.48 ×10⁻³ moles
i. Mass of Cu = 4.48 ×10-3 × 63.5 = 0.285g
ii. % of Cu = 0.0285
0.5× 100 = 57%

ACID BASE EQUILIBRIA IN WATER
A strong electrolyte is completely dissociated while a weak electrolyte is partially
dissociated.
Strong Weak
HCl HC2H3O2
HClO4 NH3
H2SO4 C6H5OH
HNO3 HCHO2
Hydrochloric acid is a strong acid and its ionization is complete
HCl + H2O → H3O+ + Cl-
The proton exists in water as hydrated ion, the hydronium ion, H3O+ for convenience and to
emphasized Bronsted behaviour.
Acetic acid is a weak acid, which ionizes only partially (a few percent)
HOAc + H2O → H3O+ + OAc-
The equilibrium constant is written as
Ka = [H3O+][OAc-]/[HOAc]
Pure water ionizes slightly, or undergoes autoprotolysis. Autoprotolysis is the self-ionization
of a solvent to give a cation and anion.

2H2O → H3O+ + OH-
The equilibrium constant for this is
Kw =[H3O+][OH-]/[H2O]2
The activity of water is constant in dilute solutions (its concentration is fairly constant)
Kw = [H3O+][OH-]
Where Ka and Kware the molar equilibrium constant.
H+ is commonly used for H3O+ in order to simplify the expression
At 25˚C, Kw = 1.0×10⁻¹⁴, i.e the product of H+ concentration and OH- concentration in
aqueous solution is always equal to 1.0×10⁻¹⁴ at room temperature.
[H+][OH-] = 1.0×10⁻¹⁴
In pure water, then, the concentrations of these two species are equal since there are no other
sources of H+ or OH- except H2O dissociation:
[H+]=[OH-]
Therefore [H+]=[OH-]=1.0×10⁻⁷
If an acid is added to water, we can calculate the hydroxyl ion concentration if we know the
hydrogen ion concentration from the acid. Except when the hydrogen ion concentration from
the acid is very small, 10-6M or less, any contribution to [H+] from the ionization of water can
be neglected.
Question:

A 1.0×10⁻³M solution of hydrochloric acid is prepared. What is the hydroxyl ion
concentration.
Solution:
1.0×10⁻³ [OH-]=1.0×10⁻¹⁴
[OH-]= 1.0×10⁻¹¹M
pH of solution
It is convenient to express the acidity scale by placing it on a logarithm basis. The pH of a
solution was defined by Sorenson as
pH = -log[H+]
The minus sign is used because most of the concentrations encountered are less than 1M, and
so this designation gives a positive number.
pOH = -log[OH-]
pKw = pH + pOH
14.00 = pH + pOH
1. Calculate the pOH and the pH of a 5.0 × 10⁻² solution of NaOH
Solution:
[OH-] =5.0×10⁻²M
pOH = -log(5.0×10⁻²) = 2-log 5.0 =2-0.70= 1.30
pH + 1.30 = 14.00

pH = 12.70
2. Calculate the pH of a solution prepared by mixing 2.0mL of a strong acid solution of
pH 3.00 and 3.0mL of a strong base of pH 10.0
[H+] of acid solution = 1.0 × 10⁻³M
Mmol H+ = 1.0 × 10-3M × 2.0×mL = 2.0×10⁻³
pOH of base solution = 14-10 = 4
[OH-]= 1.0 × 10⁻⁴M
Mmol OH- = 1.0 × 10-4 M × 3mL = 3.0 × 10⁻⁴ mmol
There is an excess of acid
Mmol H+ = 0.0020 – 0.0003 = 0.0017mmol
[H+] = 0.0017mmol/5.0mL = 3.4 × 10⁻⁴ M
pH = -log 3.4 × 10-4 = 4 – 0.53 =3.47
Calculation of pH of weak acids and bases
In weak acids and bases ionization is partial unlike strong acids and bases which are strong
electrolytes. Most organic acids and bases are weak.
The ionization constant can be used to calculate the amount ionized and, from this, the pH.
The acidity constant of acetic acid at 25˚C is 1.75×10⁻⁵
[𝐻+][𝑂𝐴𝑐−]
[𝐻𝑂𝐴𝑐] = 1.75×10⁻⁵
HOAc ↔H+ + OAc-

If the original concentration of acetic acid is C and the concentration of ionized acetic specie
(H+ and OAc-) is x, the final concentration for each specie at equilibrium is given by
HOAc ↔H++ OAc-
C-x x x
Question
Calculate the pH and pOH of 1.00×10⁻³ M solution of acetic acid. Given that the acidity
constant 1.75×10⁻⁵
Solution
HOAc ↔H+ + OAc-
The concentration of the species are as follow:
[HOAc-] [H+] [OAc-]
initial 1.00×10⁻³ 0 0
change -x +x +x
equilibrium 1.00×10⁻³ - x x x
[𝐻+][𝑂𝐴𝑐−]
[𝐻𝑂𝐴𝑐] = 1.75×10⁻⁵
(x)(x)/ 1.00×10⁻³-x = 1.75×10⁻⁵
The solution is that of a quadratic equation. If CHA> 100Ka, x can be neglected compared to
CHA (or if less than 10 or 15% of the acid is ionized).

X = 1.32 × 10⁻⁴M = [H+]
Therefore pH = -log 1.32 × 10-4 = 4 – 0.12 = 3.88
pOH = 14-3.88 = 10.12
question:
The basicity constant Kb for ammonia is 1.75×10⁻⁵at 25˚C. Calculate the pH and pOH for a
1.00×10⁻³M solution of NH3.
Ans: [OH-] = 1.32 × 10⁻⁴M
pOH = 3.88
pH = 10.12
Question 3
Calculate the concentration of silver ions in 1.00 L of solution with 0.020 mol of AgCl and
0.020 mol of Cl- in the following reaction? The equilibrium constant is 1.8 x 10⁻¹⁰.
AgCl (s)↔ Ag+(aq) + Cl-
(aq)
solution
Ag+ Cl-
initial 0 0.02/1L =0.02M
change +x +x
equilibrium x 0.02+x
Kc = [Ag+][Cl-]
1.8x10-10 = (x)(0.02-x)
x2+0.02x – 1.8×10-10=0
x= 9×10⁻⁹
[Ag+] = 9×10⁻⁹M
[Cl-] = 0.02 +x =
Question
The initial concentration of H2CO3 is 0.16 M in the following reaction. What is the H+
concentration at equilibrium? Kc=0.20.
H2CO3 ↔ H+ + HCO32-
Solution
H2CO3 H+ HCO3-
initial 0.16 0 0
change -x +x +x
equilibrium 0.16-x x x
0.20 = (x)(x)/0.16-x

X2 + 0.20x -0.032=0
X= 0.1049
[H+]=x = 0.1049M
Question:
The initial concentration of PCl5 is 0.200 moles per liter and there are no products in the
system when the reaction starts. If the equilibrium constant is 0.030, calculate all the
concentrations at equilibrium.
Solution
PCl5 ↔ PCl3 + Cl2
PCl5 PCl3 Cl2
initial 0.2 0 0
change -x +x +x
equilibrium 0.2-x x x
0.30 = x2/0.2-x
x2+0.03x-0.006=0
x= 0.064
[PCl5]= 0.2-x = 0.2-0.064= 0.136M

[PCl3]=0.064M
[Cl2]= 0.064M
Precipitation titration
This kind of titration is based on precipitation reactions, i.e. separable solid compounds form
during the course of the reaction. The titrating agent, therefore, has to react with the analyte
to produce a compound of limited solubility. A reaction in which the analyte and titrant form
an insoluble precipitate also can serve as the basis for a titration. We call this type of titration
a precipitation titration.
Although precipitation titrimetry is rarely listed as a standard method of analysis, it may still
be useful as a secondary analytical method for verifying other analytical methods. Most
precipitation titrations use Ag+ as either the titrand or the titration. A titration in which Ag+
is the titrant is called an argentometric titration.
Precipitation titrations are based upon reactions that yield ionic compounds of limited
solubility. The most important precipitating reagent is silver nitrate. Titrimetric methods
based upon silver nitrate are sometimes termed argentometric methods. Potassium
chromate can serve as an end point indicator for the argentometric determination of
chloride, bromide and cyanide ions by reacting with silver ions to form a brick-red silver
chromate precipitate in the equivalence point region.
Characteristics of precipitation reactions
they are fast and the stoichiometry is known and reproducible, (no secondary
reactions of interference);
they are complete or can be quantified depending on the amount of solubility product
(in general a precipitation titration is considered complete when Kps < 10-8);
an indicator can be used to find the equivalence point or titration end point which, for
this type of titration, corresponds to when precipitation of the analyte under analysis is
complete.

Titrants and titrands
The most common applications for precipitation methods are with the halides (Cl-, Br-, l-),
which precipitate as silver salts when we use silver nitrate (AgNO3) as the precipitating
reagent. We can also determine the ions shown in the table below:
Ions Precipitating reagents (Precipitate with)
Zn2+ [Fe(CN)3]4-
SO42- Pb2+ or Ba2+
SCN Ag+
CN-, CrO42-, C2O4
2-, PO43-, S2- Ag+
Titration curves
Titration curves for precipitation reactions are plotted in exactly the same way as those for
strong acids or bases. The only difference is that we put the solubility product of the
precipitate instead of the ionic product of water.
Titration curve for chloride ions (Cl-) with silver nitrate (AgNO3).
Solubility product
The solubility constant, or solubility product constant, is the equilibrium constant that
describes, at constant pressure and temperature, the situation when a solid of limited
solubility, which has released enough cations and anions in an aqueous solution (and is
therefore an electrolyte) to reach saturation point, is in equilibrium with the ions themselves.
If we take a mono-monovalent salt of very limited solubility in water AB, equilibrium is
established between the solute and its ions A+ and B-, as expressed in the analytical
equilibrium constant:
AB ↔A+ + B-

The equilibrium constant, which is also termed solubility product, can be written:
Kps = [A+] [B+]
With precipitation titration, as with acid-base titrations, the indicator needs to change colour
within a fairly limited p[M] interval near the point of inflection of the curve to minimize
error.
Indicators used in argentometric titration
Potentiometric
Amperometric
Chemical indicator
Chemical indicators
To find out the equivalence point in precipitation titration we can use:
Ionic species: these precipitate when they react with the same precipitating reactive used for
the analyte, but give rise to an obvious colour change. Obviously the indicator should only
precipitate when the original precipitation reaction is complete.
Adsorption indicators: these are organic substances, usually fluorescent, (fluorescein,
eosin), which undergo structural changes with a resultant colour change when they are
adsorbed onto the precipitate particles, as a result of secondary absorption.
Absorption indicators
Endpoints
In any titration, it is necessary to have some method of detecting when just enough of the
titrant has been added -- a procedure known as detecting the endpoint of the titration. The
endpoint of this titration can be detected if the rapid change in either the concentration of
silver ion or the the concentration of chloride ion which occurs at the endpoint can be made
apparent to an observer. Either instrumental methods or equilibrium methods can be used.
The equilibrium methods are fairly straightforward. In this case we can use Ag2CrO4, because
a solution of CrO42- is yellow while a solution or precipitate of Ag2CrO4 is blood-red.
Observations about Argentometric Titrations
•High reagent concentrations give sharper, more dramatic equivalence point changes in pAg
and better endpoints.

The smaller the Ksp, the more complete the precipitation reaction and the sharper the
equivalence region changes.
Both Ksp and the reagent concentrations affect the choice and use of an endpoint indicator.
Endpoint Indicators for Argentometric Titrations
Volhard method
An example of back titration, the Volhard method, named after Jacob Volhard, involves the
addition of excess silver nitrate to the analyte; the silver chloride is filtered, and the
remaining silver nitrate is titrated against ammonium thiocyanate,[1] with ferric ammonium
sulfate as an indicator which forms blood-red [Fe(OH2)5(SCN)]2+ at the end point:
Ag+ (aq) + SCN− (aq) → AgSCN (s) (Ksp = 1.16 × 10⁻¹²)
Fe(OH)(OH2)2+
5 (aq) + SCN− (aq)→ [Fe(OH2)5(SCN)]2+ + OH−
Mohr method
In the Mohr method, named after Karl Friedrich Mohr, potassium chromate is an indicator,
giving red silver chromate after all chloride ions have reacted:
2Ag+ (aq) + CrO2−
4 (aq) → Ag2CrO4 (s) (Ksp = 1.1 × 10⁻¹²)
The solution needs to be near neutral, because silver hydroxide forms at high pH, while the
chromate forms H2CrO4 at low pH, reducing the concentration of chromate ions, and
delaying the formation of the precipitate. Carbonates and phosphates precipitate with silver,
and need to be absent to prevent inaccurate results.
The Mohr method may be adapted to determine the total chlorine content of a sample by
igniting the sample with calcium, then ferric acetate. Calcium acetate "fixes" free chlorine,
precipitates carbonates, and neutralizes the resultant solution. Ferric acetate removes
phosphates. All chlorides are dissolved out of the residue, and titrated
The Mohr method uses chromate ions as an indicator in the titration of chloride ions with a
silver nitrate standard solution. After all the chloride has been precipitated as white silver
chloride, the first excess of titrant results in the formation of a silver chromate precipitate,
which signals the end point (1). The reactions are:

By knowing the stoichiometry and moles consumed at the end point, the amount of
chloride in an unknown sample can be determined. This report describes experiments
aimed at determining the concentration of chloride in a solid sample.
Fajans method
In the Fajans method, named after Kazimierz Fajans, typically dichlorofluorescein is used as
an indicator; the end-point is marked by the green suspension turning pink. Prior to the end-
point of the titration, chloride ions remain in excess. They adsorb on the AgCl surface,
imparting a negative charge to the particles. Past the equivalence point, excess silver(I) ions
adsorb on the AgCl surface, imparting a positive charge. Anionic dyes such as
dichlorofluorescein are attracted to the particles, and undergo a color change upon adsorption,
representing the end-point. Eosin (tetrabromofluorescein) is suitable for titrating against
bromide, iodide, and thiocyanate anions, giving a sharper end-point than dichlorofluorescein.
It is not suitable for titrating against chloride anions because it binds to AgCl more strongly
than chloride does.
Practical example (cont.)

Question
1. In a precipitation titration of 46.00 mL of a chloride solution of unknown
concentration, 31.00 mL of 0.6973 molar AgNO3 were required to reach the
equivalence point. Calculate the concentration of the unknown solution [ 0.4700M]

1. For a 0.2 M solution of Hypochlorous acid, calculate all equilibrium
concentrations. Given: Ka=3.5×10⁻⁸
Ans:[H3O+]=8.4 x 10⁻⁵ [OCl-]=8.4 x 10⁻⁵
2. Find the equilibrium concentration of HC7H5O2from a 0.43 M solution of Benzoic
Acid, HC7H5O2. Given: Ka for HC7H5O2= 6.4 x 10⁻⁵
Ans: [HC7H5O2]= 0.425 M
3. For acetic acid, HC2H3O2, the Ka value is 1.8×10⁻⁵. Calculate the concentration of
H3O+ in a 0.3 M solution of HC2H3O2.
Ans: x=[H3O+] = 0.0023M
4. Calculate the pH of a weak acid solution of 0.2 M HOBr, given:
HOBr + H2O ⇌ H3O+ + OBr−
Ka=2×10⁻⁹
x=[H3O+]=2×10⁻⁵M
pH=4.69