
IntelliWaveTM - ESO · interferometers. Phase Measurement Interferometry can be divided into two...
12
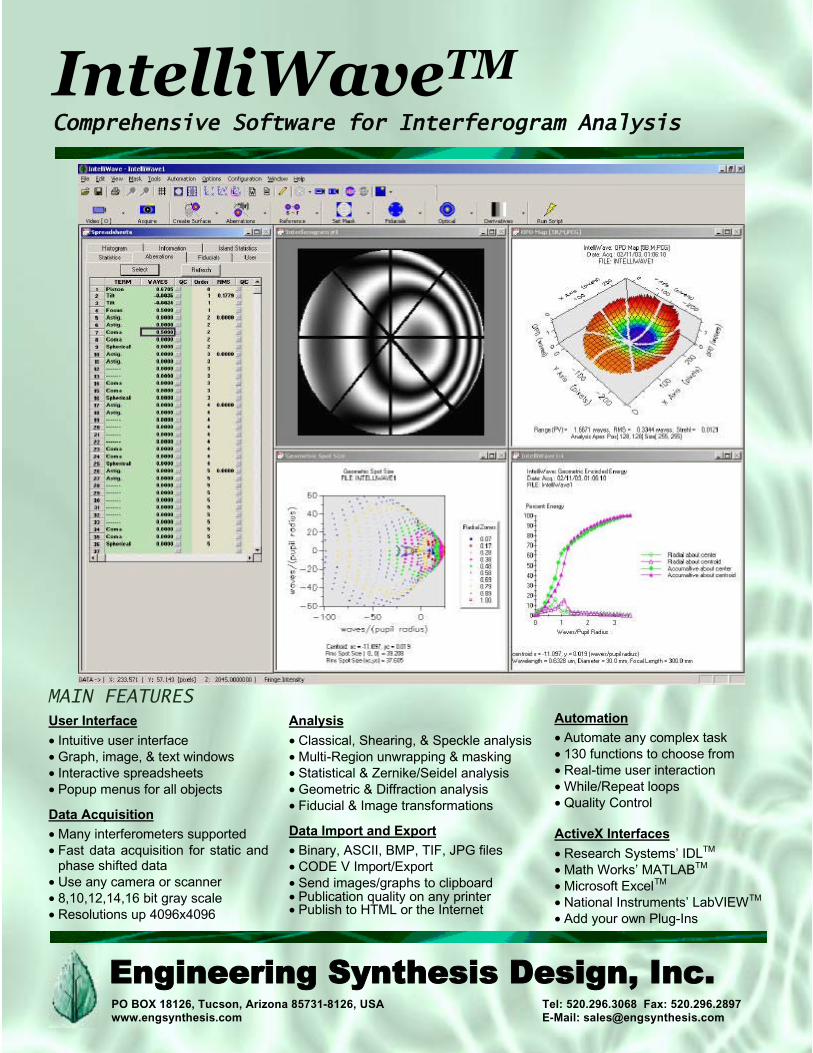
IntelliWave TM Comprehensive Software for Interferogram Analysis User Interface • Intuitive user interface • Graph, image, & text windows • Interactive spreadsheets • Popup menus for all objects Data Acquisition • Many interferometers supported • Fast data acquisition for static and phase shifted data • Use any camera or scanner • 8,10,12,14,16 bit gray scale • Resolutions up 4096x4096 MAIN FEATURES Automation • Automate any complex task • 130 functions to choose from • Real-time user interaction • While/Repeat loops • Quality Control ActiveX Interfaces • Research Systems’ IDL TM • Math Works’ MATLAB TM • Microsoft Excel TM • National Instruments’ LabVIEW TM • Add your own Plug-Ins Analysis • Classical, Shearing, & Speckle analysis • Multi-Region unwrapping & masking • Statistical & Zernike/Seidel analysis • Geometric & Diffraction analysis • Fiducial & Image transformations Data Import and Export • Binary, ASCII, BMP, TIF, JPG files • CODE V Import/Export • Send images/graphs to clipboard • Publication quality on any printer • Publish to HTML or the Internet PO BOX 18126, Tucson, Arizona 85731-8126, USA Tel: 520.296.3068 Fax: 520.296.2897 www.engsynthesis.com E-Mail: sales@engsynthesis.com Engineering Synthesis Design, Inc.
Transcript of IntelliWaveTM - ESO · interferometers. Phase Measurement Interferometry can be divided into two...
IntelliWaveTMComprehensive Software for Interferogram Analysis
User Interface• Intuitive user interface• Graph, image, & text windows• Interactive spreadsheets• Popup menus for all objects
Data Acquisition• Many interferometers supported• Fast data acquisition for static and
phase shifted data• Use any camera or scanner• 8,10,12,14,16 bit gray scale• Resolutions up 4096x4096
MAIN FEATURESAutomation• Automate any complex task• 130 functions to choose from• Real-time user interaction • While/Repeat loops• Quality Control
ActiveX Interfaces• Research Systems’ IDLTM
• Math Works’ MATLABTM
• Microsoft ExcelTM
• National Instruments’ LabVIEWTM
• Add your own Plug-Ins
Analysis• Classical, Shearing, & Speckle analysis• Multi-Region unwrapping & masking• Statistical & Zernike/Seidel analysis• Geometric & Diffraction analysis• Fiducial & Image transformations
Data Import and Export• Binary, ASCII, BMP, TIF, JPG files• CODE V Import/Export• Send images/graphs to clipboard• Publication quality on any printer• Publish to HTML or the Internet
PO BOX 18126, Tucson, Arizona 85731-8126, USA Tel: 520.296.3068 Fax: 520.296.2897 www.engsynthesis.com E-Mail: [email protected]
Engineering Synthesis Design, Inc.
INTELLIWAVETM OVERVIEWIntelliWaveTM is a powerful interferometric acquisition and analysis program that is used to measure the optical shape (or other characteristics) of many types of surfaces (or materials) including mirrors, lenses, semiconductor wafers, and many other reflective and non-reflective surfaces. To compute surface shape, IntelliWave requires interferogram data to gener-ate an Optical Phase Difference map (OPD or surface map). An interferogram is the wavefront phase in an interferome-ter corresponding to the relative difference between the test and reference optical paths. By processing interferograms, the surface shape representation of a test optic can be generated.
IntelliWave integrates all the features required to acquire, import, analyze, and document virtually any type of interfero-gram data. IntelliWave offers power, speed, flexibility, ease of use, and value in one comprehensive package.Hardware Independence
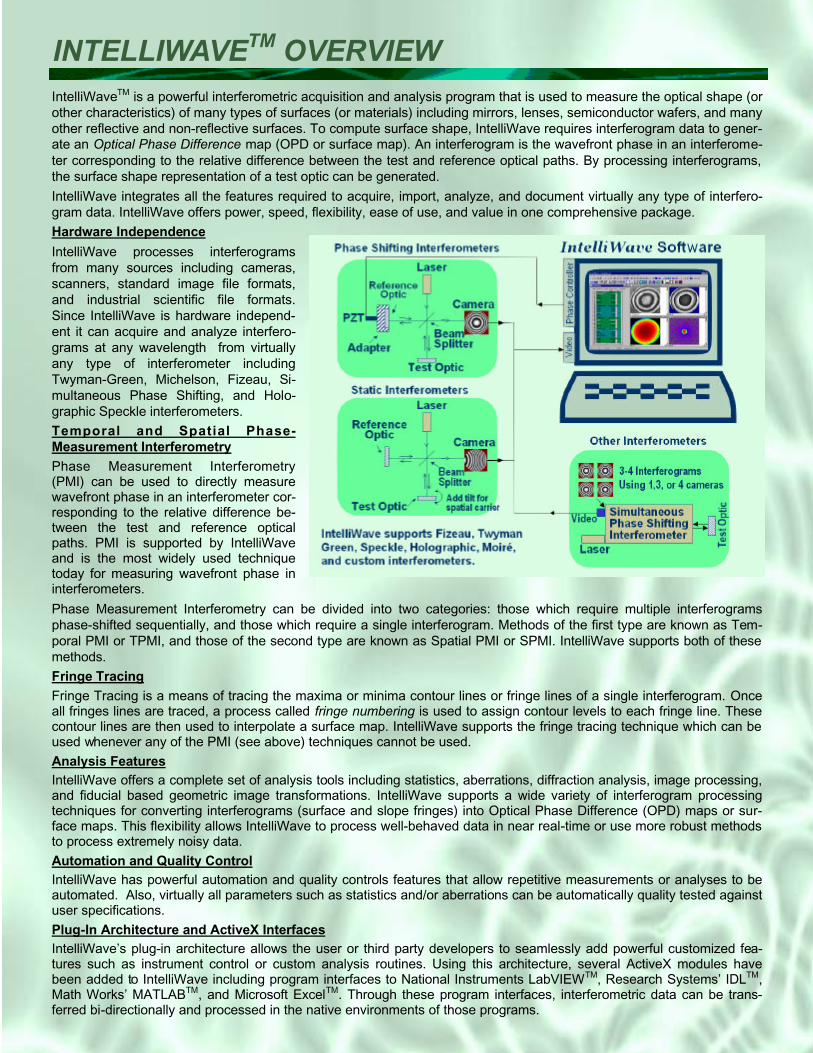
IntelliWave processes interferogramsfrom many sources including cameras,scanners, standard image file formats,and industrial scientific file formats.Since IntelliWave is hardware independ-ent it can acquire and analyze interfero-grams at any wavelength from virtuallyany type of interferometer includingTwyman-Green, Michelson, Fizeau, Si-multaneous Phase Shifting, and Holo-graphic Speckle interferometers.Temporal and Spatial Phase-Measurement Interferometry Phase Measurement Interferometry(PMI) can be used to directly measurewavefront phase in an interferometer cor-responding to the relative difference be-tween the test and reference opticalpaths. PMI is supported by IntelliWaveand is the most widely used techniquetoday for measuring wavefront phase ininterferometers.
Phase Measurement Interferometry can be divided into two categories: those which require multiple interferogramsphase-shifted sequentially, and those which require a single interferogram. Methods of the first type are known as Tem-poral PMI or TPMI, and those of the second type are known as Spatial PMI or SPMI. IntelliWave supports both of these methods.Fringe TracingFringe Tracing is a means of tracing the maxima or minima contour lines or fringe lines of a single interferogram. Onceall fringes lines are traced, a process called fringe numbering is used to assign contour levels to each fringe line. Thesecontour lines are then used to interpolate a surface map. IntelliWave supports the fringe tracing technique which can be used whenever any of the PMI (see above) techniques cannot be used.Analysis FeaturesIntelliWave offers a complete set of analysis tools including statistics, aberrations, diffraction analysis, image processing, and fiducial based geometric image transformations. IntelliWave supports a wide variety of interferogram processingtechniques for converting interferograms (surface and slope fringes) into Optical Phase Difference (OPD) maps or sur-face maps. This flexibility allows IntelliWave to process well-behaved data in near real-time or use more robust methods to process extremely noisy data.Automation and Quality ControlIntelliWave has powerful automation and quality controls features that allow repetitive measurements or analyses to beautomated. Also, virtually all parameters such as statistics and/or aberrations can be automatically quality tested against user specifications.Plug-In Architecture and ActiveX InterfacesIntelliWave’s plug-in architecture allows the user or third party developers to seamlessly add powerful customized fea-tures such as instrument control or custom analysis routines. Using this architecture, several ActiveX modules havebeen added to IntelliWave including program interfaces to National Instruments LabVIEWTM, Research Systems’ IDLTM,Math Works’ MATLABTM, and Microsoft ExcelTM. Through these program interfaces, interferometric data can be trans-ferred bi-directionally and processed in the native environments of those programs.

When acquiring interferogram data, a camera is placed at theinterferogram plane, and optionally, a phase-shifting device is placedin a reference beam. The data is then recorded rapidly whileoptionally phase-shifting the reference beam. IntelliWave acquiresdata for both static and phase-shifted analyses.
Temporal Phase-Shifted Interferogram Acquisition (TPMI)To create an Optical Phase Difference (OPD) Map representation of a surface, a set of interferograms is required. Each interferogram is sequentially phase-shifted by a specified amount (usually 90°).IntelliWave generates surface maps from three (3) to twelve (12)phase-shifted interferograms. Higher frame algorithms are moretolerant of phase-shift errors, while lower frame algorithms areusually better suited for high vibration environments.
Spatial Phase-Shifted Interferogram Acquisition (SPMI)
Spatial Carrier static interferogram analysis is a powerful means ofgenerating a surface map from a single interferogram without anyfringe tracing or user interaction. IntelliWave supports two spatialcarrier methods providing significant flexibility depending on yourapplication. One of these methods can produce high resolutionoutput similar to phase-shifting.
Static Interferogram Acquisition for Fringe Tracing
Interferograms can be acquired from a camera, scanner, or imported from many file formats. The fringes can then be traced, and an OPD map can then be generated.
Speckle Interferogram Acquisition
IntelliWave offers real-time image subtraction and filtering forviewing, acquiring, and analyzing of speckle interferograms. Afterdata acquisition, IntelliWave has all the image processing andanalysis capabilities for generating OPD maps from speckleinterferograms.
Infrared Interferogram Acquisition
Infrared interferometers usually require special treatment due to the characteristics of infrared cameras. IntelliWave has special featuresfor making sure the camera has even temperature distribution andhigh contrast interferograms during active video display and dataacquisition.
Shearing Interferometry
IntelliWave can acquire or import two complete sets of orthogonallysheared interferograms. The interferogram data can then beunwrapped and integrated into a surface map.
Scanning White Light Interferometry
Scanning white light interferometry is in development and will besupported in a future release of IntelliWave. This method allowsmeasurement of very rough surfaces.
LabVIEWTM and Serial Port Measurements
IntelliWave can monitor any parameter from a serial port device orany parameter being measured with National Instrument’sLabVIEWTM. This allows IntelliWave to measure interferometric dataas a function of real-world events such as changes in temperature,stress/strain, or vibration in real-time.
DATA ACQUISITION
Acquire from Virtually Any Source
• Cameras (analog/digital, any resolution)• Scanners• Custom acquisition from external programsIntelliWave Allows Complete Control ofData Acquisition
• Selection of the input device and thephase-shifting device
• Number of interferograms to capture• Amount of phase-shift between frames• Time delay between captured frames• Linear/non-linear phase-shift calibration
and shifting direction• Optional user prompts between frames• Real-time quality control of measured inter-
ferograms

PHASE MAP GENERATION
Flexible Analysis Tools for Adapting to the EnvironmentMany environmental and hardware conditions can effect the quality of interferogram data such as phase-shift error, de-tector/shifter non-linearity, vibration, low contrast fringes, optical noise, and optical surface contamination. IntelliWavehas many features to minimize errors due to these conditions including:
Static Interferogram Analysis with Fringe TracingFringe Tracing allows the user to define fringe lines using fringe objects. Points can be moved, added, or deleted at any time. For reference, an interferogram image can becaptured by camera or read from standard image file for-mats. Once defined, the points are used to generate a sur-face map.
IntelliWave can process single interferograms or phase-shifted interferograms using several methods.
Temporal Phase-Shifted Interferogram Analysis (TPMI) with Multiple Region UnwrappingPhase Measurement Interferometry (PMI) is used todirectly measure wavefront phase in an interferometercorresponding to relative differences between test andreference optical paths using multiple interferograms. Theprecision of phase-measurement techniques is a factor often to a hundred greater than Fringe Tracing. The image at left shows how IntelliWave can unwrap highly complex in-terferograms. Also, multiple regions can be processed and analyzed within a single image (see front page).
Spatial Phase-Shifted Interferogram Analysis (SPMI)The Spatial Carrier Method is a powerful means of allow-ing interferogram analysis to be performed on a single in-terferogram without any user interaction, fringe tracing, orinterpolation. All that is required is that the user add tilt tothe wavefront such that it is the dominant frequency(dominate aberration). In this case the tilt carrier fre-quency is too high to see in the image (far left). However, IntelliWave can still process it as shown in the image atthe right.
• 3 to 12 point wrapped phase algorithms.• 4 unwrapping methods ranging in speed and complexity.
• Gaussian, Median, and Erosion noise filters.• Automatic removal of badly contaminated data regions.• Apertures/obscurations for regional processing.
Shearing InterferometryIntelliWave has all the tools required to process bi-lateral sheared interferogram data. Two sets of orthogonally sheared interferogram data can be acquired (or imported), unwrapped, and then integrated into a single surface map. In addi-tion, IntelliWave can compensate for errors introduced by the shear itself. In the images below from left to right: X and Y Slope Interferograms, X-Slope Map, Y-Slope Map, and Integrated Surface Map.
STATISTICAL ANALYSIS
ABERRATION ANALYSIS
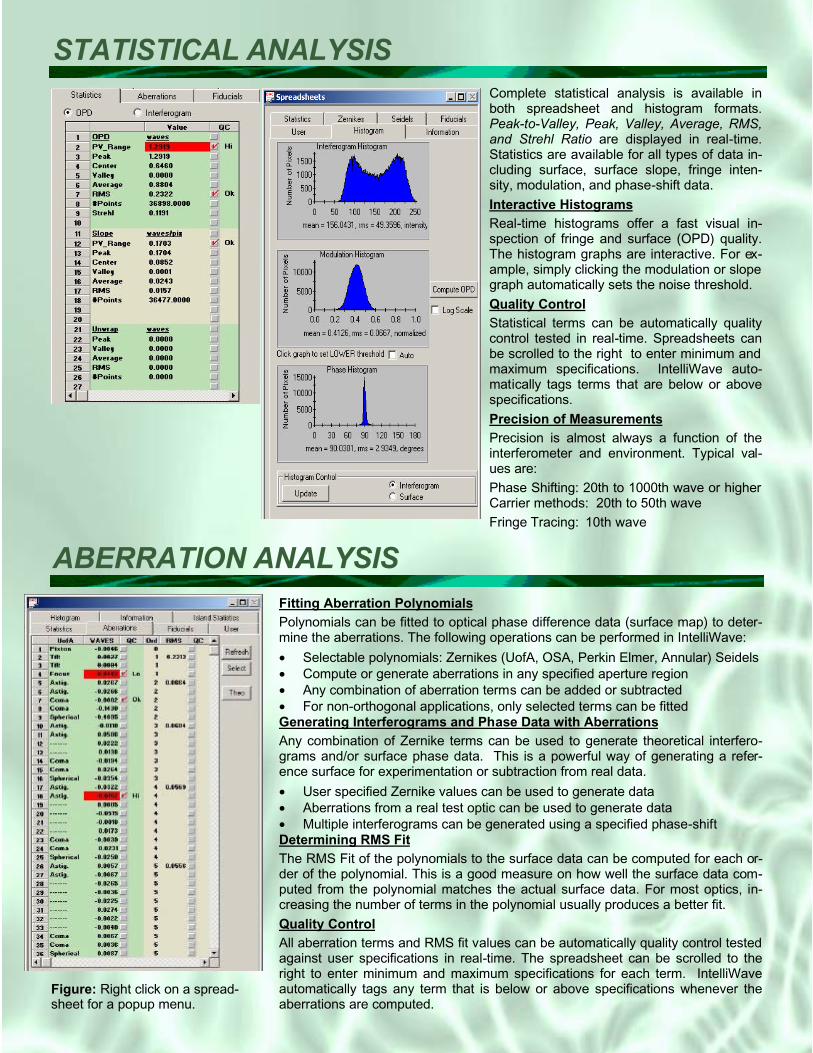
Complete statistical analysis is available inboth spreadsheet and histogram formats.Peak-to-Valley, Peak, Valley, Average, RMS,and Strehl Ratio are displayed in real-time.Statistics are available for all types of data in-cluding surface, surface slope, fringe inten-sity, modulation, and phase-shift data.Interactive HistogramsReal-time histograms offer a fast visual in-spection of fringe and surface (OPD) quality.The histogram graphs are interactive. For ex-ample, simply clicking the modulation or slope graph automatically sets the noise threshold.Quality ControlStatistical terms can be automatically qualitycontrol tested in real-time. Spreadsheets canbe scrolled to the right to enter minimum and maximum specifications. IntelliWave auto-matically tags terms that are below or abovespecifications.Precision of MeasurementsPrecision is almost always a function of theinterferometer and environment. Typical val-ues are:Phase Shifting: 20th to 1000th wave or higher Carrier methods: 20th to 50th waveFringe Tracing: 10th wave
Fitting Aberration PolynomialsPolynomials can be fitted to optical phase difference data (surface map) to deter-mine the aberrations. The following operations can be performed in IntelliWave:
• Selectable polynomials: Zernikes (UofA, OSA, Perkin Elmer, Annular) Seidels • Compute or generate aberrations in any specified aperture region• Any combination of aberration terms can be added or subtracted• For non-orthogonal applications, only selected terms can be fittedGenerating Interferograms and Phase Data with AberrationsAny combination of Zernike terms can be used to generate theoretical interfero-grams and/or surface phase data. This is a powerful way of generating a refer-ence surface for experimentation or subtraction from real data.
• User specified Zernike values can be used to generate data• Aberrations from a real test optic can be used to generate data• Multiple interferograms can be generated using a specified phase-shiftDetermining RMS FitThe RMS Fit of the polynomials to the surface data can be computed for each or-der of the polynomial. This is a good measure on how well the surface data com-puted from the polynomial matches the actual surface data. For most optics, in-creasing the number of terms in the polynomial usually produces a better fit.Quality ControlAll aberration terms and RMS fit values can be automatically quality control tested against user specifications in real-time. The spreadsheet can be scrolled to theright to enter minimum and maximum specifications for each term. IntelliWaveautomatically tags any term that is below or above specifications whenever theaberrations are computed.
Figure: Right click on a spread-sheet for a popup menu.
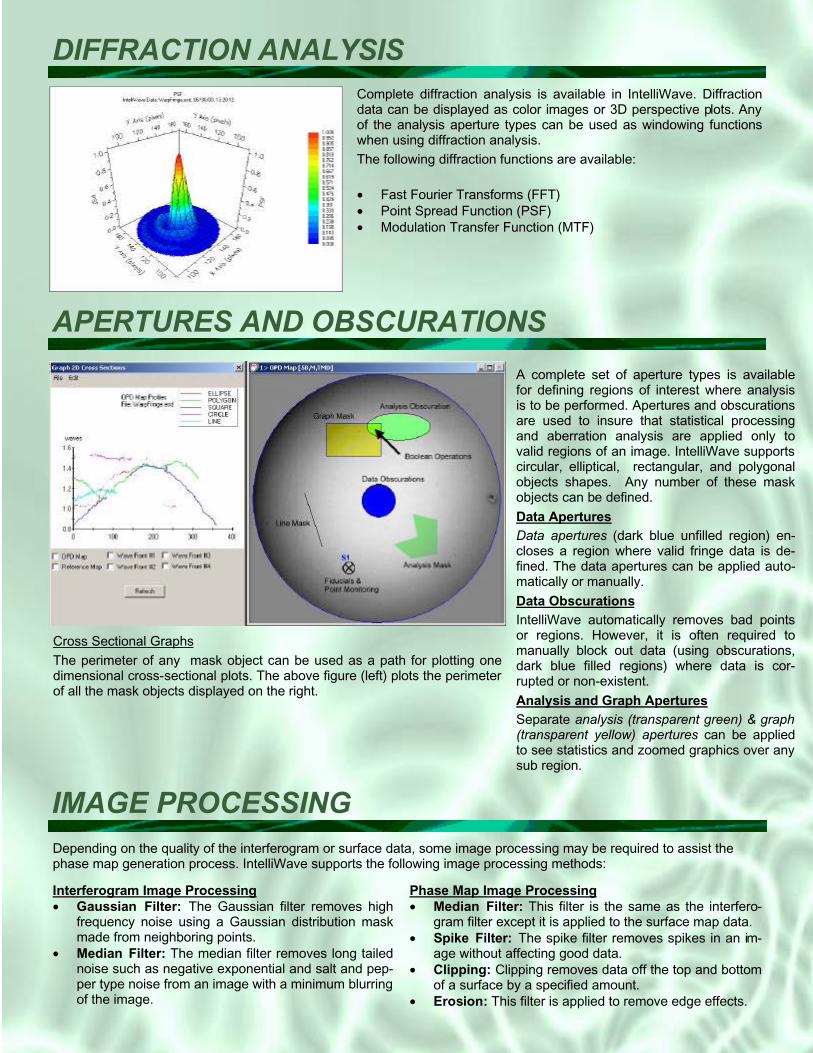
IMAGE PROCESSING
DIFFRACTION ANALYSISComplete diffraction analysis is available in IntelliWave. Diffractiondata can be displayed as color images or 3D perspective plots. Any of the analysis aperture types can be used as windowing functionswhen using diffraction analysis. The following diffraction functions are available:
• Fast Fourier Transforms (FFT)• Point Spread Function (PSF)• Modulation Transfer Function (MTF)
APERTURES AND OBSCURATIONS
Cross Sectional GraphsThe perimeter of any mask object can be used as a path for plotting onedimensional cross-sectional plots. The above figure (left) plots the perimeter of all the mask objects displayed on the right.
A complete set of aperture types is availablefor defining regions of interest where analysisis to be performed. Apertures and obscurationsare used to insure that statistical processingand aberration analysis are applied only tovalid regions of an image. IntelliWave supports circular, elliptical, rectangular, and polygonalobjects shapes. Any number of these maskobjects can be defined.Data AperturesData apertures (dark blue unfilled region) en-closes a region where valid fringe data is de-fined. The data apertures can be applied auto-matically or manually. Data ObscurationsIntelliWave automatically removes bad pointsor regions. However, it is often required tomanually block out data (using obscurations,dark blue filled regions) where data is cor-rupted or non-existent.Analysis and Graph AperturesSeparate analysis (transparent green) & graph (transparent yellow) apertures can be appliedto see statistics and zoomed graphics over any sub region.
Depending on the quality of the interferogram or surface data, some image processing may be required to assist the phase map generation process. IntelliWave supports the following image processing methods:
Interferogram Image Processing• Gaussian Filter: The Gaussian filter removes high
frequency noise using a Gaussian distribution maskmade from neighboring points.
• Median Filter: The median filter removes long tailednoise such as negative exponential and salt and pep-per type noise from an image with a minimum blurring of the image.
Phase Map Image Processing• Median Filter: This filter is the same as the interfero-
gram filter except it is applied to the surface map data.• Spike Filter: The spike filter removes spikes in an im-
age without affecting good data.• Clipping: Clipping removes data off the top and bottom
of a surface by a specified amount.• Erosion: This filter is applied to remove edge effects.

FIDUCIALS AND IMAGE TRANSFORMATIONS
IntelliWave has powerful image transformation capabilities for correcting or transforming images. An image transforma-tion can include translation, rotation, scaling, and skewing. Transformations can be used for any purpose and are com-monly used to align surface maps (OPD’s) such that they can be averaged or subtracted.
User Specified TransformationsDirect transformations can be applied to any type of image data including interferograms, surface data (OPD), andmasks. The transformation is composed of user specified values for translation, scaling, rotation, and center of rotation. Simple horizontal/vertical flipping and multiple ninety-degree image rotations are performed by direct pixel-to-pixel place-ment, thus, avoiding any image degradation.
Fiducial TransformationsFiducial based transformations are performed by transforming aset of source fiducial points onto a set of target fiducial points.The source and target fiducial points are usually a set of matching points on two separate images. Once the points are entered bymouse or through a spreadsheet, the source image is trans-formed such that its fiducial points overlay the target imagepoints. The transformation can be uniform or non-uniform depend-ing on whether or not the image must maintain its geometricshape. The fiducials can be graphically transformed as shownabove to test the transformation before transforming the actualimage. The transformed fiducials, transformation coefficients, and transformation error can be viewed graphically and in spread-sheet format.
Fiducial Transformation Features• Graphical/Spreadsheet real-time interface• Enter fiducials by mouse or spreadsheet• Enter fiducials using real-world units• Save/Open sets of source, target and trans-
formed fiducials, and coordinate systems forrepetitive use.
• View transformation results before applying to image.
• Uniform and non-uniform transformations
Performing the TransformationThe actual transformation can be performed by one of the following methods:• Direct pixel-to-pixel placement• Bi-linear interpolation• Bi-cubic interpolation.
IMPORTING AND EXPORTING DATA
PUBLISHING YOUR RESULTS
IntelliWave analyzes interferometric data from many sources includingdata that has been acquired completely outside of IntelliWave.File Import/ExportIntelliWave imports/exports from/to a wide variety of data formats in-cluding standard image formats, scientific formats, simple text files, and standard optical industry formats. A flexible means of importing the data is available so that interferogram data such as wavelength and wavesper fringe can be assigned to all file types including image files such as TIFF files.Clipboard TransferAny image, graphic, or spreadsheet can be transferred to the clipboardand pasted into any application such as Microsoft Word or Microsoft Ex-celTM. Graphics can be copied as vector metafiles so they can be easily scaled in size without loss of image quality.Camera and Scanner SupportInterferogram data can be scanned directly into IntelliWave using anycamera or TWAIN compliant device such as a scanner. Multiple inter-ferograms can be scanned simultaneously to average static interfero-gram data or perform phase-shifted analysis. Real-time Data Transfer to/from Other ProgramsUsing IntelliWave’s real-time interfaces to programs such as ExcelTM,MATLABTM, and IDLTM, data can be transferred bi-directionally in real-time. Data that can be transferred include interferograms, surface data(OPD), masks, statistics, and aberrations.
Image File Formats Supported• BMP - Microsoft Windows Bitmaps • TIFF - Tagged Image File Format• PNG - Portable Network Graphics• JPEG - Joint Photo Expert GroupScientific File Formats Supported• HDF - Hierarchical Data Format• RAW - Simple raw binary formatIndustry File Formats Supported• CODE V TM and ZMAX TM.• MetroPro TM and OptiCode TM
Application Independant File Formats• ASCII - Simple text formats• PDF - Reports • HTML and XML - Reports and Data Other Data Transfer Methods• Clipboard - Transfer bitmaps, metafiles,
or spreadsheets to the clipboard whichcan be pasted into other applications.
• Scanner - Data can be scanned usingany TWAIN compliant scanner.
• ActiveX - Through ActiveX interfaces,data can be transferred bi-directionally to programs such as ExcelTM, MATLABTM,and IDLTM.
Graphic Types Supported• 3D Perspective Plots• 2D Color Contour Maps• 1D Cross-sectional plots (real-time)
Graphics Features• Real-time rotation, scaling, and zooming• Customizable
• Add annotations & change palettes• Set custom axis scaling & contours• Numeric spreadsheet data display• Save/Open graphic settings
• Copy/Paste from/to the clipboard
Customizable HTML Reports• Create your own reports with only the
data and graphics you want.• Publish your reports to printers, HTML,
the Internet, or any email address.
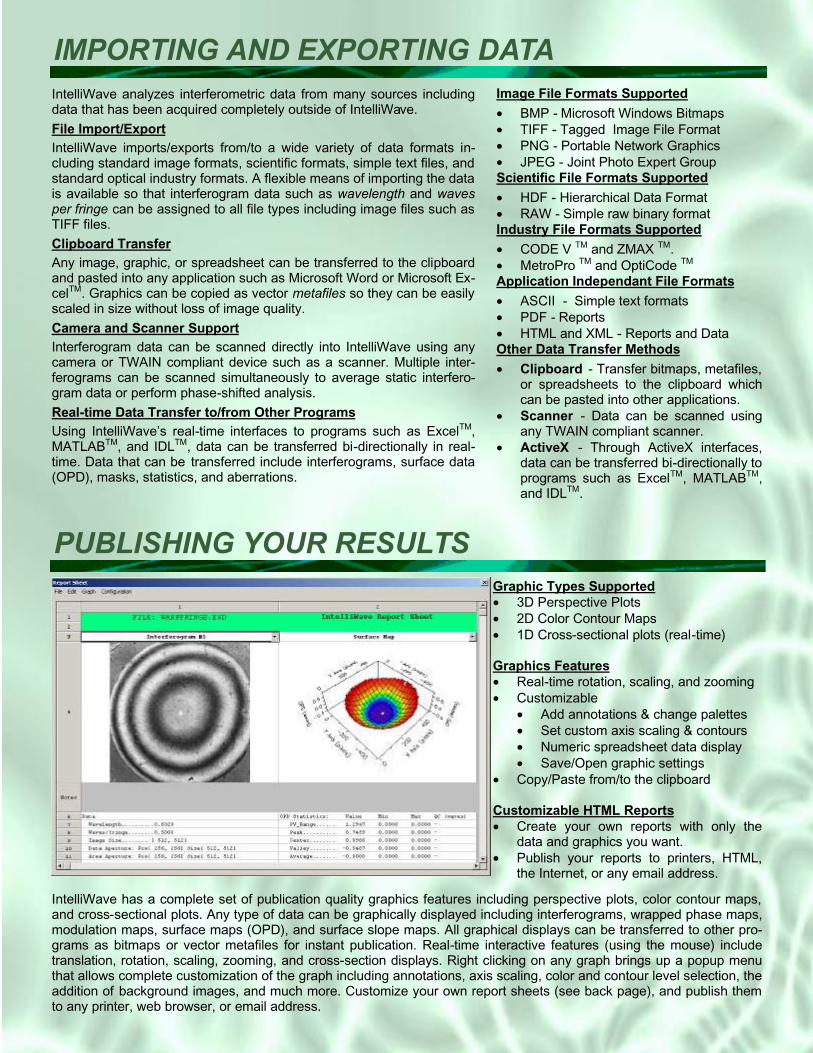
IntelliWave has a complete set of publication quality graphics features including perspective plots, color contour maps, and cross-sectional plots. Any type of data can be graphically displayed including interferograms, wrapped phase maps, modulation maps, surface maps (OPD), and surface slope maps. All graphical displays can be transferred to other pro-grams as bitmaps or vector metafiles for instant publication. Real-time interactive features (using the mouse) includetranslation, rotation, scaling, zooming, and cross-section displays. Right clicking on any graph brings up a popup menuthat allows complete customization of the graph including annotations, axis scaling, color and contour level selection, the addition of background images, and much more. Customize your own report sheets (see back page), and publish them to any printer, web browser, or email address.

AUTOMATION AND QUALITY CONTROL
ACTIVE-X INTERFACES AND PLUG-INS
The Figure above shows the MATLABTM ActiveX interface.• Send/Receive IntelliWave data to/from programs with a mouse • Define and call any external function with a mouse click
ActiveX InterfacesIntelliWave allows interferograms, surfacedata (OPD), masks, statistics, and aberra-tions to be transferred bi-directionally inreal-time to/from external programs. Anynative or user-written function from theseexternal programs can be used to process IntelliWave data. IntelliWave has ActiveXInterfaces for the following:
• Math Works’ MATLABTM
• Research Systems’ IDLTM
• Microsoft ExcelTM
• LabVIEWTM (see LabVIEW, page 3)
Plug-InsIntelliWave’s plug-in architecture (similarto AutoCADTM) allows virtually any newfeature to be seamlessly added by ESD,customers, or third party developers.Plug-Ins have complete access to Intelli-Wave data and functions. Plug-Ins aredetected and loaded at runtime.Example uses of Plug-Ins are customizedinstrument control, data analysis routines,custom interfaces, and automation of vari-ous tasks.
Automation Functions• Data acquisition and display• Interferogram processing• Surface map (OPD) processing• Statistics and aberrations• Image transformations• Real-time quality control• File input/output• Real-time communications, data transfer,
data processing, and instrument control using other programs.
• User interaction during automation• Repeat and While Loops• Automatic file naming• Functions can take parameters• Point & click programmability—no program-
ming experience required.
IntelliWave has a powerful automation and quality control system that allows repetitive and/or complex tasks to be auto-mated. For example, averaging fifty (50) data sets at 10 different field points on an optic is a simple task using automa-tion. Quality control can be performed on any statistical or aberrational value in real-time during an automation process. For example, 1) IntelliWave can acquire interferogram data continuously until the data reaches a minimum noise thresh-old, or 2) Continue acquiring and processing interferogram data until the resulting OPD Peak-to-Valley meets specifica-tions. The user can interact with IntelliWave or other programs during an automation process. With IntelliWave’s com-bined automation, quality control, and reporting features, assembly lines have a fast, concise, repeatable, and docu-mented means of making sure production parts meet specifications.

INTELLIWAVE LIBRARYIntelliWave’s internal data processing engine is available as a developer’s library that can be called from virtually anyprogramming environment. Most functions for processing interferograms, optical phase difference data (surface map),statistics, and aberrations can be performed with the library. Currently, there are interfaces for the following programming languages (items marked with an asterisk will appear in afuture release): Microsoft Visual C++, Research Systems’ IDLTM , Math Works’ MATLABTM.
TURNKEY SYSTEMS AND HARDWARE SUPPORT Complete Turnkey systems are available including interferometers, computers, cameras, and phase-shifters. IntelliWave acquires data from any analog/digital camera (or scanner) at any resolution (such as 40962) and speed (such as 1000frames/second). It controls phase-shifters of any type such as piezo transducers and crystal retarders. Supporting new hardware simply requires replacing hardware drivers like replacing a driver for a graphics card on a computer.
Phase-Shifters• Piezo transducers (PZT)• Liquid crystal variable retarders• Any analog or digital device• None required for static analysisCustomized DevicesNeed customized hardware? Wecan write drivers to control virtuallyany video capture or phase-shiftingdevice to meet your requirements.
Interferometers• Twyman-Green & Fizeau• Holographic & Speckle• Moiré & Projection• High Speed Interferometry• Simul taneous phase-
shifting interferometersWavelengths• X-ray, UV, and Visible• Mid Infrared, Far Infrared
Cameras• Any analog or digital camera• Any resolution & bit depth• Any frame rateFrame Grabbers (Video Capture)• Any analog or digital frame grabber• USB and Fire Wire 1394Scan Interferograms from Printed Matter• Use virtually any TWAIN scanner
INSTALLATION AND TRAINING COURSESInstallationInstalling IntelliWave on a computer is relativelystraight forward. How-ever, installation ser-vices are availableupon request.
Onsite Training CoursesEngineering Synthesis Design, Inc. offers complete one, two, and three day IntelliWavecourses with hands on training. These courses are recommended for those wishing to:• Master IntelliWave quickly• Master IntelliWave’s power and flexibility in solving unique and difficult problems.• Combine all of IntelliWave’s features including acquisition, analysis, automation, quality
control, Plug-Ins, and ActiveX External Program Interfaces to create powerful customized applications. Applications such as real-time mirror actuator control, measurements versus temperature, and automated assembly line quality control are all possible.
INTELLIWAVE FOR OEM SUPPLIERSIntelliWave is available to original equipment manufacturers (OEM) as an integrated part of their interferometric product line. Customized or simplified versions of the program can be provided to meet individual product or application require-ments. Call Engineering Synthesis Design, Inc. for details.
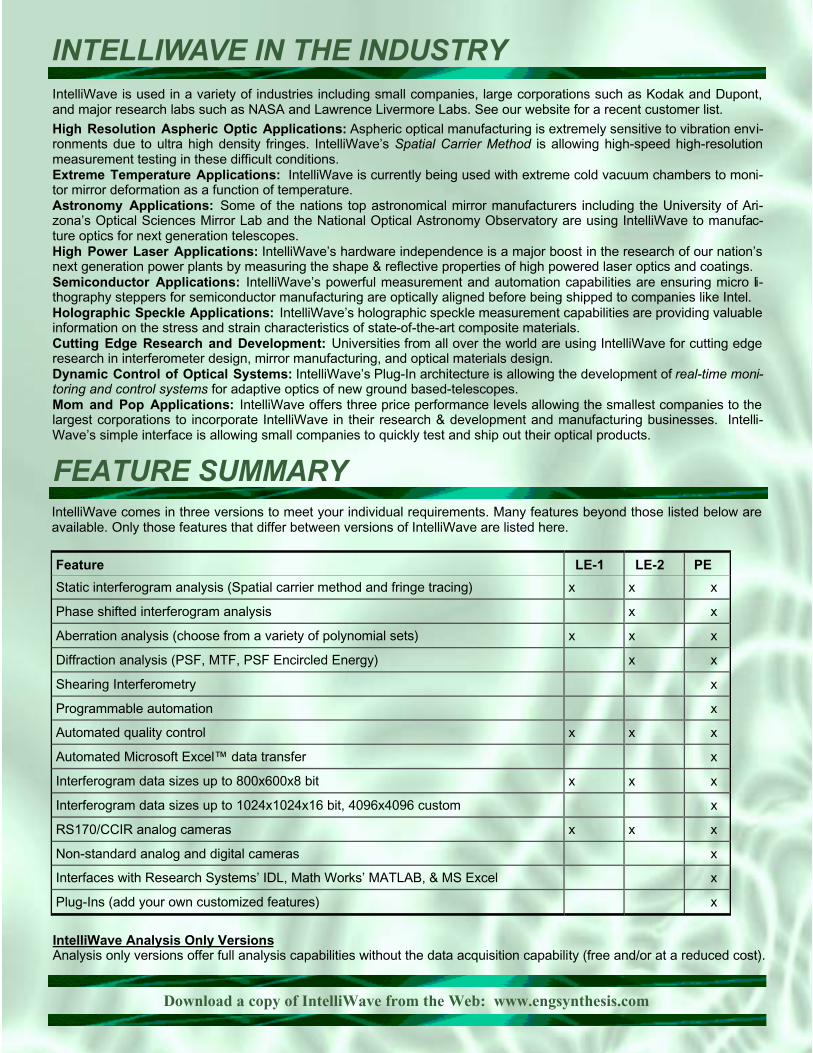
IntelliWave comes in three versions to meet your individual requirements. Many features beyond those listed below are available. Only those features that differ between versions of IntelliWave are listed here.
FEATURE SUMMARY
Feature LE-1 LE-2 PE
Static interferogram analysis (Spatial carrier method and fringe tracing) x x x
Phase shifted interferogram analysis x x
Aberration analysis (choose from a variety of polynomial sets) x x x
Diffraction analysis (PSF, MTF, PSF Encircled Energy) x x
Shearing Interferometry x
Programmable automation x
Automated quality control x x x
Automated Microsoft Excel™ data transfer x
Interferogram data sizes up to 800x600x8 bit x x x
Interferogram data sizes up to 1024x1024x16 bit, 4096x4096 custom x
RS170/CCIR analog cameras x x x
Non-standard analog and digital cameras x
Interfaces with Research Systems’ IDL, Math Works’ MATLAB, & MS Excel x
Plug-Ins (add your own customized features) x
IntelliWave Analysis Only VersionsAnalysis only versions offer full analysis capabilities without the data acquisition capability (free and/or at a reduced cost).
Download a copy of IntelliWave from the Web: www.engsynthesis.com
INTELLIWAVE IN THE INDUSTRYIntelliWave is used in a variety of industries including small companies, large corporations such as Kodak and Dupont, and major research labs such as NASA and Lawrence Livermore Labs. See our website for a recent customer list.High Resolution Aspheric Optic Applications: Aspheric optical manufacturing is extremely sensitive to vibration envi-ronments due to ultra high density fringes. IntelliWave’s Spatial Carrier Method is allowing high-speed high-resolutionmeasurement testing in these difficult conditions.Extreme Temperature Applications: IntelliWave is currently being used with extreme cold vacuum chambers to moni-tor mirror deformation as a function of temperature.Astronomy Applications: Some of the nations top astronomical mirror manufacturers including the University of Ari-zona’s Optical Sciences Mirror Lab and the National Optical Astronomy Observatory are using IntelliWave to manufac-ture optics for next generation telescopes.High Power Laser Applications: IntelliWave’s hardware independence is a major boost in the research of our nation’s next generation power plants by measuring the shape & reflective properties of high powered laser optics and coatings.Semiconductor Applications: IntelliWave’s powerful measurement and automation capabilities are ensuring micro li-thography steppers for semiconductor manufacturing are optically aligned before being shipped to companies like Intel.Holographic Speckle Applications: IntelliWave’s holographic speckle measurement capabilities are providing valuable information on the stress and strain characteristics of state-of-the-art composite materials.Cutting Edge Research and Development: Universities from all over the world are using IntelliWave for cutting edge research in interferometer design, mirror manufacturing, and optical materials design.Dynamic Control of Optical Systems: IntelliWave’s Plug-In architecture is allowing the development of real-time moni-toring and control systems for adaptive optics of new ground based-telescopes.Mom and Pop Applications: IntelliWave offers three price performance levels allowing the smallest companies to the largest corporations to incorporate IntelliWave in their research & development and manufacturing businesses. Intelli-Wave’s simple interface is allowing small companies to quickly test and ship out their optical products.
Tasks To execute after a previous task.
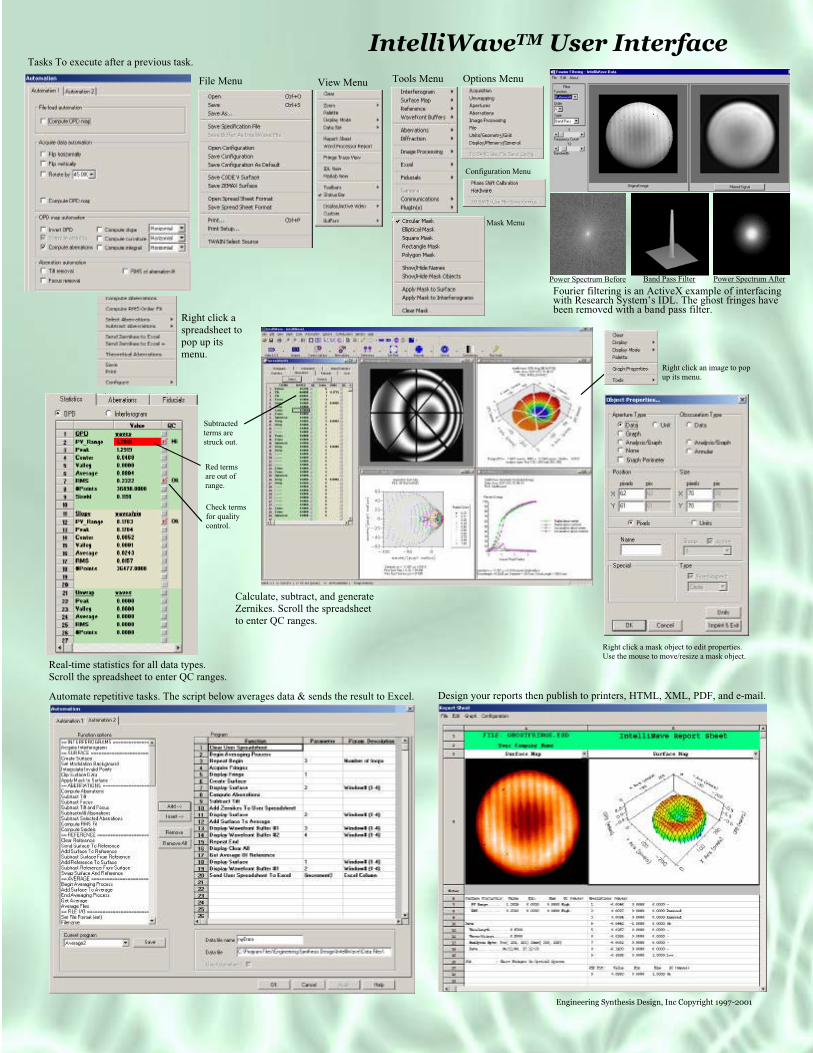
Design your reports then publish to printers, HTML, XML, PDF, and e-mail.
Right click a spreadsheet to pop up its menu.
IntelliWaveTM User Interface
Calculate, subtract, and generate Zernikes. Scroll the spreadsheet to enter QC ranges.
Real-time statistics for all data types.Scroll the spreadsheet to enter QC ranges.
Automate repetitive tasks. The script below averages data & sends the result to Excel.
Engineering Synthesis Design, Inc Copyright 1997-2001
Fourier filtering is an ActiveX example of interfacing with Research System’s IDL. The ghost fringes have been removed with a band pass filter.
Power Spectrum Before Power Spectrum AfterBand Pass Filter
Right click an image to pop up its menu.
File Menu Tools Menu
Check terms for quality control.
Red terms are out of range.
Subtractedterms are struck out.
Right click a mask object to edit properties. Use the mouse to move/resize a mask object.
Options Menu
Configuration Menu
View Menu
Mask Menu


![Towards a FPGA-controlled deep phase modulation …...Deep phase modulation interferometry [1] was proposed as a method to enhance homodyne interferometers to work over many fringes,](https://static.fdocuments.in/doc/165x107/610352c1b76a8f7c512a5be4/towards-a-fpga-controlled-deep-phase-modulation-deep-phase-modulation-interferometry.jpg)


