Intelligent Speed Adaptation - Final Report June...
101
isa- UK intelligent speed adaptation isa- UK intelligent speed adaptation Final Report June 2008 Oliver Carsten, Mark Fowkes, Frank Lai, Kathryn Chorlton, Samantha Jamson, Fergus Tate and Bob Simpkin Project Partners: The University of Leeds and MIRA Ltd Project Funded by the Transport Technology and Standards Division Department for Transport
Transcript of Intelligent Speed Adaptation - Final Report June...
isa- UKintelligent speed adaptation
isa- UKintelligent speed adaptation
Final Report
June 2008
Oliver Carsten, Mark Fowkes, Frank Lai, Kathryn Chorlton, Samantha Jamson, Fergus Tate and Bob Simpkin
Project Partners: The University of Leeds and MIRA Ltd
Project Funded by the Transport Technology and Standards Division
Department for Transport

Although this report was commissioned by the Department for Transport (DfT), the findings and recommendations are those of the authors and do not necessarily represent the views of the DfT. While the DfT has made every effort to ensure the information in this document is accurate, DfT does not guarantee the accuracy, completeness or usefulness of that information; and it cannot accept liability for any loss or damages of any kind resulting from reliance on the information or guidance this document contains. © Copyright 2007

Final Report
isa- UKintelligent speed adaptation
isa- UKintelligent speed adaptation
Table of Contents
1. INTRODUCTION ................................................................................................................ 1
2. BACKGROUND ................................................................................................................... 2
3. CAR TRIALS ........................................................................................................................ 4 3.1 Objectives ....................................................................................................................... 4 3.2 Method ............................................................................................................................ 4 3.3 Results ........................................................................................................................... 10 3.4 Conclusions from the car trials ..................................................................................... 23
4. TRUCK TRIAL .................................................................................................................. 27 4.1 Objectives ..................................................................................................................... 27 4.2 Method .......................................................................................................................... 27 4.3 Results ........................................................................................................................... 32 4.4 Conclusions from the truck trial ................................................................................... 40
5. MOTORCYCLE TRIAL ................................................................................................... 41 5.1 Objectives ..................................................................................................................... 41 5.2 Method .......................................................................................................................... 41 5.3 Results ........................................................................................................................... 50 5.4 Conclusions from the motorcycle trial .......................................................................... 60
6. SIMULATOR STUDY ....................................................................................................... 61 6.1 Introduction ................................................................................................................... 61 6.2 Method .......................................................................................................................... 61 6.3 Results ........................................................................................................................... 66 6.4 Conclusions from the simulator experiment ................................................................. 74
7. IMPLEMENTATION SCENARIOS ................................................................................ 76 7.1 Introduction ................................................................................................................... 76 7.2 Method .......................................................................................................................... 76 7.3 Effect of ISA on speed and crashes .............................................................................. 78 7.4 Relevant crashes ........................................................................................................... 80 7.5 Costs of ISA .................................................................................................................. 80 7.6 ISA penetration ............................................................................................................. 81 7.7 Estimation of costs and benefits ................................................................................... 84 7.8 Results: costs and benefits ............................................................................................ 84 7.9 Results: predicted crash reduction over time ................................................................ 87 7.10 Conclusions on implementation scenarios .................................................................... 89
8. CONCLUSIONS AND IMPLICATIONS ........................................................................ 90
9. REFERENCES .................................................................................................................... 92
APPENDIX: PROJECT REPORTS .......................................................................................... 95
i

Final Report
isa- UKintelligent speed adaptation
isa- UKintelligent speed adaptation
List of Figures
Figure 1: ISA fleet vehicle ............................................................................................................... 4 Figure 2: Steering-wheel-mounted buttons and ISA screen ............................................................ 5 Figure 3: ISA brake actuator ............................................................................................................ 6 Figure 4: ISA Display, ISA Waiting ................................................................................................ 7 Figure 5: ISA Display, no speed limit ............................................................................................. 7 Figure 6: ISA Display, ISA on, 30 mph speed limit ........................................................................ 7 Figure 7: ISA display, Overridden, 30 mph speed limit .................................................................. 8 Figure 8: ISA display, moving from a 30 mph limit to 40 mph limit .............................................. 8 Figure 9: ISA display, Fault ............................................................................................................. 8 Figure 10: ISA display, ISA Disabled ............................................................................................. 9 Figure 11: Comparison of key statistics of the speed distribution across trial phases ................... 11 Figure 12: Comparison of percentage of distance travelled over speed limit across trial
phases ........................................................................................................................... 12 Figure 13: Speed distribution by phase on 30 mph roads .............................................................. 12 Figure 14: Speed distribution by phase on 70 mph roads .............................................................. 13 Figure 15: Proportion of distance travelled with ISA when the system was overridden ............... 13 Figure 16: Comparison of overall overriding behaviour across driver groups .............................. 14 Figure 17: Comparison of overriding behaviour on 30 and 70 mph roads across driver
groups ........................................................................................................................... 14 Figure 18: The Theory of Planned Behaviour (Ajzen, 1988) ........................................................ 16 Figure 19: Mean intention to speed over time ............................................................................... 18 Figure 20: Mean perceived behavioural control score by scenario ............................................... 18 Figure 21: Mean error, lapse and violation score on DBQ over time ............................................ 19 Figure 22: Acceptability ratings for the dimensions of “usefulness” and “satisfaction”
over time ....................................................................................................................... 20 Figure 23: Individual workload dimension scores over time ......................................................... 20 Figure 24: Mean Wiener Fahrprobe score across trial phases ....................................................... 22 Figure 25: Observed negative driving behaviour across trial phases............................................. 23 Figure 26: The MAN TGL 180 ...................................................................................................... 28 Figure 27: MAN TGL cruise control column stalk ....................................................................... 29 Figure 28: The process of speed control mechanism in the ISA truck .......................................... 29 Figure 29: HMI in the ISA truck .................................................................................................... 30 Figure 30: Distribution of total vehicle kilometres with respect to speed zones ........................... 32 Figure 31: Overall speed distribution in 30 mph zones ................................................................. 33 Figure 32: Overall speed distribution in 40 mph zones ................................................................. 34 Figure 33: Overall speed distribution in 50 mph zones ................................................................. 34 Figure 34: Comparison of overriding behaviour across speed zones ............................................ 35 Figure 35: Comparison of vehicle speed on 30 mph roads across trial phases .............................. 35 Figure 36: Comparison of vehicle speed on 40 mph roads across trial phases .............................. 36 Figure 37: Comparison of vehicle speed on 50 mph roads across trial phases .............................. 36 Figure 38: Comparison of percentage of distance travelled over speed limit across trial
phases ........................................................................................................................... 37 Figure 39: Acceptability ratings on dimensions of ‘usefulness’ and ‘satisfaction’ ....................... 38 Figure 40: How do you think the following factors change when driving with the ISA
system compared to when driving without ISA on your truck? ................................... 38 Figure 41: Where would you use the ISA system? ........................................................................ 39 Figure 42: How justified do you think the system would be for the different categories of
drivers? ......................................................................................................................... 39
ii

Final Report
isa- UKintelligent speed adaptation
isa- UKintelligent speed adaptation
Figure 43: Suzuki Bandit 650S ...................................................................................................... 41 Figure 44: ISA motorcycle system diagram .................................................................................. 42 Figure 45: Illustration of a Virtual Beacon .................................................................................... 43 Figure 46: Identification of speed limits by Virtual Beacons ........................................................ 44 Figure 47: The servo motor used to limit the ISA motorbike’s throttle ........................................ 46 Figure 48: The ISA information screen ......................................................................................... 46 Figure 49: The ISA motorcycle system elements .......................................................................... 47 Figure 50: Test circuit used for ISA motorcycle trials................................................................... 48 Figure 51: Riding experience (years) ............................................................................................. 50 Figure 52: Acceptability rating for the dimension of “usefulness” ............................................... 51 Figure 53: Acceptability rating for the dimension of “satisfaction” .............................................. 51 Figure 54: How do you think the following factor would change when riding the three
systems compared to riding without any system on your motorcycle? ........................ 52 Figure 55: If you had this system on your motorcycles, where and when would you use
it? .................................................................................................................................. 53 Figure 56: How justified do you think the system would be for the different categories of
riders? ........................................................................................................................... 54 Figure 57: System trust ratings ...................................................................................................... 55 Figure 58: Willingness to install the systems ................................................................................ 55 Figure 59: Willingness to pay for the systems ............................................................................... 56 Figure 60: Comparison of speeding distance across the trial phases ............................................. 58 Figure 61: Comparison of speed profiles across trial phases ......................................................... 59 Figure 62: The Leeds Driving Simulator ....................................................................................... 63 Figure 63: Road scene showing the tapering down from two lanes to one ................................... 65 Figure 64: Mental workload scores ................................................................................................ 66 Figure 65: Acceptability scores ..................................................................................................... 67 Figure 66: Percentage decrease in attempted overtakings with ISA active (mandatory
ISA) .............................................................................................................................. 68 Figure 67: Percentage decrease in attempted overtakings with ISA active (voluntary ISA) ......... 69 Figure 68: Overtaking outcome (mandatory ISA) ......................................................................... 70 Figure 69: Overtaking outcome (voluntary ISA) ........................................................................... 70 Figure 70: Frequency of encroachments (mandatory ISA) ............................................................ 71 Figure 71: Frequency of encroachments (voluntary ISA) ............................................................. 71 Figure 72: Severity of encroachment into hatched area (mandatory ISA) .................................... 72 Figure 73: Severity of encroachment into hatched area (voluntary ISA) ...................................... 72 Figure 74: Mean minimum distance to the rear of the lead vehicle whilst overtaking
(mandatory ISA) ........................................................................................................... 73 Figure 75: Mean minimum distance to the rear of the lead vehicle whilst overtaking
(voluntary ISA) ............................................................................................................. 73 Figure 76: Mean minimum distance to the front of the lead vehicle whilst overtaking
(mandatory ISA) ........................................................................................................... 74 Figure 77: Mean minimum distance to the front of the lead vehicle whilst overtaking
(voluntary ISA) ............................................................................................................. 74 Figure 78: Implementation of ISA in passenger cars and light goods vehicles under the
market driven scenario ................................................................................................. 82 Figure 79: Implementation of ISA in the light vehicle fleet under the authority driven
scenario ......................................................................................................................... 83 Figure 80: Crash reduction over time for Market Driven ISA using the Base Combination
of crash reduction prediction models ........................................................................... 88 Figure 81: Crash reduction over time for Authority Driven ISA using the Base
Combination of crash reduction prediction models ...................................................... 88
iii
Final Report
iv
isa- UKintelligent speed adaptation
isa- UKintelligent speed adaptation
List of Tables
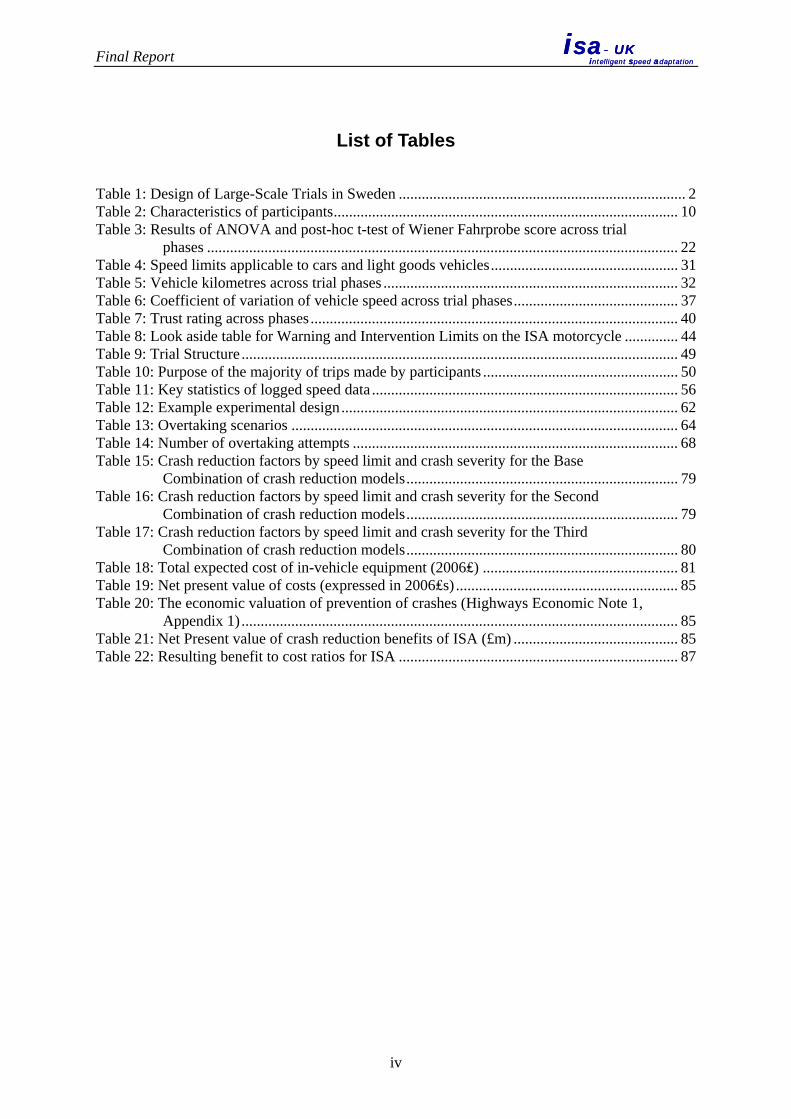
Table 1: Design of Large-Scale Trials in Sweden ........................................................................... 2 Table 2: Characteristics of participants .......................................................................................... 10 Table 3: Results of ANOVA and post-hoc t-test of Wiener Fahrprobe score across trial
phases ........................................................................................................................... 22 Table 4: Speed limits applicable to cars and light goods vehicles ................................................. 31 Table 5: Vehicle kilometres across trial phases ............................................................................. 32 Table 6: Coefficient of variation of vehicle speed across trial phases ........................................... 37 Table 7: Trust rating across phases ................................................................................................ 40 Table 8: Look aside table for Warning and Intervention Limits on the ISA motorcycle .............. 44 Table 9: Trial Structure .................................................................................................................. 49 Table 10: Purpose of the majority of trips made by participants ................................................... 50 Table 11: Key statistics of logged speed data ................................................................................ 56 Table 12: Example experimental design ........................................................................................ 62 Table 13: Overtaking scenarios ..................................................................................................... 64 Table 14: Number of overtaking attempts ..................................................................................... 68 Table 15: Crash reduction factors by speed limit and crash severity for the Base
Combination of crash reduction models ....................................................................... 79 Table 16: Crash reduction factors by speed limit and crash severity for the Second
Combination of crash reduction models ....................................................................... 79 Table 17: Crash reduction factors by speed limit and crash severity for the Third
Combination of crash reduction models ....................................................................... 80 Table 18: Total expected cost of in-vehicle equipment (2006₤) ................................................... 81 Table 19: Net present value of costs (expressed in 2006₤s) .......................................................... 85 Table 20: The economic valuation of prevention of crashes (Highways Economic Note 1,
Appendix 1) .................................................................................................................. 85 Table 21: Net Present value of crash reduction benefits of ISA (£m) ........................................... 85 Table 22: Resulting benefit to cost ratios for ISA ......................................................................... 87
Final Report
isa- UKintelligent speed adaptation
isa- UKintelligent speed adaptation
1. INTRODUCTION
Intelligent Speed Adaptation (ISA) is a system by which the vehicle “knows” the permitted or recommended maximum speed for a road. The standard system uses an in-vehicle digital road map onto which speed limits have been coded, combined with a positioning system which could be GPS, i.e. the satellite Global Positioning System, but could also be GPS enhanced with map matching and dead reckoning. ISA can take various forms: • In terms of intervention level, it can be advisory (the driver is informed of the limit and of
violations), voluntary (the system is linked to the vehicle controls but the driver can choose when to have the system enabled), or mandatory (no override is possible).
• The speed limit information can potentially be extended to incorporate lower speeds at certain locations in the network and even in the future variation with current network conditions, based on weather, traffic density, the presence of incidents etc.
The main tasks of the project reported here were to: • Investigate car driver behaviour with ISA by means of set of field trials with a voluntary ISA • Study overtaking behaviour with ISA in a driving simulator • Prepare an ISA design for motorcycles and large trucks and to build a demonstrator of each • Investigate the costs and benefits of ISA There were a number of core issues to be investigated: 1. How would behaviour change over the long term when driving with ISA? 2. How would user attitudes change with long term exposure to ISA? 3. Would some manoeuvres become more dangerous with non-overridable ISA and what would
be the implications if they did? 4. What would be the usage patterns of a voluntary ISA by type of road and type of driver 5. What practical issues would be raised by the application of ISA to other motor vehicles, such
as trucks and motorcycles? 6. Would truck drivers and motorcycle riders react differently to ISA? The most substantial part of the project work was the field trials looking at the long-term behaviour of car drivers with ISA and also comparing:
• Driving with ISA with driving in the pre (non-ISA) situation • Driving with ISA with driving in the post (after-ISA) situation • Driving in the pre situation with driving in the post situation (both non-ISA) to
investigate whether there were any carry-over effects of ISA driving. This report covers all the major aspects of the project work, namely the field trials with the car fleet, the more limited on-road trial with an equipped truck, the test-track trial with an adapted motorcycle, the simulator experiments on a situation that was considered to have the potential to become problematic with ISA, namely overtaking, and the work on implementation scenarios which has examined the accident reduction potential of ISA and evaluated the costs and benefits of ISA introduction. More detailed reports on each of these topics have been produced.
1

Final Report
isa- UKintelligent speed adaptation
isa- UKintelligent speed adaptation
2. BACKGROUND
This project was preceded by the External Vehicle Speed Control project funded by DETR which lasted from 1997 to 2000 (Carsten and Tate, 2000). The EVSC project covered a wide range of issues related to ISA from system architecture to costs and benefits. A series of short-term trials with a modified car were conducted. These on-road trials indicated that, in the short term, compliance with voluntary ISA declined with familiarity and successive use of the equipped car (Comte, 1999). However, the usage of the voluntary system was only investigated on two drives. Therefore there was a realistic concern that, in a large field trial with a voluntary system, very little data on driving with ISA might be obtained. On the other hand, the voluntary version of the system used in the EVSC project defaulted to being off, i.e. drivers had to actively reengage it at every change in speed limit. In the ISA project, the system tested has been one that defaults to being on when the speed limit is known, thus encouraging driver compliance. At the time the project began there had been no substantial long-term trials with a voluntary ISA system (Carsten, 2002). The largest trial to date with such a system was that in Eslöv near Lund in Sweden in 1997 (Almqvist and Nygård, 1997). Twenty-five drivers in this small town had their cars adapted for ISA and drove with a haptic-throttle ISA for two months. There was a speed limit of 50 km/h throughout the urban area, and, for the purpose of the trial, simple radio transmitters were sited on all the approach roads into the town. The system was automatically engaged within the urban area and automatically disengaged outside, although the drivers had the option of manually engaging the limiter outside town. No driving information was recorded outside the town, so that drivers’ propensity to use ISA on different road types and in different speed limit zones could not be ascertained. Subsequently, there have been large-scale trials in Sweden (Biding and Lind, 2002). The study was conducted in four different towns and a total fleet of approximately 4,500 vehicles was equipped. The systems were retro-fitted to individuals’ or fleet vehicles. The overall study design is shown in Table 1.
Table 1: Design of Large-Scale Trials in Sweden
Town Communications In-Vehicle System Number of vehicles
Umeå Roadside beacon Warning with buzzer 3,642 vehicles including buses
Borlänge GPS and digital mapCombination of information to drivers and recording
350 cars
Lidköping GPS and digital mapEither information or haptic throttle with kickdown
220 cars
Lund GPS and digital map Haptic throttle with kickdown 290 cars and buses
The trials were very impressive in terms of size. But intervening ISA was only investigated in Lidköping and Lund, and only in Lund was there systematic recording of driver speed choice. However, the ISA system in Lund only operated automatically within the municipal boundaries (Hjälmdahl and Várhelyi, 2004). As in the Eslöv trial, the system had to be set manually if the driver wanted support outside the city.
2

Final Report
isa- UKintelligent speed adaptation
isa- UKintelligent speed adaptation
There was therefore a substantial case for an investigation that would look at the potential of ISA on all road categories and which would be research-oriented while at the same time providing drivers with an ISA system that appeared mature and well-integrated into the vehicle.
3
Final Report
isa- UKintelligent speed adaptation
isa- UKintelligent speed adaptation
3. CAR TRIALS
3.1 Objectives
The main focus of the trials was on driver behaviour and attitudes when using ISA over a relatively long period, i.e. four months of driving. It was hoped that this four-month period was sufficiently long for drivers to be able get beyond the learning and adjustments stages and settle into long-term behavioural patterns. The driving with ISA was compared with a pre period and an after period of driving without ISA. Both the pre and after periods were one month in duration, giving a total trial duration of six months. The experimental design allowed comparison of driving without ISA in the pre period with the “ISA-On” period. It also allowed comparison of the “ISA-On” period with the after period in order to reveal whether there were any carry-over effects of the ISA driving on subsequent behaviour. 3.2 Method
3.2.1 Modifications to the vehicles
3.2.1.1 Overall design The vehicles used were a fleet of Skoda Fabia Elegance 1.4 litre estates. The vehicle model is illustrated in Figure 1. These vehicles were selected because they were considered to be representative examples of modern family cars, with an electronic throttle which allowed installation of a sophisticated intervening ISA system, and because they had sufficient hidden space to allow storage of the ISA equipment where it could not be readily accessed by the participants.
Figure 1: ISA fleet vehicle
4
Final Report
isa- UKintelligent speed adaptation
isa- UKintelligent speed adaptation
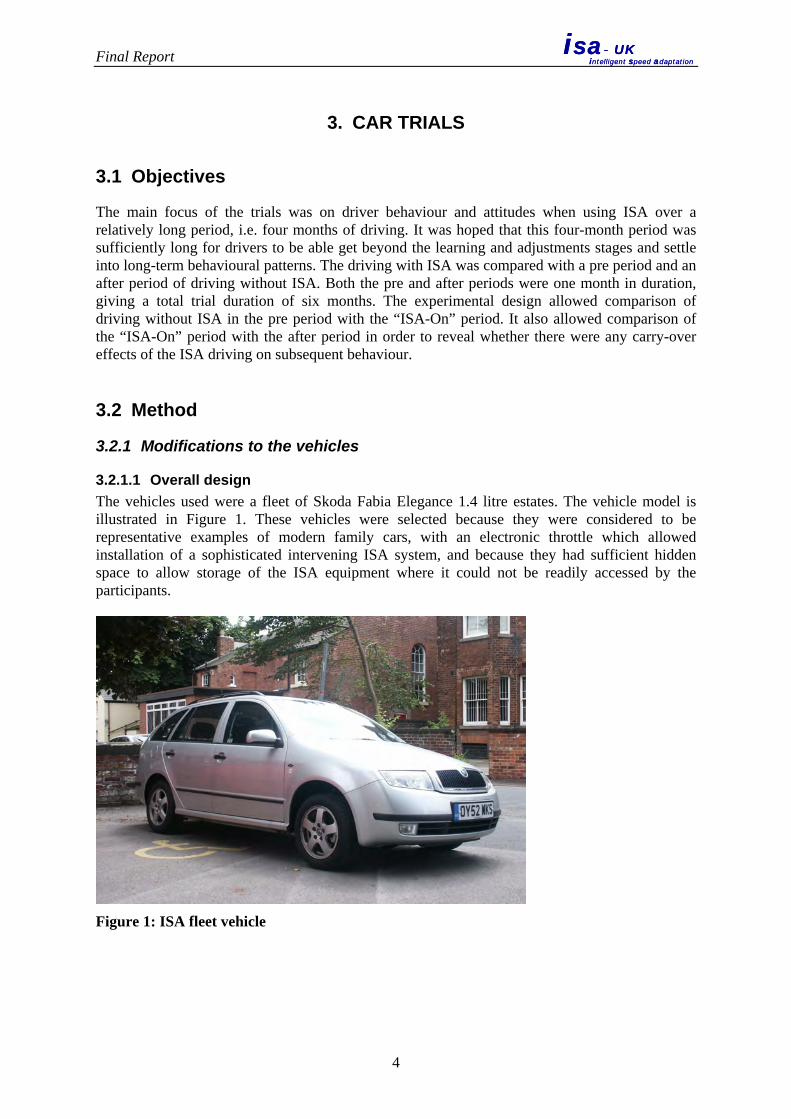
For the Human Machine Interface (HMI), the following items were implemented: Controls: Thumb operated – ISA control opt-in and opt-out buttons on the top surface of the steering wheel Foot operated – ISA system opt-out by means of “kick-down” via full depression of the accelerator pedal. Finger operated – ISA system disable button in the central control cluster; this emergency button disabled the whole ISA control system. Displays: Visual Display – an ISA status/information display panel located centrally in the vehicle instrument panel. Visual Display – via control illumination/position of all ISA controls Auditory Display – an ISA status display giving feedback on system status and activation. The overall concept was to integrate ISA system components and functionality into the base vehicle so that the user would feel that the system had been installed as original equipment. It was considered important to package the additional ISA system hardware in such a manner that it did not compromise normal storage space within the vehicle, and also to minimise the potential for tampering. Therefore, a goal was to design and install hardware that was stylistically comparable to the manufacturer’s equipment and was compatible with the interior layout. For this reason space behind the glove box and in the boot spare wheel well was utilised to allow the system to be hidden. The OEM accelerator pedal demand (i.e. pedal angle) is determined by a twin potentiometer sensor unit. To provide ISA control intervention, an interface was provided between the OEM pedal sensors and the Engine Control Unit. This enabled the throttle demand requested by the driver to be routed through the ISA control system. The standard radio aerial was replaced with a combined GPS/GSM and radio antenna. An additional LCD was mounted centrally within the instrument cluster; this could display a wide range of ISA system status and speed limit information. It was easily seen through the steering column and had character sizing, contrast and format similar to the other OEM supplied LCD displays in the cluster (see Figure 2). The only other visible elements of the ISA system accessible to the driver were the two illuminated steering wheel mounted ISA opt-in and opt-out buttons (one green and one red) and an extra Skoda-supplied button set within the dashboard to disable the system in case of malfunction.
Figure 2: Steering-wheel-mounted buttons and ISA screen
5

Final Report
isa- UKintelligent speed adaptation
isa- UKintelligent speed adaptation
An analogue I/O interface board was fitted to the rear of the glove box and an electrically driven pneumatic pump was housed in the engine bay to power an actuator fitted to the brake pedal (Figure 3).
Figure 3: ISA brake actuator
Two embedded computers, a proprietary sensor box that housed a GPS receiver, a yaw sensor, a speed pickup and direction of travel signal, together with the associated power supplies were all housed in a unit installed in the well next to the spare wheel. The ISA system used four modules for data acquisition and speed control:
• Location • Interpretation • Command • Control
The Location Module received inputs from the GPS receiver, together with direction and distance data. The Interpretation Module identified the speed limit for the location. Fused data relating to location, direction and time was processed by the navigation computer to identify the current link and the speed limit applicable to the current position on the link. This speed limit, along with other data for data logging such as location, was passed to the Command Module. The Command Module received inputs from the driver and relayed them together with the speed limit to the Control Module. When ISA control was active the primary function of the Control Module was to compare the road speed with the current speed limit and reduce speed if necessary through the throttle and the brake. The Command module also undertook the data logging functions and drove the HMI module. Speed in the ISA system was calibrated as far as possible to true road speed. However, since there was some non-linearity in the system it was not possible to achieve a perfect result. The speed of the ISA system was not the same as the speedometer reading, since the calibration results showed that the vehicle’s speedometer tended to read high, which is in line with regulations. When the car was travelling at exactly 30 mph by GPS speed reading, the speedometer read up to 33 mph.
3.2.1.2 Operational states of the ISA system When the vehicle speed was much less than the current speed limit, the driver’s throttle demand was passed straight through to the engine ECU. When the vehicle speed reached at least 90% of the current speed limit, the ISA system calculated the throttle demand to maintain the vehicle speed at the speed limit, compared this demand with the demand from the driver and passed the
6

Final Report
isa- UKintelligent speed adaptation
isa- UKintelligent speed adaptation
smaller value to the engine ECU. The following descriptions illustrate the various states of the ISA system as displayed to the driver following start-up of the vehicle.
ISA waiting At the start of a journey the ISA waiting display would be seen as shown in Figure 4. This indicated that the ISA system was waiting for a message from the navigation system, for example during the boot up sequence for the navigation system.
Figure 4: ISA Display, ISA Waiting
ISA on, no speed limit When the ISA system was unable to establish a speed limit for the current link, the display would show two question marks (see Figure 5).
Figure 5: ISA Display, no speed limit
There were several reasons for the system being unable to display a speed limit:
• The vehicle was not on a recognised link in the digital map such as a car park or a private drive
• The current link did not have a speed limit associated with it (i.e. outside the speed-mapped area)
• The navigation system was trying to establish which link the vehicle was on.
ISA on Figure 6 shows the display given to the driver when the ISA system was active and the speed limit was 30 mph. In order to limit the vehicle to the desired speed limit, the ISA system intercepted the signal sent from the electronic throttle pedal to the Engine Control Unit (ECU). The ISA system could review this signal and determine the value that was required to limit vehicle speed to the maximum speed limit set for the road. The ISA system compared the current road speed with the speed limit. If the road speed exceeded the speed limit then the throttle signal to the engine control unit was reduced. If the road speed exceeded the speed limit by more than 2% then the ISA brake was applied until the road speed fell to the speed limit.
Figure 6: ISA Display, ISA on, 30 mph speed limit
A driver might try to exceed the speed limit by increasing the throttle demand. The ISA system would activate a vibrating motor fitted to the accelerator pedal when the driver demand exceeded the calculated maximum throttle demand by 40%. This gave the driver tactile feedback indicating that the throttle demand requested was in excess of that required by the current speed limit.
7

Final Report
isa- UKintelligent speed adaptation
isa- UKintelligent speed adaptation
Override of ISA If the driver wished to exceed the current speed limit, perhaps to pass a slow moving vehicle quickly, he could override ISA control by either pressing the red Opt-Out button on the steering wheel or by depressing the throttle pedal fully to reach the “kick-through” position. When the opt-out signal was received the ISA system responded by generating a sound, removing the circle from around the displayed speed limit (see Figure 7) and passing the driver throttle demand directly to the ECU.
Figure 7: ISA display, Overridden, 30 mph speed limit
ISA control could be restored in two ways:
• The driver could press the green button (opt-in) to reinstate control to the prevailing speed limit, or.
• The system would automatically restore speed control when the vehicle speed fell below the current speed limit.
Speed limit change When the vehicle passed from one speed limit to another the driver was informed visually through the ISA display and by the new speed limit sound. The change in ISA display moving from a 30 mph limit to a 40 mph limit is shown in Figure 8.
Figure 8: ISA display, moving from a 30 mph limit to 40 mph limit
ISA system fault If certain fault conditions were identified during a trip then ISA control was suspended. The driver was informed visually through the ISA display (see Figure 9) and by the ISA Fault sound.
Figure 9: ISA display, Fault
The fault could only be cleared and ISA control returned by terminating the current journey and starting another through ignition key-off and key-on.
ISA disable The ISA disable button a modified Skoda switch, was clearly located directly above the vehicle radio/cassette on the control console, next to the ASR and below the emergency hazard flasher buttons. It was installed purely for disabling the ISA system in the unlikely event of a failure occurring with the system. It was intended for use only in an ISA failure situation and participants were instructed not to use it to override ISA control in normal driving.
8
Final Report
isa- UKintelligent speed adaptation
isa- UKintelligent speed adaptation
Figure 10: ISA display, ISA Disabled
If the disable button was pressed, then the ISA system was by-passed and there was no speed control. The ISA display is shown in Figure 10. It should be noted that logging of the various locations, speed limits and vehicle speeds continued. The disable button was reset at key-off.
3.2.1.3 Identification of speed limit The ISA system used GPS and Dead Reckoning (DR) technology to determine the vehicle’s position. GPS utilises a constellation of at least 24 medium Earth orbit satellites which transmit precise microwave signals, the system enables a receiver to determine its location, speed and direction. DR is a technique that continuously monitors vehicle speed and direction, and which enables the provision of uninterrupted positioning when GPS signals are poor such as when obscured by tree foliage, tunnels or tall buildings. Upon vehicle location information being available, the ISA system then identified the applicable speed limit by matching the vehicle’s location onto the digital speed limit map stored in the vehicle.
3.2.2 Experimental design
Four successive trials were conducted: Trial 1: Leeds area with private motorists Trial 2: Leeds area with fleet motorists Trial 3: Leicestershire with private motorists Trial 4: Leicestershire with fleet motorists
The Leeds trial was in a major urban area, although the speed limit data covered the whole of the Leeds Metropolitan District, which includes some outlying rural areas and villages. The Leicestershire area is mainly rural and small-town. Each of the participants was given the use of a modified vehicle for the trial period. These vehicles behaved like “normal” cars apart from the ISA feature. The ISA was overridable by the drivers, by mean of a button on the steering wheel or a kickdown on the throttle pedal. The speed limit map covered the local area (Leeds for Trials 1 and 2, South-West Leicestershire, including the city of Leicester, for Trials 3 and 4) as well as the national trunk road network. The intention was to give drivers ISA support for almost all their regular driving during the ISA-active phase. In-vehicle data was collected at 10 Hz and logged automatically on a computer that could not be accessed by the user, and summary data was collected after each trip through a GSM (mobile phone) link. The data was subsequently imported into a relational database, where it could be linked to other data such as that on participant characteristics, participant attitudes and roadway data.
3.2.3 Participant recruitment
Participants for the private field trials were recruited in response to adverts placed in local newspapers. Participants for the fleet trials were recruited from local organisations — in Leeds from employees of Leeds City Council (LCC), and in Leicestershire from various local authorities (including Leicestershire County Council, Leicester City Council, and Hinckley & Bosworth Borough Council) as well as a private company (Kingstone and Mutual Clothing Co). Due to a number of participants withdrawing from the final trial, the data analysis is limited to 79
9

Final Report
isa- UKintelligent speed adaptation
isa- UKintelligent speed adaptation
participants. An additional replacement driver was found, but the amount of data collected did not warrant this person’s inclusion within the analysis. It was also the aim to recruit equally across various characteristics: gender, age group (25–40 and 41–60), and speed intender/non-intender (prior intention to speed as defined by a Theory of Planned Behaviour questionnaire). However, a number of issues, including the availability of drivers within the fleets, meant that it was impossible to recruit strictly in accordance with the selected criteria. Overall, 44 males (age range 22–59 years, M = 40.30, SD = 11.73) and 35 females (age range 30–60 years, M = 41.43, SD = 8.05) took part in the four trials. Table 2 below shows the distribution of the participants across gender, age group and speeding intention.
Table 2: Characteristics of participants
Gender Age Intention to Speed Number
Male 23–39 Intender 11 Male 23–39 Non-Intender 8 Male 40–60 Intender 13 Male 40–60 Non-Intender 12 Female 23–39 Intender 6 Female 23–39 Non-Intender 11 Female 40–60 Intender 11 Female 40–60 Non-Intender 7
Data on both behaviour and attitudes was collected. Driving data was collected at a frequency of 10 Hz (i.e. 10 times per second) and was obtained for 570,660 km overall, of which 352,109 km was during the period when the ISA system was activated. Speed limits could be identified for almost all the distance travelled — 551,181 km or 96.6% of the distance travelled. Data on attitudes, acceptance of ISA and self-reported behaviour were collected at various points during the study. Observed drives along a fixed route were conducted four times during each trial.
3.3 Results
3.3.1 Driver behaviour
As indicated above, each trial was divided into three phases: Phase 1: an initial period of one month with no ISA to serve as the baseline Phase 2: four months with the ISA system active Phase 3: one month with the ISA once more inactive, for the study of carry-over effects
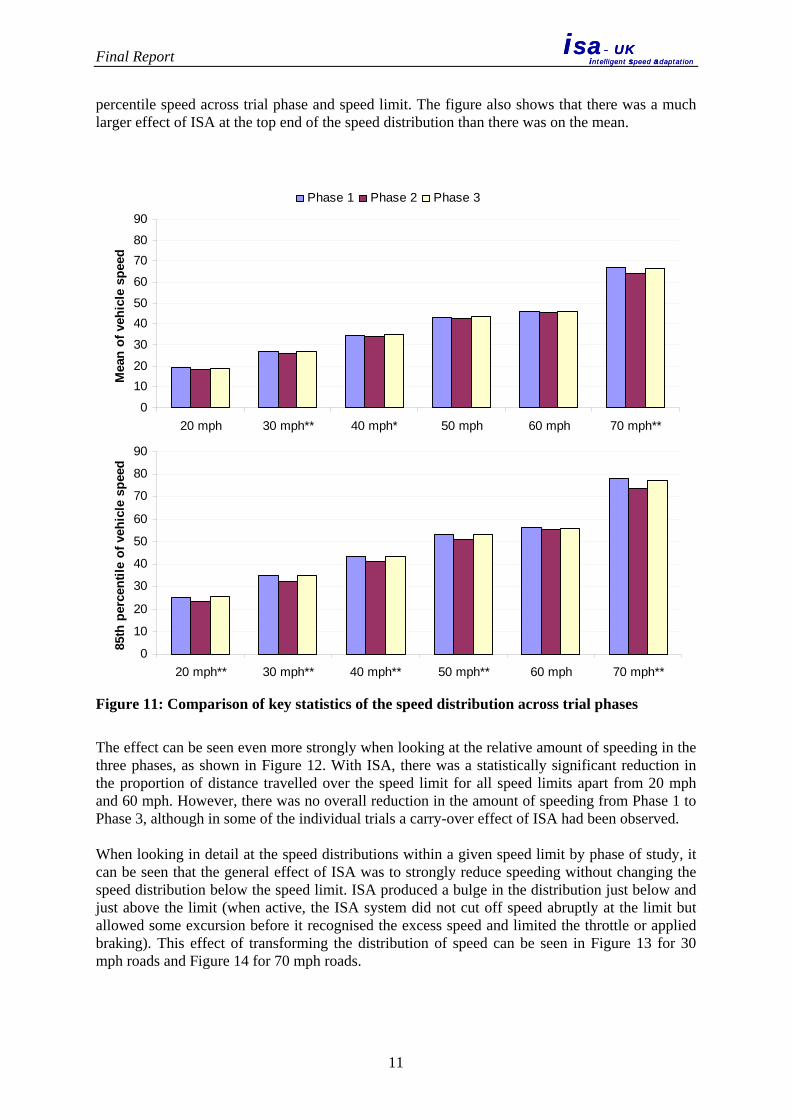
The general effect of ISA was to reduce the amount of speeding across all speed limits, with the exception of 60 mph roads where there was little speeding in Phase 1. The typical pattern was for speeding to reduce in Phase 2 as compared to Phase 1, and then for there to be at least a partial return to the baseline behaviour in Phase 3, resulting in a V-shaped pattern of speed-related statistics. This can be seen in Figure 11, which shows mean and 85th
In this and subsequent figures, * denotes that the difference between Phase 1 and Phase 2 is significant at the 0.05 level, ** denotes that the difference is significant at the 0.01 level, while *** denotes that the difference is significant at the 0.001 level.
10
Final Report
isa- UKintelligent speed adaptation
isa- UKintelligent speed adaptation
percentile speed across trial phase and speed limit. The figure also shows that there was a much larger effect of ISA at the top end of the speed distribution than there was on the mean.
0
1020
30
4050
60
7080
90
20 mph 30 mph** 40 mph* 50 mph 60 mph 70 mph**
Mea
n of
veh
icle
spe
ed
Phase 1 Phase 2 Phase 3
0
10
20
30
40
50
60
70
80
90
20 mph** 30 mph** 40 mph** 50 mph** 60 mph 70 mph**
85th
per
cent
ile o
f veh
icle
spe
ed
Figure 11: Comparison of key statistics of the speed distribution across trial phases
The effect can be seen even more strongly when looking at the relative amount of speeding in the three phases, as shown in Figure 12. With ISA, there was a statistically significant reduction in the proportion of distance travelled over the speed limit for all speed limits apart from 20 mph and 60 mph. However, there was no overall reduction in the amount of speeding from Phase 1 to Phase 3, although in some of the individual trials a carry-over effect of ISA had been observed. When looking in detail at the speed distributions within a given speed limit by phase of study, it can be seen that the general effect of ISA was to strongly reduce speeding without changing the speed distribution below the speed limit. ISA produced a bulge in the distribution just below and just above the limit (when active, the ISA system did not cut off speed abruptly at the limit but allowed some excursion before it recognised the excess speed and limited the throttle or applied braking). This effect of transforming the distribution of speed can be seen in Figure 13 for 30 mph roads and Figure 14 for 70 mph roads.
11

Final Report
isa- UKintelligent speed adaptation
isa- UKintelligent speed adaptation
0
10
20
30
40
50
60
20 mph 30 mph** 40 mph** 50 mph* 60 mph 70 mph**
Dist
ance
trav
elle
d (%
)Phase 1 Phase 2 Phase 3
Figure 12: Comparison of percentage of distance travelled over speed limit across trial
phases
0
5
10
15
20
25
30
35
40
45
<5 5-10
10-15
15-20
20-25
25-30
30-35
35-40
40-45
45-50
50-55
55-60
60-65
65-70
70-75
75-80
80-85
85-90
90-95
>95
Vehicle Speed (mph)
Trav
el D
ista
nce
(%)
Phase 1 Phase 2 Phase 3
Figure 13: Speed distribution by phase on 30 mph roads
12

Final Report
isa- UKintelligent speed adaptation
isa- UKintelligent speed adaptation
0
5
10
15
20
25
30
35
40
45
<5 5-10
10-15
15-20
20-25
25-30
30-35
35-40
40-45
45-50
50-55
55-60
60-65
65-70
70-75
75-80
80-85
85-90
90-95
>95
Vehicle Speed (mph)
Trav
el D
ista
nce
(%)
Phase 1 Phase 2 Phase 3
Figure 14: Speed distribution by phase on 70 mph roads
The use of an overridable ISA system also provided an opportunity to examine where drivers were willing to accept the control of the ISA system and where they chose to override it. ISA was overridden most often on 70 mph roads (see Figure 15).
02468
1012141618
20 mph 30 mph 40 mph 50 mph 60 mph 70 mph
Dis
tanc
e tr
avel
led
(%)
Figure 15: Proportion of distance travelled with ISA when the system was overridden
Overriding behaviour can also be examined by driver group. In general, young drivers overrode more than older drivers, males more than females and intenders to speed more than non-intenders and the private motorists slightly more than the fleet drivers (see Figure 16).
13

Final Report
isa- UKintelligent speed adaptation
isa- UKintelligent speed adaptation
0
2
4
6
8
10
12
Male Female Young Old Intender Non-intender
Private Fleet
Gender Age Intention to speed Driver type
Dis
tanc
e tr
avel
led
(%)
Figure 16: Comparison of overall overriding behaviour across driver groups
0
5
10
15
20
25
Male Female Young Old Intender Non-intender
Private Fleet
Gender Age Intention to speed Driver type
Dis
tanc
e tr
avel
led
(%)
30mph 70mph
Figure 17: Comparison of overriding behaviour on 30 and 70 mph roads across driver groups
Figure 17 examines the extent of overriding of the ISA system on 30 mph roads which are typical of urban areas and on 70 mph roads which are generally inter-city dual carriageways (often motorways). It can be seen that the patterns by gender and age are the same for the two road categories. However, intenders and non-intenders had similar behaviour on urban roads but behaved differently on 70 mph roads. There was a notable difference in behaviour between the private motorists and the fleet drivers: private motorists overrode more frequently than fleet drivers on urban roads, while fleet drivers overrode more frequently than private motorists on 70 mph roads. This implies that the need to comply with the speed limits on urban roads may have been instilled in the fleet drivers, but those same drivers might have felt little compunction about speeding on motorways.
14

Final Report
isa- UKintelligent speed adaptation
isa- UKintelligent speed adaptation
The results indicate there was a tendency for those who might benefit most (males, young, speed intenders) to use it least. Although not explored as part of this project, one possible way to overcome this tendency may be through incentives to keep ISA active and discourage overriding when ISA is deployed on a voluntary or fleet basis. Nevertheless, even without incentives ISA led to increased speed compliance among all groups. It also contributed to diminished negative driving behaviour across all groups, as revealed by the observation drives.
3.3.2 Driver attitudes
3.3.2.1 Predicting speeding behaviour with the Theory of Planned Behaviour Prior to experience with the ISA system, the attitudes of the participants were assessed using the Theory of Planned Behaviour (TPB; Ajzen, 1991) as a model. In contrast to much of the TPB work in the driving domain which is limited to looking at intention, here the relationship between cognitions (attitudinal variables) and actual behaviour was assessed. Under the TPB, intentions and perceived behavioural control (PBC) are held to be the direct antecedents of behaviour. Intentions reflect the cognitive representation of an individual’s readiness to perform a given behaviour. PBC describes the individual’s perception of the ease or difficulty of performing any given behaviour. The model also states that intentions are influenced by three factors. Attitudes, subjective norms and PBC are direct determinants of intentions:
• Attitudes towards a behaviour reflect the degree of positive or negative evaluation the individual has towards performing the behaviour. Attitudes are regarded as beliefs about the likely outcomes of the behaviour multiplied by the individual’s evaluations of these outcomes.
• Subjective norms refer to the perceived social pressure to engage or not engage in a behaviour. These are understood to be the sum of normative beliefs concerning what salient referents believe about the individual enacting the behaviour, multiplied by the individual’s motivation to comply with this group.
• PBC again reflects the perceived ease or difficulty of undertaking a given behaviour. An individual’s perception of control is assumed to be the product of the individual’s evaluation of factors likely to facilitate/inhibit the performance of a behaviour and the frequency of their occurrence. These control beliefs can be both internal and external in their nature.
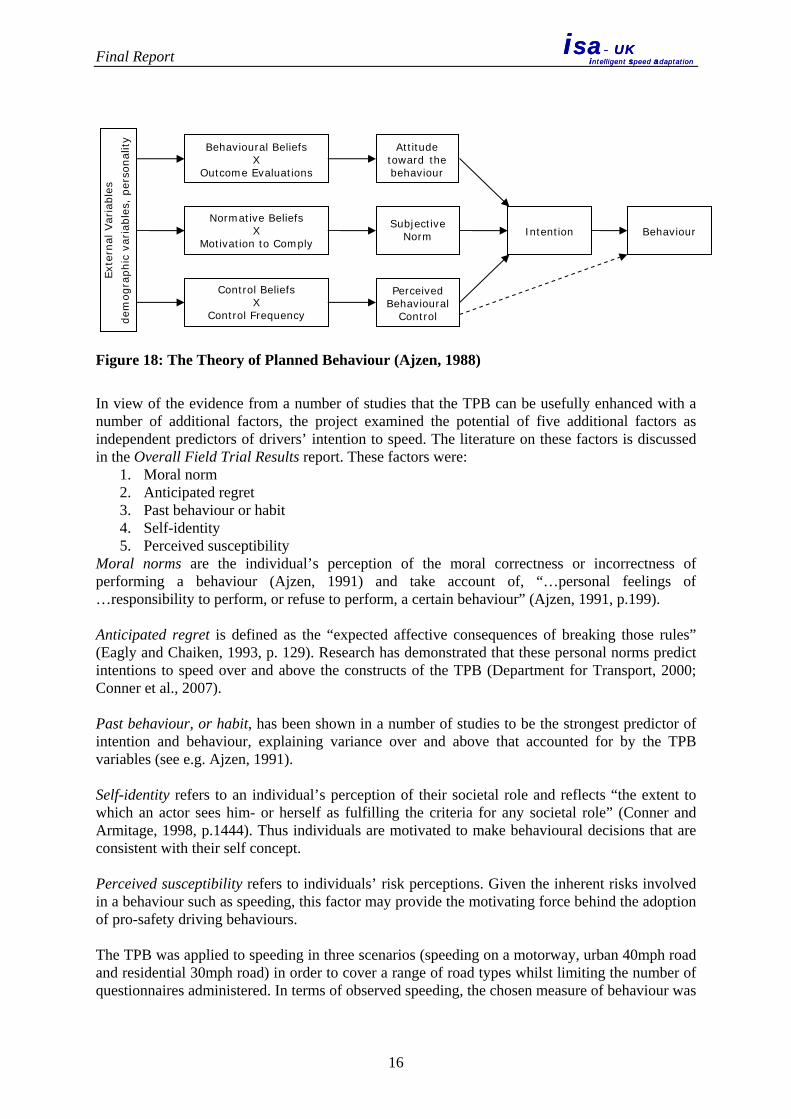
As the relative importance of intentions and PBC in predicting behaviour can differ across behaviours and populations, so too can the importance of attitudes, subjective norms and PBC in the prediction of intentions. Figure 18 provides a schematic representation of the TPB.
15
Final Report
isa- UKintelligent speed adaptation
isa- UKintelligent speed adaptation
Normative Beliefs X
Motivation to Comply
Control Beliefs X
Control Frequency
Behavioural Beliefs X
Outcome Evaluations
Intention
Attitude toward the behaviour
Perceived Behavioural
Control
Subjective Norm
Behaviour
Exte
rnal
Var
iabl
es
dem
ogra
phic
var
iabl
es,
pers
onal
ity
Figure 18: The Theory of Planned Behaviour (Ajzen, 1988)
In view of the evidence from a number of studies that the TPB can be usefully enhanced with a number of additional factors, the project examined the potential of five additional factors as independent predictors of drivers’ intention to speed. The literature on these factors is discussed in the Overall Field Trial Results report. These factors were:
1. Moral norm 2. Anticipated regret 3. Past behaviour or habit 4. Self-identity 5. Perceived susceptibility
Moral norms are the individual’s perception of the moral correctness or incorrectness of performing a behaviour (Ajzen, 1991) and take account of, “…personal feelings of …responsibility to perform, or refuse to perform, a certain behaviour” (Ajzen, 1991, p.199). Anticipated regret is defined as the “expected affective consequences of breaking those rules” (Eagly and Chaiken, 1993, p. 129). Research has demonstrated that these personal norms predict intentions to speed over and above the constructs of the TPB (Department for Transport, 2000; Conner et al., 2007). Past behaviour, or habit, has been shown in a number of studies to be the strongest predictor of intention and behaviour, explaining variance over and above that accounted for by the TPB variables (see e.g. Ajzen, 1991). Self-identity refers to an individual’s perception of their societal role and reflects “the extent to which an actor sees him- or herself as fulfilling the criteria for any societal role” (Conner and Armitage, 1998, p.1444). Thus individuals are motivated to make behavioural decisions that are consistent with their self concept. Perceived susceptibility refers to individuals’ risk perceptions. Given the inherent risks involved in a behaviour such as speeding, this factor may provide the motivating force behind the adoption of pro-safety driving behaviours. The TPB was applied to speeding in three scenarios (speeding on a motorway, urban 40mph road and residential 30mph road) in order to cover a range of road types whilst limiting the number of questionnaires administered. In terms of observed speeding, the chosen measure of behaviour was
16

Final Report
isa- UKintelligent speed adaptation
isa- UKintelligent speed adaptation
defined as the percentage of distance travelled during Phase 1 of the trial in which the driver exceeded the speed limit on three classes of road (70 mph, 40 mph and 30 mph roads). Examination of the correlations between the attitudinal predictors and the observed behaviour suggested that perceived susceptibility to an accident was the strongest correlate with behaviour (r = −0.39). Those who perceived speeding would increase the risk of an accident demonstrated a significantly weaker propensity to engage in the behaviour. Moral norm was the second most powerful predictor (r = −0.37). Participants displaying higher moral norms showed a significantly weaker propensity to speed than those expressing weaker moral norms. The propensity to speed was significantly stronger amongst participants who believed that the stated control factors facilitated exceeding the speed limit (r = 0.36). Past behaviour was the fourth most powerful correlate (r = 0.36). Participants who had frequently engaged in speeding in the past were significantly more likely to do so in the future compared to those who had not. Although highly significant, intention was only the fifth strongest correlate such that those who intended to speed demonstrated a significantly stronger propensity to engage in this behaviour than those who did not (r = 0.33). Participants expressing favourable attitudes towards exceeding the speed limit were also significantly more likely to engage in speeding than those possessing less favourable attitudes (r = 0.30). Similarly those believing that more positive outcomes would result from speeding also demonstrated a greater propensity to speed (r = 0.23). Thus the detailed analysis of individual beliefs identified a number of beliefs amenable to change which distinguished those who intend to exceed the speed limit and those who do not. Given evidence of multicollinearity, it was not possible to test a full TPB model. Hence the predictive utility of the simple TPB was tested. Intentions were found to reliably predict participants’ propensity to speed, explaining 11% of the variance. However, perceived behavioural control (PBC, i.e. how much control participants felt they had over the behaviour) did not have an effect on either intentions or behaviour. This suggests that speeding is to a large extent under an individual’s volitional control. However, it should be noted that other studies have found an effect of PBC. 3.3.2.2 The impact of experience with ISA on attitudes Given speculation in the literature that experience or habit can alter attitudes, it was expected that experience with the ISA system would affect the participants’ intention to speed and some of the predictors of that intention. Cognitions were investigated at three time points during the trial:
Time 1: prior to initial vehicle handover Time 2: on completion of Phase 2, i.e. at the end of month 5 Time 3: on completion of Phase 3, i.e. at the end of month 6
Figure 19 shows the change over time for intention to speed. There was a significant effect of time, with the lowest intention after ISA was withdrawn.
17
Final Report
isa- UKintelligent speed adaptation
isa- UKintelligent speed adaptation
-3
-2
-1
0
1
2
3M
ean
Ratin
gTime 1Time 2Time 3
-3
-2
-1
0
1
2
3M
ean
Ratin
gTime 1Time 2Time 3
Figure 19: Mean intention to speed over time
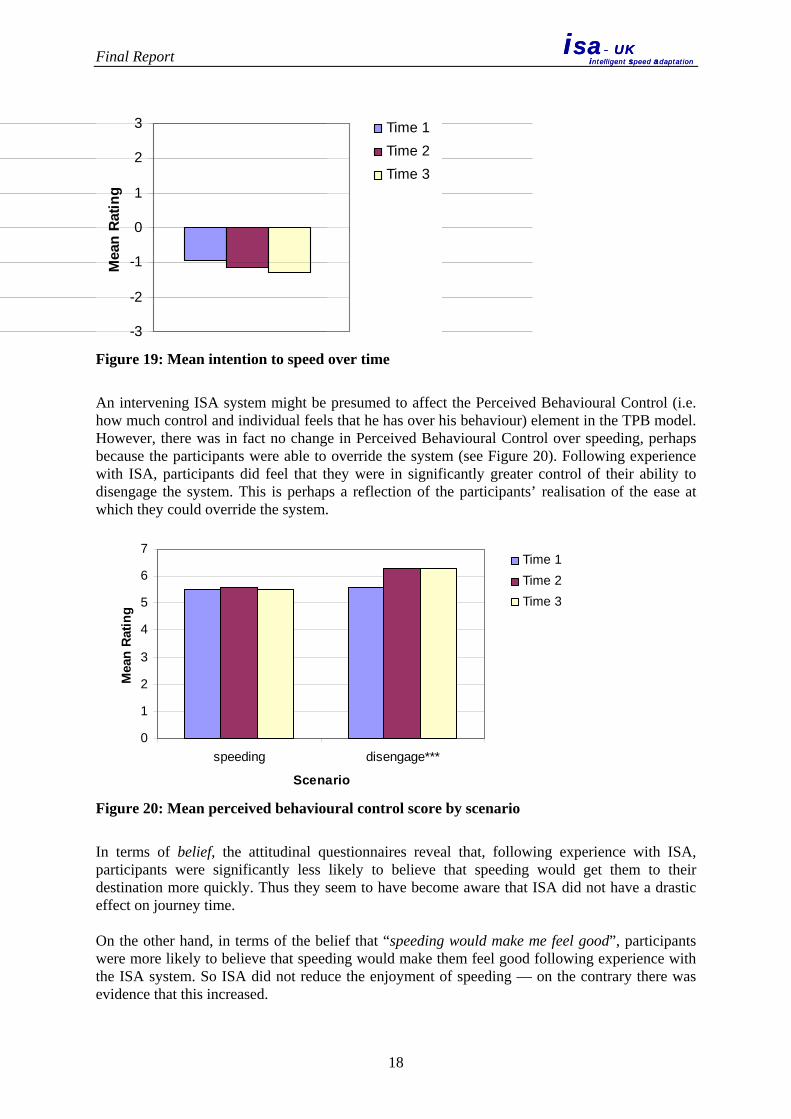
An intervening ISA system might be presumed to affect the Perceived Behavioural Control (i.e. how much control and individual feels that he has over his behaviour) element in the TPB model. However, there was in fact no change in Perceived Behavioural Control over speeding, perhaps because the participants were able to override the system (see Figure 20). Following experience with ISA, participants did feel that they were in significantly greater control of their ability to disengage the system. This is perhaps a reflection of the participants’ realisation of the ease at which they could override the system.
0
1
2
3
4
5
6
7
speeding disengage***
Scenario
Mea
n R
atin
g
Time 1Time 2Time 3
Figure 20: Mean perceived behavioural control score by scenario
In terms of belief, the attitudinal questionnaires reveal that, following experience with ISA, participants were significantly less likely to believe that speeding would get them to their destination more quickly. Thus they seem to have become aware that ISA did not have a drastic effect on journey time. On the other hand, in terms of the belief that “speeding would make me feel good”, participants were more likely to believe that speeding would make them feel good following experience with the ISA system. So ISA did not reduce the enjoyment of speeding — on the contrary there was evidence that this increased.
18

Final Report
isa- UKintelligent speed adaptation
isa- UKintelligent speed adaptation
3.3.2.3 The impact of ISA on acceptance, workload and self-reported behaviour In order to determine changes in acceptability, attitudes towards the ISA system and workload experienced when driving with ISA, questionnaires were administered at four time points:
Time 1: at initial vehicle handover, Time 2: following one month of ISA control, Time 3: following four months of ISA control, and Time 4: following a one-month return to non-ISA-controlled driving.
The Driver Behaviour Questionnaire (DBQ; Parker et al., 1995) was used to ascertain the frequency with which individuals committed various types of errors and violations when driving, identifying three distinct types of aberrant driving behaviours — errors, lapses and violations. Participants were presented with 24 aberrant driving behaviours and asked to rate how often they have committed these (0 = never, 1 = hardly ever, 2 = occasionally, 3 = quite often, 4 = frequently, 5 = nearly all the time). This questionnaire, administered at the four time points, provided a self-reported measure of changes in driving behaviour over the six month trial period. The results are shown in Figure 21. All the types of aberrant behaviour declined over time and continued to decline after ISA was removed. Thus experience with ISA apparently reduced all error types, including the most serious.
0
1
2
3
4
5
time 1 time 2 time 3 time 4
Time Point
Mea
n Sc
ore
errorslapsesviolations
Figure 21: Mean error, lapse and violation score on DBQ over time
Driver acceptance of the ISA system was assessed using an acceptability scale developed by Van de Laan et al. (1997) which measures the two dimensions of usefulness and satisfaction. The overall results are shown in Figure 22. There were no significant changes over time in usefulness, but there are indications that initial experience with the system decreased participants’ appreciation of the usefulness of ISA as compared with their preconception. However, this appreciation increased with prolonged experience and continued at a high level even when the system was removed. Female participants rated the ISA system as more useful than male participants. Speed intenders rated the ISA system as significantly less useful than non-intenders. Ratings of satisfaction generally improved over time. The ratings suggests that satisfaction dipped following early exposure to the system, but that it subsequently rose steadily and was highest
19
Final Report
isa- UKintelligent speed adaptation
isa- UKintelligent speed adaptation
after the removal of ISA support. Speed intenders rated the ISA system as significantly less satisfying than did non-intenders.
-2
-1
0
1
2
Time 1 Time 2 Time 3 Time 4
Mea
n Sc
ore
UsefulnessSatisfaction
Figure 22: Acceptability ratings for the dimensions of “usefulness” and “satisfaction” over
time
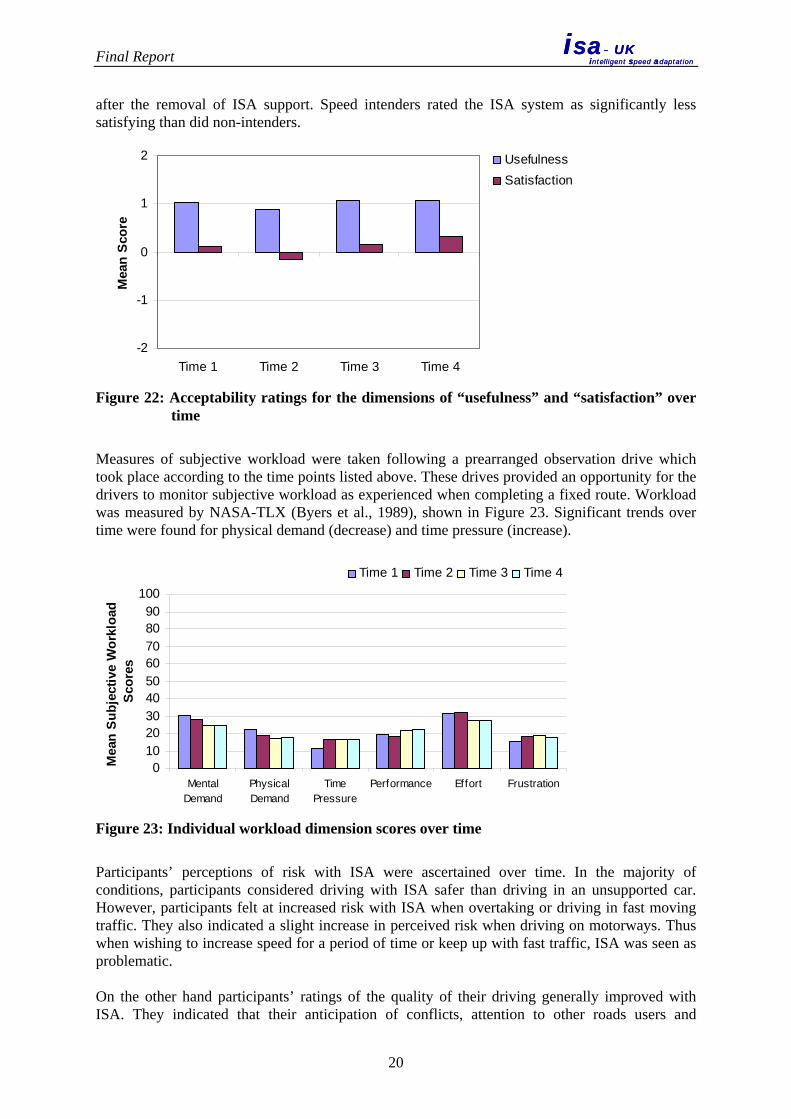
Measures of subjective workload were taken following a prearranged observation drive which took place according to the time points listed above. These drives provided an opportunity for the drivers to monitor subjective workload as experienced when completing a fixed route. Workload was measured by NASA-TLX (Byers et al., 1989), shown in Figure 23. Significant trends over time were found for physical demand (decrease) and time pressure (increase).
0102030405060708090
100
MentalDemand
PhysicalDemand
TimePressure
Performance Effort Frustration
Mea
n Su
bjec
tive
Wor
kloa
d Sc
ores
Time 1 Time 2 Time 3 Time 4
Figure 23: Individual workload dimension scores over time
Participants’ perceptions of risk with ISA were ascertained over time. In the majority of conditions, participants considered driving with ISA safer than driving in an unsupported car. However, participants felt at increased risk with ISA when overtaking or driving in fast moving traffic. They also indicated a slight increase in perceived risk when driving on motorways. Thus when wishing to increase speed for a period of time or keep up with fast traffic, ISA was seen as problematic. On the other hand participants’ ratings of the quality of their driving generally improved with ISA. They indicated that their anticipation of conflicts, attention to other roads users and
20

Final Report
isa- UKintelligent speed adaptation
isa- UKintelligent speed adaptation
pedestrians increased whilst driving with ISA compared to unsupported driving. Unsurprisingly, participants’ awareness of speed limits also increased when driving with ISA. In terms of attitudes to the introduction of ISA more widely, 54% of participants indicated that they would be willing to have ISA installed in their vehicles if its use was voluntary. Participants’ willingness to pay for the system ranged from paying nothing to £500. The average participants would be willing to pay was £111. Sixty-two percent of participants approved of requiring the fitment of ISA on all new vehicles and 56% approved of compulsory usage of ISA by all drivers.
3.3.3 Observed drives
In each trial, observed drives were conducted along a specific route at certain points during the participants’ experience with the car. These points were as follows:
Observation 1 (OB1): this took place at the end of Phase 1. As Phase 1 refers to no ISA intervention, OB1 served as baseline for comparison across the four Observation Drives. Observation 2 (OB2): this took place at the end of the first month of Phase 2, when participants had one month experience on the ISA system. Observation 3 (OB3): this took place at the end of Phase 2, when participants had experienced the ISA system over 4 months. Observation 4 (OB4): this took place at the end of Phase 3, when participants had driven for a month without ISA intervention following their ISA experience.
The routes selected in both the Leeds and Leicestershire trial areas encompassed a variety of roads and speed limits; all speed limits except 20 mph were included. The recording technique used for the observation drives was adapted from the Wiener Fahrprobe (“Vienna driving test”; Risser, 1985). The Wiener Fahrprobe coding forms record a wide variety of driver behaviour, either positive or negative, across different road geometry layouts such as links and junctions. These drives have only been analysed within trials, since the route was not the same across all four trials. Here the findings from Trial 1 are used as an illustration. Figure 24 illustrates mean Wiener Fahrprobe scores across the four Observation Drives, which shows a significant drop in the number of observed negative behaviour from OB1 to OB2, a further slight drop from OB2 to OB3, then an increase from OB3 to OB4. The ANOVA test results presented in Table 3 reveal that the Wiener Fahrprobe scores recorded when ISA was turned on (i.e. OB2 and OB3) were reliably lower than when ISA was turned off.
21

Final Report
isa- UKintelligent speed adaptation
isa- UKintelligent speed adaptation
0
5
10
15
20
25
OB1 OB2 OB3 OB4
Mea
n W
iene
r Fah
rpro
be s
core
Figure 24: Mean Wiener Fahrprobe score across trial phases
Table 3: Results of ANOVA and post-hoc t-test of Wiener Fahrprobe score across trial phases
OB1 OB2 OB3 OB4 Repeated measures ANOVA
F statistic p value Post-hoc t-test
Mean (SD)
22.85 (23.74)
4.50 (3.42)
3.65 (2.99)
8.70 (7.93)
F(3,57) = 11.49 < 0.0005**
OB2 OB3 OB4 OB1 ∗∗ ∗∗ ∗∗OB2 ∗OB3 ∗
Note: 1. * denotes the mean difference is significant at the 0.05 level 2. ** denotes the mean difference is significant at the 0.01 level
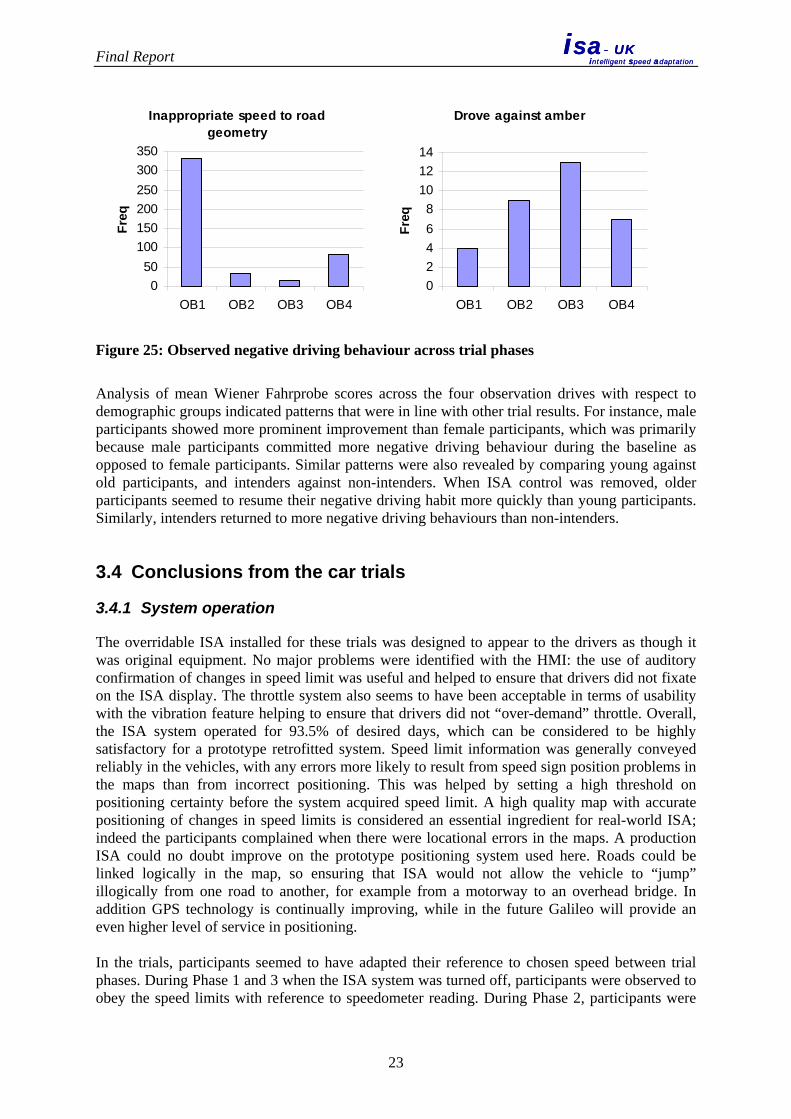
3. denotes the mean difference is not significant. Figure 25 shows two negative behaviours recorded on the Wiener Fahrprobe forms, in which the bars stand for total frequency of the negative behaviour observed from all participants rather than mean values. As indicated by the left half of the figure, participants showed considerable improvement in inappropriate choice of speed in response to road geometry when ISA was turned on. In contrast, the right half of the figure suggests negative implications of introducing ISA. The trend of changes across the four drives corresponds to the trend revealed by the graph comparing travel time in Figure 25, which suggests that participants might have tried to compensate for their loss in travel time by jumping amber lights.
22
Final Report
isa- UKintelligent speed adaptation
isa- UKintelligent speed adaptation
Inappropriate speed to road geometry
050
100150200250300350
OB1 OB2 OB3 OB4
Freq
Drove against amber
02468
101214
OB1 OB2 OB3 OB4
Freq
Figure 25: Observed negative driving behaviour across trial phases
Analysis of mean Wiener Fahrprobe scores across the four observation drives with respect to demographic groups indicated patterns that were in line with other trial results. For instance, male participants showed more prominent improvement than female participants, which was primarily because male participants committed more negative driving behaviour during the baseline as opposed to female participants. Similar patterns were also revealed by comparing young against old participants, and intenders against non-intenders. When ISA control was removed, older participants seemed to resume their negative driving habit more quickly than young participants. Similarly, intenders returned to more negative driving behaviours than non-intenders.
3.4 Conclusions from the car trials
3.4.1 System operation
The overridable ISA installed for these trials was designed to appear to the drivers as though it was original equipment. No major problems were identified with the HMI: the use of auditory confirmation of changes in speed limit was useful and helped to ensure that drivers did not fixate on the ISA display. The throttle system also seems to have been acceptable in terms of usability with the vibration feature helping to ensure that drivers did not “over-demand” throttle. Overall, the ISA system operated for 93.5% of desired days, which can be considered to be highly satisfactory for a prototype retrofitted system. Speed limit information was generally conveyed reliably in the vehicles, with any errors more likely to result from speed sign position problems in the maps than from incorrect positioning. This was helped by setting a high threshold on positioning certainty before the system acquired speed limit. A high quality map with accurate positioning of changes in speed limits is considered an essential ingredient for real-world ISA; indeed the participants complained when there were locational errors in the maps. A production ISA could no doubt improve on the prototype positioning system used here. Roads could be linked logically in the map, so ensuring that ISA would not allow the vehicle to “jump” illogically from one road to another, for example from a motorway to an overhead bridge. In addition GPS technology is continually improving, while in the future Galileo will provide an even higher level of service in positioning. In the trials, participants seemed to have adapted their reference to chosen speed between trial phases. During Phase 1 and 3 when the ISA system was turned off, participants were observed to obey the speed limits with reference to speedometer reading. During Phase 2, participants were
23

Final Report
isa- UKintelligent speed adaptation
isa- UKintelligent speed adaptation
observed to rely on the ISA system (i.e. accelerator vibration) instead of the speedometer reading. This phenomenon was noted during the observation drives and confirmed by the analysis of the speed profiles. This has implications for the design of ISA and the calibration of speedometers, because speedometers tend to read high but the ISA system used true speed based on GPS data. The ISA system implemented here did not restrict vehicle speed to posted speed limits (i.e. the speed limits provided by the digital maps) with absolute precision. The throttle control permitted vehicle speed to go somewhat over the speed limit, due to lag in the ISA system response to driver throttle demand. If drivers relied on the system to keep them within the speed limit, they might actually be above the limit. This would need to be considered in deployment of any real-world ISA.
3.4.2 Behavioural changes
The ISA system was observed to have a distinctive effect in terms of transforming the speed distribution across all speed zones except the 60 mph zones. Speeds over the speed limit and in particular very high exceeding of the limit was curtailed. On the 60 mph roads, speeding behaviour was already rare in the pre period (the first month), so it is not surprising that there was little change with ISA. The lack of speeding in these roads can be attributed to a combination of traffic and road geometry conditions, and is in line with national data. When ISA was switched on, a large proportion of the speed distribution initially spread over the speed limit was shifted to around or below the speed limit. Analysis of various statistics related to speed (mean, 85th percentile, etc.) revealed a ‘V’ shape across trial phases, i.e. the statistic went down from Phase 1 to Phase 2, then up from Phase 2 to Phase 3. This pattern is especially prominent with respect to high percentiles of the speed distribution, which are strong indicators of speeding behaviour. ISA not only diminished excessive speeding, but also led to a reduction in speed variation as well as in jerk occurrence, all with positive implications for road accident reduction and improved traffic flow. The use of an overridable ISA system also provided an opportunity to investigate potential resistance from the driving population to its implementation, based on observed behaviour instead of opinion. ISA was overridden the most on motorways, followed by built-up areas (20 and 30 mph zones). Urban environments are where drivers are most likely to encounter conflicts with vulnerable road users. Thus there was some tendency for ISA to be overridden on roads where it was perhaps needed most. In term of sub-groups within the driving population, male drivers and young drivers overrode the system more than their counterparts regardless of speed zones. Given that these two groups of drivers also drove faster and had a higher percentage of distance travelled over the speed limit than their counterparts, there is a pronounced tendency for ISA to be overridden by those drivers who in safety terms stand to benefit most from using it. It was also found that speed intenders overrode the system more frequently than non-intenders on motorways, and that private motorists were more likely to override in built-up areas while fleet drivers more frequently overrode on motorways. These findings suggest that there could be a role for incentives to enhance compliance with overridable ISA.
3.4.3 Attitudinal changes
Unfortunately evidence of multicollinearity (inter-correlation of independent variables) made it impossible to test an extended model of the TPB. Nevertheless, the analysis found support for the use of the TPB in predicting intentions and behaviour with regard to exceeding the speed limit. Although PBC did not independently predict speeding behaviour an intention-behaviour relationship of 0.37 was observed. Analysis of individual beliefs also successfully identified a number of beliefs amenable to change which distinguished those who intend to exceed the speed limit and those who do not.
24

Final Report
isa- UKintelligent speed adaptation
isa- UKintelligent speed adaptation
Findings relating to the impact of ISA suggested that an overridable intervening ISA significantly reduced the percentage of distance travelled whilst exceeding the speed limit. Although, when active, ISA served to significantly reduce speeding behaviour, failure to elicit a sustained change in behaviour when the system was removed suggested that the ISA intervention was unable to establish a new compliant habit. Despite this, there was encouraging evidence that the implementation of ISA could serve to change participants’ intentions to speed. Any successful implementation of ISA will ultimately rely upon the attitude of the general public. The current analysis indicated that long-term experience with an ISA system increases acceptability. Despite an initial dip in acceptability, the rating of the ISA system in terms of usefulness and satisfaction, improved over time. Participants tended to feel at increased risk and more frustrated in those situations (e.g. on a motorway, in fast moving and light traffic) which afforded the greatest opportunity to speed. Overtaking was also raised as a concern. Nevertheless, in the majority of driving situations, participants did feel that risk was reduced when driving with ISA compared to unsupported driving and experienced less frustration. Similarly participants believed that attention to the speed limits and to potential hazards (e.g. other road users, pedestrians) and conflicts had increased. Support for the implementation of ISA was also reasonably strong, with 56% of participants approving of compulsory fitting of ISA to all new vehicles. The project extended previous research in its examination of influence of age, sex and intention to speed. Intention to speed was the most consistent moderator of acceptability such that those expressing strong intentions to speed demonstrated the most resistance to ISA. Given that the evidence would suggest that the voluntary implementation of ISA may fail to target those who are most in need of the system, implementation of an ISA system may have more potential if high risk groups are specifically targeted. Nevertheless, the findings of the ISA-UK project provide useful information regarding the perceived benefits and drawbacks associated with driving an ISA vehicle; beliefs that could successfully form the basis of a structured implementation campaign. Indeed, there is evidence from other research on ISA to suggest that emphasising and strengthening beliefs relating to the secondary safety benefits of ISA could prove more persuasive than focussing upon ISA’s potential to reduce speeds and consequently deaths on our roads. In a Dutch study, Marchau, Heijden and Molin (2005) investigated individuals’ evaluation of ISA in terms of its overall safety benefits and the conditions under which they were willing to accept the concept. A set of 1489 households were contacted and 442 questionnaires were returned. When asked about the effects of ISA on policy goals and their relative importance, the results were somewhat at odds. Where ISA was expected to contribute to achieving a policy sub goal, the importance of this sub goal was rated as low and vice versa. Reducing traffic accidents and the propensity to speed were seen as the most important sub goals of ISA and fewer infrastructure barriers in the form of road humps and other devices, more steady traffic flows and lower probabilities of incurring penalties were rated as less important. However only 58% of respondents strongly agreed that ISA would contribute to achieving lower accident numbers. Similarly, lowering the probability of penalties was not seen as a particularly important goal (31%) but 55% agreed that ISA was likely to contribute to this. The ISA-UK drivers felt at increased risk of an accident when driving with ISA. Whilst this may reflect a natural response to inappropriate braking (which could occur when a change to a lower speed limit was in the wrong location), this would also tend to suggest that participants failed to appreciate the effect of reduced speed on their accident risk. Although it is undoubtedly important
25

Final Report
isa- UKintelligent speed adaptation
isa- UKintelligent speed adaptation
to continually impress the link between speed and accidents, more success may be gained by emphasising benefits associated with ISA that the public can readily perceive and accept. Both the Dutch trial in Tilburg and the large-scale Swedish trials effectively used information and communication to promote their work. For example, Besseling and van Boxtel (2001) noted information and communication about ISA had a relatively large effect on attitudes and acceptance, reporting that a short intensive effort lifted the level of positive attitudes from 55% to 80%.
26

Final Report
isa- UKintelligent speed adaptation
isa- UKintelligent speed adaptation
4. TRUCK TRIAL
4.1 Objectives
The objectives of this part of the project work were: • To design, build and install an Intelligent Speed Adaptation (ISA) system that was
suitable for use in a truck environment • To test the design both off- and on-road prior to delivery of the vehicle for real-world use • To operate the vehicle successfully in a commercial situation • To collect and analyse data on driver attitudes to and behaviour with the modified vehicle
The development of the ISA system to be implemented on the ISA truck was based on the fundamental system architecture of the passenger car system, with the following considerations given to a truck environment:
• It should be developed using technology developed for the ISA passenger car trial. • The selected vehicle should have a retarding function in addition to the primary friction
braking system, enabling the application of gentle braking. This was in order to help ensure compliance with the speed limits particularly on downhill gradients.
• The system should be sufficiently robust to endure the typical environmental conditions found in a truck.
• The system should be constructed and fitted in such a way that the ISA system interface provided minimal intrusion in into the driver’s environment of the vehicle (e.g. layout of ISA display and buttons) and that it could be removed easily and the truck returned to its original condition at the end of the trial.
4.2 Method
4.2.1 Modifications to the vehicle
4.2.1.1 Selected vehicle The 7.5 tonne MAN TGL 180 commercial vehicle was selected for the ISA truck trial. It had the advantage of having a CAN bus, an electronic throttle and a user configurable cruise control as part of the base vehicle design. Figure 26 shows the vehicle that was used for the ISA trials.
27

Final Report
isa- UKintelligent speed adaptation
isa- UKintelligent speed adaptation
Figure 26: The MAN TGL 180
4.2.1.2 ISA system for the truck The selected approach to modifying the vehicle was to interface the additional ISA control system to the built-in upper speed limit control on the truck. This required additional development of both software and hardware of the ISA car system to accommodate the environment and control architecture of the MAN TGL truck. The architecture developed for the trial used the same Location and Interpretation modules as the car trials. There were four sub-systems that made up the truck system:
• The Navteq Sensor Box, the LOCATION sub-system, which provided the vehicle’s geographic location (coordinates) to the Navigation Computer
• The Navigation Computer, the INTERPRETATION sub-system, which identified the appropriate speed limit for the vehicle’s location
• The ISA Command Unit, the COMMAND sub-system, which compared the vehicle speed with the applicable speed limit and determines the appropriate response required
• The ISA Speed Limit Control Switch Interface (SLSI), the CONTROL sub-system, which physically implemented the intervention in order to control the vehicle speed
As in the ISA cars, location and interpretation applied the GPS signal and Dead Reckoning (DR) technology to determine the vehicle’s position and the speed limit. The ISA system’s control function made use of the MAN TGL truck’s factory-fitted cruise control system. The truck’s cruise control was a user-configurable system and was accessible via a stalk on the steering column as shown in Figure 27.
28

Final Report
isa- UKintelligent speed adaptation
isa- UKintelligent speed adaptation
Figure 27: MAN TGL cruise control column stalk
Similar to other vehicle manufacturers’ cruise control systems, the MAN’s cruise control accelerates or decelerates the truck according to the speed set by the driver. When deceleration was needed, the cruise control used engine braking in addition to reducing throttle output. The ISA system was linked to the truck’s cruise control interface and utilised the speed reduction function of the cruise control system, i.e. the ISA system set the desired cruising speed at the appropriate speed limit rather than this being done by driver input. The ISA system continuously monitored the vehicle speed. Until the truck’s speed reached the speed limit, the cruise control remained off. When the truck’s speed exceeded the speed limit, the cruise control was turned on by the ISA system which set the desired cruising speed at the speed limit. Once the truck’s speed was reduced to the speed limit (i.e. the cruising speed set by the ISA system), the ISA system turned the cruise control off until the truck’s speed was above the speed limit again. The iteration of speed control mechanism in the ISA truck is illustrated in Figure 28.
Figure 28: The process of speed control mechanism in the ISA truck
The HMI used in the ISA truck was similar to that implemented in the ISA passenger cars. There was an opt-out button and an emergency disable button located in the central console. The speed limit was shown on a LCD display and changes of speed limit were accompanied by an auditory beep. The layouts of the ISA truck HMI are shown in Figure 29. In addition, opt-out could also be initiated by the kick-through function implemented on the acceleration pedal.
The ISA system determines if the vehicle speed is above
the speed limit?
Speed limit from Navigation computer
Vehicle speed from tachometer
Cruise Control ON
Reduce throttle output & a
Yespply en
Cruise Control OFF
gine brake
No
29

Final Report
isa- UKintelligent speed adaptation
isa- UKintelligent speed adaptation
EmergencyDisable
Figure 29: HMI in the ISA truck
However, there were aspects of the ISA truck HMI which were different from the ISA car HMI. For example, the accelerator pedal did not vibrate. This was because most commercial vehicle drivers wear safety boots with thick soles and it would therefore be unlikely for the driver to feel vibration through the pedal. However, there were no technical difficulties that prevented the addition of this feature. In addition, engine braking was used instead of the service brake in the ISA truck. This design decision was taken as the braking system on the truck had a more aggressive initial retardation force than the system on the ISA passenger cars. It was considered that utilising engine braking alone would provide a smoother speed reduction and be more effective than using the service brakes which might be perceived to be jerky and uncomfortable. Because the vehicle’s service brake was not used, when the ISA system slowed the truck down, the brake pedal was not pushed down. Furthermore, experience learned from the passenger cars trials suggested that an “Opt In” function was not necessary, as the ISA system designed in this project was switching on by default upon ignition. If the driver opted out during the trip, the ISA system would reinstate itself as soon as the vehicle speed fell below the speed limit. In a similar manner to the ISA car, the truck’s Command Unit monitored the state of the vehicle, including parameters such as the vehicle location, vehicle speed, throttle position and brake application etc. The ISA truck also used GSM network to deliver SMS (Short Message Service) messages back to the ISA trial data centre upon the ignition being turned off. It is worth noting that data collected was used for analysis in this project, and that data collection capability would not be an essential part of a production ISA system. Due to the weight classification of the truck, the speed limits incorporated in the digital speed limit map for cars needed adjustment in line with Table 4. On a single carriageway road with the national speed limit, for example, a truck of this type is not permitted to exceed 50 mph while a car can travel at up to 60 mph.
30
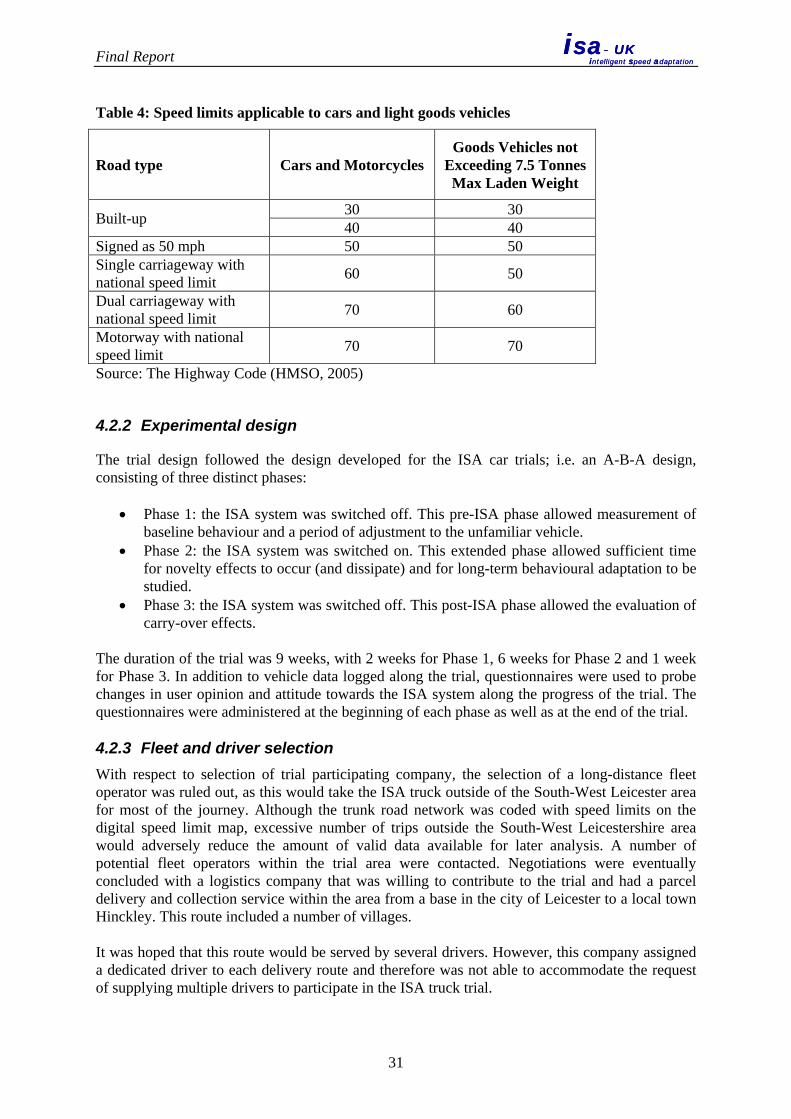
Final Report
isa- UKintelligent speed adaptation
isa- UKintelligent speed adaptation
Table 4: Speed limits applicable to cars and light goods vehicles
Road type Cars and Motorcycles Goods Vehicles not
Exceeding 7.5 Tonnes Max Laden Weight
Built-up 30 30 40 40
Signed as 50 mph 50 50 Single carriageway with national speed limit 60 50
Dual carriageway with national speed limit 70 60
Motorway with national speed limit 70 70
Source: The Highway Code (HMSO, 2005)
4.2.2 Experimental design
The trial design followed the design developed for the ISA car trials; i.e. an A-B-A design, consisting of three distinct phases:
• Phase 1: the ISA system was switched off. This pre-ISA phase allowed measurement of baseline behaviour and a period of adjustment to the unfamiliar vehicle.
• Phase 2: the ISA system was switched on. This extended phase allowed sufficient time for novelty effects to occur (and dissipate) and for long-term behavioural adaptation to be studied.
• Phase 3: the ISA system was switched off. This post-ISA phase allowed the evaluation of carry-over effects.
The duration of the trial was 9 weeks, with 2 weeks for Phase 1, 6 weeks for Phase 2 and 1 week for Phase 3. In addition to vehicle data logged along the trial, questionnaires were used to probe changes in user opinion and attitude towards the ISA system along the progress of the trial. The questionnaires were administered at the beginning of each phase as well as at the end of the trial. 4.2.3 Fleet and driver selection With respect to selection of trial participating company, the selection of a long-distance fleet operator was ruled out, as this would take the ISA truck outside of the South-West Leicester area for most of the journey. Although the trunk road network was coded with speed limits on the digital speed limit map, excessive number of trips outside the South-West Leicestershire area would adversely reduce the amount of valid data available for later analysis. A number of potential fleet operators within the trial area were contacted. Negotiations were eventually concluded with a logistics company that was willing to contribute to the trial and had a parcel delivery and collection service within the area from a base in the city of Leicester to a local town Hinckley. This route included a number of villages.
It was hoped that this route would be served by several drivers. However, this company assigned a dedicated driver to each delivery route and therefore was not able to accommodate the request of supplying multiple drivers to participate in the ISA truck trial.
31

Final Report
isa- UKintelligent speed adaptation
isa- UKintelligent speed adaptation
4.3 Results
4.3.1 Driver behaviour Following data processing and reduction, the final data file ready for analysis represents a total travel distance of 6,787 kilometres. A breakdown of vehicle kilometres with respect to speed zones is illustrated in Figure 30, which shows that no trips were made on 20 or 70 mph roads. The largest portion of vehicle kilometres was attributable to 50 mph zones (i.e. rural single carriageways), followed by 30 mph zones (i.e. built-up areas). This distribution reflects the trip patterns of a delivery lorry operated within a rural region; i.e. travelling between towns and villages.
50mph3,959km
58%
60mph1km0%
40mph958km14%
30mph1,870km
28%
Figure 30: Distribution of total vehicle kilometres with respect to speed zones
Table 5 provides a further breakdown of the proportion of vehicle kilometres within individual trial phases, which suggests that the contribution of each of the speed zones to the total vehicle kilometres remains a very similar pattern across trial phases. It is worth noting that the total vehicle kilometres accumulated in 60 mph zones was only 0.6 km across trial phases (i.e. the shaded cells in Table 5). Due to the absence of data representativeness, data collected from 60 mph roads are excluded from the analysis presented in the following sections.
Table 5: Vehicle kilometres across trial phases
Speed zone Vehicle Kilometres Distribution based on trial phase (%)
Phase 1 Phase 2 Phase 3 Phase 1 Phase 2 Phase 3
30 mph 514.0 1,152.2 203.9 26.9 27.7 28.9 40 mph 269.3 586.5 102.1 14.1 14.1 14.4 50 mph 1,130.5 2,427.6 400.5 59.1 58.3 56.7 60 mph 0.2 0.3 0.1 0.0 0.0 0.0
Sum 1,914.0 4,166.6 706.5 100.0 100.0 100.0
32
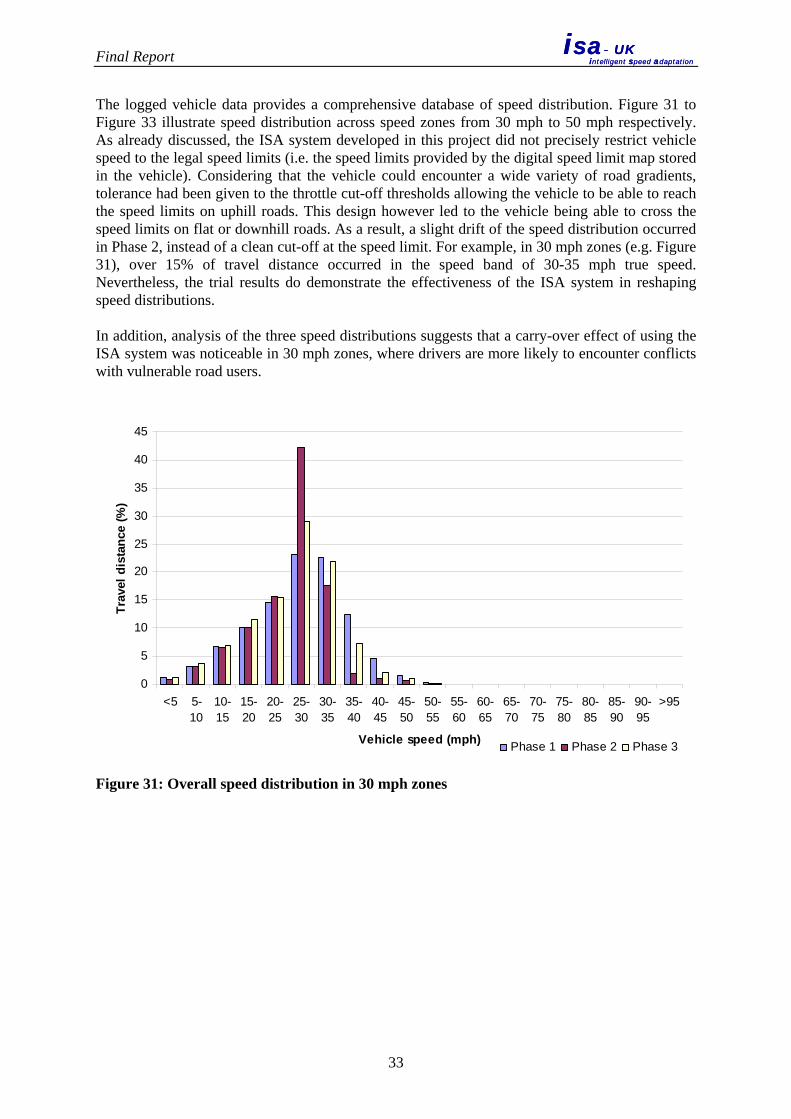
Final Report
isa- UKintelligent speed adaptation
isa- UKintelligent speed adaptation
The logged vehicle data provides a comprehensive database of speed distribution. Figure 31 to Figure 33 illustrate speed distribution across speed zones from 30 mph to 50 mph respectively. As already discussed, the ISA system developed in this project did not precisely restrict vehicle speed to the legal speed limits (i.e. the speed limits provided by the digital speed limit map stored in the vehicle). Considering that the vehicle could encounter a wide variety of road gradients, tolerance had been given to the throttle cut-off thresholds allowing the vehicle to be able to reach the speed limits on uphill roads. This design however led to the vehicle being able to cross the speed limits on flat or downhill roads. As a result, a slight drift of the speed distribution occurred in Phase 2, instead of a clean cut-off at the speed limit. For example, in 30 mph zones (e.g. Figure 31), over 15% of travel distance occurred in the speed band of 30-35 mph true speed. Nevertheless, the trial results do demonstrate the effectiveness of the ISA system in reshaping speed distributions. In addition, analysis of the three speed distributions suggests that a carry-over effect of using the ISA system was noticeable in 30 mph zones, where drivers are more likely to encounter conflicts with vulnerable road users.
0
5
10
15
20
25
30
35
40
45
<5 5-10
10-15
15-20
20-25
25-30
30-35
35-40
40-45
45-50
50-55
55-60
60-65
65-70
70-75
75-80
80-85
85-90
90-95
>95
Vehicle speed (mph)
Trav
el d
ista
nce
(%)
Phase 1 Phase 2 Phase 3
Figure 31: Overall speed distribution in 30 mph zones
33
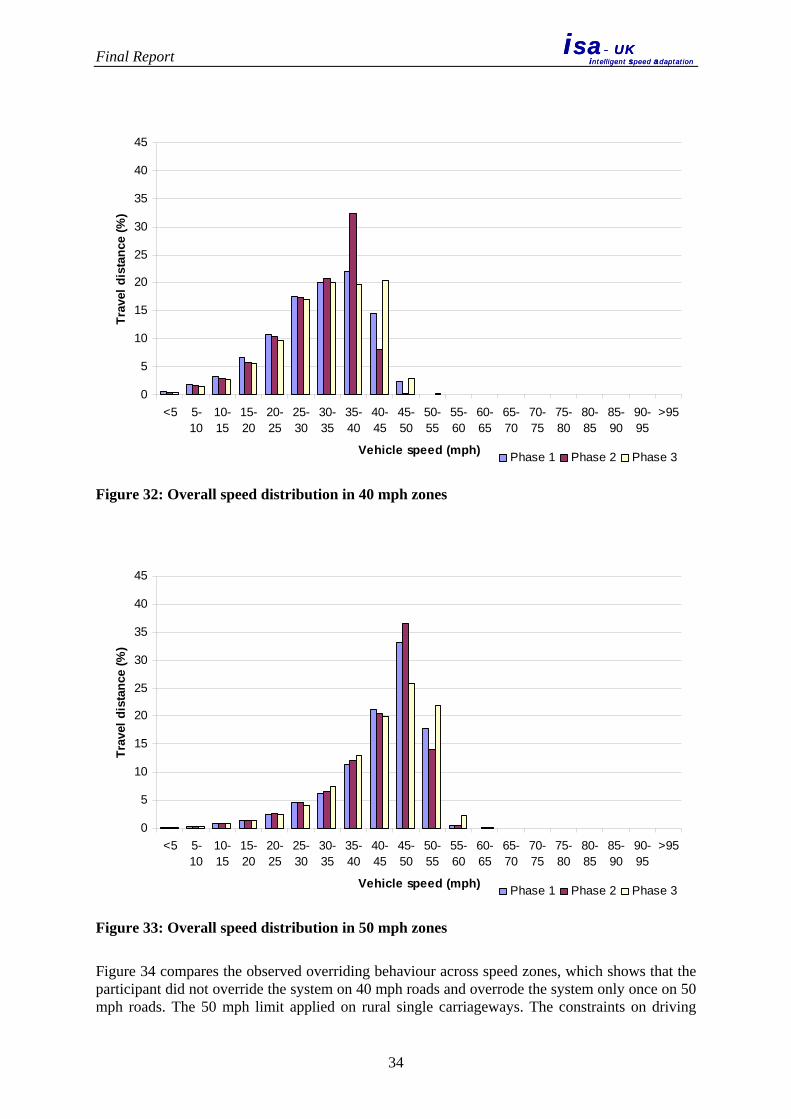
Final Report
isa- UKintelligent speed adaptation
isa- UKintelligent speed adaptation
0
5
10
15
20
25
30
35
40
45
<5 5-10
10-15
15-20
20-25
25-30
30-35
35-40
40-45
45-50
50-55
55-60
60-65
65-70
70-75
75-80
80-85
85-90
90-95
>95
Vehicle speed (mph)
Trav
el d
ista
nce
(%)
Phase 1 Phase 2 Phase 3
Figure 32: Overall speed distribution in 40 mph zones
0
5
10
15
20
25
30
35
40
45
<5 5-10
10-15
15-20
20-25
25-30
30-35
35-40
40-45
45-50
50-55
55-60
60-65
65-70
70-75
75-80
80-85
85-90
90-95
>95
Vehicle speed (mph)
Trav
el d
ista
nce
(%)
Phase 1 Phase 2 Phase 3
Figure 33: Overall speed distribution in 50 mph zones
Figure 34 compares the observed overriding behaviour across speed zones, which shows that the participant did not override the system on 40 mph roads and overrode the system only once on 50 mph roads. The 50 mph limit applied on rural single carriageways. The constraints on driving
34
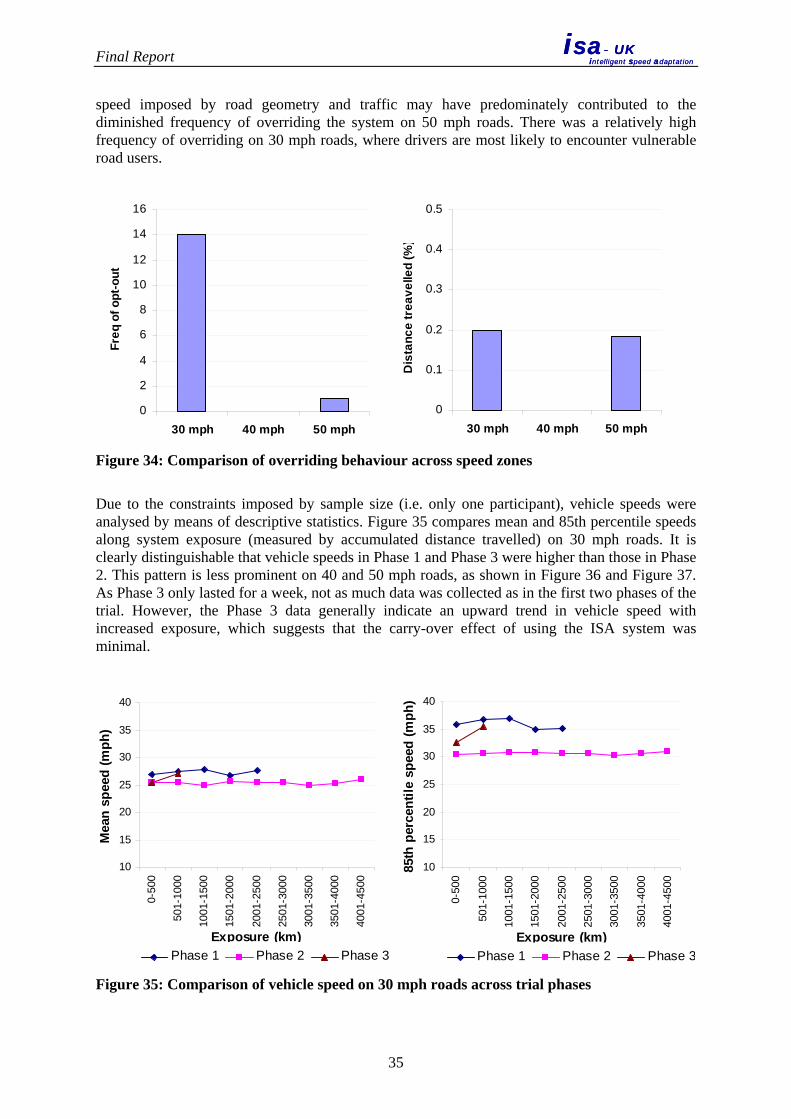
Final Report
isa- UKintelligent speed adaptation
isa- UKintelligent speed adaptation
speed imposed by road geometry and traffic may have predominately contributed to the diminished frequency of overriding the system on 50 mph roads. There was a relatively high frequency of overriding on 30 mph roads, where drivers are most likely to encounter vulnerable road users.
0
2
4
6
8
10
12
14
16
30 mph 40 mph 50 mph
Freq
of o
pt-o
ut
0
0.1
0.2
0.3
0.4
0.5
30 mph 40 mph 50 mph
Dis
tanc
e tr
eave
lled
(%)
Figure 34: Comparison of overriding behaviour across speed zones
Due to the constraints imposed by sample size (i.e. only one participant), vehicle speeds were analysed by means of descriptive statistics. Figure 35 compares mean and 85th percentile speeds along system exposure (measured by accumulated distance travelled) on 30 mph roads. It is clearly distinguishable that vehicle speeds in Phase 1 and Phase 3 were higher than those in Phase 2. This pattern is less prominent on 40 and 50 mph roads, as shown in Figure 36 and Figure 37. As Phase 3 only lasted for a week, not as much data was collected as in the first two phases of the trial. However, the Phase 3 data generally indicate an upward trend in vehicle speed with increased exposure, which suggests that the carry-over effect of using the ISA system was minimal.
10
15
20
25
30
35
40
0-50
0
501-
1000
1001
-150
0
1501
-200
0
2001
-250
0
2501
-300
0
3001
-350
0
3501
-400
0
4001
-450
0
Exposure (km)
Mea
n sp
eed
(mph
)
Phase 1 Phase 2 Phase 3
10
15
20
25
30
35
40
0-50
0
501-
1000
1001
-150
0
1501
-200
0
2001
-250
0
2501
-300
0
3001
-350
0
3501
-400
0
4001
-450
0
Exposure (km)
85th
per
cent
ile s
peed
(mph
)
Phase 1 Phase 2 Phase 3 Figure 35: Comparison of vehicle speed on 30 mph roads across trial phases
35

Final Report
isa- UKintelligent speed adaptation
isa- UKintelligent speed adaptation
20
25
30
35
40
45
50
0-50
0
501-
1000
1001
-150
0
1501
-200
0
2001
-250
0
2501
-300
0
3001
-350
0
3501
-400
0
4001
-450
0Exposure (km)
Mea
n sp
eed
(mph
)
Phase 1 Phase 2 Phase 3
20
25
30
35
40
45
50
0-50
0
501-
1000
1001
-150
0
1501
-200
0
2001
-250
0
2501
-300
0
3001
-350
0
3501
-400
0
4001
-450
0
Exposure (km)
85th
per
cent
ile s
peed
(mph
)
Phase 1 Phase 2 Phase 3 Figure 36: Comparison of vehicle speed on 40 mph roads across trial phases
30
35
40
45
50
55
60
0-50
0
501-
1000
1001
-150
0
1501
-200
0
2001
-250
0
2501
-300
0
3001
-350
0
3501
-400
0
4001
-450
0
Exposure (km)
Mea
n sp
eed
(mph
)
Phase 1 Phase 2 Phase 3
30
35
40
45
50
55
60
0-50
0
501-
1000
1001
-150
0
1501
-200
0
2001
-250
0
2501
-300
0
3001
-350
0
3501
-400
0
4001
-450
0Exposure (km)
85th
per
cent
ile s
peed
(mph
)
Phase 1 Phase 2 Phase 3 Figure 37: Comparison of vehicle speed on 50 mph roads across trial phases
Figure 38 compares the proportion of distance travelled when the vehicle speed was over the speed limit. It clearly demonstrates that ISA effectively diminishes speeding behaviour. However, it should be noted that, as for the cars, the ISA system allowed vehicle speed to be slightly over the speed limit. This led to some travel over the speed limit even when the ISA system was active in Phase 2. As shown in Figure 34, the participant did not override the ISA control very frequently.
36

Final Report
isa- UKintelligent speed adaptation
isa- UKintelligent speed adaptation
0
5
10
15
20
25
30
35
40
45
30 mph 40 mph 50 mph
Dis
tanc
e tra
velle
d (%
)
Phase 1 Phase 2 Phase 3 Figure 38: Comparison of percentage of distance travelled over speed limit across trial phases
Table 6 presents the coefficient of variation derived from individual trial phases as well as speed zones, which indicates the variability of vehicle speed. The coefficient of variation is a dimensionless measure that allows comparison of the variation of populations having considerably different mean values, which is of particular use for this analysis since the speed zones range from 30 mph to 50 mph. ISA led to a reduction in coefficient of variation in all speed zones, as the coefficient of variation derived from Phase 2 was consistently smaller than that from Phase 1 or 3 (i.e. a ‘V’ shape). The effect of ISA intervention on reducing speed variability was most prominent in lower speed zones, i.e. urban areas. It has been suggested that the coefficient of variation of speed is significantly correlated with accident occurrence in urban areas but the relationship is less prominent in rural areas (Taylor, Lynam, and Baruya, 2000; Taylor, Baruya, and Kennedy, 2002).
Table 6: Coefficient of variation of vehicle speed across trial phases
Speed zone Phase 1 Phase 2 Phase 3
30 mph 0.334 0.286 0.324 40 mph 0.292 0.264 0.277 50 mph 0.205 0.203 0.213
4.3.2 Driver acceptance
Questions sought to determine the truck driver’s acceptance of the ISA system. Driver acceptance of the ISA system was measured using the same questionnaire as the one administered to the car drivers (see page 19). The questionnaire was administered during each phase of the trial to monitor any changes in opinion. As can be seen in Figure 39, the participant’s acceptability rating decreased following experience with the system. Ratings of usefulness and satisfaction with ISA systematically declined beyond the removal of the system suggests that the driver showed little acceptance of the ISA system.
37

Final Report
isa- UKintelligent speed adaptation
isa- UKintelligent speed adaptation
-2
-1
0
1
2
Phase 1 Phase 2 Phase 3
Phase
Ratin
g
UsefulnessSatisfaction
Figure 39: Acceptability ratings on dimensions of ‘usefulness’ and ‘satisfaction’
Several sets of questions were also included to elicit the truck driver’s opinion about the ISA system in more detail. The first set of questions focused on how the ISA system would change various aspects of truck driving; the results are shown in Figure 40. These results suggest that in this truck driver’s opinion, the introduction of ISA would decrease traffic safety, the joy of driving, the ease of overtaking and surprisingly the ease of keeping to the speed limits. Similarly, he believed that ISA would increase feelings of stress, accident risk, pressure from other traffic and the feeling of being controlled. The driver was unsure whether the system increased his attentiveness to traffic and following distances (i.e. ratings were at the mid-point). Experience with the system seemed only to confirm and strengthen his negative attitude to ISA.
-2
-1
0
1
2
traffi
c sa
fety
irrita
tion
stre
ss
bein
gco
ntro
lled
joy
of d
rivin
g
atte
ntiv
enes
sin
traf
fic
acci
dent
risk
follo
win
gdi
stan
ces
ease
of
over
taki
ng
jour
ney
time
keep
ing
tosp
eed
limit
pres
sure
from
traf
fic
Scenario
Ratin
g
Phase 1 Phase 2 Phase 3 Figure 40: How do you think the following factors change when driving with the ISA system
compared to when driving without ISA on your truck?
The second set of questions investigated where and when the driver would use the ISA system. As can be seen in Figure 41, he was unsure where he would make use of ISA before having gained any experience of the system. Following experience with the system, he felt that he would make use of the system in the majority of driving systems except on motorways and during foggy
38

Final Report
isa- UKintelligent speed adaptation
isa- UKintelligent speed adaptation
driving conditions. Once the system was removed, however, his evaluation of the usefulness of ISA declined.
-2
-1
0
1
2bu
ilt-up
area
s
rura
l roa
ds
mot
orw
ays
dayt
ime
even
ing/
nigh
ttim
e
slip
pery
road
s fog
peak
traf
fic
off-p
eak
traffi
c
Scenario
Rat
ing
Phase 1 Phase 2 Phase 3 Figure 41: Where would you use the ISA system?
The third set of questions asked the participant about the road user groups for which he felt the system was most justified. Figure 42 suggests that, whilst he thought that ISA could be justified for private drivers, experience with the system changed this belief. The results suggest that he could only justify the imposition of ISA for novice drivers, speed offenders and those who had recently regained their licence (the participant’s own suggestion). He thought that ISA was more justifiable for novice drivers than speed offenders.
-2
-1
0
1
2
priv
ate
driv
ers
porfe
ssio
nal
driv
ers
mot
orcy
clis
ts
novi
cedr
iver
s
expe
rienc
eddr
iver
s
novi
ce ri
ders
spee
dof
fend
ers
rega
ined
licen
ce
Road User
Ratin
g
Phase 1 Phase 2 Phase 3 Figure 42: How justified do you think the system would be for the different categories of
drivers?
Measures of trust were also taken (see Table 7). The method used a pencil and paper scoring system in which respondents mark their trust on a scale from 0 to 100 (Lee and Moray, 1992). The truck driver’s ratings suggest that his trust in the system, having gained experience of ISA, was substantially lower than he had expected. His trust in the system continued to decline having returned to ‘normal’ driving (i.e. switched from Phase 2 to 3).
39

Final Report
isa- UKintelligent speed adaptation
isa- UKintelligent speed adaptation
Table 7: Trust rating across phases
Rating
Phase 1 55
Phase 2 13
Phase 3 5
When questioned about his willingness to install such a system, the truck driver would be unwilling to have an ISA installed in his truck even if its use was voluntary. Similarly he disapproved of any compulsory fitting of ISA to all new vehicles or the mandatory introduction of ISA for all truck drivers. He would not be interested in having ISA installed in his own private car.
4.4 Conclusions from the truck trial
It should be noted that due to the constraints imposed by the sample size (i.e. only one driver), results from this trial could only be considered to be indicative rather than representative of the whole population of truck drivers. Overall the questionnaire highlighted the participating truck driver’s dissatisfaction and mistrust of the ISA system. He appeared to start the trial with a negative attitude towards ISA and his experience with the system seemed not to have changed his beliefs. At the beginning of the trial he expressed some concern regarding the level of control of ISA:
“I think the system will have its place but should not be put into place to replace the responsibility of the driver to control the vehicle's speed. Drivers have at present too many aids which take away their concentration which leads them into false sense of driving ability in any given situation.”
These concerns regarding driver distraction did not appear to have dissipated following experience with the system:
“The system could be of use to novice drivers or those that have gained maximum points on their licence for speeding offences but people should be trained further after passing their test to make them more aware of what they should be doing behind the wheel so as not to rely on computer generated safety features being relied upon at the expense of proper observation planning techniques being used.”
The ISA system was observed to have a distinctive effect in terms of transforming the speed distribution across all speed zones. This means that speeds over the speed limit and in particular very high exceeding of the limit were curtailed. The proportion of distance travelled when vehicle speed was over the speed limit reduced with ISA. It also led to a reduction in speed variation, especially in the urban areas where lower speed limits apply.
40

Final Report
isa- UKintelligent speed adaptation
isa- UKintelligent speed adaptation
5. MOTORCYCLE TRIAL
5.1 Objectives
The objectives of the work were:
• To examine alternative approaches to implementing Intelligent Speed Adaptation (ISA) in a motorcycle environment, taking into account the operating environment in which ISA would have to perform and the dynamic characteristics of a motorcycle
• To test the design in a safe environment, taking into account the prototype nature of the modified vehicle
• To analyse the attitudes of a group of riders both before and after experiencing the ISA functionality
• To examine the effectiveness of the implemented alternative approaches to ISA in curtailing speeding on “roads” with a variety of speed limits.
5.2 Method
5.2.1 Modifications to the vehicle
5.2.1.1 Selected vehicle The selected vehicle was a Suzuki Bandit 650S. It was considered to be a representative, popular, mid-range motorcycle that was easy to ride and had a comfortable seating position and good power to weight ratio to suit both experienced and novice riders. An example of this vehicle was purchased for detailed engineering assessment, system design and system implementation. The ISA motorcycle is shown in Figure 43.
Figure 43: Suzuki Bandit 650S
5.2.1.2 ISA system design A Control Area Network (CAN) was chosen for the main architecture of the ISA motorcycle system. CAN is a standardised protocol for sending and requesting of information on a serial bus system. The CAN offers a modular approach to link together the elements of the system that can
41
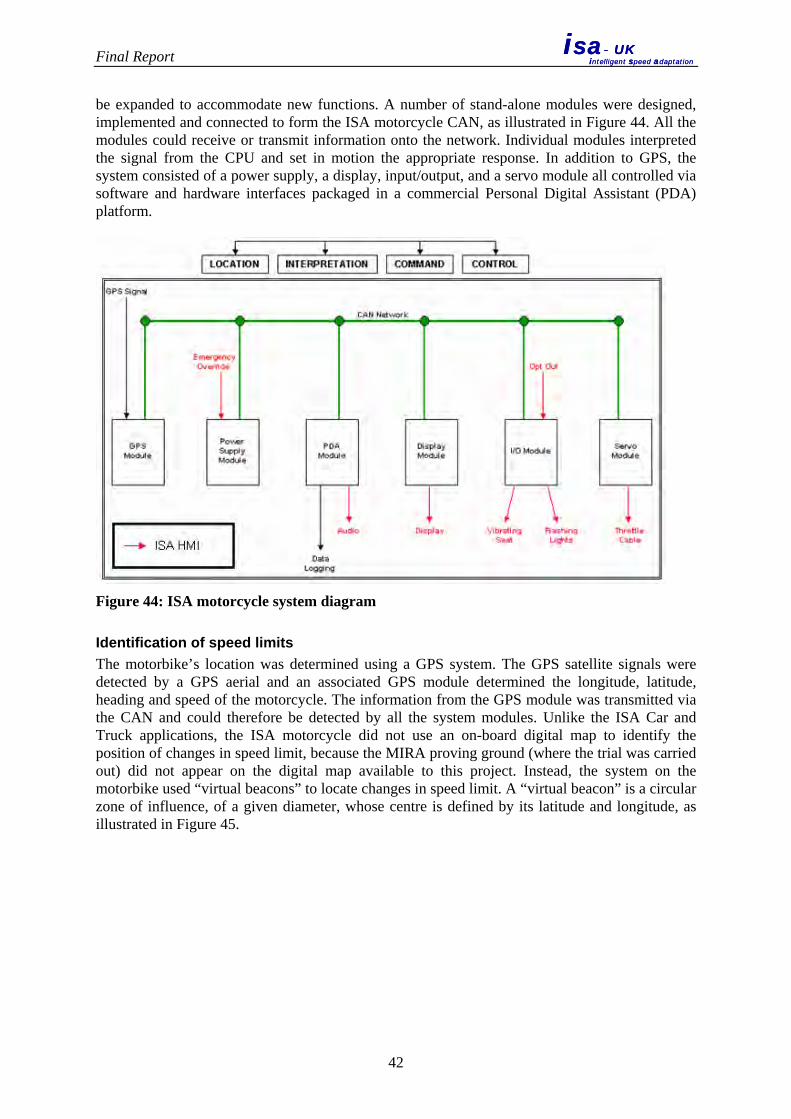
Final Report
isa- UKintelligent speed adaptation
isa- UKintelligent speed adaptation
be expanded to accommodate new functions. A number of stand-alone modules were designed, implemented and connected to form the ISA motorcycle CAN, as illustrated in Figure 44. All the modules could receive or transmit information onto the network. Individual modules interpreted the signal from the CPU and set in motion the appropriate response. In addition to GPS, the system consisted of a power supply, a display, input/output, and a servo module all controlled via software and hardware interfaces packaged in a commercial Personal Digital Assistant (PDA) platform.
Figure 44: ISA motorcycle system diagram
Identification of speed limits The motorbike’s location was determined using a GPS system. The GPS satellite signals were detected by a GPS aerial and an associated GPS module determined the longitude, latitude, heading and speed of the motorcycle. The information from the GPS module was transmitted via the CAN and could therefore be detected by all the system modules. Unlike the ISA Car and Truck applications, the ISA motorcycle did not use an on-board digital map to identify the position of changes in speed limit, because the MIRA proving ground (where the trial was carried out) did not appear on the digital map available to this project. Instead, the system on the motorbike used “virtual beacons” to locate changes in speed limit. A “virtual beacon” is a circular zone of influence, of a given diameter, whose centre is defined by its latitude and longitude, as illustrated in Figure 45.
42

Final Report
isa- UKintelligent speed adaptation
isa- UKintelligent speed adaptation
Figure 45: Illustration of a Virtual Beacon
Each virtual beacon had a designated speed limit that corresponded to an existing speed limit on the motorbike’s route. The PDA, within the PDA module, contained a look-aside table that defines the latitude and longitude, speed limit, heading (+/-10o) and the name of each virtual beacon. When the motorbike’s coordinates were within the area defined by the virtual beacon’s zone of influence and within the specified heading, the ISA system implemented the new speed limit. The ISA system continued to assume the last known speed limit being true until it entered the boundary of the next virtual beacon. This process is illustrated in Figure 46.
The motorcycle is travelling along the road approaching a
new speed limit.
The motorcycle enters the virtual
beacon and identifies the new speed limit.
43

Final Report
isa- UKintelligent speed adaptation
isa- UKintelligent speed adaptation
The motorcycle is limited to 30 mph
until it enters another virtual beacon with a different speed limit.
Figure 46: Identification of speed limits by Virtual Beacons
The ISA system was “unaware” what the next speed limit might be until it reached the next beacon. Therefore, when the ISA motorcycle was approaching a 30 mph zone from a higher speed zone, the ISA system would only start to intervene with reference to the 30 mph speed limit once the motorcycle had entered the boundary of the new virtual beacon. Hence the motorcyclist would have travelled faster than 30 mph for some distance after reaching the 30 mph zone before being affected by the system.
Interpretation and command The ISA system developed for the motorcycle had three different states:
• Non-Intervention phase, when the bike was below the speed limit. • Warning phase, when the bike had slightly exceeded the speed limit. • Intervention phase, when the bike had significantly exceeded the speed limit.
The speed condition under which the ISA motorcycle entered these states was defined in a look-aside table on the PDA, as depicted in Table 8. The following scenarios are given as an example of how the system works:
• If the motorcycle’s speed was less than the Warning limit for the given speed limit, for example 53mph in a 50 mph zone, the ISA system would stay in the “Non-Intervention” state.
• If the motorcycle’s speed was more than the Warning Limit but less than the Intervention Limit, for example 56mph in a 50 mph zone, the bike would enter the “Warning” state.
• If the motorcycle’s speed was higher than the Intervention Limit, for example 60 mph in a 50 mph zone, the bike would enter the “ISA Intervention” state.
Table 8: Look aside table for Warning and Intervention Limits on the ISA motorcycle
Speed Limit Warning Limit
Intervention Limit
30 mph 32 36 40 mph 42 46 50 mph 54 58 60 mph 64 68 70 mph 74 78
When the PDA module on the ISA motorcycle recognised a true virtual beacon, it compared the actual vehicle speed to the speed limit for that beacon. Once it determined what state the
44
Final Report
isa- UKintelligent speed adaptation
isa- UKintelligent speed adaptation
motorbike is in (i.e. Non-Intervention, Warning, or Intervention), the PDA module published it onto the CAN bus. All the ISA motorcycle sub-system modules had the capability to receive messages on the CAN Bus and were therefore aware of what state the ISA system was in. Individual modules then interpreted and commanded their own responses, depending on what state the ISA system was in. The PDA also logged the longitude, latitude, heading, vehicle speed and beacon name at a rate of 10 Hz onto a local Secure Digital (SD) card. The data collected could then be analysed off-line.
Intervention method The intervening stage of the ISA system on the motorcycle used a reduction in throttle demand to reduce engine power and hence aided speed reduction. Due to the dynamic characteristics of a two-wheeler, no intervention was made to the motorcycle’s braking system. An examination of the Suzuki Bandit’s throttle control revealed that it had two actuator cables connected to it. When the throttle was twisted to accelerate, one of the cables extended and when the throttle grip was released the second cable then pulled the throttle closed. It was considered that an intervention with the throttle cable mechanism could yield a robust and direct means of controlling throttle opening engine power. Consequently, an additional cable was attached to the throttle closing cable, which was then linked to a mechanical actuator fitted in the rear pannier of the motorcycle. In this arrangement, an ISA control system could identify the need to reduce speed, and therefore power by initiating the actuator to pull the throttle closing cable, which minimised the throttle opening available to the rider and thereby slowed the motorcycle down. Attaching a second cable to the closing side of the throttle provided a relatively simple modification to the motorcycle with minimal alteration to the original system. An added safety benefit was that, if the additional ISA cable failed mechanically, the system would automatically revert to its original design – the rider would immediately retain full control of the throttle. Measurement of the forces on the throttle twist grip suggested that the force needed to close the throttle, against the rider’s wishes, was much greater than that needed to hold it in its current position. Consequently, the mechanical actuator acting on the throttle cable was designed to be providing a force that could hold the throttle at current position but not close it against the rider’s effort. When the rider released the throttle, either to slow down or to change gear, the actuator was then able to close the throttle. This approach therefore minimised the risk that the throttle would be closed unbeknown to the rider. Within the Servo module was a servo motor (Figure 47) that was utilised to limit the motorcycle’s throttle. The servo motor arm was connected to a cable that is attached to the throttle return limb. The servo motor’s range of motion was equivalent to the range of motion of the motorcycle twist grip.
45

Final Report
isa- UKintelligent speed adaptation
isa- UKintelligent speed adaptation
Figure 47: The servo motor used to limit the ISA motorbike’s throttle
When ISA intervention was triggered, the servo was activated and the motor arm rotated, over two seconds, through its range of motion. This rotation pulled the throttle return limb back, closing the throttle and slowing the motorbike down. As the throttle return limb closed the rider felt the twist grip close in their hand. The throttle then remained closed until motorcycle’s speed was below the Warning speed limit. When the motorcycle was below the warning limit the servo arm rotated back, over two seconds, through its range and the rider regains control of the throttle. The motorcycle then returned to the Non-Intervention state.
HMI The ISA motorcycle differed from the other ISA systems developed in this project because it had a Warning Phase prior to implementing intervention. The ISA system employed on the motorcycle therefore had a philosophy of “Heavy Persuasion, Mild Intervention” unlike the more strict speed control regimes employed on the ISA cars. This meant that the rider was “aggressively” warned, using a variety of methods to alert the rider, before any intervention took place. The main visual display aspect of the Human Machine Interface (HMI) implemented on the ISA motorcycle was similar in concept to that used on the other ISA vehicles. The current speed limit was displayed on a LED matrix screen (Figure 48) located directly in front of the rider mounted on the handlebars (Figure 49). Additional visual indications were given by a pair of red LED’s fitted to the left and right hand upper edges of the motorcycle windshield (Figure 49), closer to the rider’s line of sight. When the ISA system was activated, the LED’s flashed when power reduction was about to be initiated.
Figure 48: The ISA information screen
46
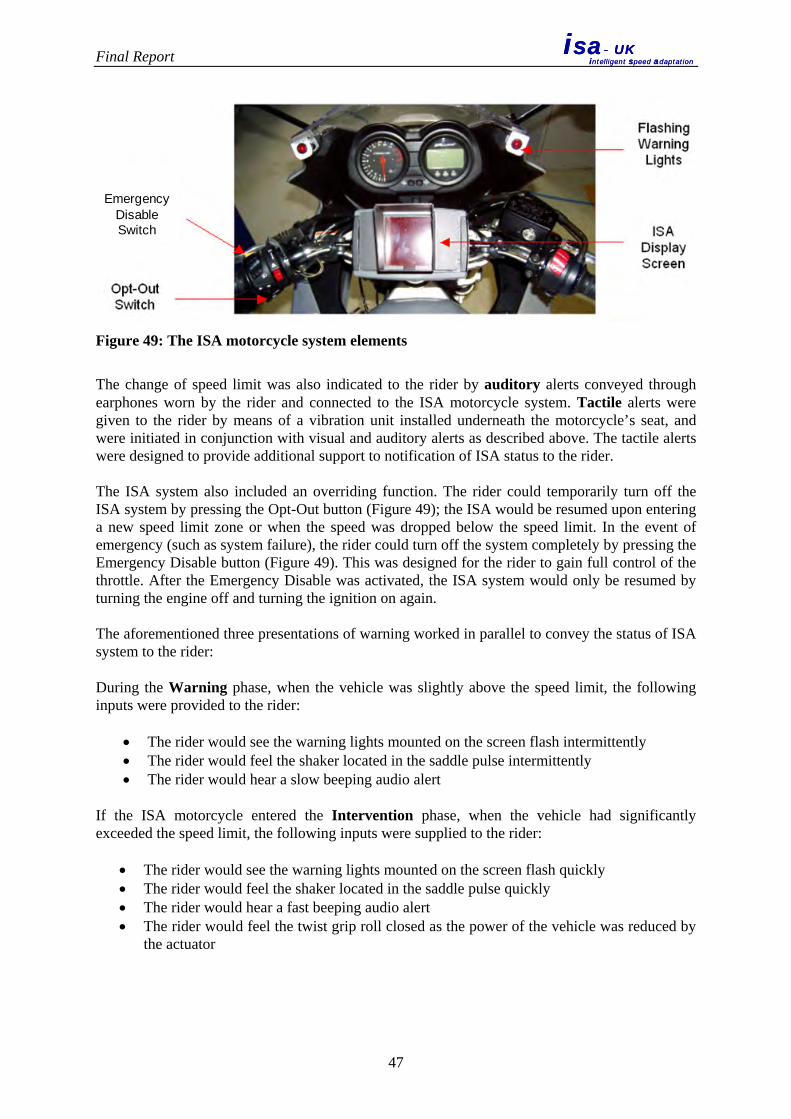
Final Report
isa- UKintelligent speed adaptation
isa- UKintelligent speed adaptation
EmergencyDisableSwitch
Figure 49: The ISA motorcycle system elements
The change of speed limit was also indicated to the rider by auditory alerts conveyed through earphones worn by the rider and connected to the ISA motorcycle system. Tactile alerts were given to the rider by means of a vibration unit installed underneath the motorcycle’s seat, and were initiated in conjunction with visual and auditory alerts as described above. The tactile alerts were designed to provide additional support to notification of ISA status to the rider. The ISA system also included an overriding function. The rider could temporarily turn off the ISA system by pressing the Opt-Out button (Figure 49); the ISA would be resumed upon entering a new speed limit zone or when the speed was dropped below the speed limit. In the event of emergency (such as system failure), the rider could turn off the system completely by pressing the Emergency Disable button (Figure 49). This was designed for the rider to gain full control of the throttle. After the Emergency Disable was activated, the ISA system would only be resumed by turning the engine off and turning the ignition on again. The aforementioned three presentations of warning worked in parallel to convey the status of ISA system to the rider: During the Warning phase, when the vehicle was slightly above the speed limit, the following inputs were provided to the rider:
• The rider would see the warning lights mounted on the screen flash intermittently • The rider would feel the shaker located in the saddle pulse intermittently • The rider would hear a slow beeping audio alert
If the ISA motorcycle entered the Intervention phase, when the vehicle had significantly exceeded the speed limit, the following inputs were supplied to the rider:
• The rider would see the warning lights mounted on the screen flash quickly • The rider would feel the shaker located in the saddle pulse quickly • The rider would hear a fast beeping audio alert • The rider would feel the twist grip roll closed as the power of the vehicle was reduced by
the actuator
47

Final Report
isa- UKintelligent speed adaptation
isa- UKintelligent speed adaptation
5.2.2 User trials
5.2.2.1 Test site The trials were held on a closed circuit within the MIRA Ride & Handling Circuit. To facilitate the ISA motorcycle trial, some temporary modifications to the basic track layout and facilities were added. This included the installation of speed limit signs. The layout of the test track is illustrated in Figure 50. A set of 30 mph, 40 mph, 50 mph and 60 mph speed limits were set up along the circuit.
Clockwise route
Counter-clockwise route
Figure 50: Test circuit used for ISA motorcycle trials
5.2.2.2 Trial protocol Before the trial commenced, each rider was given a briefing to explain how the ISA system worked and how the trial would be carried out. Although an overriding function was built in to the ISA system, the participants were asked not to override, in order to gain as much experience of using the ISA system as possible. Each participant was asked to ride the ISA motorcycle, following a pace car, around the MIRA access roads to gain experience of riding the ISA motorcycle. The ISA system was inactive and no data were logged during this period. The rider was then led to the test circuit. A pit-stop area was set up as a base for the ISA motorcycle to return after the series of laps. The structure of the trial is depicted in Table 9. Three systems were tested in the trial:
• Advisory ISA system: provided speed limit information and warning to the rider. • Assisting ISA system: functioned the same as the Advisory system but also reduced
throttle output when the speed exceeded preset values (i.e. Table 8).
48

Final Report
isa- UKintelligent speed adaptation
isa- UKintelligent speed adaptation
• Information system: functioned the same as the Advisory system but also provided route related information such as the layout of an upcoming junction etc.
The order of administering the Advisory and Assisting ISA systems was counterbalanced across all participants to avoid bias because of the order of experiencing one or the other version of the system. The Information system was always administered after the participants had completed both ISA systems. The Information system provided the riders with travel information (e.g. upcoming traffic lights and junctions) in addition to all the functionality that an Advisory ISA system offers. This configuration was designed to investigate whether combining ISA with other rider information systems led to difference in riders’ behaviour and acceptance of the ISA system. Upon completion of the trial, each participant was invited to comment on the ISA systems and discuss possible improvements.
Table 9: Trial Structure
Purpose Description Status of ISA Provision of ISA function
Data logging
Familiarisation with test track
4 laps on test track behind a pace car (2 clockwise, 2 anti-clockwise)
OFF N/A NO
Baseline 6 laps on test track (3 clockwise, 3 anti-clockwise)
OFF N/A YES
Experience the Advisory ISA system
6 laps on test track (3 clockwise, 3 anti-clockwise)
ON (Advisory system)
Speed limit display & Warning YES
Experience the Assisting ISA system
6 laps on test track (3 clockwise, 3 anti-clockwise)
ON (Assisting system)
Speed limit display, Warning & Intervention
YES
Experience the Information system
3 laps on access roads
ON (Information system)
Speed limit display & Warning YES
In addition to the digital data, a series of questionnaires was developed. Each rider was asked to complete a questionnaire before they arrived which comprised personal information (age, sex, and address), information about their personal experiences on a motorcycle, how often they rode, what they used a motorcycle for (for example recreation or commuting), how long they had held a motorcycle licence and what motorcycle they currently rode. The rider was also asked to complete a series of questions before, during and after they had experienced the Advisory and/or Assisting system, which collected their views on the ISA systems.
5.2.2.3 Participants The aim was to include professional riders, members of rider groups and industry staff. Experienced and novice, male and female, and riders of different age groups were sought. All trial participants held the appropriate driving licence. To expedite the trials the first riders were drawn from the motorcycling community working at MIRA, though none of the participants whose results were recorded were involved in the development of the ISA motorcycle. Invitations were also issued to a range of motorcyclists whose names were provided by the members of DfT’s Advisory Group on Motorcycling.
49

Final Report
isa- UKintelligent speed adaptation
isa- UKintelligent speed adaptation
Several questions sought information about key demographic and driving characteristics in order to give a brief overview of the riders taking part in the motorcycle trial. Thirty males (age range 32-60 years, M = 45.43, SD = 7.55) and three females (age range 26-42 years, M = 33.67, SD = 8.02) took part in the trial. At the time of the trial, 31 out of 33 riders owned and rode a motorcycle. Riding experience varied across the riders (see Figure 51). On average riders had 19.64 years (SD = 12.62) of riding experience and accrued an average annual mileage of 5612.50 miles (SD = 6250.82).
0
1
2
3
4
5
6
7
0-5 6-10 11-15 16-20 21-25 26-30 31-35 36-40 41-45
Experience (years)
Freq
uenc
y
Figure 51: Riding experience (years)
As can be seen in Table 10, seventy five percent of the riders used their motorcycles for leisure purposes, with 36% of riders using their machine solely for this purpose. In addition, 5 of 33 riders had been involved in one motorcycling accident in the last five years. All riders possessed a driving licence and accrued an average car annual mileage of 12212.12 miles (SD = 7753.05).
Table 10: Purpose of the majority of trips made by participants
Purpose N %
Commuting/part of work 7 21.21 Leisure 12 36.36 Both 13 39.39 Other 1 3.03 Total 33 100.00
5.3 Results
5.3.1 System acceptance
Questions sought to determine riders acceptability of the three systems tested. Rider acceptance was measured using the same acceptability scale as administered to the car drivers (see page 19). The measure was administered before and after experience with the three systems.
50
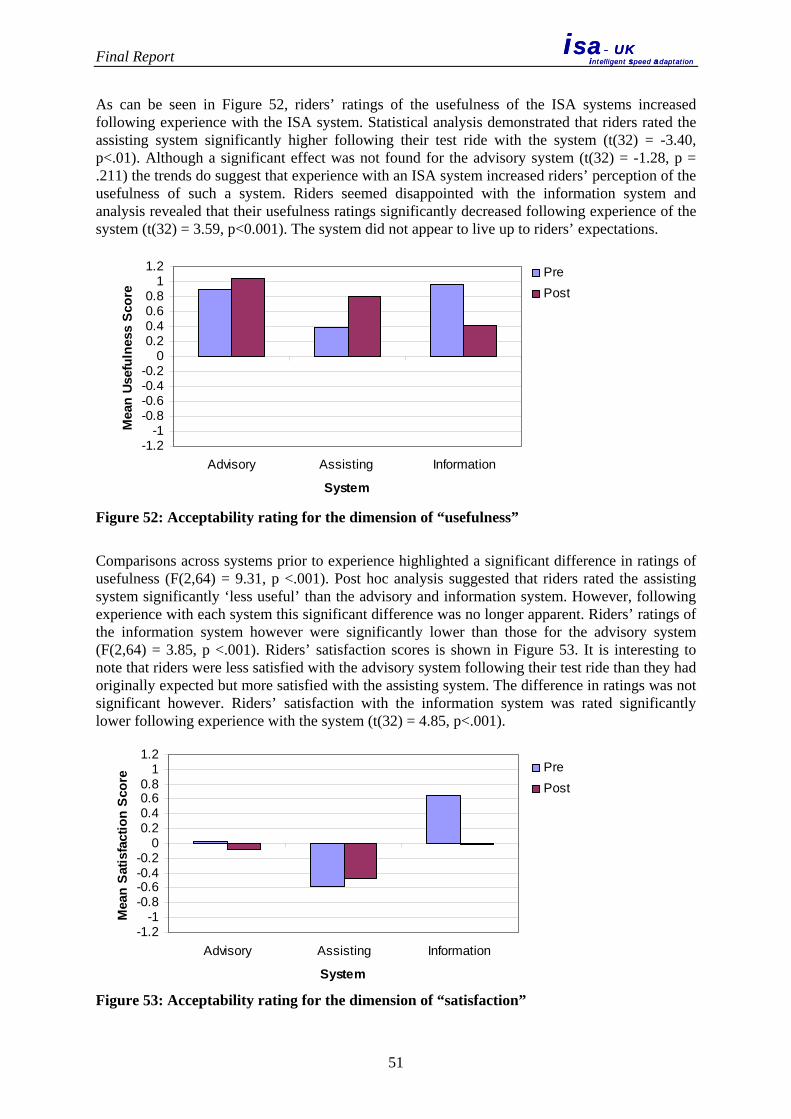
Final Report
isa- UKintelligent speed adaptation
isa- UKintelligent speed adaptation
As can be seen in Figure 52, riders’ ratings of the usefulness of the ISA systems increased following experience with the ISA system. Statistical analysis demonstrated that riders rated the assisting system significantly higher following their test ride with the system (t(32) = -3.40, p<.01). Although a significant effect was not found for the advisory system (t(32) = -1.28, p = .211) the trends do suggest that experience with an ISA system increased riders’ perception of the usefulness of such a system. Riders seemed disappointed with the information system and analysis revealed that their usefulness ratings significantly decreased following experience of the system (t(32) = 3.59, p<0.001). The system did not appear to live up to riders’ expectations.
-1.2-1
-0.8-0.6-0.4-0.2
00.20.40.60.8
11.2
Advisory Assisting Information
System
Mea
n Us
eful
ness
Sco
re
Pre Post
Figure 52: Acceptability rating for the dimension of “usefulness”
Comparisons across systems prior to experience highlighted a significant difference in ratings of usefulness (F(2,64) = 9.31, p <.001). Post hoc analysis suggested that riders rated the assisting system significantly ‘less useful’ than the advisory and information system. However, following experience with each system this significant difference was no longer apparent. Riders’ ratings of the information system however were significantly lower than those for the advisory system (F(2,64) = 3.85, p <.001). Riders’ satisfaction scores is shown in Figure 53. It is interesting to note that riders were less satisfied with the advisory system following their test ride than they had originally expected but more satisfied with the assisting system. The difference in ratings was not significant however. Riders’ satisfaction with the information system was rated significantly lower following experience with the system (t(32) = 4.85, p<.001).
-1.2-1
-0.8-0.6-0.4-0.2
00.20.40.60.8
11.2
Advisory Assisting Information
System
Mea
n S
atis
fact
ion
Sco
re
Pre Post
Figure 53: Acceptability rating for the dimension of “satisfaction”
51

Final Report
isa- UKintelligent speed adaptation
isa- UKintelligent speed adaptation
Comparisons across systems, prior to experience, highlighted significant differences across ratings of satisfaction (F(2,64) = 27.81, p<.001). Post hoc analysis suggested that riders rated the assisting system significantly less satisfying than the advisory and information system. The advisory system was also rated as less satisfying than the information system. These significant differences were still apparent following experience with each system (F(2,64)= 5.39, p<.01) except that riders’ ratings of the information system were no longer significantly different to those for the advisory system. Riders were significantly less satisfied with the assisting system than the advisory and information system.
5.3.2 Riders’ opinions about the ISA systems
Several sets of questions were designed to tap riders’ opinion about the ISA systems following their experience of each system. The first set of questions focused on how the three systems would change various aspects of riding; the results are depicted in Figure 54.
-2 -1.5 -1 -0.5 0 0.5 1 1.5 2
Traffic Safety
Irritation
Stress
Controlled
Joy
Attentiveness
Accident Risk
Following Distance
Overtaking
Mean rating score
InformationAssistingAdvisory
Figure 54: How do you think the following factor would change when riding the three
systems compared to riding without any system on your motorcycle?
Riders agreed that all the systems would increase traffic safety. There was no significant difference across systems however. Beliefs expressed also suggested that the introduction of all three systems would increase riders’ irritation, stress and feelings of being controlled and decrease the joy of riding. Repeated measures ANOVA confirmed that riders ratings of the level of irritation evoked by the systems were significantly different (F(2,64) = 6.21, p<.01). Post hoc analysis revealed that riders believed the assisting system was significantly more likely to increase irritation than the information system. Riders also expressed significantly different responses regarding the level of control (F(2,64) = 12.40, p<.001) incurred by each system and the joy (F(2,64) = 9.76, p<.001) experienced when riding with these systems active. Post hoc analysis suggested that the information system was significantly less likely to increase the feeling of being controlled than both the advisory and the
52

Final Report
isa- UKintelligent speed adaptation
isa- UKintelligent speed adaptation
assisting system. The assisting system was also deemed as significantly more likely to decrease the joy of riding compared to the advisory and information systems. Although the differences across systems were non-significant, riders thought all the systems were likely to reduce the risk of an accident. The advisory system was believed to be more likely to reduce their accident risk than the assisting systems which curbs speeds. This is perhaps a reflection of riders’ concerns regarding the safety implication of the assisting system. Riders also believed that the advisory and information system would increase following distances, whereas the assisting system would decrease distances. Differences across systems were again non-significant however. A significant difference was found in perceptions regarding overtaking behaviour (F(2,64) = 19.85, p<.001). Post hoc analysis revealed that riders believed overtaking would significantly decrease when riding with the assisting system compared to the advisory and information system. The second set of questions investigated where and when the riders would use the three systems. As can be seen in Figure 55, riders would be fairly reluctant to use the assisting ISA system in the majority of traffic conditions.
-2 -1.5 -1 -0.5 0 0.5 1 1.5 2
Built Up Area
Rural Roads
Motorways
Day time
Night
Slippery Roads
Fog
Peak Traffic
Off Peak Traffic
Mean rating score
InformationAssistingAdvisory
Figure 55: If you had this system on your motorcycles, where and when would you use it?
Opposition to utilising the ISA systems seemed strongest for those conditions that would afford the greatest opportunity to speed (i.e. riding on rural roads, motorways, during off peak traffic). A number of significant differences in riders’ appraisals of the systems utility were found. Ratings were significantly different for the potential use of the systems on rural roads (F(2,64) = 11.04, p<.001) with riders significantly more likely to use the information system more than the advisory and assisting ISA systems. Riders appeared unlikely to use the systems on the motorways (F(2,64) = 10.58, p<.001), during the daytime (F(2,64) = 4.71, p<.05) and in off peak traffic (F(2,64) = 7.31, p<.001) and the significant differences found suggested that they were less likely to use the assisting ISA system during these conditions than both the advisory and the
53

Final Report
isa- UKintelligent speed adaptation
isa- UKintelligent speed adaptation
information system. Riders believed that they would utilise all three systems fairly often when riding in built up areas and in fog, but differences across systems were non-significant. Patterns were also similar for riders’ responses regarding their potential use of these systems when riding during the night, on slippery roads and in peak traffic. Examination of the means suggested that riders would make some use of the advisory and information system in these conditions, but saw little value in the assisting ISA system. Statistical analysis confirmed that riders believed they would use the three systems differently when riding during the night (F(2,64) = 5.48, P<.01), on slippery roads (F(2,64) = 3.29, p<.05) and in peak traffic (F(24) = 4.13, p<.05). Post hoc tests revealed that riders were less likely to use the assisting ISA system than the information system when driving at night, and less likely to use the assisting ISA system than the advisory system when riding during peak traffic hours. Post analysis did not identify any significant differences for the slippery roads scenario. The third set of questions explored for which rider groups the participants felt the systems were most justified. Figure 56 suggests that riders could not justify the imposition of any of the systems for private or professional riders. Significant differences found across the ratings for private riders (F(2,64) = 6.25, p<.01) suggested that the assisting ISA system was significantly less justifiable for this group than the advisory ISA and information system. Significant differences found across ratings for the justifiability of the three systems for professional (F(2,64) = 4.52, p<.05) and elderly riders (F(2,64) = 5.16, p<.01) suggested that the assisting ISA was significantly less justifiable than an advisory ISA system. ISA systems appeared most justifiable for young or novice riders and speed offenders. Riders still believed an advisory ISA was more justifiable for speed offenders than an assisting ISA which would serve to limit repeat offenders’ speeds.
-2 -1.5 -1 -0.5 0 0.5 1 1.5 2
Private
Professional
Young
Elderly
Novice
Speed Offenders
Others
Mean rating score
InformationAssistingAdvisory
Figure 56: How justified do you think the system would be for the different categories of
riders?
54

Final Report
isa- UKintelligent speed adaptation
isa- UKintelligent speed adaptation
Measures of trust (Lee and Moray, 1992) were also taken (Figure 57). Statistical analysis revealed a significant difference across riders’ ratings (F(2,64) = 6.027, p< .01). Post hoc analysis revealed that riders’ trust in the assisting system was significantly lower than their trust in the advisory system. Issues here may again relate to their safety concerns regarding reduced throttle input.
0102030405060708090
100
Advisory Assisting Information
System
Mea
n Tr
ust S
core
Figure 57: System trust ratings
Despite reservations expressed by riders in terms of the justifiability and potential utility of the ISA systems, Figure 58 suggests that 64% (of which 36% showed a definite interest) of riders would be willing to consider having an advisory ISA system fitted to their machine. 15% of riders showed a strong interest in having an assisting ISA system fitted and a further 24% would consider having this system installed. Interest was strongest for the information system, despite the low ratings regarding this system’s acceptability. Here 70% of riders showed willingness to having this system fitted, with 30% confirming a strong interest.
0%10%20%30%40%50%60%70%80%90%
100%
Advisory Assisting Information
System
Perc
enta
ge F
requ
ency
Yes Maybe No Figure 58: Willingness to install the systems
Figure 59 shows the responses of those riders who would consider having the systems installed on their motorcycle, which suggests that the riders would be willing to pay between nothing and £300 for this equipment. An installation cost of £50-£100 was the most common price riders
55

Final Report
isa- UKintelligent speed adaptation
isa- UKintelligent speed adaptation
would be willing to pay for the systems. Riders seemed to appreciate that the assisting ISA system would come at a higher premium given the technology associated with making this system viable.
0123456789
10
Nothing £0-£50 £50-£100 £100-£200 £200-£300
Cost
Freq
uenc
y
Advisory Assiting Information Figure 59: Willingness to pay for the systems
5.3.3 Analysis of speed
Table 11 depicts speed statistics of a participant’s riding behaviour on the test track. Only the assisting ISA had a noticeable effect in this case. Decreased standard deviation and coefficient of variance suggest that speed variability was reduced, which should have positive implications for safety. Advisory ISA produced a small improvement in speed variance from the baseline but Assisting ISA system further reduced the speed variance. An evident ‘novelty effect’ was observed throughout the trial in that most participants appeared to ‘try out’ the ISA system by attempting to go over the speed limit in order to experience it. This inevitably influenced mean speed and percentage of speeding distance or duration. This novelty effect was presumably due to the fact that the motorcycle trial was a short-term trial as opposed to the car trials which gave the drivers four months of experience with ISA, and it could be expected that this novelty effect would disappear with increased exposure.
Table 11: Key statistics of logged speed data
Baseline Advisory ISA Assisting ISA
Mean speed (mph) 42.6 43.9 43.4 Maximum speed (mph) 104.0 104.0 91.0 Standard Deviation 16.9 16.6 12.9 Coefficient of Variance of speed 0.40 0.38 0.30 Percentage of travel distance over speed limit 44% 50% 50%
Percentage of travel time over speed limit 35% 41% 45%
56

Final Report
isa- UKintelligent speed adaptation
isa- UKintelligent speed adaptation
Figure 60 compares the choice of speed along the test track from this participating rider, which illustrates the novelty effect, which was especially prominent where the 40 mph speed limit applied. On the straight section where the 60 mph speed limit was applicable, ISA clearly showed its effect on speed reduction as the speeding distance when the ISA system was turned on was shortened in comparison with the baseline. Noticeably, Assisting ISA demonstrated a greater effect in speed reduction than Advisory ISA. The speed profiles shown in Figure 61 also demonstrates the effect of ISA on diminishing excessive speeds. Especially on the straight section where the 60 mph speed limit applied, Assisting ISA effectively reduced the travel speed. However, Advisory ISA showed little effect.
57
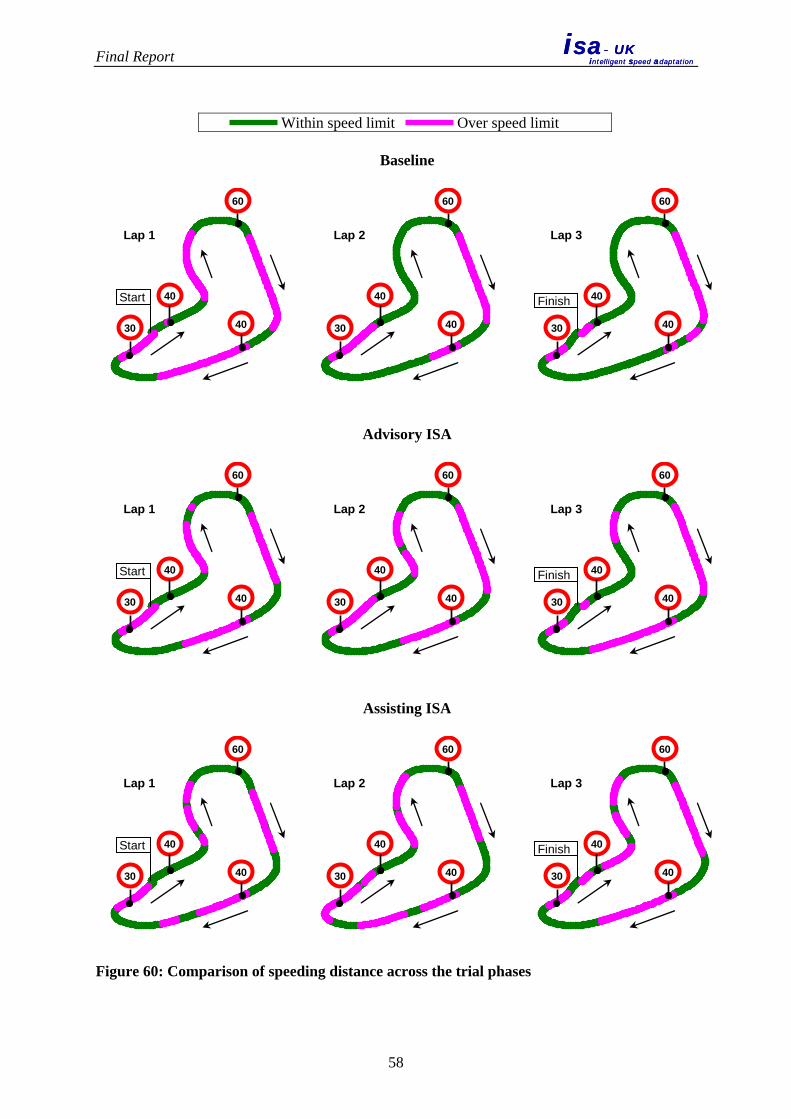
Final Report
isa- UKintelligent speed adaptation
isa- UKintelligent speed adaptation
Within speed limit Over speed limit Baseline
Lap 1
30
40
40
60
Start
Lap 2
30
40
40
60
Lap 3
30
40
40
60
Finish
Advisory ISA
Lap 1
30
40
40
60
Start
Lap 2
30
40
40
60
Lap 3
30
40
40
60
Finish
Assisting ISA
Lap 1
30
40
40
60
Start
Lap 2
30
40
40
60
Lap 3
30
40
40
60
Finish
Figure 60: Comparison of speeding distance across the trial phases
58
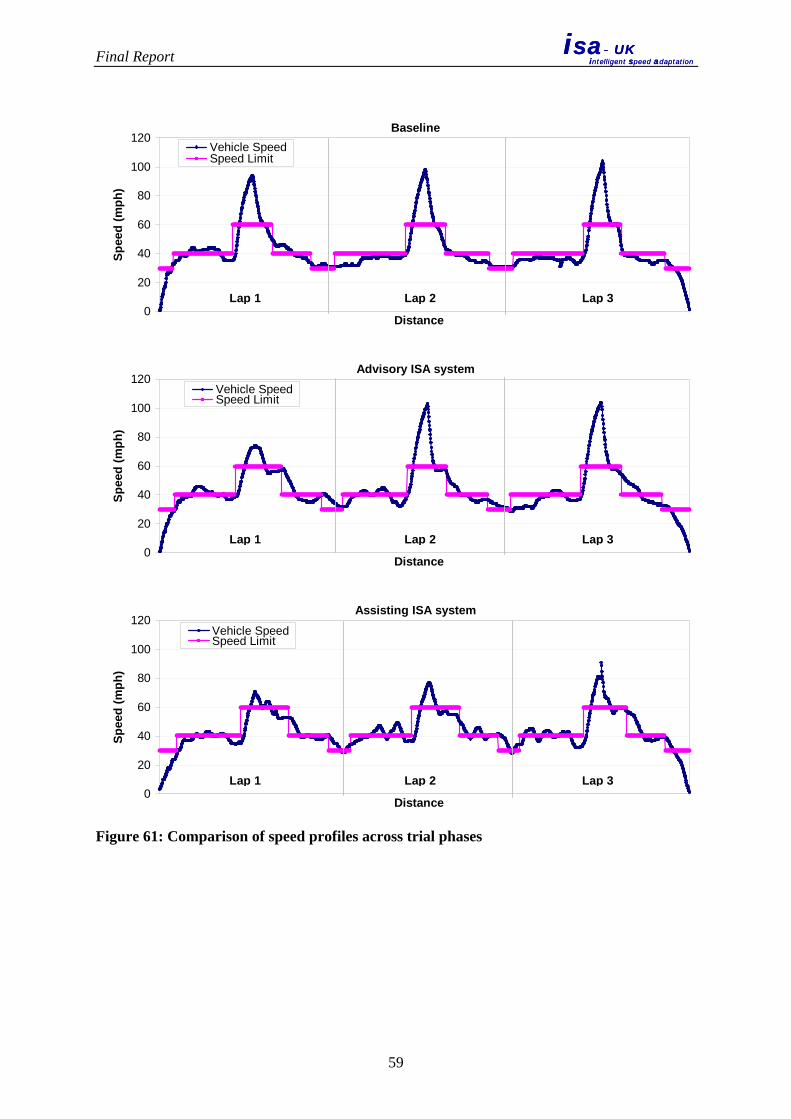
Final Report
isa- UKintelligent speed adaptation
isa- UKintelligent speed adaptation
Baseline
0
20
40
60
80
100
120
Distance
Spee
d (m
ph)
Vehicle SpeedSpeed Limit
Lap 1 Lap 3Lap 2
Advisory ISA system
0
20
40
60
80
100
120
Distance
Spee
d (m
ph)
Vehicle SpeedSpeed Limit
Lap 1 Lap 3Lap 2
Assisting ISA system
0
20
40
60
80
100
120
Distance
Spee
d (m
ph)
Vehicle SpeedSpeed Limit
Lap 1 Lap 3Lap 2
Figure 61: Comparison of speed profiles across trial phases
59
Final Report
isa- UKintelligent speed adaptation
isa- UKintelligent speed adaptation
5.4 Conclusions from the motorcycle trial
Adapting ISA to a motorcycle environment is a challenging proposition both in terms of the need to minimise weight and system volume and because of the requirement to consider the very different vehicle dynamics of a motorcycle. An ISA motorcycle was realised that offered a reliable, safe and effective vehicle demonstrator to enable proof-of-concept assessment trials. The results provide some promising evidence regarding ISA which until now has met with considerable resistance from the motorcycling community. Although riders expressed a greater reluctance to use and trust the assisting ISA system, the trial did demonstrate that experience with the ISA systems improved riders’ evaluations of their potential. Results were, however, lower than anticipated for the information system. Final comparisons of the number of riders who would at least consider having the systems fitted on their machines were surprisingly positive with 39% of riders willing to consider having an assisting ISA fitted In terms of attitudes, perceptions of “usefulness” increased after experience of the ISA functionality in comparison to opinions expressed before exposure to the ISA. However satisfaction ratings were more varied with the ISA “assisting” systems being judged significantly less satisfactory than “advisory” or “information” ISA functionality. Attitudes regarding the impact of ISA on riding indicated negative perceptions to “Joy”, “Overtaking” and “Accident Risk”, whereas positive perceptions to “Traffic safety”, “Irritation” and a perception of being “Controlled” were reported. Prior experience with assisting systems such as ABS indicates that there may be more initial resistance to them on the part of riders than there is to similar systems on the part of car drivers. However, once the benefits are clear, acceptance and take-up usually increase. In the future, the acceptability and consequent take-up of ISA technology may go through a similar cycle.
60

Final Report
isa- UKintelligent speed adaptation
isa- UKintelligent speed adaptation
6. SIMULATOR STUDY
6.1 Introduction
The simulator study was designed to quantify how the presence of a mandatory (with no opt-out function) or voluntary (with an opt-out function) ISA system might affect drivers’ overtaking decisions on rural roads. The study was undertaken on a driving simulator and allowed the presentation of a variety of overtaking scenarios in a safe and controlled environment. The road environment selected for investigation was driving on a rural road. Accident risk, particularly as regards serious and fatal crashes, is relatively high on UK rural roads compared to urban and motorway environments. Motorways are five times safer than the average single-carriageway road and twice as safe as dual-carriageways. This is often attributed to the lower consistency of road layout on rural roads, the potential to encounter turning and crossing traffic, and higher occurrences of overtaking and accidents involving departure from the carriageway. A system such as ISA that restricts maximum speed may have general “calming” benefits for rural roads. However, accidents on these roads are commonly associated with poor overtaking decisions and inappropriate curve negotiation speeds which may well be lower than the speed limit (Hughes, 1994). It is desirable to reduce the number of erroneous overtaking events, but it also has to be recognised that, as long as the infrastructure does not physically prevent overtaking, some drivers will always wish to engage in such behaviour, even when the perceived risk is relatively high. There have been numerous on-road and simulator studies that have investigated whether drivers behave differently when their vehicle is equipped with ISA. Various effects have been reported and these usually relate to their speed choice or headway keeping. Little research has been carried out to evaluate if and how drivers’ overtaking behaviour alters when using an ISA system. If drivers understand the limitations placed on their behaviour by ISA, they may choose to overtake less frequently. If, however, drivers fail to appreciate the nuances of ISA, they may continue to overtake and hence place themselves in risky situations. If positive changes in behaviour are evident, such as a decrease in the propensity of risky overtaking, then safety benefits on rural roads may be accrued. Conversely, the fact that drivers’ maximum speed is limited may mean that they spend more time in an overtaking situation, and thus increase the risk of colliding with oncoming traffic — drivers may not adapt their driving behaviour appropriately. If drivers are unable to accurately forecast the amount of time required for a particular overtaking manoeuvre, an opt-out function would allow drivers to override the system in order to exceed the posted speed limit and complete their overtaking manoeuvre more quickly. Thus whilst exceeding the speed limit is illegal, it may provide drivers with a mechanism for avoiding potential collisions. This study therefore implemented both a Mandatory and Voluntary ISA system in order to compare the effects of each on overtaking propensity and safety. 6.2 Method
6.2.1 Experimental design
Drivers took part in two trials in order to experience both mandatory (non-overridable) and voluntary (overridable) ISA. The trial with the mandatory system preceded the trial with the voluntary system. The two trials had the same experimental design. For both the mandatory and
61

Final Report
isa- UKintelligent speed adaptation
isa- UKintelligent speed adaptation
voluntary ISA trial, drivers completed two drives: in one of these drivers were informed that all the surrounding traffic was equipped with ISA, whilst in the other they were told that only 50% of the traffic was equipped with ISA (mixed fleet). Such an approach was taken to induce feelings of uncertainty in the overtaking scenario, so that drivers could not easily judge their ability to overtake the car in front. The order in which the driver encountered these two drives was randomised. Each of the drives contained 10 overtaking scenarios: in half of these scenarios ISA was available to the driver, in the other half ISA was not available (as indicated by the HMI). Again, this ordering was randomised across drivers. An example can be seen in Table 12, where this particular driver encountered the 100% fleet situation first (drive 1) and within this ISA was first switched off and then became available for the last five overtaking scenarios. In their second drive (drive 2), in the mixed fleet situation, the reverse ordering was presented.
Table 12: Example experimental design
Overtaking Scenario
Drive 1 100%
Drive 2 50%
1 ISA off ISA on 2 ISA off ISA on 3 ISA off ISA on 4 ISA off ISA on 5 ISA off ISA on 6 ISA on ISA off 7 ISA on ISA off 8 ISA on ISA off 9 ISA on ISA off 10 ISA on ISA off
Twenty-six drivers completed both trials, recruited from an existing database. Of the twelve males who took part, five were 25-39 years old and seven were 40-60 years. Nine females were aged 25-39 years and five 40-60 years. The experiment was performed using the University of Leeds Driving Simulator, shown in Figure 62. Further detail regarding the equipment contained in the simulator can be found in the separate report covering the Simulator Trials. The simulator incorporates an eight degree of freedom motion system. High and medium frequency lateral accelerations (e.g. a lane change) are simulated by sliding the whole vehicle cab and dome configuration along a railed gantry. Low frequency, sustained cues (e.g. a long, sweeping curve) are simulated using the tilt co-ordination of a 2.5t payload, electrically-driven hexapod. The whole gantry can also slide longitudinally along tracks to mimic the vehicle’s acceleration and braking. The 10m long rails and tracks allow 5m of effective travel in each direction. The motion-base enhances the fidelity of the simulator by proving realistic inertial forces to the driver during braking and cornering. It also provides lifelike high frequency heave, allowing the simulation of road roughness and bumps.
62

Final Report
isa- UKintelligent speed adaptation
isa- UKintelligent speed adaptation
Figure 62: The Leeds Driving Simulator
Limitations in projection can mean that the speed and distance of approaching vehicles in the opposing lane are difficult to perceive. Past experience suggests that drivers can be reticent to overtake due to these limitations. A scenario that allowed drivers to perform overtaking manoeuvres without having to consider the gaps in the opposing traffic was therefore created. This was achieved by modelling a 2+1 road section. 2+1 lanes refer to road sections where additional lanes are added to provide drivers with the opportunity to overtake on a single carriageway. The end of the 2+1 sections was marked by hatching which tapered two lanes down to one. Although this provided drivers with a protected overtaking opportunity, they were still obliged to perform manoeuvres safely (because of the hatching and the oncoming traffic in the opposing lane), taking into account the speed of the lead traffic, their maximum achievable speed and the length of the 2+1 section. The length of the 2+1 section was varied, based on extensive piloting. Scenarios that required drivers to make safety decisions, but that did not create floor or ceiling effects in the data (i.e. none or all drivers overtook) were created. The range of overtaking sections can be seen in Table 13. Of the ten overtaking scenarios encountered, six were configured as 2+1 sections (see Figure 63). This design allowed variation in task difficulty, ensuring that all drivers would have the opportunity to overtake — from those who actively search for overtaking opportunities to those who only do so when they believe the associated risk to be zero (no oncoming traffic and clear sight distance). The remaining four scenarios were 1+1 lane sections (1000m straight section). Of these latter four scenarios, two were marked with standard dashed centrelines (overtaking permitted), whilst the remaining two had solid double lining (overtaking prohibited).1 The latter scenario was introduced to evaluate whether drivers previously limited by ISA, would choose to overtake in a prohibited situation. In these four sections, the speed of the lead car decreased and there was no opposing traffic in order to encourage drivers to search for an overtaking opportunity.
1 In reality there would be no reason to prohibit overtaking on such a long straight section of road.
63
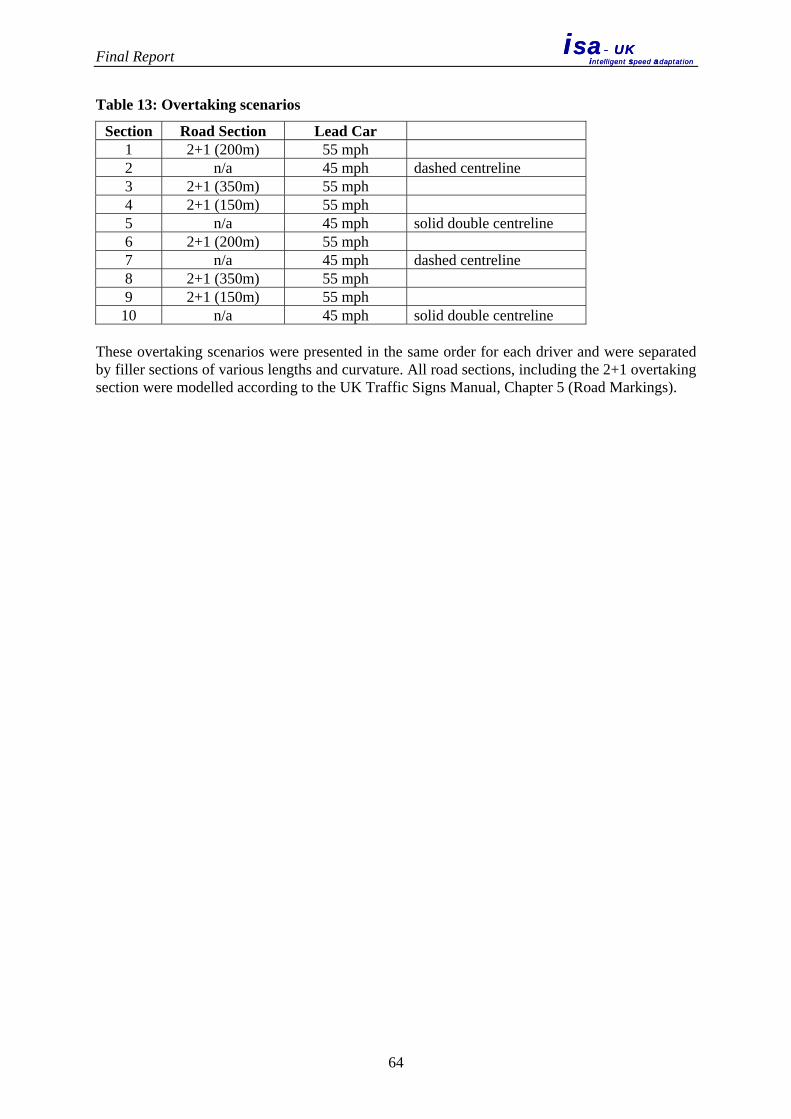
Final Report
isa- UKintelligent speed adaptation
isa- UKintelligent speed adaptation
Table 13: Overtaking scenarios
Section Road Section Lead Car 1 2+1 (200m) 55 mph 2 n/a 45 mph dashed centreline 3 2+1 (350m) 55 mph 4 2+1 (150m) 55 mph 5 n/a 45 mph solid double centreline 6 2+1 (200m) 55 mph 7 n/a 45 mph dashed centreline 8 2+1 (350m) 55 mph 9 2+1 (150m) 55 mph 10 n/a 45 mph solid double centreline
These overtaking scenarios were presented in the same order for each driver and were separated by filler sections of various lengths and curvature. All road sections, including the 2+1 overtaking section were modelled according to the UK Traffic Signs Manual, Chapter 5 (Road Markings).
64
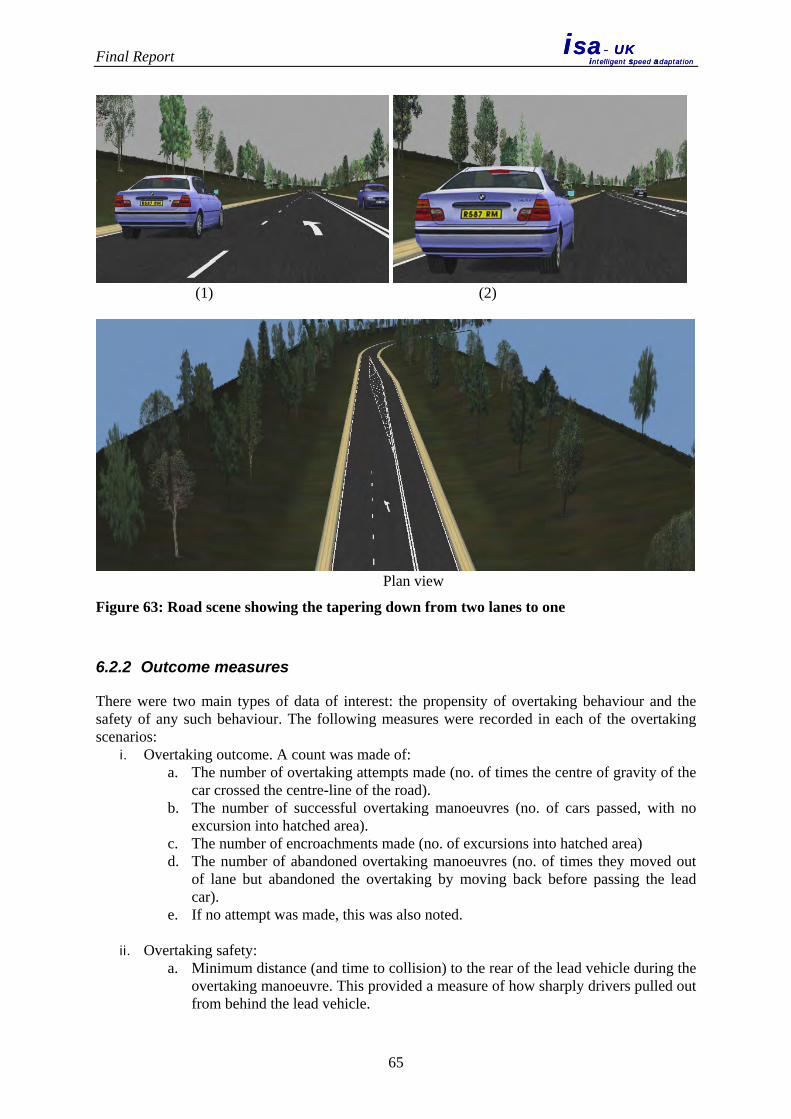
Final Report
isa- UKintelligent speed adaptation
isa- UKintelligent speed adaptation
(1) (2)
Plan view
Figure 63: Road scene showing the tapering down from two lanes to one
6.2.2 Outcome measures
There were two main types of data of interest: the propensity of overtaking behaviour and the safety of any such behaviour. The following measures were recorded in each of the overtaking scenarios:
i. Overtaking outcome. A count was made of: a. The number of overtaking attempts made (no. of times the centre of gravity of the
car crossed the centre-line of the road). b. The number of successful overtaking manoeuvres (no. of cars passed, with no
excursion into hatched area). c. The number of encroachments made (no. of excursions into hatched area) d. The number of abandoned overtaking manoeuvres (no. of times they moved out
of lane but abandoned the overtaking by moving back before passing the lead car).
e. If no attempt was made, this was also noted.
ii. Overtaking safety: a. Minimum distance (and time to collision) to the rear of the lead vehicle during the
overtaking manoeuvre. This provided a measure of how sharply drivers pulled out from behind the lead vehicle.
65

Final Report
isa- UKintelligent speed adaptation
isa- UKintelligent speed adaptation
b. Minimum distance to the front of the lead vehicle during the overtaking manoeuvre. This provided a measure of how sharply a driver pulled back in front of the lead vehicle
c. Time spent completing the overtaking manoeuvre d. Maximum speed reached during the overtaking manoeuvre e. Excursion into hatched area and the time spent in the hatched area
Behavioural data were also collected in the filler sections, mainly to discover the effect of ISA on car-following behaviour. In addition to the behavioural data, subjective data on acceptability and workload were obtained. Due to the non-parametric nature of some of the data (frequencies), log-linear analysis (a generalization of chi-square analysis) was used in order to examine the impact of several categorical variables together, as well as the interactions of each variable in modelling the data. Elsewhere, repeated measures ANOVA were used where appropriate. Exploratory analysis revealed that penetration rate of ISA (100% v 50%) in the surrounding traffic had no significant effect on overtaking behaviour. The analysis therefore concentrated on the effect of System Type (mandatory/voluntary), ISA State (on/off) and Overtaking Scenario (where 2+1 sections were either 150, 200, or 350m) on the various measures of overtaking behaviour described above.
6.3 Results
6.3.1 Workload and acceptability
Previous research in the field has shown that drivers report changes in mental workload when driving with ISA. Increases in scores pertaining to “time pressure” and “frustration” have often been found (Comte, 2000; Várhelyi and Mäkinen, 2001). Acceptability scores tend to differ, depending on the type of ISA under investigation, but generally a mandatory ISA is less acceptable than a voluntary one.
0102030405060708090
100
Men
tal
Dem
and
Phys
ical
Dem
and
Perfo
rman
ce
Effo
rt
Frus
tratio
n
Tim
ePr
essu
re
Mea
n NA
SA-
TLX
Rat
ing
Mandatory ISA Voluntary ISA Figure 64: Mental workload scores
Workload was measured using the NASA-TLX (Byers et al, 1989) as shown in Figure 64. Analysis compared drivers’ workload ratings with each system across each dimension. A repeated measures ANOVA indicated a significant main effect for System Type on the dimension
66
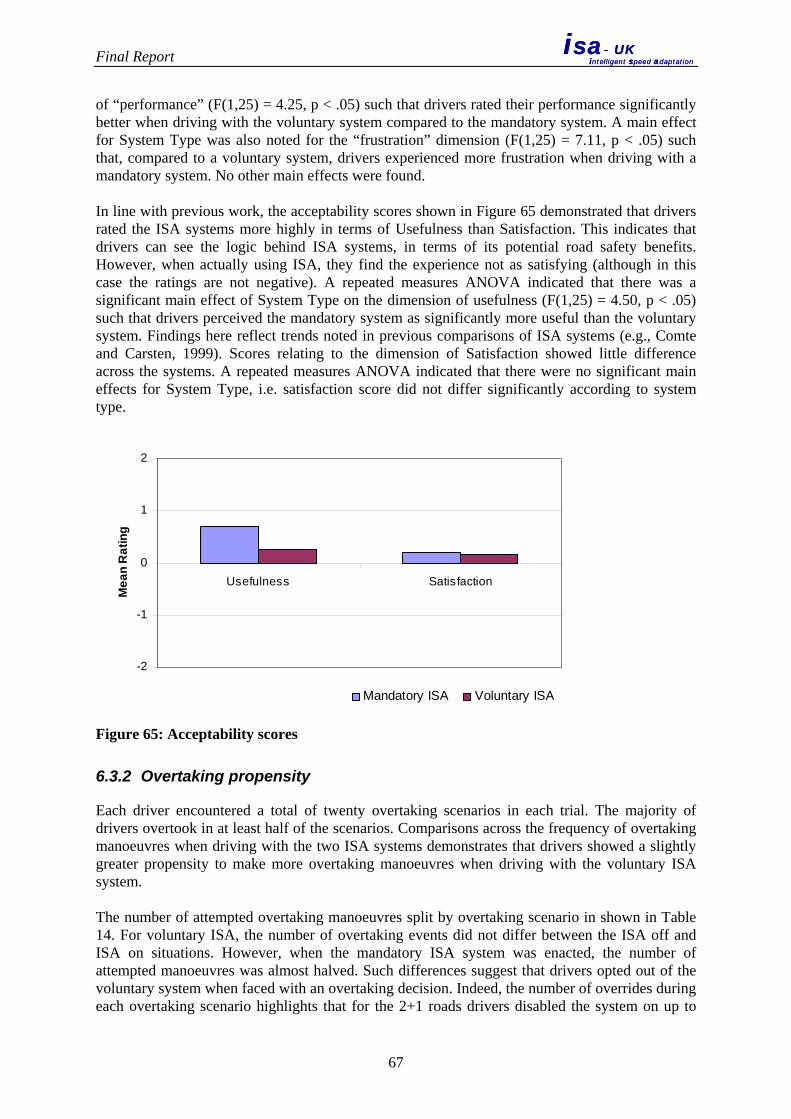
Final Report
isa- UKintelligent speed adaptation
isa- UKintelligent speed adaptation
of “performance” (F(1,25) = 4.25, p < .05) such that drivers rated their performance significantly better when driving with the voluntary system compared to the mandatory system. A main effect for System Type was also noted for the “frustration” dimension (F(1,25) = 7.11, p < .05) such that, compared to a voluntary system, drivers experienced more frustration when driving with a mandatory system. No other main effects were found. In line with previous work, the acceptability scores shown in Figure 65 demonstrated that drivers rated the ISA systems more highly in terms of Usefulness than Satisfaction. This indicates that drivers can see the logic behind ISA systems, in terms of its potential road safety benefits. However, when actually using ISA, they find the experience not as satisfying (although in this case the ratings are not negative). A repeated measures ANOVA indicated that there was a significant main effect of System Type on the dimension of usefulness (F(1,25) = 4.50, p < .05) such that drivers perceived the mandatory system as significantly more useful than the voluntary system. Findings here reflect trends noted in previous comparisons of ISA systems (e.g., Comte and Carsten, 1999). Scores relating to the dimension of Satisfaction showed little difference across the systems. A repeated measures ANOVA indicated that there were no significant main effects for System Type, i.e. satisfaction score did not differ significantly according to system type.
-2
-1
0
1
2
Usefulness Satisfaction
Mea
n R
atin
g
Mandatory ISA Voluntary ISA
Figure 65: Acceptability scores
6.3.2 Overtaking propensity
Each driver encountered a total of twenty overtaking scenarios in each trial. The majority of drivers overtook in at least half of the scenarios. Comparisons across the frequency of overtaking manoeuvres when driving with the two ISA systems demonstrates that drivers showed a slightly greater propensity to make more overtaking manoeuvres when driving with the voluntary ISA system. The number of attempted overtaking manoeuvres split by overtaking scenario in shown in Table 14. For voluntary ISA, the number of overtaking events did not differ between the ISA off and ISA on situations. However, when the mandatory ISA system was enacted, the number of attempted manoeuvres was almost halved. Such differences suggest that drivers opted out of the voluntary system when faced with an overtaking decision. Indeed, the number of overrides during each overtaking scenario highlights that for the 2+1 roads drivers disabled the system on up to
67
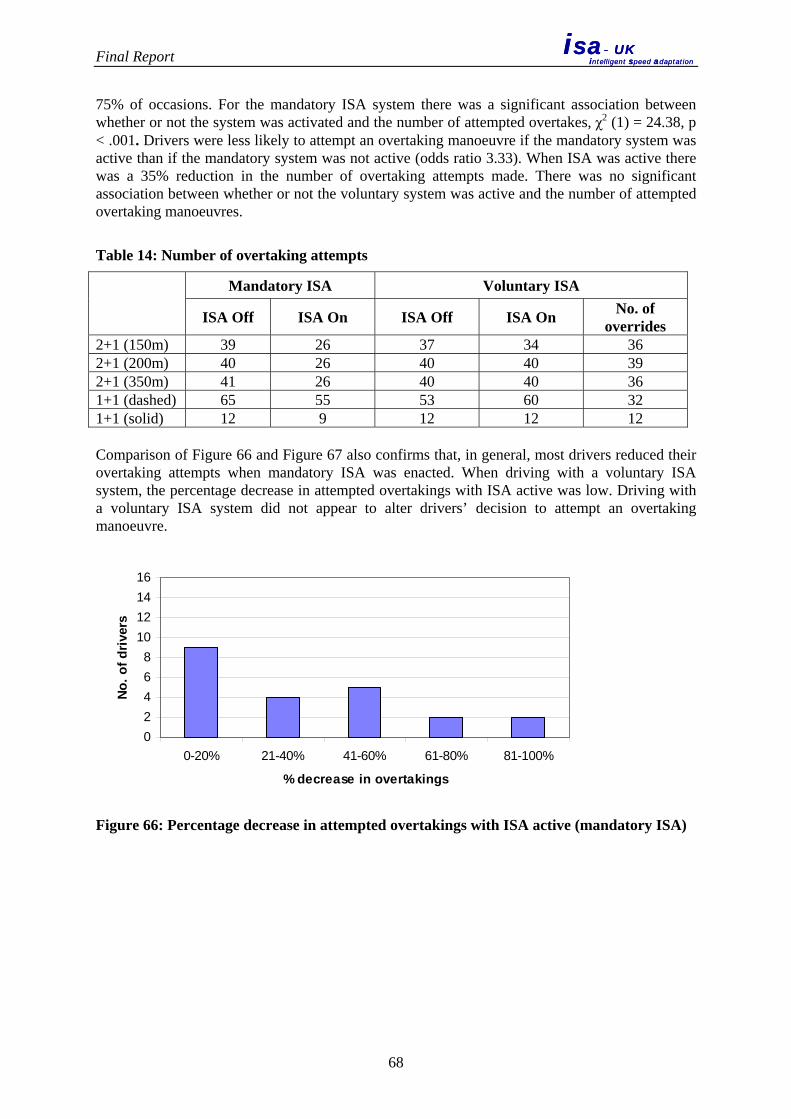
Final Report
isa- UKintelligent speed adaptation
isa- UKintelligent speed adaptation
75% of occasions. For the mandatory ISA system there was a significant association between whether or not the system was activated and the number of attempted overtakes, χ2 (1) = 24.38, p < .001. Drivers were less likely to attempt an overtaking manoeuvre if the mandatory system was active than if the mandatory system was not active (odds ratio 3.33). When ISA was active there was a 35% reduction in the number of overtaking attempts made. There was no significant association between whether or not the voluntary system was active and the number of attempted overtaking manoeuvres.
Table 14: Number of overtaking attempts
Mandatory ISA Voluntary ISA
ISA Off ISA On ISA Off ISA On No. of overrides
2+1 (150m) 39 26 37 34 36 2+1 (200m) 40 26 40 40 39 2+1 (350m) 41 26 40 40 36 1+1 (dashed) 65 55 53 60 32 1+1 (solid) 12 9 12 12 12 Comparison of Figure 66 and Figure 67 also confirms that, in general, most drivers reduced their overtaking attempts when mandatory ISA was enacted. When driving with a voluntary ISA system, the percentage decrease in attempted overtakings with ISA active was low. Driving with a voluntary ISA system did not appear to alter drivers’ decision to attempt an overtaking manoeuvre.
02468
10121416
0-20% 21-40% 41-60% 61-80% 81-100%
% decrease in overtakings
No. o
f driv
ers
Figure 66: Percentage decrease in attempted overtakings with ISA active (mandatory ISA)
68

Final Report
isa- UKintelligent speed adaptation
isa- UKintelligent speed adaptation
0
2
4
6
8
10
12
14
16
0-20% 21-40% 41-60% 61-80% 81-100%
% decrease in overtakings
No. o
f dri
vers
Figure 67: Percentage decrease in attempted overtakings with ISA active (voluntary ISA)
6.3.3 Overtaking outcome
When driving with mandatory ISA, successful overtaking attempts were less likely when the system was active (see Figure 68). This trend was not apparent when driving with a voluntary ISA system where the number of successful attempts when driving with ISA on and off was almost identical (see Figure 69). For the mandatory ISA system, there was a significant association between whether or not the system was activated and the number of successful overtakes, χ2 (1) = 55.85, p < .001. Drivers were less likely to make a successful overtaking manoeuvre if the mandatory system was active than if the mandatory system was not active (odds ratio 6.10). When ISA was active there was a 59% reduction in the number of successful overtaking attempts made. There was no significant association between whether or not the voluntary system was active and the number of successful overtaking manoeuvres. The small number of abandoned overtaking manoeuvres prohibited a statistical test of the relationship between the key variables and these manoeuvres. Although it is encouraging that there were relatively few instances of these safety critical manoeuvres, those that did occur tended to happen when mandatory ISA was active (see Figure 68 and Figure 69).
69
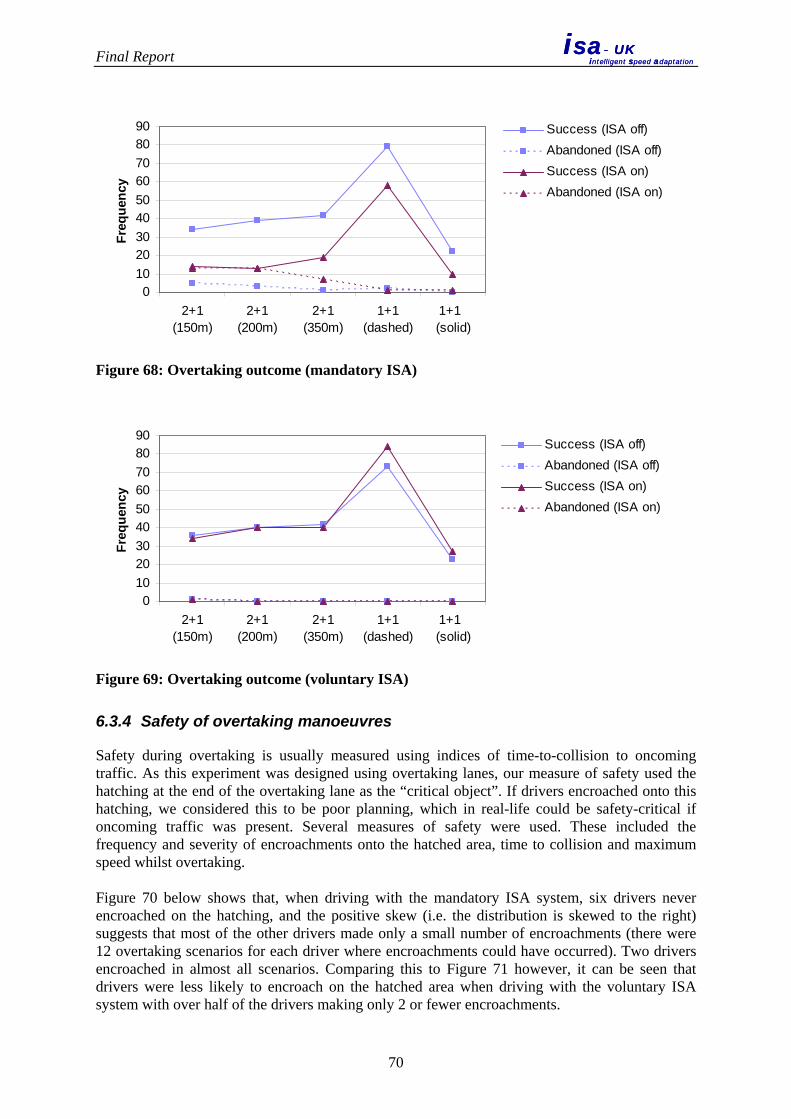
Final Report
isa- UKintelligent speed adaptation
isa- UKintelligent speed adaptation
0102030405060708090
2+1(150m)
2+1(200m)
2+1(350m)
1+1(dashed)
1+1 (solid)
Freq
uenc
ySuccess (ISA off)Abandoned (ISA off)Success (ISA on)Abandoned (ISA on)
Figure 68: Overtaking outcome (mandatory ISA)
0102030405060708090
2+1(150m)
2+1(200m)
2+1(350m)
1+1(dashed)
1+1 (solid)
Freq
uenc
y
Success (ISA off)Abandoned (ISA off)Success (ISA on)Abandoned (ISA on)
Figure 69: Overtaking outcome (voluntary ISA)
6.3.4 Safety of overtaking manoeuvres
Safety during overtaking is usually measured using indices of time-to-collision to oncoming traffic. As this experiment was designed using overtaking lanes, our measure of safety used the hatching at the end of the overtaking lane as the “critical object”. If drivers encroached onto this hatching, we considered this to be poor planning, which in real-life could be safety-critical if oncoming traffic was present. Several measures of safety were used. These included the frequency and severity of encroachments onto the hatched area, time to collision and maximum speed whilst overtaking. Figure 70 below shows that, when driving with the mandatory ISA system, six drivers never encroached on the hatching, and the positive skew (i.e. the distribution is skewed to the right) suggests that most of the other drivers made only a small number of encroachments (there were 12 overtaking scenarios for each driver where encroachments could have occurred). Two drivers encroached in almost all scenarios. Comparing this to Figure 71 however, it can be seen that drivers were less likely to encroach on the hatched area when driving with the voluntary ISA system with over half of the drivers making only 2 or fewer encroachments.
70

Final Report
isa- UKintelligent speed adaptation
isa- UKintelligent speed adaptation
012345678
0 1 2 3 4 5 6 7 8 9 10 11 12
No. of encroachments
No. o
f dri
vers
Figure 70: Frequency of encroachments (mandatory ISA)
012345678
0 1 2 3 4 5 6 7 8 9 10 11 12
No. of encroachments
No. o
f dri
vers
Figure 71: Frequency of encroachments (voluntary ISA)
Overall the frequency of encroachments was relatively similar across systems and ISA states, although encroachments were more frequent in the shorter 2+1 sections. The ratio of encroachments to non-encroachments was roughly 40:60 for the 150m scenario, 20:80 for the 200m scenario and 10:90 for the 350m scenario. In addition, the amount of time spent in the hatched area was measured, as an index of encroachment severity (Figure 72 and Figure 73). In general, when mandatory ISA was active, encroachments were more severe, with drivers spending an additional one second in the hatched area. Due to the limited number of occurrences statistical tests could not be performed.
71
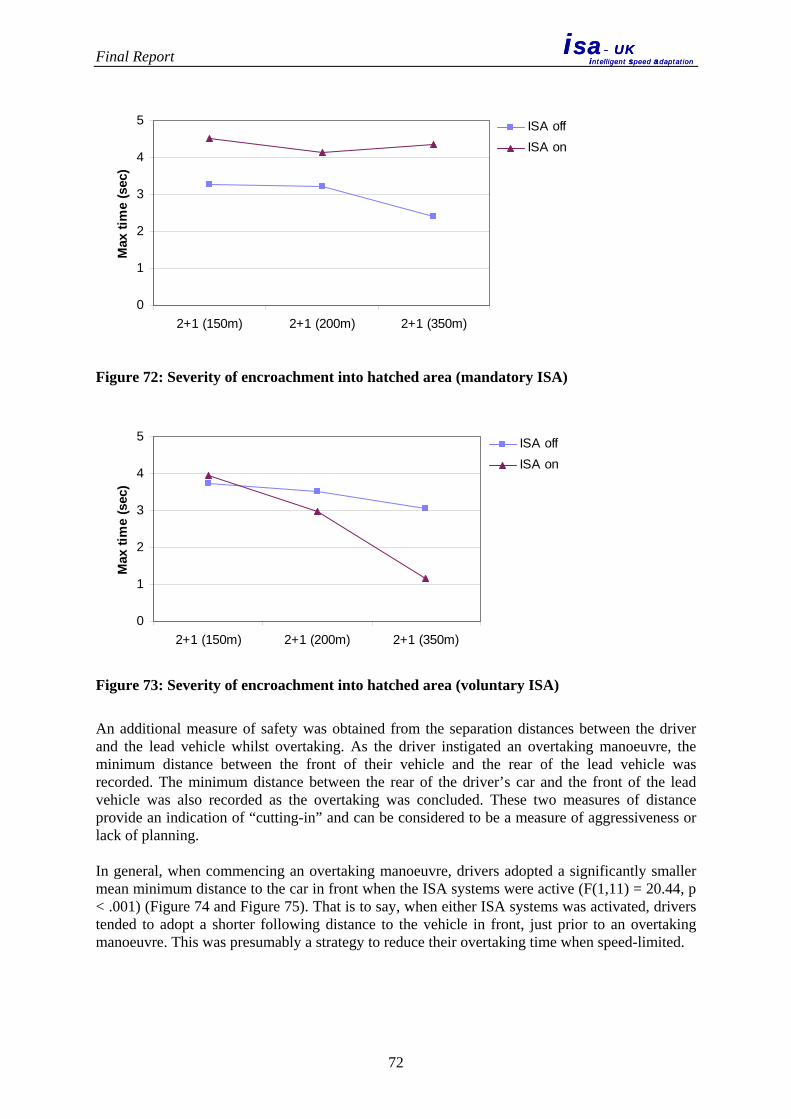
Final Report
isa- UKintelligent speed adaptation
isa- UKintelligent speed adaptation
0
1
2
3
4
5
2+1 (150m) 2+1 (200m) 2+1 (350m)
Max
tim
e (s
ec)
ISA offISA on
Figure 72: Severity of encroachment into hatched area (mandatory ISA)
0
1
2
3
4
5
2+1 (150m) 2+1 (200m) 2+1 (350m)
Max
tim
e (s
ec)
ISA offISA on
Figure 73: Severity of encroachment into hatched area (voluntary ISA)
An additional measure of safety was obtained from the separation distances between the driver and the lead vehicle whilst overtaking. As the driver instigated an overtaking manoeuvre, the minimum distance between the front of their vehicle and the rear of the lead vehicle was recorded. The minimum distance between the rear of the driver’s car and the front of the lead vehicle was also recorded as the overtaking was concluded. These two measures of distance provide an indication of “cutting-in” and can be considered to be a measure of aggressiveness or lack of planning. In general, when commencing an overtaking manoeuvre, drivers adopted a significantly smaller mean minimum distance to the car in front when the ISA systems were active (F(1,11) = 20.44, p < .001) (Figure 74 and Figure 75). That is to say, when either ISA systems was activated, drivers tended to adopt a shorter following distance to the vehicle in front, just prior to an overtaking manoeuvre. This was presumably a strategy to reduce their overtaking time when speed-limited.
72
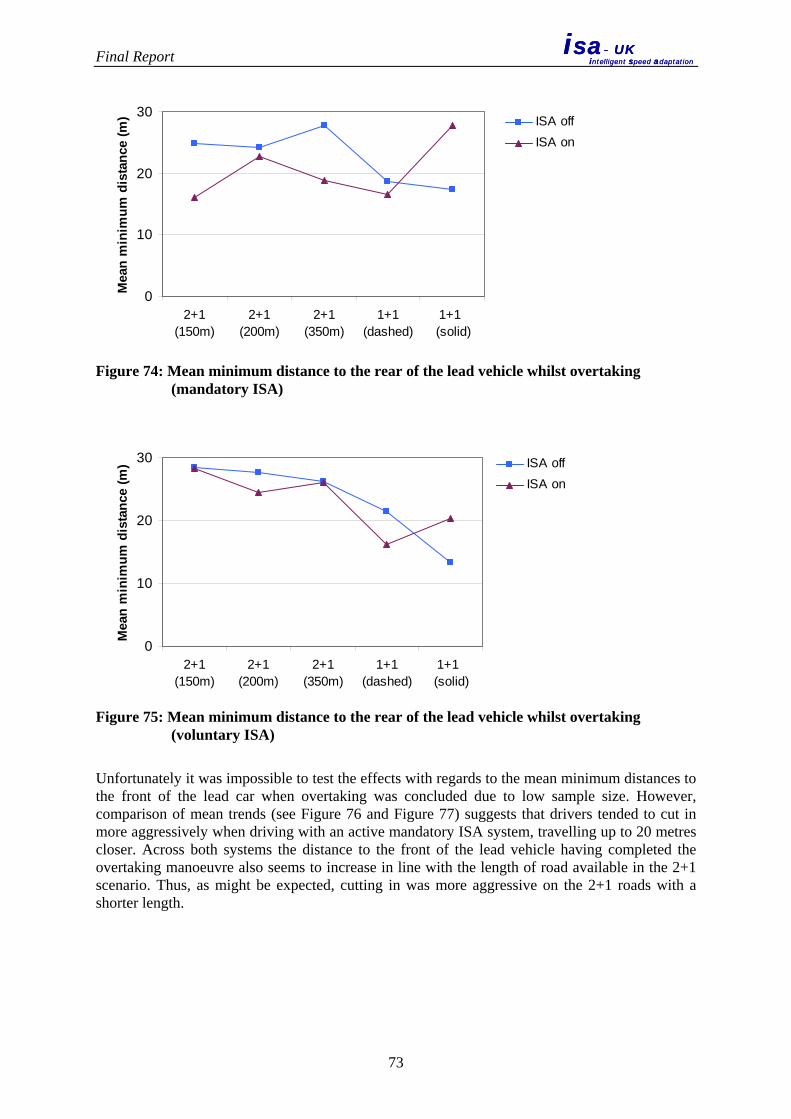
Final Report
isa- UKintelligent speed adaptation
isa- UKintelligent speed adaptation
0
10
20
30
2+1(150m)
2+1(200m)
2+1(350m)
1+1(dashed)
1+1 (solid)
Mea
n m
inim
um d
ista
nce
(m) ISA off
ISA on
Figure 74: Mean minimum distance to the rear of the lead vehicle whilst overtaking
(mandatory ISA)
0
10
20
30
2+1(150m)
2+1(200m)
2+1(350m)
1+1(dashed)
1+1 (solid)
Mea
n m
inim
um d
ista
nce
(m) ISA off
ISA on
Figure 75: Mean minimum distance to the rear of the lead vehicle whilst overtaking
(voluntary ISA)
Unfortunately it was impossible to test the effects with regards to the mean minimum distances to the front of the lead car when overtaking was concluded due to low sample size. However, comparison of mean trends (see Figure 76 and Figure 77) suggests that drivers tended to cut in more aggressively when driving with an active mandatory ISA system, travelling up to 20 metres closer. Across both systems the distance to the front of the lead vehicle having completed the overtaking manoeuvre also seems to increase in line with the length of road available in the 2+1 scenario. Thus, as might be expected, cutting in was more aggressive on the 2+1 roads with a shorter length.
73
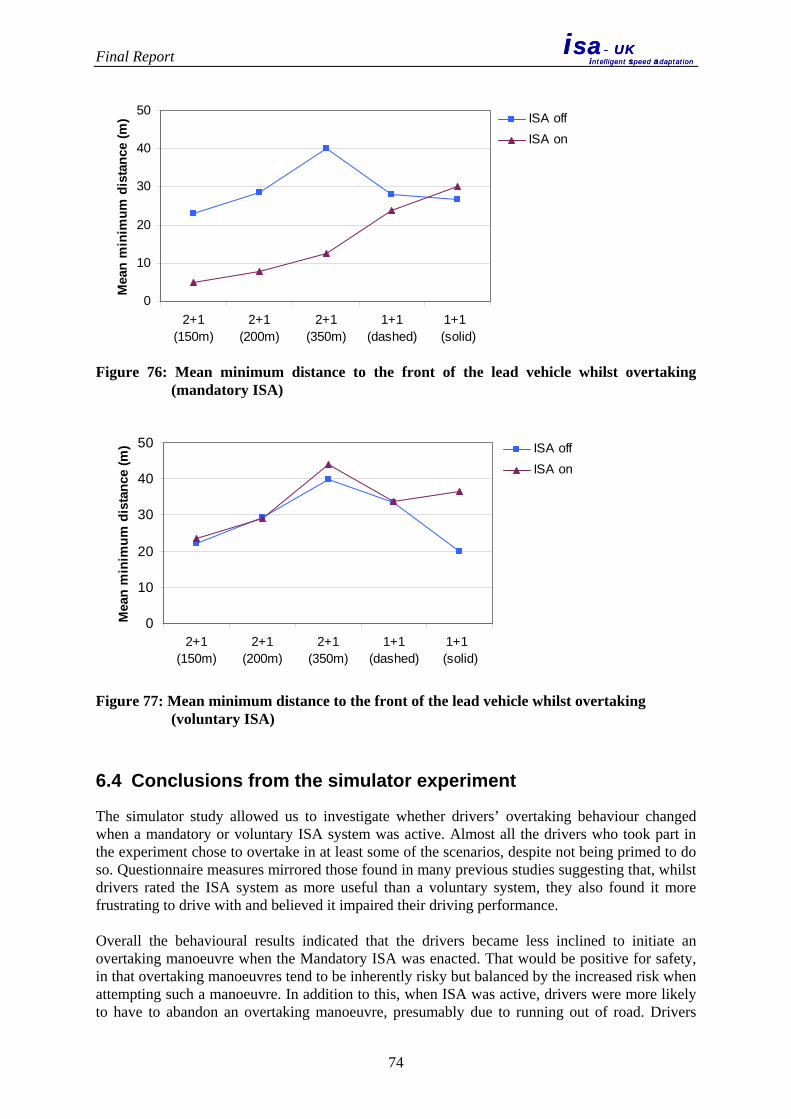
Final Report
isa- UKintelligent speed adaptation
isa- UKintelligent speed adaptation
0
10
20
30
40
50
2+1(150m)
2+1(200m)
2+1(350m)
1+1(dashed)
1+1 (solid)
Mea
n m
inim
um d
ista
nce
(m) ISA off
ISA on
Figure 76: Mean minimum distance to the front of the lead vehicle whilst overtaking
(mandatory ISA)
0
10
20
30
40
50
2+1(150m)
2+1(200m)
2+1(350m)
1+1(dashed)
1+1 (solid)
Mea
n m
inim
um d
ista
nce
(m) ISA off
ISA on
Figure 77: Mean minimum distance to the front of the lead vehicle whilst overtaking
(voluntary ISA)
6.4 Conclusions from the simulator experiment
The simulator study allowed us to investigate whether drivers’ overtaking behaviour changed when a mandatory or voluntary ISA system was active. Almost all the drivers who took part in the experiment chose to overtake in at least some of the scenarios, despite not being primed to do so. Questionnaire measures mirrored those found in many previous studies suggesting that, whilst drivers rated the ISA system as more useful than a voluntary system, they also found it more frustrating to drive with and believed it impaired their driving performance. Overall the behavioural results indicated that the drivers became less inclined to initiate an overtaking manoeuvre when the Mandatory ISA was enacted. That would be positive for safety, in that overtaking manoeuvres tend to be inherently risky but balanced by the increased risk when attempting such a manoeuvre. In addition to this, when ISA was active, drivers were more likely to have to abandon an overtaking manoeuvre, presumably due to running out of road. Drivers
74

Final Report
isa- UKintelligent speed adaptation
isa- UKintelligent speed adaptation
were not inclined to carry on with an ill-timed overtaking and chose to drop back behind the lead car — they did not encroach on the hatched area more frequently than when ISA was inactive. However, when the amount of time spent in the hatched area was considered, those with ISA active spent longer there. So whilst the frequency of poor planning was lower, the severity when it did occur was higher with ISA. These effects were not apparent in the case of the voluntary ISA system where there was no difference in the number of attempted and successful overtakes when ISA was inactive or active. Given this and the frequency with which drivers overrode the system, drivers seem to routinely disable the voluntary ISA system when making an overtaking manoeuvre. The quality of the overtaking manoeuvre was also affected when mandatory ISA was active — although the overtaking initiation was comparable, when drivers pulled back in, they did so more sharply with a smaller distance to the front of the lead vehicle. This is presumably due to drivers running out of road length and ties in with the encroachment results presented above. With ISA inactive, drivers overtook the lead car 10 mph faster and thus were able to rejoin the lane more quickly. Driving at higher speeds could increase the frequency of loss of control accidents. However, not being able to rejoin the inside lane swiftly brings its own risks. Under any full implementation of ISA, drivers would need to learn the limitations of their vehicle in overtaking situations. Again such effects were not observed with the voluntary ISA system. The activation of voluntary ISA did not affect drivers ‘cutting in’ behaviour or maximum speed when overtaking. Results again suggest that drivers quickly learned to disable the system when performing an overtaking manoeuvre. Overall, the voluntary ISA system had little influence on drivers overtaking behaviour. However, with the mandatory system, whilst the propensity to overtake reduced, the quality of those manoeuvres undertaken was compromised.
75

Final Report
isa- UKintelligent speed adaptation
isa- UKintelligent speed adaptation
7. IMPLEMENTATION SCENARIOS
7.1 Introduction
The aim of this part of the project work was to examine Intelligent Speed Adaptation from the perspective of a social cost benefit analysis, i.e. to examine whether the potential social benefits from implementing ISA exceed the costs. The investigation envisages a future in which there is a variety of ISA systems on the market. A scenario-based approach was adopted, in which there are alternative visions of the future and the rate of adoption of various types of ISA depends on the scenario. It should be made clear that the scenarios chosen are exemplar ones, and that it is possible to envisage alternative ones or mixes of the two different ones that have been proposed here. Previous work carried out in the External Vehicle Speed Control project (Carsten and Tate, 2000) showed that, while there are considerable potential benefits from fuel savings with ISA, these were far outweighed by the potential benefits from reduced accident involvement and reduced accident severity. Consequently, the analysis reported here was restricted to the accident-saving potential of ISA.
7.2 Method
7.2.1 Systems and scenarios
The ISA system envisaged here was an autonomous (in-vehicle) ISA, in which each vehicle uses Global Positioning Systems (GPS) and dead-reckoning, to locate itself on a digital map, held in the vehicle, and reads the appropriate speed limit from that map. Three system variants were envisaged, each of which used fixed speed limit information i.e. the permanent speed limits:
1. Advisory ISA Provision of in-vehicle information of current speed limit. The driver controls vehicle road speed in the normal way via brake and accelerator. An auditory signal is given when speed limit is exceeded, or a new speed limit is encountered. 2. Voluntary ISA Provision of in-vehicle information of current posted speed limit, which is used by default as a speed limiting value by the vehicle. Drivers can choose to disable the use of this information to cancel the speed limiting function and regain full manual control until a new speed limit is encountered and/or road speed drops beneath the current speed limit at which point ISA speed limitation resumes. 3. Mandatory (Non-Overridable) ISA Provision of in-vehicle information of current posted speed limit, which is used as a speed limiting value by the vehicle. Drivers cannot disable the use of this information to cancel the speed limiting function and regain full manual control.
76
Final Report
isa- UKintelligent speed adaptation
isa- UKintelligent speed adaptation
Two scenarios were developed for implementation strategies:
1. Market Driven Vehicle owners (and operators) may choose to purchase and fit a commercially available ISA variant, which might an Advisory ISA. 2. Authority Driven Although this scenario begins with some drivers choosing to equip their vehicles with ISA (as in the Market Driven scenario above), the Government or the EU at some point mandates the fitment of ISA on new vehicles and/or the retro-refitting of existing fleets to accelerate take-up, ensuring high levels of penetration.
It is important to note that the system variants and implementation strategies considered here are not necessarily independent of each other. Both advisory and voluntary ISA are envisaged in the Market Driven scenario, while the Authority Driven scenario also envisages both systems, although in quite different proportions. The Authority Driven scenarios also envisages that the use of ISA on equipped vehicles is eventually made compulsory, i.e. that Voluntary ISA is converted to Mandatory ISA. It should be noted that, under the Authority Driven scenario, the initial assumption is that the mandatory ISA variant would be switched on once 99% of vehicles are fitted with the voluntary system. This is a modelling assumption; earlier enabling of mandatory usage is feasible but would require more retrofitting to older vehicles. However, this would potentially create an attractive market for vehicles not fitted with the mandatory system, which would be undesirable on safety grounds.
7.2.2 Analysis process
The analysis process was as follows:
1. The impact of ISA on speed profiles on roads with different speed limits was estimated. The major source of information on speed with ISA was the data collected in the project’s car trials. Where required, the data from the project’s field trials was supplemented with data from other ISA trials.
2. A review was conducted of empirically derived relationships between driving speed and crash risk. A selection of candidate models for each speed limit was made. Three different combinations of models to be used in assessing the impact of ISA on crashes were selected. Each of the three combinations of model was then applied to the speed profiles to predict the reduction in all injury crashes associated with the ISA variants.
3. The crashes involving potentially ISA capable vehicles were identified and future
crash levels were predicted, taking into account increases in the volume of travel and the downward trend in crash rate.
4. The vehicle-based costs associated with ISA were estimated and the size of the future
ISA vehicle fleet was estimated for each year from 2010 until 2070. The fleet penetration of ISA was then determined for each year of the analysis, based on the expected fleet size, scrappage of older vehicles, the number the number of new vehicles entering the fleet and the two implementation scenarios.
5. The reductions in crashes associated with the two ISA implementation scenarios were
estimated for each speed limit, based on the future crash levels and the proportion of the fleet fitted with each ISA variant. Two different approaches were used for
77
Final Report
isa- UKintelligent speed adaptation
isa- UKintelligent speed adaptation
translating those estimates of overall reductions into separate estimates for reductions in fatal, serious and slight injury crashes.
6. An assessment of the economic benefit of ISA was undertaken. The procedure used
followed the guidance issued by the DfT for the appraisal of transport schemes (see http://www.webtag.org.uk/index.htm) including the advice to use a 60-year appraisal period for the calculation of costs and benefits. Thus the analysis was based on the discounted costs and benefits of ISA over the 60 year period 2010 to 2070. The major cost and benefit components were identified and the sensitivity of the resulting benefit cost ratio, to changes in these key inputs was investigated.
7.3 Effect of ISA on speed and crashes
The crash reduction benefits that will be achieved by ISA are dependent on: • the impact that ISA has on the speed choices of drivers, and the crash risk reduction
associated with changes in speed profiles, • the volume of travel in future years, and the crash risk consequences associated with that
travel both with and without ISA.
7.3.1 Speeds with ISA
The impact of Voluntary ISA on driver speed was determined using data from the field trials conducted in this project (see section 3 and “Overall Field Trial Results” report). The same data can be used to estimate the effect of a Mandatory ISA on driver speed by considering only those situations in Phase 2 of the trials was ISA was not overridden (i.e. when there was no activation of the opt-out feature of the tested system). The impact of ISA on vehicle speeds was analysed separately by speed limit, i.e. 20 mph, 30 mph, 40 mph, 50 mph, 60 mph, and 70 mph. The trials in this project did not specifically test an Advisory ISA. In order to estimate the impact of Advisory ISA, the findings of the French project LAVIA (Ehrlich et al., 2006) were applied. LAVIA investigated the impact of Advisory and Voluntary ISA on the proportion of journey time exceeding the speed limit on roads with different speed limits. The relative impact of the Advisory as opposed to the Voluntary ISA from LAVIA was applied to the Voluntary speed profiles from ISA-UK to produce a synthesised impact for Advisory ISA in the UK.
7.3.2 Selection of models of speed-crash relationships
There has been a large body of work using empirical methods to determine the relationship between speed and crash risk. Studies have employed a variety of methodologies to collect and analyse their data. A recent summary of the literature can be found in Aarts and van Schagen (2006). Given the different methodologies used in data collection, the different environments in which the data have been collected and the variety of analytical methods applied to the observed and collected data, it is not surprising that individual studies differ on the precise relationship between speed and crash risk. However, there is broad consensus about the fact that traffic speed or the travel speed of the individual driver is a very major determinant of crash and injury risk, about the fact that risk goes down when speed is reduced and goes up when speed is changed upwards and about the relationship between speed and risk being causal.
78

Final Report
isa- UKintelligent speed adaptation
isa- UKintelligent speed adaptation
There is no single best model in the literature that can be applied for the case of ISA. Rather, there is a choice of models with different levels of advantage and disadvantage for safety prediction concerning ISA. The analyst therefore has to select those models with the fewest disadvantages and interpret the results accordingly. It should be recognised that statistical models are a simplified representation of reality and no model is perfect. Because no “perfect” set of models existed, the more theoretically appropriate speed-safety models were first selected and then some alternative combinations of models were applied. The first combination of models was termed the Base Combination of crash reduction models, and the resulting crash reduction factors for each speed limit are given in Table 15 for 100% ISA penetration.
Table 15: Crash reduction factors by speed limit and crash severity for the Base Combination of crash reduction models
Speed Limit Crash Reduction Factors (x)1 for
All Reported Injury Crashes Advisory ISA Voluntary ISA Mandatory ISA
20 mph 0.964 0.646 0.371 30 mph 0.997 0.850 0.604 40 mph 0.993 0.747 0.486 50 mph 0.959 0.836 0.717 60 mph 0.919 0.881 0.861 70 mph 0.965 0.911 0.824
1 Note crashes with ISA = x crashes without ISA, assuming 100% ISA penetration in the fleet While the Base Combination of crash reduction models predicts that Mandatory ISA will deliver very large benefits on 20 mph roads, the impact of any over prediction is minimal as 20 mph roads account for a very small number of crashes and thus the impact of this large factor will be minimal. The Second Combination of models and the crash reduction factors for it are shown in Table 16. It can be seen that this combination gives substantially greater impacts for Voluntary and Mandatory ISA on 30 and 40 mph roads.
Table 16: Crash reduction factors by speed limit and crash severity for the Second Combination of crash reduction models
Speed Limit Crash Reduction Factors (x) for
All Reported Injury Crashes Advisory ISA Voluntary ISA Mandatory ISA
20 mph 0.964 0.646 0.371 30 mph 0.997 0.571 0.362 40 mph 0.993 0.599 0.314 50 mph 0.959 0.836 0.717 60 mph 0.919 0.881 0.861 70 mph 0.965 0.911 0.824
The final combination is shown in Table 17. This Third Combination tends to give somewhat smaller reductions on both urban and rural roads than combination 2.
79
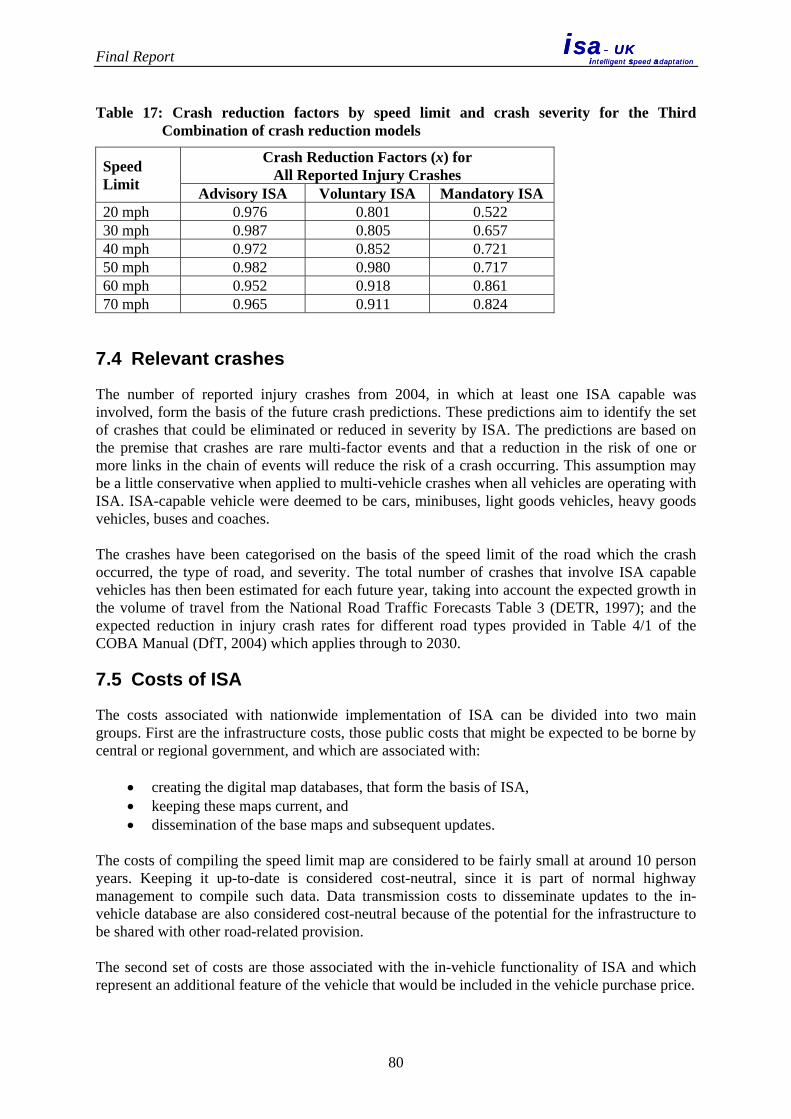
Final Report
isa- UKintelligent speed adaptation
isa- UKintelligent speed adaptation
Table 17: Crash reduction factors by speed limit and crash severity for the Third Combination of crash reduction models
Speed Limit
Crash Reduction Factors (x) for All Reported Injury Crashes
Advisory ISA Voluntary ISA Mandatory ISA 20 mph 0.976 0.801 0.522 30 mph 0.987 0.805 0.657 40 mph 0.972 0.852 0.721 50 mph 0.982 0.980 0.717 60 mph 0.952 0.918 0.861 70 mph 0.965 0.911 0.824
7.4 Relevant crashes
The number of reported injury crashes from 2004, in which at least one ISA capable was involved, form the basis of the future crash predictions. These predictions aim to identify the set of crashes that could be eliminated or reduced in severity by ISA. The predictions are based on the premise that crashes are rare multi-factor events and that a reduction in the risk of one or more links in the chain of events will reduce the risk of a crash occurring. This assumption may be a little conservative when applied to multi-vehicle crashes when all vehicles are operating with ISA. ISA-capable vehicle were deemed to be cars, minibuses, light goods vehicles, heavy goods vehicles, buses and coaches. The crashes have been categorised on the basis of the speed limit of the road which the crash occurred, the type of road, and severity. The total number of crashes that involve ISA capable vehicles has then been estimated for each future year, taking into account the expected growth in the volume of travel from the National Road Traffic Forecasts Table 3 (DETR, 1997); and the expected reduction in injury crash rates for different road types provided in Table 4/1 of the COBA Manual (DfT, 2004) which applies through to 2030.
7.5 Costs of ISA
The costs associated with nationwide implementation of ISA can be divided into two main groups. First are the infrastructure costs, those public costs that might be expected to be borne by central or regional government, and which are associated with:
• creating the digital map databases, that form the basis of ISA, • keeping these maps current, and • dissemination of the base maps and subsequent updates.
The costs of compiling the speed limit map are considered to be fairly small at around 10 person years. Keeping it up-to-date is considered cost-neutral, since it is part of normal highway management to compile such data. Data transmission costs to disseminate updates to the in-vehicle database are also considered cost-neutral because of the potential for the infrastructure to be shared with other road-related provision. The second set of costs are those associated with the in-vehicle functionality of ISA and which represent an additional feature of the vehicle that would be included in the vehicle purchase price.
80

Final Report
isa- UKintelligent speed adaptation
isa- UKintelligent speed adaptation
In-vehicle costs consist of (1) the equipment needed for speed limit knowledge and (2) an HMI and where relevant linkage to the vehicle drivetrain. The expected overall cost of in-vehicle equipment for each ISA variant is shown in Table 18.
Table 18: Total expected cost of in-vehicle equipment (2006₤)
Vehicles Fitment ISA Category 2010 2020 2030 onwards
Light Vehicles
New Advisory 220 110 110 Voluntary/Mandatory 820 560 560
Retrofit Advisory 350 240 240 Voluntary/Mandatory 1150 890 790
Heavy Vehicles
New Advisory 220 110 110 Voluntary/Mandatory 1220 860 860
Retrofit Advisory 350 240 240 Voluntary/Mandatory 2250 1590 1490
7.6 ISA penetration
The implementation costs and crash reduction benefits of ISA are related to the number of vehicles fitted with ISA each year and the proportion of ISA-capable vehicles within the fleet, respectively. The number of new vehicles joining the fleet each year is the difference between the predicted fleet size and the current fleet minus scrappage that occurs, and standard procedures have been applied to generate predictions of fleet size. Two vehicle fleets are considered in the analysis, reflecting the differences in fleet age profiles and the differences in implementation scenarios:
• The light vehicle fleet which includes passenger cars, taxis and light goods vehicles, and • The heavy vehicle fleet which includes heavy goods vehicles, buses and coaches.
As discussed in section 7.2, two implementation scenarios have been considered: a Market Driven Scenario and an Authority Driven Scenario. It is assumed that the Market Driven Scenario is driven by voluntary take-up of ISA, as demand for intelligent transport systems (ITS) increases. This will include demand for satellite navigation systems which in the near future will also provide on-board speed limit information as a standard feature. The digital map database with accurate speed limit information required to implement ISA variants based on fixed speed limits is predicted to be available in 2010. The Market Driven scenario is assumed to start in 2010, when it is expected that 50% of new passenger cars and 100% of heavy vehicles would be fitted with Advisory ISA. It is worth noting that under the Market Driven Scenario, ISA fitment to newly registered vehicles only would see ISA in some form (advisory or voluntary) saturate the heavy vehicle and light vehicle fleets, in approximately 25 years and 35 years, respectively. While there may be some initial resistance to ISA from some quarters, research indicates that those who have actually used ISA, view the system positively. It is therefore realistic to expect that some retrospective fitment of ISA to older vehicles would be undertaken, particularly for the fleet vehicles that make up a significant proportion of the car taxi and light vehicle fleet, and such retrofitting has been assumed here. The scenario also assumes that, in 2010, five percent of the existing passenger cars will also be retrofitted with Advisory ISA as a result of the system being available through standard
81
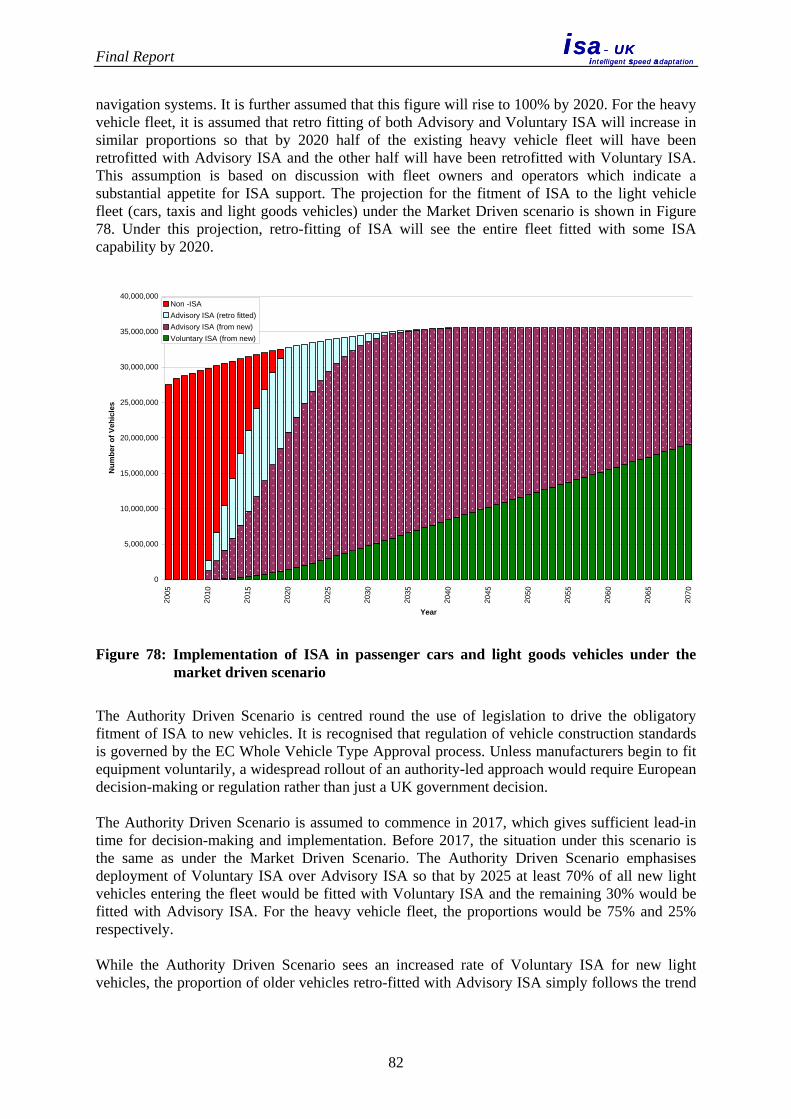
Final Report
isa- UKintelligent speed adaptation
isa- UKintelligent speed adaptation
navigation systems. It is further assumed that this figure will rise to 100% by 2020. For the heavy vehicle fleet, it is assumed that retro fitting of both Advisory and Voluntary ISA will increase in similar proportions so that by 2020 half of the existing heavy vehicle fleet will have been retrofitted with Advisory ISA and the other half will have been retrofitted with Voluntary ISA. This assumption is based on discussion with fleet owners and operators which indicate a substantial appetite for ISA support. The projection for the fitment of ISA to the light vehicle fleet (cars, taxis and light goods vehicles) under the Market Driven scenario is shown in Figure 78. Under this projection, retro-fitting of ISA will see the entire fleet fitted with some ISA capability by 2020.
0
5,000,000
10,000,000
15,000,000
20,000,000
25,000,000
30,000,000
35,000,000
40,000,000
2005
2010
2015
2020
2025
2030
2035
2040
2045
2050
2055
2060
2065
2070
Year
Num
ber o
f Veh
icle
s
Non -ISAAdvisory ISA (retro fitted)Advisory ISA (from new)Voluntary ISA (from new)
Figure 78: Implementation of ISA in passenger cars and light goods vehicles under the market driven scenario
The Authority Driven Scenario is centred round the use of legislation to drive the obligatory fitment of ISA to new vehicles. It is recognised that regulation of vehicle construction standards is governed by the EC Whole Vehicle Type Approval process. Unless manufacturers begin to fit equipment voluntarily, a widespread rollout of an authority-led approach would require European decision-making or regulation rather than just a UK government decision. The Authority Driven Scenario is assumed to commence in 2017, which gives sufficient lead-in time for decision-making and implementation. Before 2017, the situation under this scenario is the same as under the Market Driven Scenario. The Authority Driven Scenario emphasises deployment of Voluntary ISA over Advisory ISA so that by 2025 at least 70% of all new light vehicles entering the fleet would be fitted with Voluntary ISA and the remaining 30% would be fitted with Advisory ISA. For the heavy vehicle fleet, the proportions would be 75% and 25% respectively. While the Authority Driven Scenario sees an increased rate of Voluntary ISA for new light vehicles, the proportion of older vehicles retro-fitted with Advisory ISA simply follows the trend
82

Final Report
isa- UKintelligent speed adaptation
isa- UKintelligent speed adaptation
of the Market Driven Scenario which would see all older vehicles retro-fitted with Advisory ISA by 2020 (see Figure 79). No retro-fitment of Voluntary ISA is assumed to occur. For the heavy vehicle fleet, following the Market Driven Scenario until 2017 results in approximately 35% of the existing fleet being retrofitted with Advisory ISA and 35% of the existing fleet being retro-fitted with Voluntary ISA in 2017. While the retro-fitment of Voluntary would continue, increasing by 5% per year, retro-fitting of Advisory ISA would cease, and those that remain would form a decreasing proportion reaching 25% by 2025. However, it is not until 2045 that 99% of the total fleet is Voluntary ISA capable. At this time all remaining vehicles are retro-fitted with Voluntary ISA, and a Mandatory System could be “switched” on.
0
5,000,000
10,000,000
15,000,000
20,000,000
25,000,000
30,000,000
35,000,000
40,000,000
2005
2010
2015
2020
2025
2030
2035
2040
2045
2050
2055
2060
2065
2070
Year
Num
ber o
f Veh
icle
s
Non -ISAAdvisory ISA (retro fitted)Advisory ISA (from new)Voluntary ISA (from new)
Figure 79: Implementation of ISA in the light vehicle fleet under the authority driven
scenario
Given that Mandatory ISA would provide significantly greater road safety benefits, compared to Voluntary ISA, it could be expected that earlier implementation of Mandatory ISA may be worthwhile. To test this proposition, the impact of setting an earlier date for the enactment of Mandatory ISA has been investigated, considering the adoption of Mandatory ISA in 2040 and in 2035, five and ten years earlier than in the basic Authority Driven implementation scenario. By 2035 approximately 85% of the vehicle fleet would have Voluntary ISA and slightly more than 5 million (5.233 million) Advisory ISA vehicles (about 15% of the fleet) would require upgrading to Voluntary ISA in order to implement Mandatory ISA ten years early. In 2040, 3.2% of the vehicle fleet (1.1 million vehicles) would require an upgrade from Advisory ISA to Voluntary ISA, in order to “switch on” mandatory ISA five years earlier.
83
Final Report
isa- UKintelligent speed adaptation
isa- UKintelligent speed adaptation
7.7 Estimation of costs and benefits
Although numerous other scenarios can be contrived and combined to generate an almost limitless number of other possible combinations, the twelve combinations of implementation and crash prediction scenarios presented here (four implementation scenarios x three combinations of crash prediction models) were considered sufficient to indicate the implications of applying alternative models and scenarios for the purposes of economic analysis. The four implementation scenarios used were:
1. Market Driven 2. Authority Driven (mandatory ISA at 2045) 3. Authority Driven (mandatory ISA at 2040) 4. Authority Driven (mandatory ISA at 2035)
The three combinations of crash prediction models used were those shown in Table 15, Table 16 and Table 17. To provide predictions of how the crashes would be split between slight, serious and fatal crashes, coefficients from the power model of Elvik et al. 2004) were applied to the predictions of all-injury accidents.. For each of these twelve scenario combinations, there are two alternative methods for calculating the expected reductions in crashes at the various levels of severity:
Method A: Separate reduction factors are calculated for the fatal, serious and slight crashes that occur in each speed limit (note the components are not scaled up to make the sum equal to the estimated all injury crash reduction).
Method B: All injury crash reductions factors are developed for each speed limit, the all
injury crash reduction is calculated nationwide and the nationwide estimates for the reduction in fatal, serious, and slight crashes are obtained and used in the economic analysis (again the components are not scaled up to equal the all injury crash reduction).
7.8 Results: costs and benefits
In total some 24 separate analyses have been undertaken. A summary of the costs, benefits and overall economic performance is presented here, followed by a detailed discussion of the crash reduction performance of the key scenarios. The cost and benefit streams of the analysis have been projected through until 2070, which is 60 years after the suggested first implementation of ISA in the year 2010. The net present value of both costs and benefit has been discounted back to a base year of 2006, using an annual discounting factor of 3.5% through until 2040 and an annual factor of 3% beyond that date. The cost implications of ISA are relatively straightforward and the resulting net present values of costs for the four implementation scenarios are given in Table 19.
84

Final Report
isa- UKintelligent speed adaptation
isa- UKintelligent speed adaptation
Table 19: Net present value of costs (expressed in 2006₤s)
Implementation Scenario Net Present Value of Costs 2006₤million
Market Driven £16,903 Authority Driven (mandatory ISA at 2045) £26,629 Authority Driven (mandatory ISA at 2040) £26,860 Authority Driven (mandatory ISA at 2035) £28,044 The economic benefit of the crash reductions expected to be achieved through ISA has been based on the most recent Highways Economics Note 1 (DfT, 2006c). HEN1 provides information on the average monetary valuation of prevention of crashes by severity (Table 4a) in pounds for a base year of 2005 (Table 20). The values depend in part on the number of injured persons involved in an accident at each level of severity and the injury severities for those involved persons. The values have been updated in accordance with HEN1 to provide a base cost for 2006 and increased each year by the expected increase in Gross Domestic Product (GDP), in line with COBA Volume 13 Table 3/4 (DfT, 2004b).
Table 20: The economic valuation of prevention of crashes (Highways Economic Note 1, Appendix 1)
Year Fatal Serious Slight
2005 ₤1,644,790 ₤188,920 ₤19,250 2006 ₤1,715,023 ₤196,987 ₤20,072
The net present value of crash reduction benefits for each of the four crash reduction modelling scenarios and the two analysis methods discussed above are given in Table 21.
Table 21: Net Present value of crash reduction benefits of ISA (£m)
Implementation Scenario
Crash Reduction Model Combination
Analysis method A B
Market Driven Base Combination £31,316 £27,308 Second Combination £50,409 £51,734 Third Combination £30,676 £30,877
Authority Driven (2045) Base Combination £84,155 £89,824 Second Combination £127,547 £146,150 Third Combination £75,740 £83,338
Authority Driven (2040) Base Combination £90,734 £97,772, Second Combination £133,120 £152,684 Third Combination £80,682 £88,733
Authority Driven (2035) Base Combination £98,058 £106,597 Second Combination £139,719 £160,464 Third Combination £86,251 £94,849
85
Final Report
isa- UKintelligent speed adaptation
isa- UKintelligent speed adaptation
Looking at Table 21, it is immediately obvious that the analysis method used to apply the various crash models has an impact on the benefit streams predicted. Analysis Method B predicts higher benefits than Method A in which separate crash reductions are calculated for the fatal, serious and slight crashes in each speed limit. However, the variations are relatively small when compared to the variations that result from:
• the different implementation scenarios, and • the different crash reduction model combinations.
The Market Driven scenario produces between 30% and 40% of the expected benefits of the various Authority Driven scenarios. A comparison of the impacts of early adoption of Mandatory ISA suggests that the key driver is the higher penetration rates associated with the Authority Driven Scenario rather than the switch to Mandatory ISA. Adopting Mandatory ISA five years earlier than the 2045 date assumed in the Authority Driven Scenario, increases the benefits between 4% and 9% depending on the crash reduction model combination and the analysis method. As expected, the Third Combination of crash reduction models provides the lowest levels of benefits across all analyses. This is because the U1 model which is used to assess the impact of all ISA variants on urban speed limit crashes, does not take full account of the impact that ISA will have on the top end of the speed distribution. At the other end of the spectrum, the Second Combination of crash reduction models predicts the highest level of crash reduction benefits. This is in the main due to the use of the U2 model to assess the crash reduction benefits of all ISA variants in urban speed limits. As noted earlier, the U2 model is expected to over-predict the crash reduction benefits of Mandatory ISA in particular, as the model form is based around the proportion of speeders in the traffic stream. The Base Combination of crash reduction models relies heavily on the use of Kloeden’s Australian based models to assess the crash risk reduction benefits associated with the dramatic changes to the speed distributions that occur under Voluntary and Mandatory ISA. Given the lack of a directly applicable model set, this combination of models is judged by the authors to be the most appropriate of those investigated, and provides crash reduction benefits that are slightly below the middle of the range of the other two combinations for the Authority Driven scenarios, and very similar results to the Third Combination for the Market Driven Scenario. Combining the costs of Table 19 with the benefits of Table 21 yields the social benefit to cost ratios for the various analyses, which are reported in Table 22.
86
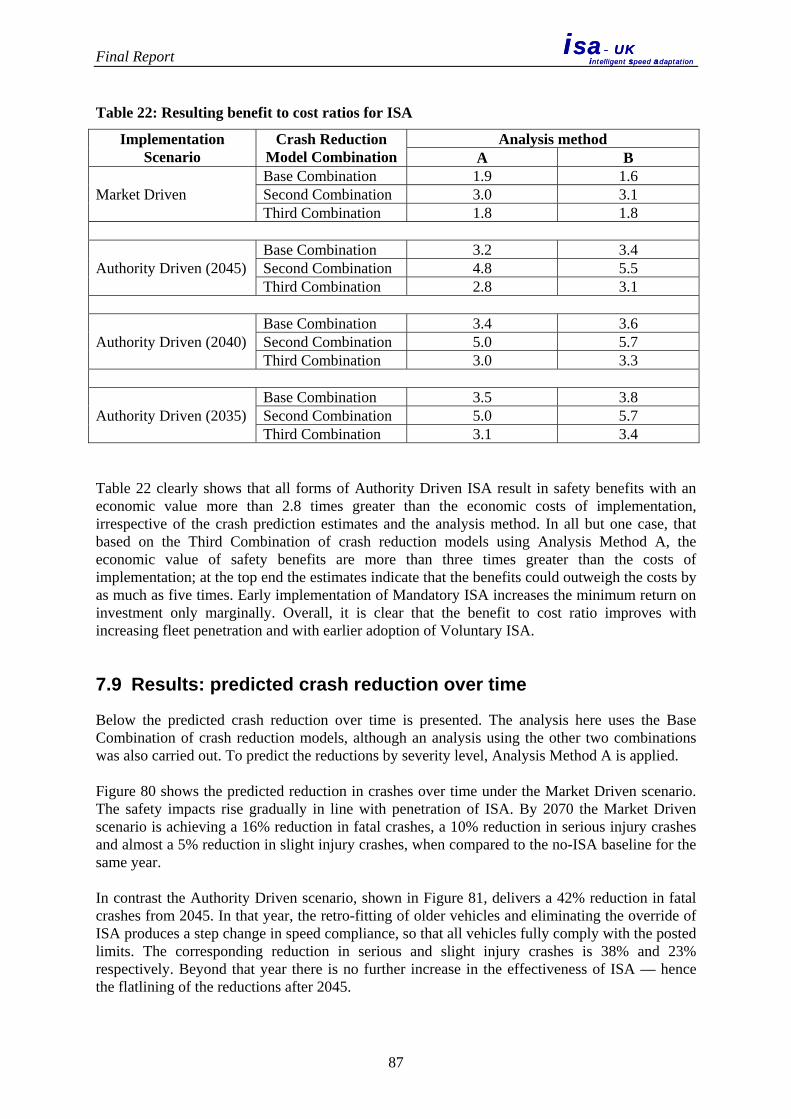
Final Report
isa- UKintelligent speed adaptation
isa- UKintelligent speed adaptation
Table 22: Resulting benefit to cost ratios for ISA
Implementation Scenario
Crash Reduction Model Combination
Analysis method A B
Market Driven Base Combination 1.9 1.6 Second Combination 3.0 3.1 Third Combination 1.8 1.8
Authority Driven (2045) Base Combination 3.2 3.4 Second Combination 4.8 5.5 Third Combination 2.8 3.1
Authority Driven (2040) Base Combination 3.4 3.6 Second Combination 5.0 5.7 Third Combination 3.0 3.3
Authority Driven (2035) Base Combination 3.5 3.8 Second Combination 5.0 5.7 Third Combination 3.1 3.4
Table 22 clearly shows that all forms of Authority Driven ISA result in safety benefits with an economic value more than 2.8 times greater than the economic costs of implementation, irrespective of the crash prediction estimates and the analysis method. In all but one case, that based on the Third Combination of crash reduction models using Analysis Method A, the economic value of safety benefits are more than three times greater than the costs of implementation; at the top end the estimates indicate that the benefits could outweigh the costs by as much as five times. Early implementation of Mandatory ISA increases the minimum return on investment only marginally. Overall, it is clear that the benefit to cost ratio improves with increasing fleet penetration and with earlier adoption of Voluntary ISA.
7.9 Results: predicted crash reduction over time
Below the predicted crash reduction over time is presented. The analysis here uses the Base Combination of crash reduction models, although an analysis using the other two combinations was also carried out. To predict the reductions by severity level, Analysis Method A is applied. Figure 80 shows the predicted reduction in crashes over time under the Market Driven scenario. The safety impacts rise gradually in line with penetration of ISA. By 2070 the Market Driven scenario is achieving a 16% reduction in fatal crashes, a 10% reduction in serious injury crashes and almost a 5% reduction in slight injury crashes, when compared to the no-ISA baseline for the same year. In contrast the Authority Driven scenario, shown in Figure 81, delivers a 42% reduction in fatal crashes from 2045. In that year, the retro-fitting of older vehicles and eliminating the override of ISA produces a step change in speed compliance, so that all vehicles fully comply with the posted limits. The corresponding reduction in serious and slight injury crashes is 38% and 23% respectively. Beyond that year there is no further increase in the effectiveness of ISA — hence the flatlining of the reductions after 2045.
87
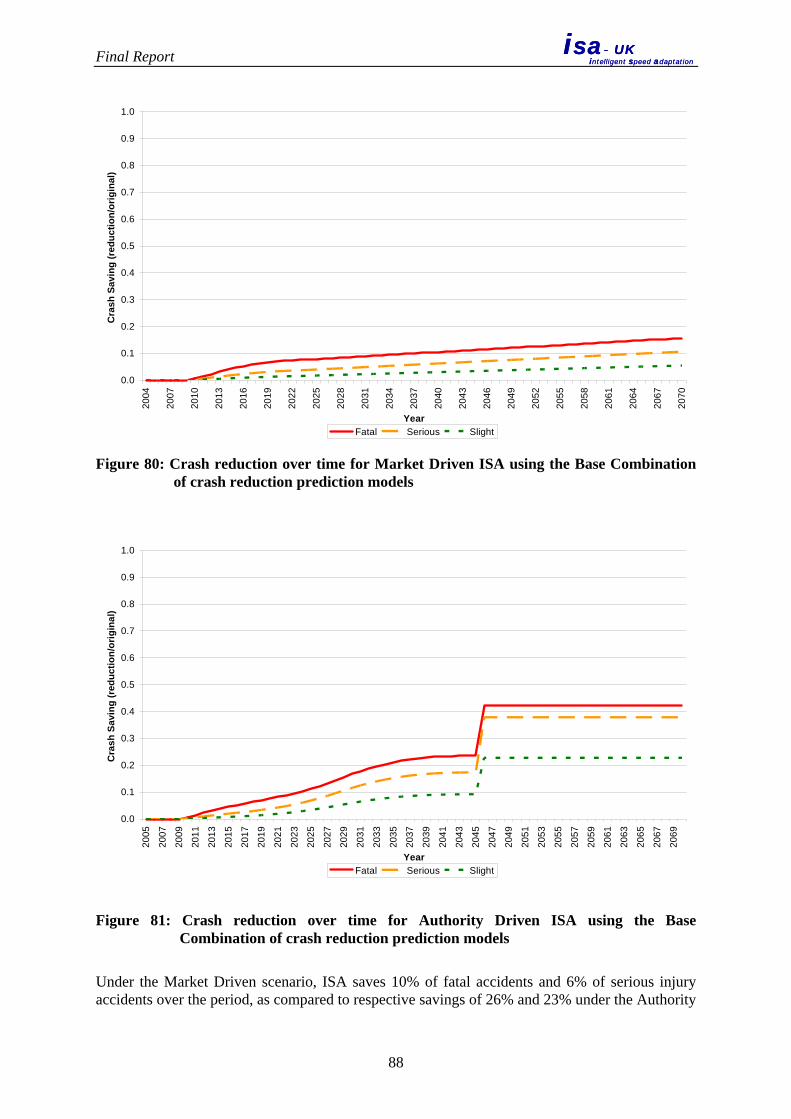
Final Report
isa- UKintelligent speed adaptation
isa- UKintelligent speed adaptation
0.0
0.1
0.2
0.3
0.4
0.5
0.6
0.7
0.8
0.9
1.0
2004
2007
2010
2013
2016
2019
2022
2025
2028
2031
2034
2037
2040
2043
2046
2049
2052
2055
2058
2061
2064
2067
2070
Year
Cra
sh S
avin
g (r
educ
tion/
orig
inal
)
Fatal Serious Slight
Figure 80: Crash reduction over time for Market Driven ISA using the Base Combination of crash reduction prediction models
0.0
0.1
0.2
0.3
0.4
0.5
0.6
0.7
0.8
0.9
1.0
2005
2007
2009
2011
2013
2015
2017
2019
2021
2023
2025
2027
2029
2031
2033
2035
2037
2039
2041
2043
2045
2047
2049
2051
2053
2055
2057
2059
2061
2063
2065
2067
2069
Year
Cra
sh S
avin
g (r
educ
tion/
orig
inal
)
Fatal Serious Slight
Figure 81: Crash reduction over time for Authority Driven ISA using the Base Combination of crash reduction prediction models
Under the Market Driven scenario, ISA saves 10% of fatal accidents and 6% of serious injury accidents over the period, as compared to respective savings of 26% and 23% under the Authority
88
Final Report
isa- UKintelligent speed adaptation
isa- UKintelligent speed adaptation
Driven scenario with mandatory usage in 2045. Bringing mandatory usage forward to 2035 increases the total reduction over the period to 29% of fatal accidents and 25% of serious injury crashes. It can be noted that this is not a very large additional increase. The prediction is that ISA has the greatest benefits on 30 mph roads. On such roads, the Market Driven scenario predicts a 5% reduction in high severity accidents, those resulting in death or serious injury. This figure rises to 32% under the Authority Driven 2045 scenario and to 38% under the Authority Driven 2035 scenario.
7.10 Conclusions on implementation scenarios
The analysis using the favoured Base Combination of crash reduction models indicates that, over a 60-year period from 2010 to 2070, the Market Driven implementation scenario is expected to reduce fatal accidents by 10% (approximately 15,400 fatal accidents), serious injury accidents by 6% (96,000 accidents), and slight injury accidents by 3% (336,000 accidents). The same combination of crash reduction models predicts that, over the 60-year, period the Authority Driven implementation scenario is expected to reduce fatal accidents by 26% (approximately 43,300 fatal accidents); serious injury accidents by 21% (330,000 accidents), and slight injury accidents by 12% (1.3 million accidents). Overall, ISA has a considerably greater impact on more severe crashes. Two variations on the Authority Driven implementation scenario were also tested. These variations would see mandatory fitment and usage of ISA brought forward to either 2040 or 2035. The early mandating of ISA increased the predicted accident reductions for each severity class by around 1% to 2% for 2040, and 3% to 4% for 2035. The greatest source of accident reduction benefits occurs on 30 mph roads where the Market Driven implementation scenario is expected to reduce high-severity (fatal and serious injury) accidents by 5% (range 5% to 13%). The Authority Driven scenario is expected to reduce fatal and serious injury accidents by 25% (range 24% to 44%) over the 60-year analysis period. The fact that the major savings are on 30 mph roads, closely followed by 40 mph roads, also indicates the potential of ISA to improve the safety of pedestrians and cyclists. The economic benefit associated with the predicted crash reductions is substantial. Under both the implementation scenarios, the benefits considerably outweigh the costs. The Market Driven implementation scenario is expected to result in benefits 1.9 times greater than the cost of introduction under the Base Combination of accident prediction models (range 1.8 to 3.0 under the other combinations). The Authority Driven implementation of ISA is expected to produce economic benefits 3.2 times greater than the investment costs under the Base Combination of accident prediction models (range 2.8 to 4.8 under the other combinations).
89
Final Report
isa- UKintelligent speed adaptation
isa- UKintelligent speed adaptation
8. CONCLUSIONS AND IMPLICATIONS
The car and truck trials demonstrated that ISA is now a mature technology which is capable of delivering substantial reductions in excessive speed and thereby considerable benefits in terms of safety. The behavioural results from the car trials show that the overridable ISA that was used by the participants reduced the amount of speeding among every category of user. It also affected driving on every road category, except the 60 mph rural roads where there was comparatively little speeding by the participants in the pre-ISA baseline. The use of an overridable ISA system in the car trials provided an opportunity to observe differential usage. ISA was overridden the most on motorways, followed by built-up areas (20 and 30 mph zones). Urban environments are where drivers are most likely to encounter conflicts with vulnerable road users such as pedestrians and cyclists. Thus there is some tendency for ISA to be overridden on roads where it is perhaps needed most. In term of sub-groups within the driving population, male drivers and young drivers overrode the system more than their counterparts regardless of speed zones. Given that these two groups of drivers also drove faster and had a higher percentage of distance travelled over the speed limit than their counterparts, there is a pronounced tendency for ISA to be overridden by those drivers who in safety terms stand to benefit most from using it. It was also found that speed intenders overrode the system more frequently than non-intenders on motorways, and that private motorists were more likely to override in built-up areas while fleet drivers more frequently overrode on motorways. These findings suggest the need for supporting a voluntary ISA with incentives to comply. There were interesting differences between the impacts of ISA on the driving of the private motorists and the impacts on the fleet drivers. The fleet drivers tended to override the system most on 70 mph roads, whereas the private motorists overrode most on 30 mph roads. Successful implementation of ISA would ultimately rely upon the attitude of the general public. The current analysis found promising support for the finding that long-term experience with an ISA system increases acceptability. Despite an initial dip in acceptability, the rating of the ISA system in terms of usefulness and satisfaction, improved over time. Participants tended to feel at increased risk and more frustrated in those situations (e.g. on a motorway, in fast moving and light traffic) which afforded the greatest opportunity to speed. Overtaking was also raised as a concern. Nevertheless, in the majority of driving situations, participants felt that risk was reduced when driving with ISA as compared to unsupported driving. Similarly participants believed that attention to the speed limits and to potential hazards (e.g. other road users, pedestrians) and conflicts had increased. ISA seems to have raised participants’ perceived safety and encouraged them to develop more effective driving styles. Support for the implementation of ISA was also reasonably strong, with 56% of participants approving of compulsory fitting of ISA to all new vehicles. However, those expressing strong intentions to speed demonstrated the most resistance to ISA. This suggests that the voluntary implementation of ISA may fail to target those who are most in need of the system. Implementation of an ISA system might be more effective if high risk groups were specifically targeted. Adapting ISA to a motorcycle environment was a more challenging proposition both in terms of the need to minimise weight and system volume and because of the requirement to consider the very different vehicle dynamics of a motorcycle. A demonstration ISA motorcycle was created that has offered a reliable, safe and effective vehicle for riding in user assessment trials within a test track environment. The response from riders was somewhat mixed.
90

Final Report
isa- UKintelligent speed adaptation
isa- UKintelligent speed adaptation
The analysis of future accidents using the favoured Base Combination of crash reduction models indicates that, over a 60-year period from 2010 to 2070, the Market Driven implementation scenario would be expected to reduce fatal accidents by 10% (approximately 15,400 fatal accidents), serious injury accidents by 6% (96,000 accidents), and slight injury accidents by 3% (336,000 accidents). The same combination of crash reduction models predicts that, over the 60-year period, the Authority Driven implementation scenario would be expected to reduce fatal accidents by 26% (approximately 43,300 fatal accidents); serious injury accidents by 21% (330,000 accidents), and slight injury accidents by 12% (1.3 million accidents). The economic benefit associated with the predicted crash reductions is substantial. Applying the Base Combination of accident prediction models, the Market Driven implementation scenario is expected to result in benefits 1.9 times greater than the cost of introduction. The Authority Driven implementation of ISA is expected to produce economic benefits 3.2 times greater than the investment costs. Under both the implementation scenarios modelled, and whatever combination of accident prediction models is applied, the benefits considerably outweigh the costs.
91
Final Report
isa- UKintelligent speed adaptation
isa- UKintelligent speed adaptation
9. REFERENCES
Ajzen, I. (1991). The theory of planned behavior. Organizational Behaviour and Human Decision Processes, 50: 179-211. Almqvist, S. and Nygård, M. (1997). Dynamic speed adaptation: a field trial with automatic speed adaptation in an urban area. Bulletin 154. Department of Traffic Planning and Engineering, University of Lund, Sweden. Besseling, H. and van Boxtel, A. (2001). Intelligent speed adaptation: results of the Dutch ISA trial. Transport Research Centre (AVV, Rotterdam), Ministry of Transport, Public Works and Water Management, The Netherlands. Biding, T. and Lind, G. (2002). Intelligent Speed Adaptation (ISA): results of large-scale trials in Borlänge, Lidköping, Lund and Umeå during the period 1999-2002. Swedish National Road Administration, Borlänge, Report 2002:89 E. Carsten, O. (2002). European research on ISA: where are we now and what remains to be done. Proceedings of the ICTCT, JATP and EWGOSC Workshop on Intelligent Speed Adaptation, Nagoya, Japan, 19-20 May 2002. Carsten, O. and Tate, F. (2000). Final report – integration. Deliverable 17 of External Vehicle Speed Control. Institute for Transport Studies, University of Leeds. COBA Manual (DfT, 2004 COBA Volume 13 Table 3/4 (DfT, 2004b). Comte, S. (1999). On road study. Deliverable 10 of External Vehicle Speed Control. Institute for Transport Studies, University of Leeds. Comte, S.L. (2000). New Systems, new behaviour? Transportation Research Part F, 3:.95-111. Comte, S.L. and Carsten, O.M.J. (1999). Simulator study. Deliverable 9 of the External Vehicle Speed Control project. Institute for Transport Studies, University of Leeds. Conner, M. and Armitage, C.J. (1998). Extending the theory of planned behaviour: a review and avenues for further research. Journal of Applied Social Psychology, 28, 1429-1464. Conner, M., Parker, D., Lawton, R., Chorlton, K., Manstead, A.S.R and Stradling, S. (2007). Application of the theory of planned behaviour to the prediction of objectively assessed breaking of posted speed limits. British Journal of Psychology, 98 (3), 429-453. Department for Transport (2000). The attitudinal determinants of driving violations. Road Safety Research Report No. 13. London: The Stationary Office. Department for Transport (2004). Design manual for roads and bridges, Volume 13 Economic assessment of road schemes, Section 1 The COBA manual. Department for Transport (2006a). Vehicle Licensing Statistics 2005. 18 May 2006 Department for Transport (2006b). Highways Economic Note 1: 2005.
92

Final Report
isa- UKintelligent speed adaptation
isa- UKintelligent speed adaptation
Department of Environment Transport and the Regions (1997). National Road Traffic Forecasts (Great Britain) 1997. Dutton, A G and Page M. (In Press). The THESIS model: an assessment tool for transport and energy provision in the hydrogen economy. International Journal of Hydrogen Energy, corrected proof, available online 20 November 2006. Ehrlich, J., Saad, F., Lassarre, S., and Romon, S. (2006). Assessment of “LAVIA” speed adaptation systems: experimental design and initial results on system use and speed behavior Proceedings of 13th ITS World Congress, 8-12 October, London, United Kingdom. Elvik, R., Christensen, P., and Amundsen, A. (2004). Speed and road accidents: an evaluation of the Power Model. TOI Research Report 740/2004, Institute of Transport Economics, Oslo. ERTICO (2005). SpeedAlert In-vehicle Speed Limit Information and Warning Systems. A brochure produced by ERTICO. Hjälmdahl, M. and Várhelyi, A. (2004). Speed regulation by in-car active accelerator pedal: effects on driver behaviour. Transportation Research Part F, 7: 77-94. Hughes, W. (1994). Accidents on rural roads: A study in Cambridgeshire. AA Foundation for Road Safety Research, Basingstoke. Kloeden, C.N., and McLean, A.J. (2001) Rural speeds and crash risk. Proceedings of Road Safety Research, Policing and Education Conference, Melbourne, Australia.. Kloeden, C.N., McLean, A.J., and Glonek, G. (2002). Travelling speed and the risk of crash involvement on rural roads. CR204 Australian Transport Safety Bureau, Canberra, Australia. Kloeden, C.N., Ponte, G., and McLean, A.J. (2001). Reanalysis of travelling speed and the risk of crash involvement in Adelaide South Australia. Road Accident Research Unit, University of Adelaide. Lee, J. and Moray, N. (1992). Trust, control strategies, and allocation of function in human-machine systems. Ergonomics, 35, 10, 1243-1270 Marchau, V.A.W.J., van der Heijden, R.E.C.M. and Molin, E.J.E. (2005). Desirability of advanced driver assistance from road safety perspective: the case of ISA. Safety Science, 43, 11-27. Risser, R. (1985). Behaviour in traffic conflict situations. Accident Analysis and Prevention, 17(2): 179-197. Taylor, M.C., Baruya, A., and Kennedy, J.V. (2002). The relationship between speed and accidents on rural single-carriageway roads. Report TRL511. TRL Limited, Crowthorne. Taylor, M.C., Lynam, D.A and Baruya, A. (2000). The effects of drivers’ speed on the frequency of road accidents. TRL Report 421. TRL, Crowthorne. Van der Laan, J.D., Heino, A. and De Waard, D. (1997). A simple procedure for the assessment of acceptance of Advanced Transport Telematics. Transportation Research Part C, 5(1), 1-10.
93

Final Report
isa- UKintelligent speed adaptation
isa- UKintelligent speed adaptation
Várhelyi, A. and Mäkinen, T. (2001). The effects of in-car speed limiters: field studies. Transportation Research C, 9: 191-211.
94
Final Report
95
isa- UKintelligent speed adaptation
isa- UKintelligent speed adaptation
APPENDIX: PROJECT REPORTS
Apart from this report, a series of more detailed reports have been prepared under the ISA project. They are:
1. Implications of Travel Patterns for ISA 2. Results of Field Trial 1 3. Results of Field Trial 2 4. Results of Field Trial 3 5. Results of Field Trial 4 6. Results of Truck Trial 7. Results of Motorcycle Trial 8. Simulator Experiments 9. Overall Field Trial Results 10. Implementation Scenarios