
Intellectual Property Rights and Innovation in Developing .../media/GIAWB/EnterpriseSurveys/... ·...
51
Intellectual Property Rights and Innovation in Developing Countries: Evidence from India Antara Dutta + & Siddharth Sharma ++ * October 2008 Abstract In 1994, India signed the TRIPs Agreement, which obligated the country to dramat- ically strengthen its protection and enforcement of intellectual property rights (IPR). This paper uses panel data on Indian firms from 1989 to 2005 to ascertain whether the IPR reforms were successful in increasing innovation by firms in India. We characterize industries according to their technological dependence on innovation, and find strong evidence that Indian firms in more innovation-intensive industries increased their R&D expenditure after TRIPs. The estimated within-firm increase in annual R&D spending after TRIPs is on average 20 percentage points higher in an industry with a one stan- dard deviation higher value of innovation intensity. This differential growth estimate is robust to accounting for contemporaneous trade and industrial policies, and growth in R&D spending by foreign-owned firms. We also find that patenting by India in the U.S. increased after TRIPs, and to a greater extent in more innovation intensive industries. JEL Codes: 030, 034, 014, D23. *+ Georgetown University, [email protected]; ++ International Finance Corporation (The World Bank Group), [email protected]. We thank Simeon Djankov, David Scott Kaplan, Jeff Wilder and sem- inar participants at the World Bank, the GPPI Development Lunch and the Georgetown Trade Working Group for many helpful comments. Pedro Martinez and Aleksander Zaklan provided superb research assis- tance. The views expressed in this paper are of the authors and do not represent those of the World Bank Group. 1
-
Upload
nguyenquynh -
Category
Documents
-
view
216 -
download
1
Transcript of Intellectual Property Rights and Innovation in Developing .../media/GIAWB/EnterpriseSurveys/... ·...
Intellectual Property Rights and Innovation in Developing
Countries: Evidence from India
Antara Dutta+ & Siddharth Sharma++ ∗
October 2008
Abstract
In 1994, India signed the TRIPs Agreement, which obligated the country to dramat-
ically strengthen its protection and enforcement of intellectual property rights (IPR).
This paper uses panel data on Indian firms from 1989 to 2005 to ascertain whether the
IPR reforms were successful in increasing innovation by firms in India. We characterize
industries according to their technological dependence on innovation, and find strong
evidence that Indian firms in more innovation-intensive industries increased their R&D
expenditure after TRIPs. The estimated within-firm increase in annual R&D spending
after TRIPs is on average 20 percentage points higher in an industry with a one stan-
dard deviation higher value of innovation intensity. This differential growth estimate is
robust to accounting for contemporaneous trade and industrial policies, and growth in
R&D spending by foreign-owned firms. We also find that patenting by India in the U.S.
increased after TRIPs, and to a greater extent in more innovation intensive industries.
JEL Codes: 030, 034, 014, D23.
∗+Georgetown University, [email protected]; ++International Finance Corporation (The World
Bank Group), [email protected]. We thank Simeon Djankov, David Scott Kaplan, Jeff Wilder and sem-
inar participants at the World Bank, the GPPI Development Lunch and the Georgetown Trade Working
Group for many helpful comments. Pedro Martinez and Aleksander Zaklan provided superb research assis-
tance. The views expressed in this paper are of the authors and do not represent those of the World Bank
Group.
1
1 Introduction
International trade involves an increasingly diverse array of products in which ideas
and knowledge play an important role. These products range from high-technology goods
such as new medicines and computer processors, to creative material like films, music and
books, as well as traditionally low-technology goods that are now associated with a higher
proportion of invention and design, such as brand-named apparel and new varieties of plants.
Before the Uruguay Round of trade negotiations that occurred between 1986 and 1994,
there was no specific agreement on intellectual property rights (IPR) in the framework of the
GATT multilateral trading system. Countries differed greatly in the extent of protection
and enforcement of IPR, with developing countries being typically associated with much
lower standards for IPR protection than developed countries. The resulting ability of local
firms in these weak-IPR countries to market products that were still under patent protection
elsewhere in the world meant that the high costs of innovation were mostly borne by the
strong-IPR nations in the developed world. However, developing countries argued that weak
IPRs protected the poor in their countries from the high prices associated with stronger
patent regimes. With increasing trade and economic integration between countries, such
differences in IP laws became a source of tension in international economic relations. The
TRIPs Agreement, formulated in 1994, is an attempt to narrow the gaps in the way IPR
are protected around the world.
India, along with several other developing countries, signed the TRIPs Agreement in
1994, and became obligated to amend its domestic IPR laws within ten years. The signing
of TRIPs remained deeply controversial in India for much of the 1990s, even as the country’s
patent regime began to be gradually modified to comply with the stronger IPR requirements
stipulated in the agreement. On January 1, 2005, India became fully TRIPs-compliant by
bringing into effect its most important requirement of enforcing product patents in all fields
of technology. Given the large number of theoretically valid conjectures on both sides of
the TRIPs debate, empirical evidence on its actual consequences in India would shed some
important light on the relevance of stronger IPR protection for developing countries. In this
paper, we use detailed firm-level panel data from India for 1989 to 2005 to examine whether
the signing of the TRIPs Agreement changed the incentives faced by firms operating in
India and led to increased innovation and technology transfer in the country.
Although the TRIPs Agreement is connected to a series of international trade negotia-
tions, enforcement of IPR has been a subject of academic and policy debate for many years
even without this context of trade and globalization. IPRs generate monopoly positions
that reduce current consumer welfare in return for providing greater payoffs for innova-
tion, which then raises future consumer welfare. The variation in the strength and scope
of IP laws across nations is largely a function of how policy-makers in different countries
2
have traditionally weighed the short-term costs against the longer-term benefits of IPR
protection.
The debate over IPR protection becomes even more complicated and controversial in an
international framework. Sharp divisions in opinions about the international harmonization
of IPR standards follow from the fact that developing countries possess neither the rights
to most current intellectual property, nor the institutional support to alleviate some of the
shorter-term costs of strong patent protection. Critics of the TRIPs Agreement argue that
the move towards stronger IPR may hurt poorer countries, because they would involve
the transfer of rents to multinational corporate patent holders based in the world’s most
developed countries. Moreover, such critics contend that in the post-TRIPs environment,
smaller domestic firms in developing countries will be unable to pay the necessary fixed
costs that would allow them to conduct research and development at a scale where they
could compete with these giant multinational firms. This, in turn, could have longer-term
implications for industry structure and composition in developing nations.
On the other hand, proponents of the TRIPs Agreement have argued that stronger IP
laws could increase incentives to conduct R&D by domestic firms in developing countries,
making these firms more likely to become owners of the rights to future innovations. A
developing country could also benefit from the TRIPs Agreement because strengthening
IP laws increases the likelihood for technology transfer between developed and developing
countries.
Our firm-level data on expenditure on R&D and technology in India allow us to test these
conjectures in the context of the strengthening of IPR induced by the TRIPs Agreement.
Trends in R&D spending and patenting activity by Indians do suggest a marked rise in
domestic innovative activity during the last decade: R&D spending by publicly listed firms
in India has risen sharply since the early 1990s,1 while U.S. patent applications by Indians
grew more than 14-fold between 1995-2004 (Abramson, 2007).
However, prior to attributing these trends entirely to the changing IPR-regime, it is
necessary to consider two facts: first, TRIPs was expected to introduce sweeping economy-
wide changes in patent administration and protection in India. Therefore, isolating the
effects of TRIPs on the incentives to innovate in India requires a careful analysis of the
relevance of innovation across different industries. Second, TRIPs was signed amidst other
changes such as trade and industrial liberalization, which could potentially deliver their
own independent effects on innovation.
To deal with these concerns, we develop a methodology that allows us to make a causal
connection between spending on innovation by Indian firms and the strengthening of IPR.
We argue that industries vary in terms of their technological dependence on innovation,
1See summary statistics on the number of firms and mean firm R&D spending in Table 2.
3

and that the strengthening of IPR would induce the largest incentives effects on those
industries which are most inherently “innovation intensive”. Furthermore, this technological
dependence can be best uncovered by focusing on environments that already have high
standards of IPR protection and enforcement. Following this argument, we use data on
R&D and patenting activity of firms in the US to construct two measures that capture an
industry’s innovation intensity: the R&D-to-sales ratio and the patents-to-sales ratios. We
then test if changes in innovative activities in India in the post-TRIPs period correspond
to these measures.
We find that R&D expenditure in Indian firms increased relatively more in the industries
in which our measures of innovation intensity are higher. In particular, we find that the
the estimated within-firm increase in annual R&D spending after TRIPs is on average 20
percentage points higher in an industry with a one standard deviation (SD) higher value of
our primary measure of innovation intensity. The results are robust to multiple specifications
that include allowing for alternate measures of innovation-intensity, changes in trade tariffs,
industrial deregulation, different trends in R&D spending by foreign-owned firms and the
staggered nature of the TRIPs-induced policy changes over several years. They are also
robust to allowing the effects of tariff reduction and industrial liberalization to vary across
high and low innovation intensity industries.
In addition, we also find evidence of increased international patenting activity by Indians
in industries that are more dependent on innovation. Our results indicate that a 1 SD
increase in our primary measure of innovation-intensity leads to a 7.4 percentage points
higher post-1994 growth rate in patents granted to Indian inventors in the United States.
For two control groups of countries that were much less dramatically affected by the TRIPs
Agreement - the U.S. and Western Europe - the corresponding increases in the growth rate
of successful U.S. patent applications are only 3.8 and 1.9 respectively. Together, these
patterns suggest that changes in IPR regimes led to more innovation by Indian firms.
The rest of the paper proceeds as follows: in the following section, we describe the
background of the Indian IPR regime, in which the TRIPs Agreement came into effect in
2005. In Section 3, we describe our empirical strategy and the regression specification.
Following this, section 4 discusses the two main data sources used in this paper, and then
Section 5 discusses some basic trends in innovative activity during the sample period. In
Section 6 we present our regression results. Finally, Section 7 concludes.
2 Background and Motivation
Due to deep political disputes over the role of patent protection in the country’s develop-
ing economy, India was unable to enact its first independently-drafted patent laws for over
two decades after its independence from British rule. India’s controversial 1970 Patents Act
4
was modeled on Great Britain’s Patents Act of 1949 but the Indian Act incorporated major
departures intended to lessen the social costs imposed by largely foreign-owned patents.
The Patents Act of 1970 specifically prohibited product patents on “substances intended
for use, or capable of being used as food or as medicine or drug” or “relating to substances
prepared or produced by chemical processes (including alloys, optical glass, semi-conductors
and inter-metallic compounds)”, while allowing the processes for the making of such sub-
stances to be patentable for a short period of between 5 to 7 years. The terms of all other
types of patents (for e.g., mechanical devices) was 14 years from the date of the patent.
In shaping its first indigenous patents regime, India made a deliberate choice to stimulate
domestic manufacturing and reduce the prices of products deemed “essential”, such as food
and medicines.
During the first three years of the Uruguay round of trade negotiations, India led the
opposition to the inclusion of patent and intellectual property rights in a GATT accord. In-
dia and other developing countries viewed the GATT framework as a tool by which wealthy
nations would impose strong IPRs as the cost of much needed access for the developing
world to western markets. By 1989, India had reversed its anti-TRIPS stance and agreed to
serious negotiations over patent protection, while arguing for special provisions to be made
within the framework of TRIPs for developing countries. Upon its signing the Uruguay
Agreement along with 116 other countries in 1994, India became a member of the WTO
from January 1, 1995 and became obligated to amend its domestic IP laws. India was given
ten years to implement its new laws.
The transformation of India’s patent laws has thus far involved a three-stage process
corresponding to the three acts amending the Patents Act of 1970. First, the Patents
Amendments Act of 1999 resulted in the creation of a “mailbox” in India which allowed
inventors to file patent applications for products invented after 1995. These applications
were to be considered for patent protection at the end of India’s ten-year transition period
when product patents were to be brought into full effect. Second, the Patents Act of
2002 further amended the 1970 Act by providing the TRIPs-required twenty-year patent
term, a reversal of the burden of proof for process patent infringement and modifications to
compulsory licensing requirements. Lastly, India finally put product patent protection into
full effect as of January 1, 2005.
Opponents of the TRIPs Agreement have often argued that the small market sizes of
developing countries such as India would not provide adequate incentives for changing either
the level or direction of total R&D expenditure, even under strong IPR regimes such as those
in developed nations. At the same time, most of the patents on existing products would
be held by giant firms in the world’s most developed nations. According to such critics,
in such a setting, the primary effect of increased IPR protection as stipulated by TRIPs
5

would be increased prices in the short-run for patented products and a transfer of rents from
developing countries to these foreign patent holders (Lanjouw (1997), McCalman (2001)).
Additionally, many researchers have questioned whether the patent system is an impor-
tant mechanism for promoting innovation. The evidence on this question is mixed. Jaffe
(2000) documents several studies that calls the value of stronger patents into question and
notes that in the U.S., a substantial increase in R&D preceded the legal reforms that made
U.S. IPR stronger. Kortum and Lerner (1998) conclude that strengthened IPR are unlikely
to have been the primary cause of the spurt in U.S. patenting activity that began in the
mid-1980’s. Schankerman’s (1998) empirical estimates of the value of patent protection
and survey data by Cohen et al (1998) suggest that patents are relatively weak, imperfect
instruments of appropriation, such that substantial increases in their strength might be
insufficient to induce additional innovation. Sakakibara and Branstetter (2001) examine
responses to the Japanese patent reforms of 1988 and find that even though reforms signif-
icantly expanded the scope of patent rights, there is no clear evidence of an in increase in
either R&D spending or innovative output. In the context of India. Lanjouw and Cockburn
(2000) use survey data from India, the results of interviews with industry and government
and measures of R&D activity to determine trends in the allocation of research to products
specific to developing country markets and find some limited evidence of an increase in the
mid-to-late 1980s which leveled off after the 1990’s. On the other hand, Mansfield (1986)
sampled 100 firms in 12 US manufacturing industries on their views about whether patents
are important in innovation and found that in pharmaceuticals and chemicals, where fixed
costs are high and imitation is easy, the strength of patents played a decisive role in the
decision to invest in R&D. Similarly, Evenson and Kumar (2001) and Chen and Puttitanum
(2005) find positive effects of stronger IPR on domestic innovation.
The supporters of TRIPs argue that the post–TRIPs era could result in big differences
in R&D expenditure because of a variety of reasons. The first of these is simply the standard
direct effect of stronger IPR on the incentives to conduct R&D, that could exist because
the market size in India is, in fact, large enough to attract such investment. For example,
investment in innovative activities by domestic firms could increase if domestic firms are
more likely to invest in products that have a specific relevance to India (such as cures for
tropical diseases) or if domestic firms have sufficiently low selling and marketing costs in
India, that would make their investment in R&D worthwhile.
Other pro-TRIPs parties argue that even if the market size in India alone is not large
enough, because several trade-related privileges of the WTO were tied to the efficient imple-
mentation of the TRIPs Agreement for developing countries, a second mechanism through
which we could observe an increase in R&D spending is that the WTO provided firms with
access to larger markets, thus allowing firms to cover the high fixed costs of R&D. A large
6

theoretical and empirical literature ties exporting status to increased spending on technol-
ogy. For example, Yeaple (2005) shows that increased export opportunities make adoption
of new technologies profitable for more firms. Using detailed firm-level data on spending
on technology adoption, Bustos (2005) finds evidence of an increase in technology spending
and skill intensity after trade and capital account liberalization in Argentina .
Third, the TRIPs and WTO were also responsible for attracting the entry of multina-
tional and other foreign firms into India in large numbers and for improving trading relations
between India and many developed countries.2This entry by R&D-intensive foreign firms
and increased interaction with such firms through increased trade could lead to several
sources of technological spillovers in the domestic economy, over and above any direct ef-
fects to invest in innovative activities by domestic firms. Such spillovers could take the form
of externalities, whereby Indian firms upgrade their technology in order to absorb some of
the benefits of a more knowledge-intensive atmosphere or technology could be explicitly
transferred between foreign firms and their domestic affiliates or other domestic firms. For
example, Branstetter et al (2006) examine how technology transfer within US multinational
firms changed in response to a series of IPR reforms undertaken by 16 countries over the
1982-1999 period and find that royalty payments for technology transferred to affiliates in-
crease at the time of reforms, as do affiliate R&D expenditures and total levels of foreign
patent applications.
3 Empirical Strategy
3.1 The Basic Strategy
Comparing innovative activity by firms in India before and after India signed the TRIPs
Agreement would lead to a biased estimate of the impact of patent reforms if other determi-
nants of innovation were also changing systematically over time. We propose a solution to
this problem that involves characterizing industries according to differences in their reliance
on IPR protection and on innovation, and then comparing changes in innovative activity
across industries based on this characterization. The basic idea here is that with the intro-
2A positive relationship of this nature between the strength of a country’s IPR and the volume and
composition of FDI is empirically established in a survey by Lee and Mansfield (1998) of about 100 US firms
in six manufacturing industries. A link between IPR and trade is established by Maskus and Penubarti (1995)
who estimate reduced-form equations for 1984 bilateral trade in manufacturing sectors for 22 exporting
countries and 71 importing countries. They find that within the group of large developing countries, the
strength of national patent laws exerted a significantly positive effect on bilateral manufacturing imports
in many product categories with qualitatively similar although statistically weaker results for the group of
smaller developing countries. Interestingly, Maskus and Penubarti find that the pharmaceuticals industry is
particularly sensitive to patent rights for protecting innovation rents.
7

duction of a stronger IPR regime in India, some industries would be expected to increase
their R&D expenditure more than other industries. A major part of this differential re-
sponse is likely to be defined by “exogenous” or technological features of the industry that
relate to how important it is to innovate in this industry.
We use data on R&D spending and innovation in the U.S. between 1990 and 1994 to try
to capture the degree to which a given industry in India was “treated” by the TRIPs-induced
IPR policy shock. Under the assumption that IPR protection and enforcement in the U.S.
was “perfect’ during this period, we assert that cross-industry differences in R&D spending
and in rates of innovation in the U.S. reflect underlying technological characteristics that
vary across industries and determine the incentives to innovate. Our strategy is similar to
that in Rajan and Zingales (1998), wherein the authors use the extent to which an industry
in the US uses external finance to construct a more general measure of an industry’s financial
dependence for a large sample of countries.
In our context, a natural industry-level measure of innovation-dependence is the R&D
intensity - or the ratio of R&D expenditure to sales- of that industry in the U.S. Such
a measure is based on the idea that in an environment of very strong IPR, U.S. firms
endogenously solve for the profit-maximizing level of R&D expenditure, so that the ratio of
R&D spending to sales reveals the importance of R&D spending in that industry.
Because not all innovation is patented and our policy change relates directly to the
patentability of inventions, we also introduce a second measure that is directly connected
to patenting activity across industries. This measure is the “patenting intensity” of an
industry, which is calculated as the ratio of total patents granted to sales. Since patents
can be thought of as the output of R&D spending, the two measures are closely related.
However, in industries where methods other than patenting are traditionally used to protect
innovation - such as marketing and branding - or where R&D spending largely reflects
upgrading of existing facilities rather than investment in patentable inventions, the patent
to sales ratio may be low even when the R&D to sales ratio is high.
Section 4.2 describes how we calculate these two measures from data on R&D and
patenting by firms in the US. But given these measures of an industry’s dependence on
innovation and IPR, our estimation strategy is clear: if the TRIPs-induced IPR reforms
increased the incentives to innovate for firms in India, then the post-TRIPs growth in
spending on innovation should be higher in industries for which the values of these measures
are higher.
Much of our empirical analysis depends on the validity of using firm-level data from the
US as a proxy for “innovation-dependence” in India. The legitimacy of this strategy is best
evaluated by considering the key components of the two measures of innovation-dependence
that we derive from US data. In interpreting cross-industry differences in the ratio of R&D
8
to sales and patent-to-sales as measures of the relative importance of innovation across
industries in India, we are basing our argument on a primarily supply-driven story. In other
words, in our story, an industry’s R&D-to-sales ratio and its patent-to-sales ratio capture
industry-specific technological features that are fully uncovered only in environments with
effective and strong IPR laws.
However, it is very probable that demand-side factors also play a role in determining
both the proportion of total sales that a firm chooses to dedicate to R&D and patenting
efforts. In this case, to the extent that the relative patterns of demand vary substantially
across industries in the US and in India, we introduce potential measurement error into our
measures.
We can respond to this criticism in several ways. First, it has been argued that because
the economic size of developing country markets are small relative to the large fixed costs
of R&D in most industries, developing country markets are unlikely to determine the size
and direction of R&D.3 Nevertheless, a large literature indicates that local strengthening of
R&D should increase incentives to conduct R&D by firms operating in the region (Mans-
field,1986). Together, these arguments imply that if TRIPs did provide a boost to the
incentives to conduct R&D in India, we should expect much of this R&D to be driven by
the needs of the more profitable markets in the developed world.
Second, according to a simple convergence story, we would expect India’s patterns of
domestic consumption and production to approximate those of more developed economies
over time. Therefore, to the extent that firms can anticipate this convergence, we expect
that they would sink more of their fixed costs of R&D into industries where they expect
future growth to be high. To the extent that US markets serve as a more general proxy for
developed economies, our use of US data seems appropriate from this point of view.
Finally, given the clear trends of increased R&D in post-TRIPs India for industries
commonly known to be heavily dependent on innovation – such as the pharmaceuticals and
other chemicals industries – it seems likely that TRIPs did, in fact, have an effect on R&D
activities undertaken by local firms in India. Therefore, we believe that a somewhat noisy
measure of innovation-dependence creates a bias against finding a more general effect of
TRIPs on the incentives to conduct R&D in India.
3.2 Regression Specification
Our key regressions examine the effect of TRIPs by comparing changes in innovative
activity across industries expected to be affected differentially by a strengthening of IPR.
Let Yj be a measure of the importance of R&D to industry j. If patent reforms cause more
innovative activity in domestic firms, then we expect the impact of these reforms to be
3Chaudhuri et al. (2005), Dutta (2008), Lanjouw (1997).
9

increasing in Yj . This can be tested by estimating a linear regression of the differences-in-
differences type specification:
xijt = αYj + βPostt + γPostt ∗ Yj + ǫijt (1)
Here, xijt is a firm-level outcome of interest and Postt is a dummy indicating if the
observation is from a year following the IPR change. The coefficient of interest is γ, which
measures how the change in outcome varies according to the industry-level IPR importance
measure Yj. For instance, if xijt measured firm R&D expenditure, then a positive estimate
of γ would mean that the increase in firm R&D following TRIPs was greater in industries
with higher Yj. Under the identifying assumption that other factors affecting innovation
were uncorrelated with Postt ∗ Yj, this would indicate a causal influence of patent reforms
on R&D.
In our main estimations, we use a more general version of equation 1, one that allows for
common year effects and either industry or firm fixed effects. The year dummies control for
shocks to xijt which are common to firms across all industries. Industry fixed effects control
for all time-invariant differences across industries. Because we use an unbalanced panel
of firms, these estimates reflect both within-firm changes as well as the within-industry
changes arising from the entry and exit of firms from the panel. Estimates of the coefficient
on Postt ∗ Yj from regressions with firm FEs are driven by the within-firm changes across
pre and post TRIPs years, since the coefficient on the interaction term is identified off firms
observed for at least one period each before and after the IPR reform. In our robustness
analysis, we also try specifications that including 2-digit industry-specific linear time trends
in addition to the interaction term.
In interpreting our results, it is important to keep in mind the staggered and uncertain
nature of the formal process of IPR change in India, and the high likelihood that the changes
in patent law were anticipated by Indian firms. No one year in particular can be claimed
to be an IPR policy “shock” year, and our approach is to simply designate the first formal
indication of a change in patent law as the first “Post” (or “shock”) year, while allowing for
subsequent policy “shocks”. Our main specification focuses on India’s signing of the TRIPs
agreement in 1994, which is represented by the “Post” dummy indicating all post-1994
years, Y r94. But to the extent that Indian firms responded before 1994 in anticipation of
the agreement, the coefficient on Y r94t ∗ Yj underestimates the response to IPR changes.
Some regressions include two other “Post” dummies- a dummy equal to one for years
2000 and later, which corresponds to the passing of the Patents (Amendment) Act of 1999,
and a similar dummy corresponding to the 2002 Patents Amendment Act. We stress that
these dummy variables are meant to be the formal markers of a lengthy reform process, and
should not taken for unanticipated policy shocks. It is likely- and this is what the additional
10

“Post” dummies would pick up- that the R&D response to these reforms was a gradual but
consistent divergence across industries.4
4 Data
4.1 Indian Firm Level Data
Our primary source of firm-level data on R&D expenditure and foreign royalty payments
is Prowess, a comprehensive database of Indian firms that is maintained by the Center for
Monitoring the Indian Economy (CMIE). Prowess contains detailed information on over
5000 firms, including all companies traded on India’s major stock exchanges and several
other firms, such as the central public sector enterprizes, for the period 1989-2006.
The database covers most organized industrial activities, banking, organized finance and
other services sectors in India. The firms in Prowess account for 75 per cent of all corporate
taxes and over 95 per cent of excise duty collected by the Government of India. Prowess
provides detailed information on each company’s production, sales and expenditure as well
as financial information such as share prices, dividends and other gains.
Because smaller Indian firms are generally not publicly-traded, the firms in the Prowess
database are mostly “medium” or “large” in size by Indian standards, constituting a small
fraction of the total number of Indian firms, but a very large share of the total revenue.
According to the Indian Annual Survey of Industries (ASI), India had more than 100,000
registered manufacturing plants in 2000. The Prowess database contained 5250 companies
in the same year, many of which were multi-plant. But the Prowess companies had a total
revenue of Rs. 9 trillion, which was nearly 90% of the combined revenue of all registered
manufacturing units.5
Table 2 summarizes the Prowess data over two periods, 1989-1994 and 1995-2005. Dur-
ing the first period, a total of 3016 unique companies existed (for at least one year each) in
the Prowess data set, with average annual sales, in year 2000 prices, of Rupees 1.5 billion,
or about 38 million USD.6 These firms, on average, spent Rs. 1.5 million annually on R&D
and Rs. 3.1 million on foreign royalties, while earning Rs. 5 million in exports. During
the second period, the total number of unique Prowess firms increased to 5252 firms, with
4Moreover, unlike some differences-in-differences studies, we cannot be certain a priori that the adjustment
to the new policy regime would be over before 2005, our last year of data. Therefore, we cannot examine
if the differential growth in R&D spending ceased, as one might expect if it were a response to the IPR
changes, some years after the end of the reforms.5These figures are based on the authors’ own calculations using the 2000-01 Annual Survey of Industries
and Prowess data.6In 2000, the Rupee-Dollar exchange was 45 Rupees to a Dollar. We have deflated all monetary values
in our Prowess data to constant year 2000 prices using the Indian Wholesale Price Index.
11
mean sales, in year 2000 prices, at Rs. 1.8 billion, R&D spending at Rs. 5 million, and
foreign royalty payments at Rs 3.8 million. Thus, annual R&D spending during 1995-2005
was more than three times of that during 1989-1994, while there was a 38% increase in the
number of firms reporting positive R&D spending between the two periods.
4.2 U.S. Firm and Patent Data: Measures of Innovation-Dependence
For our measure of the “intensity” of R&D in U.S. industries, RnDIntensity, we used
Compustat, a large US firm-level data set.7 The variable RnDIntensity is calculated using
the ratio of total R&D spending and revenue during 1990-94 at the 4-digit industry level.
All the firms in the 1990-94 Compustat universe, including those with zero reported R&D
expenditure, were included in this calculation.
The second related measure of innovation-dependence was created by matching industry
level data on sales from Compustat to data on US patents. The data on patents is from
the NBER Patent Data File which comprises detailed information on all patents granted
in the U.S. between 1963 and 1999. The measure of innovation-dependence derived from
the patent data is PatIntensity, the ratio of the total number of patents granted between
1990-1994 and the total sales of the industry calculated at the 4-digit industry level.
Table 3 lists industries in descending order of average RnDIntensity for 2-digit NIC
groups. The average value of RnDIntensity ranges between 0.076 (for radio, television and
communication equipment) and 0.0002 (for mining of metal ores). Other highly R&D-
intensive industries include office and computing machinery, medical and precision instru-
ments, and chemicals and chemical products. One fact to be noted here is that RnDIntensity
is calculated at the 4-digit industry level and there is some degree of heterogeneity in the
values of RnDIntensity within the same two-digit industry group. For example, the average
value of RnDIntensity for chemicals and chemical products is 0.039, which places it fourth
on the list of two-digit industries in Table 3, but its constituent sub-category of pharma-
ceuticals products has the highest value of RnDIntensity across all 4-digit industries at
0.09.
Table 4 lists the same industries in descending order of average PatIntensity for 2-digit
NIC groups. The variable PatIntensity is the ratio of the number of patents granted to an
industry divided by its total sales (in million USD). The two-digit average for this measure
varies between 0.098 (for radio, television and communication equipment) and 0.0007 (for
mining of coal and lignite).
Because PatIntensity and RnDIntensity are highly correlated (the correlation coefficient
at the 4-digit level is 0.64), the rankings of industries in Tables 3 and 4 are very similar.
The mining and tobacco industries have both low rates of R&D and low rates of patenting
7Compustat is the data set of all firms traded in the U.S. stock market.
12
while communication equipment, chemicals, computing and other machinery place high on
both the R&D-intensity and patent-intensity lists. However, a comparison of the two tables
demonstrates some minor differences between the two measures. For example, the chemicals
industry is ranked second according to the patent-based measure but fourth according to
the R&D-based measure, highlighting the relative significance of patenting in the chemicals
industries.
5 Preliminary Analysis
5.1 Summary Statistics by R&d Intensity
Table 5 previews our regression analysis by comparing summary statistics across the pre
and post-TRIPS periods and across “high” and “low” RnDIntensity industries- that is,
those above and below the median values of RnDIntensity. As the table shows, annual firm
sales, though highly dispersed, is on average higher in the “low” RnDIntensity industries
in both periods. So are the median values of firm sales, although to a smaller extent. Mean
and median firm sales increase in both groups after 1994, and going by the medians, this
increase is of comparable magnitudes in the two groups. So is the increase in the number
of firms between 1989-94 and 1995-2005.
In contrast to these sales statistics, firms in “high” RnDIntensity are more likely to be
spending on R&D, and more significantly, the post-1994 increase in mean R&D spending
and the likelihood of R&D spending is clearly higher in the “high” RnDIntensity group.
The mean R&D spending in a “low” group firm increases by about 155%, while that in a
“high” RnDIntensity firm increases by 250%. In the post-1994 period, 37% of the “high”
group firms report non-zero R&D spending, in contrast to just 22% of the “low” group
firms.
5.2 Trends in R&D, Sales, Firm Entry, Trade and Patenting
The first panel of Figure 1 contains a graphical exposition of our main result. It shows
the levels of average industry R&D spending of the 13 2-digit industries that are above the
median values of RnDIntensity and that of the 13 industries that are below this median.
As displayed in the graph, the R&D expenditure of the “high” industries is growing steadily
throughout the early 1990’s, rises sharply around 1996 but experiences a temporary drop
for the next 3 years and then starts to increase again at an unprecedented rate around
the year 2000. The R&D expenditure of the “low” industries displays no such trend and
levels off around the same time. The average industry R&D spending in “high” industries
is higher both in terms of the levels of R&D and the rate of growth.
13
In the second panel of Figure 1, we plot the trajectories of average industry sales during
the same period for the two categories of industries. In the “high” industries, both the
level and the rate of growth of average industry sales is lower than that for the “low”
industries throughout the sample period. Moreover, particularly for the “high” industries,
there appears to be no significant differences in the growth rate of industry sales between
the pre-TRIPs and the post-TRIPs periods. While sales is clearly an imperfect proxy for
exogenous demand conditions, to the extent that it can serve as such a proxy, the sales
graphs of the two categories of industries indicates that increases in R&D spending are not
entirely driven by underlying changes in demand.
Figure 2, which plots R&D to sales ratios, highlights this relationship between R&D and
sales in the two categories of industries. While for the “low” industries, this relationship
is essentially flat or even decreasing in the post-TRIPs period, for the “high” industries,
this relationship has a noticeable upward trajectory from 2000. Interestingly, the average
value of the variable RnDIntensity for the “high” industries is 0.036. This implies that
in the US, the average R&D to sales ratio for the 13 “high” industries between 1990 and
1994 was approximately 3.5%. Figure 2 shows that even at its highest, the average R&D
to sales ratio for the corresponding industries in India is well below this mark and does not
rise above 1%.
Figure 3 plots the growth in the number of firms with low and high values of RnDIntensity.
It is important to note here that the relationship between the number of firms and R&D
spending is fairly complicated. While greater potential for growth in traditionally more
R&D-intensive and IP-heavy industries may have increased entry into such industries in
the post-TRIPs era, the increasing importance of the high fixed costs of R&D in such in-
dustries may have served as a barrier to such entry. In addition, the entry of firms may
itself influence R&D by introducing greater competition. The first panel of Figure 3 shows
that while the absolute number of firms in the average high industry is larger than that in
the average low industry, there is not much difference in the growth in firms between the
“high” and “low” industries throughout the sample period.
In the second panel of Figure 3, we plot the growth in the number of foreign firms.
It could be argued that foreign firms represent superior competition and induce greater
R&D spending through this channel. It is clear from the graph that both in the pre-
TRIPs and post-TRIPs periods, the number of foreign firms in India was greater for the
“high” industries. The graph also shows that between 1989 and 2001, the number of foreign
firms increases at a slightly faster rate in the “high” industries as compared to the “low”
industries. However, there is an equally steep fall in that number in the later years such
that the average number of foreign firms in a “high” industry is lower in 2005 than it was
in 1995 . For the “low” industries, the number of foreign firms increases for most of the
14
sample period, albeit at a slower rate, and there are more foreign firms in the average “low”
industry in 2005 as compared to 1995.
Figures 4 and 5 address the potential relationship between trade and R&D spending
by considering the trends in trade policy during the sample period. The 1990’s saw many
changes in trade policy, particularly the reduction of export tariffs faced by Indian produc-
ers abroad and in import tariffs faced by foreign sellers in India. The reduction in export
tariffs may represent increased access to larger markets for domestic producers, poten-
tially encouraging domestic R&D spending. The reduction in import tariffs may represent
increased competition in product markets in India, which could also potentially increase
domestic R&D spending. In the first panel of Figure 4, we see the export tariffs for the
“high” versus “low” industries while in the second panel, we see the value of exports in the
two sets of industries. It is clear from the first panel that while export tariffs decreased in
both the “high” and “low” industries, export policies did not significantly favor one group of
industries over another. The second panel of Figure 4 shows that the pattern of changes in
exports resembles that of the cuts in tariffs, making export tariffs a good proxy for changes
in policy.
Similarly, Figure 5 captures trends in import tariffs and the value of imports. The first
panel shows that the sample period saw steady decreases in import tariffs for both groups of
industries, and the second panel shows that imports responded to these tariff cuts by rising
steadily throughout the period. Importantly, the changes in import tariffs do not appear
to be correlated with the type of industry in terms of its dependence on R&D.
Increases in R&D spending should eventually show up in measures of the output of
R&D, such as patents. Figure 6 considers the trends in successful patent applications
granted between 1989 and 1999. The industries are once again broken up into “high” and
“low” groups, and the three panels represent the average number of patents granted in
each of these two industry groups to firms in India, the U.S. and three Western European
countries respectively. In contrast with India, the U.S. and the three Western European
countries already had strong IP protection in place before TRIPs and were, therefore,
relatively unaffected by it. The graph shows a sharp increase in the number of patents
granted to Indian firms in the “high” industries. Patents granted to the “low” industries
also increases, but this increase is not as pronounced as that found in the “high” group.
For both U.S. and the three Western European countries, patents granted in the “high”
industries increases relative to that in the “low” group in the post-TRIPs period, but the
increase appears to be less dramatic than the corresponding increase for India.
15

6 Results
6.1 Main Results: Differential Response to IPR Changes
Our main regressions estimate equation 1, where we use firm-level data for 1989-2005,
with the logarithm of the annual R&D spending as the outcome variable Xijt. As our main
explanatory variable, we use the interaction between a post-TRIPs dummy variable (Y r94)
and the R&D to sales ratio calculated at the four-digit industry level from US Compustat
data for 1990-94 (RnDIntensity). As described in a previous section, because the US repre-
sents an environment of strong IP protection, the R&D to sales ratio in the US proxies for
the underlying technological dependence of an industry on R&D. In some specifications, we
use the patents to sales (PatIntensity) ratio as the measure of the importance of innovation
to an industry.
The regressions include a full set of year dummies (which absorb the coefficient on
Shockt) and industry or firm fixed effects (which absorb the coefficient on Yj). The purpose
of the interaction term Y r94 ∗ Yj is to measure how the proportional increase in R&D
spending between 1989-94 and 1995-2005, varied by Yj, the “innovation intensity” of an
industry.
Tables 6 presents our key results on R&D spending: the proportionate increase in ex-
penditure on R&D after 1994 was systematically higher in industries that had higher R&D
to sales ratios (or patents to sales ratios) in the United States. Column (1) presents OLS
results from regressing the logarithm of R&D on 16 year dummies and 121 industry dum-
mies, and an interaction of Y r94 with RnDIntensity. The estimated coefficient on the
interaction term has a value of 4.67, and it is significant at the 5% level. This estimate
implies that the average change in annual firm R&D spending, before and after 1994, was
roughly 9 percentage points higher in an industry with a one standard deviation higher
value of RnDIntensity.8
The industry FE estimates in column (1) reflect within-industry changes, since the
interaction of Y r94 with RnDIntensity picks up not only the within-firm changes in R&D
spending after 1994, but also the effects of any post-1994 firm entry on average firm R&D
in an industry. Here it may be significant that the early 1990s in India saw major changes
in industrial policy that are claimed to have had large effects on the entry and expansion
of firms (Aghion et al., 2007). This is evident in Figure 3, which shows a marked increase
in the number of Prowess firms in the early 1990s, in both high and low RnDIntensity
industries. If young firms- even those that intend to innovate- start off at low levels of R&D
spending, then in the short run firm entry by itself would lower average firm R&D spending
in an industry. In our context, the high rate of post-1994 firm entry, which appears to be
8RnDIntensity has a standard deviation of 0.02.
16
similar across high and low RnDIntensity industries, could have reduced the estimated
post-1994 divergence in R&D spending across industries. In addition, R&D spending could
be influenced by a number of firm-specific factors, many of them unobservable, which are
not accounted for in the above specification.
This suggests that measures of within-firm changes would be more reliable indicators
of the impact of patent reforms. So in column (2), we replace the industry dummies with
firm fixed effects. Now the coefficient on the interaction of Y r94 with RnDIntensity is
identified off firms observed at least once in both pre-1994 and post-1994 periods. The
estimated coefficient on the interaction term is markedly larger -18.9- and it is significant at
the 1% level. This number implies that the within-firm increase in annual R&D spending
in the post-TRIPs period was on average about 37 percentage points higher in an industry
with a one standard deviation higher value of RnDIntensity. Additionally, the fact that
the estimated coefficient with firm fixed effects estimate is larger that that with industry
fixed effects indicates that the post-1994 entry of firms and firm-specific unobservables
that influence R&D spending dampened the post-1994 divergence in average firm R&D
expenditure. In the rest of this paper, the reported results will correspond to firm fixed
effects, and we note now that like the first two regressions, our industry FE estimates are
in general smaller but of the same sign as the corresponding firm FE estimates.
Next, in column (3) of Table 6, we interact RnDIntensity with two additional “Post”
dummies representing the subsequent IPR policy changes, Y r99 and Y r02 (respectively,
dummy variables for the years 2000-2005 and 2003-2005). Thus, in this specification, each
successive period dummy picks up a cumulative effect over the previous one. While the
coefficient on the interaction of Y r99 with RnDIntensity is not statistically significant,
that on Y r02 ∗RnDIntensity is positive and significant at 1% level. This implies that the
cross-industry divergence in R&D spending, which began around 1994, widen further after
2002, the year in which an additional Patents Amendment Act was passed. The coefficient
on Y r94 ∗ RnDIntensity implies that the increase in annual firm R&D spending in an
industry with a 1 standard deviation higher value of RnDIntensity between the pre-TRIPs
period and its immediate aftermath (i.e. 1995-2002) was about 34 percentage points. The
coefficient on Y r02 ∗ RnDIntensity implies that subsequent phases of IP reform (in this
case, the 2002 Patent Amendenment) led to an additional increase of about 10 percentage
points in R&D spending. This pattern is thus consistent with the step-wise nature of the
formal patent law reform process.
Columns (4) and (5) use PatIntensity, instead of RnDIntensity, to characterize the
extent to which innovation matters in an industry. The results are similar to and reinforce
previous results: industries with higher values of PatIntensity saw a larger increase in R&D
spending after 1994 and 2002. In column (4), in a regression analogous to that presented in
17

column (2), the coefficient on Y r94∗PatIntensity is equal to 7.7 and is significant at the 5%
level. This number indicates that the post-1994 increase in annual firm R&D spending was
on average about 27 percentage points higher in an industry with a 1 standard deviation
higher value of PatIntensity.9 In column (5), as in column (3), the coefficients on both
Y r94 ∗ PatIntensity and Y r02 ∗ PatIntensity are positive and statistically significant.
6.2 Robustness Checks
A potential concern with our econometric specification is that differences-in-differences
estimators using multiple years of before and after data on a policy change can underestimate
the standard errors on the treatment effect, if errors are serially correlated (Bertrand et al.,
2004). A common approach to addressing this problem is to allow for arbitrary correlations
within appropriate groups. Our results are robust to different clustering schemes, and in
particular, all our regression results that use annual data report robust standard errors
that allow for arbitrary correlation within 4-digit industries.10 We have also tried another
suggested solution (Bertrand et al., 2004), which is to ignore the time-series by collapsing
the data to two periods, one before and one after the policy change. We present these
results in columns (1)-(4) of Table 7, with each column corresponding to one of the annual
data regressions shown in columns (2)-(5) of Table 6.
For example, column (1) in Table 7 corresponds to the second column of Table 6: the
annual data have been collapsed to two periods, 1989-1994 and 1995-2005, by taking within-
firm means in each period, and the logarithm of firm R&D in these periods is regressed on
two period dummies, firm fixed effects and an interaction of RnDIntensity with the dummy
for the post-1994 period. The second regression in Table 7 corresponds to that shown in
column (3) of Table 6, since here the data have been collapsed to four periods- 1989-1994,
1995-1999, 2000-2002 and 2003-2005, and RnDIntensity is interacted with all three post-
1994 period dummies. The next two columns repeat the exercise with PatIntensity.
These estimations on collapsed data yield a pattern of positive and significant interaction
affects that are similar to those in the previous table, indicating that our main results are
robust to serial correlation. The coefficients on the interactions of either RnDIntensity or
PatIntensity with the post-1994 period dummy are positive and significant, as are their
interactions with the post-2002 dummy. Their values are lower than those estimated in
Table 6. For example, a 1 standard deviation increase in RnDIntensity, is now estimated
to affect R&D growth by 27 percent points (Column 1).11
In estimating RnDIntensity and PatIntensity by averaging U.S. firm data for 1990-94,
9The variable PatIntensity has a standard deviation of 0.035 across 4-digit industries.10In general, this clustering scheme increases our estimated standard errors compared to no clustering or
other clustering schemes.11This could be related to the non-linearity of the log function.
18

we hope to have captured the stable measures of the dependence of an industry on R&D and
patenting. But it is possible that these averages also pick up the effects of shocks or recent
trends in R&D activities. For example, high RnDIntensity as measured for 1990-94 could
reflect early 1990s advancements in basic technology that stimulated commercial R&D. If
the same trend were also affecting R&D spending in India, we would misinterpret it as
the response to patent reforms. To check against this possibility, we developed alternate
RnDIntensity and PatIntensity measures by averaging Compustat’s U.S. firms data for
older periods, going as far back as 1975-80. We found that irrespective of the lag on the
RnDIntensity and PatIntensity measures, our core results stayed the same.
In the last two columns Table 7, we re-estimate our basic regressions, with RnDIntensity
and PatIntensity measured using firm-level data from the US for 1975-80. In both regres-
sions, the estimate of the coefficient on the interaction of the lagged innovation intensity
measure with the shock dummy is positive and significant. The estimated magnitudes of
the interaction effects are identical to those in the corresponding columns ((2) and (4)) of
Table 6. A 1 standard deviation increase in RnDIntensity constructed with 1975-80 data
is estimated to increase post-1994 R&D growth rate by 36 percent points, and the corre-
sponding differential effect of 1975-80 PatIntensity is 24 percent points.12 Thus, it is clear
that our original measures of RnDIntensity and PatIntensity using data from 1990-94
represented the stable, long-term dependence of an industry on innovation.
As seen in Tables 6 and 6, both measures of the innovation intensity of an industry- the
R&D/Sales and the Patents/Sales ratios- give the same basic results. This is also true of the
regressions estimated in the rest of the paper, and for the sake of economy, we report results
only from the specifications which use RnDIntensity as the measure of the importance of
innovation in an industry.
6.3 Other Policy Developments
In addition to the more general aspects of TRIPs that affected the entire economy, the
IPR reforms in 1994 included an additional provision for chemicals, drugs, agrochemicals
and food processing industries. This was the mandatory introduction of product patenting
in these industries. Column (1) of Table 8 investigates whether these additional reforms had
any independent effects by adding to our basic specification interactions of Chem-a dummy
for chemicals, drugs, agrochemicals and food processing- with the Y r94 dummy. This
inclusion does not affect the coefficients on RnDIntensity∗Y r94 and RnDIntensity∗Y r02.
This shows that our results reflect broader IPR reforms and are not driven by chemicals
or drugs industries alone. The coefficient on Chem ∗ Y r94 itself is not significant; perhaps
12The lagged RnDIntensity and PatIntensity measures have standard deviations of 0.01 and 0.04, respec-
tively.
19
because the chemicals and drugs industry group also has the highest value of U.S. R&D
intensity, our analysis cannot tease apart any potential additional effects of product patent
laws in these industries from those of the more general package of IP reforms.
The rest of Table 8 deals with the potentially confounding effects of major trade and
industrial policy reforms in India. A balance of payments crisis in the early 1990s in India
led to a period of wide-spread economic liberalization. Owing to this dramatic economy-
wide change, one concern with our interpretation of the results in Table 6 is that the
differential patterns in R&D growth could be related to other policy changes. In particular,
many industries were deregulated by removing “licensing” requirements on the entry and
expansion of firms, foreign direct investment restrictions were lowered, and trade barriers
were lowered for a large set of products. It is possible that by increasing the intensity of
competition between firms, these policy changes altered domestic incentives to invest in
R&D .
In 1991, India began to slash tariff and non-tariff barriers to imports in most industries.
The magnitude and exact timing of the tariff change varied markedly across industries, and
while there is evidence that these changes are not strongly correlated with baseline industry
characteristics such as productivity, size and capital intensity (Topalova, 2007), we would
want to confirm that our results are robust to changing tariff rates. This is necessary
because of the growing evidence that industrial productivity in developing countries rises
in response to trade liberalization (Tybout, 2000).
An additional source of complication is the fact that the TRIPs agreement was formed
in conjunction with the World Trade Organization (WTO). The WTO involved a commit-
ment by developed nations to lower trade barriers to developing countries, if these countries
complied with the obligations to strengthen IPR, in the manner stipulated by TRIPs. Be-
cause the prospect of access to larger markets can induce firms to invest more in innovation,
this lowering of trade barriers arouses concern that our results could have been influenced
by differential changes in access to foreign markets.
Another major policy change was “delicensing”, or entry liberalization. The Indus-
tries (Development and Regulation) Act of 1951 required registered manufacturing units
to obtain, through an onerous process, licenses to establish new factories, expand capacity,
change product lines or plant location (Aghion et al, forthcoming; Chari, 2008). In 1985,
the Indian government began the process of removing these controls by delicensing about
a third of industries. Most of the remaining industries were delicensed in 1991, and there
is evidence that these industries saw increased firm entry and productivity in states with
pro-employer labor regulation (Aghion et al, forthcoming). Although fewer than 10% of
industries were delicensed between 1994 and 2000, deregulation might have a delayed im-
pact on innovation, and industries delicensed in 1991 might have seen an increase in R&D
20
spending in the late 1990s.
There is also the possibility that the observed R&D patterns reflect heterogenous industry-
specific response to trade and industrial policy reforms. Suppose the R&D intensity of an
industry is correlated with other industry characteristics that predict the degree to which
an industry responds to increased competition or new market opportunities. Then even if
the extent of tariff reductions or delicensing were uniform across industries, the response
to these changes would vary by RnDIntensity, and this would be mistaken for a differential
response to patent reform. In other words, RnDIntensity ∗Y r94∗ could be correlated with
the unobserved, heterogeneous effects of tariff reductions or delicensing.
The regressions presented in columns (2)-(6) of Table 8 address these concerns by adding
appropriate controls to the regressions shown earlier in Table 6. We control for changes in
export barriers by including as a regressor annual industry-level import barriers in India’s
export destinations. To take into account domestic import liberalization, we use annual
industry-level data on import tariffs in India as a control. We control for delicensing by
including a dummy that is equal to one for an industry in the years following the removal of
license controls on that industry. To deal with the possibility of heterogeneous effects of tariff
reductions or delicensing, we also estimate regressions that allow these policy developments
to have had a differential response across high and low RnDIntensity industries. We do so
by including interactions of RnDIntensity with tariff and delicensing measures in the set of
controls.
First, in column (2) we add an interaction of a dummy for majority foreign ownership
with the post-1994 dummy to the set of regressors. This is to check against the possibility
that the observed differential in R&D growth is driven by R&D intensification in foreign
owned firms following FDI liberalization.13 The result shows that foreign owned firms
increased R&D more than domestic firms- the coefficient on Foreign ∗ Y r94 indicates that
the post-1994 R&D growth was more than 100 percent points higher in foreign owned
firms. However, this does not affect the coefficients on our main explanatory variables,
the interactions of RnDIntensity with the shock dummies. The finding that foreign-owned
firms stepped up R&D more than other firms is not surprising - for example, foreign-owned
firms might respond more because they have better access to financing or to a superior
initial R&D base. Importantly, this finding does not contradict the hypothesis that local
strengethening on IP laws increased R&D spending in India. The essential point to be
noted here is that neither foreign nor domestic firms may have willing to step up their R&D
efforts in India without the promise of the stronger IPR.
Next, column (3) of Table 8 takes into account the effects of trade policy by including
13Note that because of the firm fixed effects, any entry of foreign firms after 1994 could not be driving
our results.
21

annual industry-level import tariffs in India (InTariff ) and a weighted mean of industry-
specific tariffs in India’s export destinations (ExTariff ). In calculating the latter, for each
4-digit industry, year-wise import tariffs14 in foreign countries were weighted by that des-
tinations’s share in Indian exports for that industry in 1989. The core regression results
are unaffected by these additions, which is perhaps not surprising, given that changes in
domestic and foreign import tariffs in the 1990s were roughly similar across high and low
RnDIntensity industries. The coefficients on InTariff and ExTariff are statistically not
significant.
Column (4) adds a dummy for post-delicensing years to the set of explanatory variables;
this too does not affect the size and significance of the coefficients on the interaction of
RnDIntensity with the shock dummies. The coefficient on the delicensing dummy is not
significant, which suggests that firms in delicensed industries did not have significantly
higher R&D spending in post-delicensing years.
The regression presented in column (5) addresses the possibility of heterogeneous effects
of tariff reductions and delicensing by including interactions of RnDIntensity with tariff
and delicensing measures in the set of controls. The results are interesting: first, the
estimated coefficient on RnDIntensity*InTariff is negative and significant, indicating that
lower import tariffs raised R&D spending relatively more in higher RnDIntensity industries.
The estimates imply that for a 1 percent decline in the import tariff, the growth in R&D
spending is 0.5 percentage points higher in an industry with a 1 standard deviation higher
value of RnDIntensity. This suggests that import competition encourages firms to innovate,
and more so in more innovation dependent industries. The second notable result in column
(5) is that the estimated coefficient on RnDIntensity∗Delicensed is positive and significant,
implying that some of the divergence in R&D spending in the 1990s was the outcome of entry
and expansion. The estimates show that compared to an industry that was not delicensed,
the post-delicensing growth in R&D spending was nearly 35 percentage points higher in
an industry with 1 standard deviation higher value of RnDIntensity. This indicates that
firms in innovation-intensive industries respond to the threat of entry by stepping up R&D
efforts.
Column (5) also shows that including interactions of RnDIntensitywith tariff and deli-
censing measures in the set of controls lowers the estimated values of the coefficients on the
interactions RnDIntensity with Y r94 and Y r02, although they remain statistically signifi-
cant as before. This suggests that not accounting for potentially heterogenous impacts of
trade and industrial policy changes gave us an overestimate of the effect of IPR reforms on
R&D spending. In this more cautious estimate, which we prefer to that in Table 6, the effect
of a 1 SD increase in RnDIntensity on post-1994 R&D growth is closer to 20 percentage
14Adjusted for non-tariff restrictions through tariff equivalents.
22

points.
Lastly, column (6) does a specification check by including 2-digit industry specific time
trends to the set of control variables. The concern being addressed here is that the coef-
ficients on the interactions of RnDIntensity with the post-1994 dummy could be picking
up differential R&D trends (potentially generated by underlying demand conditions) across
broad industry groups in the 1990s. Comparing the estimates to those in column (5), it is
apparent that key coefficients are unaffected, so that our estimate of post-1994 differential
R&D spending growth is robust to allowing different linear time trends in different industry
groups.
6.4 Survey-based Measure of IPR Importance
So far, we have relied on indirectly inferring the importance of patenting and innovation
by observing R&D and patenting in U.S. firms. The Yale Survey on Industrial Research
and Development (Levin et al., 1987) asked U.S. R&D executives from over 1500 businesses
to describe and rate various mechanisms, including patents, for appropriating returns from
R&D. Cockburn and Griliches (1987) used these data to construct industry-level measures
of the effectiveness of patenting in appropriating the returns from R&D. To the extent that
these measures reflect industry-specific technological features of the R&D process that are
common across countries, they should also predict cross-industry variation in the response
of Indian firms to IPR strengthening. Just like with RnDIntensity and PatIntensity,
R&D growth should be higher in industries whose managers gave higher average ratings to
patents as a means of appropriating R&D returns in the Yale Survey.
Using the Yale survey measures in place of RnDIntensity or PatIntensity involves
tradeoffs, because although the survey tried to directly elicit the overall importance of
IPR to R&D, the managers’ responses, like other perception-based ratings, might not be
comparable across industries. Moreover, the survey was fielded across a limited number
of industries, and the industry identifier used in the survey is based not on a standard
industrial classification but on a “line of business” classification. After recomputing these
measures at the 4-digit NIC level using the industry group descriptions given in Cockburn
and Griliches (1987), we were able to calculate survey response values for only 69 of the 120
4-digit NIC industries that feature in our regressions.15
Table 9 presents results from regressing R&D spending on Y r94 interacted with the Yale
Survey measures of the importance of patenting to R&D that Cockburn and Griliches (1987)
construct. The variable PPP is based on responses to “do process/product patents prevent
15The industry averages of the measures derived from the Yale Survey are presented in Table C2 in
Cockburn and Griliches (1987). They matched the Yale survey respondents to a self-devised industry
scheme, based on the U.S. SIC, which is close to but in general coarser than the 4-digit NIC scheme.
23

competitors from duplicating inventions?”. If stronger IPR encouraged domestic R&D in
India, then we expect the post-1994 increase in R&D spending to be increasing in PPP .
This does appear to be the case, and the results presented in Table 9 are weaker than
but consistent with previous results. In column (1), where the specification corresponds
to that in columns (2) and (4) of Table 6, the estimated coefficient on PPP ∗ Y r94 is
positive and close to 10% level of significance, while in column (2), where PPP is also
interacted with Y r99 and Y r02, the coefficient on PPP ∗ Y r99 is positive and significant
at the 5% level. In column (3), we add an interaction of Y r94 with NPP , a measure of
the effective of non-patent measures to protect inventions, and find that controlling for the
effectiveness of patenting (as measured by PPP ), the post-1994 growth in R&D was falling
in NPP . Next, columns (4) and (5) verify that like our results on RnDIntensity ∗ Y r94
and PatIntensity ∗ Y r94, the PPP ∗ Y r94 result is robust to a specification in which the
firm level data have been collapsed to two periods- before and after 1994.16
6.5 Domestic Market Size Effect
Patents help in appropriating the returns from private R&D by assigning a monopoly
right to the inventor. Thus, the larger the market that could potentially be captured
by this monopoly, the greater the incentive to work towards a patentable innovation.17To
the extent that investment in R&D by local firms in India is geared towards developing
patentable innovations for the local market, stronger IP in India could matter more in
industries where the size of the local market is larger. Moreover, since India is a low-income
country, its demand structure is likely to be different from that of the U.S., and it is possible
that two industries with the same R&D intensity in the U.S. have very different domestic
market sizes in India. To the extent that US-based measures of RnDIntensity reflect
demand-side factors that are specific to the US and not applicable to India, accounting for
initial differences in market sizes in the two countries may reduce measurement error.
We test this in Table 10, where we add interactions of RnDIntensity ∗ Shock with
Dmarket to our basic specification. Dmarket, which serves as a proxy for the size of the
potential domestic market represented by each industry, is India’s industrial output less net
exports in each 4-digit industry in 1990.18 Column (1) uses one shock dummy, Y r94, while
column (2) also includes Y r99 and Y r02 dummies, and column (3) the full set of control
variables that were featured in last column of Table 8. We find that in all the specifications,
16We get similar results by using alternative measures of patent importance, similar to PPP , that are
presented in Cockburn and Griliches (1987).17Market size is a determinant of equilibrium R&D intensity in most theoretical models of R&D investment,
such as Kortum (1993).18Source: Industrial output is from the Annual Survey of Industries, and import-export data is from
COMTRADE.
24

the estimated coefficient on the interaction of RnDIntensity ∗ Y r94 with DMarket is
positive and significant at the 1% level, which indicates that the impact of RnDIntensity
on the post-1994 growth in R&D spending was significantly higher in industries with higher
domestic consumption in 1990. For example, the estimates from column (1) imply that the
coefficient on RnDIntensity ∗ Y r94 increases from about 5 to 11 as the domestic market
size increases from the 25th to the 75th percentile of its distribution across industries. This
result is consistent with the idea that the larger the size of the initial market in India, the
more relevant would U.S. RnDIntensity be in predicting the post-1994 R&D growth in
India.
6.6 Patenting by Indian Innovators
The increased R&D spending by firms in India documented in the preceding sections
could be directed towards major, patentable innovations or towards minor upgrades of
technology.19 The former kind of R&D spending is more likely to create greater long-term
economic gains for the local economy. Therefore, more light can be shed on the economic
effects of TRIPs in India by analyzing the extent to which the patterns of R&D spending
correlate with patterns of patenting by firms in India.
In this section, we use information from the NBER Patent Database on all successful
U.S. patent applications between 1989 and 1999 to examine if the post-TRIPs era saw an
increase in the total number of successful patents by India. In particular, we test whether
patenting by Indian inventors rose relative to developed countries where TRIPs involved
relatively minor changes to IP laws, and if this increase was greater in more innovation-
dependent industries.20
To make this analysis comparable to our examination of R&D spending, we would like
to measure patents by NIC industry groups. However, U.S. patents are categorized into
U.S. “patent classes”, which are distinct from industry groups, and there is no standard
mapping between these classes and 4-digit ISIC or NIC industry groups. Moreover, the
data on patenting by Compustat firms show that firms in the same 4-digit NIC group hold
patents across several U.S. patent classes, suggesting that a mapping from patent classes to
broader 2-digit NIC groups would be more realistic.
We first used the NBER patent data to calculate, for each patent class, the number
of patents granted annually between 1989-1999 to inventors from India, the United States
and three Western European countries- Britain, France and Germany. In contrast with
India, the comparison group- the U.S. and the Western European countries - had strong
19For example, Branstetter et al (2006) argue that affiliates of foreign MNC’s in developing countries
increase their R&D spending at the time of IP reforms partly because they are getting ready to absorb their
parent firm’s technology.20The NBER Patent Data are described in Hall et al. (2001).
25
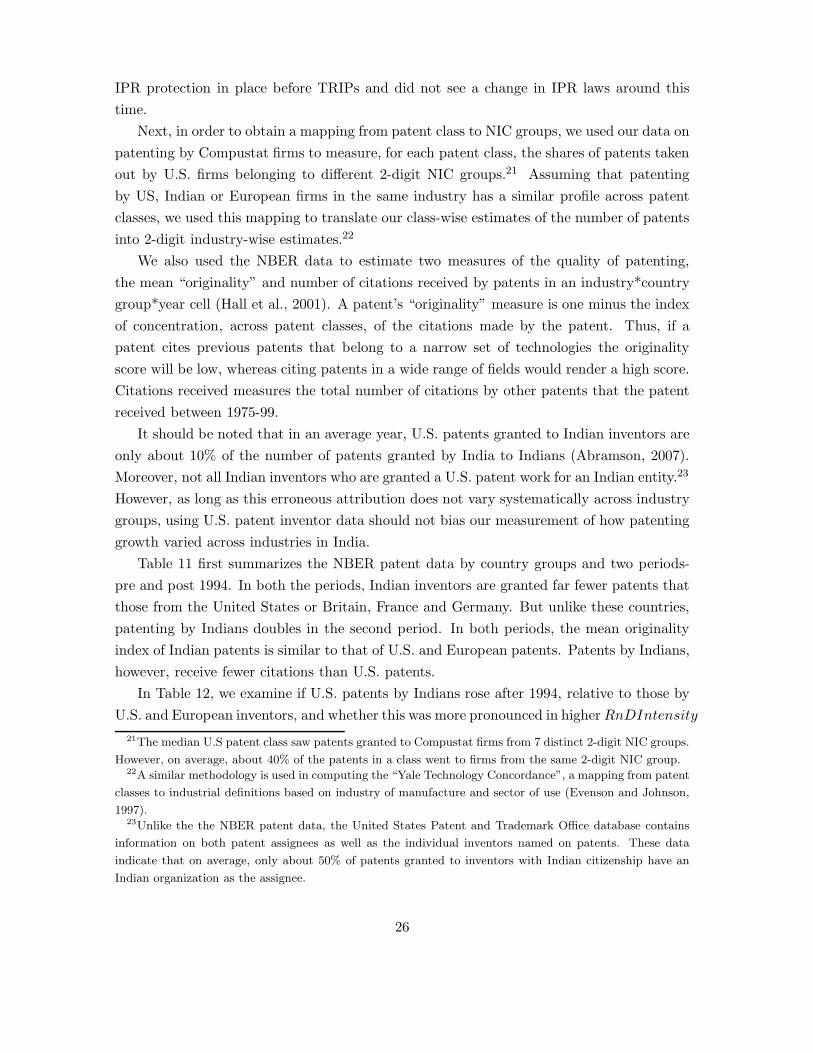
IPR protection in place before TRIPs and did not see a change in IPR laws around this
time.
Next, in order to obtain a mapping from patent class to NIC groups, we used our data on
patenting by Compustat firms to measure, for each patent class, the shares of patents taken
out by U.S. firms belonging to different 2-digit NIC groups.21 Assuming that patenting
by US, Indian or European firms in the same industry has a similar profile across patent
classes, we used this mapping to translate our class-wise estimates of the number of patents
into 2-digit industry-wise estimates.22
We also used the NBER data to estimate two measures of the quality of patenting,
the mean “originality” and number of citations received by patents in an industry*country
group*year cell (Hall et al., 2001). A patent’s “originality” measure is one minus the index
of concentration, across patent classes, of the citations made by the patent. Thus, if a
patent cites previous patents that belong to a narrow set of technologies the originality
score will be low, whereas citing patents in a wide range of fields would render a high score.
Citations received measures the total number of citations by other patents that the patent
received between 1975-99.
It should be noted that in an average year, U.S. patents granted to Indian inventors are
only about 10% of the number of patents granted by India to Indians (Abramson, 2007).
Moreover, not all Indian inventors who are granted a U.S. patent work for an Indian entity.23
However, as long as this erroneous attribution does not vary systematically across industry
groups, using U.S. patent inventor data should not bias our measurement of how patenting
growth varied across industries in India.
Table 11 first summarizes the NBER patent data by country groups and two periods-
pre and post 1994. In both the periods, Indian inventors are granted far fewer patents that
those from the United States or Britain, France and Germany. But unlike these countries,
patenting by Indians doubles in the second period. In both periods, the mean originality
index of Indian patents is similar to that of U.S. and European patents. Patents by Indians,
however, receive fewer citations than U.S. patents.
In Table 12, we examine if U.S. patents by Indians rose after 1994, relative to those by
U.S. and European inventors, and whether this was more pronounced in higher RnDIntensity
21The median U.S patent class saw patents granted to Compustat firms from 7 distinct 2-digit NIC groups.
However, on average, about 40% of the patents in a class went to firms from the same 2-digit NIC group.22A similar methodology is used in computing the “Yale Technology Concordance”, a mapping from patent
classes to industrial definitions based on industry of manufacture and sector of use (Evenson and Johnson,
1997).23Unlike the the NBER patent data, the United States Patent and Trademark Office database contains
information on both patent assignees as well as the individual inventors named on patents. These data
indicate that on average, only about 50% of patents granted to inventors with Indian citizenship have an
Indian organization as the assignee.
26

industries. Columns (1) and (2) presents results from regressions of the logarithm of the
number of U.S. patents granted on a dummy for the post-TRIPs period, and its interac-
tions with our measures of innovation-dependence.24 Patents are measured for country-
industry-year cells, with the inventor’s country clubbed into three groups (U.S., India and
Britain-France-Germany), and industries categorized into 35 2-digit NIC groups. All the
regressions include industry-country group fixed effects, and a full set of year dummies.
The regression shown in column (1) clubs U.S. and European inventors together- both
US and Europe dummies are omitted from the set of explanatory variables. Column (3)
allows patenting by U.S. and European inventors to grow at different rates- that is, only
the US dummies are omitted. This implies that in column (1) the coefficients on the India
dummy measure how patenting by Indians differed from the mean of U.S. and European
inventors’ patenting, whereas in column (2) the coefficients on the India dummy measure
how patenting by Indians differed from that by U.S. inventors.
In both columns, the coefficients on India ∗Y r94 and RnDIntensity ∗ India ∗Y r94 are
positive and statistically significant, and in column (2), the coefficient on RnDIntensity ∗
India ∗ Y r94 is higher than that on RnDIntensity ∗ Europe ∗ Y r94. This indicates that
compared to both U.S. and European inventors, the number of U.S. patents granted to In-
dian inventors increased between 1989-94 and 1995-99, and that this increase was relatively
higher in industries with higher values of RnDIntensity. The estimates in column(2) imply
that as the RnDIntensity of an industry increases by 1 SD, the post-TRIPs growth in the
number of U.S. patents awarded in that industry increases by 3.8% for U.S. inventors, 1.9%
for Western European inventors, and 7.4% for Indian inventors. Thus, changes in patenting
by Indian in the U.S. during 1989-1999 are consistent with the observed patterns in R&D
spending by Indian firms.
Another dimension of the quality of R&D is the quality of the innovation that it pro-
duces. Columns (3) and (4) test this by regressing our quality measures- respectively,
the originality index and the number of citations received in other patent applications- on
the same set of explanatory variables as in column (2). We find that analogous to the
patterns in the volume of patenting, compared to both U.S. and European inventors, the
average originality index of patents granted to Indian inventors increased between 1989-94
and 1995-99, and that this increase was relatively higher in industries with higher values of
RnDIntensity. For citations, the RnDIntensity ∗ India ∗ Y r94 is positive but not signifi-
cant. However, citations are generally received with a lag (Hall et al., 2001), so perhaps 1999
is too early for an increase in mean citations to post-1994 Indian patents to show up. On
the whole, the patenting results indicate that the post-1994 increase in R&D expenditure
24We use logarithms because the number of U.S patents to Indians is a tiny fraction of all U.S. patents,
which suggests comparing proportional, rather than absolute increases in the number of patents, across
Indians and non-Indians.
27

in India is not driven by minor technological upgrading alone.
6.7 Foreign Royalty Payments
Did the patent regime change affect technology purchases by firms in India? With secure
IPR, there is a lower risk of theft of licensed technology and consequently, we may observe
more licensing and sales of technology between firms in this environment. We test this
by regressing our measure of foreign technology purchase- their foreign royalty payments-
on the interaction variable RnDIntensity ∗ Y r94 and year and firm fixed effects. The
regressions specifications are similar to those featured in Tables 6 and 8.
The results, presented in Table 13, are ambiguous and sensitive to the the inclusion
of controls. In columns (1) and (2), which do not include controls for tariffs and deli-
censing, the coefficients on RnDIntensity ∗ Y r94 and RnDIntensity ∗ Y r02 are negative,
although statistically not significant. But in column (3), where the controls include dum-
mies for tariffs, delicensing and their interactions with RnDIntensity, the coefficients on
RnDIntensity ∗ Y r94 and RnDIntensity ∗ Y r99 are positive and significant.
Ideally, we would have liked to measure post-1994 changes in the demand for foreign
technology, rather than the equilibrium spending on foreign technology. Since stronger IPR
could increase not just demand for foreign technology but also its supply, its net effect on
foreign royalty spending can in theory be negative. It could be that our results on foreign
technology purchase are inconclusive because the changes in supply need not have varied
systematically by RnDIntensity.
7 Conclusion
The issue of strengthening intellectual property rights in developing countries has led
to a multi-faceted and acrimonious debate. Given the large number of poor people in such
countries, the risk of higher prices in a stronger IPR regime and the low levels of indigenous
innovation in developing countries, the issues involved in this debate have ranged from
concerns about market access for the poor to the implications of stronger IPRs for the
international distribution of wealth.
This has certainly been the case for India which, after several years of resistance and in
spite of severe opposition from large segments of the Indian population, finally agreed in
1994 to a ten-year deadline to completely overhaul its existing weak IPR-regime.
In this paper, we address the issue of whether the TRIPs Agreement of 1994 led to
changes that increased the level of and the capacity for innovation for domestic firms in
India. In order to do this, we develop a methodology that relates industries to their intrinsic,
technological dependence on innovation and R&D and attempt to correlate the trends in
28
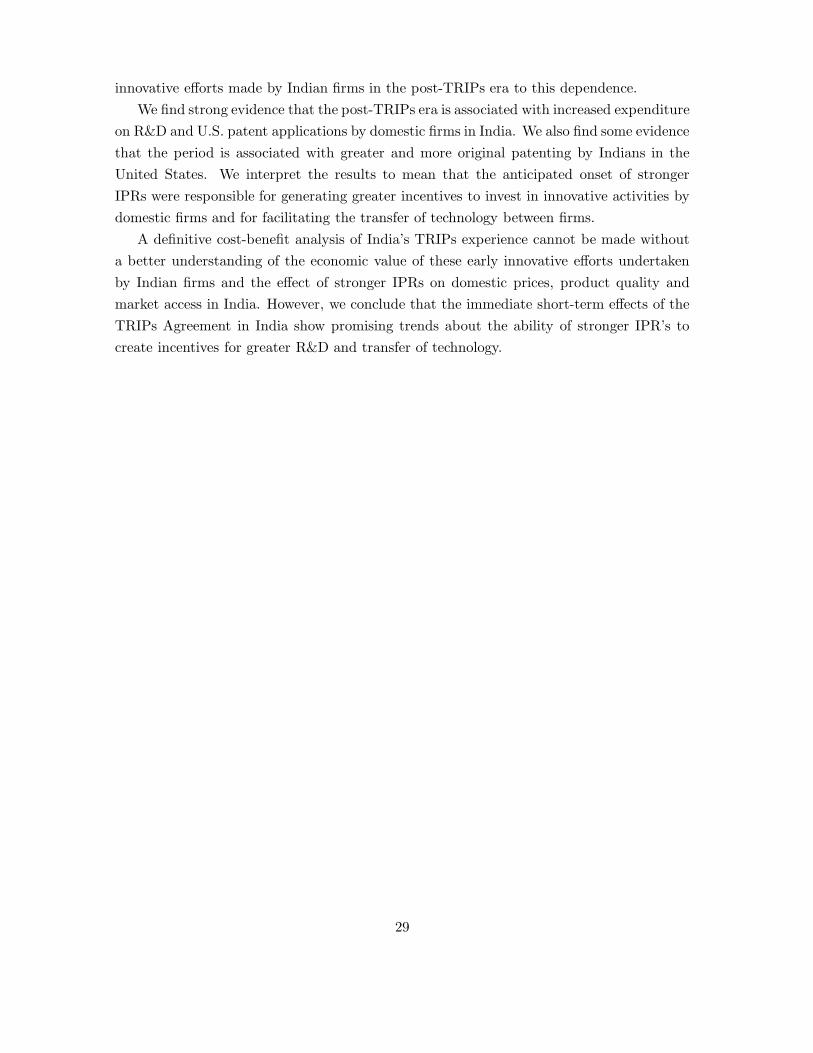
innovative efforts made by Indian firms in the post-TRIPs era to this dependence.
We find strong evidence that the post-TRIPs era is associated with increased expenditure
on R&D and U.S. patent applications by domestic firms in India. We also find some evidence
that the period is associated with greater and more original patenting by Indians in the
United States. We interpret the results to mean that the anticipated onset of stronger
IPRs were responsible for generating greater incentives to invest in innovative activities by
domestic firms and for facilitating the transfer of technology between firms.
A definitive cost-benefit analysis of India’s TRIPs experience cannot be made without
a better understanding of the economic value of these early innovative efforts undertaken
by Indian firms and the effect of stronger IPRs on domestic prices, product quality and
market access in India. However, we conclude that the immediate short-term effects of the
TRIPs Agreement in India show promising trends about the ability of stronger IPR’s to
create incentives for greater R&D and transfer of technology.
29

References
[1] ABRAMSON, B., 2007. India’s journey towards an effective patent system. Policy
Research Working Paper 4301, The World Bank.
[2] AGHION, P. and R. BURGESS and S. REDDING and F. ZILIBOTTI, forthcoming.
The Unequal Effects of Liberalization: Evidence from Dismantling the License Raj in
India. American Economic Review, 2007, forthcoming.
[3] BERTRAND, M. and E. DUFLO and S. MULLAINATHAN, 2004. How much should
we trust differences-in-differences estimates? The Quarterly Journal of Economics,
Volume 119, Issue 1, pp 249-275.
[4] BUSTOS, P., 2005. The Impact of Trade on Technology and Skill Upgrading: Evidence
from Argentina, Working Paper, CREI
[5] BRANSTETTER, L.G., et al, 2005. Do Stronger Intellectual Property Rights Increase
Technology Transfer? Empirical Evidence from U.S. Firm-Level Panel Data, Forth-
coming in Quarterly Journal of Economics
[6] CHARI, A.V., 2008. The Aggregate Productivity Effects of Entry and Output Restric-
tions: An Analysis of License Reform in India. Working Paper, Cornell University.
[7] CHEN, Y. and T. PUTTITANUM, 2005. Intellectual Property Rights and Innovation
in Developing Countries. Forthcoming in Journal of Development Economics.
[8] CHAUDHURI, S. and P.K. GOLDBERG and P. JIA, 2006. Estimating the Effects of
Global Patent Protection in Pharmaceuticals: A Case Study of Quinolones in India,
American Economic Review, December 2006, pp 1477-1513.
[9] COCKBURN, I. and Z. Griliches, 1987. Industry Effects and Appropriability Mea-
sures in the Stock Market’s Valuation of R&D and Patents. Working Paper No. 2465,
National Bureau of Economic Research.
[10] COHEN, W.M., et al, 1996, Appropriability Conditions and Why Firms Patent and
Why They Do Not in the American Manufacturing Sector. Working Paper, Carnegie
Mellon University.
[11] DUTTA, A., 2008. Free Entry in the Markets for Drugs in India: Implications for
Social Welfare. Working Paper, Georgetown University.
[12] EVENSON, R. and S.KUMAR, 2001. Does Intellectual Property Protection Spur Tech-
nological Change? Yale Economics Growth Center Discussion Paper No. 831.
30

[13] EVENSON, R. and D.K.N. Johnson, 1997. Introduction: Invention Input-Output Anal-
ysis. Economic Systems Research, 9(2), pp 149-160.
’Introduction: Invention Input-Output Analysis’. Robert E. Evenson and Daniel K.N.
Johnson. Economic Systems Research 9(2), June 1997, p.149-160.
[14] HALL, B.H. and Z. GRILICHES and J.A. HAUSMAN, 1986. Patents and R and D:
Is there a lag? International Economic Review, Vol 27, No. 2.
[15] HALL, B.H. and A.B. JAFFE and M. TRAJTENBERG, 2001. The NBER Patent
Citation Data File: Lessons, Insight and Methodology. NBER Working Paper 8498.
[16] JAFFE, A.B. , 2000. The US Patent System in Transition: Policy Innovation and the
Innovation Process, Research Policy, Vol. 29, pp 531-557.
[17] KORTUM, S., 1993. Equilibrium R&D and the Patent-R&D Ratio: U.S. Evidence.
The Americal Economic Review, Vol. 83, No. 2, Papers and Proceedings of the Hundred
and Fifth Annual Meetings of the American Economic Association.
[18] KORTUM, S. and LERNER, J., 1998. Stronger Protection or Technological Revolution:
What is Behind the Recent Surge in Patenting? Carnegie-Rochester Conference Series
on Public Policy, Vol. 48, pp. 247-304.
[19] LANJOUW, J., 1997. ”The Introduction of Pharmaceutical Products Patents in India:
Heartless Exploitation of the Poor and Suffering?”. NBER Working Paper 6366.
[20] LEE, J. Y. and E. MANSFIELD, 1996. Intellectual Property Protection and U.S.
Foreign Direct Investment. The Review of Economics and Statistics, 78, pp 181-186.
[21] LEVIN, R.C. and A.K. KLEVORICK and R.R. NELSON and S.G. WINTER and
R. GILBERT and Z. GRILICHES, 1987. Appropriating the Returns from Industrial
Research and Development. Brookings Papers on Economic Activity, Vol 1987, No. 3,
Special Issue on Microeconomics, pp. 783-831.
[22] McCALMAN, P., 2001. Reaping What You Sow: An Empirical Analysis of Interna-
tional Patent Harmonization. Journal of International Economics, 55, pp 161-186.
[23] MANSFIELD, E., 1986. Patents and Innovation: An Empirical Study. Management
Science 32, no. 2: pp 173-81.
[24] MASKUS, K., 2006. Intellectual Property Rights in the Global Economy. Institute for
International Economics. Washington, D.C.
[25] MASKUS, K. and M. PENUNBARTI, 1995. How Trade-related are Intellectual Prop-
erty Rights? Journal of International Economics, 39, pp 227-248.
31

[26] RAJAN, R. and L. ZINGALES, 1998. Financial Dependence and Growth. American
Economic Review, 88, pp 559-586.
[27] SAKAKIBARA, M. and BRANSTETTER, L., 2001. ”Do Stronger Patents Induce
More Innovation? Evidence from the 1988 Japanese Patent Law Reforms”, RAND
Journal of Economics, Vol. 32, No.1, pp 77-100
[28] SCHANKERMAN, M., 1998. How Valuable is Patent Protection? Estimates by Tech-
nology Field. RAND Journal of Economics, Vol. 29, pp 77-107.
[29] TOPALOVA, P., 2007. Trade Liberalization and Firm Productivity: The Case of India.
IMF Working Paper, WP/04/28.
[30] TYBOUT, J. R., 2000. Manufacturing Firms in Developing Countries: How Well do
They do and Why?. Journal of Economic Literature March, 2000.
[31] YEAPLE, S.R., 2005. A Simple Model of Firm Heterogeneity, International Trade and
Wages. Journal of International Economics, 65, pp 1-20.
32
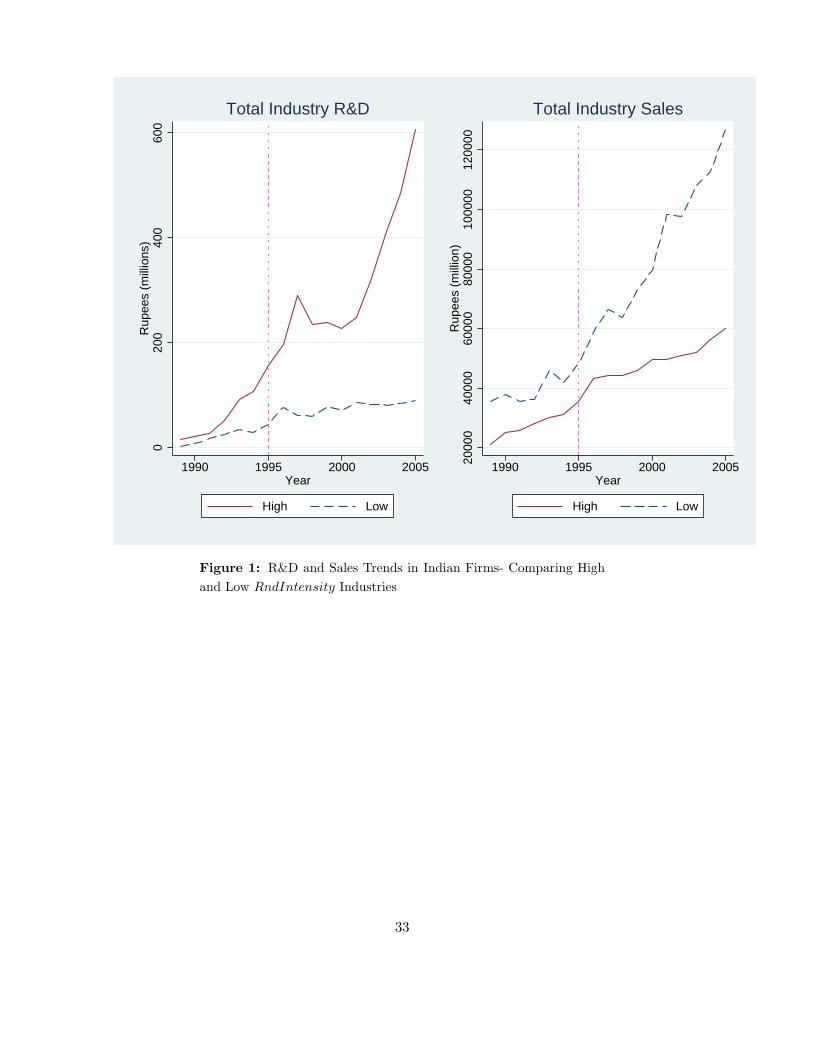
020
040
060
0R
upee
s (m
illio
ns)
1990 1995 2000 2005Year
High Low
Total Industry R&D
2000
040
000
6000
080
000
1000
0012
0000
Rup
ees
(mill
ion)
1990 1995 2000 2005Year
High Low
Total Industry Sales
Figure 1: R&D and Sales Trends in Indian Firms- Comparing High
and Low RndIntensity Industries
33

0.2
.4.6
.8P
erce
ntag
e
1990 1995 2000 2005Year
High Low
Industry R&D to Sales Ratio
Figure 2: Trends in the R&D to Sales Ratio in Indian Firms- Com-
paring High and Low RndIntensity Industries
34

1015
2025
3035
Num
ber
1990 1995 2000 2005Year
High Low
Total Number of Firms
02
Num
ber
1990 1995 2000 2005Year
High Low
Number of Foreign Firms
Figure 3: Firm Entry in High and Low RndIntensity Industries
35
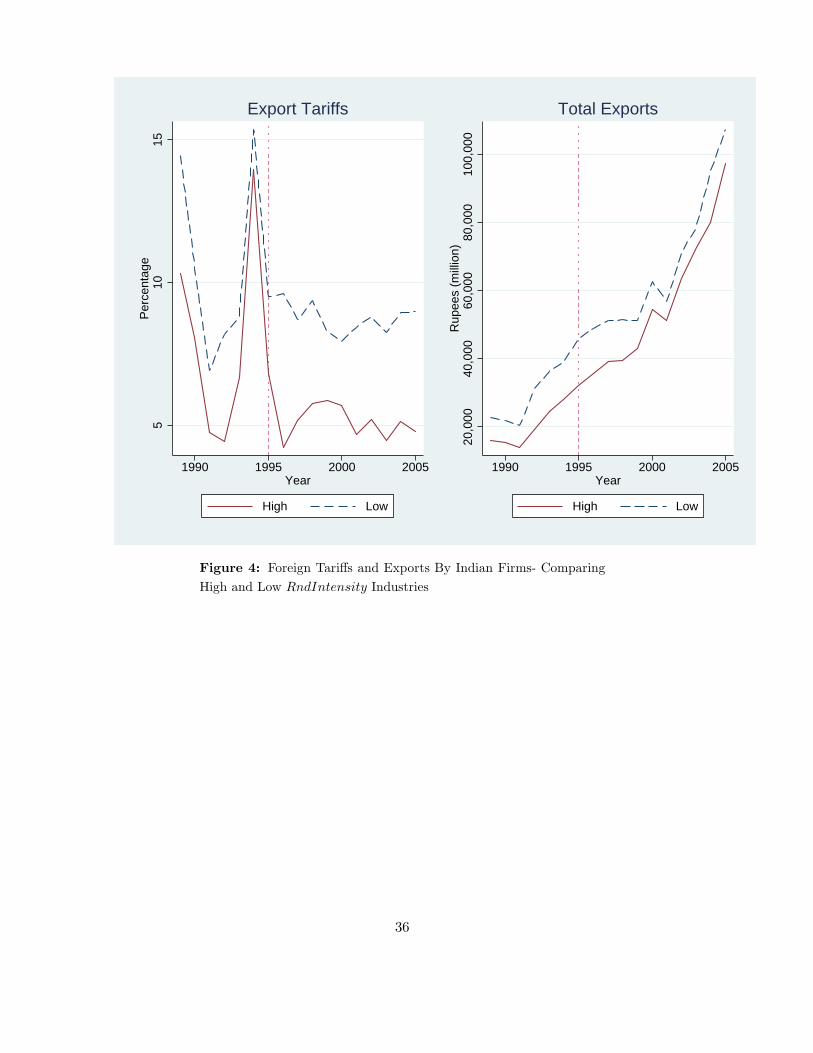
510
15P
erce
ntag
e
1990 1995 2000 2005Year
High Low
Export Tariffs
20,0
0040
,000
60,0
0080
,000
100,
000
Rup
ees
(mill
ion)
1990 1995 2000 2005Year
High Low
Total Exports
Figure 4: Foreign Tariffs and Exports By Indian Firms- Comparing
High and Low RndIntensity Industries
36
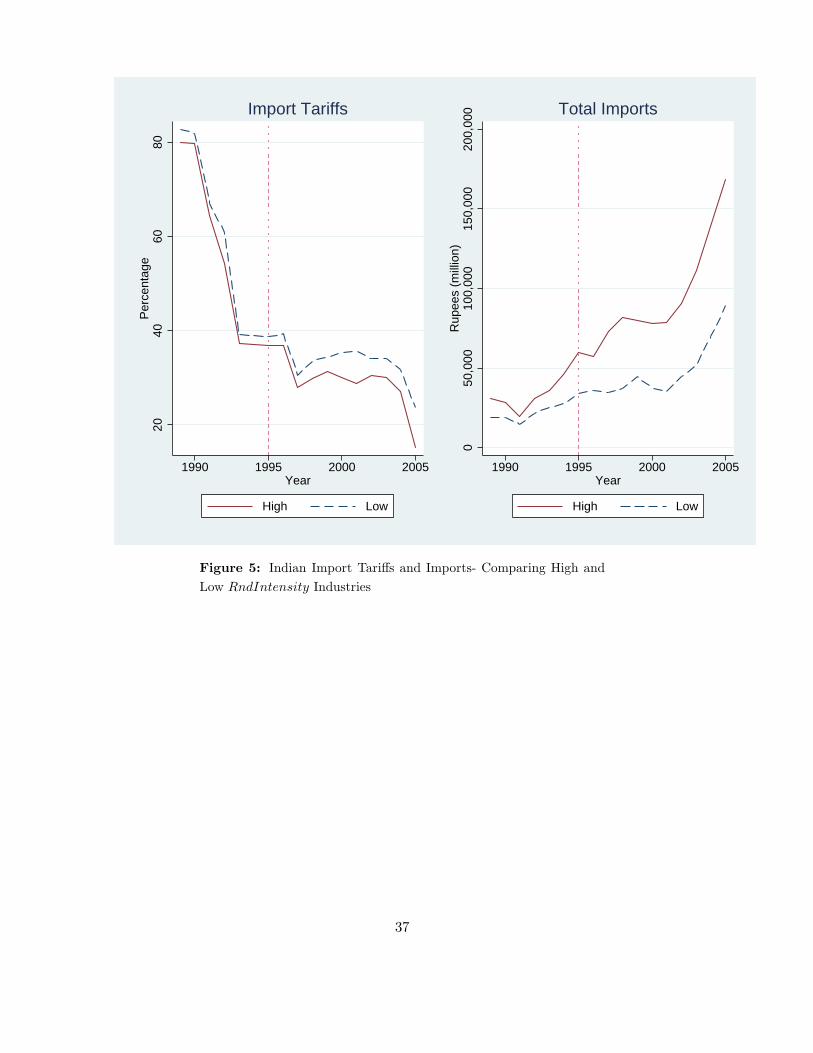
2040
6080
Per
cent
age
1990 1995 2000 2005Year
High Low
Import Tariffs
050
,000
100,
000
150,
000
200,
000
Rup
ees
(mill
ion)
1990 1995 2000 2005Year
High Low
Total Imports
Figure 5: Indian Import Tariffs and Imports- Comparing High and
Low RndIntensity Industries
37

05
1015
2025
# of
Pat
ents
1990 1995 2000Year
High Low
Patents by India
510
1520
# of
Pat
ents
(in 1
000)
1990 1995 2000Year
High Low
Patents by US
12
34
# of
Pat
ents
(in
100
0)
1990 1995 2000Year
High Low
Patents by France, Germany & UK
Figure 6: Patenting in the United States by India, the U.S. and
Western Europe- Comparing High and Low RndIntensity Industries
38
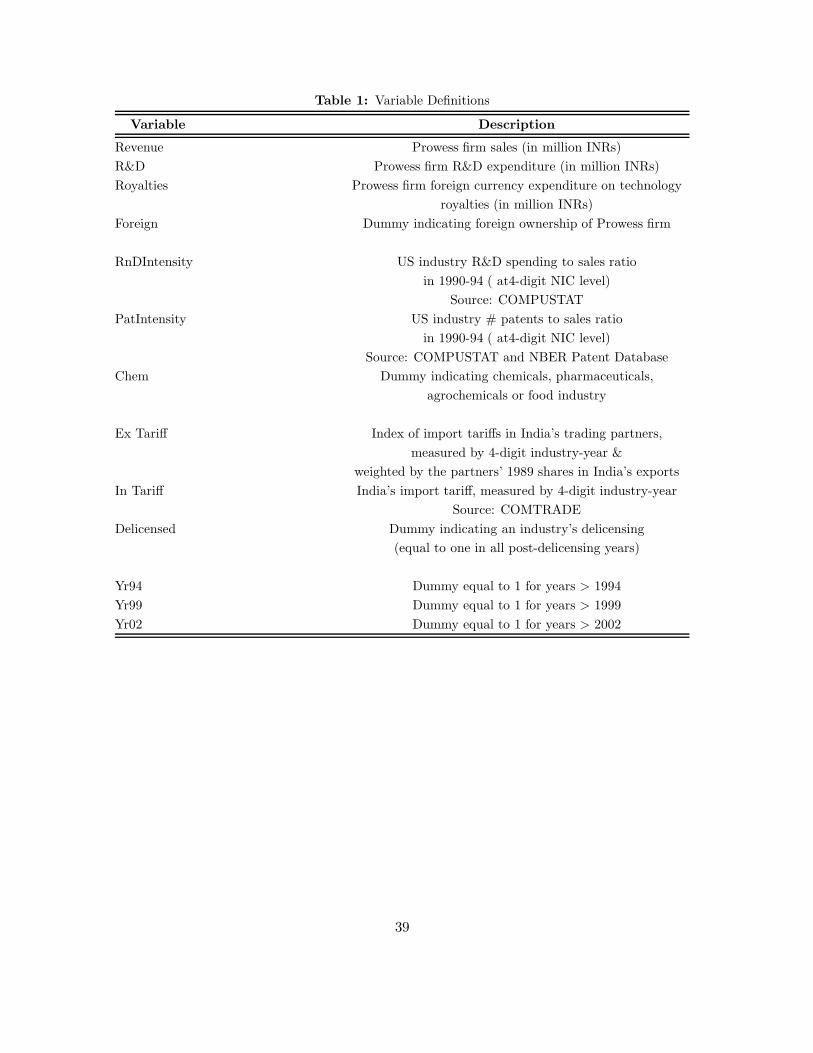
Table 1: Variable Definitions
Variable Description
Revenue Prowess firm sales (in million INRs)
R&D Prowess firm R&D expenditure (in million INRs)
Royalties Prowess firm foreign currency expenditure on technology
royalties (in million INRs)
Foreign Dummy indicating foreign ownership of Prowess firm
RnDIntensity US industry R&D spending to sales ratio
in 1990-94 ( at4-digit NIC level)
Source: COMPUSTAT
PatIntensity US industry # patents to sales ratio
in 1990-94 ( at4-digit NIC level)
Source: COMPUSTAT and NBER Patent Database
Chem Dummy indicating chemicals, pharmaceuticals,
agrochemicals or food industry
Ex Tariff Index of import tariffs in India’s trading partners,
measured by 4-digit industry-year &
weighted by the partners’ 1989 shares in India’s exports
In Tariff India’s import tariff, measured by 4-digit industry-year
Source: COMTRADE
Delicensed Dummy indicating an industry’s delicensing
(equal to one in all post-delicensing years)
Yr94 Dummy equal to 1 for years > 1994
Yr99 Dummy equal to 1 for years > 1999
Yr02 Dummy equal to 1 for years > 2002
39

Table 2: Summary Statistics
Prowess companies, 1989-1994
Number of companies 3016
Mean sales 1460.7
[9264.0]
Mean Export Earning 4.9
[31.2]
Mean R&D Spending 1.5
[15.3]
Mean Foreign Royalty Spending 3.1
[20.4]
% companies doing R&D 21.3
Prowess companies, 1995-2005
Number of companies 5252
Mean sales 1803.9
[16191.4]
Mean Export Earning 16.4
[104.8]
Mean R&D Spending 5.1
[44.2]
Mean Foreign Royalty Spending 3.8
[58.7]
% companies doing R&D 29.5
Median RnDIntensity 0.011
Mean RnDIntensity .018
[0.019]
Median PatIntensity 0.018
Mean PatIntensity 0.028
[0.035]
Notes: Standard deviations in brackets. Sales, export earnings, R&D and royalty spending of Prowess firms
are in million Indian Rupees, deflated to 2000 prices. In 2000, 1 USD was equal to approximately 45 rupees.
The statistics on the US industry-level measures from Compustat data- RnDIntensity and PatIntensity-
were calculated for 279 4-digit NIC industry groups. R&D spending and sales of US firms are in million
USD.
40

Table 3: Industries in Descending Order of Industry R&D to Sales
Ratio in the U.S. (RnDIntensity)
NIC Code Industry RnDIntensity
32 Radio, television & communication equipment 0.076
30 Office, accounting & computing machinery 0.067
33 Medical, precision & optical instruments 0.043
24 Chemicals & chemical products (incl. drugs) 0.039
23 Coke, refined petroleum products & nuclear fuel 0.037
31 Electrical Machinery 0.028
25 Rubber & plastic products 0.027
29 Machinery & equipment 0.023
35 Transport equipment (incl. ships, aircraft & spacecraft) 0.022
34 Motor vehicles 0.019
36 Misc. manufacturing 0.016
21 Paper & paper products 0.014
19 Leather, luggage & footwear 0.013
17 Textiles 0.012
27 Basic metals 0.010
18 Apparel 0.009
28 Fabricated metal products 0.008
22 Publishing, printing & reproduction of recorded media 0.007
11 Extraction of crude petroleum & natural gas 0.007
20 Wood & products of wood & cork 0.006
26 Other non-metallic mineral products 0.005
15 Food products & beverages 0.005
14 Other mining 0.004
16 Tobacco 0.003
10 Mining of coal & lignite 0.001
13 Mining of metal ores 0.0002
RnDIntensity was calculated at the 4-digit NIC level, & this tables presents its means at the 2-digit NIC
level.
41

Table 4: Industries in Descending Order of Industry Patents to Sales
Ratio in the U.S. (PatIntensity)
NIC Code Industry PatIntensity
32 Radio, television & communication equipment 0.0980
24 Chemicals & chemical products (incl. drugs) 0.0856
30 Office, accounting & computing machinery 0.0808
33 Medical, precision & optical instruments 0.0704
29 Machinery & equipment 0.0406
31 Electrical Machinery 0.0368
36 Misc. manufacturing 0.0350
35 Transport equipment (incl. ships, aircraft & spacecraft) 0.0336
25 Rubber & plastic products 0.0314
11 Extraction of crude petroleum & natural gas 0.0309
19 Leather, luggage & footwear 0.0233
28 Fabricated metal products 0.0216
34 Motor vehicles 0.0203
23 Coke, refined petroleum products & nuclear fuel 0.0167
17 Textiles 0.0126
26 Other non-metallic mineral products 0.0126
27 Basic metals 0.0117
21 Paper & paper products 0.0112
18 Apparel 0.0107
20 Wood & products of wood & cork 0.0101
14 Other mining 0.0077
22 Publishing, printing & reproduction of recorded media 0.0029
15 Food products & beverages 0.0025
16 Tobacco 0.0022
13 Mining of metal ores 0.001
10 Mining of coal & lignite 0.0007
PatIntensity was calculated at the 4-digit NIC level, & this tables presents its means at the 2-digit NIC
level.
42
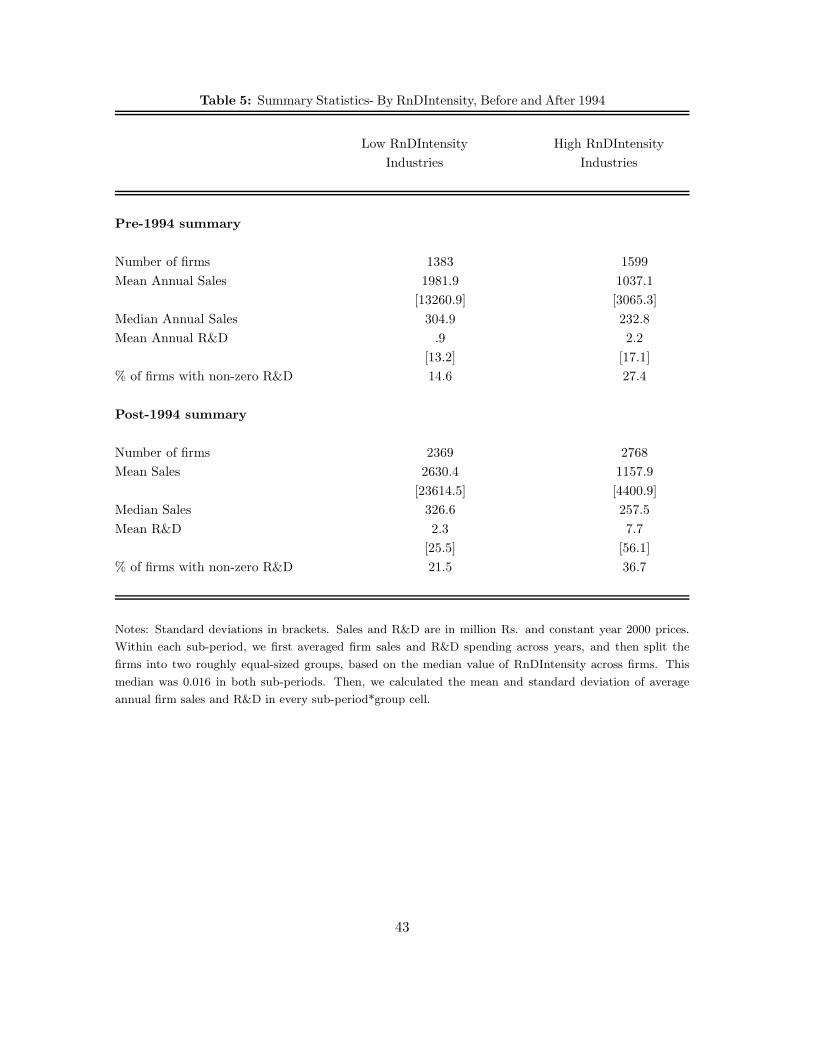
Table 5: Summary Statistics- By RnDIntensity, Before and After 1994
Low RnDIntensity High RnDIntensity
Industries Industries
Pre-1994 summary
Number of firms 1383 1599
Mean Annual Sales 1981.9 1037.1
[13260.9] [3065.3]
Median Annual Sales 304.9 232.8
Mean Annual R&D .9 2.2
[13.2] [17.1]
% of firms with non-zero R&D 14.6 27.4
Post-1994 summary
Number of firms 2369 2768
Mean Sales 2630.4 1157.9
[23614.5] [4400.9]
Median Sales 326.6 257.5
Mean R&D 2.3 7.7
[25.5] [56.1]
% of firms with non-zero R&D 21.5 36.7
Notes: Standard deviations in brackets. Sales and R&D are in million Rs. and constant year 2000 prices.
Within each sub-period, we first averaged firm sales and R&D spending across years, and then split the
firms into two roughly equal-sized groups, based on the median value of RnDIntensity across firms. This
median was 0.016 in both sub-periods. Then, we calculated the mean and standard deviation of average
annual firm sales and R&D in every sub-period*group cell.
43
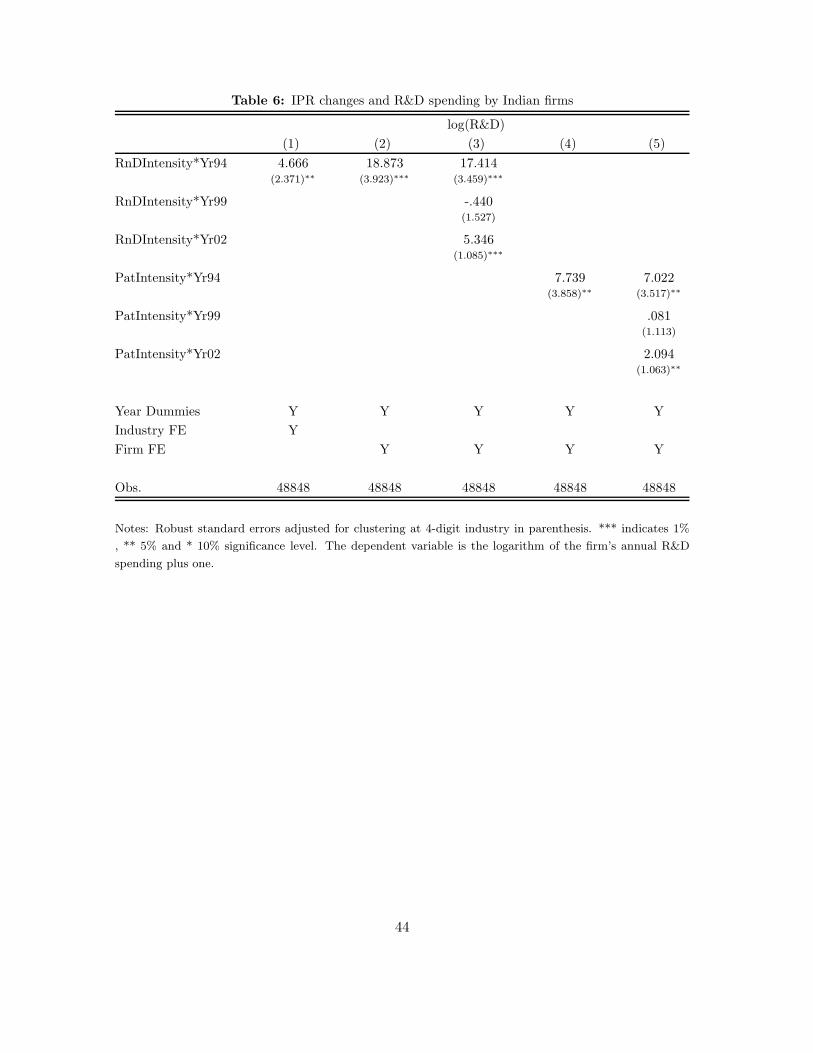
Table 6: IPR changes and R&D spending by Indian firms
log(R&D)
(1) (2) (3) (4) (5)
RnDIntensity*Yr94 4.666 18.873 17.414(2.371)∗∗ (3.923)∗∗∗ (3.459)∗∗∗
RnDIntensity*Yr99 -.440(1.527)
RnDIntensity*Yr02 5.346(1.085)∗∗∗
PatIntensity*Yr94 7.739 7.022(3.858)∗∗ (3.517)∗∗
PatIntensity*Yr99 .081(1.113)
PatIntensity*Yr02 2.094(1.063)∗∗
Year Dummies Y Y Y Y Y
Industry FE Y
Firm FE Y Y Y Y
Obs. 48848 48848 48848 48848 48848
Notes: Robust standard errors adjusted for clustering at 4-digit industry in parenthesis. *** indicates 1%
, ** 5% and * 10% significance level. The dependent variable is the logarithm of the firm’s annual R&D
spending plus one.
44

Table 7: Robustness Checks- Annual Data Collapsed to Two/Four
Periods; 1975-80 Measures of RnDIntensity & PatIntensity
log(R&D)
(1) (2) (3) (4) (5) (6)
RnDIntensity*P2 13.078 7.350(2.737)∗∗∗ (2.263)∗∗∗
RnDIntensity*P3 -2.163(1.685)
RnDIntensity*P4 6.377(1.859)∗∗∗
PatIntensity*P2 5.694 2.375(1.741)∗∗∗ (1.426)∗
PatIntensity*P3 -.632(1.098)
PatIntensity*P4 2.210(1.205)∗
Firm FE Y Y Y Y
Period Dummies Y Y Y Y
Collapsed Data Y Y Y Y
Obs. 7732 15282 7732 15282
RnDIntensity*Yr94 36.467(12.626)∗∗∗
PatIntensity*Yr94 6.078(1.919)∗∗∗
Firm FE Y Y
Year Dummies Y Y
Collapsed Data No No
1975-80 Measures Y Y
Obs. 46952 46952
Robust standard errors in parenthesis. *** indicates 1% , ** 5% and * 10% significance level. In columns (1)
and (3), the annual firm level data have been collapsed to two periods per firm - 1989-1994 and 1995-2005. In
columns (2) and (4), the data have been collapsed to four periods per firm - 1989-1994, 1995-1999, 2000-2001
and 2002-2005. P2 is a dummy equal to 1 in 1994-2005, P3 is a dummy equal to 1 in 1999-2005, and P4 is
a dummy equal to 1 in 2001-2005. In columns (5) and (6), RnDIntensity and PatIntensity are calculated
using US Compustat and NBER Patent Data from 1975-80, and standard errors are adjusted for clustering
at 4-digit NIC industry level.
45

Table 8: Robustness checks- tariffs, delicensing, foreign ownership
and industry-specific time trends
log(R&D)
(1) (2) (3) (4) (5) (6)
RnDIntensy*Yr94 17.152 15.859 16.110 16.150 10.469 8.793(3.529)∗∗∗ (3.532)∗∗∗ (3.354)∗∗∗ (3.283)∗∗∗ (3.105)∗∗∗ (2.873)∗∗∗
RnDIntensy*Yr99 -.441 -.450 -.051 .008 -.461 -1.282(1.526) (1.541) (1.417) (1.430) (1.680) (2.216)
RnDIntensy*Yr02 5.348 5.345 5.464 5.457 4.071 3.395(1.085)∗∗∗ (1.083)∗∗∗ (1.090)∗∗∗ (1.093)∗∗∗ (1.382)∗∗∗ (1.704)∗∗
Chem*Yr94 .056 .079 .086 .084 .086 .077(.290) (.280) (.273) (.273) (.288) (.215)
Foreign*Yr94 1.263 1.255 1.256 1.239 1.039(.364)∗∗∗ (.367)∗∗∗ (.367)∗∗∗ (.364)∗∗∗ (.358)∗∗∗
InTariff .005 .005 .011 .010(.004) (.003) (.004)∗∗∗ (.003)∗∗∗
RnDIntensity* -.287 -.380
InTariff (.119)∗∗ (.120)∗∗∗
ExTariff -.004 -.004 -.004 -.0003(.006) (.006) (.007) (.006)
RnDIntensity* -.048 .014
ExTariff (.410) (.374)
Delicensed .044 -.103 -.140(.277) (.295) (.284)
RnDIntensity* 17.930 15.358
Delicensed (9.969)∗ (9.819)
Year Dummies Y Y Y Y Y Y
Firm FE Y Y Y Y Y Y
Industry Trends Y
Obs. 48848 48848 48848 48848 48848 48848
Notes: Robust standard errors adjusted for clustering at 4-digit industry in parenthesis. *** indicates 1%
, ** 5% and * 10% significance level. The dependent variable is the logarithm of the firm’s annual R&D
spending plus one. Control variables in columns (6) include separate linear time trends for all 2-digit NIC
industries.
46
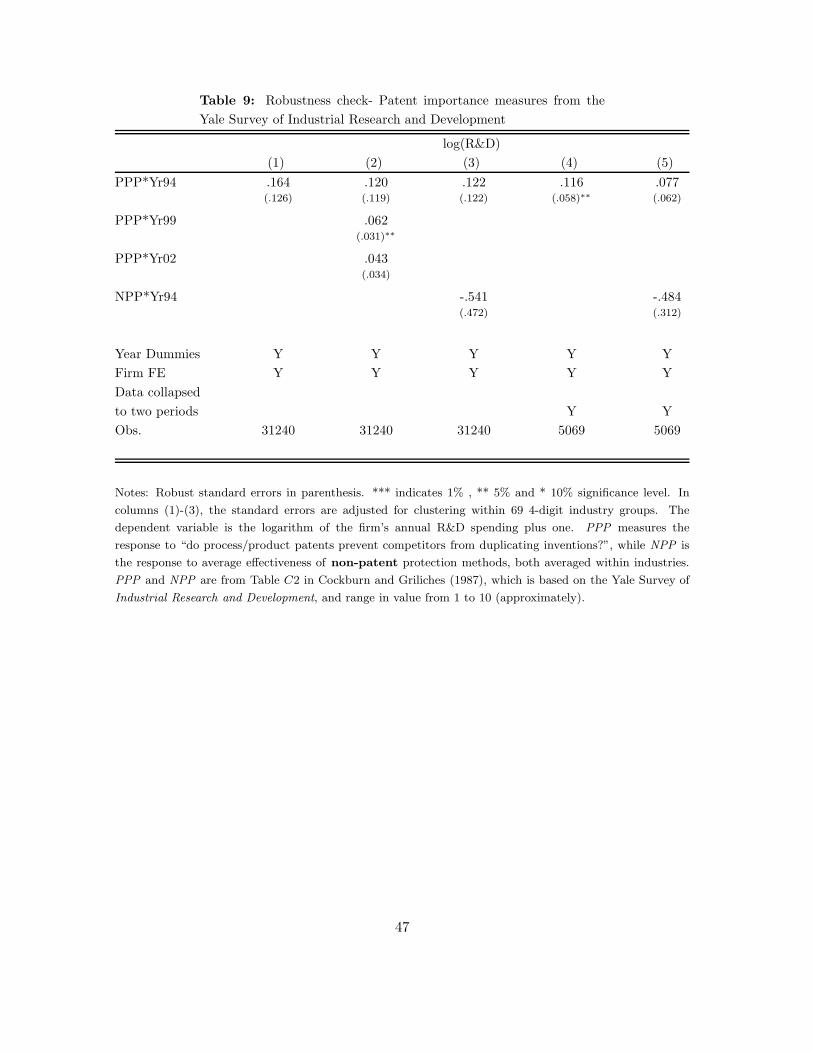
Table 9: Robustness check- Patent importance measures from the
Yale Survey of Industrial Research and Development
log(R&D)
(1) (2) (3) (4) (5)
PPP*Yr94 .164 .120 .122 .116 .077(.126) (.119) (.122) (.058)∗∗ (.062)
PPP*Yr99 .062(.031)∗∗
PPP*Yr02 .043(.034)
NPP*Yr94 -.541 -.484(.472) (.312)
Year Dummies Y Y Y Y Y
Firm FE Y Y Y Y Y
Data collapsed
to two periods Y Y
Obs. 31240 31240 31240 5069 5069
Notes: Robust standard errors in parenthesis. *** indicates 1% , ** 5% and * 10% significance level. In
columns (1)-(3), the standard errors are adjusted for clustering within 69 4-digit industry groups. The
dependent variable is the logarithm of the firm’s annual R&D spending plus one. PPP measures the
response to “do process/product patents prevent competitors from duplicating inventions?”, while NPP is
the response to average effectiveness of non-patent protection methods, both averaged within industries.
PPP and NPP are from Table C2 in Cockburn and Griliches (1987), which is based on the Yale Survey of
Industrial Research and Development, and range in value from 1 to 10 (approximately).
47

Table 10: The Effect of Domestic Market Size
log(R&D)
(1) (2) (3)
RnDIntensity*Yr94 4.649 5.302 -9.096(6.183) (6.109) (7.453)
RnDIntensity*Yr99 -3.167 -6.238(3.436) (4.668)
RnDIntensity*Yr94 2.829 2.760(3.232) (4.290)
RnDIntensity*DMarket*Yr94 .0001 .0001 .0002(.00004)∗∗∗ (.00004)∗∗ (.00006)∗∗∗
RnDIntensity*DMarket*Yr99 .00003 .00004(.00003) (.00004)
RnDIntensity*DMarket*Yr02 .00002 -1.04e-06(.00002) (.00004)
Foreign*Yr94 1.042(.357)∗∗∗
InTariff .009(.003)∗∗∗
RnDIntensity*InTariff -.385(.122)∗∗∗
ExTariff .002(.006)
RnDIntensity*ExTariff -.211(.419)
Delicensed -.179(.278)
RnDIntensity*Delicensed 22.538(10.521)∗∗
Year Dummies Y Y Y
Firm FE Y Y Y
Industry-Time Trends Y
Obs. 48848 48848 48848
Notes: Robust standard errors adjusted for clustering at 4-digit industry in parenthesis. *** indicates 1%
, ** 5% and * 10% significance level. Control variables include Chem*Yr94 & the interaction of DMarket
with the year dummies. DMarket is the 4-digit NIC industry revenue + imports - exports in India in 1990.
Source: Annual Survey of Industries and Comtrade.
48
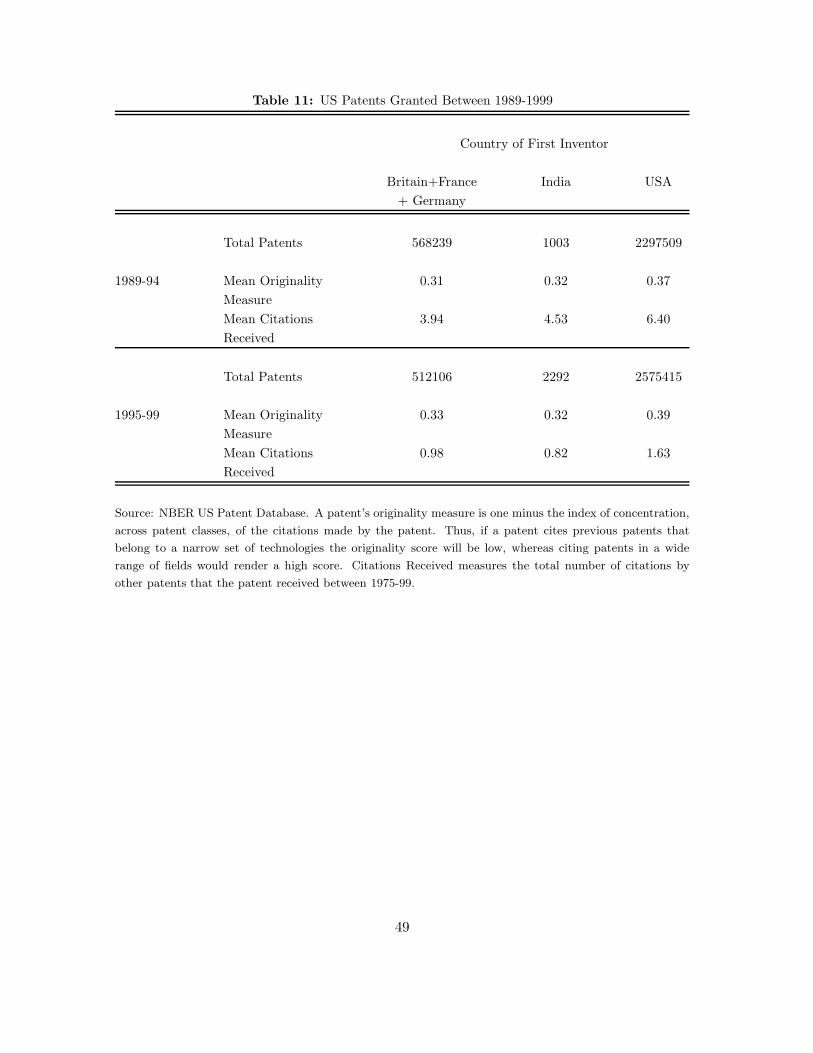
Table 11: US Patents Granted Between 1989-1999
Country of First Inventor
Britain+France India USA
+ Germany
Total Patents 568239 1003 2297509
1989-94 Mean Originality 0.31 0.32 0.37
Measure
Mean Citations 3.94 4.53 6.40
Received
Total Patents 512106 2292 2575415
1995-99 Mean Originality 0.33 0.32 0.39
Measure
Mean Citations 0.98 0.82 1.63
Received
Source: NBER US Patent Database. A patent’s originality measure is one minus the index of concentration,
across patent classes, of the citations made by the patent. Thus, if a patent cites previous patents that
belong to a narrow set of technologies the originality score will be low, whereas citing patents in a wide
range of fields would render a high score. Citations Received measures the total number of citations by
other patents that the patent received between 1975-99.
49

Table 12: Patenting in the U.S. by Indian Innovators
Total Mean Mean
# Patents Originality # Citations
(1) (2) (3) (4)
RnDIntensity*Yr94 1.470 1.990 -.054 .493(.569)∗∗∗ (.733)∗∗∗ (.087) (.583)
India*Yr94 .756 .653 .714 .950(.066)∗∗∗ (.062)∗∗∗ (.097)∗∗∗ (.111)∗∗∗
RnDIntensity*India*Yr94 2.239 1.718 4.936 1.934(1.052)∗∗ (.962)∗ (1.829)∗∗∗ (2.156)
Europe*Yr94 -.205 -.030 .022(.021)∗∗∗ (.021) (.044)
RnDIntensity*Europe*Yr94 -1.040 -.144 .027(.415)∗∗ (.335) (.667)
Year Dummies Y Y Y Y
Country*Industry FE Y Y Y Y
Obs. 1881 1881 1785 1769
Notes: Robust standard errors clustered by industry in parenthesis. *** indicates 1% , ** 5% and * 10%
significance level. In columns (1)-(2), the dependent variable is the logarithm of the total number of US
patents granted (plus one) in an industry*country group*year cell. In columns(3) and (4), respectively, the
dependent variable is the (log) mean “Originality Index” of patents in a industry*country group*year cell,
and the mean number of citations received by the patents in a cell. The number of observations is lower in
column (3) and (4) because these means are not defined when a industry*country group*year cell contains
zero patents.
Industry is the 2-digit NIC category of the patent, year refers to the patent grant year, and country
group refers to the first inventor’s country, which have been grouped into 3 categories - India, US and Europe
(Britain, France and Germany). Source of data on US patents, citations and originality index: NBER Data
on US patents granted between 1989-1999.
50

Table 13: IPR reforms and foreign royalty payments
log(Royalties)
(1) (2) (3)
RnDIntensity*Yr94 -1.495 -1.121 5.239(5.164) (4.473) (2.196)∗∗
RnDIntensity*Yr99 .980 3.572(2.088) (1.933)∗
RnDIntensity*Yr02 -2.484 -1.213(1.291)∗ (1.852)
Year Dummies Y Y Y
Firm FE Y Y Y
Additional Controls Y
Industry time trends Y
Obs. 48848 48848 48848
Notes: Robust standard errors adjusted for clustering by 4-digit industry groups in parenthesis. *** indicates
1% , ** 5% and * 10% significance level. The dependent variable is the logarithm of the firm’s annual foreign
currency spending on royalties and licenses. Additional control variables in column (3) are Foreign*Yr94,
ExTariff, InTariff, Delicensed and their interaction with RnDIntensity.
51