Intel® Profiler for OpenCL* API · PDF file2 | P a g e Intel® Profiler for OpenCL* API...
31
Intel® Profiler for OpenCL* API Version 2.1 Beta USER GUIDE EDITION 1.0 *other names and brands may be claimed as the property of others
Transcript of Intel® Profiler for OpenCL* API · PDF file2 | P a g e Intel® Profiler for OpenCL* API...

Intel® Profiler for OpenCL* API
Version 2.1 Beta
USER GUIDE EDITION 1.0
*other names and brands may be claimed as the property of others

1 | P a g e Intel® Profiler for OpenCL* API
Contents
Installation .......................................................................................................................... 2
Licensing ............................................................................................................................. 8
Tool Usage ........................................................................................................................ 12
Profiling OpenCL* Applications ....................................................................................... 14
Kernel Statistics ............................................................................................................... 18
GPU/CPU Utilization Tab .................................................................................................. 21
Overview Tab: .............................................................................................................. 22
Comparison Tab: ........................................................................................................... 23
Time Line Tab: .............................................................................................................. 24
Memory Performance Tab............................................................................................... 26
Overview Tab: .............................................................................................................. 26
API Data Tab: ................................................................................................................ 27
Hardware Counters (Experimental) ................................................................................ 28
Sessions ............................................................................................................................ 29
Help - About ..................................................................................................................... 30

2 | P a g e Intel® Profiler for OpenCL* API
Installation 1. Upon downloading the installation package, the package comes with a user guide,
readme and an installer (setup)
Double click on Setup to launch the installer
2. The installer checks if Java and MS VC++ redistributables are available on the
system. If these components are not available, installer installs these components
before the profiler is installed.

3 | P a g e Intel® Profiler for OpenCL* API
3. Java installation:
Download JRE
Hit “Install” to install Java. Profiler tool will not work without JRE. No need to change
the destination folder. Let Java get installed in the default folder.

4 | P a g e Intel® Profiler for OpenCL* API
Click “Close” after successful installation of Java.
4. Install VC++ redistributables.
VC++ redistributables are installed if not already installed.
5 | P a g e Intel® Profiler for OpenCL* API
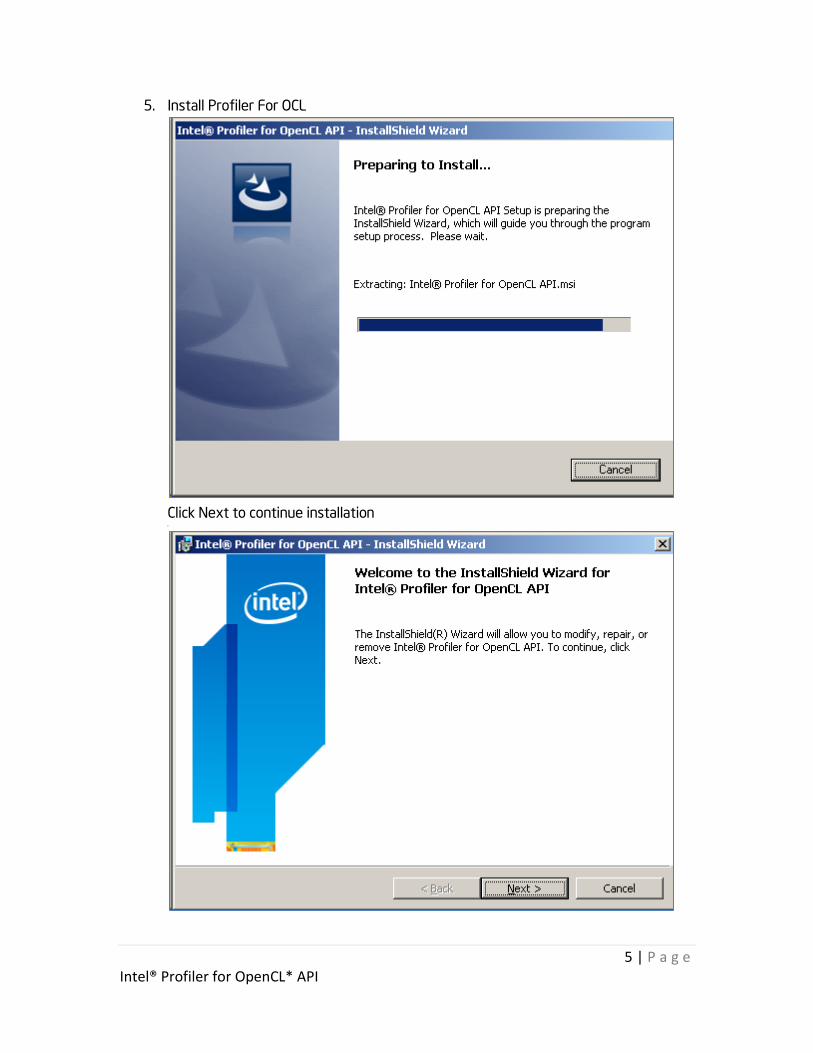
5. Install Profiler For OCL
Click Next to continue installation
nd

6 | P a g e Intel® Profiler for OpenCL* API
Please review the license agreement completely. If the license is acceptable, click the
“I accept the terms in the license agreement” radio button and click “Next”
Click “Install” to continue to installation

7 | P a g e Intel® Profiler for OpenCL* API
There may be couple of UAC popups. Hit “Okay” or “Yes” on them to allow for
installation to continue.
Hit “Finish” to complete installation.
Upon complete installation, a shortcut is placed in the start menu to launch the
Profiler tool.
A shortcut for the tool can also be found on the desktop.

8 | P a g e Intel® Profiler for OpenCL* API
Licensing
Upon launching the GUI, a splash screen comes up, displaying the version of the tool.
The use of the Intel Profiler for OpenCL* is licensed for a limited duration. The License
Checker is then launched to determine if a valid license exists for this tool. If a valid license
is found, the GUI automatically validates the license and starts up.
If a license is not found, the popup box below for License Configuration is launched.

9 | P a g e Intel® Profiler for OpenCL* API
The license is attached to a single specific host computer. To get this file, you need to send
an e-mail to <[email protected]> including your computer's COMPOSITEID
COMPOSITEID obtained by clicking on the Machine ID button
If there is an email client installed on the system, click on the “Email” button. The License
configuration window launches the client with the necessary information to be sent to

10 | P a g e Intel® Profiler for OpenCL* API
If the email client cannot be launched, a message with the information needed to be sent to
Intel pops up. Please copy-paste this information and email to [email protected].
Within a couple of hours, a license file will be issued to authenticate the installation.
Place the license file on the system that you want to run the tool and obtained the license
for, hit the “Browse” button and choose the license file.

11 | P a g e Intel® Profiler for OpenCL* API
As soon as authentication is successful, a pop up confirming registration is displayed.
NOTE: Please DONOT delete the license file or move it to a different location. Every time tool
is launched, a check for license is done, if the license file is deleted; send in another request
for license. If the license file is moved, go back to the license checker and point to the new
location of the license file. The license checker can be launched from the top menu –
Settings -> License Configuration

12 | P a g e Intel® Profiler for OpenCL* API
Tool Usage
Upon launch of the tool, the tool displays the “Device Information” of all OpenCL* compliant
devices in the platform. The device information tab displays:
1. Device capabilities
2. Extensions supported
3. OpenCL* version supported
4. Driver version
5. Local/Global Memory
6. Compute units available
7. Work group size supported by each device
There is one tab per OpenCL* compliant device on the platform.

13 | P a g e Intel® Profiler for OpenCL* API
Intel CPU OpenCL* device properties:
Intel GPU OpenCL* device properties:

14 | P a g e Intel® Profiler for OpenCL* API
Profiling OpenCL* Applications
From “Action” pull down menu, select “New”.
This action creates a new session for profiling.
Click “Browse” button.
A popup window prompting to choose the OpenCL* application comes up.
Select the directory where the OpenCL* application (.exe) to be profiled exists. Click “Open”.

15 | P a g e Intel® Profiler for OpenCL* API
The selected application will appear in the OpenCL* App bar.
If the application has any parameters to run, enter those in the “Workload Arguments” text
box.
To dump detailed API level information, a parameter called “-dumpstream” can be entered in
the “Parameters” text box.
Click “Profile” button.
Note: Dumpstream dumps detailed API level information about all the OpenCL* kernels in the
application being profiled. These metrics include:
1. Dump of all OpenCL* API calls made in the application
2. Dump of Kernel code if the application is using clCreateProgramWithSource API call

16 | P a g e Intel® Profiler for OpenCL* API
Hit “Profile” button to start profiling.
The application being profiled is launched and the tool collects all the necessary profiling
data.
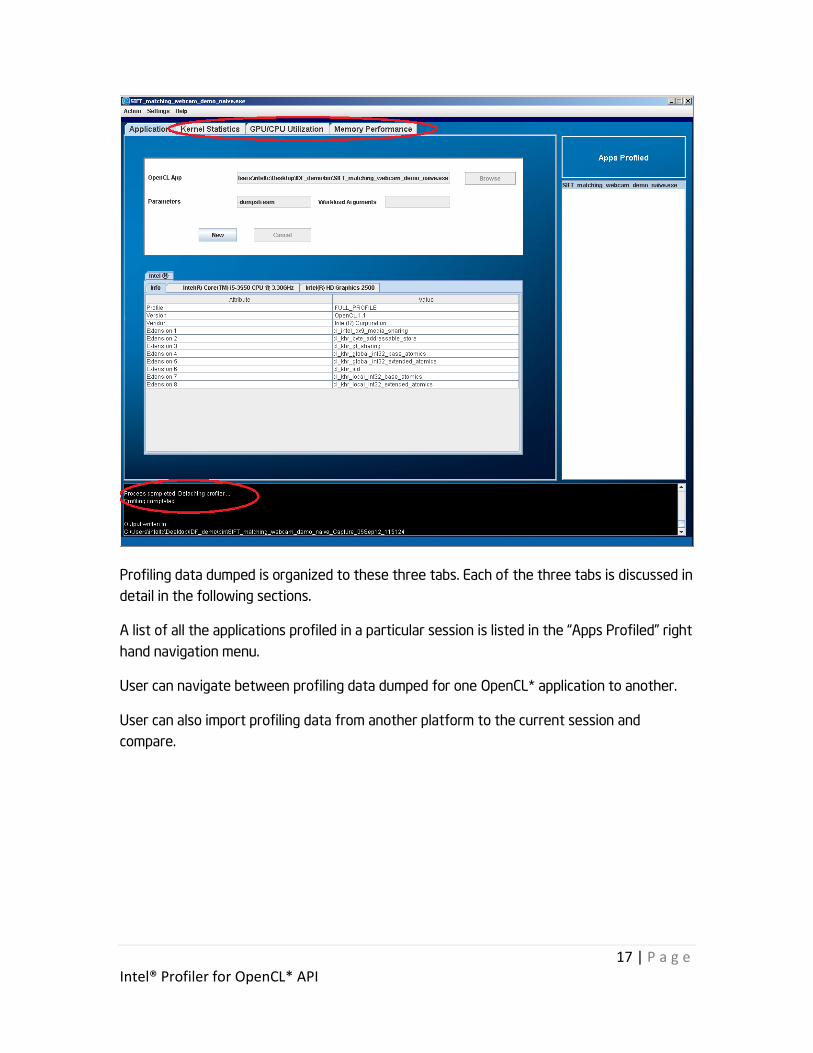
Ensure that the words "Profiling Completed" can be seen in the console at the bottom of the
screen once profiling is completed.
Notice that next to the Application Tab, there are now three additional tabs:
Kernel Statistics.
GPU/CPU Utilization.
Memory Performance.
17 | P a g e Intel® Profiler for OpenCL* API
Profiling data dumped is organized to these three tabs. Each of the three tabs is discussed in
detail in the following sections.
A list of all the applications profiled in a particular session is listed in the “Apps Profiled” right
hand navigation menu.
User can navigate between profiling data dumped for one OpenCL* application to another.
User can also import profiling data from another platform to the current session and
compare.

18 | P a g e Intel® Profiler for OpenCL* API
Kernel Statistics This tab displays information relevant to all the OpenCL* Kernels in the OpenCL* application
being profiled.
A summary on the complexity of the application being profiled is displayed in this tab:
1. Total number of OpenCL* API calls made in the application.
2. Total number of OpenCL* Kernels executed in the application.
3. Total number of clEnqueueNDRangeKernel calls made in the application.
A summary about all the OpenCL* Kernels executed in the OpenCL* application along with
details about the number of arguments for each of the kernels, work dimension, global/local
workgroup size and an average time taken for this kernel to execute on the hardware is
displayed.

19 | P a g e Intel® Profiler for OpenCL* API
A comprehensive list of all the OpenCL* APIs executed in the OpenCL* application being
profiled is displayed along all the parameters and return value is displayed in the API File tab.

20 | P a g e Intel® Profiler for OpenCL* API
The source code for all the OpenCL* Kernels executed in the OpenCL* application being
profiled is also displayed.
Note: The Kernel source code is displayed only if clCreateProgramWithSource is used in the
OpenCL* application.
Note: The source code is visual studio syntax highlighted.

21 | P a g e Intel® Profiler for OpenCL* API
GPU/CPU Utilization Tab
Click the GPU/CPU Tab. Notice the three feature tabs labeled
Overview
Comparison
Time Line

22 | P a g e Intel® Profiler for OpenCL* API
Overview Tab: The Overview Tab displays an overview of all the hardware execution times for all the
OpenCL* Kernels in the OpenCL* application being profiled. The checkboxes on the right can
be used to pick which OpenCL* Kernels are studied in detail.
Comparison bar graphs for every OpenCL* Kernel vs entire OpenCL* application can be
dumped.

23 | P a g e Intel® Profiler for OpenCL* API
A pie chart displaying the amount of time the OpenCL* application spent in execution of
OpenCL* Kernels, building the OpenCL* Kernels is also displayed.
All of the charts and graphs from the GUI can be saved as images so they can be pulled in to
reports and documents.
Comparison Tab: The Comparison tab enables the user to import profiling data from different runs or from
different platforms and compare the OpenCL* Kernel execution times.

24 | P a g e Intel® Profiler for OpenCL* API
Time Line Tab: The Timeline view tab enables the user to see the entire application on a timeline view.
With this view, users can comprehend what activities happened at what time in the
application. The radio buttons at the bottom lets the user pick which kernels they want to
study in detail.
The rectangular bars denote the instances of the Kernel. The circles denote the time at
which the Kernels were created ( clCreateKernel call )
Mouse over on the circles show more information about the creation of the kernels.

25 | P a g e Intel® Profiler for OpenCL* API
Mouse over on the rectangular bars gives more details about the instance of the kernel
including the instance number, time taken for the kernel to execute on hardware,
global/local work size, work dimension etc.
Right click on timeline graph, choose “Options” -> “Show Y Axis” to display the kernel names
next to the graph.

26 | P a g e Intel® Profiler for OpenCL* API
Memory Performance Tab
This tab displays all the memory events happening in the application. The data displayed in
this tab is useful to study bandwidth constrains and latencies.
Overview Tab: The overview tab displays the kind of memory access calls made and how many of them are
made.
Summary of all OpenCL* memory calls, the amount of memory transferred, the time to
transfer and the bandwidth is displayed.
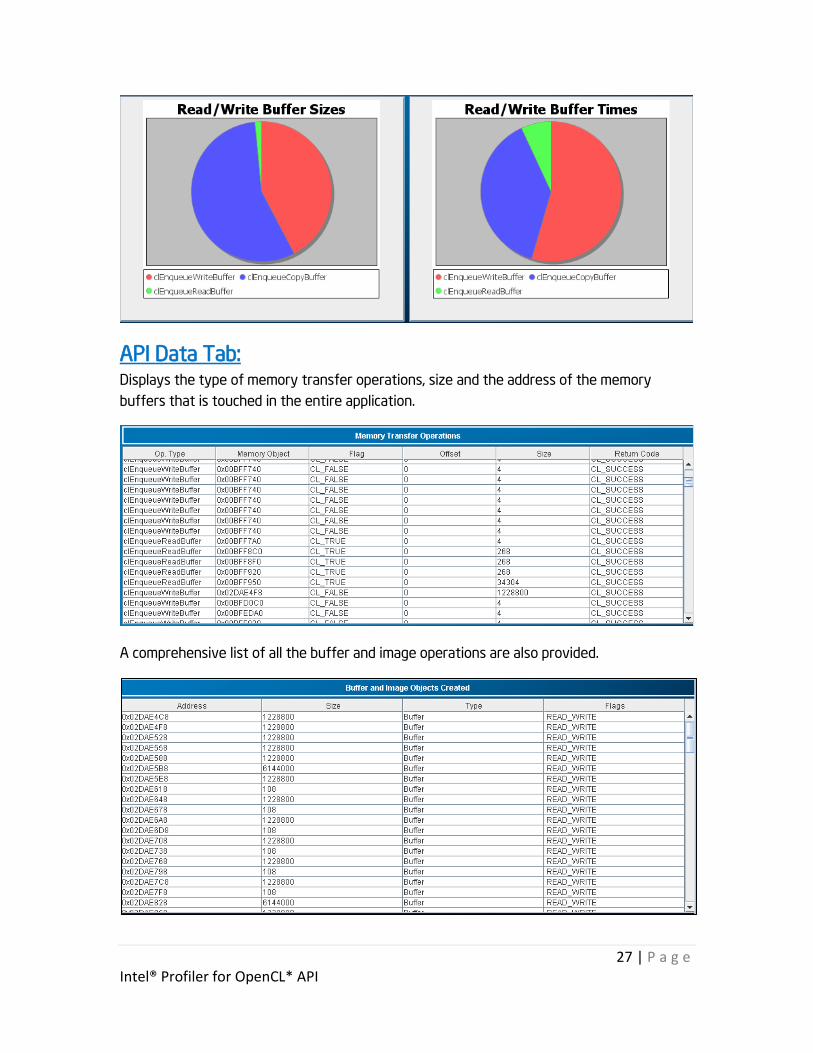
Pie charts of the distribution of the different types of memory operations – time and size is
also displayed.
27 | P a g e Intel® Profiler for OpenCL* API
API Data Tab: Displays the type of memory transfer operations, size and the address of the memory
buffers that is touched in the entire application.
A comprehensive list of all the buffer and image operations are also provided.

28 | P a g e Intel® Profiler for OpenCL* API
Hardware Counters (Experimental)
Hardware counters enables users to see the utilization of execution units in the GPU during
the execution of a kernel. To enable enable hardware counters a parameter called “-
kernelcounters” can be entered in the “Parameters” text box. This parameter enables
hardware counters for all the kernels in the application. Advanced options are available to
fine tune the metrics.
-kernelcounters=<options>
Options :-interval=<interval_value in micro secs>, default value 1000 micro secs
-kernel=<kernel1,kernel2>, To view counters for specific kernels.
Interval controls the granularity of sampling. There can be performance impacts if the
interval is too low.
The hardware counters are embedded in the TimeLine view. To view the hardware
counters for a kernel, double click the rectangular instance corresponding to a kernel.
The chart below shows Execution unit (EU) utilization and the frequency ratio for
graphics core.
29 | P a g e Intel® Profiler for OpenCL* API
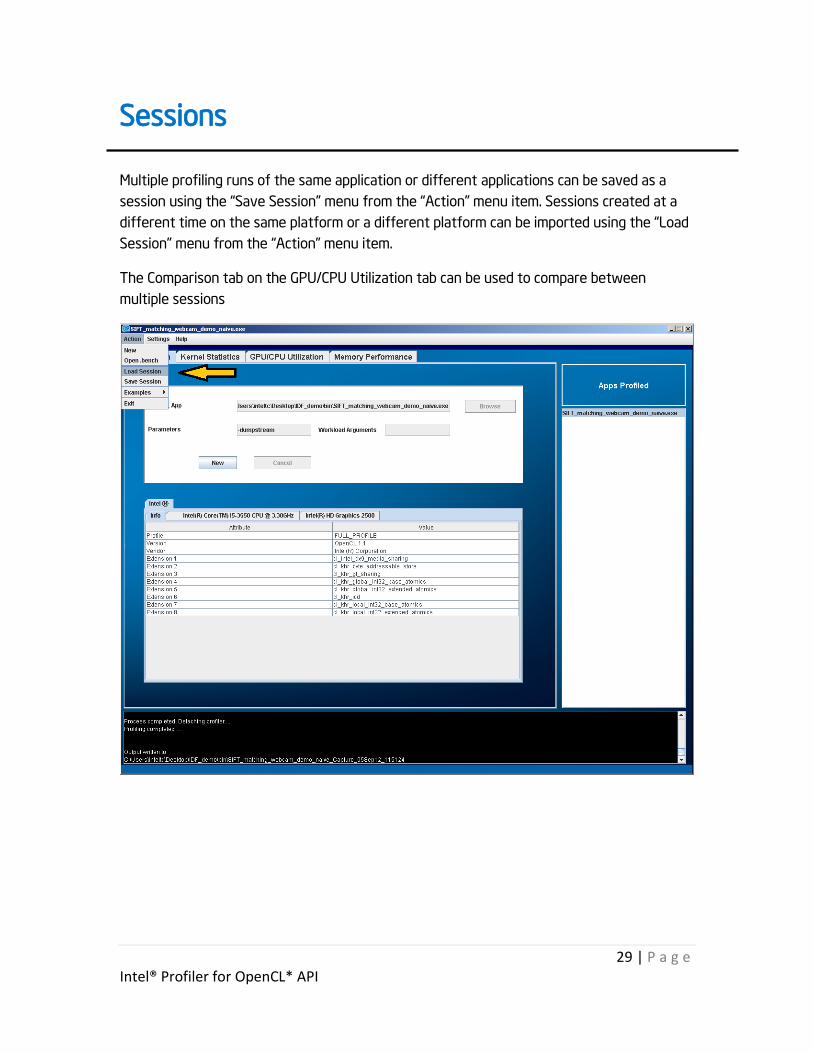
Sessions
Multiple profiling runs of the same application or different applications can be saved as a
session using the “Save Session” menu from the “Action” menu item. Sessions created at a
different time on the same platform or a different platform can be imported using the “Load
Session” menu from the “Action” menu item.
The Comparison tab on the GPU/CPU Utilization tab can be used to compare between
multiple sessions
30 | P a g e Intel® Profiler for OpenCL* API
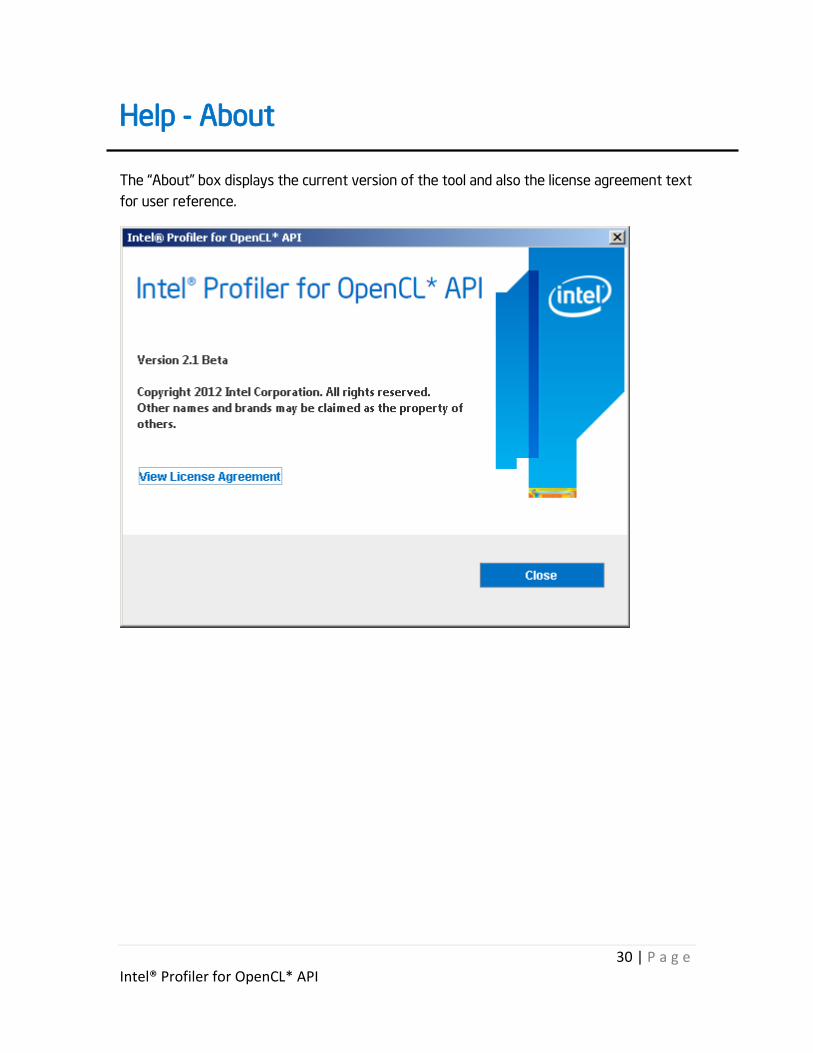
Help - About
The “About” box displays the current version of the tool and also the license agreement text
for user reference.