Integrity BHP Billiton Annual Report 2016 Resilience ...
296
Integrity Resilience Growth Annual Report 2016
Transcript of Integrity BHP Billiton Annual Report 2016 Resilience ...
BHP Billiton A
nnual Report 2016
IntegrityResilienceGrowthAnnual Report 2016

BHP Billiton Limited. ABN 49 004 028 077. Registered in Australia. Registered o� ice: 171 Collins Street, Melbourne, Victoria 3000, Australia. BHP Billiton Plc. Registration number 3196209. Registered in England and Wales. Registered o� ice: Neathouse Place, London SW1V 1LH, United Kingdom. Each of BHP Billiton Limited and BHP Billiton Plc is a member of the BHP Billiton Group, which is headquartered in Australia. BHP Billiton is a Dual Listed Company structure comprising BHP Billiton Limited and BHP Billiton Plc. The two entities continue to exist as separate companies but operate as a combined Group known as BHP Billiton.
The headquarters of BHP Billiton Limited and the global headquarters of the combined BHP Billiton Group are located in Melbourne, Australia. The headquarters of BHP Billiton Plc is located in London, United Kingdom. Both companies have identical Boards of Directors and are run by a unified management team. Throughout this publication, the Boards are referred to collectively as the Board. Shareholders in each company have equivalent economic and voting rights in the BHP Billiton Group as a whole.
Throughout this Annual Report, the terms BHP Billiton, the Company and the Group refer to the combined group, including both BHP Billiton Limited and subsidiary companies and BHP Billiton Plc and subsidiary companies. Cross references refer to sections of the Annual Report, unless stated otherwise.
Our purpose is to create long-term shareholder value through the discovery, acquisition, development and marketing of natural resources.
Our strategy is to own and operate large, long-life, low-cost, expandable, upstream assets diversified by commodity, geography and market.
Our Values
SustainabilityPutting health and safety first, being environmentally responsible and supporting our communities.
IntegrityDoing what is right and doing what we say we will do.
RespectEmbracing openness, trust, teamwork, diversity and relationships that are mutually beneficial.
PerformanceAchieving superior business results by stretching our capabilities.
SimplicityFocusing our eff orts on the things that matter most.
AccountabilityDefining and accepting responsibility and delivering on our commitments.
We are successful when:
Our people start each day with a sense of purpose and end the day with a sense of accomplishment.
Our teams are inclusive and diverse.
Our communities, customers and suppliers value their relationships with us.
Our asset portfolio is world-class and sustainably developed.
Our operational discipline and financial strength enables our future growth.
Our shareholders receive a superior return on their investment.
Andrew MackenzieChief Executive O� icer
We are BHP Billiton, a leading global resources company.
Our Charter
We are BHP Billiton, a leading global resources company.
Our Charter
BHP Billiton Annual Report 2016 1
2 Governance at BH
P Billiton1 Strategic Report
3 Rem
uneration Report4
Directors’ Report
1 Strategic Report1.1 Chairman’s Review 31.2 Chief Executive Officer’s Report 41.3 Performance summary 51.4 Samarco 61.5 Business model 101.6 Company strategy 161.7 Key performance indicators 201.8 Our operating environment 22
1.9 Management of risk 271.10 People 381.11 Sustainability 441.12 Overview of assets and Marketing 521.13 Summary of financial performance 661.14 Performance by commodity 771.15 Other information 87
2 Governance at BHP Billiton2.1 Governance at BHP Billiton 892.2 Board of Directors and Executive Leadership Team 912.3 Shareholder engagement 962.4 Role and responsibilities of the Board 972.5 Board membership 972.6 Chairman 982.7 Director skills, experience and attributes 982.8 Director induction, training and development 1012.9 Independence 1022.10 Board evaluation 1032.11 Board meetings and attendance 104
2.12 Director re-election 1042.13 Board committees 1052.14 Risk management governance structure 1132.15 Management 1142.16 Business conduct 1152.17 Market disclosure 1152.18 Remuneration 1152.19 Directors’ share ownership 1152.20 Conformance with corporate governance standards 1162.21 Additional UK disclosure 116
3 Remuneration Report3.1 Annual statement by the Remuneration
Committee Chairman 1183.2 Individuals covered by this Remuneration Report 120
3.3 Remuneration policy report 1213.4 Annual report on remuneration 128
4 Directors’ Report4.1 Review of operations, principal activities
and state of affairs 1504.2 Share capital and buy-back programs 1514.3 Results, financial instruments and going concern 1514.4 Directors 1524.5 Remuneration and share interests 1524.6 Secretaries 1524.7 Indemnities and insurance 1534.8 Employee policies 1534.9 Corporate governance 153
4.10 Dividends 1534.11 Auditors 1534.12 Non-audit services 1534.13 Political donations 1544.14 Exploration, research and development 1544.15 ASIC Instrument 2016/191 1544.16 Proceedings on behalf of BHP Billiton Limited 1544.17 Performance in relation to environmental regulation 1544.18 Share capital, restrictions on transfer of shares
and other additional information 154
5 Financial Statements5.1 Consolidated Financial Statements 1565.2 BHP Billiton Plc 2085.3 Directors’ declaration 2175.4 Statement of Directors’ responsibilities in respect
of the Annual Report and the Financial Statements 218
5.5 Lead Auditor’s Independence Declaration under Section 307C of the Australian Corporations Act 2001 219
5.6 Independent Auditors’ reports 2205.7 Supplementary oil and gas information – unaudited 225
6 Additional information6.1 Information on mining operations 2316.2 Production 2406.3 Reserves and resources 244
6.4 Major projects 2656.5 Legal proceedings 2666.6 Glossary 268
7 Shareholder information7.1 History and development 2767.2 Markets 2767.3 Organisational structure 2767.4 Material contracts 2787.5 Constitution 2787.6 Share ownership 282
7.7 Dividends 2847.8 Share price information 2847.9 American Depositary Receipts fees and charges 2857.10 Taxation 2867.11 Government regulations 2907.12 Ancillary information for our shareholders 292
Forward looking statementsThis Annual Report contains forward looking statements, including statements regarding trends in commodity prices and currency exchange rates; demand for commodities; production forecasts; plans, strategies and objectives of management; closure or divestment of certain operations or facilities (including associated costs); anticipated production or construction commencement dates; capital costs and scheduling; operating costs; anticipated productive lives of projects, mines and facilities; provisions and contingent liabilities; and tax and regulatory developments.
Forward looking statements can be identified by the use of terminology such as ‘intend’, ‘aim’, ‘project’, ‘anticipate’, ‘estimate’, ‘plan’, ‘believe’, ‘expect’, ‘may’, ‘should’, ‘will’, ‘continue’ or similar words. These statements discuss future expectations concerning the results of operations or financial conditions, or provide other forward looking information.
These forward looking statements are not guarantees or predictions of future performance and involve known and unknown risks, uncertainties and other factors, many of which are beyond our control and which may cause actual results to differ materially from those expressed in the statements contained in this Annual Report. Readers are cautioned not to put undue reliance on forward looking statements.
For example, our future revenues from our operations, projects or mines described in this Annual Report will be based, in part, on the market price of the minerals, metals or petroleum products produced, which may vary significantly from current levels. These variations, if materially adverse, may affect the timing or the feasibility of the development of a particular project, the expansion of certain facilities or mines, or the continuation of existing operations.
Other factors that may affect the actual construction or production commencement dates, costs or production output and anticipated lives of operations, mines or facilities include our ability to profitably produce and transport the minerals, petroleum and/or metals extracted to applicable markets; the impact of foreign currency exchange rates on the market prices of the minerals, petroleum or metals we produce; activities of government authorities in the countries where we are exploring or developing projects, facilities or mines, including increases in taxes, changes in environmental and other regulations and political uncertainty; labour unrest; and other factors identified in the risk factors set out in section 1.9.2.
Except as required by applicable regulations or by law, the Company does not undertake to publicly update or review any forward looking statements, whether as a result of new information or future events.
Past performance cannot be relied on as a guide to future performance.
2 BHP Billiton Annual Report 2016
Section 1 Strategic Report
About this Strategic Report1.1 Chairman’s Review1.2 Chief Executive Officer’s Report1.3 Performance summary1.4 Samarco1.5 Business model 1.5.1 About us 1.5.2 What we do 1.5.3 Our Operating Model 1.5.4 BHP Billiton locations (includes non-operated)1.6 Company strategy 1.6.1 Our strategy 1.6.2 Planning 1.6.3 Focus areas – Operating sustainably – A more productive organisation – Disciplined capital management1.7 Key performance indicators 1.7.1 Sustainability key performance indicators – Total recordable injury frequency (TRIF) – GHG emissions – Social investment 1.7.2 Financial key performance indicators – Underlying attributable profit – Underlying EBITDA – Net operating cash flows 1.7.3 Capital management key performance indicators – Total shareholder return (TSR) – Long-term credit rating1.8 Our operating environment 1.8.1 Market factors and trends – Economic outlook – Commodity performance and outlook – Exchange rates – Interest rates 1.8.2 Other factors and trends – Exploration of resources – Health, safety, environment and community – Insurance
1.9 Management of risk 1.9.1 Approach to risk management 1.9.2 Risk factors 1.9.3 Management of principal risks1.10 People 1.10.1 Our people 1.10.2 New, simplified Operating Model 1.10.3 Inclusion and diversity 1.10.4 Employee engagement 1.10.5 Leadership development 1.10.6 Performance enhancement process improvements 1.10.7 Employment relations 1.10.8 Employees and contractors1.11 Sustainability 1.11.1 Our sustainability approach 1.11.2 Climate change 1.11.3 Governance 1.11.4 Health and safety 1.11.5 Society 1.11.6 Environment1.12 Overview of assets and Marketing 1.12.1 Minerals Australia 1.12.2 Minerals America 1.12.3 Petroleum 1.12.4 Marketing1.13 Summary of financial performance˗ 1.13.1 Group overview˗ 1.13.2 Underlying financial measures˗ 1.13.3 Net debt and sources of liquidity1.14 Performance by commodity˗ 1.14.1 Petroleum˗ 1.14.2 Copper˗ 1.14.3 Iron Ore˗ 1.14.4 Coal˗ 1.14.5 Other assets – Potash and Nickel West1.15 Other information
About this Strategic Report
This Strategic Report provides insight into BHP Billiton’s strategy, operating and business model, and objectives. It describes the principal risks the Company faces and how these risks might affect our future prospects. It also gives our perspective on our recent operational and financial performance. This disclosure is intended to assist shareholders and other stakeholders to understand and interpret the Consolidated Financial Statements prepared in accordance with International Financial Reporting Standards (IFRS) included in this Annual Report. The basis of preparation of the Consolidated Financial Statements is set out in section 5.1 ‘Basis of preparation’ to the Financial Statements. To obtain full details of the financial and operational performance of BHP Billiton, this Strategic Report should be read in conjunction with the Consolidated Financial Statements and accompanying notes.This Strategic Report meets the requirements of the UK Companies Act 2006 and the Operating and Financial Review required by the Australian Corporations Act 2001.We have excluded certain information from this Strategic Report, to the extent permitted by UK and Australian law, on the basis that it relates to impending developments or matters in the course of negotiation and disclosure would be seriously prejudicial to the interests of the Company. This is because such disclosure could be misleading due to the fact it is premature or preliminary in nature, relates to commercially sensitive contracts, would undermine confidentiality between the Company and its suppliers and clients, or would otherwise unreasonably damage the business. The categories of information omitted include forward looking estimates and projections prepared for internal management purposes, information regarding the Company’s assets and projects which is developing and susceptible to change, and information relating to commercial contracts and pricing modules.Section 1 of this Annual Report 2016 constitutes our Strategic Report 2016. References to sections beyond section 1 are references to sections in this Annual Report 2016. Shareholders may obtain a hard copy of the Annual Report free of charge by contacting our Share Registrars, whose details are set out in our Corporate Directory at the end of this Annual Report.
The Annual Report 2016 is available online at www.bhpbilliton.com.
In this section
BHP Billiton Annual Report 2016 3
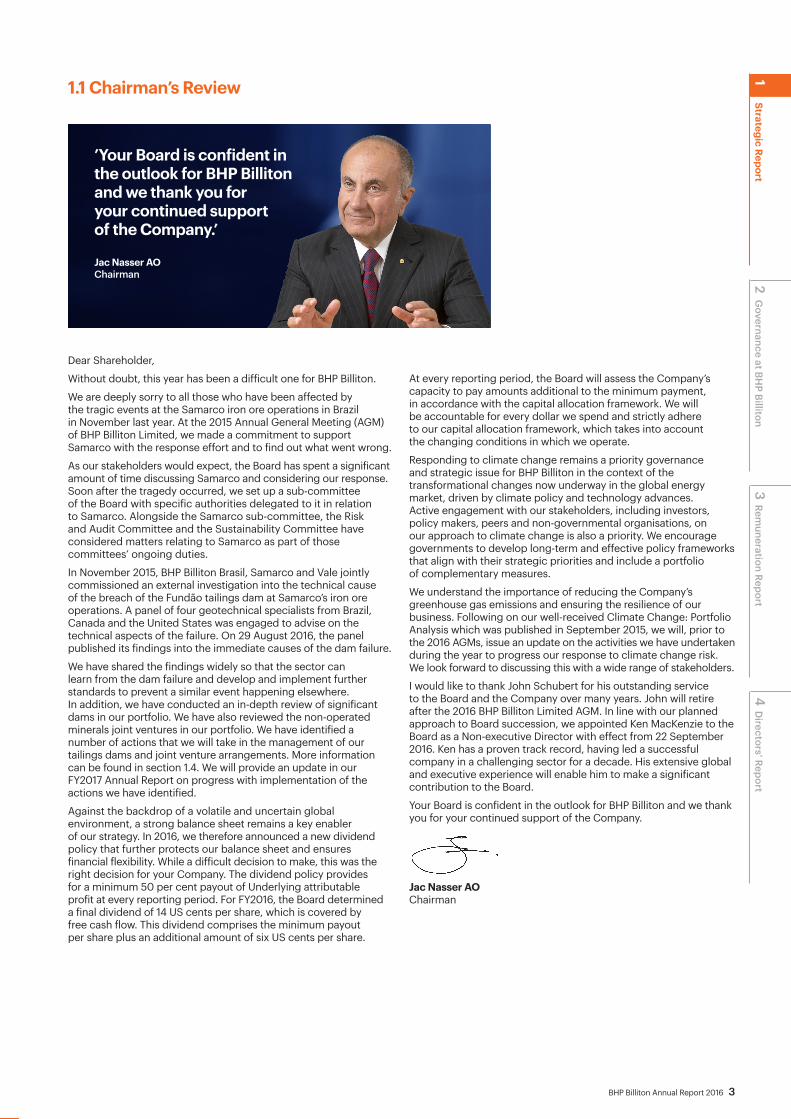
’Your Board is confident in the outlook for BHP Billiton and we thank you for your continued support of the Company.’
Jac Nasser AO Chairman
1.1 Chairman’s Review
Dear Shareholder,
Without doubt, this year has been a difficult one for BHP Billiton.
We are deeply sorry to all those who have been affected by the tragic events at the Samarco iron ore operations in Brazil in November last year. At the 2015 Annual General Meeting (AGM) of BHP Billiton Limited, we made a commitment to support Samarco with the response effort and to find out what went wrong.
As our stakeholders would expect, the Board has spent a significant amount of time discussing Samarco and considering our response. Soon after the tragedy occurred, we set up a sub-committee of the Board with specific authorities delegated to it in relation to Samarco. Alongside the Samarco sub-committee, the Risk and Audit Committee and the Sustainability Committee have considered matters relating to Samarco as part of those committees’ ongoing duties.
In November 2015, BHP Billiton Brasil, Samarco and Vale jointly commissioned an external investigation into the technical cause of the breach of the Fundão tailings dam at Samarco’s iron ore operations. A panel of four geotechnical specialists from Brazil, Canada and the United States was engaged to advise on the technical aspects of the failure. On 29 August 2016, the panel published its findings into the immediate causes of the dam failure.
We have shared the findings widely so that the sector can learn from the dam failure and develop and implement further standards to prevent a similar event happening elsewhere. In addition, we have conducted an in-depth review of significant dams in our portfolio. We have also reviewed the non-operated minerals joint ventures in our portfolio. We have identified a number of actions that we will take in the management of our tailings dams and joint venture arrangements. More information can be found in section 1.4. We will provide an update in our FY2017 Annual Report on progress with implementation of the actions we have identified.
Against the backdrop of a volatile and uncertain global environment, a strong balance sheet remains a key enabler of our strategy. In 2016, we therefore announced a new dividend policy that further protects our balance sheet and ensures financial flexibility. While a difficult decision to make, this was the right decision for your Company. The dividend policy provides for a minimum 50 per cent payout of Underlying attributable profit at every reporting period. For FY2016, the Board determined a final dividend of 14 US cents per share, which is covered by free cash flow. This dividend comprises the minimum payout per share plus an additional amount of six US cents per share.
At every reporting period, the Board will assess the Company’s capacity to pay amounts additional to the minimum payment, in accordance with the capital allocation framework. We will be accountable for every dollar we spend and strictly adhere to our capital allocation framework, which takes into account the changing conditions in which we operate.
Responding to climate change remains a priority governance and strategic issue for BHP Billiton in the context of the transformational changes now underway in the global energy market, driven by climate policy and technology advances. Active engagement with our stakeholders, including investors, policy makers, peers and non-governmental organisations, on our approach to climate change is also a priority. We encourage governments to develop long-term and effective policy frameworks that align with their strategic priorities and include a portfolio of complementary measures.
We understand the importance of reducing the Company’s greenhouse gas emissions and ensuring the resilience of our business. Following on our well-received Climate Change: Portfolio Analysis which was published in September 2015, we will, prior to the 2016 AGMs, issue an update on the activities we have undertaken during the year to progress our response to climate change risk. We look forward to discussing this with a wide range of stakeholders.
I would like to thank John Schubert for his outstanding service to the Board and the Company over many years. John will retire after the 2016 BHP Billiton Limited AGM. In line with our planned approach to Board succession, we appointed Ken MacKenzie to the Board as a Non-executive Director with effect from 22 September 2016. Ken has a proven track record, having led a successful company in a challenging sector for a decade. His extensive global and executive experience will enable him to make a significant contribution to the Board.
Your Board is confident in the outlook for BHP Billiton and we thank you for your continued support of the Company.
Jac Nasser AO Chairman
2 Governance at BH
P Billiton3
Remuneration Report
4 D
irectors’ Report 1
Strategic Report
4 BHP Billiton Annual Report 2016
1 Strategic Report continued
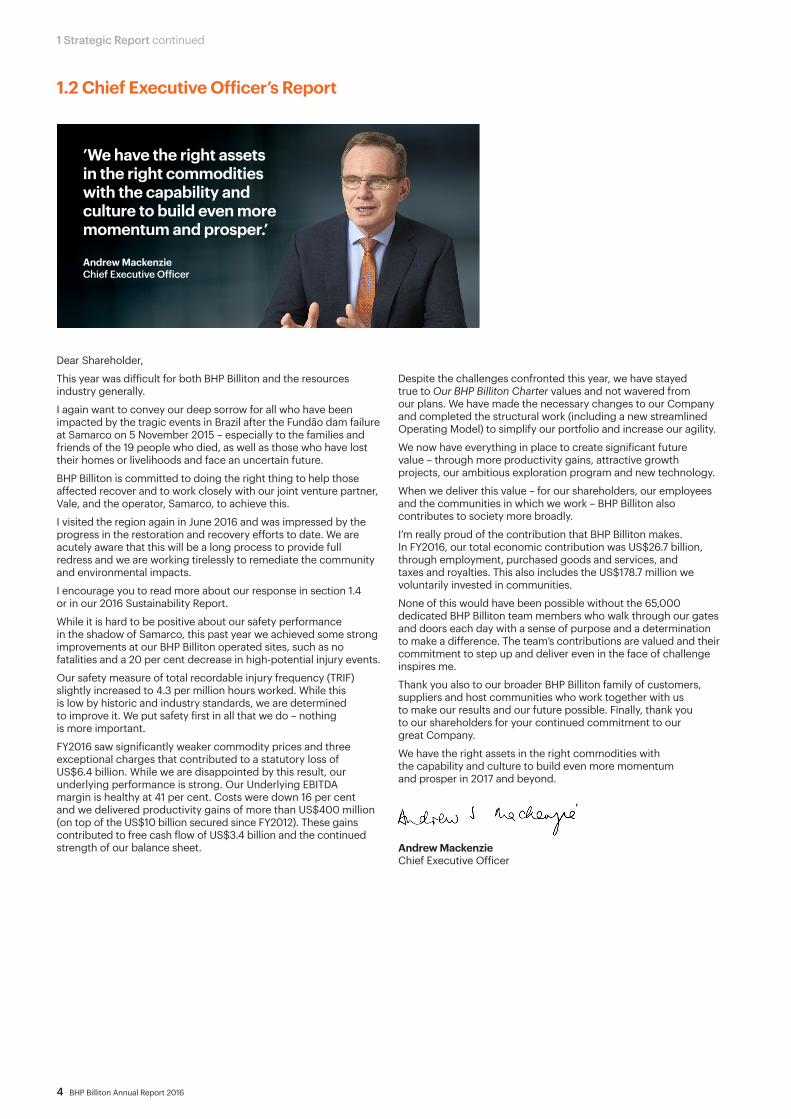
’We have the right assets in the right commodities with the capability and culture to build even more momentum and prosper.’
Andrew Mackenzie Chief Executive Officer
1.2 Chief Executive Officer’s Report
Dear Shareholder,
This year was difficult for both BHP Billiton and the resources industry generally.
I again want to convey our deep sorrow for all who have been impacted by the tragic events in Brazil after the Fundão dam failure at Samarco on 5 November 2015 – especially to the families and friends of the 19 people who died, as well as those who have lost their homes or livelihoods and face an uncertain future.
BHP Billiton is committed to doing the right thing to help those affected recover and to work closely with our joint venture partner, Vale, and the operator, Samarco, to achieve this.
I visited the region again in June 2016 and was impressed by the progress in the restoration and recovery efforts to date. We are acutely aware that this will be a long process to provide full redress and we are working tirelessly to remediate the community and environmental impacts.
I encourage you to read more about our response in section 1.4 or in our 2016 Sustainability Report.
While it is hard to be positive about our safety performance in the shadow of Samarco, this past year we achieved some strong improvements at our BHP Billiton operated sites, such as no fatalities and a 20 per cent decrease in high-potential injury events.
Our safety measure of total recordable injury frequency (TRIF) slightly increased to 4.3 per million hours worked. While this is low by historic and industry standards, we are determined to improve it. We put safety first in all that we do – nothing is more important.
FY2016 saw significantly weaker commodity prices and three exceptional charges that contributed to a statutory loss of US$6.4 billion. While we are disappointed by this result, our underlying performance is strong. Our Underlying EBITDA margin is healthy at 41 per cent. Costs were down 16 per cent and we delivered productivity gains of more than US$400 million (on top of the US$10 billion secured since FY2012). These gains contributed to free cash flow of US$3.4 billion and the continued strength of our balance sheet.
Despite the challenges confronted this year, we have stayed true to Our BHP Billiton Charter values and not wavered from our plans. We have made the necessary changes to our Company and completed the structural work (including a new streamlined Operating Model) to simplify our portfolio and increase our agility.
We now have everything in place to create significant future value – through more productivity gains, attractive growth projects, our ambitious exploration program and new technology.
When we deliver this value – for our shareholders, our employees and the communities in which we work – BHP Billiton also contributes to society more broadly.
I’m really proud of the contribution that BHP Billiton makes. In FY2016, our total economic contribution was US$26.7 billion, through employment, purchased goods and services, and taxes and royalties. This also includes the US$178.7 million we voluntarily invested in communities.
None of this would have been possible without the 65,000 dedicated BHP Billiton team members who walk through our gates and doors each day with a sense of purpose and a determination to make a difference. The team’s contributions are valued and their commitment to step up and deliver even in the face of challenge inspires me.
Thank you also to our broader BHP Billiton family of customers, suppliers and host communities who work together with us to make our results and our future possible. Finally, thank you to our shareholders for your continued commitment to our great Company.
We have the right assets in the right commodities with the capability and culture to build even more momentum and prosper in 2017 and beyond.
Andrew Mackenzie Chief Executive Officer

BHP Billiton Annual Report 2016 5
20,000
FY20
12
15,000
10,000
5,000
0
-5,000
-10,000
FY20
13
FY20
14
FY20
15
FY20
16
US$ million
(1) Comparative data includes Continuing and Discontinued operations.
Attributable (loss)/profit (1)
US$(6.4) billion
123.7
55
(1) Includes BHP Billiton’s equity share for both operated and non-operated joint venture operations. Data prior to FY2016 includes payments made by operations demerged with South32.
250
FY20
12
200
150
100
50
0
FY20
13
FY20
14
FY20
15
FY20
16
US$ million
Social investment
US$178.7 million
Contributions to BHP Billitonsupported charitiesCash expenditures
(1)
7,000
FY20
12
4,000
5,000
6,000
3,000
2,000
1,000
0
FY20
13
FY20
14
FY20
15
FY20
16
US$ million
Dividends determined
US$1.6 billion
(1) Comparative data excludes Discontinued operations.
35,000
FY20
12
30,000
25,000
20,000
15,000
10,000
5,000
0
FY20
13
FY20
14
FY20
15
FY20
16
US$ million
Underlying EBITDA (1)
US$12.3 billion
4.3 TRIFTotal recordable injury frequency performance per million hours worked. While we had no fatalities at our operated assets, tragically 19 people died as a result of the dam failure at the non-operated joint venture Samarco.
US$71.2 billionMarket capitalisation as at 30 June 2016.
US$30.9 billionRevenue (decreased by 31 per cent).
US$10.6 billionNet operating cash flows (decreased by 45 per cent).
(120) US centsBasic (loss)/earnings per ordinary share.
30 US centsTotal dividend per share.
US$437 millionSustainable productivity gains delivered during FY2016.
13 per cent lowerGreenhouse gas emissions compared to our adjusted FY2006 baseline.
1.3 Performance summary
2 Governance at BH
P Billiton3
Remuneration Report
4 D
irectors’ Report 1
Strategic Report

6 BHP Billiton Annual Report 2016
1 Strategic Report continued
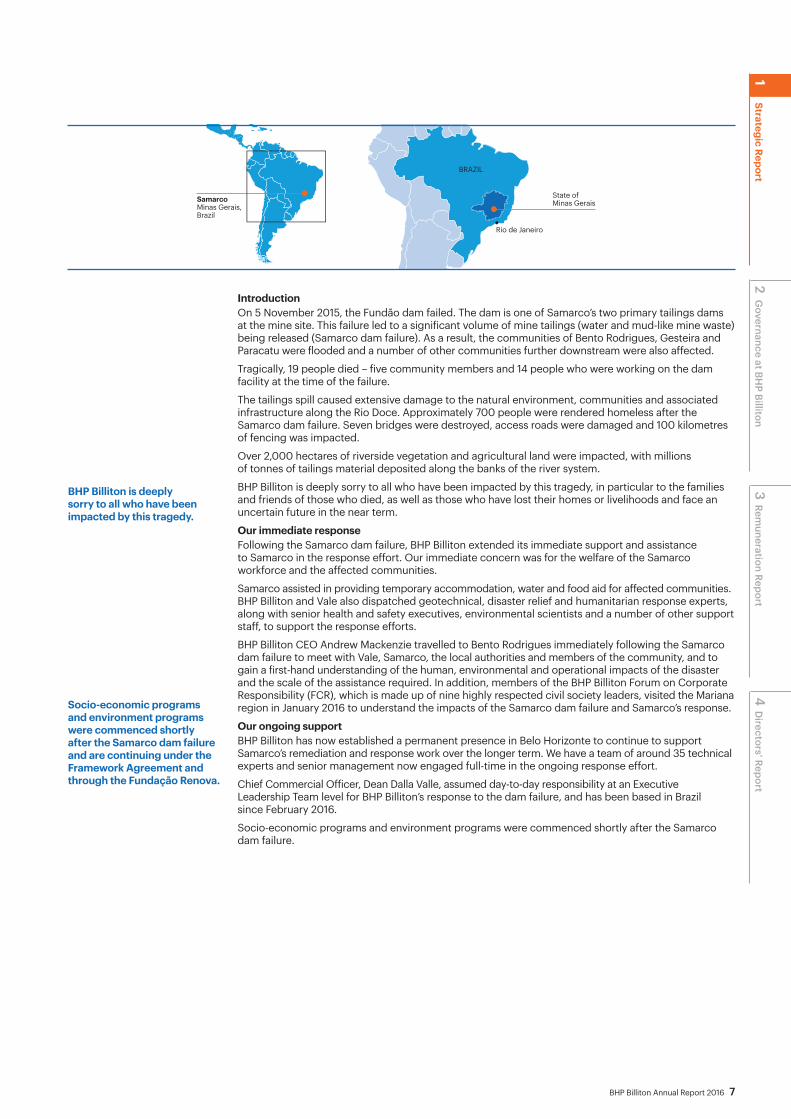
Samarco Mineração S.A. (Samarco) is a non-operated joint venture owned by BHP Billiton Brasil Ltda (BHP Billiton Brasil) and Vale S.A. (Vale), each having a 50 per cent shareholding. The Samarco operations comprise an iron ore mine, and processing and concentration facilities located in Bento Rodrigues in the Mariana region of the state of Minas Gerais, and four pellet plants and a port located in the state of Espírito Santo.
1.4 Samarco
The failure of Samarco’s Fundão dam
On 5 November 2015, the Fundão dam failed. The dam is one of Samarco’s two primary tailings dams at the mine site. This failure led to a significant volume of mine tailings (water and mud-like mine waste) being released.
Our immediate response
Following the Samarco dam failure, BHP Billiton extended its immediate support and assistance to Samarco, in the response effort. Our immediate concern was for the welfare of the Samarco workforce and the affected communities.
Our ongoing support
BHP Billiton has now established a permanent presence in Belo Horizonte to continue to support Samarco’s remediation and response work over the longer term. We have a team of around 35 technical experts and senior management now engaged full-time in the ongoing response effort.
BHP Billiton Annual Report 2016 7
SamarcoMinas Gerais,Brazil
State of Minas Gerais
Rio de Janeiro
BRAZIL
2 Governance at BH
P Billiton3
Remuneration Report
4 D
irectors’ Report 1
Strategic Report
IntroductionOn 5 November 2015, the Fundão dam failed. The dam is one of Samarco’s two primary tailings dams at the mine site. This failure led to a significant volume of mine tailings (water and mud-like mine waste) being released (Samarco dam failure). As a result, the communities of Bento Rodrigues, Gesteira and Paracatu were flooded and a number of other communities further downstream were also affected.
Tragically, 19 people died – five community members and 14 people who were working on the dam facility at the time of the failure.
The tailings spill caused extensive damage to the natural environment, communities and associated infrastructure along the Rio Doce. Approximately 700 people were rendered homeless after the Samarco dam failure. Seven bridges were destroyed, access roads were damaged and 100 kilometres of fencing was impacted.
Over 2,000 hectares of riverside vegetation and agricultural land were impacted, with millions of tonnes of tailings material deposited along the banks of the river system.
BHP Billiton is deeply sorry to all who have been impacted by this tragedy, in particular to the families and friends of those who died, as well as those who have lost their homes or livelihoods and face an uncertain future in the near term.
Our immediate responseFollowing the Samarco dam failure, BHP Billiton extended its immediate support and assistance to Samarco in the response effort. Our immediate concern was for the welfare of the Samarco workforce and the affected communities.
Samarco assisted in providing temporary accommodation, water and food aid for affected communities. BHP Billiton and Vale also dispatched geotechnical, disaster relief and humanitarian response experts, along with senior health and safety executives, environmental scientists and a number of other support staff, to support the response efforts.
BHP Billiton CEO Andrew Mackenzie travelled to Bento Rodrigues immediately following the Samarco dam failure to meet with Vale, Samarco, the local authorities and members of the community, and to gain a first-hand understanding of the human, environmental and operational impacts of the disaster and the scale of the assistance required. In addition, members of the BHP Billiton Forum on Corporate Responsibility (FCR), which is made up of nine highly respected civil society leaders, visited the Mariana region in January 2016 to understand the impacts of the Samarco dam failure and Samarco’s response.
Our ongoing supportBHP Billiton has now established a permanent presence in Belo Horizonte to continue to support Samarco’s remediation and response work over the longer term. We have a team of around 35 technical experts and senior management now engaged full-time in the ongoing response effort.
Chief Commercial Officer, Dean Dalla Valle, assumed day-to-day responsibility at an Executive Leadership Team level for BHP Billiton’s response to the dam failure, and has been based in Brazil since February 2016.
Socio-economic programs and environment programs were commenced shortly after the Samarco dam failure.
BHP Billiton is deeply sorry to all who have been impacted by this tragedy.
Socio-economic programs and environment programs were commenced shortly after the Samarco dam failure and are continuing under the Framework Agreement and through the Fundação Renova.
8 BHP Billiton Annual Report 2016
1 Strategic Report continued
The Framework Agreement and Fundação Renova In December 2015, the Federal Government of Brazil, the states of Espírito Santo and Minas Gerais and certain other public authorities (Brazilian Authorities) filed a R$20 billion claim against Samarco, Vale and BHP Billiton Brasil for clean-up costs and damages.
In March 2016, an agreement was entered into by Samarco, Vale and BHP Billiton Brasil and the Brazilian Authorities for the restoration of the environment and communities affected by the dam failure (Framework Agreement). The Framework Agreement provides a long-term, participatory framework for responding to the Samarco tragedy.
The Framework Agreement outlines a set of actions, measures and programs, including 17 environmental and 22 socio-economic programs, to restore and compensate the communities and environment affected by the Samarco dam failure.
In accordance with the Framework Agreement, Samarco, Vale and BHP Billiton Brasil have established a private foundation (Fundação Renova) to develop and execute the environmental and socio-economic programs. Samarco is responsible for funding the Fundação Renova and will make annual contributions. However, to the extent that Samarco does not meet its funding obligations, each of Vale and BHP Billiton Brasil has agreed to provide funding to the Fundação Renova in proportion to its 50 per cent shareholding in Samarco.
The Fundação Renova will be overseen by an Inter-Federative Committee comprising representatives of the Ministry for the Environment, the Federal Government, the states of Minas Gerais and Espírito Santo, the municipalities of Minas Gerais and Espírito Santo, the Public Defenders Union and the Rio Doce Hydrographic Basin Committee.
The Framework Agreement mandates community involvement in the development of the remediation and compensation programs through a formal advisory committee and social dialogue program. It includes a local level grievance mechanism and the establishment of an Ombudsman-like process, which is currently being designed with input from international experts and communities.
The Framework Agreement was ratified by the Federal Court of Appeal in Brasília on 5 May 2016, suspending the R$20 billion public civil claim commenced by the Brazilian Authorities against Samarco, Vale and BHP Billiton Brasil. However, on 30 June 2016, the Superior Court of Justice issued a preliminary order suspending the decision of the Federal Court of Appeal to ratify the Framework Agreement. Samarco, Vale and BHP Billiton Brasil have appealed the decision of the Superior Court of Justice.
The effect of the preliminary order of the Superior Court of Justice is to reinstate the R$20 billion public civil claim. Notwithstanding this preliminary order, Samarco will continue to remediate and compensate for the effects of the Samarco dam failure.
The Framework Agreement remains a binding agreement between the parties and Samarco will continue to undertake the economic and socio-economic programs under the Framework Agreement.
Ongoing socio-economic and environmental programsCompensation for those affected, the reconstruction of public infrastructure and the relocation of the impacted communities of Bento Rodrigues, Paracatu and Gesteira are key programs under the Framework Agreement. Ninety per cent of the 41 programs prescribed by the Framework Agreement have been initiated and have been transitioned to the Fundação Renova.
Following a participatory process, the Bento Rodrigues community voted on the location of Lavoura as the place to rebuild their community. The site is located approximately nine kilometres from the location of the former town.
Following a similar consultation process, 95 per cent of community members from Gesteira, in the district of Barra Longa, voted in favour of reconstructing homes and public facilities in the area of Macacos.
Residents of Paracatu have visited options for their resettlement site and are in the process of deciding on their preferred location. The next step in the process is to engage the communities in architectural and urban design, as well as the construction standards of the residences.
The Framework Agreement outlines a set of actions, measures and programs, including 17 environmental and 22 socio-economic programs, to restore and compensate the communities and environment affected by the Samarco dam failure.
Ninety per cent of the 41 programs prescribed by the Framework Agreement have been initiated and have been transitioned to the Fundação Renova.
1.4 Samarco continued
BHP Billiton Annual Report 2016 9
2 Governance at BH
P Billiton3
Remuneration Report
4 D
irectors’ Report 1
Strategic ReportOver 7,000 families whose livelihoods have been impacted by the dam failure are receiving financial assistance from Samarco. The majority of these are either from the communities closest to the mine site in Mariana and Barra Longa or from the communities along the Rio Doce and near the coast in Minas Gerais and Espírito Santo where fishing-based livelihoods were common.
An extensive negotiated compensation program has been developed to ensure affected people receive fair and reasonable compensation. The program commenced in August 2016 and will take six months to implement in 20 locations. Payments are expected to be completed by mid-2017. Preliminary compensation has already been paid to those most severely impacted.
Works are underway to reinforce and improve the dam structures at Samarco so as to contain the remaining tailings materials. A large portion of the works are scheduled to be completed before the next wet season commences. Among the measures being taken, Samarco is building a series of sediment dams to reduce the potential for tailings to be transported further downstream. Works also include re-contouring tailings deposits, establishing a temporary vegetation cover and rock armouring sections of the main river channel and tributaries to reduce erosion.
Water testing is being conducted at 94 different points along the Rio Doce and marine areas near the mouth of the river. Extensive geochemical analyses of the tailings and existing sediments and toxicity test work have also been undertaken. Results indicate that the water quality of the river, in terms of metals of environmental concern, is similar to that determined by studies conducted in 2010 by the Brazilian Geological Service and National Water Agency, and support the earlier determination that the tailings released into the river system are not toxic.
Understanding the causeIn November 2015, BHP Billiton Brasil, Samarco and Vale jointly engaged New York-based law firm Cleary Gottlieb Steen & Hamilton LLP (Cleary Gottlieb) to coordinate an external investigation into the immediate cause of the breach of the Fundão tailings dam. Cleary Gottlieb retained a panel of four geotechnical specialists to support the investigation. BHP Billiton committed to publicly share the findings in order to provide a detailed technical understanding of the cause of this tragedy and help to prevent a similar event from occurring again.
The panel’s findings can be viewed at www.fundaoinvestigation.com.
In addition to this external investigation, BHP Billiton initiated a comprehensive internal review of other significant dams and non-operated minerals joint ventures in the portfolio. A primary purpose of the dams review was to assure the integrity of significant dam structures.
BHP Billiton has identified a number of actions that we will take in our management of tailings dams and joint venture arrangements, including:• creating a centralised dam management function that will bring additional specialist expertise
in-house at BHP Billiton;• assessing technology options to enhance dam management across the portfolio;• applying at all of our operated minerals assets the process for dam safety reviews developed
by the Canadian Dam Association, which is considered to be the most rigorous in the industry;• centralising management of our interest in all major non-operated minerals joint ventures in the
Minerals Americas operating group;• establishing a new BHP Billiton global standard for non-operated minerals joint ventures.
Other legal mattersOn 3 May 2016, the Federal Public Prosecution Service filed a public civil claim against Samarco, Vale and BHP Billiton Brasil – as well as 18 other public entities – seeking R$155 billion (approximately US$48 billion) for reparation, compensation and collective moral damages in relation to the Samarco dam failure. The claim also includes a number of preliminary injunction requests. BHP Billiton Brasil has applied to have the injunctions dismissed.
BHP Billiton Brasil is among the companies named as defendants in proceedings initiated by individuals, non-governmental organisations (NGOs), corporations and governmental entities in Brazilian federal and state courts following the Samarco dam failure. The other defendants include Vale and Samarco.
For more information on these legal proceedings, refer to section 6.5.
RestartSamarco’s mining and processing operations remain suspended. Samarco is progressing plans to restart operations; however, there is uncertainty around the timing and nature of future ongoing operations. Samarco has confirmed it is unlikely to have in place the necessary approvals to restart its operations in the 2016 calendar year. Samarco makes an important contribution to the national economy and the livelihoods of thousands of people, but Samarco’s operations will restart only when it is safe to do so, and when all necessary regulatory approvals have been obtained.
Over 7,000 families whose livelihoods have been impacted by the dam failure are receiving financial assistance from Samarco.
BHP Billiton has identified a number of actions that we will take in our management of tailings dams and joint venture arrangements.
10 BHP Billiton Annual Report 2016
1 Strategic Report continued
1.5 Business model
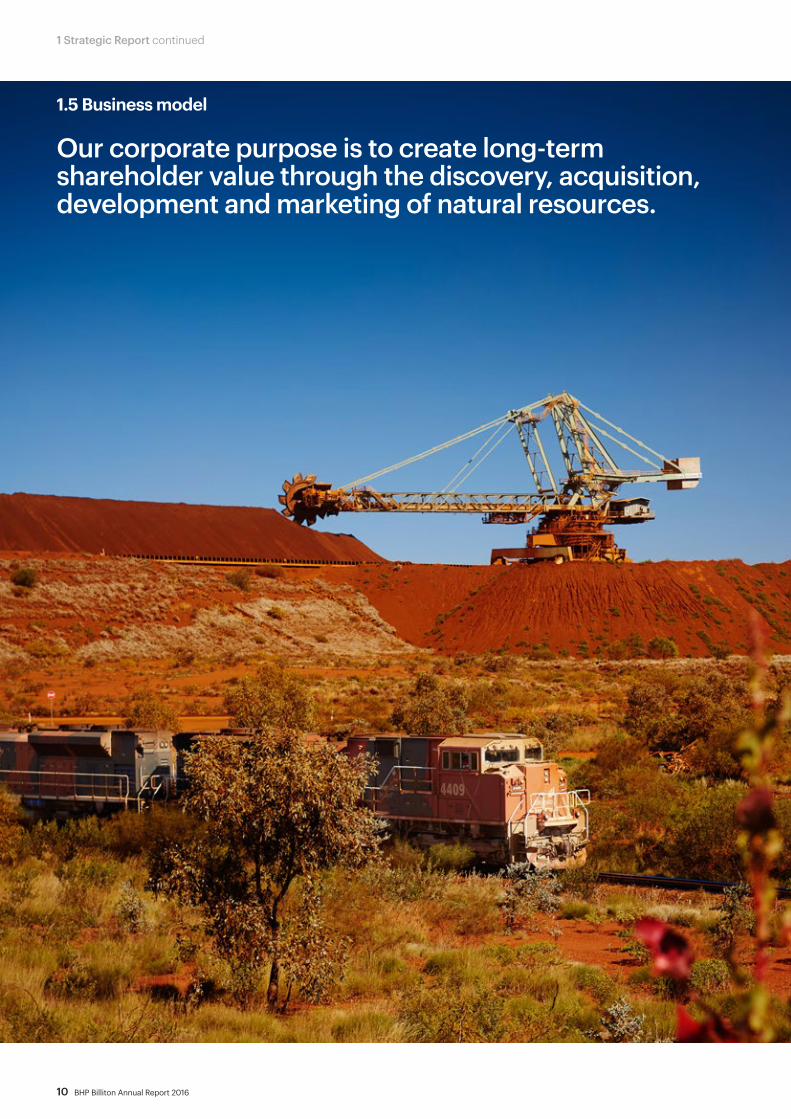
Our corporate purpose is to create long-term shareholder value through the discovery, acquisition, development and marketing of natural resources.

Top row left to right: Alex Archila, Dean Dalla Valle, Athalie Williams. Peter Beaven, Margaret Taylor, Laura Tyler, Steve Pastor. Second row left to right: Andrew Mackenzie, Pat Risner, Jane Michie. Kevin O’Kane, Danny Malchuk. Third row left to right: Edgar Basto, Eddy Haegel, Mike Henry, Rag Udd. Geraldine Slattery, Arnoud Balhuizen, Vandita Pant, Andrew Mackenzie. Fourth row left to right: Tony Cudmore, Diane Jurgens, Geoff Healy. James Palmer, Brandon Craig, Jacqueline McGill.
BHP Billiton Annual Report 2016 11
Workforce of approximately
employees and contractors as of 30 June 2016
65,000
2 Governance at BH
P Billiton3
Remuneration Report
4 D
irectors’ Report 1
Strategic Report
1.5.1 About us BHP Billiton is among the world’s top producers of major commodities including iron ore, metallurgical coal, copper and uranium. We also have substantial interests in oil, gas and energy coal.
We extract and process minerals, oil and gas from our production operations located primarily in Australia and the Americas.
Our products are sold worldwide, with sales and marketing led through Singapore and Houston, United States. Our global headquarters are in Melbourne, Australia.
We operate under a Dual Listed Company structure with two parent companies (BHP Billiton Ltd and BHP Billiton Plc) operated as a single economic entity. We are run by a unified Board and management.
With a team of more than 65,000 employees and contractors, we prioritise our people’s health and safety and strive to create an environment free from fatalities, injuries and occupational illnesses.
Our size and scope allow us to make meaningful contributions to communities and the long-term nature of our operations means we are able to build collaborative community relationships.
We aim to maximise the social and economic benefits of our operations, contribute to economic development and minimise our environmental footprint through innovation, productivity and technology.

12 BHP Billiton Annual Report 2016
1 Strategic Report continued
Exploration and evaluation
Development Extraction, processing and transportation
Marketing and logistics Contribution
Social investment (2)
Total economic contribution (3)
US$178.7m = US$26.7b
Income taxesRoyalty-relatedincome taxesRoyaltiesOther payments to governments
US$3.7b
Total payments to governments
Our broader contribution (1)
Suppliers
Employees
US$3.6bShareholders, lenders and investors (4)
US$5.2b
US$14.0b
We discover resources through brownfield and greenfield exploration. To enhance our portfolio, we also consider acquisition and divestment opportunities.
We manage product distribution through our global logistics chain, including freight and pipeline transportation. We sell our products through direct supply agreements with our customers and on global commodity exchanges. Customer insights, economic analysis and our deep knowledge of commodity markets enable us to develop a view of markets and future pricing.
To develop our options, we evaluate, plan and then invest in infrastructure, studies or trials and make decisions using a robust, rigorous process. Projects progress only if they have internal and external approvals, including Board approval for major projects.
We make a broader contribution to the communities, regions and nations in which we operate. At each step of our business model we create value – through creating jobs, purchasing goods and services and paying taxes and royalties. This generates the economic activity that supports the contribution we make to our host communities and nations.
Our goal is to safely operate our assets through mining, extracting, processing and transporting commodities. Asset teams are focused on safety, productivity and sustainability, including rehabilitation when an operation closes.
(1) For more information on our broader contribution, refer to our Economic contribution and payments to government Report, which is available at www.bhpbilliton.com.(2) Community contribution includes cash and administrative costs (US$123.7 million) and funds transferred to BHP Billiton Foundation (US$55 million). Includes payments
made by equity accounted investments.(3) The total economic contribution made during FY2016 of US$26.7 billion is determined by combining total payments to governments of US$3.7 billion (determined
on a cash paid basis), payments to suppliers of US$14.0 billion, employee expenses of US$3.6 billion, distributions to shareholders and investors of US$5.2 billion (determined on an accruals basis) and community contribution of US$178.7 million.
(4) Shareholders and investors includes US$4.2 billion of dividends attributable to members of the BHP Billiton Group and US$1.0 billion of interest expense.
Creating value We create value for both our shareholders and the broader community through the activities performed at each step of our business model.The commodities we produce underpin nearly every facet of modern life – the essential infrastructure, telecommunications, transportation and energy supplies that contribute to higher living standards for many people globally.
1.5.2 What we do

BHP Billiton Annual Report 2016 13
2 Governance at BH
P Billiton3
Remuneration Report
4 D
irectors’ Report 1
Strategic Report
1.5.3 Our Operating Model Our Operating Model describes how we are organised and work together.
The demerger of South32 in May 2015 significantly simplified our portfolio and created further opportunity for productivity improvements across our operations. Our new Operating Model, announced in February 2016, makes BHP Billiton a more agile company ready to respond to the challenges and opportunities presented by a changing global market place. The new Operating Model is designed for our simpler portfolio of 12 core operated assets. It aims to remove duplication, realise economies of scale and facilitate greater coordination in order to enhance safety, productivity and the sharing of best practice.
Under the new Operating Model, BHP Billiton is organised by:• Assets: Assets are a set of one or more geographically proximate
operations (including open-cut mines, underground mines and onshore and offshore oil and gas production and processing facilities). Our assets develop and convert resources and are focused on safety, volume and cost.
• Asset groups: We group our assets in order to drive collaboration, promote new technology adoption and to share best practice within and between groups. Our minerals assets are grouped under Minerals Australia or Minerals Americas, based on their geographic location. Our oil and gas assets are grouped together as one global Petroleum unit, reflecting the operating environment in that sector.
• Marketing: Marketing secures product sales, manages the supply chain from resources to markets, supports strategic decision-making through market insights and optimises working capital.
• Functions: Functions operate along global reporting lines to provide support to all areas of the organisation. Functions have specific accountabilities and deep expertise in areas such as finance, legal, governance, technology, corporate affairs, health, safety and community.
• Leadership: Our Executive Leadership Team (ELT) is responsible for day-to-day management of the Company and for leading the delivery of our strategic objectives. The Operations Management Committee (OMC) has responsibility for planning, directing and controlling the activities of the Company, including key Company strategic, investment and operational decisions, and recommendations to the Board.
BHP Billiton will continue to disclose financial performance by reportable commodity segments, as this provides the most meaningful insight into the nature and financial outcomes of our business activities within the economic environment in which we operate. Reporting by commodity also facilitates greater comparability against industry peers.
Minerals Australia
Core operated assetsWestern Australia Iron OreQueensland Coal (BMA and BMC)New South Wales Energy Coal Olympic Dam
Additional assetsNickel West
Core operated assetsOnshore USShenziAngosturaPyreneesMacedon
Non-operated assetsAtlantisMad DogBass StraitNorth West Shelf
Core operated assetsEscondidaPampa NorteJansen
Non-operated assetsAntaminaCerrejónSamarco
Additional assetsNew Mexico Coal
Minerals Americas
Functions
Leadership
Petroleum
Marketing

Escondida
Cerrejón
Minerals Americas o�ice
Antamina
Pampa Norte
Corporate o�ice
Jansen
Onshore US
Gulf of Mexico Production Unit
Trinidad and Tobago Production Unit
Samarco
Minerals Americas o�ice
Gulf of Mexico Joint Interest Unit
Petroleum o�ice
New Mexico Coal
9
8
7
28
1812
10
1432
1622
11
33
27 13
Algeria Joint Interest Unit
Corporate o�ice
Pakistan Production Unit
United Kingdom Production Unit
Marketing and corporate o�ice
Global Asset Services Centre
Minerals Australia o�ice
Minerals Australia o�ice
Australia Production Unit
Nickel West
Western Australia Iron Ore
Australia Joint Interest Unit
Olympic Dam
Global headquarters
Minerals Australia o�ice
New South Wales Energy Coal
Australia Joint Interest Unit
BHP Billiton Mitsui Coal
BHP Billiton Mitsubishi Alliance
Australia Production Unit
31
19
17
20
3029
266
21521
24
23
1
45
1521
25
3
BHP Billiton locations
Minerals AustraliaRef Country Asset Description Ownership
1 Australia Olympic Dam Underground copper mine, also producing uranium, gold and silver 100%
2 Australia Western Australia Iron Ore Integrated iron ore mines, rail and port operations in the Pilbara region of Western Australia
51 – 85%
3 Australia New South Wales Energy Coal Open-cut energy coal mine and coal preparation plant in New South Wales 100%
4 Australia BHP Billiton Mitsubishi Alliance Open-cut and underground metallurgical coal mines in the Queensland Bowen Basin and Hay Point Coal Terminal
50%
5 Australia BHP Billiton Mitsui Coal Two open-cut metallurgical coal mines in the Bowen Basin, Central Queensland 80%
6 Australia Nickel West Integrated sulphide mining, concentrating, smelting and refining operation in Western Australia
100%
Minerals AmericasRef Country Asset Description Ownership
7 Chile Escondida Copper producing mine, located in northern Chile 57.5%
8 Chile Pampa Norte Consists of the Cerro Colorado and Spence open-cut mines, producing copper cathode in northern Chile
100%
9 Peru Antamina (1) Open-cut copper and zinc mine in northern Peru 33.8%
10 Brazil Samarco (1) Open-cut iron ore mines, concentrators, pipelines, pelletising facilities and dedicated port
50%
11 US New Mexico Coal (2) One energy coal mine in New Mexico 100%
12 Colombia Cerrejón (1) Open-cut energy coal mine with integrated rail and port operations 33.3%
13 Canada Jansen Our interest in potash is via development projects in the Canadian province of Saskatchewan, where the Jansen Project is our most advanced
100%
PetroleumRef Country Asset Description Ownership
14 US Onshore US Onshore shale liquids and gas fields in Arkansas, Louisiana and Texas <1 – 100%
15 Australia Australia Production Unit Offshore oil fields and gas processing facilities in Western Australia and Victoria
39.99 – 90%
16 US Gulf of Mexico Production Unit Offshore oil and gas fields in the Gulf of Mexico 35 – 44%
17 Pakistan Pakistan Production Unit (3) Onshore oil and gas fields 38.5%
18 Trinidad and Tobago Trinidad and Tobago Production Unit Offshore oil and gas fields 45%
19 UK UK Production Unit (1) Offshore oil and gas fields 16 – 31.83%
20 Algeria Algeria Joint Interest Unit (1) Onshore oil and gas unit 38%
21 Australia Australia Joint Interest Unit (1) Offshore oil and gas fields in Bass Strait and North West Shelf 8.33 – 50%
22 US Gulf of Mexico Joint Interest Unit (1) Offshore oil and gas fields in the Gulf of Mexico 4.95 – 44%
BHP Billiton principal office locationsRef Country Location Office
23 Australia Adelaide Minerals Australia office
24 Australia Brisbane Minerals Australia office
25 Australia Melbourne Global headquarters
26 Australia Perth Minerals Australia office
27 Canada Saskatoon Minerals Americas office
28 Chile Santiago Minerals Americas office
29 Malaysia Kuala Lumpur Global Asset Services Centre
30 Singapore Singapore Marketing and corporate office
31 UK London Corporate office
32 US Houston Petroleum office
33 US New York Corporate office
(1) Non-operated joint venture.(2) Sale of Navajo Mine completed, however BHP Billiton will continue to manage and operate the mine until the Mine Management Agreement ends
on 31 December 2016. (3) Pakistan Production Unit was divested in FY2016.
14 BHP Billiton Annual Report 2016
1 Strategic Report continued
1.5.4 BHP Billiton locations (includes non-operated)

Minerals AustraliaRef Country Asset Description Ownership
1 Australia Olympic Dam Underground copper mine, also producing uranium, gold and silver 100%
2 Australia Western Australia Iron Ore Integrated iron ore mines, rail and port operations in the Pilbara region of Western Australia
51 – 85%
3 Australia New South Wales Energy Coal Open-cut energy coal mine and coal preparation plant in New South Wales 100%
4 Australia BHP Billiton Mitsubishi Alliance Open-cut and underground metallurgical coal mines in the Queensland Bowen Basin and Hay Point Coal Terminal
50%
5 Australia BHP Billiton Mitsui Coal Two open-cut metallurgical coal mines in the Bowen Basin, Central Queensland 80%
6 Australia Nickel West Integrated sulphide mining, concentrating, smelting and refining operation in Western Australia
100%
Minerals AmericasRef Country Asset Description Ownership
7 Chile Escondida Copper producing mine, located in northern Chile 57.5%
8 Chile Pampa Norte Consists of the Cerro Colorado and Spence open-cut mines, producing copper cathode in northern Chile
100%
9 Peru Antamina (1) Open-cut copper and zinc mine in northern Peru 33.8%
10 Brazil Samarco (1) Open-cut iron ore mines, concentrators, pipelines, pelletising facilities and dedicated port
50%
11 US New Mexico Coal (2) One energy coal mine in New Mexico 100%
12 Colombia Cerrejón (1) Open-cut energy coal mine with integrated rail and port operations 33.3%
13 Canada Jansen Our interest in potash is via development projects in the Canadian province of Saskatchewan, where the Jansen Project is our most advanced
100%
PetroleumRef Country Asset Description Ownership
14 US Onshore US Onshore shale liquids and gas fields in Arkansas, Louisiana and Texas <1 – 100%
15 Australia Australia Production Unit Offshore oil fields and gas processing facilities in Western Australia and Victoria
39.99 – 90%
16 US Gulf of Mexico Production Unit Offshore oil and gas fields in the Gulf of Mexico 35 – 44%
17 Pakistan Pakistan Production Unit (3) Onshore oil and gas fields 38.5%
18 Trinidad and Tobago Trinidad and Tobago Production Unit Offshore oil and gas fields 45%
19 UK UK Production Unit (1) Offshore oil and gas fields 16 – 31.83%
20 Algeria Algeria Joint Interest Unit (1) Onshore oil and gas unit 38%
21 Australia Australia Joint Interest Unit (1) Offshore oil and gas fields in Bass Strait and North West Shelf 8.33 – 50%
22 US Gulf of Mexico Joint Interest Unit (1) Offshore oil and gas fields in the Gulf of Mexico 4.95 – 44%
BHP Billiton principal office locationsRef Country Location Office
23 Australia Adelaide Minerals Australia office
24 Australia Brisbane Minerals Australia office
25 Australia Melbourne Global headquarters
26 Australia Perth Minerals Australia office
27 Canada Saskatoon Minerals Americas office
28 Chile Santiago Minerals Americas office
29 Malaysia Kuala Lumpur Global Asset Services Centre
30 Singapore Singapore Marketing and corporate office
31 UK London Corporate office
32 US Houston Petroleum office
33 US New York Corporate office
(1) Non-operated joint venture.(2) Sale of Navajo Mine completed, however BHP Billiton will continue to manage and operate the mine until the Mine Management Agreement ends
on 31 December 2016. (3) Pakistan Production Unit was divested in FY2016.
BHP Billiton Annual Report 2016 15
2 Governance at BH
P Billiton3
Remuneration Report
4 D
irectors’ Report 1
Strategic Report

16 BHP Billiton Annual Report 2016
1 Strategic Report continued
1.6 Company strategy
1.6.1 Our strategy
StrategyOur strategy is to own and operate large, long-life, low-cost, expandable, upstream assets diversified by commodity, geography and market.
We believe our position in the resources industry is unique, largely due to our proven and consistent strategy. The simplicity of our portfolio, the scale and quality of our assets and our standardised systems and processes are all distinctive attributes – further strengthened by our people and operational excellence.
We operate in a dynamic, globally competitive environment. Our strategy has delivered strong performance over time, which has created sustainable value for our shareholders, customers, employees and the communities in which we operate.
ValuesIn everything we do, we are guided by Our BHP Billiton Charter values of Sustainability, Integrity, Respect, Performance, Simplicity and Accountability.
Our overriding commitment is to work to ensure the safety of our people and respect our environment and the communities in which we work. This commitment informs everything we do and influences every aspect of our work.
Success factorsWe are successful when our:• people start each day with a sense of purpose and end
the day with a sense of accomplishment;• teams are inclusive and diverse;• communities, customers and suppliers value their relationships
with us;• asset portfolio is world-class and sustainably developed;• operational discipline and financial strength enables
our future growth; • shareholders receive a superior return on their investment.
BHP Billiton Annual Report 2016 17
2 Governance at BH
P Billiton3
Remuneration Report
4 D
irectors’ Report 1
Strategic Report
1.6.2 Planning We have a robust corporate planning framework that allows us to identify risks and opportunities, inform our strategic priorities and optimise returns to shareholders.
Core principles• Ownership – senior executives develop our strategy and strategic priorities for the input, consideration and ultimately, approval by
the Board.
• Engagement – the Executive Leadership Team (ELT), assets, Marketing and functions regularly collaborate and discuss plans.
• Systematic − The plans of assets, Marketing and functions are aggregated to form an overall integrated corporate plan. − Long-term directional plans are first developed for each asset. Short-term plans are developed from the long-term plans to deliver strategic priorities.
− Plans are reviewed, assessed and endorsed at appraisals of the assets and functions.• Evaluation – our portfolio and plans are regularly tested for resilience under scenarios and signals tracking.
Corporate planning frameworkOur corporate planning framework is rigorous yet flexible, providing the capability to respond and adapt to a dynamic external environment. It ensures strategic insights from across BHP Billiton are captured and considered as part of our investment decisions and capital allocation.
The main components of our corporate planning framework include: • Board Strategy Forum – the Board and the ELT regularly
discuss and debate the Company’s strategy. • Strategic Reviews – assets prepare long-term plans, discuss
them with the ELT and seek their endorsement. • Appraisals – assets and functions prepare short-term plans
and budgets, and review them during annual appraisals with ELT members.
A BHP Billiton 20-year corporate plan is prepared based on input from the assets’ long-term and short-term plans which include various alternatives for capital investments. The planning framework seeks to allocate capital to maximise shareholder value. Our capital allocation process looks at possible combinations of investment options and selects the most valuable combination that also satisfies our capital constraints. The most valuable combination of growth options is prioritised and sequenced over the 20-year plan.
The capital allocation process includes analysis using a range of metrics (1) to inform decision-making. All available growth options are assessed and prioritised to generate a high-value and capital-efficient portfolio.
For more information on our capital allocation framework, refer to section 1.6.3.
(1) Net Present Value (NPV), internal rates of return (IRR), return on capital (ROC) and margin are the main metrics used in analysis during the capital allocation process.
Scenarios and signals trackingOur corporate planning process involves many tools, including scenarios and signals tracking to help us interpret trends in the external environment. Scenarios provide a way to factor uncertainty in to the strategy process, to identify new opportunities and alternatives and to test the robustness of our decisions.
Our set of scenarios is designed to be divergent and contrasting, as well as to consider plausible and intuitively logical, future worlds. Our scenarios do not represent preferred or most likely outcomes for BHP Billiton.
Signals, including signposts (trends) and triggers (events), are regularly tracked to provide timely insights in to the potential impacts on our portfolio. This provides us with a tool to inform decision-making and enables us to act early.

18 BHP Billiton Annual Report 2016
1 Strategic Report continued
1.6.3 Focus areas
Operating sustainably
Sustainability is at the core of Our Charter values. It means putting health and safety first, being environmentally responsible and supporting communities.
We integrate health, safety, environmental, social and economic factors into our decision-making. Our sustainability framework, including risk management and sustainable development, guides our investments in our host countries and local communities, as well as directly at our own operations. The priority for our sustainability framework is identifying and managing material risks – a core part of creating value.
We play an important role in economic development and improving standards of living. As part of making a valuable contribution as community partners, we seek meaningful, long-term relationships that respect local cultures and create lasting benefits.
For more information on sustainability, refer to section 1.11 and our Sustainability Report 2016, which is available at www.bhpbilliton.com.
A more productive organisation
To date, our productivity improvements have delivered significant value, including gains of over US$10 billion secured since 2012. In FY2016, we achieved US$437 million in productivity gains and we expect this strong momentum to continue, with US$2.2 billion of gains targeted over the two years to the end of FY2017.
Future productivity gains over the short to medium term will be achieved through further cost reductions, taking advantage of latent capacity in our assets and investing in capital efficient projects.
Our productivity initiatives are expected to result in production growth of five per cent in copper, four per cent in iron ore and three per cent in metallurgical coal in FY2017.
In addition, our new Operating Model provides a further productivity opportunity across the Company. We now have a simplified, global structure and streamlined ways of working that will enable us to realise economies of scale, remove duplication, facilitate greater coordination and replicate best practice faster.
The new model incorporates an integrated technology function to provide operational and information technology services, as well as lead technology innovation across the organisation and support productivity initiatives.
For more information on our new Operating Model, refer to section 1.5.3.
We maintain a strong focus on the following strategic priorities to execute our strategy. A number of these are monitored using the key performance indicators as presented in section 1.7.

BHP Billiton Annual Report 2016 19
2 Governance at BH
P Billiton3
Remuneration Report
4 D
irectors’ Report 1
Strategic Report
Disciplined capital management
Our strong balance sheet remains a fundamental enabler of our strategy. It provides access to sufficient, low-cost funding at all points in the cycle, which offers optionality and helps to insulate our operations from rising volatility. Our balance sheet strength is demonstrated by our solid cash flow to net debt metrics (reflected in our credit ratings), liquidity, moderate gearing and long-dated debt maturity profile.
We continue to implement measures to both preserve this balance sheet strength and align our capital allocation framework with our industry’s cyclical nature.
Our capital allocation framework sets clear parameters. Capital is allocated under the following hierarchy:• maintain capital to support safe and stable operations; • maintain balance sheet strength to provide protection through the cycle; • pay shareholders a minimum of 50 per cent of Underlying attributable profit as dividends; • direct remaining cash to the value-optimising outcome, with debt reduction, paying
additional amounts by way of dividend, buying back shares, investing in growth projects and acquiring assets all competing for capital.
This capital allocation framework is simple and by strict adherence to the framework, we can balance value creation, cash returns to shareholders and balance sheet strength in a transparent and consistent manner through the cycle.
Our approach to capital allocation is illustrated in the diagram below.
Optimise returns and value
Maximise cash flow
Excess free cash flow
Operating productivity Capital productivity
Maintenance capital
Strong balance sheet
Minimum pay-out dividend
Debt reduction Additional dividend amount
Buy-backs Organic growth Acquisitions
$
Capital allocation framework
For more information on our dividend policy, refer to section 7.7.
1.6.3 Focus areas continued
20 BHP Billiton Annual Report 2016
Contributions to BHP Billitonsupported charitiesCash expenditures (1)
300
FY20
12
250
200
150
100
50
0
FY20
13
FY20
14
FY20
15
FY20
16
US$ million
Socialinvestment (1)
55
123.7
83
Adjustment to allow annual comparison (2)
6.7
11.3
17.64.1
FY2006 baseline (5)Scope 1 (4) Scope 2 (3)
60
50
FY20
12
40
30
20
10
0
FY20
13
FY20
14
FY20
15
FY20
16
Millions of tonnes CO2-e
GHG emissions (1) (6)
8.0
FY20
12
6.0
4.0
2.0
0
FY20
13
FY20
14
FY20
15
FY20
16
Per million hours worked
Total recordable injury frequency (TRIF) (1) (2)
4.3
20
15
FY20
12
10
5
0
FY20
13
FY20
14
FY20
15
FY20
16
US$ billion
Underlying attributable profit (1)
1.2
1 Strategic Report continued
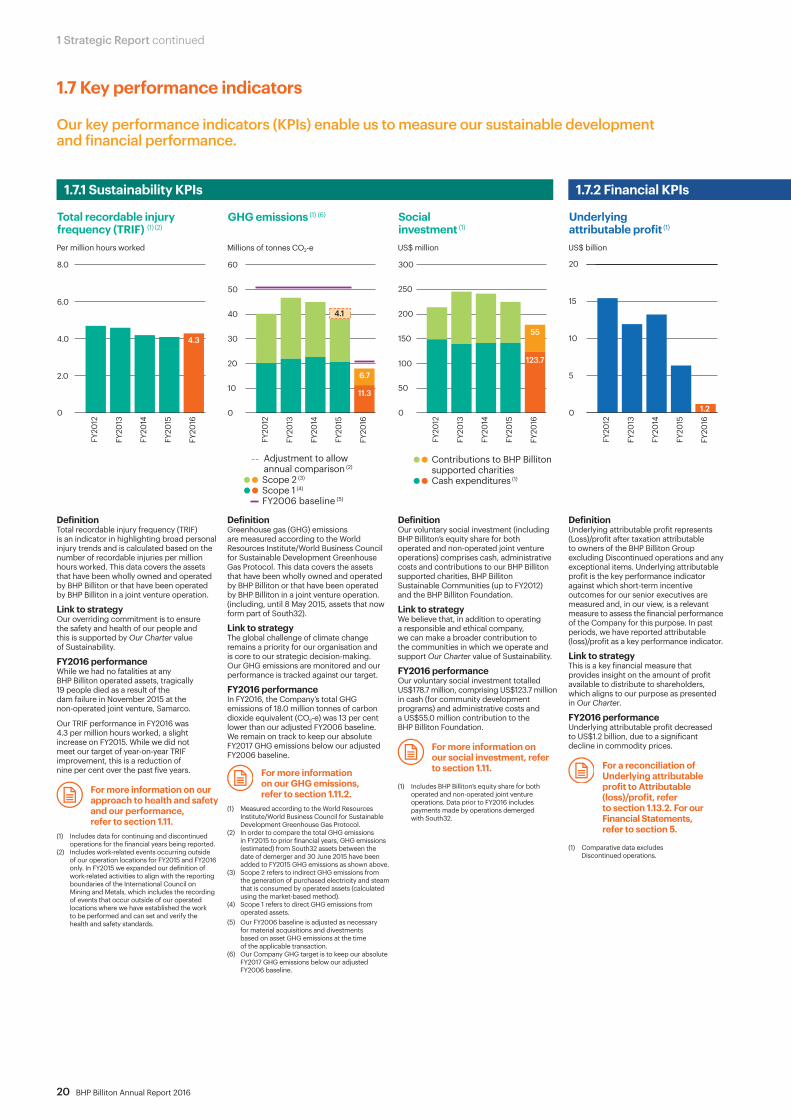
1.7 Key performance indicators
Our key performance indicators (KPIs) enable us to measure our sustainable development and financial performance.
1.7.1 Sustainability KPIs 1.7.2 Financial KPIs
DefinitionTotal recordable injury frequency (TRIF) is an indicator in highlighting broad personal injury trends and is calculated based on the number of recordable injuries per million hours worked. This data covers the assets that have been wholly owned and operated by BHP Billiton or that have been operated by BHP Billiton in a joint venture operation.
Link to strategyOur overriding commitment is to ensure the safety and health of our people and this is supported by Our Charter value of Sustainability.
FY2016 performanceWhile we had no fatalities at any BHP Billiton operated assets, tragically 19 people died as a result of the dam failure in November 2015 at the non-operated joint venture, Samarco.
Our TRIF performance in FY2016 was 4.3 per million hours worked, a slight increase on FY2015. While we did not meet our target of year-on-year TRIF improvement, this is a reduction of nine per cent over the past five years.
For more information on our approach to health and safety and our performance, refer to section 1.11.
(1) Includes data for continuing and discontinued operations for the financial years being reported.
(2) Includes work-related events occurring outside of our operation locations for FY2015 and FY2016 only. In FY2015 we expanded our definition of work-related activities to align with the reporting boundaries of the International Council on Mining and Metals, which includes the recording of events that occur outside of our operated locations where we have established the work to be performed and can set and verify the health and safety standards.
DefinitionGreenhouse gas (GHG) emissions are measured according to the World Resources Institute/World Business Council for Sustainable Development Greenhouse Gas Protocol. This data covers the assets that have been wholly owned and operated by BHP Billiton or that have been operated by BHP Billiton in a joint venture operation. (including, until 8 May 2015, assets that now form part of South32).
Link to strategyThe global challenge of climate change remains a priority for our organisation and is core to our strategic decision-making. Our GHG emissions are monitored and our performance is tracked against our target.
FY2016 performanceIn FY2016, the Company’s total GHG emissions of 18.0 million tonnes of carbon dioxide equivalent (CO2-e) was 13 per cent lower than our adjusted FY2006 baseline. We remain on track to keep our absolute FY2017 GHG emissions below our adjusted FY2006 baseline.
For more information on our GHG emissions, refer to section 1.11.2.
(1) Measured according to the World Resources Institute/World Business Council for Sustainable Development Greenhouse Gas Protocol.
(2) In order to compare the total GHG emissions in FY2015 to prior financial years, GHG emissions (estimated) from South32 assets between the date of demerger and 30 June 2015 have been added to FY2015 GHG emissions as shown above.
(3) Scope 2 refers to indirect GHG emissions from the generation of purchased electricity and steam that is consumed by operated assets (calculated using the market-based method).
(4) Scope 1 refers to direct GHG emissions from operated assets.
(5) Our FY2006 baseline is adjusted as necessary for material acquisitions and divestments based on asset GHG emissions at the time of the applicable transaction.
(6) Our Company GHG target is to keep our absolute FY2017 GHG emissions below our adjusted FY2006 baseline.
DefinitionOur voluntary social investment (including BHP Billiton’s equity share for both operated and non-operated joint venture operations) comprises cash, administrative costs and contributions to our BHP Billiton supported charities, BHP Billiton Sustainable Communities (up to FY2012) and the BHP Billiton Foundation.
Link to strategyWe believe that, in addition to operating a responsible and ethical company, we can make a broader contribution to the communities in which we operate and support Our Charter value of Sustainability.
FY2016 performanceOur voluntary social investment totalled US$178.7 million, comprising US$123.7 million in cash (for community development programs) and administrative costs and a US$55.0 million contribution to the BHP Billiton Foundation.
For more information on our social investment, refer to section 1.11.
(1) Includes BHP Billiton’s equity share for both operated and non-operated joint venture operations. Data prior to FY2016 includes payments made by operations demerged with South32.
DefinitionUnderlying attributable profit represents (Loss)/profit after taxation attributable to owners of the BHP Billiton Group excluding Discontinued operations and any exceptional items. Underlying attributable profit is the key performance indicator against which short-term incentive outcomes for our senior executives are measured and, in our view, is a relevant measure to assess the financial performance of the Company for this purpose. In past periods, we have reported attributable (loss)/profit as a key performance indicator.
Link to strategyThis is a key financial measure that provides insight on the amount of profit available to distribute to shareholders, which aligns to our purpose as presented in Our Charter.
FY2016 performanceUnderlying attributable profit decreased to US$1.2 billion, due to a significant decline in commodity prices.
For a reconciliation of Underlying attributable profit to Attributable (loss)/profit, refer to section 1.13.2. For our Financial Statements, refer to section 5.
(1) Comparative data excludes Discontinued operations.
BHP Billiton Annual Report 2016 21
FY20
12
FY20
13
FY20
14
FY20
15
FY20
16
US$ billion
30
25
20
15
10
5
0
Net operating cash flows (1)
10.6
35
FY20
12
30
25
20
15
10
5
0
FY20
13
FY20
14
FY20
15
FY20
16
US$ billion
Underlying EBITDA (1)
12.3
FY20
12
FY20
13
FY20
14
FY20
15
FY20
16
% change from previous year (3-month average)
15
10
5
0
-5
-10
-15
-20
-40
-35
-30
-25
Total shareholder return (TSR)
(36.8)
Long-termcredit rating
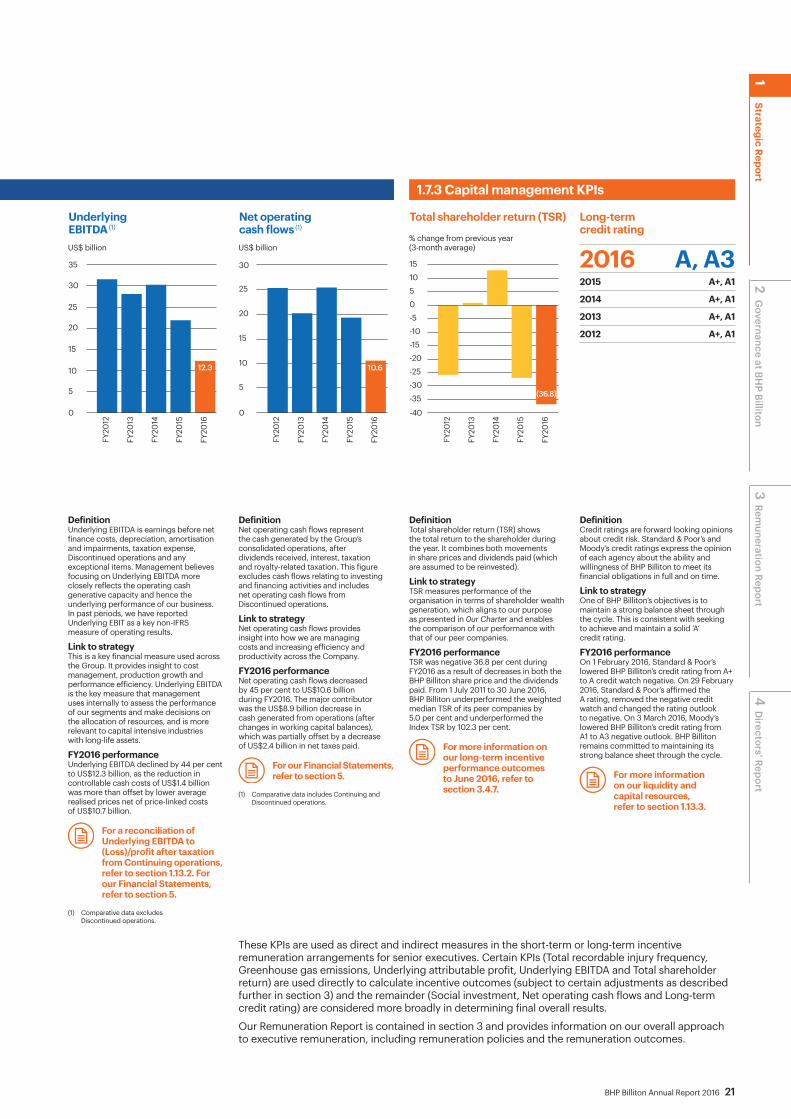
1.7.2 Financial KPIs 1.7.3 Capital management KPIs
DefinitionUnderlying EBITDA is earnings before net finance costs, depreciation, amortisation and impairments, taxation expense, Discontinued operations and any exceptional items. Management believes focusing on Underlying EBITDA more closely reflects the operating cash generative capacity and hence the underlying performance of our business. In past periods, we have reported Underlying EBIT as a key non-IFRS measure of operating results.
Link to strategyThis is a key financial measure used across the Group. It provides insight to cost management, production growth and performance efficiency. Underlying EBITDA is the key measure that management uses internally to assess the performance of our segments and make decisions on the allocation of resources, and is more relevant to capital intensive industries with long-life assets.
FY2016 performanceUnderlying EBITDA declined by 44 per cent to US$12.3 billion, as the reduction in controllable cash costs of US$1.4 billion was more than offset by lower average realised prices net of price-linked costs of US$10.7 billion.
For a reconciliation of Underlying EBITDA to (Loss)/profit after taxation from Continuing operations, refer to section 1.13.2. For our Financial Statements, refer to section 5.
(1) Comparative data excludes Discontinued operations.
DefinitionNet operating cash flows represent the cash generated by the Group’s consolidated operations, after dividends received, interest, taxation and royalty-related taxation. This figure excludes cash flows relating to investing and financing activities and includes net operating cash flows from Discontinued operations.
Link to strategyNet operating cash flows provides insight into how we are managing costs and increasing efficiency and productivity across the Company.
FY2016 performanceNet operating cash flows decreased by 45 per cent to US$10.6 billion during FY2016. The major contributor was the US$8.9 billion decrease in cash generated from operations (after changes in working capital balances), which was partially offset by a decrease of US$2.4 billion in net taxes paid.
For our Financial Statements, refer to section 5.
(1) Comparative data includes Continuing and Discontinued operations.
DefinitionTotal shareholder return (TSR) shows the total return to the shareholder during the year. It combines both movements in share prices and dividends paid (which are assumed to be reinvested).
Link to strategyTSR measures performance of the organisation in terms of shareholder wealth generation, which aligns to our purpose as presented in 0ur Charter and enables the comparison of our performance with that of our peer companies.
FY2016 performanceTSR was negative 36.8 per cent during FY2016 as a result of decreases in both the BHP Billiton share price and the dividends paid. From 1 July 2011 to 30 June 2016, BHP Billiton underperformed the weighted median TSR of its peer companies by 5.0 per cent and underperformed the Index TSR by 102.3 per cent.
For more information on our long-term incentive performance outcomes to June 2016, refer to section 3.4.7.
DefinitionCredit ratings are forward looking opinions about credit risk. Standard & Poor’s and Moody’s credit ratings express the opinion of each agency about the ability and willingness of BHP Billiton to meet its financial obligations in full and on time.
Link to strategyOne of BHP Billiton’s objectives is to maintain a strong balance sheet through the cycle. This is consistent with seeking to achieve and maintain a solid ‘A’ credit rating.
FY2016 performanceOn 1 February 2016, Standard & Poor’s lowered BHP Billiton’s credit rating from A+ to A credit watch negative. On 29 February 2016, Standard & Poor’s affirmed the A rating, removed the negative credit watch and changed the rating outlook to negative. On 3 March 2016, Moody’s lowered BHP Billiton’s credit rating from A1 to A3 negative outlook. BHP Billiton remains committed to maintaining its strong balance sheet through the cycle.
For more information on our liquidity and capital resources, refer to section 1.13.3.
2016 A, A32015 A+, A1
2014 A+, A1
2013 A+, A1
2012 A+, A1
These KPIs are used as direct and indirect measures in the short-term or long-term incentive remuneration arrangements for senior executives. Certain KPIs (Total recordable injury frequency, Greenhouse gas emissions, Underlying attributable profit, Underlying EBITDA and Total shareholder return) are used directly to calculate incentive outcomes (subject to certain adjustments as described further in section 3) and the remainder (Social investment, Net operating cash flows and Long-term credit rating) are considered more broadly in determining final overall results.
Our Remuneration Report is contained in section 3 and provides information on our overall approach to executive remuneration, including remuneration policies and the remuneration outcomes.
2 Governance at BH
P Billiton3
Remuneration Report
4 D
irectors’ Report 1
Strategic Report

22 BHP Billiton Annual Report 2016
1 Strategic Report continued
Global energy needs are expected to increase by around 30 per cent in the next 20 years.
As one of the world’s leading global resources companies, with a strong portfolio of high-quality growth opportunities, BHP Billiton is well placed to support changes across the globe through the provision of the mineral and energy commodities essential to modern life and sustainable global growth and development.
Through our diversified portfolio, we are able to meet the changing needs of our customers and the resources demand of emerging economies at every stage of their growth. We think and plan in decades and generations.
The products in our portfolio are the raw materials that are used to fuel change and support an improvement in living standards for people in many parts of the world.
Today, short-term demand for commodities has slowed. Global markets are experiencing economic uncertainty, extreme volatility and geopolitical instability on top of already well supplied markets. The speed, quantum and synchronised nature of those declines have been greater than anticipated. However, we did foresee some of these trends and took a series of early actions that have prepared us well for the current low price commodity environment.
We expect the longer-term outlook for the resources we produce to improve in many parts of the world. Global energy needs are expected to increase by around 30 per cent in the next 20 years. Around two-thirds of new demand is expected to originate from Asia, with the majority from China and India. Sub-Saharan Africa is expected to see the fastest growth, albeit from a lower base.
Responding to climate change is a priority for our Company. We accept the scientific assessment by the Intergovernmental Panel on Climate Change (IPCC). BHP Billiton believes that sustainable development requires both the continued growth of emerging economies and a significant reduction in global greenhouse gas emissions.
1.8 Our operating environment
Economic, social, technological and environmental forces are creating transformational change across the globe, creating opportunities for development and innovation at an unprecedented rate.
We believe the world must pursue the twin objectives of limiting climate change to the lower end of the IPCC emission scenarios in line with current international agreements, and providing access to reliable and affordable energy to support economic development and improved living standards.
Fossil fuels are likely to continue to be a significant part of the energy mix for decades, but technology and innovation have the potential to significantly reduce global emissions and enable long-term climate goals to be met. Renewables are anticipated to become more competitive with traditional fuels in power generation, leading to a considerable increase in their share of newly installed electricity capacity, including in China and India.
The products in our portfolio are the raw materials that are used to fuel change and support an improvement in living standards for people in many parts of the world.
Our strategic approach to climate change is underpinned by engagement with policy makers and other stakeholders, including investors, companies and non-government organisations.
For more information on climate change, refer to section 1.11.2.
A number of external factors and trends may continue to have a material impact on our financial and operational results. These factors include commodity prices, exchange rates and operating costs, as described in sections 1.8.1, 1.9.2 and 1.13.
BHP Billiton Annual Report 2016 23
1.8.1 Market factors and trendsEconomic outlookIn FY2016, the global economy grew at a modest rate of 3.1 per cent. This was consistent with our forecast and the range of recent history. In the United States, growth was a relative bright spot, while Eurozone growth improved only modestly. In Asia, the Japanese economy was soft and China decelerated modestly, while the Indian growth remained healthy. Non-Asian emerging markets continue to struggle. Global trade has returned to growth after contracting in FY2015, but the lift has been small. The UK referendum result (Brexit) adds considerable uncertainty into the short- and medium-term outlook.
China Growth slowed modestly while the process of rebalancing continued. The services sector and consumer demand provided the largest contribution to growth. At the same time, production in bulk commodity-intensive sectors, including steel, was soft. Chinese steel production decreased by 2.1 per cent during FY2016, despite higher steel exports.
The deceleration in growth was moderated by policies that targeted infrastructure and real estate spending. We expect both the monetary and fiscal policy stance to remain accommodative. We forecast the authorities’ growth target of 6.5–7 per cent for CY2016 will be achieved, as policy makers continue to seek a balance between reforms and employment objectives.
Over the medium term, the economy is likely to grow more slowly. The government’s reform program will focus on promoting more efficient use of resources and boost productivity to partly offset the impact of declines in the workforce and the maturation of the underlying economic structure.
In the longer run, we expect reform will continue to occur in a cautious but sustained manner. China’s authorities will continue to seek to improve the efficiency of capital allocation in the economy, while boosting the role of consumer demand through raising the household share of income and lowering precautionary savings. With Chinese steel stock per capita still below that of developed nations, we expect moderate but sustainable growth in Chinese steel production over the next decade.
Eurozone The Eurozone economy continues to see modest broad-based economic growth. Consumer demand has been the primary driver, supported by improved labour market conditions. However, despite more positive conditions in the real economy, the European Central Bank remains concerned about very low inflation expectations. Consequently, we expect monetary policy will remain strongly expansionary. The uncertainty and market volatility associated with the Brexit decision is expected to impact on business and household sector confidence in both the United Kingdom and continental Europe.
Japan Despite significant additional monetary stimulus during the year, economic growth has remained soft. A sharp appreciation of the exchange rate did not support the Japanese industry. Domestically, consumer demand remains soft, reflecting flat wages and the ageing population. Reform remains critical to long-term growth prospects.
United States The fundamentals remain positive in the United States, particularly for consumer demand. Importantly, the labour market remains strong, and there are signs of improving disposable incomes. These factors, alongside low interest rates and higher household wealth (reflecting improved housing prices), should continue to support consumer spending. However, business investment remains relatively soft as a result of weak export demand and a stronger US dollar. This mixed picture suggests the Federal Reserve will be cautious in its monetary policy deliberations.
Global long-term outlookWe expect ongoing increases in global living standards over the longer term, with urbanisation, industrialisation and pro-trade liberalisation to underpin commodity demand. The development trajectory of emerging economies in Asia should provide particular support for industrial metals, energy and fertilisers.
2 Governance at BH
P Billiton3
Remuneration Report
4 D
irectors’ Report 1
Strategic Report

24 BHP Billiton Annual Report 2016
1 Strategic Report continued
1.8.1 Market factors and trends continuedCommodity performance and outlookGlobal economic growth in FY2016 was little changed from FY2015. However, average year prices for all our commodities were lower compared to FY2015, reflecting ample supply and widespread cost compression. The low point for price was reached for most commodities in the March 2016 quarter.
The following table shows the prices for our most significant commodities for the years ended 30 June 2016, 2015 and 2014. These prices represent selected quoted prices from the relevant sources as indicated and will differ from the realised prices due to differences in quotation periods, quality of products, delivery terms and the range of quoted prices that are used for contracting sales in different markets.
Year ended 30 June 2016
Closing2015
Closing2014
Closing2016
Average2015
Average2014
Average2016 vs 2015
Average
Natural gas Henry Hub (1) (US$/MMBtu) 2.93 2.81 4.39 2.23 3.32 4.25 (33%)Natural gas Asian Spot LNG (2) (US$/MMBtu) 5.23 7.30 11.28 6.09 9.74 16.38 (37%)Crude oil (Brent) (3) (US$/bbl) 48.44 61.05 111.02 43.19 73.91 109.36 (42%)Ethane (4) (US$/bbl) 9.74 8.40 12.02 7.65 8.56 11.92 (11%)Propane (5) (US$/bbl) 21.71 16.25 44.47 17.87 29.34 48.05 (39%)Butane (6) (US$/bbl) 28.88 23.89 54.39 24.18 36.89 56.70 (34%)Copper (LME cash) (US$/lb) 2.19 2.60 3.15 2.22 2.89 3.18 (23%)Iron ore (7) (US$/dmt) 55.0 59.5 93.25 51.37 71.61 122.70 (28%)Metallurgical coal (8) (US$/t) 91.5 88.0 110.50 81.6 102.9 128.4 (21%)Energy coal (9) (US$/t) 56.49 61.66 70.89 53.42 64.37 78.38 (17%)Nickel (LME cash) (US$/lb) 4.27 5.30 8.49 4.24 7.02 6.88 (40%)
(1) Platts Gas based on Henry Hub – typically applies to gas sales in the US gas market.(2) Platts Liquefied Natural Gas Delivery Ex-Ship (DES) Japan/Korea Marker – typically applies to Asian LNG spot sales.(3) Platts Dated Brent is a benchmark price assessment of the spot market value of physical cargoes of North Sea light sweet crude oil. (4) OPIS Mont Belvieu non-Tet Ethane – typically applies to ethane sales in the US Gulf Coast market. (5) OPIS Mont Belvieu non-Tet Propane – typically applies to propane sales in the US Gulf Coast market. (6) OPIS Mont Belvieu non-Tet Normal Butane – typically applies to butane sales in the US Gulf Coast market. (7) Platts 62 per cent Fe Cost and Freight (CFR) China – used for fines.(8) Platts Low-Vol hard coking coal Index FOB Australia – representative of high-quality hard coking coals. (9) GlobalCoal FOB Newcastle 6,000kcal/kg NCV – typically applies to coal sales in the Asia Pacific market.
The prices we obtain for our products are a key driver of value for our business. Fluctuations in these commodity prices affect our results, including cash flows and asset values. The estimated impact of changes in commodity prices on FY2016 Underlying EBITDA are set out below.
US$M
US$1/bbl on oil price 88
US¢10/MMBtu on US gas price 37
US¢1/lb on copper price 32
US$1/t on iron ore price 201
US$1/t on metallurgical coal price 34
US$1/t on energy coal price 16
US¢1/lb on nickel price 1
Henry Hub gas Liquefied natural gas
Despite continued demand growth for gas, inventories increased to record levels on strong production and reduced heating demand due to the mild 2015/2016 winter weather across North America. Natural gas inventories at the end of FY2016 were 3,140 billion cubic feet (Bcf) (week ending 24 June), which was 25 per cent (or 637 Bcf) above the five-year average and 23 per cent (or 582 Bcf) higher year-on-year. In the near term, high inventory levels will continue to weigh on the market. In the longer term, due to inherent environmental, operational and economic advantages of gas for power generation, heating and industrial applications, we continue to expect robust natural gas demand growth. While continued investment in new supply sources will be required to replace natural field decline, abundant lower-cost supply will moderate price inflation.
Demand was subdued due to mild winter weather in northern Asia, while supply grew strongly as new liquefied natural gas (LNG) projects in Australia and the United States were commissioned. The year-end price was 14 per cent below the average for the year. We believe new supply will continue to weigh on the market in the near term. Longer-term, as overall demand for energy rises and indigenous supplies deplete, a positive outlook for LNG is supported by growing demand from Asia and Europe.

BHP Billiton Annual Report 2016 25
Crude oil Copper
Global crude supply outpaced demand during FY2016. During January 2016, prices dropped to their lowest level since CY2003 due to OPEC supply growth, resilient US production, record high inventories and a strong US dollar. However, during the June 2016 quarter, the oil market began to recover on signs of rebalancing. Declining US production, unplanned supply outages and strong non-OECD demand growth contributed to a shift in market sentiment despite persistent volatility. Although the market has begun to rebalance, we expect prices in the short term to be within an established range, due to record inventory levels. We believe the long-term outlook remains healthy, with new supply required to meet growing demand in developing countries and offset natural field decline.
The copper price trended lower during the first six months of FY2016 before reaching a six-year low in mid-January. Over the first half of FY2016, the price was impacted by weaker than expected copper consumption, industry cost compression, US dollar strength and negative sentiment on the outlook of the Chinese economy. The price subsequently increased during February to April as sentiment on China improved and the US dollar weakened, but it eventually closed the year lower as supply growth outpaced consumption. In the near term, new supply under development is expected to continue to keep steady demand growth well covered. In the medium to long term, the trend remains positive: China’s future demand will be fuelled by an increasingly consumption-based economy and will be supported by continued growth in other emerging markets. A deficit is expected to emerge as grade declines, a rise in costs and a scarcity of high-quality future development opportunities are likely to constrain the industry’s ability to cheaply meet this demand growth.
Iron ore Metallurgical coal
The iron ore price decrease was driven by lower pig iron production in China and an increase in low-cost seaborne supply. Domestic Chinese iron ore production at private mines recovered to 35 per cent of capacity late in the financial year from February lows of 28 per cent, due to higher prices and seasonality. This is still below its CY2015 average of 38 per cent of capacity. Additional price pressure came from productivity gains and input price deflation, which lowered the industry’s cost structure. The short-term outlook appears stable, with most of the incremental seaborne supply forecast to enter the market in the second half of this calendar year and in CY2017, although demand growth is expected to remain modest. In the medium and longer term, seaborne supply is expected to gain momentum as new projects ramp-up and production increases from productivity and de-bottlenecking translate into a further flattening of the cost curve.
Uneconomic high-cost supply continued to be slowly withdrawn from the seaborne market. However, prices remained subdued as industry-wide cost reductions and weaker producer currencies against the US dollar supported continued production from marginal suppliers. Prices are expected to moderate in the short term as committed growth projects ramp-up production and demand growth remains modest. The key uncertainty for the seaborne market is how China’s domestic supply will respond to government capacity controls, which have the potential to impact seaborne demand. The long-term outlook remains robust, as the supply of premium hard coking coal becomes scarce and demand is driven by steel production growth in emerging markets, particularly India.
Energy coal Nickel
The Global Coal Newcastle price decrease was driven by weak Chinese seaborne demand growth, offsetting healthy growth from Japan, South Korea, Taiwan and South East Asia. Sustained supply from Australia and Indonesia was supported by depreciating currencies, which prolonged the weak pricing environment. In the short term, weaker Chinese imports are likely to continue and this limits prospects for near-term price recovery. In the long term, global demand for energy coal is expected to grow modestly, with Indian and South East Asian demand offsetting declining demand from OECD countries.
The fall in nickel price was due to weak demand growth, driven by a slowdown in global stainless steel production and ample nickel inventories as a result of high levels of supply. A significant fraction of nickel production had operating costs above current price levels, with some supply being withdrawn from the market and hereby providing support to the price. Demand growth is expected to improve. In the medium term, excess nickel stocks will decline closer to historic levels, which should lead to a recovery in price.
1.8.1 Market factors and trends continued
Exchange ratesWe are exposed to exchange rate transaction risk on foreign currency sales and purchases. Operating costs and costs of locally sourced equipment are influenced by fluctuations in local currencies, primarily the Australian dollar and Chilean peso. The majority of our sales are denominated in US dollars and we borrow and hold surplus cash predominately in US dollars. Those transactions and balances provide no foreign exchange exposure relative to the US dollar functional currency of the Company.
The US dollar strengthened against our main local currencies during FY2016.
We are also exposed to exchange rate translation risk in relation to net monetary liabilities, being our foreign currency denominated monetary assets and liabilities, including certain debt and other
long-term liabilities. Details of our exposure to foreign currency fluctuations are contained within note 21 ‘Financial risk management’ to the Financial Statements.
Interest ratesWe are exposed to interest rate risk on our outstanding borrowings and investments. Our policy on interest rate exposure is to pay on a US dollar floating interest rate basis.
Our earnings are sensitive to changes in interest rates on the floating component of the Company’s borrowings. Our main exposure is to the three-month US LIBOR benchmark, which increased by 0.243 per cent in FY2016 to an average of 0.495 per cent.
For more information, refer to note 21 ‘Financial risk management’ to the Financial Statements.
2 Governance at BH
P Billiton3
Remuneration Report
4 D
irectors’ Report 1
Strategic Report
26 BHP Billiton Annual Report 2016
1 Strategic Report continued
1.8.2 Other factors and trendsExploration of resourcesMinerals explorationWe have secured growth opportunities via brownfield exploration around our portfolio of existing assets, principally aimed at delineating and categorising mineral deposits in resource basins near our existing operations, while advancing projects through the development pipeline, primarily in copper.
For a description of our major projects, refer to section 6.4.
This has enabled us to reduce brownfield exploration expenditure and to rationalise our greenfield exploration program.
Greenfield exploration is now focused on advancing copper targets within Chile, Peru, southwestern United States and Canada. Our activities include opportunity identification, mineral title applications and acquisitions, early reconnaissance operations and multi-million dollar delineation drilling programs.
Our brownfield minerals exploration expenditure declined by 40 per cent in FY2016 to US$116 million, while our greenfield expenditures increased slightly to US$59 million. Expenditure on minerals exploration over the last three financial years is set out below.
Year ended 30 June2016
US$M2015
US$M2014
US$M
Greenfield exploration 59 55 46Brownfield exploration 116 194 340
Total minerals exploration 175 249 386
Petroleum explorationPetroleum exploration is focused on high-impact liquids opportunities in the Gulf of Mexico, Western Australia and Trinidad and Tobago.
Year ended 30 June2016
US$M2015
US$M2014
US$M
Petroleum exploration 590 567 600
Exploration expenseExploration expense represents that portion of exploration expenditure that is not capitalised in accordance with our accounting policies, as set out in note 10 ‘Property, plant and equipment’ to the Financial Statements.
Exploration expense for each segment over the last three financial years is set out below.
Year ended 30 June
2016US$M
2015US$M
Restated
2014US$M
Restated
Exploration expense (1)Petroleum (2) 288 529 497Copper 64 90 111Iron Ore 74 38 56Coal 18 20 29Group and unallocated items (2) 1 21 77
BHP Billiton Group 445 698 770
(1) Includes US$15 million (FY2015: US$28 million; FY2014: US$72 million) exploration expense previously capitalised, written off as impaired.
(2) Group and unallocated items includes functions, other unallocated operations, including Potash (previously disclosed in the former Petroleum and Potash reportable segment), Nickel West and consolidation adjustments. Comparative information for FY2015 and FY2014 have been restated for the effects of the change in the reporting related to Potash.
Health, safety, environment and communityMany of our activities are highly regulated by laws and regulations relating to health, safety, environment and community impacts. We are committed to complying with the laws and regulations of the countries in which we operate and, where applicable, to exceeding legal and other requirements that are less stringent than our own. However, our governance and compliance processes may not guarantee compliance with legal or regulatory requirements and regulatory standards and community expectations are constantly developing. As a result, we may be exposed to increased regulatory review, litigation, compliance costs and unforeseen environmental rehabilitation expenses and loss of reputation, despite our best efforts to work with governments, community groups, scientists and other interest groups to keep pace with regulations, law and public expectations.
For more information on our approach to climate change, refer to sections 1.9.3 and 1.11.2.
For more information about our compliance with health, safety, environment and community (HSEC) regulations, refer to section 1.11.
InsuranceBHP Billiton maintains an insurance program covering property damage, business interruption, sabotage and terrorism, marine and aviation, construction, employee benefits, directors’ and officers’ liability and public and certain other liabilities. The program includes a combination of self-insurance via subsidiary captive insurance companies, industry mutuals and external market insurance and reinsurance. Required standards are established and applied for risk retention levels, policy cover and, where applicable, insurance and reinsurance counterparty security.
In line with our risk financing (insurance) approach to minimise or not to purchase external insurance, we are largely self-insured for losses arising from various risks including property damage and business interruption, sabotage and terrorism, marine cargo, construction, primary public liability and employee benefits. We internally insure our operations for these risks (for wholly owned assets and, where possible, by local insurance regulation and appropriate commercial market terms, our share of joint venture assets) via our captive insurance companies. Any such losses incurred will consequently impact the Financial Statements as they arise.
As part of our portfolio risk management approach, we regularly conduct an assessment of maximum foreseeable loss potential, cash flow at risk, loss experience, claims received and insurance premiums paid. We make adjustments to the balance of self-insurance, external insurance and reinsurance, as required.
BHP Billiton Annual Report 2016 27
2 Governance at BH
P Billiton3
Remuneration Report
4 D
irectors’ Report 1
Strategic Report
1.9 Management of risk1.9.1 Approach to risk managementIdentifying and managing risk is central to achieving our corporate purpose of creating long-term shareholder value.
If realised, risks have the potential to impact our health, safety, environment, community, regulatory, market and financial performance, as well as our reputation, and thereby the achievement of our corporate purpose. Successful risk management can be a source of competitive advantage.
We provide greater certainty and confidence for our stakeholders by understanding and managing risk.
BHP Billiton’s risks are viewed and managed on a Company-wide basis. Our diversified portfolio of commodities, geographies, currencies, assets and liabilities is a key part of our risk management approach.
We embed risk management in our critical business activities, functions, processes and systems. Materiality and risk tolerance are key considerations in our decision-making.
We seek to identify, analyse and assess risk issues. We implement the following performance requirements for material risks that could threaten our corporate purpose or strategy: • Risk assessments – we identify, analyse (including likelihood
and impact assessment), evaluate, treat and monitor risks. • Risk controls – we design, implement, operate and assess
controls to determine control effectiveness. We establish performance standards for critical controls over material risks with supporting verification processes.
• Risk materiality and tolerability evaluation – we assess the materiality of the risk based on the degree of financial and non-financial impacts, including health, safety, environment, community, reputation and legal impacts. Tolerability assessment is based on a combination of residual risk and control effectiveness.
We apply established processes when entering or commencing new activities in high-risk countries. These include risk assessments and supporting risk management plans to ensure potential reputation, legal, business conduct and corruption-related exposures are managed and legislative compliance is maintained, including relevant anti-corruption legislation and the application of any relevant sanctions or trade embargoes.
For information on our risk management governance approach, refer to sections 2.13.1 and 2.14.
Robust risk assessment and viability statementIn accordance with the UK Corporate Governance Code, the Board confirms that it has carried out a robust assessment of the Company’s principal risks, including those that would threaten the business model, future performance, solvency or liquidity.
In accordance with the UK Corporate Governance Code (longer-term viability), the Directors have assessed the prospects of the Company over the next three years, taking account of the Company’s current position and principal risks.
The Directors believe a three-year viability assessment period is appropriate for the following reasons. BHP Billiton has a two-year budget, a five-year outlook and a 20-year strategic planning horizon. The extent and synchronised nature of the decline in commodity prices experienced in FY2016 were stronger than anticipated, and the Company has publicly stated our view that the outlook for the sector remains challenging and volatile in the short to medium term. A significant proportion of the variability in plans and budgets for the Company is influenced by exchange rate volatility and price volatility. A three-year period was therefore seen as striking an appropriate balance.
The Directors’ assessment took into account, among other things, the Company’s commodity price protocols including low-case prices; the latest funding and liquidity update; the long-dated maturity profile of the Company’s debt and the maximum debt maturing in any one year; the Company-level risk profile and the mitigating actions available should particular risks materialise; the annual Board strategy forum, which provides a strategic review of the Company’s markets and plans under divergent scenarios and considers available strategic options; the flexibility in the Company’s capital and exploration expenditure programs under the enhanced capital allocation framework; and the reserve life of the Company’s minerals assets and the reserves-to-production life of its oil and gas assets.
The Directors’ assessment also took account of additional stress-testing of the balance sheet against two significant risk events: a shipping blockage of the Port Hedland Channel that could disrupt export of iron ore and a short-term extreme hypothetical event that catches the global resource industry off-guard, causing an abrupt and significant disruption to global capital markets.
The Directors were also mindful of the scenario analysis incorporated into the Company’s corporate planning process. While the scenarios use a 20-year time horizon, scenario planning is important in helping identify the key uncertainties facing the global economy and natural resources sector.
Taking account of these matters, and the Company’s current position and principal risks, the Directors have a reasonable expectation that BHP Billiton will be able to continue in operation and meet its liabilities as they fall due over the next three years.

28 BHP Billiton Annual Report 2016
1 Strategic Report continued
1.9.2 Risk factorsThere are a number of factors that may have an adverse effect on our results and operations.
The principal risks discussed below, separately or in combination, could have a material effect on BHP Billiton’s strategic and operational plans and its reputation. In addition, we have also set out the risks relating to the failure of the Fundão tailings dam at Samarco Mineração S.A. (Samarco dam failure) which could, separately or in combination with the principal risks, have a material effect on our business, competitive position, cash flows, prospects, liquidity and shareholder returns.
Samarco dam failure
Our potential liabilities from litigation and other actions resulting from the Samarco dam failure are subject to significant uncertainty and cannot be reliably estimated at this time but they could have a material adverse effect on our business
On 5 November 2015, the Samarco Mineração S.A. (Samarco) iron ore operations experienced a tailings dam failure that resulted in a release of mine tailings, flooding the communities of Bento Rodrigues, Gesteira and Paracatu and impacting other communities downstream and the Rio Doce. Samarco is a joint venture owned equally by BHP Billiton Brasil Ltda (BHP Billiton Brasil) and Vale S.A. (Vale). For information on the Samarco dam failure, refer to section 1.4.
The Samarco dam failure and subsequent suspension of Samarco’s mining and processing operations have had a significant impact on our financial results for the year ended 30 June 2016, as described in section 1.4 and in note 3 ‘Significant events – Samarco dam failure’ to the Financial Statements.
Mining and processing operations remain suspended following the dam failure. Samarco is currently progressing plans to resume operations; however, significant uncertainties surrounding the nature and timing of any resumption of operations remain, including as a result of Samarco’s significant debt obligations. For further details of financial information relating to Samarco, refer to note 28 ‘Investments accounted for using the equity method’ to the Financial Statements.
BHP Billiton Brasil is among the defendants named in a number of legal proceedings initiated by individuals, non-governmental organisations (NGOs), corporations and governmental entities in Brazilian federal and state courts following the Samarco dam failure. The other defendants include Vale and Samarco. The lawsuits seek various remedies, including rehabilitation costs, compensation to injured individuals and families of the deceased, recovery of personal and property losses, moral damages and injunctive relief. These legal proceedings include civil public actions filed by state prosecutors in Minas Gerais (claiming damages of approximately R$7.5 billion (US$2.3 billion)), public defenders in Minas Gerais (claiming damages of approximately R$10 billion (US$3.1 billion)) and state prosecutors in Espírito Santo (claiming damages of approximately R$2 billion (US$620 million)). Given the preliminary status of all these proceedings, and the duplicative nature of the damages sought in these proceedings and the R$20 billion (US$6.2 billion) and R$155 billion (US$48 billion) claims noted below, it is not possible at this time to provide a range of possible outcomes or a reliable estimate of potential future exposures for BHP Billiton Brasil.
Among the claims brought against BHP Billiton Brasil is a public civil claim commenced by the Federal Government of Brazil, the states of Espírito Santo and Minas Gerais, and certain other public authorities (Brazilian Authorities) on 30 November 2015, seeking the establishment of a fund of up to R$20 billion (US$6.2 billion) in aggregate for clean-up costs and damages.
On 2 March 2016, BHP Billiton Brasil together with Samarco and Vale entered into a Framework Agreement (Framework Agreement) with the Brazilian Authorities to establish the Fundação Renova that will develop and execute environmental and socio-economic programs to remediate and provide compensation for damage caused by the Samarco dam failure. In light of the significant uncertainties surrounding the nature and timing of ongoing future operations at Samarco and based on currently available information, at 30 June 2016, BHP Billiton recognised a provision of US$1.2 billion, before tax and after discounting, in respect of BHP Billiton Brasil’s potential obligations under the Framework Agreement.

BHP Billiton Annual Report 2016 29
2 Governance at BH
P Billiton3
Remuneration Report
4 D
irectors’ Report 1
Strategic Report
Our potential liabilities from litigation and other claims resulting from the Samarco dam failure are subject to significant uncertainty and cannot be reliably estimated at this time but they could have a material adverse effect on our business continued
The Framework Agreement was ratified by the Federal Court of Appeal in Brasilia on 5 May 2016, suspending the R$20 billion public civil claim. However, on 30 June 2016, the Superior Court of Justice issued a preliminary order (Interim Order) suspending the ratification of the Framework Agreement and reinstating the R$20 billion public civil claim. Samarco, Vale and BHP Billiton Brasil and the Federal Government have appealed the Interim Order before the Superior Court of Justice. It is not possible at this time to provide a range of possible outcomes or a reliable estimate of potential future exposures for BHP Billiton Brasil in relation to the R$20 billion public civil claim.
BHP Billiton Brasil is also among the defendants named in a claim brought by the Federal Public Prosecution Service on 3 May 2016, seeking R$155 billion (approximately US$43 billion) for reparation, compensation and moral damages in relation to the Samarco dam failure. Given the preliminary status of these proceedings, it is not possible at this time to provide a range of possible outcomes or a reliable estimate of potential future exposures for BHP Billiton Brasil.
In addition, government inquiries and investigations relating to the Samarco dam failure have been commenced by numerous agencies of the Brazilian Government, and other lawsuits and investigations are at the early stages of proceedings, including a shareholder action filed in the United States against BHP Billiton and certain current or former Directors and officers. For more information on the shareholder action and other lawsuits relating to the Samarco dam failure, refer to section 6.5. Additional lawsuits and government investigations relating to the Samarco dam failure may be brought against BHP Billiton Brasil and possibly other BHP Billiton entities in Brazil or other jurisdictions.
Works are underway to reinforce and improve the dam structures at Samarco so as to contain the remaining tailings materials. A large portion of the works are scheduled to be completed before the next wet season commences. The potential nonetheless remains for further release or downstream movement of tailings material during this season, which may result in additional claims, fines and proceedings (or impact existing proceedings) and may also have additional consequences on the environment and the feasibility, timing and scope of any restart of Samarco operations.
Our potential costs and liabilities in relation to the Samarco dam failure are subject to a high degree of uncertainty and cannot be reliably estimated at this time. The total amounts that we may be required to pay will be dependent on many factors, including the timing and nature of a potential restart of operations at Samarco, the number of claims that become payable, the quantum of any fines levied, the outcome of litigation and the amount and timing of payments under any judgements or settlements. Nevertheless, such potential costs and liabilities could have a material adverse effect on our business, competitive position, cash flows, prospects, liquidity and shareholder returns.
For more information on the Samarco dam failure, refer to section 1.4.
1.9.2 Risk factors continued
30 BHP Billiton Annual Report 2016
1 Strategic Report continued
External risks
Fluctuations in commodity prices (including sustained price shifts) and impacts of ongoing global economic volatility may negatively affect our results, including cash flows and asset values
The prices we obtain for our oil, gas and minerals are determined by, or linked to, prices in world markets, which have historically been subject to significant volatility. Our usual policy is to sell our products at the prevailing market prices. The diversity provided by our relatively broad portfolio of commodities does not necessarily insulate the Company from the the effects of price changes. Fluctuations in commodity prices can occur due to price shifts reflecting underlying global economic and geopolitical factors, industry demand, increased supply due to the development of new productive resources or increased production from existing resources, technological change, product substitution and national tariffs. We are particularly exposed to price movements in iron ore, coal, copper, oil and gas. For example, a US$1 per tonne decline in the average iron ore price and US$1 per barrel decline in the average oil price would have an estimated impact on FY2016 profit after taxation of US$141 million and US$58 million, respectively. For more information in relation to commodity price impacts, refer to section 1.8.1. Volatility in global economic growth, particularly in developing economies, has the potential to adversely affect future demand and prices for commodities. The impact of sustained price shifts and short-term price volatility, including the effects of unwinding the sustained monetary stimulus in the United States, and uncertainty surrounding the details of the United Kingdom’s exit from the European Union following the June 2016 referendum, creates the risk that our financial and operating results, including cash flows and asset values, will be materially and adversely affected by short or long-term declines in the prevailing prices of our products.
Our financial results may be negatively affected by exchange rate fluctuations
The geographic diversity of the countries in which we operate means that our assets, earnings and cash flows are influenced by a wide variety of currencies. Fluctuations in the exchange rates of those currencies may have a significant impact on our financial results. The US dollar is the currency in which the majority of our sales is denominated and the currency in which we present our financial performance. Operating costs are influenced by the currencies of those countries where our assets and facilities are located and also by those currencies in which the costs of imported equipment and services are determined. The Australian dollar, Chilean peso and US dollar are some of the currencies influencing our operating costs. We do not generally believe active currency hedging provides long-term benefits to our shareholders. From time to time, we consider currency protection measures appropriate in specific commercial circumstances, subject to strict limits established by the Board.
Reduction in Chinese demand may negatively impact our results
The Chinese market has been driving global materials demand and pricing over the past decade. Sales into China generated US$13.2 billion (FY2015: US$16.3 billion) or 42.6 per cent (FY2015: 36.6 per cent) of our revenue in FY2016. FY2016 sales into China by commodity included 61 per cent Iron Ore, 28 per cent Copper, 10 per cent Coal and one per cent Nickel (reported in Group and Unallocated). A continued slowing in China’s economic growth and demand could result in lower prices for our products and negatively impact our results, including cash flows.
Actions by governments, additional regulation or political events in the countries in which we operate could have a negative impact on our business
There are varying degrees of political, judicial and commercial stability in the locations in which we have operated and non-operated assets around the globe. At the same time, our exposure to emerging markets may involve additional risks that could have an adverse effect on the profitability of an operation. These risks could include terrorism, civil unrest, judicial activism, regulatory investigation, nationalisation, protectionism, renegotiation or nullification of existing contracts, leases, permits or other agreements, imposts, controls or prohibitions on the production or use of certain products, restrictions on repatriation of earnings or capital and changes in laws and policy, as well as other unforeseeable risks. Risks relating to bribery and corruption, including possible delays or disruption resulting from a refusal to make so-called facilitation payments, may be prevalent in some of the countries in which we operate. If any of our major operations are affected by one or more of these risks, it could have a negative effect on our operations in those countries, as well as the Company’s overall operating results, financial condition and prospects.
Our operated and non-operated assets are based on material long-term investments that are dependent on long-term fiscal stability and could be adversely affected by changes in fiscal legislation, changes in interpretation of fiscal legislation, periodic challenges and disagreements with tax authorities and legal proceedings relating to fiscal matters. The natural resources industry continues to be regarded as a source of tax revenue and can also be adversely affected by broader fiscal measures applying to businesses generally. The Group is currently involved in a number of uncertain tax and royalty matters – refer to note 5 ‘Income tax expense’ to the Financial Statements for further detail.
Our business could be adversely affected by new or evolving government regulations and international standards, such as controls on imports, exports, prices and greenhouse gas emissions. The nature of the industries in which we operate means many of our activities are highly regulated by laws relating to health, safety, environment and community impacts. Increasing requirements relating to regulatory, environmental, social or community approvals can potentially result in significant delays or interruptions and may adversely affect the economics of new mining and oil and gas projects, the expansion of existing operations and the performance of our operations. As regulatory standards and expectations are constantly developing, we may be exposed to increased regulatory review, compliance costs to meet new operating and reporting standards and unforeseen closure and site rehabilitation expenses.
1.9.2 Risk factors continued

BHP Billiton Annual Report 2016 31
2 Governance at BH
P Billiton3
Remuneration Report
4 D
irectors’ Report 1
Strategic Report
External risks continued
Actions by governments, additional regulation or political events in the countries in which we operate could have a negative impact on our business continued
Infrastructure, such as rail, ports, power and water, is critical to our business operations. We have operations or potential development projects in countries where government-provided infrastructure or regulatory regimes for access to infrastructure, including our own privately operated infrastructure, may be inadequate, uncertain or subject to legislative change. The impact of climate change may increase competition for, and the regulation of, limited resources, such as power and water. These factors may adversely affect the expansion of our business and ability of our assets to operate efficiently.
We operate in countries where land tenure can be uncertain and where disputes may arise in relation to ownership and use. For example, in Australia, the Native Title Act 1993 provides for the establishment and recognition of native title under certain circumstances.
New or evolving regulations and international standards are complex, difficult to predict and outside our control. Potential compliance costs, litigation expenses, regulatory delays, rehabilitation expenses and operational costs arising from government action, regulatory change and evolving standards could negatively affect our Company, future results, prospects and our financial condition.
Business risks
Failure to discover or acquire new resources, maintain reserves or develop new operations could negatively affect our future results and financial condition
The demand for our products and production from our operations results in existing reserves being depleted over time. As our revenues and profits are derived from our oil, gas and minerals operations, our future results and financial condition are directly related to the success of our exploration and acquisition efforts, and our ability to generate reserves to meet our future production requirements at a competitive cost. Exploration activity occurs adjacent to established operations and in new regions, in developed and less-developed countries. These activities may increase land tenure, infrastructure and related political risks. A failure in our ability to discover or acquire new resources, maintain reserves or develop new operations in sufficient quantities to maintain or grow the current level of our reserves could negatively affect our results, financial condition and prospects. Deterioration in commodities pricing may make some existing reserves uneconomic. Our actual exploration drilling activities and future drilling budget will depend on our inventory size and quality, drilling results, commodity prices, drilling and production costs, availability of drilling services and equipment, lease expirations, land access, transportation pipelines, railroads and other infrastructure constraints, regulatory approvals and other factors.
There are numerous uncertainties inherent in estimating mineral and oil and gas reserves. Geological assumptions about our mineralisation that are valid at the time of estimation may change significantly when new information becomes available. Estimates of reserves that will be recovered, or the cost at which we anticipate reserves will be recovered, are based on uncertain assumptions. The uncertain global financial outlook may affect economic assumptions related to reserve recovery and may require reserve restatements. Reserve restatements could negatively affect our results and prospects.
Potential changes to our portfolio of assets through acquisitions and divestments may have a material adverse effect on our future results and financial condition
We regularly review the composition of our asset portfolio and from time to time may add assets to, or divest assets from, the portfolio. There are a number of risks associated with acquisitions or divestments. These include: • adverse market reaction to such changes or the timing or terms on which changes are made; • the imposition of adverse regulatory conditions and obligations;• commercial objectives not being achieved as expected; • unforeseen liabilities arising from changes to the portfolio; • sales revenues and operational performance not meeting our expectations; • anticipated synergies or cost savings being delayed or not being achieved;• inability to retain key staff and transaction-related costs being more than anticipated.
These factors could negatively affect our reputation, future results and financial condition.
Increased costs and schedule delays may adversely affect our development projects
Although we devote significant time and resources to our project planning, approval and review processes, many of our development projects are highly complex and rely on factors that are outside our control, which may cause us to underestimate the cost or time required to complete a project. For instance, incidents or unexpected conditions encountered during development projects may cause setbacks or cost overruns, required licences, permits or authorisations to build a project may be unobtainable at anticipated costs, or may be obtained only after significant delay and market conditions may change, thereby making a project less profitable than initially projected.
In addition, we may fail to develop and manage projects as effectively as we anticipate and unforeseen challenges may emerge.
Any of these may result in increased capital costs and schedule delays at our development projects and adversely affect anticipated financial returns.
1.9.2 Risk factors continued
32 BHP Billiton Annual Report 2016
1 Strategic Report continued
Financial risks
If our liquidity and cash flow deteriorate significantly it could adversely affect our ability to fund our major capital programs
We seek to maintain a strong balance sheet. However, fluctuations in commodity prices and the ongoing global economic volatility may adversely affect our future cash flows and ability to access capital from financial markets at acceptable pricing. If our key financial ratios and credit rating are not maintained, our liquidity and cash reserves, interest rate costs on borrowed debt, future access to financial capital markets and the ability to fund current and future major capital programs could be adversely affected.
We may not fully recover our investments in mining, oil and gas assets, which may require financial write-downs
One or more of our assets may be adversely affected by changed market or industry structures, commodity prices, technical operating difficulties, inability to recover our mineral, oil or gas reserves and increased operating cost levels. These may cause us to fail to recover all or a portion of our investment in mining, oil and gas assets and may require financial write-downs, including goodwill, adversely affecting our financial results.
The commercial counterparties we transact with may not meet their obligations, which may negatively affect our results
We contract with many commercial and financial counterparties, including end-customers, suppliers and financial institutions. Global economic volatility continues to strain global financial markets, with tighter liquidity in China and uncertain business conditions generally. We maintain a ‘one book’ approach with commercial counterparties to ensure all credit exposures are quantified. However, our existing counterparty credit controls may not prevent a material loss due to credit exposure to a major customer segment or financial counterparty. In addition, customers, suppliers, contractors or joint venture partners may fail to perform against existing contracts and obligations. Non-supply of key inputs, such as tyres, mining and mobile equipment, diesel and other key consumables, may unfavourably impact costs and production at our operations. These factors could negatively affect our financial condition and results of operations.
Operational risks
Unexpected natural and operational catastrophes may adversely impact our operations
We operate onshore and offshore extractive, processing and logistical operations in many geographic locations. Our key port facilities are located at Coloso and Antofagasta in Chile and Port Hedland and Hay Point in Australia. We have four underground mines, including one underground coal mine. Our operational processes may be subject to operational accidents, such as port and shipping incidents, underground mine and processing plant fire and explosion, open-cut pit wall or tailings/waste storage facility failures, loss of power supply, railroad incidents, loss of well control, environmental pollution, and mechanical critical equipment failures and cyber security attacks on Company infrastructure. Our operations may also be subject to unexpected natural catastrophes such as earthquakes, floods, hurricanes and tsunamis. Our northwest Western Australia iron ore, Queensland coal and Gulf of Mexico oil and gas operations are located in areas subject to cyclones or hurricanes. Our Chilean copper and Peruvian base metals operations are located in a known earthquake and tsunami zone. Based on our risk management and concerns about the value of external insurance in the natural resource sector, our risk financing (insurance) approach is to minimise or not to purchase external insurance for certain risks, including property damage and business interruption, sabotage and terrorism, marine cargo, construction, primary public liability and employee benefits. Existing business continuity plans may not provide protection for all the costs that arise from such events, including clean-up costs, litigation and other claims. The impact of these events could lead to disruptions in production, increased costs and loss of facilities. Where external insurance is purchased, third party claims arising from these events may exceed the limit of liability of the insurance policies we have in place. Additionally, any uninsured or underinsured losses could have a material adverse effect on our financial position or results of operations.
Cost pressures and reduced productivity could negatively impact our operating margins and expansion plans
Cost pressures may continue to occur across the resources industry. As the prices for our products are determined by the global commodity markets in which we operate, we do not generally have the ability to offset these cost pressures through corresponding price increases, which can adversely affect our operating margins. Although our efforts to reduce costs and a number of key cost inputs are commodity price-linked, the inability to reduce costs and a timing lag may adversely impact our operating margins for an extended period.
A number of our operations, such as copper, are energy or water intensive and as result, the Group’s costs and earnings could be adversely affected by rising costs or by supply interruptions. These could include the unavailability of energy, fuel or water due to a variety of reasons, including fluctuations in climate, inadequate infrastructure capacity, interruptions in supply due to equipment failure or other causes and the inability to extend supply contracts on economic terms.
Many of our Australian employees have conditions of employment, including wages, governed by the operation of the Australian Fair Work Act 2009. Conditions of employment are often contained within collective agreements that are required to be renegotiated on expiry (typically every three to four years). In some instances, under the operation of the Fair Work Act it can be expected that unions will pursue increases to conditions of employment, including wages, and/or claims for greater union involvement in business decision-making.
1.9.2 Risk factors continued
BHP Billiton Annual Report 2016 33
2 Governance at BH
P Billiton3
Remuneration Report
4 D
irectors’ Report 1
Strategic Report
Operational risks continued
Cost pressures and reduced productivity could negatively impact our operating margins and expansion plans continued
In circumstances where a collective agreement is being renegotiated, industrial action is permitted under the Fair Work Act. Industrial action and any subsequent settlement to mitigate associated commercial damage can adversely affect productivity and customer perceptions as a reliable supplier, and contribute to increases in costs.
The industrial relations environment in Chile remains challenging and it is possible that we will see further disruptions. Changes to labour legislation are being considered by the Chilean Congress, and if passed would result in the right to have a single negotiating body across different operations owned by a single company, which may also result in higher risk of operational stoppages.
More broadly, cost and productivity pressures on our Company and our contractors and sub-contractors may increase the risk of industrial action and employment litigation.
These factors could lead to increased operating costs at existing operations, interruptions or delays and could negatively impact our operating margins and expansion plans.
Our non-operated assets and our commercial counterparties may not comply with our standards
Some of our assets are operated and managed by joint venture partners or by other companies. Management of our non-operated assets may not comply with our management and operating standards, controls and procedures, including our health, safety, environment and community (HSEC) standards. Failure to adopt equivalent standards, controls and procedures at these assets could lead to higher costs and reduced production, litigation and regulatory action, delays or interruptions and adversely impact our results, prospects and reputation.
Commercial counterparties, such as our suppliers, contractors and customers, may not comply with our HSEC standards causing adverse reputational and legal impacts.
Breaches in, or failures of, our information technology may adversely impact our business activities
We maintain and increasingly rely on information technology (IT) systems, consisting of digital infrastructure, applications and networks to support our business activities. These systems may be subject to security breaches (e.g. cyber-crime or activists) or other incidents (e.g. from negligence) that can result in misappropriation of funds, increased health and safety risks to people, disruption to our operations, environmental damage, poor product quality, loss of intellectual property, disclosure of commercially or personally sensitive information, legal or regulatory breaches and liability, other costs and reputational damage.
Evolving convergence of IT and Operational Technology (OT) networks across industries, including ours, present additional cyber-related risk as traditionally IT networks have been focused on availability of service to the enterprise.
Sustainability risks
Safety, health, environmental and community impacts, incidents or accidents may adversely affect our people, operations and reputation or licence to operate
SafetyPotential safety events that may have a material adverse impact on our people, operations, reputation or licence to operate include fire, explosion or rock fall incidents in underground mining operations, personnel conveyance equipment failures in underground operations, aircraft incidents, road incidents involving buses and light vehicles, incidents between light vehicles and mobile mining equipment, ground control failures, uncontrolled tailings containment breaches, well blowouts, explosions or gas leaks and accidents involving inadequate isolation, working from heights or lifting operations.
HealthHealth risks faced include fatigue, musculoskeletal illnesses and occupational exposure to substances or agents including noise, silica, coal mine dust, diesel exhaust particulate, nickel and sulphuric acid mist and mental illness. Longer-term health impacts may arise due to unanticipated workplace exposures or historical exposures of our workforce to hazardous substances. These effects may create future financial compensation obligations, adversely impact our people, reputation or licence to operate and affect the way we conduct our operations.
Given we operate globally, we could be affected by a public health emergency such as influenza or other infectious disease outbreaks in any of the regions in which we operate.
EnvironmentOur operations by their nature have the potential to adversely impact air quality, biodiversity, water resources and related ecosystem services. Changes in scientific understanding of these impacts, regulatory requirements or stakeholder expectations may prevent or delay project approvals and result in increased costs for mitigation, offsets or compensatory actions.
Environmental incidents have the potential to lead to material adverse impacts on our people, operations, reputation or licence to operate. These include uncontrolled tailings containment breaches, subsidence from mining activities, escape of polluting substances and uncontrolled releases of hydrocarbons.
We provide for operational closure and site rehabilitation. Our operating and closed facilities are required to have closure plans. Changes in regulatory or community expectations may result in the relevant plans not being adequate. This may increase financial provisioning and costs at the affected operations.
1.9.2 Risk factors continued

34 BHP Billiton Annual Report 2016
1 Strategic Report continued
Sustainability risks continued
Safety, health, environmental and community impacts, incidents or accidents may adversely affect our people, operations and reputation or licence to operate continued
Climate change may adversely affect the value of our Company, and our operations and marketsThe physical and non-physical impacts of climate change may affect our operations, productivity and the markets in which we sell our products. This includes acute and chronic changes in weather, policy and regulatory change, technological development and market and economic responses. Fossil fuel-related emissions are a significant source of greenhouse gases contributing to climate change. We produce fossil fuels such as coal, oil and gas for sale to customers, and we use fossil fuels in our mining and processing operations either directly or through the purchase of fossil fuel based electricity.
A number of national governments have already introduced, or are contemplating the introduction of, regulatory responses to greenhouse gas emissions from the combustion of fossil fuels to address the impacts of climate change. This includes countries where we have operations such as Australia, the United States and Chile, as well as customer markets such as China, India and Europe. In addition, the international community completed a new global climate agreement at the 21st Conference of the Parties (COP21) in Paris in December 2015. The absence of regulatory certainty, global policy inconsistencies and the challenges presented by managing our portfolio across a variety of regulatory frameworks has the potential to adversely affect our operations and supply chain. From a medium- to long-term perspective, we are likely to see some adverse changes in the cost position of our greenhouse gas-intensive assets and energy-intensive assets as a result of regulatory impacts in the countries where we operate. These proposed regulatory mechanisms may adversely affect our operations directly or indirectly through our suppliers and customers. Assessments of the potential impact of future climate change regulation are uncertain given the wide scope of potential regulatory change in the many countries in which we operate. For example, the Australian Government repealed a carbon tax in 2014 and carbon pricing is being discussed as part of a broader tax reform package in Chile.
There is a potential gap between the current valuation of fossil fuel reserves on the balance sheets of companies and in global equities markets and the reduced value that could result if a significant proportion of reserves were rendered incapable of extraction in an economically viable fashion due to technology, regulatory or market responses to climate change. In such a scenario, stranded reserve assets held on our balance sheet may need to be impaired or written off and our inability to make productive use of such assets may also negatively impact our financial condition and results.
The growth of alternative energy supply options, such as renewables and nuclear, could also present a change to the energy mix that may reduce the value of fossil fuel assets.
The physical effects of climate change on our operations may include changes in rainfall patterns, water shortages, rising sea levels, increased storm intensities and higher temperatures. These effects may adversely affect the financial performance of our operations.
CommunityLocal communities may be directly impacted by and become dissatisfied with our operations or oppose our new development projects, including through legal action, potentially affecting schedules, costs and production, and in extreme cases viability and adversely impacting our reputation and licence to operate. Community related risks may include community protests or civil unrest, complaints to grievance mechanisms and civil society activism and may cause delays or changes to proposed developments and interruptions to existing operations. Our operations or activities also risk the potential for adverse impacts on human rights or breaches of other international laws or conventions.
1.9.2 Risk factors continued
BHP Billiton Annual Report 2016 35
2 Governance at BH
P Billiton3
Remuneration Report
4 D
irectors’ Report 1
Strategic Report
Sustainability risks continued
Safety, health, environmental and community impacts, incidents or accidents may adversely affect our people, operations and reputation or licence to operate continued
Hydraulic fracturingOur Onshore US operations involve hydraulic fracturing, which involves using water, sand and a small amount of chemicals to fracture hydrocarbon-bearing subsurface rock formations, to allow flow of hydrocarbons into the wellbore. We depend on the use of hydraulic fracturing techniques in our onshore US drilling and completion programs.
In the United States, the hydraulic fracturing process is typically regulated by relevant US state regulatory bodies. Arkansas, Louisiana and Texas (the states in which we currently operate) have adopted various laws and regulations, or issued regulatory guidance, concerning hydraulic fracturing. Some states are considering changes to regulations in relation to permitting, public disclosure, and/or well construction requirements on hydraulic fracturing and related operations, including the possibility of outright bans on the process.
Several US federal agencies are also reviewing or advancing regulatory proposals concerning hydraulic fracturing and related operations. The US Environmental Protection Agency (EPA) commenced a study of the potential impacts of hydraulic fracturing activities on drinking water resources. The agency issued a non-determinative Progress Report in December 2012 and released a preliminary analysis on 30 March 2015. The EPA’s Science Advisory Board (SAB) engaged a research advisory panel to address criticism over the study’s core conclusion and that panel issued a draft report on 7 January 2016. The EPA’s Office of Inspector General continues to research the EPA’s and states’ ability to manage potential threats to water resources from hydraulic fracturing and produced a report on 16 July 2015 identifying two areas for improvement. The US Bureau of Land Management (BLM) issued a final rule on 20 March 2015 that would impose new requirements on hydraulic fracturing operations conducted on federal lands, including the disclosure of chemicals used, wellbore integrity, water use and disposal of flow back water. The BLM regulation took effect on 24 June 2015. On 30 September 2015, the US District Court for the District of Wyoming granted a motion for a preliminary injunction that prevents enforcement of the regulation by BLM pending litigation. Activity at the federal level, including the ongoing EPA study, BLM rules and other analysis by federal and state agencies to assess the impacts of hydraulic fracturing, could spur additional legislative or regulatory actions.
While we have not experienced a material delay or substantially higher operating costs in our Onshore US operations as a result of current regulatory requirements, we cannot predict whether additional federal, state or local laws or regulations will be enacted and what such actions would require or prohibit. Additional legislation or regulation could subject our operations to delays and increased costs, or prohibit certain activities, which could adversely affect the financial performance of our Onshore US operations.
A breach of our governance processes may lead to regulatory penalties and loss of reputationWe operate in a global environment that encompasses multiple jurisdictions and complex regulatory frameworks. Our governance and compliance processes, which include the review of internal controls over financial reporting and specific internal controls in relation to trade and financial sanctions and offers of anything of value to government officials and representatives of state-owned enterprises, may not prevent future potential breaches of law, or of accounting or governance practice. Our Code of Business Conduct, together with our mandatory policies, such as the anti-corruption, trade and financial sanctions and competition policies, may not prevent instances of fraudulent behaviour and dishonesty nor guarantee compliance with legal or regulatory requirements. This may lead to regulatory fines, disgorgement of profits, litigation, allegations or investigations by regulatory authorities, loss of operating licences and/or reputational damage.
1.9.2 Risk factors continued

36 BHP Billiton Annual Report 2016
1 Strategic Report continued
1.9.3 Management of principal risks The scope of our operations and the number of industries in which we operate and engage mean that a range of factors may impact our results. Material risks that could negatively affect our results and performance are described in section 1.9.2. Our approach to managing these risks is outlined below.
Principal risk area Risk management approach
Samarco dam failureOur potential liabilities from litigation and other actions resulting from the Samarco dam failure are subject to significant uncertainty and cannot be reliably estimated at this time.
The Board has spent a significant amount of time discussing Samarco and considering our approach to the Samarco dam failure.
Soon after the Samarco dam failure occurred, a sub-committee of the Board was established to further consider and oversee matters relating to the Samarco dam failure, including BHP Billiton’s support of the recovery and response efforts, investigation of the cause of the dam failure and our engagement with key stakeholders. The Samarco sub-committee comprises John Schubert (Chairman), Jac Nasser, Lindsay Maxsted and Malcolm Brinded.
Alongside the Samarco sub-committee, the Risk and Audit Committee and the Sustainability Committee have continued to consider matters relating to Samarco as part of the ongoing duties of those committees, including Samarco funding and the review of significant dams in the portfolio.
We believe these efforts provide a robust and comprehensive approach for the Board to best provide its oversight and input, and allows appropriate consideration to be brought to the various aspects of the response.
For further information on BHP Billiton’s response to the Samarco dam failure, refer to section 1.4.
External risksRisks arise from fluctuations in commodity prices and demand in major markets (such as China or Europe) or changes in currency exchange rates and actions by governments, including new regulations and standards, and political events that impact long-term fiscal stability.
The diversification of our portfolio of commodities, geographies and currencies is a key strategy for reducing the effects of volatility. Section 1.8.1 describes external factors and trends affecting our results and note 21 ‘Financial risk management’ to the Financial Statements outlines the Company’s financial risk management strategy, including market, commodity, and currency risk. The Financial Risk Management Committee oversees these risks as described in sections 2.14 and 2.15. We also engage with governments and other key stakeholders to ensure the potential adverse impacts of proposed fiscal, tax, resource investment, infrastructure access, regulatory changes and evolving international standards are understood and where possible mitigated.
Business risksRisks include the inherent uncertainty of identifying and proving reserves, adding and divesting assets and managing our capital development projects.
Our Geoscience Centre of Excellence manages governance and technical leadership for Mineral Resource development and Ore Reserves reporting as described in section 6.3.2. Our governance over reporting of Petroleum reserves is described in section 6.3.1.
We have established investment approval processes that apply to all major capital projects and asset divestment and acquisitions. The Investment Committee oversees these as described in sections 2.14 and 2.15. Our Project Management function additionally seeks to ensure that projects are safe, predictable and competitive.
Financial risksContinued volatility in global financial markets may adversely impact future cash flows, our ability to adequately access and source capital from financial markets and our credit rating. Volatility may impact planned expenditures, as well as the ability to recover investments in mining, oil and gas projects. In addition, the commercial counterparties (customers, suppliers, contractors and financial institutions) we transact with may, due to adverse market conditions, fail to meet their contractual obligations.
We seek to maintain a strong balance sheet, supported by our portfolio risk management strategy. As part of this strategy, the diversification of our portfolio reduces overall cash flow volatility. Commodity prices and currency exchange rates are not generally hedged, and wherever possible we take the prevailing market price. A trial hedging program for our shale gas operations is an exception and reflects the inherent differences in shale gas operations in our portfolio. A shale gas operation has a short-term investment cycle and a price responsive supply base and hedging prices and input costs can be used to fix investment returns and manage volatilities. We use Cash Flow at Risk analysis to monitor volatilities and key financial ratios. Credit limits and review processes are required to be established for all customers and financial counterparties. The Financial Risk Management Committee oversees these as described in sections 2.14 and 2.15. Note 21 ‘Financial risk management’ to the Financial Statements outlines our financial risk management strategy.
BHP Billiton Annual Report 2016 37
2 Governance at BH
P Billiton3
Remuneration Report
4 D
irectors’ Report 1
Strategic Report
Principal risk area Risk management approach
Operational risks Operating cost pressures and reduced productivity could negatively affect operating margins and expansion plans. Non-operated assets may not comply with our standards. Unexpected natural and operational catastrophes may adversely affect our operations. Breaches in IT security processes may adversely affect the conduct of our business activities.
We aim to maintain adequate operating margins through our strategy to own and operate large, long-life, low-cost and expandable upstream assets.
The organisation’s concentrated effort to reduce operating costs and drive productivity improvements has realised tangible results, with a reduction in controllable costs.
The capability to sustain productivity improvements is being further enhanced through continued refinements to our Operating Model. The Operating Model is designed to deliver a simple and scalable organisation, providing a competitive advantage through defining work, organisation and performance measurements. Defined global business processes, including 1SAP, provide a standardised way of working across the organisation. Common processes generate useful data and improve operating discipline. Global sourcing arrangements have been established to ensure continuity of supply and competitive costs for key supply inputs. We seek to influence the application of our standards to non-operated assets.
By applying our risk management processes, we seek to identify catastrophic operational risks and implement the critical controls and performance requirements to maintain control effectiveness. Business continuity plans are required to be established to mitigate consequences. Consistent with our portfolio risk management approach, we continue to be largely self-insured for losses arising from property damage, business interruption and construction.
From an industrial relations perspective, detailed planning is undertaken to support the renegotiation of employment agreements, and is supported by training and access to expertise in negotiation and agreement making.
IT security controls to protect IT infrastructure, business applications and communication networks and respond to security incidents are in place and subject to regular monitoring and assessment. To maintain adequate levels of protection, we also continue to monitor the development of threats in the external environment and assess potential responses to those threats.
BHP Billiton has identified a number of actions that we will take in the management of tailings dams and joint venture arrangements. For details of those actions, refer to section 1.4.
Sustainability risksHSEC incidents or accidents may adversely affect our people or neighbouring communities, operations and reputation or licence to operate. The potential physical impacts and related responses to climate change may impact the value of our Company, our operations and markets.
Our approach to sustainability risks is reflected in Our Charter and described in section 1.11, including a Company-level safety intervention that was initiated in FY2015. Our Requirements standards set out Group-wide HSEC-related performance requirements designed to support effective management control of these risks.
Our approach to corporate planning, investment decision-making and portfolio management provides a focus on the identification, assessment and management of climate change risks. We have been applying an internal price on carbon in our investment decisions for more than a decade. Through a comprehensive and strategic approach to corporate planning, we work with a broad range of scenarios to assess our portfolio, including consideration of a broad range of potential policy responses to and impacts from climate change.
Our approach to engagement with community stakeholders is outlined in our minimum organisational requirements for Community. Operations are also required to undertake stakeholder identification analysis, social impact and opportunity assessments, community perception surveys and human rights impact assessments to identify, mitigate or manage key potential social and human rights risks.
The Our Requirements for Risk Management standard provides the framework for risk management relating to climate change and material health, safety, environment and community risks. Internal audits are conducted to test compliance with the Our Requirements standards and action plans are developed to address any gaps. Key findings are reported to senior management and reports are considered by relevant Board committees.
Our Code of Business Conduct sets out requirements related to working with integrity, including dealings with government officials and third parties. Processes and controls are in place for the internal control over financial reporting, including under Sarbanes-Oxley. We have established anti-corruption, competition and trade sanctions performance requirements, which are overseen by the Compliance function, as described in section 2.16. Additionally, the Disclosure Committee oversees our compliance with securities dealing obligations and continuous and periodic disclosure obligations as described in sections 2.14, 2.15 and 2.17.
1.9.3 Management of principal risks continued
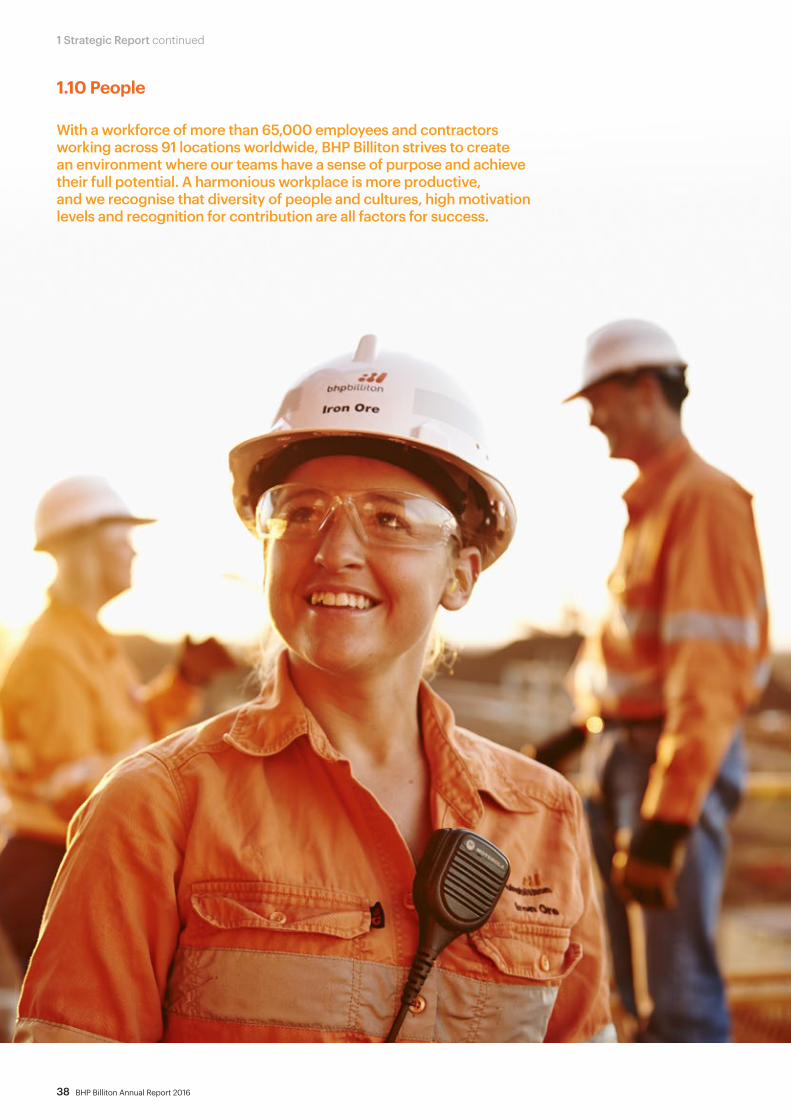
38 BHP Billiton Annual Report 2016
1 Strategic Report continued
1.10 People
With a workforce of more than 65,000 employees and contractors working across 91 locations worldwide, BHP Billiton strives to create an environment where our teams have a sense of purpose and achieve their full potential. A harmonious workplace is more productive, and we recognise that diversity of people and cultures, high motivation levels and recognition for contribution are all factors for success.

BHP Billiton Annual Report 2016 39
2 Governance at BH
P Billiton3
Remuneration Report
4 D
irectors’ Report 1
Strategic Report
1.10.1 Our peopleWe believe our people have the right to a safe and productive work environment that supports ongoing training and development in fulfilling jobs. We have a comprehensive set of policies, initiatives and frameworks to achieve this.
Examples include:• Our Charter is central to everything we do and our single most important document at BHP Billiton. Our Charter describes our purpose
and values and how we measure our success. It communicates who we are, what we do and what we stand for as an organisation. It is the basis for our decision-making.
• Our Requirements standards outline the expected actions and standards for those who work for or on behalf of BHP Billiton. Some of those standards relate to people activities; for example, recruitment and talent retention. Discrimination on any basis, including disability, is not acceptable. In instances where employees require support for a disability, we work with them to identify roles that meet their skill, experience and capability, and offer retraining where required.
• Our Code of Business Conduct helps guide our daily work. It demonstrates how to practically apply the commitments and values set out in Our Charter and reflects many of the standards and procedures we apply throughout our organisation.
• Our business conduct advisory service (EthicsPoint) and dispute and grievance handling processes are available to address issues across the Company.
• We provide employees with access to an Employee Assistance Program (EAP) in each region where we operate. The EAPs provide short-term assistance through free, confidential counselling and support services.
• Our all-employee share purchase plan, Shareplus, is available to all permanent full-time and part-time employees, and those on fixed term contracts, except where local regulations limit operation of the scheme. In these instances, alternate arrangements are in place.
1.10.2 New, simplified Operating Model A major focus for FY2016 was the announcement and implementation of a new Operating Model, which articulates how we are organised and work together. In March 2016, we commenced transitioning from an operating model primarily organised by commodity to one organised by assets.
Our new Operating Model creates a more agile and responsive company designed to best suit our now simpler portfolio of 12 core operated assets. It aims to accelerate productivity and value creation by removing duplication, standardising key processes and systems, realising economies of scale and facilitating greater coordination in order to enhance safety, productivity and learning.
This important step in the simplification of BHP Billiton will allow our assets to focus primarily on safety, volume and cost, while our functions have become globally integrated to drive deeper expertise.
For more information on the new Operating Model, refer to section 1.5.3.
1.10.3 Inclusion and diversity We recognise that inclusion and diversity are key enablers to delivering on our safety, culture and productivity priorities. Our internal benchmarking demonstrates that operations which are more inclusive and diverse achieve better performance results. Safety outcomes are better, production is more stable and employee engagement is higher. Results also show that greater employee engagement leads to improved productivity and higher retention rates. It is this business case that underpins our Inclusion and Diversity Strategy, which is rooted in the principle that leadership drives culture, and culture drives performance. Our strategy focuses on engaging, enabling, and supporting our line leaders in creating a work environment of greater inclusion where our employees feel involved, respected, valued and connected, where difference is embraced and Our Charter values are reflected.
Achieving a culture of inclusion and increasing female representation have been key priorities for BHP Billiton since 2010. Recently we took the step to embed a more unified approach and amplify our commitment by establishing a CEO-led Inclusion and Diversity Council comprising asset and functional leaders from across the organisation. Since its launch, the Council has collaborated to develop recommendations to accelerate the delivery of a more inclusive work environment and enhanced overall workforce diversity.
40 BHP Billiton Annual Report 2016
1 Strategic Report continued
1.10.3 Inclusion and diversity continuedEach financial year, the Board considers, approves and monitors progress on the Group’s performance objectives. A summary of the inclusion and diversity objectives set in FY2016 and progress to date are set out below.
Progress on our inclusion and diversity objectives
1. Assets, Marketing and functions to demonstrate progress against key objectives to improve the diversity of our workforce profile (where legally permissible), with particular emphasis on demonstrating a contribution to increasing female representation year-on-year, both overall and in leadership.
During FY2016, the following activities were prioritised by our assets, Marketing and functions to improve inclusion and diversity:• initiatives to engage with, and continue to educate employees on, inclusion and diversity, including
unconscious bias training; diversity focus groups; town hall events on targeted inclusion and diversity topics; and external benchmarking to identify opportunities for improvement;
• targeted female development, including mentoring to build capability of female employees; focusing on identifying female candidates for the talent pipeline; and increasing female representation in entry-level roles;
• resourcing campaigns targeting greater female participation; • further embedding of flexible work options across different assets, Marketing and functions,
with toolkits and support for leaders to think differently about flexible work options;• continued commitment to enabling a positive parental leave experience, with parental leave networks
and toolkits to build engagement; and targeted parental leave coaching for some employees;• enablement of a more inclusive environment through building amenities, with provision of prayer
facilities, expectant mother parking, and breastfeeding/nursing facilities in key buildings to support the varying requirements of our employees;
• initiatives to increase representation of Indigenous people in our workforce, including targeted resourcing strategies; and development programs to broaden opportunities for Indigenous candidates;
• commitment to broader facets of diversity, including membership with Pride in Diversity in Australia for greater inclusion of LGBTI employees, and early work on a small pilot with the Australian Network on Disability’s intern program.
FY2016 outcomesCompared to FY2015, female representation (i) increased by one per cent in manager and senior leadership roles to 22 per cent, and (ii) remained steady in our overall workforce representation at 17.6 per cent.
Female representation in our graduate intake increased by seven per cent to 49 per cent at a global level and by six per cent to 52 per cent in Australia. Representation of Indigenous Australians in the graduate program decreased by two per cent to nine per cent.
The Board achieved its goal to increase the number of women on the Board to three by the end of CY2015, following Anita Frew’s appointment to the Board effective 15 September 2015.
2. Demonstrate year-on-year improvement in creating a work environment of inclusion, as measured by our Employee Perception Survey (EPS) inclusion index.As in previous years, an inclusion index to gauge employees’ perceptions of feeling valued and heard was measured as part of our EPS. Our results from the CY2016 Survey show a one per cent improvement from CY2015, continuing our positive progress since 2014.
Continuous improvement While female representation has increased at leadership levels and our progress over the past three years regarding overall female representation and our inclusion index has demonstrated a positive shift, we recognise that further accelerated action is required. Core to delivering this commitment will be the Inclusion and Diversity Council; its defined program of work and inclusion of the following objective in all asset, Marketing and function FY2017 scorecards.
As in previous years, progress will be evaluated and successful completion of these objectives will be taken into account in determining bonus remuneration outcomes. Progress against each year’s measurable objectives will continue to be tracked as part of the Group’s internal compliance requirements and disclosed in the Annual Report.
The proportion of women in our workforce and in senior management positions is set out in section 1.10.8, which contains further information on diversity and our workforce profile.
At BHP Billiton, we aspire to create a work environment that is truly inclusive for all people. We will measure our success through demonstrated: • year-on-year global progress on creating a more inclusive culture as measured by a three per cent
global increase on the EPS inclusion index; • contribution to a three per cent global increase in representation of women through the leadership
team developing and implementing a specific Inclusion and Diversity Plan consistent with the Inclusion and Diversity Council’s guidelines (where, and to the extent, legally permissible in the applicable jurisdictions in which BHP Billiton operates).

Case study: Inclusion and Diversity Council
BHP Billiton Annual Report 2016 41
2 Governance at BH
P Billiton3
Remuneration Report
4 D
irectors’ Report 1
Strategic Report
1.10.4 Employee engagement Regular, honest and transparent communications are a key part of our employee engagement. For BHP Billiton, communication is a two-way process, achieved through a variety of channels including face-to-face meetings, town hall meetings, intranet, email, newsletters, social media, online collaboration forums and other channels tailored to local environments.
We also seek regular feedback from our employees, including via an annual Employee Perception Survey (EPS). The EPS helps us measure our culture, allowing us to better understand what we are doing well and where we can improve. The EPS contains 50 core questions that focus on senior leadership, safety and sustainability, communication, inclusion and diversity, work processes, leadership, development as well as career opportunities.
Our CY2016 EPS results show we are doing well at focusing on creating a safe workplace. Our line leaders are also encouraging diverse views when it comes to problem-solving and doing well at engaging their teams and leading change.
We have room to improve in better enabling our employees (by removing obstacles and increasing access to needed resources), helping employees feel more connected to the Company and providing clarity about future career opportunities.
1.10.5 Leadership developmentOur aspiration is to develop distinctive BHP Billiton leaders based on the premise that leadership drives culture and culture drives performance. Our commitment to a globally consistent leadership development approach is key to our continued success.
We are focusing on continuing to build a ‘step-up’ culture, which means our people are empowered, speak up and get involved in improving safe productivity. To support this culture, a leadership development framework called Leading the Future was launched in FY2015, incorporating a number of development programs targeted at leaders. The first program in this framework, Leading Step Up, was targeted at frontline leaders and focused on three capabilities – engage, lead change and develop. As at 30 June 2016, 97 per cent of targeted people leaders across BHP Billiton had completed Leading Step Up.
Other programs in the Leading the Future framework will focus on identifying, creating and capturing value and increasing productivity through focusing on continuous improvement and better decision-making.
We have also sustained our deep commitment to selecting and developing graduates, our future talent pipeline. The Graduate Development Program is aligned to our Company priorities and embeds our three key principles for learning: leader-led, embedded at work and focused on business problems.
1.10.6 Performance enhancement process improvements For FY2016, we made some improvements to how we develop, assess and reward our employees through the Performance Enhancement Process (PEP).
The changes broadly include having leaders undertake more regular one-on-one conversations with their team members to discuss performance and development throughout the year (rather than formalised conversations at scheduled points in time). Our main focus is to make sure leaders guide continuous improvement through regular, meaningful performance and development conversations with their employees. The enhanced program will be implemented progressively through FY2017.
In FY2016, 93 per cent of employees participated in a formal performance management process. This process provides the opportunity for employees to align their goals, receive feedback and coaching, and identify skills and capabilities for further development. Due to industrial agreements, not all of our employees are able to participate in individual performance programs.
1.10.3 Inclusion and diversity continued
BHP Billiton’s Executive Leadership Team recognised that to deliver meaningful, sustainable change in inclusion and diversity, greater visibility of senior leadership commitment and stronger involvement of line management were required. As a result, the Inclusion and Diversity Council was formed. The Council is sponsored by the CEO and comprises a group of senior leaders, including Asset Presidents and Heads of Functions, and is supported by Human Resources. The role of the Council is to create an integrated Company-wide Inclusion and Diversity Strategy and drive the execution and ownership of that strategy at a local level.
Since its formation in November 2015, the Council has been working to:• develop a Company-wide narrative and value case on inclusion and diversity;• create a deliberate platform to enable greater dialogue about inclusion and diversity
across the Company;• define specific strategies to accelerate progress on achieving greater inclusion
at BHP Billiton; • build performance on inclusion and diversity objectives into asset, Marketing and
functional scorecards; • implement visible symbols in the organisation to signify that inclusion and diversity
is an imperative.
Specific actions already planned, underway or completed include the enhancement of Our Charter with the addition of the sentence: We are successful when: ‘Our teams are inclusive and diverse’, global awareness programs on inclusion, diversity and unconscious bias, deliberate sourcing and development of female candidates to increase our talent pool; and leveraging the new Operating Model to connect the efforts of different assets, Marketing and functions in order to accelerate progress.
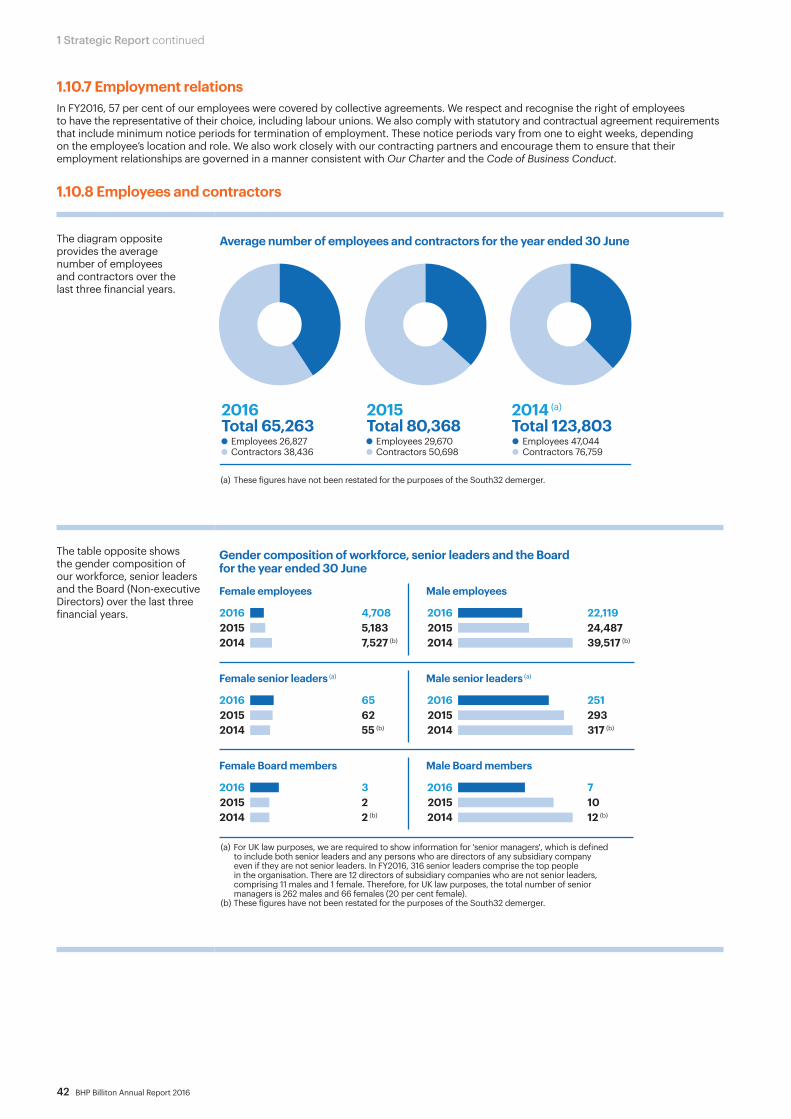
42 BHP Billiton Annual Report 2016
1 Strategic Report continued
1.10.7 Employment relationsIn FY2016, 57 per cent of our employees were covered by collective agreements. We respect and recognise the right of employees to have the representative of their choice, including labour unions. We also comply with statutory and contractual agreement requirements that include minimum notice periods for termination of employment. These notice periods vary from one to eight weeks, depending on the employee’s location and role. We also work closely with our contracting partners and encourage them to ensure that their employment relationships are governed in a manner consistent with Our Charter and the Code of Business Conduct.
1.10.8 Employees and contractors
The diagram opposite provides the average number of employees and contractors over the last three financial years.
2015Total 80,368
Employees 29,670Contractors 50,698
2014 (a)
Total 123,803Employees 47,044Contractors 76,759
Average number of employees and contractors for the year ended 30 June
2016Total 65,263
Employees 26,827Contractors 38,436
(a) These figures have not been restated for the purposes of the South32 demerger.
The table opposite shows the gender composition of our workforce, senior leaders and the Board (Non-executive Directors) over the last three financial years.
(a) For UK law purposes, we are required to show information for 'senior managers', which is defined to include both senior leaders and any persons who are directors of any subsidiary company even if they are not senior leaders. In FY2016, 316 senior leaders comprise the top people in the organisation. There are 12 directors of subsidiary companies who are not senior leaders, comprising 11 males and 1 female. Therefore, for UK law purposes, the total number of senior managers is 262 males and 66 females (20 per cent female).
(b) These figures have not been restated for the purposes of the South32 demerger.
Female employees Male employees
201620152014
201620152014
4,7085,1837,527 (b)
22,11924,48739,517 (b)
Female senior leaders (a) Male senior leaders (a)
201620152014
201620152014
656255 (b)
251293317 (b)
Female Board members Male Board members
201620152014
201620152014
322 (b)
71012 (b)
Gender composition of workforce, senior leaders and the Boardfor the year ended 30 June

BHP Billiton Annual Report 2016 43
2 Governance at BH
P Billiton3
Remuneration Report
4 D
irectors’ Report 1
Strategic Report
Opposite is a breakdown of the average number of employees across the Group, in accordance with our reporting requirements under the UK Companies Act 2006. The calculation includes the Executive Director, 100 per cent of employees of subsidiary companies and employees based on our share of joint operations for each of the past three financial years. Employees of equity accounted entities are not included. Part-time employees are included on a full-time equivalent basis. Employees of businesses acquired or disposed of during a particular year are included for the period of ownership. Contractors are not included.
2016 total – 3,2822015 total – 4,2242014 total – 4,207 (b)
2016 total – 8,0932015 total – 9,1382014 total – 9,414 (b)
2016 total – 7,2872015 total – 7,4832014 total – 8,035 (b)
2016 total – 5,0082015 total – 5,5792014 total – 6,160 (b)
2016 total – 3,1572015 total – 3,2462014 total – 19,228 (b)
2016 total – 26,8272015 total – 29,6702014 total – 47,044 (b)
Petroleum (a) Copper Iron Ore
Coal Group and unallocated (c) Total employees
Average number of employees for continuing operations for the year ended 30 June
(a) In 2014 and 2015 Petroleum includes Potash.(b) These figures have not been restated for the purposes of the South32 demerger.(c) In 2016 Group and unallocated includes Functions, other unallocated operations including
Potash and Nickel West. In 2014 Group and unallocated also includes Discontinued operations.
The diagram below provides a breakdown of our average number of employees by geographic region for each of the last three financial years.
Australia 23,048
Total 47,0442014 (a)
Asia 1,105
Africa 9,035
Europe 146
North America 4,373
South America 9,337
Total 29,6702015
Asia 1,022
Africa 117
Australia 16,839
Europe 83
North America 4,188
South America 7,421
Australia 15,834
Total 26,8272016
Asia 822
Europe 61
North America 3,601
South America 6,509
Average number of employees by geographic region for the year ended 30 June
(a) These figures have not been restated for the purposes of the South32 demerger.
Changes in market conditions and our business transformation programs focused on improving efficiencies and driving greater productivity have resulted in a decrease in our workforce requirements.
1.10.8 Employees and contractors continued
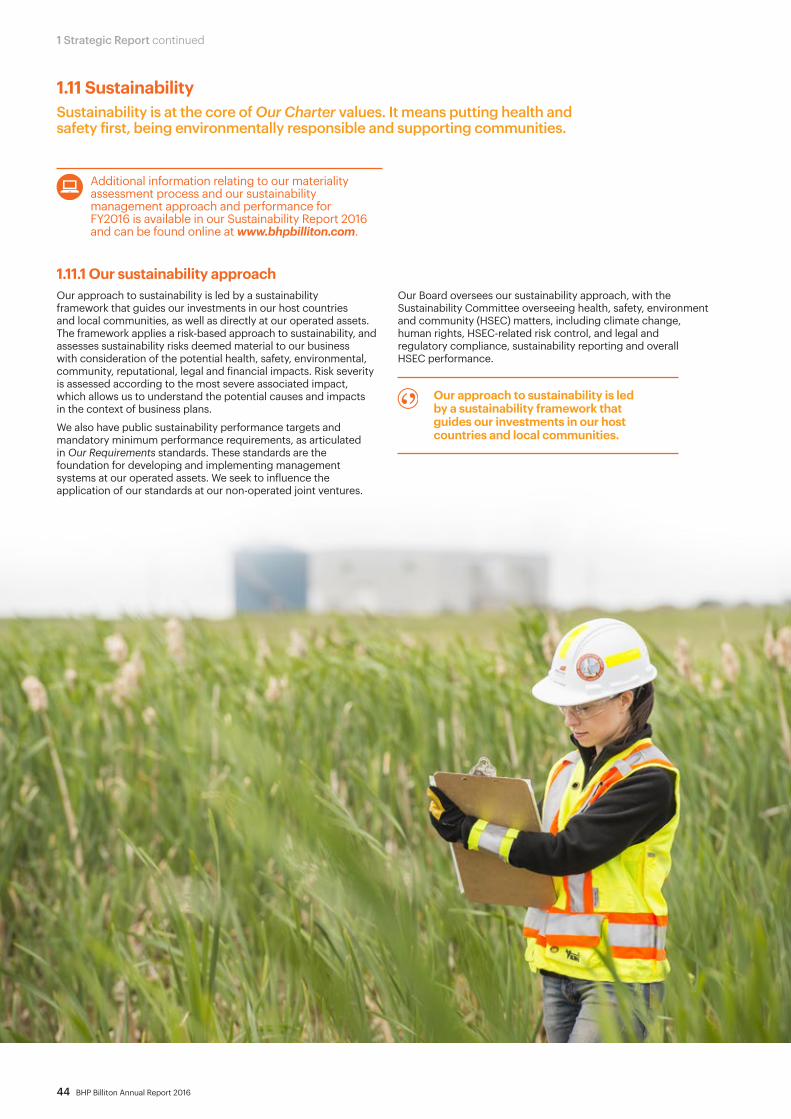
44 BHP Billiton Annual Report 2016
1 Strategic Report continued
1.11.1 Our sustainability approachOur approach to sustainability is led by a sustainability framework that guides our investments in our host countries and local communities, as well as directly at our operated assets. The framework applies a risk-based approach to sustainability, and assesses sustainability risks deemed material to our business with consideration of the potential health, safety, environmental, community, reputational, legal and financial impacts. Risk severity is assessed according to the most severe associated impact, which allows us to understand the potential causes and impacts in the context of business plans.
We also have public sustainability performance targets and mandatory minimum performance requirements, as articulated in Our Requirements standards. These standards are the foundation for developing and implementing management systems at our operated assets. We seek to influence the application of our standards at our non-operated joint ventures.
Our Board oversees our sustainability approach, with the Sustainability Committee overseeing health, safety, environment and community (HSEC) matters, including climate change, human rights, HSEC-related risk control, and legal and regulatory compliance, sustainability reporting and overall HSEC performance.
Our approach to sustainability is led by a sustainability framework that guides our investments in our host countries and local communities.
1.11 SustainabilitySustainability is at the core of Our Charter values. It means putting health and safety first, being environmentally responsible and supporting communities.
Additional information relating to our materiality assessment process and our sustainability management approach and performance for FY2016 is available in our Sustainability Report 2016 and can be found online at www.bhpbilliton.com.
BHP Billiton Annual Report 2016 45
2 Governance at BH
P Billiton3
Remuneration Report
4 D
irectors’ Report 1
Strategic Report
Our perspective on climate changeWe accept the Intergovernmental Panel on Climate Change (IPCC) assessment of climate change science, which has found that warming of the climate is unequivocal, the human influence is clear and physical impacts are unavoidable.
The world is facing two critical challenges. As the global population steadily grows, the continued development of emerging economies depends on access to reliable and affordable energy. At the same time, limiting the negative impacts of climate change requires the global average temperature increase to remain well below two degrees Celsius relative to pre-industrial levels. Successfully addressing these two challenges will result in substantial changes to the global economy.
We believe:• The world must pursue the twin objectives of:
− limiting climate change to the lower end of the IPCC emission scenarios in line with current international agreements, while − providing access to reliable and affordable energy to support economic development and improved living standards.
• Both of these objectives are essential to sustainable development, and we do not prioritise one of these objectives over the other.• Under all current plausible scenarios, fossil fuels will continue to be a significant part of the energy mix for decades.• There needs to be an acceleration of effort to drive energy efficiency, develop and deploy low-emissions technology and adapt
to the impacts of climate change.• There should be a price on carbon, implemented in a way that addresses competitiveness concerns and achieves lowest cost
emissions reductions.
We will:• Continue to take action to reduce our emissions.• Continue to build the resilience of our operations, investments, communities and ecosystems to the negative effects of climate change.• Seek to enhance the global response by engaging with governments, recognising their role as policy makers.• Work in partnership with resource sector peers to improve sectoral performance and increase the industry’s influence in policy
development to deliver effective long-term regulatory responses.• Contribute to reducing emissions from the use of fossil fuels by making material investments in low-emissions technology.
Our approachRole and responsibilitySustainable development requires an effective response to climate change. Responding to climate change is a priority Board governance and strategic issue for our Company. Management has primary responsibility for the design and implementation of an effective position on, and response to, climate change.
To reflect updates in scientific knowledge and global regulatory and political responses, we regularly review our position on climate change. We incorporate climate change considerations into our Group scenario planning to understand potential impacts on our portfolio. The Sustainability Committee has considered a range of climate change scenarios and continues to monitor the actions being taken to manage a range of climate change impacts and policy responses. Performance against our greenhouse gas (GHG) emissions target contributes to our HSEC performance, which is measured as a balanced scorecard within the overall annual financial bonus assessment for our management.
As part of our strategic approach, we continue to share lessons learned with our stakeholders and identify solutions that we believe can drive emissions reductions at lowest cost.
Active engagementOur climate change strategy is underpinned by active engagement with our stakeholders, including investors, policy makers, peer companies and non-government organisations. Industry has a key role to play in climate change policy development by working with government and other stakeholders to inform the development of an effective, long-term policy framework that delivers a measured transition to a lower emissions economy.
As part of our strategic approach, we regularly seek to share lessons learned with our stakeholders and identify solutions that we believe can drive emissions reductions at the lowest cost. We also seek input and insight from external experts, such as the Forum on Corporate Responsibility. BHP Billiton is a signatory to the World Bank’s ‘Putting a Price on Carbon’ statement, and we are a member of the World Bank’s Carbon Pricing Leadership Coalition.
In September 2015, BHP Billiton signed the CEO Statement on Business, Climate Change and the Paris Negotiations, calling for a positive outcome at the United Nations Framework Convention on Climate Change (UNFCCC) 21st Conference of the Parties (COP21). Additionally, together with a group of public, private and social leaders, we joined the Energy Transitions Commission, which aims to ‘identify pathways for change in our energy systems to ensure both better growth and a better climate’.
More information is available in our Sustainability Report 2016, which can be found online at www.bhpbilliton.com.
1.11.2 Climate Change
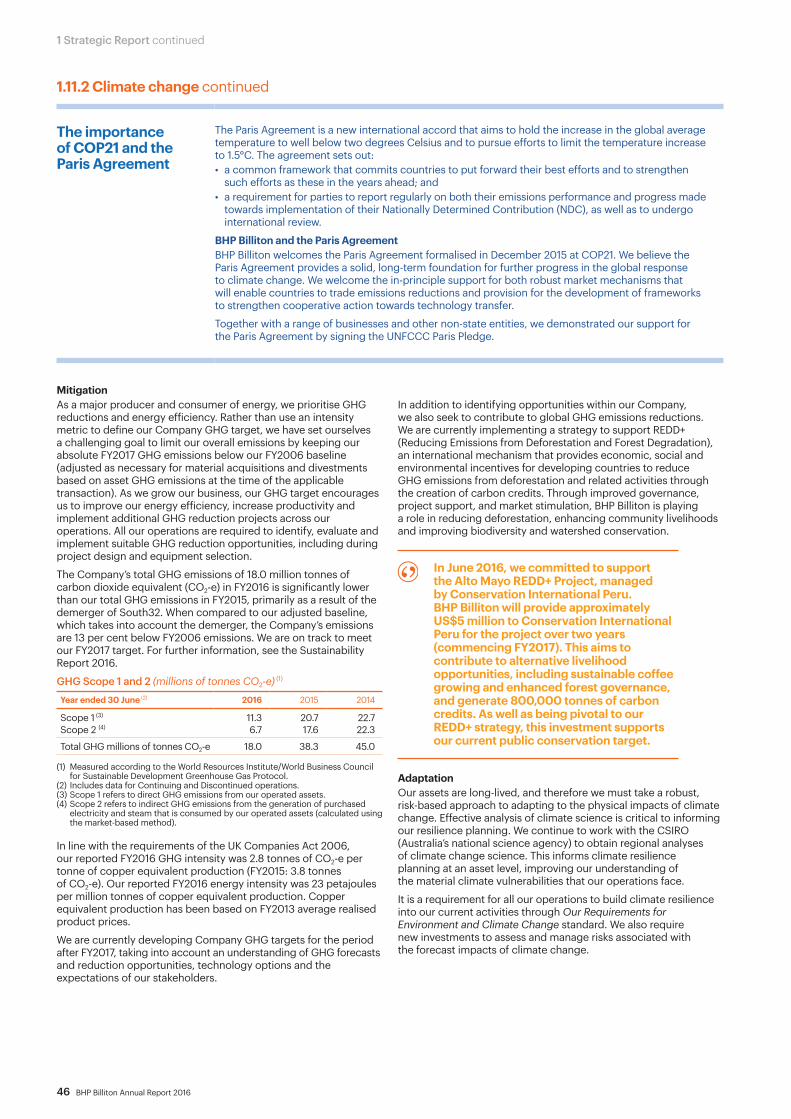
46 BHP Billiton Annual Report 2016
1 Strategic Report continued
1.11.2 Climate change continued
The importance of COP21 and the Paris Agreement
The Paris Agreement is a new international accord that aims to hold the increase in the global average temperature to well below two degrees Celsius and to pursue efforts to limit the temperature increase to 1.5°C. The agreement sets out:• a common framework that commits countries to put forward their best efforts and to strengthen
such efforts as these in the years ahead; and • a requirement for parties to report regularly on both their emissions performance and progress made
towards implementation of their Nationally Determined Contribution (NDC), as well as to undergo international review.
BHP Billiton and the Paris AgreementBHP Billiton welcomes the Paris Agreement formalised in December 2015 at COP21. We believe the Paris Agreement provides a solid, long-term foundation for further progress in the global response to climate change. We welcome the in-principle support for both robust market mechanisms that will enable countries to trade emissions reductions and provision for the development of frameworks to strengthen cooperative action towards technology transfer.
Together with a range of businesses and other non-state entities, we demonstrated our support for the Paris Agreement by signing the UNFCCC Paris Pledge.
MitigationAs a major producer and consumer of energy, we prioritise GHG reductions and energy efficiency. Rather than use an intensity metric to define our Company GHG target, we have set ourselves a challenging goal to limit our overall emissions by keeping our absolute FY2017 GHG emissions below our FY2006 baseline (adjusted as necessary for material acquisitions and divestments based on asset GHG emissions at the time of the applicable transaction). As we grow our business, our GHG target encourages us to improve our energy efficiency, increase productivity and implement additional GHG reduction projects across our operations. All our operations are required to identify, evaluate and implement suitable GHG reduction opportunities, including during project design and equipment selection.
The Company’s total GHG emissions of 18.0 million tonnes of carbon dioxide equivalent (CO2-e) in FY2016 is significantly lower than our total GHG emissions in FY2015, primarily as a result of the demerger of South32. When compared to our adjusted baseline, which takes into account the demerger, the Company’s emissions are 13 per cent below FY2006 emissions. We are on track to meet our FY2017 target. For further information, see the Sustainability Report 2016.
GHG Scope 1 and 2 (millions of tonnes CO2-e) (1)
Year ended 30 June (2) 2016 2015 2014
Scope 1 (3) 11.3 20.7 22.7Scope 2 (4) 6.7 17.6 22.3
Total GHG millions of tonnes CO2-e 18.0 38.3 45.0
(1) Measured according to the World Resources Institute/World Business Council for Sustainable Development Greenhouse Gas Protocol.
(2) Includes data for Continuing and Discontinued operations.(3) Scope 1 refers to direct GHG emissions from our operated assets.(4) Scope 2 refers to indirect GHG emissions from the generation of purchased
electricity and steam that is consumed by our operated assets (calculated using the market-based method).
In line with the requirements of the UK Companies Act 2006, our reported FY2016 GHG intensity was 2.8 tonnes of CO2-e per tonne of copper equivalent production (FY2015: 3.8 tonnes of CO2-e). Our reported FY2016 energy intensity was 23 petajoules per million tonnes of copper equivalent production. Copper equivalent production has been based on FY2013 average realised product prices.
We are currently developing Company GHG targets for the period after FY2017, taking into account an understanding of GHG forecasts and reduction opportunities, technology options and the expectations of our stakeholders.
In addition to identifying opportunities within our Company, we also seek to contribute to global GHG emissions reductions. We are currently implementing a strategy to support REDD+ (Reducing Emissions from Deforestation and Forest Degradation), an international mechanism that provides economic, social and environmental incentives for developing countries to reduce GHG emissions from deforestation and related activities through the creation of carbon credits. Through improved governance, project support, and market stimulation, BHP Billiton is playing a role in reducing deforestation, enhancing community livelihoods and improving biodiversity and watershed conservation.
In June 2016, we committed to support the Alto Mayo REDD+ Project, managed by Conservation International Peru. BHP Billiton will provide approximately US$5 million to Conservation International Peru for the project over two years (commencing FY2017). This aims to contribute to alternative livelihood opportunities, including sustainable coffee growing and enhanced forest governance, and generate 800,000 tonnes of carbon credits. As well as being pivotal to our REDD+ strategy, this investment supports our current public conservation target.
Adaptation Our assets are long-lived, and therefore we must take a robust, risk-based approach to adapting to the physical impacts of climate change. Effective analysis of climate science is critical to informing our resilience planning. We continue to work with the CSIRO (Australia’s national science agency) to obtain regional analyses of climate change science. This informs climate resilience planning at an asset level, improving our understanding of the material climate vulnerabilities that our operations face.
It is a requirement for all our operations to build climate resilience into our current activities through Our Requirements for Environment and Climate Change standard. We also require new investments to assess and manage risks associated with the forecast impacts of climate change.
BHP Billiton Annual Report 2016 47
2 Governance at BH
P Billiton3
Remuneration Report
4 D
irectors’ Report 1
Strategic Report
1.11.2 Climate change continuedTesting the resilience of our operations to these physical impacts has already changed the way we work. For example: • Identification and assessment of increasing storm intensity
and storm surge levels in project design resulted in us raising the height of the trestle at our Hay Point coal port facility in Queensland as part of our expansion plans.
• In our Western Australia Iron Ore (WAIO) business, cyclone management is critical for operations and maintaining adaptive management practices will allow them to respond to the expected increase in cyclone intensity in the Pilbara.
Low-emissions technology Technology and innovation have the potential to significantly reduce global emissions and enable long-term climate goals to be met. Given that fossil fuels are likely to continue to be a significant part of the energy mix for decades, it is vital that low-emissions technology is available at scale, lower cost and much faster than the usual commercial timeframes, to meet the challenge of climate change. We believe industry has a significant collaborative role to play with government, academia and the community to facilitate this necessary step change.
As a natural resource producer, it is not only important for us to focus on technologies that have the potential to lead to material emissions reductions in our operations, but also to assess how we can contribute to lowering the emissions from the use of our products. We look to develop technologies that align with the Company’s skills and expertise but are currently not available at commercial scale or acceptable cost. This includes carbon capture and storage (CCS), technologies to reduce fugitive emissions from coal and petroleum operations, battery storage and high-efficiency/low-emissions power generation and transportation.
Renewable energy represents a potentially significant opportunity for our operations. Battery storage solutions at grid-scale, particularly to manage the intermittency of renewable energy and to provide security of supply, may transform the way that the resources sector accesses electricity. To learn more, we are participating in the innovative Lakeland Solar and Storage Project, a 13 megawatt solar photovoltaic installation with associated grid-scale storage of 5.3 megawatt hour located at the fringe of the grid in regional Queensland, Australia. Our contribution to the project will enable informed testing of the installation for a range of conditions experienced in the resources sector. Outcomes will provide significant insight for BHP Billiton, and the results of the project will be shared widely.
BHP Billiton and Saskatchewan-based electricity provider SaskPower have established the International CCS Knowledge Centre to help advance CCS as a means of managing GHG emissions. The Knowledge Centre will enhance global access to the data, information and lessons learned from SaskPower’s unique Boundary Dam facility – the first power plant to successfully integrate CCS. In sharing the outcomes of this unique project broadly, we hope to assist project developers to reduce both the capital and operating costs of subsequent projects.
In June 2016, we announced an agreement with Peking University to help unlock the potential of CCS for steel production in China.
The three-year agreement will identify the key technical, policy and economic barriers to CCS deployment in the industrial sector, with a particular focus on the steel industry. Research outcomes will be communicated via collaborative industry forums and conferences, and a multidisciplinary Advisory Board will guide the research team. The partnership is an example of how we work with our supply chain to reduce emissions.
More information on our approach to low-emissions technology is available in our Sustainability Report.
Transparent reportingWe recognise the importance of openly engaging on a regular basis with our stakeholders, including investors, to ensure a good understanding of how climate-related risks and opportunities are identified, assessed and managed.
We have an ongoing commitment to transparent and open communications through our voluntary submission to CDP (formerly the Carbon Disclosure Project, refer to www.cdp.net). Our commitment to the enhancement of disclosure has resulted in a significant improvement in our CDP transparency score since FY2013. Reflecting this, BHP Billiton was included in the Climate Disclosure Leadership Index in 2015, with a disclosure score of 99 out of 100.
A key feature of COP21 was the strong support from the investment community, including the announcement of the Financial Stability Board’s Taskforce on Climate-related Financial Disclosures (TCFD). This industry-led group aims to develop voluntary, consistent climate-related financial risk disclosures that would be useful to lenders, insurers, investors and other stakeholders. The TCFD is chaired by Michael Bloomberg and comprises senior technical representatives from organisations that are both ‘preparers’ and ‘users’ of company disclosures. BHP Billiton’s Vice President of Sustainability and Climate Change, Dr Fiona Wild, is a member of the TCFD. We see this as a strong endorsement of the work we have already undertaken.
Portfolio evaluation We continue to identify and assess the impacts of climate change on our portfolio. Our planning process starts with the construction of a central case, a forecast built through an in-depth, bottom-up analysis using rigorous processes and benchmarked with external views. This central case is thoroughly reviewed and endorsed periodically by the ELT and the Board.
Scenarios that describe the different ways the world could evolve beyond our central case allow us to explore potential portfolio discontinuities and opportunities. In our Climate Change: Portfolio Analysis report (released in September 2015), we outlined four different scenarios, each designed to be divergent, plausible and internally consistent. Our four scenarios assess the timing and implementation of various government policies, emission reduction targets and technology developments. In one of the scenarios, we see a more unified focus on limiting climate change, including an orderly transition to a two degree Celsius world. We also stress test our portfolio against a shock event that leads to a much more rapid transition to a two degree Celsius world by 2030, driven by higher government emission reduction targets and faster technology developments.
The analysis highlights that our uniquely diversified portfolio of high-quality, low-cost assets is robust under both an orderly and a more rapid transition to a two degree Celsius world. We also have a strong project pipeline with many capital-efficient growth options that continue to generate high shareholder value in a two degree Celsius world. We will continue to align our portfolio to where we see a strong long-term growth story for different commodities. Further information on the potential risk that climate change represents to the Company, including regulatory impacts, is covered in section 1.9.2.
There will be many risks and opportunities as the world continues to respond to climate change and they will be faced by companies in all sectors, albeit to varying degrees. With the right market settings, including a price on carbon, the greatest opportunities will emerge for those who can produce the lowest cost and most efficient solutions, in line with the expectations of communities and policy makers.
Our Climate Change: Portfolio Analysis report is available online at www.bhpbilliton.com.

48 BHP Billiton Annual Report 2016
1 Strategic Report continued
Operating with integrity and transparencyIntegrity and accountability are two of Our Charter values. We believe high governance standards are integral to creating long-term value.
We are committed to ethical business practice. While we operate in a variety of international regulatory environments, we always seek to go beyond minimum legal or regulatory compliance wherever we work.
Our BHP Billiton Code of Business Conduct sets behavioural standards for everyone who works for, or on behalf of, BHP Billiton and demonstrates how to apply the values and commitments set out in Our Charter. Acting in accordance with the Code is a condition of employment, and annual risk-based Code of Business Conduct training must be undertaken by all our people in each area of the organisation.
Anti-corruption complianceCorruption deprives communities of the benefits that should flow from the development of natural resources and undermines effective government decision-making.
We are determined to play a significant role in the global fight against corruption in the resources industry. Building on a strong framework, we are committed to continuous improvement and work to adapt our compliance program to changes in the Company’s risk profile.
BHP Billiton’s compliance function is responsible for the design of the anti-corruption compliance program and plays a key role in advising, monitoring and reporting on program implementation. The function is independent of our operations and reports via the Chief Compliance Officer to the Chief External Affairs Officer and the Risk and Audit Committee.
Closure planningClosure planning touches many areas of our operations and is an important consideration throughout the life cycle of our operations. We have a governance framework for mine closures that integrates resource planning and development, health, safety, environment, community and social considerations, stakeholder engagement, finance and assurance into the operational design.
Each operated asset must develop a closure plan and a corresponding financial assessment to minimise closure-related risks over the life of the asset. Our internal audit function tests the effectiveness of these plans and their alignment to the closure planning framework. Information about the financial provisions related to closure liabilities is available in note 14 ‘Closure and rehabilitation provisions’ to the Financial Statements.
Contributing to local and national economies and beyondThe scale and long-term nature of our assets enable us to make a significant and long-term economic contribution to the countries in which we operate, and this is a key feature of our commitment to sustainability.
Payments to host governmentsWe also support local and national economies through the payment of taxes and royalties to our host governments. We act responsibly in relation to our tax affairs, to be able to provide our host communities with the best opportunity to benefit from these contributions.
BHP Billiton is a founding supporter of the Extractive Industries Transparency Initiative and an early adopter of best practice in disclosure and transparency.
We believe transparency by governments and companies around revenue flows from the extraction of natural resources is an important element in the fight against corruption.
Our payments of US$3.7 billion of taxes and royalties on a project-by-project basis and payments to state and provincial governments at a subnational level in FY2016 are presented in our standalone Economic contribution and payments to governments Report 2016.
The Economic contribution and payments to governments Report 2016 is available online at www.bhpbilliton.com.
1.11.3 Governance
BHP Billiton Annual Report 2016 49
2 Governance at BH
P Billiton3
Remuneration Report
4 D
irectors’ Report 1
Strategic Report
1.11.4 Health and safetyManaging our responsibility for people’s safetyWhen reflecting on safety for the year, our thoughts are with the families and friends of the 19 people who died as a result of the tragic dam failure at Samarco. We remain committed to supporting Samarco in the response efforts to the tragedy. For more information on the Samarco dam failure, refer to section 1.4.
In developing our broader safety strategy for our operated assets, in FY2016, we reviewed our priorities under each material safety issue, assessed our performance and determined our priorities. This was the foundation for functional planning. Over time we will continue embedding the desired safety culture, capability and systems to meet our aspirations and drive better performance.
The Our Requirements for Safety standard defines a number of the most common safety risks and their minimum controls. Each operated asset assesses further controls that may be required to manage specific risks at its operations to meet the objective of no fatalities.
In FY2016, we had no fatalities at our operated assets and there was a reduction in high-potential safety events.
Our total recordable injury frequency (TRIF) performance in FY2016 was 4.3 per million hours worked, a slight increase on FY2015. While we did not meet our target of year-on-year TRIF improvement, this represents a reduction of nine per cent over the past five years.
Total recordable injury frequency (per million hours worked)
Year ended 30 June 2016 2015 2014
Total recordable injury frequency (TRIF) (1) 4.3 4.1 4.2
(1) Includes data for continuing and discontinued operations for the financial years being reported.
Addressing potential health impacts associated with our operationsWe strive to ensure our people are fit for work and remain free from work-related injury or illness.
Our operated assets seek to identify and manage health risks by establishing and maintaining exposure risk profiles for harmful agents. We manage our exposures by complying with our internally specified occupational exposure limits that are always at least in line with, or more stringent than, applicable regulated limits. Where relevant, we monitor the health status of our people to detect early signs of occupational illness. Where illness is detected, we assist our people in the recovery and management of illness to prevent further deterioration.
We also invest in the quality of public health in many ways, including improving access to general medical care in the communities in which we operate.
Occupational exposuresIn FY2012, we established a health target baseline and committed to reducing potential occupational exposure (1) to carcinogens and airborne contaminants by 10 per cent by 30 June 2017. As at FY2016, the number of potential exposures to carcinogens and airborne contaminants that exceeded our FY2012 baseline had reduced by 70 per cent. We have therefore exceeded our target to date. (2)
While good progress has been made in controlling occupational exposures to carcinogens and airborne contaminants, we remain vigilant in adopting and maintaining exposure controls.(1) For exposures exceeding our FY2012 baseline occupational exposure limits
requiring the use of personal protective equipment.(2) Since setting the baseline in FY2012, the baseline has been adjusted for material
acquisitions and divestments. In FY2016, the baseline was adjusted to reflect divested operations, which represented approximately 60 per cent of our exposures. Our performance against targets has been impacted by the removal of the divested assets’ data with current operated assets showing larger reductions than those reported for the Company in previous years. The contraction of the industry during FY2016 also influenced our performance, with a notable proportion of the exposure reduction due to decreased activity. However, we also made significant improvements with engineering controls.
Queensland coal health reviewIn FY2016, the Queensland Government initiated a review of the Queensland Coal Mine Workers’ Health Scheme, following the identification of a number of confirmed cases of coal workers’ pneumoconiosis across the industry. We actively supported the review process and are working with the government to implement the recommendations. We are continuing to invest in and improve controls to further reduce the potential for exposure to coal mine dust, noting that our internal coal mine dust occupational exposure limit is lower than the current Australian regulatory requirements. In addition, we have offered concerned employees consultations with the Company’s nominated medical advisers.
Occupational illnessFor reporting consistency, we require our operated assets to report illnesses using the US Government’s Occupational Safety and Health Administration (OSHA) criteria.
The incidence of employee occupational illness in FY2016 was 4.17 per million hours worked, a decease of 15 per cent on FY2015. The incidence of contractor occupational illness was 1.16 per million hours worked, an increase of 38 per cent compared with FY2015.
We continue to work with our contractors and regulatory medical surveillance agencies to collect the most accurate data available and monitor occupational illness carefully to ensure our improvement is sustained.
The majority of our occupational illnesses reported are noise-induced hearing loss and musculoskeletal illness.
Employee occupational illness (per million hour worked)
Year ended 30 June 2016 2015 2014
Noise-induced hearing loss 1.75 3.05 0.68Musculoskeletal 1.75 1.52 1.61Other illnesses 0.67 0.36 0.55Total occupational illness 4.17 4.93 2.39
50 BHP Billiton Annual Report 2016
1 Strategic Report continued
1.11.5 SocietyActively supporting communitiesAs part of making a valuable contribution as community partners, we seek meaningful long-term relationships that respect local cultures and create lasting benefits. Our community relations approach is detailed in the Our Requirements for Community standard.
The identification and management of community risks are central to achieving our purpose and strategy. Community risks of greatest concern are those involving safety and security, resettlement, community health, economic impacts and any event that leads to a breach of human rights. While no significant community incidents occurred at our operated assets, we deeply regret the significant community impacts of the dam failure at our non-operated joint venture, Samarco, in Brazil.
Making a positive contributionThrough a collaborative approach, we work with communities to identify social needs and existing resources through which we can build our social investment. Our Social Investment Framework, implemented in FY2015, underpins our voluntary social investment from FY2016–FY2020 and provides a consistent framework for our local, regional, national and global investment. This Framework aligns strongly with the UN Sustainable Development Goals.
Where possible, we employ local people and purchase local goods and services. We support local, regional and national economies by paying taxes and royalties, and we seek to develop infrastructure that benefits entire communities.
We believe we also have a responsibility, in line with Our Charter values, to acknowledge our host communities through our voluntary social investment. To do this, we voluntarily invest one per cent of our pre-tax profit in community programs (calculated on the average of the previous three years’ pre-tax profit).
During FY2016, our voluntary social investment totalled US$178.7 million, comprising US$123.7 million of cash for community development programs and administrative costs and a US$55 million contribution to the US-based charity, the BHP Billiton Foundation.
Excluding our contribution to the BHP Billiton Foundation, 45 per cent of the cash component of our social investment expenditure was invested in local communities, 29 per cent was invested regionally, 21 per cent was invested in national or international programs in countries where we operate, and the remaining five per cent expenditure represented administration costs.
Social investment (US$M)
Year ended 30 June 2016 2015 2014
Expenditure (1) (including administrative costs) 123.7 142.0 141.7Contribution into BHP Billitonsupported charities 55.0 83.0 100.0Total social investment 178.7 225.0 241.7
(1) Includes BHP Billiton’s equity share for both operated and non-operated joint venture operations.
BHP Billiton supported charitiesBHP Billiton Sustainable Communities (UK-based) and the BHP Billiton Foundation (US-based) are two charities that contribute to improving the quality of life for people living in regions and countries where we have a business interest and in other regions of the world, as each charity may independently select. These two charities provide grants to organisations, enabling them to deliver large-scale, long-term social and environmental development projects. Our contribution to the BHP Billiton Foundation complements the local community development work undertaken by our assets.
At the end of FY2016, BHP Billiton Sustainable Communities had a total of US$60.4 million, and the BHP Billiton Foundation had a total of US$277.5 million, in funds available for future sustainable development projects.
Working with Indigenous peoplesAs the majority of our assets are located on or near Indigenous peoples’ lands, Indigenous peoples are critical partners for BHP Billiton around the world.
Our approach to engaging with Indigenous peoples is articulated in the BHP Billiton Indigenous Peoples Policy Statement. In our Policy Statement, we commit to the International Council on Mining and Metals (ICMM) Indigenous Peoples and Mining Position Statement.
In FY2016, we developed a global BHP Billiton Indigenous Peoples Strategy to guide effective implementation of our Indigenous Peoples Policy Statement across our businesses.
Through successful implementation of this strategy, we aim to be regarded as a partner of choice for Indigenous peoples through which we will respect their rights and seek to ensure our relationships contribute to their economic empowerment, social development needs and cultural wellbeing.
Realising and respecting human rightsRespect for human rights is critical to the sustainability of our business. We take our human rights obligations seriously. We demonstrate this by committing to operate in a manner consistent with the United Nations (UN) Universal Declaration of Human Rights, the UN Guiding Principles on Business and Human Rights and the 10 UN Global Compact principles.
Our human rights commitments outlined in our Code of Business Conduct are operationalised through mandatory human rights performance requirements for each of our operated assets reflected in Our Requirements standards.
Each of our operated assets assigns accountability for compliance with Our Requirements for Human Rights standard to appropriate senior managers and leaders. We obtain assurance of compliance with our human rights commitments through internal audits of operational compliance with relevant Our Requirements standards.
Governance oversight of BHP Billiton human rights performance is the responsibility of the Board’s Sustainability Committee as part of its mandate for monitoring HSEC-related performance.
Ok TediBHP Billiton exited from Ok Tedi Mining Limited (OTML) in February 2002. The exit arrangements included the transfer of BHP Billiton’s shares in OTML to PNG Sustainable Development Program Limited (PNGSDP) and a statutory undertaking protecting BHP Billiton from environmental claims by the PNG Government. In September 2013, the Papua New Guinea (PNG) Parliament passed laws which compulsorily acquired PNGSDP’s shares in OTML and changed other aspects of the exit arrangements, including the repeal of the protection from environmental claims by the PNG Government.
PNGSDP is challenging the validity of actions taken by the PNG Government to compulsorily acquire its OTML shares and to restructure and obtain control of PNGSDP. BHP Billiton retains an indemnity from PNGSDP in respect of environmental claims by the PNG Government and certain environmental claims by third parties. This indemnity is secured against certain key assets of PNGSDP. BHP Billiton remains committed to ensuring that the substantial long-term fund held by PNGSDP remains well governed for the benefit of the people of Papua New Guinea, and the Western Province in particular.

BHP Billiton Annual Report 2016 51
2 Governance at BH
P Billiton3
Remuneration Report
4 D
irectors’ Report 1
Strategic Report
1.11.6 EnvironmentUsing responsible and sustainable environmental practicesOur operations can have significant environmental impacts. Additionally, our operations and growth strategy are dependent on obtaining and maintaining access to environmental resources. We are committed to our environmental obligations, as detailed in Our Requirements for Environment and Climate standard.
Environmental incidents Environmental incidents have the potential to generate long-lasting physical, socio-economic and psycho-social impacts. We seek to avoid environmental incidents by identifying risks with potential environmental impacts and applying preventative controls, including implementing the mitigation hierarchy. In addition, all our operated assets are required to maintain emergency response plans as mitigating controls to minimise the potential severity of impacts should an incident occur.
While no significant environmental incidents occurred at any BHP Billiton-operated assets in FY2016, we deeply regret the significant environmental impacts of the dam failure at Samarco, our non-operated joint venture in Brazil.
Biodiversity and land managementAcross our organisation, we hold ourselves to account through targets for biodiversity conservation and land management.
In FY2016, each of our operated assets achieved their specific targets for land and biodiversity management planning, while at a wider company level, our conservation target has seen us contribute more than US$27.5 million to the conservation and ongoing management of nationally and internationally significant areas of high biodiversity and ecosystem value since FY2013.
Around our operated assets, we have made the following commitments:• to not explore or extract resources within the boundaries
of World Heritage-listed properties; • to not explore or extract resources adjacent to World
Heritage-listed properties (unless our activity is compatible with the property’s outstanding universal values);
• to not explore or extract resources within the boundaries of the International Union for Conservation and Nature (IUCN) Protected Areas Categories I to IV, unless we can implement a plan that meets regulatory requirements, takes into account stakeholder expectations and contributes to the values for which the protected area is listed;
• to not operate where we could directly impact ecosystems resulting in the extinction of an IUCN Red List Threatened Species in the wild;
• to not dispose of mined waste rock or tailings into a river or marine environment.
Rehabilitating land no longer required for our activities is integral to managing our impacts on land and biodiversity. Our operated assets are required to maintain rehabilitation plans that support life of asset and closure plans. This includes rehabilitating disturbed areas consistent with the pre-disturbance land use or an alternate use, taking into account regulatory requirements and stakeholder expectations.
Managing water responsiblyThe sustainability of our assets relies on our ability to obtain an appropriate quality and quantity of water, use it responsibly and manage it appropriately, including taking account of natural supply variations. With assets located across the world, the water-related risks and impacts experienced by our assets vary from region to region. We therefore assess and manage our water-related risks on a regional basis.
All our operated assets are required to maintain quantitative water balance models that predict and support the management of water inputs, use and outputs, consistent with business strategies and plans and facilitate timely management responses to water-related risks. Where possible, we seek to use lower-quality or recycled water to minimise extraction requirements from higher-quality water resources.
We report our water use, consistent with the Input Output model of the Minerals Council of Australia Water Accounting Framework. Under this Framework, water is categorised as Type 1 (close to drinking water standards), Type 2 (suitable for some purposes) and Type 3 (unsuitable for most purposes).
Our total water input (water intended for use) in FY2016 was 282,800 megalitres with 88 per cent defined as Type 2 or Type 3. This demonstrates our approach to utilising lower-quality water wherever feasible.
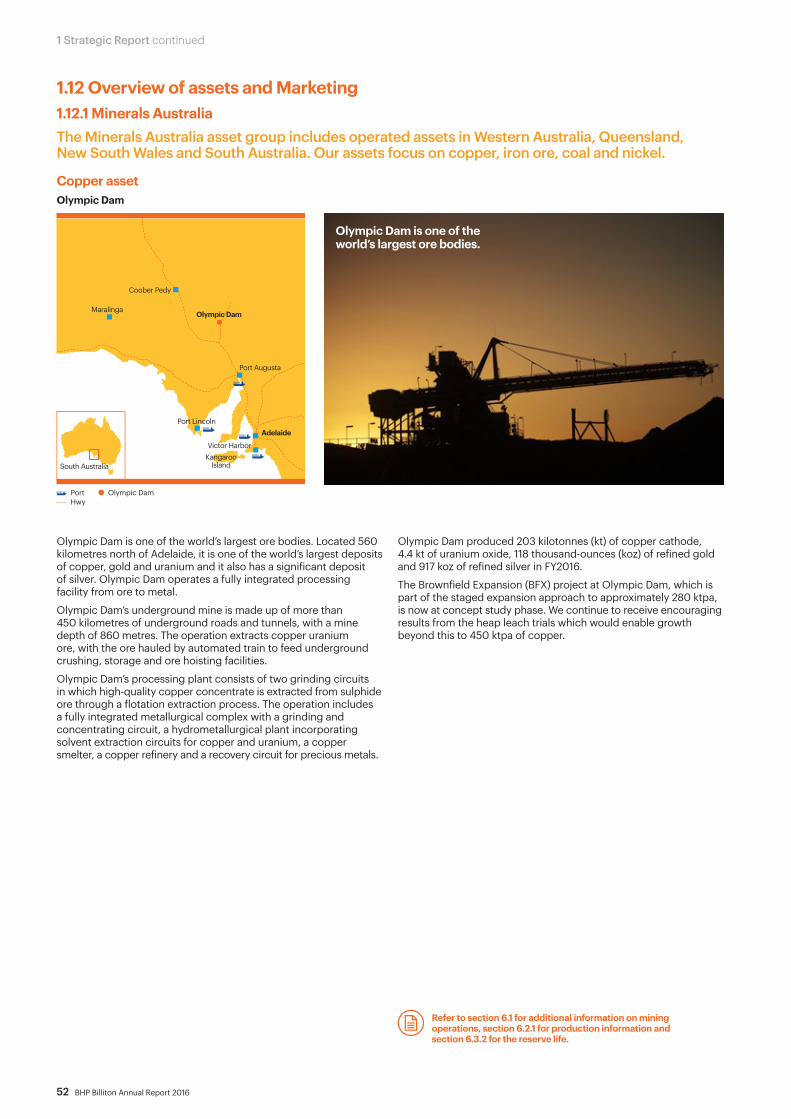
52 BHP Billiton Annual Report 2016
Olympic DamPortHwy
Adelaide
Port Augusta
Coober Pedy
Maralinga
Port Lincoln
Victor HarborKangaroo
Island
Olympic Dam
South Australia
1 Strategic Report continued
Copper asset Olympic Dam
1.12 Overview of assets and Marketing1.12.1 Minerals Australia The Minerals Australia asset group includes operated assets in Western Australia, Queensland, New South Wales and South Australia. Our assets focus on copper, iron ore, coal and nickel.
Olympic Dam is one of the world’s largest ore bodies. Located 560 kilometres north of Adelaide, it is one of the world’s largest deposits of copper, gold and uranium and it also has a significant deposit of silver. Olympic Dam operates a fully integrated processing facility from ore to metal.
Olympic Dam’s underground mine is made up of more than 450 kilometres of underground roads and tunnels, with a mine depth of 860 metres. The operation extracts copper uranium ore, with the ore hauled by automated train to feed underground crushing, storage and ore hoisting facilities.
Olympic Dam’s processing plant consists of two grinding circuits in which high-quality copper concentrate is extracted from sulphide ore through a flotation extraction process. The operation includes a fully integrated metallurgical complex with a grinding and concentrating circuit, a hydrometallurgical plant incorporating solvent extraction circuits for copper and uranium, a copper smelter, a copper refinery and a recovery circuit for precious metals.
Olympic Dam produced 203 kilotonnes (kt) of copper cathode, 4.4 kt of uranium oxide, 118 thousand-ounces (koz) of refined gold and 917 koz of refined silver in FY2016.
The Brownfield Expansion (BFX) project at Olympic Dam, which is part of the staged expansion approach to approximately 280 ktpa, is now at concept study phase. We continue to receive encouraging results from the heap leach trials which would enable growth beyond this to 450 ktpa of copper.
Olympic Dam is one of the world’s largest ore bodies.
Refer to section 6.1 for additional information on mining operations, section 6.2.1 for production information and section 6.3.2 for the reserve life.
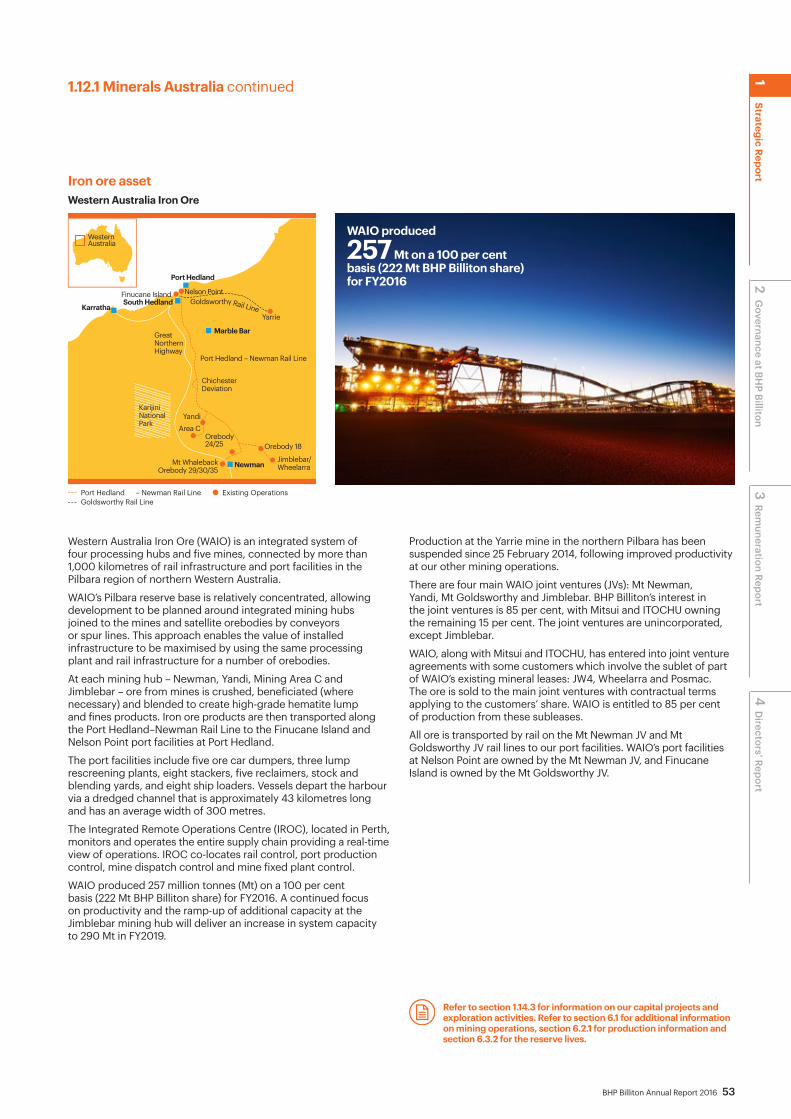
BHP Billiton Annual Report 2016 53
Port Hedland – Newman Rail LineGoldsworthy Rail Line
Existing Operations
Marble Bar
Orebody 18
Newman
Orebody24/25
YandiArea C
Mt WhalebackOrebody 29/30/35
Jimblebar/Wheelarra
Port Hedland – Newman Rail Line
Goldsworthy
ChichesterDeviation
Finucane Island
Karratha
GreatNorthern Highway
Yarrie
South Hedland
KarijiniNational Park
Rail Line
Nelson Point
Port Hedland
WesternAustralia
Iron ore assetWestern Australia Iron Ore
1.12.1 Minerals Australia continued
Western Australia Iron Ore (WAIO) is an integrated system of four processing hubs and five mines, connected by more than 1,000 kilometres of rail infrastructure and port facilities in the Pilbara region of northern Western Australia.
WAIO’s Pilbara reserve base is relatively concentrated, allowing development to be planned around integrated mining hubs joined to the mines and satellite orebodies by conveyors or spur lines. This approach enables the value of installed infrastructure to be maximised by using the same processing plant and rail infrastructure for a number of orebodies.
At each mining hub – Newman, Yandi, Mining Area C and Jimblebar – ore from mines is crushed, beneficiated (where necessary) and blended to create high-grade hematite lump and fines products. Iron ore products are then transported along the Port Hedland–Newman Rail Line to the Finucane Island and Nelson Point port facilities at Port Hedland.
The port facilities include five ore car dumpers, three lump rescreening plants, eight stackers, five reclaimers, stock and blending yards, and eight ship loaders. Vessels depart the harbour via a dredged channel that is approximately 43 kilometres long and has an average width of 300 metres.
The Integrated Remote Operations Centre (IROC), located in Perth, monitors and operates the entire supply chain providing a real-time view of operations. IROC co-locates rail control, port production control, mine dispatch control and mine fixed plant control.
WAIO produced 257 million tonnes (Mt) on a 100 per cent basis (222 Mt BHP Billiton share) for FY2016. A continued focus on productivity and the ramp-up of additional capacity at the Jimblebar mining hub will deliver an increase in system capacity to 290 Mt in FY2019.
Production at the Yarrie mine in the northern Pilbara has been suspended since 25 February 2014, following improved productivity at our other mining operations.
There are four main WAIO joint ventures (JVs): Mt Newman, Yandi, Mt Goldsworthy and Jimblebar. BHP Billiton’s interest in the joint ventures is 85 per cent, with Mitsui and ITOCHU owning the remaining 15 per cent. The joint ventures are unincorporated, except Jimblebar.
WAIO, along with Mitsui and ITOCHU, has entered into joint venture agreements with some customers which involve the sublet of part of WAIO’s existing mineral leases: JW4, Wheelarra and Posmac. The ore is sold to the main joint ventures with contractual terms applying to the customers’ share. WAIO is entitled to 85 per cent of production from these subleases.
All ore is transported by rail on the Mt Newman JV and Mt Goldsworthy JV rail lines to our port facilities. WAIO’s port facilities at Nelson Point are owned by the Mt Newman JV, and Finucane Island is owned by the Mt Goldsworthy JV.
WAIO produced
257 Mt on a 100 per cent basis (222 Mt BHP Billiton share) for FY2016
Refer to section 1.14.3 for information on our capital projects and exploration activities. Refer to section 6.1 for additional information on mining operations, section 6.2.1 for production information and section 6.3.2 for the reserve lives.
2 Governance at BH
P Billiton3
Remuneration Report
4 D
irectors’ Report 1
Strategic Report
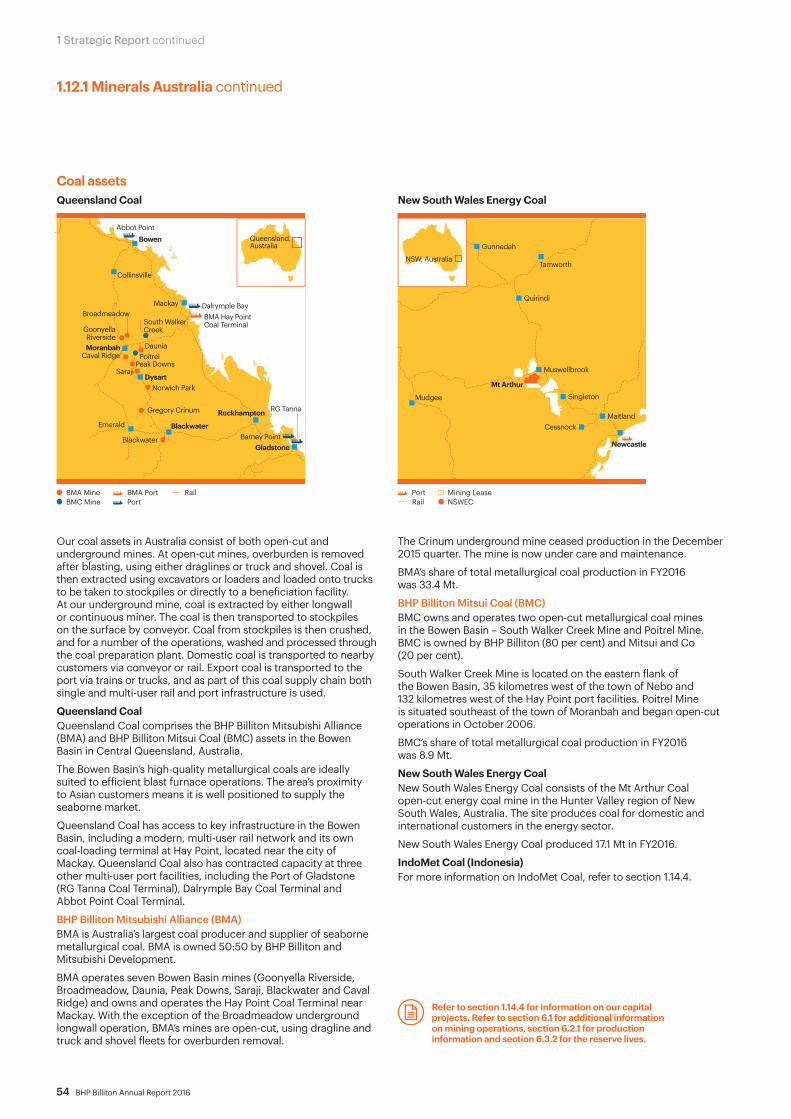
54 BHP Billiton Annual Report 2016
BMA MineBMC Mine
BMA PortPort
Rail
South WalkerCreek
Collinsville
Mackay
BowenAbbot Point
Dalrymple BayBMA Hay PointCoal Terminal
DauniaPoitrel
Peak Downs
DysartNorwich Park
Gregory Crinum
Blackwater
Blackwater
EmeraldRockhampton
Gladstone
RG Tanna
Barney Point
Saraji
Caval RidgeMoranbah
Broadmeadow
GoonyellaRiverside
Queensland,Australia
Mining LeasePortRail NSWEC
Mt Arthur
Newcastle
Maitland
Singleton
Cessnock
Muswellbrook
Quirindi
Gunnedah
Mudgee
TamworthNSW, Australia
1 Strategic Report continued
1.12.1 Minerals Australia continued
Coal assets Queensland Coal New South Wales Energy Coal
Our coal assets in Australia consist of both open-cut and underground mines. At open-cut mines, overburden is removed after blasting, using either draglines or truck and shovel. Coal is then extracted using excavators or loaders and loaded onto trucks to be taken to stockpiles or directly to a beneficiation facility. At our underground mine, coal is extracted by either longwall or continuous miner. The coal is then transported to stockpiles on the surface by conveyor. Coal from stockpiles is then crushed, and for a number of the operations, washed and processed through the coal preparation plant. Domestic coal is transported to nearby customers via conveyor or rail. Export coal is transported to the port via trains or trucks, and as part of this coal supply chain both single and multi-user rail and port infrastructure is used.
Queensland CoalQueensland Coal comprises the BHP Billiton Mitsubishi Alliance (BMA) and BHP Billiton Mitsui Coal (BMC) assets in the Bowen Basin in Central Queensland, Australia.
The Bowen Basin’s high-quality metallurgical coals are ideally suited to efficient blast furnace operations. The area’s proximity to Asian customers means it is well positioned to supply the seaborne market.
Queensland Coal has access to key infrastructure in the Bowen Basin, including a modern, multi-user rail network and its own coal-loading terminal at Hay Point, located near the city of Mackay. Queensland Coal also has contracted capacity at three other multi-user port facilities, including the Port of Gladstone (RG Tanna Coal Terminal), Dalrymple Bay Coal Terminal and Abbot Point Coal Terminal.
BHP Billiton Mitsubishi Alliance (BMA)BMA is Australia’s largest coal producer and supplier of seaborne metallurgical coal. BMA is owned 50:50 by BHP Billiton and Mitsubishi Development.
BMA operates seven Bowen Basin mines (Goonyella Riverside, Broadmeadow, Daunia, Peak Downs, Saraji, Blackwater and Caval Ridge) and owns and operates the Hay Point Coal Terminal near Mackay. With the exception of the Broadmeadow underground longwall operation, BMA’s mines are open-cut, using dragline and truck and shovel fleets for overburden removal.
The Crinum underground mine ceased production in the December 2015 quarter. The mine is now under care and maintenance.
BMA’s share of total metallurgical coal production in FY2016 was 33.4 Mt.
BHP Billiton Mitsui Coal (BMC)BMC owns and operates two open-cut metallurgical coal mines in the Bowen Basin – South Walker Creek Mine and Poitrel Mine. BMC is owned by BHP Billiton (80 per cent) and Mitsui and Co (20 per cent).
South Walker Creek Mine is located on the eastern flank of the Bowen Basin, 35 kilometres west of the town of Nebo and 132 kilometres west of the Hay Point port facilities. Poitrel Mine is situated southeast of the town of Moranbah and began open-cut operations in October 2006.
BMC’s share of total metallurgical coal production in FY2016 was 8.9 Mt.
New South Wales Energy CoalNew South Wales Energy Coal consists of the Mt Arthur Coal open-cut energy coal mine in the Hunter Valley region of New South Wales, Australia. The site produces coal for domestic and international customers in the energy sector.
New South Wales Energy Coal produced 17.1 Mt in FY2016.
IndoMet Coal (Indonesia)For more information on IndoMet Coal, refer to section 1.14.4.
Refer to section 1.14.4 for information on our capital projects. Refer to section 6.1 for additional information on mining operations, section 6.2.1 for production information and section 6.3.2 for the reserve lives.

BHP Billiton Annual Report 2016 55
Nickel West Hwy
Mt KeithCli�sLeinster
Perth
Geraldton
Kwinana Refinery
Albany
Ravensthorpe
Kalgoorlie SmelterKambalda Concentrator
NewmanWestern Australia
1.12.1 Minerals Australia continued
Nickel WestNickel West
Nickel West is a fully integrated mine-to-market nickel business. All nickel operations (mines, concentrators, a smelter and refinery) are located in Western Australia.
The integrated business adds value throughout our nickel supply chain, with the majority of Nickel West’s production sold as briquettes.
Low-grade disseminated sulphide ore is mined from Mt Keith, a large open-pit operation. The ore is crushed and processed on-site to produce nickel concentrate.
High-grade nickel sulphide ore is mined at Cliffs and Leinster underground mines and Rocky’s Reward open-pit mine. The ore is processed through a concentrator and dryer at Leinster.
Nickel West’s concentrator plant in Kambalda processes ore and concentrate purchased from third parties.
The three streams of nickel concentrate come together at the Nickel West Kalgoorlie smelter, a vital part of our integrated business. The smelter uses a flash furnace to smelt more than 650 ktpa of concentrate to produce nickel matte.
Nickel West Kwinana refines granulated nickel matte from the Kalgoorlie smelter into nickel powder and premium-grade nickel metal briquettes containing over 99 per cent nickel.
Nickel matte and metal are exported to overseas markets via the Port of Fremantle.
Refer to section 6.1 for additional information on mining operations, section 6.2.1 for production information and section 6.3.2 for the reserve lives.
Nickel West is a fully integrated mine-to-market nickel business
2 Governance at BH
P Billiton3
Remuneration Report
4 D
irectors’ Report 1
Strategic Report
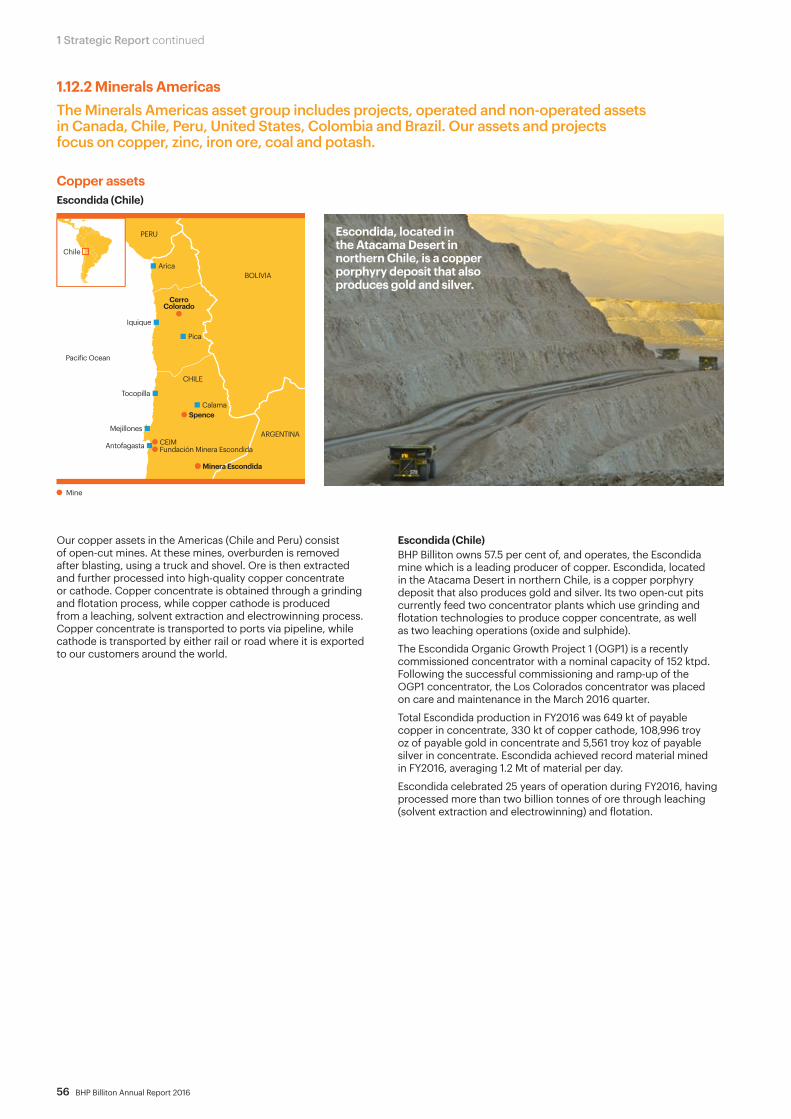
56 BHP Billiton Annual Report 2016
1 Strategic Report continued
1.12.2 Minerals Americas The Minerals Americas asset group includes projects, operated and non-operated assets in Canada, Chile, Peru, United States, Colombia and Brazil. Our assets and projects focus on copper, zinc, iron ore, coal and potash.
Copper assets Escondida (Chile)
Our copper assets in the Americas (Chile and Peru) consist of open-cut mines. At these mines, overburden is removed after blasting, using a truck and shovel. Ore is then extracted and further processed into high-quality copper concentrate or cathode. Copper concentrate is obtained through a grinding and flotation process, while copper cathode is produced from a leaching, solvent extraction and electrowinning process. Copper concentrate is transported to ports via pipeline, while cathode is transported by either rail or road where it is exported to our customers around the world.
Escondida (Chile)BHP Billiton owns 57.5 per cent of, and operates, the Escondida mine which is a leading producer of copper. Escondida, located in the Atacama Desert in northern Chile, is a copper porphyry deposit that also produces gold and silver. Its two open-cut pits currently feed two concentrator plants which use grinding and flotation technologies to produce copper concentrate, as well as two leaching operations (oxide and sulphide).
The Escondida Organic Growth Project 1 (OGP1) is a recently commissioned concentrator with a nominal capacity of 152 ktpd. Following the successful commissioning and ramp-up of the OGP1 concentrator, the Los Colorados concentrator was placed on care and maintenance in the March 2016 quarter.
Total Escondida production in FY2016 was 649 kt of payable copper in concentrate, 330 kt of copper cathode, 108,996 troy oz of payable gold in concentrate and 5,561 troy koz of payable silver in concentrate. Escondida achieved record material mined in FY2016, averaging 1.2 Mt of material per day.
Escondida celebrated 25 years of operation during FY2016, having processed more than two billion tonnes of ore through leaching (solvent extraction and electrowinning) and flotation.
Escondida, located in the Atacama Desert in northern Chile, is a copper porphyry deposit that also produces gold and silver.
Mine
AricaBOLIVIA
CHILE
ARGENTINA
PERU
Iquique
Pacific Ocean
Tocopilla
Antofagasta
Mejillones
Calama
Pica
Spence
Minera Escondida
CEIMFundación Minera Escondida
CerroColorado
Chile
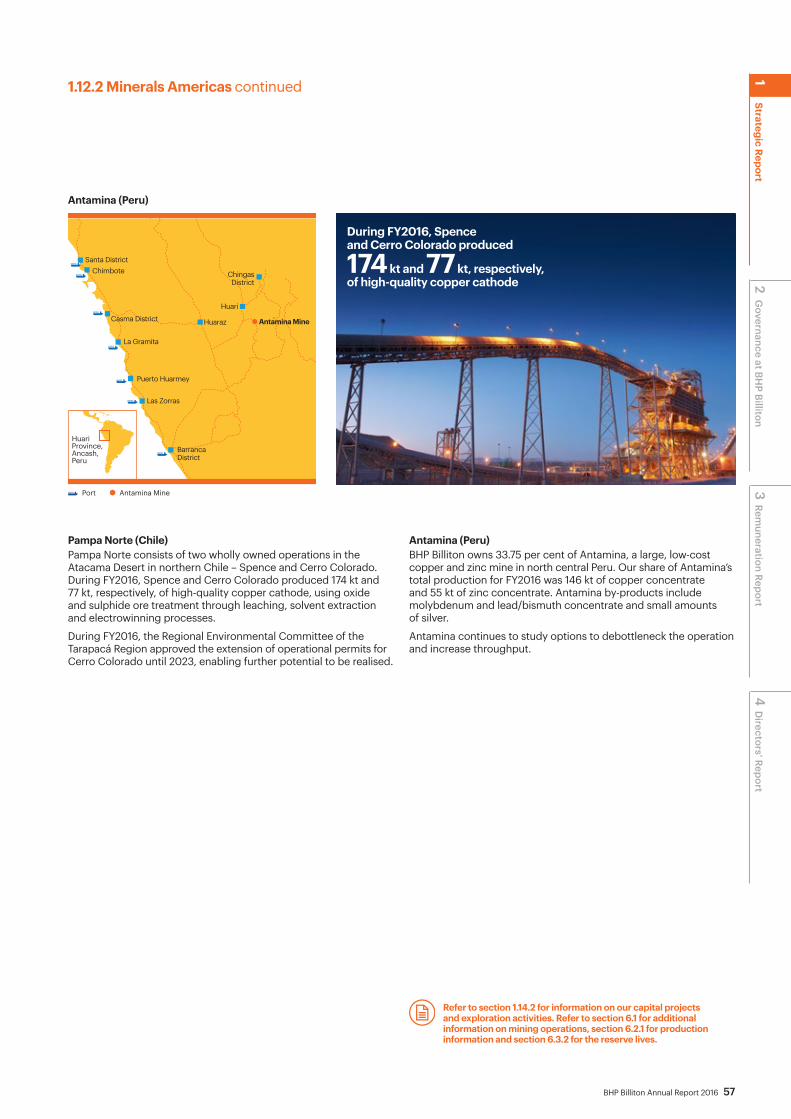
BHP Billiton Annual Report 2016 57
1.12.2 Minerals Americas continued
Antamina (Peru)
Pampa Norte (Chile)Pampa Norte consists of two wholly owned operations in the Atacama Desert in northern Chile – Spence and Cerro Colorado. During FY2016, Spence and Cerro Colorado produced 174 kt and 77 kt, respectively, of high-quality copper cathode, using oxide and sulphide ore treatment through leaching, solvent extraction and electrowinning processes.
During FY2016, the Regional Environmental Committee of the Tarapacá Region approved the extension of operational permits for Cerro Colorado until 2023, enabling further potential to be realised.
Antamina (Peru)BHP Billiton owns 33.75 per cent of Antamina, a large, low-cost copper and zinc mine in north central Peru. Our share of Antamina’s total production for FY2016 was 146 kt of copper concentrate and 55 kt of zinc concentrate. Antamina by-products include molybdenum and lead/bismuth concentrate and small amounts of silver.
Antamina continues to study options to debottleneck the operation and increase throughput.
Refer to section 1.14.2 for information on our capital projects and exploration activities. Refer to section 6.1 for additional information on mining operations, section 6.2.1 for production information and section 6.3.2 for the reserve lives.
During FY2016, Spence and Cerro Colorado produced
174 kt and 77 kt, respectively, of high-quality copper cathode 2 G
overnance at BHP Billiton
3 Rem
uneration Report4
Directors’ Report
1Strategic Report
Casma District
Las Zorras
Puerto Huarmey
La Gramita
Huaraz
ChimboteSanta District
Huari
ChingasDistrict
BarrancaDistrict
Antamina Mine
Huari Province, Ancash, Peru
Antamina MinePortHwy

58 BHP Billiton Annual Report 2016
1 Strategic Report continued
1.12.2 Minerals Americas continued
Iron ore assetSamarco (Brazil)
Each of BHP Billiton Brasil and Vale holds a 50 per cent shareholding in Samarco Mineração S.A. (Samarco), which operates the Samarco iron ore operation in Brazil. As a result of the tragic dam failure at Samarco in November 2015, operations at Samarco are currently suspended. For further information on the Samarco dam failure, refer to section 1.4. Samarco comprises a mine and three concentrators located in the state of Minas Gerais, and four pellet plants and a port located in Anchieta in the state of Espírito Santo. Three 400-kilometre pipelines connect the mine site to the pelletising facilities.
Samarco’s main product is iron ore pellets. Prior to the suspension of operations, the extraction and beneficiation of iron ore were conducted at the Germano facilities in the municipalities of Mariana and Ouro Preto. Conveyor systems were used to extract the ore and convey it from the mines. Ore beneficiation then occurred in concentrators, where crushing, milling, desliming and flotation processes produced iron concentrate. The concentrate leaves the concentrators as slurry and is pumped through the slurry pipelines from the Germano facilities to the pellet plants in Ubu, Anchieta, where the slurry is processed into pellets. The iron ore pellets are then heat treated. The pellet output is stored in a stockpile yard before being shipped out of the Samarco-owned Port of Ubu in Anchieta.
Samarco is currently seeking the necessary approvals to restart operations at reduced capacity and use mining pits for safe tailings storage while a longer-term solution is sought. Restart is not expected to occur before CY2017.
In FY2016, our share of production was 5.2 Mt of pellets.
Refer to section 6.1 for additional information on mining operations, section 6.2.1 for production information and section 6.3.2 for the reserve life.
Samarco2nd pipeline1st pipeline 3rd pipeline
Belo Horizonte(Main O�ices)
Mariana – Ouro Preto(Germano Operational Unit)
Vitória(Sales O�ice)
Anchieta(Operational unit and Ocean Terminal at Ponta Ubu)
Gov. Valadares
Juiz de Fora
Muniz Freire(Muniz Freire Hydroelectric Plant)
Nova Era – Antônio Dias(Guilman-Amorim Hydroelectric Plant)
Minas Gerais,Espírito SantoBrazil
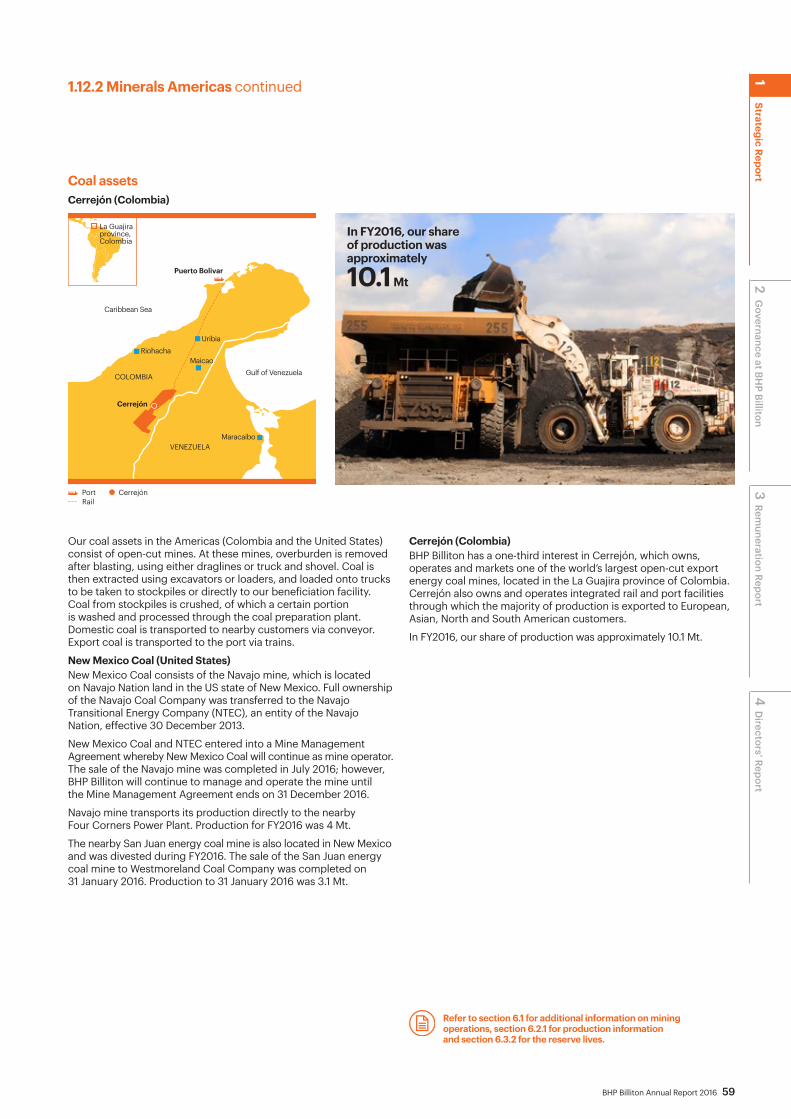
BHP Billiton Annual Report 2016 59
1.12.2 Minerals Americas continued
Coal assets Cerrejón (Colombia)
Our coal assets in the Americas (Colombia and the United States) consist of open-cut mines. At these mines, overburden is removed after blasting, using either draglines or truck and shovel. Coal is then extracted using excavators or loaders, and loaded onto trucks to be taken to stockpiles or directly to our beneficiation facility. Coal from stockpiles is crushed, of which a certain portion is washed and processed through the coal preparation plant. Domestic coal is transported to nearby customers via conveyor. Export coal is transported to the port via trains.
New Mexico Coal (United States) New Mexico Coal consists of the Navajo mine, which is located on Navajo Nation land in the US state of New Mexico. Full ownership of the Navajo Coal Company was transferred to the Navajo Transitional Energy Company (NTEC), an entity of the Navajo Nation, effective 30 December 2013.
New Mexico Coal and NTEC entered into a Mine Management Agreement whereby New Mexico Coal will continue as mine operator. The sale of the Navajo mine was completed in July 2016; however, BHP Billiton will continue to manage and operate the mine until the Mine Management Agreement ends on 31 December 2016.
Navajo mine transports its production directly to the nearby Four Corners Power Plant. Production for FY2016 was 4 Mt.
The nearby San Juan energy coal mine is also located in New Mexico and was divested during FY2016. The sale of the San Juan energy coal mine to Westmoreland Coal Company was completed on 31 January 2016. Production to 31 January 2016 was 3.1 Mt.
Cerrejón (Colombia)BHP Billiton has a one-third interest in Cerrejón, which owns, operates and markets one of the world’s largest open-cut export energy coal mines, located in the La Guajira province of Colombia. Cerrejón also owns and operates integrated rail and port facilities through which the majority of production is exported to European, Asian, North and South American customers.
In FY2016, our share of production was approximately 10.1 Mt.
Refer to section 6.1 for additional information on mining operations, section 6.2.1 for production information and section 6.3.2 for the reserve lives.
In FY2016, our share of production was approximately
10.1 Mt 2 Governance at BH
P Billiton3
Remuneration Report
4 D
irectors’ Report 1
Strategic Report
CerrejónPortRail
Puerto Bolivar
VENEZUELA
Caribbean Sea
Gulf of VenezuelaCOLOMBIA
Cerrejón
Maicao
Maracaibo
UribiaRiohacha
La Guajira province,Colombia

60 BHP Billiton Annual Report 2016
1 Strategic Report continued
1.12.2 Minerals Americas continued
PotashJansen Potash Project
Potash is a potassium rich salt, deposited millions of years ago when vast inland seas dried up. It is mainly used as fertiliser to improve the quality and yield of agricultural production. We believe demand will continue to grow with an increasing global population and improving incomes in emerging economies. Increasing urbanisation, more people and better diets demand sufficient food supply rich in protein that must be sourced from decreasing arable land per capita. Potash provides us with long-term growth and diversification benefits beyond our current portfolio, with a geographically diverse demand and customer base.
Our potash investment is consistent with our strategy to own and operate large, expandable assets that deliver value. Potash provides BHP Billiton with long-term growth and diversification benefits – supplying markets with the raw materials needed to meet the food needs of larger, more affluent populations transitioning from agrarian societies to cities.
Jansen Potash Project BHP Billiton holds mineral rights in the province of Saskatchewan, Canada. We believe Jansen is one of the world’s best undeveloped potash projects. Our footprint is substantial and we believe we have an ideal position within this basin. The Jansen Potash Project is about 140 kilometres east of Saskatoon. Using our technological expertise, we are focused on ensuring the preparatory work of sinking the shafts and preparing the mine is done safely and efficiently. Building a potash mine can present a number of opportunities and challenges. For example, the shafts need to reach about one kilometre underground and they need to be lined to ensure that water, which dissolves potash, does not flow into the mine.
Jansen is capable of supporting a mine with an annual capacity of approximately 10 Mt for up to 50 years, which means we are well positioned to help supply the future agricultural production demands needed to feed a growing world population.
The current work progressing at Jansen is the excavation and lining of two shafts (service and production), which are located 300 metres apart.
Project work has focused on de-risking shaft excavation over the last two years by introducing specialised boring machines that reduce the safety risk associated with shaft construction. We progressed both shafts in FY2016 well beyond the Blairmore formation, which lies about 450 metres below the surface and contains a major aquifer about 100 metres thick.
Jansen is in the studies phase. Construction beyond the current scope of work remains subject to Board approval.
Our opportunityOur investment in Jansen presents an opportunity to develop a multi-decade, multi-mine business in Saskatchewan, a fifth major commodity offering for BHP Billiton.
We announced in August 2013 an additional US$2.6 billion investment in Jansen, bringing total approved spending to US$3.8 billion. This investment is funding the excavation and lining of the production and service shafts as well as the installation of essential surface infrastructure and utilities. The scope of work was 60 per cent complete as of 30 June 2016.
Capital expenditure in the Jansen Potash Project in FY2016 was US$189 million.
Laying the foundation to meet expected future demand We believe in the long-term market fundamentals for potash. Our commitment is to unlock value and to do so we also need to consider the market environment. On the basis of our current projections and subject to Board approval, Jansen could be in a position to ramp-up production in the decade beginning 2020.
We believe Jansen is one of the world’s best undeveloped potash projects.
BHP Billiton Potential ProjectsBHP Billiton Land Permits
Extent of Mine IntegrityPrairie Evaporite 1,100m
Regina
WeyburnAssiniboia
Prince Albert
Moose Jaw
Yorkton
Saskatoon
Stalwart
Young
Holdfast
Regina
Jansen
Melville
WolverineBurr
Boulder
Saskatchewan,Canada
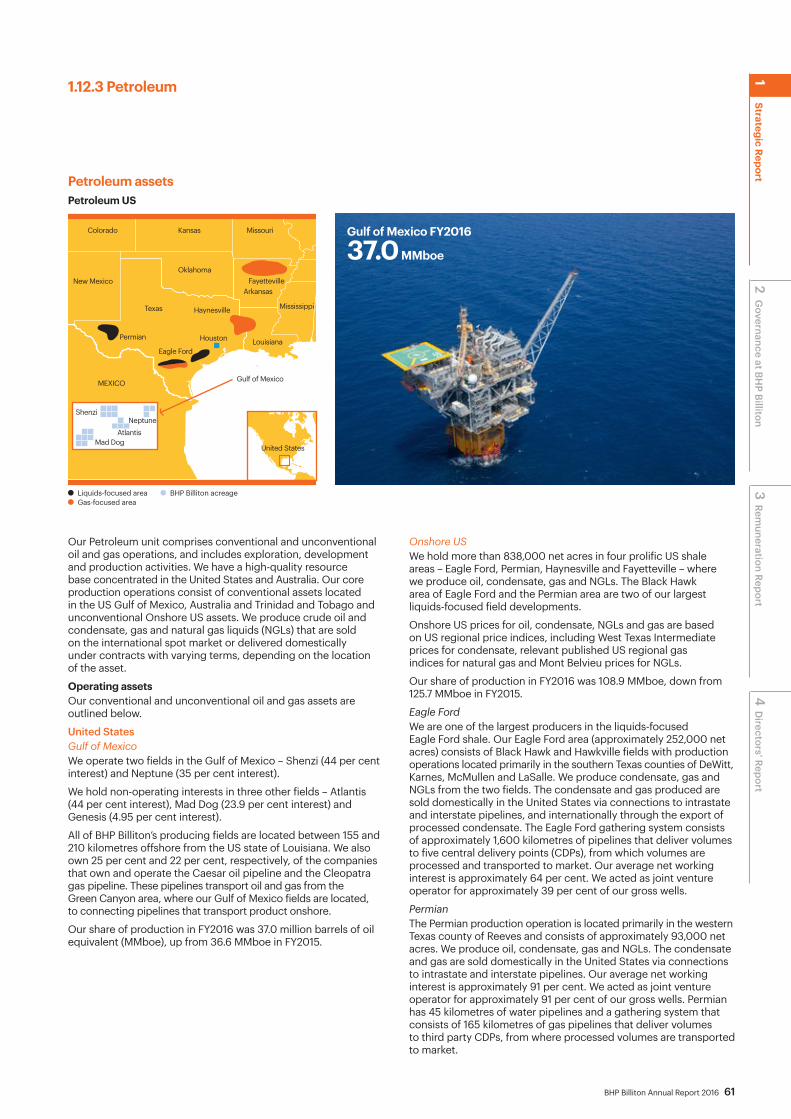
BHP Billiton Annual Report 2016 61
Petroleum assetsPetroleum US
Our Petroleum unit comprises conventional and unconventional oil and gas operations, and includes exploration, development and production activities. We have a high-quality resource base concentrated in the United States and Australia. Our core production operations consist of conventional assets located in the US Gulf of Mexico, Australia and Trinidad and Tobago and unconventional Onshore US assets. We produce crude oil and condensate, gas and natural gas liquids (NGLs) that are sold on the international spot market or delivered domestically under contracts with varying terms, depending on the location of the asset.
Operating assets Our conventional and unconventional oil and gas assets are outlined below.
United StatesGulf of MexicoWe operate two fields in the Gulf of Mexico – Shenzi (44 per cent interest) and Neptune (35 per cent interest).
We hold non-operating interests in three other fields – Atlantis (44 per cent interest), Mad Dog (23.9 per cent interest) and Genesis (4.95 per cent interest).
All of BHP Billiton’s producing fields are located between 155 and 210 kilometres offshore from the US state of Louisiana. We also own 25 per cent and 22 per cent, respectively, of the companies that own and operate the Caesar oil pipeline and the Cleopatra gas pipeline. These pipelines transport oil and gas from the Green Canyon area, where our Gulf of Mexico fields are located, to connecting pipelines that transport product onshore.
Our share of production in FY2016 was 37.0 million barrels of oil equivalent (MMboe), up from 36.6 MMboe in FY2015.
Onshore USWe hold more than 838,000 net acres in four prolific US shale areas – Eagle Ford, Permian, Haynesville and Fayetteville – where we produce oil, condensate, gas and NGLs. The Black Hawk area of Eagle Ford and the Permian area are two of our largest liquids-focused field developments.
Onshore US prices for oil, condensate, NGLs and gas are based on US regional price indices, including West Texas Intermediate prices for condensate, relevant published US regional gas indices for natural gas and Mont Belvieu prices for NGLs.
Our share of production in FY2016 was 108.9 MMboe, down from 125.7 MMboe in FY2015.
Eagle FordWe are one of the largest producers in the liquids-focused Eagle Ford shale. Our Eagle Ford area (approximately 252,000 net acres) consists of Black Hawk and Hawkville fields with production operations located primarily in the southern Texas counties of DeWitt, Karnes, McMullen and LaSalle. We produce condensate, gas and NGLs from the two fields. The condensate and gas produced are sold domestically in the United States via connections to intrastate and interstate pipelines, and internationally through the export of processed condensate. The Eagle Ford gathering system consists of approximately 1,600 kilometres of pipelines that deliver volumes to five central delivery points (CDPs), from which volumes are processed and transported to market. Our average net working interest is approximately 64 per cent. We acted as joint venture operator for approximately 39 per cent of our gross wells.
PermianThe Permian production operation is located primarily in the western Texas county of Reeves and consists of approximately 93,000 net acres. We produce oil, condensate, gas and NGLs. The condensate and gas are sold domestically in the United States via connections to intrastate and interstate pipelines. Our average net working interest is approximately 91 per cent. We acted as joint venture operator for approximately 91 per cent of our gross wells. Permian has 45 kilometres of water pipelines and a gathering system that consists of 165 kilometres of gas pipelines that deliver volumes to third party CDPs, from where processed volumes are transported to market.
1.12.3 Petroleum
Liquids-focused areaGas-focused area
BHP Billiton acreage
Oklahoma
KansasColorado Missouri
New Mexico
Texas
Permian
Fayetteville
Haynesville
Houston
Eagle Ford
Gulf of MexicoMEXICO
Louisiana
Mississippi
Arkansas
Shenzi
Mad DogAtlantis
Neptune
United States
Gulf of Mexico FY2016
37.0 MMboe
2 Governance at BH
P Billiton3
Remuneration Report
4 D
irectors’ Report 1
Strategic Report
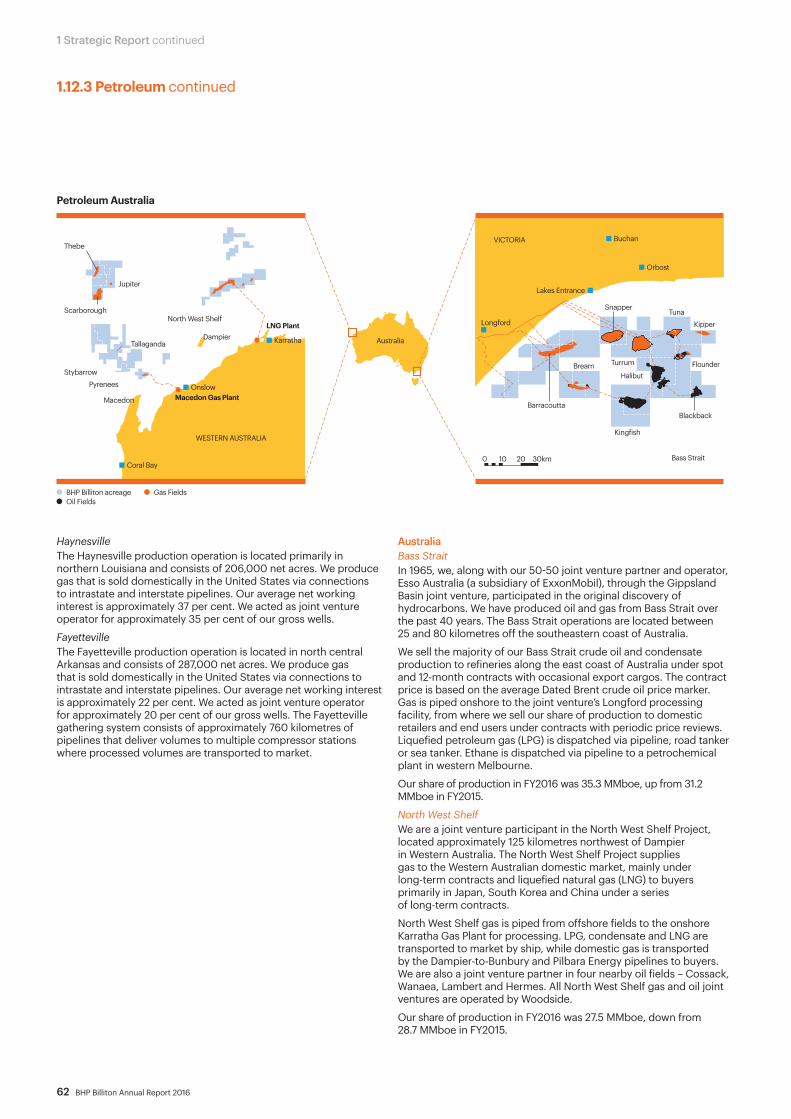
62 BHP Billiton Annual Report 2016
1 Strategic Report continued
HaynesvilleThe Haynesville production operation is located primarily in northern Louisiana and consists of 206,000 net acres. We produce gas that is sold domestically in the United States via connections to intrastate and interstate pipelines. Our average net working interest is approximately 37 per cent. We acted as joint venture operator for approximately 35 per cent of our gross wells.
FayettevilleThe Fayetteville production operation is located in north central Arkansas and consists of 287,000 net acres. We produce gas that is sold domestically in the United States via connections to intrastate and interstate pipelines. Our average net working interest is approximately 22 per cent. We acted as joint venture operator for approximately 20 per cent of our gross wells. The Fayetteville gathering system consists of approximately 760 kilometres of pipelines that deliver volumes to multiple compressor stations where processed volumes are transported to market.
BHP Billiton acreage Gas FieldsOil Fields
Australia
Longford
Lakes Entrance
Buchan
Orbost
VICTORIA
Blackback
Halibut
Kingfish
Bream
Snapper
Bass Strait
Turrum
TunaKipper
Flounder
Barracoutta
0 2010 30km
Macedon Gas Plant
Jupiter
Thebe
Scarborough
Tallaganda
Macedon
North West Shelf LNG Plant
Dampier
PyreneesStybarrow
Onslow
Karratha
Coral Bay
WESTERN AUSTRALIA
1.12.3 Petroleum continued
AustraliaBass StraitIn 1965, we, along with our 50-50 joint venture partner and operator, Esso Australia (a subsidiary of ExxonMobil), through the Gippsland Basin joint venture, participated in the original discovery of hydrocarbons. We have produced oil and gas from Bass Strait over the past 40 years. The Bass Strait operations are located between 25 and 80 kilometres off the southeastern coast of Australia.
We sell the majority of our Bass Strait crude oil and condensate production to refineries along the east coast of Australia under spot and 12-month contracts with occasional export cargos. The contract price is based on the average Dated Brent crude oil price marker. Gas is piped onshore to the joint venture’s Longford processing facility, from where we sell our share of production to domestic retailers and end users under contracts with periodic price reviews. Liquefied petroleum gas (LPG) is dispatched via pipeline, road tanker or sea tanker. Ethane is dispatched via pipeline to a petrochemical plant in western Melbourne.
Our share of production in FY2016 was 35.3 MMboe, up from 31.2 MMboe in FY2015.
North West ShelfWe are a joint venture participant in the North West Shelf Project, located approximately 125 kilometres northwest of Dampier in Western Australia. The North West Shelf Project supplies gas to the Western Australian domestic market, mainly under long-term contracts and liquefied natural gas (LNG) to buyers primarily in Japan, South Korea and China under a series of long-term contracts.
North West Shelf gas is piped from offshore fields to the onshore Karratha Gas Plant for processing. LPG, condensate and LNG are transported to market by ship, while domestic gas is transported by the Dampier-to-Bunbury and Pilbara Energy pipelines to buyers. We are also a joint venture partner in four nearby oil fields – Cossack, Wanaea, Lambert and Hermes. All North West Shelf gas and oil joint ventures are operated by Woodside.
Our share of production in FY2016 was 27.5 MMboe, down from 28.7 MMboe in FY2015.
Petroleum Australia
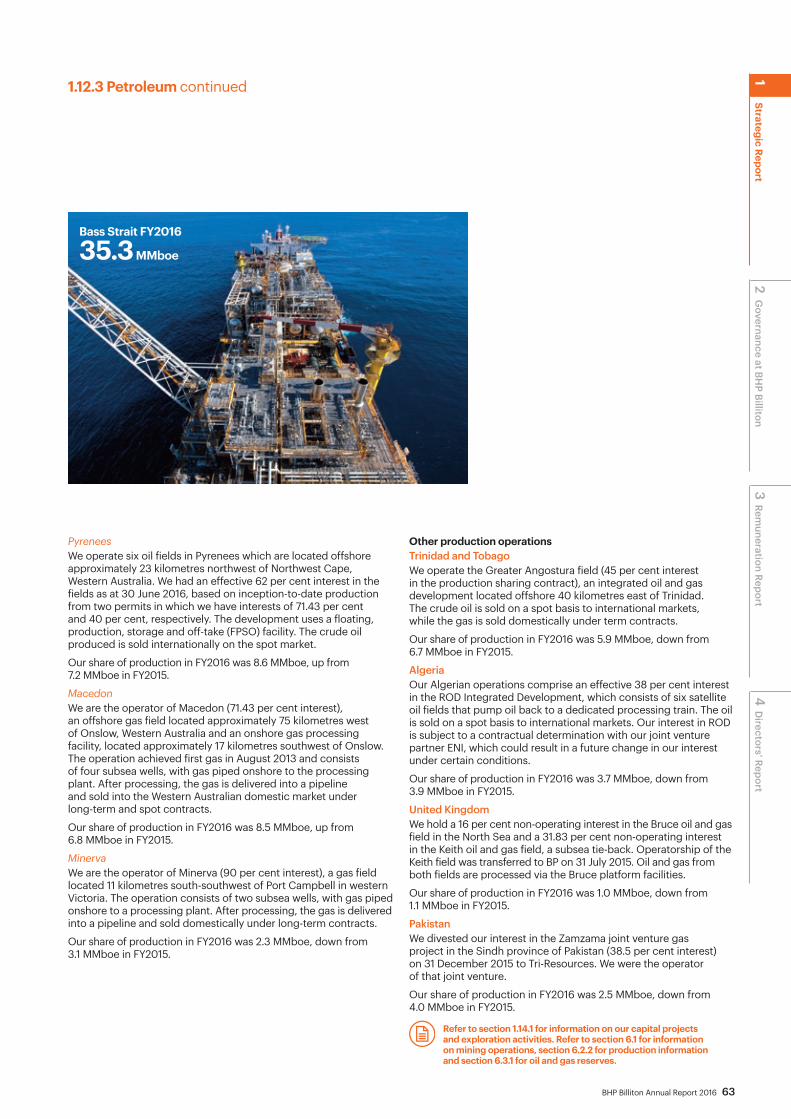
BHP Billiton Annual Report 2016 63
PyreneesWe operate six oil fields in Pyrenees which are located offshore approximately 23 kilometres northwest of Northwest Cape, Western Australia. We had an effective 62 per cent interest in the fields as at 30 June 2016, based on inception-to-date production from two permits in which we have interests of 71.43 per cent and 40 per cent, respectively. The development uses a floating, production, storage and off-take (FPSO) facility. The crude oil produced is sold internationally on the spot market.
Our share of production in FY2016 was 8.6 MMboe, up from 7.2 MMboe in FY2015.
MacedonWe are the operator of Macedon (71.43 per cent interest), an offshore gas field located approximately 75 kilometres west of Onslow, Western Australia and an onshore gas processing facility, located approximately 17 kilometres southwest of Onslow. The operation achieved first gas in August 2013 and consists of four subsea wells, with gas piped onshore to the processing plant. After processing, the gas is delivered into a pipeline and sold into the Western Australian domestic market under long-term and spot contracts.
Our share of production in FY2016 was 8.5 MMboe, up from 6.8 MMboe in FY2015.
MinervaWe are the operator of Minerva (90 per cent interest), a gas field located 11 kilometres south-southwest of Port Campbell in western Victoria. The operation consists of two subsea wells, with gas piped onshore to a processing plant. After processing, the gas is delivered into a pipeline and sold domestically under long-term contracts.
Our share of production in FY2016 was 2.3 MMboe, down from 3.1 MMboe in FY2015.
1.12.3 Petroleum continued
Refer to section 1.14.1 for information on our capital projects and exploration activities. Refer to section 6.1 for information on mining operations, section 6.2.2 for production information and section 6.3.1 for oil and gas reserves.
Bass Strait FY2016
35.3 MMboe
Other production operationsTrinidad and TobagoWe operate the Greater Angostura field (45 per cent interest in the production sharing contract), an integrated oil and gas development located offshore 40 kilometres east of Trinidad. The crude oil is sold on a spot basis to international markets, while the gas is sold domestically under term contracts.
Our share of production in FY2016 was 5.9 MMboe, down from 6.7 MMboe in FY2015.
AlgeriaOur Algerian operations comprise an effective 38 per cent interest in the ROD Integrated Development, which consists of six satellite oil fields that pump oil back to a dedicated processing train. The oil is sold on a spot basis to international markets. Our interest in ROD is subject to a contractual determination with our joint venture partner ENI, which could result in a future change in our interest under certain conditions.
Our share of production in FY2016 was 3.7 MMboe, down from 3.9 MMboe in FY2015.
United KingdomWe hold a 16 per cent non-operating interest in the Bruce oil and gas field in the North Sea and a 31.83 per cent non-operating interest in the Keith oil and gas field, a subsea tie-back. Operatorship of the Keith field was transferred to BP on 31 July 2015. Oil and gas from both fields are processed via the Bruce platform facilities.
Our share of production in FY2016 was 1.0 MMboe, down from 1.1 MMboe in FY2015.
PakistanWe divested our interest in the Zamzama joint venture gas project in the Sindh province of Pakistan (38.5 per cent interest) on 31 December 2015 to Tri-Resources. We were the operator of that joint venture.
Our share of production in FY2016 was 2.5 MMboe, down from 4.0 MMboe in FY2015.
2 Governance at BH
P Billiton3
Remuneration Report
4 D
irectors’ Report 1
Strategic Report

64 BHP Billiton Annual Report 2016
1 Strategic Report continued
Our objectives Marketing is critical to ensuring we receive full value when selling our commodities. It has accountability for: • securing sales of BHP Billiton products and managing
associated risks;• purchasing raw materials that are used by our assets; • managing the supply chains from resources to markets;• effective governance of credit, market and price
risk management;• supporting strategic decision-making by analysing
commodity markets and providing insights.
Our Marketing business adds value by understanding our customers’ needs and connecting them with the right product, working with the assets to maximise the value of upstream resources, optimising freight and distribution costs and ensuring the Company-wide view of commodity markets is well informed and insightful. This allows the assets to focus on safety, production and cost, while Marketing focuses on optimising realised prices and sales outcomes.
A simple, centralised organisation co-located with key markets Our Marketing businesses are strategically located in close proximity to our customers. Singapore is our primary Marketing business, reflecting the fact that about 72 per cent of our sales are in Asia. Our other major Marketing business is located in Houston, United States. More than half of our oil and gas sales are to customers in North America.
The Marketing business incorporates all the functions required to manage sales and distribution from our assets to our customers. In addition, we have regional marketers located close to our customers in eight other cities across the world.
1.12.4 MarketingMarketing is an independent core business of BHP Billiton. It is the link between BHP Billiton’s global operations and our global customers.
It’s how we take our iron ore mined in Australia and sell it to customers in China to make steel. It’s how we connect a fabricator in Japan with copper cathode from our Chilean operations and how we pump oil in the Gulf of Mexico to fuel US transport.
Operations
Sales
Mar
ket a
nalysis
Freight
Credit and risk
Transport
Con
stru
ctio
n
Consumer
durables Power and electrical
Hea
ting
Industry and feedst
ock
Other
Machinery
Customers
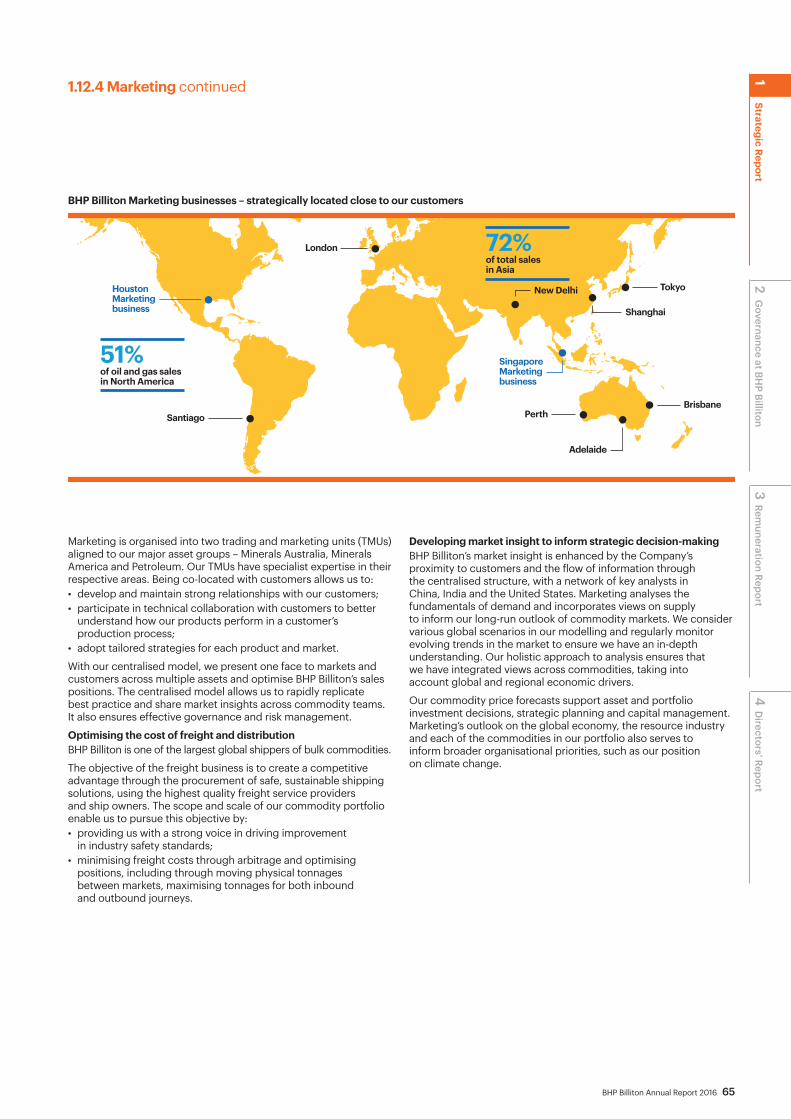
BHP Billiton Annual Report 2016 65
Houston Marketing business
Singapore Marketing business
Santiago
London
BrisbanePerth
New Delhi
Shanghai
Tokyo
Adelaide
of oil and gas sales in North America
51%
of total sales in Asia
72%
BHP Billiton Marketing businesses – strategically located close to our customers
Marketing is organised into two trading and marketing units (TMUs) aligned to our major asset groups – Minerals Australia, Minerals America and Petroleum. Our TMUs have specialist expertise in their respective areas. Being co-located with customers allows us to: • develop and maintain strong relationships with our customers; • participate in technical collaboration with customers to better
understand how our products perform in a customer’s production process;
• adopt tailored strategies for each product and market.
With our centralised model, we present one face to markets and customers across multiple assets and optimise BHP Billiton’s sales positions. The centralised model allows us to rapidly replicate best practice and share market insights across commodity teams. It also ensures effective governance and risk management.
Optimising the cost of freight and distribution BHP Billiton is one of the largest global shippers of bulk commodities.
The objective of the freight business is to create a competitive advantage through the procurement of safe, sustainable shipping solutions, using the highest quality freight service providers and ship owners. The scope and scale of our commodity portfolio enable us to pursue this objective by:• providing us with a strong voice in driving improvement
in industry safety standards;• minimising freight costs through arbitrage and optimising
positions, including through moving physical tonnages between markets, maximising tonnages for both inbound and outbound journeys.
Developing market insight to inform strategic decision-making BHP Billiton’s market insight is enhanced by the Company’s proximity to customers and the flow of information through the centralised structure, with a network of key analysts in China, India and the United States. Marketing analyses the fundamentals of demand and incorporates views on supply to inform our long-run outlook of commodity markets. We consider various global scenarios in our modelling and regularly monitor evolving trends in the market to ensure we have an in-depth understanding. Our holistic approach to analysis ensures that we have integrated views across commodities, taking into account global and regional economic drivers.
Our commodity price forecasts support asset and portfolio investment decisions, strategic planning and capital management. Marketing’s outlook on the global economy, the resource industry and each of the commodities in our portfolio also serves to inform broader organisational priorities, such as our position on climate change.
1.12.4 Marketing continued
2 Governance at BH
P Billiton3
Remuneration Report
4 D
irectors’ Report 1
Strategic Report

66 BHP Billiton Annual Report 2016
1 Strategic Report continued
1.13 Summary of financial performance 1.13.1 Group overviewOur selected financial information reflects the operations of the BHP Billiton Group and should be read in conjunction with the FY2016 Financial Statements, together with the accompanying notes.
We prepare our Consolidated Financial Statements in accordance with International Financial Reporting Standards (IFRS), as issued by the International Accounting Standards Board and as outlined in the Financial Statements in this Annual Report. We publish our Consolidated Financial Statements in US dollars.
Comparative financial information for FY2014, FY2013 and FY2012 has been restated for the effects of the application of IFRS 5/AASB 5 ‘Non-current Assets Held for Sale and Discontinued Operations’ following the demerger of South32 in FY2015, unless otherwise noted. Consolidated Balance Sheet information for these periods is not required to be, and has not been, restated. All Consolidated Income Statement, Consolidated Balance Sheet and Consolidated Cash Flow Statement information below has been derived from audited Financial Statements, except the previously published FY2012 restated data which was not required to be, and was not, subject to audit. For more information, refer to section 5.
Information in this section has been presented on a Continuing operations basis to exclude the contribution from assets that were demerged with South32, unless otherwise noted. Details of the contribution of the South32 assets to the Group’s results are disclosed in note 26 ‘Discontinued operations’ to the Financial Statements.
Year ended 30 JuneUS$M 2016 2015 2014 2013 2012
Consolidated Income Statement (section 5.1.1)Revenue 30,912 44,636 56,762 53,860 56,642(Loss)/profit from operations (6,235) 8,670 22,649 21,977 22,602(Loss)/profit after taxation from Continuing operations (6,207) 4,390 14,955 14,132 15,233(Loss)/profit after taxation from Discontinued operations – (1,512) 269 (1,312) 1,384(Loss)/profit after taxation from Continuing and Discontinued operations attributable to owners of BHP Billiton Group (attributable (loss)/profit) (1) (6,385) 1,910 13,832 11,223 15,473Dividends per ordinary share – paid during the period (US cents) 78.0 124.0 118.0 114.0 110.0Dividends per ordinary share – determined in respect of the period (US cents) 30.0 124.0 121.0 116.0 112.0Basic (loss)/earnings per ordinary share (US cents) (1) (2) (120.0) 35.9 260.0 210.9 290.7Diluted (loss)/earnings per ordinary share (US cents) (1) (2) (120.0) 35.8 259.1 210.2 289.4Basic (loss)/earnings from Continuing operations per ordinary share (US cents) (2) (120.0) 65.5 256.5 238.6 265.3Diluted (loss)/earnings from Continuing operations per ordinary share (US cents) (2) (120.0) 65.3 255.7 237.8 264.1Number of ordinary shares (million)
– At period end 5,324 5,324 5,348 5,348 5,348– Weighted average 5,322 5,318 5,321 5,322 5,323– Diluted 5,322 5,333 5,338 5,340 5,346
Consolidated Balance Sheet (section 5.1.3) (3)
Total assets 118,953 124,580 151,413 139,178 129,201Net assets 60,071 70,545 85,382 75,291 69,315Share capital (including share premium) 2,761 2,761 2,773 2,773 2,773Total equity attributable to owners of BHP Billiton Group 54,290 64,768 79,143 70,667 65,526
Other financial informationUnderlying attributable profit (4) 1,215 6,417 13,263 12,017 15,928Underlying EBITDA (4) 12,340 21,852 30,292 28,109 31,554Underlying EBIT (4) 3,469 11,866 22,098 21,680 25,948Underlying basic earnings per share (US cents) (4) 22.8 120.7 249.3 225.8 299.2Capital and exploration expenditure (Cash basis) (5) 7,711 12,763 16,210 22,425 21,130Capital and exploration expenditure (BHP Billiton share) (5) 6,396 11,040 14,608 21,422 19,793Net debt 26,102 24,417 25,786 27,510 22,208Net operating cash flows (6) 10,625 19,296 25,364 20,154 25,259
(1) Includes (Loss)/profit after taxation from Discontinued operations attributable to owners of the BHP Billiton Group.(2) For more information on earnings per share, refer to note 6 ‘Earnings per share’ to the Financial Statements. (3) The Consolidated Balance Sheet for FY2015 does not include the assets and liabilities demerged with South32. IFRS 5/AASB 5 ‘Non-current Assets Held for Sale and
Discontinued Operations’ does not require the Consolidated Balance Sheet to be restated for comparative periods. (4) Underlying attributable profit, Underlying EBITDA, Underlying EBIT and Underlying basic earnings per share are non-IFRS financial measures that we use to reflect
the underlying performance of BHP Billiton. Underlying attributable profit is attributable (loss)/profit excluding Discontinued operations and any exceptional items and Underlying basic earnings per share is Underlying attributable profit per basic share. Underlying EBITDA is earnings before net finance costs, depreciation, amortisation and impairments, taxation expense, Discontinued operations and any exceptional items. Underlying EBIT is Underlying EBITDA, including depreciation, amortisation and impairments. We believe that these non-IFRS measures provide useful information, but should not be considered as an indication of, or as an alternative to attributable (loss)/profit as an indicator of actual operating performance or as an alternative to cash flow as a measure of liquidity. Underlying EBITDA and Underlying EBIT are included in the FY2016 Consolidated Financial Statements as required by IFRS 8 ‘Operating Segments’. For a reconciliation of Underlying attributable profit to attributable (loss)/profit and of Underlying EBITDA to (Loss)/profit after taxation from Continuing operations for FY2016, FY2015 and FY2014, refer to section 1.13.2.
(5) ‘Cash basis’ capital and exploration expenditure represents purchases of property, plant and equipment plus exploration expenditure from the Consolidated Cash Flow Statement. ‘BHP Billiton share’ capital and exploration expenditure represents ‘Cash basis’, plus BHP Billiton’s share of equity accounted investments capital and exploration expenditure, less capitalised deferred stripping and non-controlling interests. FY2012 capital and exploration expenditure ‘Cash basis’ and ‘BHP Billiton share’ includes capital and exploration expenditure from Discontinued operations.
(6) Net operating cash flows are after dividends received, net interest and taxation and include Net operating cash flows from Discontinued operations.

BHP Billiton Annual Report 2016 67
1.13.1 Group overview continuedNon-IFRS measuresWe use a number of non-IFRS measures to assess our performance. Non-IFRS measures include: • Underlying attributable profit – comprises (Loss)/profit after
taxation attributable to owners of the BHP Billiton Group less exceptional items as described in note 2 ‘Exceptional items’ to the Financial Statements and excludes Discontinued operations. Underlying attributable profit is the key performance indicator against which short-term incentive outcomes for our senior executives are measured and, in our view, is a relevant measure to assess the financial performance of the Company for this purpose. In past periods, we have reported attributable (loss)/profit as a key performance indicator.
• Underlying basic earnings per share – represents Underlying attributable profit per basic share.
• Adjusted effective tax rate – comprises Total taxation benefit/(expense) excluding exceptional items, Discontinued operations and exchange rate movements included in taxation benefit/(expense) divided by (Loss)/profit before taxation and exceptional items. Management believes this measure provides useful information regarding the tax impacts from underlying operations.
• Underlying EBITDA – is earnings before net finance costs, depreciation, amortisation and impairments, taxation expense, Discontinued operations and any exceptional items. Underlying EBITDA includes BHP Billiton’s share of (loss)/profit from investments accounted for using the equity method, including net finance costs, depreciation, amortisation and impairments and taxation expense. Management believes focusing on Underlying EBITDA more closely reflects the operating cash generative capacity and hence the underlying performance of our business. In past periods, we have reported Underlying EBIT as a key non-IFRS measure of operating results.
• Underlying EBIT – is Underlying EBITDA, including depreciation, amortisation and impairments.
• Controllable cash costs – comprises operating cash costs and exploration and business development costs and excludes Discontinued operations. Management believes this measure provides useful information regarding the Company’s financial performance because it considers these expenses to be the principal operating and overhead expenses that are most directly under the Company’s control.
• Underlying EBITDA margin – comprises Underlying EBITDA, excluding third party product Underlying EBITDA, divided by revenue excluding third party product revenue.
• Net operating assets – represents operating assets net of operating liabilities, including the carrying value of equity accounted investments and predominantly excludes cash balances, loans to associates, Interest bearing liabilities and deferred tax balances. The carrying value of investments accounted for using the equity accounted method represents the balance of the Group’s investment in equity accounted investments, with no adjustment for any cash balances, interest bearing liabilities and deferred tax balances of the equity accounted investment. Management believes this measure provides useful information by isolating the net operating assets of the business from the financing and tax balances which, in combination with our other measures, provides a meaningful indicator of underlying performance.
We believe that these non-IFRS measures provide useful information, but should not be considered as an indication of, or as an alternative to, comparable IFRS measures.
Other financial measuresWe use a number of other financial measures (each of which is calculated by reference to IFRS measures) to assess our performance. Such other financial measures include:• Free cash flow – comprises Net operating cash flows less Net
investing cash flows and excludes Discontinued operations.• Gearing ratio – represents the ratio of net debt to net debt
plus Net assets.• Net debt – comprises Interest bearing liabilities less Cash and
cash equivalents for the total operations within the Group at the reporting date.
For our Financial Statements, refer to section 5.
2 Governance at BH
P Billiton3
Remuneration Report
4 D
irectors’ Report 1
Strategic Report

68 BHP Billiton Annual Report 2016
1 Strategic Report continued
1.13.1 Group overview continuedFinancial results for year ended 30 June 2016 compared with year ended 30 June 2015The following table provides a summary of the Consolidated Income Statement contained in section 5.1.1:
Year ended 30 June2016
US$M2015
US$M2014
US$M
Revenue (1)
Petroleum 6,894 11,447 14,833 Copper 8,249 11,453 12,789Iron Ore 10,538 14,753 21,356Coal 4,518 5,885 6,563Group and unallocated items/eliminations (2) 713 1,098 1,221
Total revenue 30,912 44,636 56,762
Other income 444 496 1,225
Employee benefits expense (3,702) (4,971) (5,413)Raw materials and consumables used (4,063) (4,667) (5,540)Freight and transportation (2,226) (2,644) (3,119)External services (4,984) (6,284) (6,780)Third party commodity purchases (1,013) (1,165) (1,702)Net foreign exchange gains/(losses) 153 469 (168)Government royalties paid and payable (1,349) (1,708) (2,412)Depreciation and amortisation expense (8,661) (9,158) (7,716)Exploration and evaluation expenditure incurred and expensed in the current period (430) (670) (698)Impairment of assets (7,394) (4,024) (478)Operating lease rentals (528) (636) (665)All other operating expenses (1,290) (1,552) (1,832)
Total expenses excluding net finance costs (35,487) (37,010) (36,523)
(Loss)/profit from equity accounted investments, related impairments and expenses (2,104) 548 1,185
(Loss)/profit from operations (6,235) 8,670 22,649
Net finance costs (1,024) (614) (914)
Total taxation benefit/(expense) 1,052 (3,666) (6,780)
(Loss)/profit after taxation from Continuing operations (6,207) 4,390 14,955
(Loss)/profit after taxation from Discontinued operations – (1,512) 269
(Loss)/profit after taxation from Continuing and Discontinued operations (6,207) 2,878 15,224
Attributable to non-controlling interests 178 968 1,392Attributable to owners of BHP Billiton Group (6,385) 1,910 13,832
(1) Includes the sale of third party products and excludes revenue from investments accounted for using the equity method.(2) Group and unallocated items includes functions, other unallocated operations, including Potash (previously disclosed in the former Petroleum and Potash reportable
segment), Nickel West and consolidated adjustments. Revenue not attributable to reportable segments comprises the sale of freight and fuel to third parties, as well as revenues from unallocated operations.
Revenue of US$30.9 billion reduced by US$13.7 billion, or 31 per cent, from US$44.6 billion in FY2015. This decrease was primarily attributable to weaker average realised prices across all major commodities. For a discussion of the average realised prices of our commodities, refer to section 1.8.1. Lower volumes during the year, particularly for copper at Escondida (due to anticipated grade decline) and Onshore US (deferral of development activity for value), also contributed to the decline in revenue. For production results from our operations during the periods, refer to section 6.2.
Total expenses of US$35.5 billion reduced by US$1.5 billion, or four per cent, from US$37.0 billion in FY2015. This was due to a US$1.3 billion reduction in Employee benefits expense related to lower headcount, a US$1.3 billion reduction in External services related to lower contractor expenditure and a US$604 million reduction in Raw materials and consumables used due to lower fuel and energy costs.
Depreciation and amortisation expense declined by US$497 million due to a reduction in the depreciable asset base at Onshore US due to impairments previously recorded. Impairment of assets of US$7.4 billion in FY2016 primarily relates to Onshore US assets.
(Loss)/profit from operations of US$(6.2) billion reduced by US$14.9 billion from FY2015 primarily as a result of a significant decline in commodity prices, the impairment of the Onshore US assets and the financial impacts of the Samarco dam failure (refer to section 1.13.2), partially offset by the cost reductions described above.
Net finance costs of US$1.0 billion increased by US$410 million, or 67 per cent, from US$614 million in FY2015 due to the issue of multi-currency hybrid notes during FY2016 (refer to section 1.13.3 and note 19 ‘Net debt’ to the Financial Statements), higher benchmark interest rates and a gain on the early redemption of the Petrohawk Energy Corporation Senior Notes in FY2015.
The Group’s statutory effective tax rate for FY2016 presents as nil (FY2015: 45.5 per cent) because we recognised a total taxation benefit of US$1.1 billion (including government imposed royalty-related taxation calculated by reference to profits), and a loss before taxation for the period of US$7.3 billion. The Group’s adjusted effective tax rate was 35.8 per cent (FY2015: 31.8 per cent). The increase in the Group’s adjusted effective tax rate in FY2016 reflects the relative higher proportion of profit from Australian petroleum assets (which are subject to a higher rate of tax due to the Petroleum Resource Rent Tax) in the Group’s overall profit compared to FY2015.

BHP Billiton Annual Report 2016 69
1.13.1 Group overview continuedThe adjusted effective tax rate is reconciled to the statutory effective tax rate in the table below:
2016 2015
Year ended 30 June
(Loss)/profit before taxation
US$M
Income tax benefit/
(expense)US$M %
(Loss)/profit before taxation
US$M
Income tax benefit/
(expense)US$M %
Statutory effective tax rate (7,259) 1,052 – 8,056 (3,666) 45.5%Adjusted for:Exchange rate movements – 125 – 339Exceptional items 9,704 (2,053) 3,196 (250)
Adjusted effective tax rate 2,445 (876) 35.8% 11,252 (3,577) 31.8%
Government royalties paid and payable which are not profit based are recognised as operating costs within (Loss)/profit before taxation. These amounted to US$1.3 billion during the period (FY2015: US$1.7 billion).
Cash flow statementThe following table provides a summary of the Consolidated Cash Flow Statement contained in section 5.1.4 to show the key sources and uses of cash during the periods presented:
Year ended 30 June2016
US$M2015
US$M2014
US$M
Cash generated from operations 12,671 21,620 29,318Dividends received 301 740 1,264Net interest paid (702) (541) (795)Taxation paid (1,645) (4,025) (6,147)
Net operating cash flows from Continuing operations 10,625 17,794 23,640
Net operating cash flows from Discontinued operations – 1,502 1,724
Net operating cash flows 10,625 19,296 25,364
Purchases of property plant and equipment (6,946) (11,947) (15,224)Exploration expenditure (765) (816) (986)Exploration expenditure expensed and included in operating cash flows 430 670 698Net investment and funding of equity accounted investments 40 117 (29)Other investing (4) 474 407
Net investing cash flows from Continuing operations (7,245) (11,502) (15,134)
Net investing cash flows from Discontinued operations – (1,066) (700)
Cash disposed on demerger of South32 – (586) –
Net investing cash flows (7,245) (13,154) (15,834)
Net proceeds from/(repayment of) interest bearing liabilities 4,607 (728) (1,011)Contributions from non-controlling interests – 53 1,435Dividends paid (4,130) (6,498) (6,387)Dividends paid to non-controlling interests (87) (554) (119)Other financing activities (106) (346) (354)
Net financing cash flows from Continuing operations 284 (8,073) (6,436)
Net financing cash flows from Discontinued operations – (203) (32)
Net financing cash flows 284 (8,276) (6,468)
Net increase/(decrease) in cash and cash equivalents from Continuing operations 3,664 (1,781) 2,070
Net increase in cash and cash equivalents from Discontinued operations – 233 992
Cash disposed on demerger of South32 – (586) –
Net operating cash flows after interest and tax of US$10.6 billion reduced by US$8.7 billion from FY2015. The major contributor was a US$8.9 billion decrease in cash generated from operations (after changes in working capital balances), which was partially offset by a decrease of US$2.4 billion in net taxes paid. Despite the significant decline in commodity prices, we generated US$3.4 billion of free cash flow (net operating cash flows less net investing cash flows) during FY2016 due to a reduction in operating costs and a targeted reduction of working capital.
Net investing cash flows of US$7.2 billion reduced by US$5.9 billion from FY2015 due to a US$5.1 billion reduction in capital and exploration expenditure. Exploration expenditure was US$765 million, including US$430 million classified within Net operating cash flows.
Net financing cash inflows of US$284 million increased by US$8.6 billion from outflows of US$8.3 billion in FY2015, due to the issue of multi-currency hybrid notes during FY2016 (refer to section 1.13.3 and note 19 ‘Net debt’ to the Financial Statements) and lower dividends paid in line with the new dividend policy.
2 Governance at BH
P Billiton3
Remuneration Report
4 D
irectors’ Report 1
Strategic Report
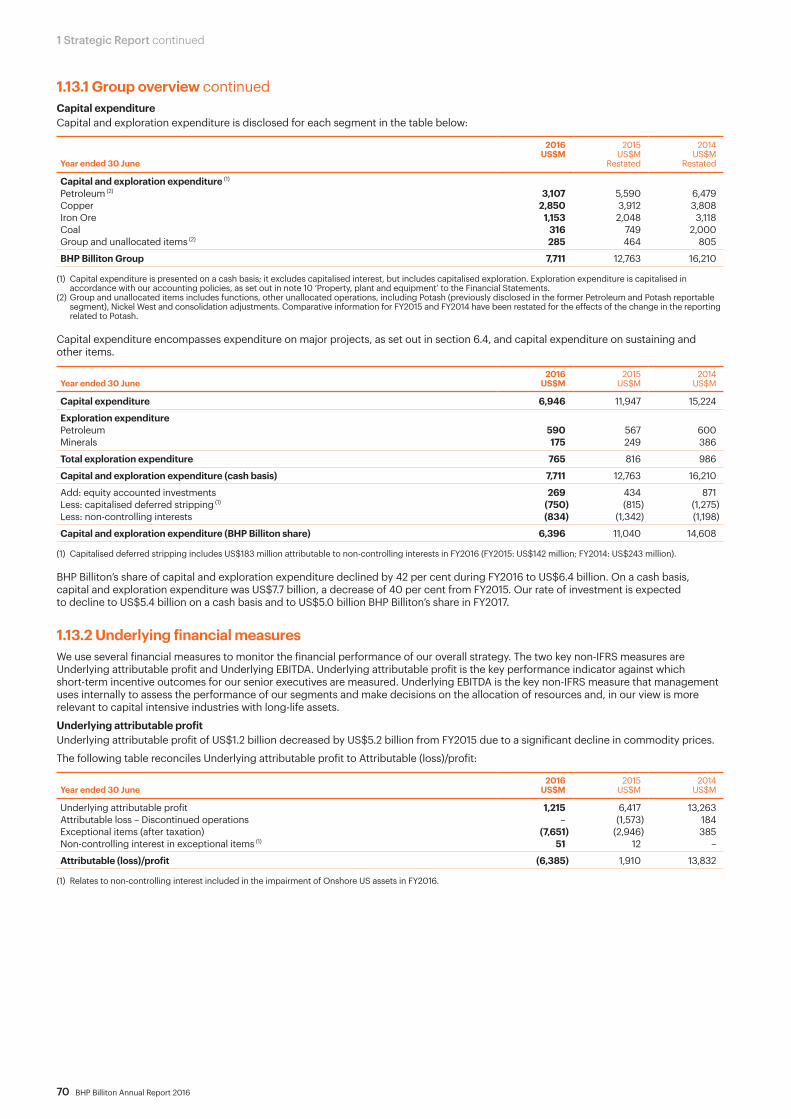
70 BHP Billiton Annual Report 2016
1 Strategic Report continued
1.13.1 Group overview continuedCapital expenditureCapital and exploration expenditure is disclosed for each segment in the table below:
Year ended 30 June
2016US$M
2015US$M
Restated
2014US$M
Restated
Capital and exploration expenditure (1)
Petroleum (2) 3,107 5,590 6,479Copper 2,850 3,912 3,808Iron Ore 1,153 2,048 3,118Coal 316 749 2,000Group and unallocated items (2) 285 464 805
BHP Billiton Group 7,711 12,763 16,210
(1) Capital expenditure is presented on a cash basis; it excludes capitalised interest, but includes capitalised exploration. Exploration expenditure is capitalised in accordance with our accounting policies, as set out in note 10 ‘Property, plant and equipment’ to the Financial Statements.
(2) Group and unallocated items includes functions, other unallocated operations, including Potash (previously disclosed in the former Petroleum and Potash reportable segment), Nickel West and consolidation adjustments. Comparative information for FY2015 and FY2014 have been restated for the effects of the change in the reporting related to Potash.
Capital expenditure encompasses expenditure on major projects, as set out in section 6.4, and capital expenditure on sustaining and other items.
Year ended 30 June2016
US$M2015
US$M2014
US$M
Capital expenditure 6,946 11,947 15,224
Exploration expenditurePetroleum 590 567 600Minerals 175 249 386
Total exploration expenditure 765 816 986
Capital and exploration expenditure (cash basis) 7,711 12,763 16,210
Add: equity accounted investments 269 434 871Less: capitalised deferred stripping (1) (750) (815) (1,275)Less: non-controlling interests (834) (1,342) (1,198)
Capital and exploration expenditure (BHP Billiton share) 6,396 11,040 14,608
(1) Capitalised deferred stripping includes US$183 million attributable to non-controlling interests in FY2016 (FY2015: US$142 million; FY2014: US$243 million).
BHP Billiton’s share of capital and exploration expenditure declined by 42 per cent during FY2016 to US$6.4 billion. On a cash basis, capital and exploration expenditure was US$7.7 billion, a decrease of 40 per cent from FY2015. Our rate of investment is expected to decline to US$5.4 billion on a cash basis and to US$5.0 billion BHP Billiton’s share in FY2017.
1.13.2 Underlying financial measuresWe use several financial measures to monitor the financial performance of our overall strategy. The two key non-IFRS measures are Underlying attributable profit and Underlying EBITDA. Underlying attributable profit is the key performance indicator against which short-term incentive outcomes for our senior executives are measured. Underlying EBITDA is the key non-IFRS measure that management uses internally to assess the performance of our segments and make decisions on the allocation of resources and, in our view is more relevant to capital intensive industries with long-life assets.
Underlying attributable profitUnderlying attributable profit of US$1.2 billion decreased by US$5.2 billion from FY2015 due to a significant decline in commodity prices.
The following table reconciles Underlying attributable profit to Attributable (loss)/profit:
Year ended 30 June2016
US$M2015
US$M2014
US$M
Underlying attributable profit 1,215 6,417 13,263Attributable loss – Discontinued operations – (1,573) 184Exceptional items (after taxation) (7,651) (2,946) 385Non-controlling interest in exceptional items (1) 51 12 –
Attributable (loss)/profit (6,385) 1,910 13,832
(1) Relates to non-controlling interest included in the impairment of Onshore US assets in FY2016.

BHP Billiton Annual Report 2016 71
1.13.2 Underlying financial measures continuedExceptional itemsWe exclude what we consider are exceptional items from Underlying attributable profit and Underlying EBITDA in order to enhance the comparability of such measures from period-to-period and provide clarity into the underlying performance of our operations.
The following table provides a summary of exceptional items for FY2016, which are discussed further below:
Year ended 30 June 2016 Gross US$M
Tax US$M
Net US$M
Exceptional items by categorySamarco dam failure (2,450) 253 (2,197)Impairment of Onshore US assets (1) (7,184) 2,300 (4,884)Global taxation matters (70) (500) (570)
Total (9,704) 2,053 (7,651)
(1) Includes amounts attributable to non-controlling interests of US$(51) million after tax benefit.
Samarco Mineração S.A. (Samarco) dam failureThe exceptional loss of US$2,450 million (before tax) related to the Samarco dam failure in November 2015 comprises the following:
Year ended 30 June 2016 US$M
Share of loss relating to the Samarco dam failure (655)Impairment of the carrying value of the investment in Samarco (525)Samarco dam failure provision (1,200)Costs incurred directly by BHP Billiton in relation to the Samarco dam failure (70)
Loss from equity accounted investments, related impairments and expenses (1) (2,450)
(1) BHP Billiton Brasil Ltda has adjusted its investment in Samarco to US$ nil (resulting from US$(655) million share of loss from Samarco and US$(525) million impairment), recognised a provision of US$(1,200) million for potential obligations under the Framework Agreement and together with other BHP Billiton entities incurred US$(70) million of direct costs in relation to the Samarco dam failure. US$(572) million of the US$(1,200) million provision represents an additional share of loss from Samarco with the remaining US$(628) million recognised as provision expense. Refer to note 3 ‘Significant events – Samarco dam failure’ to the Financial Statements.
Impairment of Onshore US assetsThe Group recognised an impairment charge of US$4.9 billion (after tax benefit) against the carrying value of its Onshore US assets in FY2016. The impairment reflects changes to price assumptions, discount rates and development plans. This follows significant volatility and much weaker prices experienced in the oil and gas industry, which have more than offset our substantial productivity improvements.
Global taxation mattersGlobal taxation matters include amounts provided for unresolved tax matters and other claims for which the timing of resolution and potential economic outflow are uncertain (refer to note 5 ‘Income tax expense’ to the Financial Statements).
The following table provides a summary of exceptional items for FY2015, which are discussed further below:
Year ended 30 June 2015 Gross US$M
Tax US$M
Net US$M
Exceptional items by categoryImpairment of Onshore US assets (2,787) 829 (1,958)Impairment of Nickel West assets (409) 119 (290)Repeal of Minerals Resource Rent Tax legislation (1) – (698) (698)
Total (3,196) 250 (2,946)
(1) Includes amounts attributable to non-controlling interests of US$(12) million.
In FY2015, the Group recognised an impairment charge of US$2.0 billion (after tax benefit) in relation to its Onshore US assets. The gas-focused Hawkville field accounts for the substantial majority of this charge reflecting its geological complexity, product mix, acreage relinquishments and amended development plans. The remainder relates to the impairment of goodwill associated with the Petrohawk acquisition.
The Group announced on 12 November 2014 that the review of its Nickel West business was complete and the preferred option, the sale of the business, was not achievable on an acceptable basis. As a result of operational decisions made subsequent to the conclusion of this process, an impairment charge of US$290 million (after tax benefit) was recognised in FY2015.
The legislation to repeal the Minerals Resource Rent Tax (MRRT) in Australia took effect on 30 September 2014. As a result, the Group derecognised a MRRT deferred tax asset of US$809 million and corresponding taxation charges of US$698 million related to Continuing operations and US$111 million related to Discontinued operations were recognised in FY2015.
The following table provides a summary of exceptional items for FY2014, which are discussed further below:
Year ended 30 June 2014 Gross US$M
Tax US$M
Net US$M
Exceptional items by categorySale of Pinto Valley 551 (166) 385
Total 551 (166) 385
In FY2014, the Group announced on 11 October 2013 that it had completed the sale of its Pinto Valley mining operation for cash consideration of US$653 million, after working capital adjustments. A gain on sale of US$385 million (after tax expense) was recognised in FY2014.
2 Governance at BH
P Billiton3
Remuneration Report
4 D
irectors’ Report 1
Strategic Report

72 BHP Billiton Annual Report 2016
1 Strategic Report continued
1.13.2 Underlying financial measures continuedUnderlying EBITDAUnderlying EBITDA of US$12.3 billion reduced by US$9.5 billion from FY2015. The following table reconciles Underlying EBITDA to (Loss)/profit after taxation from Continuing operations:
Year ended 30 June2016
US$M2015
US$M2014
US$M
Underlying EBITDA 12,340 21,852 30,292Depreciation, amortisation and impairments (1) (8,871) (9,986) (8,194)Exceptional items (before taxation) (1) (9,704) (3,196) 551
(Loss)/profit from operations (6,235) 8,670 22,649
Net finance costs (1,024) (614) (914)
Total taxation benefit/(expense) 1,052 (3,666) (6,780)
(Loss)/profit after taxation from Continuing operations (6,207) 4,390 14,955
(1) Impairments that we classify as exceptional items are excluded from depreciation, amortisation and impairments. Depreciation, amortisation and impairments includes non-exceptional impairments of US$210 million (FY2015: US$828 million; FY2014: US$478 million).
Group and segment level information is reported on a statutory basis in accordance with IFRS 8 ‘Operating Segments’. The following table provides a summary of Underlying EBITDA for our segments:
Year ended 30 June
2016US$M
2015US$M
Restated
2014US$M
Restated
Underlying EBITDAPetroleum (1) 3,658 7,201 9,826Copper 2,619 5,205 6,127Iron Ore 5,599 8,648 13,531Coal 635 1,242 1,258Group and unallocated items (1) (171) (444) (450)
BHP Billiton Group 12,340 21,852 30,292
(1) Group and unallocated items includes functions, other unallocated operations, including Potash (previously disclosed in the former Petroleum and Potash reportable segment), Nickel West and consolidated adjustments. Comparative information for FY2015 and FY2014 have been restated for the effects of the change in the reporting related to Potash.

BHP Billiton Annual Report 2016 73
1.13.2 Underlying financial measures continuedThe following table describes the impact of the principal factors that affected Underlying EBITDA for FY2016 and relates them back to our statutory accounts:
RevenueUS$M
Total expenses, other income and (Loss)/profit from equity accounted
investmentsUS$M
(Loss)/profit from operations
US$M
Depreciation, amortisation and impairments and
Exceptional ItemsUS$M
Underlying EBITDA
US$M
For the year ended 30 June 2015Revenue 44,636Other income 496Expenses excluding net finance costs (37,010)(Loss)/profit from equity accounted investments, related impairments and expenses 548
Total other income, expenses excluding net finance costs and (Loss)/profit from equity accounted investments, related impairments and expenses (35,966)
(Loss)/profit from operations 8,670Depreciation, amortisation and impairments (1) 9,986Exceptional items (1) (refer to note 2 ‘Exceptional items’ to the Financial Statements) 3,196
Underlying EBITDA 21,852
Change in sales prices (11,996) 690 (11,306) – (11,306)Price-linked costs – 592 592 – 592
Net price impact (11,996) 1,282 (10,714) – (10,714)
Productivity volumes (378) (404) (782) – (782)Growth volumes (568) 185 (383) – (383)
Changes in volumes (946) (219) (1,165) – (1,165)
Operating cash costs – 1,040 1,040 – 1,040Exploration and business development – 368 368 – 368
Change in controllable cash costs (2) – 1,408 1,408 – 1,408
Exchange rates (142) 1,248 1,106 – 1,106Inflation on costs – (328) (328) – (328)Fuel and energy – 248 248 – 248Non-cash – 196 196 – 196One-off items – 338 338 – 338
Change in other costs (142) 1,702 1,560 – 1,560
Asset sales – 25 25 – 25Ceased and sold operations (414) 157 (257) – (257)Share of operating profit from equity accounted investments – (272) (272) – (272)Other (226) 129 (97) – (97)
Depreciation, amortisation and impairments (1) – 1,115 1,115 (1,115) –Exceptional items (1) – (6,508) (6,508) 6,508 –
For the year ended 30 June 2016Revenue 30,912Other income 444Expenses excluding net finance costs (35,487)(Loss)/profit from equity accounted investments, related impairments and expenses (2,104)
Total other income, expenses excluding net finance costs and (Loss)/profit from equity accounted investments, related impairments and expenses (37,147)
(Loss)/profit from operations (6,235)Depreciation, amortisation and impairments (1) 8,871Exceptional items (1) (refer to note 2 ‘Exceptional items’ to the Financial Statements) 9,704
Underlying EBITDA 12,340
(1) Impairments that we classify as exceptional items are excluded from depreciation, amortisation and impairments. Depreciation, amortisation and impairments includes non-exceptional impairments of US$210 million (FY2015: US$828 million; FY2014: US$478 million).
(2) Collectively we refer to the change in operating cash costs and change in exploration and business development as change in controllable cash costs. Operating cash costs by definition do not include non-cash costs. The change in operating cash costs also excludes the impact of exchange rates and inflation, changes in fuel and energy costs, changes in exploration and business development costs and one-off items. These items are excluded so as to provide a consistent measurement of changes in costs across all segments, based on the factors that are within the control and responsibility of the segment. Change in controllable cash costs and change in operating cash costs are not measures that are recognised by IFRS. They may differ from similarly titled measures reported by other companies.
2 Governance at BH
P Billiton3
Remuneration Report
4 D
irectors’ Report 1
Strategic Report
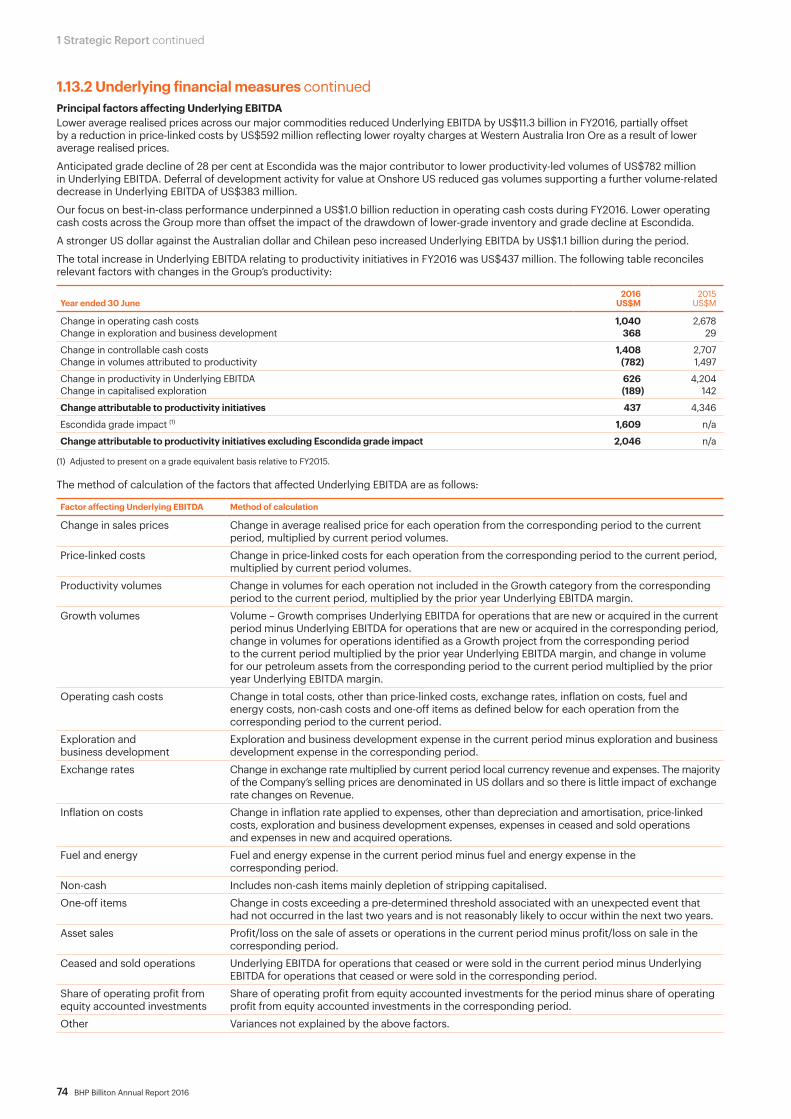
74 BHP Billiton Annual Report 2016
1 Strategic Report continued
1.13.2 Underlying financial measures continuedPrincipal factors affecting Underlying EBITDALower average realised prices across our major commodities reduced Underlying EBITDA by US$11.3 billion in FY2016, partially offset by a reduction in price-linked costs by US$592 million reflecting lower royalty charges at Western Australia Iron Ore as a result of lower average realised prices.
Anticipated grade decline of 28 per cent at Escondida was the major contributor to lower productivity-led volumes of US$782 million in Underlying EBITDA. Deferral of development activity for value at Onshore US reduced gas volumes supporting a further volume-related decrease in Underlying EBITDA of US$383 million.
Our focus on best-in-class performance underpinned a US$1.0 billion reduction in operating cash costs during FY2016. Lower operating cash costs across the Group more than offset the impact of the drawdown of lower-grade inventory and grade decline at Escondida.
A stronger US dollar against the Australian dollar and Chilean peso increased Underlying EBITDA by US$1.1 billion during the period.
The total increase in Underlying EBITDA relating to productivity initiatives in FY2016 was US$437 million. The following table reconciles relevant factors with changes in the Group’s productivity:
Year ended 30 June2016
US$M2015
US$M
Change in operating cash costs 1,040 2,678Change in exploration and business development 368 29
Change in controllable cash costs 1,408 2,707Change in volumes attributed to productivity (782) 1,497
Change in productivity in Underlying EBITDA 626 4,204Change in capitalised exploration (189) 142
Change attributable to productivity initiatives 437 4,346
Escondida grade impact (1) 1,609 n/a
Change attributable to productivity initiatives excluding Escondida grade impact 2,046 n/a
(1) Adjusted to present on a grade equivalent basis relative to FY2015.
The method of calculation of the factors that affected Underlying EBITDA are as follows:
Factor affecting Underlying EBITDA Method of calculation
Change in sales prices Change in average realised price for each operation from the corresponding period to the current period, multiplied by current period volumes.
Price-linked costs Change in price-linked costs for each operation from the corresponding period to the current period, multiplied by current period volumes.
Productivity volumes Change in volumes for each operation not included in the Growth category from the corresponding period to the current period, multiplied by the prior year Underlying EBITDA margin.
Growth volumes Volume – Growth comprises Underlying EBITDA for operations that are new or acquired in the current period minus Underlying EBITDA for operations that are new or acquired in the corresponding period, change in volumes for operations identified as a Growth project from the corresponding period to the current period multiplied by the prior year Underlying EBITDA margin, and change in volume for our petroleum assets from the corresponding period to the current period multiplied by the prior year Underlying EBITDA margin.
Operating cash costs Change in total costs, other than price-linked costs, exchange rates, inflation on costs, fuel and energy costs, non-cash costs and one-off items as defined below for each operation from the corresponding period to the current period.
Exploration and business development
Exploration and business development expense in the current period minus exploration and business development expense in the corresponding period.
Exchange rates Change in exchange rate multiplied by current period local currency revenue and expenses. The majority of the Company’s selling prices are denominated in US dollars and so there is little impact of exchange rate changes on Revenue.
Inflation on costs Change in inflation rate applied to expenses, other than depreciation and amortisation, price-linked costs, exploration and business development expenses, expenses in ceased and sold operations and expenses in new and acquired operations.
Fuel and energy Fuel and energy expense in the current period minus fuel and energy expense in the corresponding period.
Non-cash Includes non-cash items mainly depletion of stripping capitalised.One-off items Change in costs exceeding a pre-determined threshold associated with an unexpected event that
had not occurred in the last two years and is not reasonably likely to occur within the next two years.Asset sales Profit/loss on the sale of assets or operations in the current period minus profit/loss on sale in the
corresponding period.Ceased and sold operations Underlying EBITDA for operations that ceased or were sold in the current period minus Underlying
EBITDA for operations that ceased or were sold in the corresponding period.Share of operating profit from equity accounted investments
Share of operating profit from equity accounted investments for the period minus share of operating profit from equity accounted investments in the corresponding period.
Other Variances not explained by the above factors.
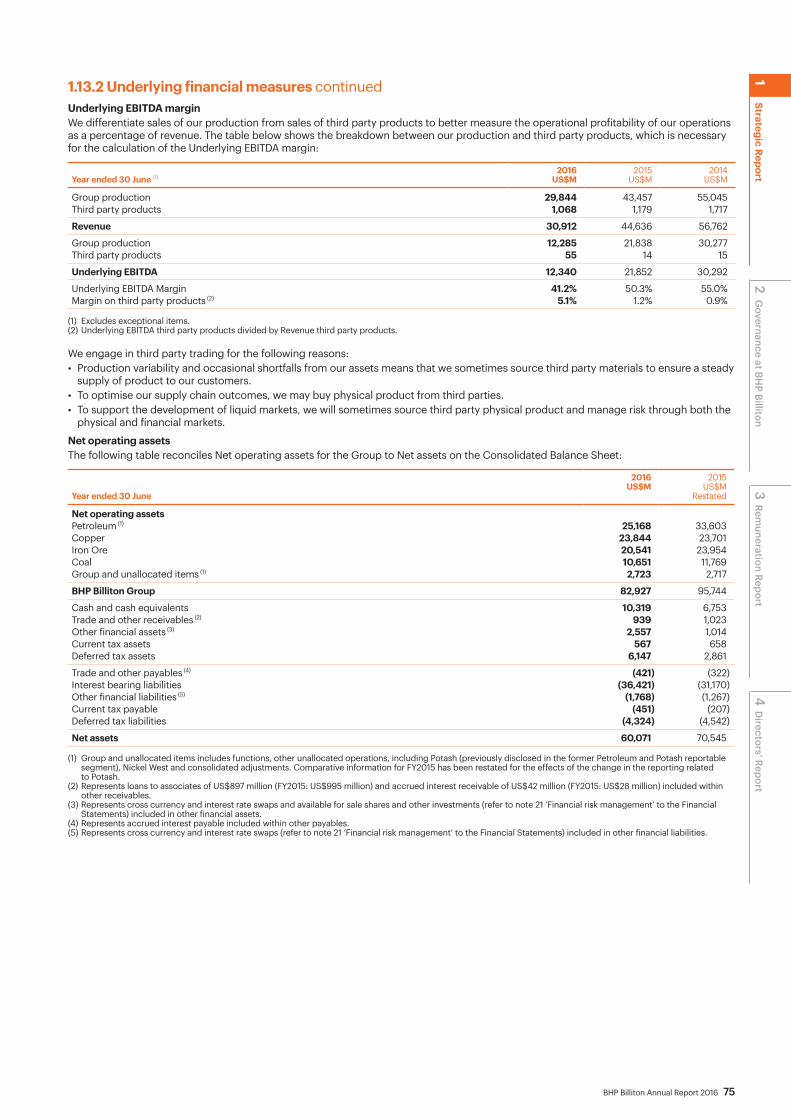
BHP Billiton Annual Report 2016 75
1.13.2 Underlying financial measures continuedUnderlying EBITDA marginWe differentiate sales of our production from sales of third party products to better measure the operational profitability of our operations as a percentage of revenue. The table below shows the breakdown between our production and third party products, which is necessary for the calculation of the Underlying EBITDA margin:
Year ended 30 June (1)2016
US$M2015
US$M2014
US$M
Group production 29,844 43,457 55,045Third party products 1,068 1,179 1,717
Revenue 30,912 44,636 56,762
Group production 12,285 21,838 30,277Third party products 55 14 15
Underlying EBITDA 12,340 21,852 30,292
Underlying EBITDA Margin 41.2% 50.3% 55.0%Margin on third party products (2) 5.1% 1.2% 0.9%
(1) Excludes exceptional items.(2) Underlying EBITDA third party products divided by Revenue third party products.
We engage in third party trading for the following reasons:• Production variability and occasional shortfalls from our assets means that we sometimes source third party materials to ensure a steady
supply of product to our customers.• To optimise our supply chain outcomes, we may buy physical product from third parties.• To support the development of liquid markets, we will sometimes source third party physical product and manage risk through both the
physical and financial markets.
Net operating assetsThe following table reconciles Net operating assets for the Group to Net assets on the Consolidated Balance Sheet:
Year ended 30 June
2016US$M
2015US$M
Restated
Net operating assetsPetroleum (1) 25,168 33,603 Copper 23,844 23,701Iron Ore 20,541 23,954Coal 10,651 11,769Group and unallocated items (1) 2,723 2,717
BHP Billiton Group 82,927 95,744
Cash and cash equivalents 10,319 6,753Trade and other receivables (2) 939 1,023Other financial assets (3) 2,557 1,014Current tax assets 567 658Deferred tax assets 6,147 2,861
Trade and other payables (4) (421) (322)Interest bearing liabilities (36,421) (31,170)Other financial liabilities (5) (1,768) (1,267)Current tax payable (451) (207)Deferred tax liabilities (4,324) (4,542)
Net assets 60,071 70,545
(1) Group and unallocated items includes functions, other unallocated operations, including Potash (previously disclosed in the former Petroleum and Potash reportable segment), Nickel West and consolidated adjustments. Comparative information for FY2015 has been restated for the effects of the change in the reporting related to Potash.
(2) Represents loans to associates of US$897 million (FY2015: US$995 million) and accrued interest receivable of US$42 million (FY2015: US$28 million) included within other receivables.
(3) Represents cross currency and interest rate swaps and available for sale shares and other investments (refer to note 21 ‘Financial risk management’ to the Financial Statements) included in other financial assets.
(4) Represents accrued interest payable included within other payables. (5) Represents cross currency and interest rate swaps (refer to note 21 ‘Financial risk management’ to the Financial Statements) included in other financial liabilities.
2 Governance at BH
P Billiton3
Remuneration Report
4 D
irectors’ Report 1
Strategic Report

76 BHP Billiton Annual Report 2016
1 Strategic Report continued
1.13.3 Net debt and sources of liquidityOur policies on debt and liquidity management pursue the following objectives:• a strong balance sheet through the cycle;• diversification of funding sources; • maintain borrowings and excess cash predominantly
in US dollars.Gearing and net debtAt the end of FY2016, net debt, comprising Interest bearing liabilities less Cash and cash equivalents, was US$26.1 billion, which represented an increase of US$1.7 billion compared with the net debt position at 30 June 2015. Gearing, which is the ratio of net debt to net debt plus net assets, was 30.3 per cent at 30 June 2016, compared with 25.7 per cent at 30 June 2015.Cash and cash equivalents less overdrafts at 30 June 2016 was US$10.3 billion compared with US$6.6 billion at 30 June 2015. Included within Cash and cash equivalents were short-term deposits of US$9.8 billion compared with US$5.8 billion at 30 June 2015.
Funding sourcesIn October 2015, BHP Billiton issued the following hybrid notes:• US$3.25 billion of subordinated fixed rate reset notes across
two tranches, comprising US$1,000 million in a 60NC5 maturity bearing an initial coupon of 6.250 per cent and US$2,250 million in a 60NC10 maturity bearing an initial coupon of 6.750 per cent.
• €2.0 billion of subordinated fixed rate reset notes across two tranches comprising €1,250 million in a 60.5NC5.5 maturity bearing an initial coupon of 4.750 per cent and €750 million in a 64NC9 maturity bearing an initial coupon of 5.625 per cent.
• £600 million of subordinated fixed rate reset notes in a 62NC7 maturity bearing an initial coupon of 6.500 per cent.
None of our Company-level borrowing facilities is subject to financial covenants. Certain specific financing facilities in relation to specific assets are the subject of financial covenants that vary from facility to facility, but which would be considered normal for such facilities. In addition to the Company’s uncommitted debt issuance programs, we hold the following committed standby facilities.
Facility available 2016
US$M
Drawn 2016
US$M
Undrawn2016
US$M
Facility available 2015
US$M
Drawn 2015
US$M
Undrawn2015
US$M
Revolving credit facility (1) 6,000 – 6,000 6,000 – 6,000
Total financing facilities 6,000 – 6,000 6,000 – 6,000
(1) The Company’s committed US$6.0 billion revolving credit facility operates as a back-stop to the Company’s uncommitted commercial paper program. The combined amount drawn under the facility or as commercial paper will not exceed US$6.0 billion. As at 30 June 2016, US$ nil commercial paper was drawn (2015: US$ nil), therefore US$6.0 billion of committed facility was available to use (2015: US$6.0 billion). The revolving credit facility expires on 7 May 2021. A commitment fee is payable on the undrawn balance and an interest rate comprising an interbank rate plus a margin applies to any drawn balance. The agreed margins are typical for a credit facility extended to a company with the Company’s credit rating.
For more information regarding the maturity profile of our debt obligations and details of our standby and support agreements, refer to note 21 ‘Financial risk management’ to the Financial Statements.In the Company’s opinion, working capital is sufficient for the Company’s present requirements.The Company’s credit ratings are currently A3/P-2 outlook negative (Moody’s – long-term/short-term) and A/A-1 outlook negative (Standard & Poor’s – long-term/short-term).

BHP Billiton Annual Report 2016 77
1.14 Performance by commodityManagement believes the following financial information presented by each commodity provides meaningful indicators of the underlying performance of the assets, including equity accounted investments, of each reportable segment. Information relating to assets that are accounted for as equity accounted investments are shown to reflect BHP Billiton’s share, unless otherwise noted, to provide insight into the drivers of these operations.
For financial information, segments are reported on a statutory basis in accordance with IFRS 8 ‘Operating Segments’ and consequently the tables included for each commodity include an ‘adjustment for equity accounted investments’ to reconcile the equity accounted results to the statutory segment results. For more information on the financial results of our segments, refer to note 1 ‘Segment reporting’ to the Financial Statements.
Unit cash costs is one of the financial measures used to monitor the performance of our individual assets and is included in the analysis of each reportable segment.
1.14.1 PetroleumDetailed below is Petroleum financial information for FY2016 and FY2015 and an analysis of Petroleum’s financial performance for FY2016 compared to FY2015.
Year ended30 June 2016US$M Revenue (i)
Underlying EBITDA D&A
Underlying EBIT
Net operating
assetsCapital
expenditureExploration
gross (ii) Exploration
to profit (iii)
Australia Production Unit (iv) 707 542 349 193 1,166 246Bass Strait 930 690 174 516 3,082 226North West Shelf 1,171 830 182 648 1,389 180Atlantis 652 481 485 (4) 1,795 328Shenzi 499 386 245 141 1,133 55Mad Dog 123 84 44 40 697 128Eagle Ford 1,508 687 1,710 (1,023) 7,193 781Permian 260 52 279 (227) 1,114 365Haynesville 299 (67) 305 (372) 2,994 44Fayetteville 246 20 154 (134) 945 49Trinidad/Tobago (v) 123 95 22 73 986 (26)Algeria 144 41 33 8 44 86Exploration − (273) 97 (370) 758 −Other (vi) (vii) 119 56 119 (63) 2,727 55
Total Petroleum from Group production 6,781 3,624 4,198 (574) 26,023 2,517 590 288
Closed mines (viii) − 20 − 20 (855) − − −Third party products 128 17 − 17 − −
Total Petroleum 6,909 3,661 4,198 (537) 25,168 2,517 590 288
Adjustment for equity accounted investments (ix) (15) (3) (3) − − − − −
Total Petroleum statutory result 6,894 3,658 4,195 (537) 25,168 2,517 590 288
Year ended30 June 2015(Restated) (x)
US$M Revenue (i) Underlying
EBITDA D&AUnderlying
EBIT
Net operating
assetsCapital
expenditureExploration
gross (ii)Exploration
to profit (iii)
Australia Production Unit (iv) 1,003 862 337 525 1,091 44Bass Strait 1,291 1,025 127 898 3,055 328North West Shelf 1,899 1,351 186 1,165 1,400 135Atlantis 1,071 904 368 536 2,146 354Shenzi 973 868 287 581 1,399 268Mad Dog 175 87 34 53 581 101Eagle Ford 2,932 1,792 2,172 (380) 10,754 2,315Permian 263 69 502 (433) 1,096 773Haynesville 532 13 554 (541) 5,916 411Fayetteville 448 162 195 (33) 2,960 183Trinidad/Tobago 220 159 28 131 827 10Algeria 309 247 38 209 97 23Exploration − (481) 48 (529) 733 −Other (vi) (vii) 276 98 342 (244) 2,518 78
Total Petroleum from Group production 11,392 7,156 5,218 1,938 34,573 5,023 567 529
Closed Mines (viii) − 47 − 47 (970) − − −Third party products 69 1 − 1 − −
Total Petroleum 11,461 7,204 5,218 1,986 33,603 5,023 567 529
Adjustment for equity accounted investments (ix) (14) (3) (3) − − − − −
Total Petroleum statutory result 11,447 7,201 5,215 1,986 33,603 5,023 567 529
(i) Petroleum revenue from Group production includes: crude oil US$3,566 million (2015: US$6,592 million), natural gas US$1,761 million (2015: US$2,489 million), LNG US$864 million (2015: US$1,366 million), NGL US$383 million (2015: US$665 million) and other US$192 million (2015: US$266 million).
(ii) Includes US$317 million of capitalised exploration (2015: US$86 million).(iii) Includes US$15 million of exploration expenditure previously capitalised, written off as impaired (included in depreciation and amortisation) (2015: US$48 million).(iv) Australia Production Unit includes Macedon, Pyrenees, Minerva and Stybarrow (ceased production June 2015).(v) Negative capital expenditure reflects movements in capital creditors.(vi) Predominantly divisional activities, business development, Pakistan (divested in December 2015), UK, Neptune and Genesis. Also includes the Caesar oil pipeline
and the Cleopatra gas pipeline which are equity accounted investments and their financial information presented above with the exception of net operating assets reflects BHP Billiton’s share.
(vii) Goodwill associated with Onshore US of US$3,026 million is included in Other net operating assets (2015: US$3,026 million).(viii) Comprises closed mining and smelting operations in Canada and the United States.(ix) Total Petroleum segment Revenue excludes US$15 million (2015: US$14 million) revenue related to the Caesar oil pipeline and the Cleopatra gas pipeline. Total Petroleum
segment Underlying EBITDA includes US$3 million (2015: US$3 million) D&A related to the Caesar oil pipeline and the Cleopatra gas pipeline.(x) Comparative information for the year ended 30 June 2015 has been restated for the effects of the change in reporting related to Potash.
2 Governance at BH
P Billiton3
Remuneration Report
4 D
irectors’ Report 1
Strategic Report
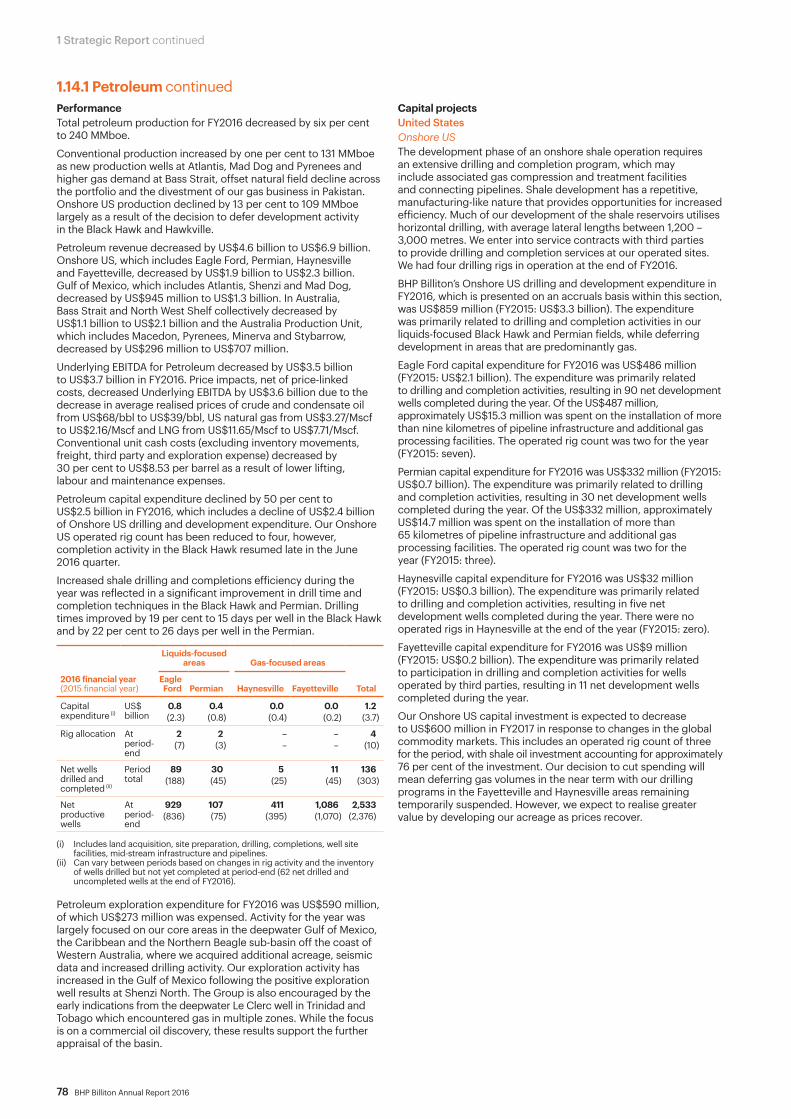
78 BHP Billiton Annual Report 2016
1 Strategic Report continued
1.14.1 Petroleum continuedPerformanceTotal petroleum production for FY2016 decreased by six per cent to 240 MMboe.
Conventional production increased by one per cent to 131 MMboe as new production wells at Atlantis, Mad Dog and Pyrenees and higher gas demand at Bass Strait, offset natural field decline across the portfolio and the divestment of our gas business in Pakistan. Onshore US production declined by 13 per cent to 109 MMboe largely as a result of the decision to defer development activity in the Black Hawk and Hawkville.
Petroleum revenue decreased by US$4.6 billion to US$6.9 billion. Onshore US, which includes Eagle Ford, Permian, Haynesville and Fayetteville, decreased by US$1.9 billion to US$2.3 billion. Gulf of Mexico, which includes Atlantis, Shenzi and Mad Dog, decreased by US$945 million to US$1.3 billion. In Australia, Bass Strait and North West Shelf collectively decreased by US$1.1 billion to US$2.1 billion and the Australia Production Unit, which includes Macedon, Pyrenees, Minerva and Stybarrow, decreased by US$296 million to US$707 million.
Underlying EBITDA for Petroleum decreased by US$3.5 billion to US$3.7 billion in FY2016. Price impacts, net of price-linked costs, decreased Underlying EBITDA by US$3.6 billion due to the decrease in average realised prices of crude and condensate oil from US$68/bbl to US$39/bbl, US natural gas from US$3.27/Mscf to US$2.16/Mscf and LNG from US$11.65/Mscf to US$7.71/Mscf. Conventional unit cash costs (excluding inventory movements, freight, third party and exploration expense) decreased by 30 per cent to US$8.53 per barrel as a result of lower lifting, labour and maintenance expenses.
Petroleum capital expenditure declined by 50 per cent to US$2.5 billion in FY2016, which includes a decline of US$2.4 billion of Onshore US drilling and development expenditure. Our Onshore US operated rig count has been reduced to four, however, completion activity in the Black Hawk resumed late in the June 2016 quarter.
Increased shale drilling and completions efficiency during the year was reflected in a significant improvement in drill time and completion techniques in the Black Hawk and Permian. Drilling times improved by 19 per cent to 15 days per well in the Black Hawk and by 22 per cent to 26 days per well in the Permian.
2016 financial year(2015 financial year)
Liquids-focused areas Gas-focused areas
TotalEagle
Ford Permian Haynesville Fayetteville
Capital expenditure (i)
US$ billion
0.8 (2.3)
0.4 (0.8)
0.0 (0.4)
0.0 (0.2)
1.2 (3.7)
Rig allocation At period- end
2 (7)
2 (3)
––
––
4 (10)
Net wells drilled and completed (ii)
Period total
89 (188)
30 (45)
5 (25)
11 (45)
136(303)
Net productive wells
At period- end
929 (836)
107 (75)
411 (395)
1,086 (1,070)
2,533(2,376)
(i) Includes land acquisition, site preparation, drilling, completions, well site facilities, mid-stream infrastructure and pipelines.
(ii) Can vary between periods based on changes in rig activity and the inventory of wells drilled but not yet completed at period-end (62 net drilled and uncompleted wells at the end of FY2016).
Petroleum exploration expenditure for FY2016 was US$590 million, of which US$273 million was expensed. Activity for the year was largely focused on our core areas in the deepwater Gulf of Mexico, the Caribbean and the Northern Beagle sub-basin off the coast of Western Australia, where we acquired additional acreage, seismic data and increased drilling activity. Our exploration activity has increased in the Gulf of Mexico following the positive exploration well results at Shenzi North. The Group is also encouraged by the early indications from the deepwater Le Clerc well in Trinidad and Tobago which encountered gas in multiple zones. While the focus is on a commercial oil discovery, these results support the further appraisal of the basin.
Capital projectsUnited StatesOnshore USThe development phase of an onshore shale operation requires an extensive drilling and completion program, which may include associated gas compression and treatment facilities and connecting pipelines. Shale development has a repetitive, manufacturing-like nature that provides opportunities for increased efficiency. Much of our development of the shale reservoirs utilises horizontal drilling, with average lateral lengths between 1,200 – 3,000 metres. We enter into service contracts with third parties to provide drilling and completion services at our operated sites. We had four drilling rigs in operation at the end of FY2016.
BHP Billiton’s Onshore US drilling and development expenditure in FY2016, which is presented on an accruals basis within this section, was US$859 million (FY2015: US$3.3 billion). The expenditure was primarily related to drilling and completion activities in our liquids-focused Black Hawk and Permian fields, while deferring development in areas that are predominantly gas.
Eagle Ford capital expenditure for FY2016 was US$486 million (FY2015: US$2.1 billion). The expenditure was primarily related to drilling and completion activities, resulting in 90 net development wells completed during the year. Of the US$487 million, approximately US$15.3 million was spent on the installation of more than nine kilometres of pipeline infrastructure and additional gas processing facilities. The operated rig count was two for the year (FY2015: seven).
Permian capital expenditure for FY2016 was US$332 million (FY2015: US$0.7 billion). The expenditure was primarily related to drilling and completion activities, resulting in 30 net development wells completed during the year. Of the US$332 million, approximately US$14.7 million was spent on the installation of more than 65 kilometres of pipeline infrastructure and additional gas processing facilities. The operated rig count was two for the year (FY2015: three).
Haynesville capital expenditure for FY2016 was US$32 million (FY2015: US$0.3 billion). The expenditure was primarily related to drilling and completion activities, resulting in five net development wells completed during the year. There were no operated rigs in Haynesville at the end of the year (FY2015: zero).
Fayetteville capital expenditure for FY2016 was US$9 million (FY2015: US$0.2 billion). The expenditure was primarily related to participation in drilling and completion activities for wells operated by third parties, resulting in 11 net development wells completed during the year.
Our Onshore US capital investment is expected to decrease to US$600 million in FY2017 in response to changes in the global commodity markets. This includes an operated rig count of three for the period, with shale oil investment accounting for approximately 76 per cent of the investment. Our decision to cut spending will mean deferring gas volumes in the near term with our drilling programs in the Fayetteville and Haynesville areas remaining temporarily suspended. However, we expect to realise greater value by developing our acreage as prices recover.

BHP Billiton Annual Report 2016 79
1.14.1 Petroleum continuedAustraliaBass Strait Kipper gas field developmentInitial development of the Kipper gas field in the Gippsland Basin, located offshore from Victoria, was approved by the Board in December 2007. A supplemental approval of the development was granted in January 2011. The first phase of the project included two new subsea wells, three new pipelines and platform modifications to supply 10 Mbbl/d of condensate and 80 MMcf/d of gas.
Gas and liquids will be processed via the existing Gippsland Basin Joint Venture facilities. The Kipper gas field development comprises the Kipper Unit Joint Venture and the Gippsland Basin Joint Venture. We own a 32.5 per cent interest in the Kipper Unit Joint Venture, with Esso Australia owning 32.5 per cent and MEPAU A Pty Ltd owning 35 per cent. We own a 50 per cent interest in the Gippsland Basin Joint Venture, with Esso Australia owning the remaining 50 per cent.
The main Kipper gas field facilities were completed in September 2012, however, first production has not yet commenced due to the need to provide for mercury removal. Funding for the installation of the mercury treatment facilities of US$120 million was approved in March 2014, with completion expected to occur in FY2017. Our share of costs incurred to 30 June 2016 was US$67 million.
Bass Strait Turrum field developmentFurther expansion of the Gippsland Basin facilities is underway following approval by the Board in July 2008 of the full field development of the Turrum oil and gas field. A supplemental approval of the development was obtained in January 2011. The project consists of five wells and a new platform, Marlin B, linked by a bridge to the existing Marlin A platform. The Turrum field, which has a capacity of 11 Mbbl/d of oil and 200 MMcf/d of gas, is located 42 kilometres offshore in approximately 60 metres of water. Our share of development costs is approximately US$1.4 billion, of which US$1.4 billion was incurred as of 30 June 2016.
The Turrum field development operates under the Gippsland Basin Joint Venture, in which we own a 50 per cent interest, with Esso Australia owning the remaining 50 per cent. Initial production of low carbon dioxide gas through the Turrum facilities occurred in June 2013. High carbon dioxide gas production from the Turrum reservoir will come online with completion of the Longford Gas Conditioning Plant in FY2017.
Bass Strait Longford Gas Conditioning The Longford Gas Conditioning Plant (LGCP) Project was approved by the Board in December 2012 to enable the production of Turrum reserves plus the production of Kipper and other undeveloped high carbon dioxide content hydrocarbons. The Project scope includes a carbon dioxide extraction facility, brownfield tie-ins, an electrical upgrade and multiple supporting utilities. Our share of development costs is approximately US$520 million, of which US$382 million was incurred as of 30 June 2016. First gas production is expected in FY2017. Esso Australia is the operator of the LGCP, owning a 50 per cent interest. BHP Billiton owns the remaining 50 per cent.
North West Shelf Greater Western Flank–AThe North West Shelf Greater Western Flank–A (GWF-A) gas project was approved by the Board in November 2011 to recover gas from the Goodwyn H and Tidepole fields. The project consists of a five well subsea tie-back of the Goodwyn H and Tidepole fields to the Goodwyn A platform. The Goodwyn A platform is located in 130 metres of water, approximately 130 kilometres offshore from Karratha on the northwest coast of Australia. Our share of development costs is approximately US$400 million, of which US$269 million was incurred as of 30 June 2016. First gas was produced in the December 2015 quarter from the first two wells. Woodside is the operator and BHP Billiton owns a 16.67 per cent interest.
North West Shelf Other – Greater Western Flank–BThe Greater Western Flank ‘2’ project was sanctioned by the Board in December 2015 and represents the second phase of development of the core Greater Western Flank fields, behind the GWF-A development. It is located to the southwest of the existing Goodwyn A platform. Woodside is the operator and BHP Billiton owns a 16.67 per cent share. Execution activities are in progress, with first production expected in CY2019.
Significant evaluation activitiesWe perform development evaluation activities to determine the technical feasibility and commercial viability of prospective projects after exploration and appraisal. Our significant recent evaluation activities include:
United StatesMad Dog Phase 2The Mad Dog Phase 2 project is in response to the successful Mad Dog South appraisal well, which confirmed significant hydrocarbons in the southern portion of the Mad Dog field. The project was sent back to study phase in 2013, following which a revised development concept was selected by the owners. The revised concept will undergo further refinement and undertake additional investigations in FY2017. BP is the operator. BHP Billiton holds a 23.9 per cent working interest.
AustraliaScarboroughDevelopment planning for the large Scarborough gas field offshore Western Australia is in progress. Further work to optimise a preferred development option is ongoing. Esso is the operator of the WA-1-R lease and we hold a 50 per cent working interest. We are the operator of, and have a 100 per cent working interest in, the adjacent Thebe discovery and the WA-346-P block. On 5 September 2016, BHP Billiton announced it had reached agreement with Woodside Energy Limited (Woodside) to divest 50 per cent of BHP Billiton’s interest in the undeveloped Scarborough area gas fields.
For more information on the partial divestment of Scarborough interests, refer to note 33 ‘Subsequent events’ to the Financial Statements.
Exploration and appraisalOur exploration strategy is to focus on material opportunities, at high working interest, with a bias for liquids and operatorship. While the majority of the expenditure incurred in FY2016 was in our Gulf of Mexico, Western Australia and Trinidad and Tobago focus areas, we also incurred expenditure in South Africa, Brazil, South-East Asia, India and Onshore US.
AccessWe acquired acreage in the US sector of the Gulf of Mexico and in Australia during FY2016. In the Gulf of Mexico, we were awarded 26 blocks from Lease sale 246, held in August 2015 (100 per cent working interest and operator on all blocks; 606 square kilometres). In addition, we were awarded four blocks from Lease sale 241, held in March 2016 (100 per cent working interest and operator; 93 square kilometres).
A Lease Exchange Agreement was executed in April 2016 with Chevron for 61 blocks totalling 1,422 square kilometres (60 per cent working interest and operator in 54 blocks, 50 per cent working interest in the remaining seven leases and operator of five of them). A purchase agreement was executed in May 2016 with Conoco Philips for 26 blocks totalling 606 square kilometres (100 per cent working interest and operator).
In Australia, we finalised a farm-in and joint operating agreement for a 60 per cent interest and operatorship in Western Australia Block WA-484-P (totalling 13,611 square kilometres) with CNOOC Limited.
2 Governance at BH
P Billiton3
Remuneration Report
4 D
irectors’ Report 1
Strategic Report
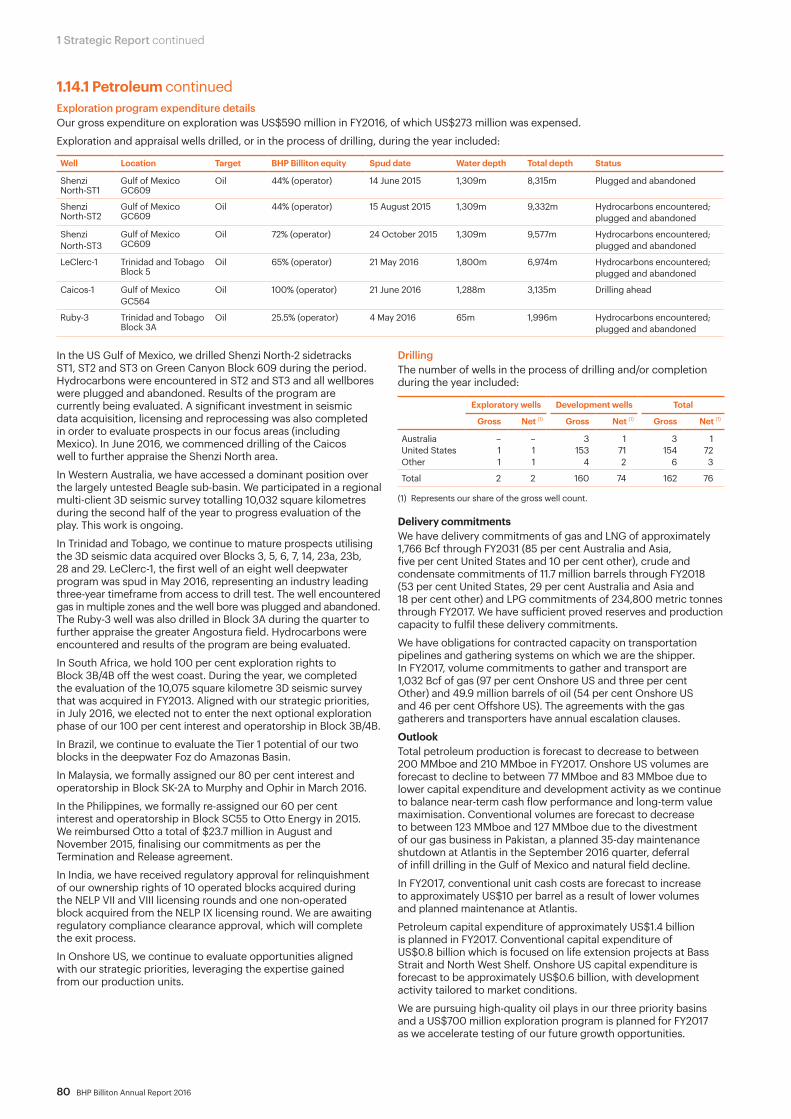
80 BHP Billiton Annual Report 2016
1 Strategic Report continued
1.14.1 Petroleum continuedExploration program expenditure detailsOur gross expenditure on exploration was US$590 million in FY2016, of which US$273 million was expensed.
Exploration and appraisal wells drilled, or in the process of drilling, during the year included:
Well Location Target BHP Billiton equity Spud date Water depth Total depth Status
Shenzi North-ST1
Gulf of Mexico GC609
Oil 44% (operator) 14 June 2015 1,309m 8,315m Plugged and abandoned
Shenzi North-ST2
Gulf of Mexico GC609
Oil 44% (operator) 15 August 2015 1,309m 9,332m Hydrocarbons encountered;plugged and abandoned
Shenzi North-ST3
Gulf of Mexico GC609
Oil 72% (operator) 24 October 2015 1,309m 9,577m Hydrocarbons encountered;plugged and abandoned
LeClerc-1 Trinidad and Tobago Block 5
Oil 65% (operator) 21 May 2016 1,800m 6,974m Hydrocarbons encountered;plugged and abandoned
Caicos-1 Gulf of MexicoGC564
Oil 100% (operator) 21 June 2016 1,288m 3,135m Drilling ahead
Ruby-3 Trinidad and Tobago Block 3A
Oil 25.5% (operator) 4 May 2016 65m 1,996m Hydrocarbons encountered;plugged and abandoned
In the US Gulf of Mexico, we drilled Shenzi North-2 sidetracks ST1, ST2 and ST3 on Green Canyon Block 609 during the period. Hydrocarbons were encountered in ST2 and ST3 and all wellbores were plugged and abandoned. Results of the program are currently being evaluated. A significant investment in seismic data acquisition, licensing and reprocessing was also completed in order to evaluate prospects in our focus areas (including Mexico). In June 2016, we commenced drilling of the Caicos well to further appraise the Shenzi North area.
In Western Australia, we have accessed a dominant position over the largely untested Beagle sub-basin. We participated in a regional multi-client 3D seismic survey totalling 10,032 square kilometres during the second half of the year to progress evaluation of the play. This work is ongoing.
In Trinidad and Tobago, we continue to mature prospects utilising the 3D seismic data acquired over Blocks 3, 5, 6, 7, 14, 23a, 23b, 28 and 29. LeClerc-1, the first well of an eight well deepwater program was spud in May 2016, representing an industry leading three-year timeframe from access to drill test. The well encountered gas in multiple zones and the well bore was plugged and abandoned. The Ruby-3 well was also drilled in Block 3A during the quarter to further appraise the greater Angostura field. Hydrocarbons were encountered and results of the program are being evaluated.
In South Africa, we hold 100 per cent exploration rights to Block 3B/4B off the west coast. During the year, we completed the evaluation of the 10,075 square kilometre 3D seismic survey that was acquired in FY2013. Aligned with our strategic priorities, in July 2016, we elected not to enter the next optional exploration phase of our 100 per cent interest and operatorship in Block 3B/4B.
In Brazil, we continue to evaluate the Tier 1 potential of our two blocks in the deepwater Foz do Amazonas Basin.
In Malaysia, we formally assigned our 80 per cent interest and operatorship in Block SK-2A to Murphy and Ophir in March 2016.
In the Philippines, we formally re-assigned our 60 per cent interest and operatorship in Block SC55 to Otto Energy in 2015. We reimbursed Otto a total of $23.7 million in August and November 2015, finalising our commitments as per the Termination and Release agreement.
In India, we have received regulatory approval for relinquishment of our ownership rights of 10 operated blocks acquired during the NELP VII and VIII licensing rounds and one non-operated block acquired from the NELP IX licensing round. We are awaiting regulatory compliance clearance approval, which will complete the exit process.
In Onshore US, we continue to evaluate opportunities aligned with our strategic priorities, leveraging the expertise gained from our production units.
DrillingThe number of wells in the process of drilling and/or completion during the year included:
Exploratory wells Development wells Total
Gross Net (1) Gross Net (1) Gross Net (1)
Australia – – 3 1 3 1United States 1 1 153 71 154 72Other 1 1 4 2 6 3
Total 2 2 160 74 162 76
(1) Represents our share of the gross well count.
Delivery commitments We have delivery commitments of gas and LNG of approximately 1,766 Bcf through FY2031 (85 per cent Australia and Asia, five per cent United States and 10 per cent other), crude and condensate commitments of 11.7 million barrels through FY2018 (53 per cent United States, 29 per cent Australia and Asia and 18 per cent other) and LPG commitments of 234,800 metric tonnes through FY2017. We have sufficient proved reserves and production capacity to fulfil these delivery commitments.
We have obligations for contracted capacity on transportation pipelines and gathering systems on which we are the shipper. In FY2017, volume commitments to gather and transport are 1,032 Bcf of gas (97 per cent Onshore US and three per cent Other) and 49.9 million barrels of oil (54 per cent Onshore US and 46 per cent Offshore US). The agreements with the gas gatherers and transporters have annual escalation clauses.
OutlookTotal petroleum production is forecast to decrease to between 200 MMboe and 210 MMboe in FY2017. Onshore US volumes are forecast to decline to between 77 MMboe and 83 MMboe due to lower capital expenditure and development activity as we continue to balance near-term cash flow performance and long-term value maximisation. Conventional volumes are forecast to decrease to between 123 MMboe and 127 MMboe due to the divestment of our gas business in Pakistan, a planned 35-day maintenance shutdown at Atlantis in the September 2016 quarter, deferral of infill drilling in the Gulf of Mexico and natural field decline.
In FY2017, conventional unit cash costs are forecast to increase to approximately US$10 per barrel as a result of lower volumes and planned maintenance at Atlantis.
Petroleum capital expenditure of approximately US$1.4 billion is planned in FY2017. Conventional capital expenditure of US$0.8 billion which is focused on life extension projects at Bass Strait and North West Shelf. Onshore US capital expenditure is forecast to be approximately US$0.6 billion, with development activity tailored to market conditions.
We are pursuing high-quality oil plays in our three priority basins and a US$700 million exploration program is planned for FY2017 as we accelerate testing of our future growth opportunities.

BHP Billiton Annual Report 2016 81
1.14.2 CopperDetailed below is Copper financial information for FY2016 and FY2015 and an analysis of Copper’s financial performance for FY2016 compared to FY2015.
Year ended30 June 2016US$M Revenue
Underlying EBITDA D&A
Underlying EBIT
Net operating
assetsCapital
expenditureExploration
grossExploration
to profit
Escondida (i) 4,881 1,743 930 813 14,449 2,268Pampa Norte (ii) 1,098 401 401 − 1,786 321Antamina (iii) 891 439 114 325 1,349 198Olympic Dam 1,432 385 237 148 6,339 197Other (iii) (iv) − (158) 10 (168) (79) −
Total Copper from Group production 8,302 2,810 1,692 1,118 23,844 2,984
Third party products 838 46 − 46 − −
Total Copper 9,140 2,856 1,692 1,164 23,844 2,984 65 65
Adjustment for equity accounted investments (v) (891) (237) (115) (122) − (198) (1) (1)
Total Copper statutory result 8,249 2,619 1,577 1,042 23,844 2,786 64 64
Year ended30 June 2015US$M Revenue
Underlying EBITDA D&A
Underlying EBIT
Net operating
assetsCapital
expenditureExploration
grossExploration
to profit
Escondida (i) 7,819 4,064 920 3,144 13,909 3,273Pampa Norte (ii) 1,437 762 669 93 1,926 242Antamina (iii) 854 420 107 313 1,379 163Olympic Dam 1,244 280 253 27 6,665 307Other (iii) (iv) − (152) 11 (163) (178) −
Total Copper from Group production 11,354 5,374 1,960 3,414 23,701 3,985
Third party products 953 23 − 23 − −
Total Copper 12,307 5,397 1,960 3,437 23,701 3,985 91 91
Adjustment for equity accounted investments (v) (854) (192) (108) (84) − (163) (1) (1)
Total Copper statutory result 11,453 5,205 1,852 3,353 23,701 3,822 90 90
(i) Escondida is consolidated under IFRS 10 and reported on a 100 per cent basis.(ii) Includes Spence and Cerro Colorado.(iii) Antamina and Resolution are equity accounted investments and their financial information presented above with the exception of net operating assets reflects
BHP Billiton’s share.(iv) Predominantly comprises divisional activities, greenfield exploration and business development. Includes Resolution.(v) Total Copper segment Revenue excludes US$891 million (2015: US$854 million) revenue related to Antamina. Total Copper segment Underlying EBITDA includes
US$115 million (2015: US$108 million) D&A and US$122 million (2015: US$84 million) net finance costs and taxation benefit/(expense) related to Antamina and Resolution that are also included in Underlying EBIT. Copper segment Capital expenditure excludes US$198 million (2015: US$163 million) and US$1 million (2015: US$1 million) Exploration expenditure related to Antamina.
2 Governance at BH
P Billiton3
Remuneration Report
4 D
irectors’ Report 1
Strategic Report

82 BHP Billiton Annual Report 2016
1 Strategic Report continued
1.14.2 Copper continuedPerformanceTotal copper production for FY2016 decreased by eight per cent to 1.6 Mt. Escondida copper production decreased by 20 per cent to 979 kt. Record cathode production and record material mined, together with the Organic Growth Project 1 reaching full capacity in the June 2016 quarter, was more than offset by an expected 28 per cent decline in grade. Pampa Norte copper production increased by one per cent to 251 kt, supported by record ore milled and higher grades at Spence. Olympic Dam copper production increased by 63 per cent to 203 kt. This reflected higher grades and improved smelter and mill utilisation after the Svedala mill outage in FY2015. Antamina copper production increased by 36 per cent to a record 146 kt due to higher grades and higher mill throughput.
Copper revenue decreased by US$3.2 billion to US$8.2 billion, primarily due to Escondida which decreased by US$2.9 billion to US$4.9 billion.
Underlying EBITDA for FY2016 decreased by 50 per cent to US$2.6 billion. Price impacts, net of price-linked costs, decreased Underlying EBITDA by US$2.2 billion due to the decrease in average realised prices for copper from US$2.78/lb to US$2.14/lb. Anticipated grade-related volume decline decreased Underlying EBITDA by a further US$1.6 billion. This was partially offset by US$369 million increase in estimated recoverable copper contained in the sulphide leach pad following the successful completion of the Escondida Bioleach Pad Extension project, US$188 million due to the implementation of the Escondida Voluntary Retirement Program in FY2015, and productivity-led initiatives of US$243 million. A stronger US dollar against the Chilean peso and Australian dollar increased Underlying EBITDA by US$323 million.
Unit cash costs (excluding one-off items, by-product credits, freight and treatment and refining charges) at our copper operated assets increased by nine per cent to US$1.20 per pound during FY2016 due to anticipated grade decline at Escondida. This was six per cent lower than prior guidance of US$1.27 per pound and was underpinned by a significant reduction in absolute costs. In addition, Olympic Dam unit cash costs declined by 29 per cent to US$1.38 per pound as a result of productivity-led cost improvements and a further reduction in labour and contractor costs.
ProjectsEscondida (Chile)BHP Billiton is investing in long-term sustainable water and power solutions in Chile. The Escondida Water Supply project was approved in July 2013 and consists of a new 2,500 litres per second sea water desalination facility. This project will provide an alternative, sustainable water supply to Escondida. The new facility is expected to be commissioned in CY2017 at a cost of US$3.4 billion (US$2.0 billion BHP Billiton share).
In November 2013, BHP Billiton awarded a long-term energy agreement for the development, operation and maintenance of a 517 megawatt (MW) combined-cycle gas-fired power plant in the town of Mejillones, Chile. The plant, which will be connected to the Northern Interconnected Grid, will supply the increasing demand for electricity at our operations. Construction work is progressing as planned and generation is expected to begin in the second half of CY2016.
In June 2016, the Escondida Los Colorados Extension project was approved at a cost of US$180 million (US$103 million BHP Billiton share). First production is expected in the second half of FY2017 adding incremental capacity of approximately 200 ktpa in FY2018.
The Escondida Bioleach Pad Extension IV project, which includes the expansion of the sulphide leach pad to four layers, was completed and fully commissioned as planned during the March 2016 quarter. Following the successful commissioning of this project, an increase to the estimated copper recoverable from the sulphide heap leach was recognised.
Pampa Norte (Chile)In the short term, the Spence Recovery Optimisation (SRO) project will facilitate the full utilisation of approximately 200 ktpa of tankhouse capacity.
The Spence Growth Option (SGO) project remains in feasibility with the potential to increase copper production capacity by approximately 200 ktpa and extend Spence mining operations by more than 50 years. The project will access primary ore beneath the current mine footprint through the continued development of the existing pit and will involve construction of a 95 ktpd concentrator and the outsourcing of a desalination plant. Final Board review is expected in the second half of CY2017 and, if approved, the project is expected to deliver first production in FY2020.
Resolution Copper (United States)We hold a 45 per cent interest in the Resolution Copper project in the US state of Arizona, which is operated by Rio Tinto (55 per cent interest). Resolution Copper is one of the largest undeveloped copper projects in the world and has the potential to be the largest copper producer in North America.
An environmental and cultural review process, as required by the National Environmental Policy Act (NEPA), commenced in March 2016. Our share of project expenditure for FY2016 was US$45 million.
Exploration activitiesOur greenfield copper exploration activities during FY2016 were focused on advancing projects in Chile, Peru, southwestern United States and Canada. Greenfield activities include opportunity identification, application for and acquisition of mineral title, early reconnaissance operations and drilling programs around the globe.
OutlookTotal copper production is forecast to increase by five per cent in FY2017 to 1.66 Mt. Escondida production is forecast to increase by nine per cent to 1,070 kt enabled by the commissioning of the Escondida Water Supply project and the ramp up of the Los Colorados Extension project, which will allow the use of three concentrators to mitigate grade decline and support a strong recovery in production, with volumes weighted to the second half of FY2017. At Olympic Dam, production is forecast to remain broadly unchanged from FY2016. We will continue with our underground transition into the higher-grade Southern Mining Area. This high-grade ore will release latent capacity and lay the foundation for the longer-term underground expansion. Production is forecast to decrease by 11 per cent to 130 kt at Antamina as the planned mining sequence moves through lower copper grades and zones of high zinc content.
In FY2017, unit cash costs at our operated copper assets are expected to decline by 12 per cent to US$1.05 per pound. At Escondida, unit cash costs are expected to decline by 11 per cent to US$1.00 per pound, largely reflecting higher concentrate throughput as a result of the completion of Escondida Water Supply and ongoing productivity improvements.

BHP Billiton Annual Report 2016 83
1.14.3 Iron OreDetailed below is Iron Ore financial information for FY2016 and FY2015 and an analysis of Iron Ore’s financial performance for FY2016 compared to FY2015.
Year ended30 June 2016US$M Revenue
Underlying EBITDA D&A
Underlying EBIT
Net operating
assetsCapital
expenditureExploration
grossExploration
to profit
Western Australia Iron Ore 10,333 5,492 1,855 3,637 21,641 969Samarco (i) 442 196 46 150 (1,193) 42Other (ii) 121 (19) 4 (23) 93 86
Total Iron Ore from Group production 10,896 5,669 1,905 3,764 20,541 1,097
Third party products (iii) 84 (8) − (8) − −
Total Iron Ore 10,980 5,661 1,905 3,756 20,541 1,097 92 74
Adjustment for equity accounted investments (iv) (442) (62) (46) (16) − (36) − −
Total Iron Ore statutory result 10,538 5,599 1,859 3,740 20,541 1,061 92 74
Year ended30 June 2015US$M Revenue
Underlying EBITDA D&A
Underlying EBIT
Net operating
assetsCapital
expenditureExploration
grossExploration
to profit
Western Australia Iron Ore 14,438 8,297 1,713 6,584 22,804 1,911Samarco (i) 1,406 695 118 577 1,044 170Other (ii) 135 (8) 3 (11) 106 19
Total Iron Ore from Group production 15,979 8,984 1,834 7,150 23,954 2,100
Third party products (iii) 180 (10) − (10) − −
Total Iron Ore 16,159 8,974 1,834 7,140 23,954 2,100 118 38
Adjustment for equity accounted investments (iv) (1,406) (326) (118) (208) − (170) − −
Total Iron Ore statutory result 14,753 8,648 1,716 6,932 23,954 1,930 118 38
(i) Samarco is an equity accounted investment and its financial information presented above with the exception of net operating assets reflects BHP Billiton Brasil’s share. Includes BHP Billiton Brasil’s share of operating profit prior to the Samarco dam failure but does not include any financial impacts following the dam failure which has been treated as an exceptional item.
(ii) Predominantly comprises divisional activities, towage services, business development and ceased operations.(iii) Includes inter-segment and external sales of contracted gas purchases.(iv) Total Iron Ore segment Revenue excludes US$442 million (2015: US$1,406 million) revenue related to Samarco. Total Iron Ore segment Underlying EBITDA includes
US$46 million (2015: US$118 million) D&A and US$16 million (2015: US$208 million) net finance costs and taxation benefit/(expense) related to Samarco that are also included in Underlying EBIT. Iron Ore segment Capital expenditure excludes US$36 million (2015: US$170 million) related to Samarco.
2 Governance at BH
P Billiton3
Remuneration Report
4 D
irectors’ Report 1
Strategic Report
84 BHP Billiton Annual Report 2016
1 Strategic Report continued
1.14.3 Iron Ore continuedPerformanceTotal iron ore production for FY2016 decreased by two per cent to 227 Mt. Record production at Western Australia Iron Ore (WAIO) offset the suspension of operations at Samarco. WAIO production increased by two per cent to 257 Mt (100 per cent basis) as the Jimblebar mining hub operated at full capacity and utilisation at the Newman ore handling plant improved. Samarco production for FY2016 was 11 Mt (100 per cent basis). For further information on the Samarco dam failure, refer to section 1.4.
Total iron ore revenue decreased by US$4.2 billion to US$10.5 billion. The decrease in revenue was due to a 28 per cent decline in the average realised price of iron ore from US$61 per wet metric tonne (FOB) to US$44 per wet metric tonne (FOB).
Iron ore Underlying EBITDA decreased by US$3.0 billion to US$5.6 billion. Price impact, net of price-linked costs, reduced Underlying EBITDA by US$3.6 billion. Higher volumes and cost efficiencies increased Underlying EBITDA by US$368 million, coupled with a stronger US dollar against the Australian dollar which favourably impacted Underlying EBITDA by US$328 million.
WAIO unit cash costs (excluding freight and royalties) declined by 19 per cent to US$15 per tonne, underpinned by reductions in labour and contractor costs, increased equipment productivity, lower diesel prices and consumption and a stronger US dollar.
Completed development projects Western Australia Iron Ore WAIO has undertaken a number of significant expansion projects during the past five years to deliver an integrated operation with a minimum capacity of 220 Mtpa (100 per cent basis).
The projects completed before or during FY2016 included:• the Jimblebar Mine Expansion project to develop the Jimblebar
mine and rail links, and procure mining equipment and rolling stock in order to deliver a capacity of 35 Mtpa;
• further development of Port Hedland, including two additional berths and ship loaders, a car dumper, connecting conveyor route and associated rail works and rolling stock improving supply chain;
• port blending facilities and rail yards to enable ore blending.
Sustaining project options at year-endSouth FlankAs the mining of ore from Yandi becomes exhausted and the current operation commences progressive ramp-down from an annual production rate of 80 Mtpa at some point during the next five years, an additional mine deposit will be required to sustain WAIO’s supply chain capacity.
An option currently being studied is to develop the South Flank deposit adjacent to the existing Mining Area C operations. If approved, this could eventually replace the 80 Mtpa currently coming from the Yandi mine and result in an expanded Mining Area C operation.
Exploration activitiesWestern Australia WAIO has a substantial existing deposit supported by considerable additional mineralisation, all within a 250-kilometre radius of our existing infrastructure. This concentration of orebodies also gives WAIO the flexibility to add growth tonnes to existing hub infrastructure and link brownfield developments to our existing mainline rail and port facilities. The total area covered by exploration and mining tenure amounts to 6,500 square kilometres, excluding crown leases and general purpose and miscellaneous licences, which are used for infrastructure space and access.
Total exploration expenditure in FY2016 amounted to US$92 million.
Guinea Iron OreWe have a 41.3 per cent interest in a joint venture that holds the Nimba Mining Concession and four iron ore prospecting permits in southeast Guinea. We will continue to assess our options for the Mount Nimba iron ore project.
Liberia Iron OreThe sale of our 100 per cent interest in the Liberia iron ore project to Cavalla Resources was completed in October 2015.
OutlookWAIO production is forecast to increase to between 265 Mt and 275 Mt (100 per cent basis). The 24-month rail renewal and maintenance program, which will support the integrated supply chain’s long-term reliability, is progressing on schedule. Along with our focus on productivity and the ramp-up of additional capacity at the Jimblebar mining hub, this should deliver an increase in system capacity to 290 Mtpa (100 per cent basis) in FY2019.
WAIO unit cash costs are forecast to decline a further seven per cent to US$14 per tonne in FY2017.
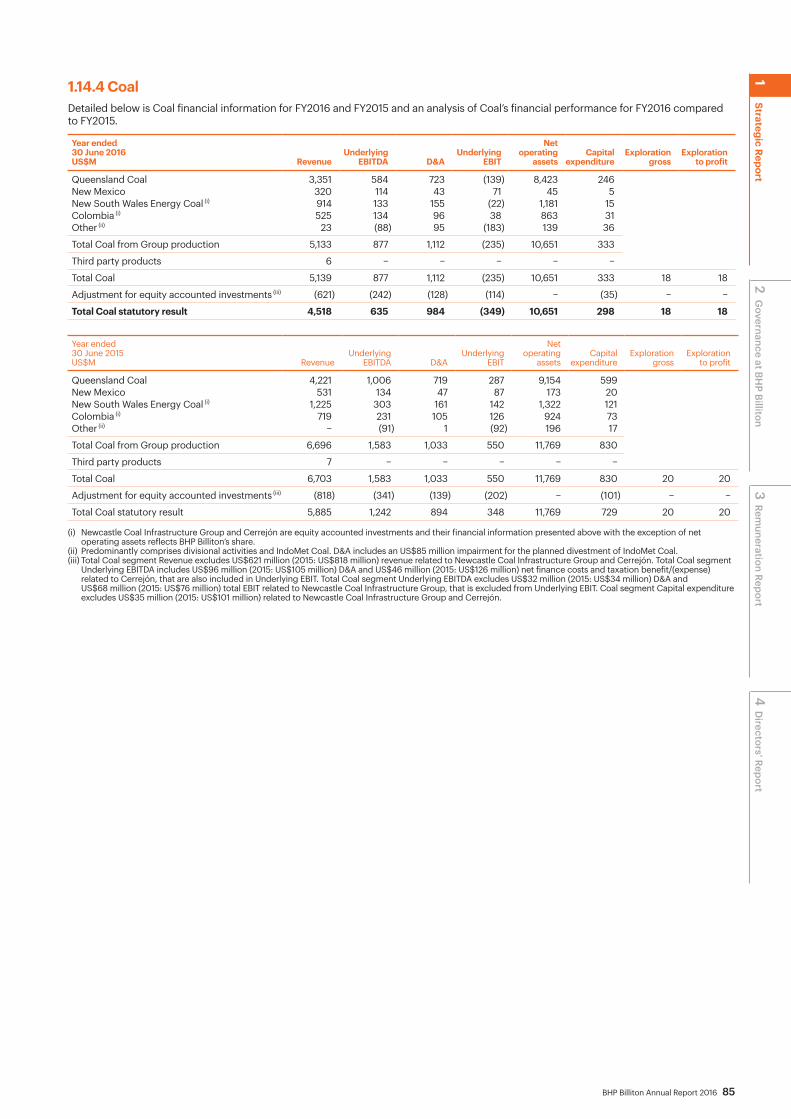
BHP Billiton Annual Report 2016 85
1.14.4 CoalDetailed below is Coal financial information for FY2016 and FY2015 and an analysis of Coal’s financial performance for FY2016 compared to FY2015.
Year ended30 June 2016US$M Revenue
Underlying EBITDA D&A
Underlying EBIT
Net operating
assetsCapital
expenditureExploration
grossExploration
to profit
Queensland Coal 3,351 584 723 (139) 8,423 246New Mexico 320 114 43 71 45 5New South Wales Energy Coal (i) 914 133 155 (22) 1,181 15Colombia (i) 525 134 96 38 863 31Other (ii) 23 (88) 95 (183) 139 36
Total Coal from Group production 5,133 877 1,112 (235) 10,651 333
Third party products 6 − − − − −
Total Coal 5,139 877 1,112 (235) 10,651 333 18 18
Adjustment for equity accounted investments (iii) (621) (242) (128) (114) − (35) − −
Total Coal statutory result 4,518 635 984 (349) 10,651 298 18 18
Year ended30 June 2015US$M Revenue
Underlying EBITDA D&A
Underlying EBIT
Net operating
assetsCapital
expenditureExploration
grossExploration
to profit
Queensland Coal 4,221 1,006 719 287 9,154 599New Mexico 531 134 47 87 173 20New South Wales Energy Coal (i) 1,225 303 161 142 1,322 121Colombia (i) 719 231 105 126 924 73Other (ii) − (91) 1 (92) 196 17
Total Coal from Group production 6,696 1,583 1,033 550 11,769 830
Third party products 7 − − − − −
Total Coal 6,703 1,583 1,033 550 11,769 830 20 20
Adjustment for equity accounted investments (iii) (818) (341) (139) (202) − (101) − −
Total Coal statutory result 5,885 1,242 894 348 11,769 729 20 20
(i) Newcastle Coal Infrastructure Group and Cerrejón are equity accounted investments and their financial information presented above with the exception of net operating assets reflects BHP Billiton’s share.
(ii) Predominantly comprises divisional activities and IndoMet Coal. D&A includes an US$85 million impairment for the planned divestment of IndoMet Coal.(iii) Total Coal segment Revenue excludes US$621 million (2015: US$818 million) revenue related to Newcastle Coal Infrastructure Group and Cerrejón. Total Coal segment
Underlying EBITDA includes US$96 million (2015: US$105 million) D&A and US$46 million (2015: US$126 million) net finance costs and taxation benefit/(expense) related to Cerrejón, that are also included in Underlying EBIT. Total Coal segment Underlying EBITDA excludes US$32 million (2015: US$34 million) D&A and US$68 million (2015: US$76 million) total EBIT related to Newcastle Coal Infrastructure Group, that is excluded from Underlying EBIT. Coal segment Capital expenditure excludes US$35 million (2015: US$101 million) related to Newcastle Coal Infrastructure Group and Cerrejón.
2 Governance at BH
P Billiton3
Remuneration Report
4 D
irectors’ Report 1
Strategic Report
86 BHP Billiton Annual Report 2016
1 Strategic Report continued
1.14.4 Coal continuedPerformanceMetallurgical coal production increased by one per cent to 43 Mt in FY2016. Record metallurgical coal production at five Queensland Coal mines and first production from the Haju mine in Indonesia, offset the cessation of production at the Gregory Crinum mine and a convergence event at the Broadmeadow mine.
Energy coal production decreased by 16 per cent to 34 Mt in FY2016. Production declined following the divestment of the San Juan Mine, operational rescheduling at New South Wales Energy Coal (NSWEC) and unfavourable weather at NSWEC and Cerrejón.
Coal revenue for FY2016 decreased by US$1.4 billion to US$4.5 billion. The decrease in revenues was due to a 21 per cent reduction in the average realised price for hard coking coal from US$105/t to US$83/t, a 22 per cent reduction in the average price received for weak coking coal from US$88/t to US$69/t and a 17 per cent reduction in the average realised price for thermal coal from US$58/t to US$48/t.
Underlying EBITDA for FY2016 decreased by US$607 million to US$635 million. Price impacts, net of price-linked costs, decreased Underlying EBITDA by US$917 million. Ceased and sold operations further decreased Underlying EBITDA by US$181 million. This was partially offset by a stronger US dollar against the Australian dollar, which increased Underlying EBITDA by US$404 million, and productivity-led cost efficiencies which increased Underlying EBITDA by US$175 million.
Queensland Coal unit cash costs (excluding freight and royalties) declined by 15 per cent to US$55 per tonne, supported by increased equipment and wash-plant utilisation, lower labour and contractor costs, lower diesel prices and a stronger US dollar. NSWEC unit cash costs decreased by two per cent to US$41 per tonne despite lower volumes.
Completed development projectsHay Point Coal Terminal Expansion Stage 3The new third berth at BMA’s Hay Point Coal Terminal was officially opened in December 2015. The project involved construction of a new berth and ship-loader alongside the existing two berths. It also included the replacement of the existing jetty, trestle conveyors, surge bins and linking conveyors.
The US$3 billion (US$1.5 billion BHP Billiton share) project is designed to withstand significant weather events, improving the resilience of the BMA business and reliability of supply. It has increased export capacity by an additional 11 Mt of annual port capacity (100 per cent basis).
Newcastle Port Third Phase ExpansionWe announced in August 2011 a US$367 million (BHP Billiton share) investment in the third stage development of the Newcastle Coal Infrastructure Group’s coal handling facility in Newcastle. The port expansion project is expected to increase total capacity at the coal terminal from 53 Mtpa to 66 Mtpa. This is expected to increase New South Wales Energy Coal’s allocation by 4.6 Mtpa to 19.2 Mtpa. First coal on ship, being the first ship loaded through the new facility, was achieved in June 2013, ahead of schedule. The project was 100 per cent complete at 30 June 2016.
IndoMet Coal Project IndoMet Coal comprises seven coal contracts of work covering a large metallurgical coal resource in Central and East Kalimantan, Indonesia, which was discovered by BHP Billiton in the 1990s. Following an assessment of the importance of local participation in developing the project, we sold a 25 per cent interest to PT Alam Tri Abadi (Adaro), a subsidiary of PT Adaro Energy TBK in 2010.
The first shipment from the Haju mine in Indonesia was achieved during the March 2016 quarter. Total production in FY2016 was 0.5 Mt.
Refer to section 6.3.2 for the reserve lives.
In FY2016, following a strategic review of our investment, BHP Billiton entered into an agreement to sell our remaining 75 per cent interest in IndoMet Coal to equity partner PT Alam Tri Abadi (Adaro). Completion of the sale is conditional upon the fulfilment of customary regulatory approvals.
OutlookMetallurgical coal production is forecast to increase in FY2017 to 44 Mt, as higher wash-plant and truck utilisation at Queensland Coal will offset the planned divestment of IndoMet Coal. Energy coal production is forecast to decline in FY2017 to 30 Mt due to the divestment of our New Mexico Coal assets, with the divestment of Navajo Coal completed on 29 July 2016. Productivity improvements at NSWEC will partially offset the decline in production. Excluding New Mexico Coal, energy coal volumes are expected to increase by approximately 10 per cent.
In FY2017, unit costs at Queensland Coal are forecast to decline a further five per cent to US$52 per tonne, reflecting continued productivity improvements. NSWEC unit costs are forecast to decline a further seven per cent to US$38 per tonne in FY2017.
1.14.5 Other assetsPotash Potash recorded an Underlying EBITDA loss of US$149 million in FY2016 compared to a loss of US$178 million in FY2015. The reduction in loss was due to a decrease in operating cash costs.
Nickel WestNickel West production in FY2016 decreased by 10 per cent to 81 kt, reflecting planned major maintenance outages at the Kalgoorlie smelter and Kwinana refinery during the December 2015 quarter and a reduction in third party ore delivered to the Kambalda concentrator. Higher nickel matte production during the June 2016 quarter was supported by additional third party concentrate purchases. Revenue for Nickel West decreased by 41 per cent to US$819 million predominantly due to lower average realised prices.
Underlying EBITDA for Nickel West decreased by US$152 million due to lower average realised prices which more than offset lower operating costs.
BHP Billiton Annual Report 2016 87
1.15 Other informationApplication of critical accounting policiesThe preparation of the Consolidated Financial Statements requires management to make judgements and estimates and form assumptions that affect the amounts of assets, liabilities, contingent liabilities, revenues and expenses reported in the Financial Statements. On an ongoing basis, management evaluates its judgements and estimates in relation to assets, liabilities, contingent liabilities, revenue and expenses. Management bases its judgements and estimates on historical experience and on other factors it believes to be reasonable under the circumstances, the results of which form the basis of the reported amounts that are not readily apparent from other sources. Actual results may differ from these estimates under different assumptions and conditions.The Group has identified a number of critical accounting policies under which significant judgements, estimates and assumptions are made. Actual results may differ for these estimates under different assumptions and conditions. This may materially affect financial results and the financial position to be reported in future. These critical accounting policies are as follows:• taxation;• inventories; • exploration and evaluation expenditure;• development expenditure;• overburden removal costs;• depreciation of property, plant and equipment;• property, plant and equipment, intangible assets and
impairments of non-current assets – recoverable amount; • closure and rehabilitation provisions;• reserve estimates.In accordance with IFRS, we are required to include information regarding the nature of the judgements and estimates and potential impacts on our financial results or financial position in the Financial Statements. This information can be found in section 5.1 ‘Consolidated Financial Statements’.
Quantitative and qualitative disclosures about market risk We identified our principal market risks in section 1.8.1. A description of how we manage our market risks, including both quantitative and qualitative information about our market risk sensitive instruments outstanding at 30 June 2016, is contained in note 21 ‘Financial risk management’ to the Financial Statements.Off-balance sheet arrangements and contractual commitments Information in relation to our material off-balance sheet arrangements, principally contingent liabilities, commitments for capital expenditure and commitments under leases at 30 June 2016 is provided in note 31 ‘Commitments’ and note 32 ‘Contingent liabilities’ to the Financial Statements.Subsidiary informationInformation about our significant subsidiaries is included in note 27 ‘Subsidiaries’ to the Financial Statements and section 5.2 ‘BHP Billiton Plc’.Related party transactionsRelated party transactions are outlined in note 30 ‘Related party transactions’ to the Financial Statements.Significant changes since the end of the yearSignificant changes since the end of the year are outlined in note 33 ‘Subsequent events’ to the Financial Statements.The Strategic Report is made in accordance with a resolution of the Board.
Jac Nasser AO ChairmanDated: 8 September 2016
2 Governance at BH
P Billiton3
Remuneration Report
4 D
irectors’ Report 1
Strategic Report

88 BHP Billiton Annual Report 2016
Section 2 Governance at BHP Billiton
In this sectionThis section of our Annual Report outlines the Corporate Governance processes of BHP Billiton.
2.1 Governance at BHP Billiton 2.2 Board of Directors and Executive Leadership Team 2.3 Shareholder engagement 2.4 Role and responsibilities of the Board 2.5 Board membership2.6 Chairman2.7 Director skills, experience and attributes 2.8 Director induction, training and development 2.9 Independence 2.10 Board evaluation2.11 Board meetings and attendance2.12 Director re-election 2.13 Board committees 2.14 Risk management governance structure 2.15 Management2.16 Business conduct 2.17 Market disclosure 2.18 Remuneration 2.19 Directors’ share ownership2.20 Conformance with corporate governance standards2.21 Additional UK disclosure
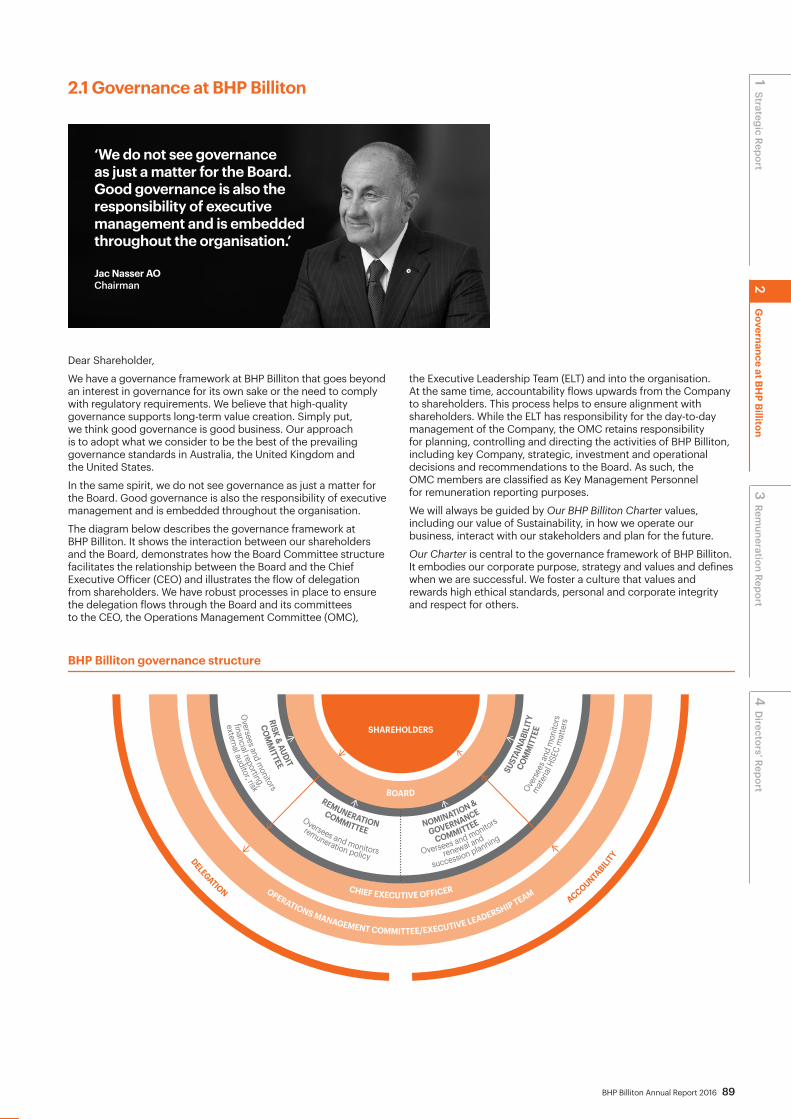
‘We do not see governance as just a matter for the Board. Good governance is also the responsibility of executive management and is embedded throughout the organisation.’
Jac Nasser AO Chairman
BHP Billiton Annual Report 2016 89
2.1 Governance at BHP Billiton
Dear Shareholder,
We have a governance framework at BHP Billiton that goes beyond an interest in governance for its own sake or the need to comply with regulatory requirements. We believe that high-quality governance supports long-term value creation. Simply put, we think good governance is good business. Our approach is to adopt what we consider to be the best of the prevailing governance standards in Australia, the United Kingdom and the United States.
In the same spirit, we do not see governance as just a matter for the Board. Good governance is also the responsibility of executive management and is embedded throughout the organisation.
The diagram below describes the governance framework at BHP Billiton. It shows the interaction between our shareholders and the Board, demonstrates how the Board Committee structure facilitates the relationship between the Board and the Chief Executive Officer (CEO) and illustrates the flow of delegation from shareholders. We have robust processes in place to ensure the delegation flows through the Board and its committees to the CEO, the Operations Management Committee (OMC),
the Executive Leadership Team (ELT) and into the organisation. At the same time, accountability flows upwards from the Company to shareholders. This process helps to ensure alignment with shareholders. While the ELT has responsibility for the day-to-day management of the Company, the OMC retains responsibility for planning, controlling and directing the activities of BHP Billiton, including key Company, strategic, investment and operational decisions and recommendations to the Board. As such, the OMC members are classified as Key Management Personnel for remuneration reporting purposes.
We will always be guided by Our BHP Billiton Charter values, including our value of Sustainability, in how we operate our business, interact with our stakeholders and plan for the future.
Our Charter is central to the governance framework of BHP Billiton. It embodies our corporate purpose, strategy and values and defines when we are successful. We foster a culture that values and rewards high ethical standards, personal and corporate integrity and respect for others.
SHAREHOLDERS
BHP Billiton governance structure
BOARD
OPERATIONS MANAGEMENT COMMITTEE/EXECUTIVE LEADERSHIP TEAM
DELEGATIONACCOUNTABILITY
CHIEF EXECUTIVE OFFICER
SUST
AINA
BILI
TYCOM
MIT
TEE
Overse
es an
d m
onito
rs
NOMINATION &
GOVERNANCE
COMMITTEE
Oversees and monitors
REMUNERATIONCOMMITTEE
Oversees and monitors
RISK & AUDIT
COM
MITTEE
Oversees and m
onitors mat
erial
HSE
C m
atte
rs
renewal andremuneration policy
financial reporting,
succession planning
external auditor, risk
1 Strategic Report3
Remuneration Report
4 D
irectors’ Report 2
Governance at BH
P Billiton

90 BHP Billiton Annual Report 2016
2 Governance at BHP Billiton continued
SamarcoThe importance of our values was evident in our response to the tragic events at Samarco Mineração S.A. As we have said from the outset, we remain committed to doing everything we can to support Samarco in the response effort as it works to rebuild the local communities and restore the surrounding environment. For more information on our approach, refer to section 1.4.
As our stakeholders would expect, the Board has spent a significant amount of time discussing Samarco and considering our approach. Soon after the tragedy occurred, we set up a sub-committee of the Board with specific authorities delegated to it relating to Samarco. Alongside the Samarco sub-committee, the Risk and Audit Committee and the Sustainability Committee have considered matters relating to Samarco as part of the ongoing duties of those committees. We believe this provides a robust and comprehensive approach which allows the Board to best provide its oversight and input, and allows appropriate consideration to be brought to the various aspects of the response. For more information relating to the Samarco sub-committee, refer to section 2.13.5.
Ongoing renewalAs noted in our Annual Report 2015, Anita Frew was appointed to the Board with effect from 15 September 2015. Ms Frew has significant experience as a director and chairman on public company boards across a range of global sectors, including chemicals, engineering and finance. She is currently Deputy Chairman of Lloyds Banking Group and Chairman of Croda International Plc, a speciality chemicals group.
Carlos Cordeiro retired from the Board following the 2015 Annual General Meetings (AGMs).
We announced in August 2015 that Shriti Vadera had been appointed as Senior Independent Director of BHP Billiton Plc. The Board believes that Baroness Vadera’s skills and attributes, as well as her experience with BHP Billiton, enable her to support the Chairman and the Board in this important governance role.
John Schubert has decided to retire from the Board after the 2016 AGMs. On behalf of all shareholders, I thank John for his outstanding service to the Board and the Company over many years and wish him all the best for the future. We will miss his wise counsel and good judgement.
On 10 August 2016, we announced that Ken MacKenzie will join the Board on 22 September 2016 as an independent Non-executive Director. From 2005 to 2015, Mr MacKenzie served as the Managing Director and Chief Executive Officer of Amcor Limited, a global packaging company with operations in over 40 countries. He is currently a Senior Adviser with McKinsey and Company. The appointments of Anita Frew in September 2015 and Ken MacKenzie in September 2016 reflect our structured and rigorous approach to Board succession planning, having regard to the skills, experience and attributes required to effectively govern and manage risk within the Company. Ken MacKenzie will join the Sustainability Committee.
A number of other changes were made to the composition of our Board committees during FY2016. Shriti Vadera was appointed to the Nomination and Governance Committee on 14 August 2015 and stepped down from the Risk and Audit Committee on 30 September 2015. Anita Frew was appointed to the Risk and Audit Committee with effect from 3 February 2016, and Malcolm Brinded joined the Remuneration Committee with effect from 13 April 2016. With effect from 22 September 2016, John Schubert will step down from the role of Sustainability Committee Chairman, and will be succeeded in that position by Malcolm Brinded. John Schubert will remain on the Sustainability Committee until he retires from the Board at the conclusion of the 2016 AGMs. For more information, refer to section 2.13.
In relation to gender diversity, the Board set a goal of increasing the number of women on the Board to at least three. This goal was met following the appointment of Anita Frew. For more information on the Board’s diversity of skills and experience, refer to section 2.7.
Continuous improvementThe Board has a commitment to ongoing improvement.
The Board continued its program of evaluations during the year and post year-end. We commenced an external Board evaluation during FY2016, an internal evaluation of the individual Directors and the annual review of each Director prior to re-election. All of these evaluations were completed in early FY2017. For information about the outcomes of the Board evaluation and the Director assessments, refer to sections 2.10 and 2.12.
I hope you find this description of our corporate governance helpful and I look forward to receiving any feedback that fellow shareholders may have.
Jac Nasser AO Chairman
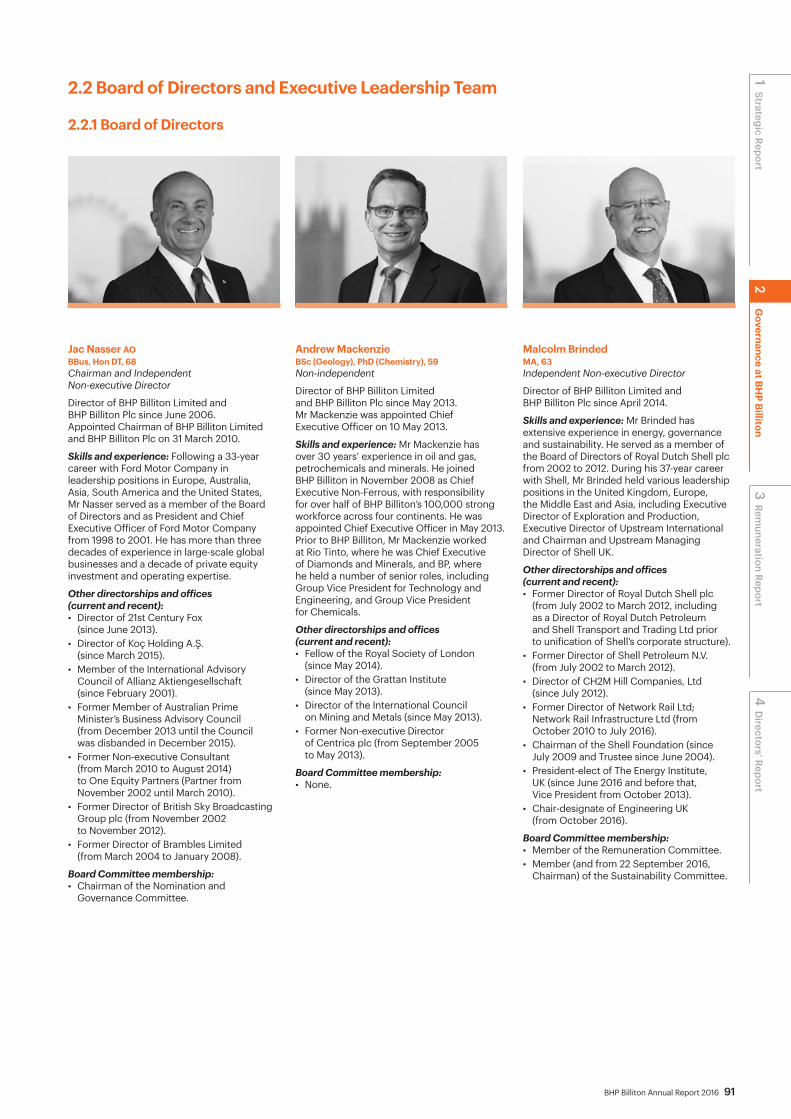
BHP Billiton Annual Report 2016 91
2.2 Board of Directors and Executive Leadership Team
2.2.1 Board of Directors
Jac Nasser AO BBus, Hon DT, 68 Chairman and Independent Non-executive Director
Director of BHP Billiton Limited and BHP Billiton Plc since June 2006. Appointed Chairman of BHP Billiton Limited and BHP Billiton Plc on 31 March 2010.
Skills and experience: Following a 33-year career with Ford Motor Company in leadership positions in Europe, Australia, Asia, South America and the United States, Mr Nasser served as a member of the Board of Directors and as President and Chief Executive Officer of Ford Motor Company from 1998 to 2001. He has more than three decades of experience in large-scale global businesses and a decade of private equity investment and operating expertise.
Other directorships and offices (current and recent): • Director of 21st Century Fox
(since June 2013). • Director of Koç Holding A.Ş.
(since March 2015). • Member of the International Advisory
Council of Allianz Aktiengesellschaft (since February 2001).
• Former Member of Australian Prime Minister’s Business Advisory Council (from December 2013 until the Council was disbanded in December 2015).
• Former Non-executive Consultant (from March 2010 to August 2014) to One Equity Partners (Partner from November 2002 until March 2010).
• Former Director of British Sky Broadcasting Group plc (from November 2002 to November 2012).
• Former Director of Brambles Limited (from March 2004 to January 2008).
Board Committee membership: • Chairman of the Nomination and
Governance Committee.
Andrew Mackenzie BSc (Geology), PhD (Chemistry), 59 Non-independent
Director of BHP Billiton Limited and BHP Billiton Plc since May 2013. Mr Mackenzie was appointed Chief Executive Officer on 10 May 2013.
Skills and experience: Mr Mackenzie has over 30 years’ experience in oil and gas, petrochemicals and minerals. He joined BHP Billiton in November 2008 as Chief Executive Non-Ferrous, with responsibility for over half of BHP Billiton’s 100,000 strong workforce across four continents. He was appointed Chief Executive Officer in May 2013. Prior to BHP Billiton, Mr Mackenzie worked at Rio Tinto, where he was Chief Executive of Diamonds and Minerals, and BP, where he held a number of senior roles, including Group Vice President for Technology and Engineering, and Group Vice President for Chemicals.
Other directorships and offices (current and recent): • Fellow of the Royal Society of London
(since May 2014).• Director of the Grattan Institute
(since May 2013). • Director of the International Council
on Mining and Metals (since May 2013). • Former Non-executive Director
of Centrica plc (from September 2005 to May 2013).
Board Committee membership: • None.
Malcolm Brinded MA, 63 Independent Non-executive Director
Director of BHP Billiton Limited and BHP Billiton Plc since April 2014.
Skills and experience: Mr Brinded has extensive experience in energy, governance and sustainability. He served as a member of the Board of Directors of Royal Dutch Shell plc from 2002 to 2012. During his 37-year career with Shell, Mr Brinded held various leadership positions in the United Kingdom, Europe, the Middle East and Asia, including Executive Director of Exploration and Production, Executive Director of Upstream International and Chairman and Upstream Managing Director of Shell UK.
Other directorships and offices (current and recent):• Former Director of Royal Dutch Shell plc
(from July 2002 to March 2012, including as a Director of Royal Dutch Petroleum and Shell Transport and Trading Ltd prior to unification of Shell’s corporate structure).
• Former Director of Shell Petroleum N.V. (from July 2002 to March 2012).
• Director of CH2M Hill Companies, Ltd (since July 2012).
• Former Director of Network Rail Ltd; Network Rail Infrastructure Ltd (from October 2010 to July 2016).
• Chairman of the Shell Foundation (since July 2009 and Trustee since June 2004).
• President-elect of The Energy Institute, UK (since June 2016 and before that, Vice President from October 2013).
• Chair-designate of Engineering UK (from October 2016).
Board Committee membership:• Member of the Remuneration Committee. • Member (and from 22 September 2016,
Chairman) of the Sustainability Committee.
1 Strategic Report3
Remuneration Report
4 D
irectors’ Report 2
Governance at BH
P Billiton

92 BHP Billiton Annual Report 2016
2 Governance at BHP Billiton continued
Malcolm Broomhead MBA, BE, 64 Independent Non-executive Director
Director of BHP Billiton Limited and BHP Billiton Plc since March 2010.
Skills and experience: Mr Broomhead has extensive experience in running industrial and mining companies with a global footprint and broad global experience in project development in many of the countries in which BHP Billiton operates. He was Managing Director and Chief Executive Officer of Orica Limited from 2001 until September 2005. Prior to joining Orica, Mr Broomhead held a number of senior positions at North Limited, including Managing Director and Chief Executive Officer and, prior to that, held senior management positions with Halcrow (UK), MIM Holdings, Peko Wallsend and Industrial Equity.
Other directorships and offices (current and recent): • Chairman of Orica Limited
(since January 2016).• Former Chairman of Asciano Limited
(from October 2009 to August 2016). • Former Director of Coates Group Holdings
Pty Ltd (from January 2008 to July 2013). • Director of the Walter and Eliza Hall Institute
of Medical Research (since July 2014). • Chairman of the Australia China One Belt One
Road Advisory Board (since August 2016).
Board Committee membership: • Member of the Sustainability Committee. • Member of the Risk and Audit Committee.
Pat Davies BSc (Mechanical Engineering), 65 Independent Non-executive Director
Director of BHP Billiton Limited and BHP Billiton Plc since June 2012.
Skills and experience: Mr Davies has broad experience in the natural resources sector across a number of geographies, commodities and markets. From July 2005 until June 2011, he was Chief Executive of Sasol Limited, an international energy, chemical and mining company with operations in 38 countries and listings on the Johannesburg and New York stock exchanges. Mr Davies began his career at Sasol in 1975 and held a number of diverse roles, including managing the group’s oil and gas businesses, before becoming Chief Executive in July 2005. He is a former Director of various Sasol Group companies and joint ventures.
Other directorships and offices (current and recent): • Former Director (from August 1997
to June 2011) and Chief Executive (from July 2005 to June 2011) of Sasol Limited.
Board Committee membership: • Member of the Remuneration Committee. • Member of the Sustainability Committee.
Anita Frew BA (Hons) MRes, Hon. D.Sc, 59 Independent Non-executive Director
Director of BHP Billiton Limited and BHP Billiton Plc since September 2015.
Skills and experience: Ms Frew has extensive board, strategy, marketing, governance and risk management experience in the chemicals, engineering, water and finance industries. She is the Chairman of Croda International Plc and Deputy Chairman of Lloyds Banking Group Plc. Ms Frew was the Chairman of Victrex Plc, Senior Independent Director of Aberdeen Asset Management Plc and IMI Plc and a Non-executive Director of Northumbrian Water.
Other directorships and offices (current and recent):• Chairman of Croda International Plc
(since September 2015).• Deputy Chairman of Lloyds Banking Group
Plc (since December 2010).• Former Senior Independent Director
of Aberdeen Asset Management Plc (from October 2004 to September 2014).
• Former Senior Independent Director of IMI Plc (from March 2006 to May 2015).
• Former Chairman of Victrex Plc (from 2008 to October 2014).
Board Committee membership:• Member of the Risk and Audit Committee.
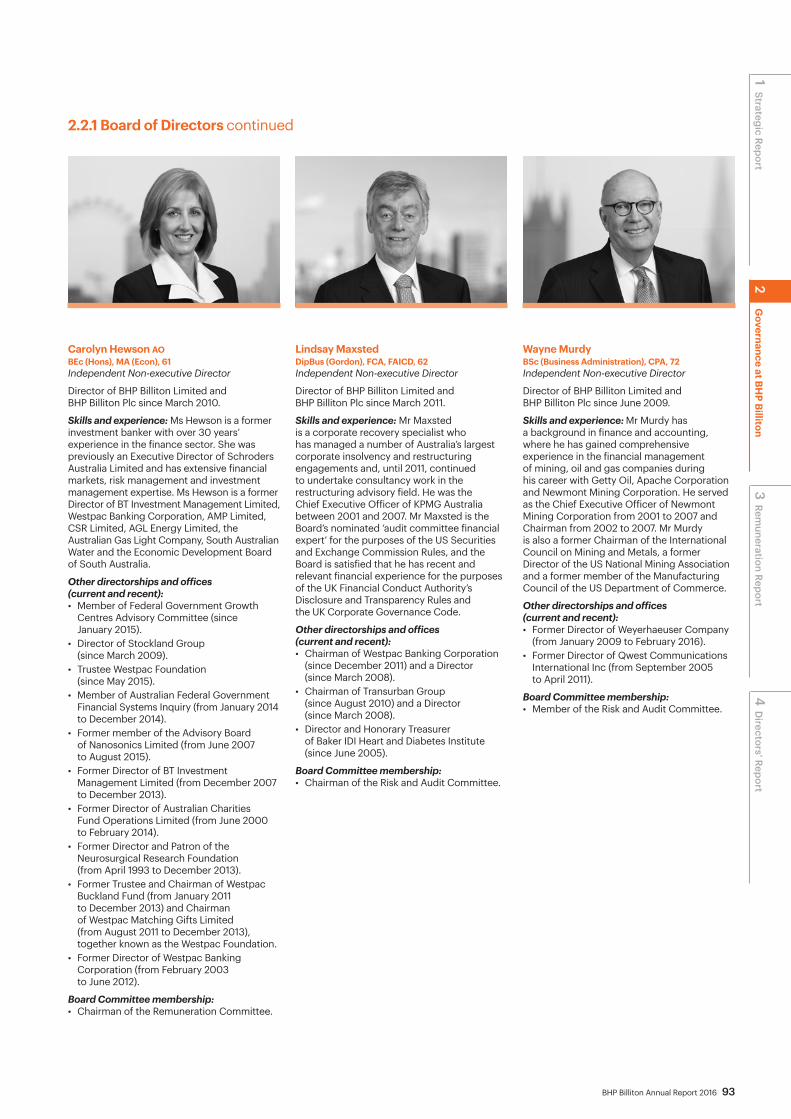
BHP Billiton Annual Report 2016 93
Carolyn Hewson AO BEc (Hons), MA (Econ), 61 Independent Non-executive Director
Director of BHP Billiton Limited and BHP Billiton Plc since March 2010.
Skills and experience: Ms Hewson is a former investment banker with over 30 years’ experience in the finance sector. She was previously an Executive Director of Schroders Australia Limited and has extensive financial markets, risk management and investment management expertise. Ms Hewson is a former Director of BT Investment Management Limited, Westpac Banking Corporation, AMP Limited, CSR Limited, AGL Energy Limited, the Australian Gas Light Company, South Australian Water and the Economic Development Board of South Australia.
Other directorships and offices (current and recent): • Member of Federal Government Growth
Centres Advisory Committee (since January 2015).
• Director of Stockland Group (since March 2009).
• Trustee Westpac Foundation (since May 2015).
• Member of Australian Federal Government Financial Systems Inquiry (from January 2014 to December 2014).
• Former member of the Advisory Board of Nanosonics Limited (from June 2007 to August 2015).
• Former Director of BT Investment Management Limited (from December 2007 to December 2013).
• Former Director of Australian Charities Fund Operations Limited (from June 2000 to February 2014).
• Former Director and Patron of the Neurosurgical Research Foundation (from April 1993 to December 2013).
• Former Trustee and Chairman of Westpac Buckland Fund (from January 2011 to December 2013) and Chairman of Westpac Matching Gifts Limited (from August 2011 to December 2013), together known as the Westpac Foundation.
• Former Director of Westpac Banking Corporation (from February 2003 to June 2012).
Board Committee membership: • Chairman of the Remuneration Committee.
2.2.1 Board of Directors continued
Wayne Murdy BSc (Business Administration), CPA, 72 Independent Non-executive Director
Director of BHP Billiton Limited and BHP Billiton Plc since June 2009.
Skills and experience: Mr Murdy has a background in finance and accounting, where he has gained comprehensive experience in the financial management of mining, oil and gas companies during his career with Getty Oil, Apache Corporation and Newmont Mining Corporation. He served as the Chief Executive Officer of Newmont Mining Corporation from 2001 to 2007 and Chairman from 2002 to 2007. Mr Murdy is also a former Chairman of the International Council on Mining and Metals, a former Director of the US National Mining Association and a former member of the Manufacturing Council of the US Department of Commerce.
Other directorships and offices (current and recent): • Former Director of Weyerhaeuser Company
(from January 2009 to February 2016). • Former Director of Qwest Communications
International Inc (from September 2005 to April 2011).
Board Committee membership: • Member of the Risk and Audit Committee.
Lindsay Maxsted DipBus (Gordon), FCA, FAICD, 62 Independent Non-executive Director
Director of BHP Billiton Limited and BHP Billiton Plc since March 2011.
Skills and experience: Mr Maxsted is a corporate recovery specialist who has managed a number of Australia’s largest corporate insolvency and restructuring engagements and, until 2011, continued to undertake consultancy work in the restructuring advisory field. He was the Chief Executive Officer of KPMG Australia between 2001 and 2007. Mr Maxsted is the Board’s nominated ‘audit committee financial expert’ for the purposes of the US Securities and Exchange Commission Rules, and the Board is satisfied that he has recent and relevant financial experience for the purposes of the UK Financial Conduct Authority’s Disclosure and Transparency Rules and the UK Corporate Governance Code.
Other directorships and offices (current and recent):• Chairman of Westpac Banking Corporation
(since December 2011) and a Director (since March 2008).
• Chairman of Transurban Group (since August 2010) and a Director (since March 2008).
• Director and Honorary Treasurer of Baker IDI Heart and Diabetes Institute (since June 2005).
Board Committee membership:• Chairman of the Risk and Audit Committee.
1 Strategic Report3
Remuneration Report
4 D
irectors’ Report 2
Governance at BH
P Billiton

94 BHP Billiton Annual Report 2016
2 Governance at BHP Billiton continued
Baroness Shriti Vadera MA, 54Senior Independent Director, BHP Billiton Plc
Director of BHP Billiton Limited and BHP Billiton Plc since January 2011.
Skills and experience: Baroness Vadera brings wide-ranging experience in finance, economics and public policy as well as extensive experience of emerging markets and international institutions. She is Chairman of Santander UK Group Holdings Plc and Santander UK Plc, and has been a Director of AstraZeneca Plc since 2011. She was an investment banker with S G Warburg/UBS from 1984 to 1999, on the Council of Economic Advisers, HM Treasury 1999 to 2007, Minister in the UK Department of International Development in 2007, Minister in the Cabinet Office and Business Department from 2008 to 2009 with responsibility for dealing with the financial crisis, G20 Adviser 2009 to 2010, and advised governments, banks and investors on the Eurozone crisis, banking sector, debt restructuring and markets from 2010 to 2014.
Other directorships and offices (current and recent): • Chairman of Santander UK Group
Holdings Plc and Santander UK Plc (since March 2015).
• Director of AstraZeneca Plc (since January 2011).
• Former Trustee of Oxfam (from 2000 until 2005).
Board Committee membership: • Member of the Nomination
and Governance Committee. • Member of the Remuneration Committee.
John Schubert AO BCh Eng, PhD (Chem Eng), 73 Independent Non-executive Director
Director of BHP Limited since June 2000 and a Director of BHP Billiton Limited and BHP Billiton Plc since June 2001.
Skills and experience: Dr Schubert has considerable experience in the international oil industry, including at Chief Executive Officer level. He has had executive mining and financial responsibilities and was Chief Executive Officer of Pioneer International Limited for six years, where he operated in the building materials industry in 16 countries. Dr Schubert has experience in mergers, acquisitions and divestments, project analysis and management. He was previously Chairman and Managing Director of Esso Australia Limited and President of the Business Council of Australia.
Other directorships and offices (current and recent): • Chairman of Garvan Institute
of Medical Research (since May 2013). • Former Chairman of G2 Therapies Pty Limited
(from November 2000 to April 2013). • Former Director of Qantas Airways Limited
(from October 2000 to November 2012). • Former Chairman (from November 2004
to February 2010) and Director (from October 1991 to February 2010) of Commonwealth Bank of Australia.
Board Committee membership: • Chairman of the Sustainability Committee
(until 22 September 2016). • Member of the Nomination and
Governance Committee.
Margaret Taylor BA, LLB, GAICD, FCIS, 56Group Company Secretary and Chairman of the Disclosure Committee
Ms Taylor was appointed Group Company Secretary of BHP Billiton effective June 2015. Previously she was Group Company Secretary of Commonwealth Bank of Australia, and before joining the Bank, held the position of Group General Counsel and Company Secretary of Boral Limited. Prior to that, Ms Taylor was Regional Counsel Australia/Asia with BHP Billiton, and earlier, a partner with law firm Minter Ellison, specialising in corporate and securities laws. She is a Fellow of the Governance Institute of Australia.
BHP Billiton Annual Report 2016 95
Diane Jurgens BSEE, MSEE, MBA, 54Chief Technology Officer
Ms Jurgens joined BHP Billiton in 2015 and was appointed Chief Technology Officer in February 2016. Prior to joining the Company, Ms Jurgens was based in China for nearly 10 years, serving as Board Member and Managing Director of Shanghai OnStar Telematics Company, in addition to prior roles as Chief Information Officer and Strategy Board member for General Motors’ International and China Operations. Ms Jurgens’ early career was with the Boeing Company where she worked for 12 years in engineering, information technology and business development leadership roles.
Daniel Malchuk BEng, MBA, 50President Operations, Minerals Americas
Mr Malchuk was appointed President Operations, Minerals Americas in February 2016 based in Santiago, Chile. Previously he was President of the Copper Business. Mr Malchuk has held a number of roles in the organisation, including President Aluminium, Manganese and Nickel; President of Minerals Exploration and Vice President Strategy and Development Base Metals. He has worked in four countries with BHP Billiton, having joined BHP Billiton in April 2002.
Steve Pastor BSc (Mechanical Engineering), MBA, 50President Operations, Petroleum
Mr Pastor joined BHP Billiton in 2001 and was appointed President Operations, Petroleum in February 2016. He is responsible for the Company’s global oil and gas operations and exploration program. During his career with the Company, Mr Pastor has served as Asset President Conventional and has held leadership roles in deepwater and shale operations. Prior to joining BHP Billiton, Mr Pastor’s experience included 11 years with Chevron.
Laura Tyler BSc (Geology (Hons)), MSc (Mining Engineering), 49Chief of Staff, Head of Geoscience
Ms Tyler joined BHP Billiton in 2004 and was appointed Chief of Staff to the CEO in 2015. Previously, Ms Tyler was Asset President of the Cannington Mine and held technical and operational roles at the EKATI Diamond Mine in Canada and corporate HSEC in London. Prior to joining BHP Billiton, Ms Tyler worked for Western Mining Corporation, Newcrest Mining and Mount Isa Mines, in various technical and operational roles and also spent five years in the civil engineering industry.
Athalie Williams BA (Hons), FAHRI, 46Chief People Officer
Ms Williams joined BHP Billiton in 2007 and was appointed President, Human Resources in January 2015. Ms Williams’ title changed to Chief People Officer effective 1 July 2015. She has previously held senior human resources positions, including Vice President Human Resources Marketing, Vice President Human Resources for the Uranium business and Group HR Manager, Executive Resourcing & Development. Prior to BHP Billiton, Ms Williams was an organisation strategy advisor with Accenture (formerly Andersen Consulting) and National Australia Bank. Ms Williams is a member of Chief Executive Women (CEW).
2.2.2 Executive Leadership TeamAndrew Mackenzie BSc (Geology), PhD (Chemistry), 59Chief Executive Officer
(See section 2.2.1 for biography.)
Arnoud Balhuizen BBE, 47President Marketing and Supply
Mr Balhuizen was appointed President Marketing and Supply in March 2016. Prior to this, he was President Marketing (from 2013). Mr Balhuizen started his career with Billiton in 1994, working for the Marketing and Trading division in the Netherlands and since then he has held various marketing roles, including General Manager Marketing for Copper Cathodes, Vice President Iron Ore Marketing and Vice President Petroleum Marketing.
Peter Beaven BAcc, CA, 49Chief Financial Officer
Mr Beaven was appointed Chief Financial Officer in October 2014. Previously, he was the President of Copper and prior to that appointment in May 2013, President of Base Metals. Mr Beaven was previously the President of BHP Billiton’s Manganese Business and Vice President and Chief Development Officer for Carbon Steel Materials, having joined BHP Billiton in 2003. He has wide experience across a range of regions and businesses in BHP Billiton, UBS Warburg, Kleinwort Benson and PricewaterhouseCoopers.
Dean Dalla Valle MBA, 57Chief Commercial Officer (seconded to Brazil)
Mr Dalla Valle was appointed President, HSE, Marketing & Technology in January 2015. Mr Dalla Valle’s title changed to Chief Commercial Officer effective 1 July 2015. Mr Dalla Valle is currently seconded to lead the Company’s response to the Samarco dam failure. He has 39 years’ experience in BHP Billiton. Mr Dalla Valle was previously the President of the Coal Business, President of the Uranium business and prior to that held the positions of Asset President, Olympic Dam, Asset President of the Cannington silver mine and Vice President Ports for Iron Ore. He was also the General Manager of the Appin, Tower and Westcliff Collieries for Illawarra Coal.
Geoff Healy BEc, LLB, 50Chief External Affairs Officer
Mr Healy joined BHP Billiton as Chief Legal Counsel in June 2013. He was appointed Chief External Affairs Officer in February 2016. Prior to BHP Billiton, Mr Healy was a partner at Herbert Smith Freehills for 16 years and a member of its Global Partnership Council, and worked widely across its network of Australian and international offices.
Mike Henry BSc (Chemistry), 50President Operations, Minerals Australia
Mr Henry joined BHP Billiton in 2003. He served as President, Coal from January 2015 to February 2016 when he was appointed President Operations, Minerals Australia. Prior to January 2015, he was President, HSE, Marketing & Technology. His earlier career with BHP Billiton included a number of commercial roles covering both Minerals and Petroleum, including the role of Chief Marketing Officer.
1 Strategic Report3
Remuneration Report
4 D
irectors’ Report 2
Governance at BH
P Billiton

96 BHP Billiton Annual Report 2016
BOARD(Annual General Meetings)
Investor Relations(meetings and correspondence)CEO/CFO/Senior Management
Group Governance (meetings and correspondence)
Chairman/Senior Independent Director/ Remuneration Committee Chairman
Proxy advisersGovernance advisers
Governance ratings agencies
Sell side analystsResearch providers
RETAIL INVESTORS
INSTITUTIONAL INVESTORS
Portfolio managers Environmental, Social & Governance managers
2 Governance at BHP Billiton continued
2.3 Shareholder engagement Part of the Board’s commitment to high-quality governance is expressed through the approach BHP Billiton takes to engaging and communicating with its shareholders. We encourage shareholders to make their views known to us.
Our shareholders are based across the globe. Outside of the two AGMs, which are an important part of the governance and investor engagement process, the Board uses a range of formal and informal communication channels to understand shareholder views to ensure the Board can represent shareholders in governing BHP Billiton. Regular proactive engagement with institutional shareholders and investor representative organisations takes place in Australia, South Africa, the United Kingdom and the United States. The purpose of these meetings is to discuss the full range of governance issues, as well as the broad strategy of the Company. The meetings are an important opportunity to build relationships and to engage directly with governance managers, fund managers and governance advisers. The meetings are led by:• the Chairman, supported by Group Governance – strategy,
governance and remuneration. The Chairman’s meetings are scheduled throughout the year to ensure we have the benefit of regular feedback. This schedule is designed to ensure governance issues can be discussed separately to the AGM and where appropriate, allows time to respond to feedback and shape new policies for the forthcoming financial year. The Chairman met with investors in Australia and the United Kingdom during FY2016;
• the Senior Independent Director and the Remuneration Committee Chairman – governance and remuneration. Meetings with the Remuneration Committee Chairman and the Senior Independent Director were held in the United Kingdom in March 2016. This was an opportunity for investors to discuss Board succession, the Company’s strategy and remuneration issues;
• the CEO, Chief Financial Officer (CFO), senior management and the Investor Relations team – strategy, financial and operating performance. Important briefings are webcast live from our website: www.bhpbilliton.com. Meetings between management and shareholders were held in Australia, Canada, Chile, China, France, Germany, Japan, Malaysia, Netherlands, Singapore, South Africa, the United Kingdom and the United States during FY2016. Meetings between management and bondholders were held in France, Germany, Netherlands, the United Kingdom and the United States as part of our commitment to engage with providers of all types of capital;
• the Head of Health, Safety and Environment (HSE) – HSE and Community strategy (together, HSEC). We conduct group and one-on-one meetings and briefings with investors each year focused on key HSEC issues. These meetings took place in Australia, the United States and the United Kingdom during FY2016, with additional meetings in mainland Europe and Canada held by conference call;
• Group Governance – governance strategy and briefings. Group Governance provides a conduit to enable the Board and its committees to remain abreast of evolving investor expectations and to continuously enhance the governance processes of the Company. The team held meetings with investors in Australia, South Africa, the United Kingdom and the United States during FY2016.
We take a coordinated approach to engagement on corporate governance and during the year responded to a wide range of shareholders, their representatives and non-governmental organisations. Issues covered included Samarco; human rights; climate change; hydraulic fracturing; long-termism; IndoMet Coal; stewardship; Cerrejón community engagement; succession planning and quarterly reporting.
Shareholder communicationsThe Company provides shareholders with the option to receive communications from, and send communications to, the Company and our registrar electronically. Shareholders can contact us at any time through our Investor Relations team, with contact details available on our website: www.bhpbilliton.com. Shareholder and analyst feedback is shared with the Board through the Chairman, the Senior Independent Director, the Chairman of the Remuneration Committee, other Directors, the CEO, the CFO and the Group Company Secretary. In addition, the Head of Investor Relations and Vice President Governance provide regular reports to the Board on shareholder and governance manager feedback and analysis. This approach provides a robust mechanism to ensure Directors are aware of issues raised and have a good understanding of current shareholder views.
Annual General MeetingsAs described above, a key part of our approach to governance involves shareholders’ views being heard and understood. The AGMs provide a forum to facilitate this and are important events in the BHP Billiton calendar. These meetings provide an update for shareholders on the Company’s performance and offer an opportunity for shareholders to ask questions and vote.
Questions can be registered prior to the meeting by completing the relevant form accompanying the Notice of Meeting. Shareholders can also email the Company at [email protected]. Key members of management, including the CEO and CFO, are present and available to answer questions. The External Auditor attends the AGMs and is also available to answer questions.
Proceedings at shareholder meetings are webcast live from our website. Copies of the speeches delivered by the Chairman and CEO to the AGMs are released to the stock exchanges and posted to our website. A summary of proceedings and the outcome of voting on the items of business are released to the relevant stock exchanges and posted to our website as soon as they are available following completion of the BHP Billiton Limited meeting.
Information relating to our AGMs is available online at www.bhpbilliton.com/home/investors/shareholderinfo/ Pages/Meetings.aspx.

BHP Billiton Annual Report 2016 97
2.4 Role and responsibilities of the Board The Board’s role is to represent the shareholders. It is accountable to shareholders for creating and delivering value through the effective governance of the Company. This role requires a high-performing Board, with all Directors contributing to the Board’s collective decision-making processes.
The Board Governance Document is a statement of the practices and processes the Board has adopted to discharge its responsibilities. It includes the processes the Board has implemented to undertake its own tasks and activities; the matters it has reserved for its own consideration and decision-making; the authority it has delegated to the CEO, including the limits on the way in which the CEO can execute that authority; and guidance on the relationship between the Board and the CEO.
The Board Governance Document specifies the role of the Chairman, the membership of the Board and the role and conduct of Non-executive Directors. It also provides that the Company Secretary is accountable to the Board and advises the Chairman and, through the Chairman, the Board and individual Directors on all matters of governance process. The Board Governance Document was reviewed and updated during FY2016 to ensure it continues to align with best practice. For more information, refer to sections 2.5 to 2.7.
The Board Governance Document is available online at www.bhpbilliton.com/home/aboutus/ourcompany/ Pages/governance.aspx.
Allocation of decision-making authority The Board has reserved the following matters for its decision:• appointing the CEO and determining the terms of the appointment; • approving the appointment of executives reporting to the CEO
and membership of the Executive Leadership Team (ELT), and material changes to the organisational structure involving direct reports to the CEO;
• succession planning for direct reports to the CEO;• monitoring the performance of the CEO and the Group;• establishing and assessing measurable diversity objectives;• approving strategy, annual budgets, balance sheet management
and funding strategy;• approving commitments, capital and non-capital items,
acquisitions and divestments above specified thresholds;• approving the dividend policy and determining dividends;• approving market risk management strategy and limits;• monitoring Board composition processes and performance;• reviewing and monitoring systems of risk management and
internal control; • determining and adopting documents (including the publication
of reports and statements to shareholders) that are required by the Group’s constitutional documents, statute or by other external regulation;
• determining and approving matters that are required by the Group’s constitutional documents, statute or by other external regulation to be determined or approved by the Board.
The Board has delegated to the CEO authority to take all decisions and actions that further the corporate purpose of creating long-term shareholder value through the discovery, acquisition, development and marketing of natural resources. This is subject to the limits imposed by the Board on the CEO’s decision-making authority as set out in the Board Governance Document and the matters the Board has specifically reserved for its decision, including in the Company’s authorities framework. The CEO remains accountable to the Board for the authority that is delegated and for the performance of the Company, with the expectation that the CEO works in a constructive partnership with the Board. The Board monitors the decisions and actions of the CEO and the performance of the Company to gain assurance that progress is being made towards the corporate purpose within the limits imposed through the Company’s governance assurance framework. The Board also monitors the performance of the Company, and assesses its risk profile, through its committees. Reports from the committees are set out in section 2.13.
The CEO is required to report regularly to the Board in a spirit of openness and trust on the progress being made by the Company. Open dialogue between individual members of the Board and the CEO and other members of the management team is encouraged to enable Directors to gain a better understanding of the organisation.
Key activities during the yearThe Board approved a range of business decisions during the year, as outlined in section 4.1.
2.5 Board membershipThe Board currently has 11 members, each of whom must seek re-election by shareholders annually. With the appointment of Ken MacKenzie to the Board effective 22 September 2016, the Board will have 12 members. This will reduce to 11 following the retirement of John Schubert after the 2016 AGMs. The Non-executive Directors are considered by the Board to be independent of management and free from any business relationship or other circumstance that could materially interfere with the exercise of objective, unfettered or independent judgement. For more information on the process for assessing independence, refer to section 2.9.
In terms of Non-executive Director recruitment, the Nomination and Governance Committee retains the services of external recruitment specialists to continue to assist in the identification of potential candidates for the Board.
The Board believes there is an appropriate balance between Executive and Non-executive Directors to promote shareholder interests and govern the Company effectively. While the Board includes a smaller number of Executive Directors than is common for UK-listed companies, its composition is appropriate for the DLC structure and is in line with Australian-listed company practice. In addition, the Board has extensive access to members of senior management who frequently attend Board meetings, where they make presentations and engage in discussions with Directors, answer questions and provide input and perspective on their areas of responsibility. The CFO attends all Board meetings. The Board, led by the Chairman, also holds discussions in the absence of management at the beginning and end of Board meetings.
The Directors of the Company, along with their biographical details, are listed in section 2.2.1.
1 Strategic Report3
Remuneration Report
4 D
irectors’ Report 2
Governance at BH
P Billiton
98 BHP Billiton Annual Report 2016
2 Governance at BHP Billiton continued
2.6 ChairmanThe Chairman, Jac Nasser, is considered by the Board to be independent. He was appointed Chairman of the Company from 31 March 2010 and has been a Non-executive Director of the Company since 6 June 2006. Mr Nasser was last re-elected at the 2015 AGMs and, in accordance with the Company’s policy that each Director stand for election annually, will stand for re-election in 2016. More information in relation to his tenure on the Board is set out in section 2.9.
The Chairman’s role includes:• leading the Board and ensuring that it is operating to the highest
governance standards;• encouraging a culture of openness and debate to foster
a high-performing and collegial team of Directors that operates effectively;
• ensuring strategic issues and shareholder and relevant stakeholder views are regularly reviewed, clearly understood and underpin the work of the Board;
• facilitating the relationship between the Board and the CEO;• ensuring the provision of accurate, timely and clear information
to the Board; • setting agendas for meetings of the Board, in consultation with
the CEO and Company Secretary, that focus on the strategic direction and performance of the Company’s business;
• ensuring that adequate time is available for discussion on all agenda items;
• leading the Board and individual Director performance assessments; and
• speaking and acting for the Board and representing the Board to shareholders.
The Board considers that none of Mr Nasser’s other commitments (set out in section 2.2.1) interferes with the discharge of his responsibilities to the Company. The Board is satisfied that Mr Nasser makes sufficient time available to serve the Company effectively.
The Company does not have a Deputy Chairman but has identified Shriti Vadera to act as Chairman should the need arise at short notice. Shriti Vadera is the Senior Independent Director of BHP Billiton Plc (in accordance with the UK Corporate Governance Code).
2.7 Director skills, experience and attributes Skills, experience and attributes requiredThe Board considers that a diversity of skills, backgrounds, knowledge, experience, geographic location, nationalities and gender is required in order to effectively govern the business. The Board and its Nomination and Governance Committee work to ensure the Board continues to have the right balance necessary to discharge its responsibilities in accordance with the highest standards of governance.
Non-executive Directors must have a clear understanding of the Company’s overall strategy, together with knowledge about the Company and the industries in which it operates. Non-executive Directors must be sufficiently familiar with the Company’s core business to be effective contributors to the development of strategy and to monitor performance. Part of the required understanding of our strategy and the core business is the requirement to understand the risks the Company faces and the processes in place to mitigate and manage those risks. We operate in an uncertain external environment and the Company is exposed to many material risks across our operations, including some that are systemic such as financial risks and climate change. All those risks are factored into the Board’s approach to strategy and its assessment of an optimised portfolio. The risk management governance structure is described in section 2.14.
Current Board profileThe Board considers that each of the Non-executive Directors has the following attributes:• time to undertake the responsibilities of the role; • unquestioned honesty and integrity; • a willingness to understand and commit to the highest
standards of governance;• an ability to apply strategic thought to relevant matters; • an ability to consider materiality and risk tolerance as key
considerations in decision-making;• a preparedness to question, challenge and critique; • experience of managing in the context of uncertainty and
an understanding of the risk environment of the Company, including the potential for risk to impact our health, safety, environment, community and reputation, as well as the Company's regulatory, market and financial performance;
• knowledge of world capital markets; • a proven track record of creating value for shareholders.
The Executive Director brings additional perspectives to the Board through a deeper understanding of the Company’s business and day-to-day operations.

BHP Billiton Annual Report 2016 99
The following table sets out the mix of skills and experience the Board considers necessary or desirable in its Directors and the extent to which they are represented on the Board and its committees. The table includes Ken MacKenzie who will join the Board as of 22 September 2016.
Skills and experience Board Risk and AuditNomination and
Governance Remuneration Sustainability
Total Directors 12 Directors 4 Directors 3 Directors 4 Directors 4 Directors
Executive leadershipSustainable success in business at a very senior executive level in a successful career.
100% 100% 100% 100% 100%
Global experienceSenior management or equivalent experience in multiple global locations, exposed to a range of political, cultural, regulatory and business environments.
92% 75% 100% 100% 100%
GovernanceCommitment to the highest standards of governance, including experience with a major organisation that is subject to rigorous governance standards, and an ability to assess the effectiveness of senior management.
100% 100% 100% 100% 100%
Strategy/RiskTrack record of developing and implementing a successful strategy, including appropriately probing and challenging management on the delivery of agreed strategic planning objectives. Track record in developing an asset or business portfolio over the long term that remains resilient to systemic risk.
100% 100% 100% 100% 100%
Financial acumenSenior executive or equivalent experience in financial accounting and reporting, corporate finance and internal financial controls, including an ability to probe the adequacies of financial and risk controls.
100% 100% 100% 100% 100%
Capital projectsExperience working in an industry with projects involving large-scale capital outlays and long-term investment horizons.
92% 100% 100% 75% 100%
Health, safety and environmentExperience related to workplace health and safety, environmental and social responsibility, and community.
92% 75% 100% 100% 100%
RemunerationBoard Remuneration Committee membership or management experience in relation to remuneration, including incentive programs and pensions/superannuation and the legislation and contractual framework governing remuneration.
100% 100% 100% 100% 100%
MiningSenior executive experience in a large mining organisation combined with an understanding of the Company’s corporate purpose to create long-term shareholder value through the discovery, acquisition, development and marketing of natural resources.
33% 50% 0% 25% 40%
Oil and gasSenior executive experience in the oil and gas industry, including in-depth knowledge of the Company’s strategy, markets, competitors, operational issues, technology and regulatory concerns.
42% 25% 33% 50% 60%
MarketingSenior executive experience in marketing and a detailed understanding of the Company’s corporate purpose to create long-term shareholder value through the discovery, acquisition, development and marketing of natural resources.
83% 100% 67% 50% 100%
Public policyExperience in public and regulatory policy, including how it affects corporations.
92% 75% 100% 100% 100%
Board skills, experience and diversity
Gender
Female 25%US 17%Europe 25%
South Africa 8%Australia 50%
LocationTenure
0–3 years 25%3–6 years 33%6–9 years 25%
9+ years 17%
1 Strategic Report3
Remuneration Report
4 D
irectors’ Report 2
Governance at BH
P Billiton

100 BHP Billiton Annual Report 2016
2 Governance at BHP Billiton continued
Board skills and experience – climate changeThe strategic issues facing the Board change over time. The important thing is that the Board is able to identify these issues and access the best possible advice.
Climate change is a multi-faceted issue that impacts on investment decisions, oversight of the sustainability of our operations and engagement with government, investors, suppliers and customers. The BHP Billiton Board includes an appropriate mix of skills and experience to understand the implications of climate change on our operations, market and society.
Climate change is treated as a Board-level governance issue and is discussed regularly, including at the Board strategy days and in the context of scenario triggers and signposts. The Sustainability Committee spends a significant amount of time considering systemic climate change matters relating to the resilience of, and opportunities for, the Company’s portfolio.
Framed as a Board-level governance issue requiring experience of managing in the context of uncertainty and an understanding of the risk environment of the Group, all of the Non-executive Directors bring relevant experience to bear in our climate change discussions.
Board members bring significant sectoral experience which equips them to consider potential implications of climate change on the Group and its operational capacity. Board members also possess extensive experience in energy, governance and sustainability. There is also wide-ranging experience in finance, economics and public policy, which helps BHP Billiton to understand the nature of the debate and the international policy response as it develops. In addition, there is a deep understanding of systemic risk and the potential impacts of our portfolio.
Collectively, this means that the Board has the experience and skills to support the allocation of financial, capital and human resources for the creation of long-term shareholder value. It also means that the Board understands the importance of meeting the expectations of stakeholders, including in respect of the natural environment.
To enhance that experience, the Board has taken a number of measures to ensure that its decisions are appropriately informed by climate change science and expert advisers.
The Board seeks the input of management (including Dr Fiona Wild, our Vice President Environment and Climate Change), our Forum on Corporate Responsibility (which advises the Board on sustainability issues and includes Don Henry, former CEO of the Australian Conservation Foundation), and other independent advisers.
Renewal The Board believes orderly succession and renewal are achieved as a result of careful planning, with the appropriate composition of the Board continually under review. This planning involves looking out over a five-year period, which provides a robust framework within which to consider Board succession and renewal. In doing this, the Board, with the assistance of the Nomination and Governance Committee:
• considers the skills, background, knowledge, experience and diversity of geographic location, nationality and gender necessary to allow it to meet the corporate purpose as compared to those qualities currently represented;
• identifies any inadequate representation of those attributes and agrees the process necessary to ensure a candidate is selected who brings those attributes to the Board;
• reviews how Board performance might be enhanced, at an individual Director level and for the Board as a whole.
When considering new appointments to the Board, the Nomination and Governance Committee oversees the preparation of a position specification that is provided to an independent recruitment organisation retained to conduct a global search. Independent search firms are instructed to consider a wide range of candidates, including taking into account the criteria and attributes set out in the Board Governance Document.
Once a candidate is identified, the Board, with the assistance of external consultants when necessary, conducts appropriate background and reference checks before the candidate is appointed to the Board or stands for re-election at the AGMs.
The Board has adopted a letter of appointment that contains the terms on which Non-executive Directors will be appointed, including the basis upon which they will be indemnified by the Company. The letter of appointment clearly defines the role of Directors, including the expectations in terms of independence, participation, time commitment and continuous improvement.
A copy of the terms of appointment for Non-executive Directors is available online at www.bhpbilliton.com/home/aboutus/ourcompany/Pages/governance.aspx.
Inclusion and diversityOur Charter and Our Requirements for Human Resources standard guides management on all aspects of human resource management, including inclusion and diversity. Underpinning Our Requirements standards and supporting the achievement of diversity across the Company are principles and measurable objectives that define our approach to diversity and our focus on creating an inclusive work environment.
The Board and the Nomination and Governance Committee believe many facets of diversity are required, as set out in section 2.13.3, in order to meet the corporate purpose. Diversity is a core consideration in ensuring the Board and its committees have the right blend of perspectives to ensure the Board oversees BHP Billiton effectively for shareholders.
Alongside Board composition, part of the Board’s role is to consider and approve the Company’s measurable objectives for workforce diversity each financial year and to oversee the Company’s progress in achieving those objectives. This progress will continue to be disclosed in the Annual Report, along with the proportion of women in our workforce, in senior management positions and on the Board. For more information on inclusion and diversity at BHP Billiton, including our progress against FY2016 measurable objectives and our employee profile more generally, refer to sections 1.10.3 and 1.10.8.
BHP Billiton Annual Report 2016 101
2.8 Director induction, training and development The Board believes the development of industry and Company knowledge is a continuous and ongoing process. The Board’s development activity reflects the diversification of the portfolio through the provision of regular updates to Directors on the Company’s assets, commodities, geographies and markets to enable the Board to remain up-to-date.
Upon appointment, each new Non-executive Director undertakes an induction program specifically tailored to his or her needs.
A copy of an indicative induction program is available online at www.bhpbilliton.com/home/aboutus/ourcompany/Pages/governance.aspx.
Following the induction program, Non-executive Directors participate in continuous improvement programs (Training and Development Program), which are overseen by the Nomination and Governance Committee. The Training and Development Program covers a range of matters of a business nature, including environmental, social and governance matters. Programs are designed to maximise the effectiveness of the Directors throughout their tenure and reflect their individual performance evaluations.
During the year, Non-executive Directors participated in the following activities that underpin and support the Board’s work in monitoring and overseeing progress towards the corporate purpose:• briefings intended to provide each Director with a deeper
understanding of the activities, environment, key issues and direction of the assets along with HSEC and public policy considerations. Briefings were presented to the Board by senior executives, including ELT members and other team members with operational and non-operational responsibilities. When they were combined with a site visit, the briefings took place on-site, otherwise they took place at Board meetings. Briefings during FY2016 covered climate change, coal strategy and an energy update;
• development sessions on specific topics of relevance, such as climate change, commodity markets, the world economy, changes in corporate governance standards, inclusion and diversity, Directors’ duties and shareholder feedback. In relation to climate change, the Board and its committees once again spent time considering systemic climate change as it relates to the resilience of, and opportunities for, the Company’s portfolio of assets, while also considering actions to manage the implications of climate change;
• visits to Escondida and Spence, Copper, Chile; and Gulf of Mexico, Petroleum, United States, including briefings on the assets, operations and other relevant issues and meetings with key personnel;
• addresses by expert external speakers.
These sessions and site visits also allow an opportunity to discuss in detail the changing risk environment and the potential for impacts on the achievement of our corporate purpose and business plans. For information on the management of principal risks, refer to sections 1.9.3 and 2.14.
In addition, Business Risk and Audit Committee (RAC) meetings take place twice yearly as part of our financial governance framework. Directors who are members of the Board’s Risk and Audit Committee chair the Business RAC meetings. For more information on Business RACs, refer to section 2.13.1.
As part of the yearly review process, the Chairman discusses development areas with each Director. Board committees in turn review and agree their training needs. The benefit of this approach is that induction and learning opportunities can be tailored to Directors’ committee memberships, as well as the Board’s specific areas of focus. This approach also ensures a coordinated process in relation to succession planning, Board renewal, training and development and committee composition, which are all relevant to the Nomination and Governance Committee’s role in securing the supply of talent to the Board.
In addition, each Board committee provides a standing invitation for any Non-executive Director to attend committee meetings (rather than just limiting attendance to committee members). Committee agendas are provided to all Directors to ensure Directors are aware of matters to be considered by the committees and any Director can elect to attend meetings where appropriate.
1 Strategic Report3
Remuneration Report
4 D
irectors’ Report 2
Governance at BH
P Billiton

102 BHP Billiton Annual Report 2016
2 Governance at BHP Billiton continued
2.9 Independence The Board is committed to ensuring a majority of Directors is independent. The Board considers all of the current Non-executive Directors, including the Chairman, are independent.
Process to determine independenceThe Board has adopted a policy which it uses to determine the independence of its Directors. This determination is carried out upon appointment, annually and at any other time where the changed circumstances of a Director warrant reconsideration.
A copy of the policy on Independence of Directors is available online at www.bhpbilliton.com/home/aboutus/ourcompany/ Pages/governance.aspx.
Under the policy, an ‘independent’ Director is one who is: ‘independent of management and any business or other relationship that could materially interfere with the exercise of objective, unfettered or independent judgement by the Director or the Director’s ability to act in the best interests of the BHP Billiton Group’.
Where a Director is considered by the Board to be independent but is affected by circumstances that appear relevant to the Board’s assessment of independence, the Board has undertaken to explain the reasons why it reached its conclusion. In applying the independence test, the Board considers relationships with management, major shareholders, subsidiary and associated companies and other parties with whom the Company transacts business against pre-determined materiality thresholds, all of which are set out in the policy.
Tenure As at the end of the year under review, two Directors, Jac Nasser and John Schubert, had each served on the Board for more than nine years. Jac Nasser is standing for re-election at the 2016 AGMs, having undergone a formal performance assessment.
Mr Nasser was first appointed to the Board in June 2006 as an independent Non-executive Director. The Board believes his expertise and broad international experience materially enhance the skills and experience profile of the Board. In accordance with the UK Corporate Governance Code, Mr Nasser’s term of appointment has been subject to a particularly rigorous review which took into account the need for progressive refreshing of the Board.
The Board does not believe Mr Nasser’s tenure materially interferes with his ability to act in the best interests of the Company. The Board believes he has retained independence of character and judgement and has not formed associations with management (or others) that might compromise his ability to exercise independent judgement or act in the best interests of the Company.
Relationships and associationsLindsay Maxsted was the CEO of KPMG in Australia from 2001 until 2007. The Board believes this prior relationship with KPMG does not materially interfere with Mr Maxsted’s exercise of objective, unfettered or independent judgement, or his ability to act in the best interests of BHP Billiton. The Board has determined, consistent with its policy on the independence of Directors, that Mr Maxsted is independent. The Board notes in particular that:• at the time of his appointment to the Board, more than three
years had elapsed since Mr Maxsted’s retirement from KPMG. The Director independence rules and guidelines that apply to the Company – which are a combination of Australian, UK and US rules and guidelines – all use three years as the benchmark ‘cooling off’ period for former audit firm partners;
• Mr Maxsted has no financial (e.g. pension, retainer or advisory fee) or consulting arrangements with KPMG;
• Mr Maxsted was not part of the KPMG audit practice after 1980, and while at KPMG was not in any way involved in, or able to influence, any audit activity associated with BHP Billiton.
The Board believes Mr Maxsted’s financial acumen and extensive experience in the corporate restructuring field to be important in the discharge of the Board’s responsibilities. His membership of the Board and Chairmanship of the Risk and Audit Committee are considered by the Board to be appropriate and desirable.
Some of the Directors hold or have previously held positions in companies with which BHP Billiton has commercial relationships. Those positions and companies are set out in the Director profiles in section 2.2.1. The Board has assessed all of the relationships between the Company and companies in which Directors hold or held positions and has concluded that in all cases the relationships do not interfere with the Directors’ exercise of objective, unfettered or independent judgement or their ability to act in the best interests of the Company.
A specific instance is Malcolm Broomhead, who on 1 January 2016 was appointed Chairman of Orica Limited (a company with which BHP Billiton has commercial dealings). Orica provides commercial explosives, blasting systems and mineral processing chemicals and services to the mining and resources industry, among others. At the time of Mr Broomhead’s appointment to the Board of Orica, the BHP Billiton Board assessed the relationship between BHP Billiton and Orica and determined (and remains satisfied) that Mr Broomhead is able to apply objective, unfettered and independent judgement and to act in the best interests of BHP Billiton.
Transactions during the year that amounted to related party transactions with Directors or Director-related entities under International Financial Reporting Standards (IFRS) are outlined in note 30 ‘Related party transactions’ to the Financial Statements.
Executive DirectorThe Executive Director, Andrew Mackenzie, is not considered independent because of his executive responsibilities. Mr Mackenzie does not hold directorships in any other company included in the ASX 100 or FTSE 100.
Conflicts of interestThe UK Companies Act 2006 requires that BHP Billiton Directors avoid a situation where they have or can have an unauthorised direct or indirect interest that conflicts, or possibly may conflict, with the Company’s interests, unless approved by non-interested Directors. In accordance with the UK Companies Act 2006, BHP Billiton Plc’s Articles of Association allow the Directors to authorise conflicts and potential conflicts where appropriate. A procedure operates to ensure the disclosure of conflicts and for the consideration and, if appropriate, the authorisation of those conflicts by non-conflicted Directors. The Nomination and Governance Committee supports the Board in this process by reviewing requests from Directors for authorisation of situations of actual or potential conflict and making recommendations to the Board, and by regularly reviewing any situations of actual or potential conflict that have previously been authorised by the Board, and making recommendations regarding whether the authorisation remains appropriate. In addition, in accordance with Australian law, if a situation arises for consideration in which a Director has a material personal interest, the affected Director takes no part in decision-making unless authorised by non-interested Directors. Provisions for Directors’ interests are set out in the Constitution of BHP Billiton Limited.

BHP Billiton Annual Report 2016 103
Year one:
Committee and individual Director assessment.*
Year two:
Whole Board assessment.*
Each year, review of:
• Directors for re-election.• Board and committees for compliance with the
Board Governance Document and committee terms of reference.
Assessment
Evaluation process
* May be internally or externally facilitated assessment. Our approach is to conduct an externally facilitated assessment of the Board or Directors and committees at least every three years.
Review
1
2
2.10 Board evaluationThe Board is committed to transparency in determining Board membership and in assessing the performance of Directors. The Board evaluates its performance through a combination of both internal peer and externally facilitated assessments. The Board conducts regular evaluations of its performance, the performance of its committees, the Chairman, individual Directors and the governance processes that support the Board’s work. The Board evaluation process comprises both assessment and review, as summarised in the diagram below. The evaluation considers the balance of skills, experience, independence and knowledge of the Company and the Board, its overall diversity including gender, and how the Board works together as a unit. Directors provide anonymous feedback on their peers’ performance and individual contributions to the Board, which is passed on to the relevant Director via the Chairman. In respect of the Chairman’s performance, feedback is provided directly to the Senior Independent Director. External independent advisers are engaged to assist with these processes, as necessary. The involvement of an independent third party has assisted in the evaluation processes being rigorous and fair and ensuring continuous improvement in the operation of the Board and committees, as well as the contributions of individual Directors. Director evaluationThe evaluation of individual Directors focuses on the contribution of the Director to the work of the Board and the expectations of Directors as specified in the Company’s governance framework. The performance of individual Directors is assessed against a range of criteria, including the ability of the Director to:• focus on creating shareholder value; • contribute to the development of strategy; • understand the major risks affecting the Company; • provide clear direction to management; • contribute to Board cohesion; • commit the time required to fulfil the role and perform their
responsibilities effectively; • listen to and respect the ideas of fellow Directors and members
of management.Board effectivenessThe effectiveness of the Board as a whole and of its committees is assessed against the accountabilities set out in the Board Governance Document and each committee’s terms of reference. Matters considered in evaluations include:• the effectiveness of discussion and debate at Board and
committee meetings;• the effectiveness of the Board’s and committees’ processes
and relationship with management;• the quality and timeliness of meeting agendas, Board and
committee papers and secretariat support;• the composition of the Board and each committee, focusing
on the blend of skills, experience, independence and knowledge of the Company and its diversity, including geographic location, nationality and gender.
The process is managed by the Chairman, with feedback on the Chairman’s performance being provided to him by the Senior Independent Director. For information on the performance review process for executives, refer to section 2.15.
Evaluations conducted in respect of FY2016During FY2016, the Board commenced an external Board evaluation, a review of compliance with the Board Governance Document, an internal terms of reference review of the committees and an internal evaluation of individual Directors, which supported the review of each Director prior to the Board’s recommendation on re-election. All of these evaluations were completed in early FY2017 and have been discussed with the Board.JCA Group (during FY2016) and Heidrick & Struggles Leadership Assessment (in previous years) have provided services in respect of Director performance assessments. Both companies have also conducted external searches and assisted in the identification of potential candidates for the Board as set out in section 2.13.3. In both cases, the search and assessment services operate independently and neither firm has any other connection with the Company.Board assessmentThe Board evaluation commenced during FY2016 was externally facilitated by JCA Group. The evaluation focused on a range of issues, including Board performance, committee performance, the effectiveness of debate and discussion and individual contributions, interaction with the CEO and management, Board succession and composition, Director training and development and ideas for improvement. Feedback was obtained from individual Directors and management. The evaluation, which took place over a period of two months, indicated that the Board is engaged, inclusive and diverse, with effective debate and discussion that achieves a balance between support and challenge. The evaluation also concluded that shareholders are the focus of the Board's deliberations and that Board planning is thorough and processes are rigorous. The improvements, which will be implemented following the Board evaluation, include enhancements to Director induction, training and development, and the involvement in relevant Board discussions of additional subject matter experts with challenging views.The review of the Board as a whole also indicated that the Board is continuing to function effectively and in compliance with the Board Governance Document.Director reviewAs the FY2015 assessment was conducted externally, the FY2016 review of individual Directors was internally facilitated. The overall findings were presented to the Board and discussed. Each Director was provided with feedback on his or her contribution to the Board and its committees. This review supported the Board’s decision to endorse all retiring Directors standing for re-election.Committee terms of reference reviewDuring the year, the terms of reference of each of the committees were reviewed and updated as appropriate. In particular, this was to reflect continued enhancements to ensure the Board, the Company and its systems and processes are right-sized for the simplified BHP Billiton following the demerger of South32. The review also focused on ensuring that the terms of reference describe key responsibilities rather than describing how work is undertaken. Other objectives of the review included ensuring that recent regulatory and governance developments are reflected, improving readability and removing repetition. An internal review was then conducted to confirm continued compliance with each committee’s respective terms of reference.
1 Strategic Report3
Remuneration Report
4 D
irectors’ Report 2
Governance at BH
P Billiton

104 BHP Billiton Annual Report 2016
2 Governance at BHP Billiton continued
2.11 Board meetings and attendanceThe Board meets as often as necessary to fulfil its role. Directors are required to allocate sufficient time to the Company to perform their responsibilities effectively, including adequate time to prepare for Board meetings. During the reporting year, the Board met 14 times, with 11 of those meetings held in Australia, two in the United Kingdom and one in the United States. Regularly scheduled Board meetings generally run over two days (including committee meetings and Director training and development sessions).
Members of the ELT and other members of senior management attended meetings of the Board by invitation. Senior managers delivered presentations on the status and performance of our assets and matters reserved for the Board, including the approval of budgets, annual Financial Statements and strategy.
Attendance at Board and standing Board committee meetings during FY2016 is set out in the table below.
Board Risk and AuditNomination and
Governance Remuneration Sustainability
A B A B A B A B A B
Malcolm Brinded 14 14 1 1 5 5
Malcolm Broomhead 14 14 10 10 5 5
Carlos Cordeiro 7 7 2 2
Pat Davies 14 14 5 5 5 5
Anita Frew 11 11 3 3
Carolyn Hewson 14 14 5 5
Andrew Mackenzie 14 14
Lindsay Maxsted 14 13 10 10
Wayne Murdy 14 13 10 10
Jac Nasser 14 14 4 4
John Schubert 14 14 4 4 5 5
Shriti Vadera 14 14 3 3 3 3 5 5
Column A: indicates the number of scheduled and ad-hoc meetings held during the period the Director was a member of the Board and/or committee.Column B: indicates the number of scheduled and ad-hoc meetings attended by the Director during the period the Director was a member of the Board and/or committee.
2.12 Director re-election The Board adopted a policy in 2011, consistent with the UK Corporate Governance Code, under which all Directors must seek re-election by shareholders annually if they wish to remain on the Board. The Board believes annual re-election promotes and supports accountability to shareholders. The combined voting outcome of the BHP Billiton Plc and BHP Billiton Limited 2015 AGMs was that each Director received more than 98.9 per cent in support of their re-election.
Board support for re-election is not automatic. Directors who are seeking re-election are subject to a performance appraisal overseen by the Nomination and Governance Committee. Annual re-election effectively means all Directors are subject to a performance appraisal annually. The Board, on the recommendation of the Nomination and Governance Committee, makes a determination as to whether it will endorse a retiring Director for re-election. The Board will not endorse a Director for re-election if his or her performance is not considered satisfactory. The Notice of Meeting will provide information that is material to a shareholder’s decision whether or not to re-elect a Director, including whether or not re-election is supported by the Board.
BHP Billiton does not apply or implement a ‘no vacancy’ rule in relation to Board appointments. Accordingly, Director candidates can be elected to the Board by ordinary resolution and are not required to out-poll an incumbent Director in order to be elected.

BHP Billiton Annual Report 2016 105
2.13 Board committees The Board has established committees to assist it in exercising its authority, including monitoring the performance of the Company to gain assurance that progress is being made towards the corporate purpose within the limits imposed by the Board.
Each of the permanent committees has terms of reference under which authority is delegated by the Board.
Group Governance provides secretariat services for each of the committees. Committee meeting agendas, papers and minutes are made available to all members of the Board. Subject to appropriate controls and the overriding scrutiny of the Board, committee chairmen are free to use whatever resources they consider necessary to discharge their responsibilities.
Reports from each of the committees follow.
The terms of reference for each committee are available online at www.bhpbilliton.com/home/aboutus/ourcompany/Pages/governance.aspx.
2.13.1 Risk and Audit Committee Report
Role and focus The role of the Risk and Audit Committee (RAC) is to assist the Board in monitoring the decisions and actions of the CEO and the Company and to gain assurance that progress is being made towards achieving the corporate purpose within the limits imposed by the Board, as set out in the Board Governance Document.
The RAC discharges its responsibilities by overseeing: • the integrity of the Company’s Financial Statements;• the appointment, remuneration, qualifications, independence
and performance of the External Auditor and the integrity of the audit process as a whole;
• the plans, performance, objectivity and leadership of the internal audit function and the integrity of the internal audit process as a whole;
• the effectiveness of the systems of internal controls and risk management;
• the Company’s systems for compliance with applicable legal and regulatory requirements within the RAC’s area of responsibility;
• capital management (funding, liquidity, balance sheet management, dividends).
For more information about our approach to risk management, refer to sections 1.9.1 and 2.14.
The RAC met 10 times during the year. Information on meeting attendance by Committee members is included in the table in section 2.11 and information on Committee members’ qualifications is set out in section 2.2.1.
In addition to the regular business of the year, the Committee discussed matters including cyber security, the hybrid debt issue and changes to the UK Corporate Governance Code, including the requirement for a viability statement in the Annual Report and the obligations surrounding the robust risk assessment. The viability statement and the Board’s confirmation that it has carried out a robust risk assessment are at section 1.9.1. Statements relating to tendering of the external audit contract, significant matters relating to the Financial Statements and the process for evaluating the external audit are set out below. In addition to those items of business, the RAC spent significant time dealing with matters relating to Samarco. For more information on Samarco, refer to section 1.4. Risk and Audit Committee members during the year
Name Status
Lindsay Maxsted (Chairman)(1) Member for whole period
Malcolm Broomhead Member for whole period
Anita Frew Member from 3 February 2016
Wayne Murdy Member for whole period
Shriti Vadera Member until 30 September 2015
(1) Mr Maxsted is the Committee’s financial expert nominated by the Board.
Business Risk and Audit CommitteesTo assist management in providing the information necessary to allow the RAC to discharge its responsibilities, Business Risk and Audit Committees have been established, covering each asset group and Treasury. These committees, known as Business RACs, operate as committees of management but are chaired by members of the RAC. The responsible member of the ELT participates in these meetings. Business RACs perform an important monitoring function in the overall governance of the Company.
Significant financial and risk matters raised at Business RAC meetings are reported to the RAC by the Group Financial Controller and the Head of Group Risk Assessment and Assurance.
1 Strategic Report3
Remuneration Report
4 D
irectors’ Report 2
Governance at BH
P Billiton

106 BHP Billiton Annual Report 2016
2 Governance at BHP Billiton continued
Activities undertaken during the yearFair, balanced and understandableDirectors are required to confirm that they consider the Annual Report, taken as a whole, to be fair, balanced and understandable. They are required to provide the information necessary for shareholders to assess the Company’s position, performance, business model and strategy.
The Company has a substantial governance framework in place for the Annual Report. This includes management representation letters, certifications, RAC oversight of the Financial Statements and a range of other financial governance procedures focused on the financial section of the Annual Report, together with verification procedures for the narrative reporting section of the Report.
The RAC advises the Board on whether the Annual Report meets the fair, balanced and understandable requirement. The process to support the giving of this confirmation involved the following:• ensuring all individuals involved in the preparation of any part
of the Annual Report are briefed on the fair, balanced and understandable requirement through training sessions for each content manager that detail the key attributes of ‘fair, balanced and understandable’;
• employees who have been closely involved in the preparation of the Financial Statements review the entire narrative for the fair, balanced and understandable requirement, and sign off an appropriate sub-certification;
• key members of the team preparing the Annual Report confirm they have taken the fair, balanced and understandable requirement into account and that they have raised, with the Annual Report project team, any concerns they have in relation to meeting this requirement;
• the Annual Report suite sub-certification incorporates a fair, balanced and understandable declaration;
• in relation to the requirement for the auditor to review parts of the narrative report for consistency with the audited Financial Statements, asking the External Auditor to raise any issues of inconsistency at an early stage.
As a result of the process outlined above, the RAC, and then the Directors, were able to confirm their view that BHP Billiton’s Annual Report 2016 taken as a whole is fair, balanced and understandable. For the Board’s statement on the Annual Report, refer to the Directors’ Report in section 4.
Integrity of Financial StatementsIn addition to the assurance process above, the RAC continues to assist the Board in assuring the integrity of the Financial Statements. The RAC evaluates and makes recommendations to the Board about the appropriateness of accounting policies and practices, areas of judgement, compliance with Accounting Standards, stock exchange and legal requirements and the results of the external audit. It reviews the half-yearly and annual Financial Statements and makes recommendations on specific actions or decisions (including formal adoption of the Financial Statements and reports) the Board should consider in order to maintain the integrity of the Financial Statements.
For the FY2016 full year and the half year, the CEO and CFO have certified that the Company’s financial records have been properly managed and that the FY2016 Financial Statements present a true and fair view, in all material respects, of our financial condition and operating results and are in accordance with applicable regulatory requirements.
Significant issuesIn addition to the Group’s key judgements and estimates disclosed throughout the FY2016 Financial Statements, the Committee also considered the following significant issues:
Samarco dam failureOn 5 November 2015, the Samarco Mineração S.A. (Samarco) iron ore operation in Minas Gerais, Brazil experienced a tailings dam failure that resulted in a release of mine tailings, flooding the community of Bento Rodrigues and impacting other communities downstream. Samarco is jointly owned by BHP Billiton Brasil Ltda (BHP Billiton Brasil) and Vale S.A. (Vale). BHP Billiton Brasil’s 50 per cent interest in Samarco is accounted for as an equity accounted joint venture investment.
Samarco’s provisions and contingent liabilitiesThe Committee reviewed matters relating to the dam failure reported by Samarco in its 31 December 2015 Annual Report and updates to these matters to 30 June 2016. BHP Billiton Brasil’s 50 per cent share of the loss recorded by Samarco was subsequently recognised and disclosed in the Group’s Financial Statements.
Potential direct financial impacts to BHP Billiton BrasilThe Committee considered:• the recoverability of BHP Billiton Brasil’s remaining equity
investment in Samarco;• the accounting implications of funding requested by Samarco
to support activities under the Framework Agreement, carry out remediation and stabilisation work and support Samarco’s operations;
• the ability to determine a range of possible outcomes or a reliable estimate of existing and potential future exposures of BHP Billiton Brasil or other BHP Billiton entities;
• legal assessments underpinning, and IFRS basis of, the provisions recognised and contingent liabilities disclosed in respect of existing and potential future claims against BHP Billiton Brasil or other BHP Billiton entities;
• the impact of the dam failure on previously recognised deferred tax assets and liabilities.
Based on currently available information, the Committee concluded that the accounting for the equity investment in Samarco (including an impairment charge made after consideration of, among other things, the uncertainties surrounding the nature and timing of ongoing future operations), the provision recognised by BHP Billiton Brasil, the treatment of deferred tax balances and contingent liabilities disclosed in the Group’s Financial Statements were appropriate.
For further information, refer to note 3 ‘Significant events – Samarco dam failure' to the Financial Statements.
Carrying value of long-term assetsThe assessment of carrying values of long-term assets uses a number of significant judgements and estimates.
The Committee compared the carrying value of the Onshore US petroleum assets, including goodwill, to internal valuations and concluded that an impairment charge was appropriate. Specific consideration was given to the most recent short, medium and long-term prices, geological complexity, expected production volumes and mix, amended development plans, operating and capital costs and discount rates.
The Committee examined the carrying value of BHP Billiton’s 75 per cent interest in the IndoMet Coal Project in Indonesia in light of the conditional sale agreement reached with its equity partner PT Alam Tri Abadi (Adaro) and concluded that an impairment charge was appropriate.
Conclusions from these reviews are reflected in note 12 ‘Impairment of non-current assets' to the Financial Statements.
2.13.1 Risk and Audit Committee Report continued
BHP Billiton Annual Report 2016 107
Tax and royalty liabilitiesThe Group is subject to a range of tax and royalty matters across many jurisdictions. The Committee considered updates on changes to the wider tax landscape, estimates and judgements supporting the measurement and disclosure of tax and royalty provisions and contingent liabilities, including the following: • tax risks arising from the Group’s cross-border operations and
transactions, including transfer pricing estimates impacting taxes payable in various jurisdictions, including disputed assessments issued by the Australian Tax Office;
• disputed royalty reassessments issued by the Queensland Office of State Revenue to certain Group companies in relation to its share of the BHP Billiton Mitsubishi Alliance (BMA);
• changes in foreign tax law; • other matters where uncertainty exists in the application
of the law.
The Committee concluded that provisions recognised and contingent liabilities disclosed for these matters were appropriate considering the range of possible outcomes, currently available information and legal advice obtained.
For further information, refer to note 5 ‘Income tax expense’ and note 32 ‘Contingent liabilities’ to the Financial Statements.
Closure and rehabilitation provisionsDetermining the closure and rehabilitation provisions is a complex area requiring significant judgement and estimates, particularly given the timing and quantum of future costs, the unique nature of each site, and the long timescales involved.
The Committee considered the various changes in estimates for closure and rehabilitation provisions recognised during the year. Consideration was given to the results of the most recently completed surveying data, current cost estimates and appropriate inclusion of contingency in cost estimates to allow for both known and residual risks. The Committee concluded that the assumptions and inputs for closure and rehabilitation cost estimates were reasonable and the related provisions recorded were appropriate.
For further information, refer to note 14 ‘Closure and rehabilitation provisions’ to the Financial Statements.
External AuditorThe RAC manages the relationship with the External Auditor on behalf of the Board. It considers the reappointment of the External Auditor each year, as well as remuneration and other terms of engagement and makes a recommendation to the Board. There are no contractual obligations that restrict the RAC’s capacity to recommend a particular firm for appointment as auditor.
The last audit tender was in 2002, at which time the Company had three external auditors following the implementation of the DLC structure. The tender resulted in KPMG and PricewaterhouseCoopers being appointed as joint auditors for FY2003 and, therefore, a reduction in audit providers. A competitive audit review was undertaken in 2003, which resulted in KPMG being appointed as the External Auditor by the Board on the recommendation of the RAC.
The lead audit engagement partners in both Australia and the United Kingdom have been rotated every five years. The current Australian audit engagement partner was appointed at the start of FY2015. A new UK audit engagement partner was appointed for the FY2013 year-end and therefore FY2017 is scheduled to be his last year.
The Committee remains satisfied with the External Auditor’s performance and independence and therefore does not believe a tender in the near term is appropriate. Consistent with the UK and EU requirements in regard to audit firm tender and rotation, the Committee’s current intention is to conduct an audit firm tender for FY2019. For the reasons outlined above, the Committee considers this timing to be in the best interests of the Company’s members.
Compliance with the CMA OrderBHP Billiton confirms that during FY2016, it was in compliance with the provisions of The Statutory Audit Services for Large Companies Market Investigation (Mandatory Use of Competitive Tender Processes and Audit Committee Responsibilities) Order 2014.
Evaluation of External Auditor and external audit processThe RAC evaluates the performance of the External Auditor during its term of appointment against specified criteria, including delivering value to shareholders and the Company, and also assesses the effectiveness of the external audit process. It does so through a range of means, including:• the Committee considers the External Audit Plan, in particular
to gain assurance that it is tailored to reflect changes in circumstances from the prior year;
• throughout the year, the Committee meets with the audit partners, particularly the lead Australian and UK audit engagement partners, without management present;
• following the completion of the audit, the Committee considers the quality of the External Auditor’s performance drawing on survey results. The survey is based on a two-way feedback model where the BHP Billiton and KPMG teams assess each other against a range of criteria. The criteria against which the BHP Billiton team evaluates KPMG’s performance include ethics and integrity, insight, service quality, communication and reporting, and responsiveness;
• reviewing the terms of engagement of the External Auditor;• discussing with the audit engagement partners the skills and
experience of the broader audit team; • reviewing audit quality inspection reports on KPMG published
by the UK Financial Reporting Council; • overseeing (and approving where relevant) non-audit services
as described below.
The RAC also reviews the integrity, independence and objectivity of the External Auditor and assesses whether there is any element of the relationship that impairs, or appears to impair, the External Auditor’s judgement or independence. This review includes:• confirming the External Auditor is, in its judgement,
independent of the Company;• obtaining from the External Auditor an account of all
relationships between the External Auditor and the Company;• monitoring the number of former employees of the External
Auditor currently employed in senior positions within the Company;
• considering the various relationships between the Company and the External Auditor;
• determining whether the compensation of individuals employed by the External Auditor who conduct the audit is tied to the provision of non-audit services;
• reviewing the economic importance of the Company to the External Auditor.
The External Auditor also certifies its independence to the RAC.
2.13.1 Risk and Audit Committee Report continued
1 Strategic Report3
Remuneration Report
4 D
irectors’ Report 2
Governance at BH
P Billiton

108 BHP Billiton Annual Report 2016
2 Governance at BHP Billiton continued
Non-audit servicesAlthough the External Auditor does provide some non-audit services, the objectivity and independence of the External Auditor are safeguarded through restrictions on the provision of these services. For example, certain types of non-audit services may be undertaken by the External Auditor only with the prior approval of the RAC (as described below), while other services may not be undertaken at all, including services where the External Auditor:• may be required to audit its own work;• participates in activities that would normally be undertaken
by management;• is remunerated through a ‘success fee’ structure;• acts in an advocacy role for the Company.
The RAC has adopted a policy entitled ‘Provision of Audit and Other Services by the External Auditor’ covering the RAC’s pre-approval policies and procedures to maintain the independence of the External Auditor.
Our policy on Provision of Audit and Other Services by the External Auditor is available online at www.bhpbilliton.com/ home/aboutus/ourcompany/Pages/governance.aspx.
In addition to audit services, the External Auditor is permitted to provide other (non-audit) services that are not, and are not perceived to be, in conflict with the role of the External Auditor. In accordance with the requirements of the 1934 Securities Exchange Act and guidance contained in Public Company Accounting Oversight Board (PCAOB) Release 2004-001, certain specific activities are listed in our detailed policy that have been ‘pre-approved’ by the RAC.
The categories of ‘pre-approved’ services are as follows: • Audit and audit-related services – work that constitutes the
agreed scope of the statutory audit and includes the statutory audits of the Company and its entities (including interim reviews). This category also includes work that is reasonably related to the performance of an audit or review and is a logical extension of the audit or review scope. The RAC will monitor the audit services engagements and if necessary approve any changes in terms and conditions resulting from changes in audit scope, Company structure or other relevant events.
• Other assurance services – work that is outside the required scope of the statutory audit but is consistent with the role of the external statutory auditor, is of an assurance or compliance nature and is work that the External Auditor must or is best placed to undertake.
• Other services – work of a tax or an advisory nature that does not compromise the independence of the External Auditor.
Activities not listed specifically are therefore not ‘pre-approved’ and must be approved by the RAC prior to engagement, regardless of the dollar value involved. Additionally, any engagement for other services with a value over US$100,000, even if listed as a ‘pre-approved’ service, requires the approval of the RAC. All engagements for other services whether ‘ pre-approved’ or not and regardless of the dollar value involved are reported quarterly to the RAC.
While not specifically prohibited by BHP Billiton’s policy, any proposed non-audit engagement of the External Auditor relating to internal control (such as a review of internal controls or assistance with implementing the regulatory requirements, including those of the 1934 Securities Exchange Act) requires specific prior approval from the RAC. With the exception of the external audit of the Company’s Financial Statements, any engagement identified that contains an internal control-related element is not considered to be pre-approved. In addition, while the categories shown above include a list of certain pre-approved services, the use of the External Auditor to perform such services will always be subject to our overriding governance practices as articulated in the policy.
An exception can be made to the above policy where it is in BHP Billiton’s interests and appropriate arrangements are put in place to ensure the integrity and independence of the External Auditor. Any such exception requires the specific prior approval of the RAC and must be reported to the Board. No exceptions were approved during the year ended 30 June 2016.
In addition, the RAC approved no services during the year ended 30 June 2016 pursuant to paragraph (c)(7)(i)(C) of Rule 2-01 of SEC Regulation S-X (provision of services other than audit).
Fees paid to the Company’s External Auditor during the year for audit and other services were US$16.9 million, of which 64 per cent comprised audit fees, 31 per cent related to legislative requirements (including Sarbanes-Oxley) and five per cent was for other services. Details of the fees paid are set out in note 35 ‘Auditors’ remuneration’ to the Financial Statements.
Based on the review by the RAC, the Board is satisfied that the External Auditor is independent.
Internal AuditThe Internal Audit function is carried out by Group Risk Assessment and Assurance (RAA). The role of RAA is to provide assurance as to whether risk management, control and governance processes are adequate and functioning. The Internal Audit function is independent of the External Auditor. The RAC reviews the terms of reference of RAA, the staffing levels and its scope of work to ensure it is appropriate in light of the key risks we face. It also reviews and approves the annual internal audit plan and monitors and reviews the overall effectiveness of the internal audit activities.
The RAC also approves the appointment and dismissal of the Head of RAA and assesses his or her performance, independence and objectivity. The role of the Head of RAA includes achievement of the internal audit objectives, risk management policies and insurance strategy. The position was held throughout the year by Alistair Mytton. Mr Mytton reports directly to the RAC. During the period, functional oversight of RAA was provided by the CFO, with that accountability transferred to the Chief External Affairs Officer on 1 March 2016.
Effectiveness of systems of internal control and risk managementIn delegating authority to the CEO, the Board has established CEO limits set out in the Board Governance Document. Limits on the CEO’s authority require the CEO to ensure there is a system of control in place for identifying and managing risk in the Company. Through the RAC, the Directors review the systems that have been established for this purpose and regularly review their effectiveness. These reviews include assessing whether processes continue to meet evolving external governance requirements.
The RAC oversees and reviews the internal controls and risk management systems. In undertaking this role, the RAC reviews the following:• procedures for identifying business and operational risks
and controlling their financial impact on the Company and the operational effectiveness of the policies and procedures related to risk and control;
• budgeting and forecasting systems, financial reporting systems and controls;
• policies and practices put in place by the CEO for detecting, reporting and preventing fraud and serious breaches of business conduct and whistle-blowing procedures;
• procedures for ensuring compliance with relevant regulatory and legal requirements;
• arrangements for protecting intellectual property and other non-physical assets;
• operational effectiveness of the Business RAC structures;• overseeing the adequacy of the internal controls and allocation
of responsibilities for monitoring internal financial controls.
2.13.1 Risk and Audit Committee Report continued
BHP Billiton Annual Report 2016 109
For more information on our approach to risk management, refer to sections 1.9.1 and 2.14. Section 1.9.2 includes a description of the material risks that could affect BHP Billiton including, but not limited to, economic, environment and social sustainability risks to which the Company has a material exposure. Section 1.9.3 also provides an explanation of how those risks are managed.
During the year, the Board conducted reviews of the effectiveness of the Company’s systems of risk management and internal controls for the financial year and up to the date of this Annual Report in accordance with the UK Corporate Governance Code, the Guidance on Risk Management, Internal Control and Related Financial and Business Reporting and the Corporate Governance Principles and Recommendations published by the Australian Securities Exchange (ASX) Corporate Governance Council (ASX Principles and Recommendations). These reviews covered financial, operational and compliance controls and risk assessment. During the year, management presented an assessment of the material business risks facing the Company and the level of effectiveness of risk management over the material business risks. The reviews were overseen by the RAC, with findings and recommendations reported to the Board. In addition to considering key risks facing the Company, the Board received an assessment of the effectiveness of internal controls over key risks identified through the work of the Board committees. The Board is satisfied that the effectiveness of the internal controls has been properly reviewed.
Management’s assessment of our internal control over financial reportingManagement is responsible for establishing and maintaining adequate internal control over financial reporting (as defined in Rule 13a-15(f) and Rule 15d-15(f) under the 1934 Securities Exchange Act). Under the supervision and with the participation of our management, including our CEO and CFO, the effectiveness of the Company’s internal control over financial reporting has been evaluated based on the framework and criteria established in Internal Controls – Integrated Framework, issued by the Committee of the Sponsoring Organizations of the Treadway Commission (COSO). Based on this evaluation, management has concluded that internal control over financial reporting was effective as at 30 June 2016. There were no material weaknesses in the Company’s internal controls over financial reporting identified by management.
Because of its inherent limitations, internal control over financial reporting may not prevent or detect misstatements and, even when determined to be effective, can only provide reasonable assurance with respect to financial statement preparation and presentation. Also, projections of any evaluation of effectiveness to future periods are subject to the risk that controls may become inadequate because of changes in conditions, or that the degree of compliance with the policies or procedures may deteriorate.
BHP Billiton has engaged our independent registered public accounting firms, KPMG and KPMG LLP, to issue an audit report on our internal control over financial reporting for inclusion in the Financial Statements section of this Annual Report on Form 20-F as filed with the SEC.
There have been no changes in our internal control over financial reporting during FY2016 that have materially affected, or are reasonably likely to materially affect, our internal control over financial reporting.
The CEO and CFO have certified to the Board that the Financial Statements for the full year and half year are founded on a sound system of risk management and internal control and the system is operating efficiently and effectively.
During the year, the RAC reviewed our compliance with the obligations imposed by the US Sarbanes-Oxley Act (SOX), including evaluating and documenting internal controls as required by section 404 of SOX.
Management’s assessment of our disclosure controls and proceduresOur management, with the participation of our CEO and CFO, has performed an evaluation of the effectiveness of the design and operation of our disclosure controls and procedures as at 30 June 2016. Disclosure controls and procedures are designed to provide reasonable assurance that the material financial and non-financial information required to be disclosed by BHP Billiton, including in the reports that it files or submits under the 1934 Securities Exchange Act, is recorded, processed, summarised and reported on a timely basis and that such information is accumulated and communicated to BHP Billiton’s management, including our CEO and CFO, as appropriate, to allow timely decisions regarding required disclosure. Based on the foregoing, our management, including the CEO and CFO, has concluded that our disclosure controls and procedures are effective in providing that reasonable assurance.
There are inherent limitations to the effectiveness of any system of disclosure controls and procedures, including the possibility of human error and the circumvention or overriding of the controls and procedures. Accordingly, even effective disclosure controls and procedures can only provide reasonable assurance of achieving their control objectives.
Further, in the design and evaluation of our disclosure controls and procedures, management was required to apply its judgement in evaluating the cost-benefit relationship of possible controls and procedures.
2.13.1 Risk and Audit Committee Report continued
Committee assessment An internally facilitated review was conducted during the year to confirm continued compliance with the RAC’s terms of reference. These terms were updated in FY2014 and further updated in FY2016. The Committee is satisfied that it has met its terms of reference.
The updated terms of reference for the RAC are available online at www.bhpbilliton.com/home/aboutus/ourcompany/Pages/governance.aspx.
1 Strategic Report3
Remuneration Report
4 D
irectors’ Report 2
Governance at BH
P Billiton
110 BHP Billiton Annual Report 2016
2 Governance at BHP Billiton continued
Committee assessment An internally facilitated review was conducted during the year to confirm continued compliance with the Committee’s terms of reference. These terms were updated in FY2013 and further updated in FY2016. The Committee is satisfied that it has met its terms of reference.
The updated terms of reference for the Remuneration Committee are available online at www.bhpbilliton.com/home/aboutus/ourcompany/Pages/governance.aspx.
2.13.3 Nomination and Governance Committee Report
2.13.2 Remuneration Committee Report
Role and focus The role of the Remuneration Committee is to assist the Board in overseeing: • the remuneration policy and its specific application to the
CEO and other members of the OMC and its general application to all employees;
• the adoption of annual and longer-term incentive plans;• the determination of levels of reward for the CEO and approval
of reward to the OMC;• the annual evaluation of the performance of the CEO,
by giving guidance to the Company Chairman;• the preparation of the Remuneration Report for inclusion
in the Annual Report;• compliance with applicable legal and regulatory requirements
associated with remuneration matters;• the review, at least annually, of remuneration by gender.
The Sustainability and Risk and Audit Committees assist the Remuneration Committee in determining appropriate HSEC and financial and capital projects metrics, respectively, to be included in OMC scorecards and in assessing performance against those measures.
The Remuneration Committee met five times during the year. Information on meeting attendance by Committee members is included in the table in section 2.11.
For full details of the Committee’s work on behalf of the Board, refer to the Remuneration Report in section 3.
Remuneration Committee members during the year
Name Status
Carolyn Hewson (Chairman) Member for whole period
Malcolm Brinded Member from 13 April 2016
John Buchanan Member until 13 July 2015
Carlos Cordeiro Member until 19 November 2015
Pat Davies Member for whole period
Shriti Vadera Member for whole period
Role and focusThe role of the Nomination and Governance Committee is to assist in ensuring the Board comprises individuals who are best able to discharge the responsibilities of a Director, having regard to the highest standards of governance, the strategic direction of the Company and the diversity aspirations of the Board. It does so by focusing on: • the succession planning process for the Board and its
committees, including the identification of the skills, experience, independence and knowledge required on the Board, as well as the attributes required of potential Directors;
• the identification of suitable candidates for appointment to the Board, taking into account the skills, experience and diversity required on the Board and the attributes required of Directors;
• the succession planning process for the Chairman;• the succession planning process for the CEO and
periodic evaluation of the process;• Board and Director performance evaluation, including
evaluation of Directors seeking re-election prior to their endorsement by the Board as set out in sections 2.10 and 2.12;
• the provision of appropriate training and development opportunities for Directors;
• the independence of Non-executive Directors;• the time required from Non-executive Directors;• the authorisation of situations of actual and potential
conflict notified by Directors in accordance with the Articles of Association of BHP Billiton Plc as set out in section 2.9;
• the Company’s corporate governance practices.
For details on the process the Board adopts for its own succession, with the assistance of the Nomination and Governance Committee, refer to section 2.7.
The Nomination and Governance Committee met four times during the year. Information on meeting attendance by Committee members is included in the table in section 2.11. In addition to the regular business of the year, the Committee considered the appointment of Anita Frew as set out below and the appointment of Ken MacKenzie.
Ken MacKenzie will join the Board on 22 September 2016 as an independent Non-executive Director. From 2005 to 2015, Mr MacKenzie served as the Managing Director and Chief Executive Officer of Amcor Limited, a global packaging company with operations in over 40 countries. He is currently a Senior Adviser with McKinsey and Company. He brings extensive global and executive experience, and a deeply strategic approach. He has a proven track record, having led a successful company in a challenging sector for a decade.
Board policy on inclusion and diversityOur Charter and Our Requirements for Human Resources standard guide management on all aspects of human resource management, including inclusion and diversity. Underpinning Our Requirements standards and supporting the achievement of diversity across the Company are principles and measurable objectives that define our approach to diversity and our focus on creating an inclusive work environment.
The Board and the Nomination and Governance Committee believe that many facets of diversity are required in order to meet the corporate purpose as set out in section 2.7. Diversity is a core consideration in ensuring that the Board and its committees have the right blend of perspectives to ensure the Board oversees BHP Billiton effectively for shareholders.
BHP Billiton Annual Report 2016 111
For the past four years, two executive search firms, JCA Group and Heidrick & Struggles, have produced all-women short lists focused on the United Kingdom, Europe and the United States, which are continually refreshed. The two lists – combined with our skills and experience profile five-year matrix – ensure we maximise the number of female candidates we talk with and consider for appointment. Short-listed candidates are considered by the Nomination and Governance Committee. During FY2016, the Chairman met regularly with potential female candidates who have a range of backgrounds.
The Board believes that critical mass is important for diversity and the Board had a goal of increasing the number of women on the Board to at least three by the end of CY2015. This was achieved with the appointment of Anita Frew to the Board. She brings extensive board, strategy, marketing, governance and risk management experience in the chemicals, engineering, water and finance industries, along with a strong understanding of shareholder expectations. While the Board has achieved its stated goal, diversity of all types remains a priority as the Board continues to be refreshed and renewed, as set out in section 2.7.
Alongside Board composition, part of the Board’s role is to consider and approve the Company’s measurable objectives for workforce diversity each financial year and to oversee the Company’s progress in achieving those objectives. The Company’s progress will continue to be disclosed in the Annual Report, along with the proportion of women
in our workforce, in senior management positions and on the Board. More information on inclusion and diversity at BHP Billiton, including our progress against FY2016 measurable objectives and our employee profile more generally, is set out in sections 1.10.3 and 1.10.8.
External recruitment specialistsThere were changes to the composition of the Board during the year. Sir John Buchanan passed away on 13 July 2015. Carlos Cordeiro retired with effect from the 2015 AGMs. The appointment of Anita Frew and Ken MacKenzie followed a process involving the retained services of external recruitment specialists Heidrick & Struggles and JCA Group, who have assisted in the identification of potential candidates for the Board, as set out above. Nomination and Governance Committee members during the year
Name Status
Jac Nasser (Chairman) Member for whole period
John Buchanan Member until 13 July 2015
John Schubert Member for whole period
Shriti Vadera Member from 14 August 2015
Committee assessment An internally facilitated review was conducted during the year to confirm continued compliance with the Committee’s terms of reference. These terms were updated in FY2013 and further updated in FY2016. The Committee is satisfied that it has met its terms of reference.
The updated terms of reference for the Nomination and Governance Committee are available online at www.bhpbilliton.com/home/aboutus/ourcompany/Pages/governance.aspx.
2.13.3 Nomination and Governance Committee Report continued
2.13.4 Sustainability Committee Report
Role and focus The role of the Sustainability Committee is to assist the Board in its oversight of the Group’s HSEC performance and the adequacy of the Group’s Sustainability Framework; and in relation to various other governance responsibilities related to HSE and Community.
The Group’s HSEC framework consists of:• the CEO limits set out in the Board Governance Document.
The Board Governance Document establishes the remit of the Board and delegates authority to the CEO, including in respect of the HSEC Management System, subject to CEO limits;
• the Sustainability Committee, which is responsible for assisting the Board in overseeing the adequacy of the Group’s HSEC Framework and HSEC Management System (among other things);
• the HSEC Management System, established by management in accordance with the CEO’s delegated authority. The HSEC Management System provides the processes, resources, structures and performance standards for the identification, management and reporting of HSEC risks and the investigation of any HSEC incidents;
• a robust and independent internal audit process overseen by the RAC, in accordance with its terms of reference;
• independent advice on HSEC matters, which may be requested by the Board and its Committees where deemed necessary.
Our approach to sustainability is reflected in Our Charter, which defines our values, purpose and how we measure success, and in our sustainability performance targets, which define our public commitments to safety, health, environment and community. More information is available in the Company’s Sustainability Report 2016.
A copy of the Sustainability Report is available online at www.bhpbilliton.com.
The Committee provides oversight of the preparation and presentation of the Sustainability Report by management, and reviewed and recommended to the Board the approval of the annual Sustainability Report for publication. The Sustainability Report identifies our targets for HSEC matters and our performance against those targets, with an emphasis on fact-based measurement and quality data in setting targets.
The Sustainability Committee met five times during the year. Information on meeting attendance by Committee members is included in the table in section 2.11.
The Sustainability Committee continued to assist the Board in its oversight of HSEC issues and performance during the year. This included consideration of strategic HSEC issues, audits and trends, the Company’s HSEC performance and the findings and action items from accidents and other incidents. In addition, the Committee considered and discussed information relating to climate change; the Company-wide safety intervention and its outcomes; the Company’s mental health framework; HSEC public targets; and material risk reviews. A significant amount of time was also devoted to Samarco updates (in addition to establishment of the separate Board sub-committee to assist the Board in overseeing the governance of BHP Billiton’s management and response to the tragic events at Samarco) and discussions around a review of dam risks.
1 Strategic Report3
Remuneration Report
4 D
irectors’ Report 2
Governance at BH
P Billiton
112 BHP Billiton Annual Report 2016
2 Governance at BHP Billiton continued
Committee assessment An internally facilitated review was conducted during the year to confirm continued compliance with the Committee’s terms of reference. These terms were updated in FY2013 and further updated in FY2016. The Committee is satisfied that it has met its terms of reference.
The updated terms of reference for the Sustainability Committee are available online at www.bhpbilliton.com/home/aboutus/ourcompany/Pages/governance.aspx.
2.13.5 Samarco sub-committee On 17 November 2015, following the tragedy at Samarco Mineração S.A., a sub-committee of the Board was established to further consider and oversee matters relating to the failure at Samarco. During the period, the Samarco sub-committee comprised John Schubert (Chairman), Jac Nasser, Lindsay Maxsted and Malcolm Brinded. Specific matters considered by the Committee include BHP Billiton’s support of the recovery and response effort by Samarco, investigation of the cause of the dam failure and our engagement with key stakeholders.
The sub-committee met five times during FY2016 and also considered certain items out of session.
Sustainability Committee members during the year
Name Status
John Schubert (Chairman) Member for whole period
Malcolm Brinded Member for whole period
Malcolm Broomhead Member for whole period
Pat Davies Member for whole period
Sustainable development governanceOur approach to HSEC and sustainable development governance is characterised by:• the Sustainability Committee assisting the Board in its oversight
of material HSEC matters and risks across the Company;• management having primary responsibility for the design and
implementation of an effective HSEC management system;• management having accountability for HSEC performance;• the HSE and Community functions providing advice and
guidance directly to the Sustainability Committee and the Board;• the Board and management seeking input and insight
from external experts, such as the BHP Billiton Forum on Corporate Responsibility;
• clear links between remuneration and HSEC performance.
The key areas on which the Committee, management and the HSE and Community functions focus are outlined on pages 12 and 13 of the Sustainability Report.
Climate changeClimate change is treated as a Board-level governance issue, with the Sustainability Committee playing a key supporting role. The Committee spends a significant amount of time considering systemic climate change matters relating to the resilience of, and opportunities for, the Company’s portfolio. The Committee also receives reports on scenarios and sign posts, which point to longer-term directional change and considers actions to manage the implications of climate change on the Company. The work during FY2016 included updates on the Group’s integrated approach to addressing climate change (including mitigation and strategies to support REDD+), low emissions technology and the outcomes of the 21st Conference of the Parties to the United Nations Framework Convention on Climate Change held in December 2015. For more information on our climate change position and how we consider the impacts on our portfolio, refer to section 1.11.2.
Social investmentWe also continued to monitor our progress in relation to our social investment and met our target for investments in community programs, with such investments comprising cash towards community development programs and administrative costs. This was the equivalent of one per cent of our pre-tax profit, calculated on the average of the previous three years’ pre-tax profit. During FY2016, our voluntary social investment totalled US$178.7 million, comprising US$123.7 million of cash towards community development programs and administrative costs and a US$55 million contribution to the US-based charity, the BHP Billiton Foundation.
HSEC matters and remunerationIn order to link HSEC matters to remuneration, 25 per cent of the short-term incentive opportunity for OMC members was based on HSEC performance during the year. This was increased from 20 per cent in FY2015 in order to emphasise the importance placed on safety and other HSEC matters. The Sustainability Committee assists the Remuneration Committee in determining appropriate HSEC metrics to be included in OMC scorecards and also assists in relation to assessment of performance against those measures. The Board believes this method of assessment is transparent, rigorous and balanced, and provides an appropriate, objective and comprehensive assessment of performance. For more information on the metrics and their assessment, refer to the Remuneration Report in section 3.
2.13.4 Sustainability Committee Report continued
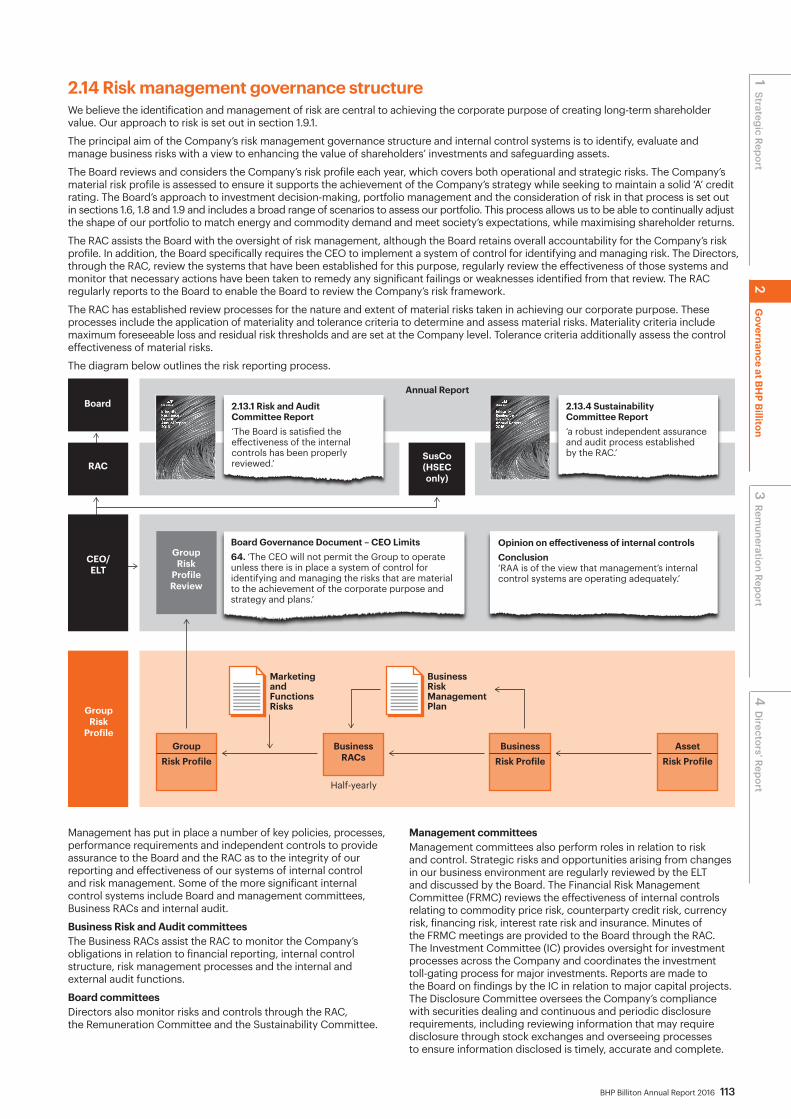
BHP Billiton Annual Report 2016 113
2.14 Risk management governance structure We believe the identification and management of risk are central to achieving the corporate purpose of creating long-term shareholder value. Our approach to risk is set out in section 1.9.1.
The principal aim of the Company’s risk management governance structure and internal control systems is to identify, evaluate and manage business risks with a view to enhancing the value of shareholders’ investments and safeguarding assets.
The Board reviews and considers the Company’s risk profile each year, which covers both operational and strategic risks. The Company’s material risk profile is assessed to ensure it supports the achievement of the Company’s strategy while seeking to maintain a solid ‘A’ credit rating. The Board’s approach to investment decision-making, portfolio management and the consideration of risk in that process is set out in sections 1.6, 1.8 and 1.9 and includes a broad range of scenarios to assess our portfolio. This process allows us to be able to continually adjust the shape of our portfolio to match energy and commodity demand and meet society’s expectations, while maximising shareholder returns.
The RAC assists the Board with the oversight of risk management, although the Board retains overall accountability for the Company’s risk profile. In addition, the Board specifically requires the CEO to implement a system of control for identifying and managing risk. The Directors, through the RAC, review the systems that have been established for this purpose, regularly review the effectiveness of those systems and monitor that necessary actions have been taken to remedy any significant failings or weaknesses identified from that review. The RAC regularly reports to the Board to enable the Board to review the Company’s risk framework.
The RAC has established review processes for the nature and extent of material risks taken in achieving our corporate purpose. These processes include the application of materiality and tolerance criteria to determine and assess material risks. Materiality criteria include maximum foreseeable loss and residual risk thresholds and are set at the Company level. Tolerance criteria additionally assess the control effectiveness of material risks.
The diagram below outlines the risk reporting process.
Management has put in place a number of key policies, processes, performance requirements and independent controls to provide assurance to the Board and the RAC as to the integrity of our reporting and effectiveness of our systems of internal control and risk management. Some of the more significant internal control systems include Board and management committees, Business RACs and internal audit.
Business Risk and Audit committeesThe Business RACs assist the RAC to monitor the Company’s obligations in relation to financial reporting, internal control structure, risk management processes and the internal and external audit functions.
Board committeesDirectors also monitor risks and controls through the RAC, the Remuneration Committee and the Sustainability Committee.
Management committeesManagement committees also perform roles in relation to risk and control. Strategic risks and opportunities arising from changes in our business environment are regularly reviewed by the ELT and discussed by the Board. The Financial Risk Management Committee (FRMC) reviews the effectiveness of internal controls relating to commodity price risk, counterparty credit risk, currency risk, financing risk, interest rate risk and insurance. Minutes of the FRMC meetings are provided to the Board through the RAC. The Investment Committee (IC) provides oversight for investment processes across the Company and coordinates the investment toll-gating process for major investments. Reports are made to the Board on findings by the IC in relation to major capital projects. The Disclosure Committee oversees the Company’s compliance with securities dealing and continuous and periodic disclosure requirements, including reviewing information that may require disclosure through stock exchanges and overseeing processes to ensure information disclosed is timely, accurate and complete.
Board 2.13.1 Risk and Audit Committee Report‘The Board is satisfied the e�ectiveness of the internal controls has been properly reviewed.’
Annual Report
RAC
CEO/ELT
Group Risk
Profile
SusCo (HSEC only)
Board Governance Document – CEO Limits64. ‘The CEO will not permit the Group to operate unless there is in place a system of control for identifying and managing the risks that are material to the achievement of the corporate purpose and strategy and plans.’
Opinion on e�ectiveness of internal controlsConclusion‘RAA is of the view that management’s internal control systems are operating adequately.’
Group Risk
Profile Review
Marketing andFunctionsRisks
Business Risk Management Plan
Group Risk Profile
2.13.4 Sustainability Committee Report‘a robust independent assurance and audit process established by the RAC.’
Business RACs
BusinessRisk Profile
Asset Risk Profile
Half-yearly
1 Strategic Report3
Remuneration Report
4 D
irectors’ Report 2
Governance at BH
P Billiton

114 BHP Billiton Annual Report 2016
2 Governance at BHP Billiton continued
2.15 ManagementBelow the level of the Board, key management decisions are made by the CEO, the OMC, the ELT, other management committees and individual members of management to whom authority has been delegated.
The diagram below describes the responsibilities of the CEO and four key management committees.
Performance evaluation for executivesThe performance of executives and other senior employees is reviewed on an annual basis. For the members of the ELT, this review includes their contribution, engagement and interaction at Board level. The annual performance review process that we employ considers the performance of executives against criteria designed to capture both ‘what’ is achieved and ‘how’ it is achieved. All performance assessments of executives consider how effective they have been in undertaking their role; what they have achieved against their specified key performance indicators; how they match up to the behaviours prescribed in our leadership model; and how those behaviours align with
Our Charter values. The assessment is therefore holistic and balances absolute achievement with the way performance has been delivered. Progression within the Company is driven equally by personal leadership behaviours and capability to produce excellent results.
A performance evaluation as outlined above was conducted for all members of the ELT during FY2016. For the CEO, the performance evaluation was led by the Chairman of the Board on behalf of all the Non-executive Directors, drawing on guidance from the Remuneration Committee.
OPERATIO
NS MANAGEMENT COMMITTEE/EXECUTIVE LEADERSHIP T
EAM
CHIEF EXECUTIVE OFFICER
COMMITTEE
INVESTMENT
MANAGEM
ENT COMMITTEE
FINANCIAL RISK COMM
ITTE
E
DISCLO
SURE
Chief Executive O�icer
• Holds delegated authority from the Board to achieve the corporate purpose. • Authority extends to all matters except those reserved for the Board’s decision. • CEO has delegated authority to management committees and individual members of
management – but CEO remains accountable to Board for all authority delegated to him.
Executive Leadership Team
• Established by the CEO, the ELT has responsibility for day-to-day management of the Company. • Purpose is to provide leadership to the Group, determining its priorities and the way
it is to operate, thereby assisting the CEO in pursuing the corporate purpose. • Is a forum to debate high-level matters important to the Group and to ensure consistent
development of the Group’s strategy.
Financial Risk Management Committee
• Purpose is to assist the CEO to monitor and oversee the management of the financial risks faced by the Group, including: • commodity price risk; • currency risk; • interest rate risk; • counterparty credit risk; • financing risk; • insurance.
Investment Committee
• Purpose is to assist the CEO in ensuring rigorous and consistent investment processes are in place and working e�ectively, so that:• investments are aligned with Group’s priorities and strategy; • key risks and opportunities are identified and managed; • shareholder value is maximised.
Disclosure Committee
• Purpose is to assist the CEO in overseeing the Group’s compliance with securities dealing and continuous and periodic disclosure requirements, including: • reviewing information that may require disclosure to stock exchanges; • overseeing disclosure processes to ensure information disclosed is timely, accurate and complete.
BHP Billiton Annual Report 2016 115
2.16 Business conduct Our Charter and our Code of Business ConductOur Charter is central to our business. It articulates the values we uphold, our strategy and how we measure success.
Our Code of Business Conduct (Code) is based on Our Charter values and describes the behaviours that we expect of those who work for or on behalf of BHP Billiton. The Code applies to employees, directors, officers and controlled entities. Consultants and contractors are also expected to act in accordance with the Code when working for BHP Billiton.
The Code describes the behaviours expected to support a safe, respectful and legally compliant working environment, when interacting with governments and the communities in which we operate, when dealing with third parties and when using Company resources.
Working with integrity is a condition of employment with BHP Billiton and in some cases a contractual obligation of many of our contractors and suppliers. All employees are required to undertake annual training in relation to the Code to promote awareness and understanding in the behaviours expected of them. Demonstration of the values described in Our Charter and the Code is part of the annual employee performance review process.
Our Code of Business Conduct is available online at www.bhpbilliton.com/home/aboutus/ourcompany/ Pages/codeofbusconduct.aspx.
EthicsPoint, BHP Billiton’s business conduct advisory serviceWhere an employee or third party has a concern regarding behaviour that may not be consistent with our Code of Business Conduct, there are reporting options available, which include BHP Billiton’s business conduct advisory service, EthicsPoint. EthicsPoint is a worldwide service available to internal and external stakeholders that facilitates the raising, management and resolution of business conduct queries and concerns via a confidential 24-hour, multilingual hotline and online case management system. Reports can be made anonymously and without fear of retaliation. Arrangements are in place to investigate all matters appropriately. Levels of activity and support processes for EthicsPoint are monitored, with activity reports presented to the Board. More information on EthicsPoint can be found in the Code of Business Conduct, available online at www.bhpbilliton.com.
Anti-corruption investigationBHP Billiton announced in May 2015 the resolution of the previously disclosed investigation by the SEC into potential breaches of the US Foreign Corrupt Practices Act (FCPA). For more information on the Investigation, refer to section 6.5.
Political donationsWe maintain a position of impartiality with respect to party politics and do not make political contributions/donations for political purposes to any political party, politician, elected official or candidate for public office. We do, however, contribute to the public debate of policy issues that may affect the Company in the countries in which we operate. As explained in the Directors’ Report, the Australian Electoral Commission (AEC) disclosure requirements are broad such that amounts that are not political donations can be reportable for AEC purposes. For example, where a political party or organisation owns shares in BHP Billiton, the AEC filing requires the political party or organisation to disclose the dividend payments received for their shareholding.
2.17 Market disclosure We are committed to maintaining the highest standards of disclosure, ensuring that all investors and potential investors have the same access to high-quality, relevant information in an accessible and timely manner to assist them in making informed decisions. The Disclosure Committee manages our compliance with market disclosure obligations and is responsible for implementing reporting processes and controls and setting guidelines for the release of information. As part of our commitment to continuous improvement, we continue to ensure alignment with best practice as it develops in the jurisdictions in which BHP Billiton is listed.
Disclosure officers have been appointed in the Company’s asset groups, Marketing and functions. These officers are responsible for identifying and providing the Disclosure Committee with referral information about the activities of the asset or functional areas using disclosure guidelines developed by the Committee. The Committee then makes the decision whether a particular piece of information is material and therefore needs to be disclosed to the market.
To safeguard the effective dissemination of information, we have developed a market disclosure and communications document, which outlines how we identify and distribute information to shareholders and market participants.
A copy of the market disclosure and communications document is available online at www.bhpbilliton.com/home/aboutus/ourcompany/Pages/governance.aspx.
Copies of announcements to the stock exchanges on which we are listed, investor briefings, Financial Statements, the Annual Report and other relevant information can be found online at www.bhpbilliton.com. Any person wishing to receive advice by email of news releases can subscribe at www.bhpbilliton.com.
2.18 Remuneration Details of our remuneration policies and practices, and the remuneration paid to the Directors (Executive and Non-executive) and members of the OMC, are set out in the Remuneration Report in section 3.
2.19 Directors’ share ownershipNon-executive Directors have agreed to apply at least 25 per cent of their fees to the purchase of BHP Billiton shares until they achieve a shareholding equivalent in value to one year’s fees. Thereafter, they must maintain at least that level of shareholding throughout their tenure. All dealings by Directors are subject to Our Requirements for Securities Dealing standard and are reported to the Board and to the stock exchanges.
Information on our policy governing the use of hedge arrangements over shares in BHP Billiton by both Directors and members of the ELT is set out in section 3.4.2.
Details of the shares held by Directors are set out in section 3.4.23.
1 Strategic Report3
Remuneration Report
4 D
irectors’ Report 2
Governance at BH
P Billiton
116 BHP Billiton Annual Report 2016
2 Governance at BHP Billiton continued
2.20 Conformance with corporate governance standardsOur compliance with the governance standards in our home jurisdictions of Australia and the United Kingdom and with the governance requirements that apply to us as a result of our New York Stock Exchange (NYSE) listing and our registration with the SEC in the United States, is summarised in this Corporate Governance Statement, the Remuneration Report, the Directors’ Report and the Financial Statements.
The Listing Rules and the Disclosure and Transparency Rules of the UK Financial Conduct Authority require companies listed in the United Kingdom to report how they have applied the Main Principles and the extent to which they have complied with the provisions of the UK Corporate Governance Code (UK Code), and explain the reasons for any non-compliance. The UK Code is available online at www.frc.org.uk/corporate/ukcgcode.cfm.
The Listing Rules of the ASX require ASX-listed companies to report on the extent to which they meet the ASX Principles and Recommendations and explain the reasons for any non-compliance. The ASX Principles and Recommendations are available online at www.asxgroup.com.au/corporate-governance-council.htm.
Both the UK Code and the ASX Principles and Recommendations require the Board to consider the application of the relevant corporate governance principles, while recognising that departures from those principles are appropriate in some circumstances. We have applied the Main Principles and complied with the provisions set out in the UK Code and with the ASX Principles and Recommendations during the financial period, with two exceptions for short periods. Following the death of Sir John Buchanan, there was no Senior Independent Director for the one month period from 14 July to 14 August 2015 when we announced Shriti Vadera had been appointed to the role. In addition, for the period from 14 July to 14 August 2015, the Nomination and Governance Committee had two members rather than the recommended three. This has since been resolved with the appointment of Shriti Vadera to that Committee.
Appendix 4G, summarising our compliance with the ASX Principles and Recommendations is available online at www.bhpbilliton.com/home/aboutus/ourcompany/Pages/governance.aspx.
BHP Billiton Limited and BHP Billiton Plc are registrants with the SEC in the United States. Both companies are classified as foreign private issuers and both have American Depositary Shares listed on the NYSE.
We have reviewed the governance requirements currently applicable to foreign private issuers under the Sarbanes-Oxley Act (US), including the rules promulgated by the SEC and the rules of the NYSE and are satisfied that we comply with those requirements.
Section 303A of the NYSE-Listed Company Manual contains a broad regime of corporate governance requirements for NYSE-listed companies. Under the NYSE rules, foreign private issuers, such as ourselves, are permitted to follow home country practice in lieu of the requirements of Section 303A, except for the rule relating to compliance with Rule 10A-3 of the 1934 Securities Exchange Act (audit committee independence) and certain notification provisions contained in Section 303A of the Listed Company Manual. Section 303A.11 of the Listed Company Manual, however, requires us to disclose any significant ways in which our corporate governance practices differ from those followed by US companies under the NYSE corporate governance standards. After a comparison of our corporate governance practices with the requirements of Section 303A of the Listed Company Manual followed by US companies, the following significant difference was identified:• Rule 10A-3 of the 1934 Securities Exchange Act requires
NYSE-listed companies to ensure that their audit committees are directly responsible for the appointment, compensation, retention and oversight of the work of the external auditor unless the company’s governing law or documents or other home country legal requirements require or permit shareholders to ultimately vote on or approve these matters. While the RAC is directly responsible for remuneration and oversight of the External Auditor, the ultimate responsibility for appointment and retention of the External Auditor rests with our shareholders, in accordance with UK law and our constitutional documents. The RAC does, however, make recommendations to the Board on these matters, which are in turn reported to shareholders.
While the Board is satisfied with its level of compliance with the governance requirements in Australia, the United Kingdom and the United States, it recognises that practices and procedures can always be improved and there is merit in continuously reviewing its own standards against those in a variety of jurisdictions. The Board’s program of review will continue throughout the year ahead.
2.21 Additional UK disclosureThe information specified in the UK Financial Conduct Authority Disclosure and Transparency Rules, DTR 7.2.6, is located elsewhere in this Annual Report. The Directors’ Report in section 4 provides cross-references to where the information is located.
This Corporate Governance Statement was approved by the Board on 8 September 2016 and signed on its behalf by:
Jac Nasser AO Chairman8 September 2016
BHP Billiton Annual Report 2016 117
Section 3 Remuneration Report
The contents of this Remuneration Report are governed by legislation in the United Kingdom and Australia. The UK Companies Act 2006 and the Large and Medium-sized Companies and Groups (Accounts and Reports) (Amendment) Regulations 2013, which are generally described as UK requirements in this Remuneration Report, require BHP Billiton to make certain disclosures regarding Directors. The Australian Corporations Act 2001, Australian Accounting Standards and IFRS also require BHP Billiton to make certain disclosures for KMP. KMP are those persons having authority and responsibility for planning, directing and controlling the activities of the Group directly or indirectly.
3.1 Annual statement by the Remuneration Committee Chairman3.2 Individuals covered by this Remuneration Report3.3 Remuneration policy report Remuneration policy for Executive Directors Remuneration policy for Non-executive Directors3.4 Annual report on remuneration Remuneration governance Remuneration outcomes for the Executive Director (the CEO) Remuneration outcomes for Non-executive Directors Remuneration for members of the OMC (other than the CEO) Other statutory disclosures
Abbreviation Item
AGM Annual General MeetingCEO Chief Executive OfficerDEP Dividend Equivalent PaymentEBIT Earnings Before Interest and TaxEBITDA Earnings Before Interest, Tax,
Depreciation and Amortisation GIS Group Incentive SchemeGMC Group Management CommitteeGSTIP Group Short-Term Incentive PlanHSEC Health, Safety, Environment and CommunityIFRS International Financial Reporting StandardsKMP Key Management PersonnelLTI Long-Term IncentiveLTIP Long-Term Incentive PlanMAP Management Award PlanMSR Minimum Shareholding RequirementOMC Operations Management CommitteeSTI Short-Term IncentiveSTIP Short-Term Incentive PlanTRIF Total Recordable Injury FrequencyTSR Total Shareholder ReturnUAP Underlying Attributable Profit
In this section
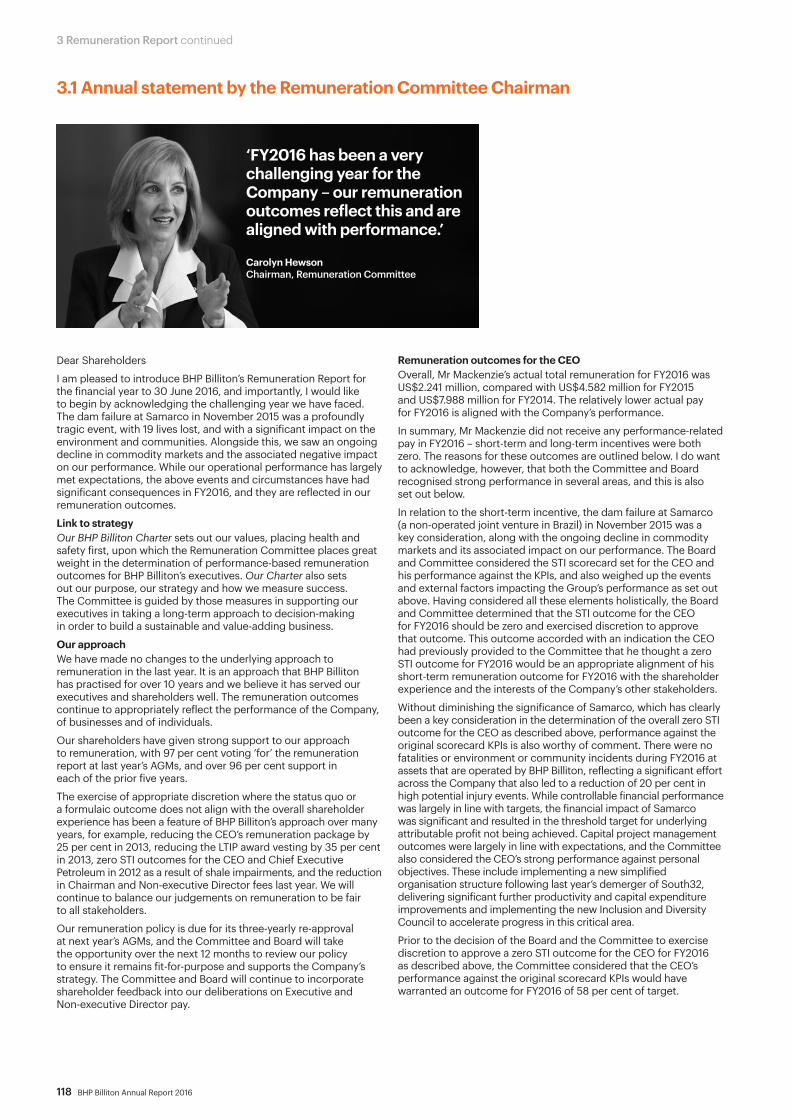
118 BHP Billiton Annual Report 2016
3 Remuneration Report continued
3.1 Annual statement by the Remuneration Committee Chairman
Dear Shareholders
I am pleased to introduce BHP Billiton’s Remuneration Report for the financial year to 30 June 2016, and importantly, I would like to begin by acknowledging the challenging year we have faced. The dam failure at Samarco in November 2015 was a profoundly tragic event, with 19 lives lost, and with a significant impact on the environment and communities. Alongside this, we saw an ongoing decline in commodity markets and the associated negative impact on our performance. While our operational performance has largely met expectations, the above events and circumstances have had significant consequences in FY2016, and they are reflected in our remuneration outcomes.
Link to strategyOur BHP Billiton Charter sets out our values, placing health and safety first, upon which the Remuneration Committee places great weight in the determination of performance-based remuneration outcomes for BHP Billiton’s executives. Our Charter also sets out our purpose, our strategy and how we measure success. The Committee is guided by those measures in supporting our executives in taking a long-term approach to decision-making in order to build a sustainable and value-adding business.
Our approach We have made no changes to the underlying approach to remuneration in the last year. It is an approach that BHP Billiton has practised for over 10 years and we believe it has served our executives and shareholders well. The remuneration outcomes continue to appropriately reflect the performance of the Company, of businesses and of individuals.
Our shareholders have given strong support to our approach to remuneration, with 97 per cent voting ‘for’ the remuneration report at last year’s AGMs, and over 96 per cent support in each of the prior five years.
The exercise of appropriate discretion where the status quo or a formulaic outcome does not align with the overall shareholder experience has been a feature of BHP Billiton’s approach over many years, for example, reducing the CEO’s remuneration package by 25 per cent in 2013, reducing the LTIP award vesting by 35 per cent in 2013, zero STI outcomes for the CEO and Chief Executive Petroleum in 2012 as a result of shale impairments, and the reduction in Chairman and Non-executive Director fees last year. We will continue to balance our judgements on remuneration to be fair to all stakeholders.
Our remuneration policy is due for its three-yearly re-approval at next year’s AGMs, and the Committee and Board will take the opportunity over the next 12 months to review our policy to ensure it remains fit-for-purpose and supports the Company’s strategy. The Committee and Board will continue to incorporate shareholder feedback into our deliberations on Executive and Non-executive Director pay.
Remuneration outcomes for the CEOOverall, Mr Mackenzie’s actual total remuneration for FY2016 was US$2.241 million, compared with US$4.582 million for FY2015 and US$7.988 million for FY2014. The relatively lower actual pay for FY2016 is aligned with the Company’s performance.
In summary, Mr Mackenzie did not receive any performance-related pay in FY2016 – short-term and long-term incentives were both zero. The reasons for these outcomes are outlined below. I do want to acknowledge, however, that both the Committee and Board recognised strong performance in several areas, and this is also set out below.
In relation to the short-term incentive, the dam failure at Samarco (a non-operated joint venture in Brazil) in November 2015 was a key consideration, along with the ongoing decline in commodity markets and its associated impact on our performance. The Board and Committee considered the STI scorecard set for the CEO and his performance against the KPIs, and also weighed up the events and external factors impacting the Group’s performance as set out above. Having considered all these elements holistically, the Board and Committee determined that the STI outcome for the CEO for FY2016 should be zero and exercised discretion to approve that outcome. This outcome accorded with an indication the CEO had previously provided to the Committee that he thought a zero STI outcome for FY2016 would be an appropriate alignment of his short-term remuneration outcome for FY2016 with the shareholder experience and the interests of the Company’s other stakeholders.
Without diminishing the significance of Samarco, which has clearly been a key consideration in the determination of the overall zero STI outcome for the CEO as described above, performance against the original scorecard KPIs is also worthy of comment. There were no fatalities or environment or community incidents during FY2016 at assets that are operated by BHP Billiton, reflecting a significant effort across the Company that also led to a reduction of 20 per cent in high potential injury events. While controllable financial performance was largely in line with targets, the financial impact of Samarco was significant and resulted in the threshold target for underlying attributable profit not being achieved. Capital project management outcomes were largely in line with expectations, and the Committee also considered the CEO’s strong performance against personal objectives. These include implementing a new simplified organisation structure following last year’s demerger of South32, delivering significant further productivity and capital expenditure improvements and implementing the new Inclusion and Diversity Council to accelerate progress in this critical area.
Prior to the decision of the Board and the Committee to exercise discretion to approve a zero STI outcome for the CEO for FY2016 as described above, the Committee considered that the CEO’s performance against the original scorecard KPIs would have warranted an outcome for FY2016 of 58 per cent of target.
‘FY2016 has been a very challenging year for the Company – our remuneration outcomes reflect this and are aligned with performance.’
Carolyn Hewson Chairman, Remuneration Committee
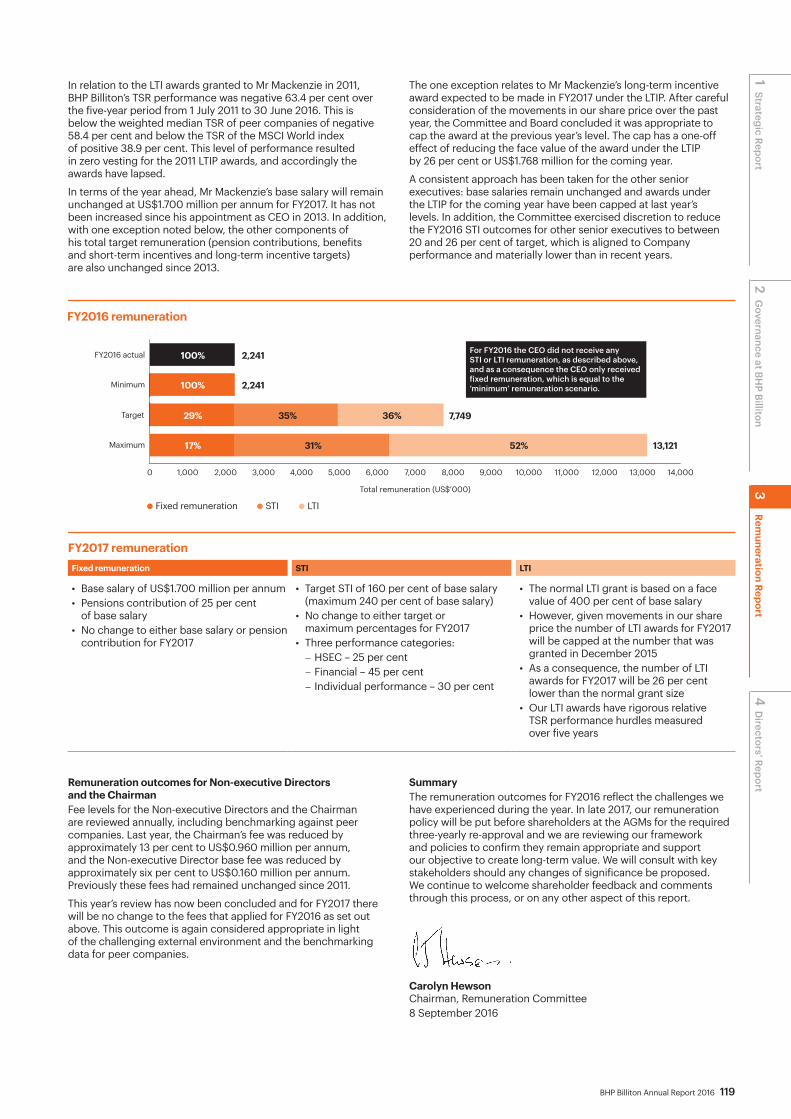
BHP Billiton Annual Report 2016 119
In relation to the LTI awards granted to Mr Mackenzie in 2011, BHP Billiton’s TSR performance was negative 63.4 per cent over the five-year period from 1 July 2011 to 30 June 2016. This is below the weighted median TSR of peer companies of negative 58.4 per cent and below the TSR of the MSCI World index of positive 38.9 per cent. This level of performance resulted in zero vesting for the 2011 LTIP awards, and accordingly the awards have lapsed.
In terms of the year ahead, Mr Mackenzie’s base salary will remain unchanged at US$1.700 million per annum for FY2017. It has not been increased since his appointment as CEO in 2013. In addition, with one exception noted below, the other components of his total target remuneration (pension contributions, benefits and short-term incentives and long-term incentive targets) are also unchanged since 2013.
The one exception relates to Mr Mackenzie’s long-term incentive award expected to be made in FY2017 under the LTIP. After careful consideration of the movements in our share price over the past year, the Committee and Board concluded it was appropriate to cap the award at the previous year’s level. The cap has a one-off effect of reducing the face value of the award under the LTIP by 26 per cent or US$1.768 million for the coming year.
A consistent approach has been taken for the other senior executives: base salaries remain unchanged and awards under the LTIP for the coming year have been capped at last year’s levels. In addition, the Committee exercised discretion to reduce the FY2016 STI outcomes for other senior executives to between 20 and 26 per cent of target, which is aligned to Company performance and materially lower than in recent years.
Remuneration outcomes for Non-executive Directors and the ChairmanFee levels for the Non-executive Directors and the Chairman are reviewed annually, including benchmarking against peer companies. Last year, the Chairman’s fee was reduced by approximately 13 per cent to US$0.960 million per annum, and the Non-executive Director base fee was reduced by approximately six per cent to US$0.160 million per annum. Previously these fees had remained unchanged since 2011.
This year’s review has now been concluded and for FY2017 there will be no change to the fees that applied for FY2016 as set out above. This outcome is again considered appropriate in light of the challenging external environment and the benchmarking data for peer companies.
SummaryThe remuneration outcomes for FY2016 reflect the challenges we have experienced during the year. In late 2017, our remuneration policy will be put before shareholders at the AGMs for the required three-yearly re-approval and we are reviewing our framework and policies to confirm they remain appropriate and support our objective to create long-term value. We will consult with key stakeholders should any changes of significance be proposed. We continue to welcome shareholder feedback and comments through this process, or on any other aspect of this report.
Carolyn Hewson Chairman, Remuneration Committee8 September 2016
Total remuneration (US$’000)
0 1,000 2,000 3,000 4,000 5,000 6,000 7,000 8,000 9,000 10,000 11,000 12,000 13,000 14,000
Minimum
Target
Maximum
Fixed remuneration STI LTI
FY2016 actual For FY2016 the CEO did not receive anySTI or LTI remuneration, as described above, and as a consequence the CEO only received fixed remuneration, which is equal to the ‘minimum’ remuneration scenario.100%
29%
2,241
100% 2,241
7,749
13,121
35% 36%
31% 52%17%
FY2016 remuneration
FY2017 remunerationFixed remuneration STI LTI
• Base salary of US$1.700 million per annum• Pensions contribution of 25 per cent
of base salary• No change to either base salary or pension
contribution for FY2017
• Target STI of 160 per cent of base salary (maximum 240 per cent of base salary)
• No change to either target or maximum percentages for FY2017
• Three performance categories: − HSEC – 25 per cent − Financial – 45 per cent − Individual performance – 30 per cent
• The normal LTI grant is based on a face value of 400 per cent of base salary
• However, given movements in our share price the number of LTI awards for FY2017 will be capped at the number that was granted in December 2015
• As a consequence, the number of LTI awards for FY2017 will be 26 per cent lower than the normal grant size
• Our LTI awards have rigorous relative TSR performance hurdles measured over five years
2 Governance at BH
P Billiton1 Strategic Report
4 D
irectors’ Report 3
Remuneration Report
120 BHP Billiton Annual Report 2016
3 Remuneration Report continued
3.2 Individuals covered by this Remuneration ReportIn this Remuneration Report, the KMP includes:• the Non-executive Directors;• the CEO and Executive Director;• up to 29 February 2016, other members of the GMC;• from 1 March 2016, other members of the OMC (which replaced the GMC).
3.2.1 Members of the OMCThe OMC makes key management decisions under the authorities that have been delegated to it by the Board. The members of the OMC on 30 June 2016 are shown in the table below.
Name Title
Andrew Mackenzie CEO and Executive Director
Peter Beaven Chief Financial Officer
Geoff Healy Chief External Affairs Officer since 4 April 2016Chief Risk and Legal Officer from 1 March 2016 to 3 April 2016Chief Legal Counsel to 29 February 2016
Mike Henry President Operations, Minerals Australia since 1 March 2016President, Coal to 29 February 2016
Daniel Malchuk President Operations, Minerals Americas since 1 March 2016President, Copper to 29 February 2016
Steve Pastor President Operations, Petroleum since 1 March 2016
Athalie Williams Chief People Officer
Section 2.2.2 for dates of appointment of OMC members.
In addition to the KMP listed above, Tony Cudmore (Chief Public Affairs Officer to 3 April 2016), Tim Cutt (President, Petroleum to 29 February 2016), Dean Dalla Valle (Chief Commercial Officer to 13 January 2016) and Jimmy Wilson (President, Iron Ore to 29 February 2016) served as KMP during FY2016 as members of the former GMC.
3.2.2 Non-executive DirectorsDetails of the Non-executive Directors who held office during FY2016 are set out below. Each Non-executive Director held office for the whole of FY2016 unless otherwise indicated.
Name Title
Jac Nasser Chairman
Malcolm Brinded Non-executive Director
Malcolm Broomhead Non-executive Director
John Buchanan Senior Independent Director to 13 July 2015
Carlos Cordeiro Non-executive Director to 19 November 2015
Pat Davies Non-executive Director
Anita Frew Non-executive Director since 15 September 2015
Carolyn Hewson Non-executive Director
Lindsay Maxsted Non-executive Director
Wayne Murdy Non-executive Director
John Schubert Non-executive Director
Shriti Vadera Senior Independent Director since 14 August 2015Non-executive Director to 13 August 2015
Section 2.2.1 for dates of appointment of Non-executive Directors.
BHP Billiton Annual Report 2016 121
3.3 Remuneration policy report BHP Billiton has an overarching remuneration policy that guides the Remuneration Committee’s decisions. Under UK legislation, shareholders have the opportunity to vote on our remuneration policy every three years with binding effect in regard to the Directors (including the CEO). Our remuneration policy was approved by shareholders at the 2014 AGMs, has not changed and is repeated below. Under Australian legislation, shareholders also have the opportunity to vote on our remuneration policy each year at the AGMs as it applies to all KMP under a non-binding advisory vote.
Contents of the remuneration policy report
3.3.1 to 3.3.8 Remuneration policy for Executive Directors
3.3.9 Remuneration policy for Non-executive Directors
Section 3.4.14 for remuneration policy for members of the OMC (other than the CEO).
Where the remuneration policy report includes cross-references to other sections of the Remuneration Report or the Annual Report, these are solely for the purposes of assisting the reader to locate related information. The referenced information is not part of the remuneration policy report.
Remuneration policy for Executive DirectorsBHP Billiton currently has a single Executive Director, being the CEO. Therefore, for simplicity, this section refers only to the CEO. This remuneration policy would, however, apply for any new Executive Director role, in the event that one were created during the life of this remuneration policy. In that case, references in this section to the CEO should be read as being to each Executive Director.
3.3.1 Overarching principlesThe Remuneration Committee recognises that remuneration has an important role to play in supporting the implementation and achievement of the Group’s strategy and our ongoing performance, aligning the activities of management to the interests of shareholders and in supporting Our BHP Billiton Charter.
Inside front cover of the Annual Report: Our Charter sets out our purpose, strategy, values and how we judge our success.
The Committee determines the appropriate remuneration for the CEO, taking into account his responsibilities, location, skills, experience and performance within the Group. In doing so, the Committee recognises that levels of remuneration should be sufficient to attract, motivate and retain a highly skilled CEO, but also that the Group should avoid paying more than is necessary for this purpose.
The key principles of our remuneration policy, which remain unchanged, are to:• support the execution of the Group’s business strategy
in accordance with a risk framework that is appropriate for the organisation;
• provide competitive rewards to attract, motivate and retain highly skilled executives willing to work around the world;
• apply demanding performance measures, including key financial and non-financial measures of performance;
• link a significant component of pay to our performance and the creation of value for our shareholders from relative outperformance;
• ensure remuneration arrangements are equitable and facilitate the deployment of people around the Group;
• limit severance payments on termination to pre-established contractual arrangements (which do not commit us to making any unjustified payments).
3.3.2 The purpose of remuneration at BHP BillitonBHP Billiton’s remuneration arrangements reinforce the achievement of our success, as set out in Our Charter, and are designed to ensure that the CEO takes a long-term approach to decision-making and to minimise activities that focus only on short-term results at the expense of longer-term business growth and success. The Remuneration Committee has considered the ways in which risk management and the long-term horizon are reflected throughout BHP Billiton’s remuneration arrangements for the CEO and all executives, and is satisfied that the approach reinforces the desired behaviours.
This is largely achieved through the Group’s approach to STI and LTI awards, which comprise a significant portion of total remuneration. The equity component of any STI award is deferred for a two-year period, and performance under the LTIP is measured over a five-year period. The actual rewards received by the CEO therefore reflect the Group’s performance and share price over an extended period.
It is the Committee’s view that this provides an appropriate focus on BHP Billiton’s sustained performance beyond the end of the initial measurement period. This approach also provides a transparent mechanism for clawback or adjustment in the event of a restatement of Group results, through changes to the vesting or non-vesting of deferred awards.
In addition, STI and LTI outcomes are not driven by a purely formulaic approach. The Committee holds discretion to determine that awards are not to be provided or vested in circumstances where it would be inappropriate or would provide unintended outcomes. The Committee has no discretion to allow vesting of equity awards when performance conditions have not been satisfied (other than in the event of death or serious injury, disability, illness that prohibits continued employment or total and permanent disablement of the CEO).
2 Governance at BH
P Billiton1 Strategic Report
4 D
irectors’ Report 3
Remuneration Report

122 BHP Billiton Annual Report 2016
3 Remuneration Report continued
3.3.3 Components of remunerationThe following table shows the components of total remuneration, the link to strategy, how each component operates, how performance is assessed and will impact remuneration, and the maximum opportunity for each component.
Remuneration component and link to strategy Operation and performance framework Maximum (1)
Base salary A competitive base salary is paid in order to attract and retain a high-quality and experienced CEO, and to provide appropriate remuneration for this important role in the Group.
• Base salary is broadly aligned with salaries for comparable roles in global companies of similar global complexity, size, reach and industry, and reflects the CEO’s responsibilities, location, skills, performance, qualifications and experience.
• Base salary is reviewed annually with effect from 1 September. Reviews are informed but not led, by benchmarking to comparable roles (as above), changes in responsibility and general economic conditions. Substantial weight is also given to the general base salary increases for employees. Base salary is not subject to separate performance conditions.
• Base salary is denominated in US dollars.• The Remuneration Committee’s discretion in respect of base salary increases applies
up to the maximum shown.
8% increase per annum (annualised), or inflation if higher in Australia.
PensionProvides a market-competitive level of post-employment benefit to attract and retain a high-quality and experienced CEO.
• Pension contributions are benchmarked to comparable roles in global companies.• Pension contributions are provided, with a choice of funding vehicles: a defined contribution
plan, an unfunded retirement savings plan, an international retirement plan or a self-managed superannuation fund. Alternatively, a cash payment may be provided in lieu.
• The Committee’s discretion in respect of pension contributions applies up to the maximum shown.
25% of base salary.
BenefitsProvides personal insurances and assistance where BHP Billiton’s structure gives rise to tax obligations across multiple jurisdictions, and a market-competitive level of benefits to attract and retain a high-quality and experienced CEO.
• Benefits may be provided as determined by the Committee. Currently, this includes such items as the costs of private family health insurance, death and disability insurance, car parking, and personal tax return preparation in the required countries where BHP Billiton has requested that the CEO relocate internationally, or where BHP Billiton’s Dual Listed Company structure requires personal tax returns in multiple jurisdictions.
• The CEO may from time-to-time be accompanied by his spouse/partner on business related travel, including for Board meetings. The costs associated with spouse/partner attendance are met by BHP Billiton. In some instances, they are deemed to be taxable benefits for the CEO. In such cases, BHP Billiton reimburses the CEO for this tax cost.
• The CEO is eligible to participate in Shareplus, which is BHP Billiton’s all-employee share purchase plan.
Section 3.4.15 for information about Shareplus and the CEO’s participation.
• The Committee’s discretion in respect of benefits applies up to the maximums shown.• A relocation allowance and assistance is provided only where a change of location
is made at BHP Billiton’s request. The Group’s mobility policies provide ‘one-off’ payments with no trailing entitlements.
Benefits as determined by the Committee but to a limit not exceeding 10% of base salary and (if applicable) a one-off taxable relocation allowance up to US$700,000.
STIThe purpose of STI is to focus the CEO’s efforts on those performance measures and outcomes that are priorities for the Group for the relevant financial year, and to motivate the CEO to strive to achieve stretch performance objectives.The performance measures for each year are chosen on the basis that they are expected to have a significant short- and long-term impact on the success of the Group.Deferral of a portion of STI awards in deferred equity over BHP Billiton shares encourages a longer-term focus aligned to that of shareholders.
Section 3.4.3 for information on MSR for the CEO.
Section 1.7 for a description of KPIs for the Group.
Setting performance measures and targets• A scorecard of measures is set at the commencement of each financial year.• The measures and their relative weightings are chosen by the Committee, in their discretion,
in order to appropriately drive overall performance for the coming year. Specified financial measures will constitute the largest weighting. The scorecard will also include measures that impact the long-term sustainability of the Group. The Sustainability Committee assists the Remuneration Committee in determining appropriate HSEC measures and weightings.
• We plan to disclose the weightings of HSEC, financial and individual measures around the beginning of each performance period.
• The target is determined for each performance measure at a level that will motivate the CEO to achieve an appropriately stretching annual performance outcome and that will contribute to the longer-term success of the Group and shareholder wealth. The target for each financial measure is derived from the annual budget as approved by the Board for the relevant financial year.
• For HSEC and for individual measures the target is ordinarily expressed in narrative form and will be disclosed near the beginning of the performance period. For reasons of commercial sensitivity, while we will provide a narrative description of financial target performance in broad terms, the actual target for each financial measure will not be disclosed in advance. However, we plan to disclose the target for each measure retrospectively. In the rare instances where this may not be prudent on grounds of commercial sensitivity, we will seek to explain why and give an indication of when the target may be disclosed.
• Should any other performance measures be added at the discretion of the Committee, we will determine the timing of disclosure of the relevant target with due consideration of commercial sensitivity.
Section 3.4.6 for details of performance measures and outcomes for FY2016.
Section 3.4.11 for details of performance measures for FY2017.
Assessment of performance• At the conclusion of the financial year, the CEO’s achievement against each measure is
assessed by the Remuneration Committee and the Board, and an STI award determined. If performance is below the Threshold level for any measure, no STI will be provided in respect of that portion of the STI opportunity.
• The Remuneration Committee is assisted by the Sustainability Committee in relation to assessment of performance against HSEC measures, and considers guidance provided by other Committees in respect of other measures.
• The Board believes this method of assessment is transparent, rigorous and balanced, and provides an appropriate, objective and comprehensive assessment of performance.
• In the event that the Remuneration Committee does not consider the level of vesting that would otherwise apply to be a true reflection of the performance of the Group or should it consider that individual performance or other circumstances makes this an inappropriate outcome, it retains the discretion to not provide all or a part of any STI award. This is an important mitigation against the risk of unintended award outcomes.
Maximum award240% of base salary (cash 120% and 120% in deferred equity).
Target performance 160% of base salary (cash 80% and 80% in deferred equity).
Threshold performance80% of base salary (cash 40% and 40% in deferred equity).
Minimum awardZero
BHP Billiton Annual Report 2016 123
Remuneration component and link to strategy Operation and performance framework Maximum (1)
STI continued Delivery of award• STI awards are provided under the STIP.• The value of any STI award is provided half in cash and half in an award of the equivalent
value of BHP Billiton equity, which is deferred for two years and may be forfeited if the CEO leaves the Group within the deferral period.
• The award of deferred equity comprises rights to receive ordinary BHP Billiton shares in the future if the CEO is still employed by BHP Billiton at the end of the deferral period (2). Before vesting (or exercise), these rights are not ordinary shares and do not carry entitlements to ordinary dividends or other shareholder rights; however, a DEP is provided on vested awards (3). The Committee has a discretion to settle STI awards in cash.
• Both cash and equity STI awards are subject to malus and clawback as described below this table.
LTIThe purpose of the LTI is to focus the CEO’s efforts on the achievement of sustainable long-term value creation and success of the Group (including appropriate management of business risks).It aligns the CEO’s reward with sustained shareholder wealth creation in excess of that of relevant comparator group(s), through the relative TSR performance condition.The provision of LTIP awards over BHP Billiton shares also encourages long-term share exposure for the CEO, and aligns the long-term interests of the CEO and shareholders.Demonstration of this alignment between the interests of the CEO and shareholders is seen through the five-year performance period of the LTI, which is consistent with the long-term nature of the resources industry.
Section 3.4.3 for information on MSR for the CEO.
Section 3.4.21 for a table of awards held under the LTIP.
Section 1.7 for a description of KPIs for the Group.
Relative TSR performance condition• The award is subject to a relative TSR performance condition, which must be achieved over
a five-year period. Full vesting under the LTIP only occurs where BHP Billiton’s relative TSR (4) significantly outperforms the TSR of the comparator group(s). The comparator group(s) and the weighting between comparator group(s) will be determined by the Committee in relation to each grant.
Section 3.4.8 for further detail on LTIP comparator group(s).
• Relative TSR has been chosen as the most appropriate measure as it allows for an objective external assessment over a sustained period on a basis that is familiar to shareholders.
Level of performance required for vesting• None of the award will vest if BHP Billiton’s TSR is below the Peer Group TSR (being the
weighted median TSR(6) where the comparator group is a specified group of peer companies) and/or below Index TSR (being the index value where the comparator group is a market index such as the MSCI World index).
• For each award, the Committee will determine the level of relative TSR outperformance required on a per annum basis or on a compounded basis over the five-year period, against the peer group and/or market index in order for the whole of the LTI award to vest.
Section 3.4.8 for details of the outperformance required for recent grants.
• 25% of the award will vest if BHP Billiton’s TSR is equal to the Peer Group TSR and/or Index TSR (as applicable), and vesting occurs on a sliding scale between that point and the point of full vesting.
• There is no retesting if the performance condition is not met. In the event that the Committee does not consider the level of vesting that would otherwise apply based on the Group’s achievement of the relative TSR performance condition to be a true reflection of the underlying performance of the Group, or should it consider that individual performance or other circumstances makes this an inappropriate outcome, it retains the discretion to lapse any portion or all of the award. This is an important mitigation against the risk of unintended vesting outcomes.
• To ensure that the LTI performance conditions continue to support operational excellence, risk management and the execution of the Group’s strategy, the Committee retains discretion to add further performance measures to supplement the existing relative TSR performance condition. Prior to doing so, consultation would be undertaken with key stakeholders. Should this be the case, the vesting of a portion of any LTI award may instead be linked to performance against the new measure(s). The Committee expects that in the event of introducing an additional performance measure(s), the weighting on relative TSR would remain the majority weighting.
Delivery of award• LTI awards are provided under the LTIP approved by shareholders at the 2013 AGMs.
When considering the value of the award to be provided, the Committee primarily considers the face value of the award, and also considers its fair value which includes consideration of the performance conditions.(7)
• The award of deferred equity comprises rights to receive ordinary BHP Billiton shares in the future if the performance and service conditions are met. (2) Before vesting (or exercise), these rights are not ordinary shares and do not carry entitlements to ordinary dividends or other shareholder rights; however, a DEP is provided on vested awards. (3) The Committee has a discretion to settle LTI awards in cash.
• LTI awards are subject to malus and clawback as described below this table.
Normal Maximum AwardFace value of 400% of base salary.
Exceptional Maximum Award (5) Face value of 488% of base salary.
Section 3.3.5 for how the remuneration policy considers other employees.
(1) UK regulations require the disclosure of the maximum that may be paid in respect of each remuneration component. Where that is expressed as a maximum annual percentage increase which is annualised it should not be interpreted that it is the Company’s current intention to award an increase of that size in total in any one year, or in each year, and instead it is a maximum required to be disclosed under the regulations.
(2) The award may be retained if the CEO has left the Group in certain circumstances.
Section 3.3.8 for payments on loss of office.
(3) A DEP is provided when the award vests (or is exercised). The CEO will receive the value of dividends that would have been payable on ordinary BHP Billiton shares over the period from grant to vest (or exercise). The Committee intends that DEP will be provided in the form of shares, although the plan accommodates a cash equivalent. A DEP is not provided in relation to any STI and LTI awards that are forfeited or lapse.
(4) BHP Billiton’s TSR is a weighted average of the TSRs of BHP Billiton Limited and BHP Billiton Plc.(5) The maximum award permitted with the LTIP rules (as approved by shareholders at the 2013 AGMs) is expressed as a fair value equal to 200 per cent of base salary.
A fair value takes into account the probability of meeting the performance condition and other factors. The current plan design produces a fair value of 41 per cent of face value. The maximum fair value of 200 per cent of base salary is therefore currently equivalent to a face value of 488 per cent of base salary (488% x 41% = 200%). This is shown as the Exceptional Maximum Award in the table. However, it is current policy to provide a maximum award of 400 per cent of base salary, which is therefore shown in the table as the Normal Maximum Award. In any case, all LTI awards to the CEO will only be provided with prior approval by shareholders in the relevant AGMs.
(6) The weighted median TSR means the median outcome when the companies are listed by their TSR, after weighting by market capitalisation. (7) The fair value is calculated by the Committee’s independent adviser. It reflects outcomes weighted by probability, taking into account the difficulty of achieving
the performance conditions and the correlation between these and share price appreciation, together with other factors, including volatility and forfeiture risks. The fair value for the current plan design (current comparator groups, outperformance percentage, etc.) is 41 per cent of the face value of an award. This fair value of 41 per cent may change should the Committee vary elements (such as adding a performance measure or altering the level of relative TSR outperformance) not specified in this remuneration policy report. This fair value is different from the fair value used for IFRS disclosures elsewhere in this report. In particular, the IFRS fair value does not take into account forfeiture conditions on the awards.
3.3.3 Components of remuneration continued
2 Governance at BH
P Billiton1 Strategic Report
4 D
irectors’ Report 3
Remuneration Report
124 BHP Billiton Annual Report 2016
3 Remuneration Report continued
3.3.3 Components of remuneration continuedMalus and clawbackThe STIP and LTIP provisions allow the Committee to reduce or clawback awards in the following circumstances:• the participant acting fraudulently or dishonestly or being in material breach of their obligations to the Group;• where BHP Billiton becomes aware of a material misstatement or omission in the financial statements of a Group company
or the Group; or• any circumstances occur that the Committee determines in good faith to have resulted in an unfair benefit to the participant.
These malus and clawback provisions apply whether or not awards are made in the form of cash or equity and whether or not the equity has vested.
Legacy incentive plans under which awards may vestThe remuneration policy approved by shareholders is required to cover awards that were granted under legacy plans and that may vest in the future on their existing terms. Key terms are shown in the table below.
Remuneration component and link to strategy Operation and performance framework
Maximum value on vesting
LTI under the former LTIPThe former LTIP was replaced by the new LTIP (described in the previous table) from FY2014. Awards were provided for the same purpose as the new LTIP.
• The terms of LTI awards provided under the former LTIP were similar to those provided under the new LTIP as described in the previous table, including the performance conditions.
• Awards provided to the CEO in December 2011 did not vest in FY2016, as the performance condition was not met, and lapsed. Awards provided to the CEO in December 2012 are due to vest in FY2018 to the extent that the performance conditions are met.
Section 3.4.7 for details of the 2011 LTIP performance outcomes.
Section 3.4.21 for a table of awards still held under the former LTIP.
The face value of the awards on vesting plus the value of any associated DEP.
3.3.4 Approach to recruitment and promotion remunerationThe ongoing remuneration arrangements for a newly recruited or promoted CEO, or for another Executive Director should one be appointed, will reflect the remuneration policy as set out in this report. The ongoing components will therefore comprise base salary, pension contributions, benefits, STI and LTI.
A market competitive level of base salary, benefits and pension contributions will be provided to a newly recruited or promoted CEO, or another Executive Director. The same maximum STI and LTI apply as per the remuneration policy for the current CEO. The combined maximum level of STI and LTI that may be provided is 728 per cent of base salary, which is the combination of the maximum 240 per cent of base salary in STI and the exceptional maximum 488 per cent of base salary in LTI as per the remuneration policy for the CEO.
For external appointments, the Remuneration Committee may determine that it is appropriate to provide additional cash and/or equity components to replace any remuneration forfeited from a former employer. It is anticipated that any foregone equity awards would be replaced by equity. The value of the replacement remuneration would not be any greater than the fair value of the awards forgone (as determined by the Committee’s independent adviser). The Committee would determine appropriate service conditions and performance conditions within BHP Billiton’s framework, taking into account the conditions attached to the forgone award. The Committee is mindful of limiting such payments and not providing any more compensation than is necessary.
For any internal CEO (or another Executive Director) appointments, any entitlements provided under former arrangements will be honoured according to their existing terms.
3.3.5 Consideration of employment conditions elsewhere in the Group When setting remuneration for the CEO, the Remuneration Committee considers the prevailing market conditions, the competitive environment and the positioning and relativities of pay and employment conditions across the wider BHP Billiton workforce.
The Committee is briefed regularly about the pay and conditions of the wider employee population and takes into account the annual base salary increases for our employee population when determining any change in the CEO’s base salary. Salary increases in Australia, where the CEO is located, are particularly relevant, as they reflect the local economic conditions.
The principles that underpin the remuneration policy for the CEO are the same as those that apply to other employees, although the CEO’s arrangements have a greater emphasis on performance-related pay and a higher proportion of the CEO’s total remuneration is variable in the form of STI and LTI. Like those for the CEO, the performance measures used to determine STI outcomes for all employees are linked to achievement of the Group’s strategy and behaviours aligned to the values in Our Charter.
Although BHP Billiton does not consult directly with employees on Directors’ remuneration, the Group conducts regular employee engagement surveys, which give employees an opportunity to provide feedback on remuneration matters. Many employees are ordinary shareholders and have the opportunity to vote on AGM resolutions. In FY2016, more than 15,300 employees were enrolled to purchase BHP Billiton shares under Shareplus, our all-employee share plan.
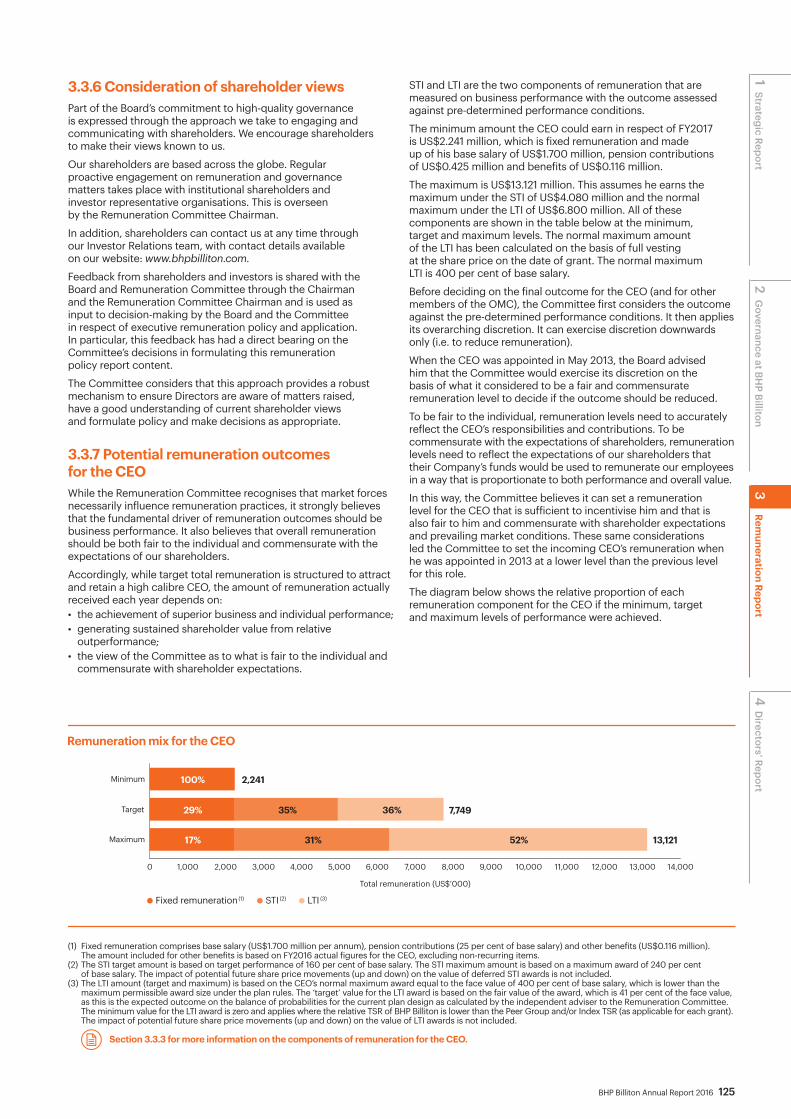
BHP Billiton Annual Report 2016 125
3.3.6 Consideration of shareholder viewsPart of the Board’s commitment to high-quality governance is expressed through the approach we take to engaging and communicating with shareholders. We encourage shareholders to make their views known to us.
Our shareholders are based across the globe. Regular proactive engagement on remuneration and governance matters takes place with institutional shareholders and investor representative organisations. This is overseen by the Remuneration Committee Chairman.
In addition, shareholders can contact us at any time through our Investor Relations team, with contact details available on our website: www.bhpbilliton.com.
Feedback from shareholders and investors is shared with the Board and Remuneration Committee through the Chairman and the Remuneration Committee Chairman and is used as input to decision-making by the Board and the Committee in respect of executive remuneration policy and application. In particular, this feedback has had a direct bearing on the Committee’s decisions in formulating this remuneration policy report content.
The Committee considers that this approach provides a robust mechanism to ensure Directors are aware of matters raised, have a good understanding of current shareholder views and formulate policy and make decisions as appropriate.
3.3.7 Potential remuneration outcomes for the CEOWhile the Remuneration Committee recognises that market forces necessarily influence remuneration practices, it strongly believes that the fundamental driver of remuneration outcomes should be business performance. It also believes that overall remuneration should be both fair to the individual and commensurate with the expectations of our shareholders.
Accordingly, while target total remuneration is structured to attract and retain a high calibre CEO, the amount of remuneration actually received each year depends on:• the achievement of superior business and individual performance;• generating sustained shareholder value from relative
outperformance;• the view of the Committee as to what is fair to the individual and
commensurate with shareholder expectations.
STI and LTI are the two components of remuneration that are measured on business performance with the outcome assessed against pre-determined performance conditions.
The minimum amount the CEO could earn in respect of FY2017 is US$2.241 million, which is fixed remuneration and made up of his base salary of US$1.700 million, pension contributions of US$0.425 million and benefits of US$0.116 million.
The maximum is US$13.121 million. This assumes he earns the maximum under the STI of US$4.080 million and the normal maximum under the LTI of US$6.800 million. All of these components are shown in the table below at the minimum, target and maximum levels. The normal maximum amount of the LTI has been calculated on the basis of full vesting at the share price on the date of grant. The normal maximum LTI is 400 per cent of base salary.
Before deciding on the final outcome for the CEO (and for other members of the OMC), the Committee first considers the outcome against the pre-determined performance conditions. It then applies its overarching discretion. It can exercise discretion downwards only (i.e. to reduce remuneration).
When the CEO was appointed in May 2013, the Board advised him that the Committee would exercise its discretion on the basis of what it considered to be a fair and commensurate remuneration level to decide if the outcome should be reduced.
To be fair to the individual, remuneration levels need to accurately reflect the CEO’s responsibilities and contributions. To be commensurate with the expectations of shareholders, remuneration levels need to reflect the expectations of our shareholders that their Company’s funds would be used to remunerate our employees in a way that is proportionate to both performance and overall value.
In this way, the Committee believes it can set a remuneration level for the CEO that is sufficient to incentivise him and that is also fair to him and commensurate with shareholder expectations and prevailing market conditions. These same considerations led the Committee to set the incoming CEO’s remuneration when he was appointed in 2013 at a lower level than the previous level for this role.
The diagram below shows the relative proportion of each remuneration component for the CEO if the minimum, target and maximum levels of performance were achieved.
Total remuneration (US$’000)
0 1,000 2,000 3,000 4,000 5,000 6,000 7,000 8,000 9,000 10,000 11,000 12,000 13,000 14,000
Minimum
Target
Maximum
Fixed remuneration(1) STI (2) LTI (3)
100%
29%
2,241
7,749
13,121
35% 36%
31% 52%17%
Remuneration mix for the CEO
(1) Fixed remuneration comprises base salary (US$1.700 million per annum), pension contributions (25 per cent of base salary) and other benefits (US$0.116 million). The amount included for other benefits is based on FY2016 actual figures for the CEO, excluding non-recurring items.
(2) The STI target amount is based on target performance of 160 per cent of base salary. The STI maximum amount is based on a maximum award of 240 per cent of base salary. The impact of potential future share price movements (up and down) on the value of deferred STI awards is not included.
(3) The LTI amount (target and maximum) is based on the CEO’s normal maximum award equal to the face value of 400 per cent of base salary, which is lower than the maximum permissible award size under the plan rules. The ‘target’ value for the LTI award is based on the fair value of the award, which is 41 per cent of the face value, as this is the expected outcome on the balance of probabilities for the current plan design as calculated by the independent adviser to the Remuneration Committee. The minimum value for the LTI award is zero and applies where the relative TSR of BHP Billiton is lower than the Peer Group and/or Index TSR (as applicable for each grant). The impact of potential future share price movements (up and down) on the value of LTI awards is not included.
Section 3.3.3 for more information on the components of remuneration for the CEO.
2 Governance at BH
P Billiton1 Strategic Report
4 D
irectors’ Report 3
Remuneration Report

126 BHP Billiton Annual Report 2016
3 Remuneration Report continued
3.3.8 Service contracts and policy on loss of officeThe terms of employment for the CEO are formalised in his employment contract. Key terms of the current contract and relevant payments on loss of office are shown below. If a new CEO or another Executive Director was appointed, similar contractual terms would apply other than where the Remuneration Committee determines that different terms should apply for reasons specific to the individual.
The CEO’s contract has no fixed term. It can be terminated by BHP Billiton on 12 months’ notice. BHP Billiton can terminate the contract immediately by paying base salary plus pension contributions for the notice period. The CEO must give six months’ notice for voluntary resignation. The table below sets out the basis on which payments on loss of office may be made.
Leaving reason (1) (2)
Voluntary resignation Termination for causeDeath, serious injury, disability or illness (3)
Cessation of employment with the agreement of the Board (4)
Base salary • Base salary for the notice period will be paid as a lump sum or progressively over the notice period.
• No payment will be made. • Base salary will be paid for a period of up to four months, after which time employment may cease.
• Base salary for the notice period will be paid as a lump sum or progressively over the notice period.
Pension • Pension contributions for the notice period will be paid as a lump sum or progressively over the notice period.
• No pension contributions will be provided from the date of termination.
• Pension contributions will be paid for a period of up to four months, after which time employment may cease.
• Pension contributions for the notice period will be paid as a lump sum or progressively over the notice period.
Benefits • Applicable benefits may continue to be provided during the notice period.
• Accumulated annual leave entitlements and any statutory payments will also be paid.
• Applicable expenses may be paid for repatriation to the home location where a relocation has been requested by BHP Billiton.
• Unvested Shareplus Matched Shares will lapse.
• No benefits will be provided.• Accumulated annual leave
entitlements and any statutory payments will be paid.
• Applicable expenses may be paid for repatriation to the home location where a relocation has been requested by BHP Billiton.
• Unvested Shareplus Matched Shares will lapse.
• Applicable benefits may continue to be provided during the notice period.
• Accumulated annual leave entitlements and any statutory payments will also be paid.
• Applicable expenses may be paid for repatriation to the home location where a relocation has been requested by BHP Billiton.
• Unvested Shareplus Matched Shares will vest in full.
• Applicable benefits may continue to be provided for the relevant year in which employment ceases.
• Accumulated annual leave entitlements and any statutory payments will also be paid.
• Applicable expenses may be paid for repatriation to the home location where a relocation has been requested by BHP Billiton.
• Unvested Shareplus Matched Shares will vest in full.
STIWhere CEO leaves during the financial year or after the end of the financial year, but before an award is provided.
• No STI will be paid. • No STI will be paid. • The Committee may determine in its discretion to pay an amount in respect of the participant’s performance for that year.
• The Committee may determine in its discretion to pay an amount in respect of the participant’s performance for that year.
Unvested STIP equity. • Will lapse. • Will lapse. • Will vest in full. • Will continue to be held on the existing terms for the scheduled deferral period before vesting (subject to a Committee discretion to lapse some or all of the award).
• The awards remain subject to malus and clawback.
Vested but unexercised STIP equity.
• Will remain exercisable for the rest of the exercise period unless the Committee determines they will lapse.
• Will remain exercisable for the rest of the exercise period unless the Committee determines they will lapse.
• Will remain exercisable for the rest of the exercise period.
• Will remain exercisable for the rest of the exercise period or for a reduced exercise period unless the Committee determines they will lapse.
Unvested GIS equity. • Will lapse. • Will lapse. • Will vest in full. • Will vest in full, except in the case of a leaving reason not specified in the plan rules, in which case the Committee has discretion to determine the treatment of equity awards.
Vested GIS Options (with a market-based exercise price) previously provided to the CEO – if still held on leaving.
• Will be retained for the scheduled exercise period and on the existing terms.
• Will lapse. • Will be retained for the scheduled exercise period and on the existing terms.
• Will be retained for the scheduled exercise period and on the existing terms.
LTIUnvested awards. • Will lapse. • Will lapse. • Will vest in full. • A pro rata portion of unvested
awards (based on the proportion of the performance period served) will continue to be held subject to the LTIP rules and terms of grant. The balance will lapse.
• The awards remain subject to malus and clawback.
Vested but unexercised awards.
• Will remain exercisable for the rest of the exercise period unless the Committee determines they will lapse.
• Will remain exercisable for the rest of the exercise period unless the Committee determines they will lapse.
• Will remain exercisable for the rest of the exercise period.
• Will remain exercisable for the rest of the exercise period or for a reduced exercise period unless the Committee determines they will lapse.
(1) If the Committee considers it to be necessary, BHP Billiton may enter into agreements with a CEO which may include the settlement of liabilities in return for payment(s), including reimbursement of legal fees subject to appropriate conditions; or to enter into new arrangements with the departing CEO (for example, entering into consultancy arrangements).
(2) In the event of a change in control event (e.g. takeover, compromise or arrangement, winding up of the Company) as defined in the STIP and LTIP rules:• base salary, pension contributions and benefits will be paid until the date of the change of control event;• the Committee may determine that a cash payment be made in respect of performance during the current financial year and all unvested STI equity awards would
vest in full;• the Committee may determine that unvested LTI awards will either vest to the extent that the Committee determines appropriate (with reference to performance
against the performance condition up to the date of the change of control event and expectations regarding future performance) or that the awards be lapsed if the Committee determines that the holders will participate in an acceptable alternative employee equity plan as a term of the change of control event.
(3) Defined as occurring when a participant leaves BHP Billiton due to death, serious injury, disability or illness that prohibits continued employment or total and permanent disablement.
(4) Defined as occurring when a participant leaves BHP Billiton due to forced early retirement, retrenchment or redundancy, termination by mutual agreement or retirement with the agreement of the Company or such other circumstances that do not constitute resignation or termination for cause.

BHP Billiton Annual Report 2016 127
Remuneration policy for Non-executive DirectorsOur Non-executive Directors are paid in compliance with the UK Corporate Governance Code (2012) and the ASX Corporate Governance Council’s Principles and Recommendations (3rd Edition).
3.3.9 Components of remuneration The following table shows the components of total remuneration for Non-executive Directors, the link to strategy, how each component operates and how performance is assessed and will impact remuneration and the maximum opportunity for each component.
Remuneration component and link to strategy Operation and performance framework Maximum (1)
FeesCompetitive base fees are paid in order to attract and retain high-quality individuals and to provide appropriate remuneration for the role undertaken.Committee fees are provided to recognise the additional responsibilities, time and commitment required.
• The Chairman is paid a single fee for all responsibilities.• Non-executive Directors are paid a base fee and relevant committee
membership fees.• Committee Chairmen and the Senior Independent Director are paid an
additional fee to reflect their extra responsibilities.• All fee levels are reviewed annually and any changes are effective from 1 July. • Fees are set at a competitive level with advice on benchmark fees in
equivalent size companies provided by external advisers. Fee levels reflect the size and complexity of the Group, the multi-jurisdictional environment arising from the Dual Listed Company structure, the multiple stock exchange listings and the extent of the geographic regions in which the Group operates. The economic environment and the financial performance of the Group are taken into account. Consideration is also given to salary reviews across the rest of the Group.
Section 3.4.13 for current fee levels provided to Non-executive Directors.
8% increase per annum (annualised) or inflation if higher in the location in which duties are primarily performed on a per fee basis.
PensionAs required by law.
• Pension contributions provided on fees only where required by law. As required by law.
BenefitsTravel allowancesCompetitive benefits are paid in order to attract and retain high-quality individuals and adequately compensate for the considerable travel burden.
• Non-executive Directors receive travel allowances on a per-trip basis reflecting the considerable travel burden imposed on members of the Board as a consequence of the Dual Listed Company structure and the resulting Board meetings in Australia and the UK, along with site visits at our multiple geographic locations.
8% increase per annum (annualised) or inflation if higher in the location in which duties are primarily performed on a per-trip basis.
Other benefitsCompetitive benefits are paid in order to attract and retain high-quality individuals and to provide appropriate remuneration for the role undertaken.
• As a consequence of the Dual Listed Company structure, Non-executive Directors are required to prepare personal tax returns in both Australia and the UK, regardless of whether they reside in one or neither of those countries. They are accordingly reimbursed for the costs of personal tax return preparation in whichever of the UK and/or Australia is not their place of residence (including payment of the tax cost associated with the provision of the benefit).
• Non-executive Directors may from time to time be accompanied by their spouse/partner to business meetings. The costs associated with spouse/partner attendance at one business meeting per annum are met by BHP Billiton and, in some instances, they are deemed to be taxable benefits for the Non-executive Director. In such cases BHP Billiton reimburses the Non-executive Director for this tax cost.
Up to a limit not exceeding 20% of fees.
STI and LTI • Non-executive Directors are not eligible to participate in any STI or LTI arrangements.
Payments on early termination • There are no provisions in any of the Non-executive Directors’ appointment arrangements for compensation payable on early termination of their directorship.
(1) UK regulations require the disclosure of the maximum that may be paid in respect of each remuneration component. Where that is expressed as a maximum annual percentage increase which is annualised, it should not be interpreted that it is the Company’s current intention to award an increase of that size in total in any one year, or in each year, and instead it is a maximum required to be disclosed under the regulations.
Approach to recruitment remunerationThe ongoing remuneration arrangements for a newly recruited Non-executive Director will reflect the remuneration policy in place for other Non-executive Directors, as above. The components will therefore comprise fees, pension contributions where required by law and benefits as set out in the table above. No variable remuneration (STI and LTI) will be provided to newly recruited Non-executive Directors.
Letters of appointment and policy on loss of officeThe standard letter of appointment for Non-executive Directors is available on our website. The Board has adopted a policy consistent with the UK Corporate Governance Code under which all Non-executive Directors must seek re-election by shareholders annually if they wish to remain on the Board. As such no Non-executive Directors seeking re-election have an unexpired term in their letter of appointment.
A Non-executive Director may resign on reasonable notice. No payments are made to Non-executive Directors on loss of office. A legacy arrangement provides accrued retirement benefits under the now closed Retirement Plan of BHP Billiton Limited and this will continue to be honoured.
Section 3.4.26 for retirement disclosures for the Non-executive Directors.
Considerations when setting Non-executive Director remunerationWhen Non-executive Director remuneration is determined, the same considerations in respect of employment conditions elsewhere in the Group and shareholder views as described in relation to setting remuneration for the CEO are taken into account.
Section 3.3.5 for consideration of employment conditions elsewhere in the Group.
Section 3.3.6 for consideration of shareholder views.
2 Governance at BH
P Billiton1 Strategic Report
4 D
irectors’ Report 3
Remuneration Report

128 BHP Billiton Annual Report 2016
3 Remuneration Report continued
3.4 Annual report on remunerationThis section of the Report shows the impact of the remuneration policy in FY2016 and how remuneration outcomes are linked to actual performance outcomes. It is divided as follows.
Contents of the annual report on remuneration
3.4.1 to 3.4.4 Remuneration governance
3.4.5 to 3.4.11 Remuneration outcomes for the Executive Director (the CEO)
3.4.12 to 3.4.13 Remuneration outcomes for Non-executive Directors
3.4.14 to 3.4.19 Remuneration for members of the OMC (other than the CEO)
3.4.20 to 3.4.27 Other statutory disclosures
Remuneration governance
3.4.1 Board oversight and the Remuneration CommitteeThe Board is responsible for ensuring that the Group’s remuneration arrangements are equitable and aligned with the long-term interests of BHP Billiton and its shareholders. In performing this function, it is critical that the Board is independent of management when making decisions affecting remuneration of the CEO, other members of the OMC and the Group’s employees.
The Board has therefore established a Remuneration Committee to assist it in making such decisions. The Committee is comprised solely of Non-executive Directors all of whom are independent. To ensure that it is fully informed, the Committee regularly invites members of management to attend meetings to provide reports and updates. The Committee can draw on services from a range of external sources, including remuneration consultants.
Remuneration CommitteeThe activities of the Remuneration Committee are governed by Terms of Reference (most recently approved by the Board in June 2016), which are available on our website. The role of the Remuneration Committee is to assist the Board in overseeing: • the remuneration policy and its specific application to the
CEO and other members of the OMC and its general application to all employees;
• the adoption of annual and longer-term incentive plans;• the determination of levels of reward for the CEO and approval
of reward to the OMC;• the annual evaluation of the performance of the CEO,
by giving guidance to the Company Chairman;• the preparation of the Remuneration Report for inclusion
in the Annual Report;• compliance with applicable legal and regulatory requirements
associated with remuneration matters;• the review, at least annually, of remuneration by gender.
The use of remuneration consultantsThe Committee seeks and considers advice from independent remuneration advisers where appropriate. Remuneration consultants are engaged by and report directly to the Committee. Potential conflicts of interest are taken into account when remuneration consultants are selected and their terms of engagement regulate their level of access to and require their independence from BHP Billiton’s management. The advice and recommendations of external advisers are used as a guide, but do not serve as a substitute for thorough consideration of the issues by each Director.
Kepler Associates was previously appointed by the Committee to act as an independent remuneration adviser to provide specialist remuneration advice. Kepler Associates did not provide other services to the Group. Kepler Associates’ parent Mercer, a member of the MMC Group of companies, currently provides human resources services to the Group. Kepler Associates is a member of the UK Remuneration Consultants Group and adheres to its Code of Conduct.
During the year, the Committee conducted a tender process to review and determine its independent remuneration adviser. PricewaterhouseCoopers was successful and was appointed as an independent remuneration adviser from 16 March 2016. Kepler Associates ceased being an independent remuneration adviser to the Committee with effect from 22 February 2016.
PricewaterhouseCoopers is also a member of the UK Remuneration Consultants Group and adheres to its Code of Conduct. The PricewaterhouseCoopers team that advises the Remuneration Committee does not provide any other services to the Group. Other parts of PricewaterhouseCoopers provide services to the Group in the areas of forensic and general technology, internal audit and international assignment solutions. Although PricewaterhouseCoopers provides other services to the Group, processes and arrangements are in place to protect independence (for example, ring-fencing of teams) and to manage any conflicts of interest that may arise.
Remuneration Committee members
Carolyn Hewson (Chairman)Malcolm Brinded (from 13 April 2016)John Buchanan (to 13 July 2015)Carlos Cordeiro (to 19 November 2015)Pat DaviesShriti Vadera
Number of meetings in FY2016
Five
Other Directors and employees who regularly attended meetings (1)
Jac Nasser (Chairman)Andrew Mackenzie (CEO)Athalie Williams (Chief People Officer)Andrew Fitzgerald (Vice President, Reward)Margaret Taylor (Group Company Secretary)Geof Stapledon (Vice President, Governance)
(1) These individuals were not present when matters associated with their own remuneration were considered.
Section 2.13.2 for further information regarding the Committee.

BHP Billiton Annual Report 2016 129
3.4.1 Board oversight and the Remuneration Committee continuedDuring the year, Kepler Associates and PricewaterhouseCoopers provided advice and assistance to the Committee on a wide range of matters, including: • advice in regard to remuneration arrangements for the
CEO and other members of the OMC (although only Kepler Associates provided ‘remuneration recommendations’ (as defined in the Australian Corporations Act 2001) to the Committee during FY2016);
• review of the sector peer group;• benchmarking of pay of senior executives against comparable
roles at a range of relevant comparator groups; • provision of information and commentary on global trends
in executive remuneration;• calculation of fair values for accounting and remuneration
setting purposes of equity awards and performance analysis for LTI awards;
• advice on Remuneration Report disclosures; • review of and commentary on management proposals;• other ad-hoc support and advice as requested by the Committee.
Kepler Associates and PricewaterhouseCoopers were the only remuneration consultants appointed by the Committee.
Management also appoints external firms from time to time to assist with remuneration benchmarking, data provision and the like. While other external firms did provide certain information to management to assist them in deliberations, only Kepler Associates provided remuneration recommendations during the year in relation to KMP.
Remuneration recommendationsAs part of its role, Kepler Associates provided ‘remuneration recommendations’ (as defined in the Australian Corporations Act 2001) to the Committee during the year. Each time Kepler Associates provided a remuneration recommendation, it provided a declaration that the remuneration recommendation was made free from undue influence by the individual to whom the recommendation relates. The Board considered the processes outlined above, the constraints incorporated into Kepler Associates’ terms of engagement, the implementation of a comprehensive protocol for the engagement of remuneration advisers and the receipt of the declaration of no undue influence. It is satisfied that the remuneration recommendations received from Kepler Associates were made free from undue influence by any member of the KMP to whom the recommendations related.
Total fees paid to Kepler Associates for the period from 1 July 2015 to 22 February 2016 were £45,950, of which £10,700 was for attendance at Committee meetings and commentary on management proposals and a total of £35,250 for the provision of remuneration recommendations (including related technical advice and support on executive remuneration). Total fees paid to the MMC Group of companies, of which Kepler Associates is a member, for the period from 1 July 2015 to 22 February 2016 were US$3.3 million. Total fees paid to PricewaterhouseCoopers for the period from 16 March 2016 to 30 June 2016 were £136,000 for attendance at Committee meetings, commentary on management proposals and related technical advice and support on executive remuneration. The majority of work performed by the independent adviser takes place in the last quarter of the financial year in respect of year-end procedures.
3.4.2 Prohibition on hedging of BHP Billiton shares and equity instruments The CEO and other members of the OMC are not allowed to protect the value of any unvested BHP Billiton equity awards allocated to them under employee programs or the value of shares and securities held as part of meeting BHP Billiton’s MSR as described below. The policy also prohibits OMC members from using unvested BHP Billiton equity awards as collateral in any financial transaction, including hedging and margin loan arrangements.
Any securities that have vested and are no longer subject to restrictions or performance conditions may be subject to hedging arrangements or used as collateral, provided that consent is obtained from BHP Billiton in advance of the employee entering into the arrangement. BHP Billiton treats compliance with this policy as a serious issue and takes appropriate measures to ensure that the policy is adhered to.
3.4.3 Share ownership guidelines and the MSRThe share ownership guidelines and the MSR help to ensure that the interests of Directors, executives and shareholders remain aligned.
The value of equity awards and any other securities for the purposes of the MSR is the market value of the underlying shares. Unvested employee equity awards do not qualify and neither do any options with a market-based exercise price.
The CEO and other members of the OMC are expected to grow their holdings to the MSR from the scheduled vesting of their employee awards over time. Under the policy, employees are not required to meet the holding requirement before awards are allocated to them. Rather, the MSR is tested at the time that shares are to be sold. The OMC members are entitled to sell sufficient shares to satisfy tax obligations arising from the granting, holding, vesting, exercise or sale of the employee awards or the underlying shares. However, if an OMC member wishes to sell additional shares they will be prohibited from doing so unless they will meet the MSR after the sale.
For FY2016:• the MSR for the CEO was five times annual pre-tax base salary
and while he has met this requirement in the past, subsequent movements in foreign exchange rates and share prices have resulted in Andrew Mackenzie’s shareholding being 2.3 times his annual pre-tax base salary at the end of FY2016;
• the MSR for other members of the OMC was three times annual pre-tax base salary. At the end of FY2016, Peter Beaven met the MSR, while the remaining members of the OMC did not meet the MSR.
No OMC members sold shares during FY2016, other than to satisfy taxation obligations, consistent with the policy.
Subject to securities dealing constraints, Non-executive Directors have agreed to apply at least 25 per cent of their remuneration (base fees plus Committee fees) to the purchase of BHP Billiton shares until they achieve an MSR equivalent in value to one year’s remuneration (base fees plus Committee fees). Thereafter, they must maintain at least that level of shareholding throughout their tenure. At the end of FY2016, each Non-executive Director met the MSR with the exception of Anita Frew, who joined the Board on 15 September 2015. Ms Frew held 9,000 shares at the end of FY2016 and this holding represents approximately 0.6 times her annual remuneration. As at the date of this report Ms Frew held 15,000 shares, which would meet the MSR.
Section 3.4.23 for details of share ownership information of the CEO, other members of the OMC and the Non-executive Directors.
3.4.4 Statement of voting at the 2015 AGMsBHP Billiton’s remuneration resolutions have attracted a high level of support by shareholders. Voting in regard to those resolutions put to shareholders at the 2015 AGMs is shown below.
AGM resolution Requirement% vote
‘for’% vote
‘against’Votes
withheld (1)
Remuneration Report (excluding remuneration policy) (2)
UK 96.84 3.16 37,048,394
Remuneration Report (whole report)
Australia 96.77 3.23 37,358,354
Approval of grants to Executive Director
Australia 95.75 4.25 23,036,494
(1) The sum of votes marked ‘Vote Withheld’ at BHP Billiton Plc’s AGM and votes marked ‘Abstain’ at BHP Billiton Limited’s AGM.
(2) The UK requirement for approval of the remuneration policy was met at the 2014 AGMs (where the following outcomes were recorded: a 97.19 per cent vote ‘for’ and a 2.81 per cent vote ‘against’, with 29,834,918 votes withheld). This resolution was not required in 2015.
2 Governance at BH
P Billiton1 Strategic Report
4 D
irectors’ Report 3
Remuneration Report
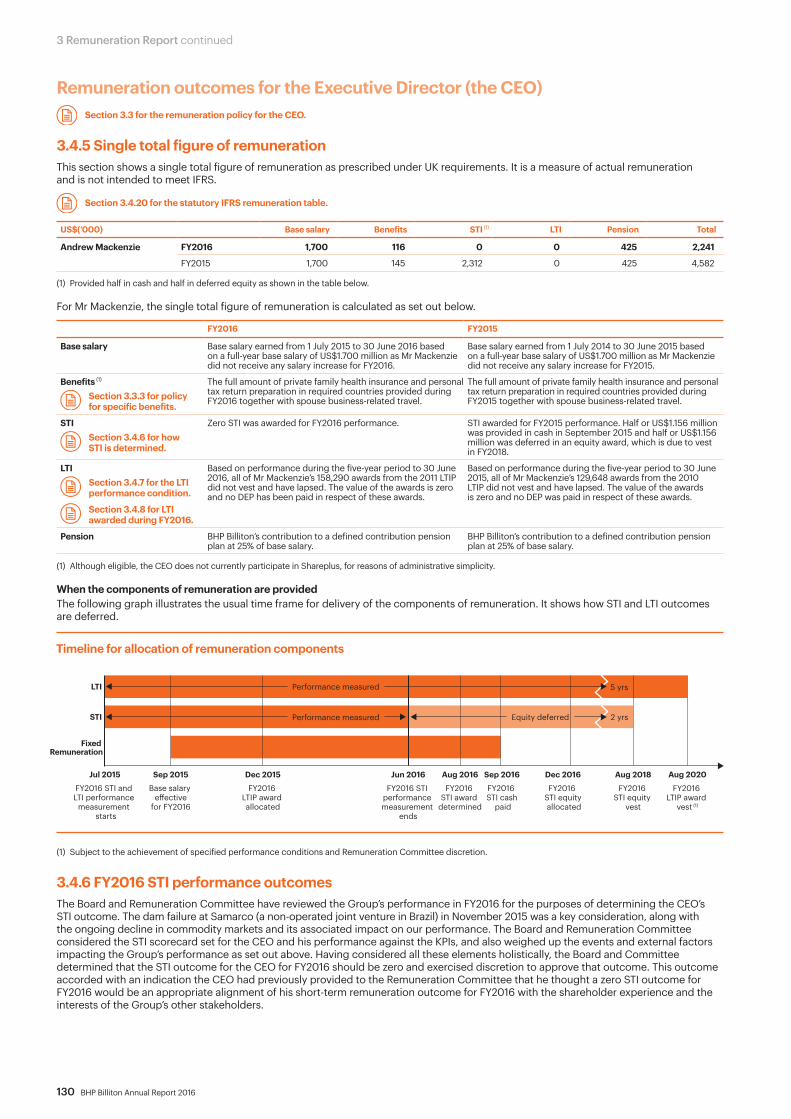
130 BHP Billiton Annual Report 2016
3 Remuneration Report continued
Remuneration outcomes for the Executive Director (the CEO) Section 3.3 for the remuneration policy for the CEO.
3.4.5 Single total figure of remunerationThis section shows a single total figure of remuneration as prescribed under UK requirements. It is a measure of actual remuneration and is not intended to meet IFRS.
Section 3.4.20 for the statutory IFRS remuneration table.
US$(’000) Base salary Benefits STI (1) LTI Pension Total
Andrew Mackenzie FY2016 1,700 116 0 0 425 2,241
FY2015 1,700 145 2,312 0 425 4,582
(1) Provided half in cash and half in deferred equity as shown in the table below.
For Mr Mackenzie, the single total figure of remuneration is calculated as set out below.
FY2016 FY2015
Base salary Base salary earned from 1 July 2015 to 30 June 2016 based on a full-year base salary of US$1.700 million as Mr Mackenzie did not receive any salary increase for FY2016.
Base salary earned from 1 July 2014 to 30 June 2015 based on a full-year base salary of US$1.700 million as Mr Mackenzie did not receive any salary increase for FY2015.
Benefits (1)
Section 3.3.3 for policy for specific benefits.
The full amount of private family health insurance and personal tax return preparation in required countries provided during FY2016 together with spouse business-related travel.
The full amount of private family health insurance and personal tax return preparation in required countries provided during FY2015 together with spouse business-related travel.
STI Section 3.4.6 for how
STI is determined.
Zero STI was awarded for FY2016 performance. STI awarded for FY2015 performance. Half or US$1.156 million was provided in cash in September 2015 and half or US$1.156 million was deferred in an equity award, which is due to vest in FY2018.
LTI Section 3.4.7 for the LTI
performance condition.
Section 3.4.8 for LTI awarded during FY2016.
Based on performance during the five-year period to 30 June 2016, all of Mr Mackenzie’s 158,290 awards from the 2011 LTIP did not vest and have lapsed. The value of the awards is zero and no DEP has been paid in respect of these awards.
Based on performance during the five-year period to 30 June 2015, all of Mr Mackenzie’s 129,648 awards from the 2010 LTIP did not vest and have lapsed. The value of the awards is zero and no DEP was paid in respect of these awards.
Pension BHP Billiton’s contribution to a defined contribution pension plan at 25% of base salary.
BHP Billiton’s contribution to a defined contribution pension plan at 25% of base salary.
(1) Although eligible, the CEO does not currently participate in Shareplus, for reasons of administrative simplicity.
When the components of remuneration are providedThe following graph illustrates the usual time frame for delivery of the components of remuneration. It shows how STI and LTI outcomes are deferred.
(1) Subject to the achievement of specified performance conditions and Remuneration Committee discretion.
3.4.6 FY2016 STI performance outcomes The Board and Remuneration Committee have reviewed the Group’s performance in FY2016 for the purposes of determining the CEO’s STI outcome. The dam failure at Samarco (a non-operated joint venture in Brazil) in November 2015 was a key consideration, along with the ongoing decline in commodity markets and its associated impact on our performance. The Board and Remuneration Committee considered the STI scorecard set for the CEO and his performance against the KPIs, and also weighed up the events and external factors impacting the Group’s performance as set out above. Having considered all these elements holistically, the Board and Committee determined that the STI outcome for the CEO for FY2016 should be zero and exercised discretion to approve that outcome. This outcome accorded with an indication the CEO had previously provided to the Remuneration Committee that he thought a zero STI outcome for FY2016 would be an appropriate alignment of his short-term remuneration outcome for FY2016 with the shareholder experience and the interests of the Group’s other stakeholders.
FY2016 STI and LTI performance
measurement starts
Base salary e�ective for FY2016
FY2016 LTIP award allocated
FY2016 STI cash
paid
FY2016 STI award
determined
FY2016 STI performance measurement
ends
FY2016 STI equity allocated
Sep 2015 Dec 2015 Sep 2016Aug 2016Jun 2016 Dec 2016
FY2016 STI equity
vest
Aug 2018
FY2016 LTIP award
vest (1)
Aug 2020Jul 2015
STI
LTI
Fixed Remuneration
5 yrs
2 yrsPerformance measured Equity deferred
Performance measured
Timeline for allocation of remuneration components

BHP Billiton Annual Report 2016 131
3.4.6 FY2016 STI performance outcomes continuedThe CEO’s STI scorecard for FY2016 is summarised in the following table, showing the outcomes both prior to and after the Committee exercised its discretion as set out above. A narrative description of each performance measure and the CEO’s level of achievement, as determined by the Remuneration Committee, prior to the approval of a zero STI outcome, is shown below the table. The performance range is set for each measure with the level of performance determined on a range of Threshold (the minimum necessary to qualify for any reward outcome), Target (where the performance requirements are met), and Stretch (where the performance requirements are significantly exceeded).
Weighting for FY2016
Performance for FY2016 Scorecard KPI outcomes Approved final outcomes
Zero Threshold Target StretchPercentage
outcomeSTI
US$(’000)Percentage
outcomeSTI
US$(’000)
HSEC 25% 23% 626 0% 0
Underlying attributable profit 40% 0% 0 0% 0
Capital project management 10% 10% 272 0% 0
Individual performance 25% 25% 680 0% 0
Total 100% 58% 1,578 0% 0
Represents outcomes against the original scorecard KPIs, prior to the Board and Committee considering the approval of a zero STI outcome for the CEO for FY2016. Represents the final outcomes after the Board and Committee approval of a zero STI outcome for the CEO for FY2016.
HSECThe HSEC targets in the original scorecard for the CEO are aligned to the Group’s suite of HSEC five-year public targets as set out in BHP Billiton’s Sustainability Report. As it has done for several years, the Remuneration Committee seeks guidance each year from the Sustainability Committee when assessing HSEC performance against the original scorecard targets. The Sustainability Committee also offers its guidance on any matters outside the original scorecard targets which it considers the Remuneration Committee should take into account when finalising the outcomes. Consistent with prior years, the Remuneration Committee then took a holistic view of how the Group had performed in critical areas, including considering the guidance provided by the Sustainability Committee.
The performance commentary below is provided against the original scorecard targets which were set on the basis of operated assets only. While this commentary therefore does not include the impact of the dam failure at Samarco, this should not be read to diminish the significance of that event, which has clearly been a key consideration in the determination of the overall zero STI outcome for the CEO as described above.
Original Scorecard Targets Performance against the Original Scorecard Targets
Fatalities, environmental and community incidents: Nil fatalities and nil actual significant environmental and community incidents at operated assets. Year-on-year improvement in trends for events with potential for such outcomes.
TRIF and occupational illness: Improved performance compared with FY2015 results, with severity and trends to be considered as a moderating influence on the overall HSEC assessment.
Risk management: For all material risks, commodity segments to have all critical control designs and critical control assessment test plans reviewed by the material risk owner and recorded. Year-on-year improvement in trends for potential events associated with identified material risks.
Health, environment and community initiatives: All assets to achieve 100 per cent of planned targets in respect of occupational exposure reduction, water and greenhouse gas, social investment, quality of life, community perceptions and community complaints.
The Sustainability Committee first considered HSEC performance against the original STI scorecard KPIs, with the following observations:
Fatalities, environmental and community incidents: There were no fatalities or environment or community incidents during FY2016 at Group operated assets (i.e. excludes Samarco which is a non-operated joint venture as noted above). The achievement of no fatalities at Group operated assets reflects a significant effort across the Group. As a Group, we still need to continue to build our focus on safety and fatality prevention through leadership, verification and effective risk management. There was one significant non-fatal safety event at New Mexico Coal in FY2016.
TRIF and occupational illness: Our TRIF in FY2016 of 4.3 has deteriorated slightly across BHP Billiton as a whole compared with 4.1 for FY2015, following an improvement of two per cent in the prior year and a pattern of improvement over several years. However, we have significantly reduced by 20 per cent the number of high potential injury events and we have recorded positive outcomes on the numbers of occupational illnesses being experienced.
Risk management: All commodity segments completed reviews of critical control designs and test plans for all material HSEC risks. In addition, all commodity segments met critical control execution and critical control verification tasks targets. There were no potential material risk events in which all critical controls were absent or failed in FY2016.
Health, environment and community initiatives: Greenhouse gas reduction targets set at the commencement of the year were exceeded in all commodity segments. Water management projects were completed consistent with targets in most assets. All occupational exposure and community targets were achieved by the assets.
Notwithstanding the performance against the original scorecard targets as set out above, the guidance offered by the Sustainability Committee to the Remuneration Committee was that the CEO’s FY2016 STI HSEC component should be zero as a consequence of the Samarco dam failure. In the absence of this, and of the Board and Committee’s approval of a zero STI outcome for the CEO for FY2016 as described above, it was considered that the performance against the HSEC KPI would have warranted an outcome for FY2016 of 23 per cent against the target of 25 per cent.
Underlying attributable profit (UAP)Underlying profit after taxation attributable to members of the BHP Billiton Group (UAP) is the key KPI against which short-term incentive outcomes for our senior executives are measured and, in our view, is the most relevant measure to assess the financial performance of the Group for this purpose. UAP is profit after taxation attributable to members of the BHP Billiton Group (which in past periods we have reported as a key KPI), excluding discontinued operations and exceptional items. At the commencement of the financial year when the target is approved, attributable profit is equal to UAP as there are no exceptional items. A description of UAP and how it reconciles to IFRS measures can be found in section 1.13.2.
When we are assessing management’s performance we make adjustments to the UAP result to allow for changes in commodity prices, foreign exchange movements and other material items to ensure that the assessment appropriately measures outcomes that are within the control and influence of the Group and its executives. Of these, changes in commodity prices has historically been the most material due to volatility in prices and the impact on Group revenue. Notwithstanding that UAP excludes exceptional items, the Remuneration Committee reviews each exceptional item to assess if it should be included in the result for the purposes of deriving the UAP STI outcome.
2 Governance at BH
P Billiton1 Strategic Report
4 D
irectors’ Report 3
Remuneration Report
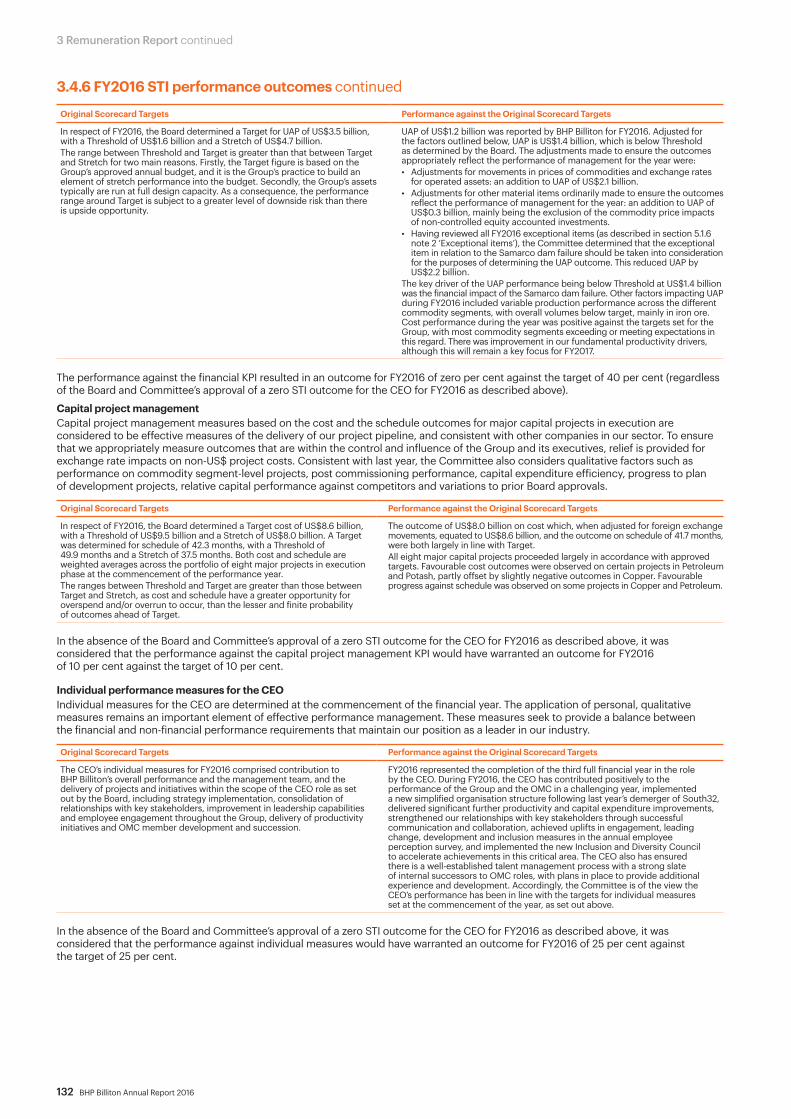
132 BHP Billiton Annual Report 2016
3 Remuneration Report continued
3.4.6 FY2016 STI performance outcomes continued
Original Scorecard Targets Performance against the Original Scorecard Targets
In respect of FY2016, the Board determined a Target for UAP of US$3.5 billion, with a Threshold of US$1.6 billion and a Stretch of US$4.7 billion.The range between Threshold and Target is greater than that between Target and Stretch for two main reasons. Firstly, the Target figure is based on the Group’s approved annual budget, and it is the Group’s practice to build an element of stretch performance into the budget. Secondly, the Group’s assets typically are run at full design capacity. As a consequence, the performance range around Target is subject to a greater level of downside risk than there is upside opportunity.
UAP of US$1.2 billion was reported by BHP Billiton for FY2016. Adjusted for the factors outlined below, UAP is US$1.4 billion, which is below Threshold as determined by the Board. The adjustments made to ensure the outcomes appropriately reflect the performance of management for the year were: • Adjustments for movements in prices of commodities and exchange rates
for operated assets: an addition to UAP of US$2.1 billion. • Adjustments for other material items ordinarily made to ensure the outcomes
reflect the performance of management for the year: an addition to UAP of US$0.3 billion, mainly being the exclusion of the commodity price impacts of non-controlled equity accounted investments.
• Having reviewed all FY2016 exceptional items (as described in section 5.1.6 note 2 ‘Exceptional items’), the Committee determined that the exceptional item in relation to the Samarco dam failure should be taken into consideration for the purposes of determining the UAP outcome. This reduced UAP by US$2.2 billion.
The key driver of the UAP performance being below Threshold at US$1.4 billion was the financial impact of the Samarco dam failure. Other factors impacting UAP during FY2016 included variable production performance across the different commodity segments, with overall volumes below target, mainly in iron ore. Cost performance during the year was positive against the targets set for the Group, with most commodity segments exceeding or meeting expectations in this regard. There was improvement in our fundamental productivity drivers, although this will remain a key focus for FY2017.
The performance against the financial KPI resulted in an outcome for FY2016 of zero per cent against the target of 40 per cent (regardless of the Board and Committee’s approval of a zero STI outcome for the CEO for FY2016 as described above).
Capital project managementCapital project management measures based on the cost and the schedule outcomes for major capital projects in execution are considered to be effective measures of the delivery of our project pipeline, and consistent with other companies in our sector. To ensure that we appropriately measure outcomes that are within the control and influence of the Group and its executives, relief is provided for exchange rate impacts on non-US$ project costs. Consistent with last year, the Committee also considers qualitative factors such as performance on commodity segment-level projects, post commissioning performance, capital expenditure efficiency, progress to plan of development projects, relative capital performance against competitors and variations to prior Board approvals.
Original Scorecard Targets Performance against the Original Scorecard Targets
In respect of FY2016, the Board determined a Target cost of US$8.6 billion, with a Threshold of US$9.5 billion and a Stretch of US$8.0 billion. A Target was determined for schedule of 42.3 months, with a Threshold of 49.9 months and a Stretch of 37.5 months. Both cost and schedule are weighted averages across the portfolio of eight major projects in execution phase at the commencement of the performance year.The ranges between Threshold and Target are greater than those between Target and Stretch, as cost and schedule have a greater opportunity for overspend and/or overrun to occur, than the lesser and finite probability of outcomes ahead of Target.
The outcome of US$8.0 billion on cost which, when adjusted for foreign exchange movements, equated to US$8.6 billion, and the outcome on schedule of 41.7 months, were both largely in line with Target. All eight major capital projects proceeded largely in accordance with approved targets. Favourable cost outcomes were observed on certain projects in Petroleum and Potash, partly offset by slightly negative outcomes in Copper. Favourable progress against schedule was observed on some projects in Copper and Petroleum.
In the absence of the Board and Committee’s approval of a zero STI outcome for the CEO for FY2016 as described above, it was considered that the performance against the capital project management KPI would have warranted an outcome for FY2016 of 10 per cent against the target of 10 per cent.
Individual performance measures for the CEOIndividual measures for the CEO are determined at the commencement of the financial year. The application of personal, qualitative measures remains an important element of effective performance management. These measures seek to provide a balance between the financial and non-financial performance requirements that maintain our position as a leader in our industry.
Original Scorecard Targets Performance against the Original Scorecard Targets
The CEO’s individual measures for FY2016 comprised contribution to BHP Billiton’s overall performance and the management team, and the delivery of projects and initiatives within the scope of the CEO role as set out by the Board, including strategy implementation, consolidation of relationships with key stakeholders, improvement in leadership capabilities and employee engagement throughout the Group, delivery of productivity initiatives and OMC member development and succession.
FY2016 represented the completion of the third full financial year in the role by the CEO. During FY2016, the CEO has contributed positively to the performance of the Group and the OMC in a challenging year, implemented a new simplified organisation structure following last year’s demerger of South32, delivered significant further productivity and capital expenditure improvements, strengthened our relationships with key stakeholders through successful communication and collaboration, achieved uplifts in engagement, leading change, development and inclusion measures in the annual employee perception survey, and implemented the new Inclusion and Diversity Council to accelerate achievements in this critical area. The CEO also has ensured there is a well-established talent management process with a strong slate of internal successors to OMC roles, with plans in place to provide additional experience and development. Accordingly, the Committee is of the view the CEO’s performance has been in line with the targets for individual measures set at the commencement of the year, as set out above.
In the absence of the Board and Committee’s approval of a zero STI outcome for the CEO for FY2016 as described above, it was considered that the performance against individual measures would have warranted an outcome for FY2016 of 25 per cent against the target of 25 per cent.
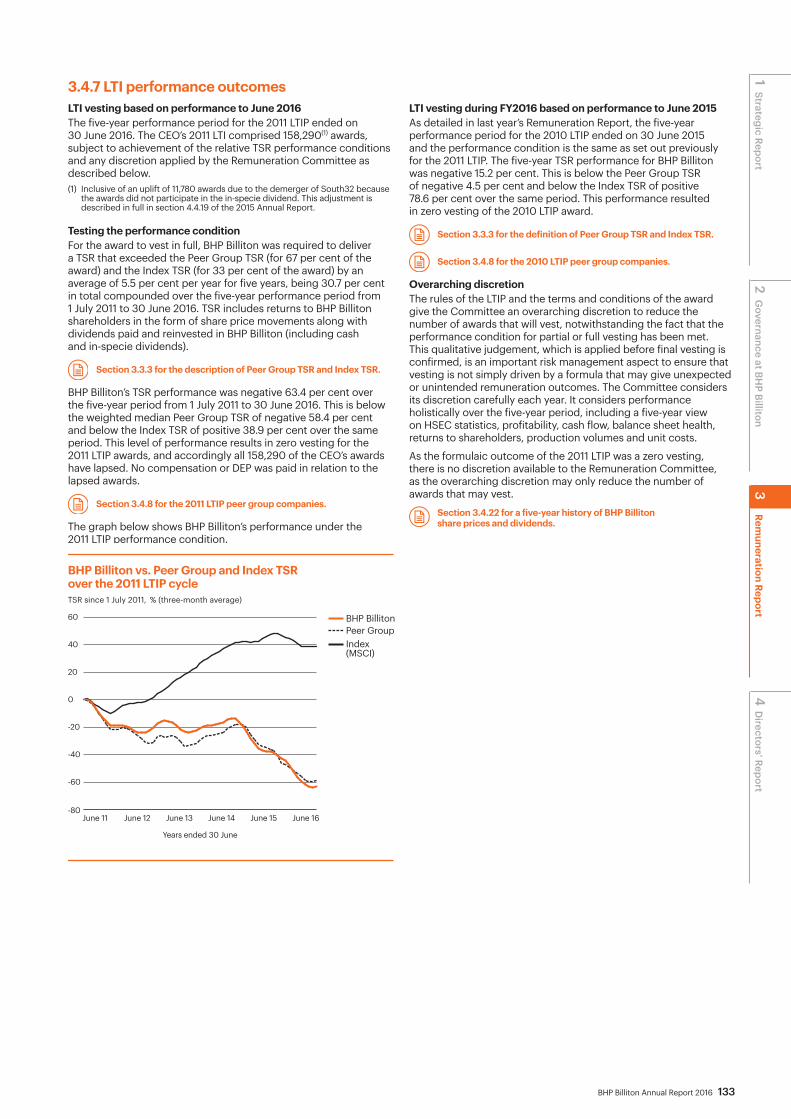
BHP Billiton Annual Report 2016 133
3.4.7 LTI performance outcomes LTI vesting based on performance to June 2016The five-year performance period for the 2011 LTIP ended on 30 June 2016. The CEO’s 2011 LTI comprised 158,290(1) awards, subject to achievement of the relative TSR performance conditions and any discretion applied by the Remuneration Committee as described below. (1) Inclusive of an uplift of 11,780 awards due to the demerger of South32 because
the awards did not participate in the in-specie dividend. This adjustment is described in full in section 4.4.19 of the 2015 Annual Report.
Testing the performance conditionFor the award to vest in full, BHP Billiton was required to deliver a TSR that exceeded the Peer Group TSR (for 67 per cent of the award) and the Index TSR (for 33 per cent of the award) by an average of 5.5 per cent per year for five years, being 30.7 per cent in total compounded over the five-year performance period from 1 July 2011 to 30 June 2016. TSR includes returns to BHP Billiton shareholders in the form of share price movements along with dividends paid and reinvested in BHP Billiton (including cash and in-specie dividends).
Section 3.3.3 for the description of Peer Group TSR and Index TSR.
BHP Billiton’s TSR performance was negative 63.4 per cent over the five-year period from 1 July 2011 to 30 June 2016. This is below the weighted median Peer Group TSR of negative 58.4 per cent and below the Index TSR of positive 38.9 per cent over the same period. This level of performance results in zero vesting for the 2011 LTIP awards, and accordingly all 158,290 of the CEO’s awards have lapsed. No compensation or DEP was paid in relation to the lapsed awards.
Section 3.4.8 for the 2011 LTIP peer group companies.
The graph below shows BHP Billiton’s performance under the 2011 LTIP performance condition.
TSR since 1 July 2011, % (three-month average)
-80
-40
-60
-20
0
40
20
60
June 16June 15June 14June 13June 11 June 12
Years ended 30 June
BHP Billiton Peer GroupIndex (MSCI)
BHP Billiton vs. Peer Group and Index TSR over the 2011 LTIP cycle
LTI vesting during FY2016 based on performance to June 2015As detailed in last year’s Remuneration Report, the five-year performance period for the 2010 LTIP ended on 30 June 2015 and the performance condition is the same as set out previously for the 2011 LTIP. The five-year TSR performance for BHP Billiton was negative 15.2 per cent. This is below the Peer Group TSR of negative 4.5 per cent and below the Index TSR of positive 78.6 per cent over the same period. This performance resulted in zero vesting of the 2010 LTIP award.
Section 3.3.3 for the definition of Peer Group TSR and Index TSR.
Section 3.4.8 for the 2010 LTIP peer group companies.
Overarching discretionThe rules of the LTIP and the terms and conditions of the award give the Committee an overarching discretion to reduce the number of awards that will vest, notwithstanding the fact that the performance condition for partial or full vesting has been met. This qualitative judgement, which is applied before final vesting is confirmed, is an important risk management aspect to ensure that vesting is not simply driven by a formula that may give unexpected or unintended remuneration outcomes. The Committee considers its discretion carefully each year. It considers performance holistically over the five-year period, including a five-year view on HSEC statistics, profitability, cash flow, balance sheet health, returns to shareholders, production volumes and unit costs.
As the formulaic outcome of the 2011 LTIP was a zero vesting, there is no discretion available to the Remuneration Committee, as the overarching discretion may only reduce the number of awards that may vest.
Section 3.4.22 for a five-year history of BHP Billiton share prices and dividends.
2 Governance at BH
P Billiton1 Strategic Report
4 D
irectors’ Report 3
Remuneration Report
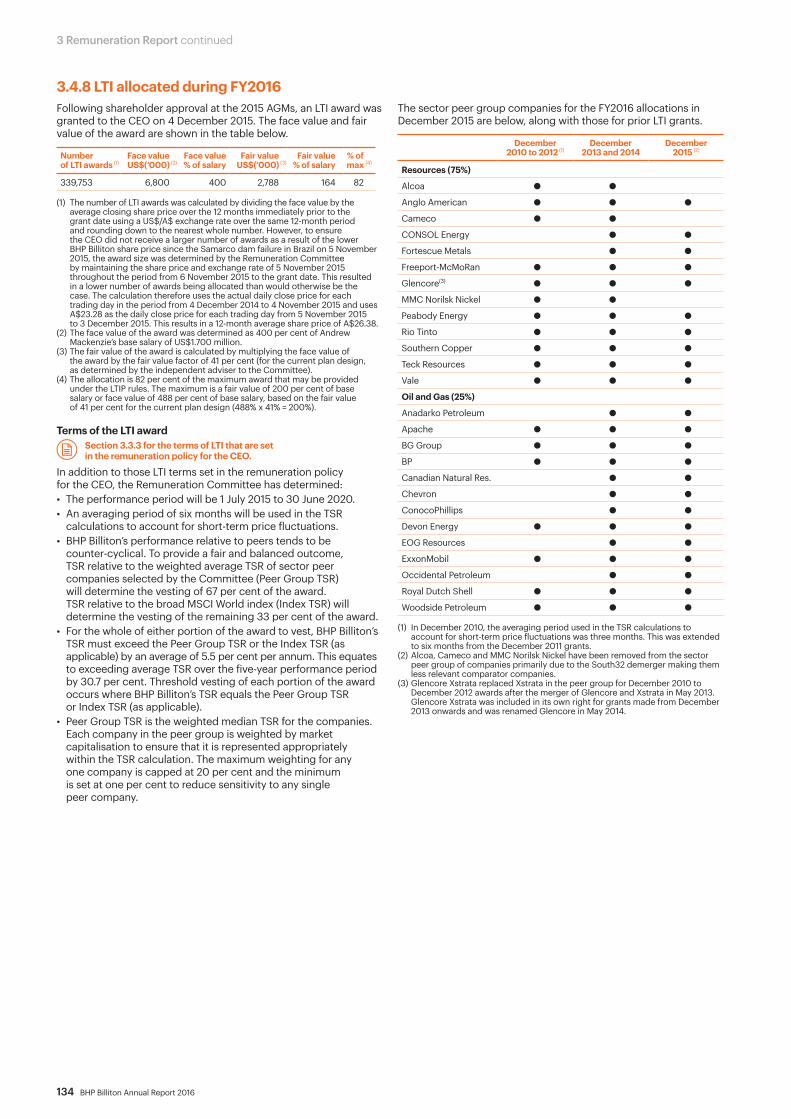
134 BHP Billiton Annual Report 2016
3 Remuneration Report continued
3.4.8 LTI allocated during FY2016Following shareholder approval at the 2015 AGMs, an LTI award was granted to the CEO on 4 December 2015. The face value and fair value of the award are shown in the table below.
Number of LTI awards (1)
Face value US$(‘000) (2)
Face value% of salary
Fair valueUS$(‘000) (3)
Fair value% of salary
% of max (4)
339,753 6,800 400 2,788 164 82
(1) The number of LTI awards was calculated by dividing the face value by the average closing share price over the 12 months immediately prior to the grant date using a US$/A$ exchange rate over the same 12-month period and rounding down to the nearest whole number. However, to ensure the CEO did not receive a larger number of awards as a result of the lower BHP Billiton share price since the Samarco dam failure in Brazil on 5 November 2015, the award size was determined by the Remuneration Committee by maintaining the share price and exchange rate of 5 November 2015 throughout the period from 6 November 2015 to the grant date. This resulted in a lower number of awards being allocated than would otherwise be the case. The calculation therefore uses the actual daily close price for each trading day in the period from 4 December 2014 to 4 November 2015 and uses A$23.28 as the daily close price for each trading day from 5 November 2015 to 3 December 2015. This results in a 12-month average share price of A$26.38.
(2) The face value of the award was determined as 400 per cent of Andrew Mackenzie’s base salary of US$1.700 million.
(3) The fair value of the award is calculated by multiplying the face value of the award by the fair value factor of 41 per cent (for the current plan design, as determined by the independent adviser to the Committee).
(4) The allocation is 82 per cent of the maximum award that may be provided under the LTIP rules. The maximum is a fair value of 200 per cent of base salary or face value of 488 per cent of base salary, based on the fair value of 41 per cent for the current plan design (488% x 41% = 200%).
Terms of the LTI award Section 3.3.3 for the terms of LTI that are set
in the remuneration policy for the CEO.
In addition to those LTI terms set in the remuneration policy for the CEO, the Remuneration Committee has determined:• The performance period will be 1 July 2015 to 30 June 2020.• An averaging period of six months will be used in the TSR
calculations to account for short-term price fluctuations.• BHP Billiton’s performance relative to peers tends to be
counter-cyclical. To provide a fair and balanced outcome, TSR relative to the weighted average TSR of sector peer companies selected by the Committee (Peer Group TSR) will determine the vesting of 67 per cent of the award. TSR relative to the broad MSCI World index (Index TSR) will determine the vesting of the remaining 33 per cent of the award.
• For the whole of either portion of the award to vest, BHP Billiton’s TSR must exceed the Peer Group TSR or the Index TSR (as applicable) by an average of 5.5 per cent per annum. This equates to exceeding average TSR over the five-year performance period by 30.7 per cent. Threshold vesting of each portion of the award occurs where BHP Billiton’s TSR equals the Peer Group TSR or Index TSR (as applicable).
• Peer Group TSR is the weighted median TSR for the companies. Each company in the peer group is weighted by market capitalisation to ensure that it is represented appropriately within the TSR calculation. The maximum weighting for any one company is capped at 20 per cent and the minimum is set at one per cent to reduce sensitivity to any single peer company.
The sector peer group companies for the FY2016 allocations in December 2015 are below, along with those for prior LTI grants.
December 2010 to 2012 (1)
December 2013 and 2014
December2015 (2)
Resources (75%)
Alcoa ● ●
Anglo American ● ● ●
Cameco ● ●
CONSOL Energy ● ●
Fortescue Metals ● ●
Freeport-McMoRan ● ● ●
Glencore(3) ● ● ●
MMC Norilsk Nickel ● ●
Peabody Energy ● ● ●
Rio Tinto ● ● ●
Southern Copper ● ● ●
Teck Resources ● ● ●
Vale ● ● ●
Oil and Gas (25%)
Anadarko Petroleum ● ●
Apache ● ● ●
BG Group ● ● ●
BP ● ● ●
Canadian Natural Res. ● ●
Chevron ● ●
ConocoPhillips ● ●
Devon Energy ● ● ●
EOG Resources ● ●
ExxonMobil ● ● ●
Occidental Petroleum ● ●
Royal Dutch Shell ● ● ●
Woodside Petroleum ● ● ●
(1) In December 2010, the averaging period used in the TSR calculations to account for short-term price fluctuations was three months. This was extended to six months from the December 2011 grants.
(2) Alcoa, Cameco and MMC Norilsk Nickel have been removed from the sector peer group of companies primarily due to the South32 demerger making them less relevant comparator companies.
(3) Glencore Xstrata replaced Xstrata in the peer group for December 2010 to December 2012 awards after the merger of Glencore and Xstrata in May 2013. Glencore Xstrata was included in its own right for grants made from December 2013 onwards and was renamed Glencore in May 2014.

BHP Billiton Annual Report 2016 135
3.4.9 CEO remuneration and returns to shareholdersSeven-year CEO remunerationThe table below shows the total remuneration earned by Andrew Mackenzie and Marius Kloppers over the last seven years along with the proportion of maximum opportunity earned for each type of incentive.
Section 3.4.5 for more detail on and the methodology used to calculate the single total figure of remuneration as used in this table.
Financial year FY2010 FY2011 FY2012 FY2013 (1) FY2014 FY2015 FY2016
Andrew Mackenzie
Total single figure remuneration, US$(’000) – – – 2,468 7,988 4,582 2,241
STI (% of maximum) – – – 47 77 57 0
LTI (% of maximum) – – – 65 58 0 0
Marius Kloppers
Total single figure remuneration, US$(’000) 14,789 15,755 16,092 15,991 – – –
STI (% of maximum) 71 69 0 47 – – –
LTI (% of maximum) 100 100 100 65 – – –
(1) As Mr Mackenzie assumed the role of CEO in May 2013, the FY2013 total remuneration shown relates only to the period 10 May to 30 June 2013. The FY2013 total remuneration for Mr Kloppers relates only to the period 1 July 2012 to 10 May 2013.
Seven-year TSR The graph below shows BHP Billiton’s TSR against the performance of relevant indices over the same seven-year period. The indices shown in the graph were chosen as being broad market indices, which include companies of a comparable size and complexity to BHP Billiton.
$0
$50
$100
$150
$200
$250
June 14 June 15 June 16June 13June 12June 11June 09 June 10
Value of investment (US$)
Years ended 30 June
BHP Billiton LimitedBHP Billiton PlcFTSE 100ASX 100
Value of US$100 invested over the seven-year period to 30 June 2016 (with dividends reinvested)
3.4.10 Remuneration in FY2016 The table below sets out the CEO’s base salary, benefits and STI amounts earned in respect of FY2016, with the percentage change from FY2015. The table also shows the average change in each element for current employees in Australia (being approximately 16,000 employees) during FY2016. This has been chosen by the Committee as the most appropriate comparison, as the CEO is located in Australia.
Base salary Benefits STI
CEO US$(’000) 1,700 116 0
% change 0.0 (20.0) (100.0)
Australian employees % change (average) 1.0 (17.8) (33.3)
The table below shows the ratio of the total remuneration of the highest paid individual in each major region in which BHP Billiton operates to the median total remuneration of all of the employees in the same region.
Region Asia Australia Europe North America South America
Ratio 32:1 55:1 4:1 30:1 133:1
2 Governance at BH
P Billiton1 Strategic Report
4 D
irectors’ Report 3
Remuneration Report
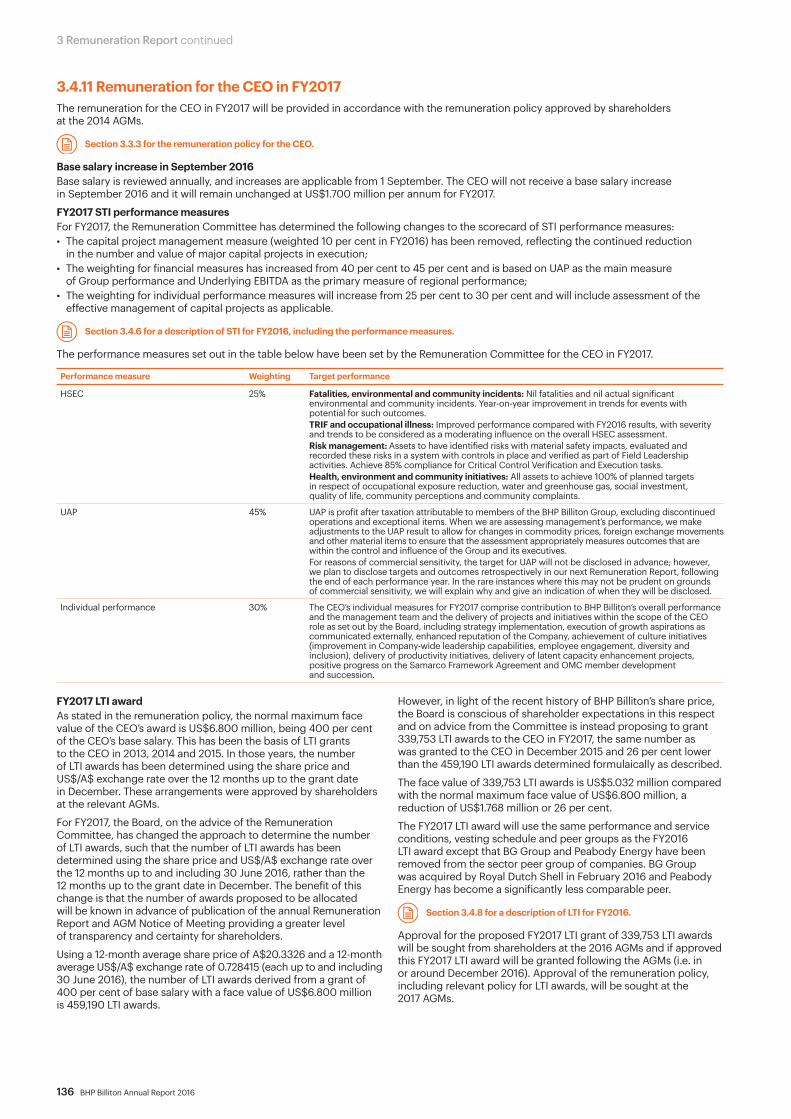
136 BHP Billiton Annual Report 2016
3 Remuneration Report continued
3.4.11 Remuneration for the CEO in FY2017The remuneration for the CEO in FY2017 will be provided in accordance with the remuneration policy approved by shareholders at the 2014 AGMs.
Section 3.3.3 for the remuneration policy for the CEO.
Base salary increase in September 2016Base salary is reviewed annually, and increases are applicable from 1 September. The CEO will not receive a base salary increase in September 2016 and it will remain unchanged at US$1.700 million per annum for FY2017.
FY2017 STI performance measuresFor FY2017, the Remuneration Committee has determined the following changes to the scorecard of STI performance measures:• The capital project management measure (weighted 10 per cent in FY2016) has been removed, reflecting the continued reduction
in the number and value of major capital projects in execution; • The weighting for financial measures has increased from 40 per cent to 45 per cent and is based on UAP as the main measure
of Group performance and Underlying EBITDA as the primary measure of regional performance;• The weighting for individual performance measures will increase from 25 per cent to 30 per cent and will include assessment of the
effective management of capital projects as applicable.
Section 3.4.6 for a description of STI for FY2016, including the performance measures.
The performance measures set out in the table below have been set by the Remuneration Committee for the CEO in FY2017.
Performance measure Weighting Target performance
HSEC 25% Fatalities, environmental and community incidents: Nil fatalities and nil actual significant environmental and community incidents. Year-on-year improvement in trends for events with potential for such outcomes.TRIF and occupational illness: Improved performance compared with FY2016 results, with severity and trends to be considered as a moderating influence on the overall HSEC assessment.Risk management: Assets to have identified risks with material safety impacts, evaluated and recorded these risks in a system with controls in place and verified as part of Field Leadership activities. Achieve 85% compliance for Critical Control Verification and Execution tasks.Health, environment and community initiatives: All assets to achieve 100% of planned targets in respect of occupational exposure reduction, water and greenhouse gas, social investment, quality of life, community perceptions and community complaints.
UAP 45% UAP is profit after taxation attributable to members of the BHP Billiton Group, excluding discontinued operations and exceptional items. When we are assessing management’s performance, we make adjustments to the UAP result to allow for changes in commodity prices, foreign exchange movements and other material items to ensure that the assessment appropriately measures outcomes that are within the control and influence of the Group and its executives. For reasons of commercial sensitivity, the target for UAP will not be disclosed in advance; however, we plan to disclose targets and outcomes retrospectively in our next Remuneration Report, following the end of each performance year. In the rare instances where this may not be prudent on grounds of commercial sensitivity, we will explain why and give an indication of when they will be disclosed.
Individual performance 30% The CEO’s individual measures for FY2017 comprise contribution to BHP Billiton’s overall performance and the management team and the delivery of projects and initiatives within the scope of the CEO role as set out by the Board, including strategy implementation, execution of growth aspirations as communicated externally, enhanced reputation of the Company, achievement of culture initiatives (improvement in Company-wide leadership capabilities, employee engagement, diversity and inclusion), delivery of productivity initiatives, delivery of latent capacity enhancement projects, positive progress on the Samarco Framework Agreement and OMC member development and succession.
FY2017 LTI awardAs stated in the remuneration policy, the normal maximum face value of the CEO’s award is US$6.800 million, being 400 per cent of the CEO’s base salary. This has been the basis of LTI grants to the CEO in 2013, 2014 and 2015. In those years, the number of LTI awards has been determined using the share price and US$/A$ exchange rate over the 12 months up to the grant date in December. These arrangements were approved by shareholders at the relevant AGMs.
For FY2017, the Board, on the advice of the Remuneration Committee, has changed the approach to determine the number of LTI awards, such that the number of LTI awards has been determined using the share price and US$/A$ exchange rate over the 12 months up to and including 30 June 2016, rather than the 12 months up to the grant date in December. The benefit of this change is that the number of awards proposed to be allocated will be known in advance of publication of the annual Remuneration Report and AGM Notice of Meeting providing a greater level of transparency and certainty for shareholders.
Using a 12-month average share price of A$20.3326 and a 12-month average US$/A$ exchange rate of 0.728415 (each up to and including 30 June 2016), the number of LTI awards derived from a grant of 400 per cent of base salary with a face value of US$6.800 million is 459,190 LTI awards.
However, in light of the recent history of BHP Billiton’s share price, the Board is conscious of shareholder expectations in this respect and on advice from the Committee is instead proposing to grant 339,753 LTI awards to the CEO in FY2017, the same number as was granted to the CEO in December 2015 and 26 per cent lower than the 459,190 LTI awards determined formulaically as described.
The face value of 339,753 LTI awards is US$5.032 million compared with the normal maximum face value of US$6.800 million, a reduction of US$1.768 million or 26 per cent.
The FY2017 LTI award will use the same performance and service conditions, vesting schedule and peer groups as the FY2016 LTI award except that BG Group and Peabody Energy have been removed from the sector peer group of companies. BG Group was acquired by Royal Dutch Shell in February 2016 and Peabody Energy has become a significantly less comparable peer.
Section 3.4.8 for a description of LTI for FY2016.
Approval for the proposed FY2017 LTI grant of 339,753 LTI awards will be sought from shareholders at the 2016 AGMs and if approved this FY2017 LTI award will be granted following the AGMs (i.e. in or around December 2016). Approval of the remuneration policy, including relevant policy for LTI awards, will be sought at the 2017 AGMs.
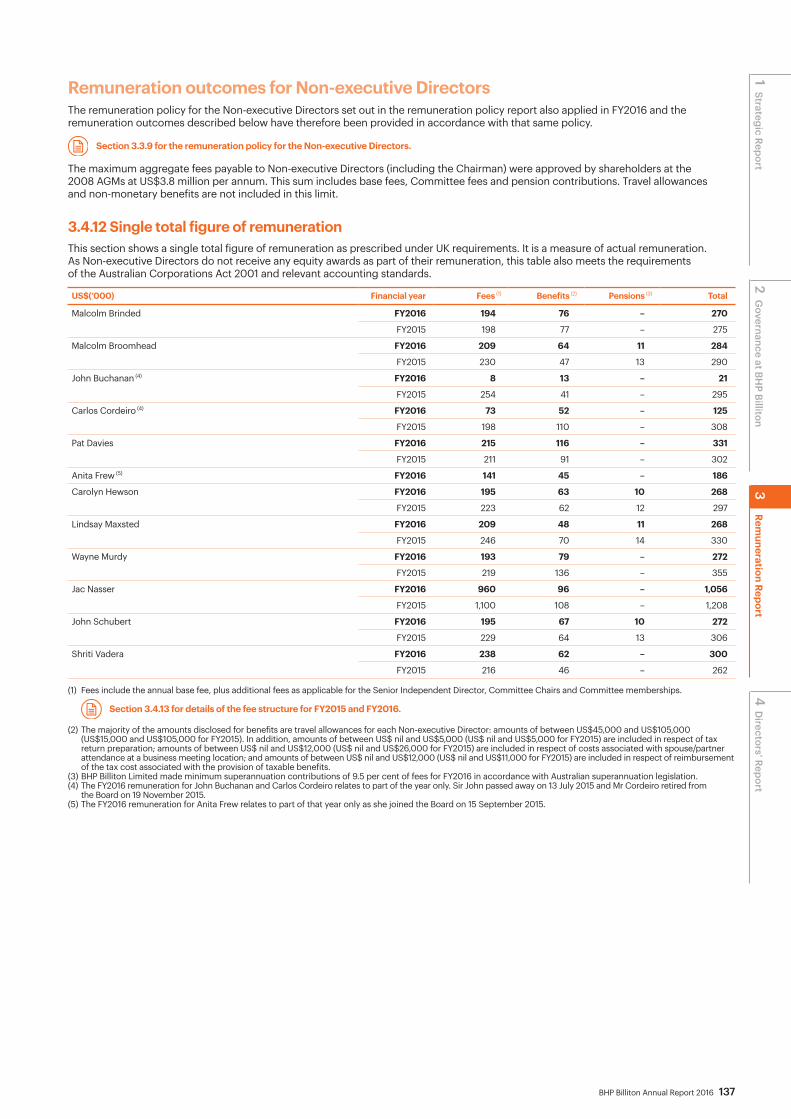
BHP Billiton Annual Report 2016 137
Remuneration outcomes for Non-executive DirectorsThe remuneration policy for the Non-executive Directors set out in the remuneration policy report also applied in FY2016 and the remuneration outcomes described below have therefore been provided in accordance with that same policy.
Section 3.3.9 for the remuneration policy for the Non-executive Directors.
The maximum aggregate fees payable to Non-executive Directors (including the Chairman) were approved by shareholders at the 2008 AGMs at US$3.8 million per annum. This sum includes base fees, Committee fees and pension contributions. Travel allowances and non-monetary benefits are not included in this limit.
3.4.12 Single total figure of remunerationThis section shows a single total figure of remuneration as prescribed under UK requirements. It is a measure of actual remuneration. As Non-executive Directors do not receive any equity awards as part of their remuneration, this table also meets the requirements of the Australian Corporations Act 2001 and relevant accounting standards.
US$(‘000) Financial year Fees (1) Benefits (2) Pensions (3) Total
Malcolm Brinded FY2016 194 76 – 270
FY2015 198 77 – 275
Malcolm Broomhead FY2016 209 64 11 284
FY2015 230 47 13 290
John Buchanan (4) FY2016 8 13 – 21
FY2015 254 41 – 295
Carlos Cordeiro (4) FY2016 73 52 – 125
FY2015 198 110 – 308
Pat Davies FY2016 215 116 – 331
FY2015 211 91 – 302
Anita Frew (5) FY2016 141 45 – 186
Carolyn Hewson FY2016 195 63 10 268
FY2015 223 62 12 297
Lindsay Maxsted FY2016 209 48 11 268
FY2015 246 70 14 330
Wayne Murdy FY2016 193 79 – 272
FY2015 219 136 – 355
Jac Nasser FY2016 960 96 – 1,056
FY2015 1,100 108 – 1,208
John Schubert FY2016 195 67 10 272
FY2015 229 64 13 306
Shriti Vadera FY2016 238 62 – 300
FY2015 216 46 – 262
(1) Fees include the annual base fee, plus additional fees as applicable for the Senior Independent Director, Committee Chairs and Committee memberships.
Section 3.4.13 for details of the fee structure for FY2015 and FY2016.
(2) The majority of the amounts disclosed for benefits are travel allowances for each Non-executive Director: amounts of between US$45,000 and US$105,000 (US$15,000 and US$105,000 for FY2015). In addition, amounts of between US$ nil and US$5,000 (US$ nil and US$5,000 for FY2015) are included in respect of tax return preparation; amounts of between US$ nil and US$12,000 (US$ nil and US$26,000 for FY2015) are included in respect of costs associated with spouse/partner attendance at a business meeting location; and amounts of between US$ nil and US$12,000 (US$ nil and US$11,000 for FY2015) are included in respect of reimbursement of the tax cost associated with the provision of taxable benefits.
(3) BHP Billiton Limited made minimum superannuation contributions of 9.5 per cent of fees for FY2016 in accordance with Australian superannuation legislation.(4) The FY2016 remuneration for John Buchanan and Carlos Cordeiro relates to part of the year only. Sir John passed away on 13 July 2015 and Mr Cordeiro retired from
the Board on 19 November 2015. (5) The FY2016 remuneration for Anita Frew relates to part of that year only as she joined the Board on 15 September 2015.
2 Governance at BH
P Billiton1 Strategic Report
4 D
irectors’ Report 3
Remuneration Report
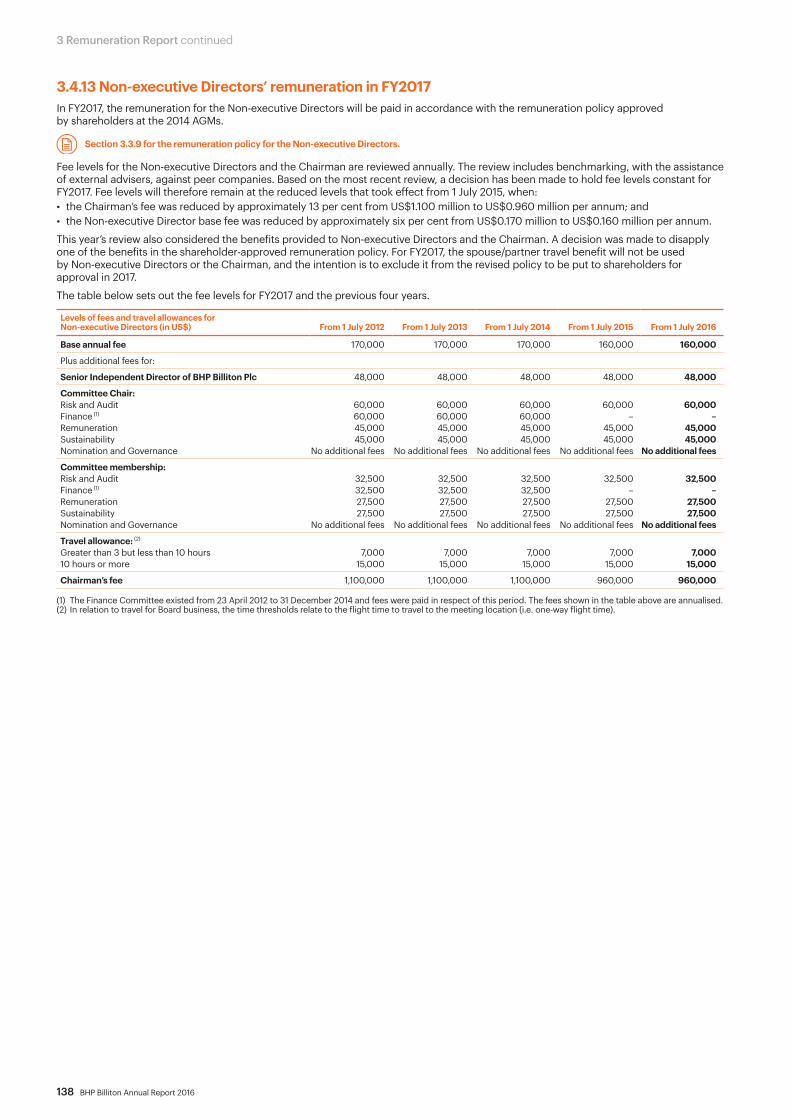
138 BHP Billiton Annual Report 2016
3 Remuneration Report continued
3.4.13 Non-executive Directors’ remuneration in FY2017In FY2017, the remuneration for the Non-executive Directors will be paid in accordance with the remuneration policy approved by shareholders at the 2014 AGMs.
Section 3.3.9 for the remuneration policy for the Non-executive Directors.
Fee levels for the Non-executive Directors and the Chairman are reviewed annually. The review includes benchmarking, with the assistance of external advisers, against peer companies. Based on the most recent review, a decision has been made to hold fee levels constant for FY2017. Fee levels will therefore remain at the reduced levels that took effect from 1 July 2015, when:• the Chairman’s fee was reduced by approximately 13 per cent from US$1.100 million to US$0.960 million per annum; and • the Non-executive Director base fee was reduced by approximately six per cent from US$0.170 million to US$0.160 million per annum.
This year’s review also considered the benefits provided to Non-executive Directors and the Chairman. A decision was made to disapply one of the benefits in the shareholder-approved remuneration policy. For FY2017, the spouse/partner travel benefit will not be used by Non-executive Directors or the Chairman, and the intention is to exclude it from the revised policy to be put to shareholders for approval in 2017.
The table below sets out the fee levels for FY2017 and the previous four years.
Levels of fees and travel allowances for Non-executive Directors (in US$) From 1 July 2012 From 1 July 2013 From 1 July 2014 From 1 July 2015 From 1 July 2016
Base annual fee 170,000 170,000 170,000 160,000 160,000
Plus additional fees for:
Senior Independent Director of BHP Billiton Plc 48,000 48,000 48,000 48,000 48,000
Committee Chair:Risk and AuditFinance (1)
RemunerationSustainabilityNomination and Governance
60,00060,00045,00045,000
No additional fees
60,00060,00045,00045,000
No additional fees
60,00060,00045,00045,000
No additional fees
60,000
–45,00045,000
No additional fees
60,000–
45,00045,000
No additional fees
Committee membership:Risk and AuditFinance (1)
RemunerationSustainabilityNomination and Governance
32,50032,50027,50027,500
No additional fees
32,50032,50027,50027,500
No additional fees
32,50032,50027,50027,500
No additional fees
32,500
–27,50027,500
No additional fees
32,500
–27,50027,500
No additional fees
Travel allowance: (2)
Greater than 3 but less than 10 hours10 hours or more
7,000
15,000
7,000
15,000
7,000
15,000
7,000
15,0007,000
15,000
Chairman’s fee 1,100,000 1,100,000 1,100,000 960,000 960,000
(1) The Finance Committee existed from 23 April 2012 to 31 December 2014 and fees were paid in respect of this period. The fees shown in the table above are annualised.(2) In relation to travel for Board business, the time thresholds relate to the flight time to travel to the meeting location (i.e. one-way flight time).
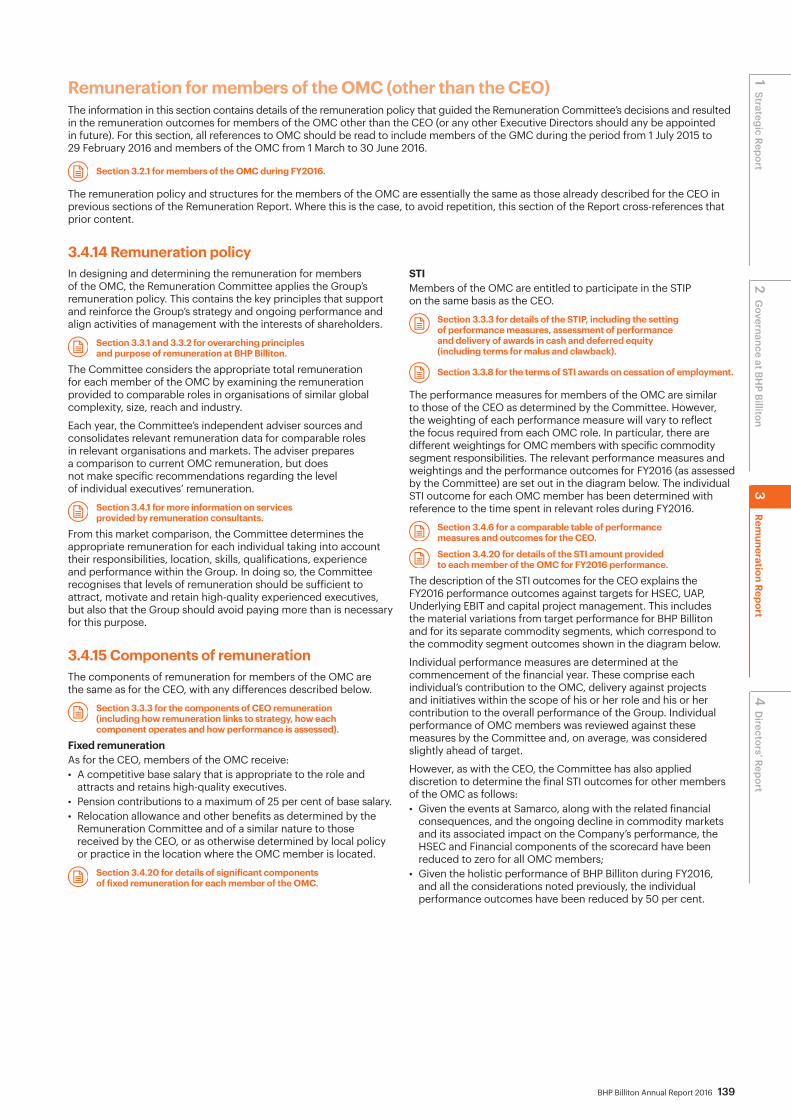
BHP Billiton Annual Report 2016 139
Remuneration for members of the OMC (other than the CEO)The information in this section contains details of the remuneration policy that guided the Remuneration Committee’s decisions and resulted in the remuneration outcomes for members of the OMC other than the CEO (or any other Executive Directors should any be appointed in future). For this section, all references to OMC should be read to include members of the GMC during the period from 1 July 2015 to 29 February 2016 and members of the OMC from 1 March to 30 June 2016.
Section 3.2.1 for members of the OMC during FY2016.
The remuneration policy and structures for the members of the OMC are essentially the same as those already described for the CEO in previous sections of the Remuneration Report. Where this is the case, to avoid repetition, this section of the Report cross-references that prior content.
3.4.14 Remuneration policy In designing and determining the remuneration for members of the OMC, the Remuneration Committee applies the Group’s remuneration policy. This contains the key principles that support and reinforce the Group’s strategy and ongoing performance and align activities of management with the interests of shareholders.
Section 3.3.1 and 3.3.2 for overarching principles and purpose of remuneration at BHP Billiton.
The Committee considers the appropriate total remuneration for each member of the OMC by examining the remuneration provided to comparable roles in organisations of similar global complexity, size, reach and industry.
Each year, the Committee’s independent adviser sources and consolidates relevant remuneration data for comparable roles in relevant organisations and markets. The adviser prepares a comparison to current OMC remuneration, but does not make specific recommendations regarding the level of individual executives’ remuneration.
Section 3.4.1 for more information on services provided by remuneration consultants.
From this market comparison, the Committee determines the appropriate remuneration for each individual taking into account their responsibilities, location, skills, qualifications, experience and performance within the Group. In doing so, the Committee recognises that levels of remuneration should be sufficient to attract, motivate and retain high-quality experienced executives, but also that the Group should avoid paying more than is necessary for this purpose.
3.4.15 Components of remuneration The components of remuneration for members of the OMC are the same as for the CEO, with any differences described below.
Section 3.3.3 for the components of CEO remuneration (including how remuneration links to strategy, how each component operates and how performance is assessed).
Fixed remunerationAs for the CEO, members of the OMC receive:• A competitive base salary that is appropriate to the role and
attracts and retains high-quality executives. • Pension contributions to a maximum of 25 per cent of base salary.• Relocation allowance and other benefits as determined by the
Remuneration Committee and of a similar nature to those received by the CEO, or as otherwise determined by local policy or practice in the location where the OMC member is located.
Section 3.4.20 for details of significant components of fixed remuneration for each member of the OMC.
STIMembers of the OMC are entitled to participate in the STIP on the same basis as the CEO.
Section 3.3.3 for details of the STIP, including the setting of performance measures, assessment of performance and delivery of awards in cash and deferred equity (including terms for malus and clawback).
Section 3.3.8 for the terms of STI awards on cessation of employment.
The performance measures for members of the OMC are similar to those of the CEO as determined by the Committee. However, the weighting of each performance measure will vary to reflect the focus required from each OMC role. In particular, there are different weightings for OMC members with specific commodity segment responsibilities. The relevant performance measures and weightings and the performance outcomes for FY2016 (as assessed by the Committee) are set out in the diagram below. The individual STI outcome for each OMC member has been determined with reference to the time spent in relevant roles during FY2016.
Section 3.4.6 for a comparable table of performance measures and outcomes for the CEO.
Section 3.4.20 for details of the STI amount provided to each member of the OMC for FY2016 performance.
The description of the STI outcomes for the CEO explains the FY2016 performance outcomes against targets for HSEC, UAP, Underlying EBIT and capital project management. This includes the material variations from target performance for BHP Billiton and for its separate commodity segments, which correspond to the commodity segment outcomes shown in the diagram below.
Individual performance measures are determined at the commencement of the financial year. These comprise each individual’s contribution to the OMC, delivery against projects and initiatives within the scope of his or her role and his or her contribution to the overall performance of the Group. Individual performance of OMC members was reviewed against these measures by the Committee and, on average, was considered slightly ahead of target.
However, as with the CEO, the Committee has also applied discretion to determine the final STI outcomes for other members of the OMC as follows:• Given the events at Samarco, along with the related financial
consequences, and the ongoing decline in commodity markets and its associated impact on the Company’s performance, the HSEC and Financial components of the scorecard have been reduced to zero for all OMC members;
• Given the holistic performance of BHP Billiton during FY2016, and all the considerations noted previously, the individual performance outcomes have been reduced by 50 per cent.
2 Governance at BH
P Billiton1 Strategic Report
4 D
irectors’ Report 3
Remuneration Report
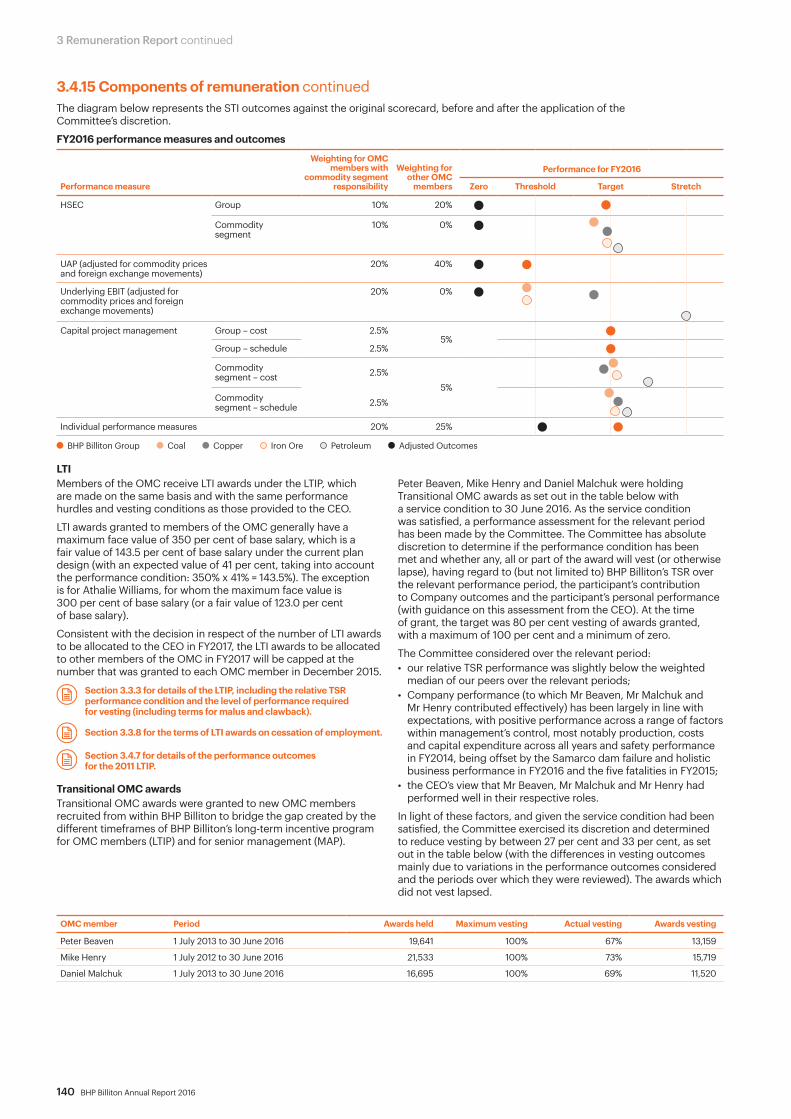
140 BHP Billiton Annual Report 2016
3 Remuneration Report continued
3.4.15 Components of remuneration continuedThe diagram below represents the STI outcomes against the original scorecard, before and after the application of the Committee’s discretion.
FY2016 performance measures and outcomes
Performance measure
Weighting for OMC members with
commodity segment responsibility
Weighting for other OMC
members
Performance for FY2016
Zero Threshold Target Stretch
HSEC Group 10% 20%
Commodity segment
10% 0%
UAP (adjusted for commodity prices and foreign exchange movements)
20% 40%
Underlying EBIT (adjusted for commodity prices and foreign exchange movements)
20% 0%
Capital project management Group – cost 2.5%5%
Group – schedule 2.5%
Commodity segment – cost 2.5%
5%Commodity segment – schedule 2.5%
Individual performance measures 20% 25%
BHP Billiton Group Coal Copper Iron Ore Petroleum Adjusted Outcomes
LTIMembers of the OMC receive LTI awards under the LTIP, which are made on the same basis and with the same performance hurdles and vesting conditions as those provided to the CEO.
LTI awards granted to members of the OMC generally have a maximum face value of 350 per cent of base salary, which is a fair value of 143.5 per cent of base salary under the current plan design (with an expected value of 41 per cent, taking into account the performance condition: 350% x 41% = 143.5%). The exception is for Athalie Williams, for whom the maximum face value is 300 per cent of base salary (or a fair value of 123.0 per cent of base salary).
Consistent with the decision in respect of the number of LTI awards to be allocated to the CEO in FY2017, the LTI awards to be allocated to other members of the OMC in FY2017 will be capped at the number that was granted to each OMC member in December 2015.
Section 3.3.3 for details of the LTIP, including the relative TSR performance condition and the level of performance required for vesting (including terms for malus and clawback).
Section 3.3.8 for the terms of LTI awards on cessation of employment.
Section 3.4.7 for details of the performance outcomes for the 2011 LTIP.
Transitional OMC awardsTransitional OMC awards were granted to new OMC members recruited from within BHP Billiton to bridge the gap created by the different timeframes of BHP Billiton’s long-term incentive program for OMC members (LTIP) and for senior management (MAP).
Peter Beaven, Mike Henry and Daniel Malchuk were holding Transitional OMC awards as set out in the table below with a service condition to 30 June 2016. As the service condition was satisfied, a performance assessment for the relevant period has been made by the Committee. The Committee has absolute discretion to determine if the performance condition has been met and whether any, all or part of the award will vest (or otherwise lapse), having regard to (but not limited to) BHP Billiton’s TSR over the relevant performance period, the participant’s contribution to Company outcomes and the participant’s personal performance (with guidance on this assessment from the CEO). At the time of grant, the target was 80 per cent vesting of awards granted, with a maximum of 100 per cent and a minimum of zero.
The Committee considered over the relevant period: • our relative TSR performance was slightly below the weighted
median of our peers over the relevant periods; • Company performance (to which Mr Beaven, Mr Malchuk and
Mr Henry contributed effectively) has been largely in line with expectations, with positive performance across a range of factors within management’s control, most notably production, costs and capital expenditure across all years and safety performance in FY2014, being offset by the Samarco dam failure and holistic business performance in FY2016 and the five fatalities in FY2015;
• the CEO’s view that Mr Beaven, Mr Malchuk and Mr Henry had performed well in their respective roles.
In light of these factors, and given the service condition had been satisfied, the Committee exercised its discretion and determined to reduce vesting by between 27 per cent and 33 per cent, as set out in the table below (with the differences in vesting outcomes mainly due to variations in the performance outcomes considered and the periods over which they were reviewed). The awards which did not vest lapsed.
OMC member Period Awards held Maximum vesting Actual vesting Awards vesting
Peter Beaven 1 July 2013 to 30 June 2016 19,641 100% 67% 13,159
Mike Henry 1 July 2012 to 30 June 2016 21,533 100% 73% 15,719
Daniel Malchuk 1 July 2013 to 30 June 2016 16,695 100% 69% 11,520

BHP Billiton Annual Report 2016 141
3.4.15 Components of remuneration continuedShareplus all-employee share purchase planParticipants in Shareplus, BHP Billiton’s all-employee share plan, contribute from their post-tax base salary (capped at US$5,000 per year) to acquire shares in BHP Billiton Limited or in BHP Billiton Plc. For each share purchase, the participant receives a right to acquire a Matched Share, which vests provided the participant remains employed by BHP Billiton on the third anniversary of the start of the relevant Shareplus plan year.
Like the CEO and other permanent employees, other members of the OMC are also eligible to participate in Shareplus. For administrative simplicity, members of the OMC do not currently participate in Shareplus. No member of the OMC had any holdings under the Shareplus program during FY2016 while a KMP.
Section 3.4.23 for information about the shareholdings of OMC members.
Equity awards provided for pre-OMC serviceMembers of the OMC who were promoted from executive roles within BHP Billiton may hold GSTIP and MAP awards that were granted to them in respect of their service in non-OMC roles.
Section 3.4.21 for details on these awards, including those which have vested during FY2016.
3.4.16 Remuneration mix The Group’s approach to remuneration for members of the OMC is that a significant portion should be ‘at risk’ to provide strong alignment between remuneration outcomes and the interests of BHP Billiton shareholders.
The diagram below sets out the relative mix of each remuneration component for other members of the OMC. Each component is determined as a percentage of base salary (at the minimum, target and maximum levels of performance-based remuneration).
Base salary (1)
Retirement benefitsOther benefits Cash STI(2) LTI (3)
Deferred STI (2)
0 10% 20% 30% 40% 50% 60% 70% 80% 90% 100%
% share of total remuneration
Minimum
Target
Maximum
Base salary 25% 1%
Base salary 25% 80% 80% 143%1%
1%25% 120% 120% 350%Base salary
Remuneration mix for other OMC membersThe percentage numbers in the bars represent the percentage of base salary
(1) Base salary earned by each member of the OMC is set out in section 3.4.20.(2) As for the CEO, the minimum STI award is zero with an award of 80 per cent of base salary in cash and 80 per cent in deferred equity for target performance
and a maximum award of 120 per cent cash and 120 per cent deferred equity for exceptional performance against KPIs.
Section 3.4.20 for actual cash STI awards for FY2016 performance, which are shown in the annual cash incentive column of the table.
(3) Other members of the OMC have a maximum LTI award with a face value of 350 per cent of base salary as shown in the chart, with the exception of Athalie Williams, who has a maximum LTI award with a face value of 300 per cent of base salary.
Section 3.4.21 for actual LTI awards for FY2016, which were granted on 4 December 2015.
2 Governance at BH
P Billiton1 Strategic Report
4 D
irectors’ Report 3
Remuneration Report

142 BHP Billiton Annual Report 2016
3 Remuneration Report continued
3.4.17 Employment contractsThe terms of employment for members of the OMC are formalised in employment contracts, which have no fixed term. They typically outline the components of remuneration paid to the individual, but do not prescribe how remuneration levels are to be modified from year-to-year. An OMC employment contract may be terminated by BHP Billiton on six months’ notice for all new OMC appointees since March 2014 or up to 12 months’ notice for prior OMC appointees. BHP Billiton can terminate a contract immediately by making a payment of up to 12 months’ base salary plus pension contributions for the relevant period. The OMC member must give six months’ notice for voluntary resignation.
Section 3.2.1 for members of the OMC (including the date they commenced in their role if during the current financial year).
3.4.18 Arrangements for OMC members leaving the Group after 30 June 2016The arrangements for OMC members leaving the Group are within the approval provided by shareholders at the 2014 AGMs in regard to Australian termination benefits legislation, including the provision of performance-based remuneration in accordance with the rules of the relevant incentive plans.
Tim Cutt and Jimmy Wilson stepped down from their roles as President, Petroleum and President, Iron Ore, respectively, on the OMC on 29 February 2016 and exited BHP Billiton on 1 July 2016.
Mr Cutt and Mr Wilson received base salary, pension contributions, STI and applicable benefits up to the date of their exit from BHP Billiton. Both Mr Cutt and Mr Wilson received a payment in lieu of notice upon exit and have been paid or will receive in the future the value of pension and superannuation funds that they have accumulated during their service with the Group. Mr Cutt and Mr Wilson were paid the value of their statutory leave entitlements. When determining the OMC STI awards for FY2016, the Remuneration Committee resolved that Mr Cutt and Mr Wilson would receive FY2016 STI awards in the form of cash based on their respective performance. No deferral period will apply in respect of these cash STI awards.
All unvested awards allocated to Mr Cutt and Mr Wilson in respect of the FY2014 STIP and FY2015 STIP remained on foot and vested in August 2016 and will not vest until August 2017, respectively. Mr Cutt’s unvested Transitional OMC awards and Mr Wilson’s unvested LTIP awards and Transitional OMC awards were pro-rated to reflect the percentage of the performance period that had elapsed to 1 July 2016. The vesting of the retained pro-rated awards will be determined by the Committee at the relevant time in future years. Mr Cutt’s LTIP awards lapsed on exit and Mr Wilson’s LTIP awards will only vest if the performance condition is met at the end of each five-year performance period, subject to the Committee’s ability to reduce vesting through its discretion under the plan rules.
3.4.19 Arrangements for employees ceasing to be OMC members during FY2016Tony Cudmore stepped down from his role as Chief Public Affairs Officer on the OMC on 3 April 2016, however, has remained employed by BHP Billiton in a non-OMC role. No payments to Mr Cudmore have been accelerated and no equity awards have been forfeited or vested early.
Dean Dalla Valle was assigned to lead BHP Billiton’s response to the Samarco dam failure on 14 January 2016 in a non-OMC role. Under the rules of the retirement savings plan (which he participated in while a member of the OMC), upon ceasing to be an OMC member Mr Dalla Valle has been paid the funds accumulated under the plan. No other payments to Mr Dalla Valle have been accelerated and no equity awards have been forfeited or vested early.
All of Mr Cudmore’s and Mr Dalla Valle’s statutory leave entitlements continue to accrue under normal employee arrangements. When determining the OMC STI awards for FY2016, the Remuneration Committee resolved that Mr Cudmore and Mr Dalla Valle would receive a FY2016 award under the STIP for the period until they each stepped down from the OMC. All other terms and conditions of the STIP will continue to apply to the awards. STI arrangements will apply on a similar basis as for other management employees for the subsequent period in their non-OMC roles.
All unvested awards allocated to Mr Cudmore and Mr Dalla Valle in respect of the FY2014 STIP and FY2015 STIP remained on foot and vested in August 2016 and will not vest until August 2017, respectively. Mr Cudmore’s and Mr Dalla Valle’s unvested LTIP awards and Mr Dalla Valle’s Transitional OMC awards remain on foot with vesting to be determined by the Committee at the relevant time in future years. The LTIP awards will only vest if the performance condition is met at the end of each five-year performance period, subject to the Committee’s ability to reduce vesting through its discretion under the plan rules.

BHP Billiton Annual Report 2016 143
Other statutory disclosuresThis section provides details of any additional statutory disclosures required by Australian or UK regulations that have not been included in the previous sections of the Remuneration Report.
3.4.20 OMC remuneration tableThe table below has been prepared in accordance with relevant accounting standards. Where applicable, remuneration data for members of the OMC are pro-rated for the periods of FY2015 and FY2016 that they were KMP. Steve Pastor joined the OMC and became KMP during FY2016 and there is no relevant FY2015 comparison. Tony Cudmore, Tim Cutt, Dean Dalla Valle and Jimmy Wilson ceased being KMP during FY2016.
More information on the policy and operation of each element of remuneration is provided in prior sections of this Report.
Share-based paymentsThe figures included in the shaded columns of the statutory table below for share-based payments were not actually provided to the KMP during FY2015 or FY2016. These amounts are calculated in accordance with accounting standards and are the amortised IFRS fair values of equity and equity-related instruments that have been granted to the executives for FY2015 and FY2016 performance or that of prior financial years. Please refer to section 3.4.21 for information on awards allocated during FY2015 and FY2016. A further explanation of the share-based payments terms used in the table is provided in the relevant footnotes.
US$(‘000)
Financial
year
Short-term benefits
Post- employment
benefits Share-based payments
Base salary (1)
Annual cash
incentive (2)
Non-monetary
benefits (3)Other
benefits (4)Retirement
benefits (5)
Value of STIand Shareplus
awards (2) (6)Value of LTI
awards (7) Total
Executive Director
Andrew Mackenzie
FY2016 1,700 0 116 – 425 874 2,792 5,907
FY2015 1,700 1,156 145 – 425 1,163 2,345 6,934
Other OMC members
Peter Beaven
FY2016 1,000 208 2 – 250 558 1,258 3,276
FY2015 1,000 680 32 700 250 667 1,259 4,588
Tony Cudmore
FY2016 569 91 – – 142 227 402 1,431
FY2015 750 552 – – 188 269 312 2,071
Tim Cutt
FY2016 666 139 4 – 166 752 836 2,563
FY2015 1,000 816 5 – 250 787 1,187 4,045
Dean Dalla Valle
FY2016 537 104 – – 134 297 677 1,749
FY2015 1,000 680 – 58 250 657 1,187 3,832
Geoff Healy
FY2016 1,000 184 59 – 250 615 987 3,095
FY2015 1,000 816 44 – 250 555 651 3,316
Mike Henry
FY2016 1,100 202 15 53 275 634 1,563 3,842
FY2015 1,100 757 16 58 275 830 1,362 4,398
Daniel Malchuk
FY2016 1,000 184 10 440 250 534 1,176 3,594
FY2015 1,000 680 33 – 250 589 1,057 3,609
Steve Pastor FY2016 267 51 – – 67 83 237 705
Athalie Williams FY2016 750 144 4 – 188 246 597 1,929
FY2015 372 294 – 580 93 57 104 1,500
Jimmy Wilson
FY2016 666 107 – – 166 655 836 2,430
FY2015 1,000 816 – – 250 739 1,259 4,064
(1) Base salaries shown in this table reflect the amounts paid over the 12-month period from 1 July 2015 to 30 June 2016 for each executive (or for the relevant period that they were KMP as set out above the table). No changes to salaries occurred during FY2016 except for Steve Pastor who was appointed to the OMC during the year on a base salary of US$0.800 million.
Section 3.3.3 and 3.4.15 for base salary policy and operation.
(2) Annual cash incentive is the cash portion of STI awards earned in respect of performance during each financial year for each executive (or for the relevant period that they were KMP as set out above the table).
Section 3.3.3, 3.4.6 and 3.4.15 for STI policy and operation and FY2016 STI outcomes.
STI is provided half in cash and half in deferred equity (which are included in the share-based payments columns of the table). The minimum possible value awarded to each individual is nil. The maximum STI is 240 per cent of base salary (120 per cent in cash and 120 per cent in deferred equity). For FY2016, OMC members earned the following STI awards as a percentage of the maximum (the remaining portion has not been earned (i.e. has been ‘forfeited’)): Andrew Mackenzie 0 per cent, Peter Beaven 17 per cent, Tony Cudmore 13 per cent, Tim Cutt 17 per cent, Dean Dalla Valle 16 per cent, Geoff Healy 15 per cent, Mike Henry 15 per cent, Daniel Malchuk 15 per cent, Steve Pastor 16 per cent, Athalie Williams 16 per cent and Jimmy Wilson 13 per cent.
(3) Non-monetary benefits are non-pensionable and include such items as health and other insurances and fees for tax return preparation (if required in multiple jurisdictions). This item also includes the cost of domestic flights for Geoff Healy as part of approved commuting arrangements and travel for Mrs Mackenzie to accompany the CEO on business-related travel.
(4) Other benefits are non-pensionable and included one-off international relocation allowances (with no trailing entitlements) provided to Peter Beaven and Athalie Williams in FY2015 and Danny Malchuk in FY2016. Dean Dalla Valle (FY2015) and Mike Henry (FY2015 and FY2016) also received domestic relocation allowances.
(5) Retirement benefits are 25 per cent of base salary for each OMC member.
2 Governance at BH
P Billiton1 Strategic Report
4 D
irectors’ Report 3
Remuneration Report

144 BHP Billiton Annual Report 2016
3 Remuneration Report continued
3.4.20 OMC remuneration table continued(6) The value of STI awards includes the estimated IFRS fair value of STI awards provided as deferred equity or cash-settled share-based payments under the GIS, GSTIP
and STIP. Awards may be paid in the form of cash where the individual ceases employment prior to the scheduled allocation date of the STI awards (in December 2015 for FY2016 awards). These share-based payments may also be forfeited after allocation in specific circumstances as described in section 3.3.8 and therefore the minimum possible value of the awards is nil. The maximum possible value cannot be determined as it depends on future share price movements, but is estimated by the IFRS fair value used for accounting purposes in this table.The IFRS fair value of the STI awards is estimated at grant date by discounting the total value of the shares that will be issued in the future using the risk-free interest rate for the period to the date of award. Participants who are provided with awards under the GIS and STIP are entitled to a DEP in lieu of the dividends that would have been payable on ordinary BHP Billiton shares over the period from the allocation date to the time they receive ordinary shares in BHP Billiton. Prior to FY2011 awards, a similar DEP entitlement applied to GSTIP awards. This is not the case with awards allocated since October 2011. From FY2011, there was a change in accounting policy to account for the DEP from cash-settled to equity-settled. STI awards are granted to OMC participants following the relevant AGMs (awards to the CEO are subject to shareholder approval). If employment ceases prior to that scheduled allocation of equity awards, the value of the awards may be provided in cash, but would still be included in this column of the table. Once awarded, there is a vesting condition that requires participants to remain in employment for a further two years. Accordingly, the number of securities (if any) that will ultimately vest cannot be determined until the service period has been completed. The IFRS fair value of STI awards is apportioned to annual remuneration based on the expected future service period, which is normally three years (being the performance year in which the STI is earned and the subsequent two-year service period). The vesting of STI awards may be accelerated in the event of leaving the Group, in which case the expected future service period is amended.The value of Shareplus awards includes the estimated IFRS fair value of rights to Matched Shares acquired during each share purchase period under the Shareplus program. These rights are acquired on each of the quarterly share purchase dates under the program (grant dates) and the IFRS fair value is apportioned to annual remuneration based on the future service period required for the Matched Shares to be allocated (i.e. the vesting date of the rights). Where entitlements to the Matched Shares are accelerated on leaving the Group, the expected future service period is amended.
Section 3.4.21 for the actual numbers of awards allocated to and held by members of the OMC.
(7) The value of LTI awards includes the estimated IFRS fair value of awards provided under the LTIP, MAP and as Transitional OMC awards which are defined as equity-settled share-based payments. These share-based payments may also be forfeited after allocation in specific circumstances as described in section 3.3.8 and therefore the minimum possible value of the awards is nil. The maximum possible value cannot be determined as it depends on future share price movements, but is estimated by the IFRS fair value used for accounting purposes in this table. The amount in respect of each award under the LTIP is the estimated IFRS fair value of the award using a Monte Carlo simulation methodology taking account of the performance condition, the term of the award, the share price at grant date, the expected price volatility of the underlying share, the risk-free interest rate for the term of the award and the value of the DEP that will be received on exercise of the award. The IFRS fair value of each award is apportioned to annual remuneration in equal amounts to each of the years in the expected future service period, which is normally five years. Where entitlements to LTI awards are preserved on leaving the Group, the expected future service period is amended.
Section 3.4.21 for the actual numbers of awards allocated to and held by members of the OMC.
This column also includes an amount allocated to remuneration in FY2015 and in FY2016 in respect of cash-settled share-based awards received by Mr Mackenzie on commencement of employment with BHP Billiton, which vested during FY2013. The final value of the awards will be determined at the time that Mr Mackenzie chooses to redeem the award and this column will incorporate an annual true-up amount until that time. For FY2016, the true-up value of Mr Mackenzie’s cash-settled share-based award is negative US$0.217 million and the equity-settled share-based awards are US$3.009 million. Full details of the award and the relevant terms and conditions were provided in the FY2013 Annual Report.
3.4.21 Equity awardsThe interests held by members of the OMC under the Group’s employee equity plans are set out below. Each equity award is a right to acquire one ordinary share in BHP Billiton Limited or in BHP Billiton Plc upon satisfaction of the vesting conditions. The vesting conditions will include performance and/or service requirements as relevant to the purpose of the award and as described in each of the following sections. BHP Billiton Limited share awards are shown in Australian dollars. BHP Billiton Plc awards are shown in pounds sterling. Our Requirements for Securities Dealing standard governs and restricts dealing arrangements and the provision of shares on vesting or exercise of awards.
Dividend Equivalent PaymentsThe awards are not ordinary shares and do not carry entitlements to ordinary dividends or other shareholder rights. Dividends are not received by the executives during the vesting period. For awards provided under the GIS, STIP and LTIP, a DEP is provided to cover dividends that would have been payable on ordinary BHP Billiton shares over the period from the allocation date to the time that the holder receives ordinary shares in BHP Billiton in respect of the award (on vesting or on exercise). A DEP is only provided for awards that have vested. No DEP is made for awards that are forfeited or lapse.
Equity awards provided for OMC serviceSTI awards under the STIP and GISAwards under the STIP will not deliver any value to the holder for at least two years from the beginning of the financial year in which they are granted (unless the executive’s employment with the Group ends earlier in specific circumstances, such as on death, serious injury, disability or illness that prohibits continued employment, or total and permanent disablement).
The STIP applied from FY2014, with awards allocated from December 2014. Prior to the STIP, awards were allocated under the GIS with largely the same terms and conditions.
LTI awards under the LTIPAwards under the LTIP will not deliver any value to the holder for at least five years from the beginning of the financial year in which they are granted (unless the executive’s employment with the Group ends earlier in specific circumstances, such as on death,
serious injury, disability or illness that prohibits continued employment, or total and permanent disablement).
The current LTIP is effective for grants from December 2013. The terms and conditions, including the performance conditions, are described in sections 3.3.3 and 3.3.8 of this Report and are largely the same as the former LTIP. The LTIP rules are available on the BHP Billiton website.
Transitional OMC awardsAs the MAP awards that are allocated to individuals in their non-OMC management positions have a three-year service condition and the LTIP awards provided to OMC members have a five-year service and performance condition, as a transitional step the Remuneration Committee may determine that new OMC members recruited from within BHP Billiton receive Transitional OMC awards to bridge the gap between the two programs.
Transitional OMC awards have two tranches. Tranche one has a three-year service and performance condition. Tranche two has a four-year service and performance condition. The Committee has absolute discretion to determine if the performance condition has been met and whether any, all or part of the award will vest (or otherwise lapse), having regard to (but not limited to) BHP Billiton’s TSR over the three- or four-year performance period (respectively), the participant’s contribution to Group outcomes and the participant’s personal performance (with guidance on this assessment from the CEO). No DEP is payable on Transitional OMC awards.
The treatment of Transitional OMC awards on cessation of employment will depend on the circumstances and is similar to those for LTIP awards. If the participant’s employment ceases due to dismissal or resignation, any unvested awards will lapse immediately. If the reason for cessation is death, serious injury, disability or illness, then the awards will vest in full on the date of cessation. If the participant retires from the Group with the agreement of BHP Billiton, is made redundant or employment is terminated by mutual agreement, then a proportion of the award (pro-rated to reflect the percentage of the performance period that has elapsed) will continue on foot and vest, subject to the performance condition, on the future vesting date. The remaining portion of the award will lapse. In all other circumstances, the Committee in its absolute discretion will determine the portion of the award that vests (or lapses).

BHP Billiton Annual Report 2016 145
Equity awards provided for pre-OMC serviceSTI awards under the GSTIPSTI awards that were held by the executives at the time that they were appointed to the OMC or which were allocated for performance and service before they became OMC members were allocated under the GSTIP. The GSTIP has applied for the non-OMC management of BHP Billiton since the awards allocated in FY2009 (for FY2008 performance).
The terms and conditions of the GSTIP awards are essentially the same as those provided under the STIP and the GIS. Under each plan, participants must satisfy applicable STl performance conditions to be eligible for any award. No DEP is payable on the GSTIP awards.
LTI awards under the MAPLTI awards that were held by the executives at the time that they were appointed to the OMC were allocated under the MAP which has applied for non-OMC management since FY2009. As the primary purpose of the MAP is the retention of key senior management employees, the plan has no performance conditions after awards are granted and the vesting of MAP awards is subject to continued employment with the Group through to the vesting date as shown in the table. Where a participant resigns or is terminated for cause prior to the vesting date, their unvested MAP awards are forfeited. If a participant’s employment ends due to redundancy, retirement, death, illness or injury, a pro rata number of unvested awards will vest based on the portion of the relevant vesting period served. No DEP is payable on the MAP awards.
Award type Date of grant
At1 July2015 Granted Vested Lapsed Exercised
At 30 June
2016
Awardvesting
date (1)
Market price on date of: Gain onawards(‘000) (5)
DEP onawards (‘000)Grant (2) Vesting (3) Exercise (4)
Andrew Mackenzie
STIP 4 Dec 2015 – 69,566 – – – 69,566 Aug 17 A$17.93 – – – –STIP 19 Dec 2014 73,527 – – – – 73,527 Aug 16 A$28.98 – – – –GIS 18 Dec 2013 30,312 – 30,312 – – – 27 Aug 2015 A$35.79 A$24.06 – A$729 A$68GIS (6) 6 Dec 2010 30,389 – – 30,389 – – 2 Oct 2012 £24.40 £19.45 – – –LTIP 4 Dec 2015 – 339,753 – – – 339,753 Aug 20 A$17.93 – – – –LTIP 19 Dec 2014 224,859 – – – – 224,859 Aug 19 A$28.98 – – – –LTIP 18 Dec 2013 213,701 – – – – 213,701 Aug 18 A$35.79 – – – –LTIP 5 Dec 2012 151,609 – – – – 151,609 Aug 17 £19.98 – – – –LTIP 5 Dec 2011 158,290 – – – – 158,290 Aug 16 £20.12 – – – –LTIP 6 Dec 2010 129,648 – – 129,648 – – 27 Aug 2015 £24.40 – – – –
Peter Beaven
STIP 4 Dec 2015 – 40,921 – – – 40,921 Aug 17 A$17.93 – – – –STIP 19 Dec 2014 39,837 – – – – 39,837 Aug 16 A$28.98 – – – –GIS 18 Dec 2013 2,609 – 2,609 – – – 27 Aug 2015 A$35.79 A$24.06 – A$63 A$6LTIP 4 Dec 2015 – 174,873 – – – 174,873 Aug 20 A$17.93 – – – –LTIP 19 Dec 2014 115,736 – – – – 115,736 Aug 19 A$28.98 – – – –LTIP 18 Dec 2013 109,993 – – – – 109,993 Aug 18 A$35.79 – – – –Transitional 18 Dec 2013 19,641 – – – – 19,641 Aug 17 A$35.79 – – – –Transitional 18 Dec 2013 19,641 – – – – 19,641 Aug 16 A$35.79 – – – –GSTIP 18 Dec 2013 13,007 – 13,007 – – – 27 Aug 2015 A$35.79 A$24.06 – A$313 –MAP 31 Oct 2012 36,871 – 36,871 – – – 27 Aug 2015 A$34.25 A$24.06 – A$887 –
Tony Cudmore (7)
STIP 4 Dec 2015 – 33,218 – – – 33,218 Aug 17 A$17.93 – – – –STIP 19 Dec 2014 10,479 – – – – 10,479 Aug 16 A$28.98 – – – –LTIP 4 Dec 2015 – 112,418 – – – 112,418 Aug 20 A$17.93 – – – –LTIP 19 Dec 2014 74,402 – – – – 74,402 Aug 19 A$28.98 – – – –LTIP 3 Mar 2014 23,977 – – – – 23,977 Aug 18 A$37.40 – – – –
Tim Cutt (7)
STIP 4 Dec 2015 – 49,105 – – – 49,105 Aug 17 A$17.93 – – – –STIP 19 Dec 2014 40,662 – – – – 40,662 Aug 16 A$28.98 – – – –LTIP 4 Dec 2015 – 174,873 – – – 174,873 Aug 20 A$17.93 – – – –LTIP 19 Dec 2014 115,736 – – – – 115,736 Aug 19 A$28.98 – – – –LTIP 18 Dec 2013 109,993 – – – – 109,993 Aug 18 A$35.79 – – – –Transitional 18 Dec 2013 19,641 – – – – 19,641 Aug 17 A$35.79 – – – –Transitional 18 Dec 2013 19,641 – – – – 19,641 Aug 16 A$35.79 – – – –GSTIP 18 Dec 2013 11,451 – 11,451 – – – 27 Aug 2015 A$35.79 A$24.06 – A$276 –MAP 14 Nov 2012 29,066 – 29,066 – – – 27 Aug 2015 A$33.73 A$24.06 – A$699 –
Dean Dalla Vale (7)
STIP 4 Dec 2015 – 40,921 – – – 40,921 Aug 17 A$17.93 – – – –STIP 19 Dec 2014 43,888 – – – – 43,888 Aug 16 A$28.98 – – – –GIS 18 Dec 2013 2,040 – 2,040 – – – 27 Aug 2015 A$35.79 A$24.06 – A$49 A$5LTIP 4 Dec 2015 – 174,873 – – – 174,873 Aug 20 A$17.93 – – – –LTIP 19 Dec 2014 115,736 – – – – 115,736 Aug 19 A$28.98 – – – –LTIP 18 Dec 2013 109,993 – – – – 109,993 Aug 18 A$35.79 – – – –Transitional 18 Dec 2013 19,641 – – – – 19,641 Aug 17 A$35.79 – – – –Transitional 18 Dec 2013 19,641 – – – – 19,641 Aug 16 A$35.79 – – – –GSTIP 18 Dec 2013 10,775 – 10,775 – – – 27 Aug 2015 A$35.79 A$24.06 – A$259 –MAP 31 Oct 2012 29,066 – 29,066 – – – 27 Aug 2015 A$34.25 A$24.06 – A$699 –
Geoff Healy
STIP 4 Dec 2015 – 49,105 – – – 49,105 Aug 17 A$17.93 – – – –STIP 19 Dec 2014 42,875 – – – – 42,875 Aug 16 A$28.98 – – – –LTIP 4 Dec 2015 – 174,873 – – – 174,873 Aug 20 A$17.93 – – – –LTIP 19 Dec 2014 115,736 – – – – 115,736 Aug 19 A$28.98 – – – –LTIP 18 Dec 2013 109,993 – – – – 109,993 Aug 18 A$35.79 – – – –
2 Governance at BH
P Billiton1 Strategic Report
4 D
irectors’ Report 3
Remuneration Report
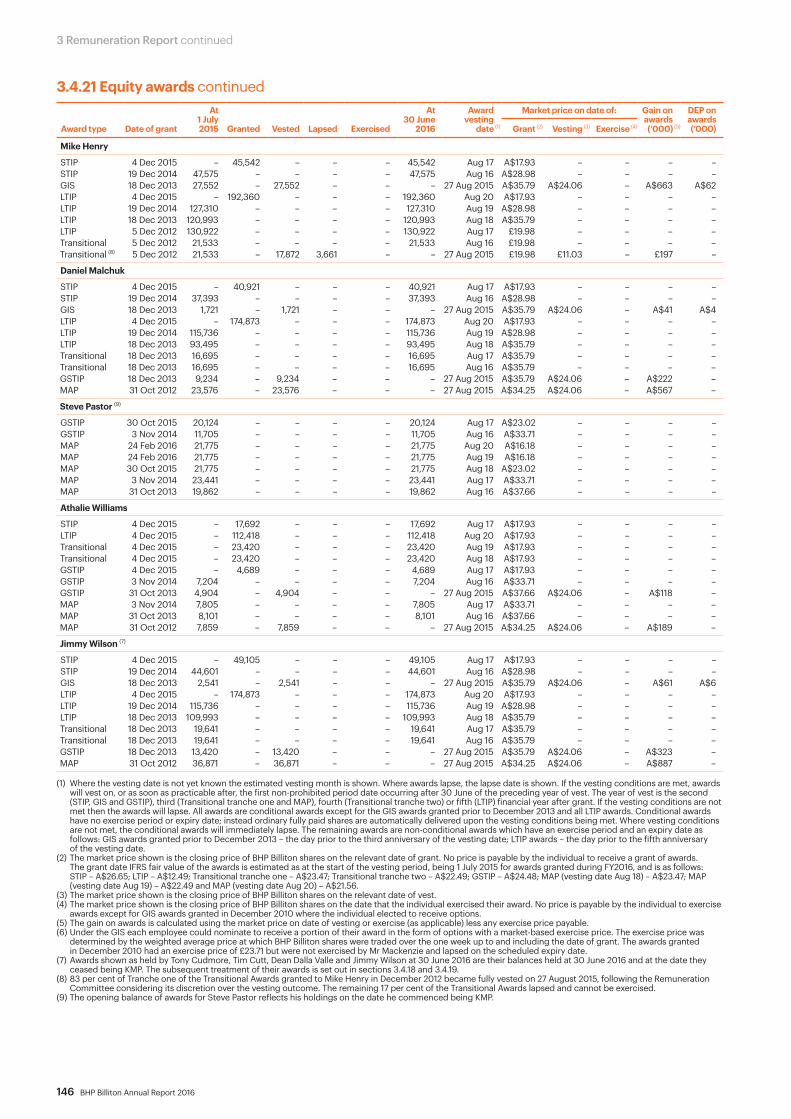
146 BHP Billiton Annual Report 2016
3 Remuneration Report continued
Award type Date of grant
At1 July2015 Granted Vested Lapsed Exercised
At 30 June
2016
Awardvesting
date (1)
Market price on date of: Gain onawards(‘000) (5)
DEP onawards (‘000)Grant (2) Vesting (3) Exercise (4)
Mike Henry
STIP 4 Dec 2015 – 45,542 – – – 45,542 Aug 17 A$17.93 – – – –STIP 19 Dec 2014 47,575 – – – – 47,575 Aug 16 A$28.98 – – – –GIS 18 Dec 2013 27,552 – 27,552 – – – 27 Aug 2015 A$35.79 A$24.06 – A$663 A$62LTIP 4 Dec 2015 – 192,360 – – – 192,360 Aug 20 A$17.93 – – – –LTIP 19 Dec 2014 127,310 – – – – 127,310 Aug 19 A$28.98 – – – –LTIP 18 Dec 2013 120,993 – – – – 120,993 Aug 18 A$35.79 – – – –LTIP 5 Dec 2012 130,922 – – – – 130,922 Aug 17 £19.98 – – – –Transitional 5 Dec 2012 21,533 – – – – 21,533 Aug 16 £19.98 – – – –Transitional (8) 5 Dec 2012 21,533 – 17,872 3,661 – – 27 Aug 2015 £19.98 £11.03 – £197 –
Daniel Malchuk
STIP 4 Dec 2015 – 40,921 – – – 40,921 Aug 17 A$17.93 – – – –STIP 19 Dec 2014 37,393 – – – – 37,393 Aug 16 A$28.98 – – – –GIS 18 Dec 2013 1,721 – 1,721 – – – 27 Aug 2015 A$35.79 A$24.06 – A$41 A$4LTIP 4 Dec 2015 – 174,873 – – – 174,873 Aug 20 A$17.93 – – – –LTIP 19 Dec 2014 115,736 – – – – 115,736 Aug 19 A$28.98 – – – –LTIP 18 Dec 2013 93,495 – – – – 93,495 Aug 18 A$35.79 – – – –Transitional 18 Dec 2013 16,695 – – – – 16,695 Aug 17 A$35.79 – – – –Transitional 18 Dec 2013 16,695 – – – – 16,695 Aug 16 A$35.79 – – – –GSTIP 18 Dec 2013 9,234 – 9,234 – – – 27 Aug 2015 A$35.79 A$24.06 – A$222 –MAP 31 Oct 2012 23,576 – 23,576 – – – 27 Aug 2015 A$34.25 A$24.06 – A$567 –
Steve Pastor (9)
GSTIP 30 Oct 2015 20,124 – – – – 20,124 Aug 17 A$23.02 – – – –GSTIP 3 Nov 2014 11,705 – – – – 11,705 Aug 16 A$33.71 – – – –MAP 24 Feb 2016 21,775 – – – – 21,775 Aug 20 A$16.18 – – – –MAP 24 Feb 2016 21,775 – – – – 21,775 Aug 19 A$16.18 – – – –MAP 30 Oct 2015 21,775 – – – – 21,775 Aug 18 A$23.02 – – – –MAP 3 Nov 2014 23,441 – – – – 23,441 Aug 17 A$33.71 – – – –MAP 31 Oct 2013 19,862 – – – – 19,862 Aug 16 A$37.66 – – – –
Athalie Williams
STIP 4 Dec 2015 – 17,692 – – – 17,692 Aug 17 A$17.93 – – – –LTIP 4 Dec 2015 – 112,418 – – – 112,418 Aug 20 A$17.93 – – – –Transitional 4 Dec 2015 – 23,420 – – – 23,420 Aug 19 A$17.93 – – – –Transitional 4 Dec 2015 – 23,420 – – – 23,420 Aug 18 A$17.93 – – – –GSTIP 4 Dec 2015 – 4,689 – – – 4,689 Aug 17 A$17.93 – – – –GSTIP 3 Nov 2014 7,204 – – – – 7,204 Aug 16 A$33.71 – – – –GSTIP 31 Oct 2013 4,904 – 4,904 – – – 27 Aug 2015 A$37.66 A$24.06 – A$118 –MAP 3 Nov 2014 7,805 – – – – 7,805 Aug 17 A$33.71 – – – –MAP 31 Oct 2013 8,101 – – – – 8,101 Aug 16 A$37.66 – – – –MAP 31 Oct 2012 7,859 – 7,859 – – – 27 Aug 2015 A$34.25 A$24.06 – A$189 –
Jimmy Wilson (7)
STIP 4 Dec 2015 – 49,105 – – – 49,105 Aug 17 A$17.93 – – – –STIP 19 Dec 2014 44,601 – – – – 44,601 Aug 16 A$28.98 – – – –GIS 18 Dec 2013 2,541 – 2,541 – – – 27 Aug 2015 A$35.79 A$24.06 – A$61 A$6LTIP 4 Dec 2015 – 174,873 – – – 174,873 Aug 20 A$17.93 – – – –LTIP 19 Dec 2014 115,736 – – – – 115,736 Aug 19 A$28.98 – – – –LTIP 18 Dec 2013 109,993 – – – – 109,993 Aug 18 A$35.79 – – – –Transitional 18 Dec 2013 19,641 – – – – 19,641 Aug 17 A$35.79 – – – –Transitional 18 Dec 2013 19,641 – – – – 19,641 Aug 16 A$35.79 – – – –GSTIP 18 Dec 2013 13,420 – 13,420 – – – 27 Aug 2015 A$35.79 A$24.06 – A$323 –MAP 31 Oct 2012 36,871 – 36,871 – – – 27 Aug 2015 A$34.25 A$24.06 – A$887 –
(1) Where the vesting date is not yet known the estimated vesting month is shown. Where awards lapse, the lapse date is shown. If the vesting conditions are met, awards will vest on, or as soon as practicable after, the first non-prohibited period date occurring after 30 June of the preceding year of vest. The year of vest is the second (STIP, GIS and GSTIP), third (Transitional tranche one and MAP), fourth (Transitional tranche two) or fifth (LTIP) financial year after grant. If the vesting conditions are not met then the awards will lapse. All awards are conditional awards except for the GIS awards granted prior to December 2013 and all LTIP awards. Conditional awards have no exercise period or expiry date; instead ordinary fully paid shares are automatically delivered upon the vesting conditions being met. Where vesting conditions are not met, the conditional awards will immediately lapse. The remaining awards are non-conditional awards which have an exercise period and an expiry date as follows: GIS awards granted prior to December 2013 – the day prior to the third anniversary of the vesting date; LTIP awards – the day prior to the fifth anniversary of the vesting date.
(2) The market price shown is the closing price of BHP Billiton shares on the relevant date of grant. No price is payable by the individual to receive a grant of awards. The grant date IFRS fair value of the awards is estimated as at the start of the vesting period, being 1 July 2015 for awards granted during FY2016, and is as follows: STIP – A$26.65; LTIP – A$12.49; Transitional tranche one – A$23.47; Transitional tranche two – A$22.49; GSTIP – A$24.48; MAP (vesting date Aug 18) – A$23.47; MAP (vesting date Aug 19) – A$22.49 and MAP (vesting date Aug 20) – A$21.56.
(3) The market price shown is the closing price of BHP Billiton shares on the relevant date of vest.(4) The market price shown is the closing price of BHP Billiton shares on the date that the individual exercised their award. No price is payable by the individual to exercise
awards except for GIS awards granted in December 2010 where the individual elected to receive options.(5) The gain on awards is calculated using the market price on date of vesting or exercise (as applicable) less any exercise price payable.(6) Under the GIS each employee could nominate to receive a portion of their award in the form of options with a market-based exercise price. The exercise price was
determined by the weighted average price at which BHP Billiton shares were traded over the one week up to and including the date of grant. The awards granted in December 2010 had an exercise price of £23.71 but were not exercised by Mr Mackenzie and lapsed on the scheduled expiry date.
(7) Awards shown as held by Tony Cudmore, Tim Cutt, Dean Dalla Valle and Jimmy Wilson at 30 June 2016 are their balances held at 30 June 2016 and at the date they ceased being KMP. The subsequent treatment of their awards is set out in sections 3.4.18 and 3.4.19.
(8) 83 per cent of Tranche one of the Transitional Awards granted to Mike Henry in December 2012 became fully vested on 27 August 2015, following the Remuneration Committee considering its discretion over the vesting outcome. The remaining 17 per cent of the Transitional Awards lapsed and cannot be exercised.
(9) The opening balance of awards for Steve Pastor reflects his holdings on the date he commenced being KMP.
3.4.21 Equity awards continued
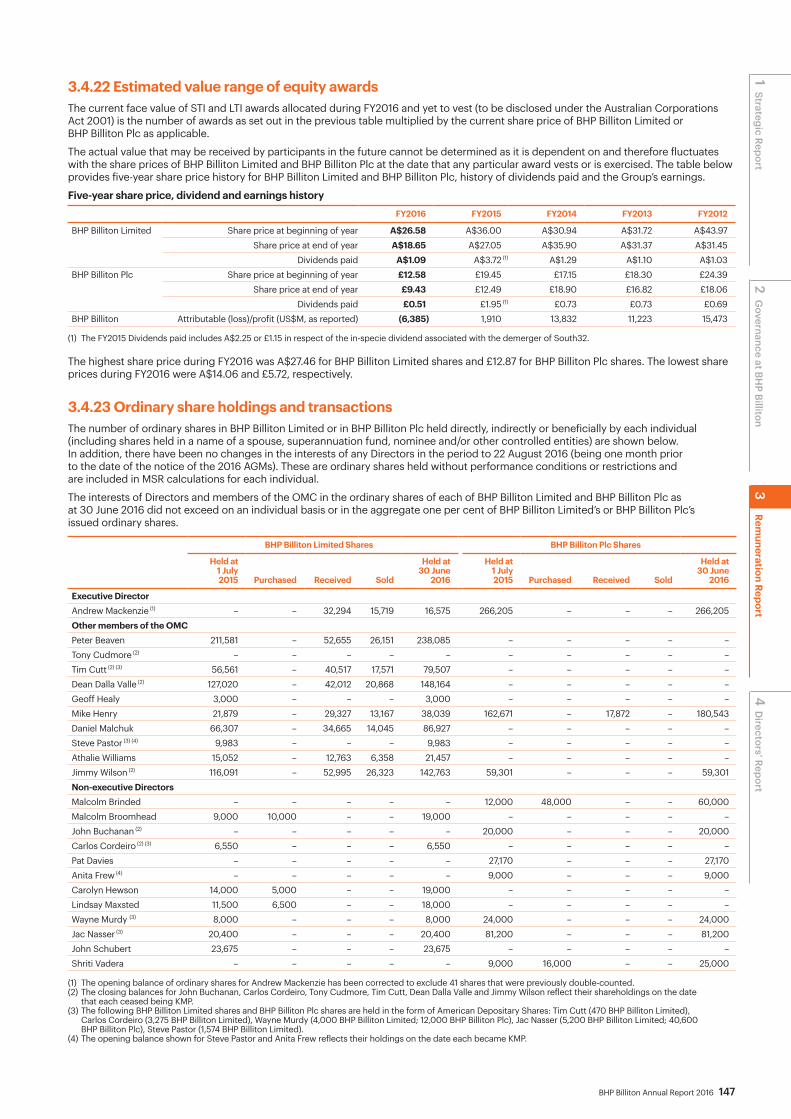
BHP Billiton Annual Report 2016 147
3.4.22 Estimated value range of equity awardsThe current face value of STI and LTI awards allocated during FY2016 and yet to vest (to be disclosed under the Australian Corporations Act 2001) is the number of awards as set out in the previous table multiplied by the current share price of BHP Billiton Limited or BHP Billiton Plc as applicable.
The actual value that may be received by participants in the future cannot be determined as it is dependent on and therefore fluctuates with the share prices of BHP Billiton Limited and BHP Billiton Plc at the date that any particular award vests or is exercised. The table below provides five-year share price history for BHP Billiton Limited and BHP Billiton Plc, history of dividends paid and the Group’s earnings.
Five-year share price, dividend and earnings historyFY2016 FY2015 FY2014 FY2013 FY2012
BHP Billiton Limited Share price at beginning of year A$26.58 A$36.00 A$30.94 A$31.72 A$43.97Share price at end of year A$18.65 A$27.05 A$35.90 A$31.37 A$31.45
Dividends paid A$1.09 A$3.72 (1) A$1.29 A$1.10 A$1.03BHP Billiton Plc Share price at beginning of year £12.58 £19.45 £17.15 £18.30 £24.39
Share price at end of year £9.43 £12.49 £18.90 £16.82 £18.06Dividends paid £0.51 £1.95 (1) £0.73 £0.73 £0.69
BHP Billiton Attributable (loss)/profit (US$M, as reported) (6,385) 1,910 13,832 11,223 15,473
(1) The FY2015 Dividends paid includes A$2.25 or £1.15 in respect of the in-specie dividend associated with the demerger of South32.
The highest share price during FY2016 was A$27.46 for BHP Billiton Limited shares and £12.87 for BHP Billiton Plc shares. The lowest share prices during FY2016 were A$14.06 and £5.72, respectively.
3.4.23 Ordinary share holdings and transactionsThe number of ordinary shares in BHP Billiton Limited or in BHP Billiton Plc held directly, indirectly or beneficially by each individual (including shares held in a name of a spouse, superannuation fund, nominee and/or other controlled entities) are shown below. In addition, there have been no changes in the interests of any Directors in the period to 22 August 2016 (being one month prior to the date of the notice of the 2016 AGMs). These are ordinary shares held without performance conditions or restrictions and are included in MSR calculations for each individual.
The interests of Directors and members of the OMC in the ordinary shares of each of BHP Billiton Limited and BHP Billiton Plc as at 30 June 2016 did not exceed on an individual basis or in the aggregate one per cent of BHP Billiton Limited’s or BHP Billiton Plc’s issued ordinary shares.
BHP Billiton Limited Shares BHP Billiton Plc Shares
Held at 1 July 2015 Purchased Received Sold
Held at 30 June
2016
Held at 1 July 2015 Purchased Received Sold
Held at 30 June
2016
Executive DirectorAndrew Mackenzie (1) – – 32,294 15,719 16,575 266,205 – – – 266,205Other members of the OMCPeter Beaven 211,581 – 52,655 26,151 238,085 – – – – –Tony Cudmore (2) – – – – – – – – – –Tim Cutt (2) (3) 56,561 – 40,517 17,571 79,507 – – – – –Dean Dalla Valle (2) 127,020 – 42,012 20,868 148,164 – – – – –Geoff Healy 3,000 – – – 3,000 – – – – –Mike Henry 21,879 – 29,327 13,167 38,039 162,671 – 17,872 – 180,543Daniel Malchuk 66,307 – 34,665 14,045 86,927 – – – – –Steve Pastor (3) (4) 9,983 – – – 9,983 – – – – –Athalie Williams 15,052 – 12,763 6,358 21,457 – – – – –Jimmy Wilson (2) 116,091 – 52,995 26,323 142,763 59,301 – – – 59,301Non-executive DirectorsMalcolm Brinded – – – – – 12,000 48,000 – – 60,000Malcolm Broomhead 9,000 10,000 – – 19,000 – – – – –John Buchanan (2) – – – – – 20,000 – – – 20,000Carlos Cordeiro (2) (3) 6,550 – – – 6,550 – – – – –Pat Davies – – – – – 27,170 – – – 27,170Anita Frew (4) – – – – – 9,000 – – – 9,000Carolyn Hewson 14,000 5,000 – – 19,000 – – – – –Lindsay Maxsted 11,500 6,500 – – 18,000 – – – – –Wayne Murdy (3) 8,000 – – – 8,000 24,000 – – – 24,000Jac Nasser (3) 20,400 – – – 20,400 81,200 – – – 81,200John Schubert 23,675 – – – 23,675 – – – – –Shriti Vadera – – – – – 9,000 16,000 – – 25,000
(1) The opening balance of ordinary shares for Andrew Mackenzie has been corrected to exclude 41 shares that were previously double-counted. (2) The closing balances for John Buchanan, Carlos Cordeiro, Tony Cudmore, Tim Cutt, Dean Dalla Valle and Jimmy Wilson reflect their shareholdings on the date
that each ceased being KMP.(3) The following BHP Billiton Limited shares and BHP Billiton Plc shares are held in the form of American Depositary Shares: Tim Cutt (470 BHP Billiton Limited),
Carlos Cordeiro (3,275 BHP Billiton Limited), Wayne Murdy (4,000 BHP Billiton Limited; 12,000 BHP Billiton Plc), Jac Nasser (5,200 BHP Billiton Limited; 40,600 BHP Billiton Plc), Steve Pastor (1,574 BHP Billiton Limited).
(4) The opening balance shown for Steve Pastor and Anita Frew reflects their holdings on the date each became KMP.
2 Governance at BH
P Billiton1 Strategic Report
4 D
irectors’ Report 3
Remuneration Report

148 BHP Billiton Annual Report 2016
3 Remuneration Report continued
3.4.24 Payments to past DirectorsUK regulations require the inclusion in the Remuneration Report of payments to past Directors (1) and payments made for loss of office. There is nothing to disclose for FY2016. (1) The Remuneration Committee has adopted a de minimis threshold of US$7,500 for disclosure of payments to past Directors under UK requirements.
3.4.25 Relative importance of spend on payThe table below sets out the total spend on employee remuneration during FY2016 (and the prior year) compared with other significant expenditure items. The table includes items as prescribed in the UK requirements. BHP Billiton has included tax payments and purchases of property, plant and equipment being the most significant other outgoings in monetary terms.
US$ million FY2016 FY2015
Aggregate employee benefits expense Section 5.1.6 Note 4. 3,788 5,100
Dividends paid to BHP Billiton shareholders Section 5.1.4. 4,130 6,498
Share buy-backs Section 5.1.4. – –
Income tax paid and royalty-related taxation paid (net of refunds) Section 5.1.4. 1,645 4,025
Purchases of property, plant and equipment Section 5.1.4. 6,946 11,947
3.4.26 Retirement disclosures for the Non-executive DirectorsThe following table sets out the accrued retirement benefits under the now-closed Retirement Plan of BHP Billiton Limited. The Retirement Plan was closed on 24 October 2003 and entitlements that had accumulated in respect of each of the participants were frozen. These will be paid on retirement. An earnings rate equal to the five-year Australian Government Bond Rate is being applied to the frozen entitlements from that date.
US$(‘000)Completed service at 30 June 2016 (years)
Change in lump sum entitlement
during the year (1)
Lump sum entitlement at
30 June 2016 30 June 2015
John Schubert 16 7 266 259
(1) No further entitlements have accrued since the closure of the Retirement Plan in 2003. The movement reflects the application of the earnings rate and foreign exchange rate (the translation from Australian dollars to US dollars for the Remuneration Report) to the lump sum entitlement at the date of closure.
3.4.27 Transactions with KMPDuring the financial year, there were no purchases by KMP (including their related parties) from the Group (2015: US$ nil; 2014: US$ nil).
There are no amounts payable at 30 June 2016 (2015: US$ nil).
Loans with KMPThere are US$ nil loans (2015: US$ nil) with KMP (including their related parties).
Transactions with personally related entitiesA number of Directors of the Group hold or have held positions in other companies, where it is considered they control or significantly influence the financial or operating policies of those entities. There have been no transactions with those entities and no amounts were owed by the Group to personally related entities or any other related parties (2015: US$ nil). This Remuneration Report was approved by the Board on 8 September 2016 and signed on its behalf by:
Carolyn Hewson Chairman, Remuneration Committee 8 September 2016

BHP Billiton Annual Report 2016 149
Section 4 Directors’ Report
In this section4.1 Review of operations, principal activities and state of affairs 4.2 Share capital and buy-back programs4.3 Results, financial instruments and going concern4.4 Directors4.5 Remuneration and share interests4.6 Secretaries4.7 Indemnities and insurance4.8 Employee policies4.9 Corporate governance 4.10 Dividends4.11 Auditors4.12 Non-audit services4.13 Political donations4.14 Exploration, research and development 4.15 ASIC Instrument 2016/1914.16 Proceedings on behalf of BHP Billiton Limited4.17 Performance in relation to environmental regulation4.18 Share capital, restrictions on transfer of shares and other
additional information
150 BHP Billiton Annual Report 2016
4 Directors’ Report continued
The information presented by the Directors in this Directors’ Report relates to BHP Billiton Limited, BHP Billiton Plc and their respective subsidiaries. Section 1 ‘Strategic Report’ (which includes the Chairman’s Review in section 1.1 and the Chief Executive Officer’s Report in section 1.2, and incorporates the operating and financial review), section 2 ‘Governance at BHP Billiton’, section 3 ‘Remuneration Report’, section 5.5 ‘Lead Auditor’s Independence Declaration’ and section 7 ‘Shareholder information’ are each incorporated by reference into, and form part of, this Directors’ Report. In addition, for the purposes of UK law, the Strategic Report in section 1 and the Remuneration Report in section 3 form separate reports and have been separately approved by the Board for that purpose.
For the purpose of the UK Listing Authority’s (UKLA) Listing Rule 9.8.4C R, the applicable information required to be disclosed in accordance with UKLA Listing Rule 9.8.4 R is set out in the sections below.
Applicable information required by UKLA Listing Rule 9.8.4 R Section in this Annual Report
(1) Interest capitalised by group Section 5, note 20
(5) Arrangements to waive emoluments from the Company or subsidiary undertakings Section 3.4.5
(6) Waiver of future emoluments Section 3.4.5
(12) Shareholder waivers of dividends Section 5, note 23
(13) Shareholder waivers of future dividends Section 5, note 23
Paragraphs (2), (4), (7), (8), (9), (10), (11) and (14) of Listing Rule 9.8.4 R are not applicable.
The Directors confirm, on the advice of the Risk and Audit Committee, that they consider the Annual Report (including the Financial Statements), taken as a whole, is fair, balanced and understandable and provides the information necessary for shareholders to assess the Company’s position, performance, business model and strategy.
4.1 Review of operations, principal activities and state of affairs A review of the operations of the Company during FY2016, the results of those operations during FY2016 and the expected results of those operations in future financial years are set out in section 1, in particular in sections 1.1 to 1.6, 1.13 and 1.14 and other material in this Annual Report. Information on the development of the Company and likely developments in future years also appears in those sections. We have excluded certain information from the Strategic Report in section 1 (which forms part of this Directors’ Report), to the extent permitted by UK and Australian law, on the basis that such information relates to impending developments or matters in the course of negotiation and disclosure would be seriously prejudicial to the interests of the Company. This is because such disclosure could be misleading due to the fact it is premature or preliminary in nature, relates to commercially sensitive contracts, would undermine confidentiality between the Company and its suppliers and clients, or would otherwise unreasonably damage the business. The categories of information omitted include forward looking estimates and projections prepared for internal management purposes, information regarding the Company’s assets and projects, which is developing and susceptible to change, and information relating to commercial contracts and pricing modules.
Our principal activities during FY2016 were the exploration, development, production, processing and marketing of minerals (in respect of iron ore, metallurgical and energy coal, copper and uranium), and exploration, development, production and marketing of conventional and unconventional oil and gas. No significant changes in the nature of the Company’s principal activities occurred during FY2016.
There were no significant changes in the Company’s state of affairs that occurred during FY2016 and no significant post-balance date events other than as disclosed in section 1.
No other matter or circumstance has arisen since the end of FY2016 that has significantly affected or is expected to significantly affect the operations, the results of operations or state of affairs of the Company in future years.
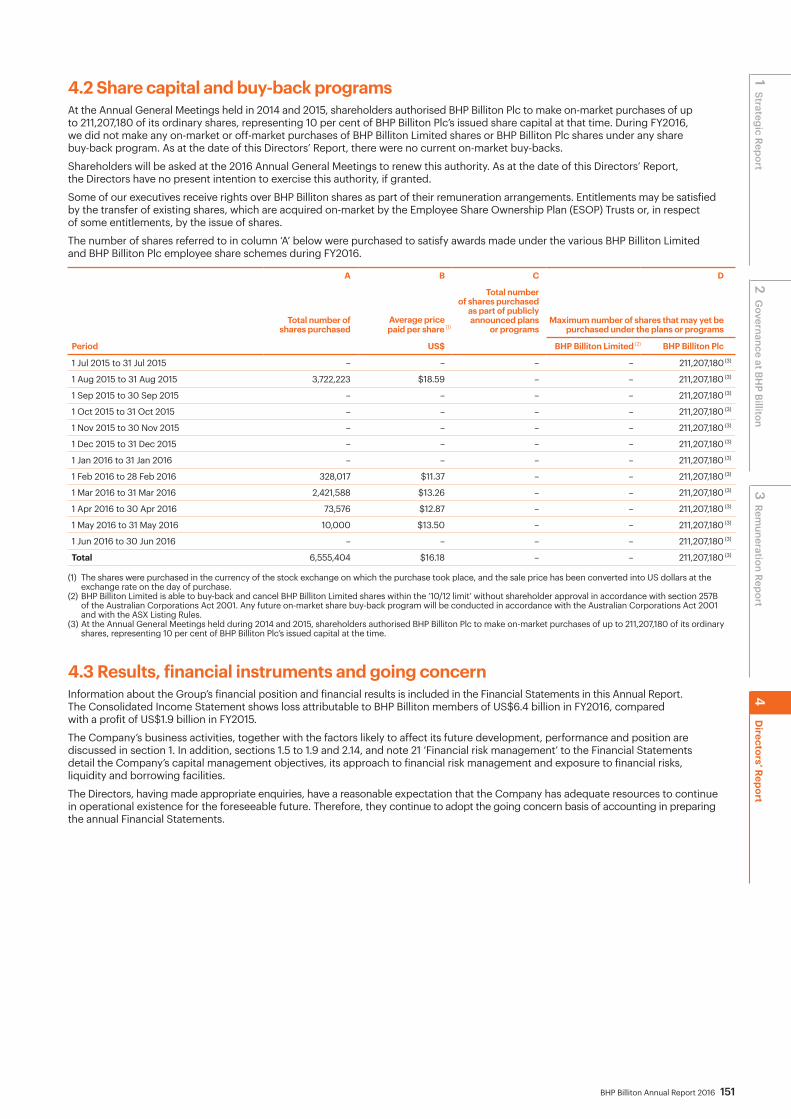
BHP Billiton Annual Report 2016 151
4.2 Share capital and buy-back programsAt the Annual General Meetings held in 2014 and 2015, shareholders authorised BHP Billiton Plc to make on-market purchases of up to 211,207,180 of its ordinary shares, representing 10 per cent of BHP Billiton Plc’s issued share capital at that time. During FY2016, we did not make any on-market or off-market purchases of BHP Billiton Limited shares or BHP Billiton Plc shares under any share buy-back program. As at the date of this Directors’ Report, there were no current on-market buy-backs.
Shareholders will be asked at the 2016 Annual General Meetings to renew this authority. As at the date of this Directors’ Report, the Directors have no present intention to exercise this authority, if granted.
Some of our executives receive rights over BHP Billiton shares as part of their remuneration arrangements. Entitlements may be satisfied by the transfer of existing shares, which are acquired on-market by the Employee Share Ownership Plan (ESOP) Trusts or, in respect of some entitlements, by the issue of shares.
The number of shares referred to in column ‘A’ below were purchased to satisfy awards made under the various BHP Billiton Limited and BHP Billiton Plc employee share schemes during FY2016.
Period
A B C D
Total number of shares purchased
Average pricepaid per share (1)
Total number of shares purchased
as part of publicly announced plans
or programsMaximum number of shares that may yet be
purchased under the plans or programs
US$ BHP Billiton Limited (2) BHP Billiton Plc
1 Jul 2015 to 31 Jul 2015 – – – – 211,207,180 (3)
1 Aug 2015 to 31 Aug 2015 3,722,223 $18.59 – – 211,207,180 (3)
1 Sep 2015 to 30 Sep 2015 – – – – 211,207,180 (3)
1 Oct 2015 to 31 Oct 2015 – – – – 211,207,180 (3)
1 Nov 2015 to 30 Nov 2015 – – – – 211,207,180 (3)
1 Dec 2015 to 31 Dec 2015 – – – – 211,207,180 (3)
1 Jan 2016 to 31 Jan 2016 – – – – 211,207,180 (3)
1 Feb 2016 to 28 Feb 2016 328,017 $11.37 – – 211,207,180 (3)
1 Mar 2016 to 31 Mar 2016 2,421,588 $13.26 – – 211,207,180 (3)
1 Apr 2016 to 30 Apr 2016 73,576 $12.87 – – 211,207,180 (3)
1 May 2016 to 31 May 2016 10,000 $13.50 – – 211,207,180 (3)
1 Jun 2016 to 30 Jun 2016 – – – – 211,207,180 (3)
Total 6,555,404 $16.18 – – 211,207,180 (3)
(1) The shares were purchased in the currency of the stock exchange on which the purchase took place, and the sale price has been converted into US dollars at the exchange rate on the day of purchase.
(2) BHP Billiton Limited is able to buy-back and cancel BHP Billiton Limited shares within the ‘10/12 limit’ without shareholder approval in accordance with section 257B of the Australian Corporations Act 2001. Any future on-market share buy-back program will be conducted in accordance with the Australian Corporations Act 2001 and with the ASX Listing Rules.
(3) At the Annual General Meetings held during 2014 and 2015, shareholders authorised BHP Billiton Plc to make on-market purchases of up to 211,207,180 of its ordinary shares, representing 10 per cent of BHP Billiton Plc’s issued capital at the time.
4.3 Results, financial instruments and going concernInformation about the Group’s financial position and financial results is included in the Financial Statements in this Annual Report. The Consolidated Income Statement shows loss attributable to BHP Billiton members of US$6.4 billion in FY2016, compared with a profit of US$1.9 billion in FY2015.
The Company’s business activities, together with the factors likely to affect its future development, performance and position are discussed in section 1. In addition, sections 1.5 to 1.9 and 2.14, and note 21 ‘Financial risk management’ to the Financial Statements detail the Company’s capital management objectives, its approach to financial risk management and exposure to financial risks, liquidity and borrowing facilities.
The Directors, having made appropriate enquiries, have a reasonable expectation that the Company has adequate resources to continue in operational existence for the foreseeable future. Therefore, they continue to adopt the going concern basis of accounting in preparing the annual Financial Statements.
2 Governance at BH
P Billiton1 Strategic Report
3 Rem
uneration Report4
Directors’ Report
152 BHP Billiton Annual Report 2016
4 Directors’ Report continued
4.4 DirectorsThe Directors who served at any time during FY2016 or up until the date of this Directors’ Report were Jac Nasser, Andrew Mackenzie, Malcolm Brinded, Malcolm Broomhead, Sir John Buchanan, Carlos Cordeiro, Pat Davies, Anita Frew, Carolyn Hewson, Lindsay Maxsted, Wayne Murdy, John Schubert and Shriti Vadera. Further details of the current Directors of BHP Billiton Limited and BHP Billiton Plc are set out in section 2.2. These details include the period for which each Director held office up to the date of this Directors’ Report, their qualifications, experience and particular responsibilities, the directorships held in other listed companies since 1 July 2013 and the period for which each directorship has been held.
Sir John Buchanan served as a Non-executive Director of BHP Billiton from February 2003 up until his death on 13 July 2015. Sir John was the Senior Independent Director of BHP Billiton Plc. Shriti Vadera was appointed the Senior Independent Director for BHP Billiton Plc with effect from 14 August 2015.
Carlos Cordeiro served as a Non-executive Director of BHP Billiton Limited and BHP Billiton Plc from February 2005 until his retirement on 19 November 2015.
Anita Frew was appointed as a Non-executive Director of BHP Billiton Limited and BHP Billiton Plc with effect from 15 September 2015. In accordance with the BHP Billiton Limited Constitution and the BHP Billiton Plc Articles of Association, she stood for election, and was elected, at the 2015 Annual General Meetings.
Ken MacKenzie was appointed as a Non-executive Director of BHP Billiton Limited and BHP Billiton Plc with effect from 22 September 2016. In accordance with the BHP Billiton Limited Constitution and the BHP Billiton Plc Articles of Association, he will seek election at the 2016 Annual General Meetings.
The number of meetings of the Board and its Committees held during the year and each Director’s attendance at those meetings are set out in section 2.11.
4.5 Remuneration and share interests4.5.1 Remuneration The policy for determining the nature and amount of emoluments of members of the Operations Management Committee (OMC) (including the Executive Director) and the Non-executive Directors, and information about the relationship between that policy and the Company’s performance, are set out in sections 3.3 and 3.4.
The remuneration tables contained in section 3.4 set out the remuneration of members of the OMC (including the Executive Director) and the Non-executive Directors.
4.5.2 DirectorsSection 3.4.23 sets out the relevant interests in shares in BHP Billiton Limited and BHP Billiton Plc of the Directors who held office during FY2016, at the beginning and end of FY2016. No rights or options over shares in BHP Billiton Limited and BHP Billiton Plc are held by any of the Non-executive Directors. Interests held by the Executive Director under employee equity plans as at 30 June 2016 are set out in the tables showing interests in incentive plans contained in section 3.4. Except for Andrew Mackenzie and Anita Frew, as at the date of this Directors’ Report, the information pertaining to shares in BHP Billiton Limited and BHP Billiton Plc held directly, indirectly or beneficially by Directors is the same as set out in the table in section 3.4. Where applicable, the information includes shares held in the name of a spouse, superannuation fund, nominee and/or other controlled entities.
As at the date of this Directors’ Report, Andrew Mackenzie holds: • (either directly, indirectly or beneficially) 266,205 shares in
BHP Billiton Plc and 55,200 shares in BHP Billiton Limited; and• rights and options over 309,899 shares in BHP Billiton Plc and
921,406 shares in BHP Billiton Limited.
As at the date of this Directors’ Report, Anita Frew indirectly holds 15,000 shares in BHP Billiton Plc.
We have not made available to any Director any interest in a registered scheme.
The former Directors of BHP Limited participated in a retirement plan under which they were entitled to receive a payment on retirement calculated by reference to years of service. This plan was closed on 24 October 2003, and benefits accrued to that date are held by BHP Billiton Limited and will be paid on retirement. For more information about this plan and its closure, refer to section 3.4.26.
4.5.3 Operations Management Committee membersAll references to OMC should be read to include members of the Group Management Committee during the period from 1 July 2015 to 29 February 2016 and members of the OMC from 1 March 2016.
Section 3.4.23 sets out the relevant interests in shares in BHP Billiton Limited and BHP Billiton Plc held directly, indirectly or beneficially at the beginning and end of FY2016 by those senior executives who were members of the OMC (other than the Executive Director) during FY2016. Where applicable, the information includes shares held in the name of a spouse, superannuation fund, nominee and/or other controlled entities. Interests held by members of the OMC under employee equity plans as at 30 June 2016 are set out in the tables contained in section 3.4.
The table below sets out the relevant interests in shares in BHP Billiton Limited and BHP Billiton Plc held directly, indirectly or beneficially, as at the date of this Directors’ Report by those senior executives who were members of the OMC (other than the Executive Director) on that date. Where applicable, the information also includes shares held in the name of a spouse, superannuation fund, nominee and/or other controlled entities.
OMC member BHP Billiton entityAs at date of
Directors’ Report
Peter Beaven BHP Billiton LimitedBHP Billiton Plc
266,359–
Geoff Healy BHP Billiton Limited BHP Billiton Plc
26,536 –
Mike Henry BHP Billiton Limited BHP Billiton Plc
65,278 196,262
Daniel Malchuk BHP Billiton Limited BHP Billiton Plc
126,530–
Steve Pastor BHP Billiton Limited BHP Billiton Plc
27,681–
Athalie Williams BHP Billiton Limited BHP Billiton Plc
28,907–
4.6 SecretariesMargaret Taylor is the Group Company Secretary. Details of her qualifications and experience are set out in section 2.2. The following people also act, or have acted during FY2016, as company secretaries of BHP Billiton Limited, BHP Billiton Plc or both (as indicated): Rachel Agnew, BComm (Economics), LLB (Hons) (BHP Billiton Limited and BHP Billiton Plc), Kathryn Griffiths, BA, LLB (Hons), GDipACG, FCIS, FGIA, GAICD (BHP Billiton Limited), Megan Pepper, BA (Hons), LLB (Hons), GDipACG, FCIS, FGIA, GAICD (BHP Billiton Limited), Geof Stapledon, BEc, LLB (Hons), DPhil, FCIS (BHP Billiton Plc) and Elizabeth Hobley, BA (Hons), ACIS (BHP Billiton Plc) (resigned 30 June 2016). Each such individual has experience in a company secretariat role or other relevant fields arising from time spent in such roles within BHP Billiton, large listed companies or other relevant entities.
BHP Billiton Annual Report 2016 153
4.7 Indemnities and insuranceRule 146 of the BHP Billiton Limited Constitution and Article 146 of the BHP Billiton Plc Articles of Association require each Company to indemnify, to the extent permitted by law, each Officer of BHP Billiton Limited and BHP Billiton Plc, respectively, against liability incurred in, or arising out of, the conduct of the business of the Company or the discharge of the duties of the Officer. The Directors named in section 2.2, the Company Secretaries and other Officers of BHP Billiton Limited and BHP Billiton Plc have the benefit of this requirement, as do individuals who formerly held one of those positions.
In accordance with this requirement, BHP Billiton Limited and BHP Billiton Plc have entered into Deeds of Indemnity, Access and Insurance (Deeds of Indemnity) with each of their respective Directors. The Deeds of Indemnity are qualifying third party indemnity provisions for the purposes of the UK Companies Act 2006 and each of these qualifying third party indemnities was in force as at the date of this Directors’ Report.
We have a policy that BHP Billiton will, as a general rule, support and hold harmless an employee, including an employee appointed as a Director of a subsidiary who, while acting in good faith, incurs personal liability to others as a result of working for BHP Billiton.
In addition, as part of the arrangements to effect the demerger of South32, we agreed to indemnify certain former Officers of BHP Billiton who transitioned to South32 from certain claims and liabilities incurred in their capacity as Directors or Officers of South32.
From time to time, we engage our External Auditor, KPMG, to conduct non-statutory audit work and provide other services in accordance with our policy on the provision of other services by the External Auditor. The terms of engagement in the United Kingdom include that we must compensate and reimburse KPMG LLP for, and protect KPMG LLP against, any loss, damage, expense, or liability incurred by KPMG LLP in respect of third party claims arising from a breach by the Company of any obligation under the engagement terms.
We have insured against amounts that we may be liable to pay to Directors, Company Secretaries or certain employees (including former Officers) pursuant to Rule 146 of the Constitution of BHP Billiton Limited and Article 146 of the Articles of Association of BHP Billiton Plc or that we otherwise agree to pay by way of indemnity. The insurance policy also insures Directors, Company Secretaries and some employees (including former Officers) against certain liabilities (including legal costs) they may incur in carrying out their duties. For this Directors’ and Officers’ insurance, we paid premiums of US$2,088,352 net during FY2016.
No indemnity in favour of a current or former officer of BHP Billiton Limited or BHP Billiton Plc, or in favour of the External Auditor, was called on during FY2016.
4.8 Employee policiesOur people are fundamental to our success. We are committed to shaping a culture where our employees are provided with opportunities to develop, are valued and are encouraged to contribute towards making work safer, simpler and more productive. We strongly believe that having employees who are engaged and connected to our organisation reinforces our shared purpose aligned to Our BHP Billiton Charter and will result in a more harmonious workplace.
For more information on employee engagement and employee policies, including communications and regarding disabilities, refer to section 1.10.
4.9 Corporate governance The UK Financial Conduct Authority’s Disclosure and Transparency Rules (DTR 7.2) require that certain information be included in a corporate governance statement set out in the Directors’ Report. BHP Billiton has an existing practice of issuing a separate corporate governance statement as part of our Annual Report. The information required by the Disclosure and Transparency Rules and the UK Financial Conduct Authority’s Listing Rules (LR 9.8.6) is located in section 2, with the exception of the information referred to in LR 9.8.6 (1), (3) and (4) and DTR 7.2.6, which is located in sections 4.2, 4.3, 4.5.2 and 4.18.
4.10 DividendsA final dividend of 14 US cents per share will be paid on 20 September 2016, resulting in total dividends determined in respect of FY2016 of 30 US cents per share. Details of the dividends paid are set out in note 15 ‘Share capital’ and note 17 ‘Dividends’ to the Financial Statements and details of the Group’s dividend policy are set out in sections 1.6.3 and 7.7.
4.11 AuditorsA resolution to reappoint KPMG LLP as the auditor of BHP Billiton Plc will be proposed at the 2016 Annual General Meetings in accordance with section 489 of the UK Companies Act 2006.
A copy of the declaration given by our External Auditor to the Directors in relation to the auditors’ compliance with the independence requirements of the Australian Corporations Act 2001 and the Professional Code of Conduct for External Auditors is set out in section 5.5.
During FY2016, Lindsay Maxsted was the only officer of BHP Billiton who previously held the role of director or partner of the Company’s External Auditor at a time when the Company’s External Auditor conducted an audit of the Company. His prior relationship with KPMG is outlined in section 2.9. Lindsay Maxsted was not part of the KPMG audit practice after 1980 and, while at KPMG, was not in any way involved in, or able to influence, any audit activity associated with BHP Billiton.
Each person who held the office of Director at the date the Board approved this Directors’ Report made the following statements:• so far as the Director is aware, there is no relevant audit
information of which the Company’s External Auditor is unaware;• the Director has taken all steps that he or she ought to have taken
as a Director to make him or herself aware of any relevant audit information and to establish that the Company’s External Auditor is aware of that information.
This confirmation is given pursuant to section 418 of the UK Companies Act 2006 and should be interpreted in accordance with, and subject to, those provisions.
4.12 Non-audit servicesDetails of the non-audit services undertaken by the Company’s External Auditor, including the amounts paid for non-audit services, are set out in note 35 ‘Auditor’s remuneration’ to the Financial Statements. All non-audit services were approved in accordance with the process set out in the Policy on Provision of Audit and Other Services by the External Auditor. No non-audit services were carried out that were specifically excluded by the Policy on Provision of Audit and Other Services by the External Auditor. Based on advice provided by the Risk and Audit Committee, the Directors have formed the view that the provision of non-audit services is compatible with the general standard of independence for auditors, and that the nature of non-audit services means that auditor independence was not compromised. For more information about our policy in relation to the provision of non-audit services by the auditor, refer to section 2.13.1.
2 Governance at BH
P Billiton1 Strategic Report
3 Rem
uneration Report4
Directors’ Report

154 BHP Billiton Annual Report 2016
4 Directors’ Report continued
4.13 Political donationsNo political contributions/donations for political purposes were made by the Company to any political party, politician, elected official or candidate for public office during FY2016.(1) (1) Note that Australian Electoral Commission (AEC) disclosure requirements are
broad, such that amounts that are not political donations can be reportable for AEC purposes. For example, where a political party or organisation owns shares in BHP Billiton, the AEC filing requires the political party or organisation to disclose the dividend payments received in respect of their shareholding.
4.14 Exploration, research and development Companies within the Group carry out exploration and research and development necessary to support their activities. Further details are provided in sections 1.12 to 1.14 and 6.3.
4.15 ASIC Instrument 2016/191BHP Billiton Limited is an entity to which Australian Securities and Investments Commission (ASIC) Corporations (Rounding in Financial/Directors’ Reports) Instrument 2016/191 dated 24 March 2016 applies. Amounts in this Directors’ Report and the Financial Statements, except estimates of future expenditure or where otherwise indicated, have been rounded to the nearest million dollars in accordance with ASIC Instrument 2016/191.
4.16 Proceedings on behalf of BHP Billiton LimitedNo proceedings have been brought on behalf of BHP Billiton Limited, nor has any application been made, under section 237 of the Australian Corporations Act 2001.
4.17 Performance in relation to environmental regulationBHP Billiton seeks to be compliant with all applicable environmental laws and regulations relevant to its operations. We monitor compliance on a regular basis, including through external and internal means, to ensure that the risk of non-compliance is minimised. For more information on the Company’s performance in relation to health, safety and the environment, refer to section 1.11.
Fines and prosecutions For the purposes of section 299 (1)(f) of the Australian Corporations Act 2001, in FY2016, BHP Billiton received three fines in relation to Australian environmental laws and regulations at our operated assets, the total amount payable being US$60,609.
One fine of US$42,483 was received in respect of the Mt Arthur Coal open-cut energy coal mine blast fume prosecution. BHP Billiton Mitsubishi Alliance received two fines of US$9,063 each. Both incidents were related to the unauthorised release of mine-affected water at the Norwich Park mine.
Greenhouse gas emissionsThe UK Companies Act 2006 requires the Company, to the extent practicable, to obtain relevant information on the Company’s annual quantity of greenhouse gas emissions, which is reported in tonnes of carbon dioxide equivalent. The Company’s total FY2016 greenhouse gas emissions and intensity are set out in sections 1.7 and 1.11.2.
For more information on environmental performance, including environmental regulation, refer to section 1.11 and the Sustainability Report 2016 which is available online at www.bhpbilliton.com.
4.18 Share capital, restrictions on transfer of shares and other additional informationInformation relating to BHP Billiton Plc’s share capital structure, restrictions on the holding or transfer of its securities or on the exercise of voting rights attaching to such securities, certain agreements triggered on a change of control and the existence of branches of BHP Billiton outside of the United Kingdom, is set out in the following sections:• Section 1.5.4 (BHP Billiton locations)• Section 4.2 (Share capital and buy-back programs)• Section 7.3 (Organisational structure)• Section 7.4 (Material contracts)• Section 7.5 (Constitution)• Section 7.6 (Share ownership)• Section 7.11 (Government regulations)• Note 15 ‘Share capital’ and note 23 ‘Employee share ownership
plans’ to the Financial Statements.
As at the date of this Directors’ Report, there were 15,767,488 unvested equity awards outstanding in relation to BHP Billiton Limited ordinary shares and 1,389,974 unvested equity awards outstanding in relation to BHP Billiton Plc ordinary shares. The expiry dates of these unvested equity awards range between September 2016 and August 2023 and there is no exercise price. No options over unissued shares or unissued interests in the Company have been granted since the end of FY2016 and no shares or interests were issued as a result of the exercise of an option over unissued shares or interests since the end of FY2016. Further details are set out in note 23 ‘Employee share ownership plans’ to the Financial Statements. Details of movements in share capital during and since the end of FY2016 are set out in note 15 ‘Share capital’ to the Financial Statements.
The Directors’ Report is approved in accordance with a resolution of the Board.
Jac Nasser AO Chairman
Andrew Mackenzie Chief Executive Officer
Dated: 8 September 2016

BHP Billiton Annual Report 2016 155
Section 5 Financial Statements
Notes to Financial Statements
Capital structure15 Share capital16 Other equity17 Dividends18 Provisions for dividends and other liabilities
Financial management19 Net debt20 Net finance costs21 Financial risk management
Employee matters22 Key management personnel23 Employee share ownership plans24 Employee benefits, restructuring and post-retirement
employee benefits provisions25 Pension and other post-retirement obligations
Group and related party information26 Discontinued operations27 Subsidiaries28 Investments accounted for using the equity method29 Interests in joint operations30 Related party transactions
Unrecognised items and uncertain events31 Commitments32 Contingent liabilities33 Subsequent events
Other items34 Acquisitions and disposals of subsidiaries, operations,
joint operations and equity accounted investments35 Auditor’s remuneration36 BHP Billiton Limited37 Deed of Cross Guarantee38 New and amended accounting standards and interpretations
issued but not yet effective39 Reserve estimates
Financial Statements
5.1 Consolidated Financial Statements 5.1.1 Consolidated Income Statement 5.1.2 Consolidated Statement of Comprehensive Income 5.1.3 Consolidated Balance Sheet 5.1.4 Consolidated Cash Flow Statement 5.1.5 Consolidated Statement of Changes in Equity 5.1.6 Notes to Financial Statements5.2 BHP Billiton Plc5.3 Directors’ declaration5.4 Statement of Directors’ responsibilities in respect of the
Annual Report and the Financial Statements5.5 Lead Auditor’s Independence Declaration under Section 307C
of the Australian Corporations Act 20015.6 Independent Auditors’ reports5.7 Supplementary oil and gas information – unaudited
Notes to Financial Statements
Performance1 Segment reporting2 Exceptional items3 Significant events – Samarco dam failure4 Expenses and other income5 Income tax expense6 Earnings per share
Working capital7 Trade and other receivables8 Trade and other payables9 Inventories
Resource assets10 Property, plant and equipment11 Intangible assets12 Impairment of non-current assets13 Deferred tax balances14 Closure and rehabilitation provisions
In this section
About these Financial Statements
Reporting entityIn 2001, BHP Billiton Limited (previously known as BHP Limited), an Australian-listed company, and BHP Billiton Plc (previously known as Billiton Plc), a UK listed company, ‘the Companies’, entered into a Dual Listed Company (DLC) merger. The Companies and their subsidiaries operate together as a single for-profit economic entity (referred to as ‘the Group’) with a common Board of Directors, unified management structure and joint objectives. In effect, the DLC structure provides the same voting rights and dividend entitlements from the Group irrespective of whether investors hold shares in BHP Billiton Limited or BHP Billiton Plc.Group and related party information is presented in note 30 ‘Related party transactions’ detailing the Group’s subsidiaries, associates, joint arrangements and the nature of transactions between these and other related parties. The nature of the operations and principal activities of the Group are described in the segment information (refer to note 1 ‘Segment reporting’).Presentation of the Consolidated Financial StatementsA review has been undertaken to identify opportunities to make the Financial Statements more user friendly, simpler and easier to understand, while complying with the financial reporting obligations.
This review included:• focusing disclosures on material items and important information;• reorganisation of the notes to the Financial Statements into sections
that will assist users in understanding the Group’s financial performance and financial position;
• integration of relevant accounting policies and information on key judgements within the notes to accompanying the financial information to enhance users understanding of key financial line items;
• use of simplified language and explanations. BHP Billiton’s Directors have included information in this report they deem to be material and relevant to the understanding of the Financial Statements. Disclosure may be considered material and relevant if the dollar amount is significant due to size or nature, or the information is important to understand the:• Group’s current year results; • impact of significant changes in BHP Billiton’s business; or • aspects of the Group’s operations that are important to
future performance. These Consolidated Financial Statements were approved by the Board of Directors on 8 September 2016. The Directors have the authority to amend the Financial Statements after issuance.

156 BHP Billiton Annual Report 2016
5 Financial Statements continued
5.1 Consolidated Financial Statements
5.1.1 Consolidated Income Statement for the year ended 30 June 2016
Notes2016
US$M2015
US$M2014
US$M
Continuing operationsRevenue 1 30,912 44,636 56,762Other income 4 444 496 1,225Expenses excluding net finance costs 4 (35,487) (37,010) (36,523)(Loss)/profit from equity accounted investments, related impairments and expenses 28 (2,104) 548 1,185
(Loss)/profit from operations (6,235) 8,670 22,649
Financial expenses (1,161) (702) (995)Financial income 137 88 81
Net finance costs 20 (1,024) (614) (914)
(Loss)/profit before taxation (7,259) 8,056 21,735
Income tax benefit/(expense) 1,297 (2,762) (6,266)Royalty-related taxation (net of income tax benefit) (245) (904) (514)
Total taxation benefit/(expense) 5 1,052 (3,666) (6,780)
(Loss)/profit after taxation from Continuing operations (6,207) 4,390 14,955
Discontinued operations(Loss)/profit after taxation from Discontinued operations 26 − (1,512) 269
(Loss)/profit after taxation from Continuing and Discontinued operations (6,207) 2,878 15,224
Attributable to non-controlling interests 178 968 1,392Attributable to owners of BHP Billiton Group (6,385) 1,910 13,832
Basic (loss)/earnings per ordinary share (cents) 6 (120.0) 35.9 260.0Diluted (loss)/earnings per ordinary share (cents) 6 (120.0) 35.8 259.1Basic (loss)/earnings from Continuing operations per ordinary share (cents) 6 (120.0) 65.5 256.5Diluted (loss)/earnings from Continuing operations per ordinary share (cents) 6 (120.0) 65.3 255.7
Dividends per ordinary share – paid during the period (cents) 17 78.0 124.0 118.0Dividends per ordinary share – determined in respect of the period (cents) 17 30.0 124.0 121.0
The accompanying notes form part of these Financial Statements.
5.1.2 Consolidated Statement of Comprehensive Income for the year ended 30 June 2016
Notes2016
US$M2015
US$M2014
US$M
(Loss)/profit after taxation from Continuing and Discontinued operations (6,207) 2,878 15,224Other comprehensive income Items that may be reclassified subsequently to the income statement:Available for sale investments:
Net valuation gains/(losses) taken to equity 2 (21) (15)Net valuation losses/(gains) transferred to the income statement 1 (115) (14)
Cash flow hedges:(Losses)/gains taken to equity (566) (1,797) 681Losses/(gains) transferred to the income statement 664 1,815 (678)
Exchange fluctuations on translation of foreign operations taken to equity (1) (2) (1)Exchange fluctuations on translation of foreign operations transferred to income statement (10) − −Tax recognised within other comprehensive income 5 (30) 29 3
Total items that may be reclassified subsequently to the income statement 60 (91) (24)
Items that will not be reclassified to the income statement:Remeasurement (losses)/gains on pension and medical schemes (20) (28) 57Tax recognised within other comprehensive income 5 (17) (17) 12
Total items that will not be reclassified to the income statement (37) (45) 69
Total other comprehensive income/(loss) 23 (136) 45
Total comprehensive (loss)/income (6,184) 2,742 15,269
Attributable to non-controlling interests 176 973 1,392Attributable to owners of BHP Billiton Group (6,360) 1,769 13,877
The accompanying notes form part of these Financial Statements.

BHP Billiton Annual Report 2016 157
5.1.3 Consolidated Balance Sheet as at 30 June 2016
Notes2016
US$M2015
US$M
ASSETSCurrent assetsCash and cash equivalents 19 10,319 6,753Trade and other receivables 7 3,155 4,321Other financial assets 21 121 83Inventories 9 3,411 4,292Current tax assets 567 658Other 141 262
Total current assets 17,714 16,369
Non-current assetsTrade and other receivables 7 867 1,499Other financial assets 21 2,680 1,159Inventories 9 764 466Property, plant and equipment 10 83,975 94,072Intangible assets 11 4,119 4,292Investments accounted for using the equity method 28 2,575 3,712Deferred tax assets 13 6,147 2,861Other 112 150
Total non-current assets 101,239 108,211
Total assets 118,953 124,580
LIABILITIESCurrent liabilitiesTrade and other payables 8 5,389 7,389Interest bearing liabilities 19 4,653 3,201Other financial liabilities 21 5 251Current tax payable 451 207Provisions 3, 14, 18, 24 1,765 1,676Deferred income 77 129
Total current liabilities 12,340 12,853
Non-current liabilitiesTrade and other payables 8 13 29Interest bearing liabilities 19 31,768 27,969Other financial liabilities 21 1,778 1,031Deferred tax liabilities 13 4,324 4,542Provisions 3, 14, 18, 24 8,381 7,306Deferred income 278 305
Total non-current liabilities 46,542 41,182
Total liabilities 58,882 54,035
Net assets 60,071 70,545
EQUITYShare capital – BHP Billiton Limited 1,186 1,186Share capital – BHP Billiton Plc 1,057 1,057Treasury shares (33) (76)Reserves 16 2,538 2,557Retained earnings 49,542 60,044
Total equity attributable to owners of BHP Billiton Group 54,290 64,768Non-controlling interests 16 5,781 5,777
Total equity 60,071 70,545
The accompanying notes form part of these Financial Statements.
The Financial Statements were approved by the Board of Directors on 8 September 2016 and signed on its behalf by:
Jac Nasser AO Andrew Mackenzie Chairman Chief Executive Officer
6 Additional inform
ation7
Shareholder information
5Financial Statem
ents

158 BHP Billiton Annual Report 2016
5 Financial Statements continued
5.1.4 Consolidated Cash Flow Statement for the year ended 30 June 2016
Notes2016
US$M2015
US$M2014
US$M
Operating activities(Loss)/profit before taxation from Continuing operations (7,259) 8,056 21,735Adjustments for:
Non-cash or non-operating exceptional items 9,645 3,196 (551)Depreciation and amortisation expense 8,661 9,158 7,716Impairments of property, plant and equipment, financial assets and intangibles 210 828 478Net finance costs 1,024 614 914Share of operating profit of equity accounted investments (276) (548) (1,185)Other 459 503 95
Changes in assets and liabilities:Trade and other receivables 1,714 1,431 (349)Inventories 527 151 (158)Trade and other payables (1,661) (990) 238Provisions and other assets and liabilities (373) (779) 385
Cash generated from operations 12,671 21,620 29,318Dividends received 301 740 1,264Interest received 128 86 120Interest paid (830) (627) (915)Net income tax and royalty-related taxation refunded 641 348 1,064Net income tax and royalty-related taxation paid (2,286) (4,373) (7,211)
Net operating cash flows from Continuing operations 10,625 17,794 23,640
Net operating cash flows from Discontinued operations 26 − 1,502 1,724
Net operating cash flows 10,625 19,296 25,364
Investing activitiesPurchases of property, plant and equipment (6,946) (11,947) (15,224)Exploration expenditure (765) (816) (986)Exploration expenditure expensed and included in operating cash flows 430 670 698Net investment and funding of equity accounted investments 40 117 (29)Proceeds from sale of assets 107 74 66Proceeds from divestment of subsidiaries, operations and joint operations, net of their cash 34 166 256 812Other investing (277) 144 (471)
Net investing cash flows from Continuing operations (7,245) (11,502) (15,134)
Net investing cash flows from Discontinued operations 26 − (1,066) (700)
Cash disposed on demerger of South32 26 − (586) −
Net investing cash flows (7,245) (13,154) (15,834)
Financing activitiesProceeds from interest bearing liabilities 7,239 3,440 6,000Proceeds/(settlements) from debt related instruments 156 (33) 37Repayment of interest bearing liabilities (2,788) (4,135) (7,048)Proceeds from ordinary shares − 9 14Contributions from non-controlling interests − 53 1,435Purchase of shares by Employee Share Ownership Plan (ESOP) Trusts (106) (355) (368)Dividends paid (4,130) (6,498) (6,387)Dividends paid to non-controlling interests (87) (554) (119)
Net financing cash flows from Continuing operations 284 (8,073) (6,436)
Net financing cash flows from Discontinued operations 26 − (203) (32)
Net financing cash flows 284 (8,276) (6,468)
Net increase/(decrease) in cash and cash equivalents from Continuing operations 3,664 (1,781) 2,070Net increase in cash and cash equivalents from Discontinued operations 26 − 233 992Cash and cash equivalents, net of overdrafts, at the beginning of the financial year 6,613 8,752 5,667Cash disposed on demerger of South32 26 − (586) −Foreign currency exchange rate changes on cash and cash equivalents (1) (5) 23
Cash and cash equivalents, net of overdrafts, at the end of the financial year 19 10,276 6,613 8,752
The accompanying notes form part of these Financial Statements.

BHP Billiton Annual Report 2016 159
5.1.5 Consolidated Statement of Changes in Equity for the year ended 30 June 2016Attributable to owners of BHP Billiton Group
US$M
Share capital Treasury shares
ReservesRetained earnings
Total equity attributable
to owners of BHP Billiton
Group
Non- controlling
interestsTotal
equity
BHP Billiton
Limited
BHP Billiton
Plc
BHP Billiton
Limited
BHP Billiton
Plc
Balance as at 1 July 2015 1,186 1,057 (19) (57) 2,557 60,044 64,768 5,777 70,545Total comprehensive loss − − − − 60 (6,420) (6,360) 176 (6,184)Transactions with owners:
Purchase of shares by ESOP Trusts − − (106) − − − (106) − (106)Employee share awards exercised net of employee contributions − − 118 31 (193) 46 2 − 2Employee share awards forfeited − − − − (26) 26 − − −Accrued employee entitlement for unexercised awards − − − − 140 − 140 − 140Dividends − − − − − (4,154) (4,154) (172) (4,326)
Balance as at 30 June 2016 1,186 1,057 (7) (26) 2,538 49,542 54,290 5,781 60,071
Balance as at 1 July 2014 1,186 1,069 (51) (536) 2,927 74,548 79,143 6,239 85,382Total comprehensive income − − − − (96) 1,865 1,769 973 2,742Transactions with owners:
Shares cancelled − (12) − 501 12 (501) − − −Purchase of shares by ESOP Trusts − − (232) (123) − − (355) − (355)Employee share awards exercised net of employee contributions and other adjustments − − 264 99 (461) 101 3 − 3Employee share awards forfeited − − − − (13) 13 − − −Accrued employee entitlement for unexercised awards − − − − 247 − 247 − 247Distribution to option holders − − − − (1) − (1) (1) (2)Dividends − − − − − (6,596) (6,596) (639) (7,235)In-specie dividend on demerger – refer to note 26 ‘Discontinued operations’ − − − − − (9,445) (9,445) − (9,445)Equity contributed − − − − 1 − 1 52 53Transfers within equity on demerger − − − − (59) 59 − − −Conversion of controlled entities to equity accounted investments − − − 2 − − 2 (847) (845)
Balance as at 30 June 2015 1,186 1,057 (19) (57) 2,557 60,044 64,768 5,777 70,545
Balance as at 1 July 2013 1,186 1,069 (8) (532) 1,970 66,982 70,667 4,624 75,291Total comprehensive income − − − − (24) 13,901 13,877 1,392 15,269Transactions with owners:
Purchase of shares by ESOP Trusts − − (290) (78) − − (368) − (368)Employee share awards exercised net of employee contributions − − 247 74 (221) (91) 9 − 9Employee share awards forfeited − − − − (32) 32 − − −Accrued employee entitlement for unexercised awards − − − − 247 − 247 − 247Distribution to option holders − − − − (2) − (2) (2) (4)Dividends − − − − − (6,276) (6,276) (252) (6,528)Equity contributed − − − − 989 − 989 477 1,466
Balance as at 30 June 2014 1,186 1,069 (51) (536) 2,927 74,548 79,143 6,239 85,382
The accompanying notes form part of these Financial Statements.
6 Additional inform
ation7
Shareholder information
5Financial Statem
ents
160 BHP Billiton Annual Report 2016
5 Financial Statements continued
Basis of preparationThe Group’s financial report as at and for the year ended 30 June 2016:• is a consolidated general purpose financial report;• has been prepared in accordance with the requirements of the:
− Australian Corporations Act 2001; − UK Companies Act 2006;
• has been prepared in accordance with accounting standards and interpretations collectively referred to as ‘IFRS’ in this report, which encompass the:
− International Financial Reporting Standards and interpretations as issued by the International Accounting Standards Board;
− Australian Accounting Standards, being Australian equivalents to International Financial Reporting Standards and interpretations as issued by the Australian Accounting Standards Board (AASB);
− International Financial Reporting Standards and interpretations adopted by the European Union (EU);
• is prepared on a going concern basis;• measures items on the basis of historical cost principles, except
for the following items: − derivative financial instruments and certain other financial assets, which are carried at fair value;
− non-current assets or disposal groups that are classified as held-for-sale or held-for-distribution, which are measured at the lower of carrying amount and fair value less cost to dispose;
• includes significant accounting policies in the notes to the Financial Statements that summarise the recognition and measurement basis used and are relevant to an understanding of the Financial Statements;
• includes selected financial information of the BHP Billiton Limited parent entity in note 36 ‘BHP Billiton Limited’. Financial Statements of the BHP Billiton Plc parent entity are presented in section 5.2 ‘BHP Billiton Plc’;
• applies a presentation currency of US dollars, consistent with the predominant functional currency of the Group’s operations. Amounts are rounded to the nearest million dollars, unless otherwise stated, in accordance with ASIC (Rounding in Financial/Directors’ Reports) Instrument 2016/191;
• presents reclassified comparative information where required for consistency with the current year’s presentation;
• adopts all new and amended standards and interpretations under IFRS issued by the relevant bodies (listed above), that are mandatory for application beginning on or after 1 July 2015. None had a significant impact on the Financial Statements;
• has not early adopted any standards and interpretations that have been issued or amended but are not yet effective.
The accounting policies have been consistently applied by all entities included in the Financial Statements and are consistent with those applied in all prior years presented.
Principles of consolidationIn preparing the Financial Statements the effects of all intragroup balances and transactions have been eliminated.
A list of significant entities in the Group, including subsidiaries, joint arrangements and associates at year-end is contained in note 27 ‘Subsidiaries’, note 28 ‘Investments accounted for using the equity method’ and note 29 ‘Interests in joint operations’.
Subsidiaries: The Financial Statements of the Group include the consolidation of BHP Billiton Limited, BHP Billiton Plc and their respective subsidiaries being the entities controlled by the parent entities during the year. Control exists where the Group is:• exposed to, or has rights to, variable returns from its involvement
with the entity; • has the ability to affect those returns through its power to direct
the activities of the entity.
The ability to approve the operating and capital budget of a subsidiary and the ability to appoint key management personnel are decisions that demonstrate that the Group has the existing rights to direct the relevant activities of a subsidiary. Where the Group’s interest is less than 100 per cent, the interest attributable to outside shareholders is reflected in non-controlling interests. The Financial Statements of subsidiaries are prepared for the same reporting period as the Group, using consistent accounting policies. The acquisition method of accounting is used to account for the Group’s business combinations.
Joint arrangements: The Group undertakes a number of business activities through joint arrangements, which exist when two or more parties have joint control. Joint arrangements are classified as either joint operations or joint ventures, based on the contractual rights and obligations between the parties to the arrangement.
The Group has two types of joint arrangements:• Joint operations: A joint operation is an arrangement in which the
Group shares joint control, primarily via contractual arrangements with other parties. In a joint operation, the Group has rights to the assets and obligations for the liabilities relating to the arrangement. This includes situations where the parties benefit from the joint activity through a share of the output, rather than by receiving a share of the results of trading. In relation to the Group’s interest in a joint operation, the Group recognises: its share of assets and liabilities; revenue from the sale of its share of the output and its share of any revenue generated from the sale of the output by the joint operation; and its share of expenses. All such amounts are measured in accordance with the terms of the arrangement, which is usually in proportion to the Group’s interest in the joint operation.
• Joint ventures: A joint venture is a joint arrangement in which the parties that share joint control have rights to the net assets of the arrangement. A separate vehicle, not the parties, will have the rights to the assets and obligations to the liabilities relating to the arrangement. More than an insignificant share of output from a joint venture is sold to third parties, which indicates the joint venture is not dependent on the parties to the arrangement for funding, nor do the parties have an obligation for the liabilities of the arrangement. Joint ventures are accounted for using the equity accounting method.
Associates: The Group accounts for investments in associates using the equity accounting method. An entity is considered an associate where the Group is deemed to have significant influence but not control or joint control. Significant influence is presumed to exist where the Group:• has over 20 per cent of the voting rights of an entity, unless it can
be clearly demonstrated that this is not the case; • holds less than 20 per cent of the voting rights of an entity;
however, has the power to participate in the financial and operating policy decisions affecting the entity.
The Group uses the term ‘equity accounted investments’ to refer to joint ventures and associates collectively.
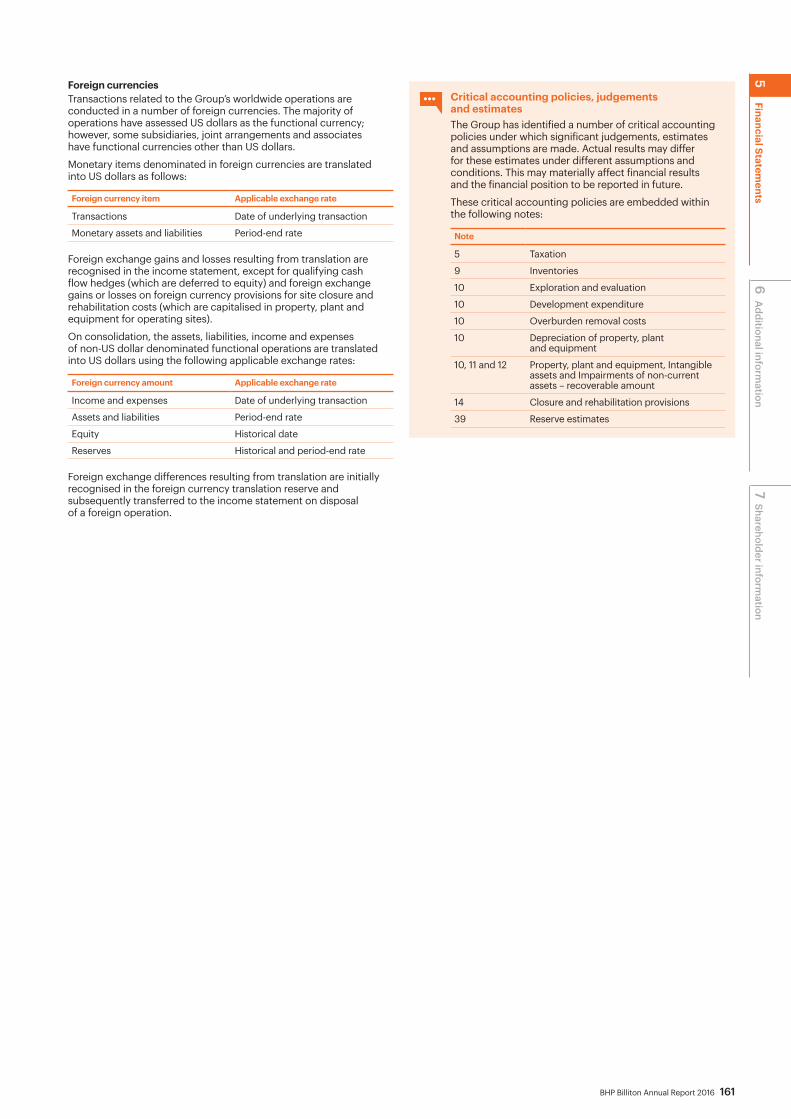
BHP Billiton Annual Report 2016 161
Foreign currenciesTransactions related to the Group’s worldwide operations are conducted in a number of foreign currencies. The majority of operations have assessed US dollars as the functional currency; however, some subsidiaries, joint arrangements and associates have functional currencies other than US dollars.
Monetary items denominated in foreign currencies are translated into US dollars as follows:
Foreign currency item Applicable exchange rate
Transactions Date of underlying transaction
Monetary assets and liabilities Period-end rate
Foreign exchange gains and losses resulting from translation are recognised in the income statement, except for qualifying cash flow hedges (which are deferred to equity) and foreign exchange gains or losses on foreign currency provisions for site closure and rehabilitation costs (which are capitalised in property, plant and equipment for operating sites).
On consolidation, the assets, liabilities, income and expenses of non-US dollar denominated functional operations are translated into US dollars using the following applicable exchange rates:
Foreign currency amount Applicable exchange rate
Income and expenses Date of underlying transaction
Assets and liabilities Period-end rate
Equity Historical date
Reserves Historical and period-end rate
Foreign exchange differences resulting from translation are initially recognised in the foreign currency translation reserve and subsequently transferred to the income statement on disposal of a foreign operation.
Critical accounting policies, judgements and estimatesThe Group has identified a number of critical accounting policies under which significant judgements, estimates and assumptions are made. Actual results may differ for these estimates under different assumptions and conditions. This may materially affect financial results and the financial position to be reported in future.
These critical accounting policies are embedded within the following notes:
Note
5 Taxation
9 Inventories
10 Exploration and evaluation
10 Development expenditure
10 Overburden removal costs
10 Depreciation of property, plant and equipment
10, 11 and 12 Property, plant and equipment, Intangible assets and Impairments of non-current assets – recoverable amount
14 Closure and rehabilitation provisions
39 Reserve estimates
6 Additional inform
ation7
Shareholder information
5Financial Statem
ents
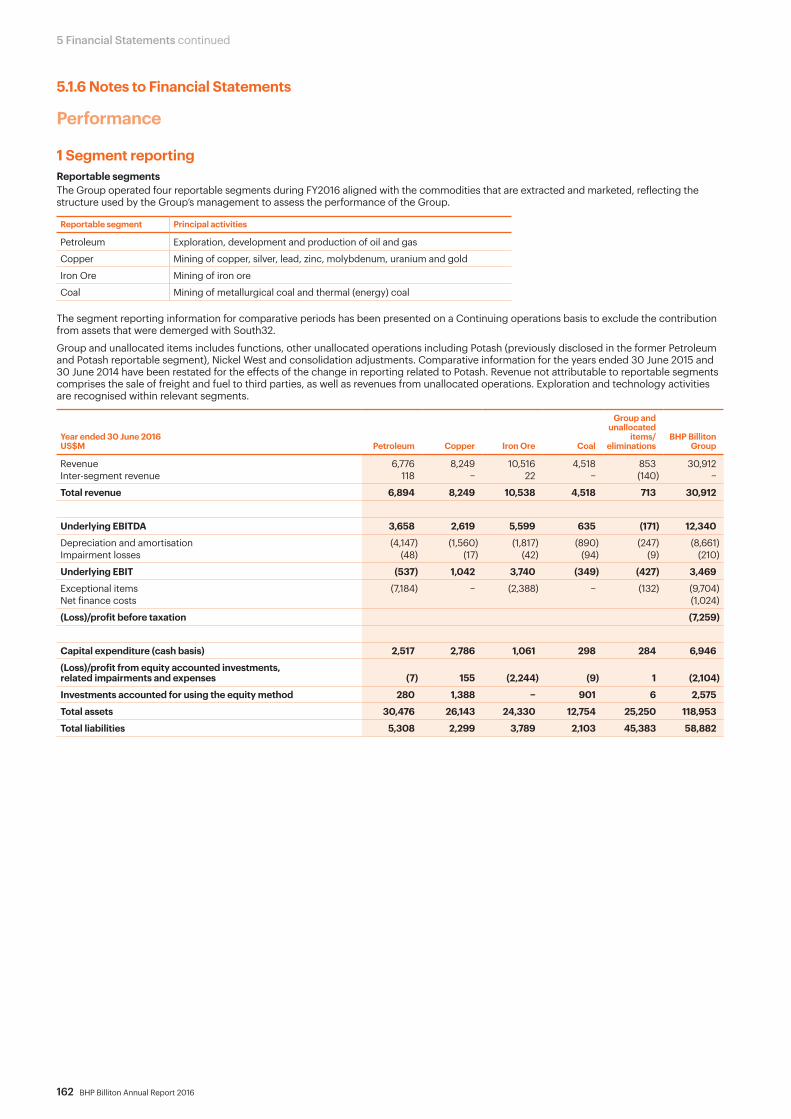
162 BHP Billiton Annual Report 2016
5 Financial Statements continued
5.1.6 Notes to Financial Statements
Performance
1 Segment reportingReportable segmentsThe Group operated four reportable segments during FY2016 aligned with the commodities that are extracted and marketed, reflecting the structure used by the Group’s management to assess the performance of the Group.
Reportable segment Principal activities
Petroleum Exploration, development and production of oil and gas
Copper Mining of copper, silver, lead, zinc, molybdenum, uranium and gold
Iron Ore Mining of iron ore
Coal Mining of metallurgical coal and thermal (energy) coal
The segment reporting information for comparative periods has been presented on a Continuing operations basis to exclude the contribution from assets that were demerged with South32.
Group and unallocated items includes functions, other unallocated operations including Potash (previously disclosed in the former Petroleum and Potash reportable segment), Nickel West and consolidation adjustments. Comparative information for the years ended 30 June 2015 and 30 June 2014 have been restated for the effects of the change in reporting related to Potash. Revenue not attributable to reportable segments comprises the sale of freight and fuel to third parties, as well as revenues from unallocated operations. Exploration and technology activities are recognised within relevant segments.
Year ended 30 June 2016US$M Petroleum Copper Iron Ore Coal
Group and unallocated
items/ eliminations
BHP Billiton Group
Revenue 6,776 8,249 10,516 4,518 853 30,912Inter-segment revenue 118 − 22 − (140) −
Total revenue 6,894 8,249 10,538 4,518 713 30,912
Underlying EBITDA 3,658 2,619 5,599 635 (171) 12,340
Depreciation and amortisation (4,147) (1,560) (1,817) (890) (247) (8,661)Impairment losses (48) (17) (42) (94) (9) (210)
Underlying EBIT (537) 1,042 3,740 (349) (427) 3,469
Exceptional items (7,184) − (2,388) − (132) (9,704)Net finance costs (1,024)
(Loss)/profit before taxation (7,259)
Capital expenditure (cash basis) 2,517 2,786 1,061 298 284 6,946
(Loss)/profit from equity accounted investments, related impairments and expenses (7) 155 (2,244) (9) 1 (2,104)
Investments accounted for using the equity method 280 1,388 − 901 6 2,575
Total assets 30,476 26,143 24,330 12,754 25,250 118,953
Total liabilities 5,308 2,299 3,789 2,103 45,383 58,882

BHP Billiton Annual Report 2016 163
1 Segment reporting continued
Year ended 30 June 2015US$MRestated Petroleum Copper Iron Ore Coal
Group and unallocated
items/ eliminations
BHP Billiton Group
Revenue 11,180 11,453 14,649 5,885 1,469 44,636Inter-segment revenue 267 − 104 − (371) −
Total revenue 11,447 11,453 14,753 5,885 1,098 44,636
Underlying EBITDA 7,201 5,205 8,648 1,242 (444) 21,852
Depreciation and amortisation (4,738) (1,545) (1,698) (875) (302) (9,158)Impairment losses (477) (307) (18) (19) (7) (828)
Underlying EBIT 1,986 3,353 6,932 348 (753) 11,866
Exceptional items (2,787) – – – (409) (3,196)Net finance costs (614)
Profit before taxation 8,056
Capital expenditure (cash basis) 5,023 3,822 1,930 729 443 11,947
(Loss)/profit from equity accounted investments, related impairments and expenses − 175 371 1 1 548
Investments accounted for using the equity method 287 1,422 1,044 956 3 3,712
Total assets 40,325 26,340 26,808 14,182 16,925 124,580
Total liabilities 6,722 2,639 2,854 2,413 39,407 54,035
Year ended 30 June 2014US$MRestated Petroleum Copper Iron Ore Coal
Group and unallocated
items/ eliminations
BHP Billiton Group
Revenue 14,571 12,789 21,143 6,563 1,696 56,762Inter-segment revenue 262 − 213 − (475) −
Total revenue 14,833 12,789 21,356 6,563 1,221 56,762
Underlying EBITDA 9,826 6,127 13,531 1,258 (450) 30,292
Depreciation and amortisation (3,945) (1,371) (1,464) (683) (253) (7,716)Impairment (losses)/reversals (309) (88) 35 − (116) (478)
Underlying EBIT 5,572 4,668 12,102 575 (819) 22,098
Exceptional items – 551 – – – 551Net finance costs (914)
Profit before taxation 21,735
Capital expenditure (cash basis) 5,879 3,697 2,949 1,971 728 15,224
(Loss)/profit from equity accounted investments, related impairments and expenses (4) 438 607 140 4 1,185
Investments accounted for using the equity method 115 1,386 1,069 1,079 15 3,664
Total assets 44,576 24,255 27,412 14,919 40,251 151,413
Total liabilities 7,317 2,258 4,022 3,010 49,424 66,031
6 Additional inform
ation7
Shareholder information
5Financial Statem
ents
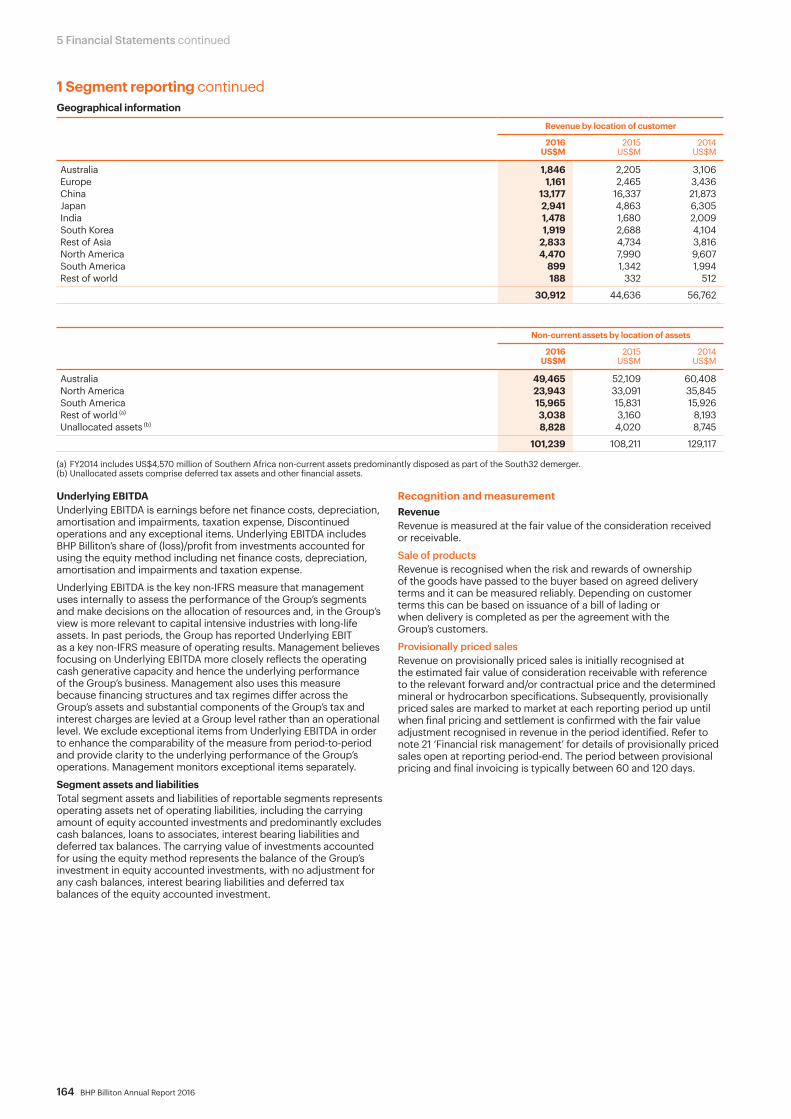
164 BHP Billiton Annual Report 2016
5 Financial Statements continued
1 Segment reporting continuedGeographical information
Revenue by location of customer
2016 US$M
2015 US$M
2014 US$M
Australia 1,846 2,205 3,106Europe 1,161 2,465 3,436China 13,177 16,337 21,873Japan 2,941 4,863 6,305India 1,478 1,680 2,009South Korea 1,919 2,688 4,104Rest of Asia 2,833 4,734 3,816North America 4,470 7,990 9,607South America 899 1,342 1,994Rest of world 188 332 512
30,912 44,636 56,762
Non-current assets by location of assets
2016 US$M
2015 US$M
2014 US$M
Australia 49,465 52,109 60,408North America 23,943 33,091 35,845South America 15,965 15,831 15,926Rest of world (a) 3,038 3,160 8,193Unallocated assets (b) 8,828 4,020 8,745
101,239 108,211 129,117
(a) FY2014 includes US$4,570 million of Southern Africa non-current assets predominantly disposed as part of the South32 demerger.(b) Unallocated assets comprise deferred tax assets and other financial assets.
Underlying EBITDAUnderlying EBITDA is earnings before net finance costs, depreciation, amortisation and impairments, taxation expense, Discontinued operations and any exceptional items. Underlying EBITDA includes BHP Billiton’s share of (loss)/profit from investments accounted for using the equity method including net finance costs, depreciation, amortisation and impairments and taxation expense.
Underlying EBITDA is the key non-IFRS measure that management uses internally to assess the performance of the Group’s segments and make decisions on the allocation of resources and, in the Group’s view is more relevant to capital intensive industries with long-life assets. In past periods, the Group has reported Underlying EBIT as a key non-IFRS measure of operating results. Management believes focusing on Underlying EBITDA more closely reflects the operating cash generative capacity and hence the underlying performance of the Group’s business. Management also uses this measure because financing structures and tax regimes differ across the Group’s assets and substantial components of the Group’s tax and interest charges are levied at a Group level rather than an operational level. We exclude exceptional items from Underlying EBITDA in order to enhance the comparability of the measure from period-to-period and provide clarity to the underlying performance of the Group’s operations. Management monitors exceptional items separately.
Segment assets and liabilitiesTotal segment assets and liabilities of reportable segments represents operating assets net of operating liabilities, including the carrying amount of equity accounted investments and predominantly excludes cash balances, loans to associates, interest bearing liabilities and deferred tax balances. The carrying value of investments accounted for using the equity method represents the balance of the Group’s investment in equity accounted investments, with no adjustment for any cash balances, interest bearing liabilities and deferred tax balances of the equity accounted investment.
Recognition and measurementRevenueRevenue is measured at the fair value of the consideration received or receivable.
Sale of productsRevenue is recognised when the risk and rewards of ownership of the goods have passed to the buyer based on agreed delivery terms and it can be measured reliably. Depending on customer terms this can be based on issuance of a bill of lading or when delivery is completed as per the agreement with the Group’s customers.
Provisionally priced salesRevenue on provisionally priced sales is initially recognised at the estimated fair value of consideration receivable with reference to the relevant forward and/or contractual price and the determined mineral or hydrocarbon specifications. Subsequently, provisionally priced sales are marked to market at each reporting period up until when final pricing and settlement is confirmed with the fair value adjustment recognised in revenue in the period identified. Refer to note 21 ‘Financial risk management’ for details of provisionally priced sales open at reporting period-end. The period between provisional pricing and final invoicing is typically between 60 and 120 days.
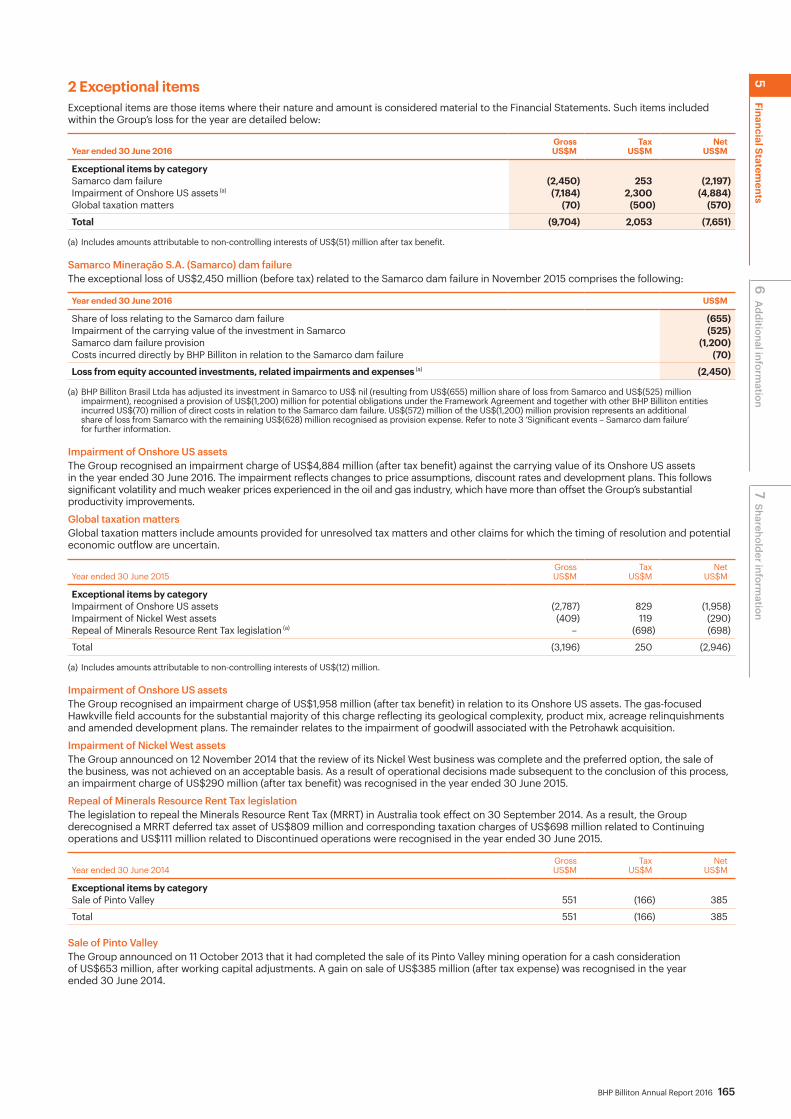
BHP Billiton Annual Report 2016 165
2 Exceptional itemsExceptional items are those items where their nature and amount is considered material to the Financial Statements. Such items included within the Group’s loss for the year are detailed below:
Year ended 30 June 2016GrossUS$M
TaxUS$M
NetUS$M
Exceptional items by categorySamarco dam failure (2,450) 253 (2,197)Impairment of Onshore US assets (a) (7,184) 2,300 (4,884)Global taxation matters (70) (500) (570)
Total (9,704) 2,053 (7,651)
(a) Includes amounts attributable to non-controlling interests of US$(51) million after tax benefit.
Samarco Mineração S.A. (Samarco) dam failureThe exceptional loss of US$2,450 million (before tax) related to the Samarco dam failure in November 2015 comprises the following:
Year ended 30 June 2016 US$M
Share of loss relating to the Samarco dam failure (655)Impairment of the carrying value of the investment in Samarco (525)Samarco dam failure provision (1,200)Costs incurred directly by BHP Billiton in relation to the Samarco dam failure (70)
Loss from equity accounted investments, related impairments and expenses (a) (2,450)
(a) BHP Billiton Brasil Ltda has adjusted its investment in Samarco to US$ nil (resulting from US$(655) million share of loss from Samarco and US$(525) million impairment), recognised a provision of US$(1,200) million for potential obligations under the Framework Agreement and together with other BHP Billiton entities incurred US$(70) million of direct costs in relation to the Samarco dam failure. US$(572) million of the US$(1,200) million provision represents an additional share of loss from Samarco with the remaining US$(628) million recognised as provision expense. Refer to note 3 ‘Significant events – Samarco dam failure’ for further information.
Impairment of Onshore US assetsThe Group recognised an impairment charge of US$4,884 million (after tax benefit) against the carrying value of its Onshore US assets in the year ended 30 June 2016. The impairment reflects changes to price assumptions, discount rates and development plans. This follows significant volatility and much weaker prices experienced in the oil and gas industry, which have more than offset the Group’s substantial productivity improvements.
Global taxation mattersGlobal taxation matters include amounts provided for unresolved tax matters and other claims for which the timing of resolution and potential economic outflow are uncertain.
Year ended 30 June 2015GrossUS$M
TaxUS$M
NetUS$M
Exceptional items by categoryImpairment of Onshore US assets (2,787) 829 (1,958)Impairment of Nickel West assets (409) 119 (290)Repeal of Minerals Resource Rent Tax legislation (a) – (698) (698)
Total (3,196) 250 (2,946)
(a) Includes amounts attributable to non-controlling interests of US$(12) million.
Impairment of Onshore US assets The Group recognised an impairment charge of US$1,958 million (after tax benefit) in relation to its Onshore US assets. The gas-focused Hawkville field accounts for the substantial majority of this charge reflecting its geological complexity, product mix, acreage relinquishments and amended development plans. The remainder relates to the impairment of goodwill associated with the Petrohawk acquisition.
Impairment of Nickel West assetsThe Group announced on 12 November 2014 that the review of its Nickel West business was complete and the preferred option, the sale of the business, was not achieved on an acceptable basis. As a result of operational decisions made subsequent to the conclusion of this process, an impairment charge of US$290 million (after tax benefit) was recognised in the year ended 30 June 2015.
Repeal of Minerals Resource Rent Tax legislationThe legislation to repeal the Minerals Resource Rent Tax (MRRT) in Australia took effect on 30 September 2014. As a result, the Group derecognised a MRRT deferred tax asset of US$809 million and corresponding taxation charges of US$698 million related to Continuing operations and US$111 million related to Discontinued operations were recognised in the year ended 30 June 2015.
Year ended 30 June 2014GrossUS$M
TaxUS$M
NetUS$M
Exceptional items by categorySale of Pinto Valley 551 (166) 385
Total 551 (166) 385
Sale of Pinto ValleyThe Group announced on 11 October 2013 that it had completed the sale of its Pinto Valley mining operation for a cash consideration of US$653 million, after working capital adjustments. A gain on sale of US$385 million (after tax expense) was recognised in the year ended 30 June 2014.
6 Additional inform
ation7
Shareholder information
5Financial Statem
ents

166 BHP Billiton Annual Report 2016
5 Financial Statements continued
3 Significant events – Samarco dam failureOn 5 November 2015, the Samarco Mineração S.A. (Samarco) iron ore operation in Minas Gerais, Brazil, experienced a tailings dam failure that resulted in a release of mine tailings, flooding the community of Bento Rodrigues and impacting other communities downstream (Samarco dam failure). Refer to section 1.4 ‘Samarco’.
Samarco is jointly owned by BHP Billiton Brasil Ltda (BHP Billiton Brasil) and Vale S.A. (Vale). BHP Billiton Brasil’s 50 per cent interest is accounted for as an equity accounted joint venture investment. BHP Billiton Brasil does not separately recognise its share of the underlying assets and liabilities of Samarco, but instead records the investment as one line on the balance sheet. Each period, BHP Billiton Brasil recognises its 50 per cent share of Samarco’s profit or loss and adjusts the carrying value of the investment in Samarco accordingly. Such adjustment continues until the investment carrying value is reduced to US$ nil, with any additional share of Samarco losses only recognised to the extent that BHP Billiton Brasil has an obligation to fund the losses, or when future investment funding is provided. After applying equity accounting, any remaining carrying value of the investment is tested for impairment.
Any charges relating to the Samarco dam failure incurred directly by BHP Billiton Brasil or other BHP Billiton entities are recognised 100 per cent in the Group’s results.
The financial impacts of the Samarco dam failure on the Group’s income statement, balance sheet and cash flow statement for the year ended 30 June 2016 are shown in the table below and have been treated as an exceptional item. The table below does not include BHP Billiton Brasil’s share of the results of Samarco prior to the Samarco dam failure, which is disclosed in note 28 ‘Investments accounted for using the equity method’, along with the summary financial information related to Samarco as at 30 June 2016.
Financial impacts of Samarco dam failureYear ended 30 June 2016 US$M
Income statement Expenses excluding net finance costs
Costs incurred directly by BHP Billiton Brasil and other BHP Billiton entities in relation to the Samarco dam failure (a) (70)(Loss)/profit from equity accounted investments, related impairments and expenses
Share of loss relating to the Samarco dam failure (b) (655)Impairment of the carrying value of the investment in Samarco (b) (525)Samarco dam failure provision (b) (1,200)
Loss before taxation (2,450)Income tax benefit 253
Loss after taxation (2,197)
Balance sheet movementTrade and other payables (11)Investments accounted for using the equity method (1,180)Deferred tax assets (158)Provisions (1,200)Deferred tax liabilities 411
Net liabilities (2,138)
Cash flow statementLoss before taxation (2,450)Comprising:Costs incurred directly by BHP Billiton Brasil and other BHP Billiton entities in relation to the Samarco dam failure (a) (70)Share of loss relating to the Samarco dam failure (b) (655)Impairment of the carrying value of the investment in Samarco (b) (525)Samarco dam failure provision (b) (1,200)Non-cash items 2,391
Net operating cash flows (59)
(a) Includes legal and advisor costs incurred.(b) BHP Billiton Brasil has adjusted its investment in Samarco to US$ nil (resulting from US$(655) million share of loss from Samarco and US$(525) million impairment)
and recognised a provision of US$(1,200) million for potential obligations under the Framework Agreement (defined on page 167). US$(572) million of the US$(1,200) million provision represents an additional share of loss from Samarco with the remaining US$(628) million recognised as provision expense.

BHP Billiton Annual Report 2016 167
3 Significant events – Samarco dam failure continuedEquity accounted investment in SamarcoThe following table details the movement in the carrying value of BHP Billiton Brasil’s equity accounted investment in Samarco:
Year ended 30 June 2016 US$M
At the beginning of the financial year 1,044
Share of operating profit prior to the Samarco dam failure 136Share of loss relating to the Samarco dam failure (a) (655)Impairment of the carrying value of the investment in Samarco (a) (525)Samarco dam failure provision (a) (1,200)
(Loss)/profit from equity accounted investments, related impairments and expenses (2,244)
Loss and expenses recognised as a provision for Samarco dam failure (b) 1,200Dividends received (c) –Investment –
At the end of the financial year –
(a) BHP Billiton Brasil has adjusted its investment in Samarco to US$ nil (resulting from US$(655) million share of loss from Samarco and US$(525) million impairment) and recognised a provision of US$(1,200) million for potential obligations under the Framework Agreement (defined below). US$(572) million of the US$(1,200) million provision represents an additional share of loss from Samarco with the remaining US$(628) million recognised as provision expense.
(b) As the investment carrying value has been adjusted to US$ nil, additional share of Samarco losses US$(572) million and Samarco dam failure provision expense US$(628) million are included in the provision for Samarco dam failure. This reflects BHP Billiton Brasil’s US$(1,200) million potential legal funding obligation to the Foundation as a result of the Framework Agreement (defined below).
(c) Samarco currently does not have profits available for distribution and is legally prevented from paying previously declared and unpaid dividends.
At the half year ended 31 December 2015, the Group assessed the recoverability of its investment in light of uncertainties surrounding the nature and timing of ongoing future operations. As a result, an impairment charge of US$525 million was recognised, reducing the investment balance to US$ nil.
As described below, the Group has recognised a provision of US$1,200 million at 30 June 2016 in respect of BHP Billiton Brasil’s potential obligation under the Framework Agreement (defined below). This reflects the ongoing uncertainty surrounding the nature and timing of a potential restart of Samarco’s operations. In doing so, the Group has recognised BHP Billiton Brasil’s share of all losses recognised by Samarco to 30 June 2016.
Provision for Samarco dam failure
Year ended 30 June 2016 US$M
At the beginning of the financial year –Provision recognition, comprising:
Share of loss relating to the Samarco dam failure 572Samarco dam failure provision expense 628
At the end of the financial year 1,200
Comprising:Current 300Non-current 900
Dam failure provisions and contingencies As at 30 June 2016, BHP Billiton Brasil has identified provisions and contingent liabilities arising as a consequence of the Samarco dam failure as follows:Environment and socio-economic remediation Framework AgreementOn 2 March 2016, BHP Billiton Brasil, together with Samarco and Vale, entered into a Framework Agreement (Agreement) with the Federal Attorney General of Brazil, the states of Espírito Santo and Minas Gerais and certain other public authorities to establish a Foundation that will develop and execute environmental and socio-economic programs to remediate and provide compensation for damage caused by the Samarco dam failure. On 5 May 2016, the Agreement was ratified by the Federal Court of Appeal suspending the public civil claim disclosed below.
The Federal Prosecutor’s Office appealed the ratification of the Agreement and on 30 June 2016, the Superior Court of Justice in Brazil issued a preliminary order (Interim Order) suspending the 5 May 2016 ratification of the Agreement.
Samarco, Vale and BHP Billiton Brasil have appealed the Interim Order before the Superior Court of Justice.
The term of the Agreement is 15 years, renewable for periods of one year successively until all obligations under the Agreement have been performed. Under the Agreement, Samarco is responsible for funding the Foundation with calendar year contributions as follows:• R$2 billion (approximately US$620 million) in 2016, less the
amount of funds already spent on, or allocated to, remediation and compensation activity;
• R$1.2 billion (approximately US$370 million) in 2017;
• R$1.2 billion (approximately US$370 million) in 2018; • R$500 million (approximately US$155 million) for a special
project to be spent on sewage treatment and landfill works from 2016 to 2018.
Annual contributions for each of the years 2019, 2020 and 2021 will be in the range of R$800 million (approximately US$250 million) and R$1.6 billion (approximately US$500 million), depending on the remediation and compensation projects which are to be undertaken in the particular year. Annual contributions may be reviewed under the Agreement. To the extent that Samarco does not meet its funding obligations under the Agreement, each of Vale and BHP Billiton Brasil has potential funding obligations under the Agreement in proportion to its 50 per cent shareholding in Samarco.
Mining and processing operations remain suspended following the dam failure. Samarco is currently progressing plans to resume operations, however significant uncertainties surrounding the nature and timing of ongoing future operations remain. In light of these uncertainties and based on currently available information, BHP Billiton Brasil has recognised a provision of US$1,200 million before tax and after discounting at 30 June 2016, in respect of its potential obligations under the Agreement.
The measurement of the provision requires the use of estimates and assumptions and may be affected by, amongst other factors, potential changes in scope of work required under the Agreement including further technical analysis, costs incurred in respect of programs delivered, resolution of uncertainty in respect of operational restart, updates to discount and foreign exchange rates, resolution of existing and potential legal claims and the status of the Agreement. As a result, future actual expenditures may differ from the amounts currently provided and changes to key assumptions and estimates could result in a material impact to the amount of the provision in future reporting periods.
6 Additional inform
ation7
Shareholder information
5Financial Statem
ents
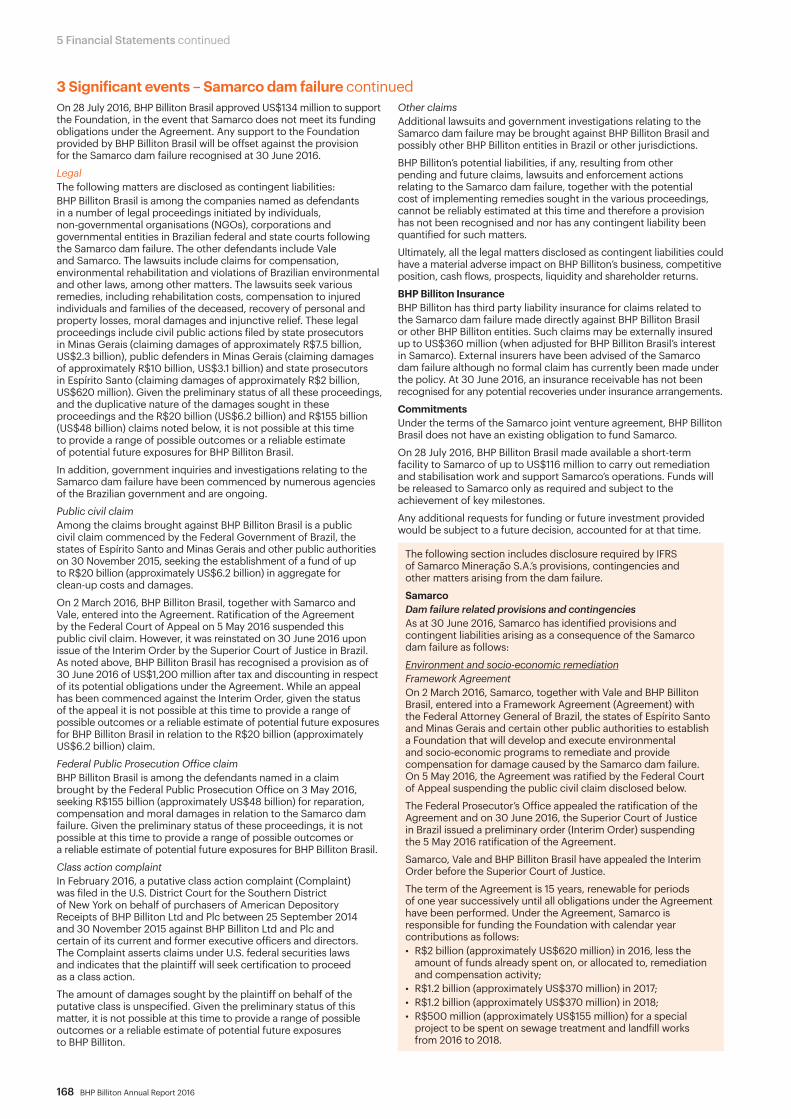
168 BHP Billiton Annual Report 2016
5 Financial Statements continued
3 Significant events – Samarco dam failure continuedOn 28 July 2016, BHP Billiton Brasil approved US$134 million to support the Foundation, in the event that Samarco does not meet its funding obligations under the Agreement. Any support to the Foundation provided by BHP Billiton Brasil will be offset against the provision for the Samarco dam failure recognised at 30 June 2016.
LegalThe following matters are disclosed as contingent liabilities:BHP Billiton Brasil is among the companies named as defendants in a number of legal proceedings initiated by individuals, non-governmental organisations (NGOs), corporations and governmental entities in Brazilian federal and state courts following the Samarco dam failure. The other defendants include Vale and Samarco. The lawsuits include claims for compensation, environmental rehabilitation and violations of Brazilian environmental and other laws, among other matters. The lawsuits seek various remedies, including rehabilitation costs, compensation to injured individuals and families of the deceased, recovery of personal and property losses, moral damages and injunctive relief. These legal proceedings include civil public actions filed by state prosecutors in Minas Gerais (claiming damages of approximately R$7.5 billion, US$2.3 billion), public defenders in Minas Gerais (claiming damages of approximately R$10 billion, US$3.1 billion) and state prosecutors in Espírito Santo (claiming damages of approximately R$2 billion, US$620 million). Given the preliminary status of all these proceedings, and the duplicative nature of the damages sought in these proceedings and the R$20 billion (US$6.2 billion) and R$155 billion (US$48 billion) claims noted below, it is not possible at this time to provide a range of possible outcomes or a reliable estimate of potential future exposures for BHP Billiton Brasil.
In addition, government inquiries and investigations relating to the Samarco dam failure have been commenced by numerous agencies of the Brazilian government and are ongoing.
Public civil claim Among the claims brought against BHP Billiton Brasil is a public civil claim commenced by the Federal Government of Brazil, the states of Espírito Santo and Minas Gerais and other public authorities on 30 November 2015, seeking the establishment of a fund of up to R$20 billion (approximately US$6.2 billion) in aggregate for clean-up costs and damages.
On 2 March 2016, BHP Billiton Brasil, together with Samarco and Vale, entered into the Agreement. Ratification of the Agreement by the Federal Court of Appeal on 5 May 2016 suspended this public civil claim. However, it was reinstated on 30 June 2016 upon issue of the Interim Order by the Superior Court of Justice in Brazil. As noted above, BHP Billiton Brasil has recognised a provision as of 30 June 2016 of US$1,200 million after tax and discounting in respect of its potential obligations under the Agreement. While an appeal has been commenced against the Interim Order, given the status of the appeal it is not possible at this time to provide a range of possible outcomes or a reliable estimate of potential future exposures for BHP Billiton Brasil in relation to the R$20 billion (approximately US$6.2 billion) claim.
Federal Public Prosecution Office claimBHP Billiton Brasil is among the defendants named in a claim brought by the Federal Public Prosecution Office on 3 May 2016, seeking R$155 billion (approximately US$48 billion) for reparation, compensation and moral damages in relation to the Samarco dam failure. Given the preliminary status of these proceedings, it is not possible at this time to provide a range of possible outcomes or a reliable estimate of potential future exposures for BHP Billiton Brasil.
Class action complaintIn February 2016, a putative class action complaint (Complaint) was filed in the U.S. District Court for the Southern District of New York on behalf of purchasers of American Depository Receipts of BHP Billiton Ltd and Plc between 25 September 2014 and 30 November 2015 against BHP Billiton Ltd and Plc and certain of its current and former executive officers and directors. The Complaint asserts claims under U.S. federal securities laws and indicates that the plaintiff will seek certification to proceed as a class action.
The amount of damages sought by the plaintiff on behalf of the putative class is unspecified. Given the preliminary status of this matter, it is not possible at this time to provide a range of possible outcomes or a reliable estimate of potential future exposures to BHP Billiton.
Other claimsAdditional lawsuits and government investigations relating to the Samarco dam failure may be brought against BHP Billiton Brasil and possibly other BHP Billiton entities in Brazil or other jurisdictions.
BHP Billiton’s potential liabilities, if any, resulting from other pending and future claims, lawsuits and enforcement actions relating to the Samarco dam failure, together with the potential cost of implementing remedies sought in the various proceedings, cannot be reliably estimated at this time and therefore a provision has not been recognised and nor has any contingent liability been quantified for such matters.
Ultimately, all the legal matters disclosed as contingent liabilities could have a material adverse impact on BHP Billiton’s business, competitive position, cash flows, prospects, liquidity and shareholder returns.
BHP Billiton InsuranceBHP Billiton has third party liability insurance for claims related to the Samarco dam failure made directly against BHP Billiton Brasil or other BHP Billiton entities. Such claims may be externally insured up to US$360 million (when adjusted for BHP Billiton Brasil’s interest in Samarco). External insurers have been advised of the Samarco dam failure although no formal claim has currently been made under the policy. At 30 June 2016, an insurance receivable has not been recognised for any potential recoveries under insurance arrangements.
Commitments Under the terms of the Samarco joint venture agreement, BHP Billiton Brasil does not have an existing obligation to fund Samarco.
On 28 July 2016, BHP Billiton Brasil made available a short-term facility to Samarco of up to US$116 million to carry out remediation and stabilisation work and support Samarco’s operations. Funds will be released to Samarco only as required and subject to the achievement of key milestones.
Any additional requests for funding or future investment provided would be subject to a future decision, accounted for at that time.
The following section includes disclosure required by IFRS of Samarco Mineração S.A.’s provisions, contingencies and other matters arising from the dam failure.
SamarcoDam failure related provisions and contingenciesAs at 30 June 2016, Samarco has identified provisions and contingent liabilities arising as a consequence of the Samarco dam failure as follows:
Environment and socio-economic remediationFramework AgreementOn 2 March 2016, Samarco, together with Vale and BHP Billiton Brasil, entered into a Framework Agreement (Agreement) with the Federal Attorney General of Brazil, the states of Espírito Santo and Minas Gerais and certain other public authorities to establish a Foundation that will develop and execute environmental and socio-economic programs to remediate and provide compensation for damage caused by the Samarco dam failure. On 5 May 2016, the Agreement was ratified by the Federal Court of Appeal suspending the public civil claim disclosed below.
The Federal Prosecutor’s Office appealed the ratification of the Agreement and on 30 June 2016, the Superior Court of Justice in Brazil issued a preliminary order (Interim Order) suspending the 5 May 2016 ratification of the Agreement.
Samarco, Vale and BHP Billiton Brasil have appealed the Interim Order before the Superior Court of Justice.
The term of the Agreement is 15 years, renewable for periods of one year successively until all obligations under the Agreement have been performed. Under the Agreement, Samarco is responsible for funding the Foundation with calendar year contributions as follows:• R$2 billion (approximately US$620 million) in 2016, less the
amount of funds already spent on, or allocated to, remediation and compensation activity;
• R$1.2 billion (approximately US$370 million) in 2017;• R$1.2 billion (approximately US$370 million) in 2018; • R$500 million (approximately US$155 million) for a special
project to be spent on sewage treatment and landfill works from 2016 to 2018.

BHP Billiton Annual Report 2016 169
3 Significant events – Samarco dam failure continued
Annual contributions for each of the years 2019, 2020 and 2021 will be in the range of R$800 million (approximately US$250 million) and R$1.6 billion (approximately US$500 million), depending on the remediation and compensation projects which are to be undertaken in the particular year. Annual contributions may be reviewed under the Agreement.
As at 30 June 2016, Samarco has a provision of US$2,400 million before tax and after discounting, in relation to its obligations under the Agreement based on currently available information.
The measurement of the provision requires the use of estimates and assumptions and may be affected by, amongst other factors, potential changes in scope of work required under the Agreement including further technical analysis, costs incurred in respect of programs delivered, resolution of uncertainty in respect of operational restart, updates to discount and foreign exchange rates, resolution of existing and potential legal claims and the status of the Agreement. As a result, future actual expenditures may differ from the amounts currently provided and changes to key assumptions and estimates could result in a material impact to the amount of the provision in future reporting periods.
Other As at 30 June 2016, Samarco has recognised provisions of US$172 million, in addition to its obligations under the Agreement, based on currently available information. The magnitude, scope and timing of these additional costs are subject to a high degree of uncertainty and Samarco has indicated that it anticipates that it will incur future costs beyond those provided. These uncertainties are likely to continue for a significant period and changes to key assumptions could result in a material change to the amount of the provision in future reporting periods. Any such unrecognised obligations are therefore contingent liabilities and, at present, it is not practicable to estimate their magnitude or possible timing of payment. Accordingly, it is also not possible to provide a range of possible outcomes or a reliable estimate of total potential future exposures at this time.
LegalSamarco has been named as defendant in a number of legal proceedings initiated by individuals, NGOs, corporations and governmental entities in Brazilian federal and state courts following the Samarco dam failure. These lawsuits include claims for compensation, environmental rehabilitation and violations of Brazilian environmental and other laws, among other matters. The lawsuits seek various remedies, including rehabilitation costs, compensation to injured individuals and families of the deceased, recovery of personal and property losses, moral damages and injunctive relief. These legal proceedings include civil public actions filed by state prosecutors in Minas Gerais (claiming damages of approximately R$7.5 billion, US$2.3 billion), public defenders in Minas Gerais (claiming damages of approximately R$10 billion, US$3.1 billion), and state prosecutors in Espírito Santo (claiming damages of approximately R$2 billion, US$620 million). Given the preliminary status of all these proceedings, and the duplicative nature of the damages sought in these proceedings and the R$20 billion (US$6.2 billion) and R$155 billion (US$48 billion) claims noted below, it is not possible at this time to provide a range of possible outcomes or a reliable estimate of potential future exposures for Samarco.
In addition, government investigations of the Samarco dam failure by numerous agencies of the Brazilian government have commenced and are ongoing.
Public civil claimAmong the claims brought against Samarco, is a public civil claim commenced by the Federal Government of Brazil, the states of Espírito Santo and Minas Gerais and other public authorities on 30 November 2015, seeking the establishment of a fund of up to R$20 billion (approximately US$6.2 billion) in aggregate for clean-up costs and damages.
On 2 March 2016, Samarco, together with Vale and BHP Billiton Brasil, entered into the Agreement. Ratification of the Agreement by the Federal Court of Appeal on 5 May 2016 suspended this public civil claim. However, it was reinstated on 30 June 2016 upon issue of the Interim Order by the Superior Court of Justice in Brazil. As noted above, Samarco has recognised a provision as of 30 June 2016 of US$2,400 million before tax and discounting in respect of its potential obligations under the Agreement. While an appeal has been commenced against the Interim Order, given the status of the appeal it is not possible at this time to provide a range of possible outcomes or a reliable estimate of potential future exposures for Samarco in relation to the R$20 billion (approximately US$6.2 billion) claim.
Federal Public Prosecution Office claimSamarco is among the defendants named in a claim brought by the Federal Public Prosecution Office on 3 May 2016, seeking R$155 billion (approximately US$48 billion) for reparation, compensation and moral damages in relation to the Samarco dam failure. Given the preliminary status of these proceedings, it is not possible at this time to provide a range of possible outcomes or a reliable estimate of potential future exposures for Samarco.
Other claimsOther pending lawsuits and investigations are at the early stages of proceedings. Until further facts are developed; court rulings clarify the issues in dispute, liability and damages; trial activity nears, or other actions such as possible settlements occur, it is not possible to arrive at a range of outcomes or a reliable estimate of Samarco’s obligations arising from these matters and therefore Samarco has not recognised a provision or quantified a contingent liability.
Additional claims may be brought against Samarco. A provision has not been made by Samarco for claims yet to be filed. Given the significant uncertainties surrounding possible outcomes it is not possible for Samarco to arrive at a range of outcomes or a reliable estimate of the liability for any unfiled claims.
Samarco InsuranceSamarco has standalone insurance policies in place with Brazilian and global insurers. Samarco has notified insurers including those covering property, project and liability risks. Insurers have appointed loss adjusters or claims representatives to investigate and assist with the claims process. The respective adjustment processes for these policies continues. An insurance receivable has not been recognised by Samarco for any recoveries under insurance arrangements at 30 June 2016.
Samarco CommitmentsAt 30 June 2016, Samarco has commitments of US$1,482 million (2015: US$2,544 million). Following the dam failure Samarco invoked force majeure clauses in a number of long-term contracts with suppliers and service providers to suspend contractual obligations.
Samarco non-dam failure related contingent liabilitiesThe following non-dam failure related contingent liabilities pre-date and are unrelated to the Samarco dam failure. Samarco is currently contesting both of these matters in the Brazilian courts. Given the status of the proceedings, the timing of resolution and potential economic outflow are uncertain. BHP Billiton entities have no legal obligation related to these matters.
Brazilian Social Contribution Levy Samarco has received tax assessments for the alleged non-payment of Brazilian Social Contribution Levy for the calendar years 2008 to 2014 totalling approximately R$3.9 billion (approximately US$1.2 billion).
Brazilian corporate income tax rate Samarco has received tax assessments for alleged incorrect calculation of Corporate Income Tax (IRPJ) in respect of the 2000 to 2002 and 2007 to 2014 income years totalling approximately R$3.3 billion (approximately US$1.0 billion).
6 Additional inform
ation7
Shareholder information
5Financial Statem
ents
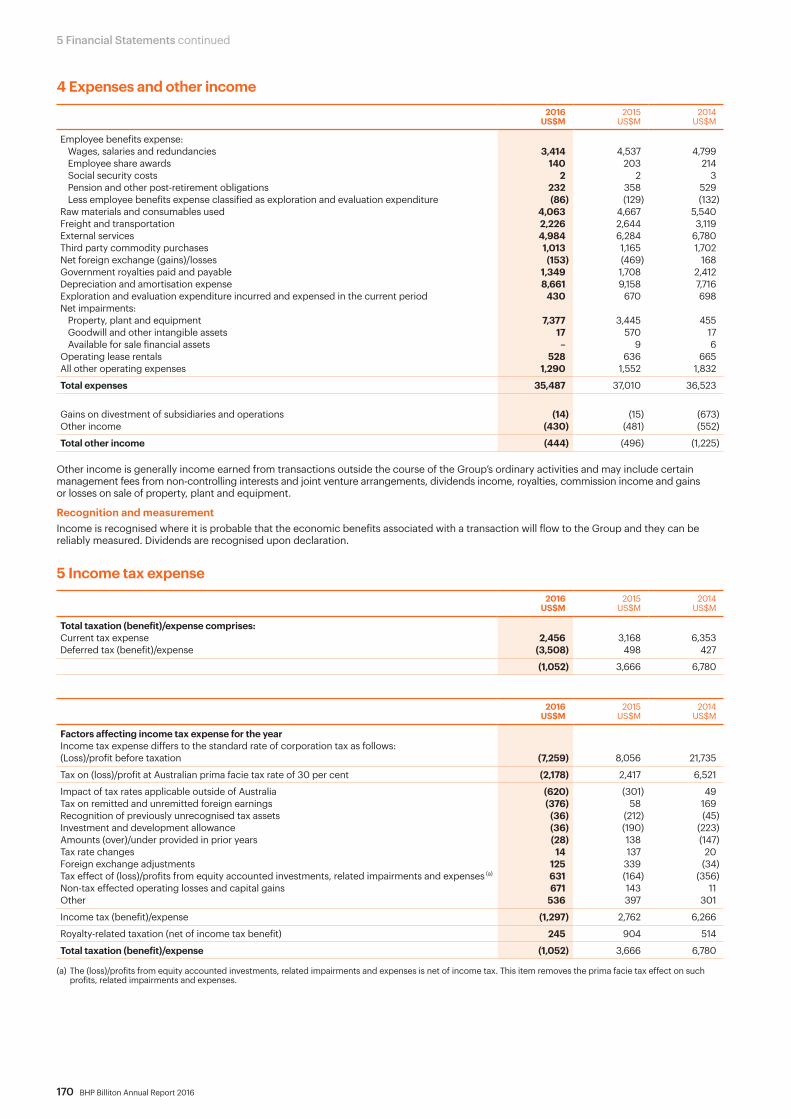
170 BHP Billiton Annual Report 2016
5 Financial Statements continued
4 Expenses and other income 2016
US$M 2015
US$M 2014
US$M
Employee benefits expense:Wages, salaries and redundancies 3,414 4,537 4,799Employee share awards 140 203 214Social security costs 2 2 3Pension and other post-retirement obligations 232 358 529Less employee benefits expense classified as exploration and evaluation expenditure (86) (129) (132)
Raw materials and consumables used 4,063 4,667 5,540Freight and transportation 2,226 2,644 3,119External services 4,984 6,284 6,780Third party commodity purchases 1,013 1,165 1,702Net foreign exchange (gains)/losses (153) (469) 168Government royalties paid and payable 1,349 1,708 2,412Depreciation and amortisation expense 8,661 9,158 7,716Exploration and evaluation expenditure incurred and expensed in the current period 430 670 698Net impairments:
Property, plant and equipment 7,377 3,445 455Goodwill and other intangible assets 17 570 17Available for sale financial assets – 9 6
Operating lease rentals 528 636 665All other operating expenses 1,290 1,552 1,832
Total expenses 35,487 37,010 36,523
Gains on divestment of subsidiaries and operations (14) (15) (673)Other income (430) (481) (552)
Total other income (444) (496) (1,225)
Other income is generally income earned from transactions outside the course of the Group’s ordinary activities and may include certain management fees from non-controlling interests and joint venture arrangements, dividends income, royalties, commission income and gains or losses on sale of property, plant and equipment.
Recognition and measurementIncome is recognised where it is probable that the economic benefits associated with a transaction will flow to the Group and they can be reliably measured. Dividends are recognised upon declaration.
5 Income tax expense 2016
US$M 2015
US$M 2014
US$M
Total taxation (benefit)/expense comprises:Current tax expense 2,456 3,168 6,353Deferred tax (benefit)/expense (3,508) 498 427
(1,052) 3,666 6,780
2016US$M
2015US$M
2014US$M
Factors affecting income tax expense for the yearIncome tax expense differs to the standard rate of corporation tax as follows:(Loss)/profit before taxation (7,259) 8,056 21,735
Tax on (loss)/profit at Australian prima facie tax rate of 30 per cent (2,178) 2,417 6,521
Impact of tax rates applicable outside of Australia (620) (301) 49Tax on remitted and unremitted foreign earnings (376) 58 169Recognition of previously unrecognised tax assets (36) (212) (45)Investment and development allowance (36) (190) (223)Amounts (over)/under provided in prior years (28) 138 (147)Tax rate changes 14 137 20Foreign exchange adjustments 125 339 (34)Tax effect of (loss)/profits from equity accounted investments, related impairments and expenses (a) 631 (164) (356)Non-tax effected operating losses and capital gains 671 143 11Other 536 397 301
Income tax (benefit)/expense (1,297) 2,762 6,266
Royalty-related taxation (net of income tax benefit) 245 904 514
Total taxation (benefit)/expense (1,052) 3,666 6,780
(a) The (loss)/profits from equity accounted investments, related impairments and expenses is net of income tax. This item removes the prima facie tax effect on such profits, related impairments and expenses.

BHP Billiton Annual Report 2016 171
5 Income tax expense continuedIncome tax recognised in other comprehensive income is as follows:
2016 US$M
2015 US$M
2014 US$M
Income tax effect of:Items that may be reclassified subsequently to the income statement:Available for sale investments:
Net valuation gains/(losses) taken to equity (1) 1 2Net valuation gains transferred to the income statement – 34 2
Cash flow hedges:(Losses)/gains taken to equity 170 539 (204)Losses/(gains) transferred to the income statement (199) (545) 203
Income tax (charge)/credit relating to items that may be reclassified subsequently to the income statement (30) 29 3
Items that will not be reclassified to the income statement:Remeasurement (losses)/gains on pension and medical schemes 5 14 (6)Employee share awards transferred to retained earnings on exercise (22) (31) 18
Income tax (charge)/credit relating to items that will not be reclassified to the income statement (17) (17) 12
Total income tax (charge)/credit relating to components of other comprehensive income (a) (47) 12 15
(a) Included within total income tax relating to components of other comprehensive income is US$(25) million relating to deferred taxes and US$(22) million relating to current taxes (2015: US$43 million and US$(31) million; 2014: US$(1) million and US$16 million).
Recognition and measurementTaxation on the (loss)/profit for the year comprises current and deferred tax. Taxation is recognised in the income statement except to the extent that it relates to items recognised directly in equity, in which case the tax is recognised in equity.
Current tax Deferred tax Royalty-related taxation
Current tax is the expected tax on the taxable income for the year, using tax rates and laws enacted or substantively enacted at the reporting date, and any adjustments to tax payable in respect of previous years.
Deferred tax is provided in full, on temporary differences arising between the tax bases of assets and liabilities and their carrying amounts in the Financial Statements. Deferred tax assets are recognised to the extent that it is probable that future taxable profits will be available against which the temporary differences can be utilised.Deferred tax is not recognised for temporary differences relating to:• initial recognition of goodwill;• initial recognition of assets or liabilities in a
transaction that is not a business combination and that affects neither accounting nor taxable profit;
• investment in subsidiaries, associates and jointly controlled entities where the Group is able to control the timing of the reversal of the temporary difference and it is probable that they will not reverse in the foreseeable future.
Deferred tax is measured at the tax rates that are expected to be applied when the asset is realised or the liability is settled, based on the laws that have been enacted or substantively enacted at the reporting date.Current and deferred tax assets and liabilities are offset when the Group has a legally enforceable right to offset and when the tax balances are related to taxes levied by the same tax authority and the Group intends to settle on a net basis, or realise the asset and settle the liability simultaneously.
Royalties and resource rent taxes are treated as taxation arrangements (impacting income tax expense/benefit) when they are imposed under government authority and the amount payable is calculated by reference to revenue derived (net of any allowable deductions) after adjustment for temporary differences. Obligations arising from royalty arrangements that do not satisfy these criteria are recognised as current provisions and included in expenses.
6 Additional inform
ation7
Shareholder information
5Financial Statem
ents
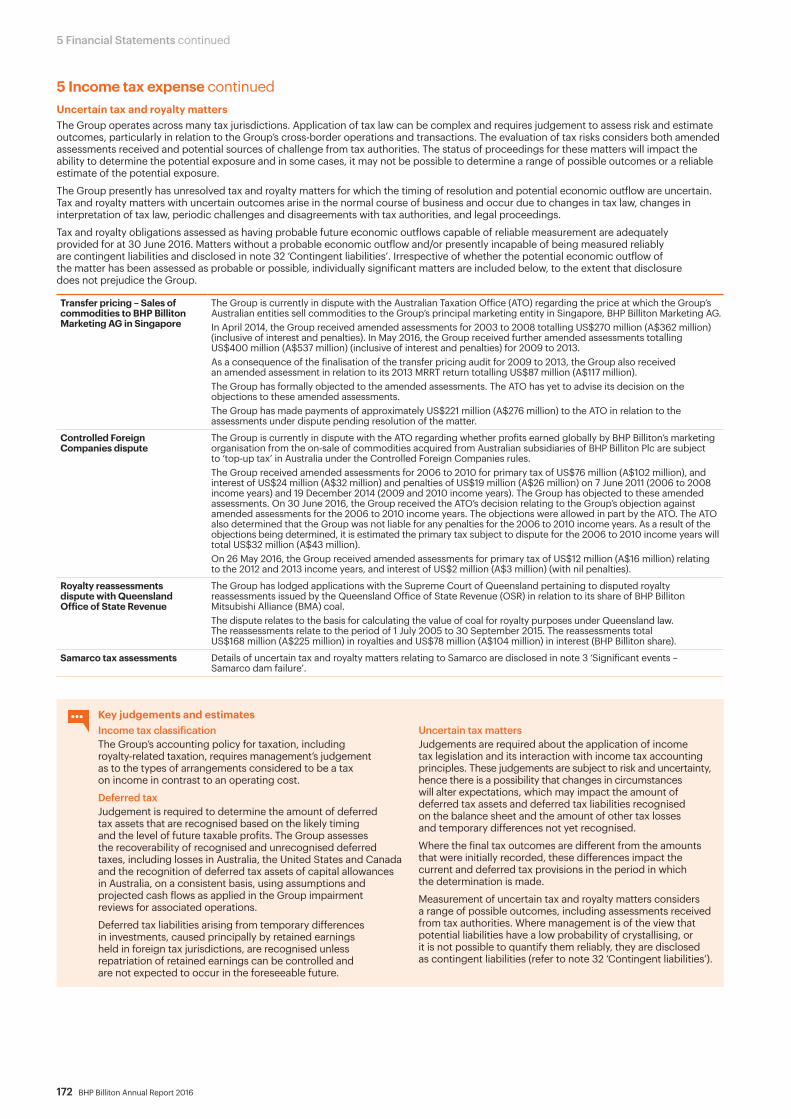
172 BHP Billiton Annual Report 2016
5 Financial Statements continued
5 Income tax expense continuedUncertain tax and royalty mattersThe Group operates across many tax jurisdictions. Application of tax law can be complex and requires judgement to assess risk and estimate outcomes, particularly in relation to the Group’s cross-border operations and transactions. The evaluation of tax risks considers both amended assessments received and potential sources of challenge from tax authorities. The status of proceedings for these matters will impact the ability to determine the potential exposure and in some cases, it may not be possible to determine a range of possible outcomes or a reliable estimate of the potential exposure.
The Group presently has unresolved tax and royalty matters for which the timing of resolution and potential economic outflow are uncertain. Tax and royalty matters with uncertain outcomes arise in the normal course of business and occur due to changes in tax law, changes in interpretation of tax law, periodic challenges and disagreements with tax authorities, and legal proceedings.
Tax and royalty obligations assessed as having probable future economic outflows capable of reliable measurement are adequately provided for at 30 June 2016. Matters without a probable economic outflow and/or presently incapable of being measured reliably are contingent liabilities and disclosed in note 32 ‘Contingent liabilities’. Irrespective of whether the potential economic outflow of the matter has been assessed as probable or possible, individually significant matters are included below, to the extent that disclosure does not prejudice the Group.
Transfer pricing – Sales of commodities to BHP Billiton Marketing AG in Singapore
The Group is currently in dispute with the Australian Taxation Office (ATO) regarding the price at which the Group’s Australian entities sell commodities to the Group’s principal marketing entity in Singapore, BHP Billiton Marketing AG. In April 2014, the Group received amended assessments for 2003 to 2008 totalling US$270 million (A$362 million) (inclusive of interest and penalties). In May 2016, the Group received further amended assessments totalling US$400 million (A$537 million) (inclusive of interest and penalties) for 2009 to 2013. As a consequence of the finalisation of the transfer pricing audit for 2009 to 2013, the Group also received an amended assessment in relation to its 2013 MRRT return totalling US$87 million (A$117 million). The Group has formally objected to the amended assessments. The ATO has yet to advise its decision on the objections to these amended assessments.The Group has made payments of approximately US$221 million (A$276 million) to the ATO in relation to the assessments under dispute pending resolution of the matter.
Controlled Foreign Companies dispute
The Group is currently in dispute with the ATO regarding whether profits earned globally by BHP Billiton’s marketing organisation from the on-sale of commodities acquired from Australian subsidiaries of BHP Billiton Plc are subject to ‘top-up tax’ in Australia under the Controlled Foreign Companies rules.The Group received amended assessments for 2006 to 2010 for primary tax of US$76 million (A$102 million), and interest of US$24 million (A$32 million) and penalties of US$19 million (A$26 million) on 7 June 2011 (2006 to 2008 income years) and 19 December 2014 (2009 and 2010 income years). The Group has objected to these amended assessments. On 30 June 2016, the Group received the ATO’s decision relating to the Group’s objection against amended assessments for the 2006 to 2010 income years. The objections were allowed in part by the ATO. The ATO also determined that the Group was not liable for any penalties for the 2006 to 2010 income years. As a result of the objections being determined, it is estimated the primary tax subject to dispute for the 2006 to 2010 income years will total US$32 million (A$43 million). On 26 May 2016, the Group received amended assessments for primary tax of US$12 million (A$16 million) relating to the 2012 and 2013 income years, and interest of US$2 million (A$3 million) (with nil penalties).
Royalty reassessments dispute with Queensland Office of State Revenue
The Group has lodged applications with the Supreme Court of Queensland pertaining to disputed royalty reassessments issued by the Queensland Office of State Revenue (OSR) in relation to its share of BHP Billiton Mitsubishi Alliance (BMA) coal.The dispute relates to the basis for calculating the value of coal for royalty purposes under Queensland law. The reassessments relate to the period of 1 July 2005 to 30 September 2015. The reassessments total US$168 million (A$225 million) in royalties and US$78 million (A$104 million) in interest (BHP Billiton share).
Samarco tax assessments Details of uncertain tax and royalty matters relating to Samarco are disclosed in note 3 ‘Significant events – Samarco dam failure’.
Key judgements and estimatesIncome tax classificationThe Group’s accounting policy for taxation, including royalty-related taxation, requires management’s judgement as to the types of arrangements considered to be a tax on income in contrast to an operating cost.
Deferred tax Judgement is required to determine the amount of deferred tax assets that are recognised based on the likely timing and the level of future taxable profits. The Group assesses the recoverability of recognised and unrecognised deferred taxes, including losses in Australia, the United States and Canada and the recognition of deferred tax assets of capital allowances in Australia, on a consistent basis, using assumptions and projected cash flows as applied in the Group impairment reviews for associated operations.
Deferred tax liabilities arising from temporary differences in investments, caused principally by retained earnings held in foreign tax jurisdictions, are recognised unless repatriation of retained earnings can be controlled and are not expected to occur in the foreseeable future.
Uncertain tax mattersJudgements are required about the application of income tax legislation and its interaction with income tax accounting principles. These judgements are subject to risk and uncertainty, hence there is a possibility that changes in circumstances will alter expectations, which may impact the amount of deferred tax assets and deferred tax liabilities recognised on the balance sheet and the amount of other tax losses and temporary differences not yet recognised.
Where the final tax outcomes are different from the amounts that were initially recorded, these differences impact the current and deferred tax provisions in the period in which the determination is made.
Measurement of uncertain tax and royalty matters considers a range of possible outcomes, including assessments received from tax authorities. Where management is of the view that potential liabilities have a low probability of crystallising, or it is not possible to quantify them reliably, they are disclosed as contingent liabilities (refer to note 32 ‘Contingent liabilities’).
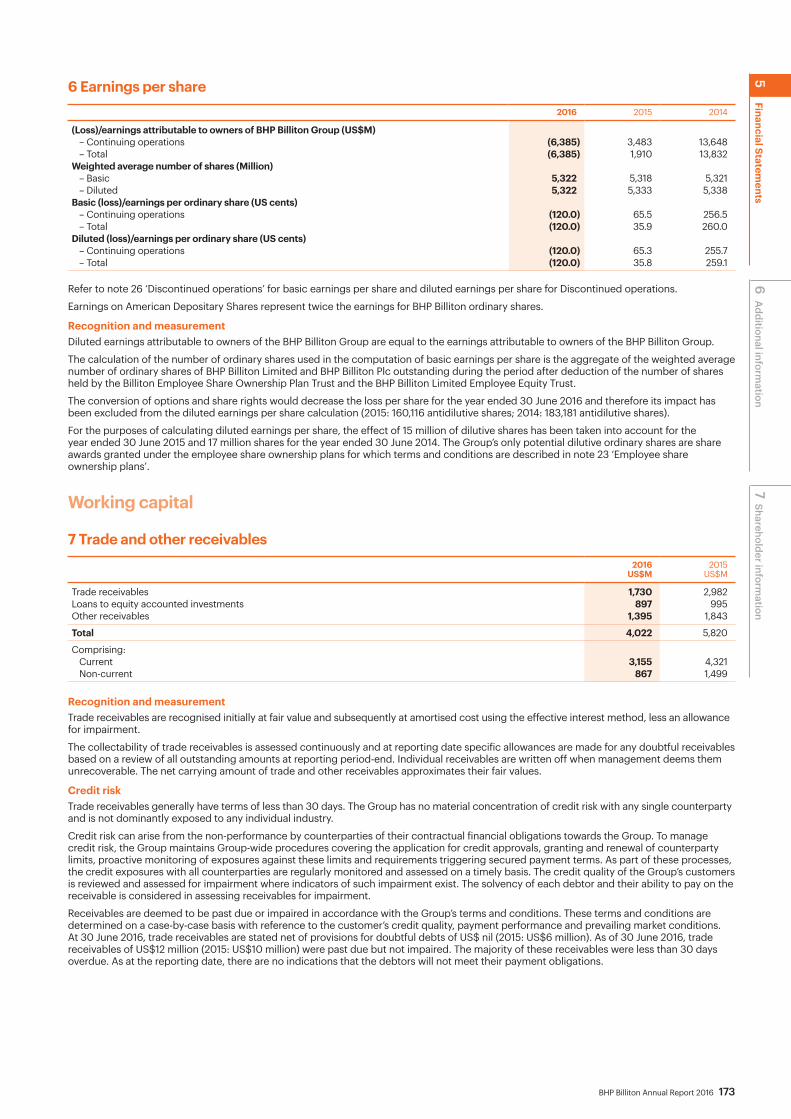
BHP Billiton Annual Report 2016 173
6 Earnings per share2016 2015 2014
(Loss)/earnings attributable to owners of BHP Billiton Group (US$M)– Continuing operations (6,385) 3,483 13,648– Total (6,385) 1,910 13,832
Weighted average number of shares (Million)– Basic 5,322 5,318 5,321– Diluted 5,322 5,333 5,338
Basic (loss)/earnings per ordinary share (US cents)– Continuing operations (120.0) 65.5 256.5– Total (120.0) 35.9 260.0
Diluted (loss)/earnings per ordinary share (US cents)– Continuing operations (120.0) 65.3 255.7– Total (120.0) 35.8 259.1
Refer to note 26 ‘Discontinued operations’ for basic earnings per share and diluted earnings per share for Discontinued operations.
Earnings on American Depositary Shares represent twice the earnings for BHP Billiton ordinary shares.
Recognition and measurementDiluted earnings attributable to owners of the BHP Billiton Group are equal to the earnings attributable to owners of the BHP Billiton Group.
The calculation of the number of ordinary shares used in the computation of basic earnings per share is the aggregate of the weighted average number of ordinary shares of BHP Billiton Limited and BHP Billiton Plc outstanding during the period after deduction of the number of shares held by the Billiton Employee Share Ownership Plan Trust and the BHP Billiton Limited Employee Equity Trust.
The conversion of options and share rights would decrease the loss per share for the year ended 30 June 2016 and therefore its impact has been excluded from the diluted earnings per share calculation (2015: 160,116 antidilutive shares; 2014: 183,181 antidilutive shares).
For the purposes of calculating diluted earnings per share, the effect of 15 million of dilutive shares has been taken into account for the year ended 30 June 2015 and 17 million shares for the year ended 30 June 2014. The Group’s only potential dilutive ordinary shares are share awards granted under the employee share ownership plans for which terms and conditions are described in note 23 ‘Employee share ownership plans’.
Working capital
7 Trade and other receivables 2016
US$M2015
US$M
Trade receivables 1,730 2,982Loans to equity accounted investments 897 995Other receivables 1,395 1,843
Total 4,022 5,820
Comprising:Current 3,155 4,321Non-current 867 1,499
Recognition and measurementTrade receivables are recognised initially at fair value and subsequently at amortised cost using the effective interest method, less an allowance for impairment.
The collectability of trade receivables is assessed continuously and at reporting date specific allowances are made for any doubtful receivables based on a review of all outstanding amounts at reporting period-end. Individual receivables are written off when management deems them unrecoverable. The net carrying amount of trade and other receivables approximates their fair values.
Credit riskTrade receivables generally have terms of less than 30 days. The Group has no material concentration of credit risk with any single counterparty and is not dominantly exposed to any individual industry.
Credit risk can arise from the non-performance by counterparties of their contractual financial obligations towards the Group. To manage credit risk, the Group maintains Group-wide procedures covering the application for credit approvals, granting and renewal of counterparty limits, proactive monitoring of exposures against these limits and requirements triggering secured payment terms. As part of these processes, the credit exposures with all counterparties are regularly monitored and assessed on a timely basis. The credit quality of the Group’s customers is reviewed and assessed for impairment where indicators of such impairment exist. The solvency of each debtor and their ability to pay on the receivable is considered in assessing receivables for impairment.
Receivables are deemed to be past due or impaired in accordance with the Group’s terms and conditions. These terms and conditions are determined on a case-by-case basis with reference to the customer’s credit quality, payment performance and prevailing market conditions. At 30 June 2016, trade receivables are stated net of provisions for doubtful debts of US$ nil (2015: US$6 million). As of 30 June 2016, trade receivables of US$12 million (2015: US$10 million) were past due but not impaired. The majority of these receivables were less than 30 days overdue. As at the reporting date, there are no indications that the debtors will not meet their payment obligations.
6 Additional inform
ation7
Shareholder information
5Financial Statem
ents
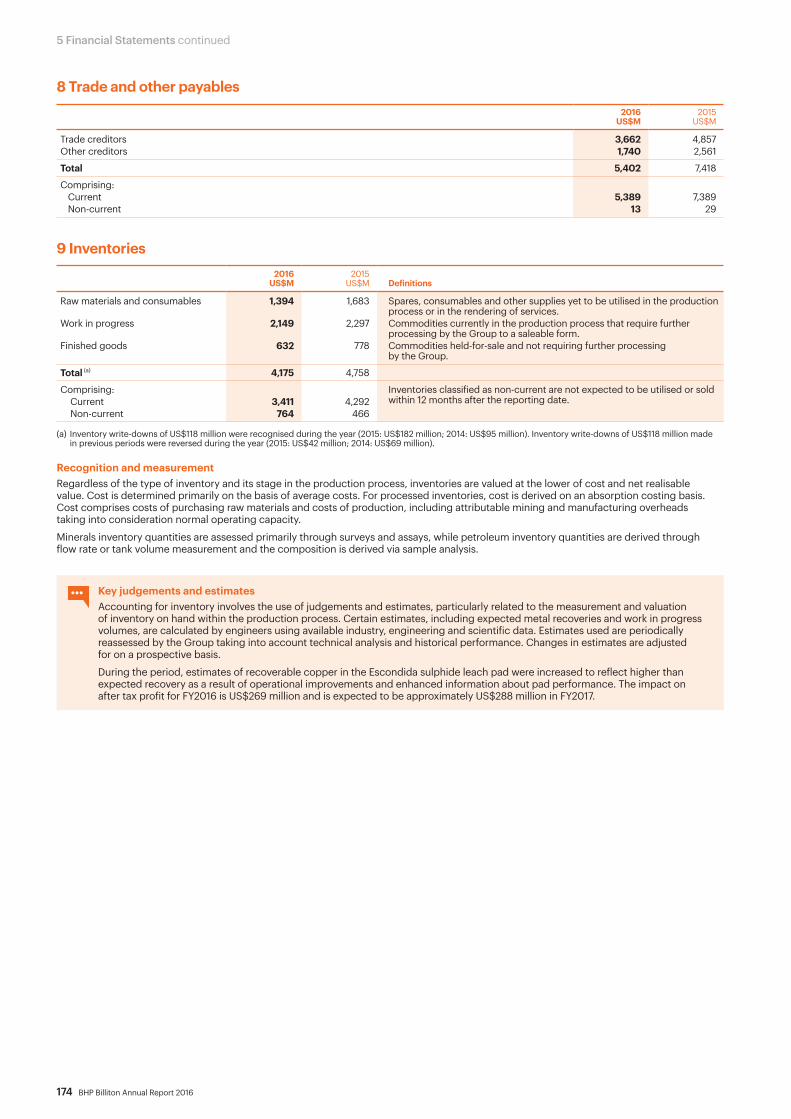
174 BHP Billiton Annual Report 2016
5 Financial Statements continued
8 Trade and other payables 2016
US$M2015
US$M
Trade creditors 3,662 4,857Other creditors 1,740 2,561
Total 5,402 7,418
Comprising:Current 5,389 7,389Non-current 13 29
9 Inventories 2016
US$M2015
US$M Definitions
Raw materials and consumables 1,394 1,683 Spares, consumables and other supplies yet to be utilised in the production process or in the rendering of services.
Work in progress 2,149 2,297 Commodities currently in the production process that require further processing by the Group to a saleable form.
Finished goods 632 778 Commodities held-for-sale and not requiring further processing by the Group.
Total (a) 4,175 4,758
Comprising: Inventories classified as non-current are not expected to be utilised or sold within 12 months after the reporting date. Current 3,411 4,292
Non-current 764 466
(a) Inventory write-downs of US$118 million were recognised during the year (2015: US$182 million; 2014: US$95 million). Inventory write-downs of US$118 million made in previous periods were reversed during the year (2015: US$42 million; 2014: US$69 million).
Recognition and measurementRegardless of the type of inventory and its stage in the production process, inventories are valued at the lower of cost and net realisable value. Cost is determined primarily on the basis of average costs. For processed inventories, cost is derived on an absorption costing basis. Cost comprises costs of purchasing raw materials and costs of production, including attributable mining and manufacturing overheads taking into consideration normal operating capacity.
Minerals inventory quantities are assessed primarily through surveys and assays, while petroleum inventory quantities are derived through flow rate or tank volume measurement and the composition is derived via sample analysis.
Key judgements and estimatesAccounting for inventory involves the use of judgements and estimates, particularly related to the measurement and valuation of inventory on hand within the production process. Certain estimates, including expected metal recoveries and work in progress volumes, are calculated by engineers using available industry, engineering and scientific data. Estimates used are periodically reassessed by the Group taking into account technical analysis and historical performance. Changes in estimates are adjusted for on a prospective basis.
During the period, estimates of recoverable copper in the Escondida sulphide leach pad were increased to reflect higher than expected recovery as a result of operational improvements and enhanced information about pad performance. The impact on after tax profit for FY2016 is US$269 million and is expected to be approximately US$288 million in FY2017.

BHP Billiton Annual Report 2016 175
Resource assets
10 Property, plant and equipment
Land and buildings
US$M
Plant and equipment
US$M
Other mineral
assetsUS$M
Assets under construction
US$M
Exploration and evaluation
US$MTotal
US$M
Net book value – 30 June 2016At the beginning of the financial year 8,762 48,361 21,069 14,502 1,378 94,072Additions (a) 4 (89) 750 5,337 344 6,346Depreciation for the year (574) (6,780) (1,090) − 4 (8,440)Impairments, net of reversals (49) (2,892) (4,432) − (4) (7,377)Disposals (15) (64) (8) (13) (10) (110)Divestment and demerger of subsidiaries and operations (39) (120) (5) (3) − (167)Exchange variations taken to reserve − 2 − − − 2Transfers and other movements 916 9,348 (342) (10,262) (11) (351)
At the end of the financial year 9,005 47,766 15,942 9,561 1,701 83,975
– Cost 12,425 98,688 30,924 9,562 2,612 154,211– Accumulated depreciation and impairments (3,420) (50,922) (14,982) (1) (911) (70,236)
Net book value – 30 June 2015At the beginning of the financial year 9,981 57,426 24,710 15,311 1,359 108,787Additions (a) − (563) 921 10,788 215 11,361Depreciation for the year (659) (7,443) (1,607) − (1) (9,710)Impairments, net of reversals (76) (2,632) (1,328) − − (4,036)Disposals (10) (80) − − (1) (91)Divestment and demerger of subsidiaries and operations (1,459) (7,703) (1,564) (1,001) (40) (11,767)Exchange variations taken to reserve − (8) − − − (8)Transfers and other movements 985 9,364 (63) (10,596) (154) (464)
At the end of the financial year 8,762 48,361 21,069 14,502 1,378 94,072
– Cost 11,689 90,571 30,814 14,502 2,630 150,206– Accumulated depreciation and impairments (2,927) (42,210) (9,745) − (1,252) (56,134)
(a) Includes net foreign exchange gains/losses related to the closure and rehabilitation provisions. Refer to note 14 ‘Closure and rehabilitation provisions’.
Recognition and measurementProperty, plant and equipmentProperty, plant and equipment is recorded at cost less accumulated depreciation and impairment charges. Cost is the fair value of consideration given to acquire the asset at the time of its acquisition or construction and includes the direct costs of bringing the asset to the location and the condition necessary for operation and the estimated future costs of closure and rehabilitation of the facility.
Equipment leasesAssets held under lease, which result in the Group receiving substantially all of the risk and rewards of ownership are capitalised as property, plant and equipment at the lower of the fair value of the leased assets or the estimated present value of the minimum lease payments. Leased assets are depreciated on the same basis as owned assets or, where shorter, the lease term. The corresponding finance lease obligation is included within interest bearing liabilities. The interest component is charged to the income statement over the lease term to reflect a constant rate of interest over the remaining balance of the obligation.
Operating leases are not capitalised and rental payments are included in the income statement on a straight-line basis over the lease term. Ongoing contracted commitments under finance and operations leases are disclosed within note 31 ‘Commitments’.
Exploration and evaluationExploration costs are incurred to discover mineral and petroleum resources. Evaluation costs are incurred to assess the technical feasibility and commercial viability of resources found.
Exploration and evaluation expenditure is charged to the income statement as incurred, except in the following circumstances in which case the expenditure may be capitalised:
In respect of minerals activities:• the exploration and evaluation activity is within an area of
interest that was previously acquired as an asset acquisition or in a business combination and measured at fair value on acquisition; or
• the existence of a commercially viable mineral deposit has been established.
In respect of petroleum activities:• the exploration and evaluation activity is within an area of interest
for which it is expected that the expenditure will be recouped by future exploitation or sale; or
• exploration and evaluation activity has not reached a stage that permits a reasonable assessment of the existence of commercially recoverable reserves.
Initial payments for the acquisition of intangible lease assets are capitalised and amortised over the term of the permit.
6 Additional inform
ation7
Shareholder information
5Financial Statem
ents
176 BHP Billiton Annual Report 2016
5 Financial Statements continued
10 Property, plant and equipment continuedA regular review is undertaken of each area of interest to determine the appropriateness of continuing to carry forward costs in relation to that area. Capitalised costs are only carried forward to the extent that they are expected to be recovered through the successful exploitation of the area of interest or alternatively by its sale. To the extent that capitalised expenditure is no longer expected to be recovered, it is charged to the income statement.
Key judgements and estimatesExploration and evaluation expenditure results in certain items of expenditure being capitalised for an area of interest where it is considered likely to be recoverable by future exploitation or sale, or where the activities have not reached a stage that permits a reasonable assessment of the existence of reserves. This policy requires management to make certain estimates and assumptions as to future events and circumstances, in particular whether an economically viable extraction operation can be established. Any such estimates and assumptions may change as new information becomes available. If, after having capitalised the expenditure under the policy, a judgement is made that recovery of the expenditure is unlikely, the relevant capitalised amount will be written off to the income statement.
Development expenditureWhen proven mineral reserves are determined and development is sanctioned, capitalised exploration and evaluation expenditure is reclassified as assets under construction within property, plant and equipment (refer to the mineral reserves definition under note 39 ‘Reserve estimates’). All subsequent development expenditure is capitalised and classified as assets under construction, provided commercial viability conditions continue to be satisfied.
The Group may use funds sourced from external parties to finance the acquisition and development of assets and operations. Finance costs are expensed as incurred, except where they relate to the financing of construction or development of qualifying assets. Borrowing costs directly attributable to acquiring or constructing a qualifying asset are capitalised during the development phase. Development expenditure is net of proceeds from the saleable material extracted during the development phase. On completion of development, all assets included in assets under construction are reclassified as either plant and equipment or other mineral assets and depreciation commences.
Key judgements and estimatesDevelopment activities commence after project sanctioning by the appropriate level of management. Judgement is applied by management in determining when a project is economically viable. In exercising this judgement, management is required to make certain estimates and assumptions as to future events and circumstances. Estimates and assumptions may change as new information becomes available. If, after having commenced the development activity, a judgement is made that a development asset is impaired, the appropriate amount will be written off to the income statement.
Other mineral assetsOther mineral assets comprise:• capitalised exploration, evaluation and development expenditure
for assets in production;• mineral rights and petroleum interests acquired;• capitalised development and production stripping costs.
Overburden removal costsThe process of removing overburden and other waste materials to access mineral deposits is referred to as stripping. Stripping is necessary to obtain access to mineral deposits and occurs throughout the life of an open-pit mine. Development and production stripping costs are classified as other mineral assets in property, plant and equipment.
Stripping costs are accounted for separately for individual components of an ore body. The determination of components is dependent on the mine plan and other factors, including the size, shape and geotechnical aspects of an ore body. The Group accounts for stripping activities as follows:
Development stripping costsThese are initial overburden removal costs incurred to obtain access to mineral deposits that will be commercially produced. These costs are capitalised when it is probable that future economic benefits (access to mineral ores) will flow to the Group and costs can be measured reliably.
Once the production phase begins, capitalised development stripping costs are depreciated using the units of production method based on the proven and probable reserves of the relevant identified component of the ore body to which the initial stripping activity benefits.
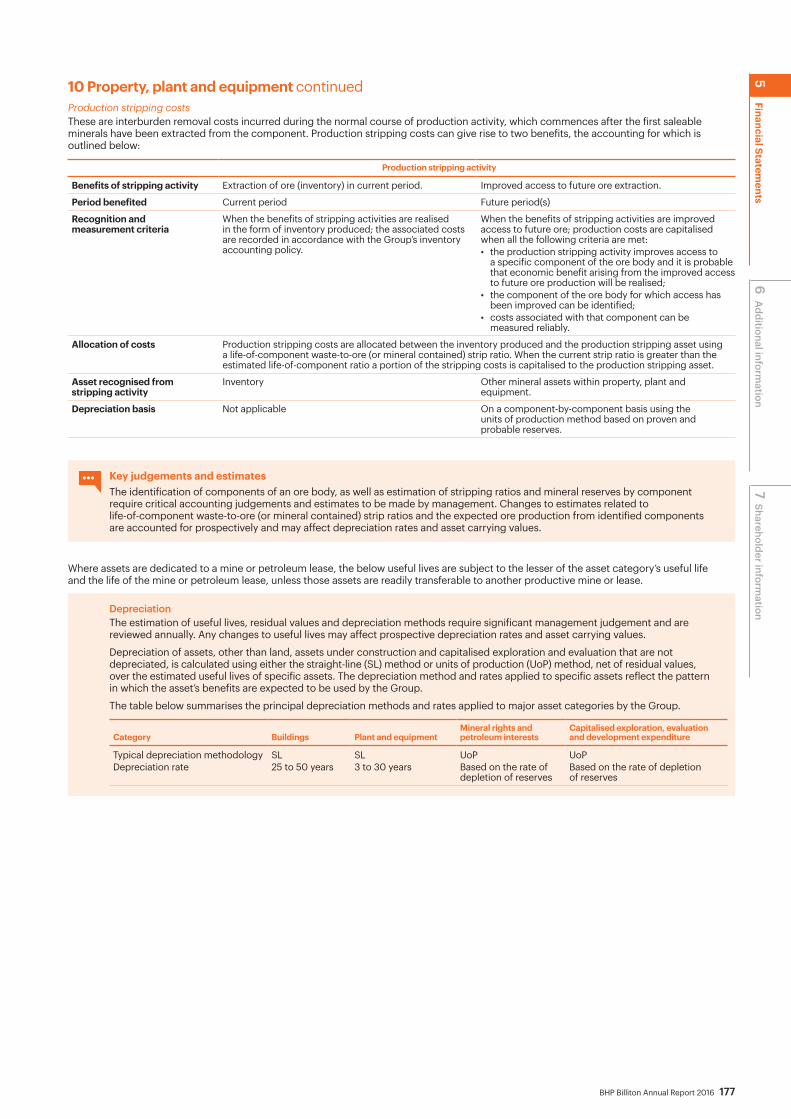
BHP Billiton Annual Report 2016 177
10 Property, plant and equipment continuedProduction stripping costsThese are interburden removal costs incurred during the normal course of production activity, which commences after the first saleable minerals have been extracted from the component. Production stripping costs can give rise to two benefits, the accounting for which is outlined below:
Production stripping activity
Benefits of stripping activity Extraction of ore (inventory) in current period. Improved access to future ore extraction.
Period benefited Current period Future period(s)
Recognition and measurement criteria
When the benefits of stripping activities are realised in the form of inventory produced; the associated costs are recorded in accordance with the Group’s inventory accounting policy.
When the benefits of stripping activities are improved access to future ore; production costs are capitalised when all the following criteria are met:• the production stripping activity improves access to
a specific component of the ore body and it is probable that economic benefit arising from the improved access to future ore production will be realised;
• the component of the ore body for which access has been improved can be identified;
• costs associated with that component can be measured reliably.
Allocation of costs Production stripping costs are allocated between the inventory produced and the production stripping asset using a life-of-component waste-to-ore (or mineral contained) strip ratio. When the current strip ratio is greater than the estimated life-of-component ratio a portion of the stripping costs is capitalised to the production stripping asset.
Asset recognised from stripping activity
Inventory Other mineral assets within property, plant and equipment.
Depreciation basis Not applicable On a component-by-component basis using the units of production method based on proven and probable reserves.
Key judgements and estimatesThe identification of components of an ore body, as well as estimation of stripping ratios and mineral reserves by component require critical accounting judgements and estimates to be made by management. Changes to estimates related to life-of-component waste-to-ore (or mineral contained) strip ratios and the expected ore production from identified components are accounted for prospectively and may affect depreciation rates and asset carrying values.
Where assets are dedicated to a mine or petroleum lease, the below useful lives are subject to the lesser of the asset category’s useful life and the life of the mine or petroleum lease, unless those assets are readily transferable to another productive mine or lease.
DepreciationThe estimation of useful lives, residual values and depreciation methods require significant management judgement and are reviewed annually. Any changes to useful lives may affect prospective depreciation rates and asset carrying values.
Depreciation of assets, other than land, assets under construction and capitalised exploration and evaluation that are not depreciated, is calculated using either the straight-line (SL) method or units of production (UoP) method, net of residual values, over the estimated useful lives of specific assets. The depreciation method and rates applied to specific assets reflect the pattern in which the asset’s benefits are expected to be used by the Group.
The table below summarises the principal depreciation methods and rates applied to major asset categories by the Group.
Category Buildings Plant and equipmentMineral rights and petroleum interests
Capitalised exploration, evaluation and development expenditure
Typical depreciation methodology SL SL UoP UoPDepreciation rate 25 to 50 years 3 to 30 years Based on the rate of
depletion of reservesBased on the rate of depletion of reserves
6 Additional inform
ation7
Shareholder information
5Financial Statem
ents
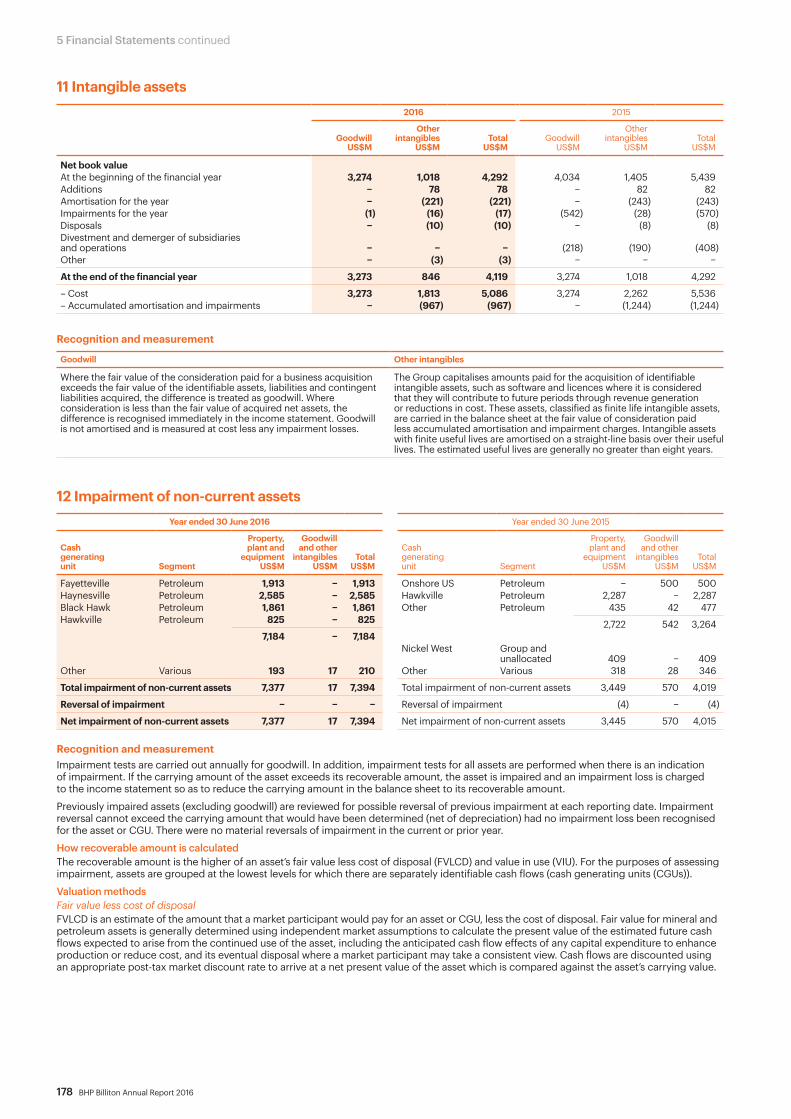
178 BHP Billiton Annual Report 2016
5 Financial Statements continued
11 Intangible assets2016 2015
GoodwillUS$M
Other intangibles
US$MTotal
US$MGoodwill
US$M
Other intangibles
US$MTotal
US$M
Net book valueAt the beginning of the financial year 3,274 1,018 4,292 4,034 1,405 5,439Additions − 78 78 − 82 82Amortisation for the year − (221) (221) − (243) (243)Impairments for the year (1) (16) (17) (542) (28) (570)Disposals − (10) (10) − (8) (8)Divestment and demerger of subsidiaries and operations − − − (218) (190) (408)Other − (3) (3) − − −
At the end of the financial year 3,273 846 4,119 3,274 1,018 4,292
– Cost 3,273 1,813 5,086 3,274 2,262 5,536– Accumulated amortisation and impairments − (967) (967) − (1,244) (1,244)
Recognition and measurement
Goodwill Other intangibles
Where the fair value of the consideration paid for a business acquisition exceeds the fair value of the identifiable assets, liabilities and contingent liabilities acquired, the difference is treated as goodwill. Where consideration is less than the fair value of acquired net assets, the difference is recognised immediately in the income statement. Goodwill is not amortised and is measured at cost less any impairment losses.
The Group capitalises amounts paid for the acquisition of identifiable intangible assets, such as software and licences where it is considered that they will contribute to future periods through revenue generation or reductions in cost. These assets, classified as finite life intangible assets, are carried in the balance sheet at the fair value of consideration paid less accumulated amortisation and impairment charges. Intangible assets with finite useful lives are amortised on a straight-line basis over their useful lives. The estimated useful lives are generally no greater than eight years.
12 Impairment of non-current assetsYear ended 30 June 2016 Year ended 30 June 2015
Cash generating unit Segment
Property, plant and
equipment US$M
Goodwill and other
intangibles US$M
Total US$M
Cash generating unit Segment
Property, plant and
equipment US$M
Goodwill and other
intangibles US$M
Total US$M
Fayetteville Petroleum 1,913 − 1,913 Onshore US Petroleum − 500 500Haynesville Petroleum 2,585 − 2,585 Hawkville Petroleum 2,287 − 2,287Black Hawk Petroleum 1,861 − 1,861 Other Petroleum 435 42 477Hawkville Petroleum 825 − 825 2,722 542 3,264
7,184 − 7,184Nickel West Group and
unallocated 409 − 409Other Various 193 17 210 Other Various 318 28 346
Total impairment of non-current assets 7,377 17 7,394 Total impairment of non-current assets 3,449 570 4,019
Reversal of impairment − − − Reversal of impairment (4) − (4)
Net impairment of non-current assets 7,377 17 7,394 Net impairment of non-current assets 3,445 570 4,015
Recognition and measurementImpairment tests are carried out annually for goodwill. In addition, impairment tests for all assets are performed when there is an indication of impairment. If the carrying amount of the asset exceeds its recoverable amount, the asset is impaired and an impairment loss is charged to the income statement so as to reduce the carrying amount in the balance sheet to its recoverable amount.
Previously impaired assets (excluding goodwill) are reviewed for possible reversal of previous impairment at each reporting date. Impairment reversal cannot exceed the carrying amount that would have been determined (net of depreciation) had no impairment loss been recognised for the asset or CGU. There were no material reversals of impairment in the current or prior year.
How recoverable amount is calculatedThe recoverable amount is the higher of an asset’s fair value less cost of disposal (FVLCD) and value in use (VIU). For the purposes of assessing impairment, assets are grouped at the lowest levels for which there are separately identifiable cash flows (cash generating units (CGUs)).
Valuation methodsFair value less cost of disposal FVLCD is an estimate of the amount that a market participant would pay for an asset or CGU, less the cost of disposal. Fair value for mineral and petroleum assets is generally determined using independent market assumptions to calculate the present value of the estimated future cash flows expected to arise from the continued use of the asset, including the anticipated cash flow effects of any capital expenditure to enhance production or reduce cost, and its eventual disposal where a market participant may take a consistent view. Cash flows are discounted using an appropriate post-tax market discount rate to arrive at a net present value of the asset which is compared against the asset’s carrying value.

BHP Billiton Annual Report 2016 179
12 Impairment of non-current assets continuedValue in use VIU is determined as the present value of the estimated future cash flows expected to arise from the continued use of the asset in its present form and its eventual disposal. VIU is determined by applying assumptions specific to the Group’s continued use and cannot take into account future development. These assumptions are different to those used in calculating fair value and consequently the VIU calculation is likely to give a different result (usually lower) to a fair value calculation.
Impairment of non-current assets (excluding goodwill)
Petroleum
What has been recognised? At 31 December 2015, the Group recognised an impairment charge of US$7,184 million (US$4,884 million after tax benefit) against the carrying value of individual Onshore US CGUs. There has been no further impairment relating to Onshore US CGUs in the six months to 30 June 2016.
What were the drivers of impairment? As a result of significant volatility and weaker prices experienced in the oil and gas industry, management adjusted its medium-term and long-term price assumptions and discount rates, which had a significant flow through impact on asset valuations.
How were the valuations calculated? Using these updated assumptions, valuations of the relevant Onshore US CGUs were calculated using FVLCD methodology, applying discounted cash flow techniques. The recoverable amount in each instance is equal to its estimated FVLCD. Future cash flow information is based upon the Group’s latest budgets and project economic plans incorporating Level 3 fair value inputs as defined in note 21 ‘Financial risk management’.
What were the significant assumptions and estimates used in the valuations?
The valuations are most sensitive to changes in crude oil and natural gas prices, estimated future production volumes and discount rates. Key judgements and estimates used in determining FVLCD are disclosed below.
Impairment test for goodwillThe carrying amount of goodwill has been allocated to the CGUs, or groups of CGUs, as follows:
Cash generating units2016
US$M2015
US$M
Onshore US 3,026 3,026Other 247 248
3,273 3,274
For the purpose of impairment testing, goodwill has been allocated to CGUs or groups of CGUs, that are expected to benefit from the synergies of previous business combinations, which represent the level at which management will monitor and manage goodwill. Onshore US goodwill is the most significant goodwill balance and has been tested for impairment after an assessment of the individual CGUs that it comprises.
Onshore US goodwill
Carrying value US$3,026 million (2015: $3,026 million).
Impairment test conclusion as at 30 June 2016
No impairment charge is required as at 30 June 2016 (30 June 2015: $500 million). The recoverable amount of Onshore US CGUs was determined to be US$14,967 million (30 June 2015: US$19,793 million).
How did the goodwill arise? Goodwill arose on the Petrohawk acquisition in August 2011 and is attributable to synergies associated with the Group’s US unconventional petroleum assets (Onshore US). This comprises the Permian, Haynesville, Fayetteville, Black Hawk and Hawkville group of CGUs, which includes the Group’s natural gas and liquid reserves and resources, production wells and associated infrastructure, including gathering systems and processing facilities in Texas and Louisiana (US).
Segment Onshore US is part of the Petroleum reportable segment.
How were the valuations calculated?
FVLCD methodology using discounted cash flow techniques has been applied in determining the recoverable value of the Onshore US business.
Level of fair value hierarchy Calculations are based primarily on Level 3 inputs as defined in note 21 ‘Financial risk management’.
Significant assumptions and sensitivities
The calculation of FVLCD for Onshore US is most sensitive to changes in crude oil and natural gas prices, production volumes and discount rates. Key accounting judgements and estimates used in forming the valuations are disclosed below. The assumptions used are consistent with those underpinning the property, plant and equipment impairment calculations for Onshore US CGUs.Reasonably possible changes in circumstances may affect significant assumptions and the estimated fair value. Isolated changes in these significant assumptions could result in the estimated recoverable amount being equal to the carrying amount of Onshore US, including goodwill. These reasonably possible changes include:• A production volume decrease of 13.3 per cent from estimates contained in management’s long-term plans;• A decrease in crude oil prices of 19.2 per cent from prices assumed in the valuations;• A decrease in natural gas prices of 37.9 per cent from prices assumed in the valuations.Crude oil and natural gas price assumptions used in FVLCD impairment testing are within or lower than the range of prices published by market commentators, as set out within the following key judgements and estimates section. Typically changes in any one of the aforementioned assumptions (including operating performance) would be accompanied by a change in another assumption which may have an offsetting impact. Action is usually taken to respond to adverse changes in assumptions to mitigate the impact of any such change.
Other goodwillGoodwill held by other CGUs is US$247 million (2015: US$248 million). This represents less than one per cent of net assets at 30 June 2016 (2015: less than one per cent). This goodwill has been allocated across a number of CGUs in different reportable segments. There was no significant impairment of other goodwill in the year to 30 June 2016 (2015: US$ nil).
6 Additional inform
ation7
Shareholder information
5Financial Statem
ents
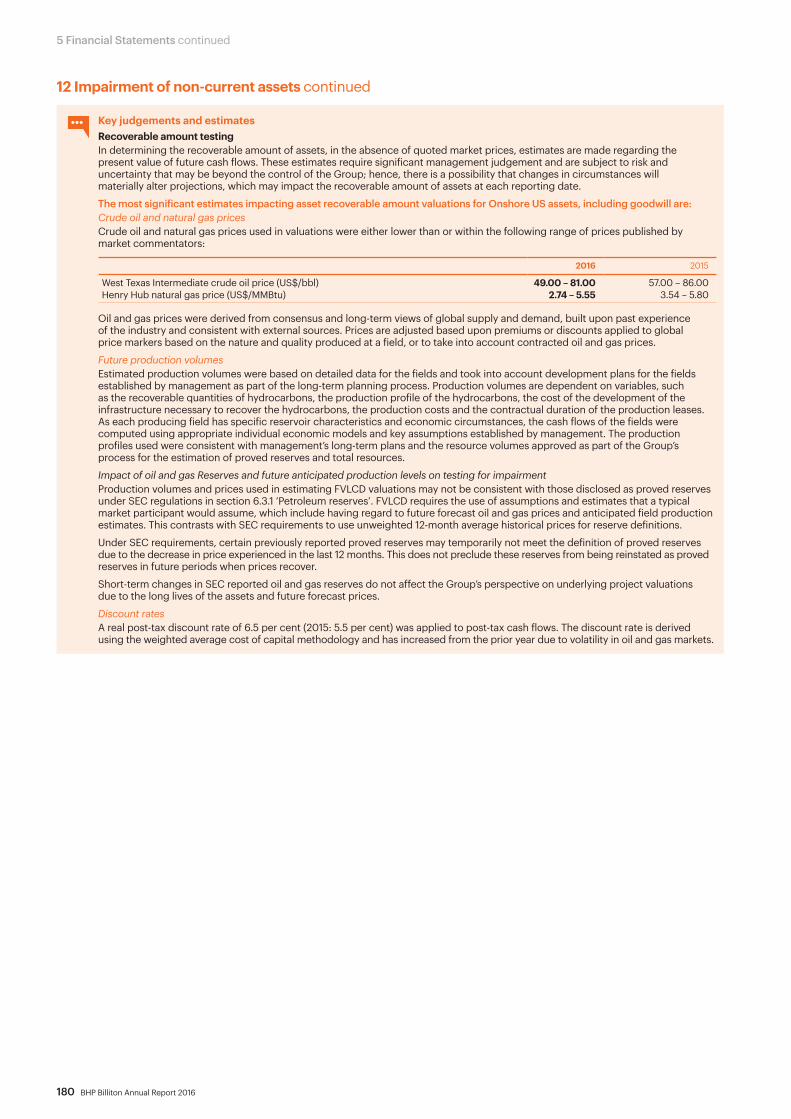
180 BHP Billiton Annual Report 2016
5 Financial Statements continued
12 Impairment of non-current assets continued
Key judgements and estimatesRecoverable amount testing In determining the recoverable amount of assets, in the absence of quoted market prices, estimates are made regarding the present value of future cash flows. These estimates require significant management judgement and are subject to risk and uncertainty that may be beyond the control of the Group; hence, there is a possibility that changes in circumstances will materially alter projections, which may impact the recoverable amount of assets at each reporting date.
The most significant estimates impacting asset recoverable amount valuations for Onshore US assets, including goodwill are:Crude oil and natural gas pricesCrude oil and natural gas prices used in valuations were either lower than or within the following range of prices published by market commentators:
2016 2015
West Texas Intermediate crude oil price (US$/bbl) 49.00 – 81.00 57.00 – 86.00Henry Hub natural gas price (US$/MMBtu) 2.74 – 5.55 3.54 – 5.80
Oil and gas prices were derived from consensus and long-term views of global supply and demand, built upon past experience of the industry and consistent with external sources. Prices are adjusted based upon premiums or discounts applied to global price markers based on the nature and quality produced at a field, or to take into account contracted oil and gas prices.
Future production volumesEstimated production volumes were based on detailed data for the fields and took into account development plans for the fields established by management as part of the long-term planning process. Production volumes are dependent on variables, such as the recoverable quantities of hydrocarbons, the production profile of the hydrocarbons, the cost of the development of the infrastructure necessary to recover the hydrocarbons, the production costs and the contractual duration of the production leases. As each producing field has specific reservoir characteristics and economic circumstances, the cash flows of the fields were computed using appropriate individual economic models and key assumptions established by management. The production profiles used were consistent with management’s long-term plans and the resource volumes approved as part of the Group’s process for the estimation of proved reserves and total resources.
Impact of oil and gas Reserves and future anticipated production levels on testing for impairmentProduction volumes and prices used in estimating FVLCD valuations may not be consistent with those disclosed as proved reserves under SEC regulations in section 6.3.1 ‘Petroleum reserves’. FVLCD requires the use of assumptions and estimates that a typical market participant would assume, which include having regard to future forecast oil and gas prices and anticipated field production estimates. This contrasts with SEC requirements to use unweighted 12-month average historical prices for reserve definitions.
Under SEC requirements, certain previously reported proved reserves may temporarily not meet the definition of proved reserves due to the decrease in price experienced in the last 12 months. This does not preclude these reserves from being reinstated as proved reserves in future periods when prices recover.
Short-term changes in SEC reported oil and gas reserves do not affect the Group’s perspective on underlying project valuations due to the long lives of the assets and future forecast prices.
Discount ratesA real post-tax discount rate of 6.5 per cent (2015: 5.5 per cent) was applied to post-tax cash flows. The discount rate is derived using the weighted average cost of capital methodology and has increased from the prior year due to volatility in oil and gas markets.
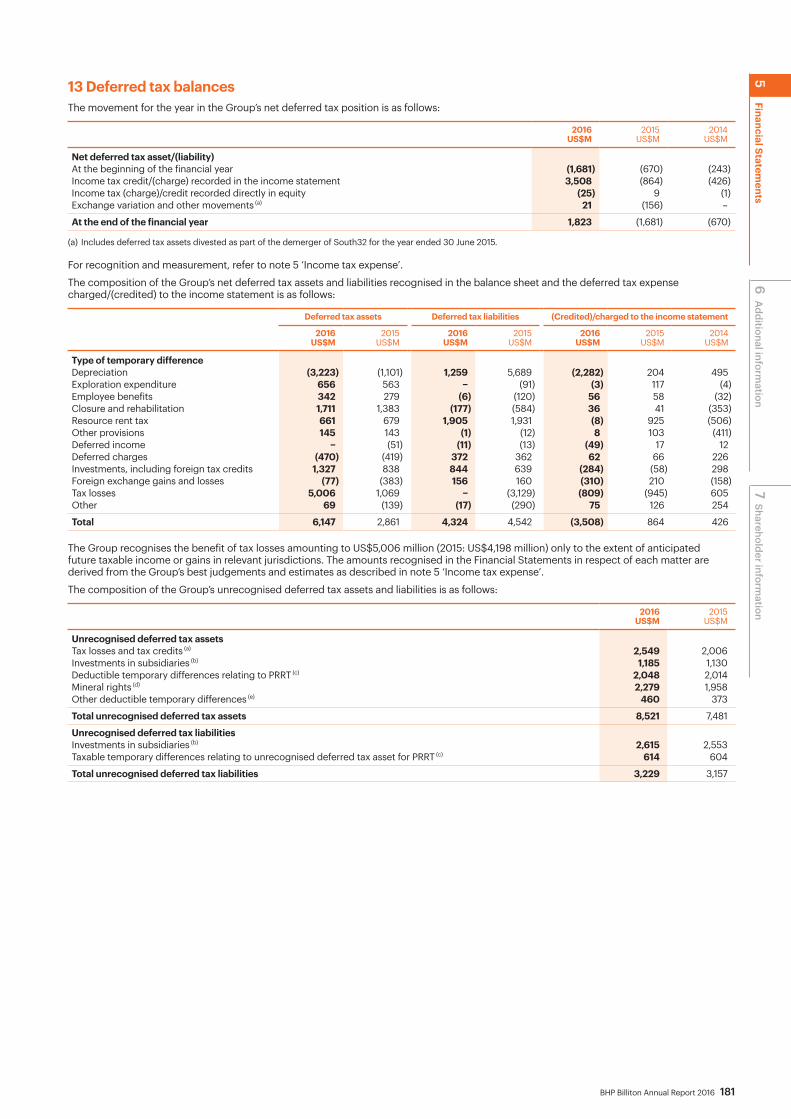
BHP Billiton Annual Report 2016 181
13 Deferred tax balancesThe movement for the year in the Group’s net deferred tax position is as follows:
2016US$M
2015US$M
2014US$M
Net deferred tax asset/(liability)At the beginning of the financial year (1,681) (670) (243)Income tax credit/(charge) recorded in the income statement 3,508 (864) (426)Income tax (charge)/credit recorded directly in equity (25) 9 (1)Exchange variation and other movements (a) 21 (156) –
At the end of the financial year 1,823 (1,681) (670)
(a) Includes deferred tax assets divested as part of the demerger of South32 for the year ended 30 June 2015.
For recognition and measurement, refer to note 5 ‘Income tax expense’.
The composition of the Group’s net deferred tax assets and liabilities recognised in the balance sheet and the deferred tax expense charged/(credited) to the income statement is as follows:
Deferred tax assets Deferred tax liabilities (Credited)/charged to the income statement
2016 US$M
2015 US$M
2016 US$M
2015 US$M
2016 US$M
2015 US$M
2014 US$M
Type of temporary differenceDepreciation (3,223) (1,101) 1,259 5,689 (2,282) 204 495Exploration expenditure 656 563 − (91) (3) 117 (4)Employee benefits 342 279 (6) (120) 56 58 (32)Closure and rehabilitation 1,711 1,383 (177) (584) 36 41 (353)Resource rent tax 661 679 1,905 1,931 (8) 925 (506)Other provisions 145 143 (1) (12) 8 103 (411)Deferred income − (51) (11) (13) (49) 17 12Deferred charges (470) (419) 372 362 62 66 226Investments, including foreign tax credits 1,327 838 844 639 (284) (58) 298Foreign exchange gains and losses (77) (383) 156 160 (310) 210 (158)Tax losses 5,006 1,069 − (3,129) (809) (945) 605Other 69 (139) (17) (290) 75 126 254
Total 6,147 2,861 4,324 4,542 (3,508) 864 426
The Group recognises the benefit of tax losses amounting to US$5,006 million (2015: US$4,198 million) only to the extent of anticipated future taxable income or gains in relevant jurisdictions. The amounts recognised in the Financial Statements in respect of each matter are derived from the Group’s best judgements and estimates as described in note 5 ‘Income tax expense’.
The composition of the Group’s unrecognised deferred tax assets and liabilities is as follows:
2016 US$M
2015 US$M
Unrecognised deferred tax assetsTax losses and tax credits (a) 2,549 2,006Investments in subsidiaries (b) 1,185 1,130Deductible temporary differences relating to PRRT (c) 2,048 2,014Mineral rights (d) 2,279 1,958Other deductible temporary differences (e) 460 373
Total unrecognised deferred tax assets 8,521 7,481
Unrecognised deferred tax liabilitiesInvestments in subsidiaries (b) 2,615 2,553Taxable temporary differences relating to unrecognised deferred tax asset for PRRT (c) 614 604
Total unrecognised deferred tax liabilities 3,229 3,157
6 Additional inform
ation7
Shareholder information
5Financial Statem
ents
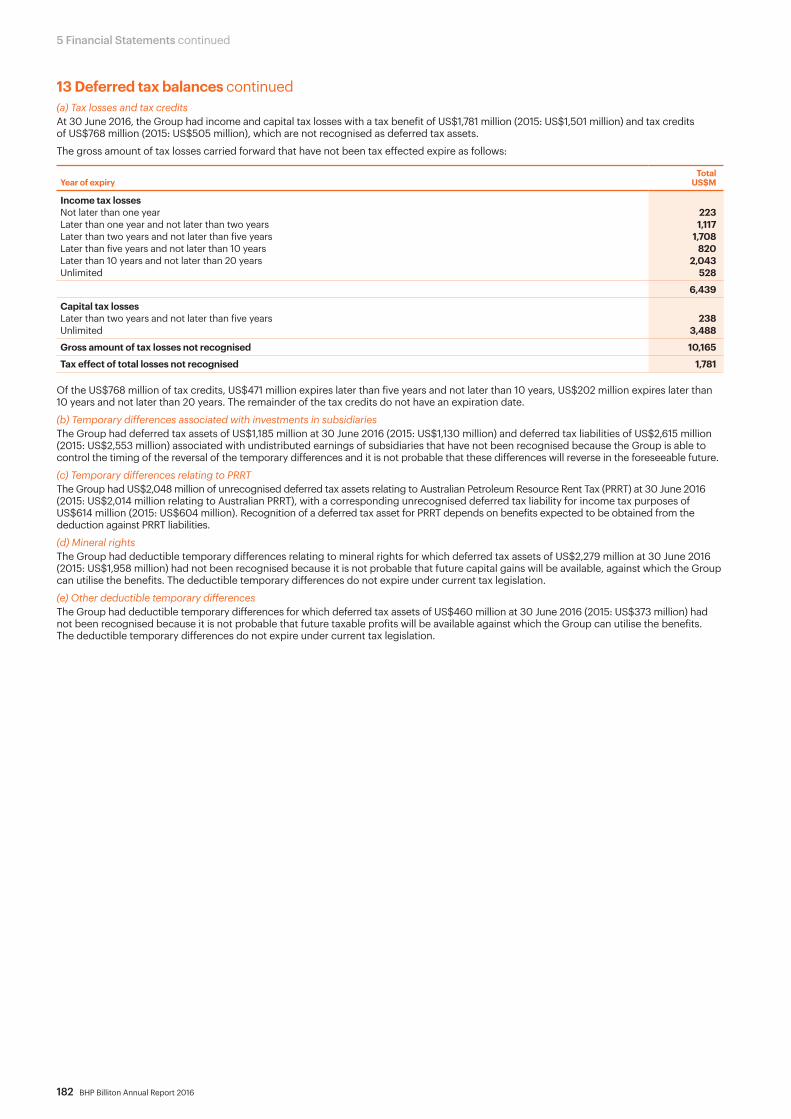
182 BHP Billiton Annual Report 2016
5 Financial Statements continued
13 Deferred tax balances continued(a) Tax losses and tax creditsAt 30 June 2016, the Group had income and capital tax losses with a tax benefit of US$1,781 million (2015: US$1,501 million) and tax credits of US$768 million (2015: US$505 million), which are not recognised as deferred tax assets.
The gross amount of tax losses carried forward that have not been tax effected expire as follows:
Year of expiry Total
US$M
Income tax lossesNot later than one year 223Later than one year and not later than two years 1,117Later than two years and not later than five years 1,708Later than five years and not later than 10 years 820Later than 10 years and not later than 20 years 2,043Unlimited 528
6,439
Capital tax lossesLater than two years and not later than five years 238Unlimited 3,488
Gross amount of tax losses not recognised 10,165
Tax effect of total losses not recognised 1,781
Of the US$768 million of tax credits, US$471 million expires later than five years and not later than 10 years, US$202 million expires later than 10 years and not later than 20 years. The remainder of the tax credits do not have an expiration date.
(b) Temporary differences associated with investments in subsidiariesThe Group had deferred tax assets of US$1,185 million at 30 June 2016 (2015: US$1,130 million) and deferred tax liabilities of US$2,615 million (2015: US$2,553 million) associated with undistributed earnings of subsidiaries that have not been recognised because the Group is able to control the timing of the reversal of the temporary differences and it is not probable that these differences will reverse in the foreseeable future.
(c) Temporary differences relating to PRRTThe Group had US$2,048 million of unrecognised deferred tax assets relating to Australian Petroleum Resource Rent Tax (PRRT) at 30 June 2016 (2015: US$2,014 million relating to Australian PRRT), with a corresponding unrecognised deferred tax liability for income tax purposes of US$614 million (2015: US$604 million). Recognition of a deferred tax asset for PRRT depends on benefits expected to be obtained from the deduction against PRRT liabilities.
(d) Mineral rightsThe Group had deductible temporary differences relating to mineral rights for which deferred tax assets of US$2,279 million at 30 June 2016 (2015: US$1,958 million) had not been recognised because it is not probable that future capital gains will be available, against which the Group can utilise the benefits. The deductible temporary differences do not expire under current tax legislation.
(e) Other deductible temporary differencesThe Group had deductible temporary differences for which deferred tax assets of US$460 million at 30 June 2016 (2015: US$373 million) had not been recognised because it is not probable that future taxable profits will be available against which the Group can utilise the benefits. The deductible temporary differences do not expire under current tax legislation.

BHP Billiton Annual Report 2016 183
14 Closure and rehabilitation provisions 2016
US$M2015
US$M
At the beginning of the financial year 6,701 9,295Capitalised amounts for operating sites:
Change in estimate (58) 276Exchange translation (112) (1,009)
Adjustments to closed sites charged/(credited) to the income statement:Increases to existing and new provisions 18 74Exchange translation (8) (104)Released during the year (81) (93)
Other adjustments to the provision:Amortisation of discounting impacting net finance costs 305 442Expenditure on closure and rehabilitation activities (111) (180)Exchange variations impacting foreign currency translation reserve (1) (7)Divestment and demerger of subsidiaries and operations (138) (1,993)Transfers and other movements (13) –
At the end of the financial year 6,502 6,701
Comprising:Current 171 193Non-current 6,331 6,508
Operating sites 5,241 5,655Closed sites 1,261 1,046
BHP Billiton is required to rehabilitate sites and associated facilities at the end of, or in some cases, during the course of production, to a condition acceptable to the relevant authorities, specified in license requirements and the Group’s environmental performance requirements as set out within Our BHP Billiton Charter.
The key components of closure and rehabilitation activities are:• the removal of all unwanted infrastructure associated with an operation;• the return of disturbed areas to a safe, stable, productive and self-sustaining condition, consistent with the agreed end land use.
Recognition and measurementProvisions for closure and rehabilitation are recognised by the Group when:• it has a present legal or constructive obligation as a result of past events;• it is more likely than not that an outflow of resources will be required to settle the obligation; • the amount can be reliably estimated.
Initial recognition Subsequent remeasurement
Closure and rehabilitation provisions are initially recognised when an environmental disturbance first occurs. The individual site provisions are an estimate of the expected value of future cash flows required to rehabilitate the relevant site using current restoration standards and techniques and taking into account risks and uncertainties. Individual site provisions are discounted to their present value using country specific discount rates aligned to the estimated timing of cash outflows. When provisions for closure and rehabilitation are initially recognised, the corresponding cost is capitalised as an asset, representing part of the cost of acquiring the future economic benefits of the operation.
The closure and rehabilitation asset, recognised within property, plant and equipment, is depreciated over the life of the operations. The value of the provision is progressively increased over time as the effect of discounting unwinds, resulting in an expense recognised in net finance costs.The closure and rehabilitation liability is reviewed at each reporting date to assess if the estimate continues to reflect the best estimate of the obligation. If necessary the provision is remeasured to account for factors, including:• revisions to estimated reserves, resources and lives of operations;• developments in technology;• regulatory requirements and environmental management strategies;• changes in the estimated extent and costs of anticipated activities, including the effects
of inflation and movements in foreign exchange rates;• movements in interest rates affecting the discount rate applied.Changes to the closure and rehabilitation estimate are added to, or deducted from, the related asset and amortised on a prospective basis accordingly over the remaining life of the operation, generally applying the units of production method.Costs arising from unforeseen circumstances, such as the contamination caused by unplanned discharges, are recognised as an expense and liability when the event gives rise to an obligation that is probable and capable of reliable estimation.
Closed sitesWhere future economic benefits are no longer expected to be derived through operation, changes to the associated closure and remediation costs are charged to the income statement in the period identified. This amounted to US$18 million in the year ended 30 June 2016 (2015: US$74 million).
Key judgements and estimatesThe recognition and measurement of closure and rehabilitation provisions requires the use of significant judgements and estimates, including, but not limited to:• the extent (due to legal or constructive obligations) of potential activities required for the removal of infrastructure and
rehabilitation activities; • costs associated with future rehabilitation activities;• applicable inflation and discount rates; • the timing of cash flows and ultimate closure of operations.
Estimates can also be impacted by the emergence of new restoration techniques and experience at other operations. These uncertainties may result in future actual expenditure differing from the amounts currently provided for in the balance sheet.
6 Additional inform
ation7
Shareholder information
5Financial Statem
ents
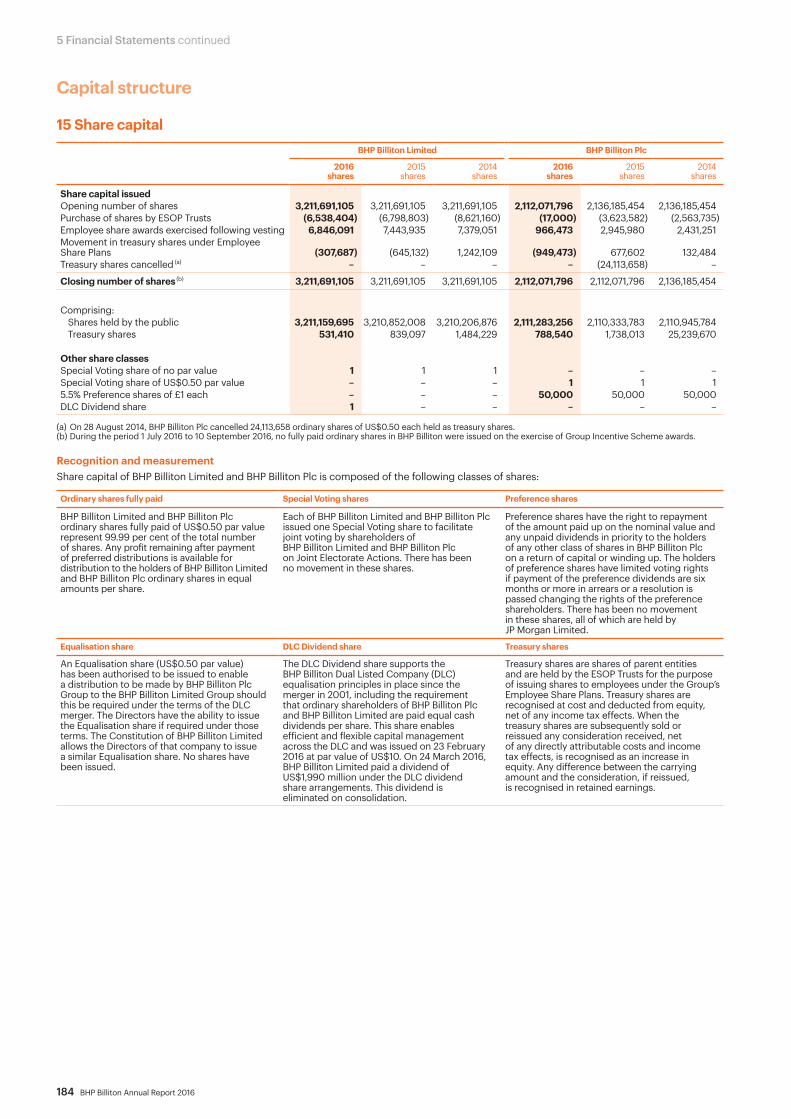
184 BHP Billiton Annual Report 2016
5 Financial Statements continued
Capital structure
15 Share capitalBHP Billiton Limited BHP Billiton Plc
2016shares
2015shares
2014shares
2016shares
2015shares
2014shares
Share capital issuedOpening number of shares 3,211,691,105 3,211,691,105 3,211,691,105 2,112,071,796 2,136,185,454 2,136,185,454Purchase of shares by ESOP Trusts (6,538,404) (6,798,803) (8,621,160) (17,000) (3,623,582) (2,563,735)Employee share awards exercised following vesting 6,846,091 7,443,935 7,379,051 966,473 2,945,980 2,431,251Movement in treasury shares under Employee Share Plans (307,687) (645,132) 1,242,109 (949,473) 677,602 132,484Treasury shares cancelled (a) – – – – (24,113,658) –
Closing number of shares (b) 3,211,691,105 3,211,691,105 3,211,691,105 2,112,071,796 2,112,071,796 2,136,185,454
Comprising: Shares held by the public 3,211,159,695 3,210,852,008 3,210,206,876 2,111,283,256 2,110,333,783 2,110,945,784Treasury shares 531,410 839,097 1,484,229 788,540 1,738,013 25,239,670
Other share classesSpecial Voting share of no par value 1 1 1 – – –Special Voting share of US$0.50 par value – – – 1 1 15.5% Preference shares of £1 each – – – 50,000 50,000 50,000DLC Dividend share 1 – – – – –
(a) On 28 August 2014, BHP Billiton Plc cancelled 24,113,658 ordinary shares of US$0.50 each held as treasury shares.(b) During the period 1 July 2016 to 10 September 2016, no fully paid ordinary shares in BHP Billiton were issued on the exercise of Group Incentive Scheme awards.
Recognition and measurementShare capital of BHP Billiton Limited and BHP Billiton Plc is composed of the following classes of shares:
Ordinary shares fully paid Special Voting shares Preference shares
BHP Billiton Limited and BHP Billiton Plc ordinary shares fully paid of US$0.50 par value represent 99.99 per cent of the total number of shares. Any profit remaining after payment of preferred distributions is available for distribution to the holders of BHP Billiton Limited and BHP Billiton Plc ordinary shares in equal amounts per share.
Each of BHP Billiton Limited and BHP Billiton Plc issued one Special Voting share to facilitate joint voting by shareholders of BHP Billiton Limited and BHP Billiton Plc on Joint Electorate Actions. There has been no movement in these shares.
Preference shares have the right to repayment of the amount paid up on the nominal value and any unpaid dividends in priority to the holders of any other class of shares in BHP Billiton Plc on a return of capital or winding up. The holders of preference shares have limited voting rights if payment of the preference dividends are six months or more in arrears or a resolution is passed changing the rights of the preference shareholders. There has been no movement in these shares, all of which are held by JP Morgan Limited.
Equalisation share DLC Dividend share Treasury shares
An Equalisation share (US$0.50 par value) has been authorised to be issued to enable a distribution to be made by BHP Billiton Plc Group to the BHP Billiton Limited Group should this be required under the terms of the DLC merger. The Directors have the ability to issue the Equalisation share if required under those terms. The Constitution of BHP Billiton Limited allows the Directors of that company to issue a similar Equalisation share. No shares have been issued.
The DLC Dividend share supports the BHP Billiton Dual Listed Company (DLC) equalisation principles in place since the merger in 2001, including the requirement that ordinary shareholders of BHP Billiton Plc and BHP Billiton Limited are paid equal cash dividends per share. This share enables efficient and flexible capital management across the DLC and was issued on 23 February 2016 at par value of US$10. On 24 March 2016, BHP Billiton Limited paid a dividend of US$1,990 million under the DLC dividend share arrangements. This dividend is eliminated on consolidation.
Treasury shares are shares of parent entities and are held by the ESOP Trusts for the purpose of issuing shares to employees under the Group’s Employee Share Plans. Treasury shares are recognised at cost and deducted from equity, net of any income tax effects. When the treasury shares are subsequently sold or reissued any consideration received, net of any directly attributable costs and income tax effects, is recognised as an increase in equity. Any difference between the carrying amount and the consideration, if reissued, is recognised in retained earnings.

BHP Billiton Annual Report 2016 185
16 Other equity 2016
US$M 2015
US$M 2014
US$M Recognition and measurement
Share premium account
518 518 518 The share premium account represents the premium paid on the issue of BHP Billiton Plc shares recognised in accordance with the UK Companies Act 2006.
Foreign currency translation reserve
41 52 54 The foreign currency translation reserve represents exchange differences arising from the translation of non-US dollar functional currency operations within the Group into US dollars.
Employee share awards reserve
293 372 599 The employee share awards reserve represents the accrued employee entitlements to share awards that have been charged to the income statement and have not yet been exercised. Once exercised, the difference between the accumulated fair value of the awards and their historical on-market purchase price is recognised in retained earnings.
Hedging reserve 210 141 129 The hedging reserve represents hedging gains and losses recognised on the effective portion of cash flow hedges. The cumulative deferred gain or loss on the hedge is recognised in the income statement when the hedged transaction impacts the income statement, or is recognised as an adjustment to the cost of non-financial hedged items. The hedging reserve records the portion of the gain or loss on a hedging instrument in a cash flow hedge that is determined to be an effective hedge relationship.
Financial assets reserve
11 9 115 The financial assets reserve represents the revaluation of available for sale financial assets. Where a revalued financial asset is sold or impaired, the relevant portion of the reserve is transferred to the income statement.
Share buy-back reserve
177 177 165 The share buy-back reserve represents the par value of BHP Billiton Plc shares that were purchased and subsequently cancelled. The cancellation of the shares creates a non-distributable reserve.
Non-controlling interest contribution reserve
1,288 1,288 1,347 The non-controlling interest contribution reserve represents the excess of consideration received over the book value of net assets attributable to the equity instruments when acquired by non-controlling interests.
Total reserves 2,538 2,557 2,927
Summarised financial information relating to each of the Group’s subsidiaries with non-controlling interests (NCI) that are material to the Group before any intra-group eliminations is shown below:
2016 2015
US$M
Minera Escondida
Limitada
Other individually immaterial
subsidiaries (incl intra-group
eliminations) Total
Minera Escondida
Limitada
Other individually immaterial
subsidiaries (incl intra-group
eliminations) Total
BHP Billiton share (per cent) 57.5 57.5
Current assets 2,033 2,542Non-current assets 14,241 13,060Current liabilities (2,240) (1,973)Non-current liabilities (2,316) (2,209)
Net assets 11,718 11,420
Net assets attributable to NCI 4,980 801 5,781 4,854 923 5,777
Revenue 5,071 8,092Profit after taxation 505 2,194Other comprehensive income (5) –
Total comprehensive income 500 2,194
Profit after taxation attributable to NCI 214 (36) 178 932 36 968Other comprehensive income attributable to NCI (2) – (2) – 5 5
Net operating cash flow 1,868 3,387Net investing cash flow (2,268) (3,273)Net financing cash flow 507 (596)
Dividends paid to NCI (a) – 87 87 536 103 639
(a) Includes US$85 million dividends paid to NCI related to Discontinued operations for the year ended 30 June 2015.
While the Group controls these subsidiaries, the non-controlling interests hold certain protective rights that restrict the Group’s ability to sell assets held by these subsidiaries, or use the assets in other subsidiaries and operations owned by the Group. These subsidiaries are also restricted from paying dividends without the approval of the non-controlling interests.
6 Additional inform
ation7
Shareholder information
5Financial Statem
ents

186 BHP Billiton Annual Report 2016
5 Financial Statements continued
17 Dividends Year ended 30 June 2016 Year ended 30 June 2015 Year ended 30 June 2014
Per share US cents
Total US$M
Per share US cents
Total US$M
Per share US cents
Total US$M
Dividends paid during the period (a)
Prior year final dividend 62.0 3,299 62.0 3,292 59.0 3,135Interim dividend 16.0 855 62.0 3,304 59.0 3,141
78.0 4,154 124.0 6,596 118.0 6,276
(a) 5.5 per cent dividend on 50,000 preference shares of £1 each determined and paid annually (30 June 2015: 5.5 per cent; 30 June 2014: 5.5 per cent).
The Dual Listed Company merger terms require that ordinary shareholders of BHP Billiton Limited and BHP Billiton Plc are paid equal cash dividends on a per share basis. Each American Depositary Share (ADS) represents two ordinary shares of BHP Billiton Limited or BHP Billiton Plc. Dividends determined on each ADS represent twice the dividend determined on BHP Billiton ordinary shares.
Dividends are determined after period-end and announced with the results for the period. Interim dividends are determined in February and paid in March. Final dividends are determined in August and paid in September. Dividends determined are not recorded as a liability at the end of the period to which they relate. Subsequent to year-end, on 16 August 2016, BHP Billiton determined a final dividend of 14.0 US cents per share (US$746 million), which will be paid on 20 September 2016 (30 June 2015: final dividend of 62.0 US cents per share – US$3,301 million; 30 June 2014: final dividend of 62.0 US cents per share – US$3,301 million).
BHP Billiton Limited dividends for all periods presented are, or will be, fully franked based on a tax rate of 30 per cent.
2016 US$M
2015 US$M
2014 US$M
Franking credits as at 30 June 9,640 11,295 13,419Franking credits/(debits) arising from the payment/(refund) of current tax 81 (428) (29)
Total franking credits available (a) 9,721 10,867 13,390
(a) The payment of the final 2016 dividend determined after 30 June 2016 will reduce the franking account balance by US$193 million.
18 Provisions for dividends and other liabilities The disclosure below excludes closure and rehabilitation provisions (refer to note 14 ‘Closure and rehabilitation provisions’), employee benefits, restructuring and post-retirement employee benefits provisions (refer to note 24 ‘Employee benefits, restructuring and post-retirement employee benefits provisions’) and the Samarco dam failure provision (refer to note 3 ‘Significant events – Samarco dam failure’).
2016 US$M
2015 US$M
Movement in provision for dividends and other liabilitiesAt the beginning of the financial year 364 558Dividends determined 4,154 6,596Charge/(credit) for the year:
Underlying 709 400Discounting – 1Exchange variations (28) (131)Released during the year (82) (138)
Utilisation (141) (359)Divestments of subsidiaries and operations – (65)Dividends paid (4,130) (6,498)Transfers and other movements (a) 84 –
At the end of the financial year 930 364
Comprising:Current 306 159Non-current 624 205
(a) Includes unpaid dividend determined to non-controlling interest of US$85 million.
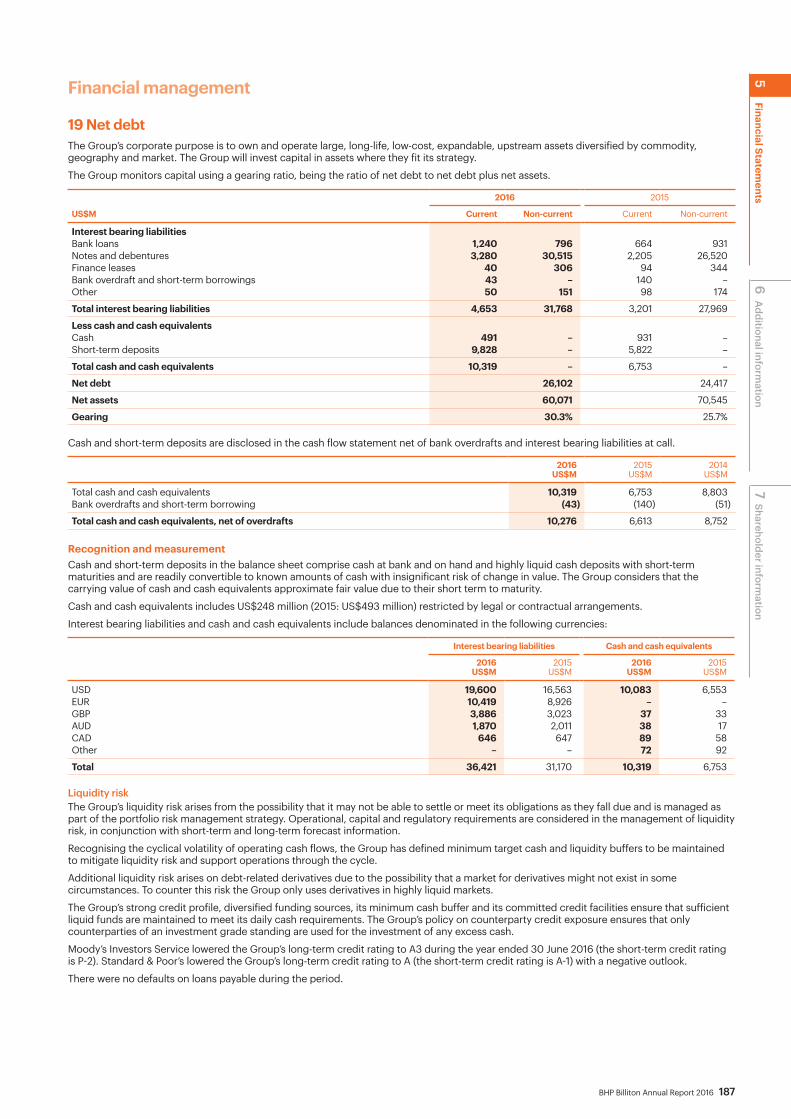
BHP Billiton Annual Report 2016 187
Financial management
19 Net debt The Group’s corporate purpose is to own and operate large, long-life, low-cost, expandable, upstream assets diversified by commodity, geography and market. The Group will invest capital in assets where they fit its strategy.
The Group monitors capital using a gearing ratio, being the ratio of net debt to net debt plus net assets.
2016 2015
US$M Current Non-current Current Non-current
Interest bearing liabilities Bank loans 1,240 796 664 931 Notes and debentures 3,280 30,515 2,205 26,520 Finance leases 40 306 94 344 Bank overdraft and short-term borrowings 43 – 140 –Other 50 151 98 174
Total interest bearing liabilities 4,653 31,768 3,201 27,969
Less cash and cash equivalents Cash 491 – 931 –Short-term deposits 9,828 – 5,822 –
Total cash and cash equivalents 10,319 – 6,753 –
Net debt 26,102 24,417
Net assets 60,071 70,545
Gearing 30.3% 25.7%
Cash and short-term deposits are disclosed in the cash flow statement net of bank overdrafts and interest bearing liabilities at call.
2016 US$M
2015 US$M
2014 US$M
Total cash and cash equivalents 10,319 6,753 8,803Bank overdrafts and short-term borrowing (43) (140) (51)
Total cash and cash equivalents, net of overdrafts 10,276 6,613 8,752
Recognition and measurementCash and short-term deposits in the balance sheet comprise cash at bank and on hand and highly liquid cash deposits with short-term maturities and are readily convertible to known amounts of cash with insignificant risk of change in value. The Group considers that the carrying value of cash and cash equivalents approximate fair value due to their short term to maturity.
Cash and cash equivalents includes US$248 million (2015: US$493 million) restricted by legal or contractual arrangements.
Interest bearing liabilities and cash and cash equivalents include balances denominated in the following currencies:
Interest bearing liabilities Cash and cash equivalents
2016US$M
2015US$M
2016US$M
2015US$M
USD 19,600 16,563 10,083 6,553EUR 10,419 8,926 – –GBP 3,886 3,023 37 33AUD 1,870 2,011 38 17CAD 646 647 89 58Other – – 72 92
Total 36,421 31,170 10,319 6,753
Liquidity risk The Group’s liquidity risk arises from the possibility that it may not be able to settle or meet its obligations as they fall due and is managed as part of the portfolio risk management strategy. Operational, capital and regulatory requirements are considered in the management of liquidity risk, in conjunction with short-term and long-term forecast information.
Recognising the cyclical volatility of operating cash flows, the Group has defined minimum target cash and liquidity buffers to be maintained to mitigate liquidity risk and support operations through the cycle.
Additional liquidity risk arises on debt-related derivatives due to the possibility that a market for derivatives might not exist in some circumstances. To counter this risk the Group only uses derivatives in highly liquid markets.
The Group’s strong credit profile, diversified funding sources, its minimum cash buffer and its committed credit facilities ensure that sufficient liquid funds are maintained to meet its daily cash requirements. The Group’s policy on counterparty credit exposure ensures that only counterparties of an investment grade standing are used for the investment of any excess cash.
Moody’s Investors Service lowered the Group’s long-term credit rating to A3 during the year ended 30 June 2016 (the short-term credit rating is P-2). Standard & Poor’s lowered the Group’s long-term credit rating to A (the short-term credit rating is A-1) with a negative outlook.
There were no defaults on loans payable during the period.
6 Additional inform
ation7
Shareholder information
5Financial Statem
ents

188 BHP Billiton Annual Report 2016
5 Financial Statements continued
19 Net debt continuedStandby arrangements and unused credit facilitiesThe Group’s committed revolving credit facility operates as a back-stop to the Group’s uncommitted commercial paper program. The combined amount drawn under the facility or as commercial paper will not exceed US$6.0 billion. As at 30 June 2016, US$ nil commercial paper was drawn (2015: US$ nil). The revolving credit facility has a five-year maturity ending 7 May 2021. A commitment fee is payable on the undrawn balance and an interest rate comprising an interbank rate plus a margin applies to any drawn balance. The agreed margins are typical for a credit facility extended to a company with the Group’s credit rating.
Maturity profile of financial liabilities The maturity profile of the Group’s financial liabilities based on the contractual amounts, taking into account the derivatives related to debt, is as follows:
2016 US$M
Bank loans,debentures and
other loans
Expected future interest
payments
Derivativesrelated to
net debtOther
derivatives
Obligationsunder finance
leases
Trade and other payables Total
Due for payment:In one year or less or on demand 4,568 826 118 5 49 5,125 10,691In more than one year but not more than two years 938 1,151 409 3 66 1 2,568In more than two years but not more than five years 9,447 3,014 837 7 155 5 13,465In more than five years 18,847 7,250 1,997 – 115 7 28,216
Total 33,800 12,241 3,361 15 385 5,138 54,940
Carrying amount 36,075 – 1,768 15 346 5,138 43,342
2015 US$M
Bank loans,debentures and
other loans
Expected future interest
payments
Derivativesrelated tonet debt
Otherderivatives
Obligationsunder finance
leases
Trade and other payables Total
Due for payment:In one year or less or on demand 3,070 664 214 8 105 6,807 10,868In more than one year but not more than two years 3,385 865 44 3 61 20 4,378In more than two years but not more than five years 6,485 2,149 850 3 157 7 9,651In more than five years 16,952 7,092 1,495 1 165 2 25,707
Total 29,892 10,770 2,603 15 488 6,836 50,604
Carrying amount 30,732 – 1,267 15 438 6,836 39,288
20 Net finance costs 2016
US$M 2015
US$M 2014
US$M
Financial expensesInterest on bank loans, overdrafts and all other borrowings 971 526 668Interest capitalised at 2.61% (2015: 1.94%; 2014: 1.82%) (a) (123) (148) (182)Discounting on provisions and other liabilities 313 333 338Fair value change on hedged loans 1,444 372 328Fair value change on hedging derivatives (1,448) (358) (292)Fair value change on non-hedging derivatives – – 101Exchange variations on net debt (24) (63) 4Other financial expenses 28 40 30
1,161 702 995
Financial incomeInterest income (137) (88) (81)
Net finance costs 1,024 614 914
(a) Interest has been capitalised at the rate of interest applicable to the specific borrowings financing the assets under construction or, where financed through general borrowings, at a capitalisation rate representing the average interest rate on such borrowings. Tax relief for capitalised interest is approximately US$37 million (2015: US$42 million; 2014: US$53 million).
Recognition and measurementInterest income is accrued using the effective interest rate method. Finance costs are expensed as incurred except where they relate to the financing of construction or development of qualifying assets.

BHP Billiton Annual Report 2016 189
21 Financial risk management Financial and capital risk management strategyThe financial risks arising from the Group’s operations comprise market, liquidity and credit risk. These risks arise in the normal course of business and the Group manages its exposure to them in accordance with the Group’s portfolio risk management strategy. The objective of the strategy is to support the delivery of the Group’s financial targets, while protecting its future financial security and flexibility by taking advantage of the natural diversification provided by the scale, diversity and flexibility of the Group’s operations and activities.
A Cash Flow at Risk (CFaR) framework is used to measure the aggregate and diversified impact of financial risks upon the Group’s financial targets. The principal measurement of risk is CFaR measured on a portfolio basis, which is defined as the worst expected loss relative to projected business plan cash flows over a one-year horizon under normal market conditions at a confidence level of 90 per cent.
Market riskThe Group’s activities expose it to market risks associated with movements in interest rates, foreign currencies and commodity prices. Under the strategy outlined above, the Group seeks to achieve financing costs, currency impacts, input costs and commodity prices on a floating or index basis. This strategy gives rise to a risk of variability in earnings, which is measured under the CFaR framework.
In executing the strategy, financial instruments are potentially employed in three distinct but related activities. The following table summarises these activities and the key risk management processes:
Activity Key risk management processes
1 Risk mitigationOn an exception basis, hedging for the purposes of mitigating risk related to specific and significant expenditure on investments or capital projects will be executed if necessary to support the Group’s strategic objectives.
• Execution of transactions within approved mandates.
2 Economic hedging of commodity sales, operating costs and debt instrumentsWhere Group commodity production is sold to customers on pricing terms that deviate from the relevant index target and where a relevant derivatives market exists, financial instruments may be executed as an economic hedge to align the revenue price exposure with the index target.
• Measuring and reporting the exposure in customer commodity contracts and issued debt instruments.
Where debt is issued in a currency other than the US dollar and/or at a fixed interest rate, fair value and cash flow hedges may be executed to align the debt exposure with the Group’s functional currency of US dollars and/or to swap to a floating interest rate.
• Executing hedging derivatives to align the total group exposure to the index target.
3 Strategic financial transactionsOpportunistic transactions may be executed with financial instruments to capture value from perceived market over/under valuations.
• Execution of transactions within approved mandates.
Primary responsibility for identification and control of financial risks, including authorising and monitoring the use of financial instruments for the above activities and stipulating policy thereon, rests with the Financial Risk Management Committee under authority delegated by the Chief Executive Officer.
Interest rate risk The Group is exposed to interest rate risk on its outstanding borrowings and investments from the possibility that changes in interest rates will affect future cash flows or the fair value of fixed interest rate financial instruments. Interest rate risk is managed as part of the portfolio risk management strategy.
The majority of the Group’s debt is issued at fixed interest rates. The Group has entered into interest rate swaps and cross currency interest rate swaps to convert most of its fixed interest rate exposure to floating US dollar interest rate exposure. As at 30 June 2016, 91 per cent of the Group’s borrowings were exposed to floating interest rates inclusive of the effect of swaps (2015: 89 per cent).
The fair value of interest rate swaps and cross currency interest rate swaps in hedge relationships used to hedge both interest rate and foreign currency risks are shown in the fair values section of this note.
Based on the net debt position as at 30 June 2016, taking into account interest rate swaps and cross currency interest rate swaps, it is estimated that a one percentage point increase in the US LIBOR interest rate will decrease the Group’s equity and profit after taxation by US$156 million (2015: decrease of US$149 million). This assumes that the change in interest rates is effective from the beginning of the financial year and the fixed/floating mix and balances are constant over the year. However, interest rates and the net debt profile of the Group may not remain constant over the coming financial year and therefore such sensitivity analysis should be used with care.
Currency riskThe US dollar is the predominant functional currency within the Group and as a result currency exposures arise from transactions and balances in currencies other than the US dollar. The Group’s potential currency exposures comprise:• translational exposure in respect of non-functional currency
monetary items; • transactional exposure in respect of non-functional currency
expenditure and revenues.
The Group’s foreign currency risk is managed as part of the portfolio risk management strategy.
Translational exposure in respect of non-functional currency monetary itemsMonetary items, including financial assets and liabilities, denominated in currencies other than the functional currency of an operation are periodically restated to US dollar equivalents and the associated gain or loss is taken to the income statement. The exception is foreign exchange gains or losses on foreign currency denominated provisions for closure and rehabilitation at operating sites, which are capitalised in property, plant and equipment.
The principal non-functional currencies to which the Group is exposed are the Australian dollar and the Chilean peso; however, 91 per cent (2015: 89 per cent) of the Group’s net financial assets are denominated in US dollars. Based on the Group’s net financial assets and liabilities as at 30 June 2016, a weakening of the US dollar against these currencies (1 cent strengthening in Australian dollar and 10 pesos strengthening in Chilean peso), with all other variables held constant, would decrease the Group’s equity and profit after taxation by US$15 million (2015: decrease of US$19 million).
Transactional exposure in respect of non-functional currency expenditure and revenuesCertain operating and capital expenditure is incurred in currencies other than their functional currency. To a lesser extent, certain sales revenue is earned in currencies other than the functional currency of operations and certain exchange control restrictions may require that funds be maintained in currencies other than the functional currency of the operation. These currency risks are managed as part of the portfolio risk management strategy. The Group enters into forward exchange contracts when required under this strategy.
6 Additional inform
ation7
Shareholder information
5Financial Statem
ents

190 BHP Billiton Annual Report 2016
5 Financial Statements continued
21 Financial risk management continuedCommodity price risk Contracts for the sale and physical delivery of commodities are executed whenever possible on a pricing basis intended to achieve a relevant index target. While the Group has succeeded in transitioning the majority of Group commodity production sales to market-based index pricing terms, derivative commodity contracts may from time to time be used to align realised prices with the relevant index. Due to the nature of the economic returns from our shale assets, from time to time the Group enters into natural gas futures contracts to manage price risk on gas production. Contracts for the physical delivery of commodities are not typically financial instruments and are carried in the balance sheet at cost (typically at US$ nil); they are therefore excluded from the fair value and sensitivity analysis. Accordingly, the financial instrument exposures set out below do not represent all of the commodity price risks managed according to the Group’s objectives. Movements in the fair value of contracts included are offset by movements in the fair value of the physical contracts; however, only the former movement is recognised in the Group’s income statement prior to settlement.
The risk associated with commodity prices is managed as part of the portfolio risk management strategy.
Financial instruments with commodity price risk are forward commodity and other derivative contracts with a net assets fair value of US$229 million (2015: US$212 million). Significant items are primarily derivatives embedded in physical commodity purchase and sales contracts of gas in Trinidad and Tobago with a net assets fair value of US$220 million (2015: US$206 million).
The potential effect of using reasonably possible alternative assumptions in these models, based on a change in the most significant input, such as commodity prices, by an increase (decrease) of 10 per cent while holding all other variables constant will increase (decrease) profit after taxation by US$34 million (2015: US$45 million).
Provisionally priced commodity sales and purchases contractsProvisionally priced sales or purchases volumes are those for which price finalisation, referenced to the relevant index, is outstanding at the reporting date. Provisional pricing mechanisms embedded within these sales and purchases arrangements have the character of a commodity derivative and are carried at fair value through profit
and loss as part of trade receivables or trade payables. The Group’s exposure at 30 June 2016 to the impact of movements in commodity prices upon provisionally invoiced sales and purchases volumes was predominately around copper.
The Group had 277 thousand tonnes of copper exposure at 30 June 2016 (2015: 331 thousand tonnes) that was provisionally priced. The final price of these sales or purchases will be determined during the first half of FY2017. A 10 per cent change in the price of copper realised on the provisionally priced sales, with all other factors held constant, would increase or decrease profit after taxation by US$98 million (2015: US$155 million). The relationship between commodity prices and foreign currencies is complex and movements in foreign exchange rates can impact commodity prices. The sensitivities should therefore be used with care.
Liquidity riskRefer to note 19 ‘Net debt’ for details on the Group liquidity risk.
Credit riskRefer to note 7 ‘Trade and other receivables’ for details on the Group credit risk.
Financial assets and liabilities The financial assets and liabilities are presented by class in the tables page 192 at their carrying amounts, which generally approximate to fair value.
Recognition and measurementAll financial assets and liabilities, other than derivatives, are initially recognised at the fair value of consideration paid or received, net of transaction costs as appropriate, and subsequently carried at fair value or amortised cost. Derivatives are initially recognised at fair value on the date the contract is entered into and are subsequently remeasured at their fair value.
The Group classifies its financial assets and liabilities into:• loans and receivables;• available for sale securities;• held at fair value through profit or loss;• cash flow hedges; • financial assets and liabilities at amortised cost.
The classification depends on the purpose for which the financial assets and liabilities are held. Management determines the classification of its financial assets at initial recognition.
Loans and receivables Available for sale securities
Loans and receivables are non-derivative financial assets with fixed or determinable payments that are not quoted in an active market and include cash and cash equivalents and trade receivables. They are included in current assets, except for those with maturities greater than 12 months after the reporting date, which are classified as non-current assets. Loans and receivables are initially measured at fair value of consideration paid and subsequently carried at either fair value or amortised cost less impairment. At the end of each reporting period, loans and receivables are assessed for objective evidence that they are impaired. The amount of loss is measured as the difference between its carrying amount and the present value of its estimated future cash flows. The loss is recognised in the income statement.
Available for sale financial assets are measured at fair value. Gains and losses on the remeasurement of trading investments are recognised directly in the income statement. Gains and losses on the remeasurement of available for sale securities and investments are recognised directly in equity and subsequently recognised in the income statement when realised by sale or redemption, or when a reduction in fair value is judged to represent an impairment.
Other financial liabilities at amortised cost
Trade and other payables represents amounts that are non-interest bearing. The carrying value approximates their fair value, which represents liabilities for goods and services provided to the Group prior to the end of the reporting period and that are unpaid. Interest bearing liabilities are initially recognised at fair value of the consideration received, net of transaction costs. Borrowings are subsequently measured at amortised cost using the effective interest method. Borrowings are removed from the balance sheet when the obligation specified in the contract is discharged, cancelled or expired. The difference between the carrying amount of a financial liability that has been extinguished or transferred to another party and the consideration paid, including any non-cash assets transferred or liabilities assumed, is recognised in the income statement as other income or finance costs.The Group has finance lease liabilities in relation to certain items of property, plant and equipment. Finance lease liabilities are initially recognised at the fair value of the underlying assets or, if lower, the estimated present value of the minimum lease payments. Each lease payment is allocated between the liability and finance cost, and the finance cost is charged to the income statement over the lease period to reflect a constant periodic rate of interest on the remaining balance of the liability for each period.
Derivatives and hedging
Derivatives, including embedded derivatives separated from the host contracts, are included within financial assets or liabilities at fair value through profit or loss unless they are designated as effective hedging instruments. Financial instruments in this category are classified as current if they are expected to be settled within 12 months; otherwise they are classified as non-current.The Group uses financial instruments to hedge its exposure to certain market risks arising from operational, financing and investing activities. At the start of the transaction, the Group documents:• the type of hedge;• the relationship between the hedging instrument and hedged items; • its risk management objective and strategy for undertaking various hedge transactions. The documentation also demonstrates, both at hedge inception and on an ongoing basis, that the hedge is expected to continue to be highly effective.

BHP Billiton Annual Report 2016 191
21 Financial risk management continuedThe Group has two types of hedges:
Fair value hedges Cash flow hedges
Exposure As the majority of the Group’s debt is issued at fixed interest rates, the Group has entered into interest rate swaps and cross currency interest rate swaps to mitigate its exposure to changes in the fair value of borrowings.
As a portion of the Group’s debt is denominated in currencies other than US dollars, the Group has entered into cross currency interest rate swaps to mitigate currency exposures.
Recognition date At the date the instrument is entered into.
Measurement Measured at fair value.
Fair value approach Based on internal valuations using standard valuation techniques with current market inputs, including interest and forward commodity; and exchange rates. Quoted market prices or dealer quotes for similar instruments
are used for long-term debt instruments held.
How are changes in fair value accounted for?
The following changes in the fair value are recognised immediately in the income statement:• the gains or losses on both the derivative or financial
instrument and hedged asset or liability attributable to the hedged risk;
• the gain or loss relating to the effective portion of interest rate swaps, hedging fixed rate borrowings, together with the gain or loss in the fair value of the hedged fixed rate borrowings attributable to interest rate risk;
• the gain or loss relating to the ineffective portion of the hedge.
If the hedge no longer meets the criteria for hedge accounting, the adjustment to the carrying amount of a hedged item for which the effective interest method is used is amortised to the income statement over the period to maturity using a recalculated effective interest rate.
• Changes in the fair value of derivatives designated as cash flow hedges are recognised directly in other comprehensive income and accumulated in equity in the hedging reserve to the extent that the hedge is highly effective.
• To the extent that the hedge is ineffective, changes in fair value are recognised immediately in the income statement.
• Amounts accumulated in equity are transferred to the income statement or the balance sheet for a non-financial asset at the same time as the hedged item is recognised.
• When a hedging instrument expires or is sold, terminated or exercised, or when a hedge no longer meets the criteria for hedge accounting, any cumulative gain or loss existing in equity at that time remains in equity and is recognised when the underlying forecast transaction occurs.
• When a forecast transaction is no longer expected to occur, the cumulative gain or loss that was reported in equity is immediately transferred to the income statement.
Certain derivative instruments do not qualify for hedge accounting. Changes in the fair value of any derivative instrument that does not qualify for hedge accounting are recognised immediately in the income statement.
Valuation hierarchyThe carrying amount of financial assets and liabilities measured at fair value is principally calculated based on inputs other than quoted prices that are observable for these financial assets or liabilities, either directly (i.e. as unquoted prices) or indirectly (i.e. derived from prices). Where no price information is available from a quoted market
source, alternative market mechanisms or recent comparable transactions, fair value is estimated based on the Group’s views on relevant future prices, net of valuation allowances to accommodate liquidity, modelling and other risks implicit in such estimates.
The inputs used in fair value calculations are determined by the relevant segment or function. The functions support the assets and operate under a defined set of accountabilities authorised by the Executive Leadership Team. Movements in the fair value of financial assets and liabilities may be recognised through the income statement or in other comprehensive income.
6 Additional inform
ation7
Shareholder information
5Financial Statem
ents

192 BHP Billiton Annual Report 2016
5 Financial Statements continued
21 Financial risk management continuedFor financial assets and liabilities carried at fair value, the Group uses the following to categorise the method used:
Fair value hierarchy Level 1 Level 2 Level 3
Valuation method Based on quoted prices (unadjusted) in active markets for identical financial assets and liabilities.
Based on inputs other than quoted prices included within Level 1 that are observable for the financial asset or liability, either directly (i.e. as unquoted prices) or indirectly (i.e. derived from prices).
Based on inputs not observable in the market using appropriate valuation models, including discounted cash flow modelling.
The financial assets and liabilities are presented by class in the tables below at their carrying amounts, which generally approximate to fair value. In the case of US$3,020 million (2015: US$3,321 million) of fixed rate debt not swapped to floating rate, the fair value at 30 June 2016 was US$3,539 million (2015: US$3,538 million).
2016US$M
Loans and receivables
Available for sale
securities
Held at fair value through
profit or lossCash flow
hedges
Other financial assets and
liabilities at amortised cost Total
Fair value hierarchy (a) Level 3 Levels 1, 2 & 3 Level 2
Current cross currency and interest rate swaps − − 43 − − 43Current other derivative contracts (b) − − 42 − − 42Current available for sale shares and other investments − − 36 − − 36Non-current cross currency and interest rate swaps − − 2,147 90 − 2,237Non-current other derivative contracts (b) − − 202 − − 202Non-current available for sale shares and other investments (c) (d) − 25 216 − − 241
Total other financial assets − 25 2,686 90 − 2,801Cash and cash equivalents 10,319 − − − − 10,319Trade and other receivables (e) 1,978 − 835 − − 2,813Loans to equity accounted investments 897 − − − − 897
Total financial assets 13,194 25 3,521 90 − 16,830
Non-financial assets 102,123
Total assets 118,953
Current cross currency and interest rate swaps − − − − − −Current other derivative contracts (b) − − 5 − − 5Non-current cross currency and interest rate swaps − − 179 1,589 − 1,768Non-current other derivative contracts (b) − − 10 − − 10
Total other financial liabilities − − 194 1,589 − 1,783Trade and other payables (f) − − 256 − 4,882 5,138Bank overdrafts and short-term borrowings (g) − − − − 43 43Bank loans (g) − − − − 2,036 2,036Notes and debentures (g) − − − − 33,795 33,795Finance leases (g) − − − − 346 346Other (g) − − − − 201 201
Total financial liabilities − − 450 1,589 41,303 43,342
Non-financial liabilities 15,540
Total liabilities 58,882
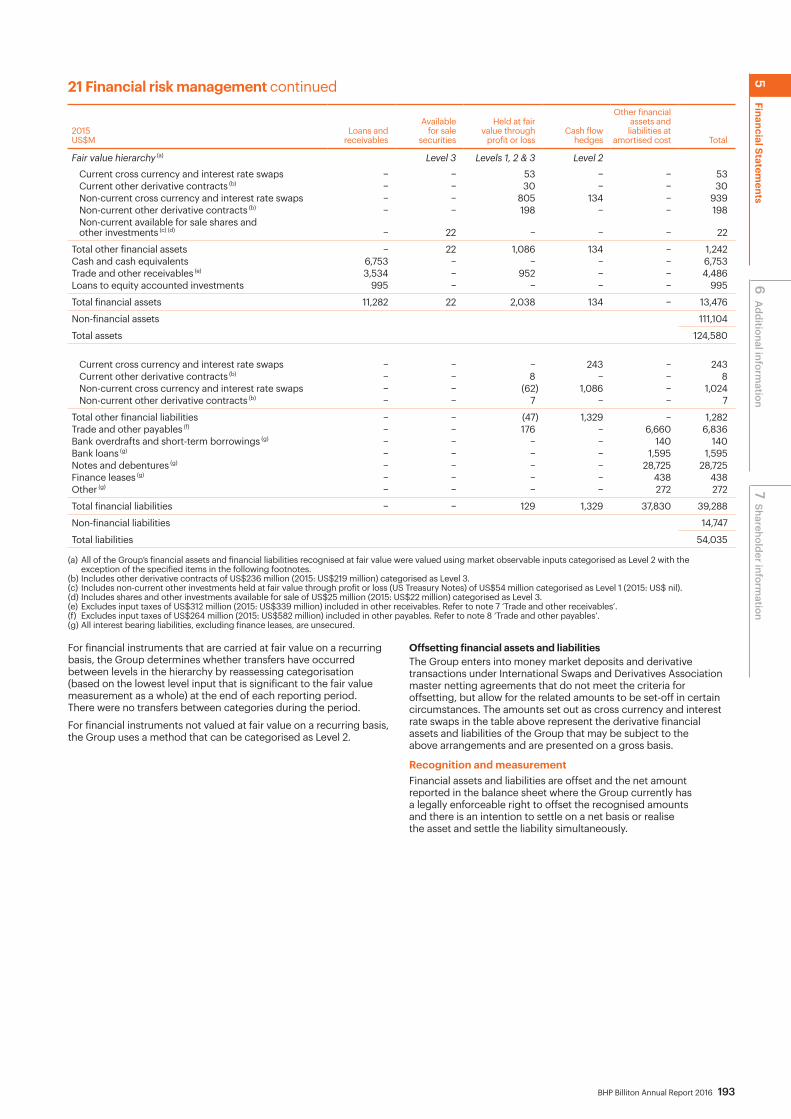
BHP Billiton Annual Report 2016 193
21 Financial risk management continued
2015US$M
Loans and receivables
Available for sale
securities
Held at fair value through
profit or lossCash flow
hedges
Other financial assets and liabilities at
amortised cost Total
Fair value hierarchy (a) Level 3 Levels 1, 2 & 3 Level 2
Current cross currency and interest rate swaps − − 53 − − 53Current other derivative contracts (b) − − 30 − − 30Non-current cross currency and interest rate swaps − − 805 134 − 939Non-current other derivative contracts (b) − − 198 − − 198Non-current available for sale shares and other investments (c) (d) − 22 − − − 22
Total other financial assets − 22 1,086 134 − 1,242Cash and cash equivalents 6,753 − − − − 6,753Trade and other receivables (e) 3,534 − 952 − − 4,486Loans to equity accounted investments 995 − − − − 995
Total financial assets 11,282 22 2,038 134 − 13,476
Non-financial assets 111,104
Total assets 124,580
Current cross currency and interest rate swaps − − − 243 − 243Current other derivative contracts (b) − − 8 − − 8Non-current cross currency and interest rate swaps − − (62) 1,086 − 1,024Non-current other derivative contracts (b) − − 7 − − 7
Total other financial liabilities − − (47) 1,329 − 1,282Trade and other payables (f) − − 176 − 6,660 6,836Bank overdrafts and short-term borrowings (g) − − − − 140 140Bank loans (g) − − − − 1,595 1,595Notes and debentures (g) − − − − 28,725 28,725Finance leases (g) − − − − 438 438Other (g) − − − − 272 272
Total financial liabilities − − 129 1,329 37,830 39,288
Non-financial liabilities 14,747
Total liabilities 54,035
(a) All of the Group’s financial assets and financial liabilities recognised at fair value were valued using market observable inputs categorised as Level 2 with the exception of the specified items in the following footnotes.
(b) Includes other derivative contracts of US$236 million (2015: US$219 million) categorised as Level 3. (c) Includes non-current other investments held at fair value through profit or loss (US Treasury Notes) of US$54 million categorised as Level 1 (2015: US$ nil). (d) Includes shares and other investments available for sale of US$25 million (2015: US$22 million) categorised as Level 3.(e) Excludes input taxes of US$312 million (2015: US$339 million) included in other receivables. Refer to note 7 ‘Trade and other receivables’.(f) Excludes input taxes of US$264 million (2015: US$582 million) included in other payables. Refer to note 8 ‘Trade and other payables’.(g) All interest bearing liabilities, excluding finance leases, are unsecured.
For financial instruments that are carried at fair value on a recurring basis, the Group determines whether transfers have occurred between levels in the hierarchy by reassessing categorisation (based on the lowest level input that is significant to the fair value measurement as a whole) at the end of each reporting period. There were no transfers between categories during the period.
For financial instruments not valued at fair value on a recurring basis, the Group uses a method that can be categorised as Level 2.
Offsetting financial assets and liabilitiesThe Group enters into money market deposits and derivative transactions under International Swaps and Derivatives Association master netting agreements that do not meet the criteria for offsetting, but allow for the related amounts to be set-off in certain circumstances. The amounts set out as cross currency and interest rate swaps in the table above represent the derivative financial assets and liabilities of the Group that may be subject to the above arrangements and are presented on a gross basis.
Recognition and measurementFinancial assets and liabilities are offset and the net amount reported in the balance sheet where the Group currently has a legally enforceable right to offset the recognised amounts and there is an intention to settle on a net basis or realise the asset and settle the liability simultaneously.
6 Additional inform
ation7
Shareholder information
5Financial Statem
ents

194 BHP Billiton Annual Report 2016
5 Financial Statements continued
Employee matters
22 Key management personnel Key management personnel compensation comprises:
2016 US$
2015 US$
2014 US$
Short-term employee benefits 14,979,983 26,663,069 29,302,029Post-employment benefits 2,356,594 2,920,007 3,176,079Share-based payments 16,837,179 20,783,959 21,300,632
Total 34,173,756 50,367,035 53,778,740
Transactions and outstanding loans/amounts with key management personnelThere were no purchases by key management personnel from the Group during the financial year (2015: US$ nil; 2014: US$ nil).
There were no amounts payable by key management personnel at 30 June 2016 (2015: US$ nil; 2014: US$ nil).
There were no loans receivable from or payable to key management personnel at 30 June 2016 (2015: US$ nil; 2014: US$ nil).
Transactions with personally related entitiesA number of Directors of the Group hold or have held positions in other companies (personally related entities) where it is considered they control or significantly influence the financial or operating policies of those entities. There were no transactions with those entities and no amounts were owed by the Group to personally related entities at 30 June 2016 (2015: US$ nil; 2014: US$ nil).
For more information on remuneration and transactions with key management personnel, refer to the ‘Remuneration Report’ in section 3.
23 Employee share ownership plans Awards, in the form of the right to receive ordinary shares in either BHP Billiton Limited or BHP Billiton Plc, were provided under the following employee share ownership plans for the year ended 30 June 2016: Long-Term Incentive Plan (LTIP), Short-Term Incentive Plan (STIP) (which replaced the Group Incentive Scheme (GIS)), Management Award Plan (MAP), Group Short-Term Incentive Plan (GSTIP), Transitional Operations Management Committee (OMC) awards and the all-employee share plan, Shareplus.
Some awards are eligible to receive a payment equal to the dividend amount that would have been earned on the underlying shares awarded to those participants (the Dividend Equivalent Payment (DEP)). The DEP is provided to the participants once the underlying shares are allocated or transferred to them. Awards under the plans do not confer any rights to participate in a share issue; however, there is discretion under each of the plans to adjust the awards in response to a variation of BHP Billiton’s share capital.
A description of these plans is as follows:
Plan STIP, GIS and GSTIP LTIP and MAP Transitional awards Shareplus
Type Short-term incentive. Long-term incentive. Long-term incentive. All-employee share purchase plan.
Overview The STIP (which replaced GIS in FY2014) is a plan for the members of the OMC and the GSTIP is a plan for senior management employees other than the OMC.Half of a participant’s short-term incentive amount is provided as a grant of rights to receive BHP Billiton shares.
The LTIP is a plan for the OMC and awards are granted annually.The MAP is a plan for management employees other than the OMC. The number of rights is determined by role, performance and organisational level.
Awards are provided to new OMC members as a transitional measure to bridge the time-based gap between the vesting of MAP awards (granted in their non-OMC position and the LTIP awards provided to OMC members).
Employees may contribute up to US$5,000 to acquire shares in any Plan year. On the third anniversary of the start of a Plan year, the Group will match the number of acquired shares.
Vesting conditions
Service conditions only. LTIP: Service conditions and performance conditions.For awards granted from December 2010 onwards, performance relative to the Peer Group Total Shareholder Return (TSR) over a five-year performance period determines the vesting of 67 per cent of the awards, while performance relative to the Index TSR (being the index value where the comparator group is a market index such as the MSCI World) determines the vesting of 33 per cent of the awards. For the awards to vest in full, the Group’s TSR must exceed the Peer Group TSR and Index TSR (if applicable) by a specified percentage per year, determined for each grant by the Remuneration Committee. Since the establishment of the LTIP in 2004, this percentage has been set at 5.5 per cent per year.MAP: Service conditions only.
Service conditions and performance conditions. The Remuneration Committee has absolute discretion to determine if the performance condition has been met and whether any, all or part of the award will vest (or otherwise lapse), having regard to (but not limited to) BHP Billiton’s TSR over the three- or four-year performance period (respectively), the participant’s contribution to Group outcomes and the participant’s personal performance (with guidance on this assessment from the CEO).
Service conditions only.
Vesting period
2 years LTIP – 5 years MAP – 3 years or 4 years or 5 years
3 years or 4 years 3 years
Dividend Equivalent Payment
Yes, except GSTIP awards granted after 1 July 2011.
Yes, except MAP granted after 1 July 2011. No No
Exercise period
None LTIP granted prior to 1 July 2013 – 5 years.MAP granted prior to 1 July 2011 – 3 years.
None None
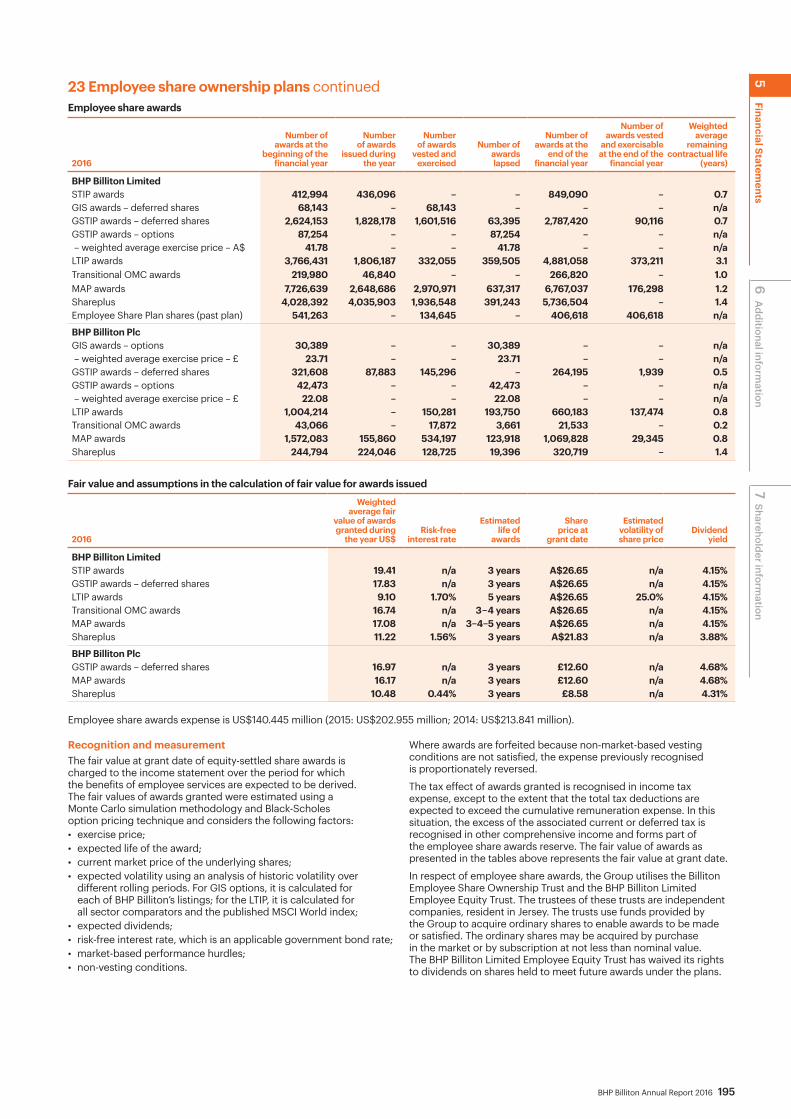
BHP Billiton Annual Report 2016 195
23 Employee share ownership plans continuedEmployee share awards
2016
Number of awards at the
beginning of the financial year
Number of awards
issued during the year
Number of awards
vested and exercised
Number of awards lapsed
Number of awards at the
end of the financial year
Number of awards vested
and exercisable at the end of the
financial year
Weighted average
remaining contractual life
(years)
BHP Billiton LimitedSTIP awards 412,994 436,096 – – 849,090 – 0.7GIS awards – deferred shares 68,143 – 68,143 – – – n/aGSTIP awards – deferred shares 2,624,153 1,828,178 1,601,516 63,395 2,787,420 90,116 0.7GSTIP awards – options 87,254 – – 87,254 – – n/a – weighted average exercise price – A$ 41.78 – – 41.78 – – n/aLTIP awards 3,766,431 1,806,187 332,055 359,505 4,881,058 373,211 3.1Transitional OMC awards 219,980 46,840 – – 266,820 – 1.0MAP awards 7,726,639 2,648,686 2,970,971 637,317 6,767,037 176,298 1.2Shareplus 4,028,392 4,035,903 1,936,548 391,243 5,736,504 – 1.4Employee Share Plan shares (past plan) 541,263 – 134,645 – 406,618 406,618 n/a
BHP Billiton PlcGIS awards – options 30,389 – – 30,389 – – n/a – weighted average exercise price – £ 23.71 – – 23.71 – – n/aGSTIP awards – deferred shares 321,608 87,883 145,296 – 264,195 1,939 0.5GSTIP awards – options 42,473 – – 42,473 – – n/a – weighted average exercise price – £ 22.08 – – 22.08 – – n/aLTIP awards 1,004,214 – 150,281 193,750 660,183 137,474 0.8Transitional OMC awards 43,066 – 17,872 3,661 21,533 – 0.2MAP awards 1,572,083 155,860 534,197 123,918 1,069,828 29,345 0.8Shareplus 244,794 224,046 128,725 19,396 320,719 – 1.4
Fair value and assumptions in the calculation of fair value for awards issued
2016
Weighted average fair
value of awards granted during
the year US$Risk-free
interest rate
Estimated life of
awards
Share price at
grant date
Estimated volatility of share price
Dividend yield
BHP Billiton LimitedSTIP awards 19.41 n/a 3 years A$26.65 n/a 4.15%GSTIP awards – deferred shares 17.83 n/a 3 years A$26.65 n/a 4.15%LTIP awards 9.10 1.70% 5 years A$26.65 25.0% 4.15%Transitional OMC awards 16.74 n/a 3–4 years A$26.65 n/a 4.15%MAP awards 17.08 n/a 3–4–5 years A$26.65 n/a 4.15%Shareplus 11.22 1.56% 3 years A$21.83 n/a 3.88%
BHP Billiton PlcGSTIP awards – deferred shares 16.97 n/a 3 years £12.60 n/a 4.68%MAP awards 16.17 n/a 3 years £12.60 n/a 4.68%Shareplus 10.48 0.44% 3 years £8.58 n/a 4.31%
Employee share awards expense is US$140.445 million (2015: US$202.955 million; 2014: US$213.841 million).
Recognition and measurementThe fair value at grant date of equity-settled share awards is charged to the income statement over the period for which the benefits of employee services are expected to be derived. The fair values of awards granted were estimated using a Monte Carlo simulation methodology and Black-Scholes option pricing technique and considers the following factors: • exercise price;• expected life of the award;• current market price of the underlying shares;• expected volatility using an analysis of historic volatility over
different rolling periods. For GIS options, it is calculated for each of BHP Billiton’s listings; for the LTIP, it is calculated for all sector comparators and the published MSCI World index;
• expected dividends;• risk-free interest rate, which is an applicable government bond rate; • market-based performance hurdles; • non-vesting conditions.
Where awards are forfeited because non-market-based vesting conditions are not satisfied, the expense previously recognised is proportionately reversed.
The tax effect of awards granted is recognised in income tax expense, except to the extent that the total tax deductions are expected to exceed the cumulative remuneration expense. In this situation, the excess of the associated current or deferred tax is recognised in other comprehensive income and forms part of the employee share awards reserve. The fair value of awards as presented in the tables above represents the fair value at grant date.
In respect of employee share awards, the Group utilises the Billiton Employee Share Ownership Trust and the BHP Billiton Limited Employee Equity Trust. The trustees of these trusts are independent companies, resident in Jersey. The trusts use funds provided by the Group to acquire ordinary shares to enable awards to be made or satisfied. The ordinary shares may be acquired by purchase in the market or by subscription at not less than nominal value. The BHP Billiton Limited Employee Equity Trust has waived its rights to dividends on shares held to meet future awards under the plans.
6 Additional inform
ation7
Shareholder information
5Financial Statem
ents
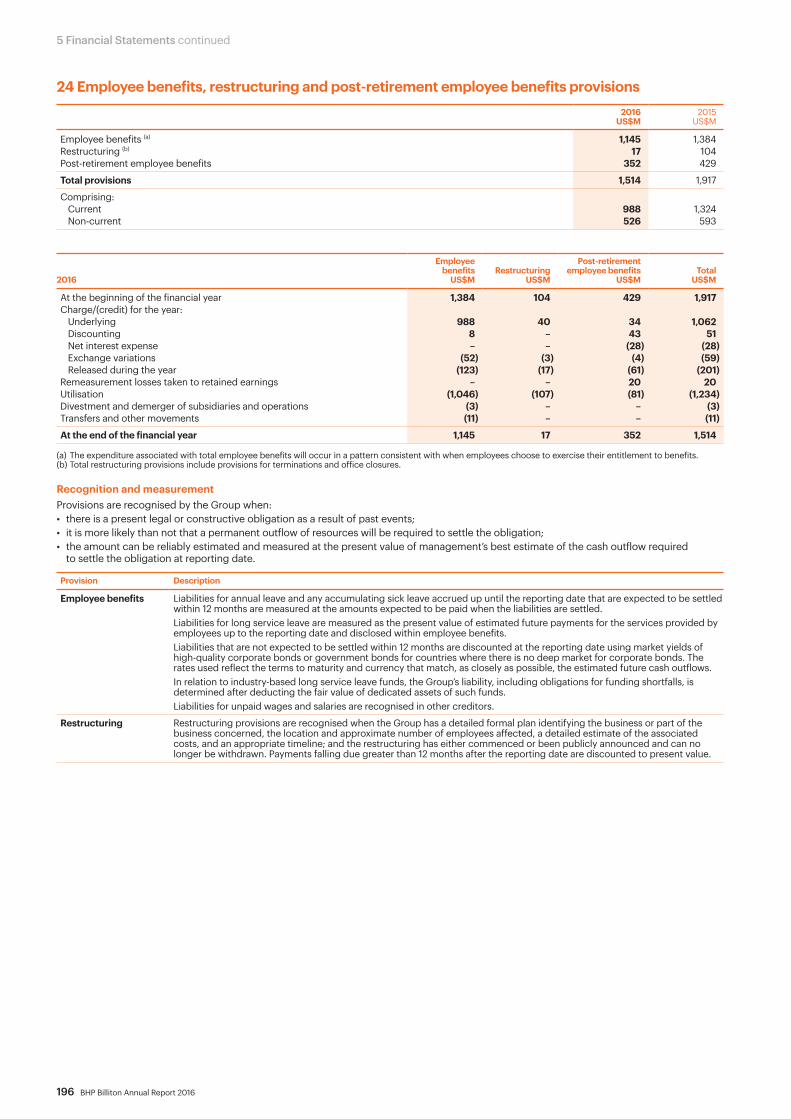
196 BHP Billiton Annual Report 2016
5 Financial Statements continued
24 Employee benefits, restructuring and post-retirement employee benefits provisions2016
US$M 2015
US$M
Employee benefits (a) 1,145 1,384Restructuring (b) 17 104Post-retirement employee benefits 352 429
Total provisions 1,514 1,917
Comprising:Current 988 1,324Non-current 526 593
2016
Employee benefits
US$MRestructuring
US$M
Post-retirement employee benefits
US$MTotal
US$M
At the beginning of the financial year 1,384 104 429 1,917Charge/(credit) for the year:
Underlying 988 40 34 1,062Discounting 8 – 43 51Net interest expense – – (28) (28)Exchange variations (52) (3) (4) (59)Released during the year (123) (17) (61) (201)
Remeasurement losses taken to retained earnings – – 20 20Utilisation (1,046) (107) (81) (1,234)Divestment and demerger of subsidiaries and operations (3) – – (3)Transfers and other movements (11) – – (11)
At the end of the financial year 1,145 17 352 1,514
(a) The expenditure associated with total employee benefits will occur in a pattern consistent with when employees choose to exercise their entitlement to benefits.(b) Total restructuring provisions include provisions for terminations and office closures.
Recognition and measurementProvisions are recognised by the Group when:• there is a present legal or constructive obligation as a result of past events;• it is more likely than not that a permanent outflow of resources will be required to settle the obligation;• the amount can be reliably estimated and measured at the present value of management’s best estimate of the cash outflow required
to settle the obligation at reporting date.
Provision Description
Employee benefits Liabilities for annual leave and any accumulating sick leave accrued up until the reporting date that are expected to be settled within 12 months are measured at the amounts expected to be paid when the liabilities are settled.Liabilities for long service leave are measured as the present value of estimated future payments for the services provided by employees up to the reporting date and disclosed within employee benefits.Liabilities that are not expected to be settled within 12 months are discounted at the reporting date using market yields of high-quality corporate bonds or government bonds for countries where there is no deep market for corporate bonds. The rates used reflect the terms to maturity and currency that match, as closely as possible, the estimated future cash outflows.In relation to industry-based long service leave funds, the Group’s liability, including obligations for funding shortfalls, is determined after deducting the fair value of dedicated assets of such funds.Liabilities for unpaid wages and salaries are recognised in other creditors.
Restructuring Restructuring provisions are recognised when the Group has a detailed formal plan identifying the business or part of the business concerned, the location and approximate number of employees affected, a detailed estimate of the associated costs, and an appropriate timeline; and the restructuring has either commenced or been publicly announced and can no longer be withdrawn. Payments falling due greater than 12 months after the reporting date are discounted to present value.

BHP Billiton Annual Report 2016 197
25 Pension and other post-retirement obligationsThe Group operates or participates in a number of pension (including superannuation) schemes throughout the world. The funding of the schemes complies with local regulations. The assets of the schemes are generally held separately from those of the Group and are administered by trustees or management boards.
Schemes Description
Defined contribution pension schemes and multi-employer pension schemes
For defined contribution schemes or schemes operated on an industry-wide basis where it is not possible to identify assets attributable to the participation by the Group’s employees, the pension charge is calculated on the basis of contributions payable. The Group contributed US$232 million during the financial year (2015: US$462 million; 2014: US$467 million) to defined contribution plans and multi-employer defined contribution plans. These contributions are expensed as incurred.
Defined benefit post-retirement medical schemes
Certain Group companies provide post-retirement medical benefits to qualifying retirees. In some cases, the benefits are provided through medical care schemes to which the Group, the employees, the retirees and covered family members contribute. In some schemes there is no funding of the benefits before retirement. These schemes are recognised on the same basis as described for defined benefit pension schemes. The Group operates a number of post-retirement medical schemes in the United States, Canada and Europe. Full actuarial valuations are prepared by local actuaries for all schemes. All of the post-retirement medical schemes in the Group are unfunded.
Defined benefit pension schemes
For defined benefit pension schemes, the cost of providing pensions is charged to the income statement so as to recognise current and past service costs, interest cost on defined benefit obligations, and the effect of any curtailments or settlements, net of returns on plan assets. Remeasurement gains and losses are recognised directly in equity. An asset or liability is consequently recognised in the balance sheet based on the present value of defined benefit obligations less the fair value of plan assets, except that any such asset cannot exceed the present value of expected refunds from and reductions in future contributions to the plan. Defined benefit obligations are estimated by discounting expected future payments using market yields at the reporting date on high-quality corporate bonds in countries that have developed corporate bond markets. However, where developed corporate bond markets do not exist, the discount rates are selected by reference to national government bonds. In both instances, the bonds are selected with terms to maturity and currency that match, as closely as possible, the estimated future cash flows.The Group has closed all defined benefit pensions schemes to new entrants. Defined benefit pension schemes remain operating in Australia, the United States, Canada and Europe for existing members. Full actuarial valuations are prepared and updated annually to 30 June by local actuaries for all schemes. The Group operates final salary schemes (that provide final salary benefits only), non-salary related schemes (that provide flat dollar benefits) and mixed benefit schemes (that consist of a final salary defined benefit portion and a defined contribution portion).
RiskThe Group’s defined benefit pension schemes and post-retirement medical schemes expose the Group to a number of risks, including asset value volatility, interest rate variations, inflation, longevity and medical expense inflation risk.
Recognising this, the Group has adopted an approach of moving away from providing defined benefit pensions. The majority of Group-sponsored defined benefit pension schemes have been closed to new entrants for many years. Existing benefit schemes and the terms of employee participation in these schemes are reviewed on a regular basis.
Fund assetsThe Group follows a coordinated strategy for the funding and investment of its defined benefit pension schemes (subject to meeting all local requirements). The Group’s aim is for the value of defined benefit pension scheme assets to be maintained at close to the value of the corresponding benefit obligations, allowing for some short-term volatility.
Scheme assets are invested in a diversified range of asset classes, predominantly comprising bonds and equities.
The Group’s aim is to progressively shift defined benefit pension scheme assets towards investments that match the anticipated profile of the benefit obligations, as funding levels improve and benefit obligations mature. Over time, this is expected to result in a further reduction in the total exposure of pension scheme assets to equity markets. For pension schemes that pay lifetime benefits, the Group may consider and support the purchase of annuities to back these benefit obligations if it is commercially sensible to do so.
Net liability recognised in the Consolidated Balance SheetThe net liability recognised in the Consolidated Balance Sheet is as follows:
Defined benefit pension schemes Post-retirement medical schemes
2016 US$M
2015 US$M
2016 US$M
2015 US$M
Present value of funded defined benefit obligation 733 868 – –Present value of unfunded defined benefit obligation 115 113 214 269Fair value of defined benefit scheme assets (710) (822) – –
Scheme deficit 138 159 214 269
Unrecognised surplus – – – –Unrecognised past service credits – – – –Adjustment for employer contributions tax – 1 – –
Net liability recognised in the Consolidated Balance Sheet 138 160 214 269
The Group has no legal obligation to settle these liabilities with any immediate contributions or additional one-off contributions. The Group intends to continue to contribute to each defined benefit pension and post-retirement medical scheme in accordance with the latest recommendations of each scheme actuary.
6 Additional inform
ation7
Shareholder information
5Financial Statem
ents

198 BHP Billiton Annual Report 2016
5 Financial Statements continued
Group and related party information
26 Discontinued operationsThe Group announced on 25 May 2015 that it completed the demerger of a selection of its aluminium, coal, manganese, nickel and silver-lead-zinc assets to create an independent metals and mining company, South32. This included the Group’s interests in its integrated Aluminium business, Energy Coal South Africa, Illawarra metallurgical coal, the Manganese business, the Cerro Matoso nickel operation and the Cannington silver-lead-zinc mine. The contribution of Discontinued operations included within the Group’s profit until the loss of control is detailed below:
Income statement – Discontinued operations
2015 US$M
2014 US$M
Profit/(loss) after taxation from operating activities 642 269
Gain on loss of control of Manganese business 2,146 –Impairment of South32 assets upon classification as held-for-distribution (1,749) –Loss on demerger net of transaction costs (a) (2,319) –Derecognition of deferred tax assets (232) –
Net loss on demerger of South32 after taxation (2,154) –
(Loss)/profit after taxation (1,512) 269
Attributable to non-controlling interests 61 85Attributable to owners of BHP Billiton Group (1,573) 184
Basic (loss)/earnings per ordinary share (cents) (29.6) 3.5Diluted (loss)/earnings per ordinary share (cents) (29.5) 3.4
(a) The Group recognised the demerger in the Financial Statements as a dividend, reducing retained earnings by the fair value of South32’s shares. The US$1,795 million loss on demerger is the difference between the fair value of South32’s shares and the book value of the assets distributed and the reclassification of reserves relating to South32 to the income statement. Transaction costs of US$524 million (after tax benefit) comprised stamp duty, professional fees and separation and establishment costs.
The total comprehensive income attributable to owners of the BHP Billiton Group from Discontinued operations was a loss of US$1,685 million during the financial year ended 30 June 2015 (2014: profit of US$164 million).
Cash flows from Discontinued operations
2015 US$M
2014 US$M
Net operating cash flows 1,502 1,724Net investing cash flows (1,066) (700)Net financing cash flows (203) (32)
Net increase in cash and cash equivalents from Discontinued operations 233 992
Cash disposed on demerger of South32 (586) –
Net (decrease)/increase in cash and cash equivalents from Discontinued operations (353) 992
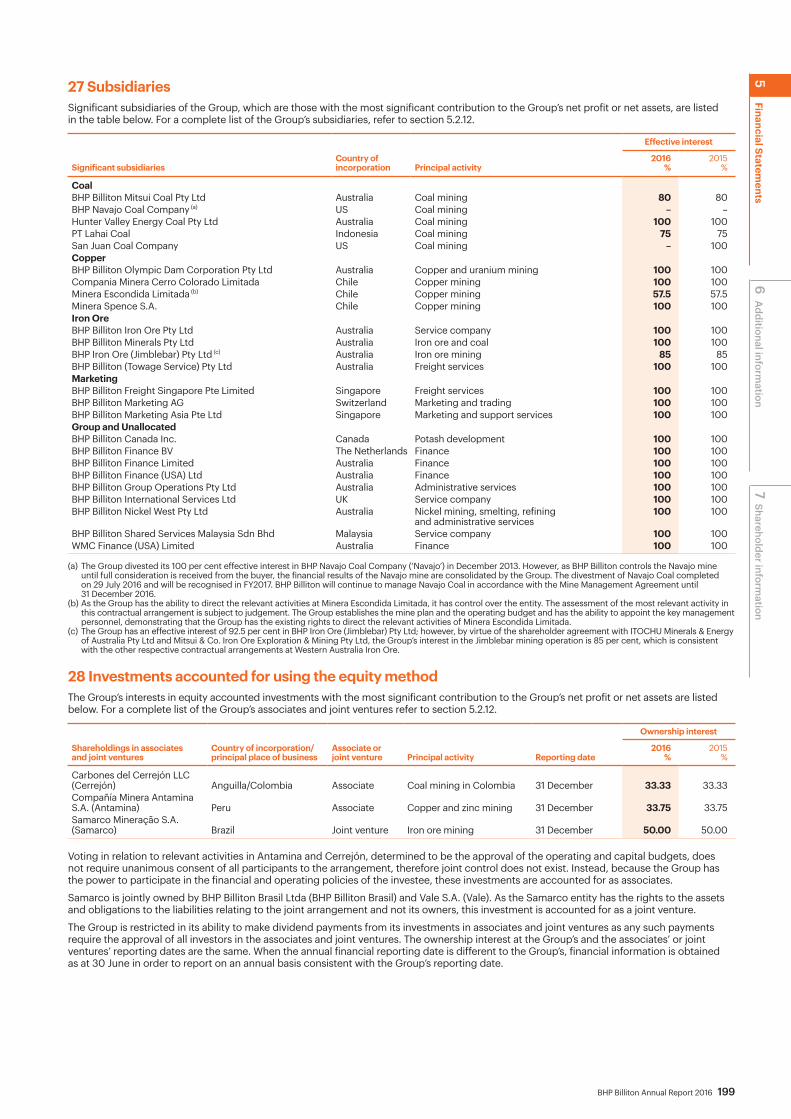
BHP Billiton Annual Report 2016 199
27 SubsidiariesSignificant subsidiaries of the Group, which are those with the most significant contribution to the Group’s net profit or net assets, are listed in the table below. For a complete list of the Group’s subsidiaries, refer to section 5.2.12.
Effective interest
Significant subsidiaries Country of incorporation Principal activity
2016%
2015%
CoalBHP Billiton Mitsui Coal Pty Ltd Australia Coal mining 80 80 BHP Navajo Coal Company (a) US Coal mining – –Hunter Valley Energy Coal Pty Ltd Australia Coal mining 100 100PT Lahai Coal Indonesia Coal mining 75 75San Juan Coal Company US Coal mining – 100CopperBHP Billiton Olympic Dam Corporation Pty Ltd Australia Copper and uranium mining 100 100 Compania Minera Cerro Colorado Limitada Chile Copper mining 100 100 Minera Escondida Limitada (b) Chile Copper mining 57.5 57.5Minera Spence S.A. Chile Copper mining 100 100 Iron OreBHP Billiton Iron Ore Pty Ltd Australia Service company 100 100BHP Billiton Minerals Pty Ltd Australia Iron ore and coal 100 100 BHP Iron Ore (Jimblebar) Pty Ltd (c) Australia Iron ore mining 85 85 BHP Billiton (Towage Service) Pty Ltd Australia Freight services 100 100MarketingBHP Billiton Freight Singapore Pte Limited Singapore Freight services 100 100 BHP Billiton Marketing AG Switzerland Marketing and trading 100 100 BHP Billiton Marketing Asia Pte Ltd Singapore Marketing and support services 100 100 Group and UnallocatedBHP Billiton Canada Inc. Canada Potash development 100 100BHP Billiton Finance BV The Netherlands Finance 100 100 BHP Billiton Finance Limited Australia Finance 100 100 BHP Billiton Finance (USA) Ltd Australia Finance 100 100 BHP Billiton Group Operations Pty Ltd Australia Administrative services 100 100 BHP Billiton International Services Ltd UK Service company 100 100 BHP Billiton Nickel West Pty Ltd Australia Nickel mining, smelting, refining
and administrative services100 100
BHP Billiton Shared Services Malaysia Sdn Bhd Malaysia Service company 100 100WMC Finance (USA) Limited Australia Finance 100 100
(a) The Group divested its 100 per cent effective interest in BHP Navajo Coal Company (‘Navajo’) in December 2013. However, as BHP Billiton controls the Navajo mine until full consideration is received from the buyer, the financial results of the Navajo mine are consolidated by the Group. The divestment of Navajo Coal completed on 29 July 2016 and will be recognised in FY2017. BHP Billiton will continue to manage Navajo Coal in accordance with the Mine Management Agreement until 31 December 2016.
(b) As the Group has the ability to direct the relevant activities at Minera Escondida Limitada, it has control over the entity. The assessment of the most relevant activity in this contractual arrangement is subject to judgement. The Group establishes the mine plan and the operating budget and has the ability to appoint the key management personnel, demonstrating that the Group has the existing rights to direct the relevant activities of Minera Escondida Limitada.
(c) The Group has an effective interest of 92.5 per cent in BHP Iron Ore (Jimblebar) Pty Ltd; however, by virtue of the shareholder agreement with ITOCHU Minerals & Energy of Australia Pty Ltd and Mitsui & Co. Iron Ore Exploration & Mining Pty Ltd, the Group’s interest in the Jimblebar mining operation is 85 per cent, which is consistent with the other respective contractual arrangements at Western Australia Iron Ore.
28 Investments accounted for using the equity methodThe Group’s interests in equity accounted investments with the most significant contribution to the Group’s net profit or net assets are listed below. For a complete list of the Group’s associates and joint ventures refer to section 5.2.12.
Ownership interest
Shareholdings in associates and joint ventures
Country of incorporation/ principal place of business
Associate orjoint venture Principal activity Reporting date
2016 %
2015 %
Carbones del Cerrejón LLC (Cerrejón) Anguilla/Colombia Associate Coal mining in Colombia 31 December 33.33 33.33Compañía Minera Antamina S.A. (Antamina) Peru Associate Copper and zinc mining 31 December 33.75 33.75Samarco Mineração S.A. (Samarco) Brazil Joint venture Iron ore mining 31 December 50.00 50.00
Voting in relation to relevant activities in Antamina and Cerrejón, determined to be the approval of the operating and capital budgets, does not require unanimous consent of all participants to the arrangement, therefore joint control does not exist. Instead, because the Group has the power to participate in the financial and operating policies of the investee, these investments are accounted for as associates.
Samarco is jointly owned by BHP Billiton Brasil Ltda (BHP Billiton Brasil) and Vale S.A. (Vale). As the Samarco entity has the rights to the assets and obligations to the liabilities relating to the joint arrangement and not its owners, this investment is accounted for as a joint venture.
The Group is restricted in its ability to make dividend payments from its investments in associates and joint ventures as any such payments require the approval of all investors in the associates and joint ventures. The ownership interest at the Group’s and the associates’ or joint ventures’ reporting dates are the same. When the annual financial reporting date is different to the Group’s, financial information is obtained as at 30 June in order to report on an annual basis consistent with the Group’s reporting date.
6 Additional inform
ation7
Shareholder information
5Financial Statem
ents
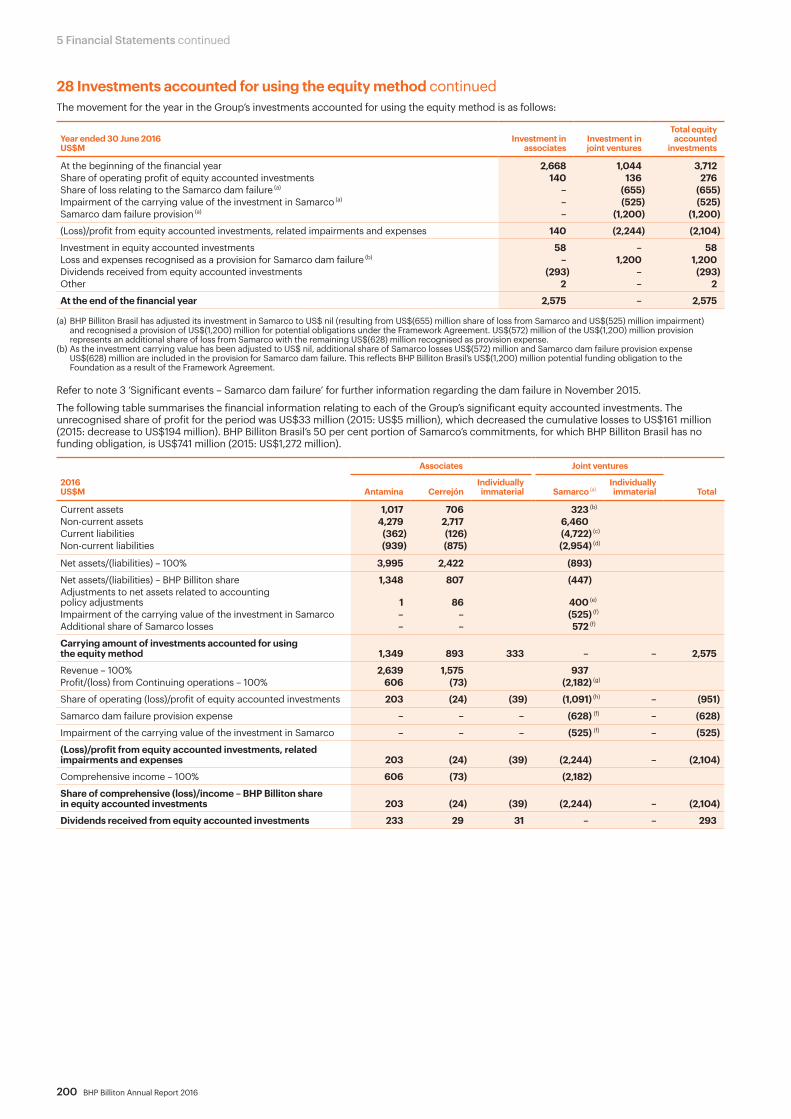
200 BHP Billiton Annual Report 2016
5 Financial Statements continued
28 Investments accounted for using the equity method continuedThe movement for the year in the Group’s investments accounted for using the equity method is as follows:
Year ended 30 June 2016US$M
Investment in associates
Investment in joint ventures
Total equity accounted
investments
At the beginning of the financial year 2,668 1,044 3,712Share of operating profit of equity accounted investments 140 136 276Share of loss relating to the Samarco dam failure (a) – (655) (655)Impairment of the carrying value of the investment in Samarco (a) – (525) (525)Samarco dam failure provision (a) – (1,200) (1,200)
(Loss)/profit from equity accounted investments, related impairments and expenses 140 (2,244) (2,104)
Investment in equity accounted investments 58 – 58Loss and expenses recognised as a provision for Samarco dam failure (b) – 1,200 1,200Dividends received from equity accounted investments (293) – (293)Other 2 – 2
At the end of the financial year 2,575 – 2,575
(a) BHP Billiton Brasil has adjusted its investment in Samarco to US$ nil (resulting from US$(655) million share of loss from Samarco and US$(525) million impairment) and recognised a provision of US$(1,200) million for potential obligations under the Framework Agreement. US$(572) million of the US$(1,200) million provision represents an additional share of loss from Samarco with the remaining US$(628) million recognised as provision expense.
(b) As the investment carrying value has been adjusted to US$ nil, additional share of Samarco losses US$(572) million and Samarco dam failure provision expense US$(628) million are included in the provision for Samarco dam failure. This reflects BHP Billiton Brasil’s US$(1,200) million potential funding obligation to the Foundation as a result of the Framework Agreement.
Refer to note 3 ‘Significant events – Samarco dam failure’ for further information regarding the dam failure in November 2015.
The following table summarises the financial information relating to each of the Group’s significant equity accounted investments. The unrecognised share of profit for the period was US$33 million (2015: US$5 million), which decreased the cumulative losses to US$161 million (2015: decrease to US$194 million). BHP Billiton Brasil’s 50 per cent portion of Samarco’s commitments, for which BHP Billiton Brasil has no funding obligation, is US$741 million (2015: US$1,272 million).
Associates Joint ventures
2016 US$M Antamina Cerrejón
Individually immaterial Samarco (a)
Individually immaterial Total
Current assets 1,017 706 323 (b)
Non-current assets 4,279 2,717 6,460Current liabilities (362) (126) (4,722) (c)
Non-current liabilities (939) (875) (2,954) (d)
Net assets/(liabilities) – 100% 3,995 2,422 (893)
Net assets/(liabilities) – BHP Billiton share 1,348 807 (447)Adjustments to net assets related to accounting policy adjustments 1 86 400 (e)
Impairment of the carrying value of the investment in Samarco – – (525) (f)
Additional share of Samarco losses – – 572 (f)
Carrying amount of investments accounted for using the equity method 1,349 893 333 – – 2,575
Revenue – 100% 2,639 1,575 937Profit/(loss) from Continuing operations – 100% 606 (73) (2,182) (g)
Share of operating (loss)/profit of equity accounted investments 203 (24) (39) (1,091) (h) – (951)
Samarco dam failure provision expense – – – (628) (f) – (628)
Impairment of the carrying value of the investment in Samarco – – – (525) (f) – (525)
(Loss)/profit from equity accounted investments, related impairments and expenses 203 (24) (39) (2,244) – (2,104)
Comprehensive income – 100% 606 (73) (2,182)
Share of comprehensive (loss)/income – BHP Billiton share in equity accounted investments 203 (24) (39) (2,244) – (2,104)
Dividends received from equity accounted investments 233 29 31 – – 293
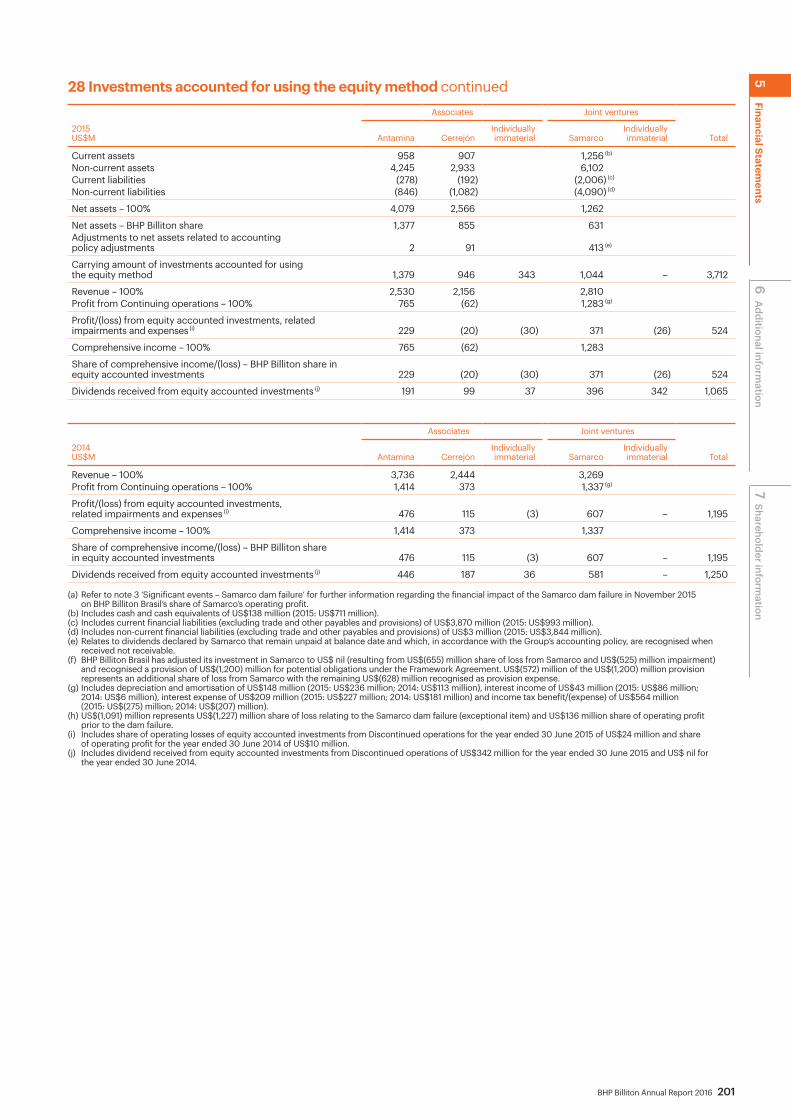
BHP Billiton Annual Report 2016 201
28 Investments accounted for using the equity method continuedAssociates Joint ventures
2015 US$M Antamina Cerrejón
Individually immaterial Samarco
Individually immaterial Total
Current assets 958 907 1,256 (b)
Non-current assets 4,245 2,933 6,102Current liabilities (278) (192) (2,006) (c)
Non-current liabilities (846) (1,082) (4,090) (d)
Net assets – 100% 4,079 2,566 1,262
Net assets – BHP Billiton share 1,377 855 631Adjustments to net assets related to accounting policy adjustments 2 91 413 (e)
Carrying amount of investments accounted for using the equity method 1,379 946 343 1,044 – 3,712
Revenue – 100% 2,530 2,156 2,810Profit from Continuing operations – 100% 765 (62) 1,283 (g)
Profit/(loss) from equity accounted investments, related impairments and expenses (i) 229 (20) (30) 371 (26) 524
Comprehensive income – 100% 765 (62) 1,283
Share of comprehensive income/(loss) – BHP Billiton share in equity accounted investments 229 (20) (30) 371 (26) 524
Dividends received from equity accounted investments (j) 191 99 37 396 342 1,065
Associates Joint ventures
2014 US$M Antamina Cerrejón
Individually immaterial Samarco
Individually immaterial Total
Revenue – 100% 3,736 2,444 3,269 Profit from Continuing operations – 100% 1,414 373 1,337 (g)
Profit/(loss) from equity accounted investments, related impairments and expenses (i) 476 115 (3) 607 – 1,195
Comprehensive income – 100% 1,414 373 1,337
Share of comprehensive income/(loss) – BHP Billiton share in equity accounted investments 476 115 (3) 607 – 1,195
Dividends received from equity accounted investments (j) 446 187 36 581 – 1,250
(a) Refer to note 3 ‘Significant events – Samarco dam failure’ for further information regarding the financial impact of the Samarco dam failure in November 2015 on BHP Billiton Brasil’s share of Samarco’s operating profit.
(b) Includes cash and cash equivalents of US$138 million (2015: US$711 million).(c) Includes current financial liabilities (excluding trade and other payables and provisions) of US$3,870 million (2015: US$993 million).(d) Includes non-current financial liabilities (excluding trade and other payables and provisions) of US$3 million (2015: US$3,844 million).(e) Relates to dividends declared by Samarco that remain unpaid at balance date and which, in accordance with the Group’s accounting policy, are recognised when
received not receivable.(f) BHP Billiton Brasil has adjusted its investment in Samarco to US$ nil (resulting from US$(655) million share of loss from Samarco and US$(525) million impairment)
and recognised a provision of US$(1,200) million for potential obligations under the Framework Agreement. US$(572) million of the US$(1,200) million provision represents an additional share of loss from Samarco with the remaining US$(628) million recognised as provision expense.
(g) Includes depreciation and amortisation of US$148 million (2015: US$236 million; 2014: US$113 million), interest income of US$43 million (2015: US$86 million; 2014: US$6 million), interest expense of US$209 million (2015: US$227 million; 2014: US$181 million) and income tax benefit/(expense) of US$564 million (2015: US$(275) million; 2014: US$(207) million).
(h) US$(1,091) million represents US$(1,227) million share of loss relating to the Samarco dam failure (exceptional item) and US$136 million share of operating profit prior to the dam failure.
(i) Includes share of operating losses of equity accounted investments from Discontinued operations for the year ended 30 June 2015 of US$24 million and share of operating profit for the year ended 30 June 2014 of US$10 million.
(j) Includes dividend received from equity accounted investments from Discontinued operations of US$342 million for the year ended 30 June 2015 and US$ nil for the year ended 30 June 2014.
6 Additional inform
ation7
Shareholder information
5Financial Statem
ents
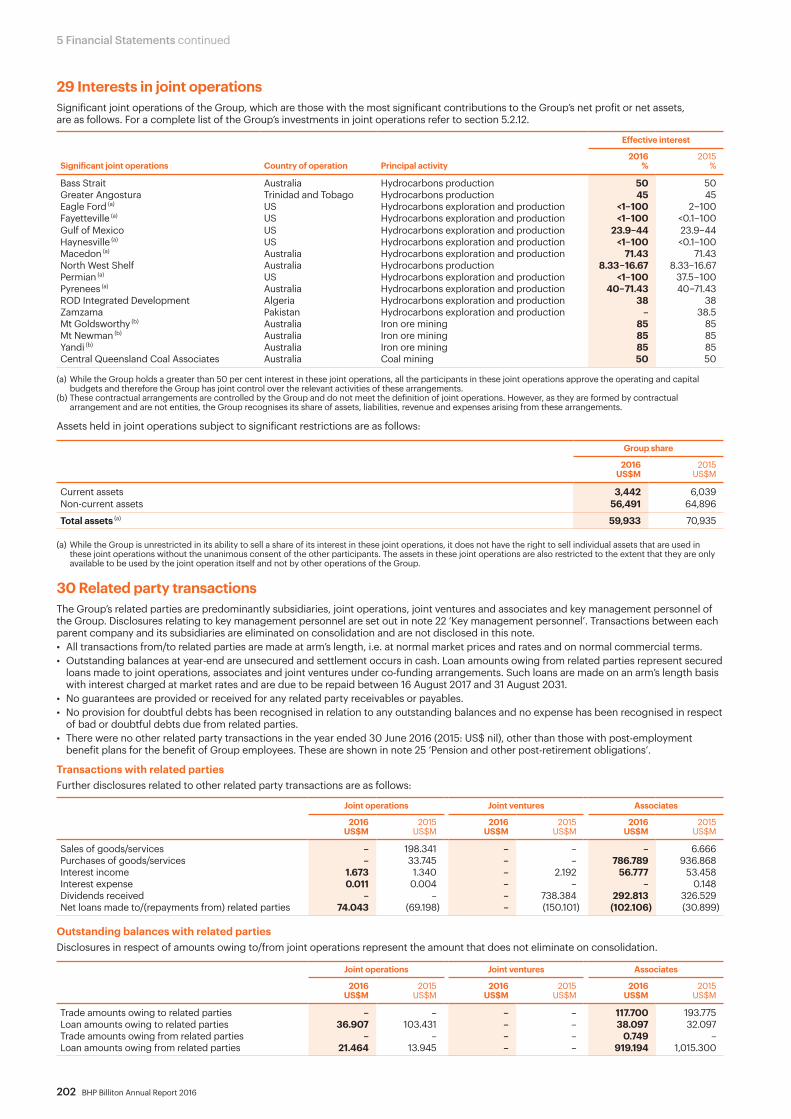
202 BHP Billiton Annual Report 2016
5 Financial Statements continued
29 Interests in joint operationsSignificant joint operations of the Group, which are those with the most significant contributions to the Group’s net profit or net assets, are as follows. For a complete list of the Group’s investments in joint operations refer to section 5.2.12.
Effective interest
Significant joint operations Country of operation Principal activity2016
%2015
%
Bass Strait Australia Hydrocarbons production 50 50Greater Angostura Trinidad and Tobago Hydrocarbons production 45 45Eagle Ford (a) US Hydrocarbons exploration and production <1–100 2–100Fayetteville (a) US Hydrocarbons exploration and production <1–100 <0.1–100Gulf of Mexico US Hydrocarbons exploration and production 23.9–44 23.9–44Haynesville (a) US Hydrocarbons exploration and production <1–100 <0.1–100Macedon (a) Australia Hydrocarbons exploration and production 71.43 71.43North West Shelf Australia Hydrocarbons production 8.33–16.67 8.33–16.67Permian (a) US Hydrocarbons exploration and production <1–100 37.5–100Pyrenees (a) Australia Hydrocarbons exploration and production 40–71.43 40–71.43ROD Integrated Development Algeria Hydrocarbons exploration and production 38 38Zamzama Pakistan Hydrocarbons exploration and production – 38.5Mt Goldsworthy (b) Australia Iron ore mining 85 85Mt Newman (b) Australia Iron ore mining 85 85Yandi (b) Australia Iron ore mining 85 85Central Queensland Coal Associates Australia Coal mining 50 50
(a) While the Group holds a greater than 50 per cent interest in these joint operations, all the participants in these joint operations approve the operating and capital budgets and therefore the Group has joint control over the relevant activities of these arrangements.
(b) These contractual arrangements are controlled by the Group and do not meet the definition of joint operations. However, as they are formed by contractual arrangement and are not entities, the Group recognises its share of assets, liabilities, revenue and expenses arising from these arrangements.
Assets held in joint operations subject to significant restrictions are as follows:
Group share
2016US$M
2015US$M
Current assets 3,442 6,039Non-current assets 56,491 64,896
Total assets (a) 59,933 70,935
(a) While the Group is unrestricted in its ability to sell a share of its interest in these joint operations, it does not have the right to sell individual assets that are used in these joint operations without the unanimous consent of the other participants. The assets in these joint operations are also restricted to the extent that they are only available to be used by the joint operation itself and not by other operations of the Group.
30 Related party transactions The Group’s related parties are predominantly subsidiaries, joint operations, joint ventures and associates and key management personnel of the Group. Disclosures relating to key management personnel are set out in note 22 ‘Key management personnel’. Transactions between each parent company and its subsidiaries are eliminated on consolidation and are not disclosed in this note.• All transactions from/to related parties are made at arm’s length, i.e. at normal market prices and rates and on normal commercial terms.• Outstanding balances at year-end are unsecured and settlement occurs in cash. Loan amounts owing from related parties represent secured
loans made to joint operations, associates and joint ventures under co-funding arrangements. Such loans are made on an arm’s length basis with interest charged at market rates and are due to be repaid between 16 August 2017 and 31 August 2031.
• No guarantees are provided or received for any related party receivables or payables. • No provision for doubtful debts has been recognised in relation to any outstanding balances and no expense has been recognised in respect
of bad or doubtful debts due from related parties.• There were no other related party transactions in the year ended 30 June 2016 (2015: US$ nil), other than those with post-employment
benefit plans for the benefit of Group employees. These are shown in note 25 ‘Pension and other post-retirement obligations’.
Transactions with related partiesFurther disclosures related to other related party transactions are as follows:
Joint operations Joint ventures Associates
2016
US$M2015
US$M2016
US$M2015
US$M2016
US$M2015
US$M
Sales of goods/services – 198.341 – – – 6.666Purchases of goods/services – 33.745 – – 786.789 936.868Interest income 1.673 1.340 – 2.192 56.777 53.458Interest expense 0.011 0.004 – – – 0.148Dividends received – – – 738.384 292.813 326.529Net loans made to/(repayments from) related parties 74.043 (69.198) – (150.101) (102.106) (30.899)
Outstanding balances with related partiesDisclosures in respect of amounts owing to/from joint operations represent the amount that does not eliminate on consolidation.
Joint operations Joint ventures Associates
2016
US$M2015
US$M2016
US$M2015
US$M2016
US$M2015
US$M
Trade amounts owing to related parties – – – – 117.700 193.775Loan amounts owing to related parties 36.907 103.431 – – 38.097 32.097Trade amounts owing from related parties – – – – 0.749 –Loan amounts owing from related parties 21.464 13.945 – – 919.194 1,015.300

BHP Billiton Annual Report 2016 203
Unrecognised items and uncertain events
31 CommitmentsThe Group’s commitments for capital expenditure were US$1,737 million as at 30 June 2016 (2015: US$2,276 million). The Group’s other commitments are as follows:
Commitments under finance leases
Commitments underoperating leases
2016 US$M
2015 US$M
2016 US$M
2015 US$M
Due not later than one year 49 138 371 606Due later than one year and not later than five years 221 222 888 864Due later than five years 115 166 887 898
Total 385 526 2,146 2,368
Future financing liability (39) (57)Right to reimbursement from joint operations partner – (31)
Finance lease liability 346 438
Finance leases include leases of power generation and transmission assets. Certain lease payments may be subject to inflation escalation clauses on which contingent rentals are determined. The leases contain extension and renewal options.
Operating leases include leases of property, plant and equipment. Rental payments are generally fixed, but with inflation escalation clauses on which contingent rentals are determined. Certain leases contain extension and renewal options.
32 Contingent liabilities2016
US$M2015
US$M
Associates and joint ventures Tax and other matters (a) 1,508 1,313Subsidiaries and joint operationsTax and other matters (a) 1,933 1,947Bank guarantees 1 3
Total 3,442 3,263
(a) There are a number of matters, for which it is not possible at this time to provide a range of possible outcomes or a reliable estimate of potential future exposures, and for which no amounts have been included in the table above.
A contingent liability is a possible obligation arising from past events and whose existence will be confirmed only by occurrence or non-occurrence of one or more uncertain future events not wholly within the control of the Group. A contingent liability may also be a present obligation arising from past events but is not recognised on the basis that an outflow of economic resources to settle the obligation is not viewed as probable, or the amount of the obligation cannot be reliably measured.
When the Group has a present obligation, an outflow of economic resources is assessed as probable and the Group can reliably measure the obligation, a provision is recognised.
The Group presently has tax matters, litigation and other claims, for which the timing of resolution and potential economic outflow are uncertain. Obligations assessed as having probable future economic outflows capable of reliable measurement are provided at reporting date and matters assessed as having possible future economic outflows capable of reliable measurement are included in the total amount of contingent liabilities above. Individually significant matters, including narrative on potential future exposures incapable of reliable measurement, are disclosed below, to the extent that disclosure does not prejudice the Group.
Uncertain tax and royalty matters
The Group is subject to a range of tax and royalty matters across many jurisdictions. Changes in tax law, changes in interpretation of tax law, periodic challenges and disagreements with tax authorities, and legal proceedings result in uncertainty of the outcome of tax and royalty matters. Areas of uncertainty at reporting date include the Group’s cross-border operations and transactions, including transfer pricing estimates.Details of uncertain tax and royalty matters have been disclosed in note 5 ‘Income tax expense’. To the extent uncertain tax and royalty matters give rise to a contingent liability, an estimate of the potential liability is included within the table above, where it is capable of reliable measurement.
Samarco contingent liabilities
The table above includes contingent liabilities related to the Group’s equity accounting investment in Samarco to the extent they are capable of reliable measurement. Details of contingent liabilities related to Samarco are disclosed in note 3 ‘Significant events – Samarco dam failure’.
Demerger of South32
As part of the demerger of South32 Limited (South32) in May 2015, certain indemnities were agreed as part of the Separation Deed. Subject to certain exceptions, BHP Billiton Limited indemnifies South32 against all claims and liabilities relating to the BHP Billiton Businesses and former BHP Billiton Businesses prior to the demerger and South32 indemnifies the Group against all claims and liabilities relating to the South32 Businesses and former South32 Businesses. No significant claims have been made pursuant to the Separation Deed as at 30 June 2016.
Investigation by the Australian Federal Police
As previously disclosed, the Australian Federal Police (AFP) announced an investigation in 2013, which relates to Division 70 of the Commonwealth Criminal Code. The investigation is ongoing and the Group continues to cooperate. In light of the continuing nature of the investigation, it is not appropriate at this stage for BHP Billiton to predict outcomes and therefore no amount is included in the table above.
Bank guarantees The Group has entered into various counter-indemnities of bank and performance guarantees related to its own future performance, which are in the normal course of business.
6 Additional inform
ation7
Shareholder information
5Financial Statem
ents

204 BHP Billiton Annual Report 2016
5 Financial Statements continued
33 Subsequent eventsCessation of the Caroona Coal ProjectAs announced on 11 August 2016, the Group has agreed with the New South Wales Government to cease progression of the Caroona Coal Project and will receive A$220 million (approximately US$170 million) due to cancellation of the related exploration licence.
Partial divestment of Scarborough interestsOn 5 September 2016, the Group announced it had signed an agreement to divest 50 per cent of its interest in the undeveloped Scarborough area gas fields to Woodside Energy Limited. The sale is subject to a number of conditions precedent, including joint venture partner pre-emption rights and regulatory approvals.
The consideration would comprise US$250 million cash on completion and a further US$150 million should the Scarborough field proceed to development.
Other than the matters outlined above or elsewhere in this financial information, no matters or circumstances have arisen since the end of the financial year that have significantly affected, or may significantly affect, the operations, results of operations or state of affairs of the Group in subsequent accounting periods.
Other items
34 Acquisitions and disposals of subsidiaries, operations, joint operations and equity accounted investmentsAcquisitionsThere were no acquisitions made during the years ended 30 June 2016, 2015 and 2014.
DivestmentsExcluding Discontinued operations, the Group disposed of the following subsidiaries, operations, joint operations and equity accounted investments during the year ended:
30 June 2016• Pakistan gas business • San Juan Mine
30 June 2015• North Louisiana conventional onshore assets• Pecos field
30 June 2014• Pinto Valley and San Manuel Arizona Railroad Company• Liverpool Bay• South Midland (Onshore US – Midland Basin)• Kelar S.A.
2016US$M
2015 US$M
2014 US$M
Net assets disposed 153 241 145Gross cash consideration 168 256 812Less cash and cash equivalents disposed (2) – –
Total consideration 166 256 812
Other effects (a) 1 – 6
Net gain on disposal 14 15 673
(a) Other effects include deferred consideration of US$1 million for 30 June 2016 (2015: US$ nil; 2014: US$6 million).
Sale of non-controlling interests in subsidiariesThere was no sale of interests in subsidiaries to non-controlling interests (NCI) for the years ending 30 June 2016 and 30 June 2015.
For the year ending 30 June 2014, the Group announced on 20 June 2013 an extension of its long-term WAIO contractual arrangement with ITOCHU Corporation (ITOCHU) and Mitsui & Co., Ltd. (Mitsui). The transaction was completed on 10 July 2013 and aligned interests across the WAIO supply chain. Under the terms of the agreement, ITOCHU and Mitsui purchased shares in BHP Iron Ore (Jimblebar) Pty Ltd providing them with an eight per cent and seven per cent NCI, respectively, in the Jimblebar mining hub and resource. The equity proceeds of US$1,337 million are included in the ‘Contributions from non-controlling interests’ item of the Consolidated Cash Flow Statement. The difference of US$971 million between the equity proceeds and the initial measurement of NCI of US$366 million is included in the NCI contribution reserve.

BHP Billiton Annual Report 2016 205
35 Auditor’s remuneration 2016
US$M2015
US$M2014
US$M
Fees payable to the Group’s auditors for assurance services Audit of the Group’s Annual Report 3.126 4.299 4.093Audit of subsidiaries, joint ventures and associates 7.715 11.185 13.201Audit-related assurance services 3.493 5.377 5.635Other assurance services 1.508 1.557 2.133
Total assurance services 15.842 22.418 25.062
Fees payable to the Group’s auditors for other servicesOther services relating to corporate finance 0.276 6.871 1.820All other services 0.815 1.093 1.573
Total other services 1.091 7.964 3.393
Total fees 16.933 30.382 28.455
All amounts were paid to KPMG or KPMG affiliated firms. Fees are determined in local currencies and are predominantly billed in US dollars based on the exchange rate at the beginning of the relevant financial year.
Fees payable to the Group’s auditors for assurance services For all periods disclosed, no fees are payable in respect of the audit of pension funds.
Audit-related assurance services comprise review of half-year reports and audit work in relation to compliance with section 404 of the US Sarbanes-Oxley Act.
Other assurance services comprise assurance in respect of the Group’s sustainability reporting.
Fees payable to the Group’s auditors for other services Other services relating to corporate finance comprise services in connection with acquisitions, divestments, the South32 demerger and debt raising transactions.
All other services comprise non-statutory assurance based procedures, advice on accounting matters, as well as tax compliance services of US$0.089 (2015: US$ nil; 2014: US$0.008 million).
36 BHP Billiton Limited BHP Billiton Limited does not present unconsolidated parent company Financial Statements. Selected financial information of the BHP Billiton Limited parent company is as follows:
2016US$M
2015US$M
Income statement information for the financial year Profit after taxation for the year 4,811 8,356Total comprehensive income 4,826 8,217Balance sheet information as at the end of the financial yearCurrent assets 9,976 8,860Total assets 48,000 47,925Current liabilities 1,476 2,046Total liabilities 1,838 2,122Share capital 898 898Treasury shares (7) (19)Reserves 251 273Retained earnings 45,020 44,651Total equity 46,162 45,803
Parent company guaranteesBHP Billiton Limited has guaranteed certain financing arrangements available to subsidiaries of US$15,316 million at 30 June 2016 (2015: US$11,948 million).
Under the terms of a Deed Poll Guarantee, the Company has guaranteed certain current and future liabilities of BHP Billiton Plc. The guaranteed liabilities at 30 June 2016 amounted to US$13 million (2015: US$16 million).
BHP Billiton Limited and BHP Billiton Plc have severally, fully and unconditionally guaranteed the payment of the principal and premium, if any, and interest, including certain additional amounts that may be payable in respect of the notes issued by 100 per cent owned finance subsidiary, BHP Billiton Finance (USA) Ltd. BHP Billiton Limited and BHP Billiton Plc have guaranteed the payment of such amounts when they become due and payable, whether on an interest payment date, at the stated maturity of the notes, by declaration or acceleration, call for redemption or otherwise. The guaranteed liabilities at 30 June 2016 amounted to US$16,000 million (2015: US$13,500 million). In addition, BHP Billiton Limited and BHP Billiton Plc have severally guaranteed a Group Revolving Credit Facility of US$6,000 million (2015: US$6,000 million), which remains undrawn.
6 Additional inform
ation7
Shareholder information
5Financial Statem
ents
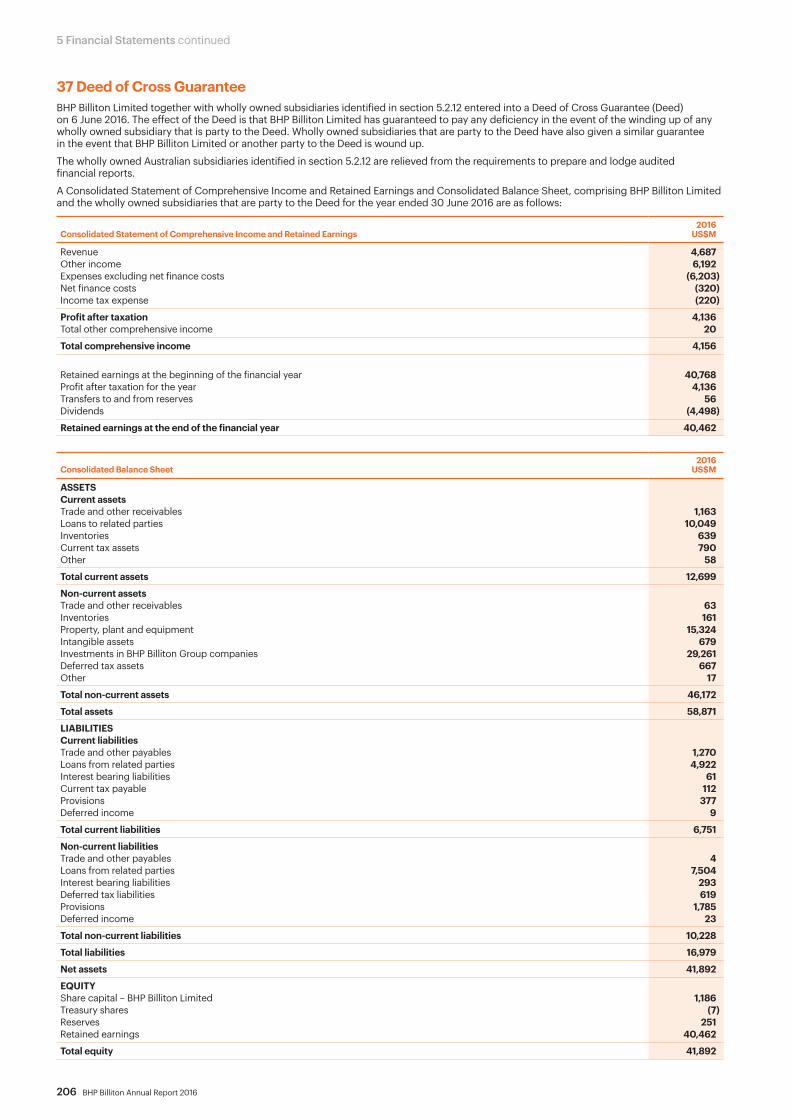
206 BHP Billiton Annual Report 2016
5 Financial Statements continued
37 Deed of Cross GuaranteeBHP Billiton Limited together with wholly owned subsidiaries identified in section 5.2.12 entered into a Deed of Cross Guarantee (Deed) on 6 June 2016. The effect of the Deed is that BHP Billiton Limited has guaranteed to pay any deficiency in the event of the winding up of any wholly owned subsidiary that is party to the Deed. Wholly owned subsidiaries that are party to the Deed have also given a similar guarantee in the event that BHP Billiton Limited or another party to the Deed is wound up.
The wholly owned Australian subsidiaries identified in section 5.2.12 are relieved from the requirements to prepare and lodge audited financial reports.
A Consolidated Statement of Comprehensive Income and Retained Earnings and Consolidated Balance Sheet, comprising BHP Billiton Limited and the wholly owned subsidiaries that are party to the Deed for the year ended 30 June 2016 are as follows:
Consolidated Statement of Comprehensive Income and Retained Earnings2016
US$M
Revenue 4,687Other income 6,192Expenses excluding net finance costs (6,203)Net finance costs (320)Income tax expense (220)
Profit after taxation 4,136Total other comprehensive income 20
Total comprehensive income 4,156
Retained earnings at the beginning of the financial year 40,768Profit after taxation for the year 4,136Transfers to and from reserves 56Dividends (4,498)
Retained earnings at the end of the financial year 40,462
Consolidated Balance Sheet2016
US$M
ASSETSCurrent assetsTrade and other receivables 1,163Loans to related parties 10,049Inventories 639Current tax assets 790Other 58
Total current assets 12,699
Non-current assetsTrade and other receivables 63Inventories 161Property, plant and equipment 15,324Intangible assets 679Investments in BHP Billiton Group companies 29,261Deferred tax assets 667Other 17
Total non-current assets 46,172
Total assets 58,871
LIABILITIESCurrent liabilitiesTrade and other payables 1,270Loans from related parties 4,922Interest bearing liabilities 61Current tax payable 112Provisions 377Deferred income 9
Total current liabilities 6,751
Non-current liabilitiesTrade and other payables 4Loans from related parties 7,504Interest bearing liabilities 293Deferred tax liabilities 619Provisions 1,785Deferred income 23
Total non-current liabilities 10,228
Total liabilities 16,979
Net assets 41,892
EQUITYShare capital – BHP Billiton Limited 1,186Treasury shares (7)Reserves 251Retained earnings 40,462
Total equity 41,892

BHP Billiton Annual Report 2016 207
38 New and amended accounting standards and interpretations issued but not yet effectiveThere are no new accounting standards or interpretations that have been adopted for the first time in these Financial Statements. The following new accounting standards are not yet effective, but may have an impact on the Group in financial years commencing on or after 1 July 2016:
Title of standard Summary of impact on the Financial StatementsApplication date of standard
Application date for the financial year commencing
IFRS 15/AASB 15 ‘Revenue from Contracts with Customers’
This standard modifies the determination of when to recognise revenue and how much revenue to recognise. The core principle is that an entity recognises revenue to depict the transfer of promised goods and services to the customer of an amount that reflects the consideration to which the entity expects to be entitled in exchange for those goods or services.
1 January 2018 1 July 2018
IFRS 9/AASB 9 ‘Financial Instruments’
This standard modifies the classification and measurement of financial assets. It includes:• a single, principles-based approach for the classification of financial assets,
which is driven by cash flow characteristics and the business model in which an asset is held;
• a new expected loss impairment model requiring expected losses to be recognised when financial instruments are first recognised;
• a modification of hedge accounting to align the accounting treatment with risk management practices of an entity.
1 January 2018 1 July 2018
IFRS 16/AASB 16 ‘Leases’ This standard requires lessees to account for all leases under a single on-balance sheet model. Under the new standard, a lessee is required to recognise all lease assets and liabilities on the balance sheet; recognise amortisation of leased assets and interest on lease liabilities over the lease term; and separately present the principal amount of cash paid and interest in the cash flow statement.
1 January 2019 1 July 2019
The Group is currently in the process of determining the potential impact of adopting the above standards. These standards have not been applied in the preparation of these Financial Statements. IFRS 15, IFRS 9 and IFRS 16 have not been endorsed by the EU and hence are not available for early adoption in the EU.
39 Reserve estimatesReserves are estimates of the amount of product that can be economically and legally extracted from the Group’s properties. In order to estimate reserves, estimates are required for a range of geological, technical and economic factors, including quantities, grades, production techniques, recovery rates, production costs, transport costs, commodity demand, commodity prices and exchange rates.
Estimating the quantity and/or grade of reserves requires the size, shape and depth of ore bodies or fields to be determined by analysing geological data such as drilling samples. This process may require complex and difficult geological judgements to interpret the data.
Additional information on the Group’s mineral and oil and gas reserves and resources can be viewed within section 6.3.
How reserves are estimated(i) Mineral reservesThe Group determines and reports ore reserves in Australia and the United Kingdom under the principles incorporated in the Australasian Code for Reporting of Exploration Results, Mineral Resources and Ore Reserves December 2012 known as the JORC Code, and the Australian Securities Exchange (ASX) Listing Rules 2014 for minerals. The JORC Code requires the use of reasonable investment assumptions when reporting reserves. As a result, management will form a view of forecast sales prices, based on current and long-term historical average price trends. For example, if current prices remain above long-term historical averages for an extended period of time, management may assume that lower prices will prevail in the future and as a result, those lower prices are used to estimate reserves under the JORC Code. Lower price assumptions generally result in lower estimates of reserves.
Reserve reporting requirements for SEC filings in the United States are specified in Industry Guide 7, with economic assumptions based on current economic conditions that may differ to the JORC Code’s reasonable investment assumptions. Accordingly, a SEC pricing assumptions test is performed with reserve estimates derived under JORC compared to those derived assuming ‘current economic conditions’. Reserves disclosed in the United States will differ only if the SEC pricing assumption test indicates reserves lower than those reported under JORC in Australia and the United Kingdom.
(ii) Oil and gas reservesOil and gas reserves reported in Australia, the United Kingdom, and the United States for SEC filing purposes, are based on the average of prices prevailing on the first day of each month for the past 12 months as required under the SEC Rules ‘Modernisation of Oil & Gas Reporting’.
Reserve impact on financial reportingEstimates of reserves may change from period-to-period as the economic assumptions used to estimate reserves change and additional geological data is generated during the course of operations. Changes in reported reserves may affect the Group’s financial results and financial position in a number of ways, including:• Asset carrying values may be affected due to changes in estimated
future production levels;• Depreciation, depletion and amortisation charged in the income
statement may change where such charges are determined on the units of production basis, or where the useful economic lives of assets change;
• Overburden removal costs recorded on the balance sheet or charged to the income statement may change due to changes in stripping ratios or the units of production basis of depreciation;
• Decommissioning, site restoration and environmental provisions may change where changes in estimated reserves affect expectations about the timing or cost of these activities;
• The carrying amount of deferred tax assets may change due to changes in estimates of the likely recovery of the tax benefits.
6 Additional inform
ation7
Shareholder information
5Financial Statem
ents
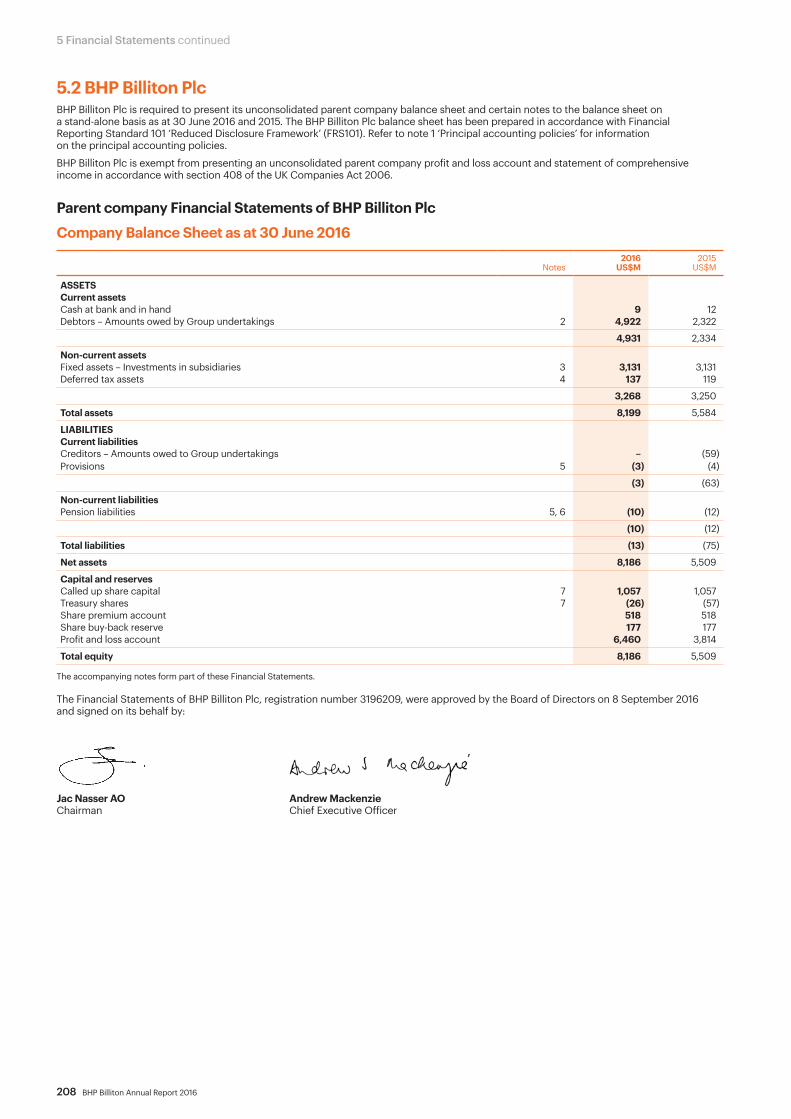
208 BHP Billiton Annual Report 2016
5 Financial Statements continued
5.2 BHP Billiton PlcBHP Billiton Plc is required to present its unconsolidated parent company balance sheet and certain notes to the balance sheet on a stand-alone basis as at 30 June 2016 and 2015. The BHP Billiton Plc balance sheet has been prepared in accordance with Financial Reporting Standard 101 ‘Reduced Disclosure Framework’ (FRS101). Refer to note 1 ‘Principal accounting policies’ for information on the principal accounting policies.
BHP Billiton Plc is exempt from presenting an unconsolidated parent company profit and loss account and statement of comprehensive income in accordance with section 408 of the UK Companies Act 2006.
Parent company Financial Statements of BHP Billiton Plc
Company Balance Sheet as at 30 June 2016
Notes2016
US$M2015
US$M
ASSETSCurrent assetsCash at bank and in hand 9 12Debtors – Amounts owed by Group undertakings 2 4,922 2,322
4,931 2,334
Non-current assetsFixed assets – Investments in subsidiaries 3 3,131 3,131Deferred tax assets 4 137 119
3,268 3,250
Total assets 8,199 5,584
LIABILITIESCurrent liabilitiesCreditors – Amounts owed to Group undertakings – (59)Provisions 5 (3) (4)
(3) (63)
Non-current liabilitiesPension liabilities 5, 6 (10) (12)
(10) (12)
Total liabilities (13) (75)
Net assets 8,186 5,509
Capital and reservesCalled up share capital 7 1,057 1,057Treasury shares 7 (26) (57)Share premium account 518 518Share buy-back reserve 177 177Profit and loss account 6,460 3,814
Total equity 8,186 5,509
The accompanying notes form part of these Financial Statements.
The Financial Statements of BHP Billiton Plc, registration number 3196209, were approved by the Board of Directors on 8 September 2016 and signed on its behalf by:
Jac Nasser AO Andrew Mackenzie Chairman Chief Executive Officer

BHP Billiton Annual Report 2016 209
Company Statement of Changes in Equity for the year ended 30 June 2016
US$MShare
capital Treasury
shares (a)
Share premium account
Share buy-back
reserve
Profit and loss account
Total equity
Balance as at 1 July 2015 1,057 (57) 518 177 3,814 5,509
Profit for the year after taxation – – – – 4,313 4,313Other comprehensive income for the year:Tax on employee entitlements taken to retained earnings – – – – 1 1Actuarial gain on pension scheme – – – – 2 2
Total comprehensive income for the year – – – – 4,316 4,316Transactions with owners:
Dividends – – – – (1,647) (1,647)Accrued employee entitlement for unexercised awards – – – – 8 8Employee share awards exercised net of employee contributions and forfeitures – 31 – – (31) –
Balance as at 30 June 2016 1,057 (26) 518 177 6,460 8,186
Balance as at 1 July 2014 1,069 (534) 518 165 6,217 7,435
Profit for the year after taxation – – – – 4,513 4,513Other comprehensive expense for the year:Actuarial loss on pension scheme – – – – (1) (1)
Total comprehensive income for the year – – – – 4,512 4,512Transactions with owners:
Dividends – – – – (2,617) (2,617)In-specie dividend on demerger – – – – (3,745) (3,745)Shares cancelled (12) 501 – 12 (501) –Purchase of shares by ESOP trusts net of employee contributions – (123) – – – (123)Accrued employee entitlement for unexercised awards – – – – 40 40Employee share awards exercised net of employee contributions and other adjustments – 99 – – (92) 7
Balance as at 30 June 2015 1,057 (57) 518 177 3,814 5,509
(a) Shares held by the Billiton Employee Share Ownership Plan Trust as at 30 June 2016 were 788,540 shares with a market value of US$10 million (2015: 1,738,013 shares with a market value of US$34 million).
The accompanying notes form part of these Financial Statements.
6 Additional inform
ation7
Shareholder information
5Financial Statem
ents

210 BHP Billiton Annual Report 2016
5 Financial Statements continued
1 Principal accounting policiesCompany informationBHP Billiton Plc (the Company) is a public company limited by shares, registered in England and Wales and with a registered office located at Neathouse Place, London SW1V 1LH United Kingdom (UK). The Company has a premium listing on the UK Listing Authority’s Official List and its ordinary shares are admitted to trading on the London Stock Exchange in the UK and have a secondary listing on the Johannesburg Stock Exchange in South Africa.
Basis of preparationThe Company meets the definition of a qualifying entity under Financial Reporting Standard 100 ‘Application of Financial Reporting Requirements’ (FRS 100) as issued by the Financial Reporting Council.
The BHP Billiton Plc Financial Statements are:• unconsolidated Financial Statements of the stand-alone Company.
BHP Billiton Plc is exempt from preparing consolidated accounts by virtue of section 400 of the UK Companies Act 2006;
• prepared in accordance with the provisions of the UK Companies Act 2006;
• presented in accordance with Financial Reporting Standard 101 ‘Reduced Disclosure Framework’ (FRS 101);
• prepared on a going concern basis;• using historical cost principles as modified by the revaluation
of certain financial assets and liabilities in accordance with the UK Companies Act;
• presented in US dollars, which is the functional currency of the Company. Amounts are rounded to the nearest million dollars, unless otherwise stated.
The principal accounting policies applied in the preparation of these Financial Statements are set out below. These have been applied consistently to all periods presented. The following disclosure exemptions have been applied under FRS 101:• Paragraphs 45(b) and 46 to 52 of IFRS 2 ‘Share-based Payment’
(details of number and weighted average exercise price of share options, and how the fair value goods or services received was determined);
• The requirements of IFRS 7 ‘Financial Instruments: Disclosures’;• Paragraphs 91 to 99 of IFRS 13 ‘Fair Value Measurement’ (disclosure
of valuation techniques and inputs used for fair value measurement of assets and liabilities);
• Paragraph 38 of IAS 1 ‘Presentation of Financial Statements’ (comparative financial information in respect of paragraph 79(a)(iv) of IAS 1);
• Disclosure of the following requirements of IAS 1 ‘Presentation of Financial Statements’:
− 10(d) – A statement of cash flows for the period; − 16 – A statement that the Financial Statements are in compliance with all IFRSs;
− 38A – Requirement for a minimum of two primary statements including cash flow statements;
− 38 B-D – Comparative information; − 111 – Cash flow statement information; − 134-136 – Capital management disclosures.
• IAS 7 ‘Statement of Cash Flows’;• Paragraph 30 to 31 of IAS 8 ‘Accounting Policies and Changes
in Accounting Estimates and Errors’ (disclosure of information when an entity has not applied a new IFRS that has been issued and is not yet effective);
• Paragraph 17 and 18A of IAS 24 ‘Related Party Disclosures’ (key management compensation);
• The requirements of IAS 24 ‘Related Party Disclosure’ (disclosure of related party transactions entered into between two or more members of a group).
Explanation of transition to FRS 101For all periods up to 30 June 2015, the Company prepared its Financial Statements in accordance with United Kingdom Generally Accepted Accounting Practice (UK GAAP). The Company has transitioned from previous UK GAAP to FRS 101 for all periods presented with the date of transition being 1 July 2014. There were no significant measurement or recognition adjustments for the Company on the adoption of FRS 101.
On adoption of FRS 101, the Company has applied the requirements of paragraphs 6 to 33 of IFRS 1 ‘First-time Adoption of International Financial Reporting Standards’ and applied the following available exemption from the general requirements of IFRS 1:• The carrying value of investments in subsidiaries at date
of transition (the deemed cost on transition to FRS 101) is equal to the carrying value of investments in subsidiaries under previous UK GAAP.
Judgements in applying accounting policies and key sources of estimation uncertaintiesThe preparation of Financial Statements in conformity with FRS 101 requires the use of critical accounting estimates, and requires the application of judgements in application of the Company’s accounting policies. Significant judgements and estimates applied in the preparation of these Financial Statements have been identified and disclosed throughout.
Foreign currenciesThe accounting policy is consistent with the Group’s policy on ‘Foreign currencies’ as set out in 5.1 of the BHP Billiton Group Financial Statements.
Investments in subsidiaries (Group undertakings)Investments in subsidiaries are stated at cost less provisions for impairments. Investments in subsidiaries are reviewed for impairment where events or changes in circumstances indicate that the carrying amount of the investment may not be recoverable.
If any such indication exists, the Company makes an assessment of the recoverable amount. If the asset is determined to be impaired, an impairment loss will be recorded and the asset written down based on the amount by which the asset carrying amount exceeds the higher of fair value less cost of disposal and value in use. An impairment loss is recognised immediately in the income statement.
TaxationThe accounting policy is consistent with the Group’s policy set out in note 5 ‘Income tax expense’ of the BHP Billiton Group Financial Statements.
Key judgements and estimatesJudgement is required to determine the amount of deferred tax assets that are recognised based upon the likely timing and the level of future taxable profits. The Group assesses the recoverability of recognised and unrecognised deferred taxes on a consistent basis, using assumptions and projected cash flows as applied in the Group impairment reviews for associated operations.

BHP Billiton Annual Report 2016 211
1 Principal accounting policies continuedShare-based paymentsThe accounting policy is consistent with the Group’s policy set out in note 23 ‘Employee share ownership plans’ of the BHP Billiton Group Financial Statements and is applied with respect to all rights and options granted over BHP Billiton Plc shares, including those granted to employees of other Group companies. However, the cost of rights and options granted is recovered from subsidiaries of the Group where the participants are employed.
BHP Billiton Plc is the Trust’s sponsoring company and so the Financial Statements of BHP Billiton Plc represent the combined Financial Statements of BHP Billiton Plc and the Trust.
Revenue recognitionInterest income is recognised on an accruals basis using the effective interest method. Dividend income is recognised when the right to receive payment is established typically on declaration by subsidiaries.
Treasury sharesThe consideration paid for the repurchase of BHP Billiton Plc shares which are held as treasury shares is recognised as a reduction in shareholders’ funds and represents a reduction in distributable reserves.
Pension costs and other post-retirement benefitsThe accounting policy is consistent with the Group’s policy set out in note 25 ‘Pension and other post-retirement obligations’ of the BHP Billiton Group Financial Statements.
Financial guaranteesFinancial guarantees issued by BHP Billiton Plc are contracts that require a payment to be made to reimburse the holder for a loss it incurs because the specified debtor fails to comply with the terms of the debt instrument. Financial guarantees are recognised initially as a liability at fair value less transaction costs as appropriate. Subsequently, the liability is measured at the higher of the best estimate of the expenditure required to settle the present obligation at the reporting date and the amount recognised less cumulative amortisation.
2 Debtors2016
US$M 2015
US$M
Amounts owed by Group undertakings 4,922 2,322
Total debtors 4,922 2,322
Comprising:Current 4,922 2,322Non-current – –
The amounts due from group undertakings primarily relate to unsecured receivable balances that are at call.
3 Fixed assets – Investments in subsidiaries2016
US$M2015
US$M
Investments in subsidiaries (Group undertakings):At the beginning and the end of the financial year 3,131 3,131
As at 30 June 2016, BHP Billiton Plc had the following principal subsidiary undertakings:
Company Principal activity Country of incorporationPercentage
shareholding
Carrying value of investment
US$M
BHP Billiton Group Ltd Holding company UK 100% 3,131BHP Billiton Finance Plc Finance company UK 99% 0.1BHP Billiton (AUS) DDS Pty Ltd (a) General finance Australia 100% –
(a) BHP Billiton (AUS) DDS Pty Ltd was incorporated on 20 November 2015. It issued one share of US$10 to BHP Billiton Plc, which is the carrying value of BHP Billiton Plc’s investment as at 30 June 2016.
BHP Billiton Group Ltd, BHP Billiton Finance Plc and BHP Billiton (AUS) DDS Pty Ltd are included in the consolidation of the BHP Billiton Group.
During the year, the Company received dividends of US$2,397 million (2015: US$4,655 million) from BHP Billiton Group Ltd and dividends of US$1,990 million (2015: US$ nil) were received from BHP Billiton (AUS) DDS Pty Ltd. Refer to note 15 ‘Share capital’ of the BHP Billiton Group Financial Statements.
In accordance with section 409 of the UK Companies Act 2006, a full list of related undertakings is disclosed in note 12 ‘Related undertakings of the BHP Billiton Group’.
6 Additional inform
ation7
Shareholder information
5Financial Statem
ents
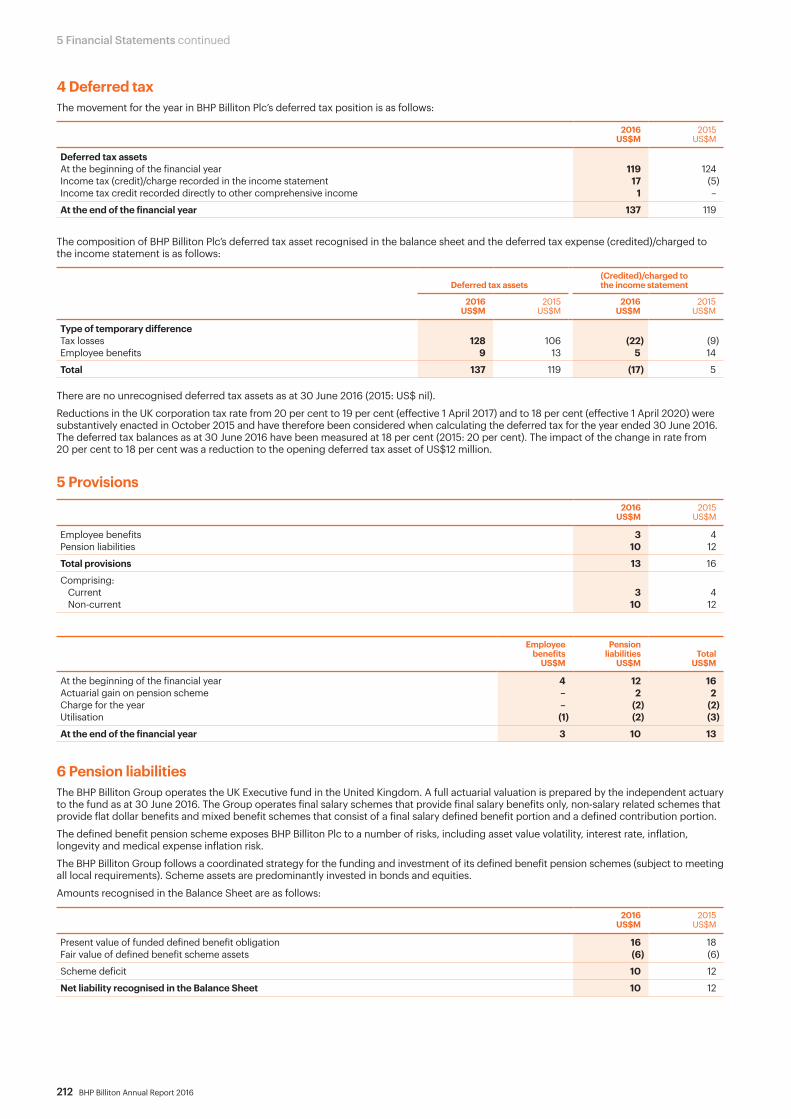
212 BHP Billiton Annual Report 2016
5 Financial Statements continued
4 Deferred taxThe movement for the year in BHP Billiton Plc’s deferred tax position is as follows:
2016 US$M
2015 US$M
Deferred tax assetsAt the beginning of the financial year 119 124Income tax (credit)/charge recorded in the income statement 17 (5)Income tax credit recorded directly to other comprehensive income 1 –
At the end of the financial year 137 119
The composition of BHP Billiton Plc’s deferred tax asset recognised in the balance sheet and the deferred tax expense (credited)/charged to the income statement is as follows:
Deferred tax assets(Credited)/charged tothe income statement
2016US$M
2015US$M
2016US$M
2015US$M
Type of temporary differenceTax losses 128 106 (22) (9)Employee benefits 9 13 5 14
Total 137 119 (17) 5
There are no unrecognised deferred tax assets as at 30 June 2016 (2015: US$ nil).
Reductions in the UK corporation tax rate from 20 per cent to 19 per cent (effective 1 April 2017) and to 18 per cent (effective 1 April 2020) were substantively enacted in October 2015 and have therefore been considered when calculating the deferred tax for the year ended 30 June 2016. The deferred tax balances as at 30 June 2016 have been measured at 18 per cent (2015: 20 per cent). The impact of the change in rate from 20 per cent to 18 per cent was a reduction to the opening deferred tax asset of US$12 million.
5 Provisions 2016
US$M 2015
US$M
Employee benefits 3 4Pension liabilities 10 12
Total provisions 13 16
Comprising:Current 3 4Non-current 10 12
Employee benefits
US$M
Pension liabilities
US$M Total
US$M
At the beginning of the financial year 4 12 16Actuarial gain on pension scheme – 2 2Charge for the year – (2) (2)Utilisation (1) (2) (3)
At the end of the financial year 3 10 13
6 Pension liabilitiesThe BHP Billiton Group operates the UK Executive fund in the United Kingdom. A full actuarial valuation is prepared by the independent actuary to the fund as at 30 June 2016. The Group operates final salary schemes that provide final salary benefits only, non-salary related schemes that provide flat dollar benefits and mixed benefit schemes that consist of a final salary defined benefit portion and a defined contribution portion.
The defined benefit pension scheme exposes BHP Billiton Plc to a number of risks, including asset value volatility, interest rate, inflation, longevity and medical expense inflation risk.
The BHP Billiton Group follows a coordinated strategy for the funding and investment of its defined benefit pension schemes (subject to meeting all local requirements). Scheme assets are predominantly invested in bonds and equities.
Amounts recognised in the Balance Sheet are as follows:
2016 US$M
2015 US$M
Present value of funded defined benefit obligation 16 18Fair value of defined benefit scheme assets (6) (6)
Scheme deficit 10 12
Net liability recognised in the Balance Sheet 10 12
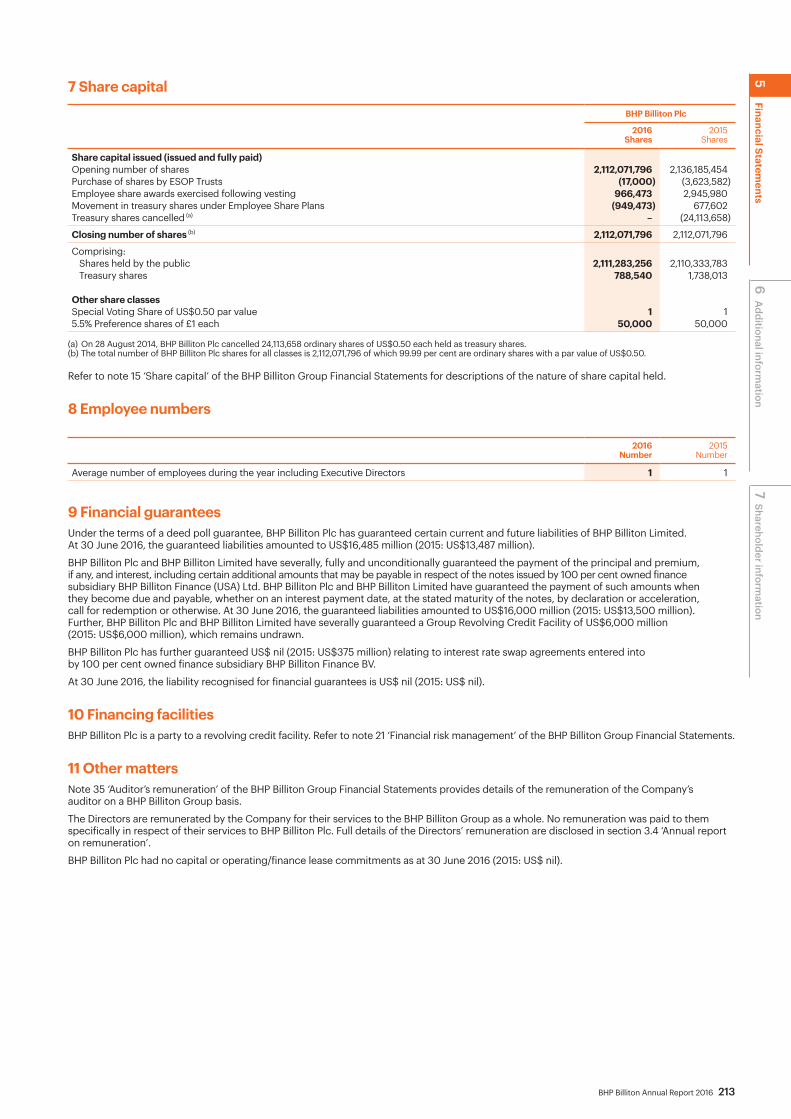
BHP Billiton Annual Report 2016 213
7 Share capital
BHP Billiton Plc
2016Shares
2015Shares
Share capital issued (issued and fully paid)Opening number of shares 2,112,071,796 2,136,185,454Purchase of shares by ESOP Trusts (17,000) (3,623,582)Employee share awards exercised following vesting 966,473 2,945,980Movement in treasury shares under Employee Share Plans (949,473) 677,602Treasury shares cancelled (a) – (24,113,658)
Closing number of shares (b) 2,112,071,796 2,112,071,796
Comprising: Shares held by the public 2,111,283,256 2,110,333,783Treasury shares 788,540 1,738,013
Other share classesSpecial Voting Share of US$0.50 par value 1 15.5% Preference shares of £1 each 50,000 50,000
(a) On 28 August 2014, BHP Billiton Plc cancelled 24,113,658 ordinary shares of US$0.50 each held as treasury shares.(b) The total number of BHP Billiton Plc shares for all classes is 2,112,071,796 of which 99.99 per cent are ordinary shares with a par value of US$0.50.
Refer to note 15 ‘Share capital’ of the BHP Billiton Group Financial Statements for descriptions of the nature of share capital held.
8 Employee numbers
2016 Number
2015 Number
Average number of employees during the year including Executive Directors 1 1
9 Financial guaranteesUnder the terms of a deed poll guarantee, BHP Billiton Plc has guaranteed certain current and future liabilities of BHP Billiton Limited. At 30 June 2016, the guaranteed liabilities amounted to US$16,485 million (2015: US$13,487 million).
BHP Billiton Plc and BHP Billiton Limited have severally, fully and unconditionally guaranteed the payment of the principal and premium, if any, and interest, including certain additional amounts that may be payable in respect of the notes issued by 100 per cent owned finance subsidiary BHP Billiton Finance (USA) Ltd. BHP Billiton Plc and BHP Billiton Limited have guaranteed the payment of such amounts when they become due and payable, whether on an interest payment date, at the stated maturity of the notes, by declaration or acceleration, call for redemption or otherwise. At 30 June 2016, the guaranteed liabilities amounted to US$16,000 million (2015: US$13,500 million). Further, BHP Billiton Plc and BHP Billiton Limited have severally guaranteed a Group Revolving Credit Facility of US$6,000 million (2015: US$6,000 million), which remains undrawn.
BHP Billiton Plc has further guaranteed US$ nil (2015: US$375 million) relating to interest rate swap agreements entered into by 100 per cent owned finance subsidiary BHP Billiton Finance BV.
At 30 June 2016, the liability recognised for financial guarantees is US$ nil (2015: US$ nil).
10 Financing facilitiesBHP Billiton Plc is a party to a revolving credit facility. Refer to note 21 ‘Financial risk management’ of the BHP Billiton Group Financial Statements.
11 Other mattersNote 35 ‘Auditor’s remuneration’ of the BHP Billiton Group Financial Statements provides details of the remuneration of the Company’s auditor on a BHP Billiton Group basis.
The Directors are remunerated by the Company for their services to the BHP Billiton Group as a whole. No remuneration was paid to them specifically in respect of their services to BHP Billiton Plc. Full details of the Directors’ remuneration are disclosed in section 3.4 ‘Annual report on remuneration’.
BHP Billiton Plc had no capital or operating/finance lease commitments as at 30 June 2016 (2015: US$ nil).
6 Additional inform
ation7
Shareholder information
5Financial Statem
ents

214 BHP Billiton Annual Report 2016
5 Financial Statements continued
12 Related undertakings of the BHP Billiton GroupIn accordance with Section 409 of the Companies Act 2006 a full list of related undertakings, the country of incorporation and the effective percentage of equity owned, as at 30 June 2016 is disclosed below. Unless otherwise stated, the share capital disclosed comprises ordinary or common shares which are held by subsidiaries of the BHP Billiton Group. Refer to note 27 ‘Subsidiaries’, note 28 ‘Investments accounted for using the equity method’ and note 29 ‘Interests in joint operations’ of the BHP Billiton Group Financial Statements for undertakings that have a significant contribution to the Group’s net profit or net assets.
Wholly owned subsidiaries (a)
141 Union Company (United States)Albion Downs Pty Ltd (Australia)Araguaia Participações Ltda (Brazil)BHP Billiton (AUS) DDS Pty Ltd (Australia) (x)
BHP Billiton (Towage Services) Pty Ltd (Australia)BHP Billiton (Trinidad) Holdings Ltd (Saint Lucia)BHP Billiton (Trinidad-2C) Ltd (Canada)BHP Billiton (Trinidad-3A) Ltd (Trinidad and Tobago)BHP Billiton (UK) DDS Limited (United Kingdom) (w)
BHP Billiton (UK) Limited (United Kingdom)BHP Billiton Aluminium Australia Pty Ltd (Australia)BHP Billiton Aluminium Limited (United Kingdom)BHP Billiton Aluminium Technologies Limited (Jersey)BHP Billiton Australia UK Finance Limited (British Virgin Islands)BHP Billiton Boliviana de Petroleo Inc. (United States)BHP Billiton Brasil Investimentos de Petróleo Ltda (Brazil)BHP Billiton Brasil Ltda (Brazil)BHP Billiton Canada Inc. (Canada)BHP Billiton Capital Inc. (United States)BHP Billiton Chile Inversiones Ltda (Chile) (k)
BHP Billiton Company BV (Netherlands)BHP Billiton Diamonds (Eurasia) LLC (Russian Federation)BHP Billiton Direct Reduced Iron Pty Ltd (Australia)BHP Billiton Energy Coal Australia Pty Ltd (Australia)BHP Billiton Energy Coal Inc. (United States)BHP Billiton Eurasia BV (Netherlands)BHP Billiton Executive Services Company Pty Ltd (Australia) (w) BHP Billiton Finance (USA) Ltd (Australia) (w)
BHP Billiton Finance BV (Netherlands)BHP Billiton Finance Limited (Australia) (w)
BHP Billiton Finance Plc (United Kingdom) (x)
BHP Billiton Foreign Holdings Inc. (United States)BHP Billiton Foundation (United States)BHP Billiton Freight Singapore Pte Limited (Singapore)BHP Billiton Group Limited (United Kingdom) (x) BHP Billiton Group Operations Pty Ltd (Australia) (z) (aa)
BHP Billiton Holdings Limited (United Kingdom)BHP Billiton Innovation Pty Ltd (Australia) (w) (z)
BHP Billiton International Metals BV (Netherlands)BHP Billiton International Services Limited (United Kingdom)BHP Billiton International Trading (Shanghai) Co. Ltd (China)BHP Billiton Investment Holdings Limited (United Kingdom) (w)
BHP Billiton IO Mining Pty Ltd (Australia)BHP Billiton IO Pilbara Mining Pty Ltd (Australia)BHP Billiton IO Workshop Pty Ltd (Australia)BHP Billiton Iron Ore Holdings Pty Ltd (Australia) (w)
BHP Billiton Iron Ore Pty Ltd (Australia) (w)
BHP Billiton Japan Limited (Japan)BHP Billiton Limited Employee Equity Trust (Jersey)BHP Billiton Lonsdale Investments Pty Ltd (Australia) (w) (z) (aa)
BHP Billiton Marine & General Insurances Pty Ltd (Australia) (w)
BHP Billiton Marketing AG (Switzerland)BHP Billiton Marketing Asia Pte Ltd (Singapore)BHP Billiton Marketing BV (Netherlands)BHP Billiton Marketing Inc. (United States)BHP Billiton Marketing Services India Pvt. Ltd (India)BHP Billiton Marketing UK Limited (United Kingdom) (h)
BHP Billiton MetCoal Holdings Pty Ltd (Australia) (w) (z) (aa) BHP Billiton Mine Management Company (United States)BHP Billiton Minerals Pty Ltd (Australia) (g) (w)
BHP Billiton New Mexico Coal Inc. (United States)
BHP Billiton Nickel Operations Pty Ltd (Australia)BHP Billiton Nickel West Pty Ltd (Australia) (z) (aa) BHP Billiton Olympic Dam Corporation Pty Ltd (Australia) (z) (aa)
BHP Billiton Petróleo Holdings de México S. de R.L. de C.V. (Mexico) (m)
BHP Billiton Petróleo Operaciones de México S. de R.L. de C.V. (Mexico) (m)
BHP Billiton Petroleum (Americas) Inc. (United States)BHP Billiton Petroleum (Arkansas Holdings) Inc. (United States)BHP Billiton Petroleum (Arkansas) Inc. (United States)BHP Billiton Petroleum (Australia) Pty Ltd (Australia)BHP Billiton Petroleum (Bass Strait) Pty Ltd (Australia)BHP Billiton Petroleum (Bimshire) Limited (United Kingdom)BHP Billiton Petroleum (Brazil) Limited (United Kingdom)BHP Billiton Petroleum (Carlisle Bay) Limited (United Kingdom)BHP Billiton Petroleum (Colombia) Corporation (Canada)BHP Billiton Petroleum (Deepwater) Inc. (United States)BHP Billiton Petroleum (Fayetteville) LLC (United States)BHP Billiton Petroleum (Foreign Exploration Holdings) LLC (United States)BHP Billiton Petroleum (GOM) Inc. (United States)BHP Billiton Petroleum (International Exploration) Pty Ltd (Australia)BHP Billiton Petroleum (KCS Resources) LLC (United States) (m) BHP Billiton Petroleum (Mexico Holdings) LLC (United States)BHP Billiton Petroleum (Mexico) Limited (United Kingdom)BHP Billiton Petroleum (New Ventures) Corporation (Canada)BHP Billiton Petroleum (North America) Inc. (United States)BHP Billiton Petroleum (North West Shelf) Pty Ltd (Australia)BHP Billiton Petroleum (Philippines) Corporation (Canada)BHP Billiton Petroleum (Sabah) Corporation (Canada)BHP Billiton Petroleum (Sarawak) Limited (United Kingdom)BHP Billiton Petroleum (South Africa 3B/4B) Limited (United Kingdom) (g) BHP Billiton Petroleum (Trinidad Block 14) Limited (United Kingdom)BHP Billiton Petroleum (Trinidad Block 23A) Limited (United Kingdom) (g)
BHP Billiton Petroleum (Trinidad Block 23B) Limited (United Kingdom) (g) BHP Billiton Petroleum (Trinidad Block 28) Limited (United Kingdom) (g) BHP Billiton Petroleum (Trinidad Block 29) Limited (United Kingdom) (g) BHP Billiton Petroleum (Trinidad Block 3) Limited (United Kingdom)BHP Billiton Petroleum (Trinidad Block 5) Limited (United Kingdom) (g) BHP Billiton Petroleum (Trinidad Block 6) Limited (United Kingdom) (g)
BHP Billiton Petroleum (Trinidad Block 7) Limited (United Kingdom)BHP Billiton Petroleum (Tx Gathering) LLC (United States) (m) BHP Billiton Petroleum (TxLa Operating) Company (United States)BHP Billiton Petroleum (Victoria) Pty Ltd (Australia)BHP Billiton Petroleum (WSF Operating) Inc. (United States)BHP Billiton Petroleum Great Britain Limited (United Kingdom)BHP Billiton Petroleum Holdings (USA) Inc. (United States) (h) BHP Billiton Petroleum Holdings LLC (United States)BHP Billiton Petroleum International Pty Ltd (Australia) (w) BHP Billiton Petroleum Investments (Great Britain) Pty Ltd (Australia)BHP Billiton Petroleum Limited (United Kingdom)BHP Billiton Petroleum Properties (GP) LLC (United States) (m)
BHP Billiton Petroleum Properties (LP) LLC (United States) (m) BHP Billiton Petroleum Properties (N.A.) LP (United States) (s)
BHP Billiton Petroleum Pty Ltd (Australia)BHP Billiton Petroleum Trading and Marketing Pty Ltd (Australia)BHP Billiton PNG Services Limited (Papua New Guinea) (w)
BHP Billiton Resources International (RSA) Pty Ltd (Australia)BHP Billiton Services Jersey Limited (Jersey)BHP Billiton Shared Business Services Pty Ltd (Australia) (w)
BHP Billiton Shared Services Malaysia Sdn. Bhd. (Malaysia)
BHP Billiton SSM Development Pty Ltd (Australia)BHP Billiton SSM Indonesia Holdings Pty Ltd (Australia) (w) BHP Billiton SSM Indonesia Pte Ltd (Singapore)BHP Billiton SSM International Pty Ltd (Australia)

BHP Billiton Annual Report 2016 215
12 Related undertakings of the BHP Billiton Group continuedBHP Billiton Sustainable Communities (United Kingdom)BHP Billiton UK Holdings Limited (British Virgin Islands)BHP Billiton UK Investments Limited (British Virgin Islands)BHP Billiton WAIO Pty Ltd (Australia)BHP Billiton Western Mining Resources International Pty Ltd (Australia)BHP Billiton World Exploration Inc. (Canada)BHP Billiton Yakabindie Nickel Pty Ltd (Australia)BHP Billiton Zambia Limited (Zambia)BHP Capital No. 20 Pty Ltd (Australia) (w)
BHP Chile Inc. (United States)BHP Coal Pty Ltd (Australia) (z) (aa)
BHP Copper Inc. (United States)BHP Development Finance Pty Ltd (Australia) (w)
BHP Escondida Inc. (United States)BHP Finance (International) Inc. (United States)BHP Group Resources Pty Ltd (Australia)BHP Hawaii Inc. (United States)BHP Holdings (International) Inc. (United States)BHP Holdings (Resources) Inc. (United States)BHP Holdings (USA) Inc. (United States) (o) (w)
BHP Holdings International (Investments) Inc. (United States)BHP Internacional Participacoes Ltda (Brazil)BHP International Finance Corp. (United States)BHP Khanij Anveshana Private Limited (India)BHP Mineral Resources Inc. (United States)BHP Minerals Asia Pacific Pty Ltd (Australia)BHP Minerals Europe Limited (United Kingdom)BHP Minerals Exploration Inc. (United States)BHP Minerals Holdings Proprietary Ltd (Australia) (w)
BHP Minerals India Pvt. Ltd (India)BHP Minerals International Exploration Inc. (United States)BHP Minerals International LLC (United States)BHP Minerals Service Company (United States)BHP Navajo Coal Company (United States) (u)
BHP Peru Holdings Inc. (United States)BHP Petroleum (Argentina) S.A. (Argentina)BHP Petroleum (Ashmore Operations) Pty Ltd (Australia)BHP Petroleum (Cambodia) Pty Ltd (Australia)BHP Petroleum (Tankers) Limited (Bermuda)BHP Queensland Coal Investments Pty Ltd (Australia) (z) (aa) BHP Queensland Coal Limited (United States) (w) (z)
BHP Resources Inc. (United States)BHP Titanium Minerals Pty Ltd (Australia) (r) (w)
BHPB Freight Pty Ltd (Australia) (w) (z) (aa)
BHPB Resolution Holdings LLC (United States)Billiton Australia Finance Pty Ltd (Australia)Billiton Coal Australia Holdings BV (Netherlands)Billiton Development (Zambia) Limited (Zambia)Billiton Development BV (Netherlands)Billiton ESOP Trustee Limited (Jersey) (x)
Billiton Executive Pension Scheme Trustee Limited (United Kingdom)Billiton Guinea BV (Netherlands)Billiton Investment 3 BV (Netherlands)Billiton Investment 8 BV (Netherlands)Billiton Investments Ireland Limited (Ireland)Billiton Manganese Australia Pty Ltd (Australia)Billiton Marketing Holding BV (Netherlands)Billiton Suriname Holdings BV (Netherlands)Broadmeadow Mine Services Pty Ltd (Australia) (z) (aa)
Broken Hill Proprietary (USA) Inc. (United States)Carson Hill Gold Mining Corporation (United States)Central Queensland Services Pty Ltd (Australia) (z) (aa)
Coal Mines Australia Pty Ltd (Australia)Compania Minera Cerro Colorado Ltda (Chile) (k) Consolidated Nominees (Pty) Ltd (South Africa)Dampier Coal (Queensland) Pty Ltd (Australia)Global BHP Copper Ltd (Cayman Islands)Global Offshore Oil Exploration (South Africa) (Pty) Ltd (South Africa)
Hamilton Brothers Petroleum Corporation (United States)Hamilton Oil Company Inc. (United States)Hay Point Services Pty Ltd (Australia) (z)
Hunter Valley Energy Coal Pty Ltd (Australia)IPS USA Inc. (United States)Jenipapo Recursos Naturais Ltda (Brazil)Marcona International S.A. (Panama)Minera Spence S.A. (Chile)Mt Arthur Coal Pty Ltd (Australia)Mt Arthur Underground Pty Ltd (Australia)Petrohawk Energy Corporation (United States)Phoenix Mining Finance Company Proprietary Limited (South Africa)Pilbara Gas Pty Ltd (Australia)PT BHP Billiton Indonesia (Indonesia)PT BHP Billiton Services Indonesia (Indonesia)PT Billiton Indonesia (Indonesia)QNI International Pty Ltd (Australia)QNI Philippines Inc. (Philippines)RAL Cayman Inc. (Cayman Islands)Rio Algom Exploration Inc. (Canada)Rio Algom Investments (Chile) Inc. (Canada)Rio Algom Limited (Canada)Rio Algom Mining LLC (United States)Riocerro Inc. (Cayman Islands)Riochile Inc. (Cayman Islands)South Texas Shale LLC (United States)Stein Insurance Company Limited (Guernsey)Tamakaya Energía SpA (Chile)The Broken Hill Proprietary Company Pty Ltd (Australia) (w) (z) (aa) The World Marine & General Insurance Plc (United Kingdom) (w)
UMAL Consolidated Pty Ltd (Australia)United Iron Pty Ltd (Australia)Westminer Insurance Pte Ltd (Singapore) (n)
Winwell Resources LLC (United States) (m)
WMC (Argentina) Inc. (United States)WMC Corporate Services Inc. (United States)WMC Finance (USA) Ltd (Australia)WMC Mineracao Ltda (Brazil)WMC Resources Marketing Limited (Canada)
Subsidiaries where the effective interest is less than 100 per cent (b)
BHP Billiton (Philippines) Inc. (Philippines, 99.99%)BHP Billiton Brasil Exploração e Produção de Petróleo Ltda (Brazil, 99.99%)BHP Billiton Mitsui Coal Pty Ltd (Australia, 80%) (l)
BHP Billiton Petroleum (Eagle Ford Gathering) LLC (United States, 75%) (h)
BHP Iron Ore (Jimblebar) Pty Ltd (Australia, 85%) (p) (v)
Consórcio Santos Luz de Imóveis Ltda (Brazil, 90%)Lubilanji Mining SPRL (Lumi SPRL) (The Democratic Republic of the Congo, 51%)Minera Escondida Ltda (Chile, 57.5%) (k)
PT Juloi Coal (Indonesia, 75%)PT Kalteng Coal (Indonesia, 75%)PT Lahai Coal (Indonesia, 75%)PT Maruwai Coal (Indonesia, 75%)PT Pari Coal (Indonesia, 75%)PT Ratah Coal (Indonesia, 75%)PT Sumber Barito Coal (Indonesia, 75%)
6 Additional inform
ation7
Shareholder information
5Financial Statem
ents
216 BHP Billiton Annual Report 2016
5 Financial Statements continued
12 Related undertakings of the BHP Billiton Group continuedJoint operations (c)
Bass Strait (Australia, 50%) (t)
BHP Billiton SaskPower Carbon Capture and Storage (CCS) Knowledge Centre Inc. (Canada, 50%) (m)
Blue Ocean Bulk Shipping Limited (Liberia, 50%)BM Alliance Coal Marketing Pty Limited (Australia, 50%)BM Alliance Coal Operations Pty Limited (Australia, 50%)BM Alliance Marketing Pte Ltd (Singapore, 50%)BMA Japan KK (Japan, 50%)Bruce (United Kingdom, 16%) (t)
Central Queensland Coal Associates (Australia, 50%) (t)
Eagle Ford (United States, <1-100%) (t)
Fayetteville (United States, <1-100%) (t)
Greater Angostura (Trinidad and Tobago, 45%) (t)
Gregory (Australia, 50%) (t)
Gulf of Mexico (United States, 23.9-44%) (t)
Haynesville (United States, <1-100%) (t)
JW4 (Australia, 68%) (t)
Keith (United Kingdom, 31.83%) (t)
Macedon (Australia, 71.43%) (t)
Minerva (Australia, 90%) (t)
Mt Goldsworthy (Australia, 85%) (t)
Mt Newman (Australia, 85%) (t)
North West Shelf (Australia, 8.33-16.67%) (t)
North West Shelf Gas Pty Limited (Australia, 16.67%)North West Shelf Liaison Company Pty Ltd (Australia, 16.67%) (i)
North West Shelf Lifting Coordinator Pty Ltd (Australia, 16.67%) (h)
North West Shelf Shipping Service Company Pty Ltd (Australia, 16.67%)Permian (United States, <1-100%) (t) Posmac (Australia, 65%) (t) Pyrenees (Australia, 40-71.43%) (t)
Red Mountain (Australia, 50%) (t) Red Mountain Infrastructure Pty Ltd (Australia, 50%)ROD Integrated Development (Algeria, 38%) (t)
South Blackwater Coal Pty Limited (Australia, 50%)Southern Natural Gas Development Pty Limited (Australia, 50%)Stybarrow (Australia, 50%) (t)
Thakweneng Mineral Resources (Pty) Ltd (South Africa, 50%)Westralian Bulk Charter Services Pty Ltd (Australia, 50%)Wheelarra (Australia, 51%) (t)
Yandi (Australia, 85%) (t)
Joint ventures and associates (d)
Caesar Oil Pipeline Company LLC (United States, 25%) (m) Carbones del Cerrejón Limited (Anguilla, 33.33%)Cerrejón Zona Norte S.A. (Colombia, 33.33%)Cleopatra Gas Gathering Company LLC (United States, 22%) (m) CMC-Coal Marketing Company Limited (Ireland, 33.33%)Compañía Minera Antamina S.A. (Peru, 33.75%)Global Coal Limited (United Kingdom, 70.97%) (f) (y)
Global HubCo BV (Netherlands, 33.33%) (q) Marine Well Containment Company LLC (United States, 10%) (m)
NCIG Holdings Pty Ltd (Australia, 35.47%)Resolution Copper Mining LLC (United States, 45%)Rightship Pty Limited (Australia, 33.33%)Samarco Mineração S.A. (Brazil, 50%)
Minority investment (e)
Beijing Iron Ore Trading Center Corporation (China, 6.25%)China Administration Company Pty Ltd (Australia, 16.67%) (h)
Commonwealth Steamship Insurance Company Pty Limited (Australia, 29.72%)Dalrymple Bay Coal Terminal Pty Ltd (Australia, 9.66%)Euronimba Limited (Jersey, 43.50%)GlobalORE Pte. Ltd (Singapore, 14.29%)Half-Tide Marine Pty Ltd (Australia, 14.97%)Integrated Logistics Company Pty Ltd (Australia, 12.50%) (h) International Gas Transportation Company Limited (Bermuda, 16.67%) (j) Interstate Steamship Insurance Company Pty Ltd (Australia, 24.91%)Metalysis Limited (United Kingdom, 6.85%) (f)
Newcastle Coal Shippers Pty Ltd (Australia, 1.75%)Pilbara Pastoral Company Pty Limited (Australia, 25%)The Baltic Exchange Limited (Min Int) (United Kingdom, 0.04%)
(a) Wholly owned 100 per cent subsidiary consolidated by the Group.(b) Subsidiaries where the effective interest is less than 100 per cent but controlled by the Group.(c) Interests in joint operations. The Financial Statements of the Group include its share of the assets in joint operations, together with its share of the liabilities, revenues
and expenses arising jointly or otherwise from those operations and its revenue derived from the sale of its share of output from the joint operation. (d) Investments accounted for using the equity method.(e) Minority investments held by the Group in which there is a non-controlling interest.(f) Ownership held in preference shares.(g) Ownership held in ordinary and preference shares.(h) Ownership held in class A shares.(i) Ownership held in class B shares.(j) Ownership held in class C shares.(k) Capital injection, no shares.(l) Ownership held in redeemable preference, class A and class B shares.(m) Ownership held in category Membership Interest.(n) Ownership held in ordinary redeemable preference shares.(o) Ownership held in class A common shares.(p) Ownership held in redeemable preference A and class B shares.(q) Ownership in preference B.(r) Ownership held in ordinary and special share classes L and M.(s) Partnership.(t) Joint operation held by a subsidiary of the Group.(u) The Group divested its 100 per cent effective interest in BHP Navajo Coal Company (‘Navajo’) in December 2013. However, as BHP Billiton controls the Navajo mine until
full consideration is received from the buyer, the financial results of the Navajo mine are consolidated by the Group. The divestment of Navajo Coal completed on 29 July 2016 and will be recognised in FY2017. BHP Billiton will continue to manage Navajo Coal in accordance with the Mine Management Agreement until 31 December 2016.
(v) The Group has an effective interest of 92.5 per cent in BHP Iron Ore (Jimblebar) Pty Ltd, however by virtue of the shareholder agreement with ITOCHU Minerals & Energy of Australia Pty Ltd and Mitsui & Co. Iron Ore Exploration & Mining Pty Ltd, the Group’s interest in the Jimblebar mining operation is 85 per cent which is consistent with the other respective contractual arrangements at Western Australia Iron Ore.
(w) Directly held by BHP Billiton Ltd.(x) Directly held by BHP Billiton Plc.(y) Global Coal Limited is a subsidiary with less than 100 per cent ownership but is held by an associate which is accounted for using the equity method.(z) These companies are parties to the Limited Deed of Cross Guarantee, originally entered into on 6 June 2016, and members of the Closed Group, as at 30 June 2016.(aa) These companies are parties to the Limited Deed of Cross Guarantee and are relieved from the Corporations Act 2001 requirements for preparation, audit
and lodgement of financial reports and Directors’ reports.

BHP Billiton Annual Report 2016 217
5.3 Directors’ declarationIn accordance with a resolution of the Directors of the BHP Billiton Group, the Directors declare that:(a) in the Directors’ opinion and to the best of their knowledge the
Financial Statements and notes, set out in sections 5.1 and 5.2, are in accordance with the UK Companies Act 2006 and the Australian Corporations Act 2001, including:
(i) complying with the applicable Accounting Standards; (ii) giving a true and fair view of the assets, liabilities, financial
position and profit or loss of each of BHP Billiton Limited, BHP Billiton Plc, the BHP Billiton Group and the undertakings included in the consolidation taken as a whole as at 30 June 2016 and of their performance for the year ended 30 June 2016;
(b) the financial report also complies with International Financial Reporting Standards, as disclosed in section 5.1;
(c) to the best of the Directors’ knowledge, the management report (comprising the Strategic Report and Directors’ Report) includes a fair review of the development and performance of the business and the financial position of the BHP Billiton Group and the undertakings included in the consolidation taken as a whole, together with a description of the principal risks and uncertainties that the Group faces;
(d) in the Directors’ opinion there are reasonable grounds to believe that each of the BHP Billiton Group, BHP Billiton Limited and BHP Billiton Plc will be able to pay its debts as and when they become due and payable;
(e) in the Directors’ opinion, as at the date of this declaration, there are reasonable grounds to believe that BHP Billiton Limited and each of the Closed Group entities identified in note 12 of section 5.2 will be able to meet any obligations or liabilities to which they are or may become subject to by virtue of the Deed of Cross Guarantee between the BHP Billiton Group and those group entities pursuant to ASIC Class Order 98/1418.
The Directors have been given the declarations required by Section 295A of the Australian Corporations Act 2001 from the Chief Executive Officer and Chief Financial Officer for the financial year ended 30 June 2016.
Signed in accordance with a resolution of the Board of Directors.
Jac Nasser AO Chairman
Andrew Mackenzie Chief Executive Officer
Dated this 8th day of September 2016
6 Additional inform
ation7
Shareholder information
5Financial Statem
ents
218 BHP Billiton Annual Report 2016
5 Financial Statements continued
5.4 Statement of Directors’ responsibilities in respect of the Annual Report and the Financial StatementsThe Directors are responsible for preparing the Annual Report and the Group and parent company Financial Statements in accordance with applicable law and regulations. References to the ‘Group and parent company Financial Statements’ are made in relation to the Group and individual parent company Financial Statements of BHP Billiton Plc.
UK company law requires the Directors to prepare Group and parent company Financial Statements for each financial year. The Directors are required to prepare the Group Financial Statements in accordance with IFRS as adopted by the EU and applicable law and have elected to prepare the parent company Financial Statements in accordance with UK Accounting Standards and applicable law (UK Generally Accepted Accounting Practice).
The Group Financial Statements must, in accordance with IFRS as adopted by the EU and applicable law, present fairly the financial position and performance of the Group; references in the UK Companies Act 2006 to such Financial Statements giving a true and fair view are references to their achieving a fair presentation.
The parent company Financial Statements must, in accordance with UK Generally Accepted Accounting Practice, give a true and fair view of the state of affairs of the parent company at the end of the financial year and of the profit or loss of the parent company for the financial year.
In preparing each of the Group and parent company Financial Statements, the Directors are required to:• select suitable accounting policies and then apply
them consistently;• make judgements and estimates that are reasonable and prudent;• for the Group Financial Statements, state whether they have
been prepared in accordance with IFRS as adopted by the EU;• for the parent company Financial Statements, state whether
applicable UK Accounting Standards have been followed, subject to any material departures disclosed and explained in the parent company Financial Statements;
• prepare the Financial Statements on the going concern basis unless it is inappropriate to presume that the Group and the parent company will continue in business.
The Directors are responsible for keeping proper accounting records that disclose with reasonable accuracy at any time the financial position of the parent company and enable them to ensure that its Financial Statements comply with the UK Companies Act 2006. They have general responsibility for taking such steps as are reasonably open to them to safeguard the assets of the Group and to prevent and detect fraud and other irregularities.
Under applicable law and regulations, the Directors are also responsible for preparing a Strategic Report, Directors’ Report, Directors’ Remuneration Report and Corporate Governance Statement that complies with that law and those regulations.
The Directors are responsible for the maintenance and integrity of the corporate and financial information included on the Company’s website. Legislation in the UK governing the preparation and dissemination of Financial Statements may differ from legislation in other jurisdictions.
BHP Billiton Annual Report 2016 219
5.5 Lead Auditor’s Independence Declaration under Section 307C of the Australian Corporations Act 2001To the Directors of BHP Billiton Limited:I declare that, to the best of my knowledge and belief, in relation to the audit for the financial year ended 30 June 2016 there have been:(i) no contraventions of the auditor independence requirements
as set out in the Australian Corporations Act 2001 in relation to the audit;
(ii) no contraventions of any applicable code of professional conduct in relation to the audit.
This declaration is in respect of BHP Billiton and the entities it controlled during the year.
KPMG
Anthony Young Partner
Melbourne 8 September 2016
KPMG, an Australian partnership and member firm of the KPMG network of independent member firms affiliated with KPMG International Cooperative (‘KPMG International’), a Swiss entity.
KPMG Australia’s liability limited by a scheme approved under Professional Standards Legislation.
6 Additional inform
ation7
Shareholder information
5Financial Statem
ents

220 BHP Billiton Annual Report 2016
5 Financial Statements continued
5.6 Independent Auditors’ reports Independent Auditors’ reports of KPMG LLP (‘KPMG UK’) to the members of BHP Billiton Plc and of KPMG (‘KPMG Australia’) to the members of BHP Billiton Limited1. OverviewFor the purpose of these reports, the terms ‘we’ and ‘our’ denote KPMG UK in relation to UK responsibilities and reporting obligations to the members of BHP Billiton Plc, and KPMG Australia in relation to Australian responsibilities and reporting obligations to the members of BHP Billiton Limited. The BHP Billiton Group (‘the Group’) consists of BHP Billiton Plc, BHP Billiton Limited and the entities they controlled during the financial year ended 30 June 2016.
We have audited the Group Financial Statements which comprise the:• Group Consolidated Balance Sheet at 30 June 2016;• Group Consolidated Income Statement, Consolidated Statement
of Comprehensive Income, Consolidated Statement of Changes in Equity and Consolidated Cash Flow Statement for the year ended 30 June 2016;
• Notes to the Financial Statements which include a summary of significant accounting policies and other explanatory information.
In addition:• We have audited the Remuneration Report; • KPMG UK has audited the BHP Billiton Plc company Financial
Statements for the year ended 30 June 2016, which comprise the unconsolidated parent company Balance Sheet and related notes;
• KPMG Australia considers the Directors’ declaration to be part of the Group Financial Statements when forming its opinion.
2. Report on the Financial StatementsA. KPMG UK’s opinion to the members of BHP Billiton Plc on the Financial Statements is unmodifiedIn our opinion the:• Financial Statements give a true and fair view of the state of the
Group’s and of BHP Billiton Plc’s affairs as at 30 June 2016 and of the Group’s profit for the year then ended;
• Group Financial Statements have been properly prepared in accordance with International Financial Reporting Standards (‘IFRSs’) as adopted by the European Union (‘EU’);
• BHP Billiton Plc company Financial Statements have been properly prepared in accordance with UK Accounting Standards, including FRS 101 Reduced Disclosure Framework;
• Financial Statements have been prepared in accordance with the requirements of the UK Companies Act 2006 and, as regards to the Group Financial Statements, Article 4 of the IAS Regulation.
B. KPMG UK’s separate opinion to the members of BHP Billiton Plc in relation to IFRSs as issued by the International Accounting Standards Board (‘IASB’)As explained in section 5.1 ‘Basis of preparation’ to the Group Financial Statements, the Group, in addition to complying with its legal obligation to apply IFRSs as adopted by the EU, has also applied IFRSs as issued by the IASB. In our opinion the Group Financial Statements have been properly prepared, in all material respects, in accordance with IFRSs as issued by the IASB.
C. KPMG Australia’s opinion to the members of BHP Billiton Limited on the Group Financial Statements is unmodifiedIn our opinion:• the Group Financial Statements, including the Directors’
declaration, are in accordance with the Australian Corporations Act 2001, including:
− Giving a true and fair view of the Group’s financial position as at 30 June 2016 and of its performance for the financial year ended on that date;
− Complying with Australian Accounting Standards and the Australian Corporations Regulations 2001;
• the Group Financial Statements also comply with IFRSs as issued by the IASB as disclosed in section 5.1 ‘Basis of preparation’.
D. KPMG Australia’s opinion on the Remuneration Report is unmodified• We have audited the Remuneration Report set out in section 3
of the Annual Report. The Directors of BHP Billiton Limited are responsible for the preparation and presentation of the Remuneration Report in accordance with Section 300A of the Australian Corporations Act 2001. Our responsibility is to express an opinion on the Remuneration Report, based on our audit conducted in accordance with Australian Auditing Standards.
• In our opinion, the Remuneration Report of the Group for the year ended 30 June 2016 complies with Section 300A of the Australian Corporations Act 2001.
3. KPMG UK’s report on other UK legal and regulatory requirements is unmodifiedIn our opinion the:• Remuneration Report set out in section 3 of the Annual Report
has been properly prepared in accordance with the UK Companies Act 2006;
• information given in the Strategic Report and the Directors’ Report for the financial year is consistent with the Financial Statements;
• information given in the Corporate Governance Statement set out in section 2 of the Annual Report with respect to internal control and risk management systems in relation to financial reporting processes and about share capital structures is consistent with the Financial Statements.
BHP Billiton Annual Report 2016 221
4. Our audit approachA. Our assessment of the risks of material misstatementIn arriving at our audit opinion on the Financial Statements our considerations include any changes year-on-year in the Group’s operations and the broader market that may influence the Group’s audit risk profile. The following changes in risks, as compared to the prior year are:• addition of an audit risk relating to the Samarco dam failure; • removal of the audit risk relating to the South32 demerger, which was completed during the prior year.
The risks of material misstatement that had the greatest effect on our audit were as follows:
The risk Our response
Asset valuation Property, plant and equipment: US$84.0 billion (2015: US$94.1 billion).Intangible assets: US$4.1 billion (2015: US$4.3 billion).Impairment of property, plant and equipment, goodwill and other intangibles (pre-tax): US$7.4 billion (2015: US$4.0 billion).
The carrying value of the Group’s portfolio of assets has been impacted by sustained volatility in commodity prices.
The key area of judgement relates to the Group’s assessment of future cash flows for each Cash Generating Unit (‘CGU’), which is used to assess the recoverable value of property, plant and equipment and intangible assets. The future cash flows use forward looking estimates which are inherently difficult to determine with precision and there is a level of judgement applied in determining other key inputs.
In response to sustained low prices in the oil and gas sector, the Group has recorded pre-tax impairment charges for its US Onshore assets of US$7.2 billion.
We performed the following key procedures:• Tested the key controls over the valuation of the Group’s assets
including those to determine any asset impairments or reversals;• Assessed the appropriateness of the Group’s identification of CGUs
for alignment with our knowledge of the business and its internal reporting structure;
• Evaluated the forecast prices incorporated into the Group’s impairment testing by comparing inputs to available market data and externally available benchmarks;
• Agreed operating and future capital expenditure and reserve life data to the latest approved plans and budgets. We assessed the historical accuracy of the plans and budgets;
• Evaluated the competency and objectivity of experts who produced the reserve statements utilised within the models by considering their professional qualifications and experience;
• Worked with our valuation specialists to compare key assumptions such as commodity prices, discount rates, inflation rates, country risk rates and foreign exchange rates to external market data, and performed sensitivity analysis using a range of these assumptions.
Refer to note 10 ‘Property, plant and equipment’ (Recognition and measurement), note 11 ‘Intangible assets’ (Recognition and measurement), note 12 ‘Impairment of non-current assets’ (Recognition and measurement), and section 2.13.1 Risk and Audit Committee Report (Significant issues – Carrying value of long-term assets).
The risk Our response
TaxationIncome tax benefit/expense (including royalties): US$1.1 billion benefit (2015: US$3.7 billion expense).Current tax assets: US$0.6 billion (2015:US$0.7 billion).Deferred tax assets: US$6.1 billion (2015: US$2.9 billion).Current tax payable: US$0.5 billion (2015: US$0.2 billion).Deferred tax liabilities: US$4.3 billion (2015: US$4.5 billion).Exceptional item – Global taxation matters: US$0.6 billion (2015: US$ nil).Contingent liability disclosure.
The Group has operations in multiple countries, each with its own taxation regime. The nature of the Group’s activities triggers various taxation obligations including corporation tax, royalties, other resource and production based taxes and employment related taxes. The cross-border nature of the Group’s commodity sales also creates complexities associated with international transfer pricing.
Application of taxation legislation to the Group’s affairs is inherently complex, highly specialised, and requires judgement to be exercised in relation to estimating tax exposures and quantifying provisions and contingent liabilities.
We performed the following key procedures:• Tested the key controls regarding the accounting for and disclosure
of tax related transactions and matters;• Worked with our tax specialists and made inquiries of management
and inspected internally or externally prepared documentation to understand current disputes and uncertain tax positions. We considered documentation from recent similar tax rulings and cases to assess the completeness of tax matters identified, and the Group’s conclusions regarding the status, possible outcomes and associated exposures;
• Tested the assumptions and forecast taxable income supporting deferred tax assets;
• Considered the appropriateness of the Group’s disclosures regarding current tax matters based on our understanding of the recent focus on tax transparency by tax and other regulatory authorities;
• Assessed the consistency of assumptions used in estimating provisions and contingent liabilities, such as the estimated range for potential litigation and settlement outcomes. We compared these assumptions with other related public statements and disclosures made by the Group.
Refer to note 5 ‘Income tax expense’ (Recognition and measurement) and section 2.13.1 Risk and Audit Committee Report (Significant issues – Tax and royalty liabilities).
6 Additional inform
ation7
Shareholder information
5Financial Statem
ents

222 BHP Billiton Annual Report 2016
5 Financial Statements continued
4. Our audit approach (continued)
The risk Our response
Samarco Losses attributable to the dam failure (pre-tax): US$2.5 billion (2015: US$ nil). Provision: US$1.2 billion (2015: US$ nil).Investment accounted for using the equity method: US$ nil (2015: US$1.0 billion).Contingent liability disclosure.
There are a number of complex accounting judgements and disclosures resulting from the Samarco dam failure including: • The application of equity accounting principles to BHP Billiton
Brasil Ltda (BHP Billiton Brasil) investment in Samarco, including recognition of BHP Billiton Brasil’s share of Samarco’s losses, evaluation of the recoverability of BHP Billiton Brasil’s investment in Samarco and related provisioning;
• Determining the legal status of claims made against Samarco and BHP Billiton Brasil and the appropriate accounting treatment;
• Determining whether BHP Billiton Brasil has a legal obligation to provide funding to Samarco and the quantification of any obligation;
• Disclosure of contingent liabilities associated with the various claims and other circumstances that represent exposures to Samarco and BHP Billiton Brasil and that cannot be reliably estimated;
• Tax implications and associated accounting and disclosure of these matters.
We performed the following key procedures:• Evaluated BHP Billiton Brasil’s accounting policies relating to
the treatment of its share of Samarco’s losses, the impairment of BHP Billiton Brasil’s investment in Samarco and the recognition of a provision attributable to BHP Billiton Brasil’s potential legal obligations;
• Assessed the existence of any legal or constructive obligations under the Samarco shareholders’ agreement, Brazilian law or the public statements made by the Group, and determined if these have been disclosed in the Financial Statements in compliance with accounting standards;
• Evaluated the liquidity forecasts for Samarco, which included consideration of a range of alternative scenarios identified by BHP Billiton Brasil and the Directors’ assessment of the most likely outcome;
• Tested the key assumptions used to determine the provision recorded by BHP Billiton Brasil in relation to its potential funding obligation. This included analysis of the amount and timing of forecast cash flows, discount rate, inflation and foreign exchange rates;
• Assessed the completeness of the disclosures relating to contingent liabilities through review of the Group’s internal legal documentation, inquiry of legal personnel and senior management and review of documentation provided by external counsel;
• Evaluated BHP Billiton Brasil’s assumptions regarding the tax treatment of the Samarco related costs and associated provisions, the recoverability of deferred tax assets that were supported by BHP Billiton Brasil’s share of Samarco’s profits, and the deferred tax liabilities attributable to undistributed earnings of Samarco;
• Tested the key controls established in relation to the accounting and disclosures associated with the dam failure;
• Instructed Samarco’s auditor to undertake procedures in relation to Samarco’s net loss for the year (of which the Group has recorded BHP Billiton Brasil’s 50 per cent share), which included all costs identified by Samarco attributable to the dam failure.
Refer to note 3 ‘Significant events – Samarco dam failure’ and section 2.13.1 Risk and Audit Committee Report (Significant issues – Samarco dam failure).
The risk Our response
Closure and rehabilitation provisionsClosure and rehabilitation provisions: US$6.5 billion (2015: US$6.7 billion).
Given the nature of its operations, the Group incurs obligations to close, restore and rehabilitate its sites. Closure and rehabilitation activities are governed by a combination of legislative requirements and Group policies. Significant estimates over life of mine and reserves are made by the Group in determining its rehabilitation provision.
The calculation of closure and rehabilitation provisions requires significant judgement due to the inherent complexity in estimating the quantum and timing of future costs and determining an appropriate rate to discount these costs back to their present value.
We performed the following key procedures:• Tested key controls over the estimation of closure and rehabilitation
provisions and compliance with accounting standards;• Evaluated the accounting treatment applied to changes in the
closure and rehabilitation provisions including whether the impact is expensed or capitalised;
• Worked with our specialists to assess the reasonableness of estimates of reserve life used by the Group in its closure and rehabilitation provisions;
• Evaluated the competence and objectivity of the Group’s mine closure specialists based on their experience and use of industry accepted methodology;
• Evaluated the economic assumptions used in the calculation, including the discount rate applied to calculate the net present value of the provision and foreign exchange rates utilised in translating the future obligation.
Refer to note 14 ‘Closure and rehabilitation provisions’ (Recognition and measurement) and section 2.13.1 Risk and Audit Committee Report (Significant issues – Closure and rehabilitation provisions).
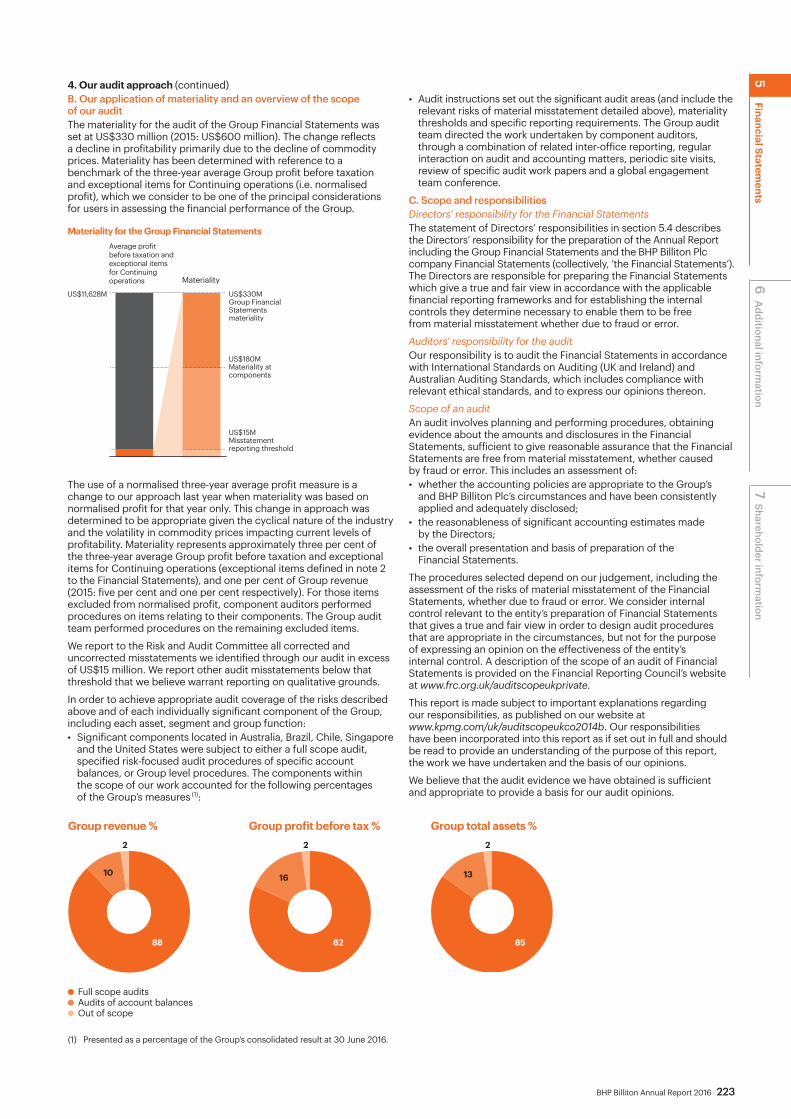
BHP Billiton Annual Report 2016 223
4. Our audit approach (continued)B. Our application of materiality and an overview of the scope of our audit The materiality for the audit of the Group Financial Statements was set at US$330 million (2015: US$600 million). The change reflects a decline in profitability primarily due to the decline of commodity prices. Materiality has been determined with reference to a benchmark of the three-year average Group profit before taxation and exceptional items for Continuing operations (i.e. normalised profit), which we consider to be one of the principal considerations for users in assessing the financial performance of the Group.
Average profit before taxation and exceptional items for Continuing operations Materiality
Materiality for the Group Financial Statements
US$330MGroup Financial Statementsmateriality
US$11,628M
US$180MMateriality atcomponents
US$15MMisstatement reporting threshold
The use of a normalised three-year average profit measure is a change to our approach last year when materiality was based on normalised profit for that year only. This change in approach was determined to be appropriate given the cyclical nature of the industry and the volatility in commodity prices impacting current levels of profitability. Materiality represents approximately three per cent of the three-year average Group profit before taxation and exceptional items for Continuing operations (exceptional items defined in note 2 to the Financial Statements), and one per cent of Group revenue (2015: five per cent and one per cent respectively). For those items excluded from normalised profit, component auditors performed procedures on items relating to their components. The Group audit team performed procedures on the remaining excluded items.
We report to the Risk and Audit Committee all corrected and uncorrected misstatements we identified through our audit in excess of US$15 million. We report other audit misstatements below that threshold that we believe warrant reporting on qualitative grounds.
In order to achieve appropriate audit coverage of the risks described above and of each individually significant component of the Group, including each asset, segment and group function:• Significant components located in Australia, Brazil, Chile, Singapore
and the United States were subject to either a full scope audit, specified risk-focused audit procedures of specific account balances, or Group level procedures. The components within the scope of our work accounted for the following percentages of the Group’s measures (1):
• Audit instructions set out the significant audit areas (and include the relevant risks of material misstatement detailed above), materiality thresholds and specific reporting requirements. The Group audit team directed the work undertaken by component auditors, through a combination of related inter-office reporting, regular interaction on audit and accounting matters, periodic site visits, review of specific audit work papers and a global engagement team conference.
C. Scope and responsibilities Directors’ responsibility for the Financial StatementsThe statement of Directors’ responsibilities in section 5.4 describes the Directors’ responsibility for the preparation of the Annual Report including the Group Financial Statements and the BHP Billiton Plc company Financial Statements (collectively, ‘the Financial Statements’). The Directors are responsible for preparing the Financial Statements which give a true and fair view in accordance with the applicable financial reporting frameworks and for establishing the internal controls they determine necessary to enable them to be free from material misstatement whether due to fraud or error.
Auditors’ responsibility for the audit Our responsibility is to audit the Financial Statements in accordance with International Standards on Auditing (UK and Ireland) and Australian Auditing Standards, which includes compliance with relevant ethical standards, and to express our opinions thereon.
Scope of an audit An audit involves planning and performing procedures, obtaining evidence about the amounts and disclosures in the Financial Statements, sufficient to give reasonable assurance that the Financial Statements are free from material misstatement, whether caused by fraud or error. This includes an assessment of: • whether the accounting policies are appropriate to the Group’s
and BHP Billiton Plc’s circumstances and have been consistently applied and adequately disclosed;
• the reasonableness of significant accounting estimates made by the Directors;
• the overall presentation and basis of preparation of the Financial Statements.
The procedures selected depend on our judgement, including the assessment of the risks of material misstatement of the Financial Statements, whether due to fraud or error. We consider internal control relevant to the entity’s preparation of Financial Statements that gives a true and fair view in order to design audit procedures that are appropriate in the circumstances, but not for the purpose of expressing an opinion on the effectiveness of the entity’s internal control. A description of the scope of an audit of Financial Statements is provided on the Financial Reporting Council’s website at www.frc.org.uk/auditscopeukprivate.
This report is made subject to important explanations regarding our responsibilities, as published on our website at www.kpmg.com/uk/auditscopeukco2014b. Our responsibilities have been incorporated into this report as if set out in full and should be read to provide an understanding of the purpose of this report, the work we have undertaken and the basis of our opinions.
We believe that the audit evidence we have obtained is sufficient and appropriate to provide a basis for our audit opinions.
(1) Presented as a percentage of the Group’s consolidated result at 30 June 2016.
Full scope auditsAudits of account balancesOut of scope
Group revenue %2
88
10
Group profit before tax %2
82
16
Group total assets %2
85
13
6 Additional inform
ation7
Shareholder information
5Financial Statem
ents
224 BHP Billiton Annual Report 2016
5 Financial Statements continued
4. Our audit approach (continued)KPMG UK has nothing to report on the disclosures of principal risksBased on the knowledge we acquired during our audit, we have nothing material to add or draw attention to in relation to the: • Directors’ statement of the viability statement in section 1.9.1 of the
Annual Report, concerning the principal risks, their management, and, based on that, the Directors’ assessment and expectations of the Group continuing in operation over the three years to June 2019; or
• disclosures in section 5.1 concerning the use of the going concern basis of accounting.
KPMG UK has nothing to report in respect of the matters on which we are required to report by exceptionUnder ISAs (UK and Ireland) we are required to report to you if, based on the knowledge we acquired during our audit, we have identified other information in the Annual Report that contains a material inconsistency with either that knowledge or the Financial Statements, a material misstatement of fact, or that is otherwise misleading.
In particular, we are required to report to you if: • we have identified material inconsistencies between the knowledge
we acquired during our audit and the Directors’ statement that they consider that the Annual Report and Financial Statements taken as a whole are fair, balanced and understandable and provides the information necessary for shareholders to assess the Group’s position and performance, business model and strategy; or
• the Risk and Audit Committee report does not appropriately address matters communicated by us to the Risk and Audit Committee.
Under the UK Companies Act 2006 we are required to report to you if, in our opinion: • adequate accounting records have not been kept by
BHP Billiton Plc, or returns adequate for our audit have not been received from component teams not visited by us; or
• the BHP Billiton Plc company Financial Statements and Remuneration Report are not in agreement with the accounting records and returns; or
• certain disclosures of Directors’ remuneration specified by law are not made; or
• a separate Corporate Governance Statement has not been prepared by BHP Billiton Plc; or
• we have not received all the information and explanations we require for our audit.
Under the UK Listing Rules we are required to review: • the Directors’ statements, set out in section 4.3 of the Directors’
Report, in relation to going concern and longer-term viability; • the part of the Corporate Governance Statement in section 2 of
the Annual Report relating to BHP Billiton Plc’s compliance with the 11 provisions of the 2014 UK Corporate Governance Code specified for our review.
We have nothing to report in respect of the above responsibilities.
5. The purpose of this report and restrictions on its use by persons other than the members of BHP Billiton Plc as a body and BHP Billiton Limited as a bodyKPMG UK’s report is made solely to BHP Billiton Plc’s members, as a body, in accordance with Chapter 3 of Part 16 of the UK Companies Act 2006 and, in respect of the opinion in relation to IFRSs as issued by the IASB, on terms that have been agreed. KPMG Australia’s report is made solely to BHP Billiton Limited’s members, as a body, in accordance with the Australian Corporations Act 2001. Our audit work has been undertaken so that we might state to the members of each company those matters we are required to state to them in an auditor’s report and those matters that we have each agreed to state to them in respect of the opinion in relation to IFRSs as issued by the IASB. Accordingly, each of KPMG UK and KPMG Australia makes the following statement: to the fullest extent permitted by law, we do not accept or assume responsibility to anyone other than the company and the company’s members as a body, for our audit work, for our report, or for the opinions we have formed.
Stephen Oxley (Senior Statutory Auditor) For and on behalf of KPMG LLP, Statutory Auditor Chartered Accountants
London 8 September 2016
KPMG
Anthony Young Partner
Melbourne 8 September 2016
KPMG, an Australian partnership and KPMG LLP, a UK limited liability partnership, are member firms of the KPMG network of independent member firms affiliated with KPMG International Cooperative (‘KPMG International’), a Swiss entity.
KPMG Australia’s liability limited by a scheme approved under Professional Standards Legislation.

BHP Billiton Annual Report 2016 225
5.7 Supplementary oil and gas information – unauditedIn accordance with the requirements of the Financial Accounting Standards Board (FASB) Accounting Standard Codification ‘Extractive Activities-Oil and Gas’ (Topic 932) and SEC requirements set out in Subpart 1200 of Regulation S-K, the Group is presenting certain disclosures about its oil and gas activities. These disclosures are presented below as supplementary oil and gas information, in addition to information disclosed in section 1.14.1 ‘Petroleum’ and section 6.3.1 ‘Petroleum reserves’.
The information set out in this section is referred to as unaudited as it is not included in the scope of the audit opinion of the independent auditor on the Consolidated Financial Statements, refer to section 5.6 ‘Independent Auditors’ reports’.
Reserves and production Proved oil and gas reserves and net crude oil and condensate, natural gas, LNG and NGL production information is included in section 6.2.2 ‘Production – Petroleum’ and section 6.3.1 ‘Petroleum reserves’.
Capitalised costs relating to oil and gas production activitiesThe following table shows the aggregate capitalised costs relating to oil and gas exploration and production activities and related accumulated depreciation, depletion, amortisation and valuation allowances.
Australia US$M
United States US$M
Other (a) US$M
Total US$M
Capitalised cost2016Unproved properties 338 5,074 119 5,531Proved properties 15,523 40,929 2,372 58,824
Total costs 15,861 46,003 2,491 64,355Less: Accumulated depreciation, depletion, amortisation and valuation allowances (8,364) (28,664) (1,938) (38,966)
Net capitalised costs 7,497 17,339 553 25,389
2015Unproved properties 385 8,117 99 8,601Proved properties 15,125 37,341 2,443 54,909
Total costs 15,510 45,458 2,542 63,510Less: Accumulated depreciation, depletion, amortisation and valuation allowances (7,727) (19,100) (2,094) (28,921)
Net capitalised costs 7,783 26,358 448 34,589
2014 Unproved properties 344 7,355 200 7,899Proved properties 14,801 34,963 2,388 52,152
Total costs 15,145 42,318 2,588 60,051Less: Accumulated depreciation, depletion, amortisation and valuation allowances (7,135) (13,269) (2,021) (22,425)
Net capitalised costs 8,010 29,049 567 37,626
(a) Other is primarily comprised of Algeria, Pakistan (divested 31 December 2015), Trinidad and Tobago and the United Kingdom.
Costs incurred relating to oil and gas property acquisition, exploration and development activitiesThe following table shows costs incurred relating to oil and gas property acquisition, exploration and development activities (whether charged to expense or capitalised). Amounts shown include interest capitalised.
Australia US$M
United States US$M
Other (c)
US$MTotal
US$M
2016Acquisitions of proved property – – – –Acquisitions of unproved property 22 42 – 64Exploration (a) 42 385 194 621Development 412 1,254 200 1,866
Total costs (b) 476 1,681 394 2,551
2015Acquisitions of proved property – – – –Acquisitions of unproved property – 37 – 37Exploration (a) 127 281 248 656Development 429 4,036 52 4,517
Total costs (b) 556 4,354 300 5,210
2014Acquisitions of proved property – – – –Acquisitions of unproved property 35 217 42 294Exploration (a) 185 242 97 524Development 949 5,034 75 6,058
Total costs (b) 1,169 5,493 214 6,876
(a) Represents gross exploration expenditure, including capitalised exploration expenditure, in addition to exploration and evaluation costs charged to income as incurred.(b) Total costs include US$2,256 million (2015: US$4,603 million; 2014: US$6,387 million) capitalised during the year.(c) Other is primarily comprised of Algeria, Pakistan (divested 31 December 2015), Trinidad and Tobago and the United Kingdom.
6 Additional inform
ation7
Shareholder information
5Financial Statem
ents
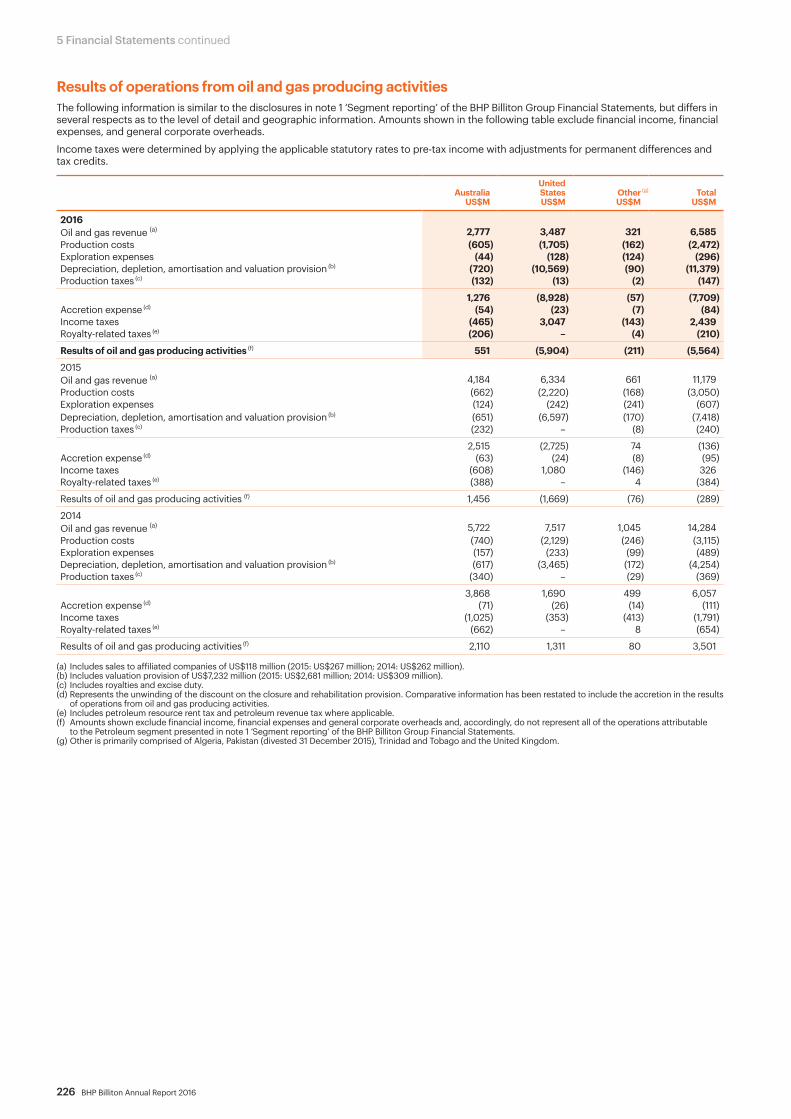
226 BHP Billiton Annual Report 2016
5 Financial Statements continued
Results of operations from oil and gas producing activitiesThe following information is similar to the disclosures in note 1 ‘Segment reporting’ of the BHP Billiton Group Financial Statements, but differs in several respects as to the level of detail and geographic information. Amounts shown in the following table exclude financial income, financial expenses, and general corporate overheads.
Income taxes were determined by applying the applicable statutory rates to pre-tax income with adjustments for permanent differences and tax credits.
Australia US$M
United States US$M
Other (g) US$M
Total US$M
2016Oil and gas revenue (a) 2,777 3,487 321 6,585Production costs (605) (1,705) (162) (2,472)Exploration expenses (44) (128) (124) (296)Depreciation, depletion, amortisation and valuation provision (b) (720) (10,569) (90) (11,379)Production taxes (c) (132) (13) (2) (147)
1,276 (8,928) (57) (7,709)Accretion expense (d) (54) (23) (7) (84)Income taxes (465) 3,047 (143) 2,439Royalty-related taxes (e) (206) – (4) (210)
Results of oil and gas producing activities (f) 551 (5,904) (211) (5,564)
2015Oil and gas revenue (a) 4,184 6,334 661 11,179Production costs (662) (2,220) (168) (3,050)Exploration expenses (124) (242) (241) (607)Depreciation, depletion, amortisation and valuation provision (b) (651) (6,597) (170) (7,418)Production taxes (c) (232) – (8) (240)
2,515 (2,725) 74 (136)Accretion expense (d) (63) (24) (8) (95)Income taxes (608) 1,080 (146) 326Royalty-related taxes (e) (388) – 4 (384)
Results of oil and gas producing activities (f) 1,456 (1,669) (76) (289)
2014 Oil and gas revenue (a) 5,722 7,517 1,045 14,284Production costs (740) (2,129) (246) (3,115)Exploration expenses (157) (233) (99) (489)Depreciation, depletion, amortisation and valuation provision (b) (617) (3,465) (172) (4,254)Production taxes (c) (340) – (29) (369)
3,868 1,690 499 6,057Accretion expense (d) (71) (26) (14) (111)Income taxes (1,025) (353) (413) (1,791)Royalty-related taxes (e) (662) – 8 (654)
Results of oil and gas producing activities (f) 2,110 1,311 80 3,501
(a) Includes sales to affiliated companies of US$118 million (2015: US$267 million; 2014: US$262 million).(b) Includes valuation provision of US$7,232 million (2015: US$2,681 million; 2014: US$309 million).(c) Includes royalties and excise duty.(d) Represents the unwinding of the discount on the closure and rehabilitation provision. Comparative information has been restated to include the accretion in the results
of operations from oil and gas producing activities.(e) Includes petroleum resource rent tax and petroleum revenue tax where applicable.(f) Amounts shown exclude financial income, financial expenses and general corporate overheads and, accordingly, do not represent all of the operations attributable
to the Petroleum segment presented in note 1 ‘Segment reporting’ of the BHP Billiton Group Financial Statements. (g) Other is primarily comprised of Algeria, Pakistan (divested 31 December 2015), Trinidad and Tobago and the United Kingdom.

BHP Billiton Annual Report 2016 227
Standardised measure of discounted future net cash flows relating to proved oil and gas reserves (Standardised measure)The purpose of this disclosure is to provide data with respect to the estimated future net cash flows from future production of proved developed and undeveloped reserves of crude oil, condensate, natural gas liquids and natural gas.
The Standardised measure is based on the Group’s estimated proved reserves (as presented in section 6.3.1 ‘Petroleum reserves’) and this data should be read in conjunction with that disclosure, which is hereby incorporated by reference into this section. The Standardised measure is prepared on a basis which presumes that year-end economic and operating conditions will continue over the periods in which year-end proved reserves would be produced. The effects of future inflation, future changes in exchange rates, expected future changes in technology, taxes, operating practices and any regulatory changes have not been included.
The Standardised measure is prepared by projecting the estimated future annual production of proved reserves owned at period-end and pricing that future production to derive future cash inflows. Estimates of future cash flows for 2016, 2015 and 2014 are computed using the average first-day-of-the-month price during the 12-month period. Future price increases for all periods presented are considered only to the extent that they are provided by fixed and determinable contractual arrangements in effect at year-end and are not dependent upon future inflation or exchange rate changes.
Future cash inflows for all periods presented are then reduced by future costs of producing and developing the year-end proved reserves based on costs in effect at year-end without regard to future inflation or changes in technology or operating practices. Future development costs include the costs of drilling and equipping development wells and construction of platforms and production facilities to gain access to proved reserves owned at year-end. They also include future costs, net of residual salvage value, associated with the abandonment of wells, dismantling of production platforms and rehabilitation of drilling sites. Future cash inflows are further reduced by future income taxes based on tax rates in effect at year-end and after considering the future deductions and credits applicable to proved properties owned at year-end. The resultant annual future net cash flows (after deductions of operating costs including resource rent taxes, development costs and income taxes) are discounted at 10 per cent per annum to derive the Standardised measure.
There are many important variables, assumptions and imprecisions inherent in developing the Standardised measure, the most important of which are the level of proved reserves and the rate of production thereof. The Standardised measure is not an estimate of the fair market value of the Group’s oil and gas reserves. An estimate of fair value would also take into account, among other things, the expected recovery of reserves in excess of proved reserves, anticipated future changes in prices, costs and exchange rates, anticipated future changes in secondary tax and income tax rates and alternative discount factors representing the time value of money and adjustments for risks inherent in producing oil and gas.
Australia US$M
United States US$M
Other (a) US$M
Total US$M
Standardised measure2016Future cash inflows 21,902 13,088 2,026 37,016Future production costs (7,306) (6,514) (567) (14,387)Future development costs (3,431) (3,063) (282) (6,776)Future income taxes (3,082) 800 (668) (2,950)
Future net cash flows 8,083 4,311 509 12,903Discount at 10 per cent per annum (2,961) (834) (121) (3,916)
Standardised measure 5,122 3,477 388 8,987
2015Future cash inflows 35,660 39,088 2,668 77,416Future production costs (9,617) (15,303) (526) (25,446)Future development costs (5,952) (7,694) (413) (14,059)Future income taxes (7,879) (3,009) (959) (11,847)
Future net cash flows 12,212 13,082 770 26,064Discount at 10 per cent per annum (4,236) (4,384) (200) (8,820)
Standardised measure 7,976 8,698 570 17,244
2014Future cash inflows 47,633 70,958 3,820 122,411Future production costs (11,355) (19,732) (717) (31,804)Future development costs (5,772) (12,953) (516) (19,241)Future income taxes (12,240) (10,527) (1,394) (24,161)
Future net cash flows 18,266 27,746 1,193 47,205Discount at 10 per cent per annum (6,880) (10,866) (295) (18,041)
Standardised measure 11,386 16,880 898 29,164
(a) Other is primarily comprised of Algeria, Pakistan (divested 31 December 2015), Trinidad and Tobago and the United Kingdom.
6 Additional inform
ation7
Shareholder information
5Financial Statem
ents
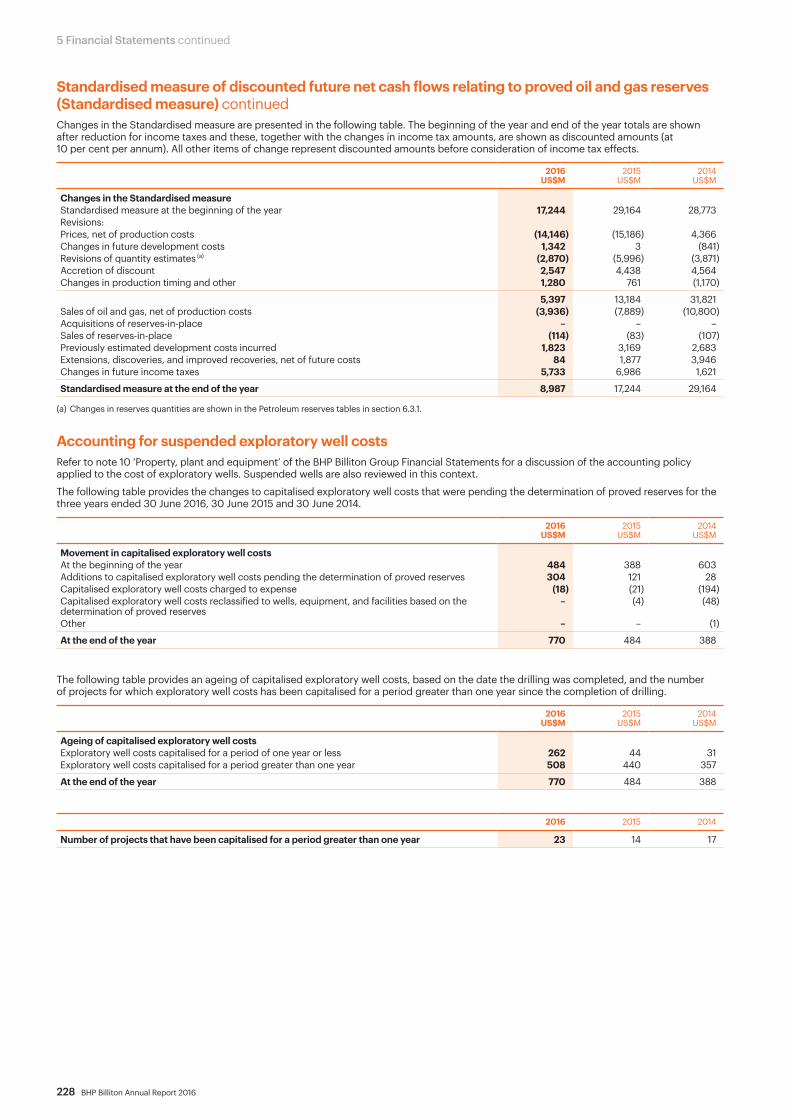
228 BHP Billiton Annual Report 2016
5 Financial Statements continued
Standardised measure of discounted future net cash flows relating to proved oil and gas reserves (Standardised measure) continuedChanges in the Standardised measure are presented in the following table. The beginning of the year and end of the year totals are shown after reduction for income taxes and these, together with the changes in income tax amounts, are shown as discounted amounts (at 10 per cent per annum). All other items of change represent discounted amounts before consideration of income tax effects.
2016 US$M
2015 US$M
2014 US$M
Changes in the Standardised measure Standardised measure at the beginning of the year 17,244 29,164 28,773Revisions:Prices, net of production costs (14,146) (15,186) 4,366Changes in future development costs 1,342 3 (841)Revisions of quantity estimates (a) (2,870) (5,996) (3,871)Accretion of discount 2,547 4,438 4,564Changes in production timing and other 1,280 761 (1,170)
5,397 13,184 31,821Sales of oil and gas, net of production costs (3,936) (7,889) (10,800)Acquisitions of reserves-in-place – – –Sales of reserves-in-place (114) (83) (107)Previously estimated development costs incurred 1,823 3,169 2,683Extensions, discoveries, and improved recoveries, net of future costs 84 1,877 3,946Changes in future income taxes 5,733 6,986 1,621
Standardised measure at the end of the year 8,987 17,244 29,164
(a) Changes in reserves quantities are shown in the Petroleum reserves tables in section 6.3.1.
Accounting for suspended exploratory well costsRefer to note 10 ‘Property, plant and equipment’ of the BHP Billiton Group Financial Statements for a discussion of the accounting policy applied to the cost of exploratory wells. Suspended wells are also reviewed in this context.
The following table provides the changes to capitalised exploratory well costs that were pending the determination of proved reserves for the three years ended 30 June 2016, 30 June 2015 and 30 June 2014.
2016 US$M
2015 US$M
2014 US$M
Movement in capitalised exploratory well costsAt the beginning of the year 484 388 603Additions to capitalised exploratory well costs pending the determination of proved reserves 304 121 28Capitalised exploratory well costs charged to expense (18) (21) (194)Capitalised exploratory well costs reclassified to wells, equipment, and facilities based on the determination of proved reserves
– (4) (48)
Other – – (1)
At the end of the year 770 484 388
The following table provides an ageing of capitalised exploratory well costs, based on the date the drilling was completed, and the number of projects for which exploratory well costs has been capitalised for a period greater than one year since the completion of drilling.
2016 US$M
2015 US$M
2014 US$M
Ageing of capitalised exploratory well costsExploratory well costs capitalised for a period of one year or less 262 44 31Exploratory well costs capitalised for a period greater than one year 508 440 357
At the end of the year 770 484 388
2016 2015 2014
Number of projects that have been capitalised for a period greater than one year 23 14 17

BHP Billiton Annual Report 2016 229
Drilling and other exploratory and development activitiesThe number of crude oil and natural gas wells drilled and completed for each of the last three years was as follows:
Net exploratory wells Net development wells
Productive Dry Total Productive Dry Total Total
Year ended 30 June 2016Australia – – – 2 – 2 2United States 1 – 1 137 2 139 140Other (a) – – – 1 – 1 1
Total 1 – 1 140 2 142 143
Year ended 30 June 2015Australia – – – 3 – 3 3United States – – – 304 1 305 305Other (a) – – – – – – –
Total – – – 307 1 308 308
Year ended 30 June 2014Australia 1 2 3 3 – 3 6United States – 2 2 401 15 416 418Other (a) – – – 1 – 1 1
Total 1 4 5 405 15 420 425
(a) Other is primarily comprised of Algeria and Trinidad and Tobago.
The number of wells drilled refers to the number of wells completed at any time during the respective year, regardless of when drilling was initiated. Completion refers to the installation of permanent equipment for production of oil or gas, or, in the case of a dry well, to reporting to the appropriate authority that the well has been abandoned.
An exploratory well is a well drilled to find oil or gas in a new field or to find a new reservoir in a field previously found to be productive of oil or gas in another reservoir. A development well is a well drilled within the limits of a known oil or gas reservoir to the depth of a stratigraphic horizon known to be productive.
A productive well is an exploratory, development or extension well that is not a dry well. Productive wells include wells in which hydrocarbons were encountered and the drilling or completion of which, in the case of exploratory wells, has been suspended pending further drilling or evaluation. A dry well (hole) is an exploratory, development, or extension well that proves to be incapable of producing either oil or gas in sufficient quantities to justify completion as an oil or gas well.
Oil and gas properties, wells, operations and acreageThe following tables show the number of gross and net productive crude oil and natural gas wells and total gross and net developed and undeveloped oil and natural gas acreage as at 30 June 2016. A gross well or acre is one in which a working interest is owned, while a net well or acre exists when the sum of fractional working interests owned in gross wells or acres equals one. Productive wells are producing wells and wells mechanically capable of production. Developed acreage is comprised of leased acres that are within an area by or assignable to a productive well. Undeveloped acreage is comprised of leased acres on which wells have not been drilled or completed to a point that would permit the production of economic quantities of oil and gas, regardless of whether such acres contain proved reserves.
The number of productive crude oil and natural gas wells in which we held an interest at 30 June 2016 was as follows:
Crude oil wells Natural gas wells Total
Gross Net Gross Net Gross Net
Australia 351 177 130 48 481 225United States 904 506 6,849 2,048 7,753 2,554Other (a) 56 23 36 7 92 30
Total 1,311 706 7,015 2,103 8,326 2,809
(a) Other is primarily comprised of Algeria and Trinidad and Tobago.
Of the productive crude oil and natural gas wells, 33 (net: 13) operated wells had multiple completions.
Developed and undeveloped acreage (including both leases and concessions) held at 30 June 2016 was as follows:
Developed acreage Undeveloped acreage
Thousands of acres Gross Net Gross Net
Australia 2,151 823 8,591 4,954United States 1,172 669 1,454 1,125Other (a) (b) 175 64 3,848 2,941
Total (b) 3,498 1,556 13,893 9,020
(a) BHP Billiton and Eni are pursuing a 10-year Production Sharing Contract (PSC) extension with Sonatrach in Algeria which is subject to regulatory approval. Current PSC expires in 2016.
(b) Undeveloped acreage primarily consists of acreage in Brazil, Trinidad and Tobago and South Africa.
Approximately 180 thousand gross acres (83 thousand net acres), 783 thousand gross acres (399 thousand net acres) and 7,896 thousand gross acres (4,850 thousand net acres) of undeveloped acreage will expire in the years ending 30 June 2017, 2018 and 2019 respectively, if the Company does not establish production or take any other action to extend the terms of the licences and concession.
6 Additional inform
ation7
Shareholder information
5Financial Statem
ents

230 BHP Billiton Annual Report 2016
Section 6 Additional information
In this section6.1 Information on mining operations6.2 Production 6.2.1 Minerals 6.2.2 Petroleum6.3 Reserves and resources 6.3.1 Petroleum reserves 6.3.2 Mineral Resources and Ore Reserves6.4 Major projects6.5 Legal proceedings6.6 Glossary 6.6.1 Mining, oil and gas-related terms 6.6.2 Other terms 6.6.3 Terms used in reserves and resources 6.6.4 Units of measure
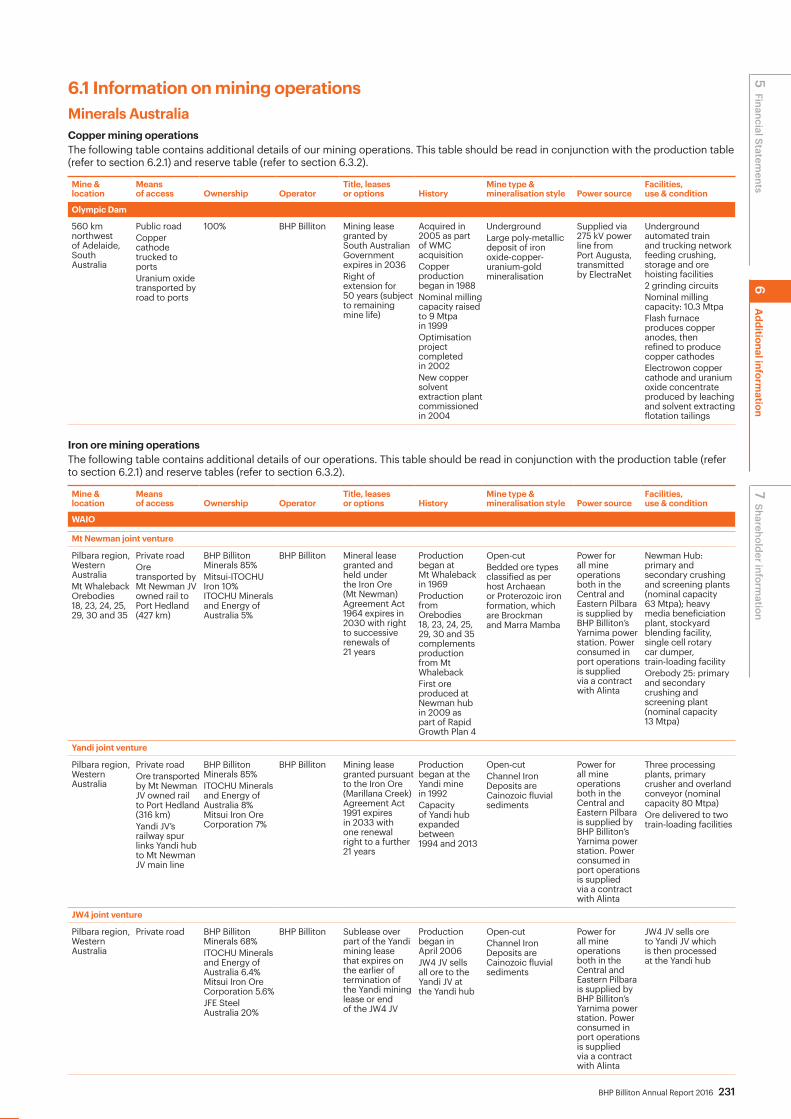
BHP Billiton Annual Report 2016 231
6.1 Information on mining operationsMinerals Australia Copper mining operationsThe following table contains additional details of our mining operations. This table should be read in conjunction with the production table (refer to section 6.2.1) and reserve table (refer to section 6.3.2).
Mine & location
Means of access Ownership Operator
Title, leases or options History
Mine type & mineralisation style Power source
Facilities, use & condition
Olympic Dam
560 km northwest of Adelaide, South Australia
Public roadCopper cathode trucked to portsUranium oxide transported by road to ports
100% BHP Billiton Mining lease granted by South Australian Government expires in 2036Right of extension for 50 years (subject to remaining mine life)
Acquired in 2005 as part of WMC acquisitionCopper production began in 1988Nominal milling capacity raised to 9 Mtpa in 1999Optimisation project completed in 2002New copper solvent extraction plant commissioned in 2004
Underground Large poly-metallic deposit of iron oxide-copper-uranium-gold mineralisation
Supplied via 275 kV power line from Port Augusta, transmitted by ElectraNet
Underground automated train and trucking network feeding crushing, storage and ore hoisting facilities 2 grinding circuits Nominal milling capacity: 10.3 Mtpa Flash furnace produces copper anodes, then refined to produce copper cathodes Electrowon copper cathode and uranium oxide concentrate produced by leaching and solvent extracting flotation tailings
Iron ore mining operationsThe following table contains additional details of our operations. This table should be read in conjunction with the production table (refer to section 6.2.1) and reserve tables (refer to section 6.3.2).
Mine & location
Means of access Ownership Operator
Title, leases or options History
Mine type & mineralisation style Power source
Facilities, use & condition
WAIO
Mt Newman joint venture
Pilbara region, Western Australia Mt Whaleback Orebodies 18, 23, 24, 25, 29, 30 and 35
Private road Ore transported by Mt Newman JV owned rail to Port Hedland (427 km)
BHP Billiton Minerals 85%Mitsui-ITOCHU Iron 10% ITOCHU Minerals and Energy of Australia 5%
BHP Billiton Mineral lease granted and held under the Iron Ore (Mt Newman) Agreement Act 1964 expires in 2030 with right to successive renewals of 21 years
Production began at Mt Whaleback in 1969Production from Orebodies 18, 23, 24, 25, 29, 30 and 35 complements production from Mt WhalebackFirst ore produced at Newman hub in 2009 as part of Rapid Growth Plan 4
Open-cut Bedded ore types classified as per host Archaean or Proterozoic iron formation, which are Brockman and Marra Mamba
Power for all mine operations both in the Central and Eastern Pilbara is supplied by BHP Billiton’s Yarnima power station. Power consumed in port operations is supplied via a contract with Alinta
Newman Hub: primary and secondary crushing and screening plants (nominal capacity 63 Mtpa); heavy media beneficiation plant, stockyard blending facility, single cell rotary car dumper, train-loading facilityOrebody 25: primary and secondary crushing and screening plant (nominal capacity 13 Mtpa)
Yandi joint venture
Pilbara region, Western Australia
Private roadOre transported by Mt Newman JV owned rail to Port Hedland (316 km)Yandi JV’s railway spur links Yandi hub to Mt Newman JV main line
BHP Billiton Minerals 85% ITOCHU Minerals and Energy of Australia 8% Mitsui Iron Ore Corporation 7%
BHP Billiton Mining lease granted pursuant to the Iron Ore (Marillana Creek) Agreement Act 1991 expires in 2033 with one renewal right to a further 21 years
Production began at the Yandi mine in 1992Capacity of Yandi hub expanded between 1994 and 2013
Open-cut Channel Iron Deposits are Cainozoic fluvial sediments
Power for all mine operations both in the Central and Eastern Pilbara is supplied by BHP Billiton’s Yarnima power station. Power consumed in port operations is supplied via a contract with Alinta
Three processing plants, primary crusher and overland conveyor (nominal capacity 80 Mtpa)Ore delivered to two train-loading facilities
JW4 joint venture
Pilbara region, Western Australia
Private road BHP Billiton Minerals 68% ITOCHU Minerals and Energy of Australia 6.4% Mitsui Iron Ore Corporation 5.6%JFE Steel Australia 20%
BHP Billiton Sublease over part of the Yandi mining lease that expires on the earlier of termination of the Yandi mining lease or end of the JW4 JV
Production began in April 2006JW4 JV sells all ore to the Yandi JV at the Yandi hub
Open-cutChannel Iron Deposits are Cainozoic fluvial sediments
Power for all mine operations both in the Central and Eastern Pilbara is supplied by BHP Billiton’s Yarnima power station. Power consumed in port operations is supplied via a contract with Alinta
JW4 JV sells ore to Yandi JV which is then processed at the Yandi hub
6A
dditional information
5 Financial Statements
7 Shareholder inform
ation

232 BHP Billiton Annual Report 2016
6 Additional information continued
Mine & location
Means of access Ownership Operator
Title, leases or options History
Mine type & mineralisation style Power source
Facilities, use & condition
WAIO continued
Jimblebar operation*
Pilbara region, Western Australia
Private road Ore is transported via overland conveyor (6 km)
BHP Billiton Minerals 85%ITOCHU Minerals and Energy of Australia 8%Mitsui & Co. Iron Ore Exploration & Mining 7%*Jimblebar is an ‘incorporated’ venture, with the above companies holding A Class Shares in BHP Iron Ore Jimblebar Pty Ltd (BHPIOJ)BHP Billiton Minerals holds 100% of the B Class Shares, which has rights to all other BHPIOJ assets
BHP Billiton Mining lease granted pursuant to the Iron Ore (McCamey’s Monster) Agreement Authorisation Act 1972 expires in 2030 with rights to successive renewals of 21 years
Production began in March 1989From 2004, production was transferred to Wheelarra JV as part of the Wheelarra sublease agreementOre was first produced from the newly commissioned Jimblebar hub in late 2013 Jimblebar sells ore to the Newman JV proximate to the Jimblebar hub
Open-cutBedded ore types classified as per host Archaean or Proterozoic banded iron formation, which are Brockman and Marra Mamba
Power for all mine operations both in the Central and Eastern Pilbara is supplied by BHP Billiton’s Yarnima power station. Power consumed in port operations is supplied via a contract with Alinta
Two primary and secondary crushers, ore handling plant, stockyards and supporting mining hub infrastructure (nominal capacity 55 Mtpa)
Wheelarra joint venture
Pilbara region, Western Australia
Private road Ore is transported via overland conveyor (6 km)
BHP Billiton Minerals 51%ITOCHU Minerals and Energy of Australia 4.8% Mitsui Iron Ore Corporation 4.2%Maanshan Iron & Steel Australia 10% Shagang Australia 10% Hebei Iron & Steel Australia 10% Wugang Australia 10%
BHP Billiton Sublease over part of the Jimblebar mining lease that expires on the earlier of termination of the mining lease or end of the Wheelarra Joint Venture
Production began in 2004Wheelarra JV sells all ore to the Mt Newman JV at the Jimblebar hub
Open-cutBedded ore types classified as per host Archaean or Proterozoic banded iron formation, which is Brockman
Power for all mine operations both in the Central and Eastern Pilbara is supplied by BHP Billiton’s Yarnima power station. Power consumed in port operations is supplied via a contract with Alinta
Wheelarra JV processes all ore at the Jimblebar hub
Mt Goldsworthy joint venture
Pilbara region, Western Australia Area C Yarrie Nimingarra
Private road Yarrie and Nimingarra iron ore transported by Mt Goldsworthy JV owned rail to Port Hedland (218 km)Area C iron ore transported by Mt Newman JV-owned rail to Port Hedland (360 km)Mt Goldsworthy JV railway spur links Area C to Yandi railway spur
BHP Billiton Minerals 85% Mitsui Iron Ore Corporation 7%ITOCHU Minerals and Energy of Australia 8%
BHP Billiton Three mineral leases granted under the Iron Ore (Mt Goldsworthy) Agreement Act 1964 and one mineral lease and one mining lease both granted pursuant to the Iron Ore (Goldsworthy – Nimingarra) Agreement Act 1972, expire between 2014 and 2028, with rights to successive renewals of 21 years
Operations commenced at Mt Goldsworthy in 1966 and at Shay Gap in 1973Original Goldsworthy mine closed in 1982 Associated Shay Gap mine closed in 1993Mining at Nimingarra mine ceased in 2007, then continued from adjacent Yarrie area Production commenced at Area C mine in 2003Yarrie mine operations were suspended in February 2014
Area C, Yarrie and Nimingarra all open-cutBedded ore types classified as per host Archaean or Proterozoic iron formation, which are Brockman, Marra Mamba and Nimingarra
Power for all mine operations both in the Central and Eastern Pilbara is supplied by BHP Billiton’s Yarnima power station. Power consumed in port operations is supplied via a contract with Alinta
Ore processing plant, primary crusher and overland conveyor (nominal capacity 60 Mtpa)
POSMAC joint venture
Pilbara Region, Western Australia
Private roadPOSMAC JV sells ore to Mt Goldsworthy JV at Area C
BHP Billiton Minerals 65% ITOCHU Minerals and Energy of Australia 8%, Mitsui Iron Ore Corporation 7%POS-Ore 20%
BHP Billiton Sublease over part of Mt Goldsworthy Mining Area C mineral lease that expires on the earlier of termination of the mineral lease or the end of the POSMAC JV
Production commenced in October 2003POSMAC JV sells all ore to Mt Goldsworthy JV at Area C
Open-cut Bedded ore types classified as per host Archaean or Proterozoic iron formation, which is Marra Mamba
Power for all mine operations both in the Central and Eastern Pilbara is supplied by BHP Billiton’s Yarnima power station. Power consumed in port operations is supplied via a contract with Alinta
POSMAC sells all ore to Mt Goldsworthy JV which is then processed at Area C
Minerals Australia continued

BHP Billiton Annual Report 2016 233
Minerals Australia continuedCoal mining operationsThe following table contains additional details of our mining operations. The tables should be read in conjunction with the production table (refer to section 6.2.1) and reserves table (refer to section 6.3.2).
Mine & location
Means of access Ownership Operator
Title, leases or options History
Mine type & mineralisation style Power source
Facilities, use & condition
Queensland Coal
Central Queensland Coal Associates joint venture
Bowen Basin, Queensland, Australia Goonyella Riverside, Broadmeadow Daunia Caval Ridge Peak Downs Saraji Blackwater and Norwich Park mines
Public roadCoal transported by rail to Hay Point, Gladstone, Dalrymple Bay and Abbot Point portsDistances between the mines and port are between 160 km and 315 km
BHP Billiton 50% Mitsubishi Development 50%
BMA Mining leases, including undeveloped tenements, expire between 2017 and 2043, renewable for further periods as Queensland Government legislation allowsMining is permitted to continue under the legislation during the renewal application period
Goonyella mine commenced in 1971, merged with adjoining Riverside mine in 1989Operates as Goonyella RiversideProduction commenced at: Peak Downs in 1972 Saraji in 1974 Norwich Park in 1979 Blackwater in 1967 Broadmeadow (longwall operations) in 2005 Daunia in 2013 and Caval Ridge in 2014Production at Norwich Park ceased in May 2012
All open-cut except Broadmeadow: longwall undergroundBituminous coal is mined from the Permian Moranbah and Rangal Coal measuresProducts range from premium quality, low volatile, high vitrinite, hard coking coal to medium volatile hard coking coal, to weak coking coal, some pulverised coal injection (PCI) coal and medium ash thermal coal as a secondary product
Queensland electricity grid connection is under long-term contracts and power source is under 5-year contracts
On-site beneficiation processing facilitiesCombined nominal capacity: in excess of 65 Mtpa
Gregory joint venture
Bowen Basin, Queensland, AustraliaGregory and Crinum mines
Public roadCoal transported by rail to Hay Point and Gladstone portsDistances between the mines and port are between 310 km and 370 km
BHP Billiton 50%Mitsubishi Development 50%
BMA Mining leases, including undeveloped tenements, expire between 2018 and 2035, renewable for further periods as Queensland Government legislation allowsMining is permitted to continue under the legislation during the renewal application period
Production commenced at:Gregory in 1979Crinum mine (longwall) commenced in 1997Production at Gregory open-cut mine ceased in October 2012Production at Crinum underground mine ceased in November 2015
Gregory: open-cut Crinum: longwall underground Bituminous coal is mined from the Permian German Creek Coal measuresProduct is a high volatile, low ash hard coking coal
Queensland electricity grid connection is under long-term contracts and power source is under 5-year contracts
On-site beneficiation processing facility Facilities under care and maintenance
BHP Billiton Mitsui Coal
Bowen Basin, Queensland, AustraliaSouth Walker Creek and Poitrel mines
Public road Coal transported by rail to Hay Point and Dalrymple Bay ports Distances between the mines and port are between 135 km and 165 km
BHP Billiton 80% Mitsui and Co 20%
BMC Mining leases, including undeveloped tenements expire between 2020 and 2034, and are renewable for further periods as Queensland Government legislation allowsMining is permitted to continue under the legislation during the renewal application period
South Walker Creek commenced in 1996 Poitrel commenced in 2006
Open-cut Bituminous coal is mined from the Permian Rangal Coal measures Produces a range of coking coal and pulverised coal injection (PCI) coal.
Queensland electricity grid
South Walker Creek coal beneficiated on-siteNominal capacity: in excess of 5 Mtpa Poitrel mine has Red Mountain joint venture with adjacent Millennium Coal mine to share processing and rail loading facilitiesNominal capacity: in excess of 3 Mtpa
6A
dditional information
5 Financial Statements
7 Shareholder inform
ation
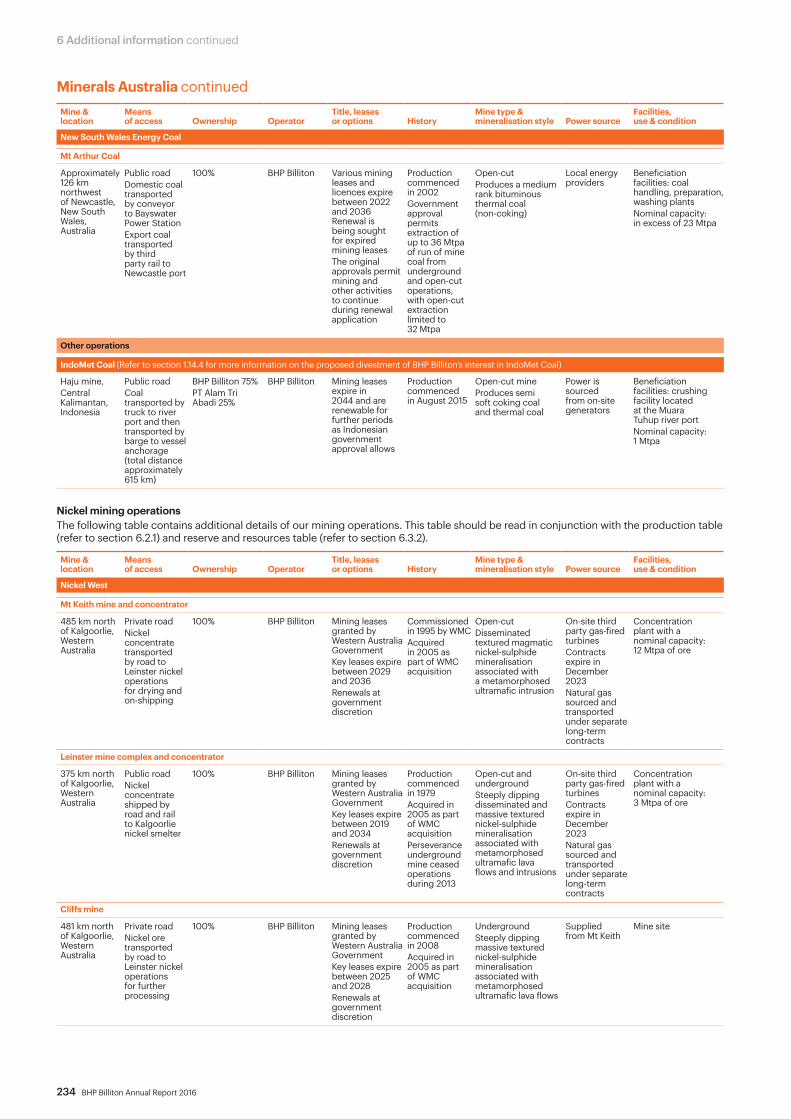
234 BHP Billiton Annual Report 2016
6 Additional information continued
Mine & location
Means of access Ownership Operator
Title, leases or options History
Mine type & mineralisation style Power source
Facilities, use & condition
New South Wales Energy Coal
Mt Arthur Coal
Approximately 126 km northwest of Newcastle, New South Wales, Australia
Public roadDomestic coal transported by conveyor to Bayswater Power StationExport coal transported by third party rail to Newcastle port
100% BHP Billiton Various mining leases and licences expire between 2022 and 2036 Renewal is being sought for expired mining leasesThe original approvals permit mining and other activities to continue during renewal application
Production commenced in 2002 Government approval permits extraction of up to 36 Mtpa of run of mine coal from underground and open-cut operations, with open-cut extraction limited to 32 Mtpa
Open-cut Produces a medium rank bituminous thermal coal (non-coking)
Local energy providers
Beneficiation facilities: coal handling, preparation, washing plantsNominal capacity: in excess of 23 Mtpa
Other operations
IndoMet Coal (Refer to section 1.14.4 for more information on the proposed divestment of BHP Billiton’s interest in IndoMet Coal)
Haju mine,Central Kalimantan, Indonesia
Public road Coal transported by truck to river port and then transported by barge to vessel anchorage (total distance approximately 615 km)
BHP Billiton 75%PT Alam Tri Abadi 25%
BHP Billiton Mining leases expire in 2044 and are renewable for further periods as Indonesian government approval allows
Production commenced in August 2015
Open-cut mineProduces semi soft coking coal and thermal coal
Power is sourced from on-site generators
Beneficiation facilities: crushing facility located at the Muara Tuhup river port Nominal capacity: 1 Mtpa
Nickel mining operationsThe following table contains additional details of our mining operations. This table should be read in conjunction with the production table (refer to section 6.2.1) and reserve and resources table (refer to section 6.3.2).
Mine & location
Means of access Ownership Operator
Title, leases or options History
Mine type & mineralisation style Power source
Facilities, use & condition
Nickel West
Mt Keith mine and concentrator
485 km north of Kalgoorlie, Western Australia
Private roadNickel concentrate transported by road to Leinster nickel operations for drying and on-shipping
100% BHP Billiton Mining leases granted by Western Australia GovernmentKey leases expire between 2029 and 2036Renewals at government discretion
Commissioned in 1995 by WMCAcquired in 2005 as part of WMC acquisition
Open-cutDisseminated textured magmatic nickel-sulphide mineralisation associated with a metamorphosed ultramafic intrusion
On-site third party gas-fired turbinesContracts expire in December 2023Natural gas sourced and transported under separate long-term contracts
Concentration plant with a nominal capacity: 12 Mtpa of ore
Leinster mine complex and concentrator
375 km north of Kalgoorlie, Western Australia
Public roadNickel concentrate shipped by road and rail to Kalgoorlie nickel smelter
100% BHP Billiton Mining leases granted by Western Australia GovernmentKey leases expire between 2019 and 2034Renewals at government discretion
Production commenced in 1979Acquired in 2005 as part of WMC acquisitionPerseverance underground mine ceased operations during 2013
Open-cut and undergroundSteeply dipping disseminated and massive textured nickel-sulphide mineralisation associated with metamorphosed ultramafic lava flows and intrusions
On-site third party gas-fired turbinesContracts expire in December 2023 Natural gas sourced and transported under separate long-term contracts
Concentration plant with a nominal capacity: 3 Mtpa of ore
Cliffs mine
481 km north of Kalgoorlie, Western Australia
Private roadNickel ore transported by road to Leinster nickel operations for further processing
100% BHP Billiton Mining leases granted by Western Australia GovernmentKey leases expire between 2025 and 2028Renewals at government discretion
Production commenced in 2008Acquired in 2005 as part of WMC acquisition
UndergroundSteeply dipping massive textured nickel-sulphide mineralisation associated with metamorphosed ultramafic lava flows
Supplied from Mt Keith
Mine site
Minerals Australia continued

BHP Billiton Annual Report 2016 235
Minerals Australia continuedNickel smelters, refineries and processing plantsSmelter, refinery or processing plant Location Ownership Operator
Title, leases or options Product
Nominal production capacity Power source
Nickel West continued
Kambalda
Nickel concentrator 56 km south of Kalgoorlie, Western Australia
100% BHP Billiton Mining leases granted by Western Australia GovernmentKey leases expire in 2028
Concentrate containing approximately 13% nickel
1.6 Mtpa oreOre sourced through tolling and concentrate purchase arrangements with third parties in Kambalda region
On-site third party gas-fired turbines supplemented by access to grid powerContracts expire in December 2023Natural gas sourced and transported under separate long-term contracts
Kalgoorlie
Nickel smelter Kalgoorlie, Western Australia
100% BHP Billiton Freehold title over the property
Matte containing approximately 65% nickel
110 ktpa matte On-site third party gas-fired turbines supplemented by access to grid powerContracts expire in December 2023Natural gas sourced and transported under separate long-term contracts
Kwinana
Nickel refinery 30 km south of Perth, Western Australia
100% BHP Billiton Freehold title over the property
LME grade nickel briquettes, nickel powderAlso intermediate products, including copper sulphide, cobalt-nickel-sulphide, ammonium-sulphate
72 ktpa nickel matte Power is sourced from the local grid, which is supplied under a retail contract
Minerals AmericasCopper mining operationsThe following table contains additional details of our mining operations. This table should be read in conjunction with the production table (refer to section 6.2.1) and reserve table (refer to section 6.3.2).
Mine & location
Means of access Ownership Operator
Title, leases or options History
Mine type & mineralisation style Power source
Facilities, use & condition
Escondida
Atacama Desert 170 km southeast of Antofagasta, Chile
Private road available for public useCopper cathode transported by privately owned rail to ports at Antofagasta and MejillonesCopper concentrate transported by Escondida-owned pipelines to its Coloso port facilities
BHP Billiton 57.5% of Minera Escondida Limitada (MEL)Rio Tinto 30% JECO Corporation consortium comprising Mitsubishi, JX Nippon Mining and Metals 10% JECO2 Ltd 2.5%
BHP Billiton Mining concession from Chilean Government valid indefinitely (subject to payment of annual fees)
Original construction completed in 1990 Sulphide leach copper production commenced in 2006
2 open-cut pits: Escondida and Escondida NorteEscondida and Escondida Norte mineral deposits are adjacent but distinct supergene enriched porphyry copper deposits
Escondida-owned transmission lines connect to Chile’s northern power gridElectricity purchased under contracts expiring 2016 and 2029. From second half CY2016, power will begin to be sourced from the Kelar gas-fired power plant, which is currently under construction
3 concentrator plants extract copper concentrate from sulphide ore by flotation extraction process2 solvent extraction plants produce copper cathodeNominal capacity: 153.7 Mtpa (nominal milling capacity) and 350 ktpa copper cathode (nominal capacity of tank house)Two 168 km concentrate pipelines167 km water pipeline Port facilities at Coloso, Antofagasta
Pampa Norte Spence
Atacama Desert 162 km northeast of Antofagasta, Chile
Public roadCopper cathode transported by rail to ports at Mejillones and Antofagasta
100% BHP Billiton Mining concession from Chilean Government valid indefinitely (subject to payment of annual fees)
Development cost of US$1.1 billion approved in 2004First copper produced in 2006
Open-cut Enriched and oxidised porphyry copper deposit containing in situ copper oxide mineralisation that overlies a near-horizontal sequence of supergene sulphides, transitional sulphides, and finally primary (hypogene) sulphide mineralisation
Spence-owned transmission lines connect to Chile’s northern power gridElectricity purchased under contract
Processing and crushing facilities, separate dynamic (on-off) leach pads, solvent extraction plant, electrowinning plant Nominal capacity of tank house: 200 ktpa copper cathode
6A
dditional information
5 Financial Statements
7 Shareholder inform
ation

236 BHP Billiton Annual Report 2016
6 Additional information continued
Mine & location
Means of access Ownership Operator
Title, leases or options History
Mine type & mineralisation style Power source
Facilities, use & condition
Pampa Norte Cerro Colorado
Atacama Desert 120 km east of Iquique, Chile
Public roadCopper cathode trucked to port at Iquique
100% BHP Billiton Mining concession from Chilean Government valid indefinitely (subject to payment of annual fees)
Commercial production commenced in 1994Expansions in 1996 and 1998
Open-cut Enriched and oxidised porphyry copper deposit containing in situ copper oxide mineralisation that overlies a near-horizontal sequence of supergene sulphides, transitional sulphides, and finally primary (hypogene) sulphide mineralisation
Long-term contracts with northern Chile power grid
2 primary, secondary and tertiary crushers, leaching pads, solvent extraction plant, electrowinning plantNominal capacity of tank house: 102 ktpa copper cathode
Antamina
Andes mountain range 270 km north of Lima, north central Peru
Public roadCopper and zinc concentrates transported by pipeline to port of HuarmeyMolybdenum and lead/bismuth concentrates transported by truck
BHP Billiton 33.75% of Compañía Minera Antamina S.A.Glencore 33.75% Teck 22.5% Mitsubishi 10%
Compañía Minera Antamina S.A.
Mining rights from Peruvian Government held indefinitely, subject to payment of annual fees and supply of information on investment and production
Commercial production commenced in 2001 Capital cost US$2.3 billion (100%)
Open-cut Zoned porphyry and skarn deposit with central copper dominated ores and an outer band of copper-zinc dominated ores
Long-term contracts with individual power producers
Primary crusher, concentrator, copper and zinc flotation circuits, bismuth/moly cleaning circuitNominal milling capacity 53 Mtpa300 km concentrate pipeline Port facilities at Huarmey
Iron ore mining operationsThe following table contains additional details of our mining operations. This table should be read in conjunction with the production table (refer to section 6.2.1) and reserve table (refer to section 6.3.2).
Mine & location
Means of access Ownership Operator
Title, leases or options History
Mine type & mineralisation style Power source
Facilities, use & condition
Samarco
Southeast Brazil
Public roadConveyor belts were used to transport iron ore to beneficiation plantThree slurry pipelines used to transport concentrate to pellet plants on coastIron pellets were exported via port facilities
BHP Billiton Brasil 50% of Samarco Mineração S.A.Vale S.A. 50%
Samarco The mining facilities are currently under administrative embargoes and judicial injunction given the Fundão dam failure
Production began at Germano mine in 1977 and at Alegria complex in 1992Second pellet plant built in 1997Third pellet plant, second concentrator and second pipeline built in 2008 Fourth pellet plant, third concentrator and third pipeline built in 2014
Open-cut Itabirites (metamorphic quartz-hematite rock) and friable hematite ores
Samarco holds interests in 2 hydroelectric power plants which supply part of its electricityPower supply contract with Cemig Geração e Transmissão expires in 2022
Samarco mining activities are currently suspended after the failure of Fundão damThe beneficiation plants, pipelines, pellet plants and port facilities are intact
Minerals Americas continued

BHP Billiton Annual Report 2016 237
Coal mining operationsThe following table contains additional details of our mining operations. The tables should be read in conjunction with the production table (refer to section 6.2.1) and reserves table (refer to section 6.3.2).
Mine & location
Means of access Ownership Operator
Title, leases or options History
Mine type & mineralisation style Power source
Facilities, use & condition
Navajo
40 km southwest of Farmington, New Mexico, United States
Public road Coal transported by rail to Four Corners Power Plant
BHP Billiton 0%Navajo Transitional Energy Company 100%
BHP Billiton Lease held by Navajo Transitional Energy Company
Production commenced in 1963 Divested in FY2014BHP Billiton continues as operator
Open-cut Produces a medium rank bituminous thermal coal (non-coking suitable for the domestic market only)
Four Corners Power Plant
Stackers and reclaimers used to size and blend coal to meet contract quantities and specificationNominal capacity in excess of 4 Mtpa
Cerrejón
La Guajira province, Colombia
Public roadCoal exported by company-owned rail to Puerto Bolivar (150 km)
BHP Billiton 33.33%Anglo American 33.33% Glencore 33.33%
Cerrejón Mining leases expire in 2034
Original mine began producing in 1976BHP Billiton interest acquired in 2000
Open-cut Produces a medium rank bituminous thermal coal (non-coking, suitable for the export market)
Local Colombian power system
Beneficiation facilities: crushing plant with capacity of 35 Mtpa and washing plantNominal capacity in excess 3 Mtpa
PetroleumPetroleum operationsThe following table contains additional details of our production operations. This table should be read in conjunction with the production table (refer to section 6.2.2) and reserve table (refer to section 6.3.1).
Operation & location Product Ownership Operator
Title, leases or options
Nominal production capacity
Facilities, use & condition
United States
Offshore Gulf of Mexico
Neptune (Green Canyon 613)
Offshore deepwater Gulf of Mexico (1,300m)
Oil and gas BHP Billiton 35%EnVen Energy 30% W&T Offshore 20% Maxus US Exploration 15%
BHP Billiton Lease from US Government as long as oil and gas produced in paying quantities
50 Mbbl/d oil 50 MMcf/d gas
Stand-alone tension leg platform (TLP)
Shenzi (Green Canyon 653)
Offshore deepwater Gulf of Mexico (1,310m)
Oil and gas BHP Billiton 44%Hess Shenzi LLC 28% Repsol 28%
BHP Billiton Lease from US Government as long as oil and gas produced in paying quantities
100 Mbbl/d oil 50 MMcf/d gas
Stand-alone TLP Genghis Khan field (part of same geological structure) tied back to Marco Polo TLP
Atlantis (Green Canyon 743)
Offshore deepwater Gulf of Mexico (2,155m)
Oil and gas BHP Billiton 44% BP 56%
BP Lease from US Government as long as oil and gas produced in paying quantities
200 Mbbl/d oil 180 MMcf/d gas
Moored semi-submersible platform
Mad Dog (Green Canyon 782)
Offshore deepwater Gulf of Mexico (1,310m)
Oil and gas BHP Billiton 23.9%
BP 60.5% Chevron 15.6%
BP Lease from US Government as long as oil and gas produced in paying quantities
80 Mbbl/d oil 60 MMcf/d gas
Moored integrated truss spar, facilities for simultaneous production and drilling operations
Genesis (Green Canyon 205)
Offshore deepwater Gulf of Mexico (approximately 790m)
Oil and gas BHP Billiton 4.95% Chevron 56.67% ExxonMobil 38.38%
Chevron Lease from US Government as long as oil and gas produced in paying quantities
55 Mbbl/d oil 72 MMcf/d gas
Floating cylindrical hull (spar) moored to seabed with integrated drilling facilities
Onshore US
Eagle Ford
Black Hawk/Hawkville southern Texas
Condensate, gas and NGL
BHP Billiton working interest in wells ranges from less than 1% to 100% BHP Billiton average net working interest is approximately 64% Largest partners include Devon Energy and EF Non OP LLC
BHP Billiton operated approximately 39% of approximately 1,441 gross wells
We currently own leasehold interests in approximately 252 thousand net acresLeases associated with producing wells remain in place as long as oil and gas is produced in paying quantities
Average daily production during FY2016 262 MMcf/d gas 73 Mbbl/d condensate 38 Mbbl/d NGL
Producing condensate and gas wells and associated pipeline and compression facilities
6A
dditional information
5 Financial Statements
7 Shareholder inform
ation
Minerals Americas continued

238 BHP Billiton Annual Report 2016
6 Additional information continued
Operation & location Product Ownership Operator
Title, leases or options
Nominal production capacity
Facilities, use & condition
United States continued
Onshore US continued
Permian
Permian western Texas
Oil, condensate, gas and NGL
BHP Billiton working interest in wells range from less than 1% to 100% BHP Billiton average net working interest is approximately 91% Residual ownership held by multiple partners
BHP Billiton operated approximately 91% of approximately 118 gross wells
We currently own leasehold interests in approximately 93 thousand net acresLeases associated with producing wells remain in place as long as oil and gas is produced in paying quantities
Average daily production during FY2016 40 MMcf/d gas 16 Mbbl/d oil 4 Mbbl/d NGL
Producing oil and gas wells with associated gathering systems to third party processing plant and compression facilities
Haynesville
Haynesville northern Louisiana and eastern Texas
Gas BHP Billiton working interest in wells range from less than 1% to 100% BHP Billiton average net working interest is approximately 37% Largest partners include Chesapeake Energy and QEP Energy
BHP Billiton operated approximately 35% of approximately 1,112 gross wells
We currently own leasehold interests in approximately 206 thousand net acresLeases associated with producing wells remain in place as long as gas is produced in paying quantities
Average daily production during FY2016 374 MMcf/d gas
Producing gas wells with an associated pipeline owned by a third party and compression infrastructure
Fayetteville
Fayetteville northern central Arkansas
Gas BHP Billiton working interest in wells range from less than 1% to 100% BHP Billiton average net working interest is approximately 22% Largest partners include Southwestern Energy and Exxon Mobil
BHP Billiton operated approximately 20% of approximately 5,016 gross wells
We currently own leasehold interests in approximately 287 thousand net acresLeases associated with producing wells remain in place as long as gas is produced in paying quantities
Average daily production during FY2016 322 MMcf/d gas
Producing gas wells with associated pipeline and compression infrastructure
Australia
Bass Strait
Offshore and onshore Victoria
Oil and gas Gippsland Basin joint venture (GBJV): BHP Billiton 50% Esso Australia (Exxon Mobil subsidiary) 50% Oil Basins Ltd 2.5% royalty interest in 19 production licencesKipper Unit joint venture (KUJV): BHP Billiton 32.5% Esso Australia 32.5% MEPAU A Pty Ltd 35%
Esso Australia 20 production licences and 2 retention leases issued by Australian GovernmentExpire between 2016 and end of life of fieldOne production licence held with MEPAU A Pty Ltd
200 Mbbl/d oil 1,075 MMcf/d gas 5,150 tpd LPG 850 tpd ethane
20 producing fields with 23 offshore developments (15 steel jacket platforms, 4 subsea developments, 2 steel gravity based mono towers, 2 concrete gravity based platforms)Onshore infrastructure:• Longford facility
(3 gas plants, liquid processing facilities)
• Interconnecting pipelines• Long Island Point LPG
and oil storage facilities• Ethane pipeline
North West Shelf
Offshore and onshore Western AustraliaNorth Rankin Goodwyn Perseus Angel and Searipple fields
Domestic gas, LPG, condensate, LNG
North West Shelf Project is an unincorporated JVBHP Billiton: 8.33% of original domestic gas JV, will ultimately increase to 16.67% 16.67% of Incremental Pipeline Gas (IPG) domestic gas JV 16.67% of original LNG JV 12.5% of China LNG JV 16.67% of LPG JVOther participants: subsidiaries of Woodside, Chevron, BP, Shell, Mitsubishi/Mitsui and China National Offshore Oil Corporation
Woodside Petroleum Ltd
9 production licences issued by Australian Government6 expire in 2022 and 3 expire 5 years from end of production
North Rankin Complex: 2,500 MMcf/d gas 60 Mbbl/d condensateGoodwyn A platform: 1,450 MMcf/d gas 110 Mbbl/d condensate Angel platform: 960 MMcf/d gas 50 Mbbl/d condensateWithnell Bay gas plant: 600 MMcf/d gas 5-train LNG plant: 52,000 tpd LNG
Production from North Rankin and Perseus processed through the interconnected North Rankin A and North Rankin B platformsProduction from Goodwyn and Searipple processed through Goodwyn A platform 4 subsea wells in Perseus field tied into Goodwyn A platformProduction from Angel field processed through Angel platformOnshore gas treatment plant at Withnell Bay processes gas for domestic market5-train LNG plant
North West Shelf
Offshore Western AustraliaWanaea Cossack Lambert and Hermes fields
Oil BHP Billiton 16.67% Woodside 33.34%, BP, Chevron, Japan Australia LNG (MIMI) 16.67% each
Woodside Petroleum Ltd
3 production licences issued by Australian Government in September 2014 expire in 2018, 2033 and 2035 respectively
Production: 60 Mbbl/d Storage: 1 MMbbl
FPSO unit
Petroleum continued

BHP Billiton Annual Report 2016 239
Operation & location Product Ownership Operator
Title, leases or options
Nominal production capacity
Facilities, use & condition
Australia continued
Pyrenees
Offshore Western AustraliaCrosby Moondyne Wild Bull Tanglehead Stickle and Ravensworth fields
Oil WA-42-L permit: BHP Billiton 71.43%Quadrant PVG P/L 28.57%WA-43-L permit: BHP Billiton 39.999%Quadrant PVG P/L 31.501% Inpex Alpha Ltd 28.5%
BHP Billiton Production licence issued by Australian Government expires 5 years after production ceases
Production: 96 Mbbl/d oilStorage: 920 Mbbl
26 subsea well completions (21 producers, 4 water injectors, 1 gas injector), FPSO
Macedon
Offshore and onshore Western Australia
Gas and condensate
WA-42-L permit BHP Billiton 71.43% Quadrant PVG P/L 28.57%
BHP Billiton Production licence issued by Australian Government expires 5 years after production ceases
Production: 200 MMcf/d gas 20 bbl/d condensate
4 well completionsSingle flow line transports gas to onshore gas processing facilityGas plant located approximately 17 km southwest of Onslow
Minerva
Offshore and onshore Victoria
Gas and condensate
BHP Billiton 90% Santos (BOL) 10%
BHP Billiton Production licence issued by Australian Government expires 5 years after production ceases
150 TJ/d gas 600 bbl/d condensate
2 subsea well completions (1 producing well)Single flow line transports gas to onshore gas processing facilityGas plant located approximately 4 km inland from Port Campbell
Other production operations
Trinidad and Tobago
Greater Angostura
Offshore Trinidad and Tobago
Oil and gas BHP Billiton 45% National Gas Company 30% Chaoyang 25%
BHP Billiton Production sharing contract with the Trinidad and Tobago Government entitles us to operate Greater Angostura until 2026
100 Mbbl/d oil 280 MMcf/d gas
Integrated oil and gas development: central processing platform connected to the Kairi-2 platform and gas export platform31 subsea well completions (17 oil producers, 4 gas producers and 7 gas injectors)3 gas producers completed in FY2016 and with production planned for Q1 FY2017
Algeria
ROD Integrated Development
Onshore Berkine Basin 900 km southeast of Algiers, Algeria
Oil BHP Billiton 45% interest in 401a/402a production sharing contract ENI 55% BHP Billiton effective 38% interest in ROD unitised integrated development ENI 62%
Joint Sonatrach/ENI entity
Production sharing contract with Sonatrach (title holder)BHP Billiton and Eni are pursuing a 10-year PSC extension with Sonatrach, which is subject to regulatory approval. Current PSC expires in 2016.
Approximately 80 Mbbl/d oil
Development and production of 6 oil fields2 largest fields (ROD and SFNE) extend into neighbouring blocks 403a, 403d Production through dedicated processing train on block 403
United Kingdom
Bruce/Keith
Offshore North Sea, UK
Oil and gas Bruce: BHP Billiton 16%BP 37% Total SA 43.25% Marubeni 3.75% Keith: BHP Billiton 31.83% BP 34.84% Total SA 25% Marubeni 8.33%
Bruce – BPKeith – BP
3 production licences issued by UK Government expire in 2018, 2046 and end of life of field
920 MMcf/d gas Integrated oil and gas platform Keith developed as tie-back to Bruce facilities
Pakistan (BHP Billiton’s interest in Pakistan was divested 31 December 2015)
Zamzama
Onshore Sindh Province, Pakistan
Gas and condensate
BHP Billiton 38.5% ENI Pakistan 17.75% PKP Exploration 9.375% PKP Exploration 2 9.375% Government Holdings 25%
BHP Billiton 20-year development and production lease from the Pakistan Government expires in 2022 (option to extend 5 years)
500 MMcf/d gas 3,350 bbl/d condensate
10 production wells 4 process trains 2 front end compression trains
6A
dditional information
5 Financial Statements
7 Shareholder inform
ation
Petroleum continued

240 BHP Billiton Annual Report 2016
6 Additional information continued
6.2 Production6.2.1 MineralsThe table below details our mineral and derivative product production for all operations (except Petroleum) for the three years ended 30 June 2016, 2015 and 2014. Unless otherwise stated, the production numbers represent our share of production and include BHP Billiton’s share of production from which profit is derived from our equity accounted investments. Production information for equity accounted investments is included to provide insight into the operational performance of these entities. For discussion of minerals pricing during the past three years, refer to section 1.8.1.
BHP Billiton Group interest
%
BHP Billiton Group share of production (1)
Year ended 30 June
2016 2015 2014
Copper (2)
Payable metal in concentrate (‘000 tonnes)Escondida, Chile (3) 57.5 648.9 916.1 844.7 Antamina, Peru (4) 33.75 146.4 107.7 143.5 Pinto Valley, United States (5) 100 – – 12.5
Total copper concentrate 795.3 1,023.8 1,000.7
Copper cathode (‘000 tonnes)Escondida, Chile (3) 57.5 330.3 310.4 308.0 Pampa Norte, Chile (6) 100 251.4 249.6 233.1 Pinto Valley, United States (5) 100 – – 0.9Olympic Dam, Australia 100 202.8 124.5 184.4
Total copper cathode 784.5 684.5 726.4
Total copper concentrate and cathode 1,579.8 1,708.3 1,727.1
LeadPayable metal in concentrate (‘000 tonnes)Antamina, Peru (4) 33.75 3.7 2.1 1.5
Total lead 3.7 2.1 1.5
ZincPayable metal in concentrate (‘000 tonnes)Antamina, Peru (4) 33.75 55.4 66.4 52.0
Total zinc 55.4 66.4 52.0
GoldPayable metal in concentrate (‘000 ounces)Escondida, Chile (3) 57.5 109 81.5 72.9 Pinto Valley, United States (5) 100 – – 0.1Olympic Dam, Australia (refined gold) 100 117.7 104.8 121.3
Total gold 226.7 186.3 194.3
SilverPayable metal in concentrate (‘000 ounces)Escondida, Chile (3) 57.5 5,561 4,786 4,271 Antamina, Peru (4) 33.75 6,711 3,826 4,359 Pinto Valley, United States (5) 100 – – 41Olympic Dam, Australia (refined silver) 100 917 724 972
Total silver 13,189 9,336 9,643
Uranium Payable metal in concentrate (tonnes)Olympic Dam, Australia 100 4,363 3,144 3,988
Total uranium 4,363 3,144 3,988
MolybdenumPayable metal in concentrate (tonnes)Antamina, Peru (4) 33.75 1,113 472 1,201
Total molybdenum 1,113 472 1,201

BHP Billiton Annual Report 2016 241
BHP Billiton Group interest
%
BHP Billiton Group share of production (1)
Year ended 30 June
2016 2015 2014
Iron oreWestern Australia Iron OreProduction (‘000 tonnes) (7)
Newman, Australia 85 65,941 63,697 56,915 Yarrie, Australia(8) 85 – − 836 Area C Joint Venture, Australia 85 46,799 49,994 46,960 Yandi Joint Venture, Australia 85 67,375 68,551 68,518 Jimblebar, Australia(9) 85 18,890 16,759 8,863 Wheelarra, Australia(10) 85 22,549 18,994 10,553
Total Western Australia Iron Ore 221,554 217,995 192,645
Samarco, Brazil(4) 50 5,404 14,513 10,919
Total iron ore 226,958 232,508 203,564
Coal Metallurgical coalProduction (‘000 tonnes)(11) Blackwater, Australia 50 7,626 6,994 6,730 Goonyella Riverside, Australia 50 8,996 8,510 7,330 Peak Downs, Australia 50 5,031 5,111 4,909 Saraji, Australia 50 4,206 4,506 4,558 Gregory Joint Venture, Australia 50 1,329 3,294 2,965 Daunia, Australia 50 2,624 2,383 2,201 Caval Ridge, Australia(12) 50 3,601 3,064 563
Total BHP Billiton Mitsubishi Alliance 33,413 33,862 29,256
South Walker Creek, Australia(13) 80 5,436 5,293 5,246 Poitrel, Australia(13) 80 3,462 3,466 3,063
Total BHP Billiton Mitsui Coal 8,898 8,759 8,309
Total Queensland Coal 42,311 42,621 37,565
IndoMet, Haju, Indonesia 100 529 – –
Total metallurgical coal 42,840 42,621 37,565
Energy coalProduction (‘000 tonnes) Navajo, United States(14) 100 3,999 4,858 5,127San Juan, United States 100 3,053 5,165 5,685
Total New Mexico Coal 7,052 10,023 10,812
New South Wales Energy Coal, Australia 100 17,101 19,698 19,964Cerrejón, Colombia(4) 33.3 10,094 11,291 12,332
Total energy coal 34,247 41,012 43,108
Other assetsNickelSaleable production (‘000 tonnes)Nickel West, Australia 100 80.7 89.9 98.9
Total nickel 80.7 89.9 98.9
Discontinued operations(15)
LeadPayable metal in concentrate (‘000 tonnes)Cannington, Australia 100 – 151.6 186.5
Total lead – 151.6 186.5
ZincPayable metal in concentrate (‘000 tonnes)Cannington, Australia 100 – 60.0 57.9
Total zinc – 60.0 57.9
SilverPayable metal in concentrate (‘000 ounces)Cannington, Australia 100 – 18,718 25,161
Total silver – 18,718 25,161
Metallurgical coalProduction (‘000 tonnes)Illawarra Coal, Australia 100 – 7,216 7,513
Total metallurgical coal – 7,216 7,513
Energy coalProduction (‘000 tonnes)Energy Coal South Africa, South Africa(16) 90 – 28,677 30,384
Total energy coal – 28,677 30,384
6A
dditional information
5 Financial Statements
7 Shareholder inform
ation
6.2.1 Minerals continued
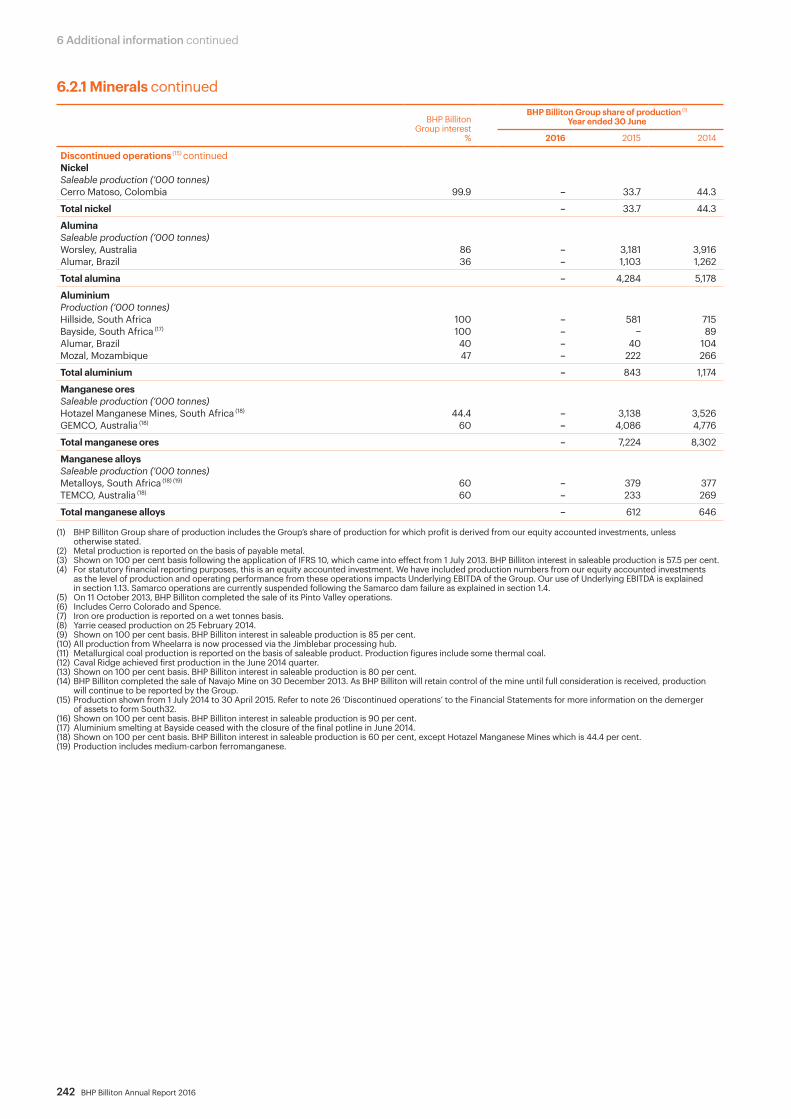
242 BHP Billiton Annual Report 2016
6 Additional information continued
BHP Billiton Group interest
%
BHP Billiton Group share of production (1)
Year ended 30 June
2016 2015 2014
Discontinued operations (15) continuedNickelSaleable production (‘000 tonnes)Cerro Matoso, Colombia 99.9 – 33.7 44.3
Total nickel – 33.7 44.3
AluminaSaleable production (‘000 tonnes)Worsley, Australia 86 – 3,181 3,916Alumar, Brazil 36 – 1,103 1,262
Total alumina – 4,284 5,178
AluminiumProduction (‘000 tonnes)Hillside, South Africa 100 – 581 715Bayside, South Africa (17) 100 – − 89Alumar, Brazil 40 – 40 104Mozal, Mozambique 47 – 222 266
Total aluminium – 843 1,174
Manganese oresSaleable production (‘000 tonnes)Hotazel Manganese Mines, South Africa (18) 44.4 – 3,138 3,526GEMCO, Australia (18) 60 – 4,086 4,776
Total manganese ores – 7,224 8,302
Manganese alloysSaleable production (‘000 tonnes)Metalloys, South Africa (18) (19) 60 – 379 377TEMCO, Australia (18) 60 – 233 269
Total manganese alloys – 612 646
(1) BHP Billiton Group share of production includes the Group’s share of production for which profit is derived from our equity accounted investments, unless otherwise stated.
(2) Metal production is reported on the basis of payable metal.(3) Shown on 100 per cent basis following the application of IFRS 10, which came into effect from 1 July 2013. BHP Billiton interest in saleable production is 57.5 per cent.(4) For statutory financial reporting purposes, this is an equity accounted investment. We have included production numbers from our equity accounted investments
as the level of production and operating performance from these operations impacts Underlying EBITDA of the Group. Our use of Underlying EBITDA is explained in section 1.13. Samarco operations are currently suspended following the Samarco dam failure as explained in section 1.4.
(5) On 11 October 2013, BHP Billiton completed the sale of its Pinto Valley operations.(6) Includes Cerro Colorado and Spence.(7) Iron ore production is reported on a wet tonnes basis.(8) Yarrie ceased production on 25 February 2014.(9) Shown on 100 per cent basis. BHP Billiton interest in saleable production is 85 per cent.(10) All production from Wheelarra is now processed via the Jimblebar processing hub.(11) Metallurgical coal production is reported on the basis of saleable product. Production figures include some thermal coal.(12) Caval Ridge achieved first production in the June 2014 quarter.(13) Shown on 100 per cent basis. BHP Billiton interest in saleable production is 80 per cent.(14) BHP Billiton completed the sale of Navajo Mine on 30 December 2013. As BHP Billiton will retain control of the mine until full consideration is received, production
will continue to be reported by the Group.(15) Production shown from 1 July 2014 to 30 April 2015. Refer to note 26 ‘Discontinued operations’ to the Financial Statements for more information on the demerger
of assets to form South32.(16) Shown on 100 per cent basis. BHP Billiton interest in saleable production is 90 per cent.(17) Aluminium smelting at Bayside ceased with the closure of the final potline in June 2014.(18) Shown on 100 per cent basis. BHP Billiton interest in saleable production is 60 per cent, except Hotazel Manganese Mines which is 44.4 per cent.(19) Production includes medium-carbon ferromanganese.
6.2.1 Minerals continued
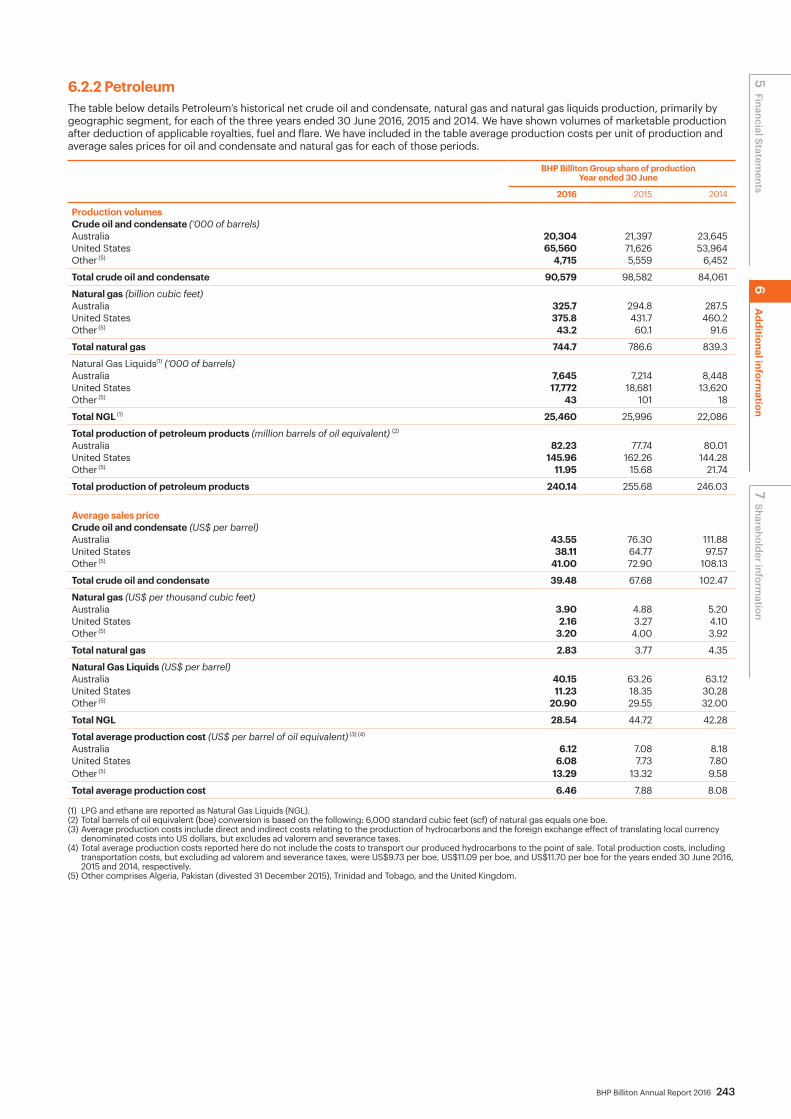
BHP Billiton Annual Report 2016 243
6.2.2 PetroleumThe table below details Petroleum‘s historical net crude oil and condensate, natural gas and natural gas liquids production, primarily by geographic segment, for each of the three years ended 30 June 2016, 2015 and 2014. We have shown volumes of marketable production after deduction of applicable royalties, fuel and flare. We have included in the table average production costs per unit of production and average sales prices for oil and condensate and natural gas for each of those periods.
BHP Billiton Group share of productionYear ended 30 June
2016 2015 2014
Production volumesCrude oil and condensate (‘000 of barrels)Australia 20,304 21,397 23,645United States 65,560 71,626 53,964Other (5) 4,715 5,559 6,452
Total crude oil and condensate 90,579 98,582 84,061
Natural gas (billion cubic feet) Australia 325.7 294.8 287.5United States 375.8 431.7 460.2Other (5) 43.2 60.1 91.6
Total natural gas 744.7 786.6 839.3
Natural Gas Liquids(1) (‘000 of barrels) Australia 7,645 7,214 8,448United States 17,772 18,681 13,620Other (5) 43 101 18
Total NGL (1) 25,460 25,996 22,086
Total production of petroleum products (million barrels of oil equivalent) (2) Australia 82.23 77.74 80.01United States 145.96 162.26 144.28Other (5) 11.95 15.68 21.74
Total production of petroleum products 240.14 255.68 246.03
Average sales price Crude oil and condensate (US$ per barrel)Australia 43.55 76.30 111.88United States 38.11 64.77 97.57Other (5) 41.00 72.90 108.13
Total crude oil and condensate 39.48 67.68 102.47
Natural gas (US$ per thousand cubic feet) Australia 3.90 4.88 5.20United States 2.16 3.27 4.10Other (5) 3.20 4.00 3.92
Total natural gas 2.83 3.77 4.35
Natural Gas Liquids (US$ per barrel) Australia 40.15 63.26 63.12United States 11.23 18.35 30.28Other (5) 20.90 29.55 32.00
Total NGL 28.54 44.72 42.28
Total average production cost (US$ per barrel of oil equivalent) (3) (4)
Australia 6.12 7.08 8.18United States 6.08 7.73 7.80Other (5) 13.29 13.32 9.58
Total average production cost 6.46 7.88 8.08
(1) LPG and ethane are reported as Natural Gas Liquids (NGL).(2) Total barrels of oil equivalent (boe) conversion is based on the following: 6,000 standard cubic feet (scf) of natural gas equals one boe.(3) Average production costs include direct and indirect costs relating to the production of hydrocarbons and the foreign exchange effect of translating local currency
denominated costs into US dollars, but excludes ad valorem and severance taxes.(4) Total average production costs reported here do not include the costs to transport our produced hydrocarbons to the point of sale. Total production costs, including
transportation costs, but excluding ad valorem and severance taxes, were US$9.73 per boe, US$11.09 per boe, and US$11.70 per boe for the years ended 30 June 2016, 2015 and 2014, respectively.
(5) Other comprises Algeria, Pakistan (divested 31 December 2015), Trinidad and Tobago, and the United Kingdom.
6A
dditional information
5 Financial Statements
7 Shareholder inform
ation

244 BHP Billiton Annual Report 2016
6 Additional information continued
6.3 Reserves and resources6.3.1 Petroleum reservesEstimates of oil and gas reserves involve some degree of uncertainty, are inherently imprecise, require the application of judgement and are subject to future revision. Accordingly, financial and accounting measures (such as the standardised measure of discounted cash flows, depreciation, depletion and amortisation charges, the assessment of impairments and the assessment of valuation allowances against deferred tax assets) that are based on reserve estimates are also subject to change.
How we estimate and report reserves Petroleum’s reserves are estimated as of 30 June 2016.
Our proved reserves are estimated and reported according to US Securities and Exchange Commission (SEC) regulations and have been determined in accordance with SEC Rule 4-10(a) of Regulation S-X.
Proved oil and gas reserves Proved oil and gas reserves are those quantities of crude oil, natural gas and natural gas liquids (NGL) that, by analysis of geoscience and engineering data, can be estimated with reasonable certainty to be economically producible from a given date forward from known reservoirs and under existing economic conditions, operating methods, operating contracts and government regulations. Unless evidence indicates that renewal of existing operating contracts is reasonably certain, estimates of economically producible reserves reflect only the period before the contracts expire. The project to extract the hydrocarbons must have commenced or the operator must be reasonably certain that it will commence within a reasonable time. As specified in SEC Rule 4-10(a) of Regulation S-X, oil and gas prices are taken as the unweighted average of the corresponding first day of the month prices for the 12 months prior to the ending date of the period covered.
Proved reserves were estimated by reference to available well and reservoir information, including but not limited to well logs, well test data, core data, production and pressure data, geologic data, seismic data and in some cases, to similar data from analogous, producing reservoirs. A wide range of engineering and geoscience methods, including performance analysis, well analogues and geologic studies were used to estimate high confidence proved developed and undeveloped reserves in accordance with SEC regulations.
Proved reserve estimates were attributed to future development projects only where there is a significant commitment to project funding and execution and for which applicable government and regulatory approvals have been secured or are reasonably certain to be secured. Furthermore, estimates of proved reserves include only volumes for which access to market is assured with reasonable certainty. All proved reserve estimates are subject to revision (either upward or downward) based on new information, such as from development drilling and production activities or from changes in economic factors, including product prices, contract terms or development plans.
Developed oil and gas reserves Proved developed oil and gas reserves are reserves that can be expected to be recovered through:• existing wells with existing equipment and operating methods; • installed extraction equipment and infrastructure operational at
the time of the reserve estimate if the extraction is by means not involving a well.
Performance-derived reserve assessments for producing wells were primarily based in the following manner: • for our conventional operations, reserves were estimated using
rate and pressure decline methods, including material balance, supplemented by reservoir simulation models where appropriate;
• for our Onshore US shale operations, rate-transient analysis and decline curve analysis methods;
• for wells that lacked sufficient production history, reserves were estimated using performance-based type curves and offset location analogues with similar geologic and reservoir characteristics.
Proved undeveloped reserves Proved undeveloped oil and gas reserves are reserves that are expected to be recovered from new wells on undrilled acreage where commitment has been made to commence development within five years from first reporting or from existing wells where a relatively major expenditure is required for recompletion.
A combination of geologic and engineering data and where appropriate, statistical analysis was used to support the assignment of proved undeveloped reserves when assessing planned drilling locations. Performance data along with log and core data was used to delineate consistent, continuous reservoir characteristics in core areas of the development. Proved undeveloped locations were included in core areas between known data and adjacent to productive wells using performance-based type curves and offset location analogues with similar geologic and reservoir characteristics. Locations where a high degree of certainty could not be demonstrated using the above technologies and techniques were not categorised as proved.
Methodology used to estimate reserves Reserve estimates have been estimated with deterministic methodology, with the exception of the North West Shelf gas operation in Australia, where probabilistic methodology has been used to estimate and aggregate reserves for the reservoirs dedicated to the gas project only. The probabilistic based portion of these reserves totals 39 million barrels of oil equivalent (MMboe) (total boe conversion is based on the following: 6,000 standard cubic feet (scf) of natural gas equals 1 boe) and represents approximately three per cent of our total reported proved reserves. Aggregation of proved reserves beyond the field/project level has been performed by arithmetic summation. Due to portfolio effects, aggregates of proved reserves may be conservative. The custody transfer point(s) or point(s) of sale applicable for each field or project are the reference point for reserves. The reserves replacement ratio is the reserves change during the year before production, divided by the production during the year stated as a percentage.
BHP Billiton Annual Report 2016 245
6.3.1 Petroleum reserves continuedGovernance The Petroleum Reserves Group (PRG) is a dedicated group that provides oversight of the reserves’ assessment and reporting processes. It is independent of the various operation teams directly responsible for development and production activities. The PRG is staffed by individuals averaging more than 20 years’ experience in the oil and gas industry. The manager of the PRG, Abhijit Gadgil, is a full-time employee of BHP Billiton and is responsible for overseeing the preparation of the reserve estimates and compiling the information for inclusion in this Annual Report. He has an advanced degree in engineering and more than 30 years of diversified industry experience in reservoir engineering, reserves assessment, field development and technical management. He is a 30-year member of the Society of Petroleum Engineers (SPE). He has also served on the Society of Petroleum Engineers Oil and Gas Reserves Committee. Mr Gadgil has the qualifications and experience required to act as a qualified petroleum reserves evaluator under the Australian Securities Exchange (ASX) Listing Rules. The estimates of petroleum reserves are based on and fairly represent information and supporting documentation prepared under the supervision of Mr Gadgil. He has reviewed and agrees with the information included in section 6.3.1 and has given his prior written consent for its publication. No part of the individual compensation for members of the PRG is dependent on reported reserves.
Reserve assessments for all Petroleum operations were conducted by technical staff within the operating organisation. These individuals meet the professional qualifications outlined by the SPE, are trained in the fundamentals of SEC reserves reporting and the reserves processes and are endorsed by the PRG. Each reserve assessment is reviewed annually by the PRG to ensure technical quality, adherence to internally published Petroleum guidelines and compliance with SEC reporting requirements. Once endorsed by the PRG, all reserves receive final endorsement by senior management and the Risk and Audit Committee prior to public reporting. Our internal Group Risk Assessment and Assurance function provides secondary assurance of the oil and gas reserve reporting processes through annual audits.
FY2016 reserves Production for FY2016 totalled 240 MMboe in sales, which is a decrease of 16 MMboe from FY2015. There was an additional 5 MMboe in non-sales production, primarily for fuel consumed in our Petroleum operations. The combined sales and non-sales production totalled 245 MMboe. The natural decline of production, primarily in mature fields, coupled with the significant reductions in our North American Shale drilling program in the current challenging economic environment, were the primary reasons for the lower amount produced.
As of 30 June 2016, our proved reserves of 1,303 MMboe reflect a net reduction of 360 MMboe (after total production) from the 1,908 MMboe reported at FY2015. This reduction was primarily the result of low product prices experienced during the reporting period, reductions in unconventional drilling activity that has deferred drilling beyond five years and the reclassification of reserves that are not economic in the current price environment. In accordance with applicable SEC regulations, the related volumes have been reclassified to non-proven reserves and resource categories. As of 30 June 2016, approximately 77 per cent of our proved reserves were in conventional fields, while about 23 per cent of our proved reserves were in unconventional fields.
Discoveries and extensionsDiscoveries and extensions added 14 MMboe to proved reserves during FY2016. This comprised 11 MMboe of extensions related to drilling in our US shale operations and 3 MMboe of discoveries in the Turrum field, which is located offshore Western Australia.
RevisionsOverall net revisions reduced proved reserves by 362 MMboe during FY2016. Of this, the impact of commodity prices using the required SEC price-basis represented a reduction of 342 MMboe, or approximately 95 per cent of the overall revisions. Virtually all the price-related reductions, or 337 MMboe, occurred in our North American Shale fields. In addition to the price-related revisions, a further net reduction of 20 MMboe occurred due to positive and negative performance revisions and data updates in numerous fields worldwide.
In our US operations, the overall reduction in proved reserves through revisions totalled 398 MMboe, including downward revisions of 401 MMboe for our onshore unconventional operations that were partially offset by additions of 9 MMboe for better than expected performance in the Shenzi and Mad Dog fields in our Gulf of Mexico operations. Price-related reductions of 5 MMboe occurred in our US conventional fields, while data updates and revised assessments in numerous fields represented the balance of the revisions. As previously noted, the downward revisions in our onshore unconventional operations were primarily related to price impact on economic productive life, deferral of development drilling beyond the required five-year development window in the Eagle Ford, Permian, Haynesville and Fayetteville fields and represented a total of 337 MMboe. There were also reductions of 64 MMboe related to new information and other development program revisions and data updates.
In our Australian operations, continued strong performance of the Pyrenees, North West Shelf and Bass Strait fields added a total of 18 MMboe through revisions. Operations outside of Australia and the United States also added 9 MMboe for the extension of our production sharing agreement in Algeria for the ROD field. The ROD field also added 3 MMboe for better than expected performance.
SalesThe sale of the Zamzama conventional operations in Pakistan accounted for 12 MMboe of the net reduction. There were no purchases during FY2016.
These results are summarised in the following tables, which detail estimated oil, condensate, NGL and natural gas reserves at 30 June 2016, 30 June 2015 and 30 June 2014, with a reconciliation of the changes in each year. Reserves have been calculated using the economic interest method and represent net interest volumes after deduction of applicable royalty. Reserves of 78 MMboe are in two production and risk-sharing arrangements that involve the Company in upstream risks and rewards without transfer of ownership of the products. At 30 June 2016, approximately six per cent of the proved reserves were attributable to such arrangements.
6A
dditional information
5 Financial Statements
7 Shareholder inform
ation
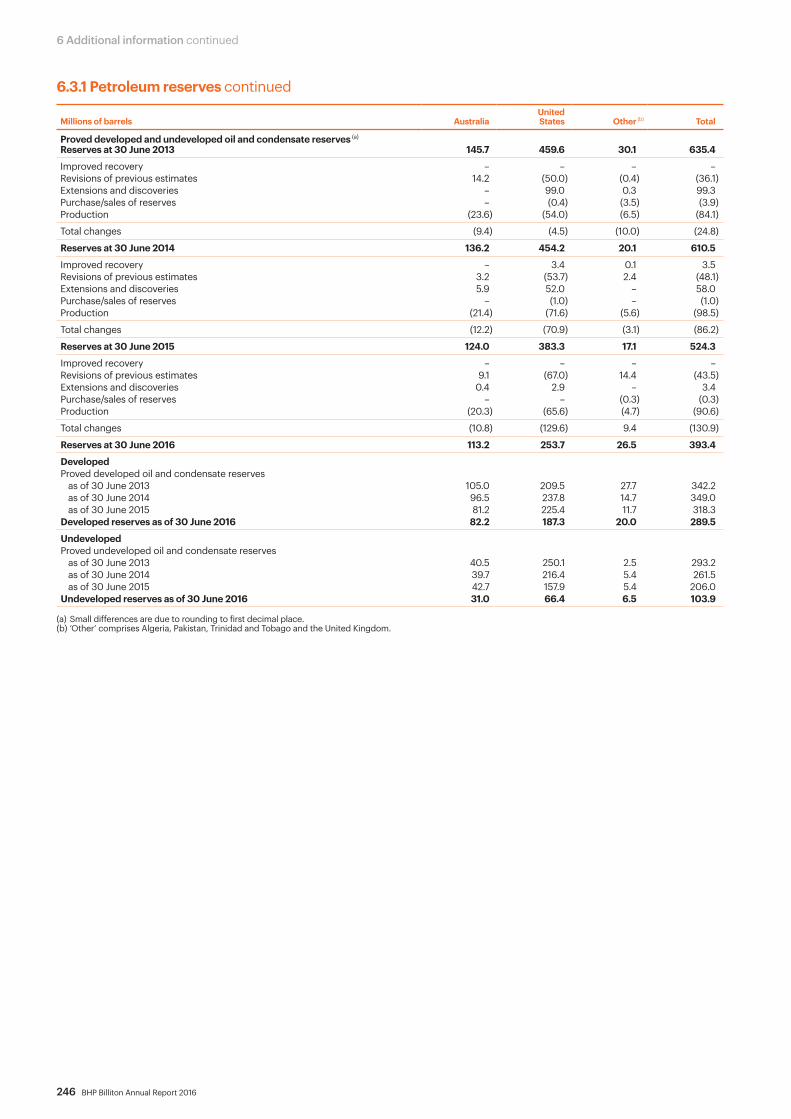
246 BHP Billiton Annual Report 2016
6 Additional information continued
6.3.1 Petroleum reserves continued
Millions of barrels AustraliaUnitedStates Other (b) Total
Proved developed and undeveloped oil and condensate reserves (a)
Reserves at 30 June 2013 145.7 459.6 30.1 635.4
Improved recovery – – – – Revisions of previous estimates 14.2 (50.0) (0.4) (36.1)Extensions and discoveries – 99.0 0.3 99.3Purchase/sales of reserves – (0.4) (3.5) (3.9)Production (23.6) (54.0) (6.5) (84.1)
Total changes (9.4) (4.5) (10.0) (24.8)
Reserves at 30 June 2014 136.2 454.2 20.1 610.5
Improved recovery – 3.4 0.1 3.5Revisions of previous estimates 3.2 (53.7) 2.4 (48.1)Extensions and discoveries 5.9 52.0 – 58.0Purchase/sales of reserves – (1.0) – (1.0)Production (21.4) (71.6) (5.6) (98.5)
Total changes (12.2) (70.9) (3.1) (86.2)
Reserves at 30 June 2015 124.0 383.3 17.1 524.3
Improved recovery – – – –Revisions of previous estimates 9.1 (67.0) 14.4 (43.5)Extensions and discoveries 0.4 2.9 – 3.4Purchase/sales of reserves – – (0.3) (0.3)Production (20.3) (65.6) (4.7) (90.6)
Total changes (10.8) (129.6) 9.4 (130.9)
Reserves at 30 June 2016 113.2 253.7 26.5 393.4
DevelopedProved developed oil and condensate reserves
as of 30 June 2013 105.0 209.5 27.7 342.2as of 30 June 2014 96.5 237.8 14.7 349.0as of 30 June 2015 81.2 225.4 11.7 318.3
Developed reserves as of 30 June 2016 82.2 187.3 20.0 289.5
UndevelopedProved undeveloped oil and condensate reserves
as of 30 June 2013 40.5 250.1 2.5 293.2as of 30 June 2014 39.7 216.4 5.4 261.5as of 30 June 2015 42.7 157.9 5.4 206.0
Undeveloped reserves as of 30 June 2016 31.0 66.4 6.5 103.9
(a) Small differences are due to rounding to first decimal place.(b) ‘Other’ comprises Algeria, Pakistan, Trinidad and Tobago and the United Kingdom.
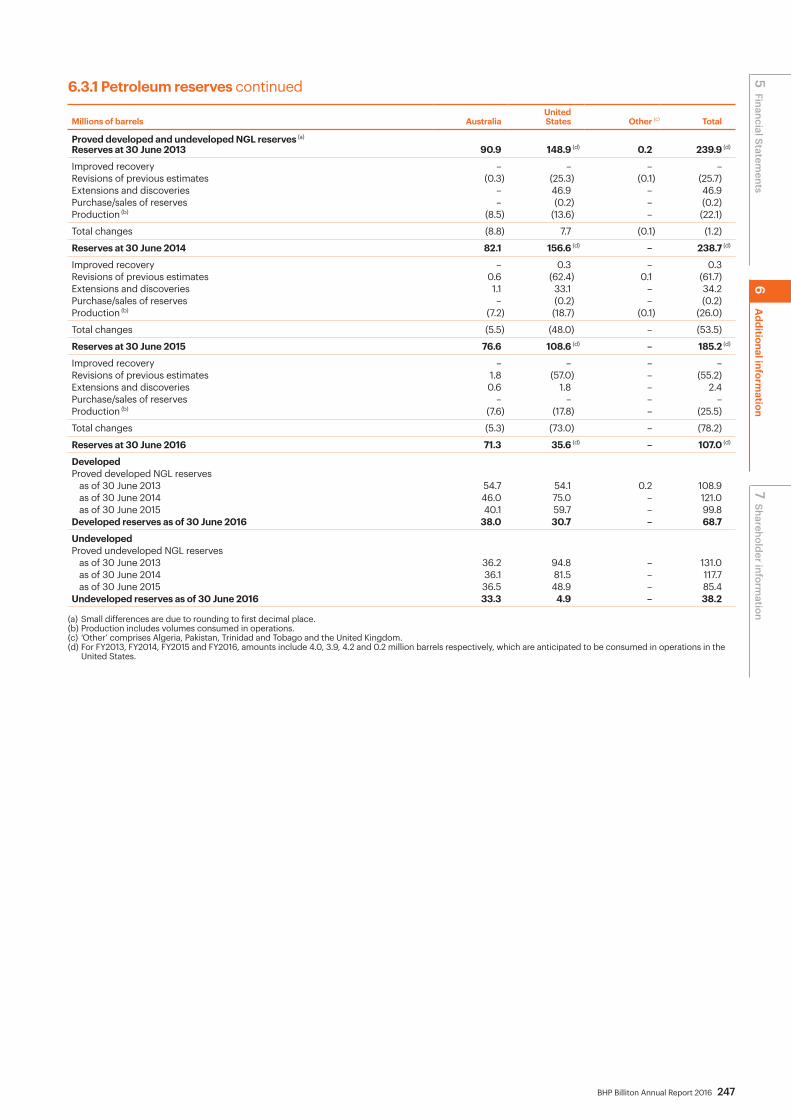
BHP Billiton Annual Report 2016 247
6.3.1 Petroleum reserves continued
Millions of barrels AustraliaUnitedStates Other (c) Total
Proved developed and undeveloped NGL reserves (a)
Reserves at 30 June 2013 90.9 148.9 (d) 0.2 239.9 (d)
Improved recovery – – – – Revisions of previous estimates (0.3) (25.3) (0.1) (25.7)Extensions and discoveries – 46.9 – 46.9Purchase/sales of reserves – (0.2) – (0.2)Production (b) (8.5) (13.6) – (22.1)
Total changes (8.8) 7.7 (0.1) (1.2)
Reserves at 30 June 2014 82.1 156.6 (d) – 238.7 (d)
Improved recovery – 0.3 – 0.3Revisions of previous estimates 0.6 (62.4) 0.1 (61.7)Extensions and discoveries 1.1 33.1 – 34.2Purchase/sales of reserves – (0.2) – (0.2)Production (b) (7.2) (18.7) (0.1) (26.0)
Total changes (5.5) (48.0) – (53.5)
Reserves at 30 June 2015 76.6 108.6 (d) – 185.2 (d)
Improved recovery – – – –Revisions of previous estimates 1.8 (57.0) – (55.2)Extensions and discoveries 0.6 1.8 – 2.4Purchase/sales of reserves – – – – Production (b) (7.6) (17.8) – (25.5)
Total changes (5.3) (73.0) – (78.2)
Reserves at 30 June 2016 71.3 35.6 (d) – 107.0 (d)
DevelopedProved developed NGL reserves
as of 30 June 2013 54.7 54.1 0.2 108.9as of 30 June 2014 46.0 75.0 – 121.0as of 30 June 2015 40.1 59.7 – 99.8
Developed reserves as of 30 June 2016 38.0 30.7 – 68.7
UndevelopedProved undeveloped NGL reserves
as of 30 June 2013 36.2 94.8 – 131.0as of 30 June 2014 36.1 81.5 – 117.7as of 30 June 2015 36.5 48.9 – 85.4
Undeveloped reserves as of 30 June 2016 33.3 4.9 – 38.2
(a) Small differences are due to rounding to first decimal place.(b) Production includes volumes consumed in operations.(c) ‘Other’ comprises Algeria, Pakistan, Trinidad and Tobago and the United Kingdom.(d) For FY2013, FY2014, FY2015 and FY2016, amounts include 4.0, 3.9, 4.2 and 0.2 million barrels respectively, which are anticipated to be consumed in operations in the
United States.
6A
dditional information
5 Financial Statements
7 Shareholder inform
ation
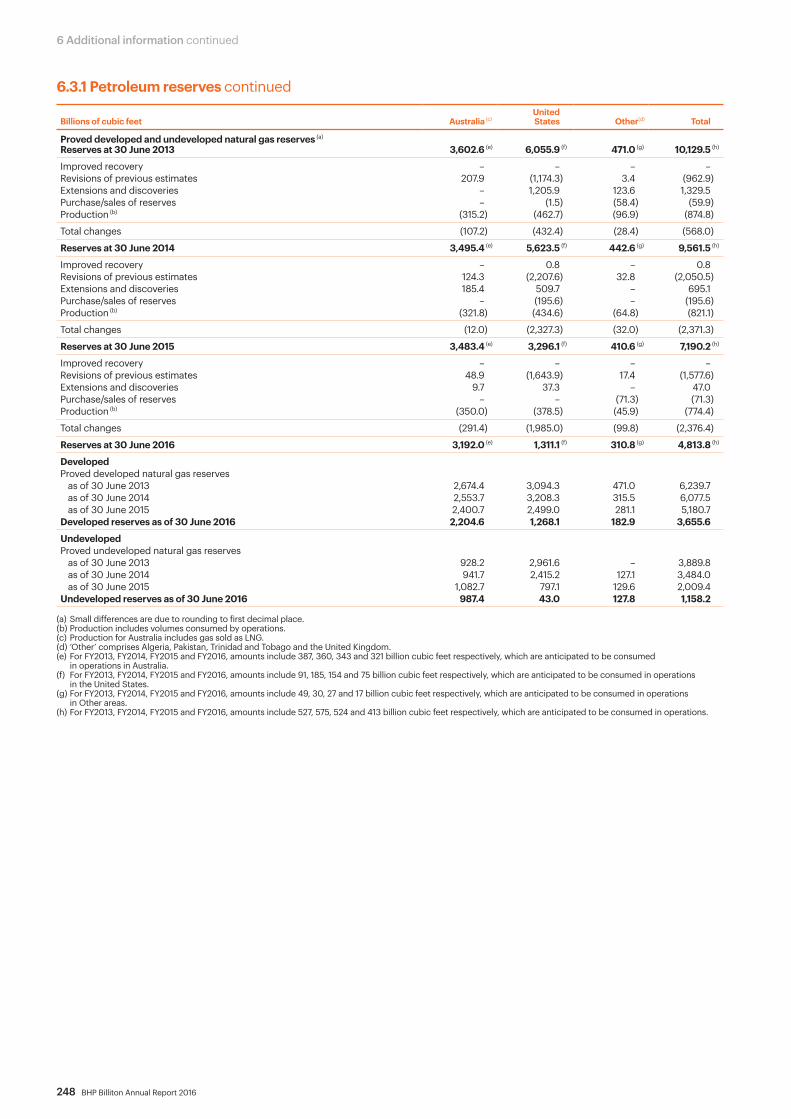
248 BHP Billiton Annual Report 2016
6 Additional information continued
6.3.1 Petroleum reserves continued
Billions of cubic feet Australia (c)UnitedStates Other(d) Total
Proved developed and undeveloped natural gas reserves (a)
Reserves at 30 June 2013 3,602.6 (e) 6,055.9 (f) 471.0 (g) 10,129.5 (h)
Improved recovery – – – – Revisions of previous estimates 207.9 (1,174.3) 3.4 (962.9)Extensions and discoveries – 1,205.9 123.6 1,329.5Purchase/sales of reserves – (1.5) (58.4) (59.9)Production (b) (315.2) (462.7) (96.9) (874.8)
Total changes (107.2) (432.4) (28.4) (568.0)
Reserves at 30 June 2014 3,495.4 (e) 5,623.5 (f) 442.6 (g) 9,561.5 (h)
Improved recovery – 0.8 – 0.8Revisions of previous estimates 124.3 (2,207.6) 32.8 (2,050.5)Extensions and discoveries 185.4 509.7 – 695.1Purchase/sales of reserves – (195.6) – (195.6)Production (b) (321.8) (434.6) (64.8) (821.1)
Total changes (12.0) (2,327.3) (32.0) (2,371.3)
Reserves at 30 June 2015 3,483.4 (e) 3,296.1 (f) 410.6 (g) 7,190.2 (h)
Improved recovery – – – –Revisions of previous estimates 48.9 (1,643.9) 17.4 (1,577.6)Extensions and discoveries 9.7 37.3 – 47.0Purchase/sales of reserves – – (71.3) (71.3)Production (b) (350.0) (378.5) (45.9) (774.4)
Total changes (291.4) (1,985.0) (99.8) (2,376.4)
Reserves at 30 June 2016 3,192.0 (e) 1,311.1 (f) 310.8 (g) 4,813.8 (h)
DevelopedProved developed natural gas reserves
as of 30 June 2013 2,674.4 3,094.3 471.0 6,239.7as of 30 June 2014 2,553.7 3,208.3 315.5 6,077.5as of 30 June 2015 2,400.7 2,499.0 281.1 5,180.7
Developed reserves as of 30 June 2016 2,204.6 1,268.1 182.9 3,655.6
UndevelopedProved undeveloped natural gas reserves
as of 30 June 2013 928.2 2,961.6 – 3,889.8as of 30 June 2014 941.7 2,415.2 127.1 3,484.0as of 30 June 2015 1,082.7 797.1 129.6 2,009.4
Undeveloped reserves as of 30 June 2016 987.4 43.0 127.8 1,158.2
(a) Small differences are due to rounding to first decimal place.(b) Production includes volumes consumed by operations.(c) Production for Australia includes gas sold as LNG.(d) ‘Other’ comprises Algeria, Pakistan, Trinidad and Tobago and the United Kingdom.(e) For FY2013, FY2014, FY2015 and FY2016, amounts include 387, 360, 343 and 321 billion cubic feet respectively, which are anticipated to be consumed
in operations in Australia.(f) For FY2013, FY2014, FY2015 and FY2016, amounts include 91, 185, 154 and 75 billion cubic feet respectively, which are anticipated to be consumed in operations
in the United States.(g) For FY2013, FY2014, FY2015 and FY2016, amounts include 49, 30, 27 and 17 billion cubic feet respectively, which are anticipated to be consumed in operations
in Other areas.(h) For FY2013, FY2014, FY2015 and FY2016, amounts include 527, 575, 524 and 413 billion cubic feet respectively, which are anticipated to be consumed in operations.
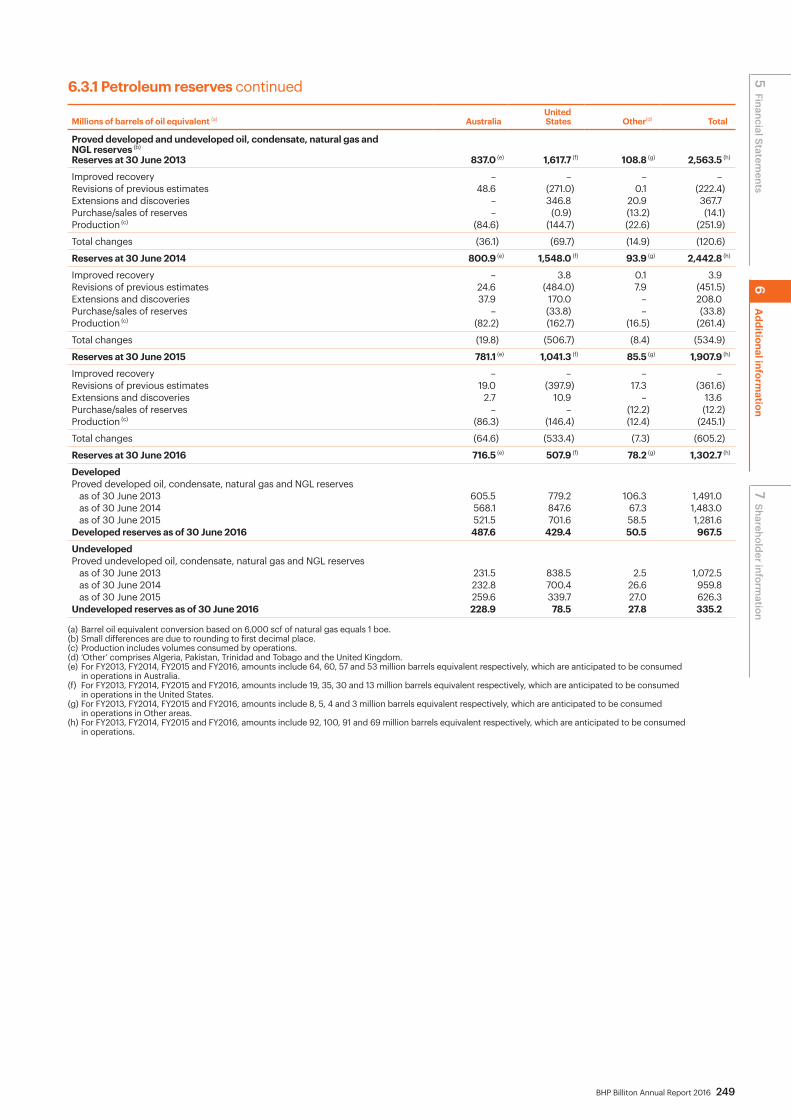
BHP Billiton Annual Report 2016 249
6.3.1 Petroleum reserves continued
Millions of barrels of oil equivalent (a) AustraliaUnitedStates Other(d) Total
Proved developed and undeveloped oil, condensate, natural gas and NGL reserves (b)
Reserves at 30 June 2013 837.0 (e) 1,617.7 (f) 108.8 (g) 2,563.5 (h)
Improved recovery – – – – Revisions of previous estimates 48.6 (271.0) 0.1 (222.4)Extensions and discoveries – 346.8 20.9 367.7Purchase/sales of reserves – (0.9) (13.2) (14.1) Production (c) (84.6) (144.7) (22.6) (251.9)
Total changes (36.1) (69.7) (14.9) (120.6)
Reserves at 30 June 2014 800.9 (e) 1,548.0 (f) 93.9 (g) 2,442.8 (h)
Improved recovery – 3.8 0.1 3.9Revisions of previous estimates 24.6 (484.0) 7.9 (451.5)Extensions and discoveries 37.9 170.0 – 208.0Purchase/sales of reserves – (33.8) – (33.8)Production (c) (82.2) (162.7) (16.5) (261.4)
Total changes (19.8) (506.7) (8.4) (534.9)
Reserves at 30 June 2015 781.1 (e) 1,041.3 (f) 85.5 (g) 1,907.9 (h)
Improved recovery – – – –Revisions of previous estimates 19.0 (397.9) 17.3 (361.6)Extensions and discoveries 2.7 10.9 – 13.6Purchase/sales of reserves – – (12.2) (12.2)Production (c) (86.3) (146.4) (12.4) (245.1)
Total changes (64.6) (533.4) (7.3) (605.2)
Reserves at 30 June 2016 716.5 (e) 507.9 (f) 78.2 (g) 1,302.7 (h)
DevelopedProved developed oil, condensate, natural gas and NGL reserves
as of 30 June 2013 605.5 779.2 106.3 1,491.0as of 30 June 2014 568.1 847.6 67.3 1,483.0as of 30 June 2015 521.5 701.6 58.5 1,281.6
Developed reserves as of 30 June 2016 487.6 429.4 50.5 967.5
UndevelopedProved undeveloped oil, condensate, natural gas and NGL reserves
as of 30 June 2013 231.5 838.5 2.5 1,072.5as of 30 June 2014 232.8 700.4 26.6 959.8as of 30 June 2015 259.6 339.7 27.0 626.3
Undeveloped reserves as of 30 June 2016 228.9 78.5 27.8 335.2
(a) Barrel oil equivalent conversion based on 6,000 scf of natural gas equals 1 boe.(b) Small differences are due to rounding to first decimal place. (c) Production includes volumes consumed by operations.(d) ‘Other’ comprises Algeria, Pakistan, Trinidad and Tobago and the United Kingdom.(e) For FY2013, FY2014, FY2015 and FY2016, amounts include 64, 60, 57 and 53 million barrels equivalent respectively, which are anticipated to be consumed
in operations in Australia.(f) For FY2013, FY2014, FY2015 and FY2016, amounts include 19, 35, 30 and 13 million barrels equivalent respectively, which are anticipated to be consumed
in operations in the United States.(g) For FY2013, FY2014, FY2015 and FY2016, amounts include 8, 5, 4 and 3 million barrels equivalent respectively, which are anticipated to be consumed
in operations in Other areas.(h) For FY2013, FY2014, FY2015 and FY2016, amounts include 92, 100, 91 and 69 million barrels equivalent respectively, which are anticipated to be consumed
in operations.
6A
dditional information
5 Financial Statements
7 Shareholder inform
ation

250 BHP Billiton Annual Report 2016
6 Additional information continued
6.3.1 Petroleum reserves continuedProved undeveloped reserves At 30 June 2016, Petroleum had 335 MMboe of proved undeveloped reserves, which represented 26 per cent of year-end 2016 proved reserves of 1,303 MMboe. Approximately 318 MMboe or 95 per cent of the proved undeveloped reserves resides primarily in our conventional offshore fields in Australia, the Gulf of Mexico and Trinidad and Tobago, while 18 MMboe or five per cent reside in our North American shale fields. The current proved undeveloped reserves reflect a net reduction of 291 MMboe from the 626 MMboe reported at 30 June 2015. This reduction was primarily the result of development activities that converted 94 MMboe of proved undeveloped to proved developed reserves and downward proved undeveloped reserves revisions of 198 MMboe primarily driven by the decline in product prices in FY2016. Development drilling related extensions in the Turrum field in Australia added 3 MMboe while the sale of the Zamzama field in Pakistan reduced proved undeveloped by 1 MMboe.
The Onshore US portion of these reductions totalled 235 MMboe and include 43 MMboe moved to proved developed for wells that were drilled and completed. Due to the very challenging price environment, 192 MMboe has been reclassified out of proved undeveloped for the Group’s North American Shale fields, leaving 18 MMboe of proved undeveloped reserves at 30 June 2016. The remaining 18 MMboe of proved undeveloped reserves are in the Black Hawk field and have been drilled and are expected to be completed and brought on production within five years.
Of the 335 MMboe currently classified as proved undeveloped at 30 June 2016, 214 MMboe has been reported for five or more years. All of these reserves are in our offshore conventional fields that are currently producing, have significant development in place and are scheduled to start producing within the next five years. The largest component of this is 122 MMboe in the Kipper-Tuna-Turrum project in Bass Strait, Australia. This project is expected to be on production later in 2016 when a gas conditioning plant is completed. The Atlantis field in the Gulf of Mexico contains 26 MMboe, while the Mad Dog field contains 15 MMboe, both of which are actively being drilled. The remainder resides in other Australian offshore fields that have active development plans. Our North American shale fields do not contain any undrilled proved undeveloped reserves due to the very challenging economic climate. During FY2016, Petroleum continued active development of our inventory of proved undeveloped projects by converting 94 MMboe to proved developed reserves. Over the past three years, the conversion of proved undeveloped to developed has totalled 405 MMboe, averaging 135 MMboe per year. In currently producing conventional fields, the remaining proved undeveloped reserves will be developed and brought on stream in a phased manner to best optimise the use of production facilities and to meet sales commitments. During FY2016, Petroleum spent US$1.9 billion on development activities worldwide.
6.3.2 Mineral Resources and Ore ReservesThe statement of Mineral Resources and Ore Reserves presented in this Annual Report has been produced in accordance with the ASX Listing Rules Chapter 5 and the Australasian Code for Reporting of Exploration Results, Mineral Resources and Ore Reserves, December 2012 (JORC Code). Commodity prices and exchange rates used to estimate the economic viability of reserves are based on asset-defined or BHP Billiton long-term forecasts. The Ore Reserves tabulated are held within existing, permitted mining tenements. The Company’s mineral leases are of sufficient duration (or convey a legal right to renew for sufficient duration) to enable all reserves on the leased properties to be mined in accordance with current production schedules. Our Ore Reserves may include areas where some additional approvals remain outstanding, but where, based on the technical investigations we carry out as part of our planning process and our knowledge and experience of the approvals process, we expect that such approvals will be obtained as part of the normal course of business and within the time frame required by the current life of mine schedule.
The information in this Annual Report relating to Mineral Resources and Ore Reserves is based on and fairly represents, information and supporting documentation compiled by Competent Persons (as defined in the JORC Code). All Competent Persons have, at the time of reporting, sufficient experience relevant to the style of mineralisation and type of deposit under consideration and to the activity they are undertaking to qualify as a Competent Person. At the reporting date, each Competent Person listed in this Annual Report is a full-time employee of BHP Billiton or a company in which BHP Billiton has a controlling interest (unless otherwise noted). Each Competent Person consents to the inclusion in this Annual Report of the matters based on his or her information in the form and context in which it appears.
All Mineral Resources and Ore Reserves presented are reported in 100 per cent terms and represent estimates at 30 June 2016 (unless otherwise stated). Tonnes are reported as dry metric tonnes (unless otherwise stated). All tonnes and grade information has been rounded, hence small differences may be present in the totals. The Measured and Indicated Mineral Resources are inclusive of those Mineral Resources modified to produce the Ore Reserves. The information contained in this document differs in certain respects from that reported to the SEC, which is prepared with reference to SEC Industry Guide 7. BHP Billiton applies governance arrangements and internal controls to verify the estimates and estimation process for Mineral Resources and Ore Reserves. These include:• standard Company procedures for public reporting aligned
with current regulatory requirements;• independent audits of new and materially changed estimates;• annual reconciliation performance metrics to validate reserves
estimates for operating mines;• internal technical assessments of resources and reserves
estimates for each asset scheduled every two years.
The Geoscience Centre of Excellence manages governance and functional leadership for Mineral Resources and Ore Reserves reporting to support the above controls.
Mineral Resources and Ore Reserves are presented in the accompanying tables.
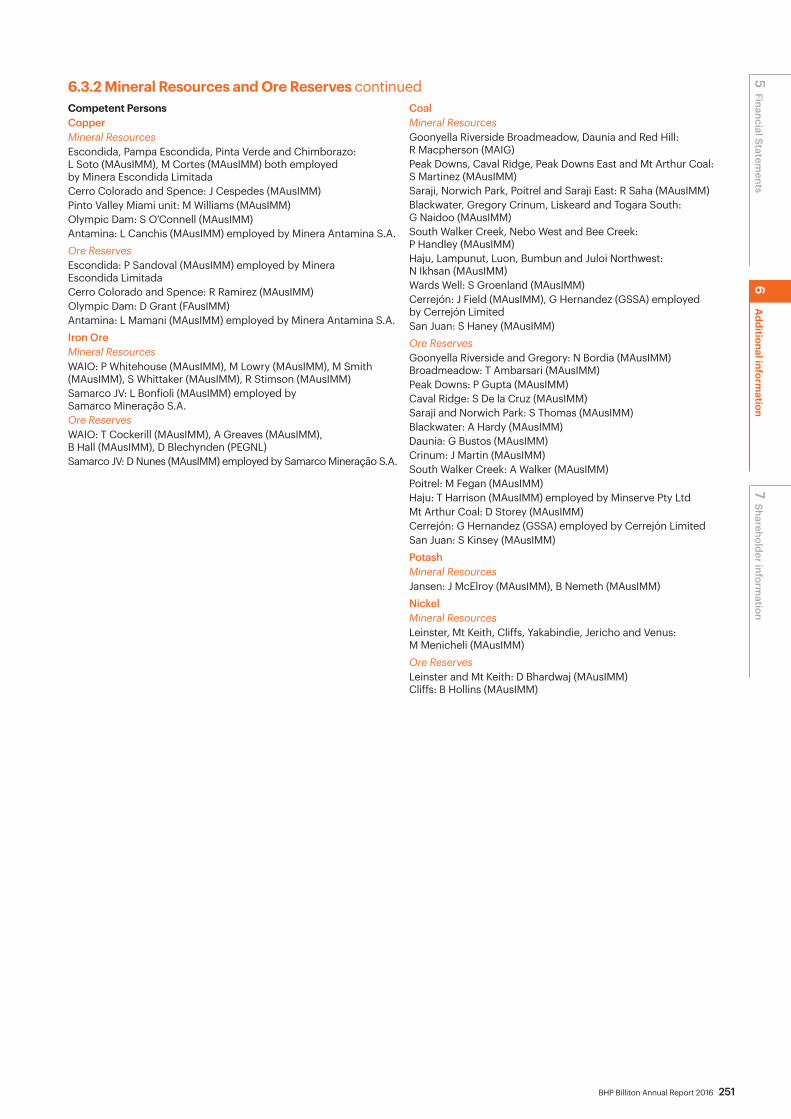
BHP Billiton Annual Report 2016 251
Competent PersonsCopperMineral ResourcesEscondida, Pampa Escondida, Pinta Verde and Chimborazo: L Soto (MAusIMM), M Cortes (MAusIMM) both employed by Minera Escondida LimitadaCerro Colorado and Spence: J Cespedes (MAusIMM)Pinto Valley Miami unit: M Williams (MAusIMM)Olympic Dam: S O’Connell (MAusIMM)Antamina: L Canchis (MAusIMM) employed by Minera Antamina S.A.Ore ReservesEscondida: P Sandoval (MAusIMM) employed by Minera Escondida LimitadaCerro Colorado and Spence: R Ramirez (MAusIMM)Olympic Dam: D Grant (FAusIMM)Antamina: L Mamani (MAusIMM) employed by Minera Antamina S.A.Iron OreMineral ResourcesWAIO: P Whitehouse (MAusIMM), M Lowry (MAusIMM), M Smith (MAusIMM), S Whittaker (MAusIMM), R Stimson (MAusIMM)Samarco JV: L Bonfioli (MAusIMM) employed by Samarco Mineração S.A.Ore ReservesWAIO: T Cockerill (MAusIMM), A Greaves (MAusIMM), B Hall (MAusIMM), D Blechynden (PEGNL)Samarco JV: D Nunes (MAusIMM) employed by Samarco Mineração S.A.
CoalMineral ResourcesGoonyella Riverside Broadmeadow, Daunia and Red Hill: R Macpherson (MAIG)Peak Downs, Caval Ridge, Peak Downs East and Mt Arthur Coal: S Martinez (MAusIMM)Saraji, Norwich Park, Poitrel and Saraji East: R Saha (MAusIMM)Blackwater, Gregory Crinum, Liskeard and Togara South: G Naidoo (MAusIMM)South Walker Creek, Nebo West and Bee Creek: P Handley (MAusIMM)Haju, Lampunut, Luon, Bumbun and Juloi Northwest: N Ikhsan (MAusIMM)Wards Well: S Groenland (MAusIMM)Cerrejón: J Field (MAusIMM), G Hernandez (GSSA) employed by Cerrejón LimitedSan Juan: S Haney (MAusIMM)Ore ReservesGoonyella Riverside and Gregory: N Bordia (MAusIMM) Broadmeadow: T Ambarsari (MAusIMM)Peak Downs: P Gupta (MAusIMM)Caval Ridge: S De la Cruz (MAusIMM)Saraji and Norwich Park: S Thomas (MAusIMM)Blackwater: A Hardy (MAusIMM)Daunia: G Bustos (MAusIMM)Crinum: J Martin (MAusIMM)South Walker Creek: A Walker (MAusIMM)Poitrel: M Fegan (MAusIMM)Haju: T Harrison (MAusIMM) employed by Minserve Pty LtdMt Arthur Coal: D Storey (MAusIMM)Cerrejón: G Hernandez (GSSA) employed by Cerrejón LimitedSan Juan: S Kinsey (MAusIMM)PotashMineral ResourcesJansen: J McElroy (MAusIMM), B Nemeth (MAusIMM)NickelMineral ResourcesLeinster, Mt Keith, Cliffs, Yakabindie, Jericho and Venus: M Menicheli (MAusIMM)Ore ReservesLeinster and Mt Keith: D Bhardwaj (MAusIMM) Cliffs: B Hollins (MAusIMM)
6.3.2 Mineral Resources and Ore Reserves continued
5 Financial Statements
7 Shareholder inform
ation6
Additional inform
ation
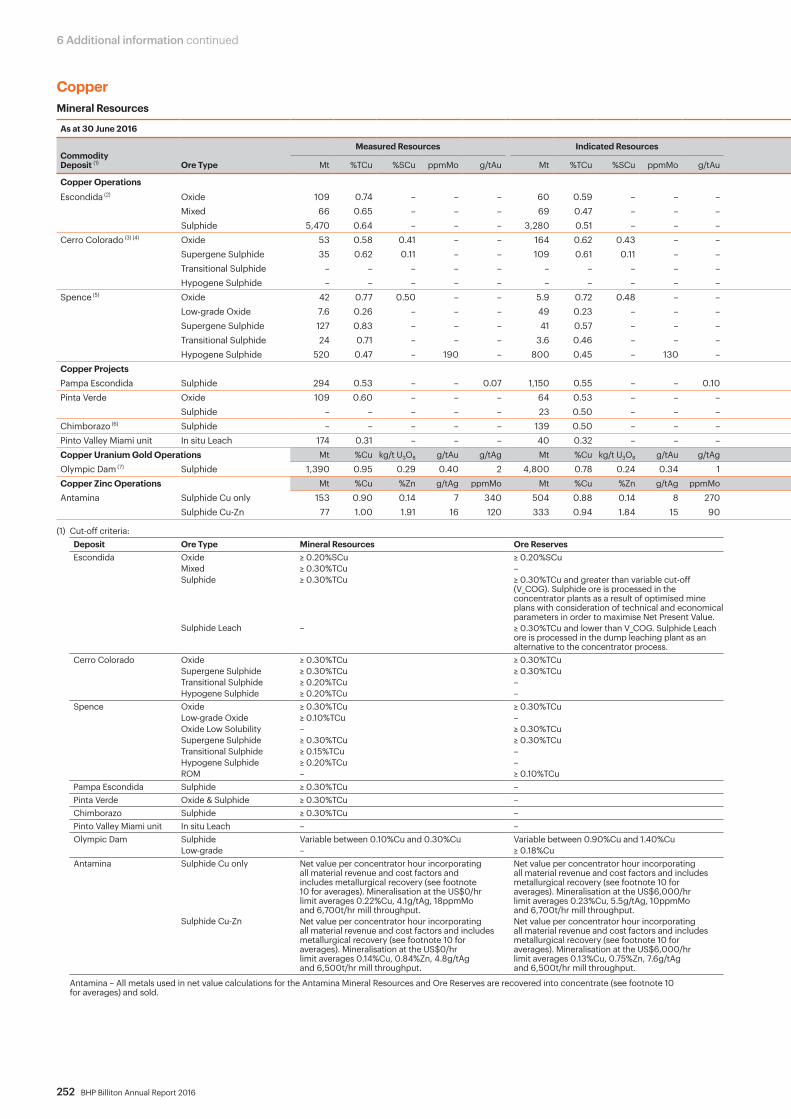
252 BHP Billiton Annual Report 2016
6 Additional information continued
CopperMineral Resources
As at 30 June 2016 As at 30 June 2015
Commodity Deposit (1) Ore Type
Measured Resources Indicated Resources Inferred Resources Total Resources BHP Billiton Interest
%
Total Resources
Mt %TCu %SCu ppmMo g/tAu Mt %TCu %SCu ppmMo g/tAu Mt %TCu %SCu ppmMo g/tAu Mt %TCu %SCu ppmMo g/tAu Mt %TCu %SCu ppmMo g/tAu
Copper OperationsEscondida (2) Oxide 109 0.74 – – – 60 0.59 – – – 26 0.54 – – – 195 0.67 – – – 57.5 213 0.68 – – –
Mixed 66 0.65 – – – 69 0.47 – – – 70 0.42 – – – 205 0.51 – – – 203 0.53 – – – Sulphide 5,470 0.64 – – – 3,280 0.51 – – – 11,200 0.52 – – – 20,000 0.55 – – – 18,800 0.54 – – –
Cerro Colorado (3) (4) Oxide 53 0.58 0.41 – – 164 0.62 0.43 – – 24 0.61 0.44 – – 241 0.61 0.43 – – 100 237 0.58 0.42 – – Supergene Sulphide 35 0.62 0.11 – – 109 0.61 0.11 – – 34 0.66 0.11 – – 178 0.62 0.11 – – 168 0.57 0.11 – – Transitional Sulphide – – – – – – – – – – 200 0.44 – – – 200 0.44 – – – – – – – – Hypogene Sulphide – – – – – – – – – – 1,700 0.35 – – – 1,700 0.35 – – – – – – – –
Spence (5) Oxide 42 0.77 0.50 – – 5.9 0.72 0.48 – – – – – – – 48 0.76 0.50 – – 100 54 0.78 0.51 – – Low-grade Oxide 7.6 0.26 – – – 49 0.23 – – – 19 0.17 – – – 76 0.22 – – – 81 0.22 – – – Supergene Sulphide 127 0.83 – – – 41 0.57 – – – 3.7 0.62 – – – 172 0.76 – – – 179 0.80 – – – Transitional Sulphide 24 0.71 – – – 3.6 0.46 – – – – – – – – 28 0.68 – – – 26 0.71 – – – Hypogene Sulphide 520 0.47 – 190 – 800 0.45 – 130 – 1,120 0.39 – 80 – 2,440 0.43 – 120 – 2,300 0.43 – 120 –
Copper ProjectsPampa Escondida Sulphide 294 0.53 – – 0.07 1,150 0.55 – – 0.10 6,000 0.43 – – 0.04 7,440 0.45 – – 0.05 57.5 7,440 0.45 – – 0.05Pinta Verde Oxide 109 0.60 – – – 64 0.53 – – – 15 0.54 – – – 188 0.57 – – – 57.5 188 0.57 – – –
Sulphide – – – – – 23 0.50 – – – 37 0.45 – – – 60 0.47 – – – 60 0.47 – – – Chimborazo (6) Sulphide – – – – – 139 0.50 – – – 84 0.60 – – – 223 0.54 – – – 57.5 223 0.54 – – – Pinto Valley Miami unit In situ Leach 174 0.31 – – – 40 0.32 – – – – – – – – 214 0.31 – – – 100 214 0.31 – – – Copper Uranium Gold Operations Mt %Cu kg/t U3O8 g/tAu g/tAg Mt %Cu kg/t U3O8 g/tAu g/tAg Mt %Cu kg/t U3O8 g/tAu g/tAg Mt %Cu kg/t U3O8 g/tAu g/tAg Mt %Cu kg/t U3O8 g/tAu g/tAg
Olympic Dam (7) Sulphide 1,390 0.95 0.29 0.40 2 4,800 0.78 0.24 0.34 1 4,220 0.70 0.24 0.27 1 10,400 0.77 0.25 0.32 1 100 10,100 0.78 0.25 0.30 1Copper Zinc Operations Mt %Cu %Zn g/tAg ppmMo Mt %Cu %Zn g/tAg ppmMo Mt %Cu %Zn g/tAg ppmMo Mt %Cu %Zn g/tAg ppmMo Mt %Cu %Zn g/tAg ppmMo
Antamina Sulphide Cu only 153 0.90 0.14 7 340 504 0.88 0.14 8 270 780 0.83 0.14 8 220 1,440 0.85 0.14 8 250 33.75 1,440 0.87 0.15 9 260Sulphide Cu-Zn 77 1.00 1.91 16 120 333 0.94 1.84 15 90 493 1.02 1.53 16 80 903 0.99 1.68 16 90 936 0.91 1.67 15 90
(1) Cut-off criteria: Deposit Ore Type Mineral Resources Ore ReservesEscondida Oxide
Mixed Sulphide
Sulphide Leach
≥ 0.20%SCu≥ 0.30%TCu≥ 0.30%TCu
–
≥ 0.20%SCu–≥ 0.30%TCu and greater than variable cut-off (V_COG). Sulphide ore is processed in the concentrator plants as a result of optimised mine plans with consideration of technical and economical parameters in order to maximise Net Present Value.≥ 0.30%TCu and lower than V_COG. Sulphide Leach ore is processed in the dump leaching plant as an alternative to the concentrator process.
Cerro Colorado OxideSupergene SulphideTransitional SulphideHypogene Sulphide
≥ 0.30%TCu≥ 0.30%TCu≥ 0.20%TCu≥ 0.20%TCu
≥ 0.30%TCu≥ 0.30%TCu––
Spence OxideLow-grade OxideOxide Low SolubilitySupergene SulphideTransitional SulphideHypogene SulphideROM
≥ 0.30%TCu≥ 0.10%TCu–≥ 0.30%TCu≥ 0.15%TCu≥ 0.20%TCu–
≥ 0.30%TCu–≥ 0.30%TCu≥ 0.30%TCu––≥ 0.10%TCu
Pampa Escondida Sulphide ≥ 0.30%TCu –Pinta Verde Oxide & Sulphide ≥ 0.30%TCu –Chimborazo Sulphide ≥ 0.30%TCu –Pinto Valley Miami unit In situ Leach – –Olympic Dam Sulphide
Low-gradeVariable between 0.10%Cu and 0.30%Cu–
Variable between 0.90%Cu and 1.40%Cu≥ 0.18%Cu
Antamina Sulphide Cu only
Sulphide Cu-Zn
Net value per concentrator hour incorporating all material revenue and cost factors and includes metallurgical recovery (see footnote 10 for averages). Mineralisation at the US$0/hr limit averages 0.22%Cu, 4.1g/tAg, 18ppmMo and 6,700t/hr mill throughput.Net value per concentrator hour incorporating all material revenue and cost factors and includes metallurgical recovery (see footnote 10 for averages). Mineralisation at the US$0/hr limit averages 0.14%Cu, 0.84%Zn, 4.8g/tAg and 6,500t/hr mill throughput.
Net value per concentrator hour incorporating all material revenue and cost factors and includes metallurgical recovery (see footnote 10 for averages). Mineralisation at the US$6,000/hr limit averages 0.23%Cu, 5.5g/tAg, 10ppmMo and 6,700t/hr mill throughput.Net value per concentrator hour incorporating all material revenue and cost factors and includes metallurgical recovery (see footnote 10 for averages). Mineralisation at the US$6,000/hr limit averages 0.13%Cu, 0.75%Zn, 7.6g/tAg and 6,500t/hr mill throughput.
Antamina – All metals used in net value calculations for the Antamina Mineral Resources and Ore Reserves are recovered into concentrate (see footnote 10 for averages) and sold.

BHP Billiton Annual Report 2016 253
(2) Escondida – The increase in Mineral Resources was due to an updated resource pit and a revised resource estimate that included 75,000m of additional drill hole data. (3) Cerro Colorado – Ore type previously reported as Sulphide was redefined as Supergene Sulphide. (4) The maiden Hypogene Sulphide Mineral Resources were based on ~95,000m of additional drilling data after the completion of project evaluation studies. (5) Spence – The increase in Mineral Resources was mainly within the Hypogene Sulphide and driven by revised economic inputs in defining the resource pit.(6) Chimborazo – Ore type previously reported as Sulphide Leach was redefined as Sulphide.(7) Olympic Dam – The Mineral Resources are defined by open pit mining and the Ore Reserves are based on underground sub-level open stoping extraction.
CopperMineral Resources
As at 30 June 2016 As at 30 June 2015
Commodity Deposit (1) Ore Type
Measured Resources Indicated Resources Inferred Resources Total Resources BHP Billiton Interest
%
Total Resources
Mt %TCu %SCu ppmMo g/tAu Mt %TCu %SCu ppmMo g/tAu Mt %TCu %SCu ppmMo g/tAu Mt %TCu %SCu ppmMo g/tAu Mt %TCu %SCu ppmMo g/tAu
Copper OperationsEscondida (2) Oxide 109 0.74 – – – 60 0.59 – – – 26 0.54 – – – 195 0.67 – – – 57.5 213 0.68 – – –
Mixed 66 0.65 – – – 69 0.47 – – – 70 0.42 – – – 205 0.51 – – – 203 0.53 – – – Sulphide 5,470 0.64 – – – 3,280 0.51 – – – 11,200 0.52 – – – 20,000 0.55 – – – 18,800 0.54 – – –
Cerro Colorado (3) (4) Oxide 53 0.58 0.41 – – 164 0.62 0.43 – – 24 0.61 0.44 – – 241 0.61 0.43 – – 100 237 0.58 0.42 – – Supergene Sulphide 35 0.62 0.11 – – 109 0.61 0.11 – – 34 0.66 0.11 – – 178 0.62 0.11 – – 168 0.57 0.11 – – Transitional Sulphide – – – – – – – – – – 200 0.44 – – – 200 0.44 – – – – – – – – Hypogene Sulphide – – – – – – – – – – 1,700 0.35 – – – 1,700 0.35 – – – – – – – –
Spence (5) Oxide 42 0.77 0.50 – – 5.9 0.72 0.48 – – – – – – – 48 0.76 0.50 – – 100 54 0.78 0.51 – – Low-grade Oxide 7.6 0.26 – – – 49 0.23 – – – 19 0.17 – – – 76 0.22 – – – 81 0.22 – – – Supergene Sulphide 127 0.83 – – – 41 0.57 – – – 3.7 0.62 – – – 172 0.76 – – – 179 0.80 – – – Transitional Sulphide 24 0.71 – – – 3.6 0.46 – – – – – – – – 28 0.68 – – – 26 0.71 – – – Hypogene Sulphide 520 0.47 – 190 – 800 0.45 – 130 – 1,120 0.39 – 80 – 2,440 0.43 – 120 – 2,300 0.43 – 120 –
Copper ProjectsPampa Escondida Sulphide 294 0.53 – – 0.07 1,150 0.55 – – 0.10 6,000 0.43 – – 0.04 7,440 0.45 – – 0.05 57.5 7,440 0.45 – – 0.05Pinta Verde Oxide 109 0.60 – – – 64 0.53 – – – 15 0.54 – – – 188 0.57 – – – 57.5 188 0.57 – – –
Sulphide – – – – – 23 0.50 – – – 37 0.45 – – – 60 0.47 – – – 60 0.47 – – – Chimborazo (6) Sulphide – – – – – 139 0.50 – – – 84 0.60 – – – 223 0.54 – – – 57.5 223 0.54 – – – Pinto Valley Miami unit In situ Leach 174 0.31 – – – 40 0.32 – – – – – – – – 214 0.31 – – – 100 214 0.31 – – – Copper Uranium Gold Operations Mt %Cu kg/t U3O8 g/tAu g/tAg Mt %Cu kg/t U3O8 g/tAu g/tAg Mt %Cu kg/t U3O8 g/tAu g/tAg Mt %Cu kg/t U3O8 g/tAu g/tAg Mt %Cu kg/t U3O8 g/tAu g/tAg
Olympic Dam (7) Sulphide 1,390 0.95 0.29 0.40 2 4,800 0.78 0.24 0.34 1 4,220 0.70 0.24 0.27 1 10,400 0.77 0.25 0.32 1 100 10,100 0.78 0.25 0.30 1Copper Zinc Operations Mt %Cu %Zn g/tAg ppmMo Mt %Cu %Zn g/tAg ppmMo Mt %Cu %Zn g/tAg ppmMo Mt %Cu %Zn g/tAg ppmMo Mt %Cu %Zn g/tAg ppmMo
Antamina Sulphide Cu only 153 0.90 0.14 7 340 504 0.88 0.14 8 270 780 0.83 0.14 8 220 1,440 0.85 0.14 8 250 33.75 1,440 0.87 0.15 9 260Sulphide Cu-Zn 77 1.00 1.91 16 120 333 0.94 1.84 15 90 493 1.02 1.53 16 80 903 0.99 1.68 16 90 936 0.91 1.67 15 90
5 Financial Statements
7 Shareholder inform
ation6
Additional inform
ation
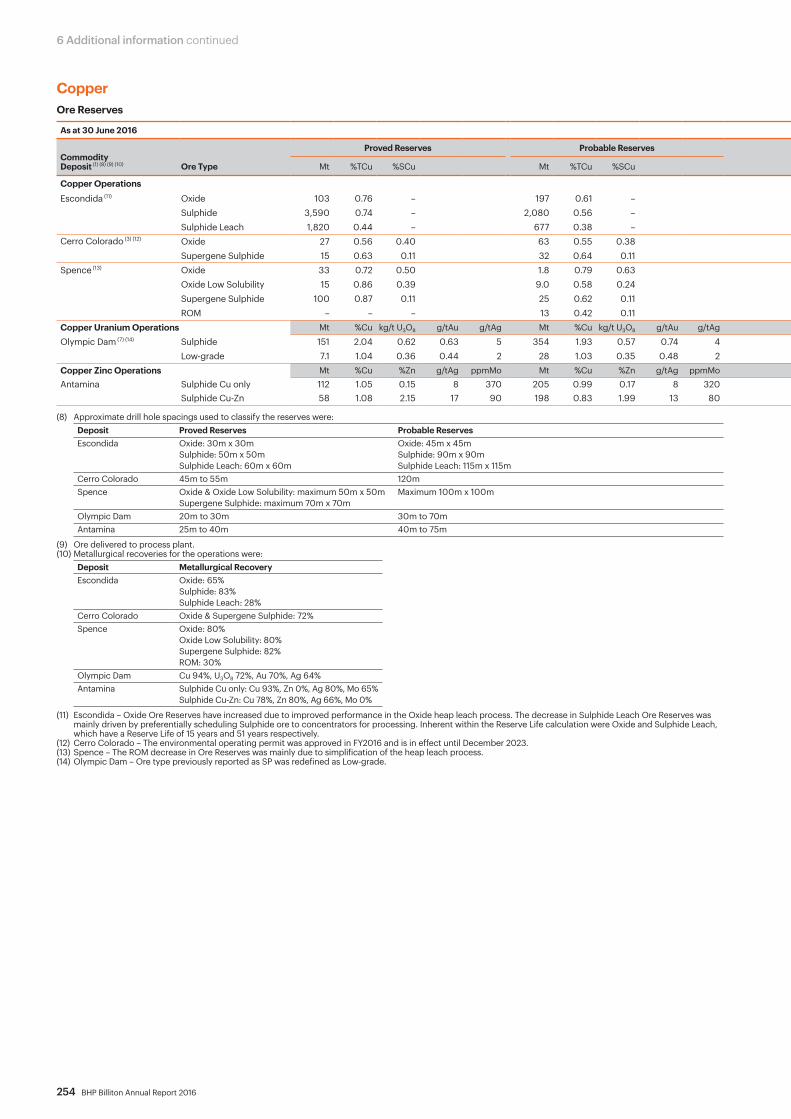
254 BHP Billiton Annual Report 2016
6 Additional information continued
CopperOre Reserves
As at 30 June 2016 As at 30 June 2015
Commodity Deposit (1) (8) (9) (10) Ore Type
Proved Reserves Probable Reserves Total Reserves Reserve Life
(years)
BHP Billiton Interest
%
Total Reserves Reserve Life
(years)Mt %TCu %SCu Mt %TCu %SCu Mt %TCu %SCu Mt %TCu %SCu
Copper OperationsEscondida (11) Oxide 103 0.76 – 197 0.61 – 300 0.66 – 58 57.5 147 0.76 – 54
Sulphide 3,590 0.74 – 2,080 0.56 – 5,670 0.67 – 5,610 0.67 – Sulphide Leach 1,820 0.44 – 677 0.38 – 2,500 0.43 – 2,640 0.45 –
Cerro Colorado (3) (12) Oxide 27 0.56 0.40 63 0.55 0.38 90 0.55 0.39 7.2 100 99 0.56 0.40 7.9Supergene Sulphide 15 0.63 0.11 32 0.64 0.11 47 0.64 0.11 54 0.63 0.12
Spence (13) Oxide 33 0.72 0.50 1.8 0.79 0.63 35 0.72 0.51 8.0 100 41 0.68 0.49 8.9Oxide Low Solubility 15 0.86 0.39 9.0 0.58 0.24 24 0.76 0.33 26 0.73 0.31Supergene Sulphide 100 0.87 0.11 25 0.62 0.11 125 0.82 0.11 135 0.86 0.12ROM – – – 13 0.42 0.11 13 0.42 0.11 55 0.37 0.08
Copper Uranium Operations Mt %Cu kg/t U3O8 g/tAu g/tAg Mt %Cu kg/t U3O8 g/tAu g/tAg Mt %Cu kg/t U3O8 g/tAu g/tAg Mt %Cu kg/t U3O8 g/tAu g/tAg
Olympic Dam (7) (14) Sulphide 151 2.04 0.62 0.63 5 354 1.93 0.57 0.74 4 505 1.96 0.58 0.71 4 51 100 484 1.95 0.59 0.74 4 48Low-grade 7.1 1.04 0.36 0.44 2 28 1.03 0.35 0.48 2 35 1.03 0.35 0.47 2 44 0.99 0.37 0.51 2
Copper Zinc Operations Mt %Cu %Zn g/tAg ppmMo Mt %Cu %Zn g/tAg ppmMo Mt %Cu %Zn g/tAg ppmMo Mt %Cu %Zn g/tAg ppmMoAntamina Sulphide Cu only 112 1.05 0.15 8 370 205 0.99 0.17 8 320 317 1.01 0.16 8 340 11 33.75 352 1.00 0.17 8 340 12
Sulphide Cu-Zn 58 1.08 2.15 17 90 198 0.83 1.99 13 80 256 0.89 2.03 14 80 262 0.88 2.11 14 80
(8) Approximate drill hole spacings used to classify the reserves were:Deposit Proved Reserves Probable ReservesEscondida Oxide: 30m x 30m
Sulphide: 50m x 50mSulphide Leach: 60m x 60m
Oxide: 45m x 45mSulphide: 90m x 90mSulphide Leach: 115m x 115m
Cerro Colorado 45m to 55m 120mSpence Oxide & Oxide Low Solubility: maximum 50m x 50m
Supergene Sulphide: maximum 70m x 70mMaximum 100m x 100m
Olympic Dam 20m to 30m 30m to 70mAntamina 25m to 40m 40m to 75m
(9) Ore delivered to process plant.(10) Metallurgical recoveries for the operations were:
Deposit Metallurgical RecoveryEscondida Oxide: 65%
Sulphide: 83%Sulphide Leach: 28%
Cerro Colorado Oxide & Supergene Sulphide: 72%Spence Oxide: 80%
Oxide Low Solubility: 80%Supergene Sulphide: 82%ROM: 30%
Olympic Dam Cu 94%, U3O8 72%, Au 70%, Ag 64%Antamina Sulphide Cu only: Cu 93%, Zn 0%, Ag 80%, Mo 65%
Sulphide Cu-Zn: Cu 78%, Zn 80%, Ag 66%, Mo 0%
(11) Escondida – Oxide Ore Reserves have increased due to improved performance in the Oxide heap leach process. The decrease in Sulphide Leach Ore Reserves was mainly driven by preferentially scheduling Sulphide ore to concentrators for processing. Inherent within the Reserve Life calculation were Oxide and Sulphide Leach, which have a Reserve Life of 15 years and 51 years respectively.
(12) Cerro Colorado – The environmental operating permit was approved in FY2016 and is in effect until December 2023.(13) Spence – The ROM decrease in Ore Reserves was mainly due to simplification of the heap leach process.(14) Olympic Dam – Ore type previously reported as SP was redefined as Low-grade.
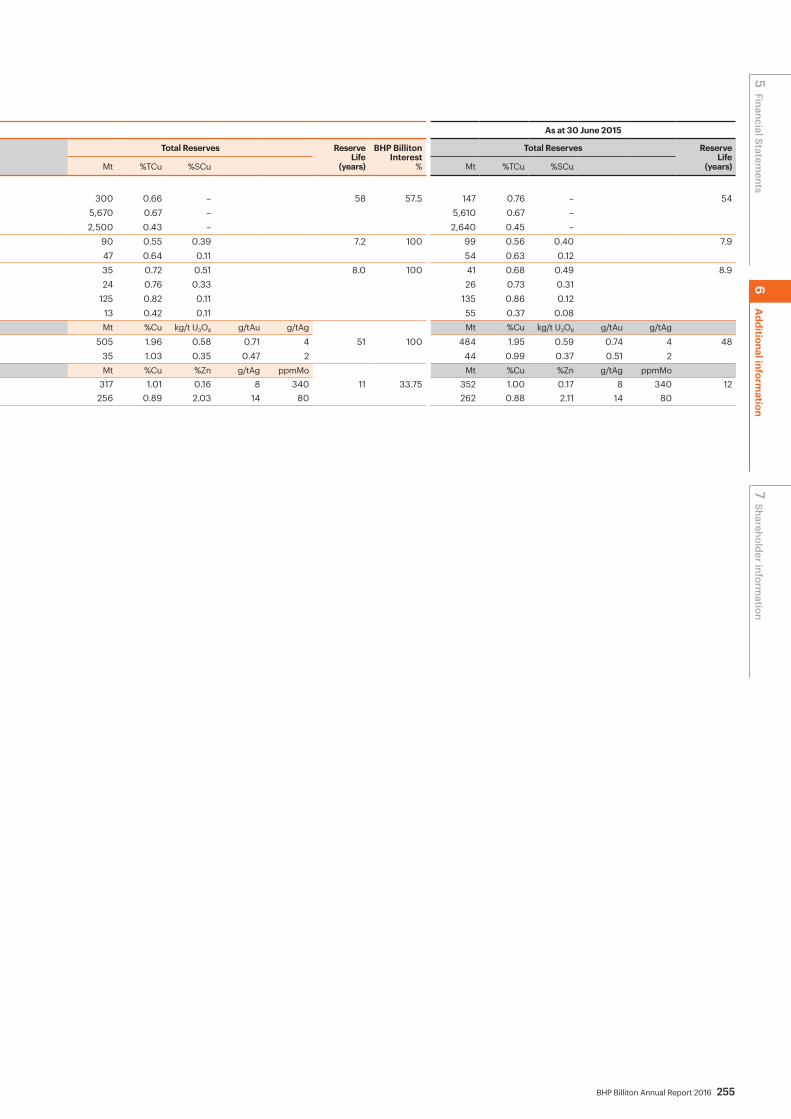
BHP Billiton Annual Report 2016 255
CopperOre Reserves
As at 30 June 2016 As at 30 June 2015
Commodity Deposit (1) (8) (9) (10) Ore Type
Proved Reserves Probable Reserves Total Reserves Reserve Life
(years)
BHP Billiton Interest
%
Total Reserves Reserve Life
(years)Mt %TCu %SCu Mt %TCu %SCu Mt %TCu %SCu Mt %TCu %SCu
Copper OperationsEscondida (11) Oxide 103 0.76 – 197 0.61 – 300 0.66 – 58 57.5 147 0.76 – 54
Sulphide 3,590 0.74 – 2,080 0.56 – 5,670 0.67 – 5,610 0.67 – Sulphide Leach 1,820 0.44 – 677 0.38 – 2,500 0.43 – 2,640 0.45 –
Cerro Colorado (3) (12) Oxide 27 0.56 0.40 63 0.55 0.38 90 0.55 0.39 7.2 100 99 0.56 0.40 7.9Supergene Sulphide 15 0.63 0.11 32 0.64 0.11 47 0.64 0.11 54 0.63 0.12
Spence (13) Oxide 33 0.72 0.50 1.8 0.79 0.63 35 0.72 0.51 8.0 100 41 0.68 0.49 8.9Oxide Low Solubility 15 0.86 0.39 9.0 0.58 0.24 24 0.76 0.33 26 0.73 0.31Supergene Sulphide 100 0.87 0.11 25 0.62 0.11 125 0.82 0.11 135 0.86 0.12ROM – – – 13 0.42 0.11 13 0.42 0.11 55 0.37 0.08
Copper Uranium Operations Mt %Cu kg/t U3O8 g/tAu g/tAg Mt %Cu kg/t U3O8 g/tAu g/tAg Mt %Cu kg/t U3O8 g/tAu g/tAg Mt %Cu kg/t U3O8 g/tAu g/tAg
Olympic Dam (7) (14) Sulphide 151 2.04 0.62 0.63 5 354 1.93 0.57 0.74 4 505 1.96 0.58 0.71 4 51 100 484 1.95 0.59 0.74 4 48Low-grade 7.1 1.04 0.36 0.44 2 28 1.03 0.35 0.48 2 35 1.03 0.35 0.47 2 44 0.99 0.37 0.51 2
Copper Zinc Operations Mt %Cu %Zn g/tAg ppmMo Mt %Cu %Zn g/tAg ppmMo Mt %Cu %Zn g/tAg ppmMo Mt %Cu %Zn g/tAg ppmMoAntamina Sulphide Cu only 112 1.05 0.15 8 370 205 0.99 0.17 8 320 317 1.01 0.16 8 340 11 33.75 352 1.00 0.17 8 340 12
Sulphide Cu-Zn 58 1.08 2.15 17 90 198 0.83 1.99 13 80 256 0.89 2.03 14 80 262 0.88 2.11 14 80
5 Financial Statements
7 Shareholder inform
ation6
Additional inform
ation

256 BHP Billiton Annual Report 2016
6 Additional information continued
Iron OreMineral Resources
As at 30 June 2016 As at 30 June 2015
Commodity Deposit (1) (2) Ore Type
Measured Resources Indicated Resources Inferred Resources Total Resources BHP Billiton Interest
%
Total Resources
Mt %Fe %P %SiO2 %Al2O3 %LOI Mt %Fe %P %SiO2 %Al2O3 %LOI Mt %Fe %P %SiO2 %Al2O3 %LOI Mt %Fe %P %SiO2 %Al2O3 %LOI Mt %Fe %P %SiO2 %Al2O3 %LOI
Iron Ore Operations AustraliaWAIO (3)(4) BKM 1,300 62.5 0.12 3.4 2.3 4.3 4,600 60.0 0.14 4.8 2.5 6.1 12,000 59.3 0.14 5.3 2.7 6.5 18,000 59.7 0.14 5.0 2.6 6.2 89 18,000 59.6 0.14 5.1 2.6 6.2
CID 850 56.1 0.05 6.4 2.0 10.8 380 56.3 0.06 6.4 2.3 10.3 910 54.8 0.06 6.8 2.9 11.1 2,100 55.6 0.05 6.6 2.5 10.8 2,200 55.6 0.05 6.5 2.4 10.9MM 650 62.2 0.07 2.9 1.6 6.1 1,100 60.9 0.06 3.7 1.9 6.7 5,700 59.8 0.06 4.5 2.3 7.0 7,400 60.1 0.06 4.2 2.2 6.9 7,000 60.0 0.07 4.3 2.2 7.0NIM 10 59.0 0.08 10.1 1.2 3.9 120 61.6 0.06 8.0 1.1 1.7 70 60.4 0.05 10.0 1.2 1.7 200 61.1 0.06 8.8 1.2 1.8 200 61.1 0.06 8.8 1.2 1.8
Brazil Mt %Fe %Pc Mt %Fe %Pc Mt %Fe %Pc Mt %Fe %Pc Mt %Fe %PcSamarco JV (5) ROM 2,800 39.2 0.05 2,800 37.2 0.05 1,300 35.8 0.05 6,900 37.7 0.05 50 7,300 37.7 0.05
Ore Reserves
As at 30 June 2016 As at 30 June 2015
Commodity Deposit (1) (6) (7) (8) (9) (10) Ore Type
Proved Reserves Probable Reserves Total Reserves Reserve Life
(years)
BHP Billiton Interest
%
Total Reserves Reserve Life
(years)Mt %Fe %P %SiO2 %Al2O3 %LOI Mt %Fe %P %SiO2 %Al2O3 %LOI Mt %Fe %P %SiO2 %Al2O3 %LOI Mt %Fe %P %SiO2 %Al2O3 %LOI
Iron Ore Operations AustraliaWAIO (3) (4) (11) (12) BKM 860 63.1 0.11 3.1 2.1 3.9 1,700 61.3 0.13 4.2 2.4 5.0 2,600 61.9 0.12 3.8 2.3 4.7 14 89 2,400 62.2 0.12 3.8 2.2 4.6 15
BKM Bene 20 57.8 0.11 10.3 3.2 2.0 30 57.0 0.10 12.0 3.0 1.9 50 57.4 0.10 11.3 3.1 1.9 170 61.2 0.12 6.5 2.7 1.7CID 580 56.4 0.05 6.3 1.8 10.8 90 56.8 0.04 6.3 1.6 10.3 670 56.5 0.05 6.3 1.8 10.7 740 56.5 0.05 6.2 1.7 10.8MM 230 62.3 0.07 2.9 1.7 5.8 430 60.2 0.07 4.5 2.2 6.4 660 60.9 0.07 4.0 2.0 6.2 610 61.2 0.07 3.6 2.0 6.1
Brazil Mt %Fe %Pc Mt %Fe %Pc Mt %Fe %Pc Mt %Fe %PcSamarco JV (13) ROM 55 43.1 0.06 7.0 45.1 0.06 62 43.3 0.06 2.0 50 2,900 39.6 0.05 38
(1) The Mineral Resources and Ore Reserves grades listed refer to in situ mass percentage on a dry weight basis. Wet tonnes are reported for WAIO deposits and Samarco JV, including moisture contents: BKM – Brockman 3%, BKM Bene – Brockman Beneficiation 3%, CID – Channel Iron Deposits 8%, MM – Marra Mamba 4%, NIM – Nimingarra 3.5%, Samarco JV 6.5%.
(2) A single cut-off grade was applied per deposit with cut-offs ranging from 50–55%Fe across WAIO. The cut-off grade applied for Samarco JV was 22%Fe.(3) WAIO Mineral Resources and Ore Reserves are reported on a Pilbara basis by ore type to align with our production of the Newman Blend lump product which
comprises BKM, BKM Bene and MM ore types, in addition to other lump and fines products including CID. This also reflects our single logistics chain and associated management system.
(4) WAIO BHP Billiton interest is reported as Pilbara Ore Reserves tonnes weighted average across all Joint Ventures. BHP Billiton ownership varies between 85% and 100%.(5) Samarco JV – The decrease in Mineral Resources was due to a boundary change of the Gandarela National Park, revised protocol prices and operational costs and a
review on the constraint limits of the Piracicaba River and the Palmital and Almas streams.(6) Approximate drill hole spacings used to classify the reserves were:
Deposit Proved Reserves Probable ReservesWAIO 50m x 50m 150m x 50mSamarco JV Maximum 150m x 100m Maximum 300m x 200m
(7) WAIO recovery was 100%, except for BKM Bene, where Whaleback beneficiation plant recovery was 72% (tonnage basis). Samarco JV recovery was 82% (metal basis).(8) Iron ore is marketed for WAIO as Lump (direct blast furnace feed) and Fines (sinter plant feed) and Samarco JV as Fines (sinter plant feed), direct reduction and blast
furnace pellets. (9) Cut-off grades: WAIO 50–58%Fe for all material types; Samarco JV Fe ≥ 22%, Pc ≤ 0.097% (phosphorous in concentrate) and PPCc ≤ 7.7% (LOI in concentrate).(10) Ore delivered to process plant.(11) WAIO Ore Reserves are all located on State Agreement mining leases that guarantee the right to mine. Across WAIO, State Government approvals (including
environmental and heritage clearances) are required before commencing mining operations in a particular area. Included in the Ore Reserves are select areas where one or more approvals remain outstanding, but where, based on the technical investigations carried out as part of the mine planning process and company knowledge and experience of the approvals process, it is expected that such approvals will be obtained as part of the normal course of business and within the time frame required by the current mine schedule.
(12) WAIO – Revised economic criteria within the mine plan has significantly reduced tonnage to the beneficiation plant. Some BKM Bene Ore Reserves have been reclassified as BKM. The decrease in Reserve Life was due to an increase in nominated production rate from 264Mt to 275Mt.
(13) Samarco JV – The decrease in Ore Reserves was due to discontinuation of operating permits following the Fundão dam failure in November 2015. The declared Ore Reserves represent the basis for the re-start mine plan for which operating approvals have been requested and there is a reasonable expectation of permits being received within the next two years. The re-start mine plan assumes storage of waste and tailings material in existing open-pit voids and complies with existing environmental licences.
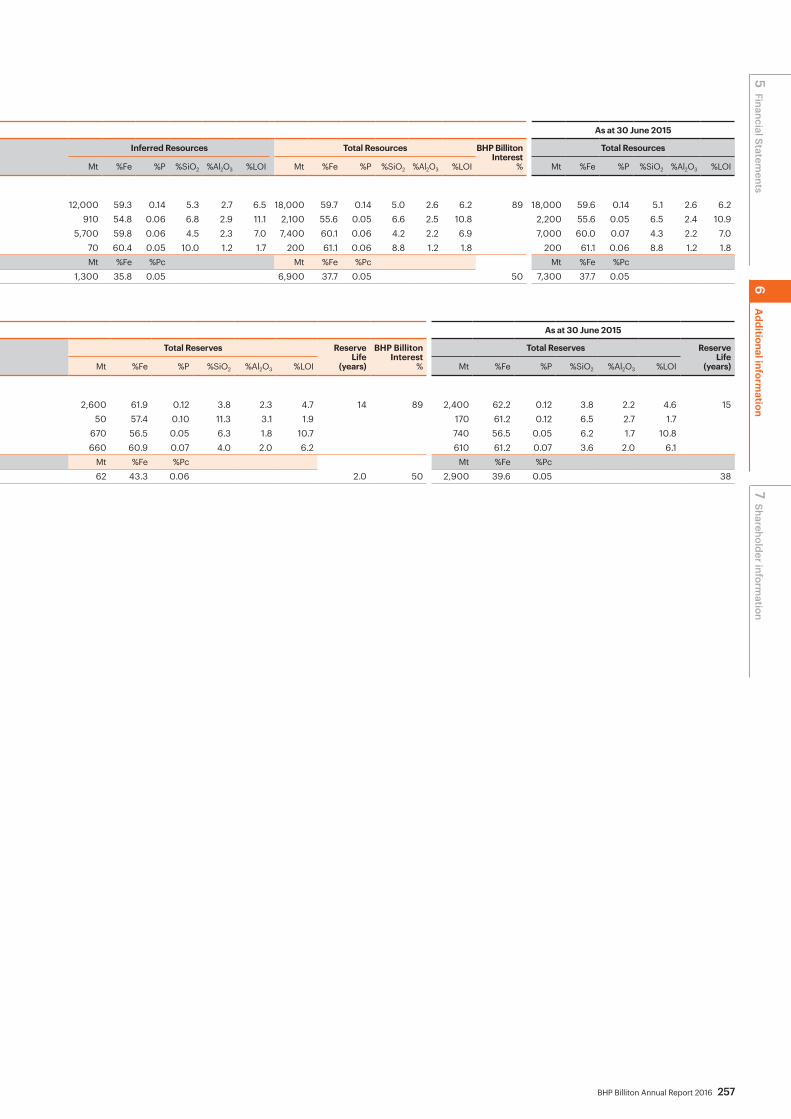
BHP Billiton Annual Report 2016 257
Iron OreMineral Resources
As at 30 June 2016 As at 30 June 2015
Commodity Deposit (1) (2) Ore Type
Measured Resources Indicated Resources Inferred Resources Total Resources BHP Billiton Interest
%
Total Resources
Mt %Fe %P %SiO2 %Al2O3 %LOI Mt %Fe %P %SiO2 %Al2O3 %LOI Mt %Fe %P %SiO2 %Al2O3 %LOI Mt %Fe %P %SiO2 %Al2O3 %LOI Mt %Fe %P %SiO2 %Al2O3 %LOI
Iron Ore Operations AustraliaWAIO (3)(4) BKM 1,300 62.5 0.12 3.4 2.3 4.3 4,600 60.0 0.14 4.8 2.5 6.1 12,000 59.3 0.14 5.3 2.7 6.5 18,000 59.7 0.14 5.0 2.6 6.2 89 18,000 59.6 0.14 5.1 2.6 6.2
CID 850 56.1 0.05 6.4 2.0 10.8 380 56.3 0.06 6.4 2.3 10.3 910 54.8 0.06 6.8 2.9 11.1 2,100 55.6 0.05 6.6 2.5 10.8 2,200 55.6 0.05 6.5 2.4 10.9MM 650 62.2 0.07 2.9 1.6 6.1 1,100 60.9 0.06 3.7 1.9 6.7 5,700 59.8 0.06 4.5 2.3 7.0 7,400 60.1 0.06 4.2 2.2 6.9 7,000 60.0 0.07 4.3 2.2 7.0NIM 10 59.0 0.08 10.1 1.2 3.9 120 61.6 0.06 8.0 1.1 1.7 70 60.4 0.05 10.0 1.2 1.7 200 61.1 0.06 8.8 1.2 1.8 200 61.1 0.06 8.8 1.2 1.8
Brazil Mt %Fe %Pc Mt %Fe %Pc Mt %Fe %Pc Mt %Fe %Pc Mt %Fe %PcSamarco JV (5) ROM 2,800 39.2 0.05 2,800 37.2 0.05 1,300 35.8 0.05 6,900 37.7 0.05 50 7,300 37.7 0.05
Ore Reserves
As at 30 June 2016 As at 30 June 2015
Commodity Deposit (1) (6) (7) (8) (9) (10) Ore Type
Proved Reserves Probable Reserves Total Reserves Reserve Life
(years)
BHP Billiton Interest
%
Total Reserves Reserve Life
(years)Mt %Fe %P %SiO2 %Al2O3 %LOI Mt %Fe %P %SiO2 %Al2O3 %LOI Mt %Fe %P %SiO2 %Al2O3 %LOI Mt %Fe %P %SiO2 %Al2O3 %LOI
Iron Ore Operations AustraliaWAIO (3) (4) (11) (12) BKM 860 63.1 0.11 3.1 2.1 3.9 1,700 61.3 0.13 4.2 2.4 5.0 2,600 61.9 0.12 3.8 2.3 4.7 14 89 2,400 62.2 0.12 3.8 2.2 4.6 15
BKM Bene 20 57.8 0.11 10.3 3.2 2.0 30 57.0 0.10 12.0 3.0 1.9 50 57.4 0.10 11.3 3.1 1.9 170 61.2 0.12 6.5 2.7 1.7CID 580 56.4 0.05 6.3 1.8 10.8 90 56.8 0.04 6.3 1.6 10.3 670 56.5 0.05 6.3 1.8 10.7 740 56.5 0.05 6.2 1.7 10.8MM 230 62.3 0.07 2.9 1.7 5.8 430 60.2 0.07 4.5 2.2 6.4 660 60.9 0.07 4.0 2.0 6.2 610 61.2 0.07 3.6 2.0 6.1
Brazil Mt %Fe %Pc Mt %Fe %Pc Mt %Fe %Pc Mt %Fe %PcSamarco JV (13) ROM 55 43.1 0.06 7.0 45.1 0.06 62 43.3 0.06 2.0 50 2,900 39.6 0.05 38
5 Financial Statements
7 Shareholder inform
ation6
Additional inform
ation

258 BHP Billiton Annual Report 2016
6 Additional information continued
Metallurgical CoalCoal Resources
As at 30 June 2016 As at 30 June 2015
Commodity Deposit (1) (2) Mining Method Coal Type
Measured Resources Indicated Resources Inferred Resources Total Resources BHP Billiton Interest
%
Total Resources
Mt %Ash %VM %S Mt %Ash %VM %S Mt %Ash %VM %S Mt %Ash %VM %S Mt %Ash %VM %S
Metallurgical Coal OperationsQueensland CoalCQCA JVGoonyella Riverside Broadmeadow
OC Met 839 8.8 22.6 0.53 32 11.2 24.3 0.56 40 12.6 25.1 0.54 911 9.1 22.8 0.53 50 930 9.1 22.8 0.53UG Met 601 9.4 21.2 0.52 423 10.2 22.9 0.55 15 13.4 24.5 0.59 1,039 9.8 21.9 0.53 1,047 9.8 21.9 0.53
Peak Downs (3) (4) OC Met 393 9.5 20.5 0.67 551 9.8 20.3 0.66 353 9.8 19.9 0.68 1,297 9.7 20.3 0.67 50 1,959 10.2 20.9 0.63UG Met – – – – – – – – – – – – – – – – 108 9.9 19.9 0.57
Caval Ridge (4) OC Met 465 12.9 22.1 0.60 207 12.9 21.9 0.57 130 13.6 22.2 0.59 802 13.0 22.1 0.59 50 – – – –Saraji OC Met 705 11.2 18.7 0.79 193 10.9 18.5 0.79 90 11.3 18.7 0.76 988 11.2 18.7 0.79 50 1,002 11.2 18.7 0.79Norwich Park OC Met 221 9.6 17.6 0.66 128 9.9 17.5 0.71 116 10.3 17.7 0.76 465 9.8 17.6 0.70 50 465 9.8 17.6 0.70
UG Met – – – – 20 9.4 17.4 0.73 22 9.9 17.1 0.65 42 9.7 17.3 0.69 42 9.7 17.3 0.69Blackwater OC Met/Th 164 7.3 27.2 0.42 479 8.2 26.5 0.41 669 8.1 27.2 0.42 1,312 8.0 26.9 0.42 50 1,329 8.0 26.9 0.42
UG Met/Th – – – – 204 6.4 27.4 0.38 686 7.4 27.8 0.38 890 7.2 27.7 0.38 890 7.2 27.7 0.38Daunia OC Met 90 8.0 20.8 0.36 52 8.6 20.0 0.32 19 15.2 19.5 0.42 161 9.0 20.4 0.35 50 165 9.0 20.4 0.35Gregory JVGregory Crinum OC Met 7.9 6.0 33.0 0.60 0.7 5.7 32.4 0.63 – – – – 8.6 6.0 33.0 0.60 50 8.6 6.0 33.0 0.60
UG Met – – – – 112 6.3 32.9 0.60 0.3 7.1 31.5 0.62 113 6.3 32.9 0.60 115 6.3 32.9 0.60BHP Billiton MitsuiSouth Walker Creek (5) OC Met 214 10.2 13.3 0.31 193 10.1 13.5 0.30 104 14.2 13.7 0.39 511 10.9 13.5 0.32 80 438 10.6 13.4 0.31
UG Met – – – – 145 10.3 12.9 0.29 99 10.6 13.7 0.32 244 10.4 13.3 0.30 237 10.4 13.2 0.30Poitrel OC Met 63 8.1 23.2 0.31 54 8.4 23.9 0.36 35 8.4 23.8 0.37 152 8.3 23.6 0.34 80 157 8.3 23.6 0.34IndonesiaIndoMet Coal (6)
Haju OC Met/Th 10 4.6 39.2 0.98 2.0 5.1 39.0 0.97 1.0 4.6 39.0 0.89 13 4.7 39.2 0.98 75 14 4.7 39.2 0.98Metallurgical Coal ProjectsQueensland CoalCQCA JVRed Hill OC Met/Th – – – – 25 12.4 19.8 0.49 – – – – 25 12.4 19.8 0.49 50 25 12.4 19.8 0.49
UG Met – – – – 1,123 9.8 19.5 0.52 563 10.0 20.4 0.52 1,686 9.9 19.8 0.52 1,686 9.9 19.8 0.52Peak Downs East (3) (7) OC Met 192 9.7 18.5 0.59 312 10.4 18.7 0.61 316 10.8 18.9 0.71 820 10.4 18.7 0.64 50 – – – –
UG Met – – – – – – – – – – – – – – – – 772 9.7 17.7 0.55Saraji East (7) OC Met 509 10.2 16.0 0.63 689 10.3 15.8 0.67 510 10.0 15.3 0.68 1,708 10.2 15.7 0.66 50 1,550 10.9 17.2 0.68
UG Met – – – – 35 8.3 13.6 0.59 16 8.5 13.9 0.59 51 8.4 13.7 0.59 97 9.0 16.5 0.57Gregory JVLiskeard OC Met 5.6 7.5 34.6 2.30 – – – – – – – – 5.6 7.5 34.6 2.30 50 5.6 7.5 34.6 2.30BHP Billiton Mitsui CoalNebo West OC Anth – – – – 178 9.0 7.5 0.60 – – – – 178 9.0 7.5 0.60 80 178 9.0 7.5 0.60Bee Creek OC Met/Th – – – – 55 8.5 14.4 0.42 5.1 8.5 13.0 0.42 60 8.5 14.3 0.42 80 60 8.5 14.3 0.42Wards Well UG Met – – – – 1,224 8.9 20.7 0.53 149 9.3 20.1 0.53 1,373 8.9 20.6 0.53 80 1,373 8.9 20.6 0.53Indonesia IndoMet Coal (6)
Lampunut (8) OC Met 63 4.5 28.5 0.50 34 4.7 28.6 0.63 13 4.7 28.5 0.64 110 4.6 28.5 0.56 75 110 4.2 28.5 0.55OC Th – – – – – – – – – – – – – – – – 10 – – –
Luon OC Met/Th – – – – – – – – 80 3.6 18.7 0.72 80 3.6 18.7 0.72 75 80 3.6 18.7 0.72UG Met – – – – – – – – 60 3.4 18.8 0.56 60 3.4 18.8 0.56 60 3.4 18.8 0.56
Bumbun OC Met/Th – – – – 82 3.5 17.6 0.76 105 3.5 17.7 0.77 187 3.5 17.7 0.76 75 187 3.5 17.7 0.76Juloi Northwest OC Met/Th – – – – 70 4.0 26.5 0.45 740 4.2 27.0 0.51 810 4.2 26.9 0.50 75 810 4.2 26.9 0.50
(1) Tonnages are reported on an in situ moisture basis. Coal qualities are for a potential product on an air-dried basis.(2) Cut-off criteria:
Deposit Mining Method Coal Resources Coal ReservesCQCA JV (excluding Daunia), GregoryDauniaCQCA JV (excluding Broadmeadow), Crinum Broadmeadow
OCOCUGUG
≥ 0.5m seam thickness≥ 0.3m seam thickness≥ 2.0m seam thickness≥ 2.0m seam thickness
≥ 0.5m seam thickness≥ 0.3m seam thickness≥ 2.0m seam thickness≥ 2.5m seam thickness
South Walker Creek, Poitrel
South Walker Creek
OC UG
≥ 0.5m seam thickness, core yields ≥ 50% and 100m lease boundary buffer≥ 2.0m seam thickness, ≤ 10° seam dip, ≥ mining depth 60m
≥ 0.5m seam thickness –
Haju OC ≥ 0.3m seam thickness at < 12:1 bcm/t overburden ratio
Met < 2.5% sulphur and < 20% ash; Th ≥ 2.5% sulphur and ≥ 20% ash
Liskeard OC ≥ 0.5m seam thickness at < 15:1 bcm/t overburden ratio
–
Nebo West, Bee Creek OC ≥ 0.5m seam thickness –Wards Well UG ≥ 2.0m seam thickness –Lampunut OC ≥ 0.3m seam thickness –
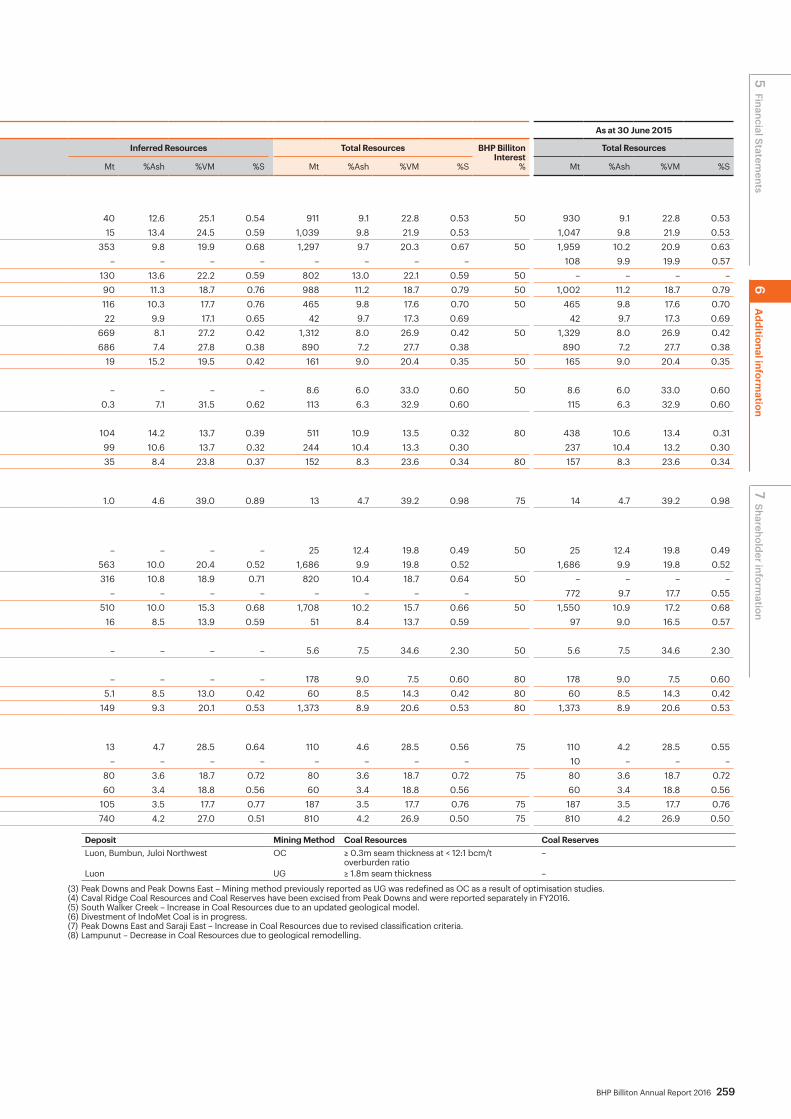
BHP Billiton Annual Report 2016 259
Metallurgical CoalCoal Resources
As at 30 June 2016 As at 30 June 2015
Commodity Deposit (1) (2) Mining Method Coal Type
Measured Resources Indicated Resources Inferred Resources Total Resources BHP Billiton Interest
%
Total Resources
Mt %Ash %VM %S Mt %Ash %VM %S Mt %Ash %VM %S Mt %Ash %VM %S Mt %Ash %VM %S
Metallurgical Coal OperationsQueensland CoalCQCA JVGoonyella Riverside Broadmeadow
OC Met 839 8.8 22.6 0.53 32 11.2 24.3 0.56 40 12.6 25.1 0.54 911 9.1 22.8 0.53 50 930 9.1 22.8 0.53UG Met 601 9.4 21.2 0.52 423 10.2 22.9 0.55 15 13.4 24.5 0.59 1,039 9.8 21.9 0.53 1,047 9.8 21.9 0.53
Peak Downs (3) (4) OC Met 393 9.5 20.5 0.67 551 9.8 20.3 0.66 353 9.8 19.9 0.68 1,297 9.7 20.3 0.67 50 1,959 10.2 20.9 0.63UG Met – – – – – – – – – – – – – – – – 108 9.9 19.9 0.57
Caval Ridge (4) OC Met 465 12.9 22.1 0.60 207 12.9 21.9 0.57 130 13.6 22.2 0.59 802 13.0 22.1 0.59 50 – – – –Saraji OC Met 705 11.2 18.7 0.79 193 10.9 18.5 0.79 90 11.3 18.7 0.76 988 11.2 18.7 0.79 50 1,002 11.2 18.7 0.79Norwich Park OC Met 221 9.6 17.6 0.66 128 9.9 17.5 0.71 116 10.3 17.7 0.76 465 9.8 17.6 0.70 50 465 9.8 17.6 0.70
UG Met – – – – 20 9.4 17.4 0.73 22 9.9 17.1 0.65 42 9.7 17.3 0.69 42 9.7 17.3 0.69Blackwater OC Met/Th 164 7.3 27.2 0.42 479 8.2 26.5 0.41 669 8.1 27.2 0.42 1,312 8.0 26.9 0.42 50 1,329 8.0 26.9 0.42
UG Met/Th – – – – 204 6.4 27.4 0.38 686 7.4 27.8 0.38 890 7.2 27.7 0.38 890 7.2 27.7 0.38Daunia OC Met 90 8.0 20.8 0.36 52 8.6 20.0 0.32 19 15.2 19.5 0.42 161 9.0 20.4 0.35 50 165 9.0 20.4 0.35Gregory JVGregory Crinum OC Met 7.9 6.0 33.0 0.60 0.7 5.7 32.4 0.63 – – – – 8.6 6.0 33.0 0.60 50 8.6 6.0 33.0 0.60
UG Met – – – – 112 6.3 32.9 0.60 0.3 7.1 31.5 0.62 113 6.3 32.9 0.60 115 6.3 32.9 0.60BHP Billiton MitsuiSouth Walker Creek (5) OC Met 214 10.2 13.3 0.31 193 10.1 13.5 0.30 104 14.2 13.7 0.39 511 10.9 13.5 0.32 80 438 10.6 13.4 0.31
UG Met – – – – 145 10.3 12.9 0.29 99 10.6 13.7 0.32 244 10.4 13.3 0.30 237 10.4 13.2 0.30Poitrel OC Met 63 8.1 23.2 0.31 54 8.4 23.9 0.36 35 8.4 23.8 0.37 152 8.3 23.6 0.34 80 157 8.3 23.6 0.34IndonesiaIndoMet Coal (6)
Haju OC Met/Th 10 4.6 39.2 0.98 2.0 5.1 39.0 0.97 1.0 4.6 39.0 0.89 13 4.7 39.2 0.98 75 14 4.7 39.2 0.98Metallurgical Coal ProjectsQueensland CoalCQCA JVRed Hill OC Met/Th – – – – 25 12.4 19.8 0.49 – – – – 25 12.4 19.8 0.49 50 25 12.4 19.8 0.49
UG Met – – – – 1,123 9.8 19.5 0.52 563 10.0 20.4 0.52 1,686 9.9 19.8 0.52 1,686 9.9 19.8 0.52Peak Downs East (3) (7) OC Met 192 9.7 18.5 0.59 312 10.4 18.7 0.61 316 10.8 18.9 0.71 820 10.4 18.7 0.64 50 – – – –
UG Met – – – – – – – – – – – – – – – – 772 9.7 17.7 0.55Saraji East (7) OC Met 509 10.2 16.0 0.63 689 10.3 15.8 0.67 510 10.0 15.3 0.68 1,708 10.2 15.7 0.66 50 1,550 10.9 17.2 0.68
UG Met – – – – 35 8.3 13.6 0.59 16 8.5 13.9 0.59 51 8.4 13.7 0.59 97 9.0 16.5 0.57Gregory JVLiskeard OC Met 5.6 7.5 34.6 2.30 – – – – – – – – 5.6 7.5 34.6 2.30 50 5.6 7.5 34.6 2.30BHP Billiton Mitsui CoalNebo West OC Anth – – – – 178 9.0 7.5 0.60 – – – – 178 9.0 7.5 0.60 80 178 9.0 7.5 0.60Bee Creek OC Met/Th – – – – 55 8.5 14.4 0.42 5.1 8.5 13.0 0.42 60 8.5 14.3 0.42 80 60 8.5 14.3 0.42Wards Well UG Met – – – – 1,224 8.9 20.7 0.53 149 9.3 20.1 0.53 1,373 8.9 20.6 0.53 80 1,373 8.9 20.6 0.53Indonesia IndoMet Coal (6)
Lampunut (8) OC Met 63 4.5 28.5 0.50 34 4.7 28.6 0.63 13 4.7 28.5 0.64 110 4.6 28.5 0.56 75 110 4.2 28.5 0.55OC Th – – – – – – – – – – – – – – – – 10 – – –
Luon OC Met/Th – – – – – – – – 80 3.6 18.7 0.72 80 3.6 18.7 0.72 75 80 3.6 18.7 0.72UG Met – – – – – – – – 60 3.4 18.8 0.56 60 3.4 18.8 0.56 60 3.4 18.8 0.56
Bumbun OC Met/Th – – – – 82 3.5 17.6 0.76 105 3.5 17.7 0.77 187 3.5 17.7 0.76 75 187 3.5 17.7 0.76Juloi Northwest OC Met/Th – – – – 70 4.0 26.5 0.45 740 4.2 27.0 0.51 810 4.2 26.9 0.50 75 810 4.2 26.9 0.50
Deposit Mining Method Coal Resources Coal ReservesLuon, Bumbun, Juloi Northwest
Luon
OC
UG
≥ 0.3m seam thickness at < 12:1 bcm/t overburden ratio≥ 1.8m seam thickness
–
–
(3) Peak Downs and Peak Downs East – Mining method previously reported as UG was redefined as OC as a result of optimisation studies.(4) Caval Ridge Coal Resources and Coal Reserves have been excised from Peak Downs and were reported separately in FY2016.(5) South Walker Creek – Increase in Coal Resources due to an updated geological model.(6) Divestment of IndoMet Coal is in progress.(7) Peak Downs East and Saraji East – Increase in Coal Resources due to revised classification criteria.(8) Lampunut – Decrease in Coal Resources due to geological remodelling.
5 Financial Statements
7 Shareholder inform
ation6
Additional inform
ation
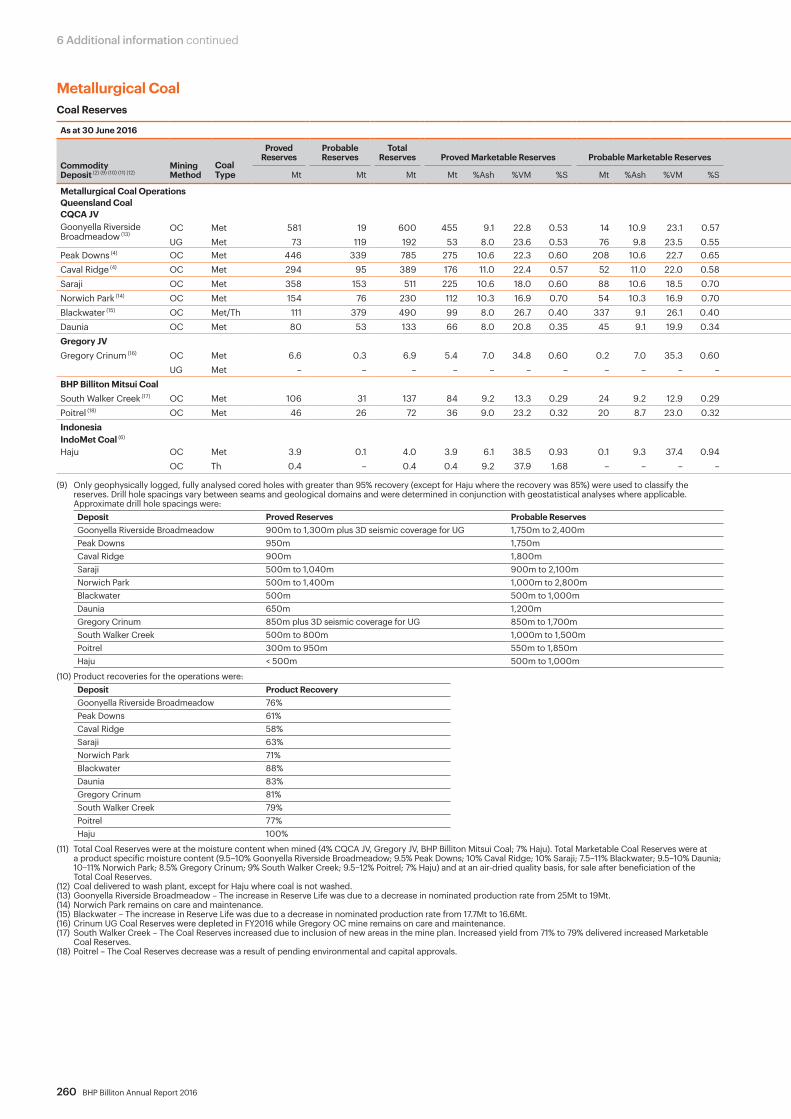
260 BHP Billiton Annual Report 2016
6 Additional information continued
Metallurgical CoalCoal Reserves
As at 30 June 2016 As at 30 June 2015
Commodity Deposit (2) (9) (10) (11) (12)
Mining Method
Coal Type
Proved Reserves
Probable Reserves
Total Reserves Proved Marketable Reserves Probable Marketable Reserves Total Marketable Reserves Reserve
Life (years)
BHP Billiton Interest
%
Total Marketable Reserves Reserve Life
(years)Mt Mt Mt Mt %Ash %VM %S Mt %Ash %VM %S Mt %Ash %VM %S Mt %Ash %VM %S
Metallurgical Coal OperationsQueensland CoalCQCA JVGoonyella Riverside Broadmeadow (13)
OC Met 581 19 600 455 9.1 22.8 0.53 14 10.9 23.1 0.57 469 9.2 22.8 0.53 42 50 483 9.2 22.8 0.53 33UG Met 73 119 192 53 8.0 23.6 0.53 76 9.8 23.5 0.55 129 9.1 23.5 0.54 140 9.0 23.4 0.54
Peak Downs (4) OC Met 446 339 785 275 10.6 22.3 0.60 208 10.6 22.7 0.65 483 10.6 22.5 0.62 29 50 601 10.5 22.1 0.60 33Caval Ridge (4) OC Met 294 95 389 176 11.0 22.4 0.57 52 11.0 22.0 0.58 228 11.0 22.3 0.58 35 50 – – – – –Saraji OC Met 358 153 511 225 10.6 18.0 0.60 88 10.6 18.5 0.70 313 10.6 18.1 0.63 30 50 322 10.6 18.1 0.63 30Norwich Park (14) OC Met 154 76 230 112 10.3 16.9 0.70 54 10.3 16.9 0.70 166 10.3 16.9 0.70 66 50 166 10.3 16.9 0.70 66Blackwater (15) OC Met/Th 111 379 490 99 8.0 26.7 0.40 337 9.1 26.1 0.40 436 8.8 26.3 0.40 30 50 451 8.8 26.3 0.40 29Daunia OC Met 80 53 133 66 8.0 20.8 0.35 45 9.1 19.9 0.34 111 8.4 20.4 0.35 24 50 116 8.4 20.4 0.35 25Gregory JVGregory Crinum (16) OC Met 6.6 0.3 6.9 5.4 7.0 34.8 0.60 0.2 7.0 35.3 0.60 5.6 7.0 34.8 0.60 3.0 50 5.6 7.0 34.8 0.60 4.0
UG Met – – – – – – – – – – – – – – – 2.2 7.2 34.2 0.57BHP Billiton Mitsui CoalSouth Walker Creek (17) OC Met 106 31 137 84 9.2 13.3 0.29 24 9.2 12.9 0.29 108 9.2 13.2 0.29 17 80 77 9.2 12.7 0.32 14Poitrel (18) OC Met 46 26 72 36 9.0 23.2 0.32 20 8.7 23.0 0.32 56 8.9 23.1 0.32 15 80 67 9.0 23.7 0.31 20IndonesiaIndoMet Coal (6)
Haju OC Met 3.9 0.1 4.0 3.9 6.1 38.5 0.93 0.1 9.3 37.4 0.94 4.0 6.1 38.5 0.93 4.4 75 4.4 6.0 38.5 0.84 4.7OC Th 0.4 – 0.4 0.4 9.2 37.9 1.68 – – – – 0.4 9.2 37.9 1.68 0.3 6.2 38.3 0.79
(9) Only geophysically logged, fully analysed cored holes with greater than 95% recovery (except for Haju where the recovery was 85%) were used to classify the reserves. Drill hole spacings vary between seams and geological domains and were determined in conjunction with geostatistical analyses where applicable. Approximate drill hole spacings were: Deposit Proved Reserves Probable ReservesGoonyella Riverside Broadmeadow 900m to 1,300m plus 3D seismic coverage for UG 1,750m to 2,400m Peak Downs 950m 1,750mCaval Ridge 900m 1,800mSaraji 500m to 1,040m 900m to 2,100m Norwich Park 500m to 1,400m 1,000m to 2,800mBlackwater 500m 500m to 1,000m Daunia 650m 1,200m Gregory Crinum 850m plus 3D seismic coverage for UG 850m to 1,700m South Walker Creek 500m to 800m 1,000m to 1,500mPoitrel 300m to 950m 550m to 1,850m Haju < 500m 500m to 1,000m
(10) Product recoveries for the operations were:Deposit Product RecoveryGoonyella Riverside Broadmeadow 76%Peak Downs 61%Caval Ridge 58%Saraji 63%Norwich Park 71%Blackwater 88%Daunia 83%Gregory Crinum 81%South Walker Creek 79%Poitrel 77%Haju 100%
(11) Total Coal Reserves were at the moisture content when mined (4% CQCA JV, Gregory JV, BHP Billiton Mitsui Coal; 7% Haju). Total Marketable Coal Reserves were at a product specific moisture content (9.5–10% Goonyella Riverside Broadmeadow; 9.5% Peak Downs; 10% Caval Ridge; 10% Saraji; 7.5–11% Blackwater; 9.5–10% Daunia; 10–11% Norwich Park; 8.5% Gregory Crinum; 9% South Walker Creek; 9.5–12% Poitrel; 7% Haju) and at an air-dried quality basis, for sale after beneficiation of the Total Coal Reserves.
(12) Coal delivered to wash plant, except for Haju where coal is not washed.(13) Goonyella Riverside Broadmeadow – The increase in Reserve Life was due to a decrease in nominated production rate from 25Mt to 19Mt.(14) Norwich Park remains on care and maintenance.(15) Blackwater – The increase in Reserve Life was due to a decrease in nominated production rate from 17.7Mt to 16.6Mt.(16) Crinum UG Coal Reserves were depleted in FY2016 while Gregory OC mine remains on care and maintenance.(17) South Walker Creek – The Coal Reserves increased due to inclusion of new areas in the mine plan. Increased yield from 71% to 79% delivered increased Marketable
Coal Reserves.(18) Poitrel – The Coal Reserves decrease was a result of pending environmental and capital approvals.

BHP Billiton Annual Report 2016 261
Metallurgical CoalCoal Reserves
As at 30 June 2016 As at 30 June 2015
Commodity Deposit (2) (9) (10) (11) (12)
Mining Method
Coal Type
Proved Reserves
Probable Reserves
Total Reserves Proved Marketable Reserves Probable Marketable Reserves Total Marketable Reserves Reserve
Life (years)
BHP Billiton Interest
%
Total Marketable Reserves Reserve Life
(years)Mt Mt Mt Mt %Ash %VM %S Mt %Ash %VM %S Mt %Ash %VM %S Mt %Ash %VM %S
Metallurgical Coal OperationsQueensland CoalCQCA JVGoonyella Riverside Broadmeadow (13)
OC Met 581 19 600 455 9.1 22.8 0.53 14 10.9 23.1 0.57 469 9.2 22.8 0.53 42 50 483 9.2 22.8 0.53 33UG Met 73 119 192 53 8.0 23.6 0.53 76 9.8 23.5 0.55 129 9.1 23.5 0.54 140 9.0 23.4 0.54
Peak Downs (4) OC Met 446 339 785 275 10.6 22.3 0.60 208 10.6 22.7 0.65 483 10.6 22.5 0.62 29 50 601 10.5 22.1 0.60 33Caval Ridge (4) OC Met 294 95 389 176 11.0 22.4 0.57 52 11.0 22.0 0.58 228 11.0 22.3 0.58 35 50 – – – – –Saraji OC Met 358 153 511 225 10.6 18.0 0.60 88 10.6 18.5 0.70 313 10.6 18.1 0.63 30 50 322 10.6 18.1 0.63 30Norwich Park (14) OC Met 154 76 230 112 10.3 16.9 0.70 54 10.3 16.9 0.70 166 10.3 16.9 0.70 66 50 166 10.3 16.9 0.70 66Blackwater (15) OC Met/Th 111 379 490 99 8.0 26.7 0.40 337 9.1 26.1 0.40 436 8.8 26.3 0.40 30 50 451 8.8 26.3 0.40 29Daunia OC Met 80 53 133 66 8.0 20.8 0.35 45 9.1 19.9 0.34 111 8.4 20.4 0.35 24 50 116 8.4 20.4 0.35 25Gregory JVGregory Crinum (16) OC Met 6.6 0.3 6.9 5.4 7.0 34.8 0.60 0.2 7.0 35.3 0.60 5.6 7.0 34.8 0.60 3.0 50 5.6 7.0 34.8 0.60 4.0
UG Met – – – – – – – – – – – – – – – 2.2 7.2 34.2 0.57BHP Billiton Mitsui CoalSouth Walker Creek (17) OC Met 106 31 137 84 9.2 13.3 0.29 24 9.2 12.9 0.29 108 9.2 13.2 0.29 17 80 77 9.2 12.7 0.32 14Poitrel (18) OC Met 46 26 72 36 9.0 23.2 0.32 20 8.7 23.0 0.32 56 8.9 23.1 0.32 15 80 67 9.0 23.7 0.31 20IndonesiaIndoMet Coal (6)
Haju OC Met 3.9 0.1 4.0 3.9 6.1 38.5 0.93 0.1 9.3 37.4 0.94 4.0 6.1 38.5 0.93 4.4 75 4.4 6.0 38.5 0.84 4.7OC Th 0.4 – 0.4 0.4 9.2 37.9 1.68 – – – – 0.4 9.2 37.9 1.68 0.3 6.2 38.3 0.79
5 Financial Statements
7 Shareholder inform
ation6
Additional inform
ation
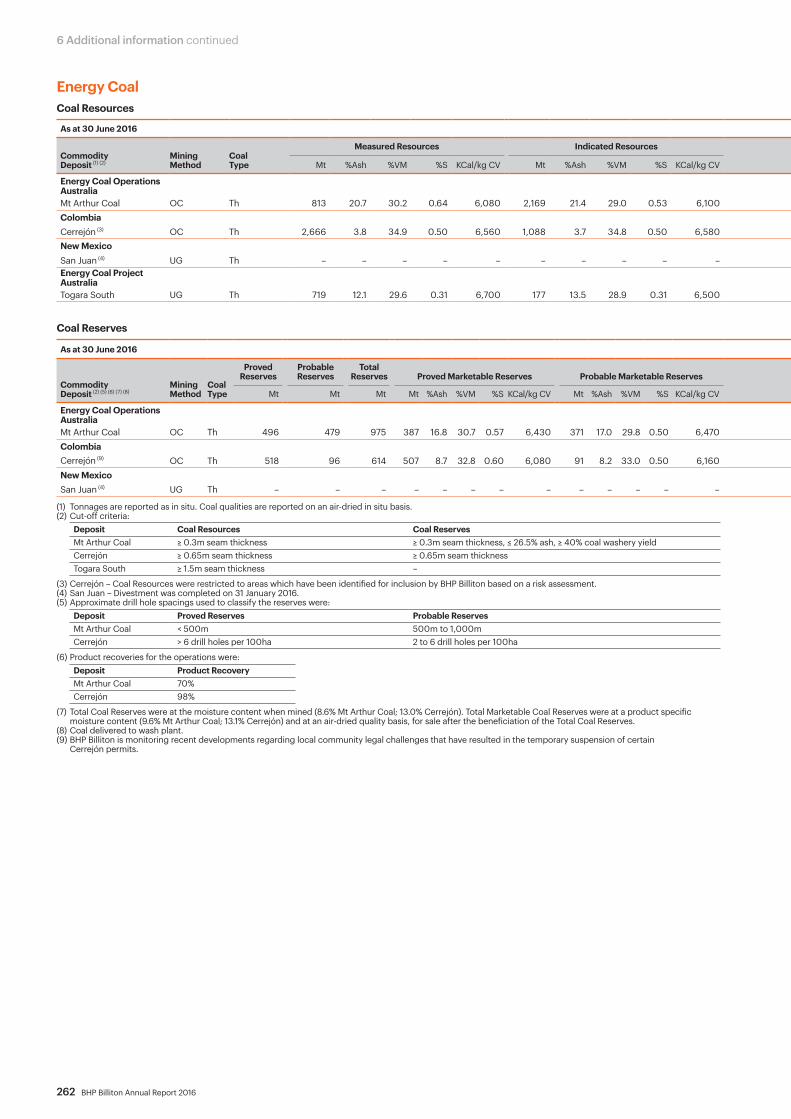
262 BHP Billiton Annual Report 2016
6 Additional information continued
Energy CoalCoal Resources
As at 30 June 2016 As at 30 June 2015
Commodity Deposit (1) (2)
Mining Method
Coal Type
Measured Resources Indicated Resources Inferred Resources Total Resources BHP Billiton Interest
%
Total Resources
Mt %Ash %VM %S KCal/kg CV Mt %Ash %VM %S KCal/kg CV Mt %Ash %VM %S KCal/kg CV Mt %Ash %VM %S KCal/kg CV Mt %Ash %VM %S KCal/kg CV
Energy Coal Operations AustraliaMt Arthur Coal OC Th 813 20.7 30.2 0.64 6,080 2,169 21.4 29.0 0.53 6,100 670 23.4 28.0 0.83 5,950 3,652 21.6 29.1 0.61 6,070 100 3,676 21.7 29.1 0.61 6,060Colombia Cerrejón (3) OC Th 2,666 3.8 34.9 0.50 6,560 1,088 3.7 34.8 0.50 6,580 778 4.1 34.5 0.60 6,560 4,532 3.9 34.8 0.52 6,570 33.33 4,439 3.7 34.8 0.50 6,550New Mexico San Juan (4) UG Th – – – – – – – – – – – – – – – – – – – – – 127 19.1 – 0.82 5,670Energy Coal Project AustraliaTogara South UG Th 719 12.1 29.6 0.31 6,700 177 13.5 28.9 0.31 6,500 1,051 16.8 28.4 0.31 6,210 1,947 14.7 28.9 0.31 6,420 100 1,947 14.7 28.9 0.31 6,420
Coal Reserves
As at 30 June 2016 As at 30 June 2015
Commodity Deposit (2) (5) (6) (7) (8)
Mining Method
Coal Type
Proved Reserves
Probable Reserves
Total Reserves Proved Marketable Reserves Probable Marketable Reserves Total Marketable Reserves Reserve
Life (years)
BHP Billiton Interest
%
Total Marketable Reserves Reserve Life
(years)Mt Mt Mt Mt %Ash %VM %S KCal/kg CV Mt %Ash %VM %S KCal/kg CV Mt %Ash %VM %S KCal/kg CV Mt %Ash %VM %S KCal/kg CV
Energy Coal Operations AustraliaMt Arthur Coal OC Th 496 479 975 387 16.8 30.7 0.57 6,430 371 17.0 29.8 0.50 6,470 758 16.9 30.3 0.54 6,450 30 100 785 17.4 30.1 0.53 6,400 31ColombiaCerrejón (9) OC Th 518 96 614 507 8.7 32.8 0.60 6,080 91 8.2 33.0 0.50 6,160 599 8.7 32.8 0.58 6,090 16 33.33 633 9.0 32.8 0.60 6,070 17New Mexico San Juan (4) UG Th – – – – – – – – – – – – – – – – – – – – 15 17.2 – 0.99 5,640 2.5
(1) Tonnages are reported as in situ. Coal qualities are reported on an air-dried in situ basis.(2) Cut-off criteria:
Deposit Coal Resources Coal ReservesMt Arthur Coal ≥ 0.3m seam thickness ≥ 0.3m seam thickness, ≤ 26.5% ash, ≥ 40% coal washery yieldCerrejón ≥ 0.65m seam thickness ≥ 0.65m seam thicknessTogara South ≥ 1.5m seam thickness –
(3) Cerrejón – Coal Resources were restricted to areas which have been identified for inclusion by BHP Billiton based on a risk assessment.(4) San Juan – Divestment was completed on 31 January 2016. (5) Approximate drill hole spacings used to classify the reserves were:
Deposit Proved Reserves Probable ReservesMt Arthur Coal < 500m 500m to 1,000mCerrejón > 6 drill holes per 100ha 2 to 6 drill holes per 100ha
(6) Product recoveries for the operations were:Deposit Product RecoveryMt Arthur Coal 70%Cerrejón 98%
(7) Total Coal Reserves were at the moisture content when mined (8.6% Mt Arthur Coal; 13.0% Cerrejón). Total Marketable Coal Reserves were at a product specific moisture content (9.6% Mt Arthur Coal; 13.1% Cerrejón) and at an air-dried quality basis, for sale after the beneficiation of the Total Coal Reserves.
(8) Coal delivered to wash plant.(9) BHP Billiton is monitoring recent developments regarding local community legal challenges that have resulted in the temporary suspension of certain
Cerrejón permits.

BHP Billiton Annual Report 2016 263
Energy CoalCoal Resources
As at 30 June 2016 As at 30 June 2015
Commodity Deposit (1) (2)
Mining Method
Coal Type
Measured Resources Indicated Resources Inferred Resources Total Resources BHP Billiton Interest
%
Total Resources
Mt %Ash %VM %S KCal/kg CV Mt %Ash %VM %S KCal/kg CV Mt %Ash %VM %S KCal/kg CV Mt %Ash %VM %S KCal/kg CV Mt %Ash %VM %S KCal/kg CV
Energy Coal Operations AustraliaMt Arthur Coal OC Th 813 20.7 30.2 0.64 6,080 2,169 21.4 29.0 0.53 6,100 670 23.4 28.0 0.83 5,950 3,652 21.6 29.1 0.61 6,070 100 3,676 21.7 29.1 0.61 6,060Colombia Cerrejón (3) OC Th 2,666 3.8 34.9 0.50 6,560 1,088 3.7 34.8 0.50 6,580 778 4.1 34.5 0.60 6,560 4,532 3.9 34.8 0.52 6,570 33.33 4,439 3.7 34.8 0.50 6,550New Mexico San Juan (4) UG Th – – – – – – – – – – – – – – – – – – – – – 127 19.1 – 0.82 5,670Energy Coal Project AustraliaTogara South UG Th 719 12.1 29.6 0.31 6,700 177 13.5 28.9 0.31 6,500 1,051 16.8 28.4 0.31 6,210 1,947 14.7 28.9 0.31 6,420 100 1,947 14.7 28.9 0.31 6,420
Coal Reserves
As at 30 June 2016 As at 30 June 2015
Commodity Deposit (2) (5) (6) (7) (8)
Mining Method
Coal Type
Proved Reserves
Probable Reserves
Total Reserves Proved Marketable Reserves Probable Marketable Reserves Total Marketable Reserves Reserve
Life (years)
BHP Billiton Interest
%
Total Marketable Reserves Reserve Life
(years)Mt Mt Mt Mt %Ash %VM %S KCal/kg CV Mt %Ash %VM %S KCal/kg CV Mt %Ash %VM %S KCal/kg CV Mt %Ash %VM %S KCal/kg CV
Energy Coal Operations AustraliaMt Arthur Coal OC Th 496 479 975 387 16.8 30.7 0.57 6,430 371 17.0 29.8 0.50 6,470 758 16.9 30.3 0.54 6,450 30 100 785 17.4 30.1 0.53 6,400 31ColombiaCerrejón (9) OC Th 518 96 614 507 8.7 32.8 0.60 6,080 91 8.2 33.0 0.50 6,160 599 8.7 32.8 0.58 6,090 16 33.33 633 9.0 32.8 0.60 6,070 17New Mexico San Juan (4) UG Th – – – – – – – – – – – – – – – – – – – – 15 17.2 – 0.99 5,640 2.5
5 Financial Statements
7 Shareholder inform
ation6
Additional inform
ation

264 BHP Billiton Annual Report 2016
6 Additional information continued
Other assetsMineral Resources
As at 30 June 2016 As at 30 June 2015
Commodity Deposit (1) (2) (3) (4)
Ore Type
Measured Resources Indicated Resources Inferred Resources Total Resources
BHP Billiton Interest
%
Total Resources
Mt %K 2
O
%In
sol.
%M
gO
Mt %K 2
O
%In
sol.
%M
gO
Mt %K 2
O
%In
sol.
%M
gO
Mt %K 2
O
%In
sol.
%M
gO
Mt %K 2
O
%In
sol.
%M
gO
Potash ProjectJansen LPL 5,320 25.6 7.9 0.18 – – – – 1,270 25.6 7.9 0.18 6,590 25.6 7.9 0.18 100 6,590 25.6 7.9 0.18
(1) The Mineral Resources are stated for the Lower Patience Lake (LPL) potash unit. A stratigraphic cut-off based on the 406 and 402 clay seams was applied.(2) 25.6%K2O grade is equivalent to 40.5%KCl content using the mineralogical conversion factor of 1.583.(3) %MgO is used as a measure of carnallite (KCl.MgCl2.6H2O) content where per cent carnallite equivalent = %MgO x 6.8918.(4) The small portion of Inferred Resources have been assigned grades extrapolated from Measured Resources.
Mineral Resources
As at 30 June 2016 As at 30 June 2015
Commodity Deposit (1) Ore Type
Measured Resources
Indicated Resources
Inferred Resources Total Resources BHP Billiton
Interest %
Total Resources
Mt %Ni Mt %Ni Mt %Ni Mt %Ni Mt %Ni
Nickel West OperationsLeinster OC 3.5 1.4 1.7 1.3 1.6 1.4 6.8 1.4 100 6.9 1.3
Disseminated Sulphide – – 67 0.51 105 0.52 172 0.52 172 0.5UG 13 2.1 4.6 2.9 5.2 2.1 23 2.3 20 2.1SP 0.15 1.1 1.4 1.0 – – 1.6 1.0 1.4 1.0SP Oxidised – – – – 1.9 1.7 1.9 1.7 1.9 1.7
Mt Keith Disseminated Sulphide 153 0.55 106 0.48 35 0.48 294 0.52 100 310 0.5SP 7.2 0.47 – – – – 7.2 0.47 6.7 0.5
Cliffs (2) Disseminated Sulphide – – 4.5 1.0 0.86 1.0 5.4 1.0 100 3.8 1.0Massive Sulphide 0.84 3.9 1.4 4.0 0.48 4.0 2.7 4.0 2.7 3.9
Nickel West ProjectsYakabindie Disseminated Sulphide 156 0.59 113 0.62 171 0.61 440 0.61 100 440 0.6Jericho Disseminated Sulphide – – – – 28 0.58 28 0.58 50 28 0.6Venus Disseminated Sulphide – – 0.47 2.4 5.4 1.7 5.9 1.8 100 5.9 1.8
Massive Sulphide – – – – 1.5 5.8 1.5 5.8 1.5 5.8
Ore Reserves
As at 30 June 2016 As at 30 June 2015
Commodity Deposit (1) (3) (4) (5) Ore Type
Proved Reserves
Probable Reserves Total Reserves Reserve
Life (years)
BHP Billiton Interest
%
Total Reserves Reserve Life
(years)Mt %Ni Mt %Ni Mt %Ni Mt %Ni
Nickel West OperationsLeinster (6) OC 2.5 1.2 0.21 0.90 2.7 1.2 2.2 100 3.0 1.3 2.0
SP 0.15 1.1 – – 0.15 1.1 – – Mt Keith OC 36 0.61 2.1 0.60 38 0.61 4.2 100 47 0.6 5.0
SP 3.6 0.48 3.7 0.45 7.2 0.47 6.7 0.5Cliffs UG – – 1.0 2.3 1.0 2.3 2.0 100 1.5 2.2 3.0
(1) Cut-off grades: Deposit Ore Type Mineral Resources Ore ReservesLeinster OC
Disseminated SulphideUGSP, SP Oxidised
≥ 0.60%Ni≥ 0.40%Ni
≥ 1.0%Ni≥ 0.70%Ni
≥ 0.60%Ni–
––
Mt Keith Disseminated Sulphide, OC, SP
Variable between 0.35%Ni and 0.40%Ni
Variable between 0.35%Ni and 0.40%Ni and ≥ 0.18% recoverable Ni
Cliffs Disseminated SulphideMassive SulphideUG
≥ 0.40%Ni Stratigraphic–
– –≥ 1.1%Ni
Yakabindie Disseminated Sulphide
≥ 0.40%Ni –
Jericho Disseminated Sulphide
≥ 0.40%Ni –
Venus Disseminated SulphideMassive Sulphide
≥ 0.40%Ni Stratigraphic
– –
(2) Cliffs – The increase in Mineral Resources was due to additional drilling and remodelling.
(3) Approximate drill hole spacings used to classify the reserves were:Deposit Proved Reserves Probable ReservesLeinster 25m x 25m 25m x 50mMt Keith 60m x 40m 80m x 80mCliffs 25m x 25m (and development) 50m x 50m
(4) Ore delivered to process plant.(5) Metallurgical recoveries for the operations were:
Deposit Metallurgical RecoveryLeinster 82%Mt Keith 64%Cliffs 88% at 8% concentrate grade
(6) Leinster – Increase in Reserve Life due to blending optimisation for Leinster concentrator.
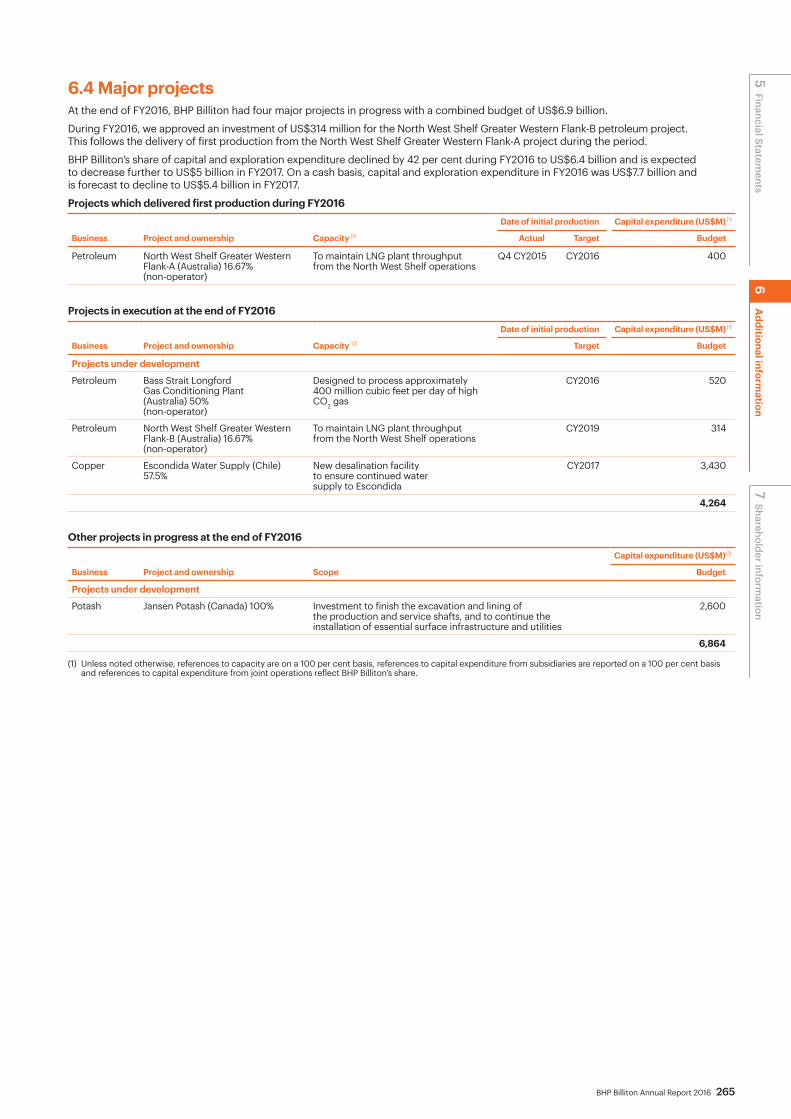
BHP Billiton Annual Report 2016 265
6.4 Major projectsAt the end of FY2016, BHP Billiton had four major projects in progress with a combined budget of US$6.9 billion.
During FY2016, we approved an investment of US$314 million for the North West Shelf Greater Western Flank-B petroleum project. This follows the delivery of first production from the North West Shelf Greater Western Flank-A project during the period.
BHP Billiton’s share of capital and exploration expenditure declined by 42 per cent during FY2016 to US$6.4 billion and is expected to decrease further to US$5 billion in FY2017. On a cash basis, capital and exploration expenditure in FY2016 was US$7.7 billion and is forecast to decline to US$5.4 billion in FY2017.
Projects which delivered first production during FY2016Date of initial production Capital expenditure (US$M) (1)
Business Project and ownership Capacity (1) Actual Target Budget
Petroleum North West Shelf Greater Western Flank-A (Australia) 16.67%(non-operator)
To maintain LNG plant throughput from the North West Shelf operations
Q4 CY2015 CY2016 400
Projects in execution at the end of FY2016Date of initial production Capital expenditure (US$M) (1)
Business Project and ownership Capacity -(1) Target Budget
Projects under development
Petroleum Bass Strait Longford Gas Conditioning Plant (Australia) 50%(non-operator)
Designed to process approximately 400 million cubic feet per day of high CO2
gas
CY2016 520
Petroleum North West Shelf Greater Western Flank-B (Australia) 16.67% (non-operator)
To maintain LNG plant throughput from the North West Shelf operations
CY2019 314
Copper Escondida Water Supply (Chile) 57.5%
New desalination facility to ensure continued water supply to Escondida
CY2017 3,430
4,264
Other projects in progress at the end of FY2016Capital expenditure (US$M) (1)
Business Project and ownership Scope Budget
Projects under development
Potash Jansen Potash (Canada) 100% Investment to finish the excavation and lining of the production and service shafts, and to continue the installation of essential surface infrastructure and utilities
2,600
6,864
(1) Unless noted otherwise, references to capacity are on a 100 per cent basis, references to capital expenditure from subsidiaries are reported on a 100 per cent basis and references to capital expenditure from joint operations reflect BHP Billiton’s share.
6A
dditional information
5 Financial Statements
7 Shareholder inform
ation
266 BHP Billiton Annual Report 2016
6 Additional information continued
6.5 Legal proceedingsWe are involved from time to time in legal proceedings and governmental investigations of a character normally incidental to our business, including claims and pending actions against us seeking damages or clarification of legal rights and regulatory inquiries regarding business practices. In many cases, insurance or other indemnification protection afforded to us relates to such claims and may offset the financial impact on the Group of a successful claim.
This section summarises the significant legal proceedings and investigations and associated matters in which we are currently involved or have finalised since the last Annual Report.
Legal proceedings relating to the failure of the Fundão tailings dam at the iron ore operations of Samarco in Minas Gerais and Espírito Santo (Samarco dam failure)BHP Billiton Brasil is engaged in numerous legal proceedings relating to the Samarco dam failure. All of these proceedings are in early stages and it is not possible at this time to provide a range of possible outcomes or a reliable estimate of potential future exposures for BHP Billiton Brasil. The most significant of these proceedings are summarised below. As described below, many of these proceedings involve claims for compensation for the similar or possibly the same damages. There are numerous additional lawsuits against Samarco relating to the Samarco dam failure in which BHP Billiton Brasil is not a party.
Public civil claim commenced by the Federal Government of Brazil, states of Espírito Santo and Minas Gerais and other authorities On 30 November 2015, the Federal Government of Brazil, states of Espírito Santo and Minas Gerais and other public authorities collectively filed a public civil claim against Samarco and its shareholders, BHP Billiton Brasil and Vale, seeking the establishment of a fund of up to R$20 billion (approximately US$6.2 billion) in aggregate for clean-up costs and damages.
The plaintiffs also requested certain interim injunctions in connection with the public civil claim. On 18 December 2015, the Federal Court granted the injunctions and, among other things, ordered Samarco to deposit R$2 billion (approximately US$620 million) in to a court-managed bank account for use towards community and environmental rehabilitation. Samarco, Vale and BHP Billiton Brasil immediately appealed against the injunction. On 17 August 2016, the Federal Court of Appeals in Brasilia dismissed the appeal.
On 2 March 2016, the plaintiffs (Federal Government of Brazil, states of Espírito Santo and Minas Gerais and other authorities) and Samarco, Vale and BHP Billiton Brasil entered into an agreement for the restoration of the environment and communities affected by the dam failure (Framework Agreement). The Framework Agreement outlines a comprehensive set of actions, measures and programs, including 17 environmental and 22 socio-economic programs to restore and compensate the communities and environment affected by the dam failure. A private foundation named Fundação Renova, incorporated by BHP Billiton Brasil, Vale and Samarco will manage and implement all projects and measures within the scope of programs.
The Framework Agreement has a term of 15 years, renewable for periods of one year successively until all the obligations under the Framework Agreement have been performed.
Under the Framework Agreement, Samarco is responsible for funding the Fundação Renova with calendar year contributions as follows:• R$2 billion (approximately US$620 million) in 2016, less the
amount of funds already spent on, or allocated to, remediation; • R$1.2 billion (approximately US$370 million) in 2017; • R$1.2 billion (approximately US$370 million) in 2018; • R$500 million (approximately US$156 million) for a special
project to be spent on sewage treatment and landfill works from 2016 to 2018.
Annual contributions for each of the years 2019, 2020 and 2021 will be in the range of R$800 million (approximately US$250 million) and R$1.6 billion (approximately US$500 million), depending on the remediation and compensation projects which are to be undertaken in the particular year. Annual contributions may be reviewed under the Framework Agreement.
To the extent that Samarco does not meet its funding obligations under the Framework Agreement, each of Vale and BHP Billiton Brasil has potential funding obligations under the Framework Agreement in proportion to its 50 per cent shareholding in Samarco.
As a formal suspension of the public civil claim, the Framework Agreement is subject to Court ratification. On 5 May 2016, the Framework Agreement was ratified by the Conciliation Chamber of the Federal Court of Appeals in Brasilia suspending this public civil claim. The Federal Prosecutor’s Office appealed the ratification of the Framework Agreement and on 30 June 2016, the Superior Court of Justice in Brazil issued a preliminary order (Interim Order) suspending the 5 May 2016 ratification decision of the Federal Court of Appeals, and reinstating this public civil claim before the first instance court, including the R$2 billion injunction. Samarco, Vale and BHP Billiton Brasil and the Federal Government appealed the Interim Order.
Public civil claim commenced by the Federal Public Prosecution Service On 3 May 2016, the Federal Public Prosecution Service filed a public civil claim against Samarco, Vale and BHP Billiton Brasil – as well as 18 other public entities – seeking R$155 billion (approximately US$48 billion) for reparation, compensation and collective moral damages in relation to the Samarco dam failure.
In addition, the claim includes a number of preliminary injunction requests, seeking orders that Samarco, Vale and BHP Billiton Brasil deposit R$7.7 billion (approximately US$2.4 billion) in a special company account and provide guarantees equivalent to R$155 billion (approximately US$48 billion). The injunctions also seek to prohibit Samarco, Vale and BHP Billiton Brasil from distributing dividends and selling certain assets (among other things).
BHP Billiton Brasil has filed two petitions to the 12th Federal Court of Belo Horizonte requesting the dismissal of the injunction requests made by the Federal Public Prosecution Service. On 7 July 2016, a first decision was made by the Court which, among other issues, ordered Samarco to present, within 30 days, its plan and measures regarding tailings containment, and scheduled a hearing for conciliation for 13 September 2016.
Public civil claims commenced by the State Prosecutors’ Office in the state of Minas Gerais On 10 December 2015, the State Prosecutors’ Office in the state of Minas Gerais filed a public civil claim against Samarco, Vale and BHP Billiton Brasil before the State Court in Mariana claiming indemnification (amount not specified) for moral and material damages to an unspecified group of individuals affected by the Samarco dam failure, including the payment of costs for housing and social and economic assistance.
The State Prosecutors’ Office also requested certain interim injunctions in connection with this claim, including orders for Samarco, Vale and BHP Billiton Brasil to provide housing, health care, financial assistance and education facilities to the people affected by the Samarco dam failure. The plaintiff also sought an order to freeze R$300 million (approximately US$94 million) in Samarco’s bank accounts. The Court granted the injunction freezing R$300 million in Samarco’s bank accounts for use towards the compensation and remediation measures requested under this public civil claim.
BHP Billiton Annual Report 2016 267
At a Court hearing on 23 December 2015, the parties agreed that Samarco should unilaterally provide:• flexible housing solutions for 271 displaced families; • monthly salaries to the displaced families for at least 12 months; • a R$20,000 (approximately US$6,000) payment to each
displaced family; • a R$100,000 (approximately US$30,000) payment to each
of the families of those deceased, as advance compensation.
On 2 February 2016, the State Prosecutors’ Office in the state of Minas Gerais filed another public civil claim against Samarco, Vale and BHP Billiton Brasil before the State Court in Ponte Nova claiming compensation of R$7.5 billion (approximately US$2.2 billion) for moral and material damages suffered by 1,350 individuals in Ponte Nova and collective moral damages allegedly suffered by the community in Ponte Nova. The claim also sought a number of preliminary injunctions, including orders to:• freeze R$1 billion (approximately US$310 million) of cash in the
defendants’ bank accounts in order to secure the compensation requested under the public civil claim;
• require the defendants to pay minimum wages and basic food supplies to the families in Ponte Nova affected by the Samarco dam failure;
• require the defendants to pay R$30,000 (approximately US$9,000) per affected family and compensation to provide dignified and adequate housing for the affected families.
On 5 February 2016, the Court granted an injunction to freeze R$475 million from bank accounts of Samarco, Vale and BHP Billiton Brasil and ordered them to pay preliminary amounts to families in Ponte Nova affected by the Samarco dam failure.
Public civil claims commenced by the Public Defender Department in Minas GeraisOn 25 April 2016, the Public Defender Department filed a public civil claim against Samarco, Vale and BHP Billiton Brasil in the State Court in Belo Horizonte, Minas Gerais, Brazil claiming R$10 billion (approximately US$3.1 billion) for collective moral damages to be deposited in the State Human Rights Defense Fund. The Public Defender Department is also seeking a number of social and environmental remediation measures in relation to the Samarco dam failure, including orders requiring the reparation of the environmental damage and the reconstruction of properties and populations, including historical, religious, cultural, social, environmental and immaterial heritages affected by the dam failure.
Public civil claims commenced by the State Prosecutors’ Office in the state of Espírito Santo On 15 January 2016, the State Prosecutors’ Office of Espírito Santo filed a public civil claim before the State Court in Espírito Santo against Samarco, Vale and BHP Billiton Brasil seeking compensation for collective moral damages in relation to the suspension of the water supply of the Municipality of Colatina as a result of the Samarco dam failure. As part of the public civil claim, the State Prosecutors’ Office sought a number of injunctions, including an order to freeze R$2 billion (approximately US$620 million) in the defendants’ bank accounts in order to secure the requested compensation. On 11 February 2016, the judge denied all of the injunction requests made by the State Prosecutors’ Office. The State Prosecutors’ Office appealed the decision and in a decision dated 2 August 2016, the State Court of Appeal remitted the lawsuit to the 12th Federal Court in Belo Horizonte, Minas Gerais.
Public civil claim commenced by the state of Espírito Santo On 8 January 2016, the state of Espírito Santo filed a public civil claim against Samarco, Vale and BHP Billiton Brasil before the State Court in Colatina (later remitted to the Federal Court in Belo Horizonte) seeking the remediation and restoration of the water supply of the residents of Baixo Guandu, Linhares, Colatina and Marilândia. In addition, the claim sought injunctions ordering, among other things, the execution of several works and improvements in public equipment in order to repair and upgrade the sewage system and water network in Colatina and Linhares, and an order to freeze R$1 billion (approximately US$310 million) of the defendants’ assets. On 4 February 2016, the Court ordered Samarco to deposit approximately R$7 million in a fund of the state of Espírito Santo to be created and granted certain injunctions relating to remediation measures; however, it denied the injunction to freeze R$1 billion (approximately US$310 million) of the defendants’ assets. Samarco appealed the decision and the Court of Appeal suspended the lawsuit until the appeal is reviewed.
Public civil claim commenced by the Association for the Defense of Collective Interests – ADIC On 17 November 2015, ADIC, a NGO in Brazil, filed a public civil claim against Samarco before the 12th Federal Court in Belo Horizonte claiming at least R$10 billion (approximately US$2.85 billion) for environmental and social damages in relation to the Samarco dam failure, in addition to collective moral damages and reparation measures. The NGO also requested preliminary injunctions ordering the deposit of R$1 billion (approximately US$284 million) and prohibiting Samarco from distributing dividends to its shareholders. On 18 November 2015, the Court denied the NGO’s application for preliminary injunctions.
Other proceedingsAs noted above, BHP Billiton Brasil has been named as a defendant in numerous other lawsuits that are at early stages of proceedings. The lawsuits seek various remedies, including rehabilitation costs, compensation to injured individuals and families of the deceased, recovery of personal and property losses and injunctive relief. In addition, government inquiries and investigations relating to the Samarco dam failure have been commenced by numerous agencies of the Brazilian Government, including criminal investigations by the federal and state police, and by federal prosecutors.
Our potential liabilities, if any, resulting from other pending and future claims, lawsuits and enforcement actions relating to the Samarco dam failure, together with the potential cost of implementing remedies sought in the various proceedings, cannot be reliably estimated at this time and therefore a provision has not been recognised and nor has any contingent liability been quantified for these matters. Ultimately these could have a material adverse impact on BHP Billiton’s business, competitive position, cash flows, prospects, liquidity and shareholder returns.
Samarco has been named as a defendant in more than 23,000 small claims, in which individual damages claimed range from R$1,000 to R$10,000 (approximately US$300 to US$3,000). Such damages have generally been awarded to people that had their water service interrupted for between five and seven days. Given the number of people affected by the Samarco dam failure, the number of potential claimants may continue to increase. BHP Billiton Brasil is a defendant in approximately 5,000 of these cases.
For more information on the Samarco dam failure, refer to section 1.4.
6A
dditional information
5 Financial Statements
7 Shareholder inform
ation
268 BHP Billiton Annual Report 2016
6 Additional information continued
US class actionIn February 2016, a putative class action complaint (Complaint) was filed in the US District Court for the Southern District of New York on behalf of purchasers of American Depositary Receipts of BHP Billiton Limited and BHP Billiton Plc between 25 September 2014 and 30 November 2015 against BHP Billiton Ltd and Plc and certain of its current and former executive officers and Directors. The Complaint asserts claims under US federal securities laws and indicates that the plaintiff will seek certification to proceed as a class action.
The amount of damages sought by the plaintiff on behalf of the putative class is unspecified. Given the preliminary status of this matter, it is not possible at this time to provide a range of possible outcomes or a reliable estimate of potential future exposures to BHP Billiton.
Tax and royalty mattersThe Group presently has unresolved tax and royalty matters for which the timing of resolution and potential economic outflow are uncertain. For details of those matters, refer to note 5 ‘Income tax expense’ to the Financial Statements.
Anti-corruption investigationsIn May 2015, the Group announced the resolution of the previously disclosed investigation by the SEC into potential breaches of the US Foreign Corrupt Practices Act. The US Department of Justice has also completed its investigation into BHP Billiton without taking any action.
The matter was resolved with the SEC pursuant to an administrative order, which imposed a US$25 million civil penalty. Under the SEC order, BHP Billiton was also required to self-report on its compliance program to the SEC for a period of 12 months following the date of the SEC order (20 May 2015). This obligation has now been satisfied.
As previously disclosed, the Australian Federal Police (AFP) announced an investigation in 2013 which relates to Division 70 of the Commonwealth Criminal Code. The investigation is ongoing and the Group continues to co-operate. In light of the continuing nature of the AFP investigation, it is not appropriate at this stage for BHP Billiton to predict outcomes.
6.6 Glossary6.6.1 Mining, oil and gas-related terms2DTwo dimensional.
3DThree dimensional.
AusIMMThe Australasian Institute of Mining and Metallurgy.
BeneficiationThe process of physically separating ore from gangue (waste material) prior to subsequent processing of the beneficiated ore.
BrownfieldAn exploration or development project located within an existing mineral province, which can share infrastructure and management with an existing operation.
ButaneA component of natural gas that occurs in two isomeric forms. Where sold separately, is largely butane gas that has been liquefied through pressurisation. One tonne of butane is approximately equivalent to 14 thousand cubic feet of gas.
Coal ReservesThe same meaning as Ore Reserves, but specifically concerning coal.
Coal ResourcesThe same meaning as Mineral Resources, but specifically concerning coal.
Coking coalUsed in the manufacture of coke, which is used in the steelmaking process by virtue of its carbonisation properties. Coking coal may also be referred to as metallurgical coal.
Competent PersonA minerals industry professional who is a Member or Fellow of The Australasian Institute of Mining and Metallurgy, or of the Australian Institute of Geoscientists, or of a ‘Recognised Professional Organisation’ (RPO), as included in a list available on the JORC and ASX websites. These organisations have enforceable disciplinary processes, including the powers to suspend or expel a member. A Competent Person must have a minimum of five years’ relevant experience in the style of mineralisation or type of deposit under consideration and in the activity that the person is undertaking (JORC Code, 2012).
CondensateA mixture of hydrocarbons that exist in gaseous form in natural underground reservoirs, but which condense to form a liquid at atmospheric conditions.
Conventional Petroleum ResourcesHydrocarbon accumulations that can be produced by a well drilled into a geologic formation in which the reservoir and fluid characteristics permit the hydrocarbons to readily flow to the wellbore without the use of specialised extraction technologies.
Copper cathodeElectrolytically refined copper that has been deposited on the cathode of an electrolytic bath of acidified copper sulphate solution. The refined copper may also be produced through leaching and electrowinning.

BHP Billiton Annual Report 2016 269
6.6.1 Mining, oil and gas-related terms continuedCrude oilA mixture of hydrocarbons that exist in liquid form in natural underground reservoirs, and remain liquid at atmospheric pressure after being produced at the well head and passing through surface separating facilities.
Cut-off gradeA nominated grade above which is defined an Ore Reserve or Mineral Resource. For example, the lowest grade of mineralised material that qualifies as economic for estimating an Ore Reserve.
Dated BrentA benchmark price assessment of the spot market value of physical cargoes of North Sea light sweet crude oil.
Electrowinning/electrowonAn electrochemical process in which metal is recovered by dissolving a metal within an electrolyte and plating it onto an electrode.
Energy coalUsed as a fuel source in electrical power generation, cement manufacture and various industrial applications. Energy coal may also be referred to as steaming or thermal coal.
EthaneA component of natural gas. Where sold separately, is largely ethane gas that has been liquefied through pressurisation. One tonne of ethane is approximately equivalent to 28 thousand cubic feet of gas.
FAusIMMFellow of the Australasian Institute of Mining and Metallurgy.
FieldAn area consisting of a single reservoir or multiple reservoirs all grouped on or related to the same individual geological structural feature and/or stratigraphic condition. There may be two or more reservoirs in a field that are separated vertically by intervening impervious strata, or laterally by local geologic barriers, or by both. Reservoirs that are associated by being in overlapping or adjacent fields may be treated as a single or common operational field. The geological terms ‘structural feature’ and ‘stratigraphic condition’ are intended to identify localised geological features as opposed to the broader terms of basins, trends, provinces, plays, areas-of-interest, etc. (per SEC Regulation S-X, Rule 4-10).
FlotationA method of selectively recovering minerals from finely ground ore using a froth created in water by specific reagents. In the flotation process, certain mineral particles are induced to float by becoming attached to bubbles of froth and the unwanted mineral particles sink.
FPSO (Floating, production, storage and off-take)A floating vessel used by the offshore oil and gas industry for the processing of hydrocarbons and for storage of oil. An FPSO vessel is designed to receive hydrocarbons produced from nearby platforms or subsea templates, process them and store oil until it can be offloaded onto a tanker.
Grade or QualityAny physical or chemical measurement of the characteristics of the material of interest in samples or product.
GreenfieldThe development or exploration located outside the area of influence of existing mine operations/infrastructure.
GSSAGeological Society of South Africa.
Heap leach(ing)A process used for the recovery of metals such as copper, nickel, uranium and gold from low-grade ores. The crushed material is laid on a slightly sloping, impermeable pad and leached by uniformly trickling (gravity fed) a chemical solution through the beds to ponds. The metals are recovered from the solution.
Hypogene SulphideHypogene mineralisation is formed by fluids at high temperature and pressure derived from magmatic activity. Hypogene sulphide consists predominantly of chalcopyrite and is not amenable to leaching technology.
Indicated Mineral ResourcesThat part of a Mineral Resource for which quantity, grade (or quality), densities, shape and physical characteristics are estimated with sufficient confidence to allow the application of Modifying Factors in sufficient detail to support mine planning and evaluation of the economic viability of the deposit.
Inferred Mineral ResourcesThat part of a Mineral Resource for which quantity and grade (or quality) are estimated on the basis of limited geological evidence and sampling. Geological evidence is sufficient to imply but not verify geological and grade (or quality) continuity.
International Centre for Settlement of Investment Disputes (ICSID)ICSID is an autonomous international institution that provides facilities and services to support conciliation and arbitration of international investment disputes between investors and States. ICSID was established under the Convention on the Settlement of Investment Disputes between States and Nationals of Other States (the ICSID Convention), with over 140 member States.
Joint Ore Reserves Committee (JORC) CodeA set of minimum standards, recommendations and guidelines for public reporting in Australasia of Exploration Results, Mineral Resources and Ore Reserves. The guidelines are defined by the Australasian Joint Ore Reserves Committee (JORC), which is sponsored by the Australian mining industry and its professional organisations.
KrigingA geostatistical method of estimating resources based on a mathematical function known as a semivariogram.
LeachingThe process by which a soluble metal can be economically recovered from minerals in ore by dissolution.
LNG (Liquefied natural gas)Consists largely of methane that has been liquefied through chilling and pressurisation. One tonne of LNG is approximately equivalent to 46 thousand cubic feet of natural gas.
6A
dditional information
5 Financial Statements
7 Shareholder inform
ation

270 BHP Billiton Annual Report 2016
6 Additional information continued
6.6.1 Mining, oil and gas-related terms continuedLOI (loss on ignition)A measure of the percentage of volatile matter (liquid or gas) contained within a mineral or rock. LOI is determined to calculate loss in mass during pyroprocessing.
LPG (Liquefied petroleum gas)Consists of propane and butane and a small amount (less than two per cent) of ethane that has been liquefied through pressurisation. One tonne of LPG is approximately equivalent to 12 barrels of oil.
MAIGMember of the Australian Institute of Geoscientists.
Marketable Coal ReservesRepresents beneficiated or otherwise enhanced coal product where modifications due to mining, dilution and processing have been considered, must be publicly reported in conjunction with, but not instead of, reports of Coal Reserves. The basis of the predicted yield to achieve Marketable Coal Reserves must be stated (JORC Code, 2012).
MAusIMMMember of the Australasian Institute of Mining and Metallurgy.
Measured Mineral ResourcesThat part of a Mineral Resource for which quantity, grade (or quality), densities, shape and physical characteristics are estimated with confidence sufficient to allow the application of Modifying Factors to support detailed mine planning and final evaluation of the economic viability of the deposit.
Metallurgical coalA broader term than coking coal, which includes all coals used in steelmaking, such as coal used for the pulverised coal injection process.
MetoceanA term that is commonly used in the offshore oil and gas industry to describe the physical environment and surrounds (i.e. an environment near an offshore oil and gas working platform).
Mineral ResourcesA concentration or occurrence of solid material of economic interest in or on the Earth’s crust in such form, grade (quality) and quantity that there are reasonable prospects for eventual economic extraction. The location, quantity, grade (or quality), continuity and other geological characteristics of a Mineral Resource are known, estimated or interpreted from specific geological evidence and knowledge, including sampling (JORC Code, 2012).
Mineralisation Any single mineral or combination of minerals occurring in a mass, or deposit, of economic interest.
Modifying FactorsConsiderations used to convert Mineral Resources to Ore Reserves. These include, but are not restricted to, mining, processing, metallurgical, infrastructure, economic, marketing, legal, environmental, social and governmental factors.
NGL (Natural gas liquids)Consists of propane, butane and ethane – individually or as a mixture.
Nominated production rateThe approved average production rate for the remainder of the life-of-asset plan or five-year plan production rate if significantly different to life-of-asset production rate.
OC/OP (open-cut/open-pit)Surface working in which the working area is kept open to the sky.
Ore ReservesThe economically mineable part of a Measured and/or Indicated Mineral Resource. It includes diluting materials and allowances for losses, which may occur when the material is mined or extracted and is defined by studies at Pre-Feasibility or Feasibility level as appropriate that include application of Modifying Factors. Such studies demonstrate that, at the time of reporting, extraction could reasonably be justified.
PEGNLAssociation of Professional Engineers and Geoscientists of Newfoundland and Labrador.
Probable Ore ReservesThe economically mineable part of an Indicated and, in some circumstances, a Measured Mineral Resource. The confidence in the Modifying Factors applying to a Probable Ore Reserve is lower than that applying to a Proved Ore Reserve. Consideration of the confidence level of the Modifying Factors is important in conversion of Mineral Resources to Ore Reserves. A Probable Ore Reserve has a lower level of confidence than a Proved Ore Reserve but is of sufficient quality to serve as the basis for a decision on the development of the deposit (JORC Code, 2012).
PropaneA component of natural gas. Where sold separately, is largely propane gas that has been liquefied through pressurisation. One tonne of propane is approximately equivalent to 19 thousand cubic feet of gas.
Proved oil and gas reservesThose quantities of oil, gas and natural gas liquids, which by analysis of geoscience and engineering data can be estimated with reasonable certainty to be economically producible – from a given date forward, from known reservoirs, and under existing economic conditions, operating methods, and government regulations – prior to the time at which contracts providing the right to operate expire, unless evidence indicates that renewal is reasonably certain, regardless of whether deterministic or probabilistic methods are used for the estimation (from SEC Modernization of Oil and Gas Reporting, 2009, 17 CFR Parts 210, 211, 229 and 249).
Proved Ore ReservesRepresents the highest confidence category of reserve estimate and implies a high degree of confidence in geological and grade continuity, and the consideration of the Modifying Factors. The style of mineralisation or other factors could mean that Proved Ore Reserves are not achievable in some deposits (JORC Code, 2012). Implies the highest degree of geological, technical and economic confidence in the estimate at the level of production increments used to support mine planning and production scheduling.
Qualified petroleum reserves and resources evaluatorA qualified petroleum reserves and resources evaluator, as defined in Chapter 19 of the ASX Listing Rules.
Reserve lifeCurrent stated Ore Reserves estimate divided by the current approved nominated production rate as at the end of the financial year.
BHP Billiton Annual Report 2016 271
6.6.1 Mining, oil and gas-related terms continuedROM (run of mine)Run of mine product mined in the course of regular mining activities. Tonnes include allowances for diluting materials and for losses that occur when the material is mined.
Solvent extractionA method of separating one or more metals from a leach solution by treating with a solvent that will extract the required metal, leaving the others. The metal is recovered from the solvent by further treatment.
SP (stockpile)An accumulation of ore or mineral built up when demand slackens or when the treatment plant or beneficiation equipment is incomplete or temporarily unable to process the mine output; any heap of material formed to create a buffer for loading or other purposes or material dug and piled for future use.
SpudCommence drilling of an oil or gas well.
Supergene SulphideSupergene is a term used to describe near-surface processes and their products, formed at low temperature and pressure by the activity of descending water. Supergene sulphide is mainly formed of chalcocite and covellite and is amenable to heap leaching.
TailingsThose portions of washed or milled ore that are too poor to be treated further or remain after the required metals and minerals have been extracted.
TLP (tension leg platform)A vertically moored floating facility for production of oil and gas.
Total Mineral ResourcesThe sum of Inferred, Indicated and Measured Mineral Resources.
Total Ore ReservesProved Ore Reserves plus Probable Ore Reserves.
UG (underground)Below the surface mining activities.
Unconventional Petroleum Resources Hydrocarbon accumulations which are generally pervasive in nature and may be continuous throughout a large area requiring specialised extraction technologies to produce or recover. Examples include, but are not limited to coalbed methane, basin-centred gas, shale gas, gas hydrates, natural bitumen (tar sands), and oil shale deposits.
Examples of specialised technologies include: dewatering of coalbed methane, massive fracturing programs for shale gas, steam and/or solvents to mobilise bitumen for in situ recovery, and, in some cases, mining activities.
WTI (West Texas Intermediate)A mixture of hydrocarbons that exists in liquid phase in natural underground reservoirs and remains liquid at atmospheric pressure after passing through surface separating facilities. Crude oil is refined to produce a wide array of petroleum products, including heating oils; gasoline, diesel and jet fuels; lubricants; asphalt; ethane, propane, and butane; and many other products used for their energy or chemical content.
West Texas Intermediate refers to a crude stream produced in Texas and southern Oklahoma that serves as a reference or ‘marker’ for pricing a number of other crude streams and which is traded in the domestic spot market at Cushing, Oklahoma.
6.6.2 Other termsADR (American Depositary Receipt)An instrument evidencing American Depository Shares or ADSs, which trades on a stock exchange in the United States.
ADS (American Depositary Share)A share issued under a deposit agreement that has been created to permit US-resident investors to hold shares in non-US companies and trade them on the stock exchanges in the United States. ADSs are evidenced by American Depositary Receipts, or ADRs, which are the instruments that trade on a stock exchange in the United States.
ASIC (Australian Securities and Investments Commission)The Australian Government agency that enforces laws relating to companies, securities, financial services and credit in order to protect consumers, investors and creditors.
Asset groups Asset groups are a set of assets. Assets are grouped in order to drive collaboration, promote new technology adoption and to share best practices. Minerals assets are grouped under Minerals Australia or Minerals Americas based on their geographic location. Oil, gas and petroleum assets are grouped together as one global unit, reflecting the operating environment in that sector.
Assets Assets are a set of one or more geographically proximate operations (including open-cut mines, underground mines, and onshore and offshore oil and gas production and production facilities). Assets develop and convert resources and are focused on safety, volume and cost.
ASX (Australian Securities Exchange)ASX is a multi-asset class vertically integrated exchange group that functions as a market operator, clearing house and payments system facilitator. It oversees compliance with its operating rules, promotes standards of corporate governance among Australia’s listed companies and helps educate retail investors.
Australian Tax TreatyA tax convention between Australia and the United States relating to the avoidance of double taxation.
BHP Billiton Being both companies in the DLC structure, BHP Billiton Limited and BHP Billiton Plc.
BHP Billiton Limited shareA fully paid ordinary share in the capital of BHP Billiton Limited.
BHP Billiton Limited shareholdersThe holders of BHP Billiton Limited shares.
BHP Billiton Limited Special Voting ShareA single voting share issued to facilitate joint voting by shareholders of BHP Billiton Limited on Joint Electorate Actions.
BHP Billiton Plc shareA fully paid ordinary share in the capital of BHP Billiton Plc.
BHP Billiton Plc shareholdersThe holders of BHP Billiton Plc shares.
BHP Billiton Plc Special Voting ShareA single voting share issued to facilitate joint voting by shareholders of BHP Billiton Plc on Joint Electorate Actions.
BoardThe Board of Directors of BHP Billiton.
6A
dditional information
5 Financial Statements
7 Shareholder inform
ation
272 BHP Billiton Annual Report 2016
6 Additional information continued
6.6.2 Other terms continuedCompanyBHP Billiton Limited, BHP Billiton Plc (and their subsidiaries).
Continuing operationsAssets/operations/entities that are owned and/or operated by BHP Billiton and were not included in the demerger of South32.
Discontinued operationsAssets/operations/entities that were owned and/or operated by BHP Billiton during FY2015 and demerged into a new company (South32) on 25 May 2015.
Dividend record dateThe date, determined by a company’s board of directors, by when an investor must be recorded as an owner of shares in order to qualify for a forthcoming dividend.
DLC Dividend ShareA share to enable a dividend to be paid by BHP Billiton Plc to BHP Billiton Limited or by BHP Billiton Limited to BHP Billiton Plc (as applicable).
DLC (Dual Listed Company)BHP Billiton’s Dual Listed Company structure has two parent companies (BHP Billiton Ltd and BHP Billiton Plc) operating as a single economic entity as a result of the DLC merger.
DLC mergerThe Dual Listed Company merger between BHP Billiton Limited and BHP Billiton Plc on 29 June 2001.
EBITEarnings before net finance costs and taxation.
EBITDAEarnings before depreciation, amortisation and impairments, net finance costs and taxation.
ELT (Executive Leadership Team)The Executive Leadership Team directly reports to the Chief Executive Officer and is responsible for the day-to-day management of the Company and leading the delivery of our strategic objectives.
Equalisation DLC Dividend ShareA share that has been authorised to be issued to enable a distribution dividend to be made by the BHP Billiton Plc Group to the BHP Billiton Limited Group or by the BHP Billiton Limited Group to the BHP Billiton Plc Group (as applicable), should this be required under the terms of the DLC merger.
FunctionsOur functions are:• Marketing and Supply• External Affairs• Finance• Human Resources• Technology.
Gearing ratio The ratio of net debt to net debt plus net assets.
GHG (Greenhouse gas) For BHP Billiton reporting purposes, these are the aggregate anthropogenic carbon dioxide equivalent emissions of carbon dioxide (CO
2), methane (CH
4), nitrous oxide (N
2O),
hydrofluorocarbons (HFCs), perfluorocarbons (PFCs) and sulphur hexafluoride (SF
6).
Group BHP Billiton Limited, BHP Billiton Plc and their respective subsidiaries.
Henry HubA natural gas pipeline located in Erath, Louisiana that serves as the official delivery location for futures contracts on the New York Mercantile Exchange.
IFRS (International Financial Reporting Standards)Accounting standards as issued by the International Accounting Standards Board.
KMP (Key Management Personnel)Persons having authority and responsibility for planning, directing and controlling the activities of the Group, directly or indirectly. For BHP Billiton, it includes the Non-executive Directors, the CEO and Executive Director, up to 29 February 2016, the other members of the GMC, and from 1 March 2016, the other members of the OMC (which replaced the GMC).
KPI (Key Performance Indicator)Used to measure the performance of the Group, individual businesses and executives in any one year.
LME (London Metal Exchange)A major futures exchange for the trading of industrial metals.
Major capital projectsProjects where the investment commitment exceeds the Group approval threshold or complexity, or associated reputational risk or exposure necessitates review at a Group level (and within the Group investment process).
MarketingRefers to the BHP Billiton staff, processes and activities that provide marketing services to the whole organisation. Marketing secures sales of BHP Billiton products and manages associated risks; purchases major raw materials that are used by assets; manages the supply chains from resources to markets; and analyses commodity markets.
Minerals AmericasA group of assets located in Brazil, Canada, Chile, Colombia, Peru and the United States (see ‘Asset groups’) focusing on copper, zinc concentrate, iron ore, thermal coal and potash.
Minerals AustraliaA group of assets located in Australia (see ‘Asset groups’). Minerals Australia includes operations in Western Australia, Queensland, New South Wales and South Australia, focusing on iron ore, copper, metallurgical, and energy coal and nickel.
Occupational illness An illness that occurs as a consequence of work-related activities or exposure. It includes acute or chronic illnesses or diseases, which may be caused by inhalation, absorption, ingestion or direct contact.

BHP Billiton Annual Report 2016 273
6.6.2 Other terms continuedOMC (Operations Management Committee)The Operations Management Committee has responsibility for planning, directing and controlling the activities of the Company, including key Company strategic, investment and operational decisions, and recommendations to the Board.
Members of the OMC are the Chief Executive Officer; the Chief Financial Officer; the Chief External Affairs Officer; the Chief People Officer; the President, Operations, Minerals Australia; the President, Operations, Minerals Americas; and the President Operations, Petroleum.
Operating ModelThe Operating Model outlines how the Company is organised, works and measures performance and includes mandatory performance requirements and common systems, processes and planning. In February 2016, the Operating Model was simplified and BHP Billiton is organised by assets, asset groups, Marketing and functions.
OperationsOpen-cut mines, underground mines, onshore and offshore oil and gas production and processing facilities.
Our Requirements The standards that give effect to the mandatory requirements arising from the BHP Billiton Operating Model as approved by the Executive Leadership Team (ELT). They describe the mandatory minimum performance requirements and accountabilities for definitive business obligations, processes, functions and activities across BHP Billiton.
Previously called Group Level Documents (GLDs), Our Requirements reflect a simpler organisation with the purpose of being more user-friendly and easier to read.
Petroleum asset groupA group of conventional and non-conventional oil and gas assets (see ‘Asset groups’). Petroleum’s core production operations are located in the US Gulf of Mexico, Australia, Trinidad and Tobago and onshore United States. Petroleum produces crude oil and condensate, gas and natural gas liquids.
PlattsPlatts is a global provider of energy, petrochemicals, metals and agriculture information and a premier source of benchmark price assessments for those commodity markets.
QuotedIn the context of American Depositary Shares (ADS) and listed investments, the term ‘quoted’ means ‘traded’ on the relevant exchange.
SEC (United States Securities and Exchange Commission)United States regulatory commission that aims to protect investors, maintain fair, orderly and efficient markets and facilitate capital formation.
Senior managerAn employee who has responsibility for planning, directing or controlling the activities of the entity or a strategically significant part of it. In the Strategic Report, senior manager includes senior leaders and any persons who are directors of any subsidiary company even if they are not senior leaders.
ShareplusAll-employee share purchase plan.
Social investmentVoluntary contributions to support communities through cash donations to community programs and associated administrative costs. BHP Billiton’s targeted level of contribution is one per cent of pre-tax profit calculated on the average of the previous three years’ pre-tax profit as reported.
South32During FY2015, BHP Billiton demerged a selection of our alumina, aluminium, coal, manganese, nickel, silver, lead and zinc assets into a new company – South32 Limited.
StrateSouth Africa’s Central Securities Depositary for the electronic settlement of financial instruments.
TRIF (Total recordable injury frequency)The sum of (fatalities + lost-time cases + restricted work cases + medical treatment cases) x 1,000,000 ÷ actual hours worked. Stated in units of per million hours worked. BHP Billiton adopts the US Government Occupational Safety and Health Administration guidelines for the recording and reporting of occupational injury and illnesses. TRIF statistics exclude non-operated assets.
TSR (Total shareholder return)TSR measures the return delivered to shareholders over a certain period through the change in share price and any dividends paid. It is the measure used to compare BHP Billiton’s performance to that of other relevant companies under the Long-Term Incentive Plan.
UKLA (United Kingdom Listing Authority)Term used when the UK Financial Conduct Authority (FCA) acts as the competent authority under Part VI of the UK Financial Services and Markets Act (FSMA).
Underlying attributable profit(Loss)/profit after taxation attributable to owners of the BHP Billiton Group less exceptional items as described in note 2 ‘Exceptional items’ to the Financial Statements and excludes Discontinued operations. Refer to section 1.13 for additional information.
Underlying EBITCalculated as Underlying EBITDA, including depreciation, amortisation and impairments. Refer to section 1.13 for further information.
Underlying EBITDACalculated as earnings before net finance costs, depreciation, amortisation and impairments, taxation expense, Discontinued operations and any exceptional items. Refer to section 1.13 for further information.
6A
dditional information
5 Financial Statements
7 Shareholder inform
ation
274 BHP Billiton Annual Report 2016
6 Additional information continued
6.6.3 Terms used in reserves and resources Agsilver
AI2O
3alumina
Ashinorganic material remaining after combustion
Augold
Cucopper
CVcalorific value
Fe iron
Insolinsolubles
K2O
potassium oxide
KClpotassium chloride
LOIloss on ignition
Metmetallurgical coal
MgOmagnesium oxide
Momolybdenum
Ninickel
Pphosphorous
Pblead
Pcphosphorous in concentrate
PPCcLOI in concentrate
Ssulphur
SCusoluble copper
SiO2silica
TCutotal copper
Ththermal coal
U3O
8uranium oxide
VMvolatile matter
Yieldthe percentage of material of interest that is extracted during mining and/or processing
Znzinc
6.6.4 Units of measure%percentage or per cent
bblbarrel (containing 42 US gallons)
bbl/dbarrels per day
Bcfbillion cubic feet (measured at 60’F, 14.73 psia)
bcmbank cubic metres
boebarrels of oil equivalent – 6,000 scf of natural gas equals 1 boe
dmtdry metric tonne
dmtudry metric tonne unit
g/tgrams per tonne
hahectare
kcal/kgkilocalories per kilogram
kdwtthousand deadweight tonnes
kg/tonne or kg/tkilograms per tonne
kmkilometre
ktkilotonnes
ktpakilotonnes per annum
ktpdkilotonnes per day
kVkilovolt
mmetre
Mbbl/dthousand barrels per day
MLmegalitre
mmmillimetre
MMbbl/dmillion barrels per day
MMboemillion barrels of oil equivalent
MMBtumillion British thermal units – 1 scf of natural gas equals 1,010 Btu
MMcf/dmillion cubic feet per day
MMcm/dmillion cubic metres per day
Mscfthousand standard cubic feet
Mtmillion tonnes
Mtpamillion tonnes per annum
MWmegawatt
ppmparts per million
psipounds per square inch
scfstandard cubic feet
ttonne
TJterajoule
TJ/dterajoules per day
tpatonnes per annum
tpdtonnes per day
tphtonnes per hour
wmtwet metric tonnes

BHP Billiton Annual Report 2016 275
Section 7 Shareholder information
In this section7.1 History and development7.2 Markets7.3 Organisational structure7.4 Material contracts7.5 Constitution7.6 Share ownership7.7 Dividends7.8 Share price information7.9 American Depositary Receipts fees and charges7.10 Taxation7.11 Government regulations7.12 Ancillary information for our shareholders
276 BHP Billiton Annual Report 2016
7 Shareholder information continued
7.1 History and developmentBHP Billiton Limited (formerly BHP Limited and, before that, The Broken Hill Proprietary Company Limited) was incorporated in 1885 and is registered in Australia with ABN 49 004 028 077. BHP Billiton Plc (formerly Billiton Plc) was incorporated in 1996 and is registered in England and Wales with registration number 3196209. Successive predecessor entities to BHP Billiton Plc have operated since 1860.
We have operated under a DLC structure since 29 June 2001. Under the DLC structure, the two parent companies, BHP Billiton Limited and BHP Billiton Plc, operate as a single economic entity, run by a unified Board and senior executive management team. More details of the DLC structure can be found in section 7.3.
7.2 MarketsAs at the date of this Annual Report, BHP Billiton Limited has a primary listing on the Australian Securities Exchange (ASX) in Australia and BHP Billiton Plc has a premium listing on the UK Listing Authority’s Official List and its ordinary shares are admitted to trading on the London Stock Exchange (LSE). BHP Billiton Plc also has a secondary listing on the Johannesburg Stock Exchange (JSE) in South Africa.
In addition, BHP Billiton Limited and BHP Billiton Plc are listed on the New York Stock Exchange (NYSE) in the United States. Trading on the NYSE is via American Depositary Receipts (ADRs) evidencing American Depositary Shares (ADSs), with each ADS representing two ordinary shares of BHP Billiton Limited or BHP Billiton Plc. Citibank N.A. (Citibank) is the Depositary for both ADS programs. BHP Billiton Limited’s ADSs have been listed for trading on the NYSE (ticker BHP) since 28 May 1987 and BHP Billiton Plc’s since 25 June 2003 (ticker BBL).
7.3 Organisational structure7.3.1 GeneralThe BHP Billiton Group consists of the BHP Billiton Limited Group and the BHP Billiton Plc Group, operating as a single unified economic entity, following the completion of the DLC merger in June 2001. Refer to note 5.2.12 ‘Related undertakings of the BHP Billiton Group’ to the Financial Statements for a full list of BHP Billiton Limited and BHP Billiton Plc subsidiaries.
7.3.2 DLC structureBHP Billiton shareholders approved the DLC merger in 2001, which was designed to place ordinary shareholders of both companies in a position where they have economic and voting interests in a single group.
The principles of the BHP Billiton DLC structure are reflected in the DLC Structure Sharing Agreement and include the following: • The two companies must operate as if they are a single
unified economic entity, through Boards of Directors that comprise the same individuals and a unified senior executive management team.
• The Directors of both companies will, in addition to their duties to the company concerned, have regard to the interests of the ordinary shareholders in the two companies as if the two companies were a single unified economic entity and, for that purpose, the Directors of each company take into account in the exercise of their powers the interests of the shareholders of the other.
• Certain DLC equalisation principles must be observed. These are designed to ensure that for so long as the Equalisation Ratio between a BHP Billiton Limited ordinary share and a BHP Billiton Plc ordinary share is 1:1, the economic and voting interests resulting from holding of one BHP Billiton Limited ordinary share and one BHP Billiton Plc ordinary share are, so far as practicable, equivalent. Further details are set out in the sub-section ‘Equalisation of economic and voting rights’.
Australian Foreign Investment Review Board conditionsThe Treasurer of Australia approved the DLC merger subject to certain conditions, the effect of which was to require that, among other things, BHP Billiton Limited continues to:• be an Australian company, which is headquartered in Australia; • ultimately manage and control the companies that conducted
the businesses that were conducted by its subsidiaries at the time of the DLC merger for as long as those businesses form part of the BHP Billiton Group.
The conditions also require the global headquarters of the BHP Billiton Group to be in Australia.
The conditions have effect indefinitely, subject to amendment of the Australian Foreign Acquisitions and Takeovers Act 1975 (FATA) or any revocation or amendment by the Treasurer of Australia. If BHP Billiton Limited no longer wishes to comply with these conditions, it must obtain the prior approval of the Treasurer. Failure to comply with the conditions results in substantial penalties under the FATA.
Equalisation of economic and voting rightsThe economic and voting interests attached to each BHP Billiton Limited ordinary share relative to each BHP Billiton Plc ordinary share are determined by a ratio known as the Equalisation Ratio.
The Equalisation Ratio is currently 1:1, meaning one BHP Billiton Limited ordinary share currently has the same economic and voting interests as one BHP Billiton Plc ordinary share.
The Equalisation Ratio governs the proportions in which dividends and capital distributions are paid on the ordinary shares in each company relative to the other. Given the current Equalisation Ratio of 1:1, the amount of any cash dividend paid by BHP Billiton Limited on each BHP Billiton Limited ordinary share must be matched by an equivalent cash dividend by BHP Billiton Plc on each BHP Billiton Plc ordinary share, and vice versa. If one company is prohibited by applicable law or is otherwise unable to pay a matching dividend, the DLC Structure Sharing Agreement requires that BHP Billiton Limited and BHP Billiton Plc will, as far as practicable, enter into such transactions with each other as their Boards agree to be necessary or desirable to enable both companies to pay matching dividends at the same time. These transactions may include BHP Billiton Limited or BHP Billiton Plc making a payment to the other company or paying a dividend on the DLC Dividend Share held by the other company (or a subsidiary of it). The DLC Dividend Share may be used to ensure that the need to trigger the matching dividend mechanism does not arise. BHP Billiton Limited issued a DLC Dividend Share on 23 February 2016. No DLC Dividend Share has been issued by BHP Billiton Plc. Further details about the DLC Dividend Share are set out in the sub-section titled ‘DLC Dividend Share’ and section 7.5.
BHP Billiton Annual Report 2016 277
7.3.2 DLC structure continuedThe Equalisation Ratio may be adjusted to maintain economic equivalence between an ordinary share in each of the two companies where, broadly speaking (and subject to certain exceptions):• a distribution or action affecting the amount or nature of issued
share capital is proposed by one of BHP Billiton Limited and BHP Billiton Plc and that distribution or action would result in the ratio of economic returns on, or voting rights in relation to Joint Electorate Actions of, a BHP Billiton Limited ordinary share to a BHP Billiton Plc ordinary share not being the same, or would benefit the holders of ordinary shares in one company relative to the holders of ordinary shares in the other company;
• no ‘matching action’ is taken by the other company. A matching action is a distribution or action affecting the amount or nature of issued share capital in relation to the holders of ordinary shares in the other company which ensures that the economic and voting rights or a BHP Billiton Limited ordinary share and BHP Billiton Plc ordinary share are maintained in proportion to the Equalisation Ratio.
For example, an adjustment would be required if there were to be a capital issue or distribution by one company to its ordinary shareholders that does not give equivalent value (before tax) on a per share basis to the ordinary shareholders of the other company and no matching action was undertaken. Since the establishment of the DLC structure in 2001, no adjustment to the Equalisation Ratio has ever been made.
DLC Dividend ShareEach of BHP Billiton Limited and BHP Billiton Plc is authorised to issue a DLC Dividend Share to the other company or a wholly owned subsidiary of it. In effect, only that other company or a wholly owned subsidiary of it may be the holder of the share. The share is redeemable.
The holder of the share is entitled to be paid such dividends as the Board may decide to pay on that DLC Dividend Share provided that: • the amount of the dividend does not exceed the cap
mentioned below; • the Board of the issuing company in good faith considers paying
the dividend to be in furtherance of any of the DLC principles, including the principle of BHP Billiton Limited and BHP Billiton Plc operating as a single unified economic entity.
The amounts that may be paid as dividends on a DLC Dividend Share are capped. Broadly speaking, the cap is the total amount of the preceding ordinary cash dividend (whether interim or final) paid on BHP Billiton Limited ordinary shares or BHP Billiton Plc ordinary shares, whichever is greater. The cap will not apply to any dividend paid on a DLC Dividend Share if the proceeds of that dividend are to be used to pay a special cash dividend on ordinary shares.
A DLC Dividend Share otherwise has limited rights and does not carry a right to vote. DLC Dividend Shares cannot be used to transfer funds outside of the BHP Billiton Group as the terms of issue contain structural safeguards to ensure that a DLC Dividend Share may only be used to pay dividends within the Group. Further information about the rights attaching to DLC Dividend Shares is set out in section 7.5. The detailed rights attaching to and terms of DLC Dividend Shares are set out in the Constitution of BHP Billiton Limited and the Articles of Association of BHP Billiton Plc.
Joint Electorate ActionsUnder the terms of the DLC agreements, BHP Billiton Limited and BHP Billiton Plc have implemented special voting arrangements so that the ordinary shareholders of both companies vote together as a single decision-making body on matters that affect the ordinary shareholders of each company in similar ways. These are referred to as Joint Electorate Actions. For so long as the Equalisation Ratio remains 1:1, each BHP Billiton Limited ordinary share will effectively have the same voting rights as each BHP Billiton Plc ordinary share on Joint Electorate Actions.
A Joint Electorate Action requires approval by ordinary resolution (or special resolution if required by statute, regulation, applicable listing rules or other applicable requirements) of BHP Billiton Limited and BHP Billiton Plc. Both the BHP Billiton Limited ordinary shareholders and the holder of the BHP Billiton Limited Special Voting Share vote as a single class and, in the case of BHP Billiton Plc, the BHP Billiton Plc ordinary shareholders and the holder of the BHP Billiton Plc Special Voting Share vote as a single class.
Class Rights ActionsMatters on which ordinary shareholders of BHP Billiton Limited may have divergent interests from the ordinary shareholders of BHP Billiton Plc are referred to as Class Rights Actions. The company wishing to carry out the Class Rights Action requires the prior approval of the ordinary shareholders in the other company voting separately and, where appropriate, the approval of its own ordinary shareholders voting separately. Depending on the type of Class Rights Action undertaken, the approval required is either an ordinary or special resolution of the relevant company.
The Joint Electorate Action and Class Rights Action voting arrangements are secured through the constitutional documents of the two companies, the DLC Structure Sharing Agreement, the BHP Billiton Special Voting Shares Deed and rights attaching to a specially created Special Voting Share issued by each company and held in each case by a Special Voting Company. The shares in the Special Voting Companies are held legally and beneficially by Law Debenture Trust Corporation Plc.
Cross guaranteesBHP Billiton Limited and BHP Billiton Plc have each executed a Deed Poll Guarantee in favour of the creditors of the other company. Under the Deed Poll Guarantees, each company has guaranteed certain contractual obligations of the other company. This means that creditors entitled to the benefit of the BHP Billiton Limited Deed Poll Guarantee and the BHP Billiton Plc Deed Poll Guarantee will, to the extent possible, be placed in the same position as if the relevant debts were owed by both BHP Billiton Limited and BHP Billiton Plc on a combined basis.
Restrictions on takeovers of one company onlyThe BHP Billiton Limited Constitution and the BHP Billiton Plc Articles of Association have been drafted to ensure that, except with the consent of the Board, a person cannot gain control of one company without having made an equivalent offer to the ordinary shareholders of both companies on equivalent terms. Sanctions for breach of these provisions would include withholding of dividends, voting restrictions and the compulsory divestment of shares to the extent a shareholder and its associates exceed the relevant threshold.
7Shareholder inform
ation5 Financial Statem
ents6 A
dditional information
278 BHP Billiton Annual Report 2016
7 Shareholder information continued
7.4 Material contractsDLC agreementsBHP Billiton Limited (then known as BHP Limited) and BHP Billiton Plc (then known as Billiton Plc) merged by way of a DLC structure on 29 June 2001. To effect the DLC structure, BHP Limited and Billiton Plc (as they were then known) entered into the following contractual agreements:• BHP Billiton DLC Structure Sharing Agreement• BHP Billiton Special Voting Shares Deed• BHP Billiton Limited Deed Poll Guarantee• BHP Billiton Plc Deed Poll Guarantee.
The effect of each of these agreements is described in section 7.3.
Demerger Implementation DeedBHP Billiton Limited, BHP Billiton Plc and South32 Limited entered into an Implementation Deed on 17 March 2015 to facilitate the demerger of South32 Limited from the BHP Billiton Group.
The Implementation Deed sets out: • the conditions to the demerger; • certain steps required to be taken by each of BHP Billiton Limited,
BHP Billiton Plc and South32 Limited to implement the demerger.
Implementation of the demerger was completed on 25 May 2015 and resulted in the formation of an independent listed company, South32 Limited, with a portfolio of assets producing alumina, aluminium, coal, manganese, nickel, silver, lead and zinc.
In accordance with the Implementation Deed, the demerger was effected through a distribution of South32 shares to eligible shareholders of BHP Billiton Limited and BHP Billiton Plc by way of an in-specie dividend by each of BHP Billiton Limited and BHP Billiton Plc. Each eligible shareholder of BHP Billiton Limited and BHP Billiton Plc received one South32 share for each share in BHP Billiton Limited or BHP Billiton Plc (as applicable) that it held as at the applicable record date for the demerger.
7.5 ConstitutionThis section sets out a summary of the Constitution of BHP Billiton Limited and the Articles of Association of BHP Billiton Plc. Where the term ‘BHP Billiton’ is used in this section, it can mean either BHP Billiton Limited or BHP Billiton Plc.
Provisions of the Constitution of BHP Billiton Limited and the Articles of Association of BHP Billiton Plc can be amended only where such amendment is approved by special resolution either:• by approval as a Class Rights Action, where the amendment
results in a change to an ‘Entrenched Provision’; or • otherwise, as a Joint Electorate Action.
In 2015, shareholders approved a number of amendments to our constitutional documents to amend the terms of the Equalisation Shares (which were renamed as DLC Dividend Shares) and to facilitate the more streamlined conduct of simultaneous general meetings.
A description of Joint Electorate Actions and Class Rights Actions is contained under the heading ‘Equalisation of economic and voting rights’ in section 7.3.2.
7.5.1 DirectorsThe Board of Directors may exercise all powers of BHP Billiton, other than those that are reserved for BHP Billiton shareholders to exercise in a general meeting.
7.5.2 Power to issue securitiesUnder the Constitution and Articles of Association, the Board of Directors has the power to issue any BHP Billiton shares or other securities (including redeemable shares) with preferred, deferred or other special rights, obligations or restrictions. The Board may issue shares on any terms it considers appropriate, provided that:• the issue does not affect any special rights of shareholders;• if required, the issue is approved by shareholders; and• if the issue is of a class other than ordinary shares, the rights
attaching to the class are expressed at the date of issue.
7.5.3 Restrictions on voting by DirectorsA Director may not vote in respect of any contract or arrangement or any other proposal in which they have a material personal interest except in certain prescribed circumstances, including (subject to applicable laws) where the material personal interest:• arises because the Director is a shareholder of BHP Billiton and
is held in common with the other shareholders of BHP Billiton;• arises in relation to the Director’s remuneration as a Director
of BHP Billiton;• relates to a contract BHP Billiton is proposing to enter into that
is subject to approval by the shareholders and will not impose any obligation on BHP Billiton if it is not approved by the shareholders;
• arises merely because the Director is a guarantor or has given an indemnity or security for all or part of a loan, or proposed loan, to BHP Billiton;
• arises merely because the Director has a right of subrogation in relation to a guarantee or indemnity referred to above;
• relates to a contract that insures, or would insure, the Director against liabilities the Director incurs as an officer of BHP Billiton, but only if the contract does not make BHP Billiton or a related body corporate the insurer;
• relates to any payment by BHP Billiton or a related body corporate in respect of an indemnity permitted by law, or any contract relating to such an indemnity; or
• is in a contract, or proposed contract with, or for the benefit of, or on behalf of, a related body corporate and arises merely because the Director is a director of a related body corporate.
If a Director has a material personal interest and is not entitled to vote on a proposal, they will not be counted in the quorum for any vote on a resolution concerning the material personal interest.
In addition, under the UK Companies Act 2006, a Director has a duty to avoid conflicts of interest between their interests and the interests of the company. The duty is not breached if, among other things, the conflict of interest is authorised by non-interested Directors. The Articles of Association of BHP Billiton Plc enable the Board to authorise a matter that might otherwise involve a Director breaching their duty to avoid conflicts of interest. An interested Director may not vote or be counted towards a quorum for a resolution authorising a conflict of interest. Where the Board authorises a conflict of interest, the Board may prohibit the relevant Director from voting on any matter relating to the conflict. The Board has adopted procedures to manage these voting restrictions.

BHP Billiton Annual Report 2016 279
7.5.4 Loans by DirectorsAny Director may lend money to BHP Billiton at interest with or without security or may, for a commission or profit, guarantee the repayment of any money borrowed by BHP Billiton and underwrite or guarantee the subscription of shares or securities of BHP Billiton or of any corporation in which BHP Billiton may be interested without being disqualified as a Director and without being liable to account to BHP Billiton for any commission or profit.
7.5.5 Appointment and retirement of DirectorsAppointment of DirectorsThe Constitution and Articles of Association provide that a person may be appointed as a Director of BHP Billiton by the existing Directors of BHP Billiton or may be elected by the shareholders in a general meeting.
Any person appointed as a Director of BHP Billiton by the existing Directors will hold office only until the next general meeting that includes an election of Directors.
A person may be nominated by shareholders as a Director of BHP Billiton if:• a shareholder provides a valid written notice of the nomination; • the person nominated by the shareholder satisfies candidature
for the office and consents in writing to his or her nomination as a Director,
in each case, at least 40 business days before the earlier of the date of the general meeting of BHP Billiton Plc and the corresponding general meeting of BHP Billiton Limited. The person nominated as a Director may be elected to the Board by ordinary resolution passed in a general meeting.
Under the Articles of Association, if a person is validly nominated for election as a Director at a general meeting of BHP Billiton Limited, the Directors of BHP Billiton Plc must nominate that person as a Director at the corresponding general meeting of BHP Billiton Plc. An equivalent requirement is included in the Constitution, which requires any person validly nominated for election as a Director of BHP Billiton Plc to be nominated as a Director of BHP Billiton Limited.
Retirement of DirectorsThe Board has a policy consistent with the UK Corporate Governance Code under which all Directors must, if they wish to remain on the Board, seek re-election by shareholders annually. This policy took effect from the 2011 Annual General Meetings (AGMs) and replaced the previous system that required Directors to submit themselves to shareholders for re-election at least every three years.
A Director may be removed by BHP Billiton in accordance with applicable law and must vacate his or her office as a Director in certain circumstances set out in the Constitution and Articles of Association. There is no requirement for a Director to retire on reaching a certain age.
7.5.6 Rights attaching to sharesDividend rightsUnder English law, dividends on shares may only be paid out of profits available for distribution. Under Australian law, dividends on shares may be paid only if the company’s assets exceed its liabilities immediately before the dividend is determined and the excess is sufficient for payment of the dividend, the payment of the dividend is fair and reasonable to the company’s shareholders as a whole and the payment of the dividend does not materially prejudice the company’s ability to pay its creditors.
The Constitution and Articles of Association provide that payment of any dividend may be made in any manner, by any means and in any currency determined by the Board.
All unclaimed dividends may be invested or otherwise used by the Board for the benefit of whichever of BHP Billiton Limited or BHP Billiton Plc determined that dividend, until claimed or, in the case of BHP Billiton Limited, otherwise disposed of according to law. BHP Billiton Limited is governed by the Victorian unclaimed monies legislation, which requires BHP Billiton Limited to pay to the State Revenue Office any unclaimed dividend payments of A$20 or more that have remained unclaimed for over 12 months.
In the case of BHP Billiton Plc, any dividend unclaimed after a period of 12 years from the date the dividend was determined or became due for payment will be forfeited and returned to BHP Billiton Plc.
Voting rightsVoting at any general meeting of BHP Billiton Limited shareholders can, in the first instance, be conducted by a show of hands unless a poll is demanded in accordance with the Constitution or Articles of Association (as applicable) or is otherwise required (as outlined below).
Generally, matters considered by shareholders at an AGM of BHP Billiton Limited or BHP Billiton Plc constitute Joint Electorate Actions or Class Rights Actions and must be decided on a poll and in the manner described under the headings ‘Joint Electorate Actions’ and ‘Class Rights Actions’ in section 7.3.2. This means that, in practice, most items of business at AGMs are decided by way of a poll.
In addition, at any general meeting a resolution, other than a procedural resolution, put to the vote of the meeting on which the holder of the relevant BHP Billiton Special Voting Share is entitled to vote must be decided on a poll.
For the purposes of determining which shareholders are entitled to attend or vote at a meeting of BHP Billiton Plc or BHP Billiton Limited, and how many votes such shareholder may cast, the Notice of Meeting will specify when shareholders must be entered on the Register of Shareholders in order to have the right to attend or vote at the meeting. The specified time must be not more than 48 hours before the time of the meeting.
Shareholders who wish to appoint a proxy to attend, vote or speak at a meeting of BHP Billiton Plc or BHP Billiton Limited (as appropriate) on their behalf must deposit the relevant form appointing a proxy so that it is received by that company not less than 48 hours before the time of the meeting.
7Shareholder inform
ation5 Financial Statem
ents6 A
dditional information

280 BHP Billiton Annual Report 2016
7 Shareholder information continued
7.5.6 Rights attaching to shares continuedRights to share in BHP Billiton Limited’s profitsThe rights attached to the ordinary shares of BHP Billiton Limited, as regards the participation in the profits available for distribution, are as follows:• The holders of any preference shares will be entitled, in priority
to any payment of dividend to the holders of any other class of shares, to a preferred right to participate as regards dividends up to but not beyond a specified amount in distribution.
• Subject to the special rights attaching to any preference shares, but in priority to any payment of dividends on all other classes of shares, the holder of the DLC Dividend Share (if any) will be entitled to be paid such non-cumulative dividends as the Board may, subject to the cap referred to in section 7.3 and the DLC Dividend Share being held by BHP Billiton Plc or a wholly owned member of its group, decide to pay on that DLC Dividend Share.
• Any surplus remaining after payment of the distributions above will be payable to the holders of BHP Billiton Limited ordinary shares and the BHP Billiton Limited Special Voting Share in equal amounts per share.
Rights to share in BHP Billiton Plc’s profitsThe rights attached to the ordinary shares of BHP Billiton Plc, in relation to the participation in the profits available for distribution, are as follows:• The holders of the cumulative preference shares will be entitled,
in priority to any payment of dividend to the holders of any other class of shares, to be paid a fixed cumulative preferential dividend (Preferential Dividend) at a rate of 5.5 per cent per annum, to be paid annually in arrears on 31 July in each year or, if any such date will be a Saturday, Sunday or public holiday in England, on the first business day following such date in each year. Payments of Preferential Dividends will be made to holders on the register at any date selected by the Directors up to 42 days prior to the relevant fixed dividend date.
• Subject to the rights attaching to the cumulative preference shares, but in priority to any payment of dividends on all other classes of shares, the holder of the BHP Billiton Plc Special Voting Share will be entitled to be paid a fixed dividend of US$0.01 per annum, payable annually in arrears on 31 July.
• Subject to the rights attaching to the cumulative preference shares and the BHP Billiton Plc Special Voting Share, but in priority to any payment of dividends on all other classes of shares, the holder of the DLC Dividend Share will be entitled to be paid such non-cumulative dividends as the Board may, subject to the cap referred to in section 7.3 and the DLC Dividend Share being held by BHP Billiton Limited or a wholly owned member of its group, decide to pay on that DLC Dividend Share.
• Any surplus remaining after payment of the distributions above will be payable to the holders of the BHP Billiton Plc ordinary shares in equal amounts per BHP Billiton Plc ordinary share.
DLC Dividend ShareAs set out in section 7.3.2, each of BHP Billiton Limited and BHP Billiton Plc is authorised to issue a DLC Dividend Share to the other company or a wholly owned subsidiary of it.
The dividend rights attaching to a DLC Dividend Share are described above and in section 7.3. The DLC Dividend Share issued by BHP Billiton Limited (BHP Billiton Limited DLC Dividend Share) and the DLC Dividend Share that may be issued by BHP Billiton Plc (BHP Billiton Plc DLC Dividend Share) have no voting rights and, as set out in sub-section 7.5.7 below, very limited rights to a return of capital on a winding-up. A DLC Dividend Share may be redeemed at any time, and must be redeemed if a person other than:• in the case of the BHP Billiton Limited DLC Dividend Share,
BHP Billiton Plc or a wholly owned member of its group;• in the case of the BHP Billiton Plc DLC Dividend Share,
BHP Billiton Limited or a wholly owned member of its group,
becomes the beneficial owner of the DLC Dividend Share.
7.5.7 Rights on a return of assets on liquidationUnder the DLC structure, special provisions designed to ensure that, as far as practicable, the holders of ordinary shares in BHP Billiton Limited and holders of ordinary shares in BHP Billiton Plc are treated equitably having regard to the Equalisation Ratio, which would apply in the event of an insolvency of either or both companies.
On a return of assets on liquidation of BHP Billiton Limited, the assets of BHP Billiton Limited remaining available for distribution among shareholders after the payment of all prior ranking amounts owed to all creditors and holders of preference shares, and to all prior ranking statutory entitlements, are to be applied subject to the special provisions referred to above in paying to the holders of the BHP Billiton Limited Special Voting Share and the DLC Dividend Share of an amount of up to A$2.00 on each such share, on an equal priority with any amount paid to the holders of BHP Billiton Limited ordinary shares, and any surplus remaining is to be applied in making payments solely to the holders of BHP Billiton Limited ordinary shares in accordance with their entitlements.
On a return of assets on liquidation of BHP Billiton Plc, subject to the payment of all amounts payable under the special provisions referred to above, prior ranking amounts owed to the creditors of BHP Billiton Plc and to all prior ranking statutory entitlements, the assets of BHP Billiton Plc to be distributed on a winding-up are to be distributed to the holders of shares in the following order of priority:• To the holders of the cumulative preference shares, the repayment
of a sum equal to the nominal capital paid up or credited as paid up on the cumulative preference shares held by them and any accrued Preferential Dividend, whether or not such dividend has been earned or declared, calculated up to the date of commencement of the winding-up.
• To the holders of the BHP Billiton Plc ordinary shares and to the holders of the BHP Billiton Plc Special Voting Share and the DLC Dividend Share, the payment out of surplus, if any, remaining after the distribution above of an equal amount for each BHP Billiton Plc ordinary share, the BHP Billiton Plc Special Voting Share and the DLC Dividend Share subject to a maximum in the case of the BHP Billiton Plc Special Voting Share and the DLC Dividend Share of the nominal capital paid up on such shares.

BHP Billiton Annual Report 2016 281
7.5.8 Redemption of preferences sharesIf BHP Billiton Limited at any time proposes to create and issue any preference shares, the terms of the preference shares may give either or both BHP Billiton Limited and the holder the right to redeem the preference shares.
The preference shares terms may also give the holder the right to convert the preference shares into ordinary shares.
Under the Constitution, the preference shares must give the holders:• the right (on redemption and on a winding-up) to payment in
cash in priority to any other class of shares of (i) the amount paid or agreed to be considered as paid on each of the preference shares; and (ii) the amount, if any, equal to the aggregate of any dividends accrued but unpaid and of any arrears of dividends;
• the right, in priority to any payment of dividend on any other class of shares, to the preferential dividend.
There is no equivalent provision in the Articles of Association of BHP Billiton Plc, although as noted in section 7.5.2, BHP Billiton can issue preference shares that are subject to a right of redemption on terms the Board considers appropriate.
7.5.9 Capital callsSubject to the terms on which any shares may have been issued, the Board may make calls on the shareholders in respect of all monies unpaid on their shares. BHP Billiton has a lien on every partly paid share for all amounts payable in respect of that share. Each shareholder is liable to pay the amount of each call in the manner, at the time and at the place specified by the Board (subject to receiving at least 14 days’ notice specifying the time and place for payment). A call is considered to have been made at the time when the resolution of the Board authorising the call was passed.
7.5.10 Borrowing powersSubject to relevant law, the Directors may exercise all powers of BHP Billiton to borrow money, and to mortgage or charge its undertaking, property, assets (both present and future) and all uncalled capital or any part or parts thereof and to issue debentures and other securities, whether outright or as collateral security for any debt, liability or obligation of BHP Billiton or of any third party.
7.5.11 Changes to rights of shareholdersRights attached to any class of shares issued by either BHP Billiton Limited or BHP Billiton Plc can only be varied (whether as a Joint Electorate Action or a Class Rights Action) where such variation is approved by:• the company that issued the relevant shares, as
a special resolution; and• the holders of the issued shares of the affected class, either
by a special resolution passed at a separate meeting of the holders of the issued shares of the class affected, or with the written consent of members with at least 75 per cent of the votes of that class.
7.5.12 Conditions governing general meetingsThe Board may, and must on requisition in accordance with applicable laws, call a general meeting of the shareholders at the time and place or places and in the manner determined by the Board. No shareholder may convene a general meeting of BHP Billiton except where entitled under law to do so. Any Director may convene a general meeting whenever the Director thinks fit. General meetings can also be cancelled, postponed or adjourned, where permitted by law or the Constitution or Articles of Association. Notice of a general meeting must be given to each shareholder entitled to vote at the meeting and such notice of meeting must be given in the form and manner in which the Board thinks fit. Five shareholders of the relevant company present in person or by proxy constitute a quorum for a meeting. A shareholder who is entitled to attend and cast a vote at a general meeting of BHP Billiton may appoint a person as a proxy to attend and vote for the shareholder in accordance with applicable law. All provisions relating to general meetings apply with any necessary modifications to any special meeting of any class of shareholders that may be held.
7.5.13 Limitations of rights to own securitiesThere are no limitations under the Constitution or the Articles of Association restricting the right to own BHP Billiton shares other than restrictions that reflect the takeovers codes under relevant Australian and English law. In addition, the Australian Foreign Acquisitions and Takeovers Act 1975 imposes a number of conditions that restrict foreign ownership of Australian-based companies.
Share control limits imposed by the Constitution and the Articles of Association, as well as relevant laws, are described in sections 7.11.3 and 7.3.2.
7.5.14 Documents on displayDocuments filed by BHP Billiton Limited on the Australian Securities Exchange (ASX) are available at www.asx.com.au and documents filed on the London Stock Exchange (LSE) by BHP Billiton Plc are available at www.morningstar.co.uk/uk/NSM. Documents filed on the ASX, or on the LSE are not incorporated by reference into this Annual Report. The documents referred to in this Annual Report as being available on our website, www.bhpbilliton.com, are not incorporated by reference and do not form part of this Annual Report.
BHP Billiton Limited and BHP Billiton Plc both file Annual Reports and other reports and information with the US Securities and Exchange Commission (SEC). These filings are available on the SEC website at www.sec.gov. You may also read and copy any document that either BHP Billiton Limited or BHP Billiton Plc files at the SEC’s public reference room located at 100 F Street, NE, Washington, DC 20549. Please call the SEC at 1-800-SEC-0330 or access the SEC website at www.sec.gov for further information on the public reference room.
7Shareholder inform
ation5 Financial Statem
ents6 A
dditional information

282 BHP Billiton Annual Report 2016
7 Shareholder information continued
7.6 Share ownershipShare capitalThe details of the share capital for both BHP Billiton Limited and BHP Billiton Plc are presented in note 15 ‘Share capital’ to the Financial Statements and remain current as at 12 August 2016.
Major shareholdersThe tables in section 3.4.23 and the information set out in section 4.18 present information pertaining to the shares in BHP Billiton Limited and BHP Billiton Plc held by Directors and members of the Operations Management Committee (OMC).
Neither BHP Billiton Limited nor BHP Billiton Plc is directly or indirectly controlled by another corporation or by any government. Other than as described in section 7.3.2, no major shareholder possesses voting rights that differ from those attaching to all of BHP Billiton Limited and BHP Billiton Plc’s voting securities.
Substantial shareholders in BHP Billiton Limited As at 12 August 2016, there were no substantial shareholders in BHP Billiton Limited. A substantial shareholder is a person who (together with associates) has a relevant interest in five per cent or more of voting rights conferred by ordinary shares in BHP Billiton Limited. Notifications to BHP Billiton Limited under section 671B of the Corporations Act 2001 indicate that no person (together with their associates) beneficially owned more than five per cent of BHP Billiton Limited’s voting securities.
Substantial shareholders in BHP Billiton PlcThe following table shows holdings of three per cent or more of voting rights conferred by BHP Billiton Plc’s ordinary shares as notified to BHP Billiton Plc under the UK Disclosure and Transparency Rule 5 as at 30 June 2016.(1)
Title of classIdentity of person or group
Date of last notice Percentage of total voting rights (2)
Date received Date of change Number owned 2016 2015 2014
Ordinary shares Aberdeen Asset Managers Limited 8 October 2015 7 October 2015 103,108,283 4.88% 6.06% 6.34%
Ordinary shares BlackRock, Inc. 3 December 2009 1 December 2009 213,014,043 10.08% 10.08% 10.08%
(1) No changes in the holdings of three per cent or more of the voting rights in BHP Billiton Plc’s shares have been notified to BHP Billiton Plc between 1 July 2016 and 12 August 2016.
(2) The percentages quoted are based on the total voting rights conferred by ordinary shares in BHP Billiton Plc as at 12 August 2016 of 2,112,071,796.
Twenty largest shareholders as at 12 August 2016 (as named on the Register of Shareholders) (1)
BHP Billiton Limited Number of fully
paid shares% of issued
capital
1. HSBC Australia Nominees P/L 639,750,740 19.922. JP Morgan Nominees Australia Limited 454,398,834 14.153. National Nominees Ltd 206,630,417 6.434. Citicorp Nominees Pty Ltd 181,277,380 5.645. Citicorp Nominees Pty Limited <Citibank NY ADR DEP A/C> 169,453,030 5.286. BNP Paribas NOMS Pty Ltd 66,041,956 2.067. Citicorp Nominees Pty Limited <Colonial First State Inv A/C> 30,939,540 0.968. BNP Paribas Nominees Pty Ltd <Agency Lending DRP A/C> 23,964,819 0.759. Aust Mutual Prov Society 16,542,870 0.5210. HSBC Custody Nominees (Australia) Limited <NT- Comnwlth Super Corp A/C> 15,084,727 0.4711. Australian Foundation Invest 13,990,941 0.4412. Computershare Nominees Cl Ltd <ASX Shareplus Control A/C> 12,262,311 0.3813. Argo Investments Limited 8,428,904 0.2614. HSBC Custody Nominees (Australia) Limited <Euroclear Bank SA NV A/C> 7,168,329 0.2215. RBC Investor Services Australia Nominees Pty Limited <BKCUST A/C> 5,881,948 0.1816. Navigator Australia Ltd <MLC Investment Sett A/C> 5,166,136 0.1617. Computershare Trustees Jey Ltd <RE 3000101 A/C> 4,380,484 0.1418. RBC Investor Services Australia Nominees Pty Limited <BKCUST A/C> 4,353,968 0.1419. IOOF Investment Management Limited <IPS Super A/C> 3,975,063 0.1220. Bond Street Custodians Limited 3,846,360 0.12
1,873,538,757 58.33
BHP Billiton PlcNumber of fully
paid shares% of issued
capital
1. PLC Nominees (Proprietary) Limited (2) 331,280,556 15.692. Chase Nominees Limited 140,840,217 6.673. National City Nominees Limited 106,698,037 5.054. State Street Nominees Limited <OM02> 101,159,454 4.795. Nortrust Nominees Limited 51,486,322 2.446. State Street Nominees Limited <OM04> 50,832,288 2.417. Lynchwood Nominees Limited <2006420> 49,136,235 2.338. The Bank of New York (Nominees) Limited 47,994,299 2.279. State Street Nominees Limited <OD64> 45,798,401 2.1710. Government Employees Pension Fund – PIC 40,961,160 1.9411. Vidacos Nominees Limited <13559> 39,864,705 1.8912. Vidacos Nominees Limited <CLRLUX2> 34,543,044 1.6413. Industrial Development Corporation of South Africa 33,804,582 1.6014. HSBC Global Custody Nominee (UK) Limited <357206> 32,425,250 1.5415. BNY Mellon Nominees Limited <BSDTGUSD> 25,860,615 1.2216. Nutraco Nominees Limited <492762> 25,165,035 1.1917. Nutraco Nominees Limited <781221> 24,200,000 1.1518. Chase Nominees Limited <BBHLEND> 23,374,720 1.1119. Vidacos Nominees Limited <CLRLUX> 23,369,058 1.1120. Vidacos Nominees Limited <FGN> 22,289,497 1.06
1,251,083,475 59.27
(1) Many of the 20 largest shareholders shown for BHP Billiton Limited and BHP Billiton Plc hold shares as a nominee or custodian. In accordance with the reporting requirements, the tables reflect the legal ownership of shares and not the details of the underlying beneficial holders.
(2) The largest holder on the South African register of BHP Billiton Plc is the Strate nominee in which the majority of shares in South Africa (including some of the shareholders included in this list) are held in dematerialised form.

BHP Billiton Annual Report 2016 283
US share ownership as at 12 August 2016BHP Billiton Limited BHP Billiton Plc
Number of Shareholders %
Number of shares %
Number of Shareholders %
Number of shares %
Classification of holderRegistered holders of voting securities 1,680 0.28 4,490,384 0.14 75 0.33 128,052 0.01ADR holders 1,340 0.22 168,822,634 (1) 5.26 236 1.02 106,698,036 (2) 5.05
(1) These shares translate to 84,411,317 ADRs.(2) These shares translate to 53,349,018 ADRs.
Geographical distribution of shareholders and shareholdings as at 12 August 2016BHP Billiton Limited BHP Billiton Plc
Number of Shareholders %
Number of shares %
Number of Shareholders %
Number of shares %
Registered addressAustralia 577,079 96.63 3,142,333,123 97.84 1,750 7.59 2,630,806 0.12New Zealand 11,496 1.93 29,603,367 0.92 36 0.16 113,581 0.01United Kingdom 2,879 0.48 8,210,289 0.26 17,259 74.89 1,754,887,719 83.09United States 1,680 0.28 4,490,384 0.14 75 0.33 128,052 0.01South Africa 139 0.02 270,211 0.01 2,350 10.19 350,492,591 16.59Other 3,942 0.66 26,783,731 0.83 1,577 6.84 3,819,047 0.18
Total 597,215 100.00 3,211,691,105 100.00 23,047 100.00 2,112,071,796 100.00
Distribution of shareholdings by size as at 12 August 2016BHP Billiton Limited BHP Billiton Plc
Number of Shareholders %
Number ofshares (1) %
Number of Shareholders %
Number ofshares (1) %
Size of holding1 – 500(2) 255,346 42.76 58,203,279 1.81 12,007 52.10 2,827,728 0.13501 – 1,000 117,364 19.65 90,815,229 2.83 4,904 21.28 3,623,681 0.171,001 – 5,000 175,471 29.38 395,434,291 12.31 4,298 18.65 8,545,527 0.405,001 – 10,000 28,815 4.82 204,112,248 6.36 428 1.86 3,032,567 0.1410,001 – 25,000 15,179 2.54 228,801,166 7.12 359 1.56 5,726,000 0.2725,001 – 50,000 3,290 0.55 112,610,426 3.51 171 0.74 6,280,968 0.3050,001 – 100,000 1,152 0.19 78,795,807 2.45 186 0.81 13,589,563 0.64100,001 – 250,000 442 0.07 63,747,093 1.98 230 1.00 36,884,244 1.75250,001 – 500,000 78 0.01 26,237,267 0.82 140 0.60 49,780,948 2.36500,001 – 1,000,000 25 0.00 17,917,754 0.56 116 0.50 82,710,384 3.921,000,001 and over 53 0.01 1,935,016,545 60.25 208 0.90 1,899,070,186 89.92
Total 597,215 100.00 3,211,691,105 100.00 23,047 100.00 2,112,071,796 100.00
(1) One ordinary share entitles the holder to one vote.(2) The number of BHP Billiton Limited shareholders holding less than a marketable parcel (A$500) based on the market price of A$20.68 as at 12 August 2016
was 13,494.
BHP Billiton Limited BHP Billiton Plc
Number of Shareholders %
Number of shares %
Number of Shareholders %
Number of shares %
Classification of holderCorporate 166,933 27.95 2,213,775,272 68.93 11,908 51.67 2,099,243,742 99.39Private 430,282 72.05 997,915,833 31.07 11,139 48.33 12,828,054 0.61
Total 597,215 100.00 3,211,691,105 100.00 23,047 100.00 2,112,071,796 100.00
7Shareholder inform
ation5 Financial Statem
ents6 A
dditional information
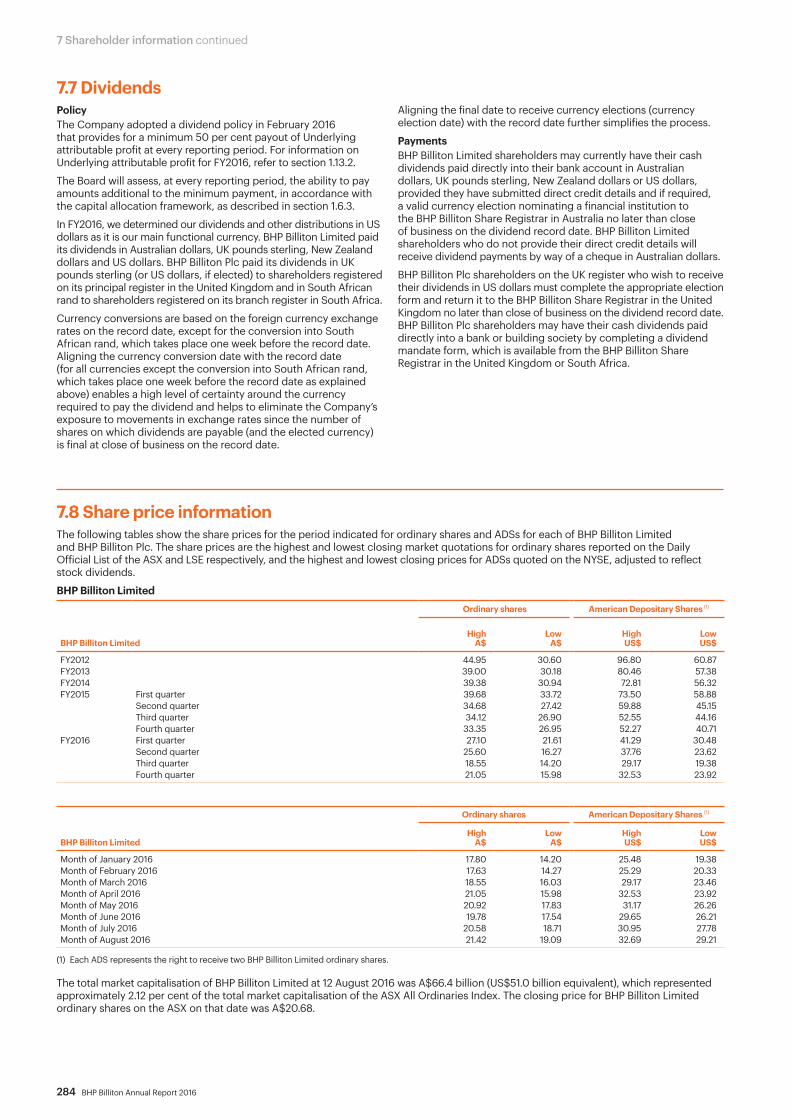
284 BHP Billiton Annual Report 2016
7 Shareholder information continued
7.7 DividendsPolicyThe Company adopted a dividend policy in February 2016 that provides for a minimum 50 per cent payout of Underlying attributable profit at every reporting period. For information on Underlying attributable profit for FY2016, refer to section 1.13.2.
The Board will assess, at every reporting period, the ability to pay amounts additional to the minimum payment, in accordance with the capital allocation framework, as described in section 1.6.3.
In FY2016, we determined our dividends and other distributions in US dollars as it is our main functional currency. BHP Billiton Limited paid its dividends in Australian dollars, UK pounds sterling, New Zealand dollars and US dollars. BHP Billiton Plc paid its dividends in UK pounds sterling (or US dollars, if elected) to shareholders registered on its principal register in the United Kingdom and in South African rand to shareholders registered on its branch register in South Africa.
Currency conversions are based on the foreign currency exchange rates on the record date, except for the conversion into South African rand, which takes place one week before the record date. Aligning the currency conversion date with the record date (for all currencies except the conversion into South African rand, which takes place one week before the record date as explained above) enables a high level of certainty around the currency required to pay the dividend and helps to eliminate the Company’s exposure to movements in exchange rates since the number of shares on which dividends are payable (and the elected currency) is final at close of business on the record date.
Aligning the final date to receive currency elections (currency election date) with the record date further simplifies the process.
PaymentsBHP Billiton Limited shareholders may currently have their cash dividends paid directly into their bank account in Australian dollars, UK pounds sterling, New Zealand dollars or US dollars, provided they have submitted direct credit details and if required, a valid currency election nominating a financial institution to the BHP Billiton Share Registrar in Australia no later than close of business on the dividend record date. BHP Billiton Limited shareholders who do not provide their direct credit details will receive dividend payments by way of a cheque in Australian dollars.
BHP Billiton Plc shareholders on the UK register who wish to receive their dividends in US dollars must complete the appropriate election form and return it to the BHP Billiton Share Registrar in the United Kingdom no later than close of business on the dividend record date. BHP Billiton Plc shareholders may have their cash dividends paid directly into a bank or building society by completing a dividend mandate form, which is available from the BHP Billiton Share Registrar in the United Kingdom or South Africa.
7.8 Share price informationThe following tables show the share prices for the period indicated for ordinary shares and ADSs for each of BHP Billiton Limited and BHP Billiton Plc. The share prices are the highest and lowest closing market quotations for ordinary shares reported on the Daily Official List of the ASX and LSE respectively, and the highest and lowest closing prices for ADSs quoted on the NYSE, adjusted to reflect stock dividends.
BHP Billiton Limited
BHP Billiton Limited
Ordinary shares American Depositary Shares (1)
HighA$
LowA$
HighUS$
LowUS$
FY2012 44.95 30.60 96.80 60.87FY2013 39.00 30.18 80.46 57.38FY2014 39.38 30.94 72.81 56.32FY2015 First quarter 39.68 33.72 73.50 58.88
Second quarter 34.68 27.42 59.88 45.15Third quarter 34.12 26.90 52.55 44.16Fourth quarter 33.35 26.95 52.27 40.71
FY2016 First quarter 27.10 21.61 41.29 30.48Second quarter 25.60 16.27 37.76 23.62Third quarter 18.55 14.20 29.17 19.38Fourth quarter 21.05 15.98 32.53 23.92
BHP Billiton Limited
Ordinary shares American Depositary Shares (1)
HighA$
LowA$
HighUS$
LowUS$
Month of January 2016 17.80 14.20 25.48 19.38Month of February 2016 17.63 14.27 25.29 20.33Month of March 2016 18.55 16.03 29.17 23.46Month of April 2016 21.05 15.98 32.53 23.92Month of May 2016 20.92 17.83 31.17 26.26Month of June 2016 19.78 17.54 29.65 26.21Month of July 2016 20.58 18.71 30.95 27.78Month of August 2016 21.42 19.09 32.69 29.21
(1) Each ADS represents the right to receive two BHP Billiton Limited ordinary shares.
The total market capitalisation of BHP Billiton Limited at 12 August 2016 was A$66.4 billion (US$51.0 billion equivalent), which represented approximately 2.12 per cent of the total market capitalisation of the ASX All Ordinaries Index. The closing price for BHP Billiton Limited ordinary shares on the ASX on that date was A$20.68.

BHP Billiton Annual Report 2016 285
BHP Billiton Plc
BHP Billiton Plc
Ordinary shares American Depositary Shares (1)
HighUK pence
LowUK pence
HighUS$
LowUS$
FY2012 2,521.50 1,667.00 80.69 51.30FY2013 2,236.00 1,673.00 72.07 51.27FY2014 1,995.00 1,666.50 66.73 62.35FY2015 First quarter 2,096.00 1,715.00 71.02 55.53
Second quarter 1,690.50 1,276.00 54.84 39.88Third quarter 1,643.50 1,285.00 51.13 39.66Fourth quarter 1,610.50 1,249.00 49.27 39.56
FY2016 First quarter 1,272.50 964.10 39.87 29.44Second quarter 1,194.50 669.30 36.44 20.72Third quarter 897.80 580.90 25.80 17.07Fourth quarter 997.00 727.50 29.13 20.68
BHP Billiton Plc
Ordinary shares American Depositary Shares (1)
HighUK pence
LowUK pence
HighUS$
LowUS$
Month of January 2016 746.00 580.90 22.25 17.07Month of February 2016 795.00 632.40 22.55 18.27Month of March 2016 897.80 740.40 25.80 20.81Month of April 2016 997.00 727.50 29.13 20.68Month of May 2016 933.10 793.30 27.56 23.17Month of June 2016 942.80 789.70 26.46 22.71Month of July 2016 1,003.50 921.10 26.82 24.18Month of August 2016 1,080.00 937.40 28.37 25.30
(1) Each ADS represents the right to receive two BHP Billiton Plc ordinary shares.
The total market capitalisation of BHP Billiton Plc at 12 August 2016 was £21.97 billion (US$28.41 billion equivalent), which represented approximately 0.99 per cent of the total market capitalisation of the FTSE All-Share Index. The closing price for BHP Billiton Plc ordinary shares on the LSE on that date was £10.40.
7.9 American Depositary Receipts fees and charges We have American Depositary Receipts (ADR) programs for BHP Billiton Limited and BHP Billiton Plc.
Depositary feesCitibank serves as the depositary bank for both of our ADR programs. ADR holders agree to the terms in the deposit agreement filed with the SEC for depositing ADSs or surrendering the ADSs for cancellation and for certain services as provided by Citibank. Holders are required to pay all fees for general depositary services provided by Citibank in each of our ADR programs, as set forth in the tables below.
Standard depositary fees:
Depositary service Fee payable by the ADR holders
Issuance of ADSs upon deposit of shares
Up to US$5.00 per 100 ADSs (or fraction thereof) issued
Delivery of Deposited Securities against surrender of ADSs
Up to US$5.00 per 100 ADSs (or fraction thereof) surrendered
Distribution of Cash Distributions No fee
Corporate actions depositary fees:
Depositary service Fee payable by the ADR holders
Cash Distributions (i.e. sale of rights, other entitlements, return of capital)
Up to US$2.00 per 100 ADSs (or fraction thereof) held
Distribution of ADSs pursuant to exercise of rights to purchase additional ADSs. Excludes stock dividends and stock splits
Up to US$5.00 per 100 ADSs (or fraction thereof) held
Distribution of securities other than ADSs or rights to purchase additional ADSs (i.e. spin-off shares)
Up to US$5.00 per 100 ADSs (or fraction thereof) held
Distribution of ADSs pursuant to an ADR ratio change in which shares are not distributed No fee
Fees payable by the Depositary to the IssuerCitibank has provided BHP Billiton net reimbursement of US$2.1 million in FY2016 for ADR program-related expenses for both of BHP Billiton’s ADR programs (FY2015 US$1.7 million). ADR program-related expenses include legal and accounting fees, listing fees, expenses related to investor relations in the United States, fees payable to service providers for the distribution of material to ADR holders, expenses of Citibank as administrator of the ADS Direct Plan and expenses to remain in compliance with applicable laws.
Citibank has further agreed to waive other ADR program-related expenses for FY2016, amounting to less than US$0.03 million, which are associated with the administration of the ADR programs (FY2015 less than US$0.03 million).
Our ADR programs trade on the NYSE under the stock tickers BHP and BBL for the BHP Billiton Limited and BHP Billiton Plc programs, respectively. As of 12 August 2016, there were 84,411,317 ADRs on issue and outstanding in the BHP Billiton Limited ADR program and 53,349,018 ADRs on issue and outstanding in the BHP Billiton Plc ADR program. Both of the ADR programs have a 2:1 ordinary shares to ADR ratio.
7Shareholder inform
ation5 Financial Statem
ents6 A
dditional information
286 BHP Billiton Annual Report 2016
7 Shareholder information continued
7.10 TaxationThe taxation discussion below describes the material Australian, UK and US federal income tax consequences to a US holder of owning BHP Billiton Limited ordinary shares or ADSs or BHP Billiton Plc ordinary shares or ADSs. The discussion below also outlines the potential South African tax issues for US holders of BHP Billiton Plc shares that are listed on the JSE.
The following discussion is not relevant to non-US holders of BHP Billiton Limited ordinary shares or ADSs or BHP Billiton Plc ordinary shares or ADSs. By its nature, the commentary below is of a general nature and we recommend that holders of ordinary shares or ADSs consult their own tax advisers regarding the Australian, UK, South African and US federal, state and local tax and other tax consequences of owning and disposing of ordinary shares and ADSs in their particular circumstances.
For purposes of this commentary, a US holder is a beneficial owner of ordinary shares or ADSs who is, for US federal income tax purposes: • a citizen or resident alien of the US;• a corporation (or other entity treated as a corporation for
US federal income tax purposes) that is created or organised under the laws of the US or any political subdivision thereof;
• an estate, the income of which is subject to US federal income taxation regardless of its source; or
• a trust:(a) if a court within the US is able to exercise primary supervision
over its administration and one or more US persons have the authority to control all of its substantial decisions; or
(b) that has made a valid election to be treated as a US person for tax purposes.
This discussion of material tax consequences for US holders is based on the Australian, UK, US and South African laws currently in effect, the published practice of tax authorities in those jurisdictions and the double taxation treaties and conventions currently in existence. These laws are subject to change, possibly on a retroactive basis.
US holders in BHP Billiton Limited(a) Australian taxationDividendsDividends (including other distributions treated as dividends for Australian tax purposes) paid by BHP Billiton Limited to a US holder that is not an Australian resident for Australian tax purposes will generally not be subject to Australian withholding tax if they are fully franked (broadly, where a dividend is franked, tax paid by BHP Billiton Limited is imputed to the shareholders).
Dividends paid to such US holders, which are not fully franked, will generally be subject to Australian withholding tax not exceeding 15 per cent only to the extent (if any) that the dividend is neither:• franked; nor• declared by BHP Billiton Limited to be conduit foreign income.
(Broadly, this means that the relevant part of the dividend is declared to have been paid out of foreign source amounts received by BHP Billiton Limited that are not subject to tax in Australia, such as dividends remitted to Australia by foreign subsidiaries).
The Australian withholding tax outcome described above applies to US holders who are eligible for benefits under the Tax Convention between Australia and the US as to the Avoidance of Double Taxation (the Australian Tax Treaty). Otherwise, the rate of Australian withholding tax may be 30 per cent.
In contrast, dividends (including other distributions treated as dividends for Australian tax purposes) paid by BHP Billiton Limited to a US holder may instead be taxed by assessment in Australia if the US holder:• is an Australian resident for Australian tax purposes (although the
tax will generally not exceed 15 per cent where the US holder is eligible for benefits under the Australian Tax Treaty as a treaty resident of the US and any franking credits may be creditable against their Australian income tax liability); or
• carries on business through a permanent establishment in Australia and the dividend is effectively connected with that permanent establishment (in which case any franking credits may be creditable against their Australian income tax liability); or
• performs independent personal services from a ‘fixed base’ situated in Australia and the dividend is effectively connected with that ‘fixed base’.
Sale of ordinary shares and ADSsGains made by US holders on the sale of ordinary shares or ADSs will generally not be taxed in Australia.
However, the precise Australian tax treatment of gains made by US holders on the sale of ordinary shares or ADSs generally depends on whether or not the gain is an Australian sourced gain of an income nature for Australian income tax purposes.
Where the gain is Australian sourced and of an income nature, a US holder will generally only be liable to Australian income tax on an assessment basis (whether or not they are also an Australian resident for Australian tax purposes) if:• they are not eligible for benefits under the Australian Tax Treaty; or • they are eligible for benefits under the Australian Tax Treaty but
the gain constitutes any of the following: − business profits of an enterprise attributable to a permanent establishment situated in Australia through which the enterprise carries on business in Australia; or
− income or gains from the alienation of property that form part of the business property of a permanent establishment of an enterprise that the US holder has in Australia, or pertain to a fixed base available to the US holder in Australia for the purpose of performing independent personal services; or
− income derived from the disposition of shares in a company, the assets of which consist wholly or principally of real property (which includes rights to exploit or to explore for natural resources) situated in Australia, whether such assets are held directly or indirectly through one or more interposed entities.
Where the gain is either not Australian sourced or is not of an income nature, the US holder will generally only be liable to Australian capital gains tax on an assessment basis if they acquired (or are deemed to have acquired) their shares or ADSs after 19 September 1985 and one or more of the following applies:• the US holder is an Australian resident for Australian tax
purposes; or • the ordinary shares or ADSs have been used by the US holder
in carrying on a business through a permanent establishment in Australia; or
• the US holder (either alone or together with associates) directly or indirectly owns or owned 10 per cent or more of the issued share capital of BHP Billiton Limited at the time of the disposal or throughout a 12-month period during the two years prior to the time of disposal and, at the time of the disposal, the sum of the market values of BHP Billiton Limited’s assets that are taxable Australian real property (held directly or through interposed entities) exceeds the sum of the market values of BHP Billiton Limited’s assets (held directly or through interposed entities) that are not taxable Australian real property at that time (which, for these purposes currently includes mining, quarrying or prospecting rights in respect of minerals, petroleum or quarry materials situated in Australia – and may be extended to associated information and goodwill); or
• the US holder is an individual who is not eligible for benefits under the Australian Tax Treaty as a treaty resident of the US and elected on becoming a non-resident of Australia to continue to have the ordinary shares or ADSs subject to Australian capital gains tax.
In certain circumstances, the purchaser may be required to withhold under the new non-resident CGT withholding regime an amount equal to 10 per cent of the purchase price if the acquisition is undertaken by way of an off-market transfer. Affected US holders should seek their own advice in relation to how this new withholding regime may apply to them.
BHP Billiton Annual Report 2016 287
The comments above on the sale of ordinary shares and ADSs do not apply:• to temporary residents of Australia who should seek advice
that is specific to their circumstances; • if the Investment Management Regime (IMR) applies to the US
holder, which exempts from Australian income tax and capital gains tax gains made on disposals by certain categories of non-resident funds – called IMR entities – of (relevantly) portfolio interests in Australian public companies (subject to a number of conditions). The IMR exemptions broadly apply to widely held IMR entities in relation to their direct investments and indirect investments made through an independent Australian fund manager. The exemptions apply to gains made by IMR entities that are treated as companies for Australian tax purposes as well as gains made by non-resident investors in IMR entities that are treated as trusts and partnerships for Australian tax purposes. The IMR exemptions will apply for the 2015-16 income year and later income years (but an entity may choose for the provisions to apply to certain earlier income years).
Stamp duty, gift, estate and inheritance taxAustralia does not impose any stamp duty, gift, estate or inheritance taxes in relation to transfers or gifts of shares or ADSs or upon the death of a shareholder.
(b) US taxationThis section describes the material US federal income tax consequences to a US holder of owning ordinary shares or ADSs. It applies only to ordinary shares or ADSs that are held as capital assets for tax purposes. This section does not apply to a holder of ordinary shares or ADSs that is a member of a special class of holders subject to special rules, including a dealer in securities, a trader in securities that elects to use a mark-to-market method of accounting for its securities holdings, a tax-exempt organisation, a life insurance company, a person liable for alternative minimum tax, a person who actually or constructively owns 10 per cent or more of the voting stock of BHP Billiton Limited, a person that holds ordinary shares or ADSs as part of a straddle or a hedging or conversion transaction, a person that purchases or sells ordinary shares or ADSs as part of a wash sale for tax purposes, or a person whose functional currency is not the US dollar.
If a partnership holds the ordinary shares or ADSs, the US federal income tax treatment of a partner generally will depend on the status of the partner and the tax treatment of the partnership. A partner in a partnership holding the ordinary shares or ADSs should consult its tax adviser with regard to the US federal income tax treatment of an investment in the ordinary shares or ADSs.
This section is in part based on the representations of the Depositary and the assumption that each obligation in the deposit agreement and any related agreement will be performed in accordance with its terms.
In general, for US federal income tax purposes, a holder of ADSs will be treated as the owner of the ordinary shares represented by those ADSs. Exchanges of ordinary shares for ADSs, and ADSs for ordinary shares, generally will not be subject to US federal income tax.
DividendsUnder US federal income tax laws and subject to the Passive Foreign Investment Company (PFIC) rules discussed below, a US holder must include in its gross income the amount of any dividend paid by BHP Billiton Limited out of its current or accumulated earnings and profits (as determined for US federal income tax purposes) plus any Australian tax withheld from the dividend payment even though the holder does not receive it. The dividend is taxable to the holder when the holder, in the case of ordinary shares, or the Depositary, in the case of ADSs, actually or constructively receives the dividend.
Dividends paid to a non-corporate US holder on shares or ADSs will be taxable at the preferential rates applicable to long-term capital gains provided the US holder holds the shares or ADSs for more than 60 days during the 121-day period beginning 60 days before the ex-dividend date and does not enter into certain risk reduction transactions with respect to the shares or ADSs during the abovementioned holding period. However, a non-corporate US holder that elects to treat the dividend income as ‘investment income’ pursuant to Section 163(d)(4) of the US Internal Revenue Code will not be eligible for such preferential rates. In the case of a corporate US holder, dividends on shares and ADSs are taxed as ordinary income and will not be eligible for the dividends received deduction generally allowed to US corporations in respect of dividends received from other US corporations.
Distributions in excess of current and accumulated earnings and profits, as determined for US federal income tax purposes, will be treated as a non-taxable return of capital to the extent of the holder’s tax basis, determined in US dollars, in the ordinary shares or ADSs and thereafter as a capital gain.
The amount of any cash distribution paid in any foreign currency will be equal to the US dollar value of such currency, calculated by reference to the spot rate in effect on the date such distribution is received by the US holder or, in the case of ADSs, by the Depositary, regardless of whether and when the foreign currency is in fact converted into US dollars. If the foreign currency is converted into US dollars on the date received, the US holder generally should not recognise foreign currency gain or loss on such conversion. If the foreign currency is not converted into US dollars on the date received, the US holder will have a basis in the foreign currency equal to its US dollar value on the date received, and generally will recognise foreign currency gain or loss on a subsequent conversion or other disposal of such currency. Such foreign currency gain or loss generally will be treated as US source ordinary income or loss for foreign tax credit limitation purposes.
Subject to certain limitations, Australian tax withheld in accordance with the Australian Treaty and paid over to Australia will be creditable against an individual’s US federal income tax liability. Special rules apply in determining the foreign tax credit limitation with respect to dividends that are taxed at the preferential rates applicable to long-term capital gains. To the extent a refund of the tax withheld is available to a US holder under Australian law or under the Australian Treaty, the amount of tax withheld that is refundable will not be eligible for credit against the holder’s US federal income tax liability. A US holder that does not elect to claim a US foreign tax credit may instead claim a deduction for Australian income tax withheld, but only for a taxable year in which the US holder elects to do so with respect to all foreign income taxes paid or accrued in such taxable year.
Dividends will be income from sources outside the US, and generally will be ‘passive category’ income or, for certain taxpayers, ‘general category’ income, which are treated separately from each other for the purpose of computing the foreign tax credit allowable to a US holder. In general, a taxpayer’s ability to use foreign tax credits may be limited and is dependent on the particular circumstances. US holders should consult their tax advisers with respect to these matters.
Sale of ordinary shares and ADSsSubject to the PFIC rules discussed below, a US holder who sells or otherwise disposes of ordinary shares or ADSs will recognise a capital gain or loss for US federal income tax purposes equal to the difference between the US dollar value of the amount realised and the holder’s tax basis, determined in US dollars, in those ordinary shares or ADSs. The gain or loss will generally be income or loss from sources within the US for foreign tax credit limitation purposes. The capital gain of a non-corporate US holder is generally taxed at preferential rates where the holder has a holding period greater than 12 months in the shares or ADSs sold. There are limitations on the deductibility of capital losses.
7Shareholder inform
ation5 Financial Statem
ents6 A
dditional information
288 BHP Billiton Annual Report 2016
7 Shareholder information continued
The US dollar value of any foreign currency received upon a sale or other disposition of ordinary shares or ADSs will be calculated by reference to the spot rate in effect on the date of sale or other disposal (or, in the case of a cash basis or electing accrual basis taxpayer, on the settlement date). A US holder will have a tax basis in the foreign currency received equal to that US dollar amount, and generally will recognise foreign currency gain or loss on a subsequent conversion or other disposal of the foreign currency. This foreign currency gain or loss generally will be treated as US source ordinary income or loss for foreign tax credit limitation purposes.
Passive Foreign Investment Company rulesWe do not believe that the BHP Billiton Limited ordinary shares or ADSs will be treated as stock of a PFIC for US federal income tax purposes, but this conclusion is a factual determination that is made annually at the end of the year and thus may be subject to change. If BHP Billiton Limited were treated as a PFIC, any gain realised on the sale or other disposition of ordinary shares or ADSs would in general not be treated as a capital gain. Instead, a US holder would be treated as if it had realised such gain and certain ‘excess distributions’ ratably over its holding period for the ordinary shares or ADSs and would be taxed at the highest tax rate in effect for each such year to which the gain was allocated, together with an interest charge in respect of the tax attributable to each such year. In addition, dividends received with respect to ordinary shares or ADSs would not be eligible for the special tax rates applicable to qualified dividend income if BHP Billiton Limited were a PFIC either in the taxable year of the distribution or the preceding taxable year, but instead would be taxable at rates applicable to ordinary income. Assuming the shares or ADSs are ‘marketable stock’, a US holder may mitigate the adverse tax consequences described above by electing to be taxed annually on a mark-to-market basis with respect to such shares or ADSs.
US holders in BHP Billiton Plc(a) UK taxationDividendsUnder UK law, no UK tax is required to be withheld at source from dividends paid on ordinary shares or ADSs.
Sale of ordinary shares and ADSsUS holders will not be liable for UK tax on capital gains realised on disposal of ordinary shares or ADSs unless:• they are resident in the UK; or• they carry on a trade, profession or vocation in the UK through
a branch or agency for the year in which the disposal occurs and the shares or ADSs have been used, held or acquired for the purposes of such trade (or profession or vocation), branch or agency. In the case of a trade, the term ‘branch’ includes a permanent establishment.
An individual who ceases to be a resident in the UK for tax purposes while owning shares or ADSs and then disposes of those shares or ADSs while not a UK resident may become subject to UK tax on capital gains if he/she:• had sole UK residence in the UK tax year preceding his/her
departure from the UK;• had sole UK residence at any time during at least four of the
seven UK tax years preceding his/her year of departure from the UK; and
• subsequently becomes treated as having sole UK residence again before five complete UK tax years of non-UK residence have elapsed from the date he/she left the UK.
In this situation US holders will generally be entitled to claim US tax paid on such a disposition as a credit against any corresponding UK tax payable.
UK inheritance taxUnder the current UK–US Inheritance and Gift Tax Treaty, ordinary shares or ADSs held by a US holder who is domiciled for the purposes of the UK–US Inheritance and Gift Tax Treaty in the US, and is not for the purposes of the UK–US Inheritance and Gift Tax Treaty a national of the UK, will generally not be subject to UK inheritance tax on the individual’s death or on a chargeable gift of the ordinary shares or ADSs during the individual’s lifetime, provided that any applicable US federal gift or estate tax liability is paid, unless the ordinary shares or ADSs are part of the business property of a permanent establishment of the individual in the UK or, in the case of a shareholder who performs independent personal services, pertain to a fixed base situated in the UK. Where the ordinary shares or ADSs have been placed in trust by a settlor who, at the time of settlement, was a US resident shareholder, the ordinary shares or ADSs will generally not be subject to UK inheritance tax unless the settlor, at the time of settlement, was not domiciled in the US and was a UK national. In the exceptional case where the ordinary shares or ADSs are subject to both UK inheritance tax and US federal gift or estate tax, the UK–US Inheritance and Gift Tax Treaty generally provides for double taxation to be relieved by means of credit relief.
UK stamp duty and stamp duty reserve taxUnder applicable legislation, UK stamp duty or stamp duty reserve tax (SDRT) is, subject to certain exemptions, payable on any issue or transfer of shares to the Depositary or their nominee where those shares are for inclusion in the ADR program at a rate of 1.5 per cent of their price (if issued), the amount of any consideration provided (if transferred on sale) or their value (if transferred for no consideration). However, from 1 October 2009, this 1.5 per cent charge has generally ceased to apply to issues of shares into European Union (EU) depositary receipt systems and into EU clearance systems. Further, the First-tier Tribunal has held that the 1.5 per cent SDRT charge on a transfer of shares to an issuer of ADRs (as an integral part of a fresh capital raising) was incompatible with EU law. Her Majesty’s Revenue and Customs has confirmed that it will no longer seek to impose the 1.5 per cent SDRT charge on the issue of shares (or, where it is integral to the raising of new capital, the transfer of shares) to a depositary receipt issuer or a clearance service, wherever located. The law in this area may still be susceptible to change. We recommend advice should be sought in relation to paying the 1.5 per cent SDRT or stamp duty charge in any circumstances.
No SDRT would be payable on the transfer of an ADS. No UK stamp duty should be payable on the transfer of an ADS provided that the instrument of transfer is executed and remains at all times outside the UK. Transfers of ordinary shares to persons other than the Depositary or their nominee will give rise to stamp duty or SDRT at the time of transfer. The relevant rate is currently 0.5 per cent of the amount payable for the shares. The purchaser normally pays the stamp duty or SDRT.
Special rules apply to transactions involving intermediates and stock lending.
(b) US taxationThis section describes the material US federal income tax consequences to a US holder of owning ordinary shares or ADSs. It applies only to ordinary shares or ADSs that are held as capital assets for tax purposes. This section does not apply to a holder of ordinary shares or ADSs that is a member of a special class of holders subject to special rules, including a dealer in securities, a trader in securities who elects to use a mark-to-market method of accounting for its securities holdings, a tax-exempt organisation, a life insurance company, a person liable for alternative minimum tax, a person who actually or constructively owns 10 per cent or more of the voting stock of BHP Billiton Plc, a person that holds ordinary shares or ADSs as part of a straddle or a hedging or conversion transaction, a person that purchases or sells ordinary shares or ADSs as part of a wash sale for tax purposes, or a person whose functional currency is not the US dollar.
BHP Billiton Annual Report 2016 289
If a partnership holds the ordinary shares or ADSs, the US federal income tax treatment of a partner generally will depend on the status of the partner and the tax treatment of the partnership. A partner in a partnership holding the ordinary shares or ADSs should consult its tax adviser with regard to the US federal income tax treatment of an investment in the ordinary shares or ADSs.
This section is in part based on the representations of the Depositary and the assumption that each obligation in the deposit agreement and any related agreement will be performed in accordance with its terms.
In general, for US federal income tax purposes, a holder of ADSs will be treated as the owner of the ordinary shares represented by those ADSs. Exchanges of ordinary shares for ADSs, and ADSs for ordinary shares, generally will not be subject to US federal income tax.
DividendsUnder US federal income tax laws and subject to the PFIC rules discussed below, a US holder must include in its gross income the gross amount of any dividend paid by BHP Billiton Plc out of its current or accumulated earnings and profits (as determined for US federal income tax purposes). The dividend is taxable to the holder when the holder, in the case of ordinary shares, or the Depositary, in the case of ADSs, actually or constructively receives the dividend.
Dividends paid to a non-corporate US holder on shares or ADSs will be taxable at the preferential rates applicable to long-term capital gains provided that the US holder holds the shares or ADSs for more than 60 days during the 121-day period beginning 60 days before the ex-dividend date and does not enter into certain risk reduction transactions with respect to the shares or ADSs during the abovementioned holding period. However, a non-corporate US holder that elects to treat the dividend income as ‘investment income’ pursuant to Section 163(d)(4) of the US Internal Revenue Code will not be eligible for such preferential rates. In the case of a corporate US holder, dividends on shares and ADSs are taxed as ordinary income and will not be eligible for the dividends received deduction generally allowed to US corporations in respect of dividends received from other US corporations.
Distributions in excess of current and accumulated earnings and profits, as determined for US federal income tax purposes, will be treated as a non-taxable return of capital to the extent of the holder’s tax basis, determined in US dollars, in the ordinary shares or ADSs and thereafter as a capital gain.
The amount of any cash distribution paid in any foreign currency will be equal to the US dollar value of such currency, calculated by reference to the spot rate in effect on the date such distribution is received by the US holder or, in the case of ADSs, by the Depositary, regardless of whether and when the foreign currency is in fact converted into US dollars. If the foreign currency is converted into US dollars on the date received, the US holder generally should not recognise foreign currency gain or loss on such conversion. If the foreign currency is not converted into US dollars on the date received, the US holder will have a basis in the foreign currency equal to its US dollar value on the date received, and generally will recognise foreign currency gain or loss on a subsequent conversion or other disposal of such currency. Such foreign currency gain or loss generally will be treated as US source ordinary income or loss for foreign tax credit limitation purposes.
Dividends will be income from sources outside the US, and generally will be ‘passive category’ income or, for certain taxpayers, ‘general category’ income, which are treated separately from each other for the purpose of computing the foreign tax credit allowable to a US holder. In general, a taxpayer’s ability to use foreign tax credits may be limited and is dependent on the particular circumstances. US holders should consult their tax advisers with respect to these matters.
Sale of ordinary shares and ADSsSubject to the PFIC rules discussed below, a US holder who sells or otherwise disposes of ordinary shares or ADSs will recognise a capital gain or loss for US federal income tax purposes equal to the difference between the US dollar value of the amount realised and the holder’s tax basis, determined in US dollars, in those ordinary shares or ADSs. The gain or loss will generally be income or loss from sources within the US for foreign tax credit limitation purposes. The capital gain of a non-corporate US holder is generally taxed at preferential rates where the holder has a holding period greater than 12 months in the shares or ADSs sold. There are limitations on the deductibility of capital losses.
The US dollar value of any foreign currency received upon a sale or other disposition of ordinary shares or ADSs will be calculated by reference to the spot rate in effect on the date of sale or other disposal (or, in the case of a cash basis or electing accrual basis taxpayer, on the settlement date). A US holder will have a tax basis in the foreign currency received equal to that US dollar amount, and generally will recognise foreign currency gain or loss on a subsequent conversion or other disposal of the foreign currency. This foreign currency gain or loss generally will be treated as US source ordinary income or loss for foreign tax credit limitation purposes.
Passive Foreign Investment Company rulesWe do not believe that the BHP Billiton Plc ordinary shares or ADSs will be treated as stock of a PFIC for US federal income tax purposes, but this conclusion is a factual determination that is made annually at the end of the year and thus may be subject to change. If BHP Billiton Plc were treated as a PFIC, any gain realised on the sale or other disposition of ordinary shares or ADSs would in general not be treated as a capital gain. Instead, a US holder would be treated as if it had realised such gain and certain ‘excess distributions’ ratably over its holding period for the ordinary shares or ADSs and would be taxed at the highest tax rate in effect for each such year to which the gain was allocated, together with an interest charge in respect of the tax attributable to each such year. In addition, dividends received with respect to ordinary shares or ADSs would not be eligible for the special tax rates applicable to qualified dividend income if BHP Billiton Plc were a PFIC either in the taxable year of the distribution or the preceding taxable year, but instead would be taxable at rates applicable to ordinary income. Assuming the shares or ADSs are ‘marketable stock’, a US holder may mitigate the adverse tax consequences described above by electing to be taxed annually on a mark-to-market basis with respect to such shares or ADSs.
(c) South African taxationDividendsSouth Africa imposes a 15 per cent withholding tax on dividends (South African Dividends Tax) paid in respect of shares in foreign companies if the shares are listed on a South African exchange.
Accordingly, it is possible that US holders of BHP Billiton Plc shares may be subject to South African Dividends Tax on any dividends received in respect of the BHP Billiton Plc shares listed on the JSE. The South African Dividends Tax would be withheld from the gross amount of the dividend paid to the shareholder, but the beneficial owner of the dividend is liable for the South African Dividends Tax on a cash dividend.
No South African Dividends Tax is required to be withheld from cash dividends provided the dividends are paid to, inter alia, South African tax resident corporate shareholders (including South African companies, pension, provident, retirement annuity and benefit funds). However, these dividends will only be exempt from South African Dividends Tax if these types of shareholders provide the requisite exemption declarations and undertakings to the regulated intermediaries making the cash dividend payments before they are paid.
7Shareholder inform
ation5 Financial Statem
ents6 A
dditional information

290 BHP Billiton Annual Report 2016
7 Shareholder information continued
South African tax resident shareholders who are natural persons (individuals) or trusts, other than closure rehabilitation trusts, do not qualify for an exemption from South African Dividends Tax. Shareholders that are not South African tax residents also do not qualify for an exemption from South African Dividends Tax. However, South Africa is a party to Double Taxation Agreements that may provide full or partial relief from South African Dividends Tax, if the requisite reduced rate declarations and undertakings are provided to the regulated intermediaries making the cash dividend payments before they are paid.
Except for certain exclusions, generally speaking such dividends paid to South African tax resident natural persons or trusts are exempt from South African income tax and, as such, the South African Dividends Tax may be considered as a final and non-creditable levy.
Sale of ordinary shares and ADSsA US holder who or which is tax resident in South Africa would be liable for income tax on any profit on disposal of BHP Billiton Plc shares or ADSs, or capital gains tax on any gain on disposal of BHP Billiton Plc shares or ADSs, depending on whether the BHP Billiton Plc shares and ADSs are held on revenue or capital account.
Income tax is payable on any profit on disposal of BHP Billiton Plc shares or ADSs held by a US holder who or which is tax resident in the US, where the profit is of a revenue nature and sourced in South Africa, unless relief is afforded under the Double Tax Agreement concluded between South Africa and the US. In such a case, the profit would only be taxed in South Africa if it is attributable to a permanent establishment of that US holder in South Africa.
Where the BHP Billiton Plc shares or ADSs are not held on revenue account, US holders will not be liable for South African tax on capital gains realised on the disposal of BHP Billiton Plc shares or ADSs unless:• such US holders are tax resident in South Africa; • 80 per cent or more of the market value of the BHP Billiton Plc
shares or ADSs is attributable (at the time of disposal of those BHP Billiton Plc shares or ADSs) directly or indirectly to immovable property situated in South Africa, held otherwise than as trading stock, and the US holder in question directly or indirectly holds 20 per cent of such BHP Billiton Plc shares or ADSs; or
• the US holder’s BHP Billiton Plc shares or ADSs form part of the business property of a permanent establishment which an enterprise of the US holder has in South Africa.
For a US holder who will recognise a capital gain or loss for South African income tax purposes on a disposal of BHP Billiton Plc shares or ADSs, such gain or loss will be equal to the difference between the Rand value of the amount realised and the holder’s tax basis, determined in Rand, in those BHP Billiton Plc shares or ADSs. The holder’s tax basis will generally be equal to the cost that was incurred to acquire the BHP Billiton Plc shares or ADSs, if such shares or ADSs were acquired after 1 October 2001. South African capital gains tax is levied at an effective rate of 22.4 per cent for companies, 16.4 per cent for individuals, and 32.8 per cent for trusts.
Securities Transfer TaxSouth African Securities Transfer Tax is levied at 0.25 per cent in respect of the transfer of shares in a foreign company that are listed on the JSE. Accordingly, a transfer of those BHP Billiton Plc shares listed on the JSE will be subject to this tax. The tax is levied on the amount of consideration at which the BHP Billiton Plc share is transferred or, where no amount/value is declared or if the amount so declared is less than the lowest price of the BHP Billiton Plc share, the closing price of the BHP Billiton Plc share. The tax is ultimately borne by the person to whom that BHP Billiton Plc share is transferred.
7.11 Government regulationsOur operations are subject to a broad range of laws and regulations imposed by governments and regulatory bodies. These regulations touch all aspects of our operations, including how we extract, process and explore for minerals, oil and natural gas and how we operate as a company, including regulations governing matters such as environmental protection, land rehabilitation, occupational health and safety, the rights and interests of Indigenous peoples, competition, foreign investment, export and taxes.
The ability to extract minerals, oil and natural gas is fundamental to BHP Billiton. In most jurisdictions, the rights to extract mineral or petroleum deposits are owned by the state. We obtain the right to access the land and extract the product by entering into licenses or leases with the government that owns the mineral, oil or natural gas deposit. The terms of the lease or licence, including the time period of the lease or licence, vary depending on the laws of the relevant government. Generally, we own the product we extract and we are required to pay royalties or similar taxes to the government.
In certain jurisdictions where we have operations, such as Trinidad and Tobago, a production sharing contract (PSC) governs the relationship between the government and companies concerning how much of the oil and gas extracted from the country each will receive. In PSCs, the government awards rights for the execution of exploration, development and production activities to the company. The company bears the financial risk of the initiative and explores, develops and ultimately produces the field as required. When successful, the company is permitted to use the money from a certain set percentage of produced oil and gas to recover its capital and operational expenditures, known as ‘cost oil’. The remaining production is known as ‘profit oil’ and is split between the government and the company at a rate determined by the government and set out in the PSC.
Related to our ability to extract is our ability to process the extracted minerals, oil or natural gas. Again, we rely on governments to grant the rights necessary to transport and treat the extracted material to prepare it for sale.
The rights to explore for minerals, oil and natural gas are granted to us by the government that owns the natural resources we wish to explore. Usually, the right to explore carries with it the obligation to spend a defined amount of money on the exploration, or to undertake particular exploration activities.
Although onshore oil and gas rights in the United States can be owned by the government (state and federal), they are primarily owned by private property owners, which is the case for our onshore oil and gas rights. Oil and gas rights primarily take the form of a lease, but can also be owned onshore outright in fee. If the rights granted are by lease, we are granted the right to access, explore, extract, produce and market the oil and gas for a specified period of time, but may be extended if we continue to produce oil or gas or operate on the leased land.
Environmental protection, land rehabilitation and occupational health and safety are principally regulated by governments and to a lesser degree, if applicable, by lease contracts with the landowners. These obligations often require us to make substantial expenditures to minimise or remediate the environmental impact of our operations and to ensure the safety of our employees and contractors.
For more information on these types of obligations, refer to sections 1.8.2 and 1.11.
From time to time, certain trade sanctions are adopted by the United Nations (UN) Security Council and/or various governments, including in the United Kingdom, the United States, the European Union (EU) and Australia against certain countries, entities or individuals, that may restrict our ability to sell extracted minerals, oil or natural gas and/or our ability to purchase goods or services.

BHP Billiton Annual Report 2016 291
7.11.1 Disclosure of Iran-related activities pursuant to section 13(r) of the U.S. Securities Exchange Act of 1934Section 219 of the Iran Threat Reduction and Syria Human Rights Act of 2012 added Section 13(r) to the U.S. Securities Exchange Act of 1934, as amended (the Exchange Act). Section 13(r) requires an issuer to disclose in its annual reports, whether it or any of its affiliates knowingly engaged in certain activities, transactions or dealings relating to Iran. Disclosure is required even where the activities, transactions or dealings are conducted outside the United States by non-U.S. persons in compliance with applicable law, and whether or not the activities are sanctionable under U.S. law. Provided in this section is certain information concerning activities of certain affiliates of BHP Billiton that took place in FY2016. BHP Billiton believes that these activities are not sanctionable and are within the scope of a specific license issued by the U.S. Department of the Treasury’s Office of Foreign Assets Control (OFAC). BHP Billiton is making this disclosure in the interests of transparency.
BHP Billiton Petroleum Great Britain Ltd (BHP Billiton GB), a wholly owned affiliate of BHP Billiton, holds a non-operating 16 per cent interest in the Bruce oil and gas field located offshore United Kingdom, together with co-venturers BP Exploration Operating Company Limited (BP) (operator and 37 per cent interest holder), Marubeni Oil & Gas (North Sea) Limited (3.75 per cent interest holder) and Total E&P UK Limited (43.25 per cent interest holder).
The Bruce platform provides transportation and processing services to the nearby Rhum gas field pursuant to a contract between the Bruce owners and Rhum owners (the Bruce-Rhum Agreement). According to BP, the Rhum field is operated by BP and owned under a 50:50 unincorporated joint arrangement between BP and Iranian Oil Company (U.K.) Limited (IOC). IOC is an indirect subsidiary of the National Iranian Oil Company (NIOC), which is a corporation owned by the Government of Iran. As a Bruce owner, BHP Billiton GB is party to the Bruce-Rhum Agreement, and BHP Billiton believes the activities thereunder are authorised by the U.S. Department of the Treasury under OFAC licence No. IA-2013-302799-4.
In FY2016, BHP Billiton GB has received income in the amount of US$3.5 million from BP and the UK government (in its capacity as temporary manager of IOC’s interest in the Rhum field pursuant to UK Regulations 3 and 5 of the Hydrocarbons (Temporary Management Scheme) Regulations 2013) in accordance with the terms of the Bruce-Rhum Agreement. This revenue is 0.05 per cent of Petroleum’s gross revenue. Our net profit generated under the Bruce-Rhum Agreement in FY2016 was insignificant.
BHP Billiton intends to continue the activities in connection with the Bruce-Rhum Agreement, provided such activities remain subject to a continuing OFAC licence or are otherwise authorised or in compliance with applicable sanctions.
7.11.2 Uranium production in AustraliaTo mine, process, transport and sell uranium from within Australia, we are required to hold possession and export permissions, which are also subject to regulation by the Australian Government or bodies that report to the Australian Government.
To possess nuclear material, such as uranium, in Australia, a Permit to Possess Nuclear Materials (Possession Permit) must be held pursuant to the Australian Nuclear Non-Proliferation (Safeguards) Act 1987 (Non-Proliferation Act). A Possession Permit is issued by the Australian Safeguards and Non-Proliferation Office, an office established under the Non-Proliferation Act, which administers Australia’s domestic nuclear safeguards requirements and reports to the Australian Government.
To export uranium from Australia, a Permit to Export Natural Uranium (Export Permit) must be held pursuant to the Australian Customs (Prohibited Exports) Regulations 1958. The Export Permit is issued by the Minister with responsibility for Resources and Energy.
A special permit to transport nuclear material is required under the Non-Proliferation Act by a party that transports nuclear material from one specified location to another specified location. As we engage service providers to transport uranium, each of those service providers is required to hold a permit to transport nuclear material issued by the Australian Safeguards and Non-Proliferation Office.
7.11.3 Exchange controls and shareholding limitsBHP Billiton Plc There are no laws or regulations currently in force in the United Kingdom that restrict the export or import of capital or the payment of dividends to non-resident holders of BHP Billiton Plc’s shares, although the Group does operate in some other jurisdictions where the payment of dividends could be affected by exchange control approvals.
From time to time, certain sanctions are adopted by the UN Security Council and/or various governments, including in the United Kingdom, the United States, the EU and Australia against certain countries, entities or individuals that may restrict the export or import of capital or the remittance of dividends to certain non-resident holders of BHP Billiton Plc’s shares.
There are no restrictions under BHP Billiton Plc’s Articles of Association or (subject to the effect of any sanctions) under English law that limit the right of non-resident or foreign owners to hold or vote BHP Billiton Plc’s shares.
There are certain restrictions on shareholding levels under BHP Billiton Plc’s Articles of Association described under the heading ‘BHP Billiton Limited’ below.
BHP Billiton LimitedUnder current Australian legislation, the payment of any dividends, interest or other payments by BHP Billiton Limited to non-resident holders of BHP Billiton Limited’s shares is not restricted by exchange controls or other limitations, except that, in certain circumstances, BHP Billiton may be required to withhold Australian taxes.
From time to time, certain sanctions are adopted by the UN Security Council and/or various governments including in the United Kingdom, the United States, the EU and Australia. Those sanctions prohibit or, in some cases, impose certain approval and reporting requirements on transactions involving sanctioned countries, entities and individuals and/or assets controlled or owned by them. Certain transfers into or out of Australia of amounts greater than A$10,000 in any currency may also be subject to reporting requirements.
The Australian Foreign Acquisitions and Takeovers Act 1975 (the FATA) restricts certain acquisitions of interests in shares in Australian companies, including BHP Billiton Limited. Generally, under the FATA, the prior approval of the Australian Treasurer must be obtained for proposals by a foreign person (either alone or together with its associates) to acquire 20 per cent or more of the voting power or issued shares in an Australian company (changed from the previous threshold of 15 per cent as a result of amendments to the FATA which came into effect on 1 December 2015). A lower approval threshold (generally 10 per cent) applies where the foreign person is a foreign government investor for the purposes of the FATA.
The FATA also empowers the Treasurer to make certain orders prohibiting acquisitions by foreign persons in Australian companies, including BHP Billiton Limited (and requiring divestiture if the acquisition has occurred) where he considers the acquisition to be contrary to the national interest. Such orders may also be made in respect of acquisitions by foreign persons where two or more foreign persons (and their associates) in aggregate already control 40 per cent or more of the issued shares or voting power in an Australian company, including BHP Billiton Limited.
7Shareholder inform
ation5 Financial Statem
ents6 A
dditional information

292 BHP Billiton Annual Report 2016
7 Shareholder information continued
7.11.3 Exchange controls and shareholding limits continuedThe restrictions in the FATA on share acquisitions in BHP Billiton Limited described above apply equally to share acquisitions in BHP Billiton Plc because BHP Billiton Limited and BHP Billiton Plc are dual listed entities.
There are certain other statutory restrictions and restrictions under BHP Billiton Limited’s Constitution and BHP Billiton Plc’s Articles of Association that apply generally to acquisitions of shares in BHP Billiton (i.e. the restrictions are not targeted at foreign persons only). These include restrictions on a person (and associates) breaching a voting power threshold of:• above 20 per cent in relation to BHP Billiton Limited on
a ‘stand-alone’ basis (i.e. calculated as if there were no Special Voting Share and only counting BHP Billiton Limited’s ordinary shares);
• 30 per cent of BHP Billiton Plc. This is the threshold for a mandatory offer under Rule 9 of the UK takeover code and this threshold applies to all voting rights of BHP Billiton Plc (therefore including voting rights attached to the BHP Billiton Plc Special Voting Share);
• 30 per cent in relation to BHP Billiton Plc on a ‘stand-alone’ basis (i.e. calculated as if there were no Special Voting Share and only counting BHP Billiton Plc’s ordinary shares);
• above 20 per cent in relation to the BHP Billiton Company, calculated having regard to all the voting power on a joint electorate basis (i.e. calculated on the aggregate of BHP Billiton Limited’s and BHP Billiton Plc’s ordinary shares).
Under BHP Billiton Limited’s Constitution and BHP Billiton Plc’s Articles of Association, sanctions for breach of any of these thresholds, other than by means of certain ‘permitted acquisitions’, include withholding of dividends, voting restrictions and compulsory divestment of shares to the extent a shareholder and its associates exceed the relevant threshold.
Except for the restrictions under the FATA, there are no limitations, either under Australian law or under the Constitution of BHP Billiton Limited, on the right of non-residents to hold or vote BHP Billiton Limited ordinary shares.
7.12 Ancillary information for our shareholdersThis Annual Report provides the detailed financial data and information on the BHP Billiton Group’s performance required to comply with the reporting regimes in Australia, the United Kingdom and the United States.
Shareholders of BHP Billiton Limited and BHP Billiton Plc will receive a copy of the Annual Report if they have requested a copy. ADR holders may view all documents online at www.bhpbilliton.com or opt to receive a hard copy by accessing citibank.ar.wilink.com or calling Citibank Shareholder Services during normal business hours using the details listed on the inside back cover of this Annual Report.
Change of shareholder details and enquiriesShareholders wishing to contact BHP Billiton on any matter relating to their shares or ADR holdings are invited to telephone the appropriate office of the BHP Billiton Share Registrar or Transfer Office listed on the inside back cover of this Annual Report.
Any change in shareholding details should be notified by the shareholder to the relevant Registrar in a timely manner.
Shareholders can also access their current shareholding details and change many of those details online at www.bhpbilliton.com. The website requires shareholders to quote their Shareholder Reference Number (SRN) or Holder Identification Number (HIN) in order to access this information.
Alternative access to the Annual Report We offer an alternative for all shareholders who wish to be advised of the availability of the Annual Report through our website via an email notification. By providing an email address through our website, shareholders will be notified by email when the Annual Report has been released. Shareholders will also receive notification of other major BHP Billiton announcements by email. Shareholders requiring further information or wishing to make use of this service should visit our website www.bhpbilliton.com.
ADR holders wishing to receive a hard copy of the Annual Report 2016 can do so by accessing citibank.ar.wilink.com or calling Citibank Shareholder Services during normal business hours. ADR holders may also contact the adviser that administers their investments. Holders of BHP Billiton Plc shares dematerialised into Strate should liaise directly with their Central Securities Depository Participant (CSDP) or broker.
Key dates for shareholders The following table sets out future dates in the next financial and calendar year of interest to our shareholders. If there are any changes to these dates, all relevant stock exchanges (see section 7.2) will be notified.
Date Event
20 September 2016 Final dividend payment date
20 October 2016 BHP Billiton Plc Annual General Meeting in LondonVenue: The QE II CentreBroad SanctuaryWestminsterLondon SW1P 3EE United KingdomTime: 12.00 noon (local time)Details of the business of the meeting are contained in the separate Notice of Meeting
17 November 2016 BHP Billiton Limited Annual General Meeting in BrisbaneVenue: Brisbane Convention and Exhibition CentreCorner of Merivale and Glenelg StreetsSouthbank, Brisbane QLD 4101AustraliaTime: 11.00am (local time)Details of the business of the meeting are contained in the separate Notice of Meeting
21 February 2017 Interim results announced
10 March 2017 Interim dividend record date
28 March 2017 Interim dividend payment date
IntegrityResilienceGrowth
Economic contribution and payments to governments Report 2016
IntegrityResilienceGrowthSustainability Report 2016
BHP Billiton produces a range of publications that can be viewed or downloaded at www.bhpbilliton.com . If you are a shareholder, you can also elect to receive a paper copy of the Annual Report through the Share Registrar (above).
Economic contribution and payments to governments Report 2016
Sustainability Report 2016
Latest news, Reports and presentationsCompany overview (including Our BHP Billiton Charter, structure and governance)
Subscribe to receive news alerts sent directly to your email address
How to access information on BHP Billiton
www.linkedin.com/company/bhp-billitonwww.youtube.com/bhpbillitonwww.twitter.com/bhpbilliton
Corporate DirectoryBHP Billiton Group Registered OfficesBHP Billiton Limited Australia171 Collins Street Melbourne VIC 3000Telephone Australia 1300 55 47 57 Telephone International +61 3 9609 3333 Facsimile +61 3 9609 3015
BHP Billiton Plc United KingdomNeathouse Place London SW1V 1LHTelephone +44 20 7802 4000 Facsimile +44 20 7802 4111
Group Company SecretaryMargaret Taylor
BHP Billiton Corporate CentresChile Cerro El Plomo 6000 Piso 18 Las Condes 7560623 SantiagoTelephone +56 2 2579 5000 Facsimile +56 2 2207 6517
United StatesOur agent for service in the United Statesis Marisa Isabel Reuter at:1360 Post Oak Boulevard, Suite 150 Houston, TX 77056-3020Telephone +1 713 961 8500 Facsimile +1 713 961 8400
Marketing OfficeSingapore 10 Marina Boulevard, #50-01 Marina Bay Financial Centre, Tower 2 Singapore 018983Telephone +65 6421 6000 Facsimile +65 6421 7000
Share Registrars and Transfer OfficesAustraliaBHP Billiton Limited Registrar Computershare Investor Services Pty Limited Yarra Falls, 452 Johnston Street Abbotsford VIC 3067 Postal address – GPO Box 2975 Melbourne VIC 3001Telephone 1300 656 780 (within Australia) +61 3 9415 4020 (outside Australia) Facsimile +61 3 9473 2460 Email enquiries: www.investorcentre.com/bhp
United KingdomBHP Billiton Plc RegistrarComputershare Investor Services PLCThe Pavilions, Bridgwater RoadBristol BS13 8AEPostal address (for general enquiries) – The Pavilions, Bridgwater RoadBristol BS99 6ZZTelephone +44 (0) 344 472 7001Facsimile +44 (0) 370 703 6101Email enquiries: www.investorcentre.co.uk/contactus
South AfricaBHP Billiton Plc Branch Register and Transfer Secretary Computershare Investor Services (Pty) Limited 70 Marshall Street Johannesburg 2001 Postal address – PO Box 61051 Marshalltown 2107Telephone +27 11 373 0033 Facsimile +27 11 688 5217 Email enquiries: [email protected]
Holders of shares dematerialised into Strate should contact their CSDP or stockbroker.
New ZealandComputershare Investor Services Limited Level 2/159 Hurstmere Road Takapuna Auckland 0622 Postal address – Private Bag 92119 Auckland 1142Telephone +64 9 488 8777 Facsimile +64 9 488 8787
United StatesComputershare Trust Company, N.A. 250 Royall Street Canton, MA 02021 Postal address – PO Box 43078 Providence, RI 02940-3078Telephone +1 888 404 6340 (toll-free within US) Facsimile +1 312 601 4331ADR Depositary, Transfer Agent and Registrar Citibank Shareholder Services PO Box 43077 Providence, RI 02940-3077Telephone +1 781 575 4555 (outside of US) +1 877 248 4237 (+1-877-CITIADR) (toll-free within US) Facsimile +1 201 324 3284 Email enquiries: [email protected]: www.citi.com/dr
The papers used in this document are FSC® Recycled and FSC mixed sources certified. Both stocks are derived from well managed forests and controlled sources. They are manufactured at mills which carry ISO 14001 certification.D
esig
ned
by A
man
da R
oach
Des
ign,
prin
ted
in A
ustr
alia
by
Gun
n an
d Ta
ylor
, Aris
toc
Road
, 315
0.

IntegrityResilienceGrowth
Economic contribution and payments to governments Report 2016
IntegrityResilienceGrowthSustainability Report 2016
BHP Billiton produces a range of publications that can be viewed or downloaded at www.bhpbilliton.com . If you are a shareholder, you can also elect to receive a paper copy of the Annual Report through the Share Registrar (above).
Economic contribution and payments to governments Report 2016
Sustainability Report 2016
Latest news, Reports and presentationsCompany overview (including Our BHP Billiton Charter, structure and governance)
Subscribe to receive news alerts sent directly to your email address
How to access information on BHP Billiton
www.linkedin.com/company/bhp-billitonwww.youtube.com/bhpbillitonwww.twitter.com/bhpbilliton
Corporate DirectoryBHP Billiton Group Registered OfficesBHP Billiton Limited Australia171 Collins Street Melbourne VIC 3000Telephone Australia 1300 55 47 57 Telephone International +61 3 9609 3333 Facsimile +61 3 9609 3015
BHP Billiton Plc United KingdomNeathouse Place London SW1V 1LHTelephone +44 20 7802 4000 Facsimile +44 20 7802 4111
Group Company SecretaryMargaret Taylor
BHP Billiton Corporate CentresChile Cerro El Plomo 6000 Piso 18 Las Condes 7560623 SantiagoTelephone +56 2 2579 5000 Facsimile +56 2 2207 6517
United StatesOur agent for service in the United Statesis Marisa Isabel Reuter at:1360 Post Oak Boulevard, Suite 150 Houston, TX 77056-3020Telephone +1 713 961 8500 Facsimile +1 713 961 8400
Marketing OfficeSingapore 10 Marina Boulevard, #50-01 Marina Bay Financial Centre, Tower 2 Singapore 018983Telephone +65 6421 6000 Facsimile +65 6421 7000
Share Registrars and Transfer OfficesAustraliaBHP Billiton Limited Registrar Computershare Investor Services Pty Limited Yarra Falls, 452 Johnston Street Abbotsford VIC 3067 Postal address – GPO Box 2975 Melbourne VIC 3001Telephone 1300 656 780 (within Australia) +61 3 9415 4020 (outside Australia) Facsimile +61 3 9473 2460 Email enquiries: www.investorcentre.com/bhp
United KingdomBHP Billiton Plc RegistrarComputershare Investor Services PLCThe Pavilions, Bridgwater RoadBristol BS13 8AEPostal address (for general enquiries) – The Pavilions, Bridgwater RoadBristol BS99 6ZZTelephone +44 (0) 344 472 7001Facsimile +44 (0) 370 703 6101Email enquiries: www.investorcentre.co.uk/contactus
South AfricaBHP Billiton Plc Branch Register and Transfer Secretary Computershare Investor Services (Pty) Limited 70 Marshall Street Johannesburg 2001 Postal address – PO Box 61051 Marshalltown 2107Telephone +27 11 373 0033 Facsimile +27 11 688 5217 Email enquiries: [email protected]
Holders of shares dematerialised into Strate should contact their CSDP or stockbroker.
New ZealandComputershare Investor Services Limited Level 2/159 Hurstmere Road Takapuna Auckland 0622 Postal address – Private Bag 92119 Auckland 1142Telephone +64 9 488 8777 Facsimile +64 9 488 8787
United StatesComputershare Trust Company, N.A. 250 Royall Street Canton, MA 02021 Postal address – PO Box 43078 Providence, RI 02940-3078Telephone +1 888 404 6340 (toll-free within US) Facsimile +1 312 601 4331ADR Depositary, Transfer Agent and Registrar Citibank Shareholder Services PO Box 43077 Providence, RI 02940-3077Telephone +1 781 575 4555 (outside of US) +1 877 248 4237 (+1-877-CITIADR) (toll-free within US) Facsimile +1 201 324 3284 Email enquiries: [email protected]: www.citi.com/dr

BHP Billiton A
nnual Report 2016