Integrative Data Mining: The New Direction in...
8
Integrative Data Mining: The New Direction in Bioinformatics Machine Learning for Analyzing Genome-Wide Expression Profiles and Proteomics Data Sets B iological research is becoming increas- ingly database driven, motivated, in part, by the advent of large-scale func- tional genomics and proteomics experi- ments such as those comprehensively measuring gene expression. These pro- vide a wealth of information on each of the thousands of proteins encoded by a ge- nome. Consequently, a challenge in bioinformatics is integrating databases to connect this disparate information as well as performing large-scale studies to col- lectively analyze many different data sets. This approach represents a paradigm shift away from traditional single-gene biol- ogy, and it often involves statistical analy- ses focusing on the occurrence of particular features (e.g., folds, functions, interactions, pseudogenes, or localiza- tion) in a large population of proteins. Moreover, the explicit application of ma- chine learning techniques can be used to discover trends and patterns in the under- lying data. In this article, we give several examples of these techniques in a genomic context: clustering methods to organize microarray expression data, sup- port vector machines to predict protein function, Bayesian networks to predict subcellular localization, and decision trees to optimize target selection for high-throughput proteomics. Biological Research Is Database Oriented Databases have defined the information structure of molecular biology for over a decade, archiving thousands of protein and nucleotide sequences and three-dimen- sional (3-D) structures. As large-scale genomics and proteomics move to the fore- front of biological research, the role of da- tabases has become more significant than ever. The current landscape of biological databases includes large public archives, such as GenBank, DDBJ, and EMBL for nucleic acid sequences [1]; PIR and SWISS-PROT for protein sequences [2]; and the Protein Data Bank for 3-D protein structure coordinate sets [3]. Another source of sequence data is dbEST [4], a di- vision of GenBank storing expressed se- quence tags (ESTs) from cell lines, which provide information about gene expression in various tissues. Databases such as these have been steadily accumulating gene se- quences and protein structures for more than a decade, which are submitted on a per-instance basis from disparate laborato- ries in the biological sciences community. In addition to these general reposito- ries of biomolecular data, specialized sys- tems have been developed that extend its interpretation by providing a context for individual sequences and structures. The SCOP, CATH, and FSSP [5] databases classify proteins based on structural simi- larity, Pfam and ProtoMap [6] identify families of proteins based on sequence homology, while PartsList and GeneCensus [7] give dynamic reports on the occurrence of protein families in vari- ous genomes. Databases have also been developed to provide comprehensive ac- cess to sequence, expression, and func- tional data for all the known genes of specific model organisms [8]. Integration of Databases and Large-Scale Surveys In addition to sequence and structure databases, many diverse experimental data sets have been compiled that focus on vari- ous aspects of protein function. However, these need to be related with other data in order to be placed in a useful context, as in- July/August 2001 IEEE ENGINEERING IN MEDICINE AND BIOLOGY 33 0739-5175/01/$10.00©2001IEEE ©1998 DIGITAL VISION STOCK CORP. Paul Bertone 1 and Mark Gerstein 2 1 Dept. of Molecular, Cellular, and Developmental Biology 2 Dept. of Molecular Biophysics and Biochemistry and Dept. of Computer Science, Yale University
Transcript of Integrative Data Mining: The New Direction in...

Integrative Data Mining:The New Direction inBioinformaticsMachine Learning for Analyzing Genome-Wide ExpressionProfiles and Proteomics Data Sets
Biological research is becoming increas-ingly database driven, motivated, in
part, by the advent of large-scale func-tional genomics and proteomics experi-ments such as those comprehensivelymeasuring gene expression. These pro-vide a wealth of information on each ofthe thousands of proteins encoded by a ge-nome. Consequently, a challenge inbioinformatics is integrating databases toconnect this disparate information as wellas performing large-scale studies to col-lectively analyze many different data sets.This approach represents a paradigm shiftaway from traditional single-gene biol-ogy, and it often involves statistical analy-ses focusing on the occurrence ofparticular features (e.g., folds, functions,interactions, pseudogenes, or localiza-tion) in a large population of proteins.Moreover, the explicit application of ma-chine learning techniques can be used todiscover trends and patterns in the under-lying data. In this article, we give severalexamples of these techniques in agenomic context: clustering methods toorganize microarray expression data, sup-port vector machines to predict proteinfunction, Bayesian networks to predictsubcellular localization, and decisiontrees to optimize target selection forhigh-throughput proteomics.
Biological Research IsDatabase Oriented
Databases have defined the informationstructure of molecular biology for over adecade, archiving thousands of protein andnucleotide sequences and three-dimen-sional (3-D) structures. As large-scalegenomics and proteomics move to the fore-front of biological research, the role of da-tabases has become more significant than
ever. The current landscape of biologicaldatabases includes large public archives,such as GenBank, DDBJ, and EMBL fornucleic acid sequences [1]; PIR andSWISS-PROT for protein sequences [2];and the Protein Data Bank for 3-D proteinstructure coordinate sets [3]. Anothersource of sequence data is dbEST [4], a di-vision of GenBank storing expressed se-quence tags (ESTs) from cell lines, whichprovide information about gene expressionin various tissues. Databases such as thesehave been steadily accumulating gene se-quences and protein structures for morethan a decade, which are submitted on aper-instance basis from disparate laborato-ries in the biological sciences community.
In addition to these general reposito-ries of biomolecular data, specialized sys-tems have been developed that extend itsinterpretation by providing a context forindividual sequences and structures. TheSCOP, CATH, and FSSP [5] databasesclassify proteins based on structural simi-larity, Pfam and ProtoMap [6] identifyfamilies of proteins based on sequencehomology, while PartsLis t andGeneCensus [7] give dynamic reports onthe occurrence of protein families in vari-ous genomes. Databases have also beendeveloped to provide comprehensive ac-cess to sequence, expression, and func-tional data for all the known genes ofspecific model organisms [8].
Integration of Databases andLarge-Scale Surveys
In addition to sequence and structuredatabases, many diverse experimental datasets have been compiled that focus on vari-ous aspects of protein function. However,these need to be related with other data inorder to be placed in a useful context, as in-
July/August 2001 IEEE ENGINEERING IN MEDICINE AND BIOLOGY 330739-5175/01/$10.00©2001IEEE
©19
98D
IGIT
AL
VIS
ION
ST
OC
KC
OR
P.
Paul Bertone1 and Mark Gerstein2
1Dept. of Molecular, Cellular,and Developmental Biology
2Dept. of Molecular Biophysics and Biochemistry andDept. of Computer Science,
Yale University

dividual bits of information are relativelymeaningless outside of this wider scope.For example, an experiment measuringhigh mRNA copy number for the humangene J00068 carries little intrinsic valueuntil one associates this fact with thegene’s functional classification, learningthat it codes for the protein actin, an abun-dant component of skeletal muscle.
The scale of genomics research precludesthe traditional single-molecule approach inbiology, where all the experimental knowl-
edge about a given protein could be obtainedthrough reading the literature. Integrative da-tabase analysis and data mining are essentialaspects of modern biology, enabling the syn-thesis of large-scale portraits of genomefunction.
In practice, data mining often takes theform of statistical surveys, in the sense ofdemographic censuses, of different popu-lations of genes and proteins. The goal inthis analysis is to identify certain out-standing features possessed by a givenpopulation. For instance, large-scale sur-veys have been used to characterize thefeatures of pseudogenes (inactive pro-tein-coding regions) in the worm genome[9], correlate the levels of protein expres-sion with subcellular localization [10], ex-amine the relationship between proteinstructure with function [11-12], and mea-sure the composition of protein folds incomplete genomes [13-14]. Bioinfor-matics researchers conducting integrativedatabase surveys face the challenge ofmerging genomics data from many differ-ent sources into a common framework.Therefore, the development of standardsal lowing federated databases tointeroperate is essential.
Functional Genomicsand Microarray Technology
With the introduction of complete ge-nome sequences, much comprehensivefunctional analysis has been done on theproteins encoded by an organism’s genome.The sequence determination phase of
genomics offers only a fraction of theanalytical possibilities. Many functional ex-periments can be performed using that data,and countless opportunities exist to relatethose experimental results with other prop-erties via integrative database analysis.
Among the experimental techniquesavailable for genome-wide analysis aregene disruption [15], two-hybrid studies[16], large-scale proteomics [17], siliconeelastomer protein chips [18], serial analy-sis of gene expression (SAGE) [19], andvarious DNA microarray technologies.Of these, microarrays have become par-ticularly popular due to the highly parallelnature of the experiments and the inherenthomogeneity of the data captured. Usingarray technologies , immobil izedoligonucleotide fragments having knownsequences are exposed to fluores-cence-labeled DNA probes, and the sig-nals corresponding to hybridizedfragments are scanned and quantified[Fig. 1(a)]. A number of these systemshave been devised, allowing the simulta-neous interrogation of thousands of genesin a single experiment. Due to the recentsequencing of complete genomes, labora-tories are using these array technologiesto generate expression data on a scale thatmost researchers would have considerednearly impossible just a few years ago.
To construct the array shown in Fig.1(a), DNA fragments of known sequenceare immobilized to each array element.Messenger RNA transcripts from cell ex-tracts are reverse-transcribed and labeled
34 IEEE ENGINEERING IN MEDICINE AND BIOLOGY July/August 2001
(a) (b) (c)
HU YPD37
EGTA
MB
YPG
Caff
BenR
Calcs
CycR
MMS
BCIP
W/R
NaCI
HHIG
Cycs
SDS
CalcR
YPD11
Bens
Hyg
No DataWild-TypeWeakMediumStrong
1. (a) Scanned image of a cDNA microarray (see text for details). (b) Hierarchical clustering techniques applied to microarrayexpression data, adapted from [24] (see text for details). (c) Double-clustering of disruption phenotype data using k-means andhierarchical methods [15] (see text for details).
Integrative database
analysis and data
mining are essential
aspects of modern
biology, enabling the
synthesis of large-scale
portraits of genome
function.
with the fluorophore cyanine-5, serving ashybridization probes. Total genomicDNA is labeled with cyanine-3 and hy-bridized to all the array elements as a neg-ative control. The two signals aregenerated separately with a laser usingdifferent excitation wavelengths (633 and543 nm, respectively), and the emissionsare scanned and quant i f ied viadensitometry. Changes in gene expres-sion are measured as the normalized ratiosbetween mRNA level and backgroundsignal for each array element. The imageis false-colored after scanning; here,genes that are up-regulated are shown inred, while genes that are down-regulatedappear green. In this way, differential ex-pression of thousands of genes can bequantified simultaneously.
Microarray technologies includecDNA arrays [20] and high-densityoligonucleotide systems, such asGeneChips [21] and intergenic DNA ar-rays [22]. Each of these methods is de-signed to capture a different type ofinformation. GeneChips and cDNA ar-rays enable genome-wide expressionmonitoring by measuring mRNA copynumber under various cellular conditions,compiling an expression profile for manygenes at incremental time points. cDNAmicroarrays measure gene expression asthe difference in signal strength betweenreverse-transcribed mRNA levels fromcells under various conditions. This dif-ference is given relative to a referencevalue, which yields a ratio for every targetgene under investigation. Conversely,GeneChips measure the absolute expres-sion levels of mRNA transcripts, in num-ber of copies per cell.
Intergenic DNA arrays are an emergingtechnology, involving the construction ofhigh-density oligonucleotide chips that areprobed with DNA fragments captured viachromatin immunoprecipitation (some-times referred to as ChIP chips).DNA-binding proteins, complexed withtheir cognate recognition sequences, aresequestered from cell extracts with anti-body-bound beads. The DNA is then iso-lated and used to probe the array,hybridizing to elements containing com-plementary nucleotide sequences. In ex-periments where transcriptionfactor-bound DNA is used to interrogate amicroarray containing intergenic se-quences, sites of transcription factor bind-ing can be identified across an entiregenome [22]. Evidence of putative geneexpression accumulates when both cDNA
and ChIP-derived probes are hybridized toidentical arrays and comparisons are madebetween differential mRNA levels and up-stream sites of transcription factor binding.Combined with existing expression analy-sis methods, this location data can be usedto assemble a more comprehensive pictureof large-scale genetic function.
Machine Learning Approachesto Genomic Data Analysis
Unsupervised Learningand Clustering
A general problem in data analysis ishow to structure information into mean-ingful taxonomies or categories. This is-sue is of great importance when trying toinfer relationships in diverse biologicaldata sets. Statistical methods for findingtrends and patterns in experimental resultshave played a large role in their interpreta-tion. Principal component analysis (PCA)can be an effective method of identifyingthe most discriminating features in a dataset. This technique usually involves find-ing two or three linear combinations of theoriginal features that best summarize thetypes of variation in the data. If much ofthe variation is captured by these two orthree most significant principal compo-nents, class membership of many datapoints can be observed.
Several approaches to this problememploy unsupervised learning to findthese categories; that is, no a priori in-formation is required, and generally, nofeedback is given to the model to adjustits performance. Unsupervised learningenables pattern discovery by organizingdata into clusters, using recursive parti-tioning methods. The k-means algo-rithm is a popular instance-basedmethod of cluster analysis. The algo-rithm partitions data into a predeter-mined number of categories as instancesare examined, according to a distancemeasure (e.g., Euclidean). Categorycentroids are fixed at random positionswhen the model is initialized, which canaffect the clustering outcome.
The self-organizing feature map(SOM) [23] consists of a neural networkwhose nodes move in relation to cate-gory membership. As with k-means, adistance measure is computed to deter-mine the closest category centroid. Un-l ike k -means , th i s ca t egory i srepresented by a node with an associatedweight vector. The weight vector of thematching node, along with those ofneighboring nodes, are updated to more
closely match the input vector. As datapoints are clustered and category cen-troids are updated, the positions ofneighboring nodes move in relation tothem. The number of network nodes thatconstitute this neighborhood typicallydecrease over time.
While both algorithms require thenumber of clusters to be empirically cho-sen, the SOM algorithm overcomes somelimitations of k-means by imposingglobal relationships between clusters,thereby improving interpretability. LikePCA, the SOM is capable of reducinghigh-dimensional data into a 1- or 2- di-mensional representation. The algorithmproduces a topology-preserving map,conserving the relationships among datapoints. Thus, although either methodmay be used to effectively partition theinput space into clusters of similar datapoints, the SOM can also indicate rela-tionships between clusters.
Supervised Learningand Classification
Analysis of large data sets that containdiverse information often involves the ex-plicit application of supervised learning.This generally involves dividing the dataset features into two categories: predic-tors, or features in a data set that are rele-vant for learning, and the responsevariable, or property to be classified.Given the heterogeneous information pre-sented by integrated bioinformatics data-bases, a number of potential correlationsbetween predictors and response vari-ables may be discovered, depending onthe subset of features used and the classifi-cations sought after.
Machine learning can be applied to awide variety of biological information,
July/August 2001 IEEE ENGINEERING IN MEDICINE AND BIOLOGY 35
Interpretability of
results is a key factor
in selecting a
particular machine
learning method.

both to partition the data into categoriesand to classify previously unseen exam-ples. Supervised learning is conducted intwo phases: training and testing the classi-fier model. Using this strategy, the data setis divided into two mutually exclusivesets. The first set is used to train themodel, where correct classifications/re-sponses of the input examples are known apriori. This information is used to im-prove the performance of the model andreduce the classification error rate, a pro-cess that incrementally adjusts an n-di-mensional hyperplane that serves topartition the data set into categories. Af-terward, unseen instances in the test setare classified according to the partitioningestablished during the training phase.
Classification Performance versusEase of Interpretation
For biological research applications,interpretability of results is a key factor inselecting a particular machine learningmethod. By deciphering the mapping be-tween points in feature space and learnedcategories, one can apply classificationresults in a practical context. The ability todecipher this mapping depends largelyupon the internal representation used by aparticular algorithm. For example, deci-sion trees are quite useful in this respect,because rules can be extracted from thetree that discriminate amongst classes.Backpropagation neural networks, while
useful classifiers, employ a numericalweight matrix to establish nonlinearmappings that can be difficult to interpret.
Biological Data Mining ApplicationsOrganizing Microarray Data
Clustering algorithms are being ap-plied to microarray data sets with increas-ing regularity; they are often incorporatedinto microarray image analysis softwareand are therefore frequently used to visu-alize local and global relationships amonghybridization signals captured by the ar-ray. Currently, hierarchical clustering isthe most popular technique employed formicroarray data analysis [24]. Hierarchi-cal methods are based on building a dis-tance matrix summarizing all the pairwisesimilarities between expression profilesand then generating cluster trees (alsocalled dendrograms) from this matrix.Genes that appear to be co-expressed atvarious time points are positioned close toone another in the tree, whose branchlengths represent the degree of similaritybetween expression profiles.
Agglomerative methods such ask-means and self-organizing maps havealso been used to cluster microarray data.The SOM algorithm has been applied toidentify cell differentiation patterns anddistinguish between cancer cell types viaarray expression profiling [25]. Usingboth hierarchical and neighborhood anal-ysis techniques, genes exhibiting similarmRNA levels tend to cluster together, re-vealing patterns in gene expression data[Figure 1(b)]. In this software display,microarray intensity values are depictedas colored blocks, where rows representindividual genes, and columns corre-spond to incremental time points whensuccessive experiments were performed.Thus, each row constitutes an expressionprofile for a given gene. Red blocks indi-cate high mRNA levels, green blocks in-dicate low levels. The data was organizedvia hierarchical clustering to group geneswith related expression profiles.
While useful visualization tools, the an-alytical utility of either type of clusteringapproach is limited in terms of interpretingmicroarray results. These techniques serveto group data points based on changes inmRNA levels under various cellular condi-tions. Although cluster membership of re-lated data points can indicate co-expression or co-repression of the genesthey represent, the existence of commonregulatory pathways based on partitioningexpression profiles remains speculative in
the absence of external information. Addi-tionally, there is no reason to believe thatco-expressed genes are evolutionarily re-lated as hierarchical ordering might imply.
Partitioning Phenotype Data withMultiple Clustering TechniquesWhere appropriate, clustering meth-
ods can be combined to establish amultitiered partitioning of a data set. Anexample of this approach is the tandemuse of k-means clustering with hierarchi-cal clustering as applied to genome-widephenotypic analysis [15]. Yeast cells con-taining transposon insertions were sortedwith the k-means algorithm based ongrowth conditions, to produce clusters ofgenes with similar phenotypes. The samedata was then ordered hierarchically, pro-ducing trees of experimental assays, andclustering those which yield trans-formants with shared phenotypes [Fig.1(c)]. Using this method, assays can beidentified that are capable of selectingfunctionally related genes.
In Fig. 1(c), both examples of hierar-chical clustering use the Pearson coeffi-cient to measure similarity between geneexpression profiles. Given two normal-ized expression ratio profiles, thePearson correlation coefficient is givenby the dot product
RN
ij i j=−
⋅1
1X X
where N is the number of elements repre-sented by the profiles Xi and X j . The mea-surement expression ratio profile x can beused to compute a Z-score from the normal-ized profile X with the following equation
X kx k x
x
( )( )
=− avg
σ
where X(k) and x(k) are the kth compo-nents of the profiles X and x, respectively,xavg is the average, and σ x is the standarddeviation of values in x. The correlationcoefficient matrix R can then be computedfor a group of genes, where each matrix el-ement Rij corresponds to the Pearson cor-relation coefficient between genes i and j.The average correlation coefficient Ravg isfound by averaging the elements of R, in-cluding the diagonal. This statistic indi-cates the overall similarity of theexpression profiles in a group of genes.
Classifying Gene Function withSupport Vector Machines
An example of a supervised learningmethod applied to functional genomics
36 IEEE ENGINEERING IN MEDICINE AND BIOLOGY July/August 2001
The future of
biological databases
will likely include
systems that are
specifically designed
to capture data in a
format that facilitates
retrospective analysis.

data is the use of support vector machines(SVMs) to classify yeast ORFs into severalfunctional categories by correlatingmRNA expression with prior knowledgeof gene function [26]. The SVM maps ann-dimensional input space onto ahigher-dimensional feature space, simulta-neously transforming a nonlinear classboundary into a simple hyperplane. Thenew feature space is embodied as a set ofnonlinear combinations of the original fea-tures. If we consider a dataset whose pointsare linearly separable in the new featurespace, their corresponding convex hulls(the tightest enclosing convex polygons)do not overlap. The maximum marginhyperplane is defined as the hyperplanethat is maximally distant from both convexhulls; this will bisect the shortest line con-necting them. The data points closest to themaximum margin hyperplane are calledsupport vectors and uniquely define themaximum margin hyperplane (the mini-mum number of support vectors from eachclass is one). Finding the support vectorsand the parameters that determine the max-imum margin hyperplane can be accom-plished with a standard constrainedquadratic optimization scheme.
To apply the SVM for gene classifica-tion, a set of examples was assembledcontaining genes of known function,along with their corresponding micro-array expression profiles. The SVM was
then used to predict the functions ofuncharacterized yeast ORFs based on theexpression-to-function mapping estab-lished during training. Supervised learn-ing techniques appear to be ideal for thistype of functional classification ofmicroarray targets, where sets of positiveand negative examples can be compiledfrom genomic sequence annotations.
Predicting SubcellularLocalization with Bayes’ RulesBioinformatics data mining often in-
volves the aggregation of proteomic datafrom multiple sources, followed by theapplication of machine learning tech-niques to identify or predict variousmacromolecular properties from thesefeatures. One such application of thisstrategy was the assignment of thousandsof proteins in the yeast genome to thesubcellular compartments to which theyare most likely transported [27]. In thisstudy, gene expression levels from a num-ber of SAGE, GeneChip, and cDNAmicroarray experiments were accrued andcross referenced with protein localizationinformation from public databases. Eachprotein was first assigned a default proba-bility of being localized to one of severalcompartments. These were then updatedusing a Bayesian system that incorporatesa number of external features to arrive atprobabilities for the localization of each
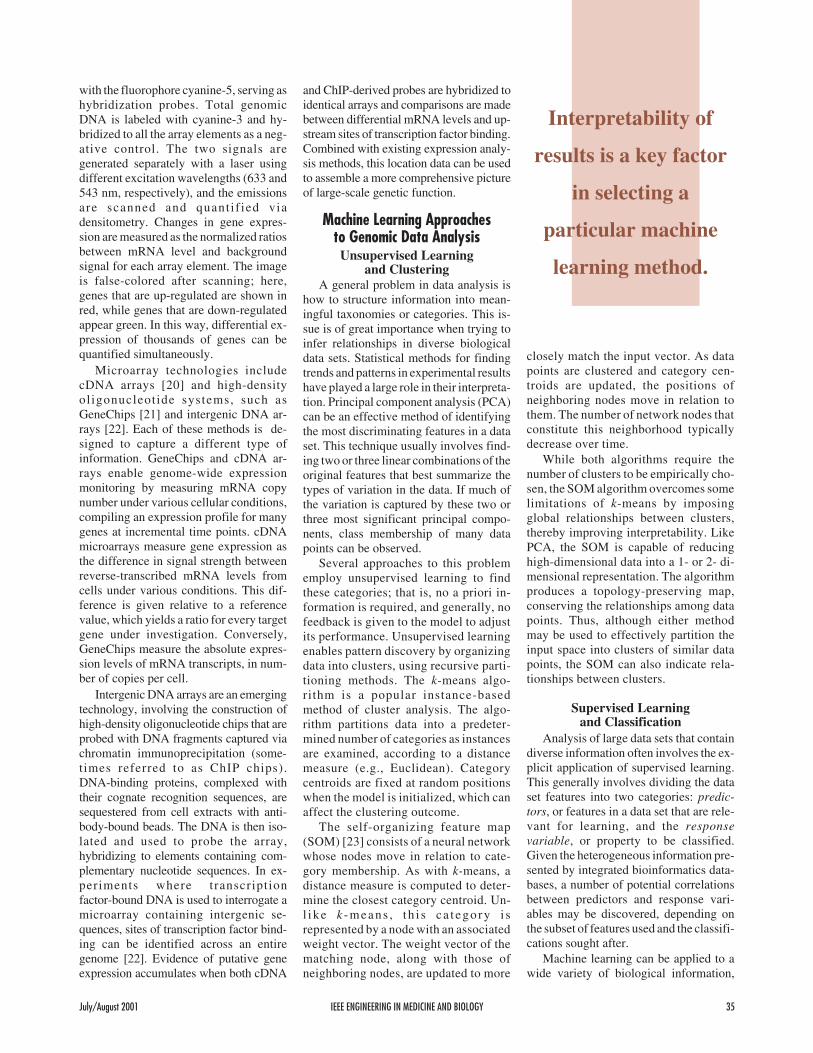
protein [Fig. 2(a)]. Training the model ona set of examples for which this informa-tion is known made possible the predic-tion of the localization of unknownproteins. This analysis also enabled theelucidation of the relationships betweenexpression and compartmental localiza-tion, with cytosolic proteins being highlyexpressed, and nuclear and mem-brane-related proteins exhibiting lowerexpression levels [Fig. 2(b)].
In Fig. 2(a), the charts depict the statevector for a protein m, representing thedistribution of probabilities of protein mlocalizing to various subcellular compart-ments. Bar graphs illustrate the vectors foreach feature considered. The prior statefor a given protein is sequentially updatedwith Bayes’ rule using feature vectors thatrepresent different attributes of the pro-tein (e.g., NLS = nuclear localization sig-nal sequence, GLY = glycosylation site);e.g.,
( )( )
Pm Pm
P Z
C feature C
feature C
| ( )
| /
=
×
where Z is a normalization factor equalto the product of the fraction of proteinslocalized in each compartment (C) hav-ing a particular feature, and the priorprobability of protein m being trans-ported to that compartment, summedover all compartments:
July/August 2001 IEEE ENGINEERING IN MEDICINE AND BIOLOGY 37
108642 Cyt
NucER
p NLS=true nuc( )|
P(NLS=true loc)|
P (loc)m
P (loc | pl > 9)m
P (loc | mRNA expr = high)m
P(mRNA expr=high | loc)
P(pl > 9 | loc)
P (loc | NLS=true)m
p (nuc)m
Initial Prior Cytoplasm
Nucleus
Membrane
Mitochondria
GolgiExtracellular
EndoplasmicRecticulum
Absolute Expression(Copies/Cell)
Expression RatioFluctuations in(copies/cell)
andDiauxic Shift
14.4 0.26 0.71
1.7 0.28 0.46
2.4 0.27 0.50
2.0 0.24 0.57
2.8 0.27 0.407.5 0.69 0.76
3.2 0.26 0.45
Posterior
p (nuc | NLS=true)m= p(NLS=true | nuc) • p (nuc) i Zm
Final Result
0
(a) (b)
2. (a) Bayesian system for predicting subcellular localization [27]. Charts depict the state vector for a protein m, representing thedistribution of probabilities of protein m localizing to various subcellular compartments. Bar graphs illustrate the vectors for eachfeature considered. (b) Total predicted compartmental populations for the yeast genome. Estimates are calculated according to thedistribution of a population vector, obtained by summing the probability state vectors of all the proteins considered.

( ) ( )Z P Pm= ×∑ feature C CC
| .
The predicted compartment for each pro-tein is indicated by the probability distri-bution of the final state vector. In Fig.2(b), estimates are calculated according tothe distribution of a population vector, ob-tained by summing the probability statevectors of all the proteins considered.
Using Decision Trees to OptimizeHigh-Throughput Proteomics
The future of biological databases willlikely include systems that are specifi-cally designed to capture data in a format
that facilitates retrospective analysis. Thisrequires careful standardization of experi-mental parameters, thereby rendering thedata amenable to subsequent computa-tion. As discussed above, computing tech-niques are readily applied to microarrayresults, partially due to the inherent homo-geneity of these data sets. Similarly, a goalin the fusion of databases with data min-ing applications is to standardize highlydivergent data sets as much as possible,making them accessible to machine learn-ing algorithms.
Recently, a combined approach wasdeveloped to facilitate distributed collab-oration among many laboratories using ashared database system and to subse-quently predict macromolecular proper-ties from structural proteomics data viadecision tree analysis [28]. Experimentalparameters for protein cloning, purifica-tion, biophysical characterization, NMR,and X-ray crystallization were recorded ina database. These values were standard-ized across many laboratories and institu-tions, providing a common data format forretrospective analysis. Using the databaseto generate training sets for supervisedlearning, decision trees [29] were used toclassify proteins as either soluble or insol-uble, based on features of their amino acidsequences. Useful rules relating these fea-tures with protein solubility were then de-termined by tracing the paths through thedecision trees (Fig. 3). Protein solubilitystrongly influences whether a given pro-tein is a feasible target for structure deter-mination, so the ability to predict thisproperty can be a valuable asset in the op-timization of high-throughput projects.
In Fig. 3, experimental data for proteincloning, purification, biophysical charac-terization, and structure determination areuploaded from many distr ibuted
workstations to a central database servervia the Internet. These are stored as stan-dardized values and used as features fordata mining analyses. A number of re-sponse variables can be predicted in thismanner. Decision trees were built with theC4.5 algorithm [29] to sort proteins basedon solubility, using training sets compiledfrom the database. The model was trainedusing features derived from the protein se-quences, such as the composition of vari-ous amino acid groups (e.g., aliphatic =C(AIGLV), aromatic = C(FWY)), sec-ondary structure features, presence of hy-drophobic regions, entropic measures ofsequence complexity, etc. Ellipses repre-sent the decision tree nodes, filled to indi-cate the number of soluble versusinsoluble proteins at each vertex. Thesevalues appear to the right and left of eachnode, respectively. Rules that discrimi-nate between classes were then extractedfrom decision trees by examining thepaths from root to leaf nodes that lead tocorrect classifications. In this example, itwas found that proteins having a com-bined composition of acidic residues(C(DE)) greater than 18% were likely tobe soluble, while insoluble proteins gen-erally had less than 18% acidic residues,possessed a stretch of amino acids withaverage hydrophobicity < −0.78 kcal/mol(Hphobe), and contained fewer than 16%acidic amino acids and their amides(C(DENQ)).
ConclusionAs with biological sciences in general,
the emphasis of computational biologyhas changed in recent years from the char-acterization of individual molecules to theanalysis of genome-wide expression pro-files and proteomics data sets. In contrastto traditional single-gene experimenta-
38 IEEE ENGINEERING IN MEDICINE AND BIOLOGY July/August 2001
90
2
0 813
221
2
05
Hphobe
C(DENQ)
C(DENQ)
C(FWY)
3
50
69 48
68 41 1 7
3 6
204 222
232 330
28 108
1 35 27 73
8 6 19 67
15 26 4 41
1 36 3 5
114 172
88 161
3 25
19 0 9 6 16 0
85 13625 6 1 5
C(DE)
Hphobe
C(FWY)
C(Y)
C(coil) C(DENQ)
CPLX(s)
Length
C(Y)
C(l)
C( )α
3. Integrated database and machine learning system for optimizing high-throughput proteomics, adapted from [28] (see textfor details).
The data storage and
analysis requirements
of genomics research
will likely promote the
development of hybrid
approaches that
merge database design
with computational
methods.

tion, comprehensive functional data setsare being produced, the scale of which hasincreased with the tandem sequencing ofentire genomes and the advent ofmicroarray technologies. An essentialpart of this work is the integration of awide variety of experimental data to as-semble a larger picture of biological func-tion and frame pertinent informationwithin a meaningful context. These com-posite data sets are conducive to extensivecomputational analysis and present newopportunities for data mining.
Machine learning is a useful tool forinterpreting genomic information. Bothsupervised and unsupervised approachescan often be used to analyze the samekinds of data, depending on the desired re-sult and the range of features available.While supervised learning can be used toclassify examples according to a given re-sponse variable, unsupervised learningcan aid in revealing previously unknownrelationships without a priori information.However, meaningful clustering relation-ships are often difficult to discern. Al-though supervised models require anexplicit training and testing regime, theycan be used to predict the class of un-known examples based on previous learn-ing by approximating a target function ordiscovering classification rules. This ca-pability can allow investigators to inter-pret data classifications and potentiallyelucidate functional properties.
Bioinformatics calls for a mosaic ofcomputing techniques to facilitate the ef-fective organization and interpretation ofdata generated by functional genomicsprojects. Large-scale experiments, suchas those performed with microarrays,yield large homogenous data sets that arewell suited for computational analysis.Consequently, new types of databaseshave been created to handle this informa-tion [30]. These information systems aredesigned to provide management andweb-based retrieval of microarray data.Currently under debate is whether datasets should be normalized as they are en-tered into a particular system, and to whatdegree the details of experimental condi-tions should be recorded. While themicroarray intensity values are wellsuited to relational table storage, experi-mental parameters vary widely across in-dividual projects and currently defyuniform standardization.
The data storage and analysis require-ments of genomics research will likelypromote the development of hybrid ap-
proaches that merge database design withcomputational methods. To facilitate this,it will be necessary to establish consistentformats for database interoperation,which will add greatly to the utility of ex-perimental results in terms of potentialdata mining applications.
Paul Bertone receivedthe B.M. degree in 1993and the M.S. in com-puter science in 1996from the University ofMassachusetts and theM.A. in cognitive andneural systems in 1998from Boston Univer-
sity. He is currently a Ph.D. candidate inthe Department of Molecular, Cellular,and Developmental Biology at Yale Uni-versity. His research interests includeintergenic and maximal-coverage DNAmicroarray design and the application ofmachine learning strategies to biologicaldata analysis, particularly in relation tohuman genomics.
Mark Gerstein is an as-sistant professor in theDepartment of Molecu-lar Biophysics and Bio-chemistry at YaleUniversity. He is also ajoint appointee in theDepartment of Com-puter Science. He re-
ceived is A.B. in physics from HarvardCollege in 1989 and his Ph.D. from Cam-bridge in biophysics in 1993. He didpostdoctoral work at Stanford and took uphis post at Yale in early 1997. Since then hehas received a number of young investiga-tor awards (e.g., from the Navy and Keckfoundations) and has published apprecia-bly in biological science journals (80 in to-tal) . His research is focused onbioinformatics and he is particularly inter-ested in large-scale integrative surveys, bi-ological database design, macromoleculargenomtry, molecular simulation, genomeannotation, gene expression analysis, andBayesian systems for data mining.
Address for Correspondence: MarkGerstein, Department of Molecular Bio-physics and Biochemistry, Yale Univer-sity, New Haven, CT 06520. Tel: +1 203432 6105. Fax: +1 360 838 7861. E-mail:[email protected].
References[1] D.A. Benson, I. Karsch-Mizrachi, D.J.Lipman, J. Ostell, B.A. Rapp, and D.L. Wheeler,
Genbank, Nucleic Acids Res., vol. 28, pp. 15-18,2000; Y. Tateno, S. Miyazaki, M. Ota, H.Sugawara, and T. Gojobori, “DNA bank of Japan(DDBJ) in collaboration with mass sequencingteams,” Nucleic Acids Res., vol. 28, pp. 24-26,2000; W. Baker, A. van der Broek, E. Camon, P.Hingamp, P. Sterk, G. Stoesser, and M.A. Tuli,“The EMBL nucleotide sequence database,” Nu-cleic Acids Res., vol. 28, pp. 19-23, 2000.[2] W.C. Barker, J.S. Garavelli, H. Huang, P.B.McGarvey, B. Orcutt, G.Y. Srinivasarao, C. Xiao,L.S. Yeh, R.S. Ledley, J.F. Janda, F. Pfeiffer,H.W. Mewes, A. Tsugita, and C. Wu, “The Pro-tein Information Resource (PIR),” Nucleic AcidsRes., vol. 28, pp. 41-44, 2000; A. Bairoch, and R.Apweiler, “The SWISS-PROT protein sequencedatabase and its supplement TrEMBL in 2000,”Nucleic Acids Res., vol. 28, pp. 45-48, 2000.[3] H.M. Berman, J. Westbrook, Z. Feng, G.Gilliland, T.N. Bhat, H. Weissig, I.N. Shindyalov,and P.E. Bourne, “The Protein Data Bank,” Nu-cleic Acids Res., vol. 28, pp. 235-242, 2000.[4] M.S. Boguski, T.M. Lowe, and C.M.Tolstoshev, “dbEST–database for ‘expressedsequence tags,’” Nat. Genet., vol. 4, pp.332-333, 1993.[5] A.G. Murzin, S.E. Brenner, T. Hubbard, andC. Chothia, “SCOP: a structural classification ofproteins database for the investigation of se-quences and structures,” J. Mol. Biol., vol. 247,pp. 536-540, 1995; C.A. Orengo, A.D. Michie, S.Jones, D.T. Jones, M.B. Swindells, and J.M.Thornton, “CATH- A Hierarchic Classification ofProtein Domain Structures,” Structure, vol. 8, pp.1093-1108, 1997; L. Holm and C. Sander,“Touring protein fold space with Dali/FSSP,” Nu-cleic Acids Res., vol. 26, pp. 316-319, 1998.[6] A. Bateman, E. Birney, R. Durbin, S.R. Eddy,K.L. Howe, and E.L. Sonnhammer, “The Pfamprotein families database,” Nucleic Acids Res.,vol. 28, pp. 263-266, 2000; G. Yona, N. Linial,and M. Linial, “ProtoMap: Automatic classifica-tion of protein sequences and hierarchy of pro-tein families,” Nucleic Acids Res., vol. 28, pp.49-55, 2000.[7] J. Qian, B. Stenger, C.A. Wilson, J. Lin, R.Jansen, S.A. Teichmann, J. Park, W.G. Krebs, H.Yu, V. Alexandrov, N. Echols, and M. Gerstein,“PartsList: a web-based system for dynamicallyranking protein folds based on disparate attrib-utes, including whole-genome expression and in-teraction information,” Nucleic Acids Res., vol.29, pp. 1750-1764, 2001.[8] J.M. Cherry, C. Adler, C. Ball, S.A. Chervitz,S.S. Dwight, E.T. Hester, Y. Jia, G. Juvik, T. Roe,M. Schroeder, S. Weng, and D. Botstein, “SGD:Saccharomyces Genome Database,” NucleicAcids Res., vol. 26, pp. 73-80, 1998; H.W.Mewes, D. Frishman, C. Gruber, B. Geier, D.Haase, A. Kaps, K. Lemcke, G. Mannhaupt, F.Pfeiffer, C. Schuller, S. Stocker, and B. Weil,“MIPS: A database for genomes and protein se-quences,” Nucleic Acids Res., vol. 28, pp. 37-40,2000; L. Stein, P. Sternberg, R. Durbin, J.Thierry-Mieg, and J. Spieth, “WormBase: Net-work access to the genome and biology ofCaenorhabditis elegans,” Nucleic Acids Res., vol.29, pp. 82-86, 2001; W.M. Gelbart, M. Crosby, B.Matthews, W.P. Rindone, J. Chillemi, S. RussoTwombly, D. Emmert, M. Ashburner, R.A. Drys-
July/August 2001 IEEE ENGINEERING IN MEDICINE AND BIOLOGY 39

dale, E. Whitfield, G.H. Millburn, A. de Grey, T.Kaufman, K. Matthews, D. Gilbert, V. Strelets,and C. Tolstoshev, “FlyBase: a Drosophila data-base. The FlyBase consortium,” Nucleic AcidsRes., vol. 25, pp. 63-66, 1997.
[9] P. Harrison, N. Echols, and M.B. Gerstein,“Digging for dead genes: An analysis of the char-acteristics of the pseudogene population in the C.elegans genome,” Nucleic Acids Res., vol. 29, pp.818-830, 2001.
[10] A. Drawid, R. Jansen, and M. Gerstein, “Ge-nome-wide analysis relating expression level withprotein subcellular localization,” Trends Genet.,vol. 16, pp. 426-430, 2000.
[11] H. Hegyi and M. Gerstein, “The relationshipbetween protein structure and function: a compre-hensive survey with application to the yeast ge-nome,” J. Mol. Biol., vol. 288, pp. 147-164, 1999.
[12] J.M. Thornton, C.A. Orengo, A.E. Todd, andF.M. Pearl, “Protein folds, functions, and evolu-tion,” J. Mol. Biol., vol. 293, pp. 333-342, 1999.
[13] M. Gerstein, “Patterns of protein-fold usagein eight microbial genomes: A comprehensivestructural census,” Proteins, vol. 33, pp. 518-534,1998.
[14] Y.I. Wolf, S.E. Brenner, P.A. Bash, and E.V.Koonin, “Distribution of protein folds in the threesuperkingdoms of life,” Genome Res., vol. 9, pp.17-26, 1999.
[15] P. Ross-Macdonald, P.S. Coelho, T. Roemer,S. Agarwal, A. Kumar, R. Jansen, K.H. Cheung,A. Sheehan, D. Symoniatis, L. Umansky, M.Heidtman, F.K. Nelson, H. Iwasaki, K. Hager, M.Gerstein, P. Miller, G.S. Roeder, and M. Snyder,“Large-scale analysis of the yeast genome bytransposon tagging and gene disruption,” Nature,vol. 402, pp. 413-418, 1999.
[16] P. Uetz, L. Giot, G. Cagney, T.A. Mansfield,R.S. Judson, J.R. Knight, D. Lockshon, V.Narayan, M. Srinivasan, P. Pochart, A.Qureshi-Emili, Y. Li, B. Godwin, D. Conover, T.Kalbfleisch, G. Vijayadamodar, M. Yang, M.Johnston, S. Fields, and J.M. Rothberg, “A com-prehensive analysis of protein-protein interac-tions in Saccharomyces cerevisiae,” Nature, vol.403, pp. 623-627, 2000.
[17] D. Christendat, A. Yee, A. Dharamsi, Y.Kluger, A. Savchenko, J.R. Cort, V. Booth, C.D.Mackereth, V. Saridakis, I. Ekiel, G. Kozlov, K.L.Maxwell, N. Wu, L.P. McIntosh, K. Gehring,M.A. Kennedy, A.R. Davidson, E.F. Pai, M.Gerstein, A.M. Edwards, and C.H. Arrowsmith,
“Structural proteomics of an archaeon,” Nat.Struct. Biol., vol. 7, pp. 903-909, 2000.[18] H. Zhu, J.F. Klemic, S. Chang, P. Bertone, A.Casamayor, K.G. Klemic, D. Smith, M. Gerstein,M.A. Reed, and M. Snyder, “Analysis of yeastprotein kinases using protein chips,” Nat. Genet.,vol. 26, pp. 283-289, 2000.[19] V.E. Velculescu, L. Zhang, W. Zhou, J.Vogelstein, M.A. Basrai, D.E. Bassett Jr., P.Heiter, B. Vogelstein, and K.W. Kinzler, “Char-acterization of the yeast transcriptome,” Cell, vol.88, pp. 243-251, 1997.[20] D. Shalon, S.J. Smith, and P.O. Brown, “ADNA microarray system for analyzing complexDNA samples using two-color fluorescent probehybridization,” Genome Res., vol. 6, pp. 639-645,1996.[21] D.J. Lockhart, H. Dong, M.C. Byrne, M.T.Follettie, M.V. Gallo, M.S. Chee, M. Mittmann,C. Wang, M. Kobayashi, H. Horton, et al., “Ex-pression monitoring by hybridization to high-den-sity oligonucleotide arrays,” Nat. Biotechnol.,vol. 14, pp. 1675-1680, 1996.[22] V.R. Iyer, C.E. Horak, C.S. Scafek, D.Botstein, M. Snyder, and P.O. Brown, “Genomicbinding sites of the yeast cell-cycle transcriptionfactors SBF and MBF,” Nature, vol. 409, pp.533-538, 2001.[23] T. Kohonen, Self-organization and Associa-tive Memory. Berlin, Germany: Springer-Verlag,1984.[24] M.B. Eisen, P.T. Spellman, P.O. Brown, andD. Botstein, “Cluster analysis and display of ge-nome-wide expresssion patterns,” Proc. Nat.Acad. Sci. USA, vol. 95, pp. 14863-14868, 1998.[25] P. Tamayo, D. Slonim, J. Mesirov, Q. Zhu, S.Kitareewan, E. Dmitrovsky, E. Lander, and T.Golub, “Interpreting patterns of gene expressionwith self-organizing maps: Methods and applica-tion to hematopoietic differentiation,” Proc. Nat.Acad. Sci. USA, vol. 96, pp. 2907-2912, 1999;T.R. Golub, D.K. Slonim, P. Tamayo, C. Huard,M. Gaasenbeek, J.P. Mesirov, H. Coller, M.L.Loh, J.R. Downing, M.A. Caligiuri, C.D.Bloomfield, and E.S. Lander, “Molecular classifi-cation of cancer: Class discovery and class predic-tion by gene expression monitoring,” Science,vol. 286, pp. 531-537, 1999; D.T. Ross, U. Scherf,M.B. Eisen, C.M. Perou, C. Rees, P. Spellman, V.Iyer, S.S. Jeffrey, M. Van de Rijn, M. Waltham,A. Pergamenschikov, J.C.F. Lee, D. Lashkari, D.Shalon, T.G. Myers, J.N. Weinstein, D. Botstein,and P.O. Brown, “Systematic variation in gene
expression patterns in human cancer cell lines,”Nat. Genet., vol. 24, pp. 227-235, 2000; C.M.Perou, S.S. Jeffrey, M. Van de Rijn, C.A. Rees,M.B. Eisen, D.T. Ross, A. Pergamenschikov, C.F.Williams, S.X. Zhu, J.C.F. Lee, D. Lashkari, D.Shalon, P.O. Brown, and D. Botstein, “Distinctivegene expression patterns in human mammary epi-thelial cells and breast cancers,” Proc. Nat. Acad.Sci. USA, vol. 95, pp. 9212-9217, 1999; A.A.Alizadeh, M.B. Eisen, R.E. Davis, C. Ma, I.S.Lossos, A. Rosenwald, J.C. Boldrick, H. Sabet, T.Tran, X. Yu, J.I. Powell, L. Yang, G.E. Marti, T.Moore, J. Hudson Jr., L. Lu, D.B. Lewis, R.Tibshirani, G. Sherlock, W.C. Chan, T.C.Greiner, D.D. Weisenburger, J.O. Armitage, R.Warnke, R. Levy, W. Wilson, M.R. Grever, J.C.Byrd, D. Botstein, P.O. Brown, and L.M. Staudt,“Distinct types of diffuse large B-cell lymphomaidentified by gene expression profiling,” Nature,vol. 403, pp. 503-511, 2000.
[26] M.P.S. Brown, W.N. Grundy, D. Lin, N.Cristianini, C.W. Sugnet, T.S. Furey, M. Ares Jr.,and D. Haussler, “Knowledge-based analysis ofmicroarray gene expression data by using supportvector machines,” Proc. Nat. Acad. Sci. USA, vol.97, pp. 262-267, 2000.
[27] A. Drawid and M. Gerstein, “A Bayesian sys-tem integrating expression data with sequencepatterns for localizing proteins: comprehensiveapplication to the yeast genome,” J. Mol. Biol.,vol. 301, pp. 1059-1075, 2000.
[28] P. Bertone, Y. Kluger, N. Lan, D. Zheng, D.Christendat. A. Yee, A.M. Edwards, C.H.Arrowsmith, G.T. Montelione, and M.B.Gerstein, “SPINE: An integrated tracking data-base and data mining approach for identifyingfeasible targets in high-throughput structuralproteomics,” Nucleic Acids Res., vol. 29, no. 13,pp. 2884-2898, 2001.
[29] J.R. Quinlan, C4.5: Programs for MachineLearning. San Mateo, CA: Morgan Kauffman,1993.
[30] National Center for Biotechnology Informa-tion (ncbi.nlm.nih.gov/geo); O. Ermolaeva, M.Rastogi, K.M. Pruitt, G.D. Schuler, M.L. Bittner,Y. Chen, R. Simon, P. Meltzer, J.M. Trent, andM.S. Boguski, “Data management and analysisfor gene expression arrays,” Nat. Genet., vol. 20,pp. 19-23, 1998; J. Aach, W. Rindone, and G.M.Church, “Systematic management and analysis ofyeast gene expression data,” Genome Res., vol.10, pp. 431-445, 2000.
40 IEEE ENGINEERING IN MEDICINE AND BIOLOGY July/August 2001