Integrative analysis and visualization of clinical and molecular … · 2019-03-12 · Enzo Medico...
20
Enzo Medico University of Torino Integrative analysis and visualization of clinical and molecular data for cancer precision medicine Candiolo Cancer Institute Laboratory of Oncogenomics [email protected]
Transcript of Integrative analysis and visualization of clinical and molecular … · 2019-03-12 · Enzo Medico...

Enzo Medico
University of Torino
Integrative analysis and visualization
of clinical and molecular data
for cancer precision medicine
Candiolo Cancer Institute
Laboratory of Oncogenomics
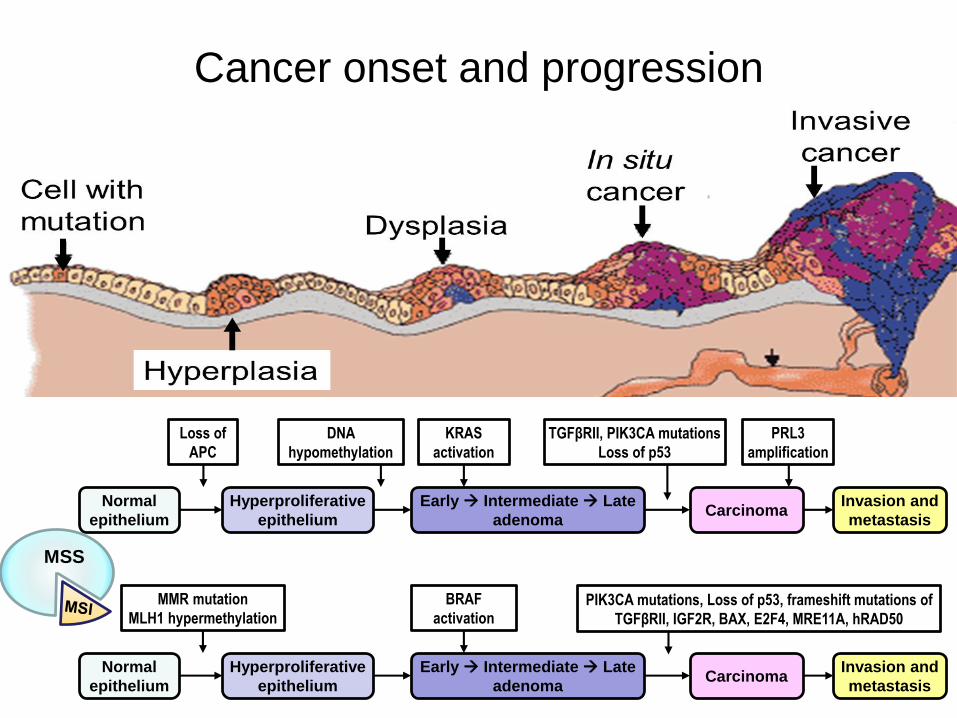
Cancer onset and progression
Normal
epithelium
Hyperproliferative
epithelium
Early → Intermediate → Late
adenomaCarcinoma
Invasion and
metastasis
Loss of
APC
DNA
hypomethylation
KRAS
activation
PRL3
amplification
TGFβRII, PIK3CA mutations
Loss of p53
Normal
epithelium
Hyperproliferative
epithelium
Early → Intermediate → Late
adenomaCarcinoma
Invasion and
metastasis
MMR mutation
MLH1 hypermethylation
BRAF
activationPIK3CA mutations, Loss of p53, frameshift mutations of
TGFβRII, IGF2R, BAX, E2F4, MRE11A, hRAD50
MSS
MSS

Towards precision cancer medicine
Targeted
drugTarget
Response
Target
alterations
Tissue/context-
specific modifiers
Sensitizing
alterations
De-sensitizing
alterations
Patient-specific
modifiers

Further elements of complexity
• Intratumoral heterogeneity
De-sensitizing lesions only present in a fraction of the cancer cells
may lead to early recurrence
• Intracellular signaling is governed by networks
Dynamic adaptation to altered signaling.
• Tumor-host interactions
Tumor growth and response also depends on stroma, vasculature,
inflammation and immune response
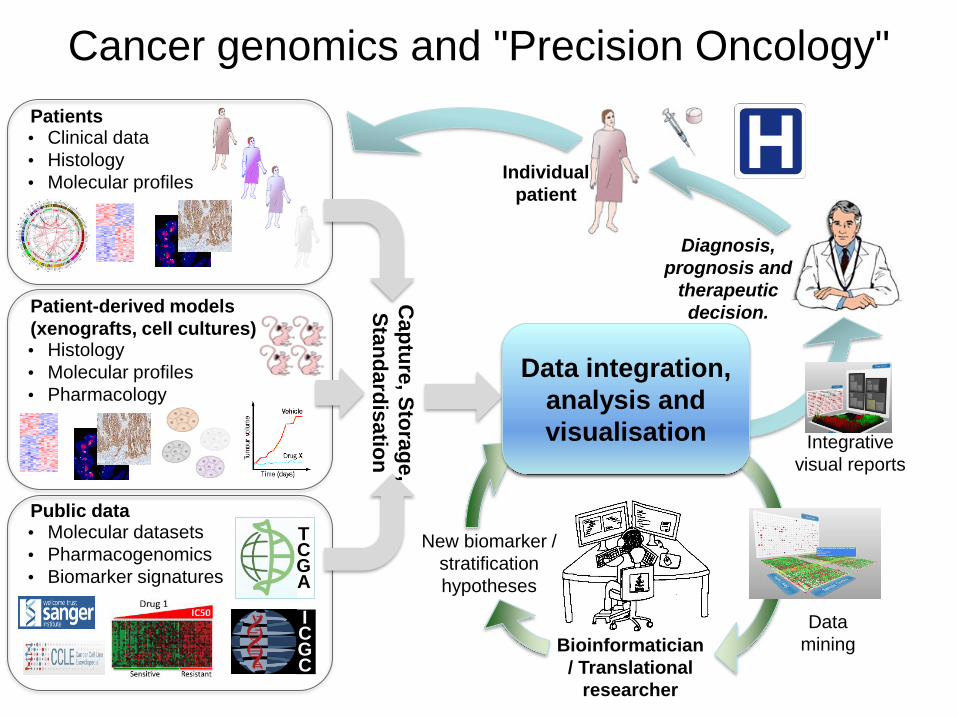
Data integration,
analysis and
visualisation
Individual
patient
Patients• Clinical data
• Histology
• Molecular profiles
Patient-derived models
(xenografts, cell cultures)• Histology
• Molecular profiles
• Pharmacology
Public data• Molecular datasets
• Pharmacogenomics
• Biomarker signatures
Bioinformatician
/ Translational
researcher
Data
mining
New biomarker /
stratification
hypotheses
TCGA
ICGC
Cap
ture
, Sto
rag
e,
Sta
nd
ard
isatio
n
Integrative
visual reports
Diagnosis,
prognosis and
therapeutic
decision.
Cancer genomics and "Precision Oncology"
Data integration,
analysis and
visualisation

Towards clinomics

MULTI-DIMENSIONAL MOLECULAR PROFILING
(primary samples, xenopatients, cells)
microRNA
profilingSequencing
Genotyping &
Array-CGHEpigenomics Proteomics
mRNA
profiling
Sequence/expression
databases
Gene sets (MSigDB)
Functional databases miRNA targets
Promoters
protein interactionsPublished signatures
Genome and
transcriptome
DATA INTEGRATIONSTANDARDIZATION – STORAGE
PROCESSING – ANNOTATION
ANALYSIS – VISUALIZATION
CLINICAL AND
PATHOLOGIC
DATA
PRECISION MEDICINEPredictions of individual treatment
response/resistance, risk stratification,
definition of clinical decision trees
Treatments and
responses in
Xenografts
CANDIDATE PRIORITIZATIONCoding/non-coding sequences whose
gain/loss-of-function is likely to affect
response to treatments
DATA MINING
Follow-up
Anamnestic data
Clinical history
Imaging
Pathology
Treatment(s)
EXPERIMENTAL
DATA
Treatments and
responses in cells
Functional/drug
screenings in
cells

The Genomic Data Flood

Typical reactions - I
Refuse
Despair
Succumb

Typical reactions - II
Ignore Adapt
…but what if…
Enjoy!!

• Choose the best data analysis tool on earth
• Process and organize data for the tool
• Keep in mind the end-user(s)

The most efficient pattern-
finding tool available on earth

• Choose the best data analysis tool on earth
• Process and organize data for the tool
• Keep in mind the end-user(s)

DA
TA
MA
TR
IX
12’0
00 g
en
es
300
samples
5 samples
9 g
en
es
The visualization problem:
reading numbers does not work
50
samples
90 g
en
es

Group Member
Height
Color
Basic
Object
Size
Highlight Blink
Continuous
Variables
Discrete
Variables
The concept of "visual metaphors"

a tri-dimensional environment in which different
types of information, such as gene expression,
dosage, methylation and clinical data can be
concomitantly visualized and analyzed.
:
www.kairos3d.it

Navigating colorectal cancer omics
DEMO

Summary
• Multiple levels of molecular alteration are functionally
involved in cancer initiation, progression, and response to
treatment.
• Reliable prediction of tumor aggressiveness and therapy
response requires integrative analysis of all data.
• Particular attention should be dedicated to interactive visual
environments, where end-users could easily navigate and
analyze the integrated information, at the genome, gene or
patient level.
GenomeCruzer playlist on Youtube:https://www.youtube.com/watch?v=buKx67CjcwY&list=PLuVag8CXc5J7wGiohs8Satz7TfUQYRaG2

Oncogenomics
Claudio Isella
Gabriele Picco
Consalvo Petti
Sara Bellomo
Andrea Terrasi
Daniela Cantarella
Roberta Porporato
Molecular Oncology & Cancer EpigeneticsCarlotta Cancelliere
Mariangela Russo
Michela Buscarino
Federica Di Nicolantonio
Alberto Bardelli
Surgery &
Gastroenterology
Alfredo Mellano
Michele De Simone
Andrea Muratore
Giovanni Galatola
Translational CancerMedicineGiorgia Migliardi
Davide Torti
Francesco Galimi
Francesco Sassi
Eugenia Zanella
Stefania Gastaldi
Andrea Bertotti
Livio Trusolino
Candiolo Cancer Institute
Acknowledgments
Luca Vezzadini
Riccardo Corsi
www.kairos3d.it