Integration of social care staff within community mental ... · Karasek JCQ Karasek Job Content...
235
© Queen‟s Printer and Controller of HMSO 2011. . This work was produced by Huxley et al. under the terms of a commissioning contract issued by the Secretary of State for Health. Project 08/1619/114 1 Integration of social care staff within community mental health teams Professor Peter Huxley, 1 Dr Sherrill Evans, 1 Dr Christine Baker, 1 Joanna White, 1 Sally Philpin, 1 Professor Steve Onyett, 2 and Professor Nick Gould 3 1 Centre for Social Work and Social Care Research, Swansea University 2 Independent consultant 3 University of Bath Published September 2011
Transcript of Integration of social care staff within community mental ... · Karasek JCQ Karasek Job Content...

© Queen‟s Printer and Controller of HMSO 2011. . This work was produced by Huxley et al. under the terms of
a commissioning contract issued by the Secretary of State for Health. Project 08/1619/114
1
Integration of social care staff within community mental health teams
Professor Peter Huxley,1 Dr Sherrill Evans,1 Dr Christine Baker,1
Joanna White,1 Sally Philpin,1 Professor Steve Onyett,2 and Professor Nick Gould3
1 Centre for Social Work and Social Care Research, Swansea University 2 Independent consultant 3 University of Bath
Published September 2011

© Queen‟s Printer and Controller of HMSO 2011. . This work was produced by Huxley et al. under the terms of
a commissioning contract issued by the Secretary of State for Health. 2
Project 08/1619/114
Address for correspondence:
Professor Peter Huxley
Centre for Social Work and Social Care Research
School of Human and Health Sciences
Swansea University
Singleton Park
SWANSEA SA2 8PP
Email: [email protected]
This report should be referenced as follows:
Huxley P J, Evans S, Baker C M, White J, Philpin S A, Onyett S, Gould N. Integration of
social care staff within community mental health teams. Final report. NIHR Service
Delivery and Organisation programme; 2011.
Copyright information:
This report may be freely reproduced for the purposes of private research and study and
extracts (or indeed, the full report) may be included in professional journals provided
that suitable acknowledgement is made and the reproduction is not associated with any
form of advertising. Applications for commercial reproduction should be addressed to
NETSCC, SDO.
Disclaimer:
This report presents independent research commissioned by the National Institute for
Health Research (NIHR). The views and opinions expressed by authors in this publication
are those of the authors and do not necessarily reflect those of the NHS, the NIHR, the
NIHR SDO programme or the Department of Health. The views and opinions expressed
by the interviewees in this publication are those of the interviewees and do not
necessarily reflect those of the authors, those of the NHS, the NIHR, the NIHR SDO
programme or the Department of Health

© Queen‟s Printer and Controller of HMSO 2011. . This work was produced by Huxley et al. under the terms of
a commissioning contract issued by the Secretary of State for Health. 3
Project 08/1619/114
Contents
Contents ………………………………………………………………………………………………………….. 3
List of tables ……………………………………………………………………………………………………. 6
List of figures …………………………………………………………………………………………………… 8
Glossary of terms/abbreviations …………………………………………………………………….. 9
Acknowledgements ………………………………………………………………………………………….. 11
Executive Summary ……………………………………………………………………………………….. 13
Background ……………………………………………………………………………………………………… 13
Aims …………………………………………………………………………………………………………………. 13
Methods …………………………………………………………………………………………………………… 13
Results ……………………………………………………………………………………………………………... 14
Conclusions ………………………………………………………………………………………………………. 17
The Report ……………………………………………………………………………………………………….. 18
1 Introduction ………………………………………………………………………………………………… 18
1.1 Aims and objectives (from the original protocol) ……………………………….. 19
2 Contexts and concepts ………………………………………………………………………………. 20
2.1 Contexts ……………………………………………………………………………………………….. 20
2.1.1 New Horizons and beyond …………………………………………………………… 21
2.1.2 A new outcomes orientation ………………………………………………………… 23
2.1.3 Multidisciplinary teams in mental health …………………………………….. 26
2.1.4 Previous research evidence on mental health team composition .. 27
2.1.5 New community mental health teams …………………………………………. 28
2.1.6 Previous research on new teams …………………………………………………. 30
2.2 Concepts ………………………………………………………………………………………………… 31
2.2.1 What is health and social care integration? ………………………………… 31
2.2.2 Team culture and climate ……………………………………………………………. 36
3 Methods …………………………………………………………………………………………………….. 40
3.1 The national survey of Trusts ……………………………………………………………… 40
3.2 The staff survey …………………………………………………………………………………… 41
3.2.1 Locations ……………………………………………………………………………………… 42

© Queen‟s Printer and Controller of HMSO 2011. . This work was produced by Huxley et al. under the terms of
a commissioning contract issued by the Secretary of State for Health. 4
Project 08/1619/114
3.2.2 Measures …………………………………………………………………………………….. 44
3.2.3 Data analysis ………………………………………………………………………….. 45
3.3 Service user interviews …………………………………………………………………… 47
3.3.1 Locations …………………………………………………………………………………… 47
3.3.2 Measures ………………………………………………………………………………….. 49
3.3.3 Data analysis and preparation ………………………………………………… 50
4 Results ………………………………………………………………………………………………….. 51
4.1 The national survey of trusts ………………………………………………………….. 51
4.1.1 Drivers for change ……………………………………………………………………. 57
4.2 The staff survey ……………………………………………………………………………….. 59
4.2.1 Team composition …………………………………………………………………….. 59
4.2.2 Integration ………………………………………………………………………………… 61
4.2.3 Team typology ………………………………………………………………………….. 61
4.2.4 Team member characteristics ………………………………………………….. 63
4.2.5 Team culture and climate ………………………………………………………….. 64
4.2.6 Location ………………………………………………………………………………………. 67
4.2.7 Team culture and team comparison …………………………………………. 71
4.2.8 Team culture by team type ………………………………………………………. 73
4.2.9 Team culture and professional groups …………………………………….. 73
4.2.10 Team culture and demography ………………………………………………… 77
4.2.11 Integration and inter-professional working ……………………………… 77
4.2.12 Location comparisons ……………………………………………………………….. 81
4.2.13 Professional group comparisons ………………………………………………. 84
4.3 Multivariate analysis …………………………………………………………………………. 86
4.3.1 Integration ………………………………………………………………………………… 86
4.3.2 Teamwork …………………………………………………………………………………. 88
4.3.3 Perceived Quality of Care ………………………………………………………… 91
4.3.4 Perceived job satisfaction ……………………………………………………….. 93
4.3.5 Intention to leave ……………………………………………………………………….. 95
4.4 Service user interviews ………………………………………………………………………. 97
4.4.1 Service User Questionnaire (SUQ) …………………………………………… 97
4.4.2 Manchester Short Assessment of Quality of Life (MANSA) ……. 99

© Queen‟s Printer and Controller of HMSO 2011. . This work was produced by Huxley et al. under the terms of
a commissioning contract issued by the Secretary of State for Health. 5
Project 08/1619/114
4.4.3 Carers‟ and Users‟ Expectations of Services (CUES) data ……. 102
4.4.4 The relationship between the WDQ data and the service user data 113
4.5.5 CUES free text response 117
4.4.6 Comments on services received (from CUES) ………………………….. 117
5 Final discussion ………………………………………………………………………………………. 133
5.1 Limitations of the study …………………………………………………………………….. 133
5.2 The national survey of Trusts …………………………………………………………… 135
5.2.1 Workforce planning is less than systematic ……………………………… 137
5.2.2 The social care composition of community mental health teams is
extremely variable ……………………………………………………………………… 138
5.3 The staff survey ………………………………………………………………………………….. 139
5.3.1 Specific professional contributions or new ways of working? …. 141
5.3.2 Higher social care composition is related to perceived quality of care
but not to integration ……………………………………………………………….. 142
5.3.3 High social care composition is associated with a lower intention of
leave the employer …………………………………………………………………….. 143
5.3.4 Management style is an important predictor ……………………………. 143
5.4 Service user interviews …………………………………………………………………….. 145
5.4.1 A more integrated service was less popular with service users … 147
5.4.2 Quality of life outcomes are not different, but there were relationships
between CUES variables and WDQ subscales ……………………………. 148
5.5 How these results fit with previous research ……………………………………. 149
5.5.1 Organisational integration ………………………………………………………….. 150
5.5.2 Team level integration ……………………………………………………………….. 151
5.5.3 Multidisciplinary integration ………………………………………………………… 151
6 Conclusions and recommendations ………………………………………………………… 155
References ………………………………………………………………………………………………………. 157
Appendix 1 Information sheet/consent form/questions (Phase I - the national
survey of Trusts) ……………………………………………………………………………………........ 170
Appendix 2 Workforce Dynamics Questionnaire (WDQ) / Karasek Job Content
Questionnaire (JCQ) …………………………………………………………………………………… 174
Appendix 3 Information sheet – team members (Phase II – the staff survey) 188
Appendix 4 Information sheet – service users (Phase III – service user
interviews ………………………………………………………………………………………………………. 191

© Queen‟s Printer and Controller of HMSO 2011. . This work was produced by Huxley et al. under the terms of
a commissioning contract issued by the Secretary of State for Health. 6
Project 08/1619/114
Appendix 5 Manchester Short Assessment of Quality of Life (MANSA) …… 194
Appendix 6 Carers‟ and Users‟ Expectations of Services (CUES) …………….. 206
Appendix 7 Service User Questionnaire (SUQ) …………………………………………. 226
List of tables
Table 1. Location characteristics for the staff survey ………………………………….. 43
Table 2. Average and range of team sizes and staffing numbers …………… 52
Table 3. Average CMHT team composition by data source (for major staff
groups only ............................................................................. 53
Table 4. Determinants of the composition of CMHTs ................................. 55
Table 5. Determinants of the social care membership of CMHTs ................. 56
Table 6. Staffing numbers by reason for CMHT team composition (n=50) ... 58
Table 7. Social care staff as a proportion of total team size in the four
locations ................................................................................. 60
Table 8. Social care staff as a proportion of the full team (Team typology) .. 62
Table 9. Professional group of respondents (Phase II teams only) .............. 64
Table 10. Team culture and climate: Descriptive statistics .......................... 66
Table 11. WDQ subscales scores by location ............................................. 68
Table 12. Karasek JCQ Scores ................................................................. 69
Table 13. WDQ subscales by proportion of social care staff in the team ........ 72
Table 14. WDQ subscales by team type .................................................... 74
Table 15. WDQ subscales by professional group ........................................ 75
Table 16. Proportion of sample with no overlapping role ….………………………….81
Table 17. Regression models: WDQ Integration …………………………………………..87
Table 18. Regression models: WDQ teamwork …………………………………………… 90
Table 19. Regression models: WDQ perceived Quality of Care …………………….92
Table 20. Regression models: WDQ perceived job satisfaction .…………………..94
Table 21. Regression models :Intention to leave the employer …………………...96
Table 22. Contact details: SUQ………….………….…………………………………………………98
Table 23. Satisfaction with care received - SUQ……………………………………….…….98

© Queen‟s Printer and Controller of HMSO 2011. . This work was produced by Huxley et al. under the terms of
a commissioning contract issued by the Secretary of State for Health. 7
Project 08/1619/114
Table 24. MANSA: Proportion wanting change and restricted opportunities by
locations A and D……………………………………………………………………………100
Table 25. Service users' satisfaction in key areas of their life …………………..103
Table 26 Service users' experience of and satisfaction with services .………104
Table 27 Test results for table 26 …………………………………………………….………..106
Table 28 Service users' satisfaction with key areas of their life ………….……107
Table 29 Service users' satisfaction with mental health services …………..…108
Table 30 CUES Section C: Free text responses, proportion responding …..111
Table 31 CUES Section C: Positive and negative free text responses ………112
Table 32 Professional group of respondents (Phase III teams only) ………..113
Table 33 Comparisons of team composition in locations A and D …………….114
Table 34 Associations between WDQ subscales and service user variables 116
Table 35 Care co-ordinators ……………………………………………………………………..…124

© Queen‟s Printer and Controller of HMSO 2011. . This work was produced by Huxley et al. under the terms of
a commissioning contract issued by the Secretary of State for Health. 8
Project 08/1619/114
List of figures
Figure 1. Community Mental Health Teams .............................................. 54
Figure 2. Proportion of social care staff in teams ....................................... 62
Figure 3 Inter-professional working and role overlap in the whole sample 79
Figure 4 Inter-professional working and role overlap by location ……………..83
Figure 5 Inter-professional working and role overlap by professional group.85
Figure 6 QoL comparison between three CMHTS ……………………………………….102

© Queen‟s Printer and Controller of HMSO 2011. . This work was produced by Huxley et al. under the terms of
a commissioning contract issued by the Secretary of State for Health. 9
Project 08/1619/114
Glossary of terms/abbreviations
ADSS Association of Directors of Social Services
AMHP Approved Mental Health Professional
AOT Assertive Outreach Team
ASW Approved Social Worker
CMHT Community mental health team
CPA Care Programme Approach
CPN Community Psychiatric Nurse
CQUIN Commissioning for Quality and Innovation
CRHTT Crisis Resolution and Home Treatment Team
CRT Crisis Resolution Team (sometimes used to mean CRHTT,
sometimes without home treatment)
CSIP Care Services Improvement Partnership
CUES Carers‟ and Users‟ Expectations of Services
CWI Centre for Workforce Intelligence
DH Department of Health
EIS Early Intervention in Psychosis Services
EIT Early Intervention Team (usually means the same as EIS)
FACS Fair Access to Care Services
FTE Full time equivalent
HoNOS Health of the Nation Outcome Scores
HRH Human Resources for Health
IAPT Improving Access to Psychological Therapies
ICP Integrated Care Pathways
Karasek JCQ Karasek Job Content Questionnaire
MANSA Manchester Short Assessment of Quality of Life
MHN Mental Health Nurse
MLM Multi-level modelling
NICE National Institute for Health and Clinical Excellence
NPMS National Psychiatric Morbidity Survey

© Queen‟s Printer and Controller of HMSO 2011. . This work was produced by Huxley et al. under the terms of
a commissioning contract issued by the Secretary of State for Health. 10
Project 08/1619/114
NSF National Service Framework for Mental Health
NSIP National Social Inclusion Programme
OSCA Outcomes of Social Care for Adults
OT Occupational Therapist
PREM Patient-reported experience measure
PROM Patient-reported outcome measure
PSSRU Personal Social Services Research Unit
QOC Quality of Care
QOL Quality of Life
STR Support Time & Recovery Worker
SUQ Service User Satisfaction Questionnaire
SWB Subjective well being
WACDS Wales Alliance for Citizen Directed Services
WAG Welsh Assembly Government
WDQ Workforce Dynamics Questionnaire
WHO World Health Organisation
WRT NHS Workforce Review Team

© Queen‟s Printer and Controller of HMSO 2011. . This work was produced by Huxley et al. under the terms of
a commissioning contract issued by the Secretary of State for Health. 11
Project 08/1619/114
Acknowledgements
First and foremost we wish to thank Karen Evans for her painstaking efforts throughout this project, for going beyond the call of duty on many occasions
but most notably in the final preparations of this report. Without her none of this would have been possible or completed professionally.
We wish to thank all the senior managers, team managers and team
members and service users for their participation in the three phases of this
investigation. We are also grateful to service users and service user
researchers who helped to complete the qualitative data collection,
especially Bill Davidson and Sarah King. We also thank Dr Ben Hannigan and
Professor Keith Lloyd for very helpful comments on drafts of the report. We
thank the following for their statistical expertise and advice: Dr Morven
Leese, Dr Peter Schofield and Dr Alan Watkins.
Finally, we would like to thank SDO not only for funding the study but for
their support throughout and understanding at particularly difficult times. In particular we would like to thank Phil Restarick and Ruth Saw whose advice and support has been much appreciated.
Contributions of Authors:
Professor Peter Huxley: PI and lead investigator, involved in the conception,
design, execution and writing up of the drafts and final reports.
Professor Steve Onyett and Professor Nick Gould replaced original
applicants when the proposal was made from Kings College in London and
then moved to Swansea. They participated in meetings about the direction
of the research, and then contributed to the interpretation of the results
drawing on their professional expertise in relation to community mental
health teams and social work respectively. They have provided advice at
key stages of the projects as well advising on all drafts of the three Phases
of the research, and approving the final version of the report.
Dr Sherrill Evans, Co-investigator was involved in the conception, design,
execution and writing up of the drafts and final reports. She was also
responsible overseeing the production of the survey instruments,
supervising research staff, and conducting the statistical analysis with
advice from experts cited in the acknowledgements.
Dr Christine Baker, was the senior researcher who worked with two other
research staff to arrange for the data to be collected and entered into SPSS.
She has contributed to the interpretation of the data and to the writing of
drafts and the final report.
Jo White was one of the research staff who conducted the telephone
interviews and went to the locations to arrange for data collection. She was

© Queen‟s Printer and Controller of HMSO 2011. . This work was produced by Huxley et al. under the terms of
a commissioning contract issued by the Secretary of State for Health. 12
Project 08/1619/114
also involved in data entry, interpretation of the results, and in the drafting
of the draft and final reports. She also managed relations with the Research
and Development bodies of the responding Trusts, and completed regular
update reports.
Sally Philpin was one of the research staff who conducted the telephone
interviews and went to the locations to arrange for data collection. She was
also involved in data entry, interpretation of the results, and in the drafting
of the draft and final reports. She also managed relations with the Research
and Development bodies of the responding Trusts, and completed regular
update reports.
This project was funded by the National Institute for Health Research
Service Delivery and Organisation programme (project number
08/1619/114)

© Queen‟s Printer and Controller of HMSO 2011. . This work was produced by Huxley et al. under the terms of
a commissioning contract issued by the Secretary of State for Health. 13
Project 08/1619/114
Executive Summary
Background
Multidisciplinary community mental health teams (CMHTs) have been the
central organisational feature of the delivery of mental health care for
decades. New teams (early intervention, home treatment and crisis
resolution, assertive outreach) have been introduced in England and their
composition has largely been left to local services to determine. Previous
research has suggested that services can have better outcomes when
delivered by multidisciplinary teams, and that new teams may have better
outcomes than CMHTs for certain people. The rationale for team
composition has never been explored systematically. Team composition
varies considerably in terms of the proportion of the team made up of social
care staff (social workers and social support workers) as opposed to health
care staff. Previous research has not focused on the social care component
of teams - which will arguably become more important as services attempt
to implement government policy that emphasises public mental health.
Aims
The aim of the present study is to provide evidence about team
composition, in particular the extent of the social care component, and
whether composition influences the culture and climate of the team and
whether this makes a difference to the service users.
Methods
Phase I: a national survey of Trusts providing mental health services in
England and Wales to describe the number of teams and their composition,
the rationale for that composition and the social care component and the
drivers of any contemplated changes in teams configuration. Referred to
hereafter as „The National Survey‟‟
Phase II: a staff survey in four locations selected purposely for their
differently constituted teams. Two locations were in England and two in

© Queen‟s Printer and Controller of HMSO 2011. . This work was produced by Huxley et al. under the terms of
a commissioning contract issued by the Secretary of State for Health. 14
Project 08/1619/114
Wales. Standardised instruments were used to assess team culture and
climate and its relationship with team composition. Referred to hereafter as
„The Staff Survey‟ in four Trusts.
Phase III: Interviews with service users in two of these locations that
had contrasting climate and cultures in the teams, using standardised
instruments and a satisfaction questionnaire, to determine whether service
user outcomes are related to team composition, culture and climate.
Referred to hereafter as the „service user interviews‟. The sample size was
small, underpowered for quantitative analysis, and results can only be
regarded as indicative not substantive.
Results
The National Survey
42/79 Trusts responded (53%) covering 381 teams staffed by 6646 people
of whom 19% were social workers and 10% were social support workers.
Nurses formed one third of the workforce. The average team size was 17.7
(sd 5.5).There were no significant differences in workforce numbers and
types of team between responding and non-responding Trusts.
Social care composition ranged from 0% to 88% of the team. Social work
staffing levels were lower where the funding was entirely in the hands of the
local authority. Staffing deficits remained (compared to policy guidance
figures) in social support staff, psychiatrists, occupational therapists (OTs)
and psychologists.
The most common rationale for overall team composition was historical
(46%) followed by policy guidance, demand factors and financial resources.
A third of the rationales for the social care component of the team involved
the need for integration or multidisciplinarity.
With regard to planned changes to teams, extensive policy guidance was
very influential on management decisions. One consequence has been the
redeployment of CMHT staff to new teams; smaller Trusts with smaller
existing teams were more likely than larger Trusts to be considering
redeployment of staff.
The findings support previous research that suggests workforce composition
is determined more by supply and historical factors than by demand or need
factors.

© Queen‟s Printer and Controller of HMSO 2011. . This work was produced by Huxley et al. under the terms of
a commissioning contract issued by the Secretary of State for Health. 15
Project 08/1619/114
The staff survey
300 staff from two Welsh (18 teams) and two English Trusts (24 teams)
completed the Workforce Dynamics Questionnaire (WDQ) and the Karasek
Job Content Questionnaire (JCQ).
Ninety percent of CMHTs responded and 60% of new teams. The individual
staff response rate was 46%. There were no differences in response rate by
professional group, country or Trust.
The main factor determining team composition was again historical (50%),
but resources played a greater part than in the National Survey (26%) as
did multidisciplinary (52%).
Almost one-fifth of teams had fewer than 10% social care staff, and only
seven per cent had over 60%. Six teams had no social care input at all, five
were in Wales.
New teams are smaller than CMHTs and have only 19% social care staff
compared to 31.6% on average in CMHTs. More than one third of new
teams have no social workers and 52% have no social support workers.
Twenty-nine percent of new teams (n=4) had no social care input compared
to 7% of CMHTs (n=2).
Where budgets were pooled the proportion of social care staff was significantly higher.
WDQ Multivariate results
The final regression models explained a modest amount of the variance of
perceived integration (29.6%), perceived Quality of Care (48.5%), overall
job satisfaction (46.1%) and intention to leave (37.6%) but 68.5% of
teamwork.
Better integration scores were associated with new teams (which have a
lower social care component), better management, and the „other‟ staff
group (OT, psychologist, psychiatrist etc) who were in short supply and
often worked on a sessional basis. Support workers‟ integration scores were
higher where the social care component of team was higher.
Teamwork scores were predicted by higher (better) scores on role
perception and flexibility, better management, more social support in the
team, fewer job demands and not being co-located.
Perceived Quality of Care scores were significantly related to better
teamwork, better management, and higher social care composition (over
60%), to a lesser extent less autonomy (p=0.057).
Job satisfaction was related to fewer job demands, working closely with
nurses, better management, more decision latitude, less overlap with
nursing roles, better training and more uncertainty about the future of the
service.

© Queen‟s Printer and Controller of HMSO 2011. . This work was produced by Huxley et al. under the terms of
a commissioning contract issued by the Secretary of State for Health. 16
Project 08/1619/114
Intention to leave was more prevalent among social workers than among
nurses, less likely in CMHTs, and in larger teams and where job satisfaction
was higher.
There were no significant differences between the four locations in terms of
the JCQ subscales (decision latitude, social support and psychological job
demands) quality of care, job satisfaction and uncertainty about the future.
Uncertainty was highest in the Trust seeking Foundation status.
One Trust (C) scored consistently higher, and one Trust (D) consistently
lower than the others in terms of teamwork, autonomy, management style,
training and access to IT. Both of these teams were in England.
Social care workers are the most likely to want to leave, especially where
they are working in a team with low social care composition.
Service user interviews
The size of teams in the selected locations (A and D) were similar, but the
numbers of nurses significantly higher in A, and social care workers
significantly higher in D. Forty five service users completed standardised
interviews one of which allowed free text responses, which were analysed
thematically. Because of the small sample size these results, in particular
the quantitative analysis (which is underpowered) need to be treated with
caution.
Excellent care was cited by 50% of users in A but only 39% in D (but not
statistically significant).
Almost all needs were met for 62% of users in A compared to 33% in D
(p=0.001).
Only two people were in work, and 46% had no leisure activities at all. The
CUES, MANSA and free text results are consistent with each other,
suggesting that satisfaction with mental health, not working and having no
leisure is low, and satisfaction with friends, family, safety and
accommodation are all high.
Quality of life scores were all similar, except for family relationships, which
were significantly better in A.
The experience of stigma was better in D, but qualitative findings revealed
that much of the stigma experienced stemmed from the service, rather than
the public. The reverse was true in A.
The integration subscale of the WDQ was unrelated to any of the user
measures.
Workers overall job satisfaction was associated with the level of choice
experienced by users and their satisfaction with the choice available to
them. These results should be regarded as indicative and not definitive,
until a suitably powered study can be conducted

© Queen‟s Printer and Controller of HMSO 2011. . This work was produced by Huxley et al. under the terms of
a commissioning contract issued by the Secretary of State for Health. 17
Project 08/1619/114
Conclusions
The results suggest that more work needs to be done on workforce planning
and better linkage is needed between supply, demand and resource factors.
In the implementation of future mental health policy initiatives
consideration needs to be given to whether the social care component of
teams and the skills associated with community social work, employment
work and support work are adequately available in team members.
The term integration continues to be used rather loosely. Workers‟
perceptions of integration may be related to a secure professional group
identity, where teams are less mixed (leading to higher integration scores
on the WDQ). The presence of a greater proportion of social care staff in the
team is associated with higher perceived quality of care among staff.
A larger study involving additional outcome measures is needed in order to
definitively address the question of the influence of team level factors on
user outcomes. The present study results suggest that this ought to be
achievable with a larger sample.

© Queen‟s Printer and Controller of HMSO 2011. . This work was produced by Huxley et al. under the terms of
a commissioning contract issued by the Secretary of State for Health. 18
Project 08/1619/114
The Report
1 Introduction
Multidisciplinary community mental health teams (CMHTs) have been the
central organisational feature of the delivery of care for decades. The
rationale for team composition has never been explored systematically.
Team composition varies considerably in terms of the proportion of the
team made up of social care personnel (social workers and social support
workers) as opposed to health care staff. New teams (early intervention,
home treatment and crisis resolution, assertive outreach) have been
introduced in England and their composition has largely been left to local
services to determine. Previous research has tended to confirm that
services can have better outcomes when delivered by multidisciplinary
teams, however little attention has been paid to the social care components
of such teams. Some people have suggested that integration of health and
social care in CMHTs may lead to better outcomes, and new teams have
advantages over the CMHT. None of this research has focused on the social
care components, which will arguably become more important as services
attempt to implement the New Horizons policy(1) with its emphasis on public
mental health.
Phase I of the study (The National Survey) draws upon national survey data
provided by senior managers in NHS Trusts in England and Wales in 2007,
to illustrate the workforce planning arrangements for community mental
health teams (CMHTs). The focus is on what influences decisions about
team composition, particularly decisions to employ social workers or social
care support workers (usually untrained non-professionals) alongside
psychiatrists, nurses and other health care staff, and what changes to team
composition are planned and why.
Mental ill health is associated with a range of social causes but also has
considerable social consequences in terms of peoples‟ ability to work and so
maintain an adequate and stable financial situation, their ability to form and
maintain friendships, engage in local communities and community activities
etc. Social workers have historically adopted an holistic approach to mental
health care looking at the wider needs of the person rather than just the
person‟s illness. New mental health policies in England and Wales are based
on a public mental health approach, in which social work skills such as those
relating to community engagement and promoting social inclusion will be
more in demand.

© Queen‟s Printer and Controller of HMSO 2011. . This work was produced by Huxley et al. under the terms of
a commissioning contract issued by the Secretary of State for Health. 19
Project 08/1619/114
1.1 Aims and objectives (from the original protocol)
Phase I: The national survey of Trusts
The composition of mental health teams appears to be determined by
factors other than the need to integrate health and social care
professionals. Mental Health Mapping Data(2) ashows that there is enormous
variability in team composition, with some teams operating with no social
care staff at all. We need to understand the factors that determine this
situation. This will provide us with an insight into current workforce planning
and provide evidence about the key determinants of team structure and
inputs. This will be of general value to health and social care workforce
planners.
Phase II: The staff survey in four locations
We also need to know, however, whether variability in team composition
makes any difference to the way that these teams operate. The evidence
produced may show that the social care component needs to be at a certain
level in order for team climate to be positively affected, or it may show that
having too many social care members interferes with team functioning in an
unhelpful way. In either event, this is useful information for those who plan
the teams, and for those who manage them.
Phase III: Service user interviews
Finally, does the composition or characteristics of the teams, relate in any
way to outcomes for service users. As one referee of the original proposal
pointed out, without an understanding of whether the structure and the
processes make a difference to outcomes, the exercise would be far less
worthwhile and fail to address a key issue. We therefore need to interview
service users, using standardised instruments to see if the differences in
structure and process can be identified at the outcome stage. As this Phase
was not in the original proposal, the resources that could be devoted to it
were less than ideal. Service user researchers conducted the interviews in
two of the locations.
The report begins with an introduction to the policy and practice contexts in
which the study took place, and the conceptual terminology used, bearing in
mind that the terms „integration‟ „climate‟ and culture‟ are contestable
constructs. We explain the rationale for our approach to these topics in the
next Chapter.
a Mental Health mapping data was collected by Durham University on behalf of the DH. It was based on
managers’ annual returns covering the number and type of services offered by the Trust, and the numbers and
types of staff employed. It transferred to Mental Health Systems of Salford.

© Queen‟s Printer and Controller of HMSO 2011. . This work was produced by Huxley et al. under the terms of
a commissioning contract issued by the Secretary of State for Health. 20
Project 08/1619/114
2 Contexts and concepts
In this Chapter we consider the context in which this study took place. We
look at the policy context in terms of workforce planning, and the policies
that affect mental health service delivery and organisation, specifically in
relation to community teams. In this Chapter we also attempt to address
the vexed question of the definition of integration, culture and climate, as
well as associated terms.
2.1 Contexts
It has been argued that the global health workforce and the behavioural
health workforce in the USA are in crisis(3, 4). Mental health services around
the world are experiencing shortages across staff groups(5) not only within
psychiatry(6, 7) and nursing(8). In this context and in an era of worker
migration workforce planning has become a global issue(9, 10). Following the
first worldwide forum on Human Resources for Health (HRH) governments
have been called upon to determine the appropriate health workforce skill-
mix and to institute coordinated policies for the community health
workforce(3). The World Health Organisation (WHO) and Global Health
Workforce Alliance have since produced an HRH Action Framework(11) to
inform the development of best workforce planning practice. As in the past,
social care workforce planning is at risk of being forgotten as part of this
process.
Workforce planning has three main elements(12) relating to the demand for
staff of different types, the supply of these staff and the balance between
the two. The extent to which the planning process connects with and
influences funding allocation decisions about staffing levels and mix is more
critical in determining impact on national policy and local service delivery
than workforce planning itself(12). The present study attempts to examine
that relationship with regard to CMHTs.
The need for better workforce development planning is now acute given the
ageing population(6), and ageing mental health nursing(8) and social work
workforces(13, 14). For example, 42% of the UK social work workforce were
aged over 50 in 2003(14), and in the USA 62% were over 40 years old in
2006(13). Unlike the US where there is a planned 30% growth rate for social
workers (from a base of 310,000 of whom about half work in mental
health), the growth in mental health social work in the UK is unplanned,
small and slow. One report(15) identified a need for a 120% increase in the
number of social workers, starting from a small base of about 4,000

© Queen‟s Printer and Controller of HMSO 2011. . This work was produced by Huxley et al. under the terms of
a commissioning contract issued by the Secretary of State for Health. 21
Project 08/1619/114
workers. The UK growth rate in social work contrasts considerably with
community mental health nursing, which benefited from 70% growth
between 1990 and 1996(16), and a further 13% growth between 1999 and
2003(17).
Criticisms of the state of UK health and social care services and of workforce
planning in particular(12, 18-20) have continued despite an overhaul of
workforce planning in the NHS in England(21). The House of Commons Health
Select Committee report(20) was particularly scathing describing workforce
planning in the NHS as a „disastrous failure‟, and pointing to a lack of
strategic planning, insufficient workforce planning capacity, poor integration
and coordination between workforce and financial planning, constant re-
organisation, and short-termism as associated factors. Neither social care
nor mental health are current priorities for the UK NHS Workforce Review
Team (WRT) despite recognition of the need „to bridge the gap between
health and social care provision‟(22) (p3) and to pilot work on integrated care
organisations that connect health and social care(23).
2.1.1 New Horizons and beyond
New Horizons(1), the Labour government‟s plan for mental health and social
care services from 2010 onwards is firmly based on the NHS Next Stage Review(23) thinking and principles. The emphasis is on the strengthening of mental health in a broad sense, reducing inequalities and increasing
participation with a firm focus on related outcomes such as quality of life, recovery and social inclusion. The new Health Secretary has recently
outlined a vision for locally led NHS service changes that continue to support this approach and emphasise the need to ensure that patient outcomes, clinical evidence and a person-centred approach are at the heart of any
changes to health services(24).
“When they need it, all patients want care that is personal to
them.
That includes those people traditionally less likely to seek
help or who find themselves discriminated against in some
way”.(p 15)
The move to the New Horizons agenda requires an emphasis on non-
medical and non-clinical interventions. It is a new approach to mental health
that brings together a wide range of voluntary and statutory agencies as
well as communities and individuals to work towards a situation where
people understand that their mental well-being is as important as their
physical health. It also sets out the benefits, including economic benefits, of
maintaining good mental health. It aims to cover a person‟s lifetime, from
childhood, through to maintaining resilience in older age. New Horizons(1)
also emphasises the importance of prevention, early intervention, effective
treatment and recovery.
This new approach may have implications for professional groups working in
mental health and the necessity to review current working practices. For
example, the Chief Nursing Officer undertook a review in 2006(18) to ask the

© Queen‟s Printer and Controller of HMSO 2011. . This work was produced by Huxley et al. under the terms of
a commissioning contract issued by the Secretary of State for Health. 22
Project 08/1619/114
question „How can mental health nursing best contribute to the care of
service users in the future?‟ and recommended:
“Mental health nursing should take a holistic approach, seeing
service users as whole people and taking into account their
physical, psychological, social and spiritual needs. This means
that MHNs need to widen their skills to improve service users‟
physical well-being through better assessment and health
promotion activities and provide more evidence-based
psychological therapies.” (p 4).
Whilst recommendations for change to fit with this approach are mentioned
within nursing, acknowledgement of the current working practices and
principles of social work has been described by The British Association of
Social Workers as "disappointing.” It is suggested that social workers are
able to make a valuable contribution to this way of working.
“The four guiding values of equality and justice, reaching full
potential, being in control, and valuing relationships, are some of
the guiding principles of New Horizons that fit well with a social
work approach.”(25)
Planning for team composition is more than getting the correct
numbers of team members but also ensuring that staff have the
necessary skills to provide high quality care to mental health service
users. However it has been shown that nurse workforce planning in
the UK tends to be led not by demand and need but rather by supply
factors. Buchan(12) suggests that supply, demand and finances need
linking in a way that they are not at present. Similarly, the House of
Commons Health Committee(20) was highly critical of NHS workforce
planning and highlighted some of the underlying problems that drove
these failures, including a lack of alignment between workforce
planning and service/financial planning, and inadequate workforce
planning capacity. In 2008, the NHS Next Stage Review (23) called for
service providers and local commissioners to take a leading role in
workforce planning. A Centre for Workforce Intelligence (CWI)(23) has
since been set up to provide leadership to help improve the quality
of forecasting and provide expert support in workforce planning
across the health and social care system.
A more recent report considered the extent to which NHS workforce
planning in England is likely to support the delivery of a workforce fit for the
future.(26) The Report warned that there will be a risk that the current
workforce planning system will continue to drive investment towards „more
of the same‟ which maintains the supply-led, single-profession approach
that has previously dominated the NHS and contributed to its inefficiencies
(and which is evident in the results of the present study).
The authors of that report concluded:

© Queen‟s Printer and Controller of HMSO 2011. . This work was produced by Huxley et al. under the terms of
a commissioning contract issued by the Secretary of State for Health. 23
Project 08/1619/114
“There is a need for new thinking based on the recognition that
the workforce should have the skills and potential to respond
flexibly to a population with changing health care needs, be able
to work effectively in teams to deliver new models of care, and be
able to work with new technologies. These should be core policy
objectives at any time but, in the constrained funding situation
that the NHS will be in for the foreseeable future, they must
become key factors in ensuring its survival.” (p 28)
The authors questioned how planning could be better integrated across different professional groups when funding and planning remain divided
between the medical and „non-medical‟ workforces. The report recommended that in consideration of the prospects of reduced funding
during the present economic climate there should be more focus on integration by linking financial and workforce planning, particularly in the
light that the NHS may not be able to afford the number of doctors or nurses currently being supplied and planned. There will remain however, serious obstacles to over come, for instance in the form of the different
terms and conditions of the health and social care workers.
2.1.2 A new outcomes orientation
In England, the NHS Next Stage Review(23) makes it clear that there is going to be an increasing reliance on outcomes performance. Under the
Commissioning for Quality & Innovation (CQUIN) scheme(27) providers will be rewarded in the first year for submitting outcomes and quality data and then from 2010, payments will reward outcomes under the scheme. The
World Class Commissioning programme(28) is designed to raise ambitions for a new form of commissioning that delivers better health and well-being for
the population, improving health outcomes and reducing health inequalities. In addition, NHS commissioners will be held to account for the quality of health outcomes that they achieve for the populations they serve, including
the most vulnerable or excluded people with complex care needs. The Outcome Framework for Mental Health Day Services(29) followed by the
Outcomes Framework for Mental Health Services(30) for example, have been devised to help commissioners and providers to monitor, evaluate and measure the effectiveness of day services for adults of working age with
mental health problems.
In Wales, a series of Welsh Assembly Government (WAG) papers and announcements confirm the need for adult social care services to be based
on available evidence and aim for efficiency and effectiveness in producing the best outcomes for service users(31, 32) . Designed for Life(33) for instance says the government will „ensure that changes are based on evidence of
what works‟ in health and social care,(p14) and that „establishing an evidence base for health and social care … is a vital component‟ of the
strategy (p32). The evidence base for health is better established, as are the means of assessing outcome. As a result of the Wanless Review(34) the Assembly intends to measure health outcomes using the Health Gain

© Queen‟s Printer and Controller of HMSO 2011. . This work was produced by Huxley et al. under the terms of
a commissioning contract issued by the Secretary of State for Health. 24
Project 08/1619/114
Targets for Wales for 2012, but no similar measure exists for the outcome of social care over the same period.
Fulfilled Lives, Supportive Communities(31) expects social services in Wales
to become outcome orientated. The vision is of social services, which are
strong, accessible, and accountable, in tune with citizens‟ and communities‟
needs and promote social inclusion, citizens‟ rights and good outcomes
(1.6). All parts of social care services are expected to improve outcomes for
service users, including adult service users (3.21). In adult services it is
recognised that improved outcome measures are needed and that the
universal standards for social services must incorporate training and
performance of staff in the use of research evidence. Joint strategic
outcomes for health and social services will also be developed as part of this
work (4.21). These themes continue in the more recent document ‘Better
Outcomes for Tougher Times‟(35) that sets out a plan to improve public
services in Wales within the current pressure on public finances and an
increasing demand for services and action. The approach calls for the needs
of citizens to be met through local and regional collaboration and
partnership rather than competition, improving performance by shifting the
balance from reliance on targets to focus more on outcomes and providing
better information and evidence through the use of surveys and
performance indicators. This document recognises the need for better
workforce planning in public sector services.
There has been a general move towards self directed services in creating
person-centred care in the UK. Personalised and integrated care planning
supports World Class Commissioning(28) and the aims of Putting People
First(36) and recognises there are needs other than medical that can impact
on a person‟s total health and well-being. A full range of issues are
considered including ethnic and cultural background, health, personal,
social, family, educational and the mental health needs of a service user.
The approach is a holistic process with a focus on outcomes to ensure
people have choice and control over their support arrangements. Patients
do want to be more involved in individual decisions made about their own
treatment and generally participate much less in these decisions than they
would wish.(37)
Several recent documents in Wales subscribe to this way of giving service
users control over their lives including Putting People First(36) ;One Wales: A
progressive agenda for the government of Wales(38); Fulfilled Lives,
Supportive Communities(31); and Adult Mental Health Services: Stronger in
Partnership 2(39). The Wales Alliance for Citizen Directed Services
(WACDS)(40) was launched in June 2010 in support of developing a Welsh
approach to increased choice and control for service users.
As part of this process, service providers should offer service users the
chance to be involved in drawing up their own care plan. Nevertheless, the
issue of service user involvement in care planning has had a poor history
and was one of the shortcomings identified by the Healthcare

© Queen‟s Printer and Controller of HMSO 2011. . This work was produced by Huxley et al. under the terms of
a commissioning contract issued by the Secretary of State for Health. 25
Project 08/1619/114
Commission(41). In a survey of 27,000 mental health service users on the
Care Programme Approach (CPA), only 53% of all respondents said they
had been given or offered a copy of their care plan. Forty-five percent of
those on the standard care programme approach had been given (or
offered) a copy of their care plan, although this increased to 71% amongst
those on the enhanced care programme approach. Respondents who had
been given or offered a copy were asked about their understanding of, and
involvement in, their care plan. Fifty-eight percent of people said that they
definitely understood what was in their plan. Of those who wanted to be
involved in drawing up their plan 40% said that they definitely had been
while 35% said that they had been involved to some extent and 25% said
that they had not been involved. In addition, for personalisation to be
successful, as well as service users being involved in developing their own
plans there is yet no clear direction in the delivery of personal care planning
as warned by Goodwin and Lawton-Smith(42) in the following way:
“Personalised care planning appears to be an essential part of the
design, yet it is clear that no specific vision exists for how this
maybe delivered. Little guidance as yet, has been put forward for
how a holistic assessment of need should be made, who should
take responsibility for coordination of the care package that
results; and the skills and leverage that the care co-ordinator
needs to be effective.” (p3).
Traditionally the focus for measuring the effectiveness of care has been mainly based on measuring clinical indicators. One exception has been an interest in patient based outcomes that have measured the impact of illness
or healthcare interventions on the individual and how they live day-to-day.(43)
Lord Darzi‟s Report(23) made quality of care and treatment a guiding
principle and the basis for the future development of Health and Social Care
services. The view of service users on the success of their treatment and
the quality of their care through personal experience has now been given
prominence.
“Patient experience. Quality of care includes quality of caring. This
means how personal care is – the compassion, dignity and respect
with which patients are treated. It can only be improved by analysing
and understanding patient satisfaction with their own experiences.”
(p 47).
Service users‟ experience of treatment and care has become a major
indicator of quality and there has been a recent expansion of different
measures including patient reported experience measures (PREMS) which
are used to understand patients‟ views on their experience while receiving
care, rather than the outcome of that care. Patient-reported outcome
measures (PROMs) have also been used to provide a means of gaining an
insight into the way patients perceive their health and the impact that
treatment or adjustments to personal lifestyle have had on their quality of

© Queen‟s Printer and Controller of HMSO 2011. . This work was produced by Huxley et al. under the terms of
a commissioning contract issued by the Secretary of State for Health. 26
Project 08/1619/114
life. Client centred care in mental health requires the collection of
outcomes that are consequential to service users and clinicians. A study
conducted to explore how services users understood and prioritised
outcomes found that they placed a great emphasis on non-clinical and
social outcomes.(44)
Accordingly, the present study will involve a consideration of the views of
service users in services with different levels of integration.
2.1.3 Multidisciplinary teams in mental health
Ovretveit(45, 46) was one of the first to delineate models of multidisciplinary
mental health team management and organisation describing teams in three
dimensions: structure, process and integration. Structure refers to the
composition of teams and how team composition is managed. Existing
evidence suggests that the rationale for team composition is rarely well
thought out, and highlights a need for more research to establish the
optimal skill-mix within teams(47).
A recent synthesis of reviews reported that multidisciplinary teams and
integrated care changes impacted positively on symptom severity,
functioning, employment, and housing of people with severe mental illness,
compared with conventional services(48). Others have found: team
composition to be an important factor influencing inter-professional
working(49); that more stable teams produce more effective teamwork(49-51);
that teams with greater occupational diversity are more effective overall in
terms of patient care(49); that team functioning is better where mental
health and social care are integrated(52) and that the culture and climate of
the host organisation needs to be supportive for the team to work
effectively(49).
There is long-standing evidence that different professional groups make
unique contributions to teams: social workers are important for providing
continuity of care; psychiatrists ensure easy access to hospital beds;
occupational therapists offer practical help with activities of daily living and
community mental health nurses provide the main full-time workforce(53). All
add value to the team, which is, after all, the rationale for multidisciplinary
approaches.
Social workers often take a different stance on service delivery and have
different skills to other team members. For example, mental health social
workers (and to some extent psychologists) take a different view about the
use of compulsory treatment to other health professionals(54), and differ in
their views of compulsory community supervision(55), which suggests that
team composition might influence the type of care received. Different
professional groups also differ in their judgements of assessed need and
case complexity, with nurses being less able than social workers to
distinguish between critical and substantial social needs according to Fair
Access to Care Services (FACS) criteria(56).

© Queen‟s Printer and Controller of HMSO 2011. . This work was produced by Huxley et al. under the terms of
a commissioning contract issued by the Secretary of State for Health. 27
Project 08/1619/114
In many countries, including Australia(57), Ireland(58, 59), Indonesia and
Singapore(60) and Sweden(61), policy and practice statements emphasise that
social work is a core professional group for multidisciplinary teams. In most
cases however, the balance of professionals within teams is not considered
further resulting in radically different approaches towards developing the
wider social care components of community mental health services
worldwide, and workforce compositions that are disparate in the
extreme(13). For example, the mental health workforce is made up largely of
postgraduate trained social workers in the USA, and community nurses in
the UK; in the former Soviet Union the official state list of job titles did not
include „social worker‟, so trained social workers working in mental health
could only be appointed to nursing posts(62).
2.1.4 Previous research evidence on mental health team composition
The most comprehensive CMHT survey data available for England(53) and
Wales(63) are now outdated but provide a useful baseline with which to
compare CMHT composition pre and post introduction of new teams
(sometimes referred to as „specialist‟ or „functional‟ teams, these are
assertive outreach teams, early intervention in psychosis teams, and crisis
resolution and home treatment teams). In the early 1990s the average
CMHT in England hosted 11.4 (sd=6.3) full-time equivalent staff (FTEs) and
15 people (sd=7.4). The figure for Wales was 17.6 FTEs in 1997(63).
Community psychiatric nurses (CPNs) and other nurses provided the largest
full-time commitment, alongside generic support workers (although they
were few in number); clinical psychologists, psychiatrists, other doctors and
specialist therapists were not available full-time. CPNs, social workers and
administrative staff were the most frequently occurring disciplines in
CMHTs, followed by consultant psychiatrists; nevertheless, one-fifth did not
report having a psychiatrist in their team and frozen or unfilled clinical
psychology and occupational therapy posts were disproportionately high in
both England and Wales. It is likely that the composition of UK CMHTs has
changed since the new specialist teams have been introduced.
A more recent evaluation of the structure of psychiatric multidisciplinary
teams in eight Irish Health Boards(64), in which desirable team composition
was expressed as the ratio of consultant psychiatrists to other team
members suggested a minimum of 2.5 staff per psychiatrist (representing a
full-time OT and social worker, and a half-time psychologist). Significant
variations were observed between Health Boards, with 37.4% failing to
meet this minimum standard. The team staffing ratio was strongly
negatively correlated with admission rates per 1,000 population (r=−0.805,
p<0.001). Subsequent research, also in Ireland(59) suggested that the

© Queen‟s Printer and Controller of HMSO 2011. . This work was produced by Huxley et al. under the terms of
a commissioning contract issued by the Secretary of State for Health. 28
Project 08/1619/114
optimal size for mental health teams involved in making complex decision is
about seven.
After decades of delivering multidisciplinary mental health care, evidence
about how the balance of input from various personnel is decided upon and
managed, is lacking. How do we decide what team composition provides the
most synergy and best outcomes for consumers? Does composition have a
bearing on team climate or culture and if so is this related to the service
user experience? We remain a long way from answering these questions(65)
but the present study will begin to inform the evidence gap.
2.1.5 New community mental health teams
In England, the 1999 National Service Framework for Mental Health
(NSF)(66) and the NHS Plan (2000)(67) provided significant funds and impetus
to revolutionise the organisation and delivery of mental health services.
Prior to the NSF(66), small teams provided for all categories of mental health
problem (from common to severe disorders). Since the NSF, attention has
been refocused on to people with more severe disorders, and there has
been extensive development of community based teams that include
community mental health teams but now also include early intervention in
psychosis services (EIS); crisis resolution and home treatment teams
(CRHTT); and assertive outreach teams (AOT).
CMHTs interface with all of these types of teams as well as other services
providing mental health and social care and as such may be affected by the
introduction of the new types of team. It appears that when introducing a
new team, insufficient thought has been given to the impact on the existing
CMHTs and other mental health services as explained by Hannigan(68):
“Setting up and staffing crisis services had significant, wider,
consequences. Some were foreseen (the closure of a ward to
provide funding), others unforeseen (impossible-to-sustain initial
shift patterns, the loss of experienced staff from other parts of
the local service, increased workloads in other parts of the
system).”(p5-6).
The implementation of the different types of teams in England and Wales is
geographically variable. Audit information revealed that whilst the
Department of Health has met its target of creating 335 CRHT teams by the
end of 2005 it also reported that a wide variation existed in the size and
composition of the teams relative to the identified levels of local need.(69, 70)
In Wales, an audit conducted in 2005(71) reported that crisis intervention
and home treatment services were in place or were being set up in only
nine of the 22 Local Authority areas in Wales. In addition, early intervention
and supportive outreach services were found to be poorly developed across
the country. The failure to develop a comprehensive range of teams in

© Queen‟s Printer and Controller of HMSO 2011. . This work was produced by Huxley et al. under the terms of
a commissioning contract issued by the Secretary of State for Health. 29
Project 08/1619/114
mental health services in Wales might highlight a capacity issue where
some authorities representing very small geographical areas struggle to
populate these new teams without impinging on existing provision. The
following quote from the audit office report rather supports this view.
„Very few areas have a dedicated early intervention and treatment
service or team. A number of CMHTs report that they include
early intervention as part of their remit, and in one area a limited
number of CMHT staff have been identified and trained to provide
an early intervention service.‟ (1.39 p25)
Elsewhere, some CMHTs have been stripped of resources and many of their
skilled staff have been recruited to the new, better funded teams which are
said to have a clearer focus and purpose.(61) A recent survey of CRHTTs in
England(72) reported that recruitment to these new crisis teams had been
„relatively easy‟ as staff simply transferred from hospitals and especially
from CMHTs. Partly, as a consequence, 93% of CRHTTs reported delays in
referring to local CMHTs that were seen as “poorly resourced, often burnt
out and evasive of contact”(72) (p219). The recruitment and retention of
social work staff in mental health is reported to be proving difficult, with
high turnover arising from pressures on existing staff, job dissatisfaction,
high stress and concerns about the disappearance of a distinctive social
work role.(73)
In England, there has also been the introduction of „New Ways of
Working‟(74) that initially reflected concerns about the role of psychiatrists in
the team, combined with concerns about the pressure of demand for
services and an insufficient supply of some categories of professionally
qualified staff. This was followed by „Creating Capable Teams‟(75) which
placed an emphasis on reviewing current working practices and exploring
how existing roles can be extended and new roles created to improve the
way that teams support users and families. New roles include Support, Time
and Recovery Workers(76) and those arising from the Mental Health Act
(2007)(77): the Responsible Clinician and the Approved Mental Health
Professional(77). The emphasis on greater collaboration and integration has
sparked concerns that the distinctive contribution of professions,
particularly social workers, might be diminished.(78, 79)
In England, additional roles have also been established to address common
mental health problems in primary care. These include Graduate Primary
Care Mental Health Workers and the development of services under the new
service model, Improving Access to Psychological Therapies (IAPT)(80), with
workers providing guided support and/or cognitive-behavioural therapy in
the management of depression and some anxiety disorders. These therapies
are considered the preferred treatment of choice and a substantial amount
of funding has been set aside for IAPT with the Comprehensive Spending

© Queen‟s Printer and Controller of HMSO 2011. . This work was produced by Huxley et al. under the terms of
a commissioning contract issued by the Secretary of State for Health. 30
Project 08/1619/114
Review(80) allocating £33 million in 2008/09; a further £70 million to a total
of £103 million in 2009/10; and a further £70 million to a total of £173
million in 2010/11 for this purpose. It is as yet unclear whether this
allocation will be amended by the incoming government, but early evidence
that suggests a lack of impact on social outcomes (i.e. those that
demonstrate improvements in people‟s daily functioning and lives) might
make it a candidate for efficiency savings.
Extended roles also include those associated with the introduction of non-
medical prescribing for nurses and pharmacists. All these developments
have significant implications for CMHTs.
Social work membership of the new teams is lower than membership of
CMHTs which, at the turn of the century was about 25%. In contrast, in
England in 2004, social work membership of assertive outreach teams was
17%, and only 8% in early intervention teams. These changes have been
accompanied by changes in the proportions of care workers in teams. It is
not clear whether this picture arises from conscious workforce decision
making, the shortage of social workers, or the „more appropriate‟ use of the
skills of other disciplines (Appleby personal communication) or simply
downward substitution. Recently Huxley(81) reported that social work
membership of the new community teams continued to remain low, and the
proportion of social support workers continued to grow.
2.1.6 Previous research on the new teams
Several evaluations of the effects of the different types of teams have been
conducted in the past few years but little attention has been devoted in this
research to the question of team composition. It has been shown that
patients in assertive outreach teams maintain better contact with the
services(82) and crisis resolution teams (CRTs) can reduce hospital
admissions in times of mental health crises.(83, 84) Joy et al(85) found that
CRHTTs reduced family burden and were a more satisfactory form of care
for both patients and families. Similarly, studies of EIS show they are highly
valued by service users and their carers(86), that they are cost-effective over
the short to medium term(87) and also produce better clinical outcomes than
generic CMHTs.(88) Friis(89) suggests that EIS invest a high level of personal
engagement with patients which is not possible in the standard CMHTs.
However Hannigan(68) warns that continuity of care is difficult to achieve in
services with teams such as AOTs which are inter-professional and in which
staff work in shift systems.
An assumption of the present study is that different team composition and
the nature of integration may be related to the way that the culture and
climate of the team develops, and this might have an impact on the service
user experience. Next, we turn to the concepts of integration, team culture
and climate.

© Queen‟s Printer and Controller of HMSO 2011. . This work was produced by Huxley et al. under the terms of
a commissioning contract issued by the Secretary of State for Health. 31
Project 08/1619/114
2.2 Concepts
2.2.1 What is health and social care integration?
The failure of health and social care agencies and personnel to integrate
policies, procedures and practices has helped to maintain the health and
social care divide(67, 90, 91). A report(92) on stroke and learning disability
services concluded:
“There is no other group of people or sequence of events whose actions
or experiences are in any sense continuous. Service providers come and
go, and there is no consistent pattern of communication and feedback
between any of the other parties involved in treatment and care.”(p8).
This could be said of almost any client group in receipt of health and social
care services. Lack of progress towards integration means it has remained a
policy priority for decades.
Integration is said to have great potential to redesign care around the needs
of patients rather than NHS structures, particularly for patients with long-
term conditions.(93) The creation of integrated mental health and social care
providers in England(67) and the Single Assessment Process in England and
Wales(90) are two examples of policy initiatives that aim to implement this
transformation. It is frequently asserted that service users will receive a
better service from integrated services in which multidisciplinary teams
work together.
These groundless assertions are one of the two outstanding characteristics
of the promotion of „integration‟ of health and social care as an
unquestionably good thing (for organisations, teams, efficiency, outcomes
and user valued outcomes). It is more often asserted to be a „good thing‟
rather than being supported by any evidence. Second, that which is „being
integrated‟ is poorly specified or not specified at all.(94)
As Ramsay and Fulop (2008) wrote: “in many discussions, integration is not
well defined but is suggested as a promising solution to the problem of
fragmentation”.(95) The situation appears to remain the same today, as
indicated in recent research. (96).
There are many dimensions of integration, including horizontal and vertical
integration(97). The degree of integration in teams has been measured at
two levels(98). First, at a structural level where integration refers to the
nature of the team, its links with other services (e.g. GP/primary health
services and other agencies). Secondly, integration is measured at a

© Queen‟s Printer and Controller of HMSO 2011. . This work was produced by Huxley et al. under the terms of
a commissioning contract issued by the Secretary of State for Health. 32
Project 08/1619/114
practical level that considers a number of factors such as shared
assessment processes, shared client databases, shared points of referral
and joint training. At its most basic it can be interpreted as the co-location
of all team members. Management arrangements can vary even in co-
located services. One manager may be designated as the health and social
care co-ordinator - but the health and social care staff still are separately
managed and are separately accountable to two different organisations with
different priorities, procedures and practices. In some settings, even where
there is joint operational management, separate professional management
is retained. In others all management arrangements are now combined in a
single structure. In very few cases budgets are also said to be „integrated‟
that is combined or pooled, but this is not very common(94)
Ramsay and Fulop(95) argue that the effects of integration are experienced
at three levels, micro, meso and macro. At the micro-level they relate to the
individual service user experience. They suggest that here integration is
synonymous with coordination, that is, the close collaboration between
different professionals and teams required to deliver timely, efficient and
high quality interventions. At a meso-level, integration describes
organisational or clinical structures and processes designed to enable teams
and/or organisations to work collaboratively towards common goals.
Examples include integrated health and social care teams so they may
share IT, administration and data systems that support processes (such as
booking appointments) or information.
At a macro-level, integration describes structures and processes that link
organisations and support shared strategic planning and development.
Examples include merged provider organisations that span health and social
care services, such as care trusts and mental health Trusts. Scott et al(99)
point out that there has been a growing interest in the need for cultural
change to accompany structural reform.
Glendenning (2002) describes some core characteristics of integrated
organisations(100). Integration, she suggests, is more likely when several of
the following are evident: joint goals; very close-knit and highly connected
networks of professionals; little concern about reciprocation, underpinned
by a mutual and diffuse sense of long-term obligation high degrees of
mutual trust; joint arrangements which are „core business‟ rather than
marginal; joint arrangements covering operational and strategic issues;
shared or single management arrangements; joint commissioning at macro-
and micro- levels.
Rosen and Ham (2008) report on the lessons that can be drawn from
existing practice and research(101) (based on Ramsay and Fulop(95)).

© Queen‟s Printer and Controller of HMSO 2011. . This work was produced by Huxley et al. under the terms of
a commissioning contract issued by the Secretary of State for Health. 33
Project 08/1619/114
These are:
be very clear about the reasons for which integration is pursued and
reflect carefully on whether integration is the best way to achieve
stated goals;
do not start by integrating organisations – which may not bring about
improvements for patients. A more promising place to focus is
services and clinical relationships, with the consequences for
organisations and structures being considered subsequently.
ensure the local context will support integration – requiring trust
between partner organisations and teams; supportive local leaders;
a culture of quality improvement and effective communications and
IT.
do not overlook cultural differences between potential partner
organisations and work to overcome these.
protect community services in initiatives to integrate acute services
with primary and community services.
create the right incentives – which may involve risk- and gain-
sharing, and incentives for frontline staff.
do not assume economies of scope and scale.
there is little evidence that integration increases efficiency; start-up
costs may wipe out savings and where economies do exist, it may
take time to harvest them.
be patient: establishing effectively integrated services takes time,
and it may take even longer to deliver measurable changes in
outcomes and patient satisfaction.
In some parts of the UK, health and social care services are provided by the
same body. For example, there are a total of five Health and Social Care
Trusts in Northern Ireland that provide integrated health and social care.
Care trusts were introduced in England in 2002(67) to provide better
integrated health and social care and represented a move towards closer
health and social care partnership working by bringing the agencies
together as a single organisational entity. By combining both NHS
responsibilities and local authority responsibilities under a single
management and governance system, it was suggested that Care Trusts
could increase continuity of care, simplify administration and, due to the
formal status these organisations have in law, reduce some of the
complexity of partnership working(102). In some parts of England (but not in
Wales) mental health trusts offer similar integration.

© Queen‟s Printer and Controller of HMSO 2011. . This work was produced by Huxley et al. under the terms of
a commissioning contract issued by the Secretary of State for Health. 34
Project 08/1619/114
The policy of partnership in mental health services is being implemented
and is reflected in the growth of „integrated‟ multi-disciplinary community
mental health teams. Data from the Service Mapping database(2) show that
between 2002 and 2004 the number of „fully integrated‟ teams doubled,
„multi agency‟ teams reduced from over 300 to 30, and „single agency‟
teams almost disappeared (from 79 to four).
Research evidence is limited, but the results of one study suggest that in a
mental health context the provision of health and social care together,
through teams using treatment at home methods, can produce better
outcomes i.e. reduced hospitalisation(103). Nevertheless, it is not clear
exactly what the „combined responsibility for health and social care‟ in this
study actually meant, nor how far that responsibility extended into the
wider social care field (which also includes employment services, leisure
services and financial support services).
Services that provide care in the person‟s home (the traditional mode of
operation in social work) tend to have advantages over other forms of care.
A systematic review of crisis intervention services(85) that also provided
home care, found that this approach reduces the number of people leaving
the study, reduces family burden, and is a more satisfactory form of care
for both patients and families. No data on staff satisfaction or team
variables were reported in these studies and the authors suggest that more
research is needed into these workforce issues.
We know that the nature of team work and its organisation has an impact
on outcome in terms of voluntary and compulsory hospitalisation.(104)
Weekend working, staff burn-out and lack of patient / service user contact
with other services were associated independently with a higher probability
of both voluntary and compulsory admission. Nevertheless, contact with
other services (possibly those outside the health sector) was also a positive
prognostic factor. Fifty-four percent of these newly developed (and to some
extent experimental) community mental health team services were not
sustained beyond the end of the study period, (and half of the remainder
were no longer in existence by the publication date).(105) This makes
sustainability an important issue for future research.
In preliminary analysis of national survey data (the main results of which
have been reported elsewhere)(14), it would appear that in teams with
greater staff mix, social workers suffer from more emotional exhaustion and
more days off sick. Social workers in balanced teams (where there are
roughly equal numbers of nurses and social workers) have lower job
satisfaction, feel less valued at work, are more emotionally exhausted and
have less decision latitude compared to social workers in teams where they

© Queen‟s Printer and Controller of HMSO 2011. . This work was produced by Huxley et al. under the terms of
a commissioning contract issued by the Secretary of State for Health. 35
Project 08/1619/114
are outnumbered by nurses and others – perhaps because clarity of role
perception is greater in the latter context?
Alternatively, it may be that where one staff group is in short supply they
are valued more highly by their colleagues. Another possibility is that where
teams are more balanced in terms of health and social care professionals,
the potential for a clash of cultures increases. Whatever the explanation,
there could be positive and / or negative effects on the quality of care
provided. Compared to social workers in CMHTs, those in newly created
teams (i.e. assertive outreach, early intervention in psychosis, crisis
resolution; n=62) had less decision latitude, greater job demands, lower job
satisfaction, and were key-worker for a higher proportion of their caseload
(77% cf 64%); social workers in assertive outreach teams (n=11) had more
decision latitude and higher job satisfaction than workers in all other types
of teams and were key-worker for a lower proportion of their caseload (60%
cf 75%). New teams can be considered to be at greater risk of what has
been called „survivor sickness‟ resulting from loss of identity and
concomitant feelings of detachment and bereavement (106, 107), anger and
resentment (108) and anxiety and stress (109, 110)argue that role ambiguity
underlies a lot of workplace-related stress and others have suggested that
professional support and supervision needs to be in place to ensure
professional development and identity(52, 111) .
Previous research has pointed out that in partnership mental health Trusts,
social workers have poor mental health, are overstressed, emotionally
exhausted and feel undervalued(14).
It is important to note the limited sense in which social care services have
been conceived when integration has been considered to date. The social
care element is almost always exclusively confined to the social work and
other services provided by the local authority social services department,
rather than the totality of the services that they commission, or those
services that are out-with social services (leisure, housing, education etc) or
out-with the local authority altogether, in the third sector. This lack of
attention to the full range of social care staff was notable in the workforce
section of the Report „Mental Health Ten Years On‟.(112)
In most cases, therefore, „integration‟ in mental health services is
interpreted very narrowly, in the sense the local authority social workers
(and/or social care support staff) are transferred into the Trust (with a
variety of budgetary arrangements). This is the basic sense in which we
use the term in the present study, while attempting to reflect the variety of
interpretations of „integration‟ that we observed in the four participating
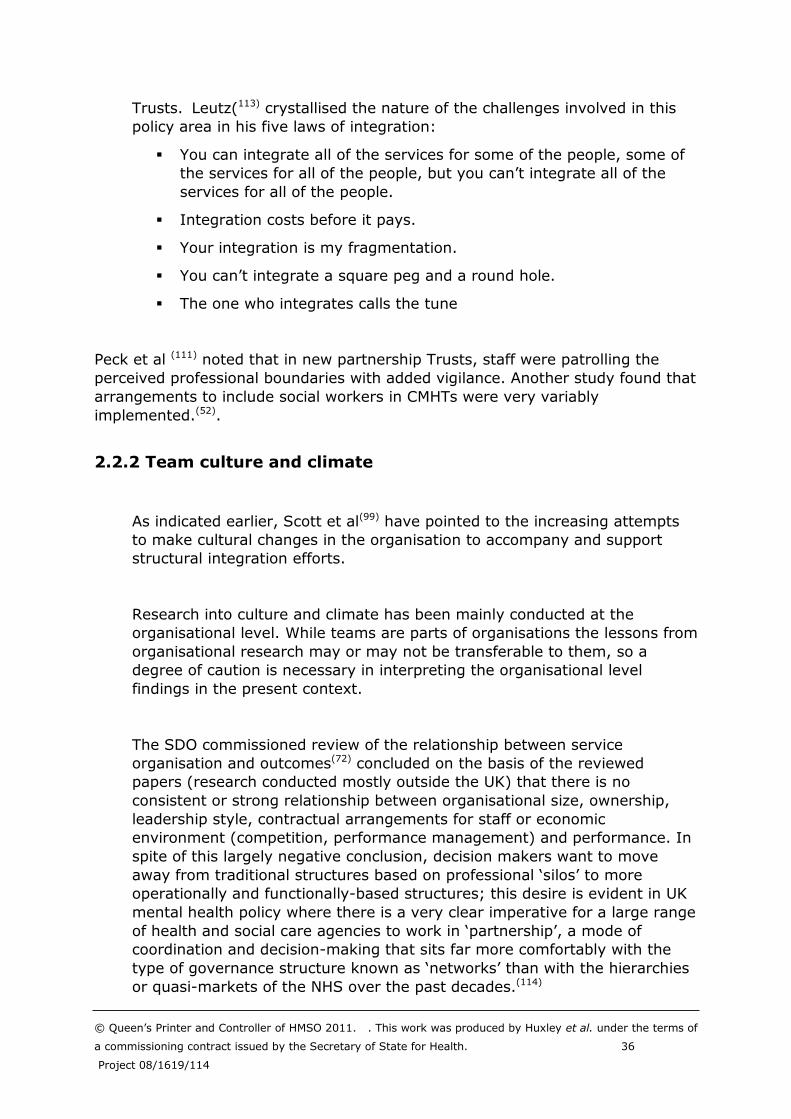
© Queen‟s Printer and Controller of HMSO 2011. . This work was produced by Huxley et al. under the terms of
a commissioning contract issued by the Secretary of State for Health. 36
Project 08/1619/114
Trusts. Leutz(113) crystallised the nature of the challenges involved in this
policy area in his five laws of integration:
You can integrate all of the services for some of the people, some of
the services for all of the people, but you can‟t integrate all of the
services for all of the people.
Integration costs before it pays.
Your integration is my fragmentation.
You can‟t integrate a square peg and a round hole.
The one who integrates calls the tune
Peck et al (111) noted that in new partnership Trusts, staff were patrolling the
perceived professional boundaries with added vigilance. Another study found that
arrangements to include social workers in CMHTs were very variably
implemented.(52).
2.2.2 Team culture and climate
As indicated earlier, Scott et al(99) have pointed to the increasing attempts
to make cultural changes in the organisation to accompany and support
structural integration efforts.
Research into culture and climate has been mainly conducted at the
organisational level. While teams are parts of organisations the lessons from
organisational research may or may not be transferable to them, so a
degree of caution is necessary in interpreting the organisational level
findings in the present context.
The SDO commissioned review of the relationship between service
organisation and outcomes(72) concluded on the basis of the reviewed
papers (research conducted mostly outside the UK) that there is no
consistent or strong relationship between organisational size, ownership,
leadership style, contractual arrangements for staff or economic
environment (competition, performance management) and performance. In
spite of this largely negative conclusion, decision makers want to move
away from traditional structures based on professional „silos‟ to more
operationally and functionally-based structures; this desire is evident in UK
mental health policy where there is a very clear imperative for a large range
of health and social care agencies to work in „partnership‟, a mode of
coordination and decision-making that sits far more comfortably with the
type of governance structure known as „networks‟ than with the hierarchies
or quasi-markets of the NHS over the past decades.(114)

© Queen‟s Printer and Controller of HMSO 2011. . This work was produced by Huxley et al. under the terms of
a commissioning contract issued by the Secretary of State for Health. 37
Project 08/1619/114
The strongest message emerging from the review is “that there is no simple
or clear-cut relationship between the form of an organisation and the way
that it functions. Instead, the relationship is complex and contingent.”(72)
Nevertheless, and significantly for the present study, it also concludes that
there are some findings in which one can have confidence. Among these
findings are for instance:
hierarchical and bureaucratic structures (such as the health service or
local authority) operate most effectively in a stable external
environment (one can argue that the mental health policy
environment is not stable currently for organizations or teams);
the engagement of staff is a pre-requisite for its success (there may
be poor engagement of social care staff in teams);
professional support is essential for the implementation of change
(the way social care staff are supported may be influential within the
team);
smaller organisations are easier to manage, respond more rapidly,
and have happier staff (although this refers to organisational size,
team size may be related to these intermediate outcomes);
collaboration across agencies and sectors is inhibited by lack of
coherence at the level of policymaking (this may be the case for
national mental health policy but also for local implementation);
cross-professional working such as clinical networks or „communities
of practice‟ may improve practice, and people able to work at
professional interfaces (boundary spanners) produce more effective
teams;
multidisciplinarity and/or skill mix may contribute to the effectiveness
of teams in relation to service users‟ valued outcomes).
The review points out that the evidence for the impact of culture and
climate on organisational performance is equivocal currently, but adds that
organisational climate and culture has a contingent impact on performance.
In particular, there is evidence that organisations with a dominant clan
culture are happier places to work in, but organisations with a dominant
rational or market culture are more productive(115).
Brown(116) defines organisational culture as:
“The patterns of beliefs, values and learned ways of coping with
experience that have developed during the course of an organisation‟s
history, and which tend to be manifested in its material arrangements
and in the behaviour of its members.”(116), (p9).

© Queen‟s Printer and Controller of HMSO 2011. . This work was produced by Huxley et al. under the terms of
a commissioning contract issued by the Secretary of State for Health. 38
Project 08/1619/114
Scott et al(117) point out:
“While it is important to acknowledge that some observers contest the nature and importance of organizational culture, this should not inhibit
empirical research into an issue that has potential both as a lever for quality improvement and as an aid for understanding the management
of change in health care organizations. This paper has…..argued that the purpose and context of cultural assessment should determine the
choice of instrument or instruments used.” (p 941)
They suggest that most significant impact of culture is on morale and staff
retention. There is considerable evidence in the research literature that
organisational culture and climate play central roles in the social context of
an organisation(118, 119). A number of studies in various types of
organisations link culture and climate to service quality, service outcomes,
worker morale, staff turnover, the adoption of innovations, and
organisational effectiveness. Team composition as a mediating factor in
these relationships has not been explored fully.
A literature review in the late 1990s found more than 50 definitions of
culture and more than 30 definitions of climate.(120) The literature review
helped address the confusion around the boundaries that separated the two
constructs. Based on a content analysis of the 84 definitions, the review
found consensus that culture captures the way things are done in an
organisation, and climate captures the way people perceive their work
environment. This results in a definition of culture as the norms,
expectations, and way things are done in the organisation.(118) This is the
way we interpret these concepts in the present study and we expect to use
a tool that captures these elements of the way things are done in the team.
More recently, another review(121) found 70 measures of organisational
culture, 48 of which had sufficient psychometric information to be assessed.
The authors point out that culture and climate are often used
interchangeably and that both have been linked to organisational outcomes,
and some people have argued that they have become virtually
indistinguishable.(122) Despite some overlap they conclude that they
address different concepts, with culture being more encompassing and
global, and climate being more of an index of an organisation‟s operation.
The definition of climate (which we use in the present study) is the
individual employees‟ perceptions of the psychological impact of their work
environment on their own wellbeing. Organisational climate is created when
individuals in a work unit, team, or organisation share the same perceptions
of how their work environment affects them as individuals. In these terms
the Karasek JCQ measure(123) that we plan to use in the present study is a

© Queen‟s Printer and Controller of HMSO 2011. . This work was produced by Huxley et al. under the terms of
a commissioning contract issued by the Secretary of State for Health. 39
Project 08/1619/114
measure of climate. There is evidence that organizational culture and
climate affect staff morale, staff turnover, service quality, and service
outcomes in various ways. (124-128)
The present study will explore the relationships between these variables at
the CMHT level.

© Queen‟s Printer and Controller of HMSO 2011. . This work was produced by Huxley et al. under the terms of
a commissioning contract issued by the Secretary of State for Health. 40
Project 08/1619/114
3 Methods
3.1 The national survey of Trusts
Data were collected in a national telephone survey of mental health service
managers in Mental Health Trusts in England and Wales, conducted in 2007.
A sampling frame was constructed using Binleys Guide, Trust websites
and/or national mental health mapping data(129). We identified managers
with responsibility for community teams. Where the named person turned
out not to have that responsibility we asked for contact details of the person
who did. Managers were contacted by telephone or email to arrange a
convenient date and time to inform them about the study, invite their
participation and arrange an interview slot. Interviews were conducted by
research staff using an interview schedule designed specifically for this
study. This schedule consisted of five open-ended questions. The first two
considered the structure of the service within the Trust:
number and types of teams within the Trust;
number of staff in each staff group in each team;
and the other three related to the thinking behind team composition:
rationale for composition of CMHTs;
reasoning behind the inclusion of social work and social care staff in
CMHTs;
planned changes in CMHT structures and composition.
Managers were given a copy of the questions prior to interview to enhance
the quality of the data provided (see Appendix 1). No limit was set for the
number of reasons that could be cited by each respondent, and all reasons
were treated equally and not ranked by importance, although a note was
taken of the first reason given. In retrospect, it would have been preferable
to then ask the respondent which if any of these they considered to be of
most importance. Responses were recorded verbatim at the time of the
telephone interview and analysed thematically by two research team
members following the Ritchie & Spencer framework(130) to produce coded
categories for entry in SPSS(131) and analysis alongside the quantitative
data.

© Queen‟s Printer and Controller of HMSO 2011. . This work was produced by Huxley et al. under the terms of
a commissioning contract issued by the Secretary of State for Health. 41
Project 08/1619/114
Descriptive frequencies, mean scores and skewness statistics were used to
describe the sample in terms of staff numbers, membership and
composition, and to assess the normality of distributions. Variables that
were skewed significantly were square-root or log transformed as
appropriate(130) and their distributions rechecked. Chi-square (2) and Phi
effect size statistics were used to test for differences in rationale between
more and lesser levels of integration. Independent samples t-tests were
used to test the equality of mean staff numbers in total and for nursing,
social work and social care support staff groups in Trusts citing and not
citing each team composition rationale; effect sizes were calculated using
the following formula(131):
cohen’s d (d) = M1 – M2 / pooled (pooled= (1-1)/2)
Potential interaction effects between level of integration and rationale were
tested using two-way between-groups analysis of variance and partial eta-
square (2p) statistics.
In accordance with convention and statistical advice results are reported for
statistically significant p values in the range p≤0.05, non-significant trends
in the range p=0.5-0.10, and for small, medium and large effect sizes(132),
within these ranges.
3.2 Staff Survey
Using the national survey (Phase I) data we were able to identify Trusts
where the social care composition of teams varied, in terms of the
proportion of social workers and social care support workers (e.g. Support
Time and Recovery workers) to the total number of staff employed. In some
Trusts there were a number of teams that had no social care staff at all,
whilst in others social care staff were the major staff group. Informed by
these data, we approached our four first choice Trusts on the basis of their
differing social care staffing input and rationale for team composition. Three
of the four Trusts agreed to participate in the study, but one Trust that was
balanced in terms of health and social care provision was unable to
participate due to imminent service reorganisation. An alternative, nearest
equivalent Trust that was identified and approached to take part in the
study agreed to do so. Unfortunately in the event this participation was
limited to the staff survey (phase II) as this Trust‟s attempt to achieve
Foundation status took priority over the research as one might expect,
causing them to withdraw from participation in the service user interviews.

© Queen‟s Printer and Controller of HMSO 2011. . This work was produced by Huxley et al. under the terms of
a commissioning contract issued by the Secretary of State for Health. 42
Project 08/1619/114
3.2.1 Locations
Trust A is located in Wales and services an ethnically diverse urban
population. Health and social care services are managed and financed
separately by the Trust and the Local Authority but the services work
together in a partnership. The Trust reports that several areas within the
geographical limits of the Trust have high mental health needs index (MINI)
scores that are up to 30% higher than the rest of Wales with addiction and
homeless rates being particularly high in the urban centre.
Trust B is also located in Wales and services a large geographical area
within a pre-1996 county borough, incorporating urban, traditional mining
and rural communities. Trust B works alongside the different local
authorities within the geographical area in an integrated way. The
management structures for health and social care are separate however,
with management and finance coming from the Trust for health service staff
and from the Local Authorities for social care staff.
Trust C was the second choice location and is located in England. It too
services a large geographical area within an existing county borough, which
encompasses urban centres and rural areas. The Trust is an integrated
health and social care partnership.
Trust D is located in England and also services a large county borough that
includes urban centres but a largely rural population. Trust D is a
Foundation Trust, health care staff are financed and managed by the Trust
while social care staff are financed and managed by the Local Authority.
In setting up the staff survey we worked closely with senior and then middle
managers in each of the four participating locations to make arrangements
for a cross-sectional data collection from all teams. The principal
investigator, co-applicants and research staff visited each of the Trusts to
set up this phase of the study. Based on our previous experience we know
that data collection is more likely to succeed where the teams providing the
data are familiar with the project and the research staff, and where the
burden on them is reduced. In this case we organised sessions that followed
on from planned team meetings, which were attended by research staff and
where team members were asked to complete the survey, over a lunch
provided by the research teams.

© Queen‟s Printer and Controller of HMSO 2011. . This work was produced by Huxley et al. under the terms of a commissioning contract issued by the Secretary of State
for Health. Project 08/1619/114 43
Table 1: Location characteristics for the staff survey
Trust Country Pop(k)
(133)
Working
age(133)
Over
65(133)
Long
term
limiting
illness(133)
Economically
inactive(133)
CMHT Crisis
resolution
Early
intervention
Assertive
Outreach
A Wales 500 61% 15% 19% 26% 7 2 0 0
B Wales 600 55% 20% 18% 23% 10 4 3 2
C England 530 58% 19% 18% 23% 5 3 1 2
D England 725 61% 17% 20% 28% 12 5 4 3

© Queen‟s Printer and Controller of HMSO 2011. . This work was produced by Huxley et al. under the terms of
a commissioning contract issued by the Secretary of State for Health. Project 08/1619/114
44
We did this in as many teams as possible, but also allowed staff to return
questionnaires independently of these sessions by providing stamped
addressed envelopes where necessary. Although the senior staff
encouraged teams to participate, it was always voluntary and either decided
by the team leader or the whole team at team meetings. Even then,
individuals could still refuse to participate or could withdraw.
This was a labour intensive method, but produced good results in that the
required number of individuals responding went beyond the protocol target
of 276 (see section 4.2).
3.2.2 Measures
In the original proposal we planned to use several different measures to
capture aspects of organisational and team culture and climate and working
patterns. Seventy different instruments and approaches for measuring
organisational culture have emerged over the past five decades, most of
which have emerged since the 1980s.(134) Prior to data collection a new
validated measure was published(135) and used recently to examine how,
and with what impact, workforce substitution and specialisation is
influenced by workforce change policies in the context of older people‟s
services. The measure met most of our requirements in the one instrument;
the Workforce Dynamics Questionnaire (WDQ).(136) (See Appendix 2). The
WDQ also enabled us to address the issue raised by one of the reviewers of
the original proposal, that we needed comparative data from another
client/patient group. WDQ data was already available for older people‟s and
intermediate care teams in England, and is now also available for older
people‟s teams in Wales, and mental health and older people‟s teams in
Scotland.(137) These comparative data are being examined outside the time
frame of the present study.
The WDQ consists of 68 questions, three of which - overall job satisfaction,
plans to leave the employer and plans to leave the profession - stand
alone, and the other 65 make up ten subscales (autonomy, integration,
uncertainty, management style, role flexibility, teamwork, role perception,
access to IT, training and career progression and quality of care). All are
rated on a ten point scale and standardised to a score of 100. As indicated
below, these dimensions are commonly agreed to be elements of integrated
services and the organisational culture that arises in them, and so justified
the use of this instrument.

© Queen‟s Printer and Controller of HMSO 2011. . This work was produced by Huxley et al. under the terms of
a commissioning contract issued by the Secretary of State for Health. 45
Project 08/1619/114
In addition, the WDQ asks respondents how closely they work with other
team members and how much role overlap they have with them. All the
team members are included in the list, with scope to add others. These
variables, and the WDQ subscales (especially integration and teamwork)
and data about co-location and pooled budgets can be taken to be the
range of ways in which we attempt to measure integration in the present
study. The role overlap aspect of the WDQ was not covered in such detail by
the instruments we originally intended to use.
We retained the Karasek Job Content Questionnaire (JCQ)(123) (Appendix 2)
identified in the original proposal for two reasons: first we already had data
from the Karasek JCQ from a national survey of mental health social
workers(14)with which to compare data from the present study; and
secondly it is a very widely used and well validated instrument.
It is a 22 item instrument, which produces three main subscales which
relate to decision-latitude, psychological job demands, and social support
(from peers and managers). It is rated on a five point scale and can be
standardised using z scores. As indicated elsewhere, we regard this as more
a measure of climate than of culture.
3.2.3 Data analysis
Data were entered into SPSS version 16(138) and analysed using SPSS and
STATA version 10(139), following transfer using STAT transfer.
Data were first prepared for analysis. The distribution of continuous
variables was first examined using box-plots and skewness statistics, and
where significant skew was observed according to the formula skewness /
s.e. skew > ±1.96, data were transformed appropriately in order to achieve
a normal distribution. Missing data analysis were undertaken in order to
examine the likely significance of retaining missing values in analysis and to
explore whether any form of imputation would be necessary.
Descriptive statistics including frequencies, mean scores with standard
deviations and chi-square (χ2) statistics were used to describe the sample in
terms of team size, proportion of health and social care staff, gender etc
and to examine between group differences in categorical variables. Between
group differences in normally distributed continuous variables were
examined using independent samples t-tests or one-way analysis of
variance. Where it was not possible to normalise the distribution of
dependent variables, between group comparisons were examined using
non-parametric tests (Mann Whitney-U and Kruskall-Wallis).

© Queen‟s Printer and Controller of HMSO 2011. . This work was produced by Huxley et al. under the terms of
a commissioning contract issued by the Secretary of State for Health. 46
Project 08/1619/114
In order to accommodate possible Type 1 error due to multiple-testing
Simes procedure(140) adjustments were made to all analyses; this is a
modified Bonferroni adjustment that has greater power to detect
significance differences, using the formula:
Test p=1 x 0.05
X
(where X = number of tests undertaken.(140)
The Simes adjustment produces values that are less conservative than the
originals by comparing unadjusted p values that take account of the number
of tests and a target p values (p<0.05).
In the analyses that follow we first describe the whole sample in terms of
team type (CMHT or other), location, country, professional group, and social
care composition. Next we examine the team culture and climate using
WDQ and Karasek JCQ items, making similar comparisons between areas
and teams, and different features of integration. Finally we examine the
relationship between area, team and individual level indicators including
process indicators of team culture and climate and interim outcomes of
integration and teamwork, and final outcomes relating to quality of care, job
satisfaction, and intention to leave the employer. This final element of
analysis requires multivariate analyses that control for a multitude of
potential mediating and confounding factors.
As outlined in the original protocol it was our intention to undertake multi-
level modelling analysis in recognition of the fact that individual responses
are nested or clustered within teams, within areas, within countries; this
approach reduces the chances of identifying false positive findings (Type 1
error). Although we had a sufficient number of teams to undertake this
specialist approach we did not have a sufficient number of individuals within
teams to do this.
In order to take some account of team level clustering, and so reduce error
relating to false positives we opted to conduct a series of regression models
using the regress command in STATA that controlled for some team level
factors. Prior to the construction of these models sample size requirement
was determined according to the formula n≥50 + 8m(141) (where m= the
number of independent variables). Potential collinearity between variables
to be included was checked using correlation coefficients, and variables that
correlated at > r=0.7 were excluded.(141)

© Queen‟s Printer and Controller of HMSO 2011. . This work was produced by Huxley et al. under the terms of
a commissioning contract issued by the Secretary of State for Health. 47
Project 08/1619/114
On the basis of these checks it became evident that we could not simply
construct a dummy variable that identified each team as that would
transgress the sample size condition and undermine the model. Therefore
we constructed a typology of teams based on the proportion of social care
staff in the team that could be included legitimately in analyses.
Also due to relatively small sample size compared to the number of
variables, independent variables were entered in three blocks rather than in
one block. Personal characteristics – professional group, age and gender
were entered in Block 1; individual level team climate variables - WDQ sub-
scores, Karasek JCQ sub-scales, length of time in team, close working with
nurses and social workers, role overlap with social workers and nurses were
added in Block 2; location/ area and team level indicators, team typology
(social care composition), team size, CMHT or not, and co-location were
added in Block 3.
Variables that did not make a statistically significant contribution to the
variance explained in Blocks 1 and 2 were not carried forward to the final
model, unless the variable was considered conceptually important.
Following the fitting of each model, residuals (random fluctuations around
the regression line) were examined and plotted to ascertain model fit and
check model assumptions. Outlying residuals were identified using Cook‟s
distance statistics, and where appropriate the adequacy of the model was
checked by refitting it when outliers were removed. Regression models were
also refitted using transformed dependent variables or in binary logistic
regression models where it was not possible to normalise distributions. As
the models included items that were measured on different types of scales,
standardised beta coefficients that standardise all values to between 0 and
1, are reported.
3.3 Service user interviews
3.3.1 Locations
The selection of the locations was informed by the previous two phases. As
the study was concerned with the social care composition of community
mental health teams, we purposively selected two Trusts in which the
balance of social care composition differed in the operational teams. Their
team composition was significantly different from one another when other
variables were controlled in a regression equation (Section 3.5.4). The team
sizes were similar (t=1.26 df 138, p=0.21, mean difference 1,07 (CI -0.62,
2.75) but the proportion of health staff, in particular nurses was

© Queen‟s Printer and Controller of HMSO 2011. . This work was produced by Huxley et al. under the terms of
a commissioning contract issued by the Secretary of State for Health. 48
Project 08/1619/114
significantly higher in Trust A (t=15.27 df143 p=0.000, mean difference 4.9
(CI 4.3, 5.5) and social care workers (social workers and support workers)
significantly higher in Trust D (t=-10.0 df73 p=0.000, mean difference = -
5.2 (CI -6.2, -4.1).
The service managers from the two locations were each asked to provide us
with a list of 25 randomly selected service user participants to be
interviewed. This information was obtained from a dedicated proprietary
computer system in location A and by an administrator in location D.
In the first instance and as previously arranged, the research staff in the
university had to match the availability of the service user researchers to
the convenience of the date and time provided by the service users to be
interviewed, which sometimes proved difficult. They visited the teams and
conducted interviews with the service users in their own homes during
which they completed three standardised measures. In two of these there
are open text boxes for the service users to make any comments they wish.
This data collection method was working fairly well in location A, but proved
increasingly problematic in Trust D. As the research progressed, it became
difficult to sustain this approach in Trust D. Problems arose mainly around
location and time as the contracted service user researchers were from the
NE of England, the research team in South West Wales, and location D
under study was in the north of England. The method and data from Phases
I and II of the study dictated that these were necessary arrangements, but
more problems arose when one of the service user researchers was
hospitalised and timescales became tight.
Consequently, the data collection methods were changed. Initially we
attempted to visit the teams as we had done in Phase II to collect the data,
but governance approvals had expired, and some teams were declining to
take part in this Phase. We found that dealing at a distance with several
different teams in different areas within location D was exceptionally time
consuming and often fruitless. Frequent phone calls, follow up reminders
and e-mails merely served to aggravate team leaders and managers, and
hence put the data collection at risk. A suggested plan to conduct telephone
interviews proved to be even more complicated for the service managers to
arrange and was subsequently abandoned. After discussion with managers
on several occasions, it was decided that batches of questionnaires would
be delivered by post with accompanying high-street vouchers to be
distributed to the service users on completion of the questionnaires. These
forms would then be returned to us in a stamped addressed envelope along
with the consent forms. No personal identifiers were required for this part of
the study only the study team code number on the forms.

© Queen‟s Printer and Controller of HMSO 2011. . This work was produced by Huxley et al. under the terms of
a commissioning contract issued by the Secretary of State for Health. 49
Project 08/1619/114
As well as struggling to reach the target number of 50 service users for this
essentially qualitative phase of the research, it became clear that not all of
the service users identified and who had agreed to complete the forms, had
informal carers. If we had insisted that each service user had to suggest a
carer to be involved in the study, the service user sample size would have
been reduced. Subsequently we thought it best to persist with the attempt
to reach the target number of service user participants. In addition, many
of those who did have carers refused us having access to them. As a result,
we were only able to obtain one of the target number of 35 making this part
of the study impossible to complete satisfactorily.
3.3.2 Measures
Carers and Users Expectations of Services (CUES) is a questionnaire that
arose from the Department of Health Outcomes of Social Care for Adults
(OSCA) initiative(142)(see Appendix 6). The CUES scales(143) were developed
with service user involvement and designed to be used in community
mental health services. The three aims of CUES are:
1) to directly improve clinical care planning, by allowing individuals to tell
staff about their experiences and current practical problems;
2) to measure users‟ satisfaction with their life and the local mental health
service, acting as a baseline for future service developments; and
3) to allow comparison of the local mental health service with other areas
of the UK. (144)
It is therefore a useful measure to use that fits well with present day policy
directives.
The Manchester Short Assessment of Quality of Life (MANSA)(145) was also
developed for use in community mental health services and we have a
decade‟s experience of its use and a large data base of results. In addition
many of the questions appear in the National Psychiatric Morbidity Survey
(NPMS)(146). The questionnaire measures the different aspects of the quality
of life and satisfaction of people who use mental health services. The items
cover issues that they have identified themselves as being their own
priorities. The MANSA covers nine life domains (accommodation, safety,
leisure, living situation, social life, relationships, family, income, health and
mental health) with objective and subjective questions. It has good
psychometric properties(145, 147)and it has been found to be easy to use and
administer.(148) The questionnaire is completed by the service user, with
support if needed from a relative, friend or advocate. The questionnaire has
previously been used to investigate whether patient‟s satisfaction with their
mental health care and quality of life is related to their age, gender,
psychiatric diagnosis and duration of mental disorder(149) and in an
epidemiological survey of need amongst psychiatric patients(145).

© Queen‟s Printer and Controller of HMSO 2011. . This work was produced by Huxley et al. under the terms of
a commissioning contract issued by the Secretary of State for Health. 50
Project 08/1619/114
The MANSA has been used to measure the subjective quality of life in
patients with a variety of mental health problems including patients with
post-traumatic stress following conflicts in ex-Yugoslavia(148) chronic fatigue
syndrome(150) and schizophrenia.(151)
The Service User Questionnaire (SUQ) used service satisfaction questions of
the type commonly used in patient surveys (see Appendix 7)
3.3.3 Data analysis and preparation
Most of the SUQ satisfaction scales were highly skewed towards positive
responses.
We square root transformed the 10 SUQ satisfaction scales, but this failed
to provide a normal enough distribution to allow parametric tests . Because
of the small sample size, most of the descriptive statistics using the 4 point
scale for SUQ items, violated the assumptions for cross tabulated data, so
we collapsed the variables into bivariate form and repeated the analyses for
a 2X2 table, and computed Fisher‟s Exact Test.
We used parametric tests for the MANSA D-T scales, which were normally
distributed. The MANSA also contains questions within each of the domains,
asking whether the service user wants their circumstance in that domain to
be improved, and if they do whether their opportunities to obtain
improvements have been restricted in any way. We used cross-tabulations
and other descriptive statistics for all the categorical variables in the MANSA
and the CUES.
Although the original WDQ subscales were skewed, in some cases
transformations made them more skewed. We ran the analysis using both
skewed and transformed variables and found that the original variables
gave the most conservative results, so we present those in the final part of
this report.
The open ended questions in the SUQ and the CUES were transcribed and
coded separately by two researchers who then compared ratings and
resolved disagreements or consulted the PIs in any cases they found hard
to resolve. All the free-text comments were classed as „positive‟, „negative‟
or „neutral‟. It was not possible to analyse these data other than
descriptively, due to the small cell sizes.

© Queen‟s Printer and Controller of HMSO 2011. . This work was produced by Huxley et al. under the terms of
a commissioning contract issued by the Secretary of State for Health. 51
Project 08/1619/114
4 Results
4.1 The national survey of Trusts
Of the 79 mental health provider Trusts in England and Wales at the time of
data collection, 42 participated in the study (53.2%), 36 in England and six
in Wales. Comparison with national mental health mapping data(129) for the
nearest time period indicated that our sample (n=381, 48.9%) was
representative of all CMHTs (n=780), in that there were no significant
differences between responding and non-responding Trusts in terms of
reported integration status nor the number of: CMHTs; number of hospital
beds; Approved Social Workers (ASWs) who had statutory duties under the
1983 Mental Act(152); all social workers; support workers; Support Time and
Recovery (STR) workers; psychiatrists; assertive outreach teams (AOTs);
all AOT staff; Crisis Resolution Teams (CRTs); Early Intervention Teams
(EITs); social workers in CRTs; and total staff numbers.
While most services were administered and managed at the Trust level, a
small number (n=4) were managed at a locality level because they had
formerly been Trusts in their own right, which resulted in different rationale
for team composition in each of the eight localities. In the results that follow
we refer to the 50 localities as Trusts to avoid confusion.
All team and staffing number variables were significantly positively skewed.
Following square-root transformation total CMHT and social care support
staffing became normally distributed, as did total social work and nurse
staffing following log transformation.
Table 2 shows the average and range of team sizes, and staffing numbers in
the study sample.
The average team size (based on total CMHT staff) was 17.7 (sd=5.5, range
7-33.5), slightly lower than the national mapping data average of 19.446 but
higher than the 1994 mean of 15 (sd=7.4)12.
Staffing numbers did not differ significantly in less integrated Trusts (where
social care staffing was determined solely by the local authority (n=11)),
although a small-medium effect (d=0.34)49 on social work staffing was
apparent with lower numbers being employed in less integrated Trusts.

© Queen‟s Printer and Controller of HMSO 2011. . This work was produced by Huxley et al. under the terms of
a commissioning contract issued by the Secretary of State for Health. 52
Project 08/1619/114
Table 2. Average and range of team sizes and staffing numbers
Data from the present study and a variety of other sources (Table 3) show
that the average team consists mostly of nurses and social workers,
followed by doctors, but with less input from other staff.
Firstly, in relation to the Policy Implementation Guidance (PIG) we can see
that the intention was that there should be a fairly even distribution in
terms of the composition of nurses and social workers in a ratio of 4:3,
supported by Occupational Therapists (OTs), Psychologists, Doctors and
three social care support staff.
All of the data since the publication of this guidance indicates that this kind
of representation has never been achieved, and that nurses are the
dominant workforce within CMHTs, compensating for shortages in other
staff groups. There has been considerable growth in the numbers of CPNs in
CMHTs that is matched by the number of Social Workers, but while social
work shows an overall surplus compared to guidance of 16.7%, the surplus
over guidance of nurses is a massive 52.5%.
Considerable deficits are observed in relation to psychologists and other
staff whose role has a more social orientation such as social support
workers of whom there are 53% fewer and OTs of whom there are 40%
fewer than the estimated requirement. Just taking social workers and social
care support staff there is an apparent undersupply of social care provision
of 36.3%, and if OTs are included in this group the undersupply of people
trained to deal with the social aspects of mental ill health reaches 76.3%.
Sample data per Trust (381 teams; 7.6 per Trust ; sd 4.9)
Staff n Mean per Trust (sd) Range
% of total
staffing
Social workers 1279 25.6 (20) 0-93 19.3
Nurses 2212 44.3 (30.4) 8-135 33.3
Social care
support workers
655 13.1 (21.1) 0-96 10.0
Total staffing 6646 132.9 (sd 91.1) 38-400 100.0

© Queen‟s Printer and Controller of HMSO 2011. . This work was produced by Huxley et al. under the terms of
a commissioning contract issued by the Secretary of State for Health. 53
Project 08/1619/114
Table 3. Average CMHT team composition by data source (for major staff
groups only
Source Community
Psychiatric
Nurse
Social
Worker
Occupational
Therapist
Psychologist Doctor Social Care
Support
Worker
Onyett et al.
1994
3.3 1.9 1.0 1.0 1.0 0.9
Policy
Implementation
Guidance 2001
4 3 1.5 1.5 2.5 3.0
Boardman and
Parsonage 2005
4.9 2.7 1.6 1.0 3.0 4.0
National
mapping data
2007
6 3.5 0.9 1.1 1.5 1.7
Present study
2007
6.1 3.5 0.9 0.8 2.1 1.4
Growth since
1994
+84.8% +84.2% -10% -20% +110% +55.6%
Surplus (+) or
deficit (-) over
Guidance
+52.5% +16.7% -40% -46.7% -16% -53%
Examination of CMHT composition since 2001 (when guidance was issued)
shows that provision has remained relatively stable over time in most
respects. The supply of support workers has increased by 155% to 2009,
but between 2007 and 2009 the rate of growth in numbers of social care
support workers had slowed to 18%, which would on average represent 5
staff per team. When the number of social care support workers in 2009 is
added to the number of social workers the picture does appear somewhat
more balanced in relation to nursing staff but an imbalance between health
and social care expertise remains (Social work plus social support workers =
4,357, nurses = 4,720, other health workers = 6,032).

© Queen‟s Printer and Controller of HMSO 2011. . This work was produced by Huxley et al. under the terms of
a commissioning contract issued by the Secretary of State for Health. 54
Project 08/1619/114
Figure 1. Community Mental Health Teams
I
We asked the service managers questions about team composition. The first
was concerned with the factors that the manager thought influenced
composition. The second concerned the specific factors leading to social
care staff being included in the team, and the third was which factors are
now influencing any proposed changes to team composition.
Managers provided up to five different reasons explaining team
composition. Reasons were post-coded initially into 14 categories and then
under five broad themes. From the original 14 the influence of
commissioners on funding, vacancies due to financial constraints and citing
finances as a determinant were classified under a general „financial
resources‟ heading. Benchmarking to reach a certain level of provision,
usually by comparison with Trusts of a similar size and location was
reported infrequently and was classed alongside similar exercises based on
use of Department of Health (DH) or other guidance. Local client needs, the
demands of primary care, local population characteristics and ratings based
on local deprivation indices were classified with other „demand for services‟
factors. Team roles and the need to ensure integration and
multidisciplinarity were classed together, and historical reasons stood alone.
Table 4 shows the proportion of Trusts citing these five themes, and shows
that history is a prominent factor.
0
1000
2000
3000
4000
5000
6000
2001 2002 2003 2004 2007 2008 2009
Nurses Social W Doctors Support

© Queen‟s Printer and Controller of HMSO 2011. . This work was produced by Huxley et al. under the terms of
a commissioning contract issued by the Secretary of State for Health. 55
Project 08/1619/114
Table 4 Determinants of the composition of CMHTs
Classes of reason n %
History 30 27.0
Guidance 25 22.5
Demand factors 24 21.6
Financial resources 22 19.8
Multidisciplinarity 10 9.1
Total 111 100
The picture becomes more mixed when looking at the reasoning behind the
social care composition of CMHTs. In some instances, historical levels of
funding played a part in these decisions, but again resources were not the
main issue for most responding services (see Table 5). As one might
expect, the policy (or strategy) of developing integrated services and the
desire to maintain multidisciplinarity accounted for almost a third of the
reasons driving the need for more social care staff. History and workload
complexity were also important, specifically in relation to people on the
enhanced Care Programme Approach (CPA) or needing the services of an
ASW, as they required more social care input from the team. Other
determinants of additional social care input related to the social deprivation
experienced by people in some areas, or the wish to promote peoples‟ social
inclusion.
There were indications that for some Trusts (12.8%; n=11) these matters
were entirely out of their hands, services were not integrated or co-located,
budgets were not pooled and decisions were made entirely by the local
authority social services department. Table 5 shows that the level of
integration was associated with a medium (or approaching medium)
magnitude effect49 on the rationale for team composition, in which social
care input was determined less by history and slightly (but not significantly)
more by „financial resources‟ in lesser integrated services.

© Queen‟s Printer and Controller of HMSO 2011. . This work was produced by Huxley et al. under the terms of
a commissioning contract issued by the Secretary of State for Health. 56
Project 08/1619/114
Table 5. Determinants of the social care membership of CMHTs
Contributing reason
%
Workload complexity (including ASW*) 15 16.5
History 15 16.5
Guidance 5 5.5
Financial 9 9.9
Integration requires it 20 22.0
Team needs (inc Multidisciplinarity) 8 8.8
Social services determined 11 12.0
Other 8 8.8
Total 91 100.0
Social care determinant by level of integration
Contributing
Reason
Level of
integration
n % 2 df p Phi
History More integrated
Less integrated
15
0
38.5
0.0
6.04 1 0.021 -0.35
Financial
resources
More integrated
Less integrated
5
4
12.8
36.4
3.22 1 0.093 0.25
Table 5 also shows that the number and balance of staff in teams were not
associated, largely, with the cited reasons for the social care composition of
teams.
Total staffing numbers appeared to be slightly higher in Trusts citing
„financial resources‟ as a determining factor of team composition. Despite
being statistically insignificant the „financial resource‟ effect was of medium
magnitude(132). .

© Queen‟s Printer and Controller of HMSO 2011. . This work was produced by Huxley et al. under the terms of
a commissioning contract issued by the Secretary of State for Health. 57
Project 08/1619/114
Similarly, there was a non-significant but approaching medium-sized effect
on higher numbers of social care support staff when guidance was cited as a
rationale for CMHT composition. .
None of the rationale for social care composition was associated significantly
or with any great magnitude with total, social work or social care staff
numbers. A non-significant (p=0.076) medium magnitude (2p=0.067)
trend towards higher staff numbers existed in more integrated trusts not
citing financial resources.
4.1.1 Drivers for change
Drivers for any planned changes to CMHTs were clearly policy related in
most cases. Almost two-thirds of first reasons given (63.7%) and 47.1% of
all reasons given related to new roles, new ways of working, various DH
guidance about the creation of new teams and the resulting redeployment
from CMHTs.
Redeployment of staff emerged as the main factor for more than half of the
Trusts sampled, with 34% citing „redeployment‟ specifically and a further
18% referring to the „guidance‟. New worker roles accounted for just over
10% and the same proportion reported financial issues including in one case
disinvestment by commissioners. Demands from primary care were the
main driver for change in five Trusts, while six had other reasons including
multidisciplinarity, skill mix and in one case external consultant advice.
Table 6 shows a medium-magnitude, statistically significant association
between redeployment and total staffing in which Trusts with smaller
CMHTs were most likely to be considering redeployment to other teams.
The association between redeployment and social work numbers was larger
in magnitude, with Trusts having to consider redeployment having
significantly less input to CMHTs from social workers. These results might
suggest that smaller Trusts struggle to populate the emerging new teams
without impacting upon existing CMHTs, and raises questions about the
sustainability of these services where this is the case.

© Queen‟s Printer and Controller of HMSO 2011. . This work was produced by Huxley et al. under the terms of a commissioning contract issued by the Secretary of State
for Health. Project 08/1619/114 58
Table 6. Staffing numbers by reason for CMHT team composition (n=50)
Variable Reason n Mean (sd) t test
(df)
p Cohen‟s d Mean
difference
95% Confidence
Interval
All staff Not Financial
Financial
28
22
1.97 (0.25)*
2.11 (0.31)*
-1.65
(48)
0.105 -0.51 -0.13 -0.29 to 0.03
Social Care
support staff
Not Guidance
Guidance
25
25
0.53 (0.60)*
0.83 (0.67)*
-1.67
(48)
0.101 -0.47 -0.30 -0.66 to 0.06
Staffing numbers by reason for social care composition (n=50)
Nothing
Staffing numbers by change driver (n=50)
All staff Not redeployment
Redeployment
35
15
2.08 (0.27)*
1.91 (0.27)*
2.09
(48)
0.033 0.66 0.18 0.02 to 0.35
Social work
staff
Not redeployment
Redeployment
35
15
5.07 (1.96)**
3.58 (1.02)**
2.43
(48)
0.019 0.75 1.49 0.22 to 2.76

© Queen‟s Printer and Controller of HMSO 2011. . This work was produced by Huxley et al. under the terms of
a commissioning contract issued by the Secretary of State for Health. Project 08/1619/114
59
4.2 The staff survey
Three hundred and four staff members responded to the survey
representing 42 teams in four locations in two countries. Four WDQs were
completed by administrators in one location only, so they were omitted
from further analyses.
Twenty-eight of the teams were CMHTs representing a team level response
rate across the four locations of 90% (28/31), but the response in the
newly created teams was lower at 61% (14/23). Of the 300 individual
responses, 240 staff worked in CMHTs and 60 in the other teams. The
overall staff response rate was 46%, which is reasonable for a survey of this
type and similar to previous studies of the mental health workforce.(14, 153)
Team coverage was similar in both countries with 18 teams from Wales and
24 from England. Data were provided from seven teams in Trust A (16.7%),
11 teams in Trust B (26.2%), 14 in Trust C (33.3%), and 10 in Trust D
(23.8%).
Most teams were managed by a nurse (n=39, 92.9%) and all but one team
was co-located (all health and social care staff in the same place/building).
In just under half of the teams (n=20, 47.6%) health and social care
budgets were pooled (though in effect this simply meant that local authority
funds had been transferred to the Trust to employ social worker and
support workers). The factors determining team composition included
history for 50% of team, resources for 26.2%, guidance for just under half
the teams (47.6%) and multi-disciplinarity, also in just over half (52.4%).
All mentioned demand as a determining factor.
4.2.1 Team Composition
On average the proportion of social care staff within these teams (as
reported by managers in Phase I) was 29% (sd 17.2%), but ranged from
zero to 88.2%. Six teams had no social care input at all either from social
workers or social care support workers, eight teams had no social workers
and 16 had no social care support workers. Clearly these data were
significantly skewed and required log-transformation to normalise the
distribution. Significant differences in the composition, by area, country,
CMHT status and degree of integration, in relation to co-location and pooled
funding were observed in transformed and untransformed data and in non-
parametric tests. Therefore for ease of interpretation untransformed results
are presented below.

© Queen‟s Printer and Controller of HMSO 2011. . This work was produced by Huxley et al. under the terms of
a commissioning contract issued by the Secretary of State for Health. 60
Project 08/1619/114
On average the proportion of social care staff within teams was higher in
the English participating locations than in the Welsh locations (Means 35.3,
sd 19.9 cf 22.7, sd 10.7; t=6.83, df 228.8, p=0.000). Two of the English
teams had no social workers (8.3%), eight had no social care support
workers (25%) but only one team had no social care input at all (neither
social work or social care support. In Wales, six teams had no social
workers (33.3%), seven had no social care workers (38.9%) and five had
no social care input at all (27.8%).
Clearly these teams are nested within areas that were selected on the basis
of their rationale for team composition and levels of integration, so it is not
surprising that the proportion of social care in teams also varied by area
(F=143.7, p=0.000). The respective means, standard deviations and ranges
are shown in Table 7, which shows that the social care composition was
significantly higher in locations A (p<0.001) and D (p<0.000) than in any
other group; the proportions in locations B and C did not differ from each
other. Both of the English teams with no social workers and all but one of
the English teams with no social support workers were located in location C.
Only location B of the Welsh teams had no social work and / or social care
input to their teams.
Table 7. Social care staff as a proportion of total team size in the four
locations
Location (n) Mean % (sd) 95% CI Range
A (78) 27.6 (8.3) 25.7 - 29.5 27.5 – 58.8
B (72) 17.4 (10.5) 14.9 - 19.9 0 – 34.2
C (81) 20.9 (8.8) 19.0 - 22.9 0 – 36.8
D (69) 52.2 (15.6) 48.5 - 56.0 19.7 – 88.2
CMHTs differ from other types of team, in that the latter are significantly
smaller and team composition varied considerably, in terms of the social
care component. In the CMHT sample the average proportion of social care
staff was 31.5% (sd 17.6), compared to less than one-fifth in the other
types of team (19.1%, sd 10.6; t= -0.70 (df 150.76), p=0.000).
Forty-three percent of the new teams have no social workers in them (n=6)
and almost three-quarters (71.4%, n=10) have no social support workers.

© Queen‟s Printer and Controller of HMSO 2011. . This work was produced by Huxley et al. under the terms of
a commissioning contract issued by the Secretary of State for Health. 61
Project 08/1619/114
(There is an argument about whether some of these teams need support
workers or social workers – see later). Just over a quarter (28.6%, n=4)
had no social care input at all.
There was less variability in the corresponding figures for CMHTs, of which
only two had no social care input at all (7.1%), although just over a fifth
(21.4%, n=6) had no social care support staff
4.2.2 Integration
The proportion of social care staff was lower in co-located services than
where staff were not co-located (28.8% (sd 17.5%) cf 33.7% (sd 0%), t=
4.73 (df 287) p=0.000), although all of the teams with no social care input
were co-located.
Finally the proportion of social care staff was higher where health and social
care budgets were pooled (mean 35.3 (sd 19.9) cf mean 22.7 (sd 10.7); t=
-16.8 (df 228.8) p=0.000). This result is consistent with the finding in the
national survey that where social services determined the staffing levels
the proportion of social care staff was lower (see section 2.5). None of the
teams in Wales had access to pooled budgets, whereas all the English ones
did, which is due to the absence of mental health Trusts in Wales (χ2 =
38.1, df 1, p<0.001, Phi 1.00). Sixty-two percent of CMHTs had pooled
budgets.
4.2.3 Team typology
Team typology in relation to the social care composition of teams was
determined according to the distribution of the proportion of social care
staff (including social work and social care staff groups) to total staffing.
Figure 2 shows that six clear groups were identifiable. For some subsequent
analyses these groups were collapsed further to form three groups <20%,
30-40% and >40%, but where possible the six groups identified in Table 8
were retained in order to identify factors associated with very high, high
and very low social care membership.

© Queen‟s Printer and Controller of HMSO 2011. . This work was produced by Huxley et al. under the terms of
a commissioning contract issued by the Secretary of State for Health. 62
Project 08/1619/114
Figure 2: Proportion of social care staff in teams
Table 8. Social care staff as a proportion of the full team (Team typology)
Proportion Number of teams (%) Number of staff (%)
10% or less 8 (19.0) 35 (11.6)
Up to 20% 9 (21.4) 62 (20.6)
Up to 30% 13 (31.0) 105 (35.0)
Up to 40% 6 (14.3) 41 (13.6)
Up to 60% 3 ( 7.1) 28 ( 9.3)
Over 60% 3 ( 7.1) 31 (10.3)
Total 42 (100)
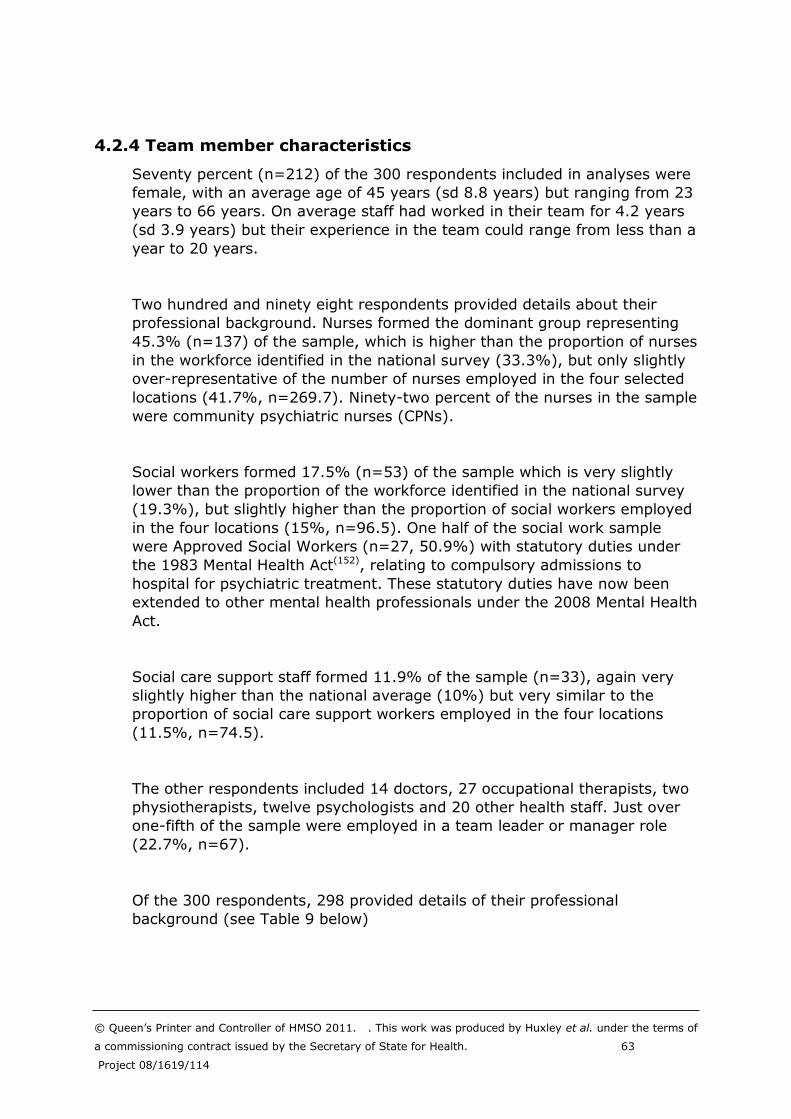
© Queen‟s Printer and Controller of HMSO 2011. . This work was produced by Huxley et al. under the terms of
a commissioning contract issued by the Secretary of State for Health. 63
Project 08/1619/114
4.2.4 Team member characteristics
Seventy percent (n=212) of the 300 respondents included in analyses were
female, with an average age of 45 years (sd 8.8 years) but ranging from 23
years to 66 years. On average staff had worked in their team for 4.2 years
(sd 3.9 years) but their experience in the team could range from less than a
year to 20 years.
Two hundred and ninety eight respondents provided details about their
professional background. Nurses formed the dominant group representing
45.3% (n=137) of the sample, which is higher than the proportion of nurses
in the workforce identified in the national survey (33.3%), but only slightly
over-representative of the number of nurses employed in the four selected
locations (41.7%, n=269.7). Ninety-two percent of the nurses in the sample
were community psychiatric nurses (CPNs).
Social workers formed 17.5% (n=53) of the sample which is very slightly
lower than the proportion of the workforce identified in the national survey
(19.3%), but slightly higher than the proportion of social workers employed
in the four locations (15%, n=96.5). One half of the social work sample
were Approved Social Workers (n=27, 50.9%) with statutory duties under
the 1983 Mental Health Act(152), relating to compulsory admissions to
hospital for psychiatric treatment. These statutory duties have now been
extended to other mental health professionals under the 2008 Mental Health
Act.
Social care support staff formed 11.9% of the sample (n=33), again very
slightly higher than the national average (10%) but very similar to the
proportion of social care support workers employed in the four locations
(11.5%, n=74.5).
The other respondents included 14 doctors, 27 occupational therapists, two
physiotherapists, twelve psychologists and 20 other health staff. Just over
one-fifth of the sample were employed in a team leader or manager role
(22.7%, n=67).
Of the 300 respondents, 298 provided details of their professional
background (see Table 9 below)

© Queen‟s Printer and Controller of HMSO 2011. . This work was produced by Huxley et al. under the terms of
a commissioning contract issued by the Secretary of State for Health. 64
Project 08/1619/114
Table 9. Professional group of respondents (Phase II teams only)
Professional n %
Doctors 14 4.7
OT 27 9.1
Social worker 53 17.8
Nurse 137 46.0
Support worker 33 11.1
Psychologist 12 4.0
Other 22 7.4
Total 298 100
There were no differences in the responses from different staff groups
between countries, areas nor more and less integrated teams (as indicated
by pooled funding and / or co-location), but differing responses were
observed between CMHTs and the new teams. Nurses and social workers in
the two team types responded in similar proportions but it appeared that
fewer support workers responded from CMHTs (9.2% (n=22) cf 18.3%
(n=11) and fewer „other‟ staff members responded from the new teams
(10% (n=6) cf 29% (n=69; χ2=11.34 (df 3) p=0.010). Further examination
of the „other‟ professional group difference suggested that it was a lack of
response from doctors within the new teams that contributed the groups‟
lower response, but as this analysis violated the expected cell count
assumption this assertion should be treated with some caution (χ2=11.92
(df 5) p=0.036). While it is almost certain that a lower response from
doctors in the new teams is due to the low numbers employed in these
teams, it is not the case that social support staff are employed in lower
numbers in CMHTs.
Nevertheless, on the whole the data can be considered representative of the
mental health workforce within the selected locations.
4.2.5 Team Culture and Climate
Organisational and team culture was assessed using WDQ and Karasek JCQ
subscales. Three of the WDQ subscales were normally distributed
(autonomy, integration and uncertainty), but others had to be transformed
to normalise their distributions. Intention to leave the employer was

© Queen‟s Printer and Controller of HMSO 2011. . This work was produced by Huxley et al. under the terms of
a commissioning contract issued by the Secretary of State for Health. 65
Project 08/1619/114
normalised by log-transformation, while role perception, teamwork, access
to information technology and quality of care required reflect square root
transformations, which caused positive associations to be indicated by the
negative beta coefficients in the regression analyses. It was not possible to
normalise the distributions of role flexibility, management, training and
career progression or intent to leave the profession. Of the Karasek JCQ
subscales, only psychological job demands was not normally distributed in
the original data requiring square-root transformation.
In most respects the results of transformed and untransformed data were
similar in terms of statistical significance and magnitude of effect, therefore,
to make the results more readily interpretable we have, for the most part,
reported the untransformed means and standard deviations rather than the
transformed results. Where transformation did alter the findings, this is
reported in the text.
Missing data analyses indicated that most variables had less than 1%
missing data, only intention to leave the profession (1.3%), intention to
leave the employer (2.3%) and overall job satisfaction (10.6%) were
higher; the higher level of missing data in job satisfaction is thought to be
due to the location of the question within the questionnaire, which on
reflection appears to be easily overlooked. Nevertheless, repeated analyses
that were undertaken both with and without the missing data (as
recommended by Tabachnick and Fidell(141), p63) demonstrated that the
influence of missing data was limited and only related to access to IT, in
that it had a significantly different relationship with overall job satisfaction
in the two forms of analysis. Access to IT subscale scores were higher when
the missing data were included (t=2.3, 33.6 p=0.013), but became
statistically insignificant following Simes procedure adjustments. As access
to IT was not deemed a conceptually important variable and would not be
included in regression analysis, the analyses that follow contain the missing
data.
Table 10 describes the sample as a whole in terms of team culture and
climate as measured by WDQ and Karasek JCQ items. On both scales higher
ratings generally indicate a positive rating for each aspect of team climate
and culture. Nevertheless, for uncertainty, psychological job demands and
indicators relating to future work plans lower scores are desirable as they
reflect less uncertainty and intent to leave the employer or the profession.
All WDQ indicators are rated on a percentage scale, on which the minimum
possible score is 10. Karasek JCQ items are rated on different scale: the
minimum possible score for decision latitude is 14 and the maximum 92;
scores for psychological job demands can range between 15 and 48, and
those for social support between four and 32.

© Queen‟s Printer and Controller of HMSO 2011. . This work was produced by Huxley et al. under the terms of
a commissioning contract issued by the Secretary of State for Health. 66
Project 08/1619/114
Table 10. Team culture and climate: Descriptive statistics
WDQ Subscales Median Mean (sd) Range
Autonomy 55.0 58.33 (17.04) 12.5-100
Role perception 62.2 61.27 (10.99) 17.8 – 87.8
Role flexibility 78.3 77.87 (12.53) 26.7-100
Integration 66.6 66.80 (16.05) 20-100
Teamwork 77.0 75.02 (15.56) 6 -100
Management 90.0 83.35 (17.90) 10 -100
Access to IT 80.0 74.73 (18.57) 22.5 – 100
Training, career 62.5 61.81 (12.84) 17.5 – 88.8
Quality of care 90.0 84.65 (13.93) 10 -100
Uncertainty 58.8 59.94 (12.59) 15 -100
Intend to leave
employer
30.0 43.10 (35.51) 10 -100
Intend to leave
Profession
20.0 37.94 (35.43) 10 -100
Overall job
satisfaction
70.0 67.16 (19.43) 10 -100
Karasek Subscales
Psychological job
demands
33.0 34.10 ( 5.96) 18-48
Decision latitude 62.0 63.52 (11.62) 24-88
Social Support 25.0 25.64 ( 3.43) 14-32
All WDQ items were above the mid-point, which with the exception of
uncertainty (in relation to job security, team direction and clarity of role
within the team) suggests positive team climate and culture. Psychological
job demand scores were relatively high at 68.8% when the median rating
was standardised as a percentage of the maximum possible score. High
levels of social support were in evidence however, reaching 78% when
standardised as a percentage. Accordingly, job satisfaction ratings were
high and intention to leave ratings low, suggesting that there was an overall
positive feeling about the employer and profession. Ratings were
particularly high for quality of care and management, perhaps reflecting

© Queen‟s Printer and Controller of HMSO 2011. . This work was produced by Huxley et al. under the terms of
a commissioning contract issued by the Secretary of State for Health. 67
Project 08/1619/114
social desirability bias. Access to IT was generally highly rated, as were
team work, role flexibility and to a lesser extent integration. WDQ scores for
autonomy and Karasek JCQ decision latitude were significantly correlated
(r=0.25, p=0.000) and both indicated that autonomy ratings were slightly
lower (median decision latitude ratings expressed as a percentage of the
maximum possible rating =67.4%).
4.2.6 Location
Table 11 shows that ratings for uncertainty, quality of care and overall job
satisfaction were similar across the four locations. Given individual staff
motivation for going into community mental health work and the presence
of ubiquitous change in the NHS it is not surprising that these variables did
not differ by location. It is interesting that the location with the most
uncertainty was the Trust applying for Foundation status, and which, as a
direct consequence was unable to take part in the service user interviews
phase of the present study. In terms of wanting to leave the employer, staff
in location C were more likely to want to leave compared to staff in location
A (mean difference = 24.3, CI 9.7, 38.8); similarly location C ratings for
leaving the profession were higher than locations A (mean difference =-
0.30, CI -0.47, -0.13) and D (mean difference =-0.30, CI -0.48,-0.13) (all
p<0.001).
The pattern of the significant results usually reveals that location C most
often has higher (better) scores on most subscales and that location D most
often has the lower (worse) scores (except the intention to leave variables
which are reversed). In terms of integration, location C was significantly
different to all the others locations, but most different from location D
(mean difference = -15.1, CI -21.7, -8.4). A similar result, between
locations C and D was observed for autonomy (mean difference = -8.4, CI -
15.7, -1.0), teamwork (mean difference = -8.7, CI -15.4, -2.07, p=0.003),
management style (mean difference = -8.5, CI -16.25, -0.67, p<0.001),
training (mean difference = -7.43, CI -12.77, -2.08, p=0.002), and access
to IT subscales (mean difference = -8.15, CI -16.21, -0.09, p= 0.46).
While psychological job demands and decision latitude did not differ
significantly by area (despite a non-significant trend in untransformed
data), social support did; ratings were lowest in location D and highest in
location C (p=0.04) and the result remained significant following Simes
procedures adjustment(140). Social support was the only Karasek JCQ
subscale to be significantly correlated with the proportion of social care staff
in the team. (Table 12) The larger the number of social care staff the less
social support there was from colleagues and supervisors (r=-0.15
p=0.012).

© Queen‟s Printer and Controller of HMSO 2011. . This work was produced by Huxley et al. under the terms of a commissioning contract issued by the Secretary of State
for Health. Project 08/1619/114 68
Table 11. WDQ subscales scores by location
WDQ subscale
Location A Mean (sd)
Location B Mean (sd)
Location C Mean (sd)
Location D Mean (sd)
Statistical significance*
Integration 64.5 (12.6) 66.6 (17.6) 74.9 (16.8) 59.8 (12.7) F=13.08 (293) 0.001
Autonomy 52.3 (15.1) 55.3 (17.6) 57.8 (18.3) 49.4 (16.7) F= 3.45 (295) 0.017
Uncertainty 61.9 (11.3) 59.1 (14.9) 58.5 (11.5) 60.2 (12.6) F= 1.14 (294) NS
Access to IT 73.6 (18.2) 72.5 (18.9) 80.1 (17.4) 71.9 (19.1) F= 3.90 (293) 0.009
Quality of Care 84.2 (12.6) 85.6 (13.8) 86.2 (13.6) 82.3 (15.6) F= 1.20 (294) NS
Teamwork 73.8 (13.3) 77.4 (14.3) 78.5 (16.4) 69.7 (16.8) χ2 = 18.40 (3) 0.001
Training 65.5 (9.0) 64.3 (11.1) 62.1 (11.5) 54.7 (16.7) χ2 = 23.12 (3) 0.001
Role flexibility 75.1 (12.1) 79.9 (11.1) 80.2 (12.9) 76.0 (13.4) χ 2 = 10.74 (3) 0.013
Role perception 59.6 (10.0) 61.8 (10.3) 63.7 (12.9) 59.7 (9.8) χ2 = 13.13 (3) 0.004
Management style 84.4 (17.0) 80.7 (20.8) 87.8 (13.7) 79.4 (19.0) χ2 = 9.26 (3) 0.026
Overall Job satisfaction 68.2 (15.7) 68.9 (15.7) 67.9 (20.3) 63.2 (25.0) χ2 = 1.48 (3) NS
Intention to leave the employer
29.8 (27.3) 47.7 (36.2) 54.1 (38.7) 40.5 (34.6) χ2 = 15.45 (3) 0.001
Intention to leave the profession
26.4 (25.4) 40.6 (36.7) 55.8 (40.0) 26.8 (28.3) χ2 = 13.40 (3) 0.001
* All significant results remain significant after Simes adjustment

© Queen‟s Printer and Controller of HMSO 2011. . This work was produced by Huxley et al. under the terms of a commissioning contract issued by the Secretary of State
for Health. 69
Project 08/1619/114
Table 12. Karasek JCQ Scores
Karasek variable Test result Mean (sd) Significance
By location
Psychological job demands F= 2.21 (3,284) A= 33.8 (5.4) B =32.8 (5.2) C =34.7 (6.6) D = 35.3 (6.4) NS
Social support F=2.81 (3,286) A = 25.8 (3.7) B= 25.9 (3.7) C= 26.2 (3.3) D=24.6 (3.3) 0.040*
Decision latitude F=2.73 (3,277) A= 61.6 (11.9) B= 65.0 (10.5) C = 65.9 (12.7) D=61 (12.7) 0.044*
By team type
Psychological job demands t=-0.79 (286) CMHT = 34.2 (5.9)
New = 33.6 (6.3)
NS
Social support t=0.92 (285) CMHT = 25.5 (3.6)
New = 26.0 (3.3)
NS
Decision latitude t=1.42 (279) CMHT = 63.0 (11.8)
New = 64.5 (10.7)
NS
By professional group
Psychological job demands F=2,.84 (3,275) Nurse 34.5 (5.7) SW 36.6 (6.5)
Support W 29.3 (6.5) Other 33.5 (5.4)
p=0.039*
Social support F=2.07 (3, 284) Nurse 25.5 (3.7) SW 25.9 (3.9)
Support W 25.8 (2.9) Other 25.8 (3.0)
NS
Decision latitude F=10.67 (3,282) Nurse 64.1 (11.6) SW 61.2(13.2)
Support W 59.5(9.3) Other 65.7 (10.7)
p<0.001
* no longer significant after Simes procedure applied

© Queen‟s Printer and Controller of HMSO 2011. . This work was produced by Huxley et al. under the terms of a commissioning contract issued by the Secretary of State
for Health. 70
Project 08/1619/114
Table 12. Karasek JCQ scores (continued)
By proportion of social care staff
Karasek variable Test result <10% Up to 20% 20-29% 30-39% 40-59% 60% and
over
Significance
Psychological job demands F= 0.38
(5,282)
33.4 (6.1) 33.5 (6.0) 34.3 (5.7) 34.5 (6.8) 34.8 (5.7) 33.9 (5.9) NS
Social support F= 3.39 (5,284)
25.1 (3.3) 26.1 (3.4) 26.5 (3.6) 24.5 (3.5) 24.9 (3.6) 24.5 (2.9) p=0.005
Decision latitude F=1.59 (2,275)
62.5 (11.9) 67.5 (10.3)
62.9 (11.9)
62.7 (10.9)
63.7 (10.9)
61.1 (12.8)
NS

© Queen‟s Printer and Controller of HMSO 2011. . This work was produced by Huxley et al. under the terms of
a commissioning contract issued by the Secretary of State for Health. Project 08/1619/114
71
4.2.7 Team culture and team composition
Table 13 shows that integration varies significantly with the proportion of
social care staff in the team. The lower the proportion the higher (better)
the perceived integration score is. The significant differences are between
the top two (more than 40%) and the bottom two (less than 20%). This
result tends to confirm the previously reported findings from a national
survey of mental health social workers.(14) The patterns for management
style, teamwork and training and career development are not dissimilar,
where on the whole having 30% or less of social care staff seems to
produce the higher scores on the WDQ variable. Interestingly, overall job
satisfaction is also significantly higher where there are fewer social care
staff. There are no variables where the results are in the reverse order, so
there is no evidence that more social care staff improves culture and
climate, but there is evidence that the more social care staff there are, the
more certain aspects of culture and climate are adversely affected, and
integration is one of these. As we shall see later, integration scores do not
differ by professional group, from which we conclude that having more
social care staff affects all professional groups equally and is not confined to
any one in particular.
There were no significant differences between the psychological demand
and decision latitude Karasek JCQ subscales in relation to the proportion of
social care staff in the teams.. There were low but significant inverse
correlations between the decision latitude subscale and the proportion of
social care staff in the team (r=-0.126, p=0.034) and the proportions of
support workers (r=-0.133, p=0.024) but not the proportion of social
workers (after Simes adjustment). There was a significant difference in
social support depending on the proportion of social care staff (F=3.39
(5,284) p=0.005). The proportion below the mean percentage (20-29%)
differed from the group just above the mean (30-40%) (mean difference =-
2.03 (-3.95, -0.10) p=0.03), with higher ratings being reported where the
social care proportion was higher.
Overall, the proportion of social care workers in the team was unrelated to
higher scores on the psychological job demand scale, however, both the
number of social workers (r=0.144, p=0.015) and the proportion of ASWs
in the team were related to the psychological demand scale (r=0.131,
p=0.026).

© Queen‟s Printer and Controller of HMSO 2011. . This work was produced by Huxley et al. under the terms of a commissioning contract issued by the Secretary of State
for Health. Project 08/1619/114 72
Table 13. WDQ subscales by proportion of social care staff in the team
WDQ subscale Less than 10% Up to 20% Up to 30% Up to 40% Up to 60% Over 60% Statistical significance
Integration 71.2 (16.9) 68.1 (15.7) 69.3 (15.5) 64.8 (17.3) 58.6 (13.5) 59.6 (13.8) F=3.94 (291) 0.002*
Autonomy 57.0 (19.2) 56.6 (17.6) 53.9 (16.40 54.4 (14.2) 49.7 (17.7) 47.1 (16.8) F= 1.86 (293) NS
Uncertainty 58.4 (14.5) 60.6 (13.4) 60.4 (11.7) 57.4 (12.5) 64.5 (13.1) 58.1 (10.7) F= 1.31 (292) NS
Access to IT 77.4 (18.1) 72.7 (21.1) 76.5 (17.9) 75.2 (15.8) 74.6 (16.5) 64.0 (20.5) F= 0.39 (292) NS
Quality of Care 84.0 (12.0) 85.1 (16,4) 85.6 (12.2) 83.4 (12.4) 82.8 (18.2) 84.2 (14.8) F= 1.00 (291) NS
Teamwork 77.8 (14.1) 80.4 (117) 77.2 (12.4) 78.5 (14.3) 77.3 (2.4) 75.1 (12.3) χ2 = 15.0 (5) 0.010*
Training 60.8 (9.9) 63.5 (12.3) 65.2 (9.9) 60.0 (13.4) 56.9 (17.8) 54.7 (15.9) χ = 18.22 (5) 0.003 *
Role flexibility 77.7 (12.4) 80.4 (11.7) 77.2 (12.4) 78.5 (14.3) 77.3 (12.4) 77.9 (12.5) χ 2 = 5.1 (5) NS
Role perception 64.8 (9.9) 60.9 (12.2) 61.3 (10.7) 62.3 (11.0) 59.9 (12.0) 57.8 (8.3) χ 2 = 9.3 (5) NS
Management style 81.1 (19.8) 83.6 (19.3) 86.8 (15.8) 80.2 (17.6) 82.5 (17.5) 78.4 (19.2) χ 2 = 11.9 (5) 0.036
Overall Job
satisfaction
66.6 (18.10 70.4 (16.8) 68.7 (17.6) 67.5 (20.1) 66.8 (24.6) 63.2 (25.1) χ 2 = 15.75 (5) 0.008*
Intention to leave
the employer
59.4 (35.9) 41.2 (36.3) 40.0 (34.6) 46.1 (36.5) 39.6 (34.7) 37.3 (32.9) χ 2 = 9.01 (5) NS
Intention to leave
the profession
59.7 (39.0) 33.8 (33.7) 39.2 (36.3) 38.3 (34.1) 26.0 (26.2) 25.4 (29.1) χ 2 = 5.38 (5) NS
* remain significant when Simes adjustment applied

© Queen‟s Printer and Controller of HMSO 2011. . This work was produced by Huxley et al. under the terms of
a commissioning contract issued by the Secretary of State for Health. Project 08/1619/114
73
4.2.8 Team culture by team type
Table 14 shows that the new teams ratings are significantly higher than
those for CMHTs for integration and teamwork, role perception, access to IT
and autonomy, all of which are understandable. CMHTs have a greater
degree of uncertainty, which is possibly a consequence of service
reconfiguration and the loss of staff to the new teams. The new team staff
are however, much more likely to report that they intend to leave the
employer and the profession, which could be interpreted as a worrying sign.
The difference in intention to leave between the two teams could be due to
the nature of the work in the new teams, or the type of employment
contract of the workers. Other possible explanations are that the new team
staff are the more ambitious and younger and are planning their career
moves, or the CMHT staff are more comfortable in the work they are doing
and less ambitious. Length of time in the team differs between the team
types, but that is an artefact of the recent creation of the new teams. Age
(46.4 (sd8.9) cf 44.6 (sd 8.8)) and gender are not significantly different in
the two team types (New teams 75% female, CMHT 62%).
None of the Karasek JCQ sub-scales differed by type of team (CMHT or
other).
4.2.9 Team culture and professional groups
Once again, as Table 15 shows, professional groups did not differ on a
number of the subscales. This may be in part a consequence of the fact that
they are members of the same teams, and subject to many of the same
experiences. So, as with the location data, uncertainty is consistent across
the groups, as is overall job satisfaction. On this occasion, however, ratings
on the quality of care subscale were significantly different because support
workers had rated it more highly than social workers (mean difference = -
1.42 CI -2.6, -0.21, p=0.012). Support workers also reported higher scores
in relation to access to IT than social workers (mean difference = -1.57 CI -
2.93, -0.22, p=0.042) and „other‟ workers (mean difference = -1.67, CI -
2.94, -0.39, p=0.004).
Integration, which differed by location did not differ by professional group,
nor did teamwork, training, role flexibility, management style, or the
intention to leave the profession.
Support workers had, as one might have expected, significantly lower
autonomy scores (38.3 sd 16.5, CI 12.5-82.5) compared to nurses (55.9 sd
15.7 CI 17.5-100), social workers (55.6 sd17.8, CI22.5-87.5), and others
(55.7 sd 16.1, CI 2.5 -92.3). As a result, the composition of the team, in

© Queen‟s Printer and Controller of HMSO 2011. . This work was produced by Huxley et al. under the terms of a commissioning contract issued by the Secretary of State for
Health. Project 08/1619/114 74
Table 14. WDQ subscales by team type
WDQ subscale Functional teams
Mean (sd)
CMHTs
Mean (sd)
Statistical significance*
Integration 81.1 (18.8) 63.2 (17.9) t = 6.95 (74) p<0.001
Autonomy 62.8 (18.9) 51.6 (15.8) t = 4.24 (81) p<0.001
Uncertainty 54.5 (11.1) 61.3 (12.6) t = -3.79 (296) p<0.001
Access to IT 82.1 (17.0) 72.9 (18.5) t = -3.86 (295) p<0.001
Quality of Care 86.7 (12.6) 84.1 (14.2) t = -1.3 (296 ) NS
Teamwork 81.3 (14.2) 73.4 (15.5) MWU= 4688, z=-4.10, p<0.001
Training 63.7 (11.0) 61.3 (13.2) MWU= 6519, z=-1.04, NS
Role flexibility 80.3 (11.5) 77.2 (12.7) MWU= 6176, z=-1.66, NS
Role perception 66.8 (10.8) 59.8 (10.6) MWU= 4388, z=-4.70, p<0.001
Management style 86.8 (15.4) 82.5 (18.4) MWU= 6171, z= -1.50 NS
Overall Job satisfaction 68.2 (20.1) 66.9 (19.1) MWU= 5217, z=-.81 NS
Intention to leave the employer 81.2 (25.7) 33.5 (30.9) MWU=1949, z=-8.8) p<0.001
Intention to leave the profession 87.8 (21.0) 25.3 (25.9) MWU= 934, z=-11.1) p<0.001
* All significant results remain significant after Simes adjustment

© Queen‟s Printer and Controller of HMSO 2011. . This work was produced by Huxley et al. under the terms of a commissioning contract issued by the Secretary of State
for Health. 75
Project 08/1619/114
Table 15. WDQ subscales by professional group
WDQ subscale Nurse Social worker Support worker ‘Other’ group Statistical
significance
Integration 64.1 (10.4) 66.9 (15.9) 64.3 (15.2) 67.7 (14.6) F=0.25 (293) NS
Autonomy 55.9 (15.7) 55.6 (17.7) 40.5 (18.3) 52.6 (12.1) F=5.30 (295) 0.001*
Uncertainty 59.4 (13.8) 58.5 (11.8) 60.4 (12.5) 61.5 (11.1) F=0.77 (294) NS
Access to IT 75.9 (18.3) 72.9 (17.8) 85.0 (18.9) 71.6 (18.7) F=4.58 (293) 0.004*
Quality of Care 85.7 (13.2) 81.2 (14.8) 90.5 (13.9) 83.6 (14.0) F= 3.83 (294) 0.01*
Teamwork 76.2 (15.6) 71.4 (17.1) 80.2 (15.2) 74.2 (14.3) χ 2 = 7.0 (3) NS
Training 61.6 (13.2) 63.4 (12.2) 59.4 (16.1) 61.7 (11.8) χ 2 = 1.4 (3) NS
Role flexibility 77.5 (13.0) 78.1 (13.7) 81.3 (11.0) 77.5 (11.4) χ 2 = 1.95 (3) NS
Role perception 64.1 (10.4) 56.3 (10.2) 65.0 (11.8) 59.0 (10.8) χ 2 = 30.6 (3) 0.001*
Management style 84.5 (16.9) 81.9 (20.0) 86.5 (20.9) 81.7 (17.4) χ 2 = 6.18 (3) NS
Overall Job satisfaction 66.4 (20.0) 64.2 (19.9) 66.5 (23.9) 70.3 (17.1) χ 2 = 2.35 (3) NS
Intention to leave the employer 44.0 (36.7) 52.4 (34.1) 43.5 (38.2) 36.2 (32.8) χ 2 = 8.3 (3) 0.04
Intention to leave the profession 38.9 (35.6) 43.2 (38.7) 46.5 (37.7) 31.4 (31.9) χ 2 = 5.5 (3) NS
* remain significant after Simes adjustment

© Queen‟s Printer and Controller of HMSO 2011. . This work was produced by Huxley et al. under the terms of
a commissioning contract issued by the Secretary of State for Health. Project 08/1619/114
76
terms of the proportion of social care staff was inversely correlated with
autonomy. (r=-0.185 p<0.001)
Nurses and support workers were the most confident about their role in the
team and social workers and others less so. The proportion of social care
staff in the team was inversely related to role perception (r=-0.154,
p=0.008). The proportion of social care workers in the team was also
inversely related to integration (r=-0.227, p<0.001), training and career
development (r=-0.240, p<0.001), and teamwork (r=-0.206, p<0.001),
but social care input was unrelated to uncertainty, access to IT, role
flexibility, management style and overall job satisfaction.
The psychological job demand subscale had to be transformed to render it
normal. The results of untransformed and transformed data indicated that
psychological job demands differed significantly between the professional
groups (F=10.67 (2, 282) p<0.001 and F=11.05 (3, 282) p<0.001
respectively). Post hoc analyses showed that support workers‟ scores were
significantly lower than social workers (mean difference = -0.63 (-0.92, -
0.33) p<0.001), nurses (mean difference = -0.46, (-0.72, -0.19) p<0.001),
and „other‟ staff (mean difference = -0.37 (-0.65, -0.21) p=0.024) but the
latter difference became non-significant when Simes adjustments were
applied).
Decision latitude also differed between the groups (F=2.83, (3,275)
p=0.039) with support workers, as might be expected scoring lower than
the other groups; nevertheless this difference became insignificant when
the Simes procedure was applied.
Professional group differences were also observed in staff outcome variables
relating to future work plans. Tests of original and transformed data
identified significant differences in intention to leave the employer (original
F=3.99, (3,287) p=0.18) and transformed (F=3.75, (3,287) p=<0.01).
It was not possible to normalise the intention to leave the profession
variable and the significant result of the ANOVA (F=4.88 (3, 290) =0.003)
was confirmed by nonparametric testing (KWχ2 = 13.83, df 3 p=0.003). As
one might expect, support workers were more likely to leave (probably to
undertake other forms of professional training or higher paid jobs), scoring
significantly higher than the score in the „other‟ category. Social worker and
nurse median scores were 20, while support workers scored 50 and „others‟
10.

© Queen‟s Printer and Controller of HMSO 2011. . This work was produced by Huxley et al. under the terms of
a commissioning contract issued by the Secretary of State for Health. 77
Project 08/1619/114
The higher the proportion of social care staff in the team, the lower the
intention to leave the profession, a result in the same direction as the last
one but stronger (r=-0.208, p<0.001). Taken together the two suggest that
those who are intending to leave are more likely to want to do so where the
proportion of social care staff is lower.
4.2.10 Team culture and demography
There were no age or gender differences in overall job satisfaction and
intention to leave. The only team culture subscales to show an age
difference were role perception and psychological job demands. Workers
who were under 25 years old had lower role perception scores compared to
older workers (in both the original and transformed variables F=4.86 (4,
291) p=0.001; and F=4.28, (4, 291) p=0.002); similarly staff aged under
25 had lower psychological job demands than staff aged between 25 and 45
(F=3.53, df 4,279, p=0.008).
4.2.11 Integration and inter-professional working
Individuals rated how closely they work with other professional groups
within and outside the mental health team using a scale that ranges from
zero indicating that they did not work with that profession at all, to five
indicating a very close working relationship with that staff group. They also
provided ratings of the extent of role overlap between their own role and
that of the same professional groups, using the same scale. Most variables
were significantly skewed and could not be normalised using the
appropriate transformation techniques, so these are analysed using non-
parametric tests.
In the analyses that follow we focus on inter-professional working between
different professional groups located within community mental health
teams, to indicate the extent of integration in a practical sense within the
mental health context. We also examine the working relationships between
key staff groups within these teams and general practitioners operating
outside the system in primary care, other nurses some of whom will be
outside the mental health system and other health care professionals
operating in the wider context. We do this in order to examine the extent of
structural level integration, as defined in Section 3.2.
All team members reported some form of working relationship with a
psychiatrist or some type of social worker, although five did not work with
ASWs, and a different five did not work with non-ASW social workers.
Overall, the vast majority reported having some form of working
relationship with the key professional groups involved in mental health care

© Queen‟s Printer and Controller of HMSO 2011. . This work was produced by Huxley et al. under the terms of
a commissioning contract issued by the Secretary of State for Health. 78
Project 08/1619/114
with only three people not working with any nurses, four not working with
CPNs, two not working with psychologists, six not working with GPs, nine
not working with psychologists and 13 not working with OTs. Nevertheless,
a reasonable proportion did not work with nurses who were not CPNs
(18.5%, n=48), a finding that we will investigate further, later. As you
might expect the proportion not working with staff groups outside of these
core professions was considerably higher ranging from around 50% for
dieticians and physiotherapists to 80% for geriatricians and 85% for
podiatrists and speech and language therapists.
This is reflected clearly in Graph A presented in Figure 3. These radial
graphs indicate the extent to which each staff group works closely with the
other professions (in the black area) and the extent to which their own role
overlaps with other professions (in the grey area). The larger the area
covered the closer the working relationship or the extent of role overlap.
Graph A illustrates that overall, staff within community mental health teams
work most closely and have more role overlap with fellow teams than with
fellow health professionals operating outside the mental health field.
Working relationships with general practitioners and to a lesser extent
nurses (who may also operate in primary care settings) were closer than for
other allied specialisms. Given the lack of integration with the profession
that are largely unrelated to the mental health field, further analyses focus
upon the core staff groups, including GPs and other nurses. Graph B is
presented to facilitate comparisons with other presented later in this
section.
Both graphs in Figure 3 show that Approved Social Workers, non-approved
social workers, CPNs and support workers work very closely together. Inter-
professional working relationships with occupational therapists,
psychologists and psychiatrists are slightly less close, but nevertheless the
findings suggest that on a practical level community mental health services
(at least in the locations being studied) are reasonably well integrated.
Working relationships with other nurses and general practitioners are less
well established averaging 2.3 and 2.8 respectively, but still suggest some
integration at a structural level, particularly with the services that are most
involved in mental health care.
Figure 3 also demonstrates considerable overlap between roles within
community mental health teams. Approved social worker, CPN, other social
worker and support worker roles overlap considerably, while there is slightly
less overlap with OT, psychologist and psychiatrist roles.

© Queen‟s Printer and Controller of HMSO 2010 79
Project 08/1619/114
Figure 3: Inter-professional working and role overlap in the whole sample
Graph A Graph B
0.0
0.5
1.0
1.5
2.0
2.5
3.0
3.5
4.0
4.5
5.0
Dietician
Geriatrician
GP
Other nurse
OT
Physiotherapist
Podiatrist
PsychologistSocial worker
Approved Social Worker
SLT
Support Workers
Secretary/Admin
CPN
Psychiatrists
Closness of working
Role overlap
0.00
0.50
1.00
1.50
2.00
2.50
3.00
3.50
4.00
4.50
5.00
Approved Social Workers
GPs
Psychiatrists
Other Nurses
OTsPsychologists
Social Workers
CPNs
Support Workers
Closely with Role overlap

© Queen‟s Printer and Controller of HMSO 2010 80
Project 08/1619/114
Graph A illustrates that overall, staff within community mental health teams
work most closely and have more role overlap with fellow teams than with
fellow health professionals operating outside the mental health field.
Working relationships with general practitioners and to a lesser extent
nurses (who may also operate in primary care settings) were closer than for
other allied specialisms. Given the lack of integration with the profession
that are largely unrelated to the mental health field, further analyses focus
upon the core staff groups, including GPs and other nurses. Graph B is
presented to facilitate comparisons with other presented later in this section
Both graphs in Figure 3 show that Approved Social Workers, non-approved
social workers, CPNs and support workers work very closely together. Inter-
professional working relationships with occupational therapists,
psychologists and psychiatrists are slightly less close, but nevertheless the
findings suggest that on a practical level community mental health services
(at least in the locations being studied) are reasonably well integrated.
Working relationships with other nurses and general practitioners are less
well established averaging 2.3 and 2.8 respectively, but still suggest some
integration at a structural level, particularly with the services that are most
involved in mental health care.
Figure 3 also demonstrates considerable overlap between roles within
community mental health teams. Approved social worker, CPN, other social
worker and support worker roles overlap considerably, while there is slightly
less overlap with OT, psychologist and psychiatrist roles.
Nevertheless, Table 16 indicates that with the exception of staff groups that
are or might be located outside of the mental health context (GPs and other
nurses) the proportion of staff reporting that their own role did not overlap
at all with the ASW role was higher, (albeit slightly) than the proportion
reporting no overlap with psychiatrists‟ roles who also held statutory powers
and psychologists; the proportion reporting no role overlap with non-ASW
social workers (and CPNs) was considerably lower than for ASWs suggesting
that it is likely to be that statutory function that mediates role overlap with
ASWs. This raises questions about the nature of the social work role in
mental health teams now, since that function has been opened up to other
professionals within the team.

© Queen‟s Printer and Controller of HMSO 2011. . This work was produced by Huxley et al. under the terms of
a commissioning contract issued by the Secretary of State for Health. 81
Project 08/1619/114
Table 16. Proportion of sample with no overlapping role
Role No overlap (n, %)
Psychiatrist 30 (11.9%)
GP 98 (38.1%)
CPN 15 ( 5.7%)
Other nurse 85 (35.0%)
OT 23 ( 9.0%)
Psychologist 27 (10.3%)
Social Worker 12 ( 4.7%)
ASW 37 (14.4%)
Support Worker 22 ( 9.0%)
4.2.12 Location comparisons
Location comparisons also indicate that in the main most professional
groups involved in the delivery of mental health care, work closely together.
Each location had staff who did not work with non-CPN nurses and there
was a non-significant trend to this being more likely in locations A (n=18,
25.4%) and D (n=14, 24.1%) than in B (n=9, 15%) and C (n=7, 10%);
2=7.27 (df 3) p=0.064, Cramer‟s V =0.17. All four people not working with
a CPN were based in location B and the three not working with nurses were
in C; eight of the nine not working with support workers were also based in
location B (with one in location A). Six of the 13 who had no working
relationship with OTs were based in location C with another six in location D
and one in B. Finally three of the five not working with ASWs were in
location B and two in D, as were four of the five having no working
relationship with non-ASW social workers. These location differences were
statistically significant (p<0.05) but are not being treated as important due
to the small numbers and a failure to meet the expected cell count
assumption of the analysis.
Radial graphs for the four locations included in Phase II (Figure 4) suggest
that inter-professional working relationships and role overlap operate
differently in different locations. While ASWs usually work most closely with
CPNs, other social workers and support workers, in the same way as
outlined for the sample as a whole, the extent of that close working varies
notably. Statistically significant location differences were observed for all
staff groups.

© Queen‟s Printer and Controller of HMSO 2011. . This work was produced by Huxley et al. under the terms of
a commissioning contract issued by the Secretary of State for Health. 82
Project 08/1619/114
In location C there are extremely close working relationships between most
staff groups, particularly CPNs and other social workers, but also with OTs,
psychologists and psychiatrists, suggesting that teams are well integrated
at a practical level. Trusts B and D seem to be integrated to a similar extent
at a practical level in that their area coverage are very similar, with less
close working relationship with support workers in location B being offset by
closer working relationships with psychiatrists1. Location A is clearly the
least integrated of the teams, at a practical and structural level.
In locations A and B, staff work significantly less closely with support
workers2 than locations C and D. This support function might be provided by
OTs and other nurses in location B where staff worked significantly more
closely with OTs3 compared to other locations, but it is not clear who
provides this supporting role for service users in location A. These findings
raise questions about the nature of these roles and the comparative
availability of these staff in different locations (see Chapter 5 – Final
discussion).
In contrast, Trust C and to a lesser extent Trust B appear to have closer
working relationships with GPs and other nurses suggesting better
structural level integration compared to locations A and D; significance tests
based on ANOVA indicate that there are indeed closer working relationships
with other nurses4 in locations B and C compared to location A, and with
GPs5 in location C compared to A, but not D.
Role overlap is clearly greater in location C than in all of the other locations.
Location C differed significantly from most others in relation to overlap with
nurses that are not CPNs6, ASWs7 and psychiatrists8, and support workers9
(compared to B only) even when Simes adjustments were applied,
indicating closer working in location C in all instances.
1 F=7.02 (3, 286) p=0.000; A cf B p=0.003, A cf C p=0.019, B cf D p=0.004, C cf D p=0.022
2 2=21.81 (df 3) p=0.000
3 2=10.84 (df 3) p=0.013
4 F=7.65 (df 3, 278) p=0.000; C cf A p=0.000, cf D p=0.015
5 F=6.07 (df 3, 278) p=0.001; A cf 3 p=0.000
6 2=19.31 (df 3) p=0.000;
7 F=8.75 (df 3, 253) p=0.000; cf A and D p=0.000, cf B p=0.001
8;
2=11.27 (df 3) p=0.010
9 F=2.84 (df 3, 241) p=0.039; cf B only p=0.045
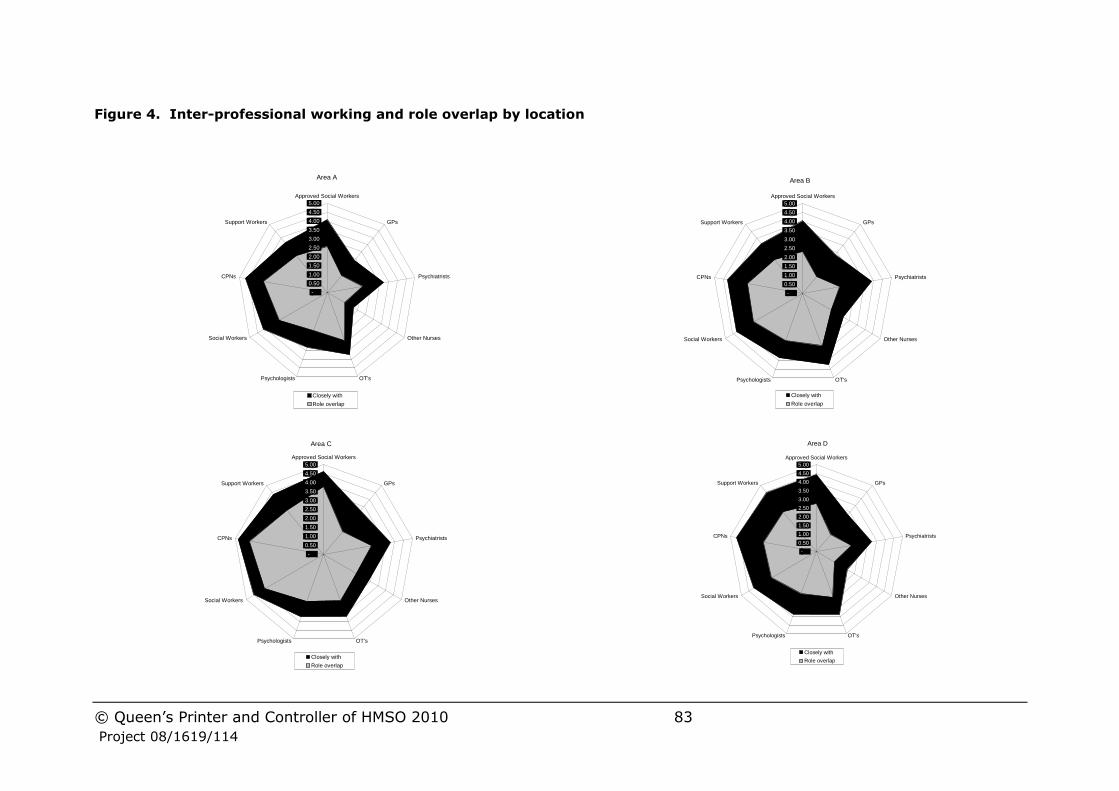
© Queen‟s Printer and Controller of HMSO 2010 83
Project 08/1619/114
Figure 4. Inter-professional working and role overlap by location
Area A
-
0.50
1.00
1.50
2.00
2.50
3.00
3.50
4.00
4.50
5.00
Approved Social Workers
GPs
Psychiatrists
Other Nurses
OT'sPsychologists
Social Workers
CPNs
Support Workers
Closely with
Role overlap
Area B
-
0.50
1.00
1.50
2.00
2.50
3.00
3.50
4.00
4.50
5.00
Approved Social Workers
GPs
Psychiatrists
Other Nurses
OT'sPsychologists
Social Workers
CPNs
Support Workers
Closely with
Role overlap
Area C
-
0.50
1.00
1.50
2.00
2.50
3.00
3.50
4.00
4.50
5.00
Approved Social Workers
GPs
Psychiatrists
Other Nurses
OT'sPsychologists
Social Workers
CPNs
Support Workers
Closely with
Role overlap
Area D
-
0.50
1.00
1.50
2.00
2.50
3.00
3.50
4.00
4.50
5.00
Approved Social Workers
GPs
Psychiatrists
Other Nurses
OT'sPsychologists
Social Workers
CPNs
Support Workers
Closely with
Role overlap

© Queen‟s Printer and Controller of HMSO 2010 84
Project 08/1619/114
4.2.13 Professional group comparisons
Given the subject of this research and the preponderance of nursing,
support and social work staff within mental health teams, we have selected
these professional groups for inclusion in further analyses.
Comparison of the four diagrams presented in Figure 5 suggest that ASWs
work more closely with more staff groups than non-ASW social workers,
CPNs and social support workers. Although the area of the ASW graphs are
slightly larger than the other staff groups, their shape are similar for both
sets of social worker and CPNs; nevertheless ASWs appear to work slightly
more closely with GPs than the other staff groups, which might have
something to do with their statutory functions under the mental health acts.
The main differences between the four graphs is in the way that support
workers interact with health staff, working less closely, as one might
expect, with psychiatrists, GPs and other nurses (although they are not
dissimilar to non ASW social workers in that regard).
The area of the role overlap graph for ASWs is larger than for the other
three groups, all of which were very similar, suggesting that the ASW role
overlaps more with others, than the other key staff groups within mental
health teams. The shape of the graphs vary for each staff group,
demonstrating different patters of role overlap, mirroring to a large extent
the shape of the close working relationship graph for CPNs, but less so for
the other professions. ASW and CPN roles overlap more with psychologists
than either non-ASW social workers or support workers, and in these data
at least, ASWs roles overlap less with support workers than either CPNs or
other social workers. Again, the assumption is that the distinguishing factor
is the statutory function. Understandably, ASWs report significant role
overlap with other social workers and CPNs, but interestingly, ASW ratings
were in excess of one whole scale point higher (+ 1.1 and +1.16
respectively) than their counterparts, suggesting that the ASWs recognise
that their role is not limited to their statutory duties whereas others do not.
Although ASW ratings of agreement with feeling threatened by the amount
that others‟ roles overlap with their own were significantly higher than those
for nurses when all other staff groups were excluded from analysis (F=2.63,
(df 4, 193) p=0.036, this finding was not upheld in non-parametric analysis
nor analyses using appropriately transformed data.

© Queen‟s Printer and Controller of HMSO 2010 85
Project 08/1619/114
Figure 5. Inter-professional working and role overlap by professional group
0
0.5
1
1.5
2
2.5
3
3.5
4
4.5
5
CPN
GP
Psychiatrists
Other nurses
Occupational TheapistsPsychologists
Social Workers
Approved Social Workers
Support Workers
Work closely with
Role overlaps with
0
0.5
1
1.5
2
2.5
3
3.5
4
4.5
5
Approved Social Workers
GP
Psychiatrists
Other nurses
Occupational TheapistsPsychologists
Social Workers
CPN
Support Workers
Work closely with
Role overlaps with
0
0.5
1
1.5
2
2.5
3
3.5
4
4.5
5
Social Workers
GP
Psychiatrists
Other nurses
Occupational TheapistsPsychologists
CPNs
Approved Social Workers
Support Workers
Work closely with
Role overlaps with
0
0.5
1
1.5
2
2.5
3
3.5
4
4.5
5
Support Workers
GP
Psychiatrists
Other nurses
Occupational TheapistsPsychologists
Social Workers
CPN
Approved Social Workers
Work closely with
Role overlaps with

© Queen‟s Printer and Controller of HMSO 2010 86
Project 08/1619/114
Although these results indicate apparent differences in the close working relationships with CPNs and other nurses in actual fact the number of non-
CPN nurses is very small (n=11, 8% of all nurses). On this basis all nurses are grouped together in the analyses that follow, in order to optimise the number of cases to variables included in the regression models. Similarly,
ASWs and other social workers have been combined in one group (for the same reason) on the basis that their patterns of close working and role
overlap are similar. The results that follow are almost identical to those of models that did separate the distinct groups.
4.3 Multivariate Analysis
4.3.1 Integration
Integration scores were normally distributed and so did not require
transformation. In order to determine what factors were associated with
higher integration (better) scores a series of regression analyses were
undertaken in which conceptually or theoretically important factors were
controlled for.
The initial model controlled for the age, gender and professional group of
each respondent, none of which were significantly associated independently
with integration ratings (F 5, 285=0.08, p =0.996) and the model was
unable to explain any of the variance in integration itself.
Professional group was retained in the next model in which WDQ ratings for
autonomy, role perception and flexibility, teamwork, management, training
and career opportunities, and uncertainty were included alongside Karasek
JCQ items for decision latitude, social support and psychological job
demands, and four separate items relating to how closely team members
worked with nurses and social workers, and how much other team roles
overlapped with nursing and social work. This interim model explained
23.5% of the variance in integration (17.4% when adjusted; F 17, 216 =
3.89, p=0.000), with autonomy and management being associated
significantly with better integration ratings, and job demands and
uncertainty emerging as trends. When area and team level indicators of
team size, team typology (six-item), CMHT status and co-location were
added the amount of variance explained increased to 37.7%.

© Queen‟s Printer and Controller of HMSO 2010 87
Project 08/1619/114
Table 17. Regression models: WDQ integration
Variance
explained
Explanatory variables β p
R2 = 0.338
AR2 = 0.296
Not being in a CMHT
Better management
Not being a nurse, social worker or
support worker
Fewer job demands
-0.38
0.29
0.11
-0.10
0.000
0.000
0.043
0.071
Possible interaction effects between team typology and independent
variables
Team typology 1:
Social care component
<20%
R2 = 0.285
AR2 = 0.196
Not being in a CMHT
Better management
Support worker cf nurses
Co-location & Location D dropped
-0.31
0.29
-0.22
0.011
0.007
0.059
Team typology 2:
Social care component
20 - 40%
R2 = 0.459
AR2 = 0.408
Not being in a CMHT
Better management
Not being a nurse, social worker or
support worker
Support worker cf nurse
-0.59
0.38
0.24
-0.13
0.000
0.000
0.002
0.099
Team typology 3:
Social care component
>40%
R2 = 0.409
AR2 = 0.291
More autonomy
Not being a nurse, social worker or
support worker
Support worker cf nurse
Fewer job demands
Better management
Social Worker cf nurse
CMHT and locations C & D dropped
0.46
0.37
0.32
-0.33
0.24
0.24
0.008
0.019
0.046
0.054
0.073
0.095
Normal distribution and no outlying residuals.
Final model includes: autonomy, management, job demands, professional
group area, team typology, co-location, team size and CMHT status.
(29.2% adjusted, F 28, 205 =4.44, p=0.000). At this point most individual
level variables became insignificant and membership of a new team and not
a CMHT emerged as a significant explanatory factor. Area and team
typology were not associated with integration.

© Queen‟s Printer and Controller of HMSO 2011. . This work was produced by Huxley et al. under the terms of
a commissioning contract issued by the Secretary of State for Health. 88
Project 08/1619/114
In order to meet the sample size requirement a final model (outlined in
Table 17) that controlled only for team culture and climate factors that were
associated significantly (or with a trend p<0.10) with integration in the
second model, plus area and team level indicators was fitted. This
confirmed that new teams are significantly more integrated (or perceived to
be by staff) than CMHTs, and that integration is better where management
is strong. Higher ratings by staff other than nurses, social workers and
support workers (i.e. doctors, psychologists and others) might be
interpreted as meaning that these staff, who tend to work part-time and are
present in small numbers) are less aware of the true level of integration
operating within the team, or perceive it to be better because staff
members have to work closely with them because they are in short supply.
Also a non-significant trend towards fewer job demands where integration is
better, suggests that close working can reduce pressures on individuals and
staff groups.
Due to interaction effects between team typologies separate models were
fitted for each of the three types that included only the significant factors
(or non-significant trends) identified in the whole sample model, obviously
minus the confounding team typology variable (in order to reduce error due
to inadequate sample size).
Although the model is less robust for team typologies 1 and 3 than for team
type 2 (and so should be treated with some caution), the factors associated
with integration did appear to be similar in all three team types. It‟s of
interest that while there is a non-significant trend towards lower ratings of
integration among support workers where the social care component is very
low and to a lesser extent where team composition is more mixed, their
ratings for integration are significantly higher where the social care
component is high. It appears that fewer job demands might be related
(non-significant trend) to better integration only in the teams with a higher
social care component, where having more autonomy also emerges as
factor related to better integration; the team function and the two locations
with less social care input were dropped from these analysis, suggesting
that if valid these results are only generalisable to non-CMHTs in teams with
a high social care component
4.3.2 Teamwork
Initial models of team-working suggested that it was not associated with
personal characteristics, nor close working with other professionals or
overlapping roles with other professionals. These models did suggest that
teamwork was associated with team culture and climate variables relating
to autonomy, role perception and flexibility, management, job demands and
social support, but team-working was not associated with integration,
uncertainty, training or decision latitude.

© Queen‟s Printer and Controller of HMSO 2011. . This work was produced by Huxley et al. under the terms of
a commissioning contract issued by the Secretary of State for Health. 89
Project 08/1619/114
A final model including autonomy, role perception, role flexibility,
management style, psychological job demands, social support (co-worker
and supervisor support combined), team typology (social care composition),
team size, co-location, CMHT status and area was then fitted.
This model, presented in Table 18, explained around 70% of the variance in
the sample as a whole. It suggested that the only integration related
variables making a statistically significant contribution to the explanation of
higher teamwork scores was not being co-located, hardly a positive finding!
Team culture and climate variables had a stronger and more positive
influence, with better team-working being related to greater role perception
and flexibility, better management and social support. In addition where
team-working is good, job demands appear to be lower.
There appeared to be significant interaction effects between the team
typology variable and team-working, so regression models were fitted for
each of the three team types but again including only the variables that had
emerged as significant in the whole sample.
The imbalanced models need to be treated with some caution because they
are still underpowered but they do appear to have face validity, in that the
results are understandable.
The models were somewhat similar in each of the three groups, with up to
six variables explaining between two-thirds and three-quarters of the
variance in team-working. Having a clear understanding of each others‟
roles, greater flexibility within roles and management style were important
in the three groups.
Co-location did not enter either of the imbalanced models due to most or all
teams being co-located in those groups, but being co-located was
associated with lower teamwork scores where team composition was more
balanced.
There was a negative association between high job demands and good
teamwork where social care composition is imbalanced (whether high or
low) but not where it is balanced.
Social support is not associated with teamwork where the social care
composition dominates, but it is in other team types.

© Queen‟s Printer and Controller of HMSO 2011. . This work was produced by Huxley et al. under the terms of
a commissioning contract issued by the Secretary of State for Health. 90
Project 08/1619/114
Finally having more autonomy was associated with better team working in
an imbalanced team but not where the balance between health and social
care was more equal.
Table 18 Regression models: WDQ Teamwork
Variance explained Explanatory variables β p
R2 = 0.710
AR2 = 0.685
Greater role perception
Better management
Greater role flexibility
Greater social support
Not co-located
Fewer job demands
0.33
0.31
0.20
0.22
-0.11
-0.11
0.000
0.000
0.000
0.000
0.005
0.004
Significant interaction effects between team typology and independent
variables
Team typology 1:
Social care component
<20%
R2 = 0.690
AR2 = 0.671
Greater role perception
Better management
Greater role flexibility
Greater social support
Fewer job demands
Co-location dropped
0.32
0.30
0.24
0.17
-0.17
0.000
0.000
0.001
0.024
0.010
Team typology 2:
Social care component
20 - 40%
R2 = 0.725
AR2 = 0.712
Greater role perception
Better management
Greater role flexibility
Greater social support
Not co-location
Fewer job demands
0.38
0.32
0.20
0.26
-0.19
0.00
0.000
0.000
0.000
0.000
0.000
NS
Team typology 3:
Social care component
>40%
R2 = 0.675
AR2 = 0.636
Better management
Greater role perception
Greater role flexibility
Fewer job demands
Greater social support
Co-location dropped
0.34
0.33
0.27
-0.23
0.17
0.006
0.001
0.012
0.012
NS
No outlying residuals
© Queen‟s Printer and Controller of HMSO 2011. . This work was produced by Huxley et al. under the terms of
a commissioning contract issued by the Secretary of State for Health. 91
Project 08/1619/114
4.3.3 Perceived Quality of Care
The perceived Quality of Care variable was significantly skewed and
required a reflect square root transformation to normalise its distribution.
The model produced very similar results to that using untransformed data
but more significant factors were identified in the transformed data that did
not transgress the assumption of normality so in this instance the
transformed data are presented; please note that negative beta coefficients
due to the reflect procedure1 indicate positive associations in the regression
models. Initial models of quality of care suggested that social workers rated
quality of care lower than nurses and that team climate and culture
variables relating to autonomy, management and job demands were related
to quality of care. Perceived quality of care was not associated with
integration scores, working closely with nurses and social workers, training
and career opportunities or other team culture and climate indicators.
A final model that included only significant and conceptually important
variables was constructed using team culture and climate variables for
autonomy, team-working, management, job demands, role overlap with
nurses and social workers, area, team typology, team size, co-location and
CMHT status.
Table 19 shows that in the sample as a whole and in all team typology
groups, quality of care was associated significantly with better teamwork
and management. Perceived quality of care (QOC) also appeared to be
better where there was a high proportion of social care staff in the team.
One explanation would be that social workers and social care workers rate
quality of care higher than other staff, but the initial regressions showed
that this was not the case and that social workers actually rate quality of
care slightly lower than other staff; social care support workers did not
differ from other staff in their ratings.
Due to interaction effects between team typologies, models that included
only the significant effects in the overall sample were fitted for each of the
three team typologies as before. Although again underpowered (for
typologies 1 and 3) the results suggested that the non-significant trend
towards better quality of care where other roles overlap more with social
work was found to be limited to teams where there is a relative balance
between health and social care composition, perhaps suggesting skill-
sharing that contributes to downward substitution to support worker roles
or role transference to other staff. In contrast to the integration model in
which more autonomy was associated with more integration in social care
dominated teams, there was a non-significant trend towards better quality
of care where role autonomy was lower. This could have resulted from the
1 calculated as SQRT (K – original variable) where K equals the largest possible value plus 1

© Queen‟s Printer and Controller of HMSO 2011. . This work was produced by Huxley et al. under the terms of
a commissioning contract issued by the Secretary of State for Health. 92
Project 08/1619/114
fact that support workers have less autonomy than other workers, but their
presence in the team contributed to a better perception of the quality of
care (univariate analyses suggested that support workers rate QOC more
highly but this effect did not emerge in early regression models).
Table 19. Regression models: WDQ Perceived Quality of Care
Variance explained Explanatory variables β p
R2 = 0.526
AR2 = 0.484
Better teamwork
>60% social care in team
Better management
Larger team size
40-60% social care in team
Less autonomy
More overlap with social work role
-0.561
-0.23
-0.19
-0.15
-0.14
0.11
-0.11
0.000
0.011
0.003
0.080
0.090
0.057
0.076
Significant interaction effects between team typology and independent
variables
Team typology 1:
Social care component
<20%
R2 = 0.534
AR2 = 0.504
Better teamwork
Better management
-0.42
-0.41
0.000
0.000
Team typology 2:
Social care component
20 - 40%
R2 = 0.511
AR2 = 0.492
Better teamwork
Better management
Less autonomy
More overlap with social work role
-0.55
-0.21
0.13
-0.11
0.000
0.013
0.045
0.085
Team typology 1:
Social care component
>40%
R2 = 0.580
AR2 = 0.531
Better teamwork
Larger team size
Less autonomy
-0.91
-0.34
0.20
0.000
0.002
0.070
All models reflect square-root transformed hence negative symbol for positive
result

© Queen‟s Printer and Controller of HMSO 2011. . This work was produced by Huxley et al. under the terms of
a commissioning contract issued by the Secretary of State for Health. 93
Project 08/1619/114
4.3.4 Perceived job satisfaction
Perceived job satisfaction was significantly skewed but not normalisable by
any form of transformation. Consequently this model is somewhat flawed
because it does not meet the assumption of normality. Nevertheless, we
can have some confidence in the findings because a binary logistic
regression model that sought to explain above average job satisfaction
produced very similar results, with the exception of uncertainty and
training, which were not significantly associated with the binary variable.
Initial models of job satisfaction indicated that no personal characteristic
variables explained job satisfaction, and only training and career
opportunities and job demands of the team culture and climate variables
were associated with it. Close working with nurses was also associated
significantly with job satisfaction. Non-significant trends towards higher
satisfaction where management was good and where there was more
overlap with nursing roles were also observed, in these early models.
A final model was fitted that included significant and conceptually important
variables, namely integration, management, training and career
opportunities, job demands, close working with nurses, overlap with nursing
roles, professional group, area, team typology, co-location, decision
latitude, uncertainty and role flexibility.
This model (presented in Table 20) indicated that higher job satisfaction
was associated significantly with team culture and climate and to a limited
extent integration. Specifically higher job satisfaction was associated with
fewer psychological job demands, working closely with nurses, better
management, having more decision latitude, a bit of uncertainty, less
overlap with the nursing role, better training and career development
opportunities and being co-located; no other integration related variables
were associated with it. There was a trend towards lower scores in one
location.
Separate models for each team typology were fitted following the same
principles of significance and conceptual importance as outlined previously.
Splitting the models in this way failed to produce a robust model for teams
with a high social care component, which were all located in one area. The
models were rather dissimilar in the other two typologies being associated
with fewer job demands in both but that‟s where the commonality ends.

© Queen‟s Printer and Controller of HMSO 2011. . This work was produced by Huxley et al. under the terms of
a commissioning contract issued by the Secretary of State for Health. 94
Project 08/1619/114
Table 20. Regression models: WDQ Perceived job satisfaction
Variance explained Explanatory variables β p
R2 = 0.513
AR2 = 0.461
Fewer job demands
Working closely with nurses
Better management
More decision latitude
More uncertainty
Less overlap with nurse role
Better training & career opps
Being co-located
Location B cf Location A
-0.35
0.28
0.21
0.18
0.15
-0.16
0.12
0.14
-0.15
0.000
0.000
0.001
0.005
0.006
0.010
0.044
0.050
0.068
Significant interaction effects between team typology and independent
variables
Team typology 1:
Social care component
<20%
R2 = 0.601
AR2 = 0.498
Fewer job demands
Better training & career opps
Greater role flexibility
Less overlap with nurse role
More uncertainty
Location B & collocation dropped
-0.48
0.36
0.25
-0.24
0.20
0.000
0.000
0.022
0.055
0.058
Team typology 2:
Social care component
20 - 40%
R2 = 0.548
AR2 = 0.473
Fewer job demands
Working closely with nurses
Better management
Being co-located
Greater decision latitude
Location B cf Location A
0.35
0.31
0.26
0.18
0.17
-0.14
0.000
0.001
0.005
0.024
0.065
0.094
Team typology 3:
Social care component
>40%
R2 = 0.468
AR2 = 0.167
Failed to fit a model

© Queen‟s Printer and Controller of HMSO 2011. . This work was produced by Huxley et al. under the terms of
a commissioning contract issued by the Secretary of State for Health. 95
Project 08/1619/114
Inadequate sample size and the dropping of some variables due to a lack of
variance in the model for team type 1 suggests that these results should be
treated with some caution and perhaps are only relevant to teams that are
not co-located. Nevertheless, it did appear that where the social care
component is very low, job satisfaction is also associated with better
training, greater role flexibility, less overlap with the nursing role (perhaps
indicating that specific skills are used more appropriately in teams of this
type) with a trend towards uncertainty.
Where team composition is more balanced (or at least the social care
contribution is in less short supply) job satisfaction is associated with
working closely with nurses, better management and being co-located, with
a trend towards higher satisfaction where more decision latitude is present.
4.3.5 Intention to leave
The intention to leave the employer variable was also significantly skewed
and required log transformation. The results were identical to those for non-
transformed data so for ease of interpretation the latter are presented here.
Unlike previous models this was fitted in four blocks rather than three in
order to observe the effect of job satisfaction, which can dominate models
of this type.
Initial models suggested that intention to leave the employer within twelve
months was not associated with demography but was associated
professional groups and four of the eight process indicators of team culture
and climate variables - role perception, training and career opportunities,
uncertainty, and integration. These factors continued to contribute to the
explanation of future work plans when overall job satisfaction was controlled
for, but the influence of uncertainty and integration became insignificant
when area and team related indicators were controlled for.
A final model was fitted that included role perception, uncertainty,
professional group, job satisfaction, location, team typology, team size, co-
location and CMHT status. This model presented in Table 21 indicated that
the integration related findings of these early models were confounded with
location and team related variables and became insignificant when these
factors were controlled for. It also suggested that two team culture
variables had a positive effect on intention to leave the employer. Staff
were less likely to intend leaving where there were better training and
career opportunities, higher job satisfaction and conversely where role
perception was poor, perhaps indicating that where this was the case staff
do not have the confidence to move on. Intent to leave was also less where
staff were located in CMHTs and larger teams. Social workers were more
likely than nurses to want to leave their employer, even when other

© Queen‟s Printer and Controller of HMSO 2011. . This work was produced by Huxley et al. under the terms of
a commissioning contract issued by the Secretary of State for Health. 96
Project 08/1619/114
mitigating circumstances are controlled for. This finding is concerning given
the already small numbers of social workers in mental health teams, and
the potential lack of capacity to deliver on the New Horizons policy that
already exists, especially given a non-significant trend in univariate analysis
towards social workers being more likely than „other‟ staff to intend to leave
the profession within a year.
Table 21. Regression models: Intention to leave the employer
Variance explained Explanatory variables β p
R2 = 0.422
AR2 = 0.376
Less likely if in CMHT
Less likely - larger team size
Less likely – better training
Less likely – higher job
satisfaction
Less likely – poor role perception
Social Worker more likely than
nurses
Less likely in Location C
-0.51
-0.23
-0.17
-0.17
0.16
0.13
-0.18
0.000
0.019
0.005
0.013
0.007
0.021
0.089
Significant interaction effects between team typology and independent
variables
Team typology 1:
Social care component
<20%
R2 = 0.551
AR2 = 0.498
Less likely if in CMHT
Social Worker more likely than
nurses
Support workers more likely than
nurses
-0.64
0.20
0.16
0.000
0.027
0.056
Team typology 2:
Social care component
20 - 40%
R2 = 0.363
AR2 = 0.314
Less likely if in CMHT
Less likely – higher job
satisfaction
Less likely – poor role perception
Support workers less likely than
nurses
-0.39
-0.17
0.18
-0.14
0.000
0.047
0.049
0.088
Team typology 3:
Social care component
>40%
R2 = 0.489
AR2 = 0.376
Less likely – higher job
satisfaction
Less likely – more uncertainty
Less likely – better training
Less likely – poor role perception
-0.39
-0.32
-0.28
0.27
0.009
0.028
0.063
0.072

© Queen‟s Printer and Controller of HMSO 2011. . This work was produced by Huxley et al. under the terms of
a commissioning contract issued by the Secretary of State for Health. 97
Project 08/1619/114
One outlying residual: log transformation and residual removal produced
identical results
The models for different team typologies were quite different, with the
exception of the effect of CMHT in typologies 1 and 2, and job satisfaction
and poor role perception in typologies 2 and 3. Again error associated with
inadequate sample sizes in the less balanced team models should be
considered when interpreting these findings. Nevertheless, there is a clear
face validity to a model that indicates that social care staff are more likely
to have plans to leave teams in which they form the minority group by far.
The findings for the social care dominated teams may be less easily
interpreted, but suggest that having access to better training and being
subject to more uncertainty are related to plans to leave.(14)
Role perception and job satisfaction are associated with job intentions in
team types two and three only. The training effect is limited to teams with a
high proportion of social care staff.
4.4 Service user interviews
Locations were selected on the basis that one had just below the Phase II
average proportion of social care workers in the teams (Location A), and the
other (Location D) had almost double the average. Data were supplied by
seven teams, three in D and four in A. Forty-five service users responded
(n=26 from A and n=19 from D), and 68.1% were female. 96% were white.
The three teams from location D came from a large rural county in northern
Britain, where the teams were based in centres of population. The four
location A teams were all part of one large service covering a major city
plus its rural surroundings. This means that the comparison of A and D
services is also an urban-rural comparison.
4.4.1 Service User Questionnaire (SUQ)
The length of contact with the team was different, but not significantly so.
Over a third of A‟s service users and a quarter of D‟s had been in contact for
more than ten years , but only eleven percent of D‟s service users had
been in contact for between 6 and 10 years compared to almost a quarter
of the service users in location A.

© Queen‟s Printer and Controller of HMSO 2011. . This work was produced by Huxley et al. under the terms of
a commissioning contract issued by the Secretary of State for Health. 98
Project 08/1619/114
Table 22. Contact details (SUQ)
A D
Variable n (%) n (%) Significance
Proportion in contact over
10 years
9 (34.6) 5 (27.8) NS
Proportion seen in the last
week
17 (68.0) 11 (61.1) NS
Proportion seen more
than 4 months ago
5 (20%) 0 (0.0) (χ2 = 20.6,
df1,
p<0.001)
There were a number of other differences between the teams. As expected,
because they had been purposively selected to differ in composition, care
coordinators were more likely to be nurses in A (n=19, 76%) than in D (n=
11, 61.1%).
Satisfaction with services was also different, with the majority of service
users in A being very satisfied with the way the staff worked as a team
(n=17, 68%) and the majority in D being either mostly satisfied or
dissatisfied (χ2 = 24.5, df1, p<0.001). This finding is the opposite of what
we expected to find based on previous work reporting the advantages of
integrated working. The same is the case in respect of needs being met.
One has, however, to bear in mind the small sample size and the possibility
of selection bias.
Table 23. Satisfaction with care received – SUQ
A D
Variable n (%) n (%) Significance
Received excellent care 13 (50%) 7 (38.9) NS
Very satisfied with the way the
staff work as a team
17 (68.0) 6 (33.3) (χ2 = 24.5, df1,
p<0.001)
Yes enough say in care and
treatment
19 (73.1) 11 (61.1) NS
Almost all needs are met 16 (61.5) 6 (33.3) (χ2 = 14.6 df1,
p<0.001)

© Queen‟s Printer and Controller of HMSO 2011. . This work was produced by Huxley et al. under the terms of
a commissioning contract issued by the Secretary of State for Health. 99
Project 08/1619/114
4.4.2 MANSA – Manchester Short Assessment of Quality of Life
Wanting change and restricted opportunities
The MANSA covers ten life domains (accommodation, safety, leisure, living
situation, social life, relationships, family, income, health and mental
health).
Within each of the MANSA life domains, the respondent is asked whether
they want circumstances in that domain to be improved, and then if they
want improvement, they are asked if they feel that their opportunities to
produce improvement are restricted in any way.
Understandably, the area requiring most attention, in their view, was their
health, with only eight people appearing to be content with their current
health status. All twenty-four of the people wanting improved health felt
that their chances of attaining improvement were restricted in some way.
Quite a large proportion of people had no leisure activities at all (45.5%,
n=20). Unsurprisingly, almost three-quarters of the respondents wanted to
improve their leisure activity. A similar proportion wanted to improve their
financial situation.
As in other samples of people with long term mental health problems, most
people were not in any form of full or part time work, only two reported
themselves as working currently (4.4%), one in location A and one in D.
Improvements in the work domain were only wanted by just under half of
the sample (n=21, 46.6%), and opportunities for work were restricted for
almost three-quarters of those who wanted to improve their lives in this
respect (n=16, 72.7%).
Three-fifths of the sample did not want improvements to their personal
safety but half wanted improved accommodation (n=25, 55.6%) and almost
two-thirds wanted an improved social life (n=29, 64.4%). These findings
are consistent with the CUES data and free text data described later in the
report.
Many people (46.6%, n=21) lived alone, but most people (86.7%, n=39)
had daily or weekly contact with family and friends; only two people
reported no family contact at all and most (80%, n=36) had at least one
close friend.

© Queen‟s Printer and Controller of HMSO 2011. . This work was produced by Huxley et al. under the terms of
a commissioning contract issued by the Secretary of State for Health. 100
Project 08/1619/114
We compared these MANSA results for locations A and D and mostly found
no significant differences, summarised in Table 24.
Table 24. MANSA: Proportion wanting change and restricted opportunities
by locations A(n=26) and D (n=19)
Wanting improvements in
A
n (%)
D
n (%)
χ2 (df) p
Health 22 (88.0) 19 (100.0) NS
Leisure 18 (75.0) 13 (68.4) NS
Finances 16 (69.6) 16 (84.2) NS
Family 17 (68.0) 12 (63.2) NS
Social life 17 (65.4) 12 (63.2) NS
Work 8 (36.4) 14 (73.7) χ2= 27.66, (1)
p<0.001
Safety 10 (40.0) 7 (38.9) NS
Accommodation 15 (57.7) 10 (52.6) NS
Living situation 9 (36.0) 8 42.1) NS
Experiencing restricted opportunities in
Health 13 (52.0) 11 (57.9) NS
Leisure 14 (56.0) 14 (73.3) χ2= 5.59 (1) p=0.02
Finances 11 (47.8) 8 (42.1) NS
Family 11 (44.0) 12 (63.2) χ2= 6.51 (1) p=0.01
Social life 15 (57.7) 11 (7.9) NS
Work 11 (55.0) 11 (57.9) NS
Safety 7 (28.0) 5 (27.8) NS
Accommodation 10 (38.5) 7 (38.9) NS
Living situation 9 (36.0) 8 (42.1) NS
When Simes‟ adjustment for multiple testing is made this becomes non-significant
Any discrepancies in % caused by missing data

© Queen‟s Printer and Controller of HMSO 2011. . This work was produced by Huxley et al. under the terms of
a commissioning contract issued by the Secretary of State for Health. 101
Project 08/1619/114
A distinct pattern emerges in Table 24, which suggests that there was more
unmet need in location A in certain areas and more unmet need in D in
others.
Significantly more people in D wanted improvements in their work situation
(all bar one were unemployed), and more found restrictions to improved
leisure and family life. These may be related to the geography of D.
Although not significant, it appeared that D respondents (in comparison
with A) wanted more health improvements, to improve their finances.
Location A respondents more often wanted improved accommodation. Some
of the reasons for these differences emerge in the free text responses later.
MANSA Subjective well-being
Subjective ratings on the MANSA are made in each of the life domains, on
the Delighted – Terrible (D–T) seven-point scales. All of these were
normally distributed.
Figure 6 compares the domain satisfaction scores on the D-T scale with the
data from the National Psychiatric Morbidity Survey (NPMS)(146). The data
from location A mirrors almost exactly the NPMS data, but in each instance
is almost one rating scale point less. In previous work a difference of this
magnitude has usually been significantly different. (This is confirmed by
computing a Reliable Change Index over time, where a difference of 1.3
points on the scale would be needed to be sure that the result was not
simply produced as a result of measurement error)(154). There is a debate
about the issue of the reliability of individual subjective judgements, which
some argue are not subject to unreliability of measurement, in the way that
scales applied by a rater (such as the HONoS [Health of the Nation Outcome
Scores]) are. The issue is perhaps whether their subjective rating is made in
a way that accurately reflects their true feelings at the time, a topic well
beyond this research. Another possibility is that they intended to make one
rating but mistakenly made another. Again we have no way of knowing if
this was the case.
For almost all domains location D scores are lower than A, but only
significantly so for relationships with the family where the location A mean
is 5.4 (sd 1.2) and location D mean is 4.2 (sd 1.7) (t=2.31 df 28 p=0.03,
mean difference = 1.15 (CI 2.1, 0.21). Trends were evident for mental
health and leisure activity. The mean D-T score for those not working was
low at 3.8, whereas the D-T scale score for both people who were working
was 7 out of 7 (delighted).

© Queen‟s Printer and Controller of HMSO 2011. . This work was produced by Huxley et al. under the terms of
a commissioning contract issued by the Secretary of State for Health. 102
Project 08/1619/114
Figure 6. QOL comparison between 3 CMHTs (D and A from this study)
(1= terrible, 7= delighted)
1234567
Gen
eral
Hea
lthM
enta
l hea
lthNot
wor
king
Fina
nces
Leis
ure
Frie
nds
Saf
ety
Livi
ng s
it
Alo
ne
Fam
ily
Life domains
CMHT1 D A NPMS
Team composition and MANSA results
There were no significant associations between the subjective well being
ratings in any domain, and the proportion of social care staff in the team.
4.4.3 CUES data
CUES data are in three parts. A – where the respondents rate their
circumstances as being as good as a normative statement of how things
should be in a life domain or an aspect of service delivery. B – where they
then rate whether they are satisfied with this state of affairs, and C – where
they are asked to say in what way they would like things to change (a free
text response).
In tables 25 to 29 we have compared our results with those of the original
Lelliot(143) UK data and the Blenkiron (142) data from one team in the north of
England.

© Queen‟s Printer and Controller of HMSO 2010 103
Project 08/1619/114
Table 25. Service users' satisfaction in key areas of their life
12 = 4.07, df1, p=0.04 2
2= 4.52, df1, p=0.03 but when Simes adjustment is applied these are no longer significant
Part A responses(% who rated their
experiences 'as good as' the normative statement)
Part B (% who replied 'yes' to
satisfaction questions below)
Lelliot et al
2001
% (n =449)
Blenkiron et al
2003
% (n= 86 )
Huxley et al
2010
% (n=45)
Lelliot et al
2001
% (n=449)
Blenkiron et al
2003 % (n=86)
Huxley et al
2010
% (n=45)
Where you live
Are you satisfied with the place you live in?
75
77
86
72
76
82
Money
Do you have enough money to meet your basic needs?
65
72
70
61
73
74
Finances
Are you satisfied with the level of help you get with your
finances?
70
66
81
63
61
74
How you spend your day
Are you satisfied with the way you spend your day?
72
64
64
58
55
47
Family and friends
Are you satisfied with your relationships with the people closest to you?
57
69
58
53
69
56
Social Life
Are you satisfied with your social life?
54
62
62
40
49
46
Stigma and discrimination
Are you satisfied with the way people treat you?
52
72
671
45
72
61 2

© Queen‟s Printer and Controller of HMSO 2011. . This work was produced by Huxley et al. under the terms of a commissioning contract issued by the Secretary of State for
Health. 104
Project 08/1619/114
Table 26. Service users’ experience of and satisfaction with services
Part A responses (% who rated their
experiences ‘as good as’ the normative
statement
Part B (% who replied ‘yes’ to satisfaction
questions below) Local UK
Lelliot et al
2001
%(n = 449)
Blenkiron et al
2003
% (n=86)
Huxley et al
2010
% (n=45)
Lelliot et al
2001
% (n=449)
Blenkiron et al
2003
% (n=86)
Huxley et al
2010
% (n=45)
Information and advice
Are you satisfied with the information and advice you get?
58 76 801 52 77 762
Access to mental health services
Are you satisfied with your ability to get help when you need it?
52 73 72 3 50 72 64
Choice of mental health services
Are you satisfied with the range of choice you have?
52 73 79 4 46 73 805
Relationships with mental health workers
Are you satisfied with your relationships with mental health
workers?
64 85 79 6 64 87 80 7
Consultation and control
Are you satisfied with the level of consultation and control you
have?
65 84 91 8
59 84 80 9
Advocacy
Are you satisfied with the help you get in dealing with difficult
situations?
63 72 87 10 56 74 85 11

© Queen‟s Printer and Controller of HMSO 2011. . This work was produced by Huxley et al. under the terms of a commissioning contract issued by the Secretary of State for
Health. 105
Project 08/1619/114
Table 26. Service users’ experience of and satisfaction with services (continued)
Your drug treatment
Are you satisfied with your current medication?
51 71 72 58 73 64
Access to physical health services
Are you satisfied with your access (General practitioner,
hospital, dentist, opticians, chiropodist)?
77 83 80 74 80 80
Relationships with physical health workers
Are you satisfied with the way your physical problems are dealt
with?
74 88 8613 70 86 82
1-13 significantly different between Lelliot and present study. Test results given in Table 25.
NB none of the differences between Blenkiron‟s data and the present study were significant.

© Queen‟s Printer and Controller of HMSO 2011. . This work was produced by Huxley et al. under the terms of a commissioning contract issued by the Secretary of State for
Health. 106
Project 08/1619/114
Table 27. Test results for Table 26
Result number χ2 All 1 degree of freedom
1 10.31 p=0.001
2 11.48 p=0.001
3 7.66 p=0.005
4 14.96 p=0.001
5 23.36 p=0.001
6 4.81 p=0.03
7 5.58 p=0.02
8 18.21 p=0.001
9 9.44 p=0.003
10 14.11 p =0.001
11 18.55 p =0.001
12 8.45 p =0.004
13 3.78 p =0.05
All remain significant after application of Simes procedure

© Queen‟s Printer and Controller of HMSO 2011. . This work was produced by Huxley et al. under the terms of a commissioning contract issued by the Secretary of State for
Health. 107
Project 08/1619/114
Table 28. Service users’ satisfaction with key areas of their life
Part A responses (% who rated their experiences 'as good as' the normative
statement)
Part B (% who replied 'yes' to satisfaction questions below
A % (n) D % (n) A % (n) D % (n)
Where you live
Are you satisfied with the place you live in?
92 (23)
79 (15)
85 (22)
78 (14)
Money
Do you have enough money to meet your basic needs?
75 (18)
63 (12)
76 (19)
72 (13)
Finances
Are you satisfied with the level of help you get with your finances?
83 (20)
77 (13)
70 (16)
81 (13)
How you spend your day
Are you satisfied with the way you spend your day?
72 (18)
531 (10)
50 (13)
42 (8)
Family and friends
Are you satisfied with your relationships with the people
closest to you?
63 (15)
53 (10)
63 (15)
472 (9)
Social Life
Are you satisfied with your social life?
57 (13)
68 (13)
58 (14)
323 (6)
Stigma and discrimination
Are you satisfied with the way people treat you?
63 (15)
72 (13)
54 (14)
724(13)
1 χ2 = 6.91, df1, p=0.008 2 χ 2 = 4.55, df1, p=0.03* 3 χ 2 = 12.64, df1, p<0.001 4 χ 2 = 6.2, df1, p=0.01
*Not significant when Simes adjustment applied

© Queen‟s Printer and Controller of HMSO 2011. . This work was produced by Huxley et al. under the terms of a commissioning contract issued by the Secretary of State for
Health. 108
Project 08/1619/114
Table 29. Service users’ satisfaction with mental health services
Part A responses (% who rated their experiences 'as good as' the normative
statement)
Part B (% who replied 'yes' to satisfaction questions below
A % (n=26) D % (n=19) A % (n=26) D % (n=19)
Information and advice
Are you satisfied with the information and advice you get?
82 (18)
78 (14)
79 (19)
72 (13)
Access to mental health services
Are you satisfied with your ability to get help when you need it?
83 (20)
581 (11)
73 (19)
532 (10)
Choices of mental health services
Are you satisfied with the range of choice you have?
74 (17)
84 (16)
77 (20)
84 (16)
Relationships with mental health workers
Are you satisfied with your relationships with mental health workers?
76 (19)
83 (15)
81 (21)
78 (14)
Consultation and control
Are you satisfied with the level of consultation and control you
have?
88 (21)
95 (18)
81 (21)
79 (15)
Advocacy
Are you satisfied with the help you get in dealing with difficult situations?
86 (19)
87 (13)
84 (21)
87 (13)
Your drug treatment
Are you satisfied with your current medication?
78 (18)
63 (12)
68 (17)
58 (11)
Access to physical health services
Are you satisfied with your access (general practitioner, hospital, dentist, opticians, chiropodist)?
84 (21)
74 (14)
85 (22)
74 (14)

© Queen‟s Printer and Controller of HMSO 2011. . This work was produced by Huxley et al. under the terms of a commissioning contract issued by the Secretary of State for
Health. 109
Project 08/1619/114
Table 29. Service users’ satisfaction with mental health services ( continued)
Relationships with physical health workers
Are you satisfied with the way your physical problems are dealt with?
88 (21)
84 (16)
88 (22)
74 (14)
1 2 = 13.85, df1, p=<0.001 2 χ2 = 7.74, df1, p=0.005
When Simes adjustment is applied these remain significant

© Queen‟s Printer and Controller of HMSO 2010 110
Project 08/1619/114
In our data, people‟s experience is less good in terms of how they spend
their day, and their social life, in the former being below the figure in the
original UK data. Later we will compare the two locations to see if they
differ on any of these items.
Team composition and CUES results
We compared the team composition with the CUES variables. Basically,
these results are not at all robust, due to multiple testing, and all the
significant results violated the assumptions (due to a larger number of cells
with a count less than five than expected). There were no significant results
that stood up to the assumptions or Simes testing. A larger sample is
required to examine the relationship in a robust way.
CUES differences between locations A and D
When we compared A and D on the same CUES items, significant
differences emerged in relation to satisfaction with financial help (higher in
D); how they spent the day (better in A); satisfaction with social life (better
in A); and stigma (better in D). The family and friends result was no longer
significant after Simes adjustment was applied.
It may be worth observing that stigma and discrimination have been the
subject of much policy, research and campaigning since both the previous
CUES papers were published so it is perhaps not surprising to see
significantly higher levels of satisfaction in our 2010 results. What may be
surprising are the lower ratings in location A, which are not significantly
different from Lelliot‟s(143) from ten years earlier. Free text responses
suggested that this dissatisfaction stemmed from public rather than service
sources, and the reverse was the case in location D.
The only significant differences in service provision concerned access to
services which favoured location A, which might be associated with the
rurality of D. The result might also be related to difficulties accessing out of
hours services. There were a number of complaints about this in the free
text responses.
Free text responses on the CUES
The third part of the CUES asks the respondents what thing they would like
to change in each of the CUES domains and provides an empty box for
them to write free text.

© Queen‟s Printer and Controller of HMSO 2011. . This work was produced by Huxley et al. under the terms of
a commissioning contract issued by the Secretary of State for Health. 111
Project 08/1619/114
The 45 respondents made 297 free text entries (42% of a possible total
number of free text opportunities of 704 for the whole sample). The
average number of responses was 6.5 out of a possible 16 (sd 6.8). Only
four individuals chose to make no responses at all, one in location D and
three in location A (Table 30).
Table 30. CUES Section C: Free text responses, proportion responding
CUES
N=45
Respondents answered
Home 19 (42%)
Money 24 (47%)
Help with money 15 (33%)
Spend the day 26 (58%)
Family & friends 20 (44%)
Social life 21(46%)
Advice 17 (38%)
Access to mental health services 21 (46%)
Choice 13 (29%)
Relationships with mental health workers 19 (42%)
Consultation and control 11 (24%)
Advocacy 16 (36%)
Stigma 20 (44%)
Medication 28 (62%)
Access to physical health services 11 (24%)
Relationships with physical health workers 13 (29%)
Total 297 (42%)
There is a consistent relationship between the free-text responses and the
structured element of the CUES (Parts A and B). Clearly not all respondents
completed all items, but those who were moved to do so were almost
exclusively negative about the teams in location D, and either positive or
balanced between positive and negative remarks about the teams in
location A. One of the A teams in particular came in for considerably more
positive remarks than any other team.

© Queen‟s Printer and Controller of HMSO 2011. . This work was produced by Huxley et al. under the terms of
a commissioning contract issued by the Secretary of State for Health. 112
Project 08/1619/114
Table 31 shows the ratio of negative to positive comments for locations A
and D. Overall there is a ratio of 6.8 to 1 negative to positive comments in
D, and a slightly better than 1:1 ratio of positive to negative comments in
A.
Table 31. Positive and negative free text responses: CUES section C
CUES item
Location A
(n=26)
Location D
(n=19)
Fisher’s
Exact Test Negative Positive Negative Positive
Home 9 10 8 2 NS
Money 10 9 11 1 0.05
Help with finances 7 7 8 1 Trend
Day activity 11 5 11 0 Trend
Family Friends 7 6 9 1 NS
Social life 6 7 10 1 0.03
Stigma 7 3 7 0 NS
Information advice 6 7 5 4 NS
Access 3 6 11 0 0.002
Choice 4 6 4 2 NS
Relationship with
mental health
workers
6 8 5 1 NS
Consultation &
control
0 8 3 2 0.03
Advocacy 4 7 5 1 NS
Medication 7 3 12 0 Trend
Access physical
health workers
8 8 5 0 NS
Relationship with
physical health
workers
4 7 3 1 NS
Total 96 114 117 17 OR 0.12 (0.07,
0.23) (χ2 =
58.28 df 1
p<=0.001)

© Queen‟s Printer and Controller of HMSO 2011. . This work was produced by Huxley et al. under the terms of
a commissioning contract issued by the Secretary of State for Health. 113
Project 08/1619/114
The significant areas, all in favour of location A are money, social life,
access (as indicated the rural features of D probably account for this) and
consultation and control, which seems to be particularly popular in A.
Stigma, access, medication and access to physical health workers were all
exclusively negative in D. There were trends toward an advantage for A in
help with finances, day time activity, and medication. The overall difference
in negative and positive remarks was significant.
4.4.4 The relationship between the WDQ data and the service user
data
One of the main purposes of the present study was to see how the culture
and climate of different teams impacts upon the staff and service users. The
Phase II results examined the differences between the four locations, and
the teams in them, in terms of the WDQ and Karasek JCQ subscales and
found that while team composition was not related to team features of
teamwork and integration, it was related to staff rated outcomes of quality
of care, job satisfaction and intention to leave the employer. In this section,
we look at the teams who delivered services to the 45 service users who
completed the MANSA, CUES and SUQ, to explore whether services users
are affected in a similar way. There were 95 WDQ responses from these
teams. Table 32 shows the professional group of the respondents.
Table 32. Professional group of respondents (Phase III teams only)
Professional n %
Doctors 5 5.3
OT 8 8.4
Social worker 19 20.0
Nurse 35 36.8
Support worker 7 7.4
Psychologist 5 5.3
Other 15 15.8
Missing 1 1.0
Total 95
Overall ratio 1:1.2 6.8:1

© Queen‟s Printer and Controller of HMSO 2011. . This work was produced by Huxley et al. under the terms of
a commissioning contract issued by the Secretary of State for Health. 114
Project 08/1619/114
There were 58 responses from Location A and 37 from D. Table 33 shows
location comparisons in relation to team size and composition. The support
worker data were skewed and so were transformed. There was no
significant difference in team size (A mean 21.2 (sd 4.3) D mean 22.3
(sd5.5). There were significantly more nurses in the teams in location A
(10.2 sd2.2) than in D (5.7 sd 0.8) and significantly more social care
support workers in D than A. Teams in location A had only 1 or 2 support
workers, whereas the teams in D have between 4.5 and 10.2 per team.
Table 33. Comparison of team composition in locations A and D
Staff
A
(n=58)
D
(n=37)
t test, df, p
mean difference
(95%CI) Mean
(sd)
Mean
(sd)
Social workers 4.31 (0.8) 4.94
(1.9)
-1.9, df 94.5, p=0.06
Mean difference -0.63
(-1.3, 0.03)
Support workers 1.2
(0.4)
8.1
(2.5)
-27.3 df 64.5 p=0.000
Mean difference -0.82
(-0.9, -0.8)*
All social care staff 5.5 (0.9) 13.0 (4.4) -10.28 df 37.8 p=0.000
Mean difference -7.7
(-7.7, -6.0)
* log transformed
As the number of interviews was small and might be unrepresentative we
assessed whether the teams where the interviews were conducted differed
in their culture and climate from teams in the sample where interviews were
not conducted. We compared the WDQ and Karasek JCQ sub scores for the
teams where interviews took place with teams where interviews had not
taken place. Psychological job demands differed and were more demanding
in the service user interview (Phase III) locations (t=-3.37, df86, p=0.001.
Mean difference = -0.32 (-0.51, -0.13). All the other Karasek JCQ and WDQ
subscales were not significantly different in the interview locations and non-
interview locations. This gives us some confidence that the interview
findings, although largely descriptive have not been conducted in teams in
the sample with atypical culture or climate.

© Queen‟s Printer and Controller of HMSO 2011. . This work was produced by Huxley et al. under the terms of
a commissioning contract issued by the Secretary of State for Health. 115
Project 08/1619/114
Because of the large number of variables in the WDQ, MANSA, CUES and
SUQ, we need to take a theoretically informed approach about which items
to use in the analysis. As the purpose of the study is to see to what extent
culture and climate impact on workers, and thence upon the service users
and the quality of care, we isolated those variables that lent themselves to
addressing these questions.
We selected the WDQ teamwork subscale, the integration subscale, the
quality of care subscale, training and staff development sub-scale and
overall job satisfaction. We selected the variables on the CUES that related
to worker characteristics and team characteristics: access to mental health
services, choice, relations with mental health workers and satisfaction with
care coordinator, social worker, CPN and support worker. Chronologically,
the WDQ data were gathered before the user data. Although the original
WDQ subscales were skewed, in some cases transformations made them
more skewed. We ran the analysis using both skewed and transformed
variables and found that the original variables gave the most conservative
results, so we present those in Table 34.
The first and perhaps most interesting result to report is that the
„integration‟ subscale was unrelated to all the service user variables,
suggesting that it is something that has little impact on service user
perceptions.
The pattern of the remaining results is interesting because it shows which
aspects of team culture and climate are related to user experience in the
present study. Training opportunities and quality of care (which themselves
are significantly correlated) are both associated with similar factors to do
with how service users perceive the competence and listening abilities of
the workers, and met needs. Teamwork was associated with the service
users‟ feelings about the choice of service available, and overall job
satisfaction of the workers was also associated with choice, both in relation
to the normative statement comparison and satisfaction with choice.
Even though the WDQ data were collected before the CUES and MANSA
data the direction of the relationship cannot be assumed. Service user
satisfaction with the service choices that they have been afforded could well
be reflected in worker job satisfaction, and vice-versa, workers may have
greater job satisfaction where the range of services they provide is greater.
Nevertheless, the results in Table 34 are readily interpretable and intuitively
make sense. This form of analysis will need to be repeated on a much larger
sample in order to explore these potential relationships robustly.

© Queen‟s Printer and Controller of HMSO 2011. . This work was produced by Huxley et al. under the terms of
a commissioning contract issued by the Secretary of State for Health. 116
Project 08/1619/114
Table 34. Associations between WDQ subscales and service user variables
WDQ subscale CUES item Correlation, p (n)
Integration None n/a
Teamwork Available choice (CUES A) -.037, p=0.02 (38)
Quality of care CPN competent and
knowledgeable
0.66, p=0.002 (20)*
Social worker listened
and understood
0.58, p=0.04 (13)
Quality of care 0.45, p=0.02(26) 1
Needs met 0.34, p=0.03 (41)
Training Social worker listened
and understood
0.70, p=0.03 (13)
Social worker competent
and knowledgeable
0.65, p=0.03 (11)
Support worker listened
and understood
0.51, p=0.02 (20)
Support worker
competent and
knowledgeable
0.47, p=0.03 (20)
Available choice (CUES A) -0.54, p=0.001 (35)*
Overall job satisfaction Choice (satisfaction)
(CUES B)
-0.36, p=0.02 (37)
Choice (satisfaction)
(CUES B)
-0.36, p=0.02 (37)
1 In location A only
* remain significant after Simes adjustment
The quality of care subscale was related to the service users‟ rating of the
quality of care provided by the team in location A, but not in D. To some
extent this is inconsistent with the results of the multivariate analysis which
showed that quality of care was related to the proportion of social care
workers in the team, so one might have expected this to emerge in location
A and not in D. The small sample size in D may have been responsible.
Because management structure and style emerged as an important
contributor in the multivariate analysis, we examined the association with
the service users‟ experiences. Management style did not differ significantly
between A and D teams. It was unrelated to quality of life scores on the

© Queen‟s Printer and Controller of HMSO 2011. . This work was produced by Huxley et al. under the terms of
a commissioning contract issued by the Secretary of State for Health. 117
Project 08/1619/114
MANSA and the CUES. It was however related to the Karasek Job Content
Questionnaire, as one might expect. Better management (higher WDQ
scores) were weakly (but significantly even after Simes was applied) related
to lower psychological job demand (r=-0.162, p=0.04), greater decision
latitude (r=0.344, p<0.001) and more social support in the team (r=0.519
p=<0.001).
4.4.5 CUES free text response
Each of the domains of the CUES has a section C, which permits the user to
add free text. The wording of the questions is slightly different for each
domain, but they are generally asking what changes people would like or for
them to give examples of the sorts of situations they encounter e.g. in the
advocacy section, the question is “What situations do you most want help
with?” Where there are no observable differences in response between A
and D this is confirmed in the text, otherwise the statements are presented
separately to illustrate the difference in response.
In the text that follows we provide examples of the types of comments
made by service users, first in relation to aspects of their lives that they
would like to change and later in relation to services. These are grouped
into themes. As most of the themes were self-evident and related to the
specific questions that they had just been asked we saw no need to process
them using proprietary software.
Remarks relating to the home suggest that the remoteness of some of the
communities in D does contribute to the service users‟ problems:
“I would like my very supportive friend to live nearer.”
“No shop in village restricts any life so no purpose to pop to the shop or
get out to do something.”
“People are not very friendly, very standoffish. Isolated - no shops, few
buses, beautiful but remote.”
On the other hand, many people clearly valued their home and its location
as the following quotes suggest:
“I feel comfortable where I live”
”I would not like to change anything”
”No changes needed”
There were some remarks that indicated the need for small practical
changes that might lead to improved quality of life:

© Queen‟s Printer and Controller of HMSO 2011. . This work was produced by Huxley et al. under the terms of
a commissioning contract issued by the Secretary of State for Health. 118
Project 08/1619/114
“Wish we had a smaller garden. Or even nicer would be to have
someone to do it.”
“It would be nice to have a clothes line outside, to dry clothes.”
“To have the money to decorate it as it‟s still the same as when the last
occupied it.”
In a few instances in A there were indications that some more substantial
social needs might be going unaddressed:
“Perhaps have somebody I could call in an emergency.”
“I worry about the rent as financially restrained. Also would like the
house to be redecorated throughout but nervous of asking the landlord.
A bit ashamed of asking people in for coffee as it looks so tired.”
“I would like it to be quieter. All I hear are trains screeching people
coming out of the bars, waiting for taxis, neighbours banging loud
music. Skateboarders. I have no heating, so would like heating.”
Changes to finances and help with finances
In both A and D the impact of the economic downturn was evident with a lot
of people reporting debts, bankruptcies and home re-possessions. The
MANSA subjective well-being score was the same in both areas, and the
picture painted by the free text does not suggest that there was any
difference between the areas in terms of the nature of financial problems
people faced.
In relation to help with finances, there were no indications in D that help
was being provided directly by the CMHT. Some people clearly had difficulty
in paying for the basics, and paying for transport was an issue for those in
remote parts of D.
Any help that was mentioned was from external agencies, as the following
quotes illustrate:
“Have been above my limit. Bought too much so I have debts but CAB
helped to sort it out for me. My partner (then) advised me to go to
CAB.”
“Get food in, paying the bills e.g. getting a new toaster etc. Feel cold in
the winter, I (Name) her son helps her with the cooking, because she's
forgetful and would burn the meal. Quality Care comes in to watch her
take her tablets so she doesn't forget to take them.”

© Queen‟s Printer and Controller of HMSO 2011. . This work was produced by Huxley et al. under the terms of
a commissioning contract issued by the Secretary of State for Health. 119
Project 08/1619/114
On the other hand, in A there were several indications that the workers
were engaged directly in assistance with financial issues, including help with
filling in forms such as benefit claims.
“CPN helps me with finances with the help of my brother.”
“Would like to have my CPN and social worker back in communication
with me. Their visits were a great help and pleasure to me.”
Nevertheless, there were some clear indications that some individuals
required further assistance in relation to their finances, and not all their
problems are attributable to the recession.
“Am in arrears with the gas, elec and water, also have to keep £50
towards the rent.”
"Just getting by. Shopping with the girls is more restricted now.”
“Husband bankrupt 2 yrs ago. That was upheaval, not very pleasant.
His circumstances have impacted on us. After 42 yrs of marriage lost
house etc.”
“Debt incurred over years of chronic ill health and bringing up a
family.”
“More money going out than coming in.”
One person suggested that their financial situation would be improved if
they were able to claim a “grand-parenting benefit”. Others were clearly
struggling and would benefit from further advice and guidance but appeared
not to be receiving it:
“Trying to work out after basics to budget for little extras as for myself
and girls. Want to make ends meet, would like to have some left over
to get things for the girls.”
“Have found the CAB very helpful so is my CPN who also advises me
but I often can‟t stretch my money out. Find it stressful. Have to ask
my sister to help me out, she lives in NE England but very supportive.”
Changes to daytime activity (including work)
Low levels of satisfaction with leisure activities and work were observed on
the MANSA and the structured part of the CUES. The free text responses
confirm that this is one of the most neglected areas in both of the locations
(23 of the 41 respondents made critical remarks in this section).

© Queen‟s Printer and Controller of HMSO 2011. . This work was produced by Huxley et al. under the terms of
a commissioning contract issued by the Secretary of State for Health. 120
Project 08/1619/114
The issues are not simply the lack of available opportunities, although this
was mentioned in D:
“Limited places you can go in (area X) for people with mental health
problems. There could be some drop ins or day centres. Last day
centre died down nothing re-opened.”
More often, the individual attributed the problem to their own lack of
confidence or motivation, two areas where specific forms of help (such as
motivational interviewing) are available:
“I would like to have confidence to go about the opportunities on offer.
Sometimes I know I can‟t do it other times I know I can do it but I still
do not do it. That annoys me.”
”Like to be more motivated. Find it hard to do it and can put myself off
doing things.”
“Would like to get out more. If I do go out I feel I get more done when
I get back home.”
“Would like the confidence to be involved and go to day centre or
something.”
In accordance with the MANSA and CUES results the free text responses
indicated a strong desire to be helped back into employment by training,
getting a career or simply a job. Of course, whether these plans are
realistic or not cannot be determined, but we know that employment has
positive benefits for the health and well-being benefits for people with
serious mental health problems.(155)
“I want full time employment NOT stacking shelves.”
“Would like to be well enough to manage a career.”
“Went to search - various activities becoming more limited. Classes
being cut back.”
“I'd like the opportunity to be able to do courses but money to pay for
these is not available.”
In location A people complained of inactivity and of needing help to become
engaged in doing something social or leisure activity related. In some cases
the illness was having an adverse impact on their ability to participate in
activities:
“To get out of my bedroom more often.”
“If it is a bad (MH) day I get bored.”

© Queen‟s Printer and Controller of HMSO 2011. . This work was produced by Huxley et al. under the terms of
a commissioning contract issued by the Secretary of State for Health. 121
Project 08/1619/114
“Depends how I am. Would like to do something in the day which will
make a difference.”
“Just like to get out and about. Have free bus pass and cannot get out
to use it.”
The task of accompanying people to help them to overcome this kind of
difficulty, and other practical tasks such as those related to the home (see
section above), usually fall to support workers, but none were mentioned in
the free text (under home or daytime activity) in any of the free text
responses in A. This may be because between the seven teams in location A
there were only 4.5 support staff. This role was obviously being performed
for some people by their CPN:
“I don‟t leave my house. If I have to leave my CPN takes me.”
A couple of respondents expressed feelings of loneliness, and again the
professional staff were the preferred helpers for these people:
“Would like CPN back visiting me. Would like to have CPN and social
worker back.”
“Meet people instead of being lonely.”
One person who was motivated to go out, was at the same time not
motivated to take care of their own well-being.
“I attend 2 classes a week and volunteer 1 a week but not motivated to
do general housework also do not cook meals.”
Throughout the responses in this section, there is a general air of passivity,
sometimes attributed to the illness or illness-related factors like lack of
motivation. On the MANSA 93% wanted to improve their health. There is
also a sense that many people expect the services to resolve these matters,
while others appear not to have been offered assistance in relation to social
participation. This is the domain in which the lowest CUES and MANSA
subjective well being (SWB) scores were recorded. Low SWB scores were
also recorded in terms of living alone.
Some of these responses point to the differences between role and task. So
in a team with lots of social care support workers, nurses may not
accompany people on visits or deal with money-related issues. But where
there are fewer (or no) support workers, social care needs may still be met
but by other members of the team (e.g. nurses).

© Queen‟s Printer and Controller of HMSO 2011. . This work was produced by Huxley et al. under the terms of
a commissioning contract issued by the Secretary of State for Health. 122
Project 08/1619/114
Changes to social life
On the MANSA 61% wanted to improve their social lives and 56% felt that
their opportunities to do so were restricted. Statements under this heading
are similar to those for daytime activity. People want to do more, but find
various factors restrict their opportunities or they lack the ability,
sometimes attributed to the illness:
“Would like to be a bit more outgoing if my condition improved.”
Self-confidence appeared to be a factor for some people:
“Would like to be more confident mixing with people - especially people
who I know which I will avoid so as not to talk to them. Always OK in a
structured situation. Can meet new people on holiday but get tongue
tied.”
As we have observed in similar samples before financial resource problems
restrict people‟s ability to participate:
“Restricted by limitations of income. Basics covered but doesn't extend
to any more Would like more money to do more things that I enjoy.”
“Not enough money for transport cannot access countryside and
concerts etc that I'd like.”
“Don't have one again no available money.”
“Would like to be able to get out when I want - don't always have
money for a drink.”
“Have to watch money for petrol to go out fishing if invited. All money
goes on collecting fetching girls.”
Some of the statements indicated that there might be a role for support
workers to help people to pick up previous interests, or to accompany
someone to social or other events (these are the kind of tasks that STR
workers take on):
“Would like to get back into my amateur dramatics again. It was such a
big part of who I am. I got so many positives out of it.”
“Go to church but am only one under 40 but would like to go some
where with others of my age.”
It was quite common in our STR study(24) to find workers accompanying
people who found going out was difficult for them for some reason. In
location A however, CPNs were undertaking this type of work:

© Queen‟s Printer and Controller of HMSO 2011. . This work was produced by Huxley et al. under the terms of
a commissioning contract issued by the Secretary of State for Health. 123
Project 08/1619/114
“I never leave my home unless accompanied by CPN. Dont like going
out on my own.”
Some people appear to have had something of a dependent relationship
with their workers:
“More contact with the fabulous mental health team. Wish I had more
time with them.”
For others physical and mental health problems limited their activities:
“ ..physical ailments affecting mental state and at present time I
cannot improve it.”
“I prefer not to socialise as very nervous and self conscious. Also
cannot use public transport on my own. I have a very good friend and I
meet her every week for a chat.”
Contact with Services
Table 35 indicates that most service users in both locations are aware of
who their care coordinator is and feel able to contact them when necessary,
in the knowledge that they are likely to listen and be helpful.
It is striking that having a social worker as a care coordinator is unusual
even in D where it does happen, even though the social care composition of
teams is dominant.
Although none of the area comparisons produced significant differences it is
also striking that so few people have actually had contact with a social
worker, again even in D. Having contact with a support worker is much
more common. The CUES question about the competence and
understanding of the worker asks about „the last time you saw a social
worker‟ (or CPN etc) so the „n‟ for responses to those questions can be
greater than the number of people who saw a worker in the last year, as
they may have seen them more than a year ago. The relatively low
proportion rating their CPN in the highest category of competence in
location A, is offset by the higher proportion rating them as mostly
competent (n=12, 75%).

© Queen‟s Printer and Controller of HMSO 2011. . This work was produced by Huxley et al. under the terms of
a commissioning contract issued by the Secretary of State for Health. 124
Project 08/1619/114
Table 35. Care coordination
A
n (%)
D
N (%)
Yes I have been told who my care coordinator is 22 (84.6) 17 (94.4)
My care coordinator is a CPN 19 (76.0) 11 (61.1)
My care coordinator is a social worker 0 (00) 3 (16.7)
I can always contact my coordinator about a problem 14 (79.2) 14 (77.8)
My care coordinator was helpful on the last occasion 22 (91.7) 13 (72.2)
My care coordinator listened and understood me 14 (79.2) 16 (88.9)
My care coordinator is highly competent and
knowledgeable
20 (83.3) 17 (94.4)
My CPN was helpful on the last occasion 14 (87.5) 5 (100.0)
My CPN listened and understood me 13 (81.3) 1 5 (100.0)
My CPN is highly competent and knowledgeable 3 (18.0) 4 (80.0)
I have seen a social worker in the last 12 months 4 (16.7) 5 (31.3)
Social worker was helpful on the last occasion 3 (50.0) 5 (100.0)
My social worker listened and understood me 5 (100.0) 5 (100.0)
My social worker is highly competent and
knowledgeable
4 (80.0) 5 (100.0)
I have seen a support worker in the last 12 months 10 (40.0) 11 (61.1)
Support worker was helpful on the last occasion 7 (70.0) 10 (90.9)
1 mostly n=12 (75%),
4.4.6 Comments on services received (from the CUES)
Access
In location D the most common complaints were about accessing services
out of hours:
“Major element missing is out of hours access. There is no one to get
hold off when I am high as a kite. Crisis team will not respond as I am
not on their books.”
“Weekend availability is JUST NOT THERE. Last time I tried to ring after
5 on a Friday told to contact NHS direct! Try explaining mania.”

© Queen‟s Printer and Controller of HMSO 2011. . This work was produced by Huxley et al. under the terms of
a commissioning contract issued by the Secretary of State for Health. 125
Project 08/1619/114
“Out of hour's service. Getting attention 24/7 weekends/bank
holidays.”
In some cases, people found that access was difficult during office hours:
“Have difficulties getting through to services in day. Sometimes no
answer and can get cut off. When you get put through to admin dept.”
“Well its too expensive for my mum to ring on her mobile and they
make her wait ages, sometimes she says please will you ring back and
they never do. She needs some grab handles on the bath because
she‟s not got any, its so hard for to get in and out of the bath. Me her
son has to be there for everytime she has a bath. Social worker is good
at ringing back though.”
By contrast, services in location A were seen to be readily available:
“They have been there when needed or required.”
“I have a CPN to talk to weekly.”
“I have a very good relationship with my psychiatrist and feel able to
ring them anytime.
“Can ring Dave anytime 24/7.”
There were one or two indications that services were not providing what the
service users wanted:
“Our mental team are so busy and under pressure. Would be lovely to
have CPN and have visit as I used to have before they stopped due to
excessive lack of time.”
“One pointed me in direction of things but no follow up to see if you
have done it. Sign posted to what is useful but no follow up.”
Choice
A small number of people in D gave examples of how their choices had been
restricted and how they had not received what they wanted:
“In the past requested lady psychiatrist but refused. Had to fit in with
what they provided. Not comfortable with men - do not even sit next to
them on bus.”
“Have mentioned about counselling and therapies and have hit a brick
wall with trust, would like to go and talk things through with someone
to put things in perspective.”
“Psychiatrist asks same questions every time only about medicine.”

© Queen‟s Printer and Controller of HMSO 2011. . This work was produced by Huxley et al. under the terms of
a commissioning contract issued by the Secretary of State for Health. 126
Project 08/1619/114
“Very much geared to activities and relaxation but there is no
psychotherapy or counselling. Not made clear how I could get there.”
Respondents from A made both positive and negative comments about the
choices that they had:
“The fact that you have no choice really false. Choices that they are
choosing for you.”
“Don‟t know anything about many of the above (i.e. choice of mental
health services)”
“Would love to see more of the mental health team if possible. Increase
number of staff so as to increase time spent with patients especially
me.”
“I am very pleased with the choice of mental health services I have.”
“I been ill for a while and this health service is the best so far.”
“No concerns, very satisfied.”
Relationships with mental health workers
Given the significance of relationships in mental health work(24) it is
unsurprising that the service users had a lot to say in this section. In D,
their concerns focused on three things, confidentiality, continuity and
repetition.
“Don't want to keep meeting different psychiatrists each time. Want to
avoid repetition.”
“Have had to repeat my medical history so many times. It is probably
poor record keeping or not passing them on. Have been asked about
medication and can see my records on the shelf and have said it is in
these records why don't you look there?”
“Felt confidentiality was not there. Told I had no capacity but I was
sectioned.”
“Passing on of info not as good as it could be. Psyc talked to me and
then realised I was not the person whose notes he was looking at.
What does this mean about confidentiality?”
In some cases, it was the worker‟s style that provoked a negative
comment:
“As far as the psychiatrists concerned - he stretches back in chair and
yawns and then I think to myself I might as well go home. Not first the
first time that noticed it - a good friend of mine gets exactly the same
behaviour!”

© Queen‟s Printer and Controller of HMSO 2011. . This work was produced by Huxley et al. under the terms of
a commissioning contract issued by the Secretary of State for Health. 127
Project 08/1619/114
“Threatened to lose support worker if I did not do what social work told
me to do.”
“In recent past social workers always late! Used to think it was part of
their training.”
Similar complaints were voiced in A regarding continuity and repetition:
“They seem to change my keyworker every nine months and I been
with the service for 20 years. They need to read my files more and ask
less questions as there‟s nothing worse than going over your mental
condition every 9 months.”
“Does my head in how am I supposed to forget the past and
keyworkers don‟t have or read up enough information on me.”
Some people felt that the worker listened to them while others felt not:
“They don‟t give you enough time to explain yourself and give you
answers.”
“My CPN listened to me.”
On the whole, relationships were reported to be good, but some people felt
they required more contact, and some sounded as if they were dependent
on the team:
“I have a very pleasant relationship with the CPNs.”
“I would not change anything about my nurse. She is very supportive
of all my needs.”
“In the past appointments have been missed by CPNs and then I‟ve
ended up in hospital without their knowledge. All due to missed
appointments on 2 occasions.”
“Only see CPN and sometime a psychiatrist (6 monthly) otherwise do
not see anyone.”
“Would like to have more visits to doctor at health centre. Have my
CPN back visiting me. Worrying that one day the health team will be
taken away from me.”
“Do not feel happy about what the present worker is going to say to
the next one when she leaves. Worker failed to come to appointments -
missed 4 and never rang. The reaction was that things cropped up I
just had to do. But she never rang me. Makes me feel I count for
nothing.”

© Queen‟s Printer and Controller of HMSO 2011. . This work was produced by Huxley et al. under the terms of
a commissioning contract issued by the Secretary of State for Health. 128
Project 08/1619/114
Consultation and control
Respondents were asked if they were „satisfied with the level of consultation
and control you have?‟ in relation to the care that they were receiving. All
the comments made by D service users were negative:
“In past totally not satisfied. I felt as though I needed permission to do
everything.”
“Don't know that they always listen not sure they always take me
seriously.”
“Would like to find out other options to normal procedure - therapy,
counselling etc.”
“When they halved my medication - they should have spoken directly
to me and not just left a message with my husband. Then I might have
questioned them about their instruction.”
By contrast, the comments made by location A respondents tended to be
positive:
“My CPN listens to me and my family and that is important.”
“I am pleased with my mental health workers.”
“Just to see them more often. Realise that I am dependent on health
team. But literally my life and well being is linked with the good work of
the health team.”
“I feel more at ease with my new CPN than any one else it so helpful
knowing some one there to listen to you.”
“I always feel listened to.”
Advocacy
In D there were signs that some people used the advocacy services for
practical help, such as filling in forms, or phoning on someone‟s behalf.
One said that is was not relevant to them as:
“I can speak up for myself.”
In A, it appeared that an advocacy service was not widely used (if
available?) and people mentioned several others who could act on their
behalf when required, such as siblings, partners and CPNs.

© Queen‟s Printer and Controller of HMSO 2011. . This work was produced by Huxley et al. under the terms of
a commissioning contract issued by the Secretary of State for Health. 129
Project 08/1619/114
Stigma and discrimination
In D most comments referred to stigma and discrimination within the
services themselves, only one person mentioned the general public.
In contrast, all the comments made by respondents in A concerned negative
responses from people outside the services. The services themselves were
not criticized:
“Sometime I have trouble in streets on local or local shops.”
“I only go places where the people know me for sometime.”
“Stigma with MH although majority of people are fine.”
“Wish there was more understanding of mental health issues generally.
Feel a bit at odds with the community.”
Medication
Location D respondents made negative comments about side effects such as
weight gain, drowsiness, feeling sedated and tiredness. They also had
anxieties about the long-term effects:
“Worry about long term effects of lithium have mentioned it to doctors
- they say you are having a regular blood test - so that's enough - but
it does not reassure me about long term effects. Physical consequences
(troubles) worry me.”
Location A respondents also mentioned side effects, but more seemed to be
happy with their current regime:
“My GP/Psychiatrists sorts out my medication.”
“Satisfied. Years ago had injections.”
“My doctor keep a close eye on my medication.”
“Prozac was wrong medication for me first place. Definitely wrong for
me. But sorted out now.”
“My medication is always discussed with me when I see Dr every 6-8
weeks. No complaints.”
Access to physical health care
Both A and D respondents complained about being unable to access the GP,
chiropody services, dentists and opticians.

© Queen‟s Printer and Controller of HMSO 2011. . This work was produced by Huxley et al. under the terms of
a commissioning contract issued by the Secretary of State for Health. 130
Project 08/1619/114
Relationships with physical health care staff
Very few respondents in location D made comments. One was happy with
the GP and another complained that they:
“Would like GPs to understand more about mental health issues.”
Similar remarks were made by location A respondents. There was again
some evidence of dependency on popular staff in the responses from A:
“More contact as they seem to settle my nervous. Every health worker
I know has been helpful and understanding in supporting teams they
are champions”
Care coordinators
Both sets of respondents made comments about their care coordinators,
nurses, social workers and support workers. They were almost universally
positive and reported that their workers were: helpful, positive, supportive,
understanding, listened to them, were empathic, and were there when they
were needed. Some of the (few) negative remarks may have been due to
illness:
“From my choice due to previous experience I keep them at a distance
so they are not controlling me.”
What they liked about the service and what they would change
These questions were followed by the opportunity to say whether there was
anything that they liked about the service and how, if at all, they would
change it.
There were further positive comments on the teams in D, but there were
also some indications of dissatisfaction:
“No not really.”
“It has been a complete utter farce. We have not been able to make
appointments because of work they've changed them (wrong dates
given). It has been like ships that pass in night.”
Some further dissatisfaction emerged in response to the question about
what, if anything they would change about the service:

© Queen‟s Printer and Controller of HMSO 2011. . This work was produced by Huxley et al. under the terms of
a commissioning contract issued by the Secretary of State for Health. 131
Project 08/1619/114
“To make people feel more real - so they don't make you feel
uncomfortable. They have done all the training so they think they know
it all. Make you feel you need them more than you really do.”
They took the opportunity to complain again about the out of hours service:
“Out of hours provision non existent unless you are referred to crisis
team. If you are not ill enough you do not get this. Mon-Fri 9-5 10 out
of 10 often is ? 0 out of 10.”
“Focus time is a volunteer service. It is good at 2am in morning but
you are conscious that it is NOT the CMHT.”
“Change after hours care. If you have a problem after 5pm or at
weekends no help available.”
They also repeated the continuity and access issues and added that there
needed to be improved communication between the team and the service
users:
“When I go to see psychiatrist - it is never same one - no continuity.
Had to go to K to see him last time which is a v.long journey for me.
Why couldn't the doctor come nearer?”
“Improve communication between team and patient.”
“Continuity of care and communication broken down.”
The respondents in A repeated many of the positive points that they liked
about the service that had emerged in their previous free-text answers:
“The way they listen and understand my problems was very helpful.”
“All aspects.”
“How quickly I can have an opportunity to see the psychiatrist when I
need to.”
“The way the team operate is like a well oiled machine and they show
compassion. They are very considerate and unbiased and non
judgmental. They listen to you.”
“To me they are my family. Every one of them has that something
about them which makes them to be a pleasure to be with.”
“Better than where I came from. Did voluntary work for a while but was
moved as job wasn't permanent which was very.unsettling.”
“I am very familiar with all the staff at the CMHT they all call me by my
first name and make me feel very accepted for who I am.”

© Queen‟s Printer and Controller of HMSO 2011. . This work was produced by Huxley et al. under the terms of
a commissioning contract issued by the Secretary of State for Health. 132
Project 08/1619/114
“That they are always there for me, and they always make me feel
relaxed.”
When asked what they would change, the common theme that emerged
was increased face-to-face contact with the team workers. The other
common remark was that there was nothing to change.
Among the things to note are the low levels of leisure activities and work in
both locations, according to the CUES, MANSA objective indicators, and the
free text responses. We need to explain the SWB ratings in these domains,
because respondents in A score more highly than the respondents in D.
While there may be a multitude of factors at work here, from a clinical
perspective to have people with no leisure activity and no work, content
with the situation does not seem to be acceptable, especially as the free
text responses suggest a number of people would like to do more. It could
be that the extent of disabling aspects of their illnesses genuinely rules out
greater participation and social inclusion. It might also be that this indicates
that the service is not addressing these needs or that the lack of motivation
to improve is not being addressed adequately.
In D, the lower ratings could either be interpreted as reflecting their
aspirations to improve their circumstances, or as a failure to help them to
achieve goals in these areas. In the free text responses in the financial,
leisure and work domains there are more complaints about inactivity in D,
and more positive comments in A, but balanced by negative ones as well. It
could be argued that neither service is doing particularly well in these social
domains. From the medication results it looks like there may be some cause
for some concern in D (although disputes over the correct form and dose of
medication are not uncommon). A seems to have worked out an effective
system for communication and control given the absence of negative
comments about this aspect. The structured part of the CUES suggested
both locations are doing well in this respect. This would be consistent with
the growing emphasis on negotiation and partnership with service users in
the care process.

© Queen‟s Printer and Controller of HMSO 2011. . This work was produced by Huxley et al. under the terms of
a commissioning contract issued by the Secretary of State for Health. 133
Project 08/1619/114
5 Final Discussion
5.1 Limitations of the study
In some instances these are serious and mean that we have to be tentative
in drawing conclusions. The major failing is the sample size for the service
user interviews, a phase which was added at the request of the original
protocol reviewers. A much larger and well-powered study has now been
funded by SDO and this will permit firm conclusions to be drawn about the
service user experience. Our results are indicative at best.
Although our data collection methods used in the national survey, with
hindsight, could have been be improved, the response rate for Phase I was
quite good for a national survey, but only reached 50%. This is similar to
previous national surveys we have conducted(14) Many of the respondents
referred us to the Mental Health Service Mapping data(129) (see footnote
p19) for their team data, while others were able to provide more up to date
figures. We compared our data to that of the Mapping data(129) and found
that on all the workforce variables our respondents‟ data were not different
from non-respondents, which gives some confidence in the generalisability
of our results from the national survey of Trusts.
In retrospect, it would have been better, rather than recording the first
reason for team composition, to allow all reasons to be exhausted and then
ask the respondent to indicate, which in their view, was the major influence
in their Trust. Also, although it was usually clear what the respondent
meant by „financial‟ or „resource‟ issues, resources might be scarce or
abundant. For CMHTs it was usually scarcity, but for new teams it could
refer to the additional resources that allowed them to populate the new
teams, or to the fact that even with the new resources they were still
unable to populate the teams in the way that they wanted to. In the event
this probably made little difference to the results, as either way resources
remained an important consideration for many Trusts.
The selection of locations for the staff survey phase of the study proved
problematic in that one of our initially selected locations withdrew due to
internal reorganisation. This was substituted with another similar Trust
without any difficulty, but subsequently this Trust also withdrew due to
constraints imposed on the staff who were preparing for a Foundation Trust
status application. This was unfortunate, as this Trust C was significantly

© Queen‟s Printer and Controller of HMSO 2011. . This work was produced by Huxley et al. under the terms of
a commissioning contract issued by the Secretary of State for Health. 134
Project 08/1619/114
and consistently different from Trust D. In the event we substituted A for C
on a number of grounds, including similar team size but significantly
different composition and rationale. Having the two Trusts with the larger
teams (a situation that was anticipated in the original proposal) meant that
we stood a better chance of an adequate response to the staff survey, and
that proved to be the case. The response exceeded the target by over 10%.
Using the larger Trusts with larger teams resulted in enough teams to
undertake multi-level modelling (MLM), but the number of responses per
team did not result in a sufficient number for MLM.
In order to assess the impact of climate and culture on outcome we again
selected A and D because of the differences revealed in the staff survey.The
service user interviews, however, proved much more challenging in terms of
data collection than we anticipated. Although we agreed lists of people to be
assessed using the standardised instruments (removing people who were
too unwell to participate), we were beholden to the team leaders and team
members to operate the arrangements for selection of and contact with
people who agreed to participate. As indicated in the body of the report, in
some cases we have confidence that this went according to plan but in
some teams we were unsure whether the approach had been applied
faithfully. Representativeness at this stage is perhaps less important than in
the earlier phases, and we did compare the locations and teams from which
Phase III respondents came, with the other locations and found only one
significant difference in terms of psychological job demands, which was
higher in the interview sites. This suggests that the interview locations were
broadly representative.
As the end of the project approached we had only 41 out of a target of 50
interviews and it was proving very difficult to gain the full cooperation of
some team leaders in one of the Trusts. We persisted in our attempts to
gather the final nine interviews, and one area manager tried to help with
the process. Putting efforts into the gathering of the final user data resulted
in us abandoning our attempts to gather similar data on the CUES from
carers. As indicated in the body of the report we felt that pursuit of carers
with the same teams who were finding it difficult to recruit service users
would have resulted in more difficulties for them and more delay. In
addition, as we have pointed out, far fewer of the users recruited had
carers, and many that did refused us access, so reluctantly we abandoned
this effort to concentrate on achieving the service user target specified in
the protocol. The total number of service users included reached 45. This
part of the study raises issues about the gate-keeping functions of service
managers and team leaders, which we will consider elsewhere. Anecdotally,
team workers are under considerable work pressures, which means that
time for research (even their own) is not a priority, but also the increased
amount of regulation and associated paperwork has perhaps taken the
space that research might have occupied in the past.)

© Queen‟s Printer and Controller of HMSO 2011. . This work was produced by Huxley et al. under the terms of
a commissioning contract issued by the Secretary of State for Health. 135
Project 08/1619/114
5.2 The national survey of Trusts
Aim: The composition of mental health teams appears to be determined by
factors other than the need to integrate health and social care
professionals. Mental Health Mapping Data2 shows that there is enormous
variability in team composition, with some teams operating with no social
care staff at all. We need to understand the factors that determine this
situation. This will provide us with an insight into current workforce planning
and provide evidence about the key determinants of team structure and
inputs. This will be of general value to health and social care workforce
planners.
It is possible that, given the sample size our results might be subject to
response bias but our comparison of responding and non-responding Trusts
suggests this is not the case.
In addition to the limitation mentioned above (regarding the relative weight
of each of reasons), further prompting should have taken place when the
respondent mentioned financial and resource reasons, so that a shortage of
resource could be distinguished from additional resources being made
available. On the whole, further information made it clear that the
respondents were referring to a shortage of resource when discussing
CMHTs; new teams had additional resources but in some instances these
were still insufficient to develop the teams as they would have liked to. We
should also have asked what role the respondent played in team
construction; had they been personally responsible for team construction, or
did they inherited management of the teams from someone else. We could
then have created a variable representing the extent or length of their
involvement.
The quantitative findings point to some disturbing though understandable
findings that team size and composition (in terms of their social care
component) is determined more by financial resource than by demand or
any other factor. The trend towards social care staffing being greater in
more integrated Trusts suggests that local authorities might be less inclined
than NHS Trusts to invest in mental health social work or, perhaps, pay for
social care provision in health settings; of course this finding could reflect
absolute lower levels of resource within the local authority environment or a
preference for spending on other priority services, such as child protection
or other adult services. It might also reflect the fact that integration and
pooling of budgets give larger Trusts the capacity to invest in a wider range
of staff and for the senior managers with responsibility for the social care
staffing may be able to exert more influence to ensure an adequate

© Queen‟s Printer and Controller of HMSO 2011. . This work was produced by Huxley et al. under the terms of
a commissioning contract issued by the Secretary of State for Health. 136
Project 08/1619/114
presence of social care staff in the teams. The figures show that support
staff have grown consistently in recent years, which in economic terms,
looks like downward substitution, ie replacing more expensive staff with
cheaper staff.
The absence of long-term planning endorses the need to implement the
HRH Action Framework issued by the WHO and the Global Health Workforce
Alliance(11) and reinforces previous criticism of NHS workforce planning(20).
Despite the introduction of reams of policy guidance and an increasing
emphasis on promoting social inclusion and recovery(156, 157), resource levels
appear to be the only major influence on multidisciplinary team composition
and shortages remain in key staff groups. Policy directives are cited as
major reasons for planned changes to teams.
The findings are relevant internationally given that staff shortages are
evident worldwide and service quality is dependent largely on the staff
delivering those services. Inadequate numbers of trained workers has been
identified as one of the major obstacles to the improvement of community
mental health services in low and middle-income countries (158). The findings
appear to support previous evidence based on international comparisons
that mental health workforce composition is determined more by supply
factors than by demand factors(13). The transfer of hospital-based nurses
into community settings following deinstitutionalisation has created a
mental health workforce that is dominated by nursing in the UK(13),
Jamaica(159) and Canada(160), among others.
Perhaps it is naive to assume that workforce planning and its outcome in
terms of team composition is a rational process. Pragmatism will always be
a necessary feature of service development as managers working with
limited resources often struggle to achieve acceptable (or guidance) staffing
levels let alone balancing skill-mix. Nevertheless, it seems inconceivable
that service, financial and workforce planning are not considered alongside
each other, especially given the impact of financial resources on team size
and composition.
Decisions about how best to organise services so that they meet the health
and social needs of mental health service users need to consider how
integrated care can be optimised. Building on the WHO HRH framework
further international research could inform understanding of how long-term
workforce planning can be effected within resource constraints, and whether
a more consistent approach to mental health workforce planning is feasible.
The alternative is that supply, resource and historical factors(161, 162) continue
to dictate the shape of services and the membership of community mental
health teams, rather than demand and need.

© Queen‟s Printer and Controller of HMSO 2011. . This work was produced by Huxley et al. under the terms of
a commissioning contract issued by the Secretary of State for Health. 137
Project 08/1619/114
Is it likely that community teams as presently constituted are going to be in
a position to deliver the government‟s vision of future mental health policy?
Things do not look very promising. It is not necessarily the case that teams
needs a perfect balance between health and social care workers but having
a stronger social care component is more likely to facilitate the
implementation of policies which emphasise public mental health objectives
(see Section 3.2 for more detail).
Recovery is now a core component of UK Department of Health Policy
New Horizons(1), and the coalition government‟s White paper, Liberating the
NHS(163), with its clear focus on service user experience and shared decision
making – „no decision about me without me‟ (Department of Health, 2010).
In addition, the profession of medicine is changing. It is becoming more
collaborative, with a greater emphasis on shared decision making, self-care
and patient choice, and greater recognition of the contribution of service
users as experts in their own conditions. (164)
5.2.1 Workforce planning is less than systematic
The Phase I findings support Buchan(12) and other critics of workforce
planning in the NHS(18, 20) and in mental health services in particular. It may
be wishful thinking to expect workforce planning to be a rational process,
but as Buchan has suggested one could at least expect some form of
coordination and alignment between resources and supply factors. That this
was not the case, is shown by the way in which, while multi-disciplinarity
was supported, the composition of new community teams was dominated
by the supply of nurses, in some cases redeployed from CMHTs and in other
cases hired using new resources provided for the new teams. Where
resources are more readily available, in the Trusts with pooled budgets
there was a higher proportion of social care staff (significantly so and with a
medium to large effect size), whereas, where the local authority social
services department still controlled the budget and supply of social workers,
the social care component was lower. There could be a number of
explanations for this finding, and it needs to be treated with caution, as it
depends on univariate analysis and not multivariate analysis, which would
control for other influences. Larger Trusts, which acquire pooled budgets
and additional resources for new teams could be regarded as „resource rich‟
and able to meet their objectives for multi-disciplinarity in their community
teams. They would be able, by using the new monies for new teams to
populate them with whichever staff they deemed necessary. The local
authorities who controlled the social care staff budget might be in difficult
financial times and unable to find the required level of resources. More
sinisterly, and we have nothing but anecdotal evidence to support this from
our previous work, there remain some local authorities who are reluctant to
spend what they see as social care resources on community mental health

© Queen‟s Printer and Controller of HMSO 2011. . This work was produced by Huxley et al. under the terms of
a commissioning contract issued by the Secretary of State for Health. 138
Project 08/1619/114
services, especially in the face of competing demands from services for
children and older people.
Given the prominence of guidance in the mental health field we were
surprised to find how much historical reasons dominated the picture,
paradoxically for the new teams as well (although this finding partly may
have arisen because a handful of the informants gave a single global
rationale applied to all types of teams rather than distinguishing CMHTS
from new teams). Some of the new teams may now have existed for long
enough in some locations for history to be a real determinant. There was a
difference between the answers for overall rationale, drivers of change, and
social care composition, which adds to the face validity of these data. The
reverse consideration, that many said that guidance determined CMHT
composition is due to the fact that NICE guidance, the NSF and the NHS
Plan could all be cited as guidance as to the composition of CMHTs. Only
one Trust referred to external guidance, and there had been a number of
published papers on the mental health workforce that could be construed as
„guidance‟, e.g. Boardman and Parsonage.(15)
5.2.2 The social care composition of community mental health
teams is extremely variable, ranging from nil to 88%
When one looks at the composition of the CMHTs and the new teams,
especially over time, it is evident that, as Buchan(12) suggests the supply of
nurses is dominating the picture. The research we conducted took place at a
time when the DH in England and the ADSS in Wales were preoccupied with
introducing mechanisms to increase the supply of social workers. It is
somewhat ironic, that the Chief Nursing Officer‟s report in 2006(18) is urging
nurses to adopt values, perspectives and roles that have long been the
basis for social work (and not just in the mental health field). Shifting the
policy towards prevention and a wider perspective on outcomes, as New
Horizons(1) does in England is likely to require a skill set that is much more
akin to that of a community worker than that of a therapist, although of
course the latter will still be centrally significant for many workers and
service users, as part of a whole person, personalised approach. We note,
however, the results of a recent study of IAPT (improved access to
psychological therapies) that showed a lack of impact on social
outcomes.(165)
There is some limited evidence that social workers take a different view of
service delivery and may have different skills to other team members that
add value to the service, which is, after all, the rationale for all
multidisciplinary approaches. For example, it has been shown(54) that social
workers (and to some extent psychologists) in mental health teams take a
different view about the use of compulsory treatment to other health
professionals (i.e. psychiatrists and nurses); they also differ in their views

© Queen‟s Printer and Controller of HMSO 2011. . This work was produced by Huxley et al. under the terms of
a commissioning contract issued by the Secretary of State for Health. 139
Project 08/1619/114
of compulsory community supervision (55) suggesting that team composition
might influence the type of care received.
There is also evidence that different professional groups differ in their
assessment decisions. In examining the relationship between assessments
and eligibility decisions made by health and social care staff in
multidisciplinary community mental health teams in England, one study(56)
found that judgements about social care needs and levels of severity or
complexity according to the CPA (Care Programme Approach) were distinct
from one another. Judgements of assessed need and case complexity
differed by professional group; social workers‟ judgements about the need
for social care were significantly related to an independent measure of
complex needs; nurses were less able to distinguish between the critical
and substantial social care needs of the Fair Access to Care Services (FACS)
criteria.
5.3 The staff survey
Aims: Does variability in team composition makes any difference to the
way that these teams operate? The evidence produced may show that the
social care component needs to be at a certain level in order for team
climate to be positively affected, or it may show that having too many social
care members interferes in an unhelpful way. In either event, this is useful
information for those who plan the teams, and for those who manage them.
We need to attempt to make sense of a complex set of results and identify
the main messages. It is perhaps best to concentrate on the multivariate
analyses to begin with as they control for the influence of other variables,
and focus on the major variables, such as integration, teamwork, job
satisfaction and intention to leave the profession.
Before doing that we should note that there is extreme variability in the
social care composition of teams, and while some Trusts indicated in the
National Survey that some of the rationale was related to meeting needs in
deprived areas, or promoting social inclusion, there was no clearly
discernable association of higher social care staffing with well known centres
of deprivation. The failure to observe any rationale for staffing
multidisciplinary teams in older people‟s services has been reported
recently.(135) The finding that the social care composition was lower where
budgets were not pooled repeats the finding in the national survey that
where local authorities have sole responsibility for funding, social care
staffing is lower.
Higher integration scores were not explained by other integration related
variables such as co-location, closeness of working relationships with other

© Queen‟s Printer and Controller of HMSO 2011. . This work was produced by Huxley et al. under the terms of
a commissioning contract issued by the Secretary of State for Health. 140
Project 08/1619/114
team members. Instead it was related to not being in a CMHT, not being a
nurse, social worker or support worker, and with better management.
Better management emerged as an important predictor in four of the
models, and we discuss the significance of this later..
The new teams have a lower proportion of social care staff than CMHTs,
which means that the integration score may actually reflect greater uni-
disciplinarity rather than integration as defined in section 3.2.1. Autonomy
dropped out of the final model perhaps because of a close relationship
between it and management style.
A similar interpretation might be placed on the fact that support workers‟
integration ratings were higher where the social care component was
higher. It is important to note that less than one-third of the variance of the
integration variable was accounted for by the variables we entered into the
model. Either we need to consider alternative variables in an effort to
increase the proportion accounted for, or accept that the measure of
integration we used has some inherent unpredictability about it. There is a
sense in which the composition of the integration subscale, means that it is
more akin to a secure professional identity within the team, this would be
consistent with the univariate finding that professional group was not
associated with integration. The multivariate analysis suggested that the
„other‟ category of staff (the doctors, OTs and psychologists) do have
superior professional identity scores.
Professional group was also not associated with teamwork scores.
Confidence in one‟s role and flexibility in roles emerged as important
determinants of higher teamwork scores - which is understandable. Greater
social support may be a function of better management, and both may
contribute to the feeling of fewer job demands.
Integration was not related to perceptions about the Quality of Care
provided but teamwork and better management were. A higher proportion
of social care staff in the team was also associated with higher QOC scores,
which might have been due to the support worker scores for QOC being
higher as indicated by univariate analysis, rather than the social workers‟
perceived QOC scores, which were lower; nevertheless, initial regression
models confirmed that social worker scores were lower and also indicated
that support workers‟ scores were no different to the nurse reference group
when other factors were controlled for. This suggests that while culture
clashes may be taking place between different models of care, such as
medical and social, in fact this is a creative tension, and individual
contributions are actually valued, creating a „whole‟ that participants see as
leading to a better quality of care (arguably the original purpose of

© Queen‟s Printer and Controller of HMSO 2011. . This work was produced by Huxley et al. under the terms of
a commissioning contract issued by the Secretary of State for Health. 141
Project 08/1619/114
multidisciplinarity). Better teamwork and management also make a
contribution to the perceive QOC. In one recent study(135) the teams with
higher quality of care ratings also had higher service costs.
For job satisfaction the main observations to make are that the model itself
was somewhat flawed but supported by a similar, more robust logistic
regression model. Both models had face validity in that job satisfaction was
explained by fewer job demands, better management, closer working
relationships, less role overlap, more decision latitude and better training
opportunities. Co-location was also related to job satisfaction and that
better management also explained job satisfaction. The intention to leave
analysis was more robust but explained less than 40% of the variance.
Better training, being in a CMHT, having higher job satisfaction meant that
staff were less likely to leave. Social workers were more likely to want to
leave than other staff groups, as were support workers when social care
staff were in the minority. This might account for the new teams being more
likely to lose staff than CMHTs. The support workers have lower decision
latitude and less autonomy (the latter is also the case in another recent
report(135)) and are quite likely to want to leave to better themselves
(professionally or financially).(24) (Both social workers and social care staff
were more likely to leave community and intermediate care services for
older people.(135)
Finally, univariate analyses relating to inter-professional working
relationships and role overlap indicated that there were close working
relationship and some role overlap between ASW, other social worker, CPN
and support worker roles. Inter-professional working varied according to
location, being strongest in location C which is an integrated health and
social care Trust, and weakest in location A. ASWs appear to work most
closely and have most role overlap with a wider range of other staff groups.
These variables only entered the job satisfaction regression model, where
closer working and less role overlap with nurses appeared to have a positive
effect; close working with nurses was associated with job satisfaction in
more balanced teams.
5.3.1 Specific professional contributions or new ways of working?
The variability in team composition seen in the national survey was
confirmed in the staff survey (because the locations were selected to be
variable in their approach to the composition of team). New teams have an
even smaller social care contribution than CMHTs. There is an argument to
suggest that the new teams do not require the particular approach of social
work or social support to be part of the team. This is at odds with the
situation elsewhere in the world, for instance in relation to Assertive

© Queen‟s Printer and Controller of HMSO 2011. . This work was produced by Huxley et al. under the terms of
a commissioning contract issued by the Secretary of State for Health. 142
Project 08/1619/114
Outreach teams, which in the USA are made up of far more social workers
than nurses(13). A National Audit Office report(69) bemoaned the fact that
only half of CRHTTs had even a part-time Approved Social Worker.
There is of course, a long standing dilemma here, which is how best to
prepare the workforce for this kind of work. While the idea of core
competencies for community mental health practice underpins the New
Ways of Working in England(21) there are problems with the competency
approach adopted by the DH(21, 67, 166), which has focused on the
development of competencies and capabilities applicable to all mental
health professionals. These plans have paid scant attention to the criticisms
of the competency and capability models, which have no association with
patient outcomes(167, 168) but rather mechanistically fracture work
performance into „task‟ completion as opposed to the development of
„learning‟ that can be applied to new contexts.(169, 170) A significant body of
research suggests that the competency and capability model is in fact
characteristic only of „novice‟ practice, given that „expert practice‟ is
characterised not by the acquisition of de-contextualised competencies but
by experience that blends formal with tacit knowledge.(171-173) These UK
developments seem to share a common failing of capability frameworks,
which are rarely used to assess real performance in practice.(174) Finally,
there are considerable problems in competency based workforce planning
including the lack of data about the competencies of the existing workforce
and a lack of clarity about how to derive commissioning strategies from
competencies.(175)
The concept of a generic community mental health worker raises its head
every few years, but to date has not been explicitly mandated.(176) We take
this as a sign that organisational barriers and fundamental values, training
and orientation to the work are sufficiently different for multi-disciplinarity
to remain the cornerstone of community mental health care. This fact
seems to have been recognised in respect of the Approved Mental Health
Professional (AMHP), whose curriculum and training in England and Wales
remains under the control of local authority partnerships.
5.3.2 Higher social care composition is related to perceived quality of
care but not to WDQ integration
As the results of the staff survey suggest, however, the picture is more
complicated than that. In univariate analysis, integration scores are higher
where the social care component is lower. This is a similar finding to one in
our previous work.(14) In the multivariate analysis, however, the proportion
of social care staff made no contribution to the variance of integration.
Perceived Quality of Care is affected in the opposite way. In the multivariate
analysis, quality of care is associated with higher proportions of social care
staff in the team.

© Queen‟s Printer and Controller of HMSO 2011. . This work was produced by Huxley et al. under the terms of
a commissioning contract issued by the Secretary of State for Health. 143
Project 08/1619/114
5.3.3 High social care composition is associated with a lower intention
to leave the employer
A high social care component is associated with a lower intention to leave,
again suggesting that staff are more content when a balanced service is
working well. Conversely, those who are looking to leave the profession are
working in teams with a lower social care component. This runs counter to
the argument that when one staff group is in a minority, they feel more
valued by their colleagues. As social workers are the most likely to want to
leave this suggests that where they are in a distinct minority in the team
they are more likely to want to leave. Workers in new teams are more
likely to want to leave, not because they are younger, but perhaps due to
the nature of the work or the nature of their contracts; alternatively they
may be a more ambitious group, as demonstrated by their initiative in
terms of their original move to a new team. Since the new teams have
fewer social workers, it may be nurses and social support workers within
those teams who want to leave.
Some of the Karasek JCQ results rather go against this picture. First of all
psychological job demands are higher the more social workers and the more
ASWs there are in the team. This seems to suggest that social workers and
ASWs bring with them more complex cases (this is a finding from previous
research)(177) than is the norm in the team. In turn, the skills that the ASWs
bring may be a welcome addition in this context. Another result suggests
that support from colleagues and supervisors, is significantly lower where
there is a larger proportion of social care staff. This may simply be an
artefact of the less time available for support from senior staff, or the
division of professional from team supervision, which, when both forms are
operating, take up more time than combined supervision.
5.3.4 Management style is an important predictor
Management style emerged as a significant factor in four of the regression
models, team integration, teamwork, quality of care, and job satisfaction.
The fact that it did not enter into the intention to leave model could be
viewed positively, as an indication that whatever variables did contribute to
the intention to leave, management style was not one of them. The fact
that management style contributed to the regression models and was
related to greater social support, lower psychological job demands and
greater decision latitude are also positive findings. Greater decision latitude
implies greater autonomy. A number of previous studies have referred to
the way in which management in community teams is low key and unlike
the styles adopted in more structured environments. This produces relative
autonomy when it comes to professional decision making.(178) Teams
operate from multiple bases and locations, and perhaps come together once
a week (or less often) for a team meeting, and even less often for formal

© Queen‟s Printer and Controller of HMSO 2011. . This work was produced by Huxley et al. under the terms of
a commissioning contract issued by the Secretary of State for Health. 144
Project 08/1619/114
supervision. Team members spend a large amount of their time in service
users‟ homes and communities. In such a context management is:
“….not about the rational task of resource distribution or task planning,
but is about developing subjectivities which are self–governing and self
tasking in the team and in the field.” (179)(p68)
In the absence of formal support and guidance from their senior
colleagues (staff) have effectively become self-regulating so that
professionalism itself has become a disciplinary mechanism.” (180)(p79)
This lack of managerial direction and the encouragement of generic working
(and shared competencies), makes some team members more insistent on
separate professional identities, and, according to some researchers(181)
boundaries are actively encouraged by the experience of multi-disciplinary
working. This strikes at the heart of the issues in the present study. Has the
New Ways of Working agenda(74), inadvertently contributed to a renewed
sense of professional identification, and to greater levels of stress within
teams(182) by role blurring? Brown et al(182) argue (2002):
“The idea of health and social care staff working together with clearly
defined roles is often frowned upon as poor and retrogressive practice,
out of step with the government‟s modernisation agenda, but
increasingly blurred roles in already stressful and demanding clinical
teams can be counterproductive, with practitioners becoming
entrenched in their own perception of particular roles, and less flexible
in their work.” (p38)
Others have come to a rather different conclusion(183) suggesting that local
managers and team members tend to work together to promote
professionalism. It has been suggested that since the strategic culture of
management is about performance rather than the process by which
performance is achieved, this allows local managers to support practitioners
in their exercise of professional judgement. We found evidence that better
management scores were related to greater decision latitude.
Recently the argument against the temptation to modernise mental health
care by the creation of a generic mental health practitioners has been
reiterated.(175) The case is made for the unique role of the mental health
social worker, in challenging the emerging „bureau-medicalisation‟ of mental
health services resulting from the New Labour government‟s policy agenda.
Others(182) have suggested that well defined boundaries and clearly defined
roles can be „supportive and enabling‟. Over ten years ago, the argument
was made for role clarity and the recognition and management of
boundaries, rather than merging them.(184) It was suggested that the
challenge is for CMHT operational policies to resolve the tensions at the
service delivery level, by establishing: the teams aims, priorities, target

© Queen‟s Printer and Controller of HMSO 2011. . This work was produced by Huxley et al. under the terms of
a commissioning contract issued by the Secretary of State for Health. 145
Project 08/1619/114
client group and boundaries; team membership and the roles and
responsibilities of professional groups; eligibility criteria for access to
services; agreed client pathways to and from care; unified models of case
management and care coordination; standardised documentation;
compatible information technology systems; shared standards for the
exchange of information and the protection of client confidentiality;
agreement over the role of team leader; and agreed management and
accountability arrangements. On reflection then, another limitation of the
present study may be that we did not collect more detailed information on
these operational policies, which might have given a different perspective
on the extent of integration at the coal face.
5.4 Service user interviews
Aims: Does the composition or characteristics of the teams, relate in any
way to outcomes for service users? As one referee of the original proposal
pointed out, without an understanding of whether the structure and the
processes make a difference to outcomes, the exercise would be far less
worthwhile and fail to address a key issue. We therefore need to interview
service users, using standardised instruments to see if the differences in
structure and process can be identified at the outcome stage. Service user
researchers conducted the interviews in two of the locations.
As this Phase was not in the original proposal, the resources that could be
devoted to it were less than ideal resulting in any quantitative analysis
being underpowered. The results cannot be considered as robust, but rather
as indicative findings. A larger better powered study is required.
As we did not have any clinical details about the service users, we cannot
be certain that their diagnoses, length of illness or severity were the same
in both locations. The fact that they match the age profile and gender
profile and were all on the current caseload of a CMHT professional, means
that they are broadly comparable in these terms. Also the profile of their
MANSA and CUES scores are similar to results from elsewhere(142, 143) and
they were not significantly different in terms of their length of contact with
the team.
Results in location D for satisfaction with their own mental health could be a
reflection of greater clinical severity, or persons at an earlier stage of care
and treatment than in A. The results for not working and for leisure indicate
that service users may have needs in these areas that are not being met, or
could reflect the fact that more people are being encouraged to want to
improve these matters, than in A. The proportion wanting to improve their

© Queen‟s Printer and Controller of HMSO 2011. . This work was produced by Huxley et al. under the terms of
a commissioning contract issued by the Secretary of State for Health. 146
Project 08/1619/114
work situation was significantly greater according to that MANSA item
(Table 22).
The MANSA results are broadly consistent with the CUES results in that the
satisfaction levels with mental health and leisure and not working are all
low, and friends, safety and living accommodation are higher, approaching
NPMS levels.
On the CUES, there are significantly better results for the present sample,
compared to the national data, on all items except satisfaction with access,
medication, access to physical health services and relationships with
physical health workers. All these results are similar to those of
Blenkiron‟s(142) responses against the normative statement. As indicated
earlier a great deal of attention has been focused on user choice, improved
access and greater involvement in care over recent years, and these results
suggest that this effort is having some impact.
It was unfortunate that none of the City teams in location D responded to
the WDQ survey, because this means that the A:D comparison is in effect
an urban /rural comparison as well as a team culture/climate comparison.
As a consequence some of the findings result more directly from the
accessibility issues in rural areas rather than the way that services are
delivered and organised. Having said that, the difficulty of access to
services out of hours, which was a frequent complaint in D, could have been
due to the way that this service was delivered. Also, D teams, despite the
rural location, saw their service users more often, and everyone had been
seen within the last four months. The aspects of the rural services that may
have influenced the differences between A and D include the restriction on
contacts with family members. The differences in the stigma experiences of
the A and D users might also be because stigma may be less prevalent in
closer, smaller communities. Certainly, the examples given of the stigma
experiences in D came from contacts with the workers, whereas, on the
whole, in A, stigma experiences seemed to relate more to the general
public. A‟s user experience of stigma and their dissatisfaction with it is at
the same level as that in Lelliot‟s study (143) of ten years ago.
In both locations, relationships with the workers were, nevertheless,
reported to be very positive, a common finding in research of this kind.(185,
186) Higher ratings on the WDQ teamwork subscale did not differ by team,
but were related to the service user ratings of available choice. Available
choice and satisfaction with choice were both related to the overall job
satisfaction of the workers. The integration subscale of the WDQ, which
asks about access to peer support and formal management support from
members of their own profession, and professional isolation, was unrelated

© Queen‟s Printer and Controller of HMSO 2011. . This work was produced by Huxley et al. under the terms of
a commissioning contract issued by the Secretary of State for Health. 147
Project 08/1619/114
to all the user experience data, suggesting that it is unobservable to the
services users compared to other aspects of team culture and climate.
Given the nature of the integration items this is not surprising, although one
might argue that professional isolation might restrict professional
development through the broadening of horizons, which might then have a
negative impact on the user experience.
The only finding that reflected negatively on these locations when compared
to the national figure, although not significantly so, was satisfaction with
current medication. In clinical terms, this may be an issue that requires
further investigation.
The small sample size along with multiple testing, require that these
findings be treated with extreme caution. In addition, as there was more
than one respondent per team in many cases, service user data, like
staffing data are also nested within teams and locations, but the numbers
are insufficient to be able to control for this, or to aggregate responses to
the team level.
Nevertheless, the results suggest that the relationship between team
culture and climate and service user satisfaction, ought to be demonstrable
in a larger sample. Given the difficulties we have experienced in obtaining
service user level data, such a study would have to have engaged with
services at the pre-funding development stage, in order to achieve the
complete support of the agencies involved, at all levels. Even then, there is
a threat to successful completion posed by front-line workers who may be
less enthused by or committed to the research, have inadequate time
available to participate in the study and who may also be protective of their
service users, and so act as a gatekeeper to their participation. There may
be a case for seeking funding from the Research for Patient Benefit
programme for a much larger and better powered study, (but these funds
are not open to researchers in Wales). We note that the DH has funded
such a study in England, under the SDO programme (187) which has
ambitious targets, which if met, would give the study more power than the
present study has achieved, but as we have indicated several times,
gathering these data presents considerable challenges.
5.4.1 A more integrated service was less popular with service users
The theme of integration continues in the service user interviews, where the
more integrated service according to the results of the national and staff
surveys is less popular with the service users, who made significantly more
negative remarks about it. It is important to recognise the potential here for
sampling bias to be operating; Users from the two chosen locations had
significantly different stigma ratings on both sections of the CUES

© Queen‟s Printer and Controller of HMSO 2011. . This work was produced by Huxley et al. under the terms of
a commissioning contract issued by the Secretary of State for Health. 148
Project 08/1619/114
(normative and satisfaction ratings). Interestingly, the bulk of the negative
comments in the integrated service concerned aspects of the service or its
workers. While this did happen in the less integrated service as well, the
majority of these remarks concerned stigma experienced at the hands of
the general public. Previous research has shown that while team members
believe that they work towards the reduction of stigma for their service
users, this represents a rather passive view of the service users. In reality,
it was found that service users actively challenged discrimination
themselves when they experienced it.(182)
5.4.2 Quality of life outcomes were not different, but there were
relationships between CUES variables and WDQ subscales (but not
the integration subscale)
The outcome in terms of quality of life, as assessed by the MANSA did not
differ, except in respect of relationships with family and family contacts.
This may be to do with the rural nature of the more integrated service.
Basically, integration appears to have nothing to do with the quality of life
of the service user, nor does it bear any relation to the other outcome
measures of service satisfaction and CUES. Other factors, such as
teamwork, training and quality of care do relate to the CUES in meaningful
ways. They suggest that well trained workers who can develop a good
relationship with the service user are highly valued, and that users can
recognise people who listen to and understand them, and who are
knowledgeable and competent. This finding is in accordance with our earlier
findings in relation to support time and recovery workers(24) and with the
views of others(186) who argue that a high quality and stable relationship is
the key to effective care, and not the professional background or individual
skills of the worker.
“Anyone who has cared for someone with schizophrenia in the real
world knows that what works best is a stable relationship with an
understanding, patient and skilled person who stays with the patient,
and their illness, over time, through thick and thin. Just how to achieve
this in a culture hell bent on atomisation requires careful thought”
(p97).

© Queen‟s Printer and Controller of HMSO 2011. . This work was produced by Huxley et al. under the terms of
a commissioning contract issued by the Secretary of State for Health. 149
Project 08/1619/114
5.5 How these results fit with previous research
In this study we have confined ourselves to integration in the mental health
context; however, the results can usefully be located in a wider context.
Minford(188) conducted an international review of the health and social care
boundaries in services for older people and mental health services. His
conclusions are broadly in line with the general thrust of the present study.
For instance:
“A broad strategy for integrated care should ensure that: care is
person-centre and family-centred, with multidisciplinary needs
assessment; accessible and adapted housing is available; there are
transparent and flexible funding streams; care is provided by properly
trained staff; people are assertively followed up and monitored with a
focus on outcomes.” (p3)
Anticipating the debate between integration and personalisation Minford(188)
argues that:
“With increasingly complex service delivery mechanisms, good
outcomes are associated with making services revolve around people,
not the other way round. Holistic care is likely to be both more efficient
and more effective, consuming fewer total resources for a given output
as well as yielding a better outcome for given inputs.” (p5)
He concludes that much of the international evidence suggests that
multidisciplinary teams are worthwhile, in part because multidisciplinary
assessment helps to identify all the client‟s needs at the outset and
therefore avoids time-consuming and costly problems arising either from
undetected and unexpected complexity at a later stage or interagency
referral processes. He acknowledges that multidisciplinary teams are hard
to run given the different professional cultures. Finally, he suggests that
that the era of 'vertical' care delivery systems may be waning.
Organisations which deliver care 'in one place' with vertical 'chains of
command', e.g. hospitals and social services departments, have led to large
health and welfare gains, but these hierarchical organisations may have
reached a natural limit in delivering better care. He argues that horizontal'
forms of care delivery are better at providing integrated care. Examples of
such models include: one-stop advice centres in Germany, 'Community
Options' programs in the USA, coordinated care agencies, home and
community care programmes in Australia and multidisciplinary mental
health care in New Zealand. Recognising the challenges in implementing
„horizontal‟ care he lists the hurdles to be overcome:
“…the steep learning curve associated with fund pooling; the challenges
of multidisciplinary team working; the difficulty of accurately targeting

© Queen‟s Printer and Controller of HMSO 2011. . This work was produced by Huxley et al. under the terms of
a commissioning contract issued by the Secretary of State for Health. 150
Project 08/1619/114
home health care on those who would otherwise be institutionalised
and the shortage of unpaid carers and respite facilities.” (p6)
“Ultimately, without a single funding source for chronic care, it will be
hard to deliver truly integrated care. Countries with systems of social
insurance and the Scandinavian countries with comprehensive public
health and social care systems get closest (but not very close) to
unitary funding. However, even in these countries there are still
significant operational boundaries between agencies at local level.” (p4)
5.5.1 Organisational integration
There is little systematic or conclusive evidence available about the benefits
of service integration. Almost twenty years ago, a review of organisational
integration in respect of older people (189) identified „surprisingly few‟
empirical studies. It concluded that instead of empirically based reports, the
literature is “largely comprised of polemics, which essentially restate long-
standing positions on the preferred handling of integration.” About ten
years ago, national demonstration projects for people with serious mental
health problems in the USA (190) produced evidence for service system
change and improvement but little consistent evidence for improved client-
level outcomes. About the same time Provan (191) found that integrated
services were not as productive as single provider organizations; in contrast
to the generally held wisdom that "more integration is better," he found
that high integration among provider agencies does not result in more
favorable outcomes, but that service integration is most effective when
coordinated through a single core provider.
Also ten years ago a literature review of integration within health care
involving the organisational merger of acute and community services in the
UK(192) found that combined trusts were no more likely to provide integrated
acute and community services than separate trusts. They were no more
likely to provide formally or informally integrated services or better quality
patient care in terms of arrangements for discharge and continuity of care.
Separate acute and community trusts experienced greater problems than
combined trusts in planning and developing continuity of care across the
interface between health care and social services. These findings are
consistent with work in the Netherlands(193), which suggested that while the
common assumption that the feasibility of integrated care provision is
caused by characteristics of the legislation, the financing system and other
aspects of the institutional context, these characteristics are not decisive. In
contrast, the conclusion of this work was that the commitment of the actors
involved, their support and the way developments are managed, make the
difference to outcome.

© Queen‟s Printer and Controller of HMSO 2011. . This work was produced by Huxley et al. under the terms of
a commissioning contract issued by the Secretary of State for Health. 151
Project 08/1619/114
5.5.2 Team level integration
The evidence for service integration at this level is also conflicting,
producing different perceptions between staff and user groups. Two studies
used a naturalistic successive measures design in which community mental
health staff completed a questionnaire on three occasions during the
integration process. In the first study(194) the integration of acute inpatient
and continuing care services resulted in changes to service process and
outcome, which were judged by staff to be beneficial, especially with
respect to continuity of patient care. The second study(195) showed that
there was a negative impact on mental health service users, during the
process of integration of two service teams, and that while this was
reversed after integration, the previous levels of individual performance
were not achieved within a further nine months.
5.5.3 Multidisciplinary integration
Integrated care pathways (ICPs) are structured multidisciplinary care plans
that detail essential steps in the care of patients with a specific clinical
problem.(196) Designed to encourage the translation of national guidelines
into local protocols and subsequently into clinical practice, they are often
used where people have overlapping health and social care needs.(197)
Jones(198, 199) has described their use in the mental health field where he
found that there were some conceptual and implementation problems,
particularly in pre-formulating the work of different disciplines into a care
pathway sequence. Nevertheless, a study of integrated case and care
management for older people in Italy(200) found results similar to the early
PSSRU community care experiments in the UK, suggesting that integrated
care may be a cost-effective approach to the reduction of hospital
admissions and functional decline in community residents. A similar
conclusion was reached in a review of stroke care.(201) Others have
described the potential for ICP in the NHS (202) and with reference to clinical
governance.(203) In one of the few empirical studies of ICP(197) (for people
with Parkinson‟s disease) „disturbingly few‟ community care assessments
were being carried out and low levels of provision existed in some key
community support services, despite high levels of need. The authors
attribute these problems to weaknesses in joint working and inter-
professional communication. They recommended instead, the resourcing
and supporting of individual service users / carers in the management of
their own care pathways.
This brings us neatly to the present preoccupation with personalization, and
the hopes of the Darzi review(23) and New Horizons(1) that care may be
improved through this means. One could argue that, given the failure of
integration both conceptually and empirically to demonstrate a convincing
© Queen‟s Printer and Controller of HMSO 2011. . This work was produced by Huxley et al. under the terms of
a commissioning contract issued by the Secretary of State for Health. 152
Project 08/1619/114
relationship with patient outcome, it is perhaps time to abandon it to
rhetorical status and concentrate instead on what works for the individual
users, family members and team workers. Whatever the future holds for the
idea of integration, researchers, policymakers and practitioners need to
provide a clear idea of exactly what it is that is being integrated. Also, we
should not allow the term „health and social care‟ to be used without greater
specificity about what exactly is meant by the „social care‟ element in any
specific context.
Organisational culture is said to include the following items that are
shared(204) (in this case within the team): beliefs, values, attitudes, norms
of behaviour, routines, traditions, ceremonies, rewards, meanings,
narratives and sense-making. One can see that where workers come from
essentially different cultures that a clash of cultures is more likely to occur.
The evidence suggests that there are significant points of divergence in the
ideology and work of the professions of nursing and social work, for
instance.(184) The results of our multivariate analysis, however, suggest that
this mix may be a creative rather than a comfortable one, resulting in a
higher perceived quality of care. This finding is consistent with a positive
view of the outcome of inter-professional working(205), which is in contrast to
the often reported barriers to working caused by different professional
backgrounds.(206, 207)
Whether the creative mix translates into outcomes for the service users
cannot be answered definitively by the present study, but the indications
are that it probably does, and the qualitative data provides a little support
for this proposition. If multidisciplinary community teams were impaired by
this meeting of cultures then one might have expected them to have a
much shorter shelf life, and the literature we reviewed earlier confirms that
in mental health and other services there are advantages to
multidisciplinary team-working. Disappointingly, from the social care
perspective is the fact that while the social care contribution has been
maintained in CMHTs, CMHTs themselves are now less well resourced and
the new teams are well resourced but less multidisciplinary. To engage with
and implement government policy aspirations will require the organisation
of community mental health services to be revisited as it appears not to be
fit for that particular purpose.
More than 95% of CMHTS in England now describe themselves as fully
integrated(64) by which they mean, integrated in the limited sense of social
workers being employed by the mental health Trust in some form, or are
working in joint and often co-located teams. In one sense, therefore, there
is no longer any variance in the concept of integration when used in this
loose way; its meaning and usefulness could be said to be diminished as a
consequence.

© Queen‟s Printer and Controller of HMSO 2011. . This work was produced by Huxley et al. under the terms of
a commissioning contract issued by the Secretary of State for Health. 153
Project 08/1619/114
Lower social care composition leads to a better integration score, which is
counterintuitive. Close working relationships between CPNs, ASWs and
other social workers (and all nurses and all social workers) is unrelated to
the integration score. What if the integration subscale is really a measure
of secure professional group identity? (This may be the case given the
nature of the three items that make up the integration subscale). Then the
lower social care leading to a higher integration score makes more sense.
If location D is characterised as more integrated than location A then this
could be interpreted as location A staff having a more secure professional
group identity (more of them are nurses). The same result applies to
support workers whose integration scores are higher when they are in
teams with larger social care composition. In these teams the social care
staff have a more secure professional group identity.
Better integration scores are associated with the new teams, but again this
is counterintuitive as they are dominated by nurses. If the WDQ integration
subscale is really an indicator of a secure professional group identity, then
again it makes intuitive sense that the new teams should have higher
scores.
Better integration scores are associated with not being a nurse, social
worker or support worker, in other words being a member of one of the
clearly identifiable professions of psychiatrist, psychologist or occupational
therapist.
Job satisfaction is related to having less overlap with the role of nurses. This
is not a diatribe against nurses, whose presence in the teams is essential,
(albeit driven more by supply factors than need), but it does suggest that
weakening the professional group identity of any of the team members may
be counterproductive, and that New Ways of Working may be contributing
to a loss of identity especially for the two groups making up the bulk of the
CMHT workforce, nurses and social workers.
If location D can be characterised as integrated, with a high level of support
workers, and more close working than location A (see the radar charts for A
and D (more close working with support workers and psychologists), then
this is not as popular with the service users, as in the service provided by
the less integrated location A. Thus a secure professional identity, combined
with a good relationship with the service user produces a more positive
response from the service users in location A. Integration may be invisible

© Queen‟s Printer and Controller of HMSO 2011. . This work was produced by Huxley et al. under the terms of
a commissioning contract issued by the Secretary of State for Health. 154
Project 08/1619/114
to the service user, who thinks more in terms of key relationships with
different workers.
Finally, the results of research into the outcomes of the new teams suggest
that they are positive and better than the traditional CMHT outcomes. These
teams have even fewer social care staff in them, so one might conclude that
these outcomes have been produced by staff with a secure professional
identity, and without, on the whole, much social care input; therefore a
social care component is not necessary to achieve improved outcomes.
Alternatively, where there are few actual social care staff, someone, in most
cases nurses, must be undertaking social care tasks with service users
(such as we observed in free text responses to the staff survey in location
A) that would otherwise be undertaken by social care staff. So, one might
conclude, again, that the social care composition of the team is immaterial
to the delivery of what the service user needs, so long as someone is skilled
in assessing and providing appropriate help for social problems and can
produce equivalent outcomes. We have seen in previous work(56) however,
that social workers make more accurate assessment of complex social
needs, than nurses.
In addition, there is an emerging sense that the outcomes that the new
teams improve on may not always be related to the social outcomes valued
by service users(56, 165) but are more often clinical in nature (admission
rates(47, 82) community tenure rates, symptom levels etc.(48)). Whether this
means that social care needs are not being assessed and addressed
appropriately (something hinted at in the service users free text responses)
cannot be determined by the present study. New Ways of Working could be
said to be attempting to address this issue by bringing everyone to the
same level of competence in these areas, including assessment(208),
however the approach continues to rely on examples of good practice rather
than a firm evidence base, and as indicated earlier may be based on a
flawed approach. More research is needed to see if the models advocated
really do produce an improved quality of work experience for workers and
improved quality of care and quality of life for service users.
© Queen‟s Printer and Controller of HMSO 2011. . This work was produced by Huxley et al. under the terms of
a commissioning contract issued by the Secretary of State for Health. 155
Project 08/1619/114
6 Conclusions and recommendations
The national survey of mental health service managers confirmed
previous research and opinion, that there is a need to improve workforce planning by developing links between supply and demand factors and
financial resources
The national survey of mental health service managers confirmed that the social care component of community teams is extremely variable and determined more by supply and historical factors than need. Therefore,
the social care component of community mental health teams needs to be reconsidered especially in the light of the recent changes in the policy
agenda. Most recent policy guidance is the driving factor for planned changes to teams, and none of this guidance refers to compositional factors.
The multivariate analysis suggested that a strong social care component in
teams seems to be related to reported better quality of care. Multi-disciplinary inter-professional care which has been seen as a barrier to
integration may be a more creative force than previously supposed and should be the subject of further research
The multivariate analysis suggested that integration scores contributed
very little to the models of job satisfaction and intention to leave. There was no relationship between this measure of integration and service user
experience, but this part of the study was underpowered to discover such a relationship.
The concept of integration needs specific explication in every context in which it is used, and its value as a useful concept in health and social care
delivery may need to be reappraised.
The survey of teams showed that social workers were in short supply in
some teams, and entirely absent from some. As they were also shown to
be the most likely to want to leave urgent attention needs to be paid to the supply of social workers for work in adult mental health services
The survey of workers used two particular measures and there is scope for
further research to use other measures to assess the nature of the culture and climate difference between teams, and their causes
The interviews with service users used standardized measures of quality of
life and user experience. There was no relationship between the culture

© Queen‟s Printer and Controller of HMSO 2011. . This work was produced by Huxley et al. under the terms of
a commissioning contract issued by the Secretary of State for Health. 156
Project 08/1619/114
and climate measure and the quality of life measure (but this part of the study was underpowered). In future research new user determined
outcome measures could usefully be added to attempt to capture the effects of team differences and different working practices and operational policies on larger samples of service users.
The knowledge base in relation to culture and climate is a growing one, as
is the development of methods to capture the user experience, and these
can be usefully linked in future research. The knowledge base in relation to
social work and social support workers is also growing, but there are
widely acknowledged research capacity problems (both in the availability
of dedicated research funding and in a research skilled workforce) that
mean that the pace of development is not rapid. Further investment in
social work and social care research ought to be a priority given the
changing policy agenda in mental health in both England and Wales.
More research is needed to see if the models advocated really do produce
an improved quality of work experience for workers and improved quality
of care and quality of life for service users.

© Queen‟s Printer and Controller of HMSO 2011. . This work was produced by Huxley et al. under the terms of
a commissioning contract issued by the Secretary of State for Health. 157
Project 08/1619/114
References
1. New Horizons. Department of Health. 2009 [cited 21 July 2009];
Available from: http://www.dh.gov.uk/en/Healthcare/Mentalhealth/NewHorizons/index.htm
2. Care Services Improvement Partnership (CSIP). Combined Mapping Framework; 2009 21/07/09.
3. World Health Organisation. Health Workers for All and All For Health Workers: The Kampala Declaration and Agenda for Global Action. 2008 [cited
17 March 2010]; Available from: http://www.who.int/workforcealliance/Kampala%20Decleration%20and%20Agen
da%20web%20file.%20FINAL.pdf
4. Hoge MA, Morris JA, Stuart GW. A National Action Plan for Workforce
Development in Behavioural Health. Psychiatric Services. 2009;60(7):883-37.
5. Baldwin LM, Patanian MM, Larson EH. Modelling the Mental Health
Workforce in Washington State: Using State Licensing Data to Examine Provider Supply in Rural and Urban Areas. Journal of Rural Health. 2006;22(1):50-8.
6. Draper B, Reutens S, Sabau D. Workforce and Advanced Training Survey of the RANZCP Faculty of Psychiatry of Old Age: Issues and Challenges for the
Field. Australasian Psychiatry. 2010;Jan 27 (e publication ahead of print).
7. Withy K, Andaya J, Vitousek S. HawaiI's Island Health Workforce
Assessment 2008. Hawaii Medical Journal. 2009;68(11):268-72.
8. Happell B. Putting all the Pieces Together: Exploring Workforce Issues in
Mental Health Nursing. Contemporary Nurse. 2008;29(1):43-52.
9. World Health Organisation/Organisation for Economic Co-operation and Development. Country Case Study Summaries: WHO/OECD - Hosted Dialogue on
Migration and Other Health Workforce Issues in a Global Economy; 2008.
10. Dal Poz MR, Gupta N, Quain E. Handbook on Monitoring and Evaluation of
Human Resources for Health with Special Applications for Low and Middle Income Countries.: Nonserial Publication: World Health Organisation; 2009.
11. HRH Action Framework. World Health Organisation/Global Health Workforce Alliance; 2009.
12. Buchan J. Nurse Workforce Planning in the UK: A Report for the Royal
College of Nursing. London: Royal College of Nursing; 2007.
13. Beinecke R, Huxley PJ. Mental Health Social Work and Nursing in the USA
and the UK: Divergent Paths Coming Together? International Journal of Social Psychiatry 2009;55:214-25.
14. Evans S, Huxley P, Gately C. Mental Health, Burnout and Job Satisfaction
Among Mental Health Social Workers in England and Wales. British Journal of
Psychiatry. 2006;188(1):75-80.
15. Boardman J, Parsonage M. Delivering the Government's Mental Health
Policies, Services, Staffing and Costs. London: The Sainsbury Centre for Mental Health; 2007.

© Queen‟s Printer and Controller of HMSO 2011. . This work was produced by Huxley et al. under the terms of
a commissioning contract issued by the Secretary of State for Health. 158
Project 08/1619/114
16. White E, Brooker C. The Fourth Quinquennial National Community Mental
Health Nursing Census of England and Wales. International Journal of Nursing
Studies. 2001;38(1):61-70.
17. Department of Health. The National Service Framework for Mental Health -
Five Years On. London: Department of Health; 2004.
18. Department of Health. From Values to Action: The Chief Nursing Officer's
Review of Mental Health Nursing. London: Department of Health; 2006.
19. Commission for Healthcare Audit and Inspection (CHAI) No Voice, No
Choice: A Joint Review of Adult Community Mental Health Services in England. London: Commission for Healthcare Audit and Inspection; 2007.
20. Report into Workforce Planning (HC171-1). House of Commons Health
Select Committee; 2007.
21. Department of Health. Guidance on New Ways of Working in a
Multidisciplinary and Multiagency Context, Interim Report, National Steering Group. London:Department of Health; 2004.
22. Workforce Review Team (WRT). Assessment of Workforce Priorities. 2009/10. Available from: http://www/wrt.nhs.uk/indec.php/publications/89-
assessment-of-workforce-priorities-2009. (Accessed 9 February 2010)
23. Darzi A. High Quality Care for All: NHS Next Stage Review Final Report.
London: Department of Health; 2008.
24. Huxley PJ, Evans S, Beresford P, Davidson B, King S. The Principles and
Provisions of Relationships: Findings from an Evaluation of Support, Time and Recovery Workers in England. Journal of Social Work. 2009;9(1):99-117.
25. Dunning J. New Horizons: A Signpost Towards a Healthier Future.
Community Care; 2009.
26. Imison C, Buchan J, Xavier S. NHS Workforce Planning: Limitations and
Possibilities. London: Kings Fund; 2009.
27. Department of Health. Commissioning for Quality and Innovation (CQUIN)
Payment Framework. London: Department of Health; 2008.
28. Department of Health. The World Class Commissioning Programme - an
Introduction. London: Department of Health; 2009.
29. Care Services Improvement Partnership. The Outcome Framework for
Mental Health Day Services: A Common Purpose: Recovery in Future Mental
Health Services. London: Care Service Improvement Partnership; 2007.
30. National Social Inclusion Programme. Outcomes Framework for Mental
Health Services [Online] Available from: http://www.socialinclusion.org.uk/publications/Broadened_Social_Inclusion_Outc
omes_Framework.pdf . (Accessed 25 May 2010)
31. Fulfilled Lives, Supportive Communities: A Summary of Improving
Services in Wales 2008-2018. Welsh Assembly Government; 2007.
32. Making the Connections: Delivery Better Services for Wales. Welsh
Assembly Government; 2004.

© Queen‟s Printer and Controller of HMSO 2011. . This work was produced by Huxley et al. under the terms of
a commissioning contract issued by the Secretary of State for Health. 159
Project 08/1619/114
33. Designed for Life - A World Class Health Service for Wales. Welsh
Assembly Government; 2005.
34. Wanless D. The Review of Health and Social Care in Wales. Welsh Assembly Government; 2003.
35. Better Outcomes for Tougher Times. Welsh Assembly Government; 2009.
36. Putting People First; Beyond Boundaries Citizen-Centred Local Services for Wales. Welsh Assembly Government; 2006.
37. Fotaki M, Roland M, Boyd A, McDonald R, Scheaff R, Smith L. What Benefits Will Choice Bring to Patients? Literature Review and Assessment of
Implications. Journal of Health Services Research & Policy. 2008;13(3):178-84.
38. One Wales: A Progressive Agenda for the Government of Wales. An
Agreement between the Labour and Plaid Cymru Groups in the National Assembly: Welsh Assembly Government; 2007.
39. Adult Mental Health Services. Stronger in Partnership 2: Improving Service
Users and Carers in the Design, Planning, Delivery and Evaluation of Mental health and Services in Wales. Welsh Assembly Government; 2008.
40. Wales Alliance for Citizen directed support. Empowered Lives, Supportive
Communities. Working in Partnership with in Control. [Online] Available from http://wacds.org.uk/our-principles/. [Accessed 25 May 2010]
41. Mental Health Trusts Community Mental Health Service User Survey.
London: Healthcare Commission; 2006.
42. Goodwin N, Lawton-Smith S. Integrating Care for People with Mental
Illness: The Care Programme Approach in England and it's Implications for Long-Term Conditions Management. International Journal of Integrated Care.
2010;10:1-10.
43. Gilbody SM, House AO, Sheldon TA. Outcome Measurement in Psychiatry:
A Critical Review of Outcomes Measurement in Psychiatric Research and Practice: Centre for Reviews and Dissemination; 2003.
44. Perry A, Gilbody S. User-Defined Outcomes in Mental Health: A Qualitative Study and Consensus Development Exercise. Journal of Mental Health.
2009;18(5):415-23.
45. Ovretveit J. Organising Multidisciplinary Community Teams. Middlesex:
BIOSS Brunel University; 1986.
46. Ovretveit J. Coordinating Comminity care. Milton Keynes: Open University
Press; 1993.
47. Burns T, LLoyd H. Is a Team Approach Based on Staff Meetings Cost-
Effective in the Delivery of Mental Health Care? Current Opinion in Psychiatry.
2004;17:311-4.
48. Franx G, Kroon H, Grimshaw J. Organizational Change to Transfer
Knowledge and Improve Qaulity and Outcomes of Care for Patients with Severe Mental Illness: A Systematic Overview of Reviews. Canadian Journal of Psychiatry (Revue Canadienne de Psychiatrie). 2008;53:294-305.

© Queen‟s Printer and Controller of HMSO 2011. . This work was produced by Huxley et al. under the terms of
a commissioning contract issued by the Secretary of State for Health. 160
Project 08/1619/114
49. Borrill C, Carletta JC, Carter A. Team Working and Effectiveness in Health
Care: Findings from the Health Care Team Effectiveness Project: Aston
University: Aston Centre for Health Service Organisation Research; 2001.
50. Field R, West M. Teamwork in Primary Health Care: Perspectives from
Practices. Journal of Interprofessional Care. 1995;9(2):123-30.
51. Cashman S, Reidy P, Cody K. Developing and Measuring Progress Toward
Collaborative, Intergrated, Interdisciplinary Health Care Teams. Journal of Interprofessional Care. 2004;8(2):183-96.
52. Carpenter J, Schneider J, Brandon T. Working in Multidisciplinary Community Mental Health Teams: The Impact on Social Workers and Health
Professionals of Intergrated Mental Health Care. British Journal of Social Work. 2003;33(8):1081-103.
53. Onyett S, Heppleston T. A National Survey of Community Mental Health Teams. Teams Structure and Process. Journal of Mental Health. 1994;3(2):175-
94.
54. Steinert T, Lepping P, Baranyai R. Compulsory Admission and Treatment in
Schizophrenia: A Study of Ethical Attitudes in Four European Countries. Social Psychiatry and Psychiatric Epidemiology. 2005;40:635-41.
55. Pinfold V, Rowe A, Hatfield B. Lines of Resistance: Exploring Professional's
Views of Compulsory Community Supervision. Journal of Mental Health. 2002;11:177-90.
56. Cestari L, Munroe M, Evans S. Fair Access to Care Services (FACS):
Implementation in the Mental Health Context. Health and Social Care in the Community. 2006;14(6):474-81.
57. Fourth National Mental Health Plan. An Agenda for Collaborative
Government Action in Mental Health 2009-2014. Commonwealth of Australia; 2009.
58. Mental Health Commission (Ireland). Multidisciplinary Team Working:
From Theory to Practice. Dublin: Mental Health Commission; 2006.
59. Byrne M, Onyett SR. Teamwork Within Mental Health Services in Ireland - Resource Paper. Dublin: Mental Health Commission 2010.
60. Asia-Australia Mental Health (AAMH). Asia-Pacific Community Mental Health Development Project: Summary Report. Melbourne: The University of
Melbourne and St Vincent's Health; 2008.
61. Falk K, Allebeck P. Implementing Assertive Community Care for Patients
with Schizophrenia: A Case Study of Co-operation and Collaboration Between Mental Health Care and Social Services. Scandanavian Journal of Caring
Sciences. 2002;16:280-6.
62. Jenkins R, Lancashire S, McDaid D. Mental Health Reform in the Russian
Federation: An Integrated Approach to Achieve Social Inclusion and Recovery Bulletin of the World Health Organisation. 2007;85(11):858-66.
63. Carter MF, Evans KE, Crosby C. The All-wales Community Mental Health
Team Survey 1997. Bangor: University of Wales Bangor; 1997.

© Queen‟s Printer and Controller of HMSO 2011. . This work was produced by Huxley et al. under the terms of
a commissioning contract issued by the Secretary of State for Health. 161
Project 08/1619/114
64. Browne S, Magar B, Sheppard N. Is There a Relationship Between the
Structure of Irish Psychiatry Multidiciplinary Teams and Patient Outcome. Irish
Medical Journal. 2004;97(7):206-7.
65. Snooks H, Peconi J, Porteret A. An Overview of the Evidence Concerning
the Effectiveness of Services Delivered Jointly by Health and Social Care Providers and Related Workforce Issues. Swansea: AWARD Review for Wales
Office for Research and Development; 2006.
66. Department of . The National Service Framework for Mental Health.
London: Department of Health; 1999.
67. Department of Health. The NHS Plan: A Plan for Investment, A Plan for
Reform. Cm 4818-I. London: Department of Health; 2000.
68. Hannigan B. Mental Health Services in Transition: Examining Community
Crisis Resolution and Home Treatment Care: Research Capacity Building Collaboration for Wales Nursing and Allied Health Professionals (rcbwales); 2009.
69. National Audit Office. Helping People Through Mental Health Crisis: The
Role of Crisis Resolution and Home Treatment Services. London: The Stationary Office; HC 5 Session 2007-2008.
70. Jones R, Robinson B. A National Survey of Crisis Resolution Home
Treatment Teams in Wales. 2008.
71. Wales Audit Office. Adult Mental Health Services in Wales: A Baseline Review of Service Provision. Wales Audit Office; 2005.
72. Onyett SR, Linde K, Glover G, Floyd S, Bradley S, Middleton H. Implementation of Crisis Resolution Home Treatment Teams in England: Findings
of a National Survey 2005-2006. Psychiatric Bulletin. 2008;32:374-7.
73. Ray M, Pugh R. SCIE Research Briefing 26: Mental Health and Social Work.
Social Care Institute for Excellence; 2008.
74. Department of Health. New Ways of Working for Everyone: Developing
and Sustaining a Capable and Flexible Workforce. London: Department of Health;
2007.
75. Department of Health. Creating Capable Teams Approach (CCTA): Best
Practice Guidance to Support the Implementation of New Ways of Working (NWW) and New Roles. London: Department of Health; 2007.
76. Mental Health Policy Implementation Guide. Support, Time and Recovery
(STR) Workers. Learning from the National Implementation Programme. London:
Department of Health; 2007.
77. NIMHE. Mental Health Act 2007: New Roles. Guidance for Approving
Authorities and Employers on Approved Mental Health Professionals and Approved Clinicians. London: National Institute for Mental Health in England;
2008.
78. Foster J. Where are we going? The Social Work Contribution to Mental
Health Services. London: Special Perspectives Network; 2005.

© Queen‟s Printer and Controller of HMSO 2011. . This work was produced by Huxley et al. under the terms of
a commissioning contract issued by the Secretary of State for Health. 162
Project 08/1619/114
79. National Institute for Mental Health in England. The Social Work
Contribution to Mental Health Services: The Future Direction: A Discussion Paper.
Leeds: National Institute for Mental Health in England; 2005.
80. Department of Health and Care Services Improvement Partnership.
Improving access to psychological therapies (IAPT). Department of Health; 2008.
81. Huxley PJ. New Horizons: Implementing the Recommendations from the
National Strategy: Measuring Outcomes. HSRN / NIHR SDO Conference. Manchester; 2010.
82. Gafoor R, Nitsch D, McCrone P. Effect of Early Intervention on 5-Year Outcome in Non-Affective Psychosis. British Journal of Psychiatry.
2010;196(5):372-6.
83. Johnson S, Nolan F, Pilling S. Randomised Controlled Trial of Acute Mental
Health Care by a Crisis Resolution Team: The North Islington Crisis Study. British Medical Journal. 2005;331(7517):599.
84. Glover G, Arts G, Babu KS. Crisis Resolution /Home Treatment Teams and
Psychiatric Admission Rates in England. British Journal of Psychiatry. 2006;189:441-5.
85. Joy CB, Adams CE, Rice K. Crisis Intervention for People with Severe
Mental Illness: The Cochrane Database of Systematic Reviews; 2004.
86. Lester H, Birchwood M, Bryan S. Development and Implementation of Early Intervention Services for Young People with Psychosis: Case Study. British
Journal of Psychiatry. 2009;194:446-50.
87. McCrone P, Craig TKJ, Power P, Garety PA. Cost Effectiveness of an Early
Intervention Service for People with Psychosis. British Journal of Psychiatry. 2010;196:377-82.
88. Singh SP. Early Intervention in Psychosis. British Journal of Psychiatry. 2010;196:343-5.
89. Friis S. Early Specialised Teatment for First-Episode Psychosis: Does it
Make a Difference? British Journal of Psychiatry. 2010;196:339.
90. Department of Health. The National Service Framework for Older People.
London: Department of Health; 2001.
91. Mountain G. Integration: The Occupational Therapy Experience. Managing
Community Care. 2002;10(2):44-8.
92. Hardy B, Hudson B, Keen J. Partnership and Complexity in Continuity of
Care: A Study of Vertical and Horizontal Integration and Professional Boundaries: National Co-ordination Centre for Service Delivery and Organisation R&D
(NCCSDO) 2005.
93. Fulop N, Mowlem A, Edwards N. Building Integrated Care: Lessons from
the UK and Elsewhere. London: The NHS Confederation; 2005.
94. Cameron A, Lart R. Factors Promoting and Obstacles Hindering Joint
Working: A Systematic Review of the Research Evidence. Journal of Integrated care. 2003;11(2):9-17.

© Queen‟s Printer and Controller of HMSO 2011. . This work was produced by Huxley et al. under the terms of
a commissioning contract issued by the Secretary of State for Health. 163
Project 08/1619/114
95. Ramsay A, Fulop N. The evidence base for integrated care: NIHR King's
Patient Safety and Service Quality Research Centre, King's College London 2008.
96. Prendergast L. Organisational Culture, Secondment and Social Care: an exploration of a partnership organisation in the East of England. University of
Essex; 2011.
97. Jones R. Bringing Health and Social Care Together for Older People:
Wiltshire's Journey from Independence to Interdependence to Integration. Journal of Integrated care. 2004;12:27-32.
98. Abendstern M, Reilly S, Hughes J. Levels of Integration and Specialisation within Professional Community Teams for People with Dementia. International
Journal of Geriatric Psychaitry. 2006;21:77-85.
99. Scott T, Mannion R, Marshall M, Davies H. Does organisational culture
influence health care performance? A review of the evidence. Journal of Health Service and Research Policy. 2003;8(2):105-17.
100. Glendenning C, Powell M, Rummery K. Partnerships, New Labour and the
Governance of Welfare. Bristol Policy Press; 2002.
101. Rosen R, Ham C. Integrated care: lessons from evidence and experience.
London: Nuffield Trust; 2008.
102. Dickinson H, Peck E, Davidson D. Opportunity Seized or Missed? A Case
Study of Leadership and Organisational Change in the Creation of a Care Trust. Journal of Interprofessional Care. 2007;21(5):503-13.
103. Catty J, Burns T, Knapp M. Home Treatment for Mental Health Problems: A Sytematic Review. Psychological Medicine. 2002;32(3):383-40.
104. Priebe S, Fakhoury W, White I. Characteristics of Teams, Staff and
Patients: Associations with Outcomes of Patients in Assertive Outreach. British Journal of Psychiatry. 2004;185:306-11.
105. Wright C, Catty J, Watt H, Burns T. A Systematic Review of Home
Treatment Services, Classification and Sustainability. Social Psychiatry and
Psychiatric Epidemiology. 2003;39(10):789-96.
106. Burke R, Cooper C. The organisation in crisis: downsizing, restructuring
and privatisation. Oxford: Blackwell; 2000.
107. Noer D. Leading organisations through survivor sickness: a framework for
the new millennium. In: Burke R, Cooper C, editors. The Organisation in Crisis: Downsizing, restructuring and privatisation. Oxford: Blackwell; 2000.
108. Hughes L. New cultures, new territory, new professions. In: Allen I, editor. Social Care and Health, a new deal? London: Policy Studies Institute; 2001.
109. Gulliver P, Peck E, Towell D. Evaluation of the integration of Health and
Social Services in Somerset: Part 2 - lessons for other localities. Managing Community Care. 2002;10(3):33-7.
110. Chew C, Slade M, Montana C, Stewart M, Gask L. A qualitative study of
referral to community mental health teams in the UK: exploring the rhetoric and the reality. BMC Health Services Research. 2007;7:117-33.

© Queen‟s Printer and Controller of HMSO 2011. . This work was produced by Huxley et al. under the terms of
a commissioning contract issued by the Secretary of State for Health. 164
Project 08/1619/114
111. Peck E, Towell D, Gulliver P. The meaning of culture in health and social
care: a case study of the combined Trust in Somerset. Journal of
Interprofessional Care. 2001;15(4):319-27.
112. Appleby L. Mental Health Ten Years On: Progress on Mental Health Care
Reform. London: Department of Health; 2007 01/06/10.
113. Leutz WN. Five laws for integrating medical and social services: lessons
from the United States and the United Kingdowm. The Millbank Quarterly. 1999;77:77-110.
114. Rummery K. Towards a Theory of Welfare Partnerships. In: Glandinning C, Powell M, Rummery K, editors. Partnerships, New Labour and the Governance of
Welfare. Bristol: Policy Press; 2002.
115. Scott T, Mannion R. Organisational Culture and Health Care Performance:
A Review of the Theory, Instruments and Evidence. York: University of York, Centre for Health Economics; 2001.
116. Brown A. Organisational Culture. 2nd ed. Harlow: Prentice Hall; 1998.
117. Scott T, Mannion R, Davies H, Marshall M. The Quantitative Measurement of Organisational Culture in Health Care: A Review of the Available Instruments.
Health Services Research. 2003;38(3):923-45.
118. Glisson C. Organisational Culture and Climate. In: Pattie R, editor. The
Handbook of Social Welfare Management. Thousand Oaks, CA: Sage; 2000.
119. Hemmelgarn AL, Glisson C, James LR. Organisational Culture and Climate:
Implications for Services and Interventions Research. Clinical Psychology: Science and Practice. 2006;13(1):73-89.
120. Verbeke W, Volgering M, Hessels M. Exploring the Conceptual Expansion
Within the Field of Organisational Behaviour: Organisational Climate and Organisational Culture. Journal of Management Studies. 1998;35:303-29.
121. Jung T, Scott T, Davies HTO. Instruments for Exploring Organisational
Culture: A Review of the Literature. Public Administration Review.
2009;69(6):1087-96.
122. Denison DR. Corporate Culture and Organisational Effectiveness. New
York: Wiley; 1990.
123. Karasek R. Job Demands, Job Decision Latitude and Mental Strain.
Implications for Job Redesign. Administrative Quarterly. 1979;24:285-308.
124. Glisson C, James LR. The Cross-Level Effects of Culture and Climate in
Human Service Teams. Journal of Organisational Behaviour. 2002;23:767-94.
125. Glisson C, Hemmelgarn AL. The Effects of Organisational Climate and
Interorganisational Coordination on the Quality and Outcomes of Children's
Service Systems. Child Abuse and Neglect. 1998;22:401-21.
126. Glisson C, Durick M. Predictors of Job Satisfaction and Organisational
Committment in Human Service Organisations. Administrative Science Quarterly. 1988;33:61-81.

© Queen‟s Printer and Controller of HMSO 2011. . This work was produced by Huxley et al. under the terms of
a commissioning contract issued by the Secretary of State for Health. 165
Project 08/1619/114
127. Glisson C. Assessing and Changing Organisational Culture and Climate for
Effective Services. Research of Social Work Practice. 2007;17:736.
128. Glisson C. The Organisational Context of Children's Mental Health Services. Clinical Child and Family Psychology Review. 2002;5:233-53.
129. Mental Health Strategies. Mental Health Mapping Data 2007.[Online]
Available from: http://www.mentalhealthstrategies.co.uk. [Accessed 26 February 2010]
130. Ritchie J, Spencer L. Qualitative Data Analysis for Applied Policy Research
In: Bryman A, Burgess R, editors. Analysing Qaulitative Data. London: Routledge; 1994.
131. Pallant J. SPSS Survival Manual. 3rd ed. Berkshire: Open University Press;
2007.
132. Cohen JW. Statistical Power Analysis for the Behavioural Sciences. 2nd ed.
Hillsdale NJ: Lawrence Erlbaum Associates; 1988.
133. Statistics OfN. Census Area Statistics; 2001.
134. Mannion R. Measuring and assessing organisational culture in the NHS:
Report for the National Institute for Health Research Service Delivery and Organisation Programme; 2009.
135. Nancarrow SA, Enderby P, Morran AM. The Relationship Between
Workforce Flexibility and the Costs and Outcomes of Older People's Services:
National Institute for Health Research Service and Delivery and Organisation Programme; 2010.
136. Nancarrow SA, Moran A, Borthwick A, Buchnan J. The Impact of Work
Flexibility on the Costs and Outcomes of Older People's Services: A Policy and
Literature Review. Sheffield: University of Sheffield; 2006.
137. Huby G, Huxley PJ, Evans S. Supporting Reconfiguration of Social Care
Roles in Integrated Settings in the UK: A Comparative Study Across Three Health and Social Care Economies: Department of Health Policy Research Programme,
Social Care Workforce Research Initiative 2009.
138. SPSS for Windows: Release 16.0.01. Chicago: SPSS Inc.; 2007.
139. Statacorp Sv. Stata Statistical Software: release 10.0. College Station TX: Statacorp LP; 2007.
140. Simes RJ. An Improved Bontferroni Procedure with Multiple Tests of
Significance. Biometrika. 1986;73:751-4.
141. Tabachnik BG, Fidell LS. Using Multivariate Statistics. 5th ed: Pearson
Higher Education; 2007.
142. Blenkiron P, Hong Mo K, Cuzen J, Hammill C. Involving Service Users in
Their Mental Health Care: the CUES Project. Psychiatric Bulletin. 2003;27:224-338.
143. Lelliot P, Beevor A, Hogmann G. Carers' and Users' Expectations of Services - User Version (CUES-U): A New Instrument to Measure the Experience

© Queen‟s Printer and Controller of HMSO 2011. . This work was produced by Huxley et al. under the terms of
a commissioning contract issued by the Secretary of State for Health. 166
Project 08/1619/114
of Users of Mental Health Services. British Journal of Psychiatry. 2001;179:67-72.
144. Blenkiron P, Hammill CA. What Determines Patient's Satisfaction with Their Mental Health Care and Quality of Life. Postgrad Med Journal. 2003;79:337-40.
145. Priebe S, Huxley P, Knight S, Evans S. Application and Results of the
Manchester Short Assessment of Quality of Life (MANSA). International Journal of Social Psychiatry. 1999;45:7-12.
146. Singleton N, Lewis G. Better or Worse: A Longitudunal Study of the Mental
Health of Adults Living in Great Britain. London: The Stationery Office; 2003.
147. Bjorkman T, Svensson B. Quality of Life in People with Severe Mental
Illness. Reliability and Validity of the Manchester Short Assessment of Quality of
Life (MANSA). Nordic Journal of Psychiatry. 2005;59(4):302-6.
148. Priebe S, Aleksandra M, Jankovic J. Posttraumatic Stress Disorder
Following War in Former Yugoslavia: Morbidity Subjective Quality of Life and Care Costs. Croat Medical Journal. 2009;50:465-75.
149. Foy C, Haynes R, MacPherson R, Slade M, Summerfield L. The Use of Carers' and Users' Expectations of Services (CUES) in an Epidemiological Survey
of Need. International Journal of Social Psychiatry. 1999;51(1):35-43.
150. Rakib A, White PD, Pinching A. Subjective Quality of Life in Patients with
Chronic Fatigue Syndrome. Quality of Life Research. 2005;14(1):11-9.
151. McCabe R, Priebe S. Explanatory Models of Illness in Schizophrenia:
Comparison of Four Ethnic Groups. British Journal of Psychiatry. 2004;185:25-30.
152. Department of Health. Mental Health Act 1983. London: Her Majesty's
Stationery Office; 1983.
153. Evans S, Huxley P. Factors Associated with the Recruitment and Retention
of Social Workers in Wales: Employer and Employee Perspectives. Health and Social Care in the Community. 2009;17(3):254-66.
154. Trauer T, Coombs T. What's New in Outcome Measurement? Conference Presentation. The MHS Conference. Perth, Australia; 2009.
155. Crowther R, Marshall M, Bond GR, Huxley P. Vocational Rehabilitation for People with Severe Mental Illness (Cochrane Review). The Cochrane Library.
2002.
156. Office of the Deputy Prime Minister (OPDM). Mental Health and Social
Exclusion: Social Exclusion Unit Report. London; 2004.
157. Vision and Progress:Social Inclusion and Mental Health: National Social
Inclusion Programme [Online] Available from:
http://www.socialinclusion.org.uk/publications/NSIP_vision_and_progress.pdf [Accessed 18 March 2010).
158. Saraceno B, Van Ommeren M, Batniji R. Barriers to Improvement of
Mental Health Services in Low-Income and Middle Income Countries. The Lancet. 2007;370(9593):1164-74.

© Queen‟s Printer and Controller of HMSO 2011. . This work was produced by Huxley et al. under the terms of
a commissioning contract issued by the Secretary of State for Health. 167
Project 08/1619/114
159. Robertson-Hickling HA, Abel WD, Hickling FW. Evaluating the Effectiveness
of Teams in the Delivery of Mental Health in Jamaica. St Michael Barbados:
Caribbean Development Bank; 2008.
160. Salhani D, Coulter ID. The Politics of Interprofessional Working and the
Struggle for Professional Autonomy in Nursing. Social Science and Medicine. 2009;68(7):1221-8.
161. Jacob KS, Sharan P, Mirza I. Mental Health Systems in Countries: Where Are We Now? The Lancet. 2007;370(9592):1061-77.
162. Saxena S, Thornicroft G, Knapp M. Resources for Mental Health: Scarcity, Inequity and Inefficiency. The Lancet. 2007;370(9590):878-89.
163. Equity and Excellence: Liberating the NHS. Department of Health; 2010.
164. Recovery is for All. Hope, agency and opportunity in Psychiatry. A position statement by consultant psychiatrists. London: South London and
Maudsley NHS Foundation Trust and South West London and St George's Mental Health NHS Trust (SLAM/SWLSTG); 2010.
165. McPherson S, Evans C, Richardson P. The NICE Depression Guidelines and the Recovery Model: Is there an Evidence Base for IAPT? Journal of Mental
Health. 2009;518(5):405-14.
166. Hope R. The Ten Essential Shared Capabilities - A Framework for the
Whole of the Mental Health Workforce. London: DH/National Institute for Mental Health England (NIMHE); 2002.
167. Freeth D, Hammick M, Koppel I. A Critical Review of Evaluations of Interprofessional Education. London: Learning and Teacher Support Network for
Health Sciences and Practice; 2002.
168. Zwarenstein M, Reeves S, Barr H. Interprofessional Education: Effects on
Professional Practice and Health Care Outcomes Cochrane Review. 2002(4).
169. Sabin S. Competence in Practice - Based Calculation: Issues for Nursing
Education. London: LTSN - Centre for Health Science and Practice; 2002.
170. Heron G, Murray R. The Place of Writing in Social Work: Bridging the Theory - Practice Divide. Journal of Social Work. 2004;4:199-214.
171. Benner P. From Novice to Expert: Practice, Theory, Education and Education for Working in Uncertainty. Menlo Park, California: : Addison Wesley;
1984.
172. Gould N. Social Work Education and the 'Crisis of the Professions'. In:
Gould N, Taylor I, editors. Reflective Learning for Social Work. Aldershot: Arena; 1996.
173. Fook J, Ryan M, Hawkins L. Professional Expertise: Practice, Theory and
Education for Working in Uncertainty. London: Whiting and Birch Ltd; 2000.
174. While A. Competence Versus Performance: Which is More Important?
Journal of Advanced Nursing. 1994;20:525-31.
175. Burgess N. Competency Based Planning, Discussion Paper. London: NHS
National Workforce Projects; 2006.

© Queen‟s Printer and Controller of HMSO 2011. . This work was produced by Huxley et al. under the terms of
a commissioning contract issued by the Secretary of State for Health. 168
Project 08/1619/114
176. Nathan J, Webber M. Mental Health and Social Work and The Bureau -
Medicalisation of Mental Health Care: Identity in a Changing World. E Version
Accessed Pre-Publication; 2010.
177. Galvin SW, McCarthy S. Multidisciplinary Community Teams: Clinging to
the Wreckage. Journal of Mental Health. 1994;3:157-66.
178. Wells JSG. Priorities 'Street Level Bureaucracy' and the Community Mental
Health Team. Health and Social Care in the Community. 1997;5:333-42.
179. Brown B, Crawford P. The Clinical Governance of the Soul: 'Deep
Management' and the Self - Regulating Subject in Integrated Community Mental Health Terms. Social Science and Medicine. 2003;56:67-81.
180. Brown B, Crawford P, Darongkamas J. Blurred Roles and Permeable
Boundaries: The Experience of Multidisciplinary Working in Community Mental Health. Health and Social Care in the Community. 2000;6(6):425-35.
181. Fournier V. The Appeal to Professionalism as a Diciplinary Mechanism. The
Sociological Review. 1999;47:280-307.
182. Brown B, Crawford P, Darongkamas J. Interdisciplinary Work in Community Mental Health. Nursing Times. 2002;98(32):38-9.
183. Evans T. Professionals, Managers and Discretion: Critiquing Street - level Bureaucracy. British Journal of Social Work. 2010:1-19.
184. Hannigan B. Joint Working in Community Mental Health: Prospects and
Challenges. Health and Social Care in the Community. 1999;7(1):25-31.
185. Sserunkuma J, Sin J. Joined Up Thinking. Professional Social Work.
2010:12-3.
186. Salter M. Schizophrenia and NICE: All Quiet on the Community Front?
Evidence - Based Mental Health. 2009;12(4):97-8.
187. West M. Effectiveness of Multi-Professional Team Working (MPTW) in
Mental Health Care. SDO 08/1819/215.
188. Minford M. The Boundaries Between Health and Social Care for Older
People in Developed Countries. London: The Nuffield Trust; 2001.
189. Lago Z, Zarit SH. Empirical Perspectives on Services Integration and Aging: A Review. Journal of Aging and Social Policy. 1993;4(3-4):91-109.
190. Morrisey J. Integrating Service Delivery Systems for Persons with a Severe Mental Illness. In: Horwitz AV, Scheid T, editors. A Handbook for the Study of
Mental Health: Social Contexts, Theories and Systems. New York; 1999. p. 449-66.
191. Provan KG. Services Integration for Vulnerable Populations: Lessons from Community Mental Health. Family & Community Health. 1997;19(4):19-30.
192. Fulop N, King A, Edwards N, Street A. Organisational Factors and Quality
of Health Care: A comparison of combined and separate acute and community provider trusts. DH National electronic library for health 2000.
193. Van Raak A, Mur-Veeman I, Paulus A. Understanding the Feasibility of
Integrated Care: A Rival Viewpoint on the Influence of Actions and the

© Queen‟s Printer and Controller of HMSO 2011. . This work was produced by Huxley et al. under the terms of
a commissioning contract issued by the Secretary of State for Health. 169
Project 08/1619/114
Institutional Context. International Journal of Health Planning and Management. 1999;4(3):235-48.
194. Le Bas J, King R, Block M. Impact of Mental Health Service Integration on Systematic Function: A Staff Perspective. Australian & New Zealand Journal of
Psychiatry. 1998;5:666-72.
195. Barr W, Huxley PJ. The Impact of Community Mental Health Reform on
Service Users: A Cohort Study. Health and Social Care in the Community. 1999;7(2):129-39.
196. Campbell H, Hotchkiss R, Bradshaw N, Porteous M. Integrated Care Pathways. British Medical Journal. 1998;316(7125):133-7.
197. Lloyd M, Chatzifotiou S. Using the Resources of the Service User in the
Management of the Care Pathway. Practice. 2001;13(2):55-66.
198. Jones A. The Development of Mental Health Care Pathways: Friend or Foe?
British Journal of Nursing. 1999;8(21):1441-3.
199. Jones A. A Modernised Mental Health Service: the Role of Care Pathways.
Journal of Nursing Management. 1999;7(6):331-8.
200. Bernabei R, Landi F, Gambassi G, Sgadari A, Zuccala G, Mor V, et al.
Randomised Trial of Impact of Model of Integrated Care and Case Management for Older People Living in the Community. British Medical Journal.
1998;316(7141):1348-51.
201. Sulch D, Kalra L. Integrated Care Pathways in Stroke Management. Age
and Ageing. 2000;29(4):349-52.
202. Lowe C. Care Pathways: Have They a Place in 'The New National Health
Service'? Journal of Nursing Management. 1998;6(5):303-6.
203. Ellis BW, Johnson S. The Care Pathway: A Tool to Enhance Clinical Governance. British Journal of Clinical Governance. 1999;4(2):61-71.
204. Mannion R, Davies H, Marshall M. Culture for Performance in Health Care: Evidence on the Relationship Between Organisational Culture and Performance in
the NHS. York: Paper Presented at the Centre for Health Economics at York University; 2001.
205. Hudson B. Interprofessionality in Health and Social Care: The Achilles' Heel of Partnership. Journal of Interprofessional Care. 2002;16(1):7-17.
206. Hall P. Interprofessional Teamwork: Professional Cultures as Barriers.
Journal of Interprofessional Care. 2005;1:188-96.
207. Baxter SK, Brumfitt SM. Professional Differences in Interprofessional
Working. Journal of Interprofessional Care. 2008;22(3):239-51.
208. CSIP/NIMHE. 3 Keys to a Shared Approach in Mental Health Assessment.
London: CSIP/NIMHE; 2008.

© Queen‟s Printer and Controller of HMSO 2011. . This work was produced by Huxley et al. under the terms of
a commissioning contract issued by the Secretary of State for Health. 170
Project 08/1619/114
Appendix 1
INFORMATION SHEET FOR PARTICIPANTS IN THE SURVEY
YOU WILL BE GIVEN A COPY OF THIS INFORMATION SHEET
Culture and Climate in Community Teams
SDO/114 - Integration of social care staff within community mental health
teams
1.0 We would like to invite you to participate in this evaluation project (see
specifically section 3 below and the 5 attached questions.). You should only participate
if you want to; choosing not to take part will not disadvantage you in any way. Before
you decide whether you want to take part, it is important for you to understand why
the research is being done and what your participation will involve. Please take time to
read the following information carefully and discuss it with others if you wish. Ask us if
there is anything that is not clear or if you would like more information. (Contact Peter
Huxley at [email protected] or 01792 602548).
2.0 Based at the University of Wales, Swansea, the Centre for Social Carework
Research (CSCR) undertakes a wide variety of research projects concerning social work
and social care. We have been given a grant by the Department of Health in England
(from the National Coordinating Centre for Service Development and Organisation
Research; SDO/114) to undertake a study of the culture and climate in community
teams and the relationship with outcomes for service users. Previous research, almost
all in the United States of America, has shown that the type of team culture and
climate can have an effect on the outcomes of service for service users. The present
study is the first of its kind in the UK and will assess whether the same relationship
between culture and climate (measured using standard instruments) and outcomes
(measured using standard instruments and service data) exists in community teams
here, or not.
3.0 The first part of the study for which we are seeking your participation is a
national survey of mental health services providers. We are interested in how
community mental health team (including assertive outreach and crisis team)
membership has been determined, and what factors affected the staffing decisions.
This will require one brief interview with the senior service manager with the overall
responsibility for current CMHT provision. We are aware that this person will not
always have been party to the original staffing decisions which may have been made

© Queen‟s Printer and Controller of HMSO 2011. . This work was produced by Huxley et al. under the terms of
a commissioning contract issued by the Secretary of State for Health. 171
Project 08/1619/114
some time ago. However, we are also interested in current staffing levels and future
plans, as you can see from the list of questions below.
4.0 We will not use your name, or the name of your Trust in any reports of this
work and it will not be made known who took part. However, we might use some of
the things you say to illustrate and support the findings of the evaluation. It is
possible, but very unlikely, that someone who knows you very well might be able to
identify you from such comments, but we will make every effort to minimise this
possibility.
5.0 All information is held anonymously, using ID codes, and kept in secure
systems. Hard copy records will be shredded at the end of the project and anonymous
computer files held securely with password protection for 7 years and then destroyed.
6.0 It is up to you to decide whether or not to take part. If you do decide to take
part you will be given this information sheet to keep and be asked to sign a consent
form. If you decide to take part you are still free to withdraw at any time and without
giving a reason. A decision to withdraw at any time, or a decision not to take part,
will have no effect on you and we will not inform your managers or other
staff members that you have withdrawn.

© Queen‟s Printer and Controller of HMSO 2011. . This work was produced by Huxley et al. under the terms of
a commissioning contract issued by the Secretary of State for Health. 172
Project 08/1619/114
CONSENT FORM FOR PARTICIPANTS IN THE SURVEY
Please complete this form after you have read the Information Sheet and/or listened to an explanation about the research.
Title of Study: CULTURE AND CLIMATE IN COMMUNITY TEAMS (SDO/114)
Thank you for considering to take part in this research. The person organizing the
research must explain the project to you before you agree to take part.
If you have any questions arising from the Information Sheet or explanation already
given to you, please ask the researcher before you decide whether to join in. You will be given a copy of this Consent Form to keep and refer to at any time.
I understand that if I decide at any other time during the research that I no longer
wish to participate in this project, I can notify the researchers involved and be withdrawn from it immediately.
I consent to the processing of my personal information for the purposes of this
research study. I understand that such information will be treated as strictly confidential and handled in accordance with the provisions of the Data Protection Act 1998.
Participant’s Statement:
I _________________________________________________________________
agree that the research project named above has been explained to me to my
satisfaction and I agree to take part in the study. I have read both the notes written
above and the Information Sheet about the project, and understand what the research
study involves.
Signed Date
Investigator’s Statement:
I _______________________________________________________
confirm that I have carefully explained the nature, demands and any foreseeable risks
of the proposed research to the participant.
Signed Date

© Queen‟s Printer and Controller of HMSO 2011. . This work was produced by Huxley et al. under the terms of
a commissioning contract issued by the Secretary of State for Health. 173
Project 08/1619/114
QUESTION LIST
Id
Q1 How many community teams are currently provided by your organisation?
(please specify whether CMHT, Assertive outreach, crisis resolution, early intervention
or other)
Q2 What is the current staffing level of these teams, by discipline?
Q3 What factors determined the present staffing levels?
Q4 Have you any plans to change the current staffing levels, and if ‘yes’ what factors are
being taken into consideration?
Q5 How do you determine the need for and level of social care staffing in these teams?
(please specify whether social workers, social support workers or others)

© Queen‟s Printer and Controller of HMSO 2011. . This work was produced by Huxley et al. under the terms of
a commissioning contract issued by the Secretary of State for Health. 174
Project 08/1619/114
Appendix 2
Mental Health Workforce Study
Funded by NIHR-SDO
Workforce Dynamics Questionnaire
and
Karasek Job Content Questionnaire
INSTRUCTIONS FOR COMPLETION OF THESE QUESTIONNAIRES
Please use black or blue ink to complete the form
Please note that only one answer can be selected
All information provided will be strictly confidential.
Results will be reported anonymously and care will be
We are very grateful to Dr Susan Nancarrow, of the School of Health
and Related Research, University of Sheffield, who devised the original
Workforce Dynamic Questionnaire (WDQ) *, and who has allowed us
to adapt it for our study, which surveys Mental Health as well as
Older People‟s teams, and in Scotland and Wales as well as in England.

© Queen‟s Printer and Controller of HMSO 2011. . This work was produced by Huxley et al. under the terms of
a commissioning contract issued by the Secretary of State for Health. 175
Project 08/1619/114
taken to ensure that there is no chance of identifying any
individual views.
Please answer every question.

© Queen‟s Printer and Controller of HMSO 2010 176
Project 08/1619/114
Office Use:
CC AC TTC TNC SC

© Queen‟s Printer and Controller of HMSO 2011. . This work was produced by Huxley et al. under the terms of
a commissioning contract issued by the Secretary of State for Health. 177
Project 08/1619/114
Workforce Dynamics Questionnaire
To be completed by each team member
This survey examines a range of issues around your experiences of working in your current job, including your job satisfaction, team working, and role overlap with other practitioners.
Please answer every question.
Please sign the consent form before completing these questionnaires
I. Have you signed your consent form? Please tick Yes
II. To which team do you belong? ………………………………………………..
III. What is your professional group or
discipline?
1. Dietician
2. General practitioner
3. Geriatrician
4. Psychiatrist
5. Other doctor
6. Community Psychiatric Nurse
7. Other nurse
8. Occupational therapist
9. Physiotherapist
10. Podiatrist
Please tick
11. Psychologist
12. Secretary / admin
13. Social worker
14. Approved Social Worker (Eng/Wales)
15. Mental Health Officer (Scotland)
16. Speech and language therapist
17. Support worker (mainly social care)
18. Support worker (mainly nursing/ persona/
recovery care)
19. Support worker (other/ generic)
20. Other ……………..
IV. What is your current grade or designation?
i.e.
for NHS staff - Agenda for change (AfC)
grading;
for Social Work – grade = „up to 3‟/ 4/ 5/ „6 or
above‟
AfC ……………… SW …………….
V. Are you in a team leader/management role? Please tick Yes No
VI. What is the time commitment of your work in this team
Please tick
1. Full time
2. Part time
3. Other (Please State)……………….
VII. Gender
Please tick
1. Male
2. Female
VIII. What is your year of birth?
1 9 … …
Office Use:

© Queen‟s Printer and Controller of HMSO 2011. . This work was produced by Huxley et al. under the terms of
a commissioning contract issued by the Secretary of State for Health. 178
Project 08/1619/114
IX. Are you a volunteer? Please tick
1.Yes If Yes, please skip to question
XI
2. No
X. a) How many hours are you contracted to
work each week in this team?
b) Who pays your salary for your work in
this team?
a) ……………Hours per week
b)………………………………………..
XI. a) How long have you worked in this team?
..……..Years ……….Months
b) How long have you worked in this
general kind of care provision (but not
necessarily in this particular type of
team)?
..……..Years ……….Months
Role overlap
This question relates to the amount of role overlap you have with other
practitioners in your team (including practitioners who are not a regular part of your
team).
How closely do you
work with the
practitioners listed
below?
How much does your
role overlap with other
practitioners in your
team?
Note: If you
work with a team
member whose
„skills/training‟ is
not listed below,
please write their
„profession‟ in an
'Other' box and
complete
columns B & C
for that person,
as for the listed
practitioners.
By „how closely‟ we mean
the extent of
liaison/discussion in
dealing with a case/client.
You should score this
between 0 and 5, to
specify „how closely‟.
By „role overlap‟ we
mean the extent to which
you undertake the same
tasks as part of
patient/client care (eg
ordering equipment,
interacting with
clients/patients,
organising referral).
You should score this
between 0 and 5, to
specify „how much role
overlap‟.
Column A Column B Column C

© Queen‟s Printer and Controller of HMSO 2011. . This work was produced by Huxley et al. under the terms of
a commissioning contract issued by the Secretary of State for Health. 179
Project 08/1619/114
Do
not
work
with
at all
I
work
very
closel
y
with
No
ove
rlap
at
all
A great
deal of
role
overlap
Dietician 0 1 2 3 4 5 0 1 2 3 4 5
Geriatrician 0 1 2 3 4 5 0 1 2 3 4 5
General
practitioner
0 1 2 3 4 5 0 1 2 3 4 5
Psychiatrist 0 1 2 3 4 5 0 1 2 3 4 5
Other doctor 0 1 2 3 4 5 0 1 2 3 4 5
CPN 0 1 2 3 4 5 0 1 2 3 4 5
Other Nurse 0 1 2 3 4 5 0 1 2 3 4 5
Occupational
therapist
0 1 2 3 4 5 0 1 2 3 4 5
Physiotherapist 0 1 2 3 4 5 0 1 2 3 4 5
Podiatrist 0 1 2 3 4 5 0 1 2 3 4 5
Psychologist 0 1 2 3 4 5 0 1 2 3 4 5
Social worker 0 1 2 3 4 5 0 1 2 3 4 5
Approved Social
Worker
0 1 2 3 4 5 0 1 2 3 4 5
Mental Health
Officer (Scotland)
0 1 2 3 4 5 0 1 2 3 4 5
Speech and
language
therapist
0 1 2 3 4 5 0 1 2 3 4 5
Secretary /
admin
0 1 2 3 4 5 0 1 2 3 4 5
Support worker * 0 1 2 3 4 5 0 1 2 3 4 5
Other 1 specify
…………….
0 1 2 3 4 5 0 1 2 3 4 5
Other 2 specify
…………….
0 1 2 3 4 5 0 1 2 3 4 5
*support worker includes social care worker, personal care, therapy assistant,
recovery worker, generic worker, etc

© Queen‟s Printer and Controller of HMSO 2011. . This work was produced by Huxley et al. under the terms of
a commissioning contract issued by the Secretary of State for Health. 180
Project 08/1619/114
Extrem
ely
dissatis
fied
Extrem
ely
satisfie
d
Overall, how satisfied are you with your
current job? Please tick 1 2 3 4 5 6 7 8 9 1
0
On a scale of 1 (strongly disagree) to 10 (strongly agree) please mark which is closest to how you feel. (n/a = not applicable) Strongly Strongly Disagree Agree
N/A
Autonomy and role perception
Most of my work involves following instructions
given by other people
1 2 3 4 5 6 7 8 9 1
0
I am responsible for delegating work to my colleagues
1 2 3 4 5 6 7 8 9 10
I am responsible for deciding what care the client / patient needs
1 2 3 4 5 6 7 8 9 10
I make important decisions that influence the
direction of my team
1 2 3 4 5 6 7 8 9 1
0
I am often placed in a position of having to do things that are against my professional judgement
1 2 3 4 5 6 7 8 9 10
I am proud of my profession / discipline 1 2 3 4 5 6 7 8 9 1
0
My profession is well understood by the people I
work with
1 2 3 4 5 6 7 8 9 10
My profession is well understood by the general
public
1 2 3 4 5 6 7 8 9 1
0
My role is valued as highly as that of the other
members of my team
1 2 3 4 5 6 7 8 9 10
If I could, I would change my profession 1 2 3 4 5 6 7 8 9 10
Role overlap
I am confident in my own role in my current job 1 2 3 4 5 6 7 8 9 10
I sometimes feel threatened by the amount that others‟ roles overlap with mine
1 2 3 4 5 6 7 8 9 10
I have learnt a lot about the roles of other staff by
working in this team
1 2 3 4 5 6 7 8 9 10
I undertake joint patient visits with other members
of my team
1 2 3 4 5 6 7 8 9 1
0
I have learnt a lot of new skills working in my current job
1 2 3 4 5 6 7 8 9 10
I am at risk of losing skills by working in my current job
1 2 3 4 5 6 7 8 9 10

© Queen‟s Printer and Controller of HMSO 2011. . This work was produced by Huxley et al. under the terms of
a commissioning contract issued by the Secretary of State for Health. 181
Project 08/1619/114
My job requires that I am flexible in my role 1 2 3 4 5 6 7 8 9 10
Uncertainty
I am unclear about the future direction of my team 1 2 3 4 5 6 7 8 9 10
I am clear of my role within the team 1 2 3 4 5 6 7 8 9 10
I have a clear idea of how my team will look one
year from now.
1 2 3 4 5 6 7 8 9 1
0
I feel secure in my current job 1 2 3 4 5 6 7 8 9 10
Workload
The workload in my current job is too high 1 2 3 4 5 6 7 8 9 10
I am satisfied with the hours I am required to work
(eg shift work etc)
1 2 3 4 5 6 7 8 9 1
0
I would like to have more flexibility in my hours 1 2 3 4 5 6 7 8 9 10
I am not paid enough to reflect the level of
experience and responsibility my job requires
1 2 3 4 5 6 7 8 9 1
0
Innovation
Much of my work is governed by care protocols or clinical pathways
1 2 3 4 5 6 7 8 9 10
I have to be innovative to work in my current job 1 2 3 4 5 6 7 8 9 1
0
My current job enables me to be innovative in my role
1 2 3 4 5 6 7 8 9 10
On a scale of 1 (strongly disagree) to 10 (strongly agree) please mark which is closest to how you feel.
(n/a = not applicable) Strongly Strongly
Disagree Agree
N/
A
Integration with peers and colleagues
I have access to peer support from members of my own profession
1 2 3 4 5 6 7 8 9 10
I have formal management support from a member
of my own profession
1 2 3 4 5 6 7 8 9 1
0
I am professionally isolated 1 2 3 4 5 6 7 8 9 1
0
My team members have a clear understanding of my role
1 2 3 4 5 6 7 8 9 10
Team members make appropriate referrals to me 1 2 3 4 5 6 7 8 9 1
0

© Queen‟s Printer and Controller of HMSO 2011. . This work was produced by Huxley et al. under the terms of
a commissioning contract issued by the Secretary of State for Health. 182
Project 08/1619/114
My contribution is listened to in team meetings 1 2 3 4 5 6 7 8 9 1
0
My team works well together 1 2 3 4 5 6 7 8 9 1
0
Team working
My team has shared goals 1 2 3 4 5 6 7 8 9 10
My team often disagrees on the treatment of a
client/ patient
1 2 3 4 5 6 7 8 9 1
0
Team members can negotiate differences to reach a common understanding
1 2 3 4 5 6 7 8 9 10
There is not much conflict within my team 1 2 3 4 5 6 7 8 9 1
0
I get on well with my team members 1 2 3 4 5 6 7 8 9 1
0
My team has a clear and common focus 1 2 3 4 5 6 7 8 9 10
I am a valued member of my team 1 2 3 4 5 6 7 8 9 1
0
I feel confident to voice my opinion in my team 1 2 3 4 5 6 7 8 9 10
Management structures and styles
I have a clearly defined line manager 1 2 3 4 5 6 7 8 9 1
0
I am satisfied with the management of my team 1 2 3 4 5 6 7 8 9 10
I can voice my concerns to my manager 1 2 3 4 5 6 7 8 9 1
0
My manager is accessible 1 2 3 4 5 6 7 8 9 1
0
My manager understands my role 1 2 3 4 5 6 7 8 9 10
Access to technology and equipment
I have access to the type of equipment I need to do my job (eg equipment, aides)
1 2 3 4 5 6 7 8 9 10
I can access appropriate equipment when I need it 1 2 3 4 5 6 7 8 9 1
0
I have access to administrative support when I need
it
1 2 3 4 5 6 7 8 9 1
0
I have access to a computer at work 1 2 3 4 5 6 7 8 9 10

© Queen‟s Printer and Controller of HMSO 2011. . This work was produced by Huxley et al. under the terms of
a commissioning contract issued by the Secretary of State for Health. 183
Project 08/1619/114
On a scale of 1 (strongly disagree) to 10 (strongly agree) please mark which is closest to how you feel. (n/a = not applicable) Strongly Strongly Disagree Agree
Training and career progression opportunities
I have clear career opportunities in my current job 1 2 3 4 5 6 7 8 9 1
0
I have access to training if I need it 1 2 3 4 5 6 7 8 9 10
I am satisfied with the career development opportunities offered by my current job
1 2 3 4 5 6 7 8 9 10
I am more satisfied working in my current job than
in other places I have worked
1 2 3 4 5 6 7 8 9 1
0
If I want to progress professionally, I will have to leave my current job
1 2 3 4 5 6 7 8 9 10
I cannot see a clear direction for my future in my current job
1 2 3 4 5 6 7 8 9 10
I can take time off work for training if I need to 1 2 3 4 5 6 7 8 9 1
0
I have the opportunity to specialise in my current job
1 2 3 4 5 6 7 8 9 10
I am planning to leave my current employer in the
next twelve months
1 2 3 4 5 6 7 8 9 1
0
I am planning to change my profession in the next
twelve months
1 2 3 4 5 6 7 8 9 1
0
Feeling prepared and trained for the role
I have the skills necessary to do my job 1 2 3 4 5 6 7 8 9 1
0
If I am uncertain about an aspect of client/ patient care, I can always access someone who can help me
1 2 3 4 5 6 7 8 9 10
The quality of the care provided where I work is
good
1 2 3 4 5 6 7 8 9 1
0
My service benefits the clients / patients 1 2 3 4 5 6 7 8 9 1
0
My team has clear systems for resolving disputes or workplace problems
1 2 3 4 5 6 7 8 9 10

© Queen‟s Printer and Controller of HMSO 2011. . This work was produced by Huxley et al. under the terms of
a commissioning contract issued by the Secretary of State for Health. 184
Project 08/1619/114
Thank you very much for completing the Work Force Development Questionnaire,
now please complete the Karasek questionnaire on page 7
KARASEK JOB CONTENT QUESTIONNAIRE
Instructions: Please tick ONE response to each statement
KARASEK JOB CONTENT QUESTIONNAIRE
Skill Discretion
My job requires that I learn new things Strongly Disagree Disagree Agree Strongly agree
My job involves a lot of repetitive work Strongly Disagree Disagree Agree Strongly agree
My job requires me to be creative Strongly Disagree Disagree Agree Strongly agree
My job requires a high level of skill Strongly Disagree Disagree Agree Strongly agree
I get to do a variety of things in my job Strongly Disagree Disagree Agree Strongly agree
I have an opportunity to develop my own Strongly Disagree Disagree Agree Strongly agree
special abilities
Decision Authority

© Queen‟s Printer and Controller of HMSO 2011. . This work was produced by Huxley et al. under the terms of
a commissioning contract issued by the Secretary of State for Health. 185
Project 08/1619/114
My job allows me to make a lot of Strongly Disagree Disagree Agree Strongly agree
decisions on my own
In my job, I have very little freedom Strongly Disagree Disagree Agree Strongly agree
to decide how I do my work
I get a lot of say about what happens Strongly Disagree Disagree Agree Strongly agree
in my job
Psychological Job Demands
My job requires working very fast Strongly Disagree Disagree Agree Strongly agree
My job requires working very hard Strongly Disagree Disagree Agree Strongly agree
I am not asked to do an excessive Strongly Disagree Disagree Agree Strongly agree
amount of work
I have enough time to get the job done Strongly Disagree Disagree Agree Strongly agree
I am free from the conflicting demands Strongly Disagree Disagree Agree Strongly agree
that others make
Supervisor Social Support

© Queen‟s Printer and Controller of HMSO 2011. . This work was produced by Huxley et al. under the terms of
a commissioning contract issued by the Secretary of State for Health. 186
Project 08/1619/114
My supervisor/ immediate superior/ Strongly Disagree Disagree Agree Strongly agree
teamleader is concerned about the
welfare of those under her/him
My supervisor/ immediate superior/ Strongly Disagree Disagree Agree Strongly agree
teamleader listens to what I am saying
My supervisor/ immediate superior/ Strongly Disagree Disagree Agree Strongly agree
teamleader is helpful in getting the
job done
My supervisor/ immediate superior/ Strongly Disagree Disagree Agree Strongly agree
teamleader is successful in getting
people to work together
Co-worker Support
People I work with are competent Strongly Disagree Disagree Agree Strongly agree
at doing their job
People I work take a personal Strongly Disagree Disagree Agree Strongly agree
interest in me
People I work with are friendly Strongly Disagree Disagree Agree Strongly agree
People I work with are helpful in Strongly Disagree Disagree Agree Strongly agree
getting the job done
Thank you very much for completing these questionnaires

© Queen‟s Printer and Controller of HMSO 2011. . This work was produced by Huxley et al. under the terms of
a commissioning contract issued by the Secretary of State for Health. 187
Project 08/1619/114
If you have any comments about your work or this survey please give them below: ……………………………………………………………………………………………………………….……………………………………………………………… ……………………………………………….……………………………………………………………………………………………………………….…………… ………………………………………………………………………………………………………………………………………………………………………………..
The address for return of completed surveys is:
Centre for Social Work and Social Care Research
School of Human Sciences
Swansea University
Singleton Park
Swansea
SA2 8PP

© Queen‟s Printer and Controller of HMSO 2011. . This work was produced by Huxley et al. under the terms of
a commissioning contract issued by the Secretary of State for Health. 188
Project 08/1619/114
Appendix 3
INFORMATION SHEET FOR PARTICIPANTS - TEAM MEMBERS
YOU WILL BE GIVEN A COPY OF THIS INFORMATION SHEET
Culture and Climate in Community Teams
We would like to invite you to participate in this research project. You should only
participate if you want to; choosing not to take part will not disadvantage you in any
way. Before you decide whether you want to take part, it is important for you to
understand why the research is being done and what your participation will involve.
Please take time to read the following information carefully and discuss it with others if
you wish. Ask us if there is anything that is not clear or if you would like more
information; a research team member will answer your questions on the day of
participation, or you can contact one of the research team at these numbers:
Professor Peter Huxley 01792 602548
Dr Sherrill Evans 01792 602605
Chris Baker 01792 602624
Sally Philpin 01792 602632
Jo White 01792 602631
Based at Swansea University in Wales, the Centre for Social Work and Social Care
Research undertakes a wide variety of research projects concerning social work and
social care. We have been given a grant by the Department of Health in England (from
the NIHR Service Delivery and Organisation Programme) to undertake a study of the
culture and climate in community teams and the relationship with outcomes for service
users. About 40 teams will be taking part in the study. Previous research, almost all in
the United States of America, has shown that the type of team culture and climate can
have an effect on the outcomes of service for service users. The present study is the
first of its kind in the UK and will assess whether the same relationship between
culture and climate (measure using standard instruments) and outcomes (measured
using standard instruments and service data) exists in community teams here, or not.
Participating teams will have been identified on the basis of a national survey, and
senior executives of your organisation will have consented to the organisation’s

© Queen‟s Printer and Controller of HMSO 2011. . This work was produced by Huxley et al. under the terms of
a commissioning contract issued by the Secretary of State for Health. 189
Project 08/1619/114
participation by the time you receive this invitation. In selected sites (ones which differ
in terms of social care composition) teams will be randomly selected from team lists
provided by service managers. Participation is entirely voluntary and all information is
held anonymously, and teams are identified by ID only.
A number of service user and carer participants will be randomly selected from the
caseloads of teams which vary in their proportion of social care workers, and they will
be interviewed about their experience of the help that they have received and
complete a standard questionnaire about their needs.
If you are willing, we would like you to:
Either at one half day team meeting or specially convened meeting, complete standard instruments on team culture climate and organisation. This should take less than one hour.
At the same time, indicate which people on your current caseload, who are not in hospital, or detained under the provisions of mental health legislation, could be included in a list of potential interview subjects, from which a random sample would be invited by letter to participate in interviews with user researchers about the care they have received.
We will not use your name in any reports of this work and it will not be made known
who took part. However, we might use some of the things you write in response to the
questions, to illustrate and support the findings of the evaluation. It is possible, but
very unlikely, that someone who knows you very well might be able to identify you
from such comments, but we will make every effort to minimise this possibility.
All information is held anonymously, using ID codes, and kept in secure systems. Hard
copy records will be shredded at the end of the project and anonymous computer files
held securely with password protection for 7 years and then destroyed.
It is up to you to decide whether or not to take part. If you do decide to take part you
will be given this information sheet to keep and be asked to sign a consent form. If
you decide to take part you are still free to withdraw at any time and without giving a
reason. A decision to withdraw at any time, or a decision not to take part, will have no
effect on you and we will not inform your managers or other staff members that you
have withdrawn.

© Queen‟s Printer and Controller of HMSO 2011. . This work was produced by Huxley et al. under the terms of
a commissioning contract issued by the Secretary of State for Health. 190
Project 08/1619/114
CONSENT FORM FOR PARTICIPANTS IN RESEARCH STUDIES
Please complete this form after you have read the Information Sheet (Version 2 December 2007) and/or listened to an explanation about the research.
Title of Study: CULTURE AND CLIMATE IN COMMUNITY TEAMS
Thank you for considering to take part in this research. The person organizing the
research must explain the project to you before you agree to take part.
If you have any questions arising from the Information Sheet (Version 2 December
2007) or explanation already given to you, please ask the researcher before you decide whether to join in. You will be given a copy of this Consent Form to keep and refer to at any time.
I understand that if I decide at any other time during the research that I no longer
wish to participate in this project, I can notify the researchers involved and be withdrawn from it immediately.
I consent to the processing of my personal information for the purposes of this
research study. I understand that such information will be treated as strictly confidential and handled in accordance with the provisions of the Data Protection Act 1998.
Participant’s Statement:
I _________________________________________________________________
agree that the research project named above has been explained to me to my
satisfaction and I agree to take part in the study. I have read both the notes written
above and the Information Sheet about the project, and understand what the research
study involves.
Signed Date
Investigator’s Statement:
I _______________________________________________________
confirm that I have carefully explained the nature, demands and any foreseeable risks
of the proposed research to the participant.
Signed Date

© Queen‟s Printer and Controller of HMSO 2011. . This work was produced by Huxley et al. under the terms of
a commissioning contract issued by the Secretary of State for Health. 191
Project 08/1619/114
Appendix 4
INFORMATION SHEET FOR SERVICE USERS
YOU WILL BE GIVEN A COPY OF THIS INFORMATION SHEET
Culture and Climate in Community Teams
We would like to invite you to participate in this evaluation project. You should only
participate if you want to; choosing not to take part will not disadvantage you in any
way. Before you decide whether you want to take part, it is important for you to
understand why the research is being done and what your participation will involve.
Please take time to read the following information carefully and discuss it with others if
you wish. Ask us if there is anything that is not clear or if you would like more
information (Contact Professor Peter Huxley at [email protected] or 01792
602548).
Based at the University of Wales, Swansea, the Centre for Social Carework Research
undertakes a wide variety of research projects concerning social work and social care.
We have been given a grant by the Department of Health in England (from the
National Coordinating Centre for Service Development and Organisation Research) to
undertake a study of community team membership and the effects it may have on
people who use the services.
Participation is entirely voluntary and all information is held anonymously, and you will
be identified by a number only.
If you are willing, we would like to interview you on one occasion to ask you to
complete two brief questionnaires on your quality of life and your needs.
We will not use your name in any reports of this work and it will not be made known
who took part. However, we might use some of the things you say to illustrate and
support the findings of the evaluation. It is possible, but very unlikely, that someone
who knows you very well might be able to identify you from such comments, but we
will make every effort to minimise this possibility.
All information is held anonymously, using ID codes, and kept in secure systems. Hard
copy records will be shredded at the end of the project and anonymous computer files
held securely with password protection for 7 years and then destroyed.

© Queen‟s Printer and Controller of HMSO 2011. . This work was produced by Huxley et al. under the terms of
a commissioning contract issued by the Secretary of State for Health. 192
Project 08/1619/114
It is up to you to decide whether or not to take part. If you do decide to take part you
will be given this information sheet to keep and be asked to sign a consent form. If
you decide to take part you are still free to withdraw at any time and without giving a
reason. A decision to withdraw at any time, or a decision not to take part, will not
affect the standard of care you receive.

© Queen‟s Printer and Controller of HMSO 2011. . This work was produced by Huxley et al. under the terms of
a commissioning contract issued by the Secretary of State for Health. 193
Project 08/1619/114
CONSENT FORM FOR SERVICE USERS
Please complete this form after you have read the Information Sheet and/or listened to an explanation about the research.
Title of Study: CULTURE AND CLIMATE IN COMMUNITY TEAMS
Thank you for considering to take part in this research. The person organizing the research must explain the project to you before you agree to take part.
If you have any questions arising from the Information Sheet or explanation
already given to you, please ask the researcher before you decide whether to join in. You will be given a copy of this Consent Form to keep and refer to at any time.
I understand that if I decide at any other time during the research that I no longer
wish to participate in this project, I can notify the researchers involved and be withdrawn from it immediately.
I consent to the processing of my personal information for the purposes of this
research study. I understand that such information will be treated as strictly confidential and handled in accordance with the provisions of the Data Protection Act 1998.
Participant’s Statement:
I _________________________________________________________________
agree that the research project named above has been explained to me to my
satisfaction and I agree to take part in the study. I have read both the notes written
above and the Information Sheet about the project, and understand what the research
study involves.
Signed Date
Investigator’s Statement:
I _______________________________________________________
confirm that I have carefully explained the nature, demands and any foreseeable risks
of the proposed research to the participant.
Signed Date

© Queen‟s Printer and Controller of HMSO 2011. . This work was produced by Huxley et al. under the terms of
a commissioning contract issued by the Secretary of State for Health. 194
Project 08/1619/114
Appendix 5
MMMAAANNNSSSAAA QQQUUUAAALLLIIITTTYYY OOOFFF LLLIIIFFFEEE AAASSSSSSEEESSSSSSMMMEEENNNTTT ––– VVV222UUU
The MANSA asks a number of questions about you quality of life. The style and content of these questions have been developed and agreed by service users. The form takes only a short time to complete (about 10 minutes), the questions are quite easy and there are no right or wrong answers. The information that you provide is confidential.
WWWHHHAAATTT YYYOOOUUU DDDOOO...
1. Please read all of the questions.
2. Most questions apply to everybody and should be completed by everyone. Some questions have instructions that tell you whether or not the question applies to you, for example there are some different questions for people who are working compared to those who are not working.
3. For most questions you just need to tick one box to answer the question. For some questions you may be able to tick more than one box, for example to show that you live with a parent and other family. Most questions have instructions that tell you whether you need to tick one box only or whether you can tick as many boxes as apply to you. Please follow these instructions carefully.
4. Some of the questions ask how you feel about certain aspects of your life and look like the examples below. Each number on the scale describes how you feel, ranging from 1 for terrible to 7 for delighted. Here are some examples of how this scale should be used.

© Queen‟s Printer and Controller of HMSO 2011. . This work was produced by Huxley et al. under the terms of a commissioning
contract issued by the Secretary of State for Health. 195
Project 08/1619/114
If you think that a part of your life e.g. health is as bad as it could be you should tick box 1 like this:
Terrible Mostly dissatisfied Mostly satisfied Delighted
Displeased Mixed Pleased
If you think that your health couldn’t be any better you should tick box 7 like this:
Terrible Mostly dissatisfied Mostly satisfied Delighted
Displeased Mixed Pleased
5. If you make a mistake or change you mind about an answer, please make sure that it is clear which response you want us to take notice of.
1 3 4 5 6 7 2
1 3 4 5 6 7 2

© Queen‟s Printer and Controller of HMSO 2011. . This work was produced by Huxley et al. under the terms of a commissioning
contract issued by the Secretary of State for Health. 196
Project 08/1619/114
MMMAAANNNSSSAAA QQQUUUAAALLLIIITTTYYY OOOFFF LLLIIIFFFEEE AAASSSSSSEEESSSSSSMMMEEENNNTTT
Date of completion I.D. NUMBER
DEMOGRAPHIC DETAILS
DATE OF BIRTH (dd/mm/19yy)
GENDER Male Female
ETHNIC GROUP White Pakistani
Black Caribbean
Bangladeshi
Black African Chinese
Black Other Other
Indian
LLIIFFEE IINN GGEENNEERRAALL
1. HOW DO YOU FEEL ABOUT YOUR LIFE AS A WHOLE, TODAY? (Please tick one box only)
Terrible Mostly dissatisfied Mostly satisfied Delighted
Displeased Mixed Pleased
HHEEAALLTTHH
2. HOW DO YOU FEEL ABOUT YOUR HEALTH? (Please tick one box only)
Terrible Mostly dissatisfied Mostly satisfied Delighted
Displeased Mixed Pleased
1 3 4 5 6 7 2
1 3 4 5 6 7 2

© Queen‟s Printer and Controller of HMSO 2011. . This work was produced by Huxley et al. under the terms of a commissioning
contract issued by the Secretary of State for Health. 197
Project 08/1619/114
3. HOW DO YOU FEEL ABOUT YOUR PRESENT MENTAL HEALTH? (Please tick one box only)
Terrible Mostly dissatisfied Mostly satisfied Delighted
Displeased Mixed Pleased
4. IN THE PAST YEAR, HAVE THERE BEEN TIMES WHEN YOU WANTED TO IMPROVE YOUR HEALTH? (Please tick one box only)
Yes No
5. IN THE PAST YEAR, HAVE THE CHANCES FOR YOU TO IMPROVE YOUR HEALTH BEEN RESTRICTED IN ANY WAY?
(Please tick one box only)
Yes No
WWOORRKK AANNDD EEDDUUCCAATTIIOONN
6. HOW MANY MONTHS HAVE YOU WORKED (PART-TIME OR FULL-TIME) IN THE PAST 2 YEARS? Months
7. WHAT IS YOUR CURRENT EMPLOYMENT STATUS? (Please tick one box only)
In paid work Looking after the home
In sheltered work Unemployed and actively seeking employment
In training / education Retired
Not working due to long-term Other
illness or disability
8. If working:
1 3 4 5 6 7 2

© Queen‟s Printer and Controller of HMSO 2011. . This work was produced by Huxley et al. under the terms of a commissioning
contract issued by the Secretary of State for Health. 198
Project 08/1619/114
HAVE YOU WORKED CONTINUOUSLY OVER THE PAST 3 MONTHS? Yes No
9. If working:
ON AVERAGE, HOW MANY HOURS A WEEK DO YOU WORK? Hours
10a. If working:
HOW DO YOU FEEL ABOUT YOUR JOB? (Please tick one box only)
Terrible Mostly dissatisfied Mostly satisfied Delighted
Displeased Mixed Pleased
10b.If not working:
HOW DO YOU FEEL ABOUT NOT WORKING? (Please tick one box only)
Terrible Mostly dissatisfied Mostly satisfied Delighted
Displeased Mixed Pleased
11. IN THE PAST YEAR, HAVE THERE BEEN TIMES WHEN YOU WANTED TO IMPROVE YOUR WORK SITUATION?
(Please tick one box only)
Yes No
12. IN THE PAST YEAR, HAVE THE CHANCES FOR YOU TO IMPROVE YOUR WORK SITUATION BEEN RESTRICTED
IN ANY WAY?
(Please tick one box only)
Yes No
1 3 4 5 6 7 2
1 3 4 5 6 7 2

© Queen‟s Printer and Controller of HMSO 2011. . This work was produced by Huxley et al. under the terms of a commissioning
contract issued by the Secretary of State for Health. 199
Project 08/1619/114
FFIINNAANNCCEE
13. HOW FREQUENTLY (IF AT ALL) DO YOU FIND IT DIFFICULT TO MEET THE COST OF HOUSEHOLD BILLS? (Please tick
one box)
All of the time Most of the time Some of the time Seldom Never
14. HOW DO YOU FEEL ABOUT YOUR FINANCIAL SITUATION? (Please tick one box only)
Terrible Mostly dissatisfied Mostly satisfied Delighted
Displeased Mixed Pleased
15. IN THE PAST YEAR, HAVE THERE BEEN TIMES WHEN YOU WANTED TO IMPROVE YOUR FINANCIAL SITUATION? (Please tick one box only)
Yes No
16. IN THE PAST YEAR, HAVE THE CHANCES FOR YOU TO IMPROVE YOUR FINANCIAL SITUATION BEEN RESTRICTED IN ANY WAY?
(Please tick one box only)
Yes No
LLEEIISSUURREE
17. HOW MANY LEISURE ACTIVITIES DO YOU DO ON A WEEKLY BASIS (IF ANY)? (Please tick one box only)
1 3 4 5 6 7 2

© Queen‟s Printer and Controller of HMSO 2011. . This work was produced by Huxley et al. under the terms of a commissioning
contract issued by the Secretary of State for Health. 200
Project 08/1619/114
None Two or three
One Four or more
18. HOW DO YOU FEEL ABOUT YOUR LEISURE ACTIVITIES? (Please tick one box only)
Terrible Mostly dissatisfied Mostly satisfied Delighted
Displeased Mixed Pleased
19. IN THE PAST YEAR, HAVE THERE BEEN TIMES WHEN YOU WANTED TO IMPROVE YOUR LEISURE? (Please tick one box only)
Yes No
20. IN THE PAST YEAR, HAVE THE CHANCES FOR YOU TO IMPROVE YOUR LEISURE BEEN RESTRICTED IN ANY WAY?
(Please tick one box only)
Yes No
1 3 4 5 6 7 2

© Queen‟s Printer and Controller of HMSO 2011. . This work was produced by Huxley et al. under the terms of a commissioning
contract issued by the Secretary of State for Health. 201
Project 08/1619/114
SSOOCCIIAALL
21. DO YOU HAVE ANYONE WHO YOU WOULD CALL A ‘CLOSE FRIEND’? Yes No
22. IN THE PAST WEEK HAVE YOU HAD CONTACT WITH A FRIEND (EITHER FACE TO FACE OR BY TELEPHONE)?
Yes No
23. HOW DO YOU FEEL ABOUT THE NUMBER OF FRIENDS YOU HAVE? (Please tick one box only)
Terrible Mostly dissatisfied Mostly satisfied Delighted
Displeased Mixed Pleased
24. HOW DO YOU FEEL ABOUT THE RELATIONSHIPS YOU HAVE WITH YOUR FRIENDS? (Please tick one box only)
Terrible Mostly dissatisfied Mostly satisfied Delighted
Displeased Mixed Pleased
25. IN THE PAST YEAR, HAVE THERE BEEN TIMES WHEN YOU WANTED TO IMPROVE YOUR SOCIAL LIFE? (Please tick one box only)
Yes No
26. IN THE PAST YEAR, HAVE THE CHANCES FOR YOU TO IMPROVE YOUR SOCIAL LIFE BEEN RESTICTED IN ANY WAY?
(Please tick one box only)
Yes No
SSAAFFEETTYY
27. IN THE PAST YEAR, HAVE YOU BEEN A VICTIM OF VIOLENCE? Yes No
1 3 4 5 6 7 2
1 3 4 5 6 7 2

© Queen‟s Printer and Controller of HMSO 2011. . This work was produced by Huxley et al. under the terms of a commissioning
contract issued by the Secretary of State for Health. 202
Project 08/1619/114
28. HOW DO YOU FEEL ABOUT YOUR PERSONAL SAFETY? (Please tick one box only)
Terrible Mostly dissatisfied Mostly satisfied Delighted
Displeased Mixed Pleased
29. IN THE PAST YEAR, HAVE THERE BEEN TIMES WHEN YOU WANTED TO IMPROVE YOUR PERSONAL SAFETY?
(Please tick one box only)
Yes No
30. IN THE PAST YEAR, HAVE THE CHANCES FOR YOU TO IMPROVE YOUR PERSONAL SAFETY BEEN RESTRICTED IN ANY WAY?
(Please tick one box only)
Yes No
1 3 4 5 6 7 2

© Queen‟s Printer and Controller of HMSO 2011. . This work was produced by Huxley et al. under the terms of a commissioning
contract issued by the Secretary of State for Health. 203
Project 08/1619/114
LLIIVVIINNGG SSIITTUUAATTIIOONN
31. IN WHICH TYPE OF ACCOMODATION DO YOU CURRENTLY LIVE? (Please tick one box only)
House or flat (owned) Sheltered housing
House or flat (rented) Residential home
Boarding out (inc B&B) Nursing home
Mobile Home Hospital ward
Hostel/ Supported or Group Home Homeless
32. HOW DO YOU FEEL ABOUT YOUR ACCOMMODATION? (Please tick one box only)
Terrible Mostly dissatisfied Mostly satisfied Delighted
Displeased Mixed Pleased
33. IN THE PAST YEAR, HAVE YOU WANTED TO IMPROVE YOUR ACCOMODATION? (Please tick one box only)
Yes No
34. IN THE PAST YEAR, HAVE THE CHANCES FOR YOU TO IMPROVE YOUR ACCOMODATION BEEN RESTRICTED IN ANY WAY? (Please tick one box only)
Yes No
35. WHO DO YOU LIVE WITH (IF ANYBODY) IN YOUR CURRENT HOME? (Please tick all boxes that apply)
Live alone Children over 18
Spouse / partner Other family
Parent(s) Non-family
Children under 18
36a.If living with other people:
HOW DO YOU FEEL ABOUT THE PEOPLE THAT YOU LIVE WITH? (Please tick one box only)
Terrible Mostly dissatisfied Mostly satisfied Delighted
Displeased Mixed Pleased
1 3 4 5 6 7 2
1 3 4 5 6 7 2

© Queen‟s Printer and Controller of HMSO 2011. . This work was produced by Huxley et al. under the terms of a commissioning
contract issued by the Secretary of State for Health. 204
Project 08/1619/114
36b.If living alone:
HOW DO YOU FEEL ABOUT LIVING ALONE? (Please tick one box only)
Terrible Mostly dissatisfied Mostly satisfied Delighted
Displeased Mixed Pleased
37. IN THE PAST YEAR, HAVE YOU WANTED TO CHANGE YOUR LIVING ARRANGEMENTS? (Please tick one box only)
Yes No
38. IN THE PAST YEAR, HAVE THE CHANCES FOR YOU TO IMPROVE YOUR LIVING ARRANGEMENTS BEEN RESTRICTED IN ANY WAY? (Please tick one box only)
Yes No
FFAAMMIILLYY
39. HOW OFTEN DO YOU HAVE CONTACT WITH A RELATIVE (NOT INCLUDING THOSE WHO LIVE WITH YOU) EITHER FACE TO FACE
OR BY TELEPHONE? (Please tick one box only)
Not at all At least 3 monthly
Daily At least yearly
At least weekly Less than yearly
At least monthly
40. HOW DO YOU FEEL ABOUT YOUR RELATIONSHIP WITH YOUR FAMILY? (Please tick one box only)
Terrible Mostly dissatisfied Mostly satisfied Delighted
Displeased Mixed Pleased
41. IN THE PAST YEAR, HAVE YOU WANTED TO IMPROVE YOUR FAMILY LIFE? (Please tick one box only)
Yes No
42. IN THE PAST YEAR, HAVE THE CHANCES FOR YOU TO IMPROVE YOUR FAMILY LIFE BEEN RESTRICTED IN ANY WAY? (Please tick one box only)
1 3 4 5 6 7 2
1 3 4 5 6 7 2

© Queen‟s Printer and Controller of HMSO 2011. . This work was produced by Huxley et al. under the terms of a commissioning
contract issued by the Secretary of State for Health. 205
Project 08/1619/114
Yes No
LLIIFFEE OOVVEERRAALLLL
43. HOW DO YOU FEEL ABOUT YOUR LIFE AS A WHOLE? (Please tick one box only)
Terrible Mostly dissatisfied Mostly satisfied Delighted
Displeased Mixed Pleased
Thank you for completing the
1 3 4 5 6 7 2

© Queen‟s Printer and Controller of HMSO 2011. . This work was produced by Huxley et al. under the terms of
a commissioning contract issued by the Secretary of State for Health. 206
Project 08/1619/114
Appendix 6
CUES Service User Questionnaire
C U E S Carers’ and Users’ Expectations of Services
Contents 1 Where you live
2 Money
3 Help with finances
4 How you spend your day
5 Family and friends
6 Social life
7 Information and advice
8 Access to mental health services
9 Choice of mental health services
10 Relationships with mental health workers
11 Consultation and control
12 Advocacy
13 Stigma and discrimination
14 Your medication/drug treatment
15 Access to physical health services
16 Relationships with physical health workers
Other issues

© Queen‟s Printer and Controller of HMSO 2011. . This work was produced by Huxley et al. under the terms of
a commissioning contract issued by the Secretary of State for Health. 207
Project 08/1619/114
Introduction CUES has a number of different uses. Such as:
To help plan your support or care; For you to keep track of what’s happening in your life;
Surveys.
If someone has given you this copy of CUES, they should explain what the information will be used for. If you would like to use it for yourself but want more information, please contact rethink at the address on the back cover. There are a few things you should bear in mind while completing CUES:
CUES is about what is happening in your life. It is not about anybody else.
CUES is not a test. There are no right or wrong answers.
Each question asks how things are at the moment. If you read through the questions first, it will help you to work out the best place for everything you want to say. There is a space at the end of the questionnaire for you to mention anything that hasn’t already come up.

© Queen‟s Printer and Controller of HMSO 2011. . This work was produced by Huxley et al. under the terms of
a commissioning contract issued by the Secretary of State for Health. 208
Project 08/1619/114
1 Where you live
The place you live in should meet your individual needs. You shouldn’t have to worry about having to move out, and it shouldn’t be too out-of-the-way. You should be able to come and go when you want, be alone when you want, and not be harassed by the people you live with, by staff or by neighbours. How does the place you live in compare with this description? As good as this Worse than this Very much worse than this (please tick one box only)
Are you satisfied with the place you live in? Yes Unsure No (please tick one box only)
What would you most like to change about where you live?

© Queen‟s Printer and Controller of HMSO 2011. . This work was produced by Huxley et al. under the terms of
a commissioning contract issued by the Secretary of State for Health. 209
Project 08/1619/114
2 Money
You should have enough money to pay bills, stay out of debt and not miss meals. You should not have to feel isolated or cut off from society because of lack of money. How does your money situation compare with this description? As good as this Worse than this Very much worsethan this (please tick one box only)
Do you have enough money to meet your basic needs? Yes Unsure No (please tick one box only)
What are your most serious money problems?

© Queen‟s Printer and Controller of HMSO 2011. . This work was produced by Huxley et al. under the terms of
a commissioning contract issued by the Secretary of State for Health. 210
Project 08/1619/114
3 Help with finances
Many people find they need help with claiming benefits, filling in forms, and working out how to manage their money. You should get as much help as you need to do these things. How does the help you get compare with this description? As good as this Worse than this Very much worse than this (please tick one box only)
Are you satisfied with the level of help you get with your finances? Yes Unsure No (please tick one box only)
What aspects of your finances would you most like help with?

© Queen‟s Printer and Controller of HMSO 2011. . This work was produced by Huxley et al. under the terms of
a commissioning contract issued by the Secretary of State for Health. 211
Project 08/1619/114
4 How you spend your day
You should have the opportunity of spending your day in some form of regular and meaningful activity. This could be working, studying, training, going to a day centre or to a day hospital. How does the way you spend your day compare with this description? As good as this Worse than this Very much worse than this (please tick one box only)
Are you satisfied with the way you spend your day? Yes Unsure No (please tick one box only)
What would you most like to change about how you spend your day?

© Queen‟s Printer and Controller of HMSO 2011. . This work was produced by Huxley et al. under the terms of
a commissioning contract issued by the Secretary of State for Health. 212
Project 08/1619/114
5 Family and friends
Mental illness can affect a person’s relationships with the people he or she cares most about. You should be able to maintain good relationships with the people closest to you. How do your relationships comparewith this description? As good as this Worse than this Very much worse than this (please tick one box only)
Are you satisfied with your relationships with the people closest to you? Yes Unsure No (please tick one box only)
What would you most like to change about your relationships?

© Queen‟s Printer and Controller of HMSO 2011. . This work was produced by Huxley et al. under the terms of
a commissioning contract issued by the Secretary of State for Health. 213
Project 08/1619/114
6 Social life
You should have the opportunity to mix with people and form new friendships and relationships. To make this possible, you should have enough money, access to transport if you need it, and the use of a phone. How does your social life compare with this description? As good as this Worse than this Very much worse than this (please tick one box only)
Are you satisfied with your social life? Yes Unsure No (please tick one box only)
What would you most like to change about your social life?

© Queen‟s Printer and Controller of HMSO 2011. . This work was produced by Huxley et al. under the terms of
a commissioning contract issued by the Secretary of State for Health. 214
Project 08/1619/114
7 Information and advice
You should be given as much information as you want or need about the services and treatments available to you, about the Mental Health Act and how it works, and about the mental health system generally. Some people find it helpful to have someone like them (such as another service user or a member of the same community) to explain things to them. The information you are given should be clear and easy to understand, and should be available as and when you need it. How does the information and advice you get compare with this description? As good as this Worse than this Very much worse than this (please tick one box only)
Are you satisfied with the information and advice you get? Yes Unsure No (please tick one box only)
What areas would you like more information on or advice about?

© Queen‟s Printer and Controller of HMSO 2011. . This work was produced by Huxley et al. under the terms of
a commissioning contract issued by the Secretary of State for Health. 215
Project 08/1619/114
8 Access to mental health services
You should be able to get help from your local mental health services when you need it, throughout the week, at any time of the day or night. How does your ability to get help from the mental health services compare with this description? As good as this Worse than this Very much worse than this (please tick one box only)
Are you satisfied with your ability to get help when you need it? Yes Unsure No (please tick one box only)
What kind of difficulties do you have getting these services when you need them?

© Queen‟s Printer and Controller of HMSO 2011. . This work was produced by Huxley et al. under the terms of
a commissioning contract issued by the Secretary of State for Health. 216
Project 08/1619/114
9 Choice of mental health services
A range of services should be available to you, and you should be able to choose those which best meet your needs, including complementary/alternative therapies, counselling and psychotherapy. You should have a choice about the mental health workers you meet with regularly (for example being able to choose their sex or ethnic background), and be able to change workers if you don’t get on. How does the range of choice you have compare with this description? As good as this Worse than this Very much worse than this (please tick one box only)
Are you satisfied with the range of choice you have? Yes Unsure No (please tick one box only)
What are your main concerns about the choice of mental health services available to you?

© Queen‟s Printer and Controller of HMSO 2011. . This work was produced by Huxley et al. under the terms of
a commissioning contract issued by the Secretary of State for Health. 217
Project 08/1619/114
10 Relationships with mental health
workers Doctors, nurses, social workers and other mental health workers should show you respect, be honest with you and discuss things with you in a way you can understand. They should be trustworthy and do what they say they will. They should offer regular appointments, not miss appointments and not keep you waiting. They should keep information about you confidential or ask your permission before passing it on to others. If they pass on information, it should be accurate and save you from having to repeat yourself to new mental health workers. How does your situation compare with this description? As good as this Worse than this Very much worse than this (please tick one box only)
Are you satisfied with your relationships with mental health workers? Yes Unsure No (please tick one box only)
What situation would you most like to change?

© Queen‟s Printer and Controller of HMSO 2011. . This work was produced by Huxley et al. under the terms of
a commissioning contract issued by the Secretary of State for Health. 218
Project 08/1619/114
11 Consultation and control
Mental health workers should not pressurise you to do anything you don’t want to, or take decisions on your behalf without getting your permission first. Even if you have been ‘sectioned’, people should listen to you and take your opinions seriously. How does your situation compare with this description? As good as this Worse than this Very much worse than this (please tick one box only)
Are you satisfied with the level of consultation and control you have? Yes Unsure No (please tick one box only)
What would you most like to change?

© Queen‟s Printer and Controller of HMSO 2011. . This work was produced by Huxley et al. under the terms of
a commissioning contract issued by the Secretary of State for Health. 219
Project 08/1619/114
12 Advocacy
You should be able to put your views across to people in authority. This can be difficult for several reasons, such as the effects of medication, if English is not your first language, or if the situation is frightening or intimidating. If you want, you should have someone (an advocate) to help or support you, or speak for you. You should feel this person really understands what you want and genuinely represents your views when he/she speaks on your behalf. How do your circumstances compare with this description? As good as this Worse than this Very much worse than this (please tick one box only)
Are you satisfied with the help you get in dealing with difficult situations? Yes Unsure No (please tick one box only)
What situations do you most want help with?

© Queen‟s Printer and Controller of HMSO 2011. . This work was produced by Huxley et al. under the terms of
a commissioning contract issued by the Secretary of State for Health. 220
Project 08/1619/114
13 Stigma and discrimination
You should feel safe and other people should not harass, exploit, victimise or be violent towards you. You should not experience stigma or discrimination at home, at work, from mental health workers, police or any other section of the community. People should not discriminate against you because of your race, culture, religion, sex, sexual orientation, physical or mental disability or for any other reason. How do people treat you compared with this description? As good as this Worse than this Very much worse than this (please tick one box only)
Are you satisfied with the way other people treat you? Yes Unsure No (please tick one box only)
What situation would you most like to change?

© Queen‟s Printer and Controller of HMSO 2011. . This work was produced by Huxley et al. under the terms of
a commissioning contract issued by the Secretary of State for Health. 221
Project 08/1619/114
14 Your medication/drug treatment
Medication should only be given to relieve symptoms of mental ill-health and to reduce your distress. All medication can have unwanted effects, but these should not cause more disruption to your life than improvement. How does your medication compare with this description? As good as this Worse than this Very much worse than this (please tick one box only)
Are you satisfied with your current medication? Yes Unsure No (please tick one box only)
What would you most like to change about your medication/drug treatment?

© Queen‟s Printer and Controller of HMSO 2011. . This work was produced by Huxley et al. under the terms of
a commissioning contract issued by the Secretary of State for Health. 222
Project 08/1619/114
15 Access to physical health services
You should be able to get the treatment and care you need for your physical health when you need it, whether you are in hospital or living at home. You should be able to be registered with a GP and have regular check-ups from a dentist. You should have access to other types of care, such as opticians, chiropodists, physiotherapists and so on. How does your physical health care compare with this description? As good as this Worse than this Very much worse than this (please tick one box only)
Are you satisfied with your access to these services? Yes Unsure No (please tick one box only)
What type of health care do you have problems getting?

© Queen‟s Printer and Controller of HMSO 2011. . This work was produced by Huxley et al. under the terms of
a commissioning contract issued by the Secretary of State for Health. 223
Project 08/1619/114
16 Relationships with physical health
workers The people who give you physical health care should listen to you, show you respect and take your condition seriously. How does your situation compare with this description? As good as this Worse than this Very much worse than this (please tick one box only)
Are you satisfied with the way your physical health problems are dealt with? Yes Unsure No (please tick one box only)
What would you most like to change about your relationships with physical health workers?

© Queen‟s Printer and Controller of HMSO 2011. . This work was produced by Huxley et al. under the terms of
a commissioning contract issued by the Secretary of State for Health. 224
Project 08/1619/114
Other issues There may be other issues which are important to you, in addition to those the questionnaire has already asked about. Please use the space below to write down anything that’s important to you, that you’d like help with or that you’d like to change.

© Queen‟s Printer and Controller of HMSO 2011. . This work was produced by Huxley et al. under the terms of
a commissioning contract issued by the Secretary of State for Health. 225
Project 08/1619/114
The CUES questionnaire was developed jointly by: Royal College of Psychiatrists Royal College of Nursing Research Institute Rethink Department of Social Work, University of East Anglia CUES has been developed over two years to reflect the important issues for service users. It can be used in two distinct ways:
Individual care planning and evaluation over time (Owned and used by service users)
Service planning, monitoring and evaluation (owned and used by mental
health and social care staff)
Contact address for further copies of CUES: FRONT DOOR 0845 456 0455 The development of CUES (Carers’ and Users’ Expectations of Services) was funded by the Department of Health as part of the OSCA (Outcome of Social Care for Adults) initiative. Produced by Rethink Graphics, 2 The Keys, Eagle Way, Great Warley Brentwood, Essex CM13 3BP. Tel: 01277 221074 Royal College of Psychiatrists Research Institute Rethink is the operating name of National Schizophrenia Fellowship Department of Social Work,
University East Anglia

© Queen‟s Printer and Controller of HMSO 2011. . This work was produced by Huxley et al. under the terms of
a commissioning contract issued by the Secretary of State for Health. 226
Project 08/1619/114
Appendix 7
Culture and Climate in Community Mental Health Teams
Service User Questionnaire
What is this survey about?
This survey is about the mental health services you receive from your
community team.
Completing the questionnaire
For each question please tick clearly inside one box using a black or blue
pen.
Sometimes you will find the box you have ticked has an instruction to go to
another question. By following the instruction carefully you will miss out
the questions that do not apply to you.
Don‟t worry if you make a mistake; simply cross out the mistake and put a
tick in the correct box.
Questions or help?
If you have any queries about the questionnaire, please call the Centre for
Social Work and Social Care Research on 01792 602651
Your participation in this survey is entirely voluntary and your decision to take
part or not to take part does not affect the service you receive.
If you choose to take part, your answers will be treated in strict confidence.

© Queen‟s Printer and Controller of HMSO 2011. . This work was produced by Huxley et al. under the terms of
a commissioning contract issued by the Secretary of State for Health. 227
Project 08/1619/114
This questionnaire is anonymous, please do not write your name or address
anywhere on it.
YOUR CARE AND TREATMENT
1. How long have you been in contact with your mental health team?
One year or less
One to five years
Six to ten years
More than ten years
Don’t know/ Can’t
remember
2. When was the last time you saw someone from your mental health team?
In the last week
More than one week but less than one month ago
One to three months ago
Four to six months ago
More than six months ago
3. How would you rate the care you have received from your mental health team in the last
12 months?
Excellent
Very good
Good
Fair
Poor
Very poor
4. How satisfied are you with the way staff in the service seem to work together as a
team?
Very Satisfied
Mostly Satisfied
Indifferent or mildly

© Queen‟s Printer and Controller of HMSO 2011. . This work was produced by Huxley et al. under the terms of
a commissioning contract issued by the Secretary of State for Health. 228
Project 08/1619/114
dissatisfied
Very dissatisfied
5. Do you have enough say in decisions about your care and treatment?
Yes, definitely
Yes, to some extent
No
6. To what extent does your service meet your needs?
Almost all are met
Most are met
Only a few are met
None are met
YOUR CARE CO-ORDINATOR
A Care Co-ordinator (or key worker) is someone from your mental health team who keeps
in regular contact with you. For example this person could be a Community Psychiatric
Nurse (CPN), a Psychiatrist or a Social Worker.
7. Have you been told who your care co-ordinator is?
Yes Please go to question 8
No Please go to question 9
Not sure/ Don’t Know Please go to question 9
8. Is your care co-ordinator a …….
CPN Please miss out questions 14 to 18
Social Worker Please miss out questions ? to ?
Other (Please State)

© Queen‟s Printer and Controller of HMSO 2011. . This work was produced by Huxley et al. under the terms of
a commissioning contract issued by the Secretary of State for Health. 229
Project 08/1619/114
Not sure/ Don’t Know
9. Can you contact your care co-ordinator if you have a problem?
Yes, always
Yes, sometimes
No
The LAST time you saw your care co-ordinator….
10. Was the care co-ordinator helpful to you?
Yes, definitely Please go to question 11
Yes, to some extent Please go to question 11
Not much Please go to question 12
Not helpful Please go to question 12
11. In what way was the care co-ordinator helpful?
Please State
12. How satisfied are you that the care co-ordinator listened to you and understood your
problem?
Satisfied
Mostly Satisfied
Mostly Dissatisfied
Dissatisfied
13. How satisfied are you that the care co-ordinator was competent and knowledgeable?
Satisfied
Mostly Satisfied
Mostly Dissatisfied
Dissatisfied
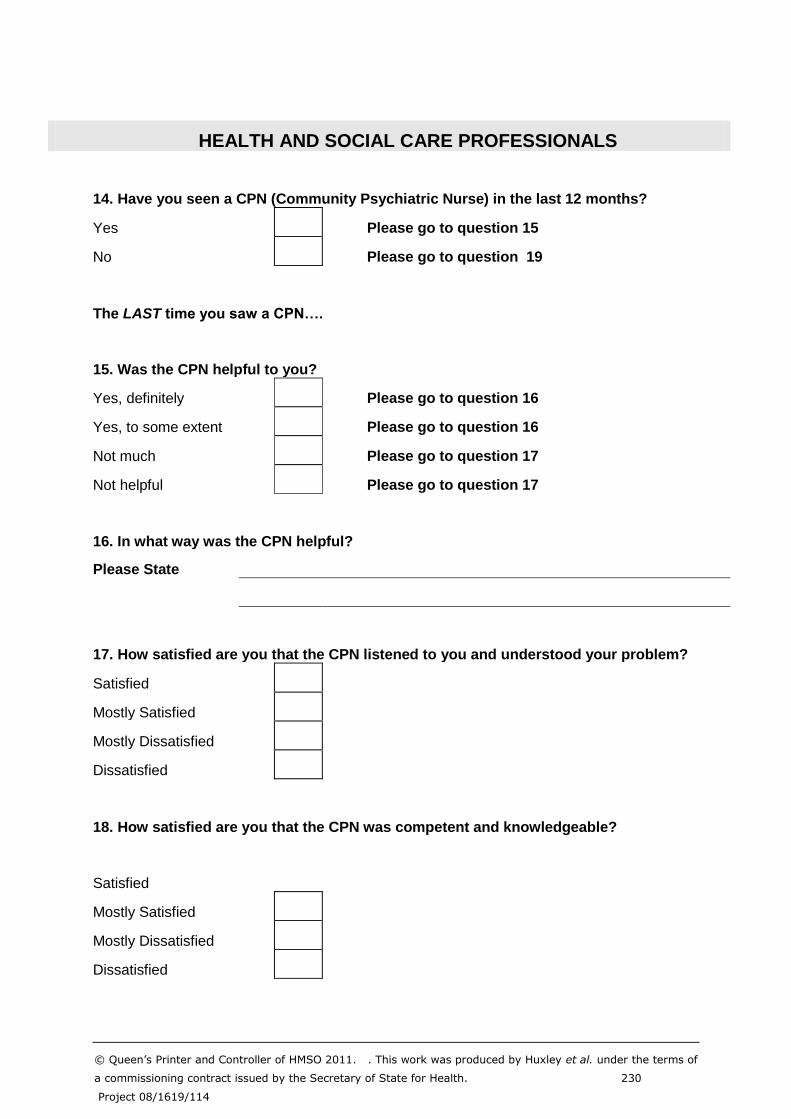
© Queen‟s Printer and Controller of HMSO 2011. . This work was produced by Huxley et al. under the terms of
a commissioning contract issued by the Secretary of State for Health. 230
Project 08/1619/114
HEALTH AND SOCIAL CARE PROFESSIONALS
14. Have you seen a CPN (Community Psychiatric Nurse) in the last 12 months?
Yes Please go to question 15
No Please go to question 19
The LAST time you saw a CPN….
15. Was the CPN helpful to you?
Yes, definitely Please go to question 16
Yes, to some extent Please go to question 16
Not much Please go to question 17
Not helpful Please go to question 17
16. In what way was the CPN helpful?
Please State
17. How satisfied are you that the CPN listened to you and understood your problem?
Satisfied
Mostly Satisfied
Mostly Dissatisfied
Dissatisfied
18. How satisfied are you that the CPN was competent and knowledgeable?
Satisfied
Mostly Satisfied
Mostly Dissatisfied
Dissatisfied

© Queen‟s Printer and Controller of HMSO 2011. . This work was produced by Huxley et al. under the terms of
a commissioning contract issued by the Secretary of State for Health. 231
Project 08/1619/114
19. Have you seen a Social Worker in the last 12 months?
Yes Please go to question 20
No Please go to question 24
The LAST time you saw a Social Worker….
20. Was the Social Worker helpful to you?
Yes, definitely Please go to question 21
Yes, to some extent Please go to question 21
Not much Please go to question 22
Not helpful Please go to question 22
21. In what way was the social worker helpful?
Please State
22. How satisfied are you that the Social Worker listened to you and understood your
problem?
Satisfied
Mostly Satisfied
Mostly Dissatisfied
Dissatisfied
23. How satisfied are you that the Social Worker was competent and knowledgeable?
Satisfied
Mostly Satisfied
Mostly Dissatisfied
Dissatisfied

© Queen‟s Printer and Controller of HMSO 2011. . This work was produced by Huxley et al. under the terms of
a commissioning contract issued by the Secretary of State for Health. 232
Project 08/1619/114
24. Have you seen a support worker (Sometimes called a STR worker or STAR worker) in
the last 12 months?
Yes Please go to question 25
No Please go to question 29
The LAST time you saw the support worker ….
25. Was the support worker helpful to you?
Yes, definitely Please go to question 26
Yes, to some extent Please go to question 26
Not much Please go to question 27
Not helpful Please go to question 27
26. In what way was the support worker person helpful?
Please State
27. How satisfied are you that the support worker listened to you and understood your
problem?
Satisfied
Mostly Satisfied
Mostly Dissatisfied
Dissatisfied
28. How satisfied are you that the support worker was competent and knowledgeable?
Satisfied
Mostly Satisfied
Mostly Dissatisfied
Dissatisfied

© Queen‟s Printer and Controller of HMSO 2011. . This work was produced by Huxley et al. under the terms of
a commissioning contract issued by the Secretary of State for Health. 233
Project 08/1619/114
OTHER COMMENTS
If there is anything else you would like to tell us about your experience of your mental
team in the last 12 months, please do so here.
29. Is there anything that you particularly like about your service?
30. If you could change anything about your service what would that be?
31. Any other comments?

© Queen‟s Printer and Controller of HMSO 2011. . This work was produced by Huxley et al. under the terms of
a commissioning contract issued by the Secretary of State for Health. 234
Project 08/1619/114
ABOUT YOU
32. Are you male or female?
Male
Female
33. What was your year of birth?
(please write in eg 1934)
THANK YOU VERY MUCH FOR YOUR HELP
Please check that you have answered all the questions that apply to you.
Please return this questionnaire using the stamped addressed envelope.
You can either post it or hand the sealed envelope to the person who gave it to you.

© Queen‟s Printer and Controller of HMSO 2011. . This work was produced by Huxley et al. under the terms of
a commissioning contract issued by the Secretary of State for Health. 235
Project 08/1619/114
Addendum:
This document is an output from a research project that was commissioned by the
Service Delivery and Organisation (SDO) programme whilst it was managed by the
National Coordinating Centre for the Service Delivery and Organisation (NCCSDO)
at the London School of Hygiene & Tropical Medicine. The NIHR SDO programme is
now managed by the National Institute for Health Research Evaluations, Trials and
Studies Coordinating Centre (NETSCC) based at the University of Southampton.
Although NETSCC, SDO has managed the project and conducted the editorial
review of this document, we had no involvement in the commissioning, and
therefore may not be able to comment on the background of this document. Should
you have any queries please contact [email protected].