First Title - Green Title - Title Insurance for the Renewables Sector Scotland Brochure
Integration of Renewables in the power sector
Rangan Banerjee
Dept of Energy Science and Engineering
Seminar at Dept of Electrical Engineering,Cambridge University , UK, May 29,2009

Overview of talk
Indian Context
What is the status and potential for renewables in the power sector?
How can we plan future power systems with high renewable shares?

India and UK (2005 Statistics)
Source: IEA
Population 1095 million 60 million
GDP (PPP) 3362 Billion US$ 1627 Billion US$
Primary Energy 22.4 EJ 9.8 EJ
Energy/person 20.5 GJ/person/year 163.3 GJ/person/year
Electricity/person
480 kWh/capita/year 6254kWh/capita/year
CO2 emissions
Per person
Per GDP
1147 Million tonnes 530 Million tonnes
1.05 tonnes /capita/year 8.8tonnes /capita/year
0.31 kg /US$ 0.34 kg /US$

Power Generation Installed Capacity
Coal
52%
Oil
1%
Gas
10%
Hydro
25%
Nuclear
3%
Renew able
9%
As on 31st March, 2009.
Total installed capacity = 149 GW
Source: Ministry of Power

Power Generation Options
Power Generation
Centralised Grid Connected
Cogeneration/Trigeneration
Decentralised Distributed Generation
Isolated
Demand Side Management (Solar Water Heater, Passive
Solar)

Need for Alternatives
Fossil fuel reserves limited
India - 17% of World population, 4% of primary energy
Present pattern – predominantly fossil based (87% comm, 64% total)
52% of households unelectrified
Linkage between energy services and quality of life

Renewable Energy Options
Wind
Solar Small
Hydro Biomass
Tidal
Energy
Wave Energy
Ocean Thermal
Energy
Solar Thermal
Solar
Photovoltaic
Geothermal*

Summary of Power Generation Technologies Using Renewable Energy
Technology
Status of
Technology
Largest
Installation
Capaci
ty
Factor
Cost of
Generati
on
(Rs./kWh)
CDM Projects Applications
No. of
project
s
MW Estimate of
GHG
abatement
in million
tCO2 eq.
Geothermal D 50 25%
OTEC D 1 MWa -
Wave P 150 kW -
Tide P 3.6 MWb 17%
Wind C 400 MW 14% 2.0-4.4 42 1186 20.5
Small Hydro C 25 MW 40% 1.0-4.5 37 317 8.4
Solar PV C 239 kW 15% 18.0-50.0 - - -
D - Demonstration
P - Prototype
C – Commerciala - Not operational till dateb – being planned

Renewable Installed Capacity trend
0
2000
4000
6000
8000
10000
12000
1992 1994 1996 1998 2000 2002 2004 2006 2008
Year
Insta
lled
Cap
acit
y

Estimated Renewable Generation in India
0
5000
10000
15000
20000
25000
2001 2002 2003 2004 2005 2006 2007
Year
An
nu
al G
en
era
tio
n
(M
iliio
n K
Wh
)

Renewable Share in Power

Perspective Plan (MNRE)
Source: 11th Plan proposal MNRE Govt of India

Renewable installed capacity and generation
Installed
Capacity*
(MW)
Estimated
Capacity factor
Estimated
Generation
(GWh)
Wind 7845 14% 9621
Biomass Power 606 70% 3185
Biomass Gasifier 86 60% 527
Bagasse
Cogeneration
720 60% 3784
Small Hydro 2046 40% 7169
Waste to Energy 55 50% 241
Solar PV 2.74 20% 5
Total 11360 25% 24380
*as on Jan 1, 2008

Geothermal/OTEC/Tidal/Wave
World Cost Estimates
Geothermal COMMERCIAL 8240 MW 4c/kWh
$2000/kW
No Indian experience
50 MW plant J & K planned
Tidal PROTOTYPE 240 MW
FRANCE
LF 20%
No Indian experience (3.6MW planned Sunderbans)
OTEC PROTOTYPE 50 kW
210 kW
NELHA
India 1MW gross plant attempted
Wave Energy
PROTOTYPE < 1MW
Grid Connected
India 150kW plant Thiruvananthpuram

OTEC plant schematic

Mooring Arrangement

Wave Energy
Source: Sukhatme

Wind Power
7800 MW installed
Single machine upto 2.1 MW
Average capacity factor 14%
Capital cost Rs 4-5crores/MW, Rs 2-3/kWh (cost effective if site CF >20%)
India 45000 /13000 MW potential estimated
32%/ year (5 year growth rate)
0
5
10
15
20
25
30
35
40
1991 1993 1995 1997 1999 2001 2003
An
nu
al L
oa
d F
ac
to
r (
%)
Satara, Maharashtra

0
200
400
600
800
1000
1200
1400
Jan
Feb
Mar
Apr
May
Jun
Jul
Aug Se
pO
ctNov
Dec
Month of year
Actu
al
Mo
nth
ly G
en
era
tio
n
(*1
00
0k
Wh
)
0
2
4
6
8
10
12
14
Av
era
ge W
ind
Sp
eed
(m
/s)
Monthly GenerationWind Speed
Variation in Wind Output

Small Hydro Power
Classification - Capacity
-Micro less than 100 kW
Mini 100 kW - 3 MWSmall 3 MW - 15 MW
Micro and Mini - usually isolated,
Small grid connected
Heads as low as 3 m viable
Capital Cost Rs 5-6crores/MW ,
Rs 1.50-2.50/kWh
1846 MW (7%/year)
200 kW Chizami village, Nagaland
Aleo (3MW) Himachal Pradesh
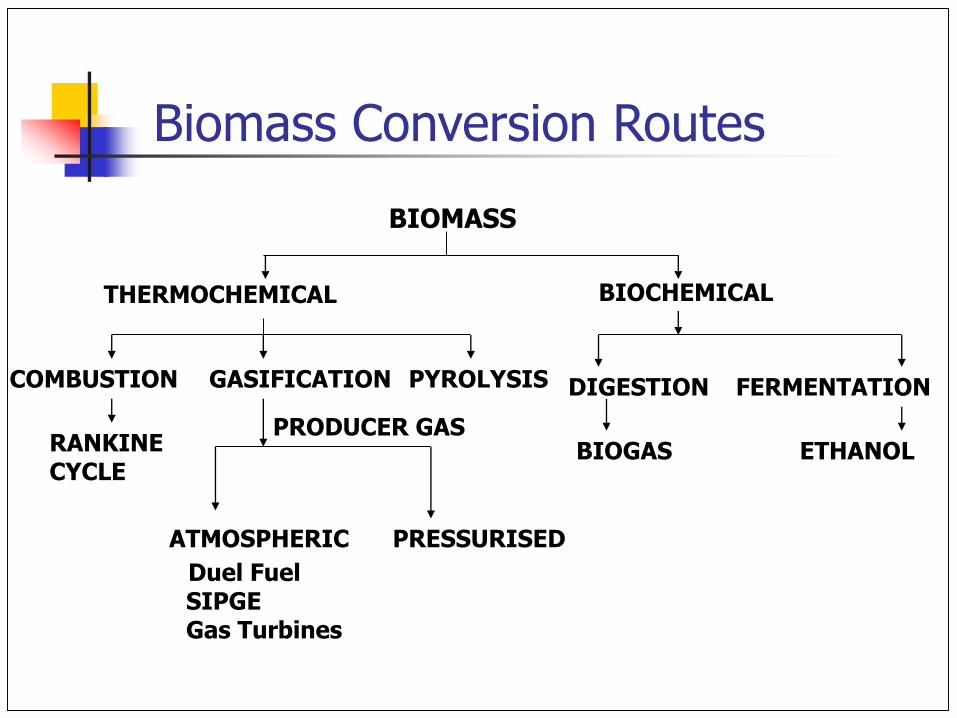
BIOMASS
THERMOCHEMICAL BIOCHEMICAL
COMBUSTION GASIFICATION PYROLYSIS
RANKINE CYCLE
PRODUCER GAS
ATMOSPHERIC PRESSURISED
FERMENTATIONDIGESTION
BIOGAS ETHANOL
Duel Fuel SIPGEGas Turbines
Biomass Conversion Routes

Biomass Power
Higher Capacity factors than other renewables
Fuelwood, agricultural residues, animal waste
Atmospheric gasification with dual fuel engine -
500 kW gasifier - largest installation
Combustion – 5-7.5 MW
Rs 2.50-4/kWh
Kaganti Power Ltd. Raichur Distt. A.P. 7.5 MW
100 kWe Pfutseromi village, Nagaland

Biogas
45-70% CH4 rest CO2
Calorific value 16-25MJ/m3
Digestor- well containing animal waste slurry
Dome - floats on slurry- acts as gas holder
Spent Slurry -sludge- fertiliser
Anaerobic Digestion- bacterial action
Family size plants 2m3/day
Community Size plants 12- 150 m3/day
Rs 12-14000 for a 2m3 unit
Cooking, Electricity, running engine
Pura, Karnataka

Bagasse Cogeneration
Incremental Capital Cost
(Rs/kW)
30000
Life 20 years
Boiler Efficiency 70%
Bagasse NCV = 3400 kcal/kg (dry basis), Price Rs 1.50/kg
Discount rate = 10%, O&M cost = Rs 0.5/kWh
2500 tcd plant 9.5 MW export, 0.93 kg extra/ kWh
Load factor 0.4 0.5 0.6
Rs/kWh 2.60 2.40 2.27

0.5T/hr
Feed water
Process
Process
2 ata
~
STEAM
TURBINE
2.5 MW
6 ata
BAGASSE
58 T/hr 22 ata
330o C
4.5T/hr 27T/hr
26T/hr
Schematic of typical 2500 tcd Sugar factory
Flashed
Condensate
PRDS
PRDS
MILLING
0.5T/hr
FEED
WATER
BOILER
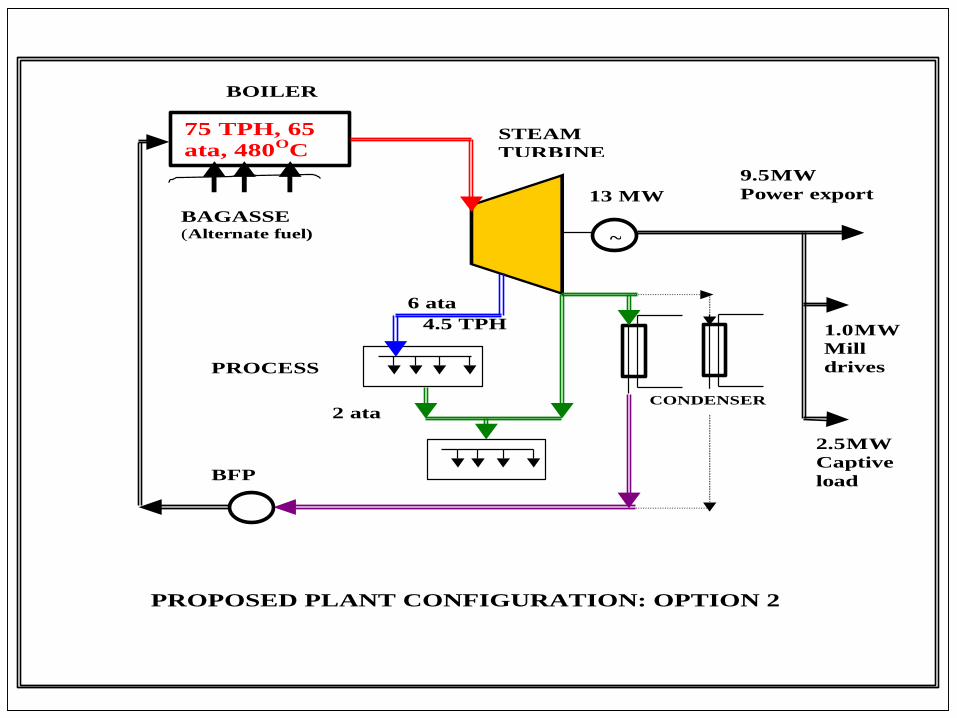
Feed water
Con
dens
er
2 ata
PROCESS
75 TPH, 65
ata, 480O
C
Process
Process
4.5 TPH
~
6 ata
BAGASSE (Alternate fuel)
2 ata
BFP
13 MW
BOILER
1.0 MW
Mill
drives
9.5 MW
Power export
2.5 MW
Captive
load
PROCESS
PROPOSED PLANT CONFIGURATION: OPTION 2
STEAM
TURBINE
CONDENSER
ESS

Solar PV
India -2740 kW Grid connected systems
(25-239 kW)
Array efficiency in field 12-15%
Cost Rs 26cr/MW
Rs 15-20 /kWh
Vidyut Saudha Building, 100 kWp , APTRANSCO
(2001) BHEL
Mousuni Island , 105 kWp, West Bengal
Renewable Energy Agency (2003 )

Solar Photovoltaic Power Plant
www.mnes.nic.in


Map of India showing geothermal provinces

Annual Insolation
kWh/m2/year
kWh/m2/year
kWh/m2/year
kWh/m2/year

Area for Power Generation
India’s present electricity
requirement approx. 500
billion kWh, can be met by
installing 2500 sq. km of
solar field.
A square of 50km x 50km,
or
4 smaller squares of 25km
x 25km.

Trend of wind energy development in India
0
1000
2000
3000
4000
5000
6000
7000
Till
03/9
2
1992-
93
1993-
94
1994-
95
1995-
96
1996-
97
1997-
98
1998-
99
1999-
2000
2000-
01
2001-
02
2002-
03
2003-
04
2004-
05
2005-
06
Till
09/0
6
Year
Inst
all
ed
Ca
pa
cit
y (
MW
)

Generation from wind
0
500
1000
1500
2000
2500
3000
3500
Till 0
3/92
1992-93
1993-94
1994-95
1995-96
1996-97
1997-98
1998-99
1999-2000
2000-01
2001-02
2002-03
2003-04
Year
Po
wer
Gen
era
ted
An
nu
aly
(G
Wh
)..

Diffusion curve
L wind potential estimate.
P cumulative installed capacity
dP/dt increment in installed capacity
)( PLPdt
dP
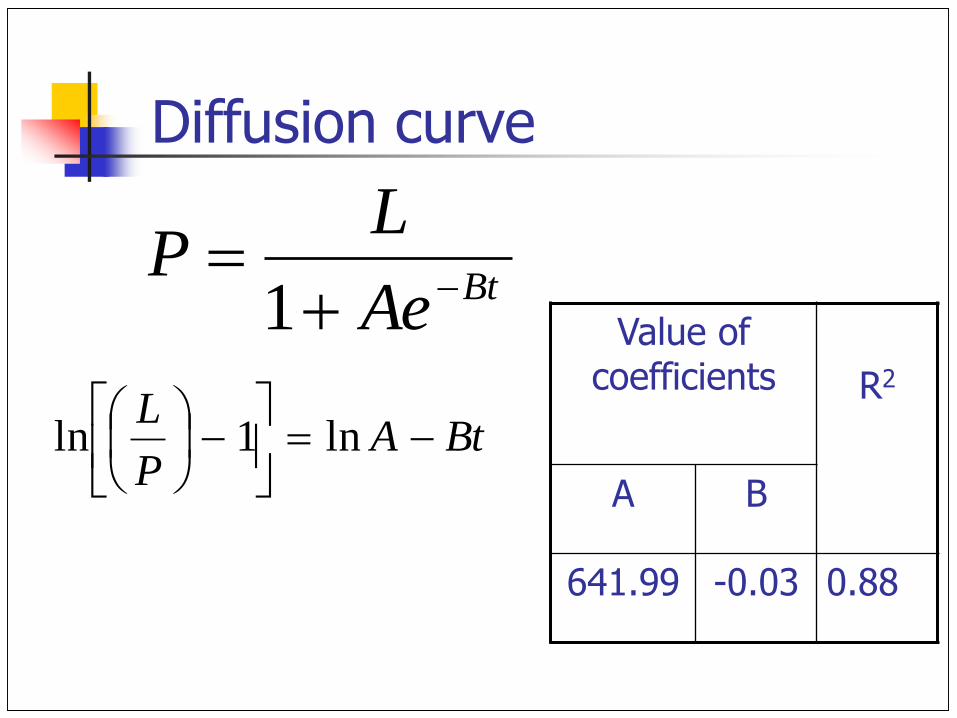
Diffusion curve
BtAP
L
ln1ln
BtAe
LP
1 Value of coefficients R2
A B
641.99 -0.03 0.88

Diffusion Curves for wind energy
0
10000
20000
30000
40000
50000
1990 1995 2000 2005 2010 2015 2020 2025 2030 2035 2040
Year
Inst
all
ed C
ap
aci
ty (
MW
)
Actual Installation
Diffusion curve
Upper limit of uncertainityLow er limit of uncertainity
Forecast Values by MNRE
Potential = 45000MW
a1
a2
a
am
Year Projection by
MNRE
Projection by
diffusion curve
Values in the uncertainty limit of
5%
Lower
limit Higher limit
2007 7000 8700 2000 24800
2012 17500 23000 5800 39600

Wind Diffusion

Hydro Diffusion
0
2000
4000
6000
8000
10000
12000
14000
16000
18000
20000
22000
1990 2010 2030 2050 2070 2090 2110 2130
Year
Inst
all
ed
Ca
pa
cit
y (
MW
)..
Actual InstallationPotential 15000 MWPotential11000 MWPotential 20000 MWValues by MNRE Potential = 15000MW
Potential =20000MW
Potential = 11000MW

Projected Renewable installed capacity and generation (2022)
Installed
Capacity*
(MW)
Estimated
Capacity factor
Estimated
Generation
(GWh)
Wind 42900 17% 63400
Biomass Power 2500 70% 15300
Biomass Gasifier 100 60% 527
Bagasse
Cogeneration
5500 60% 39400
Small Hydro 6500 40% 22,800
Waste to Energy 100 50% 241
Solar PV 100 20% 175
Total 59,800 27% 142600

Aggregate Grid connected
Integrated Energy Policy Committee
2022 – 425000 MW Installed capacity 2118000 Generation
Renewables 14% of Installed capacity
6.7% of generation
Trends of overall growth lower than forecast values
Trends of renewable capacity higher than forecast value
Technology cost reductions
Need for refinement of methods

Total installed capacity (GW)
Renewable power
Wind power (GW)
Solar power (GW)
Biomass power (GW)
Planning Commission
425 4 4 -- --
TERI BAU 441 4.5 4.2 -- --
TERI HYB 395 12 9 1.05 2
Greenpeace BAU
294 7 4.5 -- 2
Greenpeace ER
290 72 51 12 2
Diffusion model
-- -- 38 -- --
Scenarios for 2021-22

Issues in grid integration
Conventional power planning- hydro-thermal scheduling
How do we deal with renewables?
Capacity credit
New methodology based on Load Duration Curve
Illustrated for Wind in Tamil Nadu

Tamil Nadu location
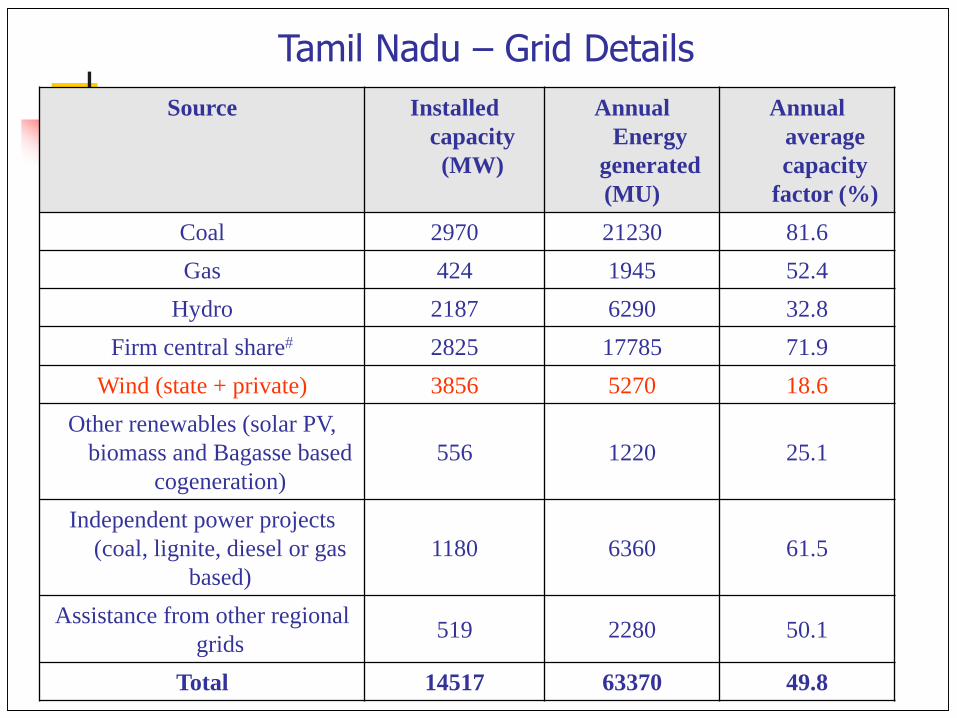
Source Installed
capacity
(MW)
Annual
Energy
generated
(MU)
Annual
average
capacity
factor (%)
Coal 2970 21230 81.6
Gas 424 1945 52.4
Hydro 2187 6290 32.8
Firm central share 2825 17785 71.9
Wind (state + private) 3856 5270 18.6
Other renewables (solar PV,
biomass and Bagasse based
cogeneration)
556 1220 25.1
Independent power projects
(coal, lignite, diesel or gas
based)
1180 6360 61.5
Assistance from other regional
grids519 2280 50.1
Total 14517 63370 49.8
Tamil Nadu – Grid Details

Installed wind power
Wind energy
generated
0
500
1000
1500
2000
2500
3000
3500
4000
1994 1995 1996 1997 1998 1999 2000 2001 2002 2003 2004 2005 2006 2007
Year
Insta
lled
cap
acit
y (
MW
)
0
1000
2000
3000
4000
5000
6000
En
erg
y g
en
era
ted
(M
U)
TN – Installed wind power and wind energy generated

5000
5500
6000
6500
7000
7500
8000
8500
9000
9500
0 4 8 12 16 20 24
Jan-07
june
july
august
sept
0
200
400
600
800
1000
1200
1400
1600
1800
2000
0 4 8 12 16 20 24
hours
Po
we
r g
en
era
ted
in
MW
january
June
July
August
September
Wind Generation
Total Generation
Tamil Nadu 2006-7

0
500
1000
1500
2000
2500
0 4 8 12 16 20 24
Hours
Po
wer
gen
era
ted
in
MW January
June
September
Mean value
0
200
400
600
800
1000
1200
JAN FEB MAR APR MAY JUN JUL AUG SEP OCT NOV DEC
Months
Win
d e
ne
rgy g
en
era
ted
(M
U)
Hourly variation of
wind power
Monthly variation of
wind energy
generated

Capacity Credit Methodology

Mean Value
0
5
10
15
20
25
30
35
40
JAN FEB MAR APR MAY JUN JUL AUG SEP OCT NOV DEC
Months
Cap
acit
y c
red
it (
%)
Variation of CC

0
5
10
15
20
25
30
35
40
0 5 10 15 20 25 30 35 40
Monthly capacity factor (%)
Mo
nth
ly c
ap
acit
y c
red
it (
%)
Capacity Credit and Capacity factor

Percentage penetration of
wind power (%)
Wind power installed
capacity (MW)Capacity credit (MW)
0 0 0
5.5 500 130
11.1 1000 240
16.7 1500 350
22.2 2000 460
33.3 3000 675
44.4 4000 895
61.1 5500 1220
77.8 7000 1550
88.9 8000 1750
100 9000 1965
Variation of Capacity credit with wind penetration

Methodology – Wind (Micro level)
Select major sitesHourly wind speed data at
sensor height
Wind turbine characteristics
Extrapolated hourly wind
power generated in the
state
Installed capacity at each
site
Hourly wind power at
sensor height
Hourly wind power at hub
height
Hub height, power law
index at each site
Continue to LDC
Methodology

Input n and
n discrete
wind
capacities
Select major sites
Extrapolated hourly wind
power generation
Effective load curve
Divide load curve into 100
MW bins
Record number of hours in
each bin
Calculate effective base and
peak load savings from
different LDCs obtained
Evaluate for n discrete wind
capacities
Sum up to obtain annual load
duration curve
Frequency distribution of load
over the year
Hourly
wind
speed
data
Wind
turbine
characteris
ticsInstalled
capacity of
wind power
Hourly
load
curve
Methodology – Wind

Impacts on Load Duration Curve

Wind power installed capacity
(MW)
Base load capacity saved
(MW)
Peak load capacity saved
(MW)
0 0 0
500 60 70
1000 100 355
1500 150 1105
2000 240 1265
3000 470 1475
4000 770 1625
5500 1150 1775
7000 1460 1975
8000 1630 2085
9000 1855 2125
Effect of Wind penetration on LDC
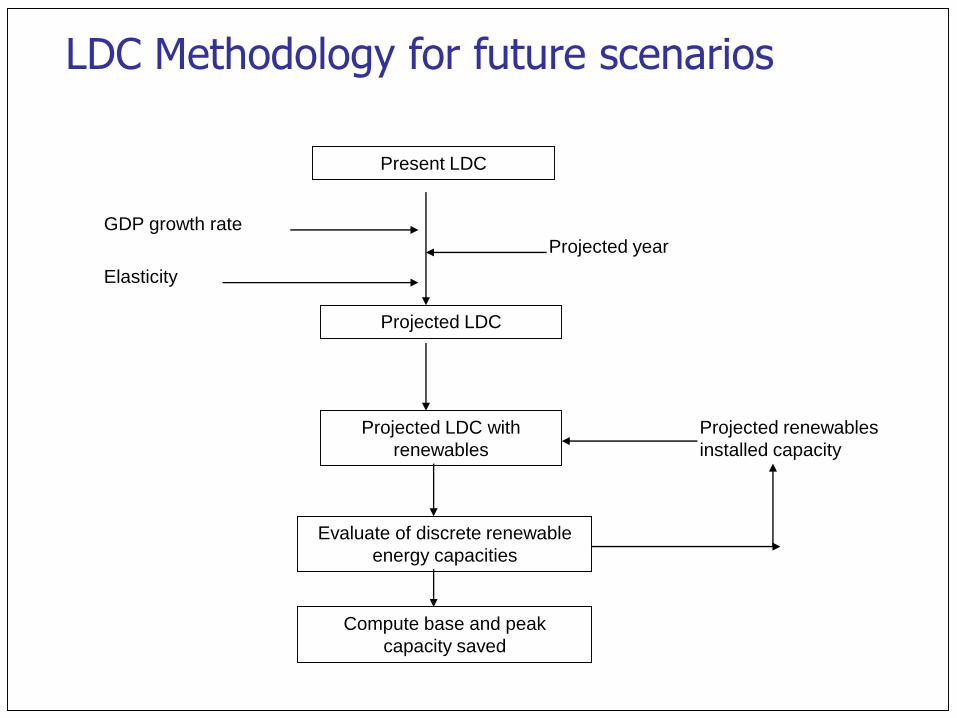
LDC Methodology for future scenarios
Present LDC
GDP growth rate
Elasticity
Projected LDC
Projected year
Projected LDC with
renewables
Projected renewables
installed capacity
Evaluate of discrete renewable
energy capacities
Compute base and peak
capacity saved

TN – Wind energy scenarios for 2021

Simulation for UK
Site: Valley, Hollyhead, Anglessy (Wales)
Mean monthly wind speed
0
1
2
3
4
5
6
7
8
9
1 2 3 4 5 6 7 8 9 10 11 12
month
win
d s
pe
ed
(m
/s)

0
0.2
0.4
0.6
0.8
1
1.2
0 5 10 15 20 25
Hrs.
no
rma
lis
ed
po
we
r g
en
era
ted
UK load
wind power
0
0.2
0.4
0.6
0.8
1
1.2
0 5 10 15 20 25
Hrs.
No
rmali
sed
w.r
.t.
peak
Load
wind power
0
0.2
0.4
0.6
0.8
1
1.2
0 5 10 15 20 25
Hrs.
No
rmali
sed
gen
era
tio
n w
.r.t
.
peak Load
Wind power
0
0.2
0.4
0.6
0.8
1
1.2
0 5 10 15 20 25
Series1
Series2
Wind power - load curve correlation in UK
July – 0.88 Jan – (-)0.51
Mar – 0.48 Oct – 0.39
Average correlation factor over the year = 0.38

No wind power
3200 MW wind (present installed
capacity)
6000 MW wind (2011 estimate)
Results for UK

% wind powerInstalled cap
MWbase saved peak saved
TN
6.9 620 1.50% 0.30%
12.9 1140 2.80% 1.20%
UK
6.9 3200 5.90% 0.90%
12.9 6000 10.30% 6%
Comparison of UK and TN impact

Installed solar power
capacity
Hourly total renewable
energy generated
Installed wind power
capacity
Installed biomass
power capacity
Hourly solar energy
generated
Hourly wind energy
generated
Hourly biomass energy
generated
Effective load curve
Divide load curve into equal-sized bins
Record no. of hrs. in each bin
Sum up to obtain annual LDC
Frequency distribution of load over the year
Evaluate for n discrete renewable energy capacities
Hourly load curve
Compute base and peak load savings from diff. LDCs
Input n and n
discrete capacities
of W, S and B

Wind resource model
WECS performance model Solar PV performance model Biomass power generation
Solar resource model
Utility generation model Load model
Economic scenarioCapacity expansion model
Output: Capacity Savings
Micro level model
Macro level model

TN Solar Methodology (Micro-level)
Select major sites
Hourly solar power
generation at each site
Correction for panel
inclination
Correction for temperature
effect
Extrapolate based on
installed capacity at each
site to get hourly solar
power generation for the
state
Continue to LDC
Methodology
Hourly average
insolation
Solar module
characteristics (efficiency
vs insolation)
Power coefficient
(W/deg. C)
Cos ()

0
20
40
60
80
100
120
140
160
0 4 8 12 16 20 24
hrs
MW
March
Julyl
September
December
Solar power – hourly variation

100
125
150
175
200
225
250
jan feb mar apr may jun jul aug sep oct nov dec
months
Mo
nth
ly g
en
era
tio
n f
or
10
00
MW
so
lar
PV
(M
U)
Solar power – monthly variation

0
20
40
60
80
100
120
140
160
180
jan feb mar apr may jun jul aug sep oct nov dec
months
en
erg
y g
en
era
ted
in
MU
Biomass power – monthly variation
Installed capacity – 450 MW (340 MW from bagasse cogen)

Wind and solar power required for 1000 MW avg. peak saving

y = -0.8666x + 2798.1
R2 = 0.9834
0
500
1000
1500
2000
2500
3000
3500
0 500 1000 1500 2000 2500 3000 3500 4000
Installed wind power (MW)
Ins
talle
d s
ola
r p
ow
er
(MW
)Wind and solar power installations to replace 1000 MW base power
Slope = 0.8666 which is almost equal to ratio of capacity factors (0.18/0.21 = 0.857)

Base capacity savings with wind + solar

Peak capacity savings with wind + solar

Hybrid scenarios – Impacts on LDC
A
B
C

Impacts on LDC – capacity savings
Scenario Wind
(MW)
Solar
(MW)
Biomass
(MW)
Base capacity
saved (MW)
Base capacity
saved (% of
installed RE
capacity)
Peak
capacity
saved
(MW)
Peak
capacity
saved(% of
installed
RE
capacity)
A 4000 1000 1000 1568 30.31 1252 27.22
B 5000 1000 1500 2137 28.66 1423 26.79
C 3000 3000 3000 2984 33.15 2276 25.29
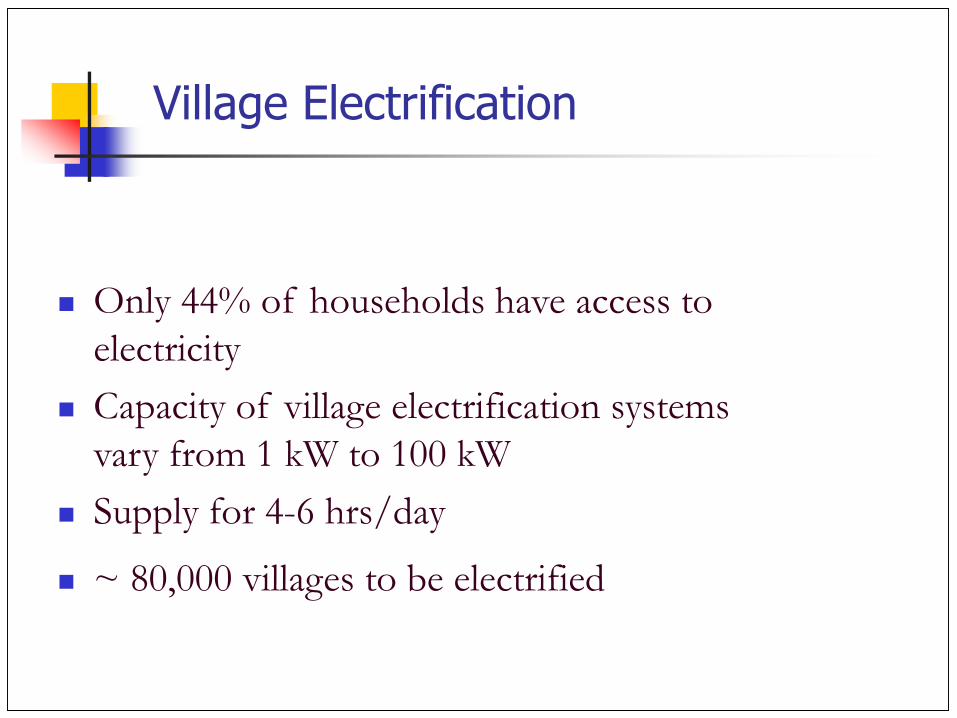
Only 44% of households have access to
electricity
Capacity of village electrification systems
vary from 1 kW to 100 kW
Supply for 4-6 hrs/day
~ 80,000 villages to be electrified
Village Electrification

State Type of Renewable Energy No. of Isolated Power systems
Chattisgarh
PV
Bio-Diesel
Hybrid
800 (1 to 6 kW)
05 (10 kW)
01
MaharashtraPV
Bio-mass
2 (5 kW)
1 (15 kW)
West Bengal
PV
Wind-Diesel
Bio-mass gasifier
17 (25 to 110 kW)
1 (510 kW)
2 (500 kW)
AssamPV
Micro-hydel
1
1
Andhra Pradesh PVSolar home lighting systems
only
Karnataka PVSolar home lighting systems
only
Kerala micro-hydel2 (55 kW) – but recently got
synchronized with the grid

Isolated SPV power plants in India
Installed capacity (As on 31/01/2009) : 2.8 MWp
Total number of SPV power plants : 230 Nos.
S.No StatePV Capacity
( kWp)No. of power
plants
1 Maharashtra 5 2
2 Chattisgargh 1 to 6 108
3 Rajasthan 17.2534.5
821
4 Jharkhand 28 1
5 Orissa 2 11
6 Haryana 10 -
7 Mizoram 25 1
8 UP (NTPC) 11.9 kW 1
9 West Bengal 25 kW 15

Isolated biomass gasifier power plants in India
S.No StateCapacity
( kW)
No. of power plants
1 Maharashtra 2010
42
2 Chattisgargh 1020
100
551
3 Arunachal Pradesh 10-20 5
4 Jharkhand 50 1
5 Orissa 10010
110
6 Karnataka 1205020
232
7 Tamilnadu 940
120250
60524
8 Bihar 50 2
9 West Bengal 500 2
10 UP 10 15-20
11 Uttaranchal 50 4
12 MP 80 1
13 Nagaland 25010-20
45
14 Meghalaya 10-20 5

Issues- Low plant capacity factor
Name of the plant
PV Capacity( kWp)
Inverter capacity
(kVA)
Charge controller
(kW)
Battery capacity
(Ah)
Battery Voltage(Volts)
DistributionVoltage(Volts)
ConnectedLoad (kW)
PlantCapacity
factor (%)
Dound II,Chattisgargh
1 1.5 2 400 48 230 0.3 5.8
Latdadar,Chattisgargh
2 3 3 500 48 230 0.7 7.1
Chatal,Chattisgargh 3 5 5 800 48 230 0.7 4.4
Gudagarh, Chattisgargh
4 5 5 800 48 230 1.2 6.3
Rajmachi, Maharashtra
5 7.5 5 800 120 230 1.4 8.2
Sura, Udaipur, Rajasthan
17.25 15 20 1200 120 230 5.0 7.3
Nurda village, Jharkhand
28 20 25 1200 120 230 9.5 8.5
Anandgarh, Bikaner, Rajasthan.
34.5 2*15 2*20 2*1200 120 230 10 7.5

Lonarwadi
Dissoli
Rajmachi
Maharashtra
INDIA
More issues- Case study analysis

5 kWp Solar PV power plant at Rajmachi Village, Maharashtra
No. of house holds: 29
Connected load : 1.4 kW

0
200
400
600
800
1000
1200
0:00 2:24 4:48 7:12 9:36 12:00 14:24 16:48 19:12 21:36 0:00
Time (hrs)
Pow
er(
Watt
s)
and V
oltage (
Volts)
VOLTAGE POWER
Measurements
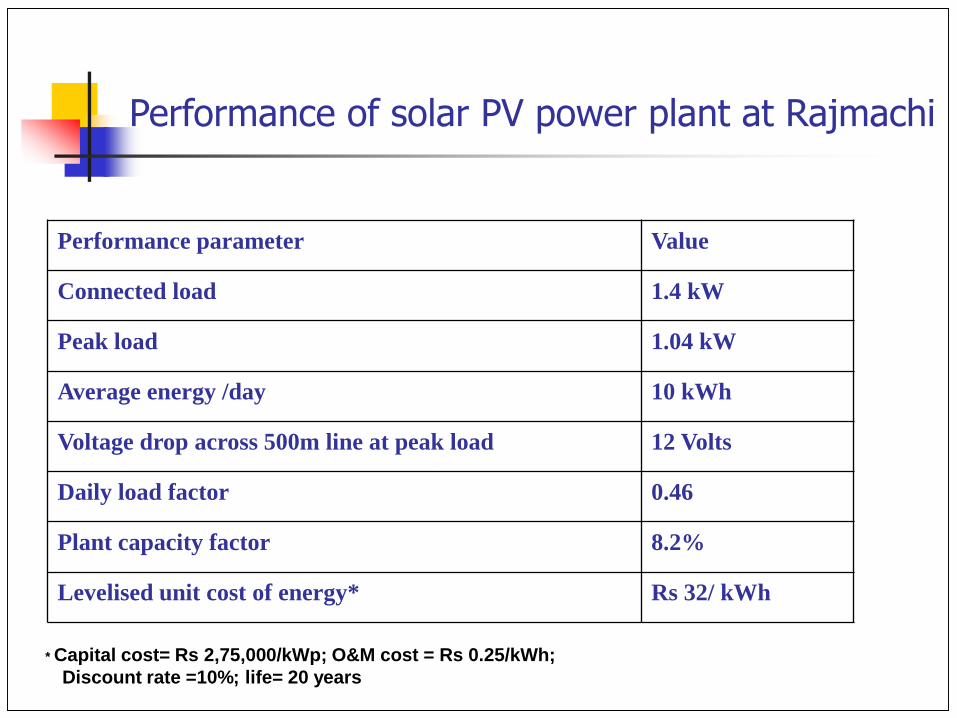
Performance of solar PV power plant at Rajmachi
Performance parameter Value
Connected load 1.4 kW
Peak load 1.04 kW
Average energy /day 10 kWh
Voltage drop across 500m line at peak load 12 Volts
Daily load factor 0.46
Plant capacity factor 8.2%
Levelised unit cost of energy* Rs 32/ kWh
* Capital cost= Rs 2,75,000/kWp; O&M cost = Rs 0.25/kWh;
Discount rate =10%; life= 20 years

20 kWe biomass gasifier plant at Lonarwadi
Gasifier
20 kW
Gasifier
20 kW
Natural
Gas engine
20 kW
Alternator
15 kVA
1500 rpm
Natural
Gas engine
20 kW
Alternator
15 kVA
1500 rpm
A A A
V
Hz
Energy
meter
32 A, 415 V, 4 pole switch
Control pannel
Three phase
Distribution
feeder

Performance of biomass gasifier plant at Lonarwadi
Performance parameter Value
Connected load (kW) 10.7
Peak load (kW) 6.0
Average energy /day(kWh/day) 20-25
Voltage drop across 2 km line at peak load 42 Volts
Daily load factor 0.14
Plant operating efficiency* 14-15 %
Phase voltage variation (Volts) 250.10.4%
251.00.5%
241.00.5%
Frequency variation (Hz) 51.40.4%
Plant capacity factor (%) 4.3 - 5.6
Voltage unbalance (%) 2.66%
Current unbalance (%) 42.94%
Voltage THD (%) 7.82%, 11.01%, 7.91.6%
Current THD (%) 16.04%, 17.41.4%, 10.83%
Levelised unit cost of energy** Rs 45-66/ kWh
* Caloric value of fuel= 20.3 MJ/kg
** Capital cost = Rs 1, 10,000/kW; O&M cost= Rs 0.5/kWh; Discount rate =10%;
Life= 20 years; Fuel cost = Rs 0.5/kg

Three phase distribution network of Lonarwadi (ViPOR)
Distribution network

Measurements
0
10
20
30
40
50
19:20 19:40 20:00 20:20 20:40 21:00 21:20 21:40 22:00
Time (Hrs)
Unbala
nce (
%)
Voltage unbalace (%) Current unbalance (%)
0
4
8
12
16
20
19:20 19:40 20:00 20:20 20:40 21:00 21:20 21:40 22:00
Time (Hrs)
To
tal H
arm
on
ic D
isto
rtio
n (
%)
Voltage A phase Voltage B phase
Voltage C phase Current A phase
Current B phase Current C phase

10 kWe biomass gasifier plant at
Dissoli village, Maharashtra
Gasifier
20 kW
Natural
Gas engine
20 kW
Alternator
15 kVA
1500 rpm
Three phase
Distribution
feeder
100 A
FUSE
MCCB
100 A, 415 V
Dissoli Gasifier

Performance of biomass gasifier plant at Dissoli
Performance parameter Value
Connected load (kW) 6.9
Peak load (kW) 6.345
Average energy /day(kWh/day) 20-22
Plant capacity factor(%) 9.2
Daily load factor 0.15
Plant operating efficiency* 14-15 %
Phase voltage variation (Volts) 231.30.3%.
234.20.3%
245.60.3%
Frequency variation (Hz) 49.40.3%
Plant capacity factor (%) 8.3-9.5
Voltage unbalance factor (%) 3.63%
Current unbalance factor (%) 604%
Voltage THD (%) 4.78%, 10.32%, 8.92%
Current THD (%) 4.48%, 10.13%, 8.92%
Levelised unit cost of energy** Rs 29.5- 36.5/ kWh
* Caloric value of fuel= 20.3 MJ/kg
** Capital cost = Rs 1, 40,000/kW; O&M cost= Rs 0.5/kWh; Discount rate =10%;
Life= 10 years; Fuel cost = Rs 0.5/kg
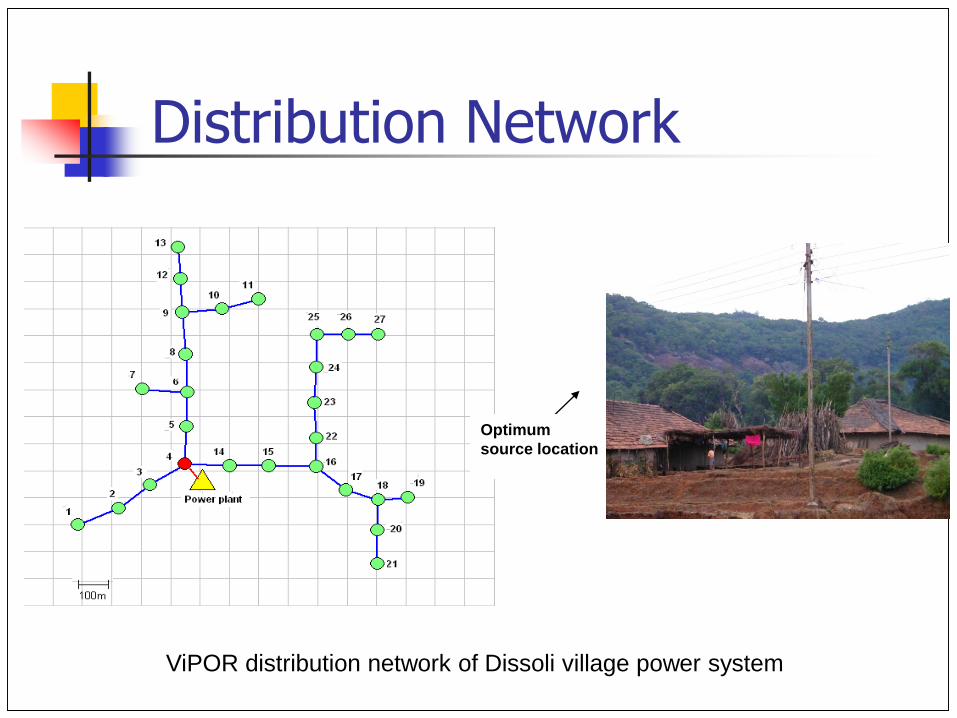
Optimum
source location
ViPOR distribution network of Dissoli village power system
Distribution Network

S. No. Parameter Standard value 10 kWe plant at
Dissoli
20 kWe plant at
Lonarwadi
1 Voltage
Phase ‘A’
2405%
231.30.3% 250.10.4%
Phase ‘B’ 234.20.3% 251.00.5%
Phase ‘C’ 245.60.3% 241.00.5%
2 Frequency 503% 49.40.3% 51.40.4%
3 Voltage unbalance <2% 3.63% 2.66%
4Current unbalance <20% for current
<40A
604% 42.94%
5 Voltage THD
Phase ‘A’
<5%
4.78% 7.82%
Phase ‘B’ 10.32% 11.01%
Phase ‘C’ 8.92% 7.91.6%
6 Current THD
Phase ‘A’ 4.48% 16.04%
Phase ‘B’ 10.13% 17.41.4%
Phase ‘C’ 8.92% 10.83%
IEEE 1159-1995 IEEE 519
Performance of isolated power system- Summary

Design approach
Case study
of sample
systemsAnalysis
Decision
making
Integrated
design
method
Sample
design
INPUT OUTPUT
Develop
generic
guidelines
for
design
Compare
with
Existing
design
methods

Integrated design of Isolated power system
Load estimation
Sizing
Distribution network
using ViPOR
Load flow analysis
Is the current
location of
source gives
minimum loss
Relocate the source
No
Yes
End
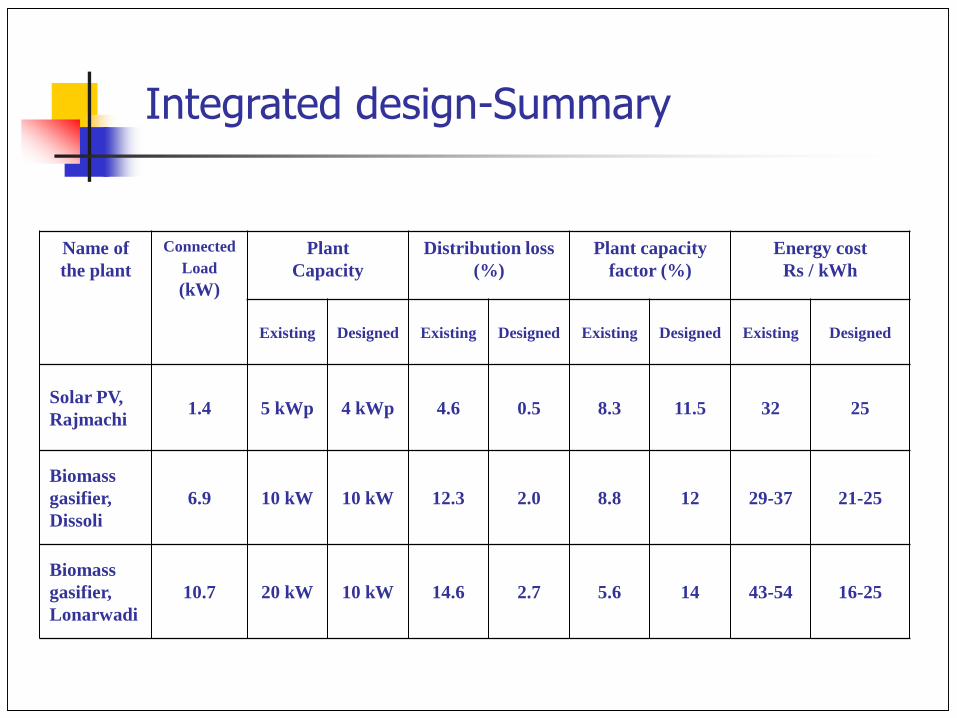
Name of
the plant
Connected
Load
(kW)
Plant
Capacity
Distribution loss
(%)
Plant capacity
factor (%)
Energy cost
Rs / kWh
Existing Designed Existing Designed Existing Designed Existing Designed
Solar PV,
Rajmachi1.4 5 kWp 4 kWp 4.6 0.5 8.3 11.5 32 25
Biomass
gasifier,
Dissoli
6.9 10 kW 10 kW 12.3 2.0 8.8 12 29-37 21-25
Biomass
gasifier,
Lonarwadi
10.7 20 kW 10 kW 14.6 2.7 5.6 14 43-54 16-25
Integrated design-Summary

Photovoltaic array
AC busDC bus
Charge controller
Battery bank
Inverter Load
Sizing of Photovoltaic-Battery Systems
Objective:
To arrive at the set of all feasible configurations (Array rating and Battery
capacity) to meet a given demand following a time-series simulation of the system
Schematic of the System

Mathematical model
Energy balance
Repeatability of battery energy
Non negativity of battery energy
For a small time step, battery energy:
Hourly energy balance
Battery storage requirement
Power from the photovoltaic array

Photovoltaic-Battery System Sizing (Deterministic Approach)
Inputs: Hourly solar insolation data, Hourly load data,
Photovoltaic system efficiency, Power conversion
efficiency
Estimation of the solar insolation incident on the array
System simulation to obtain the minimum array size
and the corresponding battery capacity
Calculation of the minimum storage capacity for
different array sizes greater than the minimum
Plot of sizing curve and the identification of the
design space

Array rating (W)
Ba
tte
ry c
ap
acity (
Wh
)
Infeasible design
region
Minimum array
size
Feasible design region
(design space)
sizing curve
Battery capacity
corresponding to
the minimum array
size
Graphical representation
Sizing curve for given solar insolation profile, load curve and system
characteristics

Mathematical Formulations
Chance constraint:
Incorporating energy conservation equation of the storage:
Deterministic equivalent:
Generation of design space incorporating other constraints
)}()({ tDtDyProbabilit actual
)()(
)(
)(
)(
)(tPtD
ttf
tQ
ttf
ttQyProbabilit actual
BB
))(()(
)(
)(
)()()( ztD
ttf
tQ
ttf
ttQtPactualtP
BB

PV-Battery System
0.6
0.8
1
1.2
1.4
0 1 2 3 4 5 6 7
Array rating (kWp)
Battery
capacity
(kW
h)
α = 0.5
α = 0.7
α = 0.8
α = 0.95

Solar Water Heating System
COLLECTOR
STORAGE
TANK
FROM
OVERHEAD
TANK
TO USAGE
POINT
AUXILIARY
HEATER
STORAGE
TANK
COLLECTOR
PUMP
FROM
OVERHEAD
TANK
TO USAGE
POINT
Schematic of solar water heating system
AUXILIARY
HEATER
Solar Water Heating Systems in India
– Installed Capacity = 1.5 million sq. m. (0.8% of estimated potential)

Model for Potential Estimation of Target Area
Target areaWeather data, area details
Identification and Classification of different end uses by sector (i)
Residential (1) Hospital
(2)Nursing
Homes (3)
Hotels
(4)
Others
(5)
POTENTIAL OF SWHS IN TARGET AREA
Technical Potential (m2 of collector area)
Economic Potential (m2 of collector area)
Market Potential (m2 of collector area)
Energy Savings Potential (kWh/year)
Load Shaving Potential (kWh/ hour for a monthly average day)
Sub-class (i, j)
Classification based on factors* (j)
Technical Potential
Economic Potential Market Potential
Potential for end use
sector (i = 1)
Potential
for i = 2
Potential
for i = 5
Potential
for i = 4
Potential
for i = 3

Base load for heating
Electricity/ fuel savings
Economic viability
Price of electricity
Investment for
SWHS
Technical
PotentialSWHS
capacity
Constraint: roof
area availability
Capacity of SWHS
(Collector area)
TargetAuxiliary heating
Single end use point
Micro simulation using TRNSYS
Hot water
usage pattern
Weather
data
SIMULATION
Auxiliary heating requirement
No. of end
use points
Technical
Potential
Economic
Potential
Economic
Constraint
Market
Potential
Constraint:
market
acceptance
Potential for end use sector (i = 1)
* Factors affecting the adoption/sizing of
solar water heating systems
Sub-class (i, j)
Classification based on factors* (j)
Single end use point
POTENTIAL
SECTOR (i)

Load Curve Representing Energy Requirement for Water Heating for Pune
0
100
200
300
400
500
600
700
800
900
1000
0 2 4 6 8 10 12 14 16 18 20 22 24Hour of day
En
erg
y C
on
sum
pti
on
(M
W)
Typical day of January
Typical day of May
Total Consumption =760 MWh/day
Total Consumption = 390 MWh/day
53%
Electricity Consumption for water heating of Pune
Total Consumption =14300 MWh/day
Total Consumption = 13900 MWh/day
Total Electricity Consumption of Pune

Solar Water Heater Diffusion
0
10
20
30
40
50
60
70
80
1988 1998 2008 2018 2028 2038 2048 2058 2068 2078
Year
Inst
all
ed
Ca
pa
cit
y o
f S
oa
lr W
ate
r H
ea
tin
g
Sy
stem
s (m
illi
on
sq
. m
.)
Actual installed (million sq. m.)Diffusion curve Upper limit of uncertainityLower limit of uncertainity Potential =60 million sq.m.

Diffusion of SWH
0
50
100
150
200
250
300
1990 2010 2030 2050 2070 2090
Year
So
lar W
ate
r H
ea
tin
g C
ap
acit
y (
co
llecto
r a
rea
in
mil
lio
n
sq. m
.)..
Actual installed (million sq. m.)Potential 140 million sq. m.Potential 60 million sq. m.Potential 200 million sq. m.Extrapolated Potential (million sq.m.)
Potential = 60 million m 2
Potential = 140 million m 2
Potential = 200 million m 2
Estimated Potential in
2092 = 199 million m2

Conclusions
Renewables – status in India –mainstreaming
Diffusion curve- Potential estimation
Integration – Load Duration Curve approach –Base and peak capacity
Isolated systems –System design, sizing
DSM options – Micro-macro model
Mainstreaming of renewables- Need for better analysis, planning tools

Acknowledgment
Balkrishna Surve
Project Assistant
Indu R. Pillai
Ph.D - 2008Mel George A.
M.Tech - Ongoing
M.B. Sivapriya
M.Tech - 2008
Thank youManojkumar M.V.M.Tech - Ongoing
Santanu B. Faculty
Arun P. Ph.D. - 2009

References MNES Annual Reports, 2001-2009 Integrated Energy Policy Report, Planning Commission, 2006 11th Five year plan proposal, MNRE, Govt of India www.mnes.nic.in S.P.Sukhatme, Solar Energy, Tata McGraw Hill, Delhi,1997 Banerjee, Comparison of DG options, Energy Policy, 2006 Manish, Pillai, Banerjee, ‘Sustainability analysis of renewables’, Energy for
Sustainable Development , December 2006 Arun P., R. Banerjee, and S. Bandyopadhyay, Solar Energy, in press, 2009. Arun P., Santanu Bandyopadhyay and R. Banerjee, ‘Sizing curve for design of
isolated power systems’, Energy for Sustainable Development,Volume XI, No. 4, December 2007.
George, R. Banerjee,Analysis of impacts of wind integration in the Tamil Nadu grid, in press, Energy Policy
Indu R. Pillai and R. Banerjee, ‘Methodology for estimation of potential for solar water heating in a target area’, Solar Energy, Vol.8, No.2, pp 162-17, 2007.
Pillai and Banerjee,Renewable Energy in India, Status and Potential, Energy, in press
UK Wind speed data: GWEFR Cyf Hourly-mean wind speed datasets for sites in the European Wind Atlas, available at http://www.gwefr.co.uk/datasets.htm
UK load curves: Demand Data, UK National Grid, available at http://www.nationalgrid.com/uk/Electricity/Data/


![[Webinar Slides] Advanced distribution management system integration of renewables and storage](https://static.fdocuments.in/doc/165x107/554a07c5b4c905e56c8b5840/webinar-slides-advanced-distribution-management-system-integration-of-renewables-and-storage.jpg)