Integration of Local and Global Shape Analysis for Logo ...hjs/pubs/neumannprl02.pdf · Integration...
11
Integration of Local and Global Shape Analysis for Logo Classification Jan Neumann a , Hanan Samet a* , Aya Soffer a† a Computer Science Department Center for Automation Research Institute for Advanced Computer Studies University of Maryland College Park, Maryland 20742 [email protected], [email protected], [email protected] A comparison is made of global and local methods for the shape analysis of logos in an image database. The qualities of the methods are judged by using the shape signatures to define a similarity metric on the logos. As representatives for the two classes of methods, we use the negative shape method which is based on local shape information and a wavelet- based method which makes use of global information. We apply both methods to images with different kinds of degradations and examine how a particular degradation highlights the strengths and shortcomings of each method. Finally, we use these results to develop a new adaptive weighting scheme which is based on the relative performances of the two methods. This scheme gives rise to a new method that is much more robust with respect to all degradations examined and works by automatically predicting if the negative shape or wavelet method is performing better. Keywords: shape representation, shape recognition, image databases, symbol recognition, logos 1. Introduction We examine three different approaches for classifying images with several components in an image database. One approach uses a local method to represent the image, the second uses a global method, while the third combines both using an adaptive weighting scheme based on relative performance. The local method uses so-called negative symbols, as described in [7], to compute a number of statistical and morphological shape features for each connected component of an image foreground and background. The global method uses a wavelet decomposition of the horizontal and vertical projections of the global image as described in [3]. As a sample application of well-defined multi-component images, we use logos. Several studies have reported results on some form of logo recognition. Each study used either global or local methods. These include local invariants [2,6], wavelet features [3], neural networks [1], and graphical distribution features [5]. The performance * The support of the National Science Foundation under Grants CDA-95-03994, IRI-97-12715, EIA-99- 00268, and IIS-00-86162 is gratefully acknowledged. † Currently at IBM Research Lab, Haifa 31905, Israel.
Transcript of Integration of Local and Global Shape Analysis for Logo ...hjs/pubs/neumannprl02.pdf · Integration...

Integration of Local and Global Shape Analysis for Logo Classification
Jan Neumanna, Hanan Sameta∗, Aya Soffera†
aComputer Science DepartmentCenter for Automation ResearchInstitute for Advanced Computer StudiesUniversity of MarylandCollege Park, Maryland [email protected], [email protected], [email protected]
A comparison is made of global and local methods for the shape analysis of logos in animage database. The qualities of the methods are judged by using the shape signatures todefine a similarity metric on the logos. As representatives for the two classes of methods,we use the negative shape method which is based on local shape information and a wavelet-based method which makes use of global information. We apply both methods to imageswith different kinds of degradations and examine how a particular degradation highlightsthe strengths and shortcomings of each method. Finally, we use these results to developa new adaptive weighting scheme which is based on the relative performances of the twomethods. This scheme gives rise to a new method that is much more robust with respectto all degradations examined and works by automatically predicting if the negative shapeor wavelet method is performing better.Keywords: shape representation, shape recognition, image databases, symbol recognition,logos
1. Introduction
We examine three different approaches for classifying images with several componentsin an image database. One approach uses a local method to represent the image, thesecond uses a global method, while the third combines both using an adaptive weightingscheme based on relative performance. The local method uses so-called negative symbols,as described in [7], to compute a number of statistical and morphological shape features foreach connected component of an image foreground and background. The global methoduses a wavelet decomposition of the horizontal and vertical projections of the global imageas described in [3]. As a sample application of well-defined multi-component images, weuse logos. Several studies have reported results on some form of logo recognition. Eachstudy used either global or local methods. These include local invariants [2,6], waveletfeatures [3], neural networks [1], and graphical distribution features [5]. The performance
∗ The support of the National Science Foundation under Grants CDA-95-03994, IRI-97-12715, EIA-99-00268, and IIS-00-86162 is gratefully acknowledged.† Currently at IBM Research Lab, Haifa 31905, Israel.

in case of certain degradations was examined. In this paper we compare the local andglobal methods under the influence of several image degradations. The performancemeasure is the ranking of the original logo after inputing a degraded version of it into theclassifier. The results exhibit the advantages and disadvantages of local methods, basedon shape features, in contrast to global methods, rooted in signal processing. Finally,we present an algorithm that combines both methods into a single, robust framework byadaptively weighting the contributions of each method according to an estimate of theirrelative performance.
2. Wavelet Method
We studied logos in the UMD-Logo-Database which are gray-scale images that arescanned versions of black and white logos (Figure 1a). We assume that the logos havealready been segmented and binarized by a preprocessing step. The problems of seg-mentation and threshold selection are beyond the scope of this paper. The classificationmethods should be scale, translation, and rotation invariant. To achieve this, we applysome normalizing steps to the input images before we start the computation of any fea-tures (Figure 1b). After shifting the image so that the centroid of the white pixel locationsis located at the image center, which gives us translational invariance, we rotate the imagearound the centroid so that its major principal axis is aligned with the horizontal. Thisgives us rotational invariance. Finally, we resize the image so that the bounding box ofthe logo symbol is a given percentage of the image size. This accounts for changes inscale of the input logos. These transformations make it possible to perform the followingcomputations without reference to orientation, position, and scale.
Given a normalized image we compute the horizontal and vertical projections (Fig-ures 1c–1d) of this binary image which are defined as P (y) =
∑nx=1 I(x, y) and P (x) =∑m
y=1 I(x, y). This means that we are counting the number of white pixels for each rowand column. Next, we use a wavelet transform to low-pass filter the projections (Fig-ures 1e–1f). In our experiments, we used the Haar wavelet and the Daubechies wavelet.This process is illustrated in Figure 1 for the Haar wavelet. These coefficient vectors,called signatures, are used to compare different logos among each other. We use the L1-Norm to compute the difference between their signatures because the L1-Norm is knownto be robust against outliers [8].
3. The Negative Shape Method
The novel idea of the negative shape method as defined in [7] for the representation ofsymbol-like data such as found in logos is that we compute the shape features not justfor the components of the foreground that constitute the symbol itself, but also for thecomponents that make up the background of the image containing the symbol.
We start by labeling the connected components of the image and its background. Toeach component of the labeled image, we first apply the preprocessing steps described inSection 2 and then compute the following shape features:
1. F1: Invariant moment: Normalized distance of pixel positions to the centroid.
2. F2: Eccentricity: The ratio between the lengths of the major and minor axes.

Original Logo Horizontal Projection
2 4 6 8 10 12 14 160
20
40
60
80
100
120
Lowpass Coeff. of Hor. Proj.
(a) (c) (e)Normalized Logo Vertical Projection
2 4 6 8 10 12 14 160
20
40
60
80
100
120
Lowpass Coeff. of Vert. Proj.
(b) (d) (f)
Figure 1. The steps of the wavelet method: (a) original image, (b) normalized image,(c) horizontal projection, (d) vertical projection, (e) low-pass wavelet coefficients of thehorizontal projection, (f) low-pass wavelet coefficients of the vertical projection (x-axis:index of coefficient, y-axis: coefficient magnitude).
3. F3: Circularity: The ratio between the perimeter of the component and theperimeter of a circle of equivalent area.
4. F4: Rectangularity: The ratio between the area of the component and the areaof its bounding box.
5. F5: Hole Area Ratio: The ratio between the area of the holes inside the compo-nent and the area of the solid part of the component.
6. F6,F7: Horizontal (Vertical) Gap Ratio: The square of the number of pixelsinside the component that have a right (bottom) neighbor that does not belong tothe component divided by the area of the component.
For the negative shape method we define the distance measure between two logos L1
and L2 as follows. First, we normalize the value range for each element of the featurevector over all the logos in the dataset. Then, for each component of L1 we find thecomponent of L2 that has the smallest Euclidean distance in feature space to it. Finally,the average of these minimal distances over all the components of L1 yields a measure forthe distance between the two logos.

4. Comparison Between the Methods
All methods were implemented in MatlabTM and were applied to the logos containedin the UMD-Logo-Database (123 logos, can be found at [9]). The system was tested byproviding it with an input logo and ranking the logos in the database based on theirsimilarity to this logo. Below, we investigate the robustness of the methods when thelogos are corrupted using four different image degradation methods. We choose two globaldegradations as demonstrated in Figures 2a and 2b, and two local degradations as shownin Figures 2c and 2d which we will describe in more detail later. Global degradationmeans that the degradation influences all regions of the image in the same way whileleaving the large-scale image structure intact. Local degradations either influence onlya localized image region (Figure 2c) or leave the small-scale image structure invariant(Figure 2d).
(a) Sensor Noise (b) Subsampling (c) Occlusion (d) Swirl
Figure 2. The two global (a–b) and two local (c–d) types of degradations.
For each method, we degrade the images in the database, varying the amount of degra-dation in ten equally spaced steps. We then classify the logos in the database based onthe computed distance in the feature space to the degraded input, before we examinethe rank–in terms of feature space distance–of the corresponding uncompromised logo.To analyze the influence of a degradation on the performance of a method, we plot thecumulative distribution of the ranks of the original logos which is defined as follows. Leti be the index of a logo and n the number of logos in the database. If we degrade logo iand input it into the classifier, the corresponding original, uncompromised logo will haverank rk(i). The cumulative distribution of the ranks (CDR) is now defined as
CDR(R) =1
n
n∑i=1
φ(rk(i), R) where φ(rk(i), R) =
{1 : rk(i) ≤ R0 : rk(i) > R
. (1)
This monotone function indicates the percentage of the logos for which the classifier hasranked their undegraded match in the database among the first R logos thereby giving usa means to measure the performance of each classifier. In order to show the difference inperformance between the methods that we used, we also included graphs displaying thedifference of the respective CDRs. Note that the closer the CDR is to 1, the better theclassifier performs because the correct matches have been given high ranks.

4.1. Global Degradations: Optical Sensor Noise and Reduced ResolutionTo simulate the image degradation that is caused by processes such as fax transmis-
sions or photo copying, we use the well-known document degradation model by Kanungo,Haralick, and Baird [4]. It models the inversion of individual pixel (from foreground tobackground and vice versa) due to light intensity fluctuations, the sensitivity of the sensorand the thresholding level used in the binarization, as well as the blurring caused by thepoint-spread function of the scanner optical system. We first computed the distance d ofeach pixel from the logo boundary, then we flipped each pixel value with the probabilityp(0|1, d, α) = p(1|0, d, α, α0) = α0e
−αd2. Finally, we correlated the value of neighbouring
pixels by performing a morphological closing operation with a disk structuring element ofdiameter k. For more details, see [4]. In our experiments, we set α0 = 0.5 and k = 2, andα was varied logarithmic steps from 0.05 to 1 as indicated on the x-axis in Figures 3a–3c.An example degraded image is given in Figure 2a.
0.6 0.13 0.0272070
1200
0.2
0.4
0.6
0.8
1
Amount of DegradationRank
Per
cent
age
of L
ogos
Ran
ked
0.6 0.13 0.0272070
1200
0.2
0.4
0.6
0.8
1
Amount of DegradationRank
Per
cent
age
of L
ogos
Ran
ked
0.6 0.13 0.0272070
120−0.4
−0.3
−0.2
−0.1
0
0.1
0.2
0.3
Amount of DegradationRank
Per
cent
age
of L
ogos
Ran
ked
(a) CDR Shape (b) CDR Wavelet (c) Difference of CDRs
0.6 0.2 0.12070
1200
0.2
0.4
0.6
0.8
1
Amount of DegradationRank
Per
cent
age
of L
ogos
Ran
ked
0.6 0.2 0.120
70120
0
0.2
0.4
0.6
0.8
1
Amount of DegradationRank
Per
cent
age
of L
ogos
Ran
ked
0.6 0.2 0.120
70120−0.4
−0.3
−0.2
−0.1
0
0.1
0.2
0.3
Amount of DegradationRank
Per
cent
age
of L
ogos
Ran
ked
(d) CDR Shape (e) CDR Wavelet (f) Difference of CDRs
Figure 3. Performance under global degradations: (a–c) show the results when we addedoptical sensor noise and (d–f) when we reduced the resolution. We see in (a) and (d) thatthe shape method is very sensitive to global degradations, and is noticeably outperformedby the wavelet method as seen in the difference plots in (c) and (f), where we subtractthe CDR of the negative shape method from the CDR of the wavelet method.
The wavelet method outperforms the negative shape method noticeably as can be seenin Figure 3c. Even for large amounts of noise, the wavelet method classifies accuratelyas indicated by the flat CDR in Figure 3b, while the performance of the negative shapemethod worsens rapidly (Figure 3a). It is to be expected that the wavelet method outper-

forms the negative shape method when we simulate optical sensor noise because flippingforeground and background pixels with equal probability should have only a small effecton the distribution of white and black pixels in a row or column, and thus the projectionshould not change much. On the other hand, in the negative shape method, we computethe feature vectors only on a small subset of the pixels of each component. In this case,the noise will change the spatial distribution of the pixels more drastically because of thesmaller number of pixels involved. Thus the negative shape method is less robust towardsoptical sensor noise than the wavelet method.
To see how the methods handle differences in image resolution, which is obviously notoffset by the scaling invariance since we work on digitized images, we reduce the sizeof the input images through sub-sampling using bilinear interpolation (e.g., Figure 2b).The parameter value is the size ratio between the original and the sub-sampled image asindicated on the x-axis in Figures 3d–3f).
As before, the wavelet method outperforms the negative shape method (Figure 3f),although the negative shape method does not exhibit the same breakdown in performanceas in the case of random noise (Figure 3d). Since we use the low-pass wavelet coefficientsfor the classifier, the reduced resolution does not influence the performance of the waveletmethod drastically. This is because subsampling an image by bilinear interpolation has asimilar effect as low-pass filtering the image. The low-pass wavelet coefficients of a low-pass filtered image are in general very similar to the low-pass coefficients computed onthe original image. As before, the negative shape method is affected by this degradationbecause even when large scale changes are hardly visible, local shape features such ascircularity, rectangularity and gap ratios are more susceptible to local changes due to aloss of detail.
4.2. Local Degradations: Occlusion and SwirlTo model the occlusion of parts of a logo, we add a component to the logo image which
in this case is a black rectangle of varying size (see Figure 2c). The parameter here is thepercentage of the image that is occluded by the rectangle.
The performance graphs show that occlusion has a greater effect on the wavelet methodthan the negative shape method (Figures 4a–4c) although both methods are able to handlesmall occlusions well. Since the addition of an extra object or the omission of parts ofthe image causes global changes to the distribution of pixels in each row or column, theprojections are strongly affected and thus so are the wavelet coefficients. Because ofthe local structure of the shape features, the components that are not occluded are notdegraded at all and their feature values are unchanged. In the classifier we average thebest feature vector matches for all the components in the input image. Since an occlusionis more likely to combine components into larger aggregates than to break them into manynew ones, these few new components which do not have a corresponding component in theoriginal image, are influencing the feature distance only to a small extent. Except for verydegenerate configurations, the influence of the new components is averaged out by thecontinuing good matches of the feature vectors of the remaining uninfluenced components.
Swirling is a smooth deformation of an image which can be used to model a non-isotropicstretching of a logo. The relative position of each row is shifted to the left or right byan offset given by a smooth function, where the offset is limited to a certain percentage

0.02 0.125 0.2520
70120
0
0.2
0.4
0.6
0.8
1
Amount of DegradationRank
Per
cent
age
of L
ogos
Ran
ked
0.02 0.125 0.2520
70120
0
0.2
0.4
0.6
0.8
1
Amount of DegradationRank
Per
cent
age
of L
ogos
Ran
ked
0.02 0.125 0.252070
120−0.4
−0.3
−0.2
−0.1
0
0.1
0.2
0.3
Amount of DegradationRank
Per
cent
age
of L
ogos
Ran
ked
(a) CDR Shape (b) CDR Wavelet (c) Difference of CDRs
0.02 0.13 0.252070
1200
0.2
0.4
0.6
0.8
1
Amount of DegradationRank
Per
cent
age
of L
ogos
Ran
ked
0.02 0.13 0.2520
70120
0
0.2
0.4
0.6
0.8
1
Amount of DegradationRank
Per
cent
age
of L
ogos
Ran
ked
0.02 0.13 0.2520
70120−0.4
−0.3
−0.2
−0.1
0
0.1
0.2
0.3
Amount of DegradationRank
Per
cent
age
of L
ogos
Ran
ked
(d) CDR Shape (e) CDR Wavelet (f) Difference of CDRs
Figure 4. Local degradations: (a–c) shows the results for the occlusion and (d–f) theresults for the swirl. Notice how the local degradations affect the performance of thewavelet method much more than the negative shape method as indicated in the differenceplots (c) and (f), where we subtract the CDR of the negative shape method from theCDR of the wavelet method.
of the image width which is given as a parameter. This deforms the logo as if we wouldstretch a rubber sheet in different directions (see Figure 2d).
This degradation has very different effects on the two methods. The performance ofthe wavelet method worsens rapidly with increasing swirl until we basically get a randomranking, as indicated by the linear increase of the CDR in Figure 4e. In contrast, thenegative shape method classifies much better as seen in the difference of the CDRs inFigure 4f because it is possible to approximate this deformation by localized similaritytransforms since the deformation is smooth. The local features used by the negativeshape method are invariant to similarity transforms due to the component normalization.Therefore, it is much less affected by this degradation than the wavelet method. Recallthat the wavelet method is only globally invariant to similarity transforms due to theglobal preprocessing, but not locally.
5. The Best of both Worlds: A Combination of the two Methods
In Section 4 we saw that the wavelet and the negative shape methods perform verydifferently if the input logo is corrupted by either local or global degradations. Thus,if we were able to detect which method is performing better, then we could devise aswitching mechanism that chooses the better performing method automatically.
−90 −50 0 50 900.1
1
100
Rank Difference
Ra
tio
−90 −50 0 50 900.1
1
10
Rank Difference
Ra
tio
−90 −50 0 50 900.1
1
10
Rank Difference
Ratio
−90 −50 0 50 900.1
1
10
Rank Difference
Ra
tio
(a) Sensor Noise (b) Subsampling (c) Occlusion (d) Swirl
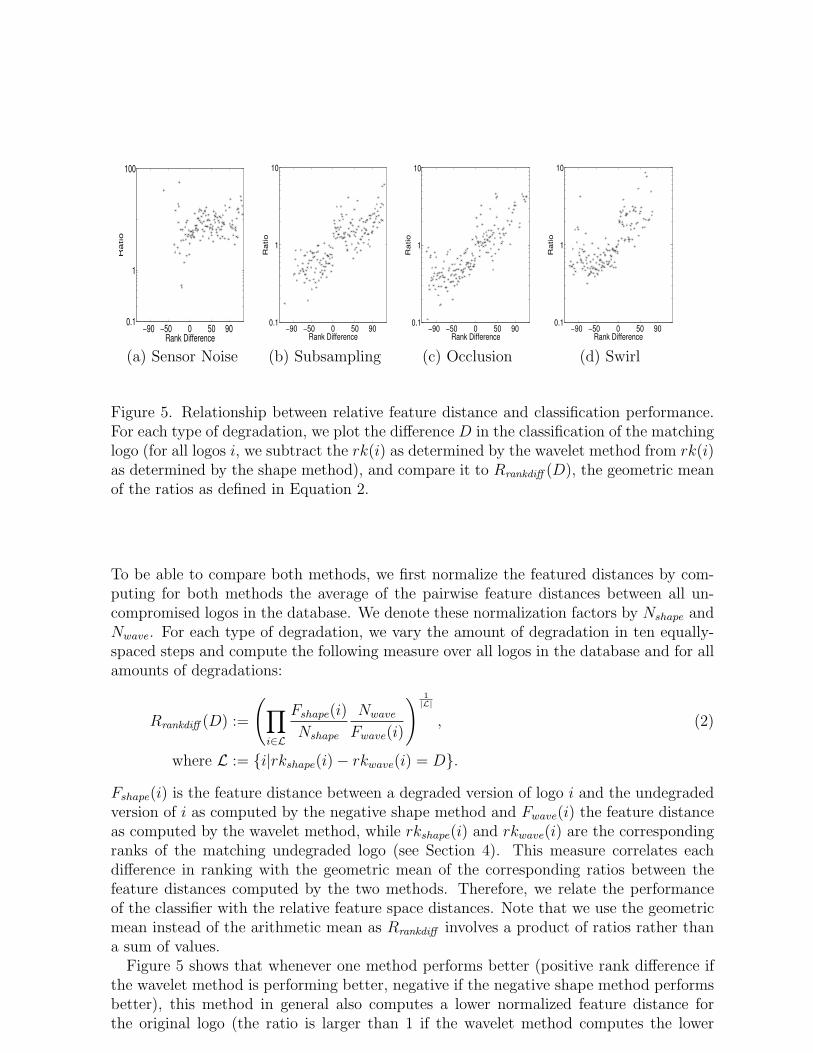
Figure 5. Relationship between relative feature distance and classification performance.For each type of degradation, we plot the difference D in the classification of the matchinglogo (for all logos i, we subtract the rk(i) as determined by the wavelet method from rk(i)as determined by the shape method), and compare it to Rrankdiff (D), the geometric meanof the ratios as defined in Equation 2.
To be able to compare both methods, we first normalize the featured distances by com-puting for both methods the average of the pairwise feature distances between all un-compromised logos in the database. We denote these normalization factors by Nshape andNwave. For each type of degradation, we vary the amount of degradation in ten equally-spaced steps and compute the following measure over all logos in the database and for allamounts of degradations:
Rrankdiff (D) :=
(∏i∈L
Fshape(i)
Nshape
Nwave
Fwave(i)
) 1|L|
, (2)
where L := {i|rkshape(i)− rkwave(i) = D}.
Fshape(i) is the feature distance between a degraded version of logo i and the undegradedversion of i as computed by the negative shape method and Fwave(i) the feature distanceas computed by the wavelet method, while rkshape(i) and rkwave(i) are the correspondingranks of the matching undegraded logo (see Section 4). This measure correlates eachdifference in ranking with the geometric mean of the corresponding ratios between thefeature distances computed by the two methods. Therefore, we relate the performanceof the classifier with the relative feature space distances. Note that we use the geometricmean instead of the arithmetic mean as Rrankdiff involves a product of ratios rather thana sum of values.
Figure 5 shows that whenever one method performs better (positive rank difference ifthe wavelet method is performing better, negative if the negative shape method performsbetter), this method in general also computes a lower normalized feature distance forthe original logo (the ratio is larger than 1 if the wavelet method computes the lower

normalized feature distance, the ratio is smaller than 1 if the negative shape methodcomputes the lower normalized feature distance). Understanding this relationship betweenthe change in the ratio of the normalized feature distances and the relative performanceof the two methods when applied to degraded images enabled us to adaptively weight therespective contributions of the two methods when combining them into a single distancemeasure. Therefore, in order to take advantage of the respective strengths of both methodswe devised the following performance-dependent weighting scheme.
Let the vector of feature distances of the degraded logo i to all undegraded logos inthe database be Dshape(i) for the negative shape method and be Dwave(i) for the waveletmethod. Moreover, denote their means by Ashape(i) and by Awave(i), respectively. Now, ifthe ratio
Ran(i) =Ashape(i)
Nshape
Nwave
Awave(i)(3)
indicates that one of the two methods is performing worse than expected, then we decreaseits weight in the final classification and increase the weight of the other method. Thecombined feature distance vector Dcomb(i) for the degraded input logo i is then a weightedsum of Dwave(i) and Dshape(i):
Dcomb(i) = Ran(i)Dwave(i)
Nwave
+ Ran(i)−1Dshape(i)
Nshape
(4)
If the ratio Ran decreases (increases), this indicates that the degradation of the inputlogo causes the wavelet method to compute feature distances larger (smaller) than thenegative shape method. Consequently, the weight of Dwave with respect to Dshape inEquation 4 will be reduced (increased), because we have less (more) confidence in thewavelet method’s ability to classify the input logo correctly than in the negative shapemethod’s ability to do so.
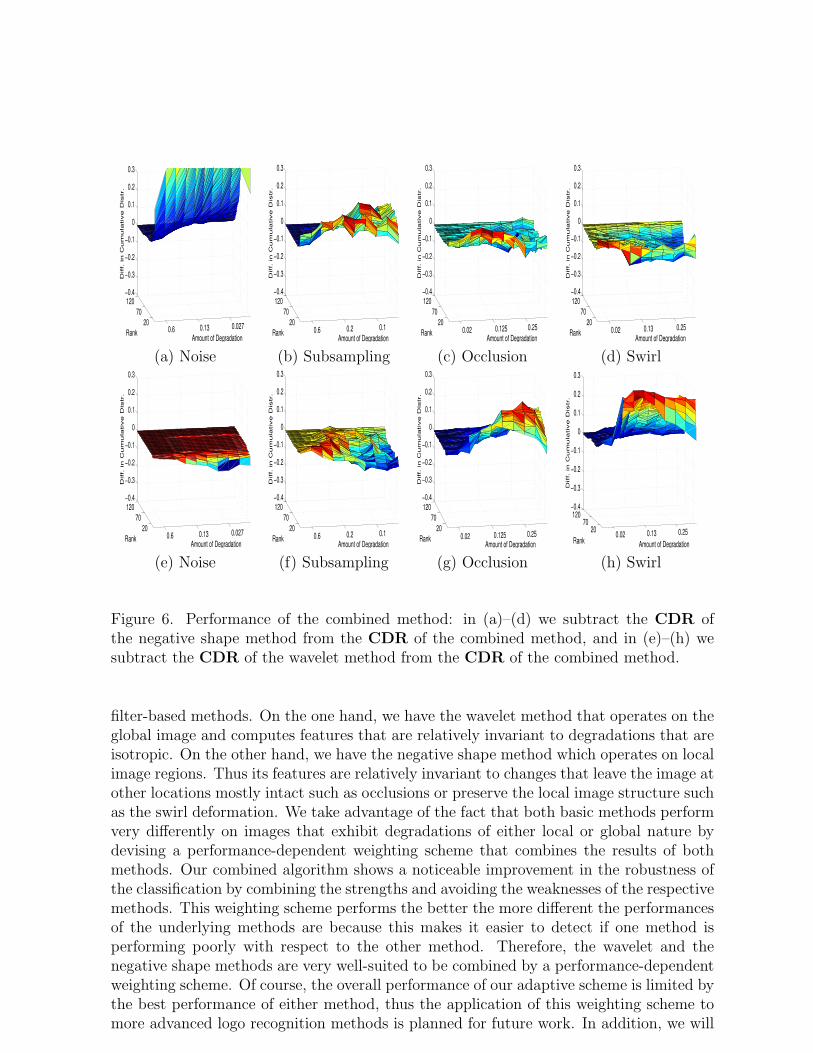
This adaptive weighting scheme increases the robustness of the classification dramat-ically. Comparing the performance of the combined method on the images degraded asdescribed in Section 4, we see that our weighting scheme is able to detect the changein relative performance and adjust the weights to mimic the classification of the bet-ter performing method. Almost always the combined method equals the performanceof the better method (Figures 6c,d,e,f) and surpasses by far the worse method (Figures6a,b,g,h) in terms of the CDR. This shows that our combined scheme is effective incapturing global as well as local shape information and is thus able to deal well with allthe image degradations of the kind that we described.
6. Summary and Future Work
Both the wavelet as well as the negative shape method are well-suited for certain kindsof image degradations but are very sensitive to others. This discrepancy in performancecan be explained by the difference between local shape feature-based methods and global
0.6 0.13 0.0272070
120−0.4
−0.3
−0.2
−0.1
0
0.1
0.2
0.3
Amount of DegradationRank
Diff.
in
Cu
mu
lative
Dis
tr.
0.6 0.2 0.12070
120−0.4
−0.3
−0.2
−0.1
0
0.1
0.2
0.3
Amount of DegradationRank
Diff.
in
Cu
mu
lative
Dis
tr.
0.02 0.125 0.252070
120−0.4
−0.3
−0.2
−0.1
0
0.1
0.2
0.3
Amount of DegradationRank
Diff.
in
Cu
mu
lative
Dis
tr.
0.02 0.13 0.252070
120−0.4
−0.3
−0.2
−0.1
0
0.1
0.2
0.3
Amount of DegradationRank
Diff.
in
Cu
mu
lative
Dis
tr.
(a) Noise (b) Subsampling (c) Occlusion (d) Swirl
0.6 0.13 0.0272070
120−0.4
−0.3
−0.2
−0.1
0
0.1
0.2
0.3
Amount of DegradationRank
Diff.
in
Cu
mu
lative
Dis
tr.
0.6 0.2 0.12070
120−0.4
−0.3
−0.2
−0.1
0
0.1
0.2
0.3
Amount of DegradationRank
Diff.
in
Cu
mu
lative
Dis
tr.
0.02 0.125 0.2520
70120−0.4
−0.3
−0.2
−0.1
0
0.1
0.2
0.3
Amount of DegradationRank
Diff. in C
um
ula
tive D
istr
.
0.02 0.13 0.252070
120−0.4
−0.3
−0.2
−0.1
0
0.1
0.2
0.3
Amount of DegradationRank
Diff.
in
Cu
mu
lative
Dis
tr.
(e) Noise (f) Subsampling (g) Occlusion (h) Swirl
Figure 6. Performance of the combined method: in (a)–(d) we subtract the CDR ofthe negative shape method from the CDR of the combined method, and in (e)–(h) wesubtract the CDR of the wavelet method from the CDR of the combined method.
filter-based methods. On the one hand, we have the wavelet method that operates on theglobal image and computes features that are relatively invariant to degradations that areisotropic. On the other hand, we have the negative shape method which operates on localimage regions. Thus its features are relatively invariant to changes that leave the image atother locations mostly intact such as occlusions or preserve the local image structure suchas the swirl deformation. We take advantage of the fact that both basic methods performvery differently on images that exhibit degradations of either local or global nature bydevising a performance-dependent weighting scheme that combines the results of bothmethods. Our combined algorithm shows a noticeable improvement in the robustness ofthe classification by combining the strengths and avoiding the weaknesses of the respectivemethods. This weighting scheme performs the better the more different the performancesof the underlying methods are because this makes it easier to detect if one method isperforming poorly with respect to the other method. Therefore, the wavelet and thenegative shape methods are very well-suited to be combined by a performance-dependentweighting scheme. Of course, the overall performance of our adaptive scheme is limited bythe best performance of either method, thus the application of this weighting scheme tomore advanced logo recognition methods is planned for future work. In addition, we will

try to improve the synergy between the two methods by using local image information toestimate how much an image region is degraded and then use this locality information toadaptively weight the feature vectors on the component level.
REFERENCES
1. F. Cesarini, E. Fracesconi, M. Gori, S. Marinai, J. Q. Sheng, and G. Soda. A neural-based architecture for spot-noisy logo recognition. In Proceedings of the Fourth In-ternational Conference on Document Analysis and Recognition, pages 175–179, Ulm,Germany, August 1997.
2. D. Doermann, E. Rivlin, and I. Weiss. Applying algebraic and differential invariantsfor logo recognition. Machine Vision and Applications, 9(2):73–86, 1996.
3. M. Y. Jaisimha. Wavelet features for similarity based retrieval of logo images. InProceedings of the SPIE, Document Recognition III, volume 2660, pages 89–100, SanJose, CA, January 1996.
4. T. Kanungo, R. M. Haralick, H. S. Baird, W. Stuezle, and D. Madigan. Statistical,nonparametric methodology for document degradation model validation. IEEE Trans-actions on Pattern Analysis and Machine Intelligence, 22(11):1209–1223, November2000.
5. T. Kato. Database architecture for content-based image retrieval. In Proceedings ofthe SPIE, Image Storage and Retrieval Systems, volume 1662, pages 112–123, SanJose, CA, February 1992.
6. M. Kliot and E. Rivlin. Shape retrieval in pictorial databases via geometric features.Technical Report CIS9701, Technion - IIT, Computer Science Department, Haifa,Israel, 1997.
7. A. Soffer and H. Samet. Using negative shape features for logo similarity matching.In Proceedings of the 14th International Conference on Pattern Recognition, pages571–573, Brisbane, Australia, August 1998.
8. G. Strang and T. Nguyen. Wavelets and Filter Banks. Wellesley-Cambridge Press,Wellesley, MA, 1996.
9. http://documents.cfar.umd.edu/resources/database/umdlogo.html.