Integrating Water Risk in Corporate Bond Valuation and...
12
Integrating Water Risk in Corporate Bond Valuation and Portfolio Stress Testing Simone Dettling, 7 th July 2015
Transcript of Integrating Water Risk in Corporate Bond Valuation and...
Integrating Water Risk in Corporate Bond
Valuation and Portfolio Stress Testing
Simone Dettling, 7th July 2015
1) Tool for Integrating Water Risk in
Corporate Bond Valuation

Project
Partners
Project Partners
Expert
Council
(Examples)

Purpose: Enable finance professionals to quantify water metrics
and incorporate water risks in the credit risk analysis, e.g. for
corporate bond valuations.
Approach - Overview:
Approach
1) Calculate shadow prices for water worldwide that reflect water
scarcity and demand drivers.
2) Combine company data on location of operations and water
use by location with the location-specific shadow price for water.
3) Model potential impact of increased water costs on company
financials and adjust credit ratios.
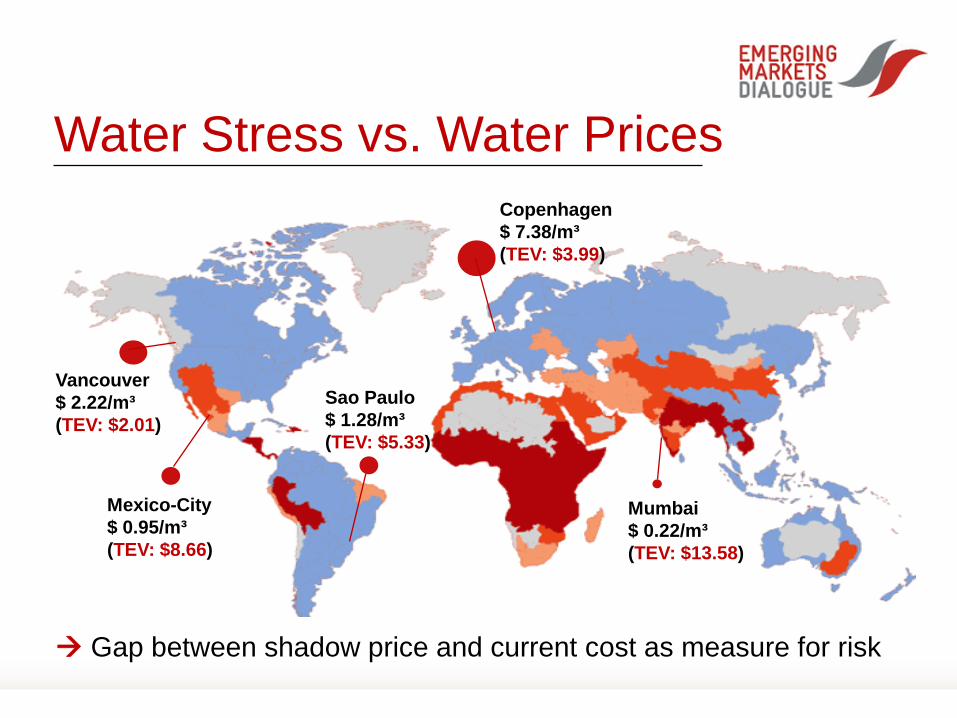
Water Stress vs. Water Prices
Copenhagen
$ 7.38/m³
(TEV: $3.99)
Mumbai
$ 0.22/m³
(TEV: $13.58)
Mexico-City
$ 0.95/m³
(TEV: $8.66)
Vancouver
$ 2.22/m³
(TEV: $2.01)
Sao Paulo
$ 1.28/m³
(TEV: $5.33)
Gap between shadow price and current cost as measure for risk

The Value of Water
Agricultural values
Domestic supply values
Human health impacts
Environmental impacts
Population weighting
Opportunity cost based on level of water stress (WRI)

Barrick Gold
Location Name Latitude Longitude
Water Use
in Thousand m3
2010 TEV
$/m3
2020 TEV,
$/m3
Hemlo, Ontario, Canada 48.68 -85.98 1,042 0.11 0.11
Lagunas Norte, Peru -12.06 -77.1 732 11.56 11.41
Lumwana Copper, Zambia -11.82 25.13 2,729 0.11 0.11
Nevada, USA 38.8 -116.42 15,158 3.29 3.29
Porgera, Papua New Guinea -5.46 143.15 32,410 0.51 0.51
Pueblo Viejo, Dom. Republic 18.4 -70.77 18,484 5.54 5.26
Super Pit, Australia -30.79 121.5 18,631 8.16 8.16
Veladero, Argentina -27.91 -68.92 1,473 3.29 3.29
Zaldivar Copper, Chile -33.23 -70.8 6,920 12.69 13.58
Example: Mining Companies

%age Difference With Water Costs 2014 2015 2016 2017
Barrick Gold EBITDA/Revenues, % -8% -8% -8% -8% Net debt/EBITDA, X 12% 33% 48% 60%
BHP Billiton EBITDA/Revenues, % -7% -7% -7% -7% Net debt/EBITDA, X 19% 38% 83% 347%
Rio Tinto EBITDA/Revenues, % -33% -32% -32% -32% Net debt/EBITDA, X 99% 146% 199% 264%
Vale EBITDA/Revenues, % -2% -2% -2% -2% Net debt/EBITDA, X 0% -3% -7% -14%
Vedanta EBITDA/Revenues, % -20% -20% -20% -20% Net debt/EBITDA, X 32% 42% 52% 65%
Example: Mining Companies

This tool provides:
• a measure for the water risk exposure of companies and
potential impact on credit ratios
• under average current and projected water supply and demand
• for direct risk exposure per company (microeconomic perspective)
Open Questions/Next steps:
• How would companies fare in a specific environmental shock
scenario, such as a prolonged drought.
• How would your portfolio/loan book fare in an environmental
shock scenario?
Next Steps

2) Environmental Stress Testing for
Lending and Investment Portfolios

1) Develop science-based scenarios for
droughts in several G20 markets and their
impacts on water availability.
2) Create index of exposure to water scarcity
for companies in different sectors and model
both direct economic costs at company level
and macro-economic impacts.
3) Model impacts to non-performing loan rates
Academia (Cambridge Center for
Climate Change, Stockholm Environment Institute)
(Re-)Insurance Industry and
service providers
Pilot Project: Stress Testing
Output: Methodology to stress-test lending portfolios for drought scenarios
Starting October 2015, 5-10 Partner FI from G20 Economies