Integrating The Process of determining Mizaj(Temprament ...
92
See discussions, stats, and author profiles for this publication at: https://www.researchgate.net/publication/278405493 Integrating The Process of determining Mizaj(Temprament) in Hospital Management system Article · July 2012 CITATIONS 0 READS 100 1 author: Murtaza Mohiuddin Junaid Farooque Dhofar University 9 PUBLICATIONS 0 CITATIONS SEE PROFILE All content following this page was uploaded by Murtaza Mohiuddin Junaid Farooque on 16 June 2015. The user has requested enhancement of the downloaded file. All in-text references underlined in blue are added to the original document and are linked to publications on ResearchGate, letting you access and read them immediately.
Transcript of Integrating The Process of determining Mizaj(Temprament ...

Seediscussions,stats,andauthorprofilesforthispublicationat:https://www.researchgate.net/publication/278405493
IntegratingTheProcessofdeterminingMizaj(Temprament)inHospitalManagementsystem
Article·July2012
CITATIONS
0
READS
100
1author:
MurtazaMohiuddinJunaidFarooque
DhofarUniversity
9PUBLICATIONS0CITATIONS
SEEPROFILE
AllcontentfollowingthispagewasuploadedbyMurtazaMohiuddinJunaidFarooqueon16June2015.
Theuserhasrequestedenhancementofthedownloadedfile.Allin-textreferencesunderlinedinblueareaddedtotheoriginaldocument
andarelinkedtopublicationsonResearchGate,lettingyouaccessandreadthemimmediately.

“Euro crisis: the failure of optimum currency areas”
Prof. Dhirendra Kumar, Asst. Professor, SIBAR, Pune
Dr. R. Ganesan, Director, AIMS, Pune
Ms. Gauri Pathak, Asst. Professor, AIMS, Pune
“A study on short run and long run analysis of IPOs listed from 2007 to 2011”
Dr. Jigna C. Trivedi, Asst. Professor, Shri Jairambhai Patel Institute of Business Management & Computer Application,
Gandhinagar, Gujarat
“Is ‘Innovation’ the new age mantra, for FMCG in India ?”
Shri Pradip P. Chatterjjee, Research Scholar
“An explorative study on political marketing in Western Orissa”
Dr. Srinibash Dash, Sr. Lecturer, Gangadhar Meher (Auto.) College, Sambalpur
Sri Sisir Ranjan Dash, Lecturer, Gangadhar Meher (Auto.) College, Sambalpur
“Cold calling - ‘the strategic way of selling to unknown potential prospect’”
Prof. Jignesh R. Vaja, HOD, Asst. Professor, Sarvoday College of Management & Tech. (MBA), Limbdi, Gujarat
Prof. Prakashraj P. Kumavat, Asst. Professor, Sarvoday College of Management & Tech. (MBA), Limbdi, Gujarat
“Employee perceptions of performance appraisal with respect to fairness and utility in select manufacturing companies
in and around Pune”
Prof. Netra Neelam, Asst. Professor, Symbiosis Centre for Management Studies, Pune
Dr. Deepa Tanksale, Asst. Professor, Symbiosis Centre for Management Studies, Pune
“Leadership for institution building”
Dr. Sanjay Kaptan, Head, Department of Commerce and Research Centre, University of Pune
“Training and Development”
Prof. S. D. Bagade, Asst. Professor, AIMS, Pune
“Incident Management”
Mr. P. R. Ramdas, Head, Plant Engineering & EHS, Intervet India Pvt. Ltd., Pune
“Growth of education sector in India with Public-Private Partnership”
Dr. Vikas Saraf, Professor & Additional Director, Vidyasagar Institute of Management (VIM), Bhopal (M.P.)
Dr. Mahendra Singhai, Asst. Professor, Geetanjali Girls P.G. College, Bhopal (M.P.)
Ms. Lata Yadav, Asst. Professor, Vidyasagar Institute of Management (VIM), Bhopal (M.P.)
“Integrating the process of determining mizaj (temperament) in a hospital management system”
Saeed Afrough, Dept. of Computer, Tiran Branch, Islamic Azad University, Tiran, Iran
Prof. Murtaza M. Junaid Farooque, Associate Professor, AIMS, Pune
Pune / Vol. II - Issue 2 / July - Dec. 2012 (Half Yearly) / Price 300/-

“ALLANA MANAGEMENT JOURNAL OF RESEARCH” half yearly magazine is
printed and published by Dr. R. Ganesan for the owner - Allana Institute of
Management Sciences, Pune, printed at Yash Enterprises, 15 Park View Co-
Op. Society, 1019, New Nana Peth, Pudamjee Park, Pune - 411002 and published
at M.C.E. Society’s, Allana Institute of Management Sciences, 2390-B, K.B.
Hidayatullah Road, Azam Campus, Pune - 411001. Chief Editor - Dr. R. Ganesan

FINANCE
MARKETING
MANAGEMENT
HUMAN
RESOURCES
MANAGEMENT
GENERAL
MANAGEMENT
“EURO CRISIS: THE FAILURE OF OPTIMUM CURRENCY AREAS”
PROF. DHIRENDRA KUMAR, ASST. PROFESSOR, SIBAR, PUNE
DR. R. GANESAN, DIRECTOR, AIMS, PUNE
MS. GAURI PATHAK, ASST. PROFESSOR, AIMS, PUNE
“A STUDY ON SHORT RUN AND LONG RUN ANALYSIS OF IPOS LISTED IN 2007 TO 2011”
DR. JIGNA C. TRIVEDI, ASST. PROFESSOR, SHRI JAIRAMBHAI PATEL INSTITUTE OF BUSINESS MANAGEMENT
AND COMPUTER APPLICATION,GANDHINAGAR, GUJRAT
“IS ‘INNOVATION’ THE NEW AGE MANTRA, FOR FMCG IN INDIA ?”
SHRI PRADIP P. CHATTERJJEE,RESEARCH SCHOLAR
“AN EXPLORATIVE STUDY ON POLITICAL MARKETING IN WESTERN ORISSA”
DR. SRINIBASH DASH, SR. LECTURER, GANGADHAR MEHER (AUTO.) COLLEGE, SAMBALPUR
SRI SISIR RANJAN DASH, LECTURER, GANGADHAR MEHER (AUTO.) COLLEGE, SAMBALPUR
“COLD CALLING - 'THE STRATEGIC WAY OF SELLING TO UNKNOWN POTENTIAL PROSPECT'”
JIGNESH R. VAJA, HOD, ASST. PROFESSOR, SARVODAY COLLEGE OF MANAGEMENT & TECH.(MBA), LIMBDI, GUJARAT
PRAKASHRAJ P. KUMAVAT, ASST. PROFESSOR, SARVODAY COLLEGE OF MANAGEMENT & TECH.(MBA), LIMBDI, GUJARAT
“EMPLOYEE PERCEPTIONS OF PERFORMANCE APPRAISAL WITH RESPECT TO FAIRNESS AND UTILITY IN SELECT
MANUFACTURING COMPANIES IN AND AROUND PUNE”
PROF. NETRA NEELAM, ASSISTANT PROFESSOR, SYMBIOSIS CENTRE FOR MANAGEMENT STUDIES, PUNE
DR. DEEPA TANKSALE, ASSISTANT PROFESSOR, SYMBIOSIS CENTRE FOR MANAGEMENT STUDIES, PUNE
“LEADERSHIP FOR INSTITUTION BUILDING”
DR. SANJAY KAPTAN, HEAD, DEPARTMENT OF COMMERCE AND RESEARCH CENTRE, UNIVERSITY OF PUNE
“TRAINING AND DEVELOPMENT”
PROF. S.D. BAGADE, ASST. PROFESSOR, AIMS, PUNE
“INCIDENT MANAGEMENT”
MR. HEAD, P. R. RAMDAS, PLANT ENGINEERING & EHS, INTERNET INDIA PVT. LTD., PUNE
GROWTH OF EDUCATION SECTOR IN INDIA WITH PUBLIC-PRIVATE PARTNERSHIP”“
DR. VIKAS SARAF, PROFESSOR & ADDITIONAL DIRECTOR, VIDYASAGAR INSTITUTE OF MANAGEMENT (VIM), BHOPAL (M.P)
DR. MAHENDRA SINGHAI, ASSISTANT PROFESSOR, GEETANJALI GIRLS P.G. COLLEGE, BHOPAL(M.P)
MS. LATA YADAV, ASSISTANT PROFESSOR, VIDYASAGAR INSTITUTE OF MANAGEMENT (VIM), BHOPAL (M.P)
INTEGRATING THE PROCESS OF DETERMINING MIZAJ (TEMPRAMENT) IN A HOSPITAL DRQSZMANAGEMENT SYSTEM”
SAEED AFROUGH, DEPT OF COMPUTER,TIRAN BRANCH, ISLAMIC AZAD UNIVERSITY, TIRAN, IRAN
PROF. MURTAZA M. JUNAID FAROOQUE, ASSOCIATE PROFESSOR, AIMS, PUNE
15
25
36
39
46
51
61
64
70
76
82
ALLANA MANAGEMENT JOURNAL OF RESEARCH /JULY - DEC 2012 / PAGE NO. 001
ALLANA MANAGEMENT JOURNAL OF RESEARCHCONTENTS
JULY - DECEMBER, 2012

CHIEF EDITOR
DR. R. GANESAN
DIRECTOR, AIMS
ADVISOR
DR. A. B. RAO
SENIOR RESEARCH GUIDE & MANAGEMENT CONSULTANT
EDITORS
DR. ASHRAF RIZVI
PROFESSOR, IIM, INDORE
DR. ROSHAN KAZI
PROFESSOR, AIMS
DR. (MRS.) SURYA RAMDAS
DIRECTOR, ALARD INSTITUTE OF MANAGEMENT SCIENCES
ASST. EDITORS
PROF. ASHFAQUE AHMED PINITOD
ASST. PROFESSOR, UNIVERSITY OF YAMBU, KINGDOM OF SAUDI, ARABIA
PROF. S. D. BAGADE
ASST. PROFESSOR, AIMS
ALLANA MANAGEMENT JOURNAL OF RESEARCH /JULY - DEC 2012 / PAGE NO. 002
EDITORIAL
BOARD
he enthusiastic response and earnest appreciation from
Tresearchers, academicians and readers to the earlier
issues of this journal has encouraged the editorial
committee to select only those articles of variety and relevance
in research content. Research in Management, Information
Technology and Commerce, that is based on originality genuine
findings, realistic interpretations, deserves encouragement.
Towards this objective, “Allana Management Journal of
Research” has been striving its utmost.
With technological advances and inter-disciplinary approach,
research in every sphere of human activity becomes all the more
imperative, in this age characterised by challenges of change,
multiplicity and complexity.
Contributors to this journal have given expression to their
research in their respective articles. The editorial committee
conveys its best wishes to all the contributors, readers and
subscribers to this journal on the occasion of the ensuing New
Year 2013.
May the New Year usher in happiness and prosperity !!!.
DR. R. GANESAN
CHIEF EDITOR
ALLANA MANAGEMENT JOURNAL OF RESEARCH /JULY - DEC 2012 / PAGE NO. 003
EDITORIAL
ALLANA MANAGEMENT JOURNAL OF RESEARCH /JULY - DEC 2012 / PAGE NO. 004
ABSTRACT
he damage caused by the financial crisis of 2007 lasted long mainly in three forms: high and rising public
Tdebts, fragile banks and a huge liquidity overhang that need to be eventually withdrawn. The crisis which
strikes at the heart of worlds' largest trading block(Europe), contain only two of the three fateful elements-
problematic sovereign debt in Greece and other vulnerable countries and fragile European banks, which hold a large
part of that debt. The case not only illustrates the initiatives taken by European countries to form a currency Union
with fixed exchange rates among themselves and flexible exchange rates for others but also questioned the
optimum currency theories given by Mundell and others. It totally questioned the viability of the concept of optimum
currency areas and the formation of European Union.
KEYWORDS
Fragile, Liquidity overhang, Optimum currency theory.
15 “EURO CRISIS: THE FAILURE OF OPTIMUM CURRENCY AREAS”
PROF. DHIRENDRA KUMAR
ASST. PROFESSOR, SIBAR, PUNE
DR. R. GANESAN
DIRECTOR, AIMS, PUNE
MS. GAURI PATHAK
ASST. PROFESSOR, AIMS, PUNE

ALLANA MANAGEMENT JOURNAL OF RESEARCH /JULY - DEC 2012 / PAGE NO. 005
ABSTRACT
POs are vital instruments for corporate to raise money from general public. It is considered that an IPO is the first
Isale of stock by formerly a private company. IPOs turn the private company into a public company. Paper tries to
investigate the short term return available to subscribers of IPO. It further tries to segregate the return available
to short term investors as listing day gains or intra day gains. IPO issued in the duration of five years, starting from
2007 to 2011 is taken as elementary base for computing the return and commenting on the performance of IPO.
Overall the reasons for high and low performance of IPO are discussed in the paper. The paper also tries to highlight
the return availed by investors who hold the shares allotted in IPO for a long term. The paper comments on the overall
performance of the IPOs in the long run.
KEYWORDS
Average Return, Initial Public Offerings (IPOs), Intra Day Gains, Listing Gains, Return on Investment (ROI)
25 “A STUDY ON SHORT RUN AND LONG RUN ANALYSIS OF IPOS LISTED IN 2007 TO 2011”
DR. JIGNA C. TRIVEDI
ASST. PROFESSOR, SHRI JAIRAMBHAI PATEL INSTITUTE OF BUSINESS MANAGEMENT &
COMPUTER APPLICATION, GANDHINAGAR, GUJARAT

ALLANA MANAGEMENT JOURNAL OF RESEARCH /JULY - DEC 2012 / PAGE NO. 006
ABSTRACT
he Rs 130,000-crore FMCG (Fast Moving Consumer Goods) industry, which accounts for 2.2 per cent of India's
Tnational income, has realized that the only way to survive and grow in today's dynamic consumerism era, is to
keep “INNOVATING”.
Even though India has one of the lowest per capita consumption of FMCG products in the world, the stage is set for
that to change. With 60% of the country's population below 30 years of age coupled with an increased spending power
and knowledge and wanting a good living, FMCG companies have learnt that without innovation, their industry will be
left far behind. It is needed for overtaking their competitors in the current competitive scenario and the FMCG
companies in India are using these trends to their advantage.
“INNOVATING” means “INVESTING” for the future — ahead of the competition. The FMCG companies out there
have understood this and is ready to play the game.
36 “IS ‘INNOVATION’ THE NEW AGE MANTRA, FOR FMCG IN INDIA ?”
SHRI PRADIP P. CHATTERJJEE
RESEARCH SCHOLAR

ALLANA MANAGEMENT JOURNAL OF RESEARCH /JULY - DEC 2012 / PAGE NO. 007
ABSTRACT
ollowing the Orissa State Assembly Election in 2009, the Naveen Patnaik led Biju Janata Dal (BJD) came to
Fpower for the third consecutive time. During its tenure in the state the BJD led government has done
tremendous developmental works characterized by many positive trends like industrialization,
infrastructural development, expansion of education, poverty alleviation, peace and stability etc. But how do the
ordinary Odia citizens view them? This study makes an humble attempt to explore the perceptions of citizens of
Western Odisha towards the performance of BJD led government in the state basis various predefined parameters
and identify the factors influencing the citizens' voting decisions. The study is expected to give a new political
direction to the present government in the state.
KEYWORDS
Political Marketing, Factor Analysis, Principal Component Analysis, Varimax Rotation.
39 “AN EXPLORATIVE STUDY ON POLITICAL MARKETING IN WESTERN ORISSA”
DR. SRINIBASH DASH
SR. LECTURER, GANGADHAR MEHER (AUTO.) COLLEGE, SAMBALPUR
SRI SISIR RANJAN DASH
LECTURER, GANGADHAR MEHER (AUTO.) COLLEGE, SAMBALPUR

ALLANA MANAGEMENT JOURNAL OF RESEARCH /JULY - DEC 2012 / PAGE NO. 008
ABSTRACT
ost business firms across the world are in the race to target more and more clients and customers to
Mgenerate revenue through sales. The different business firms according to their nature, types of
business, products or services they use the various sales techniques and methods. Cold Calling is the
strategic marketing process of approaching unknown potential prospects. The term 'Cold' refers a sales person not
done any groundwork for going to approach. Potential customers can be targeted with the help of cold calling
through the various means of it. Basically in the sales process, the sales person contact the customers or clients via
telephone, can visit him physical and drop-in visit. This strategic sales technique is widely used in service industries
across the globe. In India, Banking, Insurance and Broking firms are mostly using it as a mean of lead generation and
converting the client into prospect. The sales person mostly dislikes this process of marketing. The sales person
always hesitate to undertake it because of mainly two reasons, firstly the fear of failure and secondly the fear of
rejection. Many sales experts believe that the cold calling is the most efficient and effective way to generate new
leads. But due to the development of technology and advancement in various marketing communication means, cold
calling is losing its popularity.
KEYWORDS
Customer, Prospect, Cold Calling, Sales, Marketing, Lead
46 “COLD CALLING - 'THE STRATEGIC WAY OF SELLING TO UNKNOWN POTENTIAL PROSPECT'”
JIGNESH R. VAJA
HOD, ASST. PROFESSOR,
SARVODAY COLLEGE OF MANAGEMENT & TECH.(MBA), LIMBDI, GUJARAT
PRAKASHRAJ P. KUMAVAT
ASST. PROFESSOR
SARVODAY COLLEGE OF MANAGEMENT & TECH.(MBA), LIMBDI, GUJARAT

ALLANA MANAGEMENT JOURNAL OF RESEARCH /JULY - DEC 2012 / PAGE NO. 009
ABSTRACT
his paper attempts to understand the employees' perception of performance appraisal system in terms of
Tfairness and utility. The data was collected using a questionnaire from 100 middle level managers from five
manufacturing companies in and around Pune. Fifteen items in the questionnaire measured perceived
fairness and utility with regards to performance appraisal system in their organization. The results show that there is
a positive perception of performance appraisal with respect to fairness but a negative perception about its utility.
This indicates that organizations should seriously address the issue of effectiveness of performance appraisal
system. Performance appraisal should not be an annual routine procedure to be carried out and steps should be taken
to ensure that the performance appraisal data is used for important developmental decisions.
KEYWORDS
Employee Perception, Performance Appraisal Fairness, Utility, Trust, Open Communication Management,
Evaluation, Impartial.
51 “EMPLOYEE PERCEPTIONS OF PERFORMANCE APPRAISAL WITH RESPECT TO FAIRNESS
AND UTILITY IN SELECT MANUFACTURING COMPANIES IN AND AROUND PUNE”
PROF. NETRA NEELAM
ASST. PROFESSOR, SYMBIOSIS CENTRE FOR MANAGEMENT STUDIES, PUNE
DR. DEEPA TANKSALE
ASST. PROFESSOR, SYMBIOSIS CENTRE FOR MANAGEMENT STUDIES, PUNE

ALLANA MANAGEMENT JOURNAL OF RESEARCH /JULY - DEC 2012 / PAGE NO. 010
ABSTRACT
true outcome of leader efforts is not visible in the mere sales, output or performance, but in the form of
Amanpower i.e. development. A leader may not innovate or research for new things but definitely provides a
creative vision to search for new pastures. The function of leadership from this point of view is to build
manpower and develop appropriate successors who continue with the mission and follow vision. A leader develops
winning attitude and a culture that works for excellence. Leader is a reflection of institution in a visible form. What
for the institution stands can be understood by knowing how the leader response, reacts, acts and thinks. The true
purpose of leadership is institution building. Therefore the most important task before the leader is to set the
process of institution building in an action.
KEYWORDS
Leadership, Institution building, the purpose of leadership, hurdles in institution building, leadership function for
institution building.
61 “LEADERSHIP FOR INSTITUTION BUILDING”
DR. SANJAY KAPTAN
HEAD, DEPARTMENT OF COMMERCE AND RESEARCH CENTRE, UNIVERSITY OF PUNE
ALLANA MANAGEMENT JOURNAL OF RESEARCH /JULY - DEC 2012 / PAGE NO. 011
ABSTRACT
n a neck cutting competitive era; the demand for skillful and devoted employees has risen to great height.
IManagement is emphatically emphasizing on employee engagement, top talent retention strategy, leadership
practices, key performance index, training for behavioral change- skill and capacity building in the culture –
functional competence. Along with it, the values of the organization such as integrity, understanding, excellence,
unity, responsibility, creating a culture to get aspired- action oriented – achiever.
As trainees are main focus; so is the case of trainers also. It is not what we say; it is what we radiate. The
approachability is a function of rapport, response, role and knowledge. Coupled with it; there must be a massive
change and that too positive; in feeling, association, experience, visualization and imagination. To penetrate to this
aspect we can say: connection comes before content. Choosing the right content as well as role of the step, choosing
the right sequence, knot, linking the flowers tight, making the thread visible and making it serve the participants'
goal…..are important.
The participants the training program [ trainees] can very well be categorized in different groups such as: excited,
enthused, interactive, curious, skeptical and so on. As a result there is a need for engaging all the five senses. Define
the audience, describe objectives, classify concern,\ freeze the content. Handle the process, assess the outcome
and prepare spreading.
METHODOLOGY
Conversation, Observation, Review of literature, Self Study
Sample Size :: 50 Participants in a training Program.
KEYWORDS
Massive Change, trainees, trainer, integrity, understanding, excellence, unity, responsibility, creating a culture to
get aspired- action oriented – achiever.
64 “TRAINING AND DEVELOPMENT”
PROF. S.D. BAGADE
ASST. PROFESSOR, AIMS, PUNE

ALLANA MANAGEMENT JOURNAL OF RESEARCH /JULY - DEC 2012 / PAGE NO. 012
ABSTRACT
ncident investigations are increasingly getting embedded in the safety management systems. Incidents are
Icaused by a complex mix of human error and systemic failures. The idea to carry out incident investigations is to
bring about a clear picture of the adverse effects of the incidents and what should be done as an immediate
remedial measure, Plan and implement appropriate corrective and preventive actions, verification of the
effectiveness of the corrective and preventive actions in order to minimize / eliminate occurrences of similar
incidents in future.
This article provides a non-mandatory direction to seek and improve incident investigation processes. While the
elements of this article may have universal applicability, it is important to consider compliance to local laws and
regulations. The article is useful for the investigator to understand the investigation process which can bring about
the root cause of incidents, present a clear and precise overview of major failures, arrive at conclusions by a
stepwise process visualizing the factors involved in the happening of the incidents and understand incident costs.
70 “INCIDENT MANAGEMENT”
MR. P. R. RAMDAS
PLANT ENGINEERING & EHS, INTERNET INDIA PVT. LTD., PUNEHEAD,

ALLANA MANAGEMENT JOURNAL OF RESEARCH /JULY - DEC 2012 / PAGE NO. 013
ABSTRACT
Public Private Partnership (PPP) is a partnership between the public and private sector for the purpose of
Adelivering a project or service, which would traditionally be provided by the public sector. The PPP process
recognizes that both the public sector and the private sector have certain advantages relative to the other
in the performance of specific tasks, and can enable public services and infrastructure to be provided in the most
economically efficient manner by allowing each sector to do what it does best.
PPPs involve the private sector partner providing a 'bundle' of services such as design, construction and maintenance.
Bundling thus differs from traditional contracting out, whereby separate contracts are let for each service. PPPs are
another element in the general move to modernize the public service and local government, providing greater
efficiency and effectiveness and ultimately a better quality customer service.
As far as education is concerned there are many obstacles to the successful provision of universal primary and
secondary education. The failure of state schools to provide adequate schooling is a serious hindrance to achieving
the international goal of education for all. Non-state providers of education are regarded as an alternative but the
variation in the quality of education provided is a growing concern.
In developing countries like India, the state's ability to provide an adequate and acceptable level of education has
been scrutinized over the last two decades. Private providers of education have long been present in Indian
education at primary, secondary and tertiary levels. The possibility of partnerships in education has emerged at the
tertiary level with the increased demand for Indian university education both within India and outside. It has yet to
emerge as a contending framework for provision in the Indian school system.
KEYWORDS
Partnership, Mentoring, bottom of the pyramid, Build -Own-Operate-Transfer (BOOT)
76 “GROWTH OF EDUCATION SECTOR IN INDIA WITH PUBLIC-PRIVATE PARTNERSHIP”
DR. VIKAS SARAF, PROFESSOR & ADDITIONAL DIRECTOR,
VIDYASAGAR INSTITUTE OF MANAGEMENT (VIM), BHOPAL (M.P)
DR. MAHENDRA SINGHAI, ASSISTANT PROFESSOR,
FACULTY OF COMMERCE, GOVT. GEETANJALI GIRLS P.G. COLLEGE, BHOPAL(M.P)
MS. LATA YADAV, ASSISTANT PROFESSOR,
VIDYASAGAR INSTITUTE OF MANAGEMENT (VIM), BHOPAL (M.P)

ALLANA MANAGEMENT JOURNAL OF RESEARCH /JULY - DEC 2012 / PAGE NO. 014
ABSTRACT
ospital Management system (HMS) is important for any hospital for its strategic planning, budgeting,
Hresource allocation, maintaining patients' record, personnel development, distribution and management
of equipment, supplies, drugs and supervision of the services. The present paper reports a prototype
Hospital Management Information System (HMIS) developed for Z.V.M. Unani Medical College and hospital. The
unique feature of this Unani_HMS was a special module for identification of Mizaj (temperament). A quick survey
conducted at Alana Institute of Management Sciences (AIMS) [9] was taken as the basis for the Mizaj determination
process. A data mining exercise using WEKA applied to data of 67 respondents was used to generate the decision tree,
by the authors. A Module to read the decision tree (text file ) was written in PHP. While the patient's registration
details are being stored in the data base, a copy of patient's details are sent to Determination Of Temperament()
function as parameters to determine the Temperament. The function gets the parameters and begins to start parsing
the decision tree by using relevant records in the data base.
KEYWORDS
Hospital Management Systems, Medical informatics, Mizaj, Temperament, Data Mining, Php, Mysql. Weka, Parse
82 “INTEGRATING THE PROCESS OF DETERMINING MIZAJ (TEMPRAMENT) IN
A HOSPITAL MANAGEMENT SYSTEM”
SAEED AFROUGH,
DEPT OF COMPUTER, TIRAN BRANCH, ISLAMIC AZAD UNIVERSITY, TIRAN, IRAN
MURTAZA M. JUNAID FAROOQUE
ASSOCIATE PROFESSOR, AIMS, PUNE

ALLANA MANAGEMENT JOURNAL OF RESEARCH /JULY - DEC 2012 / PAGE NO. 015
FINANCE
INTRODUCTION
n economics, an optimum currency area (OCA), also known Ias an optimal currency region (OCR), is a geographical region
in which it would maximize economic efficiency to have the
entire region share a single currency. It describes the optimal
characteristics for the merger of currencies or the creation of a
new currency. The theory is used often to argue whether or not
a certain region is ready to become a monetary union, one of the
final stages in economic integration. An optimal currency area
is often larger than a country. For instance, part of the rationale
behind the creation of the euro is that the individual countries of
Europe do not each form an optimal currency area, but that
Europe as a whole does form an optimal currency area. The
creation of the euro is often cited because it provides the most
modern and largest-scale case study of the engineering of an
optimum currency area, and provides a comparative before-and-
after model by which to test the principles of the theory. The
recent crisis has exposed the hollowness of the theory as well as
has given economists an opportunity in redefining the model of
optimum currency areas.
ROAD TO EURO
The overarching justification for the Euro was not merely
economic, but political. A single currency was perceived as a
symbol of political and social integration in the post-World War II
Europe and a catalyst for further integration in other spheres. At
the micro level, the use of a common currency was expected to
increase cross border competition, integration and efficiency in
the markets for goods, services and capital.
“EURO CRISIS: THE FAILURE OF
OPTIMUM CURRENCY AREAS”
PROF. DHIRENDRA KUMAR
ASST. PROFESSOR,
SIBAR, PUNE
DR. R. GANESAN
DIRECTOR,
AIMS, PUNE
MS. GAURI PATHAK
ASST. PROFESSOR,
AIMS, PUNE

ALLANA MANAGEMENT JOURNAL OF RESEARCH /JULY - DEC 2012 / PAGE NO. 016
Euro is the official currency of the euro zone: 17 of the
27 member states of the European Union.
1950: Belgium, France, Germany, Italy, Luxembourg
and Netherland (6 countries) set up European Coal &
Steel Community. The aim was to end the frequent and
bloody war between neighbors' which cause the World
War II.
1957: Six countries signed treaty of Rome and created
European Economic Community or the common
market. At that time monetary integration was the
least important value.
The disintegration of Soviet Union followed by the end
of cold war and emergence of globalization and
liberalization led to a major change in the structure
and functions of European Union during 1990s.
Maastricht Treaty 1992: It became the basis of
European Monetary Integration. It obliges most EU
member states to adopt the Euro upon meeting
certain monetary and budgetary requirements.
The name Euro was officially adopted on 16 Dec 1995.
The Euro was introduced to world financial markets as stan accounting currency on 1 Jan 1999 (nonphysical
form as travelers cheque, electronic transfers etc.)
replacing the former European Currency unit.
Euro as a single currency in the form of bank notes and stcoins entered circulation on 1 Jan 2002.
CONDITIONS FOR JOINING EMU (CONVERGENCE
CRITERIA)
Price Stability: The country must have a rate
of inflation no more than 15 percentage points
above the average of three countries in EU
with lowest inflation rate.
Long Term Interest Rate: Nominal interest
rate on long term government bonds should be
no more than 2 percentage points above the
average of three countries in EU with lowest
inflation.
Government budget deficits should be no
more than 3% of GDP.
The total government debt should be no more
than 60% of GDP.
The national government cannot influence
the Central bank's decision.
Exchange rate stability in member countries.
BENEFITS OF SINGLE CURRENCY
Logical component of a common market.
Price transparency
Eliminates the currency exchange cost and
the Forex risk.
It facilitates smooth international trade.
Tourists travel becomes easy within EMU.
DISADVANTAGES OF A SINGLE CURRENCY
Increased potential for price wars, especially
as large firms enter the local markets,
previously served by smaller companies.
Lack of national monetary policy as an
important tool for a member state to adjust to
the economic equilibrium when it experiences
an economic shock.
Public and Private institutions had to spend
enormous amount of money to adjust
invoices, price lists, pay rolls, bank a/c,
databases etc.
Unexpected changes in the macroeconomic
environment of an EU member state which
may result in imbalance of production,
consumption, investment, govt. spending and
trade. The worst of it is asymmetric shock. Ex.
Economic growth in a country affected by it
goes down while in others does not. If a
country which is not a member of EU
can handle it using monetary and fiscal
policies but a member of EU has no right to
conduct national monetary policy. The
remaining tools are fiscal adjustment, labor
mobility and capital mobility.

ALLANA MANAGEMENT JOURNAL OF RESEARCH /JULY - DEC 2012 / PAGE NO. 017
EUROPEAN SOVEREIGN DEBT CRISIS
From late 2009, fears of sovereign debt crisis
developed among fiscally conservative investors
concerning some European states with the situation
becoming tense in 2010. This included euro zone
members Greece, Ireland, Spain & Portugal and also
some EU countries outside the area.
Imagine there are two countries, one we can think of
as a rich country, the other a relatively poorer country.
These countries come together and they say, “Why
don't we form a currency union!” Over the course of a
decade, the two countries pursue different policies
towards growth and the richer country happens to be a
little bit more productive than the poorer country. The
wages in the poorer country don't necessary adjust
and they don't have an exchange rate safety valve
because now they're under the same monetary union,
and then they have unemployment in the poorer
country. How do we start thinking about this mess ?
Imagine a different situation in context of India. We
often see confronting situations between the Finance
Ministry having control of fiscal measures and RBI in
control of monetary measures over debt & deficits
management issues. Both blame each other on these
issues. Thus even at the national level where there are
sub national entities, decision making is always
problematic. But since both are operating under one
system, it is easy to handle the situations through
cooperative efforts.
Taking cue from both the situations, the only
conclusion can be drawn that even in a single
democratic set up, it is challenging to monitor both
monetary and fiscal policies when handled two
different institutional set up. Think of another
situation when different countries having different
systems coming together handing their monetary
power to a common central bank and alone left with
fiscal powers. Currency Union is no doubt a good idea
but it should be backed by strong regulatory measures
and flexible and special approach towards some
members if lagged behind in the race. In a monetary
Union, political decisions taken in one country affect
the economies of other countries. But the ECB is a
central bank with a limited focus on the macro
economy as the economic policies remain controlled
by national governments with their own political
compulsions and have different fiscal consequences.
Thus monetary union without a fiscal union seems
doubtful. You cannot expect a fair play when two
boxers in the boxing ring belong to two different
weight group.
DESCRIPTION OF THE CASE
The sequence of events that led the bursting of bubble
is somewhat similar among the GIIPS countries :
The adoption of the Euro was accompanied by
a large fall in the interest rates and a surge in
confidence as institutions and incomes
expected to converge to those of Europe's
northern core economies.
Larger borrowing costs and the expansion of
domestic demand boosted tax revenues in the
GIIPS. Instead of realizing this as temporary
revenue and saving the windfall gains, GIIPS
govt. increased spending. From 1997-2007,
public spending per person rose by an average
of 76% and government's contribution to GDP
rose by 3.5 percentage points. Over the same
period, per capita employee compensation
rose by an average annual growth rate of 5.9%
in the GIIPS, considerably faster than the
EUN's average of 3.2%. These increases were
not matched by improvements in productivity
per employee particularly in GIIPS which grew
only by 1.3% per year. Blatant fiscal
mismanagement added to problems.
The unemployment rates are also different for
the Euro zone countries on account of
differences in the labor market conditions. As
compared to the other countries, Germany
has the lowest rate of unemployment due to
its short time working scheme and flexible
time arrangements in the manufacturing
sector. The fact that there has been
persistence different in the unemployment
levels show that labor mobility remained far
more limited as compared to capital mobility
despite there being a monetary union.

ALLANA MANAGEMENT JOURNAL OF RESEARCH /JULY - DEC 2012 / PAGE NO. 018
Domestic demand surged with accelerating
domestic services, construction and
government expansionary policies but exports
stagnated as a share of GDP and imports and
the current account deficits soared.
The result was indebtness.
Meanwhile, following reunification, Germany
was undergoing a historic transformation to
become the world's largest exporter and
Europe's entire northern nation
economies reaped the benefits of the expanding
market and decreased competition offered by the
GIIPS. This is only a generalized story but the
details vary to some extent within each
country.
EUN : Europe's northern members (Austria, Belgium,
France, Germany, Netherlands)
GREECE
Prior to the establishment of the Euro, Greece was
among the worst economic performers of eventual
euro area members. Annual inflation rate was one of
the highest in the region. The Greek government paid
the highest borrowing premium and GDP growth was
the slowest in Europe. The adoption of Euro appeared
to solve many of these deficiencies. Inflation fell from
an average of 18% from 1980-1995 to just above 3%
from 2000-2007. As Greece Stabilized, it quickly
became an attractive destination for foreign capital.
CAUSES
After averaging an annual GDP growth rate of
1.1% from 1980-1997, the slowest in eventual
euro area members, Greece's economy
expanded at an annual average rate of 4.1%
over the next ten years.
As the tax revenues rose, the government
rapidly expanded spending especially in social
transfers and public sector wages. From 1997-
2007, Greece increased govt. spending per
capita by 140%, compared to 40% in the rest
euro area.
Greece Public Sector per capita employee
compensation grew by 112% compared to 38%
in the rest of euro area.
Country's largest industries are tourism and
shipping, both badly affected by the down
turn with revenues falling by 15% in 2009 due
to financial crisis.
The government misreported the country's
official economic statistics to keep within
monetary union guidelines. Govt. hid the
actual level of borrowing.
Reflecting the economy's rapid growth, public
sector deficits remained within what
appeared to be reasonable bounds- average
5% of GDP from 2000 to 2007. The picture
changed markedly with the financial crisis and
when markets realized Greece's chronic
failure to report accurate statistics.
GDP expanded by only 2% in 2008 and contracted
by 2% in 2009 pushing down tax revenues and
driving the deficits to the level of 15% by the
end of 2009.
With debt ballooning from 96% of GDP in 2007
to 115% in 2009 and the IMF projecting it to
reach nearly 150% by 2012. The worry part is
that Greece would not be able to repay its
loans and the crisis would quickly infect other
troubled European nations if necessary
actions will not be taken by the Global
financial institutions and the leaders.
BEST POLICY RESPONSE
At the moment, as the Greece is a member of the Euro
zone, it cannot unilaterally stimulate its economy
with monetary policy in the same way as the Federal
Reserve of USA expanded its balance sheets by over $
1.3 tn. by printing new money and injecting in to the
system by purchasing outstanding debt. At this
moment abandonment of euro and default, though an
extraordinarily painful course may eventually prove to
be a less costly option for Greece if its adjustment
does not succeed and help is not forthcoming.
Devaluation and default would shift some of the
burden on to foreign creditors, avoid further debt
ALLANA MANAGEMENT JOURNAL OF RESEARCH /JULY - DEC 2012 / PAGE NO. 019
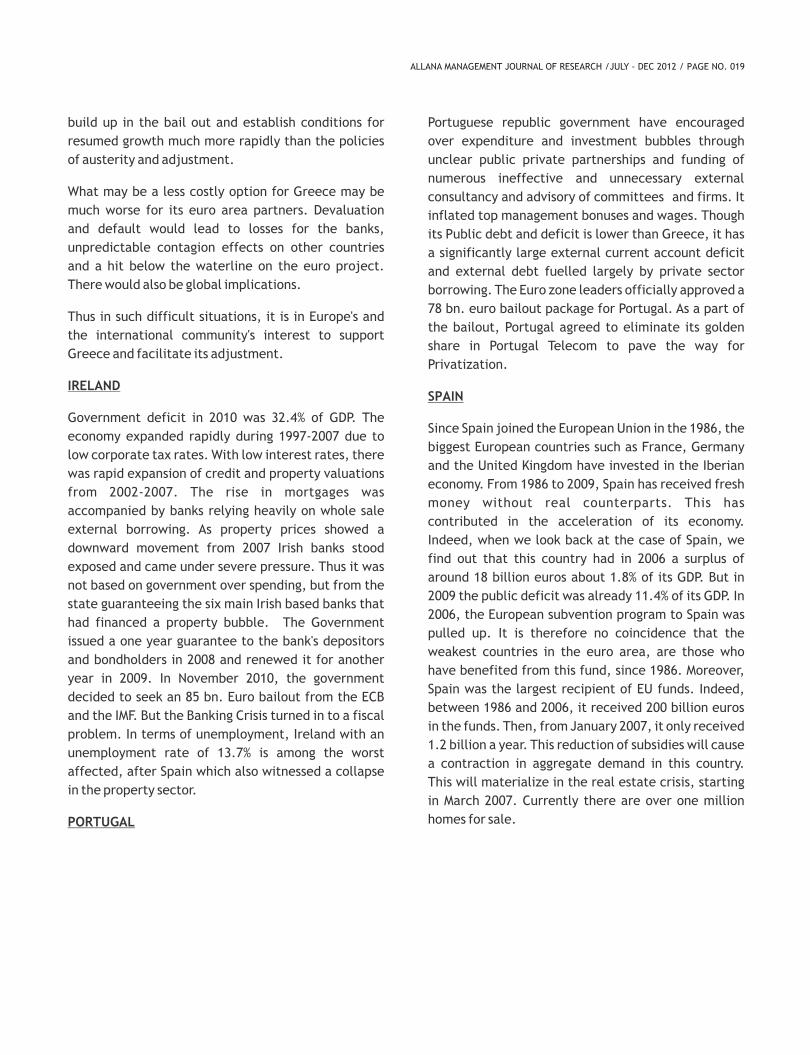
build up in the bail out and establish conditions for
resumed growth much more rapidly than the policies
of austerity and adjustment.
What may be a less costly option for Greece may be
much worse for its euro area partners. Devaluation
and default would lead to losses for the banks,
unpredictable contagion effects on other countries
and a hit below the waterline on the euro project.
There would also be global implications.
Thus in such difficult situations, it is in Europe's and
the international community's interest to support
Greece and facilitate its adjustment.
IRELAND
Government deficit in 2010 was 32.4% of GDP. The
economy expanded rapidly during 1997-2007 due to
low corporate tax rates. With low interest rates, there
was rapid expansion of credit and property valuations
from 2002-2007. The rise in mortgages was
accompanied by banks relying heavily on whole sale
external borrowing. As property prices showed a
downward movement from 2007 Irish banks stood
exposed and came under severe pressure. Thus it was
not based on government over spending, but from the
state guaranteeing the six main Irish based banks that
had financed a property bubble. The Government
issued a one year guarantee to the bank's depositors
and bondholders in 2008 and renewed it for another
year in 2009. In November 2010, the government
decided to seek an 85 bn. Euro bailout from the ECB
and the IMF. But the Banking Crisis turned in to a fiscal
problem. In terms of unemployment, Ireland with an
unemployment rate of 13.7% is among the worst
affected, after Spain which also witnessed a collapse
in the property sector.
PORTUGAL
Portuguese republic government have encouraged
over expenditure and investment bubbles through
unclear public private partnerships and funding of
numerous ineffective and unnecessary external
consultancy and advisory of committees and firms. It
inflated top management bonuses and wages. Though
its Public debt and deficit is lower than Greece, it has
a significantly large external current account deficit
and external debt fuelled largely by private sector
borrowing. The Euro zone leaders officially approved a
78 bn. euro bailout package for Portugal. As a part of
the bailout, Portugal agreed to eliminate its golden
share in Portugal Telecom to pave the way for
Privatization.
SPAIN
Since Spain joined the European Union in the 1986, the
biggest European countries such as France, Germany
and the United Kingdom have invested in the Iberian
economy. From 1986 to 2009, Spain has received fresh
money without real counterparts. This has
contributed in the acceleration of its economy.
Indeed, when we look back at the case of Spain, we
find out that this country had in 2006 a surplus of
around 18 billion euros about 1.8% of its GDP. But in
2009 the public deficit was already 11.4% of its GDP. In
2006, the European subvention program to Spain was
pulled up. It is therefore no coincidence that the
weakest countries in the euro area, are those who
have benefited from this fund, since 1986. Moreover,
Spain was the largest recipient of EU funds. Indeed,
between 1986 and 2006, it received 200 billion euros
in the funds. Then, from January 2007, it only received
1.2 billion a year. This reduction of subsidies will cause
a contraction in aggregate demand in this country.
This will materialize in the real estate crisis, starting
in March 2007. Currently there are over one million
homes for sale.

ALLANA MANAGEMENT JOURNAL OF RESEARCH /JULY - DEC 2012 / PAGE NO. 020
1. GDP Growth (%) (Source: Euro stat)
2002 2005 2006 2007 2008 2009 2010
Euro area 0.9 1.7 3.1 2.8 0.4 -4.2 1.8
Germany 0.0 0.8 3.4 2.7 1.0 -4.7 3.6
France 0.9 1.8 2.5 2.3 -0.1 -2.7 1.5
Ireland 6.5 6.0 5.3 5.6 -3.5 -7.6 -1.0
Greece 3.4 2.3 5.2 4.3 1.0 -2.0 -4.5
Spain 2.7 3.6 4.0 3.6 0.9 -3.7 -0.1
Italy 0.5 0.7 2.0 1.5 -1.3 -5.2 1.3
Portugal 0.7 0.8 1.4 2.4 0.0 -2.5 1.3
MARCO INDICATORS : ANALYSIS
2.0 UNEMPLOYMENT RATE, ANNUAL AVERAGE (%) SOURCE: EURO STAT
-10
-8
-6
-4
-2
0
2
4
6
8
Euro area Germany France Ireland Greece Spain Italy Portugal
2002
2005
2006
2007
2008
2009
2010
2007 2008 2009 2010
Euro area 7.6 7.6 9.6 10.1
Germany 8.7 7.5 7.8 7.1
Ireland 4.6 6.3 11.9 13.7
Greece 8.3 7.7 9.5 12.6
Spain 8.3 11.3 18.0 20.1
Italy 6.1 6.7 7.8 8.4
Portugal 8.9 8.5 10.6 12.0

ALLANA MANAGEMENT JOURNAL OF RESEARCH /JULY - DEC 2012 / PAGE NO. 021
0
5
10
15
20
25
Euro areaGermany Ireland Greece Spain Italy Portugal
2007
2008
2009
2010
3.0 FISCAL DEFICIT AS % OF GDP (SOURCE: EURO STAT)
2002 2005 2006 2007 2008 2009 2010
Euro area 2.6 2.5 1.4 0.7 2.0 6.3 6.0
Germany 3.7 3.3 1.6 0.3 0.1 3.0 3.3
France 3.1 2.9 2.3 2.7 3.3 7.5 7.0
Ireland 0.4 1.6 2.9 0.1 7.3 14.3 32.4
Greece 4.8 5.2 5.7 6.4 9.8 15.4 10.5
Spain 0.5 1.0 2.0 1.9 4.2 11.1 9.2
Italy 2.9 4.3 3.4 1.5 2.7 5.4 4.6
Portugal 2.9 5.9 4.1 3.1 3.5 10.1 9.1
0
5
10
15
20
25
30
35
Euro area Germany France Ireland Greece Spain Italy Portugal
2002
2005
2006
2007
2008
2009
2010

ALLANA MANAGEMENT JOURNAL OF RESEARCH /JULY - DEC 2012 / PAGE NO. 022
4.0 PUBLIC DEBT
5.0 CURRENT ACCOUNT DEFICITS

ALLANA MANAGEMENT JOURNAL OF RESEARCH /JULY - DEC 2012 / PAGE NO. 023
Current account balances refer to the net import or
export activity of a country. A trade surplus is when
exports exceed imports. A trade deficit is when
imports exceed exports. Germany has a significant
trade surplus, meaning it is a net exporter. The other
countries often mentioned in this crisis all have trade
deficits.
A country with a large trade surplus would generally
see the value of its currency appreciate relative to
other currencies; which would reduce the imbalance
as the relative price of its exports increases. Trade
Surplus can drive capital in to other countries but
trade deficits, artificially lowering interest rates and
creating asset bubbles.
STEPS TAKEN
On May 2010, 27 member states of EU agreed to create
the European Financial Stability Facility (EFSF), a
legal instrument to provide financial stability. The
facility is devised in the form of Special Purpose
Vehicle (SPV) that will sell bonds and use the money it
raises to make loans up to a maximum of 440 bn. euro
in Euro zone nations in need. The bonds were to be
backed by guarantees given by the European
Commission representing the whole EU, the euro zone
member states and the IMF. The measures taken in
2010 had negative effects on the market. Serious
doubts remained on the ability of Greece to service its
debts. Moody's lowered Greece's credit rating to junk
status on June 1, 2011.
An extraordinary summit was again convened on 21
July 2011 in Brussels. The leaders decided to take
measures to stop the risk of contagion. They agreed on
a further bailout for Greece for 109 billion euros with
the participation of the IMF and voluntary contribution
from the private sector in order to cover the financial
gap. Since this has a contagious effect, even the global
leaders have shown their commitment in order to
solve the crisis by buying the Euro bonds. But all these
measures have so far failed to satisfy the financial
markets.
IMPLICATIONS
Since the creation of European Union and Euro Zone
has both political and economic motives, its break up
would be painful both in economic terms and political
fallout. The banks of Germany and France face large
exposures. America is one of the trusted trading
partners. American banks have over $600 bn. of
exposure in the troubled economies.
As far as India is concerned, the EU is a major trading
partner and accounted for as much as 20.2% of India's
exports and 13.3% of India's imports (2009-10).
Bilateral trade between the two has been growing on
an average of 9.6% during 2006-10. The total FDI from
EU during 2010 amounted to 3 bn. euro while India also
invested about 0.6 bn. euro in the EU. In other words a
slowdown in the euro zone and the EU is likely to have
adverse impact on India's exports.
The current situation provides China an opportunity to
gain political mileage by simply offering to hold
troubled assets of the euro zone states. These assets
could be in the form of sovereign debt as well as real
assets like interest in public sector units that may be
privatized.
The major impact will be global as the global banking
system played a crucial role in transmitting the crisis
from the advanced economies to various parts of the
world including the emerging markets.
POSSIBLE SOLUTIONS
Fiscal consolidation through austerity
measures: Austerity measures no doubt will
decrease the expenditure but at the same
time, it may further deepen the crisis
increasing social costs in the form of
unemployment. The growth is already
stagnating and prospects of exports leading
growth appear dim. Thus austerity measures
do not seem to solve the problem but it will no
doubt restrict the unnecessary expenditures
and force the government to work on its
priorities.
FISCAL UNION:
This solution does not seem to work in the
short run but no doubt it is must for a
successful monetary union. A substantially
enlarged European Budget, a common form of

ALLANA MANAGEMENT JOURNAL OF RESEARCH /JULY - DEC 2012 / PAGE NO. 024
protection of employment on the German
lines with more flexibility, greater cross
border investment even if this implies
takeover of sick public sector units by
richer euro zone states or by privatization will be
fruitful.
BREAKING THE EURO ZONE :
This seems to be a very costly proposition. The
worst affected countries may be helped out
but the spillover effect of this will cross
boundaries and could lead to
insolvency of several euro zone countries.
CONCLUSION
Now, the world is already experiencing the outcome of
the crisis. At the moment no any policy options seem
to work efficiently. Status quo is also not an option.
The situation is either to love it or leave it. Both has its
own pros and cons. The situation is so critical that if
you love it, be ready to face the bullet and if you leave
it, there is a ditch 100ft. depth which will lead you to
your natural sad demise. So, it's a high time that the
international community understands this and come
out with bullet proof jackets to save the Euro from its
fall.
REFERENCES
Anand MR/ Gupta G L/ The Euro zone crisis, its dimensions and implication
economic times.
indiatimes.com
European central Bank

ALLANA MANAGEMENT JOURNAL OF RESEARCH /JULY - DEC 2012 / PAGE NO. 025
FINANCE
INTRODUCTION
Capital markets serves as an intermediary between
individuals, government and businesses. It channelizes
the surplus funds of investors to the corporate. The
Indian Capital Market deals in long term securities of
government and corporate, which helps the two entities to raise
money from public (Deodhar & Abhyankar, 2007). Capital market
constitutes operation in the new issues and stock market. New
issues made by companies form primary market and trading in
the existing securities confer to secondary market (Avadhani,
1997). IPOs refer to the fresh, first hand equity offered by
corporate to investors. Investors invest in the IPOs for varied
reasons such as availing listing gains and maximizing wealth.
Present paper tries to examine the listing gains derived by the
investor; profit booking by the intraday traders and benefit of
holding shares for long term was also analyzed in the paper. The
paper analyzes whether IPOs are under-priced or over-priced.
RESEARCH OBJECTIVES
To identify the short term return in terms of listing gains
and intra day gains available to subscribers of IPOs with
respect to the duration, from 2007 to 2011.
To study the long term returns available to subscribers of
IPOs with respect to the duration from, 2007 to 2011.
To access the performance of the IPOs and identify the
overall sentiment of the market thereby commenting on
the pricing of the IPOs listed during 2007 to 2011.
“A STUDY ON SHORT RUN AND
LONG RUN ANALYSIS OF IPOS
LISTED IN 2007 TO 2011”
DR. JIGNA C. TRIVEDI
ASST. PROFESSOR,
SHRI JAIRAMBHAI PATEL INSTITUTE
OF BUSINESS MANAGEMENT AND
COMPUTER APPLICATION,
GANDHINAGAR, GUJRAT

ALLANA MANAGEMENT JOURNAL OF RESEARCH /JULY - DEC 2012 / PAGE NO. 026
RESEARCH METHODOLOGY
Descriptive research design was adopted for the study
as the research had been based on secondary data.
The sample in this study includes the fresh equity
issues offered through the book built route on the NSE.
A sample (unit or element) of 217 companies which
came out with 100 percent book built IPO and got
listed on National Stock Exchange (NSE) from the
period (sample duration) commencing from 2007 to
2011 was taken as primary dataset for the short run
analysis. The companies offering follow on issue or
IPOs which was offered in 2011, but got listed in 2012
or IPOs which only got listed on Bombay Stock
Exchange (BSE) and not on NSE, were excluded from
the data set. Non-probability purposive sampling
technique was used for deciding the appropriate
sample size. The list of 217 companies, its issue size,
its price range, its grading and its offer price was
downloaded from the website of NSE. The data
regarding the closing date of the closure of IPO was
downloaded from IndiaIPO website. Approximately
1,000 bhav copies were downloaded from NSE's
website, to obtain the opening and the closing prices
on the day of IPO listing and the next day, of the listing
of the IPO. For long run the prices of shares after
listing, were taken intermittently in the trenches
after every 3 months, 6 months, 12 months, 24
months, 36 months, 48 months and 60 months, this
was the primary reason for variation in sample size in
the long run. The sample size varied from 216 to 5, in
the long run estimation of returns. Nifty index values
were retrieved from Capitaline database and Ace
Analyzer database. Closing Nifty index on the last of
the offer, opening value of Nifty index on the day of
listing and closing value of Nifty index on the day of
listing was obtained for short run and for long run; the
Nifty value was taken intermittently.
The price performance of IPO was evaluated for the
short run i.e. returns received on the day of listing and
on the next day of listing. Considering the study of
Kumar (2007), as a base of the present study, the
return realized over the period from the offering of
the shares to the first trading day on NSE, called as
offer- to- close return have been computed. The work
of Barry and Jennings (1993), as referred and applied
by Kumar (2007) in his study the same have been
applied in this study too. The short run analysis was
examined by offer-to-open returns for obtaining a
reasonable idea of how much IPOs gained or lost on
opening trades, as well as intra day return on the
listing day, which is defined as open –to-close returns
on the day of listing. Similar returns are analyzed for
the next intraday (second day after the listing day).
Buy and hold market adjusted return (BHAR) and
monthly market adjusted returns (MMAR) were
computed for evaluating the long run performance of
the IPO. Considering the study of Kumar (2007) as the
base of the study, the average annualized return was
calculated.
Simple returns, market adjusted returns and excess
returns were computed to know the performance of
the IPOs. Simple returns (R ), Market Adjusted Returns it
(R ) and Excess Returns (ER,,) were calculated with mt
the following formula.
R = (P –O ) x 100 R = (l –l ) x 100 ER,, = R – Rit it i mt t o it mt
O l i o
P represents the opening or closing price of stock 'i' at it
time 't 'i.e. at the time of listing.
O represents the offer price of the stock 'I''.i
l represents Nifty index closing or opening value on the t
day of 't' i.e. on the day of listing.
l represents closing level of Nifty on the last day of the o
IPO offering.
Descriptive research design had been used for the
study. At univariate level descriptive statistics like
mean, 5% trim mean, median, SD had been applied for
computing the significance of returns on the listing
day and the next day. At multivariate level inferential
statistics was applied. Inferential statistic like cross
sectional 'T' statistic had been used to test the
hypothesis on significance of the samples mean
return. Other statistical test that was applied was
Independent T-test, linear regression, cross sectional
regression. Various secondary sources of offline data
like newspaper, journals, books and online research
papers and periodicals had also been studied for
better interpretation of the computed values. Trend

ALLANA MANAGEMENT JOURNAL OF RESEARCH /JULY - DEC 2012 / PAGE NO. 027
analysis was performed to predict the future value of
Nifty indices. The collected data was processed for
analysis by editing, coding and entering it into
computer software- Statistical Package for Social
Scientists (SPSS 17) and Microsoft excel programmes.
FINDINGS AND DISCUSSION ON SHORT RUN ANALYSIS
OF IPOs (2007 - 2011)
Table 1 gives a details of the IPO activity from 2007-11.
TABLE 1: SNAPSHOT OF IPO ACTIVITY DURING THE
YEAR 2007-2011
(Source: Author's Compilation)
SIMPLE RETURNS ANALYSIS
Simple returns (R ) are calculated to capture the it
market movements during the period between offer
closures to listing. R measures whether an investor it
gained or lost by buying the shares during the IPO at
the offer price and selling at the prevailing price on
the listing day. If R was positive one may infer that the it
issue was under-priced. If R was negative one may it
understand that the issue was over-priced. If R was it
zero, it meant that the issue was aptly priced (Kumar,
2007). Work of Kumar (2007) was extended by
comparing the offer price with opening price as well as
closing price in order to identify the impact on
investors. For the primary dataset of 2007 to 2011,
when average percentage R was computed by taking it
the offer (opening) price and listing price of the 217
IPOs under study, one can obtain the categorization of
IPOs in the category of overpriced, under-priced and
aptly priced. The results of the average percentage R it
with offer price and opening price is described in table
2; results of the average percentage R with offer it
price and closing price is described in table 3.
TABLE 2: AVERAGE % SIMPLE RETURNS (R )*IT
(Source: Author's Computation),
TABLE 3: AVERAGE % SIMPLE RETURNS (R )*IT
(Source: Author's Computation)
There are two ways in which IPOs can be priced that is
fixed price and book built. From the data obtained out
of 217 book built IPOs it may be inferred that in
overpricing, if the stock is offered to the public at a
higher price than what the market will pay, then the
stock tends to fall in value on the first day of trading
and it may eventually lose its marketability and value
in future. For an overpriced issue underwriters too
have a trouble in selling the shares and meeting their
commitments. Under-pricing of IPO generates
additional interest in the stock when it, first becomes
publicly traded. This can lead to significant gains for
investors. From the perspective of company's under-
pricing an IPO results in “money left on the table”- lost
capital that could have been raised for the company
had the stock been offered at a higher price (IPO,
n.d.).
MARKET ADJUSTED RETURN ANALYSIS
The price observed in the market on the listing day
may vary from the offer price. This may result due to
overall market movements. Computations of market
adjusted return (R ) of the IPOs are made for the same mt
period. To compute the market adjusted return,
adjustment is first made by calculating the returns on
the market index (Nifty) during the same period. If R mt
was positive it was considered that the market on the
whole has moved up. If it was negative it may be
measured that there was decline in the overall market
Year
Nos. of Issues
IPOs taken for Study
2007
87
83
2008 41 30
2009 22 20 2010 75 58 2011
41
26 Total
266
217
Number of IPOs
Average % R it
Interpretation
Impact on Investors
42 -8.85% Over-Priced Winner’s Curse
161 22.49% Under-Priced Boon 14 0.00% Aptly Priced Neutral *Note: Offer Price and Opening Price is used in computation of Rit
Number of IPOs
Average % R it
Interpretation
Impact on Investors
82 -20.56% Over-Priced Winner’s Curse
134 40.91% Under-Priced Boon 1 0.00% Aptly Priced Neutral *Note: Offer Price and Closing Price is used in computation of Rit

Parameters Listing Day Next Day
Offer-Open
Offer-Close
Open-Close
Offer-Open
Offer-Close Open-Close
Mean (Listing Price < Offer Price)
-58.24% -37.20% -25.60% -31.76% -35.38% -11.28%
Mean (Listing Price > Offer Price)
33.63%
68.94%
56.75%
72.33%
71.43% 19.20%
Number of IPOs
Average ER Interpretation
86 -0.15 Over-Priced
154 0.40 Under-Priced
3 0.00
Fairly Priced
Number of IPOs Average % Rmt Interpretation Market Sentiment
103 -5.18% Decline in overall Nifty Index Bearish
143 7.32% Overall Nifty Index has gone up Bullish
*Note: Closing Nifty Index and Closing Nifty Index on last day of IPO Offering is used in computation of Rmt
ALLANA MANAGEMENT JOURNAL OF RESEARCH /JULY - DEC 2012 / PAGE NO. 028
and if it was equal to zero it may be accomplished that
market remained unchanged during the interval
between IPO offering to its listing (Kumar, 2007). Work
of Kumar (2007) was extended by comparing the
opening Nifty index and closing Nifty index on last day
of IPO offering and closing Nifty index and closing Nifty
index on last day of IPO offering in order to identify
the overall market sentiment. The result of average
R with opening Nifty index and closing Nifty index on mt
last day of the IPO offering is mentioned in table 4 and
the result of average R with closing Nifty index and mt
closing Nifty index on last day of the IPO offering is
mentioned in table 5.
TABLE 4: AVERAGE % MARKET ADJUSTED RETURNS
(R )*MT
(Source: Author's Computation)
TABLE 5: AVERAGE % MARKET ADJUSTED RETURNS
(R )*MT
(Source: Author's Computation)
From Table 4 and Table 5 it may be inferred that there
was a sharp fall in the market index Nifty at the time of
closure of the trade. The market index Nifty had
improved by the end of the closure of the day. Overall
upward movement in the Nifty index indicated a
bullish sentiment in the market at the time of majority
of the listings of IPO. Anticipation of listing gains and
purchasing of value buy stocks (from secondary
market) on the day of listing could be a valid reason for
positive sentiments in the market.
EXCESS RETURN ANALYSIS
On deducting the market returns from the IPO's
returns, the resultant returns so obtained was called
excess return (ER,,). If ER was positive one may
deduce that the issue was under-priced, after
adjusting for the market movements in the
intervening period. Negative value of ER indicated
that the issue was overpriced, after adjusting for the
market movements in the intervening period. If ER
was equal to zero, it may be inferred that the issue
was fairly priced, after adjusting for the market
movements (Kumar, 2007). The result of the average
ER was represented in the Table 6.
TABLE 6: REPRESENTATION OF EXCESS RETURNS
(ER,)
(Source: Author's Computation)
Average Return Analysis on Listing Day and Next Day of
Listing
As a part of short run analysis, the price performance
of IPOs on the listing day and the next day is presented
below.
TABLE 7: REPRESENTATION OF RETURNS OF SHARES
ON LISTING DAY AND NEXT DAY
(Source: Author's Computation)
It was observed that some of the shares on the listing
day listed at a lower price compared to their
respective offer price, which represented a negative
return. From table 7 it may be inferred that on the
listing day, the average return with respect to the
difference between offer price and open price was
found to be (-) 58.24%. On comparison of offer-close
price the mean return was found to be (-) 37.20%,
which means that the share price continued to go
down in comparison to the offer price and listing
price. On comparison with listing day's open and close
Number of IPOs Average % Rmt Interpretation Market Sentiment
105 -4.82% Decline in overall Nifty Index Bearish
112 4.52% Overall Nifty Index has gone up Bullish
*Note: Opening Nifty Index and Closing Nifty Index on last day of IPO Offering is used in computation of Rmt

Particulars
Listing Day Next Day
Offer -Open
Offer-
Close
Open-Close
Offer -Open
Offer- Close Open-Close
Mean 16.76% 21.37% 4.61% 23.68% 25.27% 1.59%
5% Trim Mean 14.36% 18.51% 3.99% 19.96% 21.96% 1.09%
Median 3.68%
5.00%
-0.85%
5.85%
5.48% -0.05%
SD 85.47 115.69 68.42 116.44 118.94 28.46
ALLANA MANAGEMENT JOURNAL OF RESEARCH /JULY - DEC 2012 / PAGE NO. 029
price, the mean return was (-) 25.60%, which meant
that the price did not improve in the first day trading
session, it was still low when compared to the offer
price and open price. The companies who's IPOs were
listed at a lower price on the browses, indicated that
investors had a bearish sentiment towards the
companies. The downfall in the price of the share on
the next day of the listing had considerably reduced
when compared to the offer price. The offer-open
price stood at (-) 31.76%, offer-close was (-) 35.38%
and open-close was (-) 11.28%.
It was observed that some of the shares on the listing
day listed at a higher price compared to their
respective offer price, which represented a positive
return. From table 7 it may be inferred that on the
listing day, the average return with respect to the
difference between offer price and open price was
found to be 33.63%. On comparison of offer-close
price, the mean return was found to be 68.94%, which
meant that the share price increased in comparison to
the offer price and listing price. On comparison with
listing day's open and close price, the mean return was
56.75%, which meant that the price improved when
compared to the offer price but on comparison with
open price it slightly went down, as the open-close
was 56.75% which was greater than 33.63%, but lower
than 68.94%. The companies who's IPOs were listed at
a higher price on the browses, indicated that investors
had bullish sentiment towards the companies. The
upward movement in the price of the share on the next
day of the listing had considerably increased when
compared to the offer price. The offer-open price
stood at 72.33%, offer-close was 71.43%.
Unfortunately on the next day of the listing the open-
close was just 19.20%, which was quite lower than
offer-open at 33.63%. This indicated that the listing
gains have been discounted and the momentum of
drastic upward movement had reduced.
COMPLETE ANALYSIS OF IPO RETURNS ON LISTING
DAY AND NEXT DAY
The statistical parameter for studying the short run
analysis of IPO on the day of listing as well as on the
next day of listing was applied in this paper in
connotation to the fundamental work of Kumar
(2007). The average IPO return of both the days i.e. on
listing day and on the next day of the listing is
presented below in Table 8.
TABLE 8: OVERALL ANALYSIS OF THE IPO RETURNS
ON THE LISTING AND ON THE NEXT DAY OF LISTING
It may be observed that on an average IPOs listed with
a premium of 16.76% over the offer price and the
median premium was around 3.68%. On the listing day,
the listed IPO closed at a premium of 21.37% over the
offer price and the median premium was around
5.00%. This implied that the average premium and
median premium had improved during the first trading
session itself, which indicated positive sentiments,
bullish trend and a high level of upward volatility in
the market. The level of volatility was further
confirmed by studying the SD which was 85.47 and
115.69 during the open-offer and close-offer
respectively. It also showed the bullish trend in the
market. To report for the possibility of outlier effect,
average trimmed mean based on opening return and
average trimmed mean based on closing return was
calculated. 5% Trimmed mean was computed by
ignoring 5% or 11 observations extremely high and low
in data points. On comparing the average trimmed
opening returns and closing returns, it was found that
the opening returns marginally decreased to 14.36%
and the closing returns decreased to 18.51%, to
thereby confirming that under-pricing of IPOs was not
caused by a few outliers. This indicated that the
under-pricing of IPOs was purely due to the price
discovery on account of book built mechanism, which
favoured the investor to derive a positive gain.
CROSS SECTIONAL T-STATISTICS ANALYSIS
Whether the average returns were statistically
significant or not were studied, by constructing a
cross-sectional 'T' statistic. One sample T-test was
applied for verifying the statistical significance with
respect to offer open, offer close, open close on listing
day as well as next day. It is illustrated through
following hypothesis.

ALLANA MANAGEMENT JOURNAL OF RESEARCH /JULY - DEC 2012 / PAGE NO. 030
H : There is no significant difference in the (offer-01
open, offer-close and open-close) mean returns of the
IPOs on the listing day or next day of listing.
H : There is a significant difference in the (offer-11
open, offer-close and open-close) mean returns of the
IPOs on the listing day or next day of listing.
TABLE 9: COMPUTATION OF 'T' STATISTICS ON THE
LISTING AND ON THE NEXT DAY OF LISTING
(Source: Author's Computation)
* Note : The µ values in all the cases are based on the
previous similar study undertaken by Kumar (2007).
The 'T' statistic and corresponding 'p' values, indicated
that the listing day excess returns were statistically
significant. The last row representing N>0, indicates
that out of 217 IPOs sampled 162 IPOs listed with a
positive return while the rest opened at a discount to
the offer price. On the listing day a noteworthy point
was found that, all those 162 IPOs which listed at a
premium did not close at premium at the end of the
day. In fact 27 IPOs which listed at a premium closed at
a discount (when compared to the offer price), on the
listing day. The intraday returns were also examined.
Intra day refers to a position where the investor buys
the shares at the opening price and sells by the end of
the day at the closing price. It was observed that there
was an average positive return of 4.61%. The
corresponding 'T' statistic explained that the return
was statistically significant. It can be inferred that the
IPOs listing do provide economically considerable
trading opportunities for a day trader.
The second day's (next day after the listing day) return
analysis showed that all the IPO investors gained on
the listing day's performance. 23.68% (refer table 8)
was the percentage average returns on the next day of
the listing with respect to the open price of the next
day. At the closure of the next day of the listing the
return improved to 25.27% (refer table 8), with a SD of
116.44 to 118.94 (refer table 8). If any trader buys the
IPOs on the listing day at the opening or closing price,
with an intention of profiting from liquidating the
position on the next day at opening or closing levels,
on the second day they will earn a meager return of
1.59% (refer table 8). The corresponding 'T' statistic
explained that the return was statistically
insignificant. Moreover, the median return was also
found to be -0.05% (refer table 8). It was further
observed that out of 162 IPOs which listed at a
premium on the listing day, only 105 IPOs were found
to be traded at a premium on the next day of listing, at
the closure of the trade. This indicated high level of
volatility prevalent in the secondary market, which
was due the presence of intraday traders, speculators
and arbitrageurs. These players do offer momentum
to the prices of the stock.
INDEPENDENT T-TEST ANALYSIS
In order to check the significant difference in the
opening and closing returns on the day of listing with
respect to independent T-Test the normality of the
data was checked by superimposing of normal curve
on the histogram which is given below.
Figure 1 : Graph to check normality
Null Hypothesis (Ho)*
µ = 26.35% µ= 27.26% µ = -0.77% µ = 0.03% µ = 0.64% µ = 0.67%
Alternate Hypothesis (H1)
µ �26.35%
µ
�
27.26%
µ
�
-0.77%
µ
�
0.03%
µ
�
0.64% µ �0.67%
t 1.73 2.43
2.32
9.05
1.73
1.45
p-value 0.09>0.05
0.00<0.05
0.00<0.05 0.00<0.05
0.00<0.05 1.45>0.05
Decision Rule H0 is not rejected
H0 is rejected H0
is rejected H0 is rejected H0
is rejected
H0 is not rejected
Analysis Statistically not Significant
Statistically Significant
Statistically Significant
Statistically Significant
Statistically Significant
Statistically not Significant
N 217 217 217 217 217 217
N>0 162 135 100 135 140 105

RR Square
Adjusted R Square Std. Error of the Estimate
0.81a 0.66 0.655 68.08
a. Predictors: (Constant), (X)
Levene's Test for Equality of Variances
T-Test for Equality of Means
F Sig. T df Sig. (2-tailed)
LnPrice
Equal variances assumed 0.06 0.81 -0.22 432 0.83
Equal variances not assumed -0.22 431.89 0.83
ALLANA MANAGEMENT JOURNAL OF RESEARCH /JULY - DEC 2012 / PAGE NO. 031
Figure 2 : Graph representing normality
From figure 1 it can be observed that the distribution
is not a normal distribution. For obtaining normal
distribution natural log function was applied on the
data and from figure 2 it was observed that now the
distribution becomes a normal distribution.
Independent T-test was applied to check the
difference in opening and closing returns.
H : There is no significant difference in opening and 02
closing returns on the day of listing.
H : There is a significant difference in opening and 12
closing returns on the day of listing.
TABLE 10: TEST STATISTICS FOR INDEPENDENT T-
TEST
(Source : SPSS Output)
From the above table 10 it may be inferred that at 95%
level of confidence Levene's test of equality of
variance was found to be significant (i.e. 081>0.05).
Once the equality of variances was proved to be
significant at 5 percent level of significance, the two
tailed test represented the p-value 0.83 > 0.05 which
implied that H cannot be rejected i.e. there is no 0
significant difference in the opening and closing
returns on the day of listing, was accepted.
Descriptive statistics further revealed that the mean
opening returns was 5.08, which marginally improved
to 5.10 as the closing returns.
LINEAR REGRESSION ANALYSIS
In order to know whether the average initial IPO
returns based on the closing prices were dependent on
the opening returns (based on the listing day) or not a
regression analysis was run. The opening returns are
deterministic variable i.e. independent variable
which is denoted as X. Closing returns are dependent
variable which is denoted by Y.
H : Closing returns do not depend on opening returns.03
H : Closing returns depend on opening returns.13
TABLE 11 MODEL SUMMARY
(Source: SPSS Output)
From table 11, the significant correlation with R =
0.81, which showed that there was correlation
between predicted returns based on closing price and
actual one. As the value of r is 0.81 > 0.70 which
indicated that there was a positive strong correlation
between the two variables, further it was also known
that the correlation was significant. R-Square
provided an indication of the explanatory power of the
regression model. R-Square was simply the
percentage of variance in the dependent variable
explained by the collection of independent variable.
Approximately 65.5% of variation in return based on
the closing price was dependent on the returns based
on the opening price.
BTABLE 12 ANOVA

Model
Unstandardized Coefficients Standardized Coefficients
B Std. Error
Beta
t Sig.
(Constant) 6.52 5.03 1.29 0.19
(X) 1.09
0.05
0.81
20.22 0.00
a. Dependent Variable: (Y)
ALLANA MANAGEMENT JOURNAL OF RESEARCH /JULY - DEC 2012 / PAGE NO. 032
(Source: SPSS Output)
Sig. refers to a “significance test”, which was another
of way saying statistical hypothesis test. In other
words number of columns labeled “Sig” was p-values
and therefore it gave the results of a hypothesis test.
In this case, the p-values refer to a test of the entire
model (i.e. the entire collections of independent
variables) as a whole. From table 12 it may be inferred
that the p-value 0.00<0.05, so H is rejected and H is 0 1
accepted, i.e. Closing returns depend on opening
returns, was accepted.
ATABLE 13 COEFFICIENTS
(Source: SPSS Output)
From the table of co-efficient, the significant p value
for the constant used in the regression procedure does
not matter. The p-value for each of the independent
variable was important. This p-value was only applied
to a single independent variable, and not to the entire
group. The general form of the hypothesis test is as
follows:
H : The opening price (X- independent variable) is not 04
a significant predictor of (Y- dependent variable).
H : The opening price (X- independent variable) is a 14
significant predictor of (Y- dependent variable).
From table 13 it may be inferred that the significant p-
value of X i.e. Opening price was 0.00<0.05.
Therefore, the null hypothesis H was rejected and H 0 1
was accepted i.e. opening price is a significant
predictor of the closing price. Therefore, from the
overall interpretation it may be inferred that the
investor's sentiment generated on the day of listing
was carried throughout the day till the close of the
market.
Thus, the regression equation Y= a + bx. From co-
efficient table, Y= 6.52 + 1.09X , where a = 6.52 and b=
1.09. From the co-efficient table it may be
interpreted that the returns based on opening price
had 5% significance for changes in the returns based on
the closing price. Therefore, it may be inferred that
closing returns depend on opening returns.
CROSS SECTIONAL REGRESSION ANALYSIS
In order to know whether the average initial IPO
returns based on the opening price are dependent on
before market condition, size of the IPO, offer price
quotient or not, a cross sectional regression analysis
was run.
H : Opening (Initial) returns do not depend on before 05
market condition, size of the IPO and offer price
Quotient
H : Opening (Initial) return depends on before market 15
condition, size of the IPO and offer price Quotient
TABLE 14 MODEL SUMMARY
(Source: SPSS Output)
bTABLE 15 ANOVA
(Source: SPSS Output)
Model Sum of Squares
df
Mean Square
F
Sig.
Regression
1894257.13
1
1894257.13
408.67
0.00a
Residual 996573.74 215 4635.23 Total 2890831.87 216 a. Predictors: (Constant), (X)
b. Dependent Variable: (Y)
RR Square
Adjusted R Square Std. Error of the Estimate
0.21a 0.043 0.03 84.51
a. Predictors: (Constant), Market (Y), Size (Y), Quotient (Y)
Model Sum of Squares
df
Mean Square
F
Sig.
Regression
68200.24
3
22733.41 3.18 0.03a
Residual 1507046.99 211 7142.40 Total 1575247.23 214 a. Predictors: (Constant), Market (Y), Size (Y), Quotient (Y)
b. Dependent Variable: (Opening Returns =X)

Model
Unstandardized Coefficients
Standardized Coefficients
B
Std. Error
Beta
t Sig.
(Constant) -402.96 162.49 -2.480 0.01
Size (Y) 4.93 3.56 0.09 1.39 0.17
Quotient (Y) 408.03
153.22
0.19
2.67 0.01
Market (Y) -14.79 11.55 -0.09 -1.28 0.20
a. Dependent Variable: (Opening Returns =X)
ALLANA MANAGEMENT JOURNAL OF RESEARCH /JULY - DEC 2012 / PAGE NO. 033
aTABLE 16 COEFFICIENTS
(Source: SPSS Output)
SIZE
The size of one IPO varies from the size of other IPO.
Therefore, natural log of size was taken. If the
absolute value of the size was taken for running
regression analysis then it may not give correct result,
due to normality issue of the data (Kumar, 2007). To
avoid this problem (Ln) Natural Log function was used.
BEFORE MARKET CONDITION
In the run up to the opening of the issue if the general
market conditions are buoyant the issue may draw
more investors and this may lead to a higher demand.
Since the number of shares was limited and the
demand was not fully met, upon listing there may be
lot of buying interest that may lead to the issue listing
at a premium to the offer price. A dummy variable was
introduced that assumed a value of zero if market has
declined in at least half of the trading days in the
month prior to the IPO opening and it will assume a
value of 1 if the market had moved up (Kumar, 2007).
OFFER PRICE QUOTIENT
Higher the listing day gains means more was the
demand for the stock. If the demand was properly
gauged in the market before the issue was opened
then the offered price will be close to the upper price
limit. Therefore, the quotient of offered price to
upper price limit was introduced as another
independent variable to explain the under pricing
phenomena (Kumar, 2007).
Offer price Quotient was calculated by using the
following formula
Offer price Quotient =
Offer price (Issue price)
Upper Price limit
INTERPRETATION
Significant Co-relation with r was equal to 0.21.
Approximately 4.3% of variation in return based on
opening price was dependent on the before market 2condition, size of the IPO, offer price quotient. R was
simply the percentage of variance in the dependent
variable explained by collection of independent 2 variable. R provided an indication of explanatory
power of regression model. Significant linear
regression with p-value was 0.00.
REGRESSION EQUATION
y= a+bx+cx +dx where, x size of the IPO, x before 1 2 = 1 =
market condition x offer price quotient. From the co-, 2 =
efficient table, y= -402.96+4.93 x +408.03 x -14.79 x . 1 2 3
If value of dummy variable is 0, then y= -402.96. If
value of dummy variable is 1, then, y=-402.96-14.79
x ; where, a = -402.96, b = 4.93, c = 408.03, and d = -3
14.79.
Positive coefficient means X and Y change in same
direction. If X increases then Y increases and if X
decreases then Y decreases. Negative coefficient
means X and Y change in opposite direction and if X
increases then Y decreases and if X decreases then Y
increases. The multiple R is 0.21 which showed that
there was no correlation between the dependent and
independent variable, further it was also known that
the correlation was not significant. From cross
sectional regression it may be inferred that opening
return depended on quotient because p-value was
0.01(p<0.05), so it was statistically significant.
Remaining variables are not statistically significant. As
per the table 15 of ANOVA the p-value was 0.03 (0.03 <
0.05) which meant that null hypothesis was rejected
and so opening(initial) return do not depend on before
market condition, size of the IPO and offer price
quotient was rejected. From the co-efficient table it
may be interpreted that opening return was
dependent on quotient.

BHAR MMAR
Sample Size
Months from Listing
Annualized Returns
Trimmed Mean (5%)
Annualized Returns
Trimmed Mean (5%)
216 3 4.4798
3.8662
-0.0003
0.0023
204 6 4.5881
4.0646
-0.0188
-0.0169
190 12 -0.1269 -0.1494 -0.0954 -0.0926
133 24 8.6664
9.0776
0.0254
0.0299
109 36 6.4062
5.7982
0.1442
0.1471
85 48 1.0670 0.0056 0.1251 0.0015
5 60 -4.5640 -0.9128 1.6225 0.3245
Year Time (t) Average Nifty (y) W= t-t Wy W2
2007 1 4567.285
-2
-9134.57
4
2008 2 4346.214 -1 -4346.21 1
2009 3 4109.5790 0 0 0
2010 4 5461.193 1 5461.193 1
2011 5 5340.394
2
10680.79
4
Total �t=15 �y=23824.666 �wy�=�2661.197 �w2 = 10
ALLANA MANAGEMENT JOURNAL OF RESEARCH /JULY - DEC 2012 / PAGE NO. 034
TREND ANALYSIS
Trend analysis was used to forecast the value of
average Nifty for the year 2012 and 2013.
TABLE 17 TREND ANALYSIS COMPUTATION
(Source: Excel Output)
Average Nifty was used to forecast the value of
average Nifty in 2012 and 2013. The average Nifty of
2007, 2008, 2009, 2010 and 2011 was coded as 1,2,3,4,
and 5 respectively.
2 B = �wy/�w , B = 266.1197
A = �y/n, A= 4764.93
Average Nifty for 2012 can be calculated by using
following equation,
y a + bw [Year 2012 is coded as 6], Average Nifty for t =
2012 =5563.2891. Average Nifty for 2013 can be
calculated by using above equation, [Year 2013 is
coded as 7], Average Nifty for 2013 =5829.4088.
Figure 3 Trend Analysis
From the above graph, it can be inferred that market
showed a bullish trend. It moved from 4567.29 in 2007
to 5340.39 in 2011. The trend analysis showed the
uptrend of Nifty Index for the year 2012 and 2013 with
the anticipated values at 5563.29 and 5829.41
respectively.
FINDINGS AND DISCUSSION ON LONG RUN ANALYSIS
OF IPOs (2007 - 2011)
IPO performance in long run was examined by using
two measures buy and hold market adjusted returns
(BHAR) and monthly market adjusted returns (MMAR).
The formula for the same is given below.
BHAR = [{� (1+Rit )-1}-{�(1+Rit )-1} ]*100 where, Rit 1 2 1
= Return of Script after 3 months. Rit = Return of 2
Script on the day of listing. MMAR= [{� (1+Rmt )-1}-{�1
(1+Rmt )-1} ]*100, where, Rmt = Return of Index after 2 1
3 months. Rmt = Return of Index on the day of listing.2
TABLE 18 CALCULATION OF BHAR & MMAR
(Source: Excel Output)
Above table 18 shows BHAR and MMAR after
3,6,12,24,36,48 and 60 months. After 3 months of IPO
listing if investor had sold the shares allotted in IPO
then he would get 4.48% return which was higher then
return of Index (Nifty return). Average trimmed mean
was calculated to remove the effect of outliers. At the
end of 12 months of listing it was observed that the
return was negative, this may happen because of stock
selling pressure which might have outperformed the
buying pressure. It may happen that long term
investors (who stayed invested for 12 months) might
have achieved their targeted return and so they sell
the share. After the period of 12 months, only very
long term investors stayed invested in the share, and
such very long term investors were rewarded with
highest return. The return was highest after 12 months
may due to companies hitting their targeted objective
of green field or brown field project and were earning
good returns, which was reflected in terms of rise in
the price of shares. After 24 months the return showed
diminishing trend. After 60 months it became
negative. When a comparison was made between Nifty
return and IPO return, it may be inferred that the IPO
had performed well and Nifty showed a bearish trend.
4567.29 4346.21 4109.58
5461.19 5340.39 5563.29 5829.41
0
1000
2000
3000
4000
5000
6000
7000
1 2 3 4 5 6 7
Year
ALLANA MANAGEMENT JOURNAL OF RESEARCH /JULY - DEC 2012 / PAGE NO. 035
So a trend could be understood that after 12 months
the stock faced server selling pressure and after the
lower bottom it performed well. Investors tend to
carry forward shares (allotted in IPO) of those
companies which had strong fundamentals. Since 60
months was treated as a long period the cycle of stock
specific bearish trend repeated after 5 years. Prudent
investors would like to exit from their investment
after the horizon of five years, anticipating that
companies might have moved in the maturity stage
and investors considered this an appropriate time to
reap wealth and profits.
CONCLUSION
In short run out of 217 IPOs 161 IPOs were under-
priced, which enabled the investor to get listing gain.
42 IPOs were overpriced and 14 IPOs were aptly price.
In long run if investor holds script for 24 months the
investor got highest average return, after that the
average return showed diminishing trend. After 12
months it showed negative return because of selling
pressure in stock market. When annualized return of
Nifty wass compared with annualized return of IPOs
then, IPOs had performed well as compared to Nifty
return. Based on secondary data it may be concluded
that initial return depended only on offer price
quotient and closing return depended on opening
returns.
REFERENCES
Avadhani V. (1997). Indian Capital Market, Himalaya Publishing
House, Mumbai, pp.1-10.
Barry C. B. and Jennings, R.H. (1993). “The Opening Price
Performance of Initial Public Offerings of Common
Stock”, Financial Management, Volume 22, Issue 1, pp.54-63.
Deodhar S. & Abhyankar A. (2007). Indian Financial System,
Himalaya Publishing House, Mumbai, pp.6-10.
IPO (n.d.). How is IPO Priced?, accessed on December 19, 2011
http://surakshit5.blogspot.com/2008/02/how-is- ipo-
priced.html
Kumar S.S.S. (2007). “Short and Long Performance of Bookbuilt
IPOs in India”, International Journal of Management Practices
and Contemporary Thoughts, Volume 2, Issue 2, pp.19-29,
a c c e s s e d o n O c t o b e r 1 4 , 2 0 1 1
h t t p : / / d s p a c e . i i m k . a c . i n /
bitstream/2259/523/1/sssk.pdf

ALLANA MANAGEMENT JOURNAL OF RESEARCH /JULY - DEC 2012 / PAGE NO. 036
MARKETING
MANAGEMENT
he Rs 130,000-crore FMCG (Fast Moving Consumer Goods) Tindustry, which accounts for 2.2 per cent of India's
national income, was not exactly known for introducing
new products or “INNOVATING” and used the regular tried and
tested methods. But not anymore !
10 years ago, a product like “FAIR AND HANDSOME” for MEN,
would be blasphemy but today, it is a REALITY. India is changing
and changing fast. With 60% of population tending towards being
“BELOW 30 YEARS OF AGE”, the age of INDIAN CONSUMERISM has
arrived.
Hence, it isn't difficult to note that in the year 2010 alone,
10,000 SKU's were leashed into the market by the FMCG
companies. Stock Keeping Unit's (SKU's) are : ANY INNOVATION
EITHER IN CONTENT OR PACKAGING RANGING FROM A MINOR
TWEAK TO A COMPLETELY NEW PRODUCT OFFERING.
If one sees the level of consumerism around us these days, it is
difficult to comprehend that the per capita consumption of
almost all FMCG products in the country is amongst the lowest in
the world. But that is changing and changing real fast. The
demand or prospect could be increased further if these
companies can change the consumer's mind set and offer new
generation products. Earlier, Indian consumers were using non-
branded products, but today, different brands are available and
the same consumers are willing to pay more for branded quality
products. It's the quality, promotion and innovation of products,
which can drive these Companies and Sectors. As a foundation
for overtaking their competitors in the current competitive
scenario, FMCG companies in India are using these trends to their
“IS ‘INNOVATION’ THE NEW AGE
MANTRA, FOR FMCG IN INDIA ?”
SHRI PRADIP P. CHATTERJJEE
RESEARCH SCHOLAR

ALLANA MANAGEMENT JOURNAL OF RESEARCH /JULY - DEC 2012 / PAGE NO. 037
advantage. Economic down turns provide
opportunities to come out ahead of the pack and
requires using recessionary trends to build and
innovate.
But it's important to have a clear and comprehensive
strategy and in the race to introduce new products to
serve changing consumer needs, it's important to be
selective. Each new product a company launches has
the potential to increase its operating complexity.
Those added costs could reverse any revenue gains.
Any time is a good time to introduce new products for
a changing consumer, it's also important to reduce
complexity by pruning unprofitable product lines or to
reconsider the need for high-end products at a time
when shoppers want better value. Consumer-products
company Marico is trying to get consumers to use its
Parachute brand of hair oil more frequently by
promoting the traditional habit of oil massage, hoping
to gain from category expansion. There are lessons
here for other traditional product sectors like
toothpaste, soaps, and shampoos, which have
witnessed modest volume growth in the past.
As part of it's PRICE REDUCTION (an INNOVATION
INDEED, STRATEGICALLY), Hindustan Unilever did
what was unheard of before with Lifebuoy, its leading
soap brand, which is particularly popular in rural
India. In January 2009, the company reduced the price
from 13 rupees to 12 rupees on 90-gram bars. Even a 1-
rupee price cut can be significant in a country like
India. Meanwhile, companies such as Godrej
Consumer Products, P&G are taking other steps that
will allow them to reduce prices aggressively while
making sure margins aren't eroded—moves such as
improving supply chains by shifting suppliers, ensuring
they're not caught with excess inventory as consumer
demand fluctuates, and looking for ways to reduce
operating costs. Costs become even more critical in
case of PREMIUM PRODUCTS. India's consumers just
aren't willing to pay high prices.
There are three routes for companies hoping to avoid
overpriced goods :
Acquire a less expensive brand
Price products more carefully
Launch new value-focused brand extensions,
such as different package sizes
Dove shampoo in India successfully introduced a 3-
rupee sachet in 2007 that now accounts for more than
30% of the brand's hair-care sales. The sachet was
launched before the downturn, as part of a strategy to
reach lower-end consumers. Winning companies are
doubling down on traditional trades in rural areas,
too.
Right now consumer demand for fast-moving
consumer goods is holding up well in rural India—and
the regions represent a major opportunity. More than
40% of all purchases of biscuits, a household staple in
India, take place outside of urban areas, according to
research done by BAIN & CO. Success in rural areas
starts by establishing the right product mix for local
stores, adapting promotions, and ensuring a tight
focus on route-to-market management. That's why
Clinic Plus, Hindustan Unilever's leading shampoo
brand, is aggressively targeting its half-a-rupee sachet
to rural consumers through extensive trade
promotions.
Another recent INNOVATION has been seen in recent
times in the way CHANNELS have been passed on
commission or discounts. Marico, HUL and DABUR, all
have programs that give LOCAL RETAIL stores in India's
cities, the same type of discounts on branded goods
that are commonly provided to modern retailers. In
exchange, the consumer-goods companies get point-
of-sale visibility and dominant display—the goal is to
tap the large loyal customer base that's typical of big-
city local outlets. For consumer-products companies
in India, moving up in the downturn means focusing on
selling only the right products, becoming more
strategic about pricing, following consumers to where
they shop, and investing ahead of the competition to
strengthen a core market segment or help make the
most of a new one.
INNOVATING means INVESTING for the future—ahead
of the competition. Marico has built its core business
of healthy foods based on its core product, OIL. Marico
has expanded its Saffola cooking oil brand to include
extensions such as Saffola foods for diabetics and
Saffola Zest baked snacks. While the Indian company

ALLANA MANAGEMENT JOURNAL OF RESEARCH /JULY - DEC 2012 / PAGE NO. 038
began the brand-extension strategy before the
downturn, it hasn't let the economic turbulence
curtail its efforts. The moves also help detract
newcomers from establishing strong positions in the
downturn and is an effective and able step AND that is
“INNOVATION”. The reasons for the change are
obvious. The just-concluded decade of high growth,
raising per capita consumption to Rs 52,800 in 2010,
has instilled a new confidence and boosted
consumption.
According to a McKinsey estimate, average household
income in India is set to grow from Rs 113,744 in 2005
to Rs 318,896 by 2025. India's gross domestic product,
or GDP, is even expected to overtake that of its former
colonial master Britain in the coming decade. The
demographic pattern - 59 per cent of India's 1.2 billion
people are below 30 - encourages innovation too. The
same people who earlier set curd every night to
consume the next day now buy it readymade from the
store, where they have the option of the probiotic
variety, as well as flavoured yoghurt. "This is the next
stage, where a large segment of the population has
moved up the value chain to becoming aspirants and
thereby finicky in its choices.
Every year, FMCG companies are getting into new
product verticals. In 2008, FMCG giant Hindustan Unilever moved into consumer durables by launching
a water purifier, PUREIT. Dabur's innovations include
OXYLIFE BLEACH - for which it is awaiting a patent -
that claims to release oxygen into the skin. It is aimed
purely at the 20,000-odd beauty parlours in the
country. Marico has launched a branded rice, SAFFOLA
ARISE, which has a low glycemic index, or reduced
carbohydrate content. Dabur was equally enterprising
too, when it tweaked it successful Chyawanprash
brand - a health tonic whose formula is based on an
ancient Ayurvedic text - to provide it in different
flavours. It did the same with its HONEY line of
products and introduced COUGH SYRUP with honey as
it's base, which was easy to use with children.
However, it must be noted that INNOVATIONS COST
MONEY. Every time, launching a new SKU costs
between Rs 8 crore and Rs 10 crore and could go up to
Rs 15 crore in some cases. This includes the cost of
research trials, promotions and marketing budgets.
Despite the expense, relatively smaller companies
have not only launched innovative products but also
carved out new niches for themselves with these, as
well as forced multinationals to follow their example.
Multinationals like HUL and L'Oreal were forced to
follow suit when health and personal care products
major Emami launched a new fairness cream
exclusively for men, Fair and Handsome. Multi
national companies are doing it too. Apart from its
water purifier, HUL has expanded its chain of Lakme
salons and even experimented with laundry services in
the past. Research and development centres are the
flavour of the season at focus group meetings. Marico's
Parachute Hot Oil was borne out of a discussion on
giving away a heater with its coconut hair oil as
consumers faced the problem of the oil-congealing-
during-winters. Ways to reduce the costs of a heater,
MARICO came up with the idea of hot oil instead. The
innovation bandwagon is also driving ACQUISITIONS.
Companies are getting into new segments by acquiring
brands.
The new game in the FMCG space is “INNOVATION” and
the companies that accept this fact with this game
changer rule in mind, will be here to stay longer.

ALLANA MANAGEMENT JOURNAL OF RESEARCH /JULY - DEC 2012 / PAGE NO. 039
MARKETING
MANAGEMENT
INTRODUCTION
Orissa, officially spelled 'Odisha' is a state of India,
located on the east coast of India, by the Bay of Bengal.
It is the modern name of the ancient kingdom of
Kalinga, which was invaded by the Mauryan Emperor Ashoka in
261 BC. The modern state of Orissa was established on April 1,
1936, as a province in British India and consisted predominantly
of Oriya speakers. April 1 is therefore celebrated as Utkala
Dibasa (foundation day of Orissa). Cuttack remained the capital
of the state for over eight centuries until April 13, 1948 when
Bhubaneswar was officially declared as the new capital of Orissa,
and still is the present capital of this state. There are 30 districts
in Orissa. Orissa is governed through a parliamentary system of
representative democracy, a feature the state shares with other
Indian states. The state contributes 21 seats to Lok Sabha and 10
seats to Rajya Sabha of the Indian Parliament. The Assembly is
unicameral with 147 Members of the Legislative Assembly, or
MLAs, including one nominated from the Anglo-Indian
community. Terms of office run for 5 years, unless the Assembly is
dissolved prior to the completion of the term. The main players
in the regional politics are the Biju Janata Dal, the Indian
National Congress and Bhartiya Janata Party. Following the
Orissa State Assembly Election in 2009, the Naveen Patnaik led
Biju Janata Dal (BJD) came to power for the third consecutive
time. Naveen Patnaik took over his father's Lok Sabha seat in
1996 as a member of the Janata Dal. In 1997, Patnaik split from
Janata Dal over its failure to ally with the BJP, and formed the
BJD in December 1997. The BJD has participated in several ruling
coalitions with the Bharatiya Janata Party (BJP) both at the
“AN EXPLORATIVE STUDY
ON POLITICAL MARKETING
IN WESTERN ORISSA”
DR. SRINIBASH DASH
SR. LECTURER,
GANGADHAR MEHER (AUTO.)
COLLEGE, SAMBALPUR
SRI SISIR RANJAN DASH
LECTURER,
GANGADHAR MEHER (AUTO.)
COLLEGE, SAMBALPUR

ALLANA MANAGEMENT JOURNAL OF RESEARCH /JULY - DEC 2012 / PAGE NO.040
Centre and in Orissa. The BJD, however, was one of the
main professedly secular parties of the National
Democratic Alliance (NDA). Much of the popularity and
electoral success of the party is credited to Patnaik's
image as an incorruptible and 'clean' candidate. BJD
won nine seats in the 1998 general elections and
Naveen was named the Minister for Mines. In the 1999
general elections, BJD won 10 seats. The party won a
majority of seats in the state legislative assembly in
the 2000 and 2004 elections in alliance with BJP. The
party won 11 Lok Sabha seats in the 2004 elections.
However the BJD parted ways with the BJP for both
the Lok Sabha and Assembly elections 2009 citing
differences in seat sharing. As for now, it is a part of
the Third Front. In 2009 loksabha election, BJD won 14
seats and secured strong 103 legislative seats out of
147 seats in assembly election of 2009. This study
makes an humble attempt to explore the perception
of citizens of Western Odisha towards the
performance of BJD led government in the state basis
various predefined parameters and identify the
factors influencing the citizens' voting decisions.
RESEARCH OBJECTIVES
The reason to conduct this study is,
1. To measure the satisfaction levels of citizens
of Western Odisha towards the performance
of BJD led government in the state.
2. To identify the factors influencing the citizens'
voting decisions in the state elections.
RESEARCH METHODOLOGY
A survey instrument in the form of close-ended
questionnaire was developed for the purpose of
collecting the main data for the study. This study was
conducted districts of Western Odisha that includes
Sambalpur, Balangir, Bargarh, Sonepur, Kalahandi,
Sundargarh, Boudh, Deogarh, Nuapada and
Jharsuguda. Factors such as precision and confidence,
population size, time and cost constraints were taken
into consideration in selecting sample size. Using the
non-probability sampling technique, a total of 88
respondents were selected as a sample of the study
from the region. The respondents come from various
age groups, income status, educational qualifications
and both the gender in order to increase the
generalization of the result.
ANALYSIS AND RESULTS
For the purpose of testing the reliability of the data
Cronbach's alpha has been used in the present study.
Cronbach's alpha developed by Lee Cronbach in 1951 is
the most common form of internal consistency
reliability coefficient. Alpha equals zero when the
true score is not measured at all and there is only an
error component. Alpha equals 1.0 when all items
measure only the true score and there is no error
component. Cronbach's alpha is a measure of internal
consistency, that is, how closely related a set of items
are as a group. By convention, a lenient cut-off of 0.6
is acceptable in exploratory research. The data was
tested for reliability and yielded a Cronbach alpha
score of 0.865495152.
The following are the tables representing the results
of the study. In these tables the average of
respondents falling in each categories of responses are
given. The sample has been divided gender wise (i.e.
Male and Female), age wise (i.e. <than 30 and >than 30
years of age), income wise (i.e. <than 20000 MHI and
>than 20000 MHI) and educational status wise (i.e.
Graduates and Post Graduates), further they were
tested through 'Z' Test in order to discover any
significant differences in the perceptions. Since most
of the theoretical distributions in statistics like 2Binomial, Poisson, Beta, Gamma, t, F, x , etc. do
conform to Normal Distribution asymptotically, the
present paper has used the Normal Test of Significance
for large sample (Gupta. S. C.; 2009). However, for
samples usually less than 30, the exact sample tests of
significance are applied. In the present study since the
total sample size is 88 and the sample size in each
demographic groups are also above 30, the large
sample test is done by using the standard normal
variate Z (i.e. Z - Test). Calculations of descriptive
statistics like mean values and standard deviations
and tests of significance were conducted using
Microsoft Excel. The factor analysis has been done
with the help of Statistical Package for Social Sciences
(SPSS) on the cross-sectional data comprising various
parameters of consumption behavior. The results of
the study shows that the top three areas in which the

ALLANA MANAGEMENT JOURNAL OF RESEARCH /JULY - DEC 2012 / PAGE NO. 041
BJD led government has succeeded in the past years of
its ruling are infrastructure development,
industrialization and working of the government with
their scores 62.0 (mean = 3.1), 60.9 (mean = 3.0) and
60.7 (mean = 3.0) respectively. It seems that the BJD
led government has put maximum emphasis on the
infrastructure development and industrialization in
the region. Biju Patnaik during his times had set up
Kalinga tubes, Kalinga Airways, Kalinga Iron work,
Kalinga Refractories and the Kalinga, a daily Oriya
Newspaper. In 1951 he had established the
international Kalinga Prize for popularisation of
Science and Technology among the people and
entrusted the responsibility to the UNESCO. The
projects which he was known to have spearheaded
includes the Hirakud Dam, Port of Paradip, Orissa
aviation centre, Bhubaneswar Airport, the Cuttack-
Jagatpur Mahanadi highway bridge, Regional
Engineering College , Rourkela, (presently known as
NIT, Rourkela), Sainik School Bhubaneswar, Orissa
University of Agriculture and Technology-
Bhubaneswar, NALCO (National Aluminum Company),
Rourkela Steel Plant and the Choudwar & Barbil
industrial belts. Following his footsteps the BJD led
government in Orissa has set up the industrial belt at
Jharsuguda, constructed multipurpose flyovers in the
Bhubaneswar city as well as across all over Orissa,
initiated PPP mode investments for city building and
also for other projects, renovated highways,
encouraged establishment of private universities like
KIIT and 'SOA' university, institutions of repute like IIT,
Bhubaneswar and AIIMS, Orissa Chapter etc. Apart
from this the functioning of the government is also
getting appreciated by the people. BJD today is
perceived as one of the political parties which is
actually working as per its vision and mission.
The most weak areas discovered in the study (as
perceived by the people) are employment generation,
main streaming Maoists and combating corruption
with score 48.9 (mean = 2.4), 49.1 (mean = 2.5) and
49.1 (mean = 2.5) respectively. Even after the rapid
industrialization in the state, people perceive that the
employment generation in the region are not up to the
mark since most of the people from outside the state
are getting the newly created jobs. Secondly, during
the last few years only, the Maoists have become more
active in the state. Even, the BJD led government is
not able to combat corruption in a good manner. The
male citizens of the region gave significantly low
ratings on overall performance of the government
(mean = 2.5) as compared to the female citizens
(mean = 3.1). The male citizens seem to be more
dissatisfied on the grounds of agricultural
development (mean = 2.3), social change (mean =
2.4), justice (mean = 2.7), expansion of education and
literacy (mean = 2.7), and working of the BJD led
government (mean = 2.7) (See Annexure I). This is
understandable, since the male citizens in the region
are politically more active and their proportion in
terms of participation and voting in the state elections
is more than the female voters, their verdict on the
performance of the government is more reliable. It
has been also explored in the survey that the higher
age group (>than 30 Yrs) voters are significantly less
satisfied with the performance of the government
(mean = 2.7) as compared to the young generation
voters (<than 30 Yrs) (mean = 2.8) (See Annexure II).
The higher age group citizens' views are found to be
significantly different (mean = 2.5) than the young
generation view (mean = 3.2) on expansion of
education and literacy by the BJD led government.
This is one area where the BJD led government needs
special focus. Then when the survey results were
compared between the lower income group people
(<than 20000 MHI) and higher income group people
(>than 20000 MHI), it has been discovered that the
higher income group people are significantly less
satisfied with the overall performance of the
government (mean = 2.7) as compared to the lower
income group people (mean = 2.9) (See Annexure III).
The higher income group citizens of the region
perceive that more of industrialization should be
promoted in the state (mean = 2.8) and secondly, the
TABLE 1
Sl. No. Description/Attributes N Range Min Max Mean SD PercentageRank
Overall= 88 4 1 5 2.8 1.2 55.4
1 Working of the BJD government 88 4 1 5 3.0 1.1 60.7 3
2 Peace and Reconciliation 88 4 1 5 3.0 1.2 60.7 4
3 Industrialization 88 4 1 5 3.0 1.3 60.9 2
4 Agricultural Development 88
4
1
5
2.5 1.3 50.9 11
5 Combating Corruption 88
4
1
5
2.5 1.2 49.1 12
6 Infrastructure Development
88
4
1
5
3.1 1.3 62.0 1
7State Restructuring through Governance 88
4
1
5
2.6 1.1 51.6 10
8 Employment Generation 88
4
1
5
2.4 1.3 48.9 14
9 Poverty Eradication 88
4
1
5
2.7 1.3 54.3 8
10 Mainstreaming the Maoists 88 4 1 5 2.5 1.2 49.1 13
11 Social Change 88 4 1 5 2.6 1.1 52.7 9
12 Justice 88 4 1 5 2.9 1.2 57.7 7
13 Expansion of Education & Literacy 88 4 1 5 2.9 1.2 58.9 5
14 Functioning of Health System 88 4 1 5 2.9 1.3 58.6 6

ALLANA MANAGEMENT JOURNAL OF RESEARCH /JULY - DEC 2012 / PAGE NO. 042
government needs to put more emphasis on poverty
eradication (mean = 2.8). Another important thing
that came into picture in the study is that the higher
educated mass in the region (post graduates) are
significantly less dissatisfied (mean = 2.7) as
compared to the lower educated mass (graduates)
(mean = 2.8) (See Annexure IV).
RESULTS OF FACTOR ANALYSIS
In the present study, the factors influencing voting
decisions have been explored by asking the
respondents to evaluate their relative importance on
each parameter on a semantic differential scale. But,
before going for the factor analysis it is always
advisable to test the appropriateness of the factor
model through the available data. Bartlett's Test (BT)
of Sphericity and Kaiser-Meyer-Olkin (KMO) Measure of
Sampling Adequacy are two statistics on the SPSS
output, which provides information whether the data
set is appropriate for carrying factor analysis or not.
Table 2 below presents the KMO and BT results of the
data.
TABLE 2 KMO AND BARTLETT'S TEST
Bartlett's test of sphericity can be used to test the null
hypothesis that the variables are uncorrelated in the
population; in other words, the population correlation
matrix is an identity matrix. In an identity matrix, all
the diagonal terms are 1, and all off-diagonal terms
are 0.The test statistic for sphericity is based on a chi-
square transformation of the determinant of the
correlation matrix. A large value of the test statistic
favours the rejection of the hypothesis. If the
hypothesis cannot be rejected, then the
appropriateness of factor analysis should be
questioned. As the observed significance level in the
present study is found to be 0.000 which is small
enough to reject the hypothesis, the null hypothesis
that the population correlation matrix is an identity
matrix is rejected and we can conclude that the
strength of the relationship among variables is strong.
Hence, it is a good idea to proceed for factor analysis
on the data.
Another useful statistic is the Kaiser-Meyer-Olkin
(KMO) measure of sampling adequacy. This index
compares the magnitudes of the observed correlation
coefficients to the magnitudes of the partial
correlation coefficients. Small values of the KMO
statistic indicate that the correlations between pairs
of variables cannot be explained by other variables
and the factor analysis may not be appropriate.
Generally, a value greater than 0.5 is desirable. The
KMO statistic in the present study is also large (>0.5),
thus factor analysis would be considered as an
appropriate technique for analyzing the correlation
matrix.
Once, it is ascertained that factor analysis can be
worked out on the present data set, the next step is to
actually implement it and explore the factors
underlying the voters' behaviour. The goal of factor
analysis is to identify the not-directly-observable
factors based on a set of observable or measurable
indicators. The first step in factor analysis is to
produce a correlation matrix for all variables.
Variables that do not appear to be related to other
variables can be identified from this matrix. The
number of factors necessary to represent the data and
the method for calculating them must then be
determined. Principal components analysis is one
method of extracting factors. In principal components
analysis, linear combinations of variables are formed.
The first principal component is that which accounts
for the largest amount of variance in the sample, the
second principal component is that which accounts for
the next largest amount of variance and is
uncorrelated with the first and so on. At this step it is
also necessary to ascertain how well the model fits the
data. Coefficients (factor loadings), that relate
variables to the identified factors, are calculated. In
order for a parameter to belong to a given factor it is
recommended that the loading value be not less than
0.40. The factor model is then rotated to transform
the factors and make them more interpretable. The
rotation phase transforms a factor matrix in which
most factors are correlated with many variables into
one in which each factor has non-zero loadings for only
Kaiser-Meyer-Olkin Measure of Sampling Adequacy. .812Bartlett's Test of Sphericity
Approx. Chi-Square 405.224
df 91
Sig. .000

ALLANA MANAGEMENT JOURNAL OF RESEARCH /JULY - DEC 2012 / PAGE NO. 043
some of the variables. The most commonly used
method for rotation is varimax rotation which seeks to
minimise the number of variables that have high
loadings on a factor thus permitting the factors to be
differentiated from one another. Following rotation,
`scores for each factor can be computed for each case
in a sample. These scores can then be used in further
data analysis, such as analysis of variance, correlation
and regression analysis. The results of the factor
analysis of the voters' behavioral variables are shown
in Table 3.
Table 3 above provides the factorial structure of the
behaviour of the variables in the sample. In the
present sample, a forced three factor model of voters'
perception has explained 63. 95297% of the variance.
Based on the factor loadings, the variables of voters'
behavior in the present study can be compressed to
three important factors and on the basis of the nature
of variables included in different factors. The present
BJD led government should take into consideration the
above three factors to work on for making its position
more stronger in the state.
CONCLUSION
Three major findings emerged from this preliminary
study. Firstly, the instrument used in this study
indicated Cronbach's alpha values greater than .60
indicating good internal consistency and could be seen
to be most reliable. Secondly, results from this study
also revealed that the majority of respondents have a
Table 3 Rotated Component Matrix
Components
Factor 1 Factor 2 Factor 3
Working of the BJD government VAR00001 0.524558
Peace and Reconciliation VAR00002 0.660312
Industrialization VAR00003
0.617471
Agricultural Development
VAR00004
0.528923
Combating Corruption VAR00005
0.526119
Infrastructure Development
VAR00006
0.823646
State Restructuring through Governance
VAR00007
0.561246
Employment Generation VAR00008 0.701616 Poverty Eradication VAR00009
0.478972
Mainstreaming the Maoists
VAR00010
0.816385
Social Change VAR00011
0.437133
Justice VAR00012
0.581617
Expansion of Education & Literacy VAR00013 0.832329
Functioning of Health System VAR00014 0.588911
Extraction Method: Principal Component Analys is.
Rotation Method: Varimax with Kaiser Normalization.
a Rotation converged in 4 iterations.
moderate level of satisfaction towards the present
BJD led government in the state based on various
predefined parameters. Thirdly, some problem areas
that have been discovered which need immediate
attention of the leaders of the party are;
1. Employment Generation
2. Main streaming Maoists
3. Combating Corruption
The results of this study are preliminary in nature but
are able to provide some insights that can be
considered as intervening elements of political issues
in this context. These findings even if cannot be
treated as predictions but the data will be useful when
developing a research hypothesis for a further study.
REFERENCES
JOURNALS
1. Hachhethu, Krishna; Kumar, Sanjay; and Subedi, Jiwan; (2008).
“Nepal in Transition: A Study on the State Democracy”,
International Institute for Democracy and Electoral Assistance,
ISBN 978-91-85724-35-2.
2. Whyte, Martin K. (2009). “Fair versus Unfair: How Do Chinese
Citizens View Current Inequalities?”, (pp. 305 – 332).
BOOKS
1. Gupta, S.C. (2011). “Fundamentals of Statistics”, Himalaya
Publishing House, Mumbai
2. Kothari, C.R., “Research Methodology”, (2005). New Age
International, New Delhi
3. Malhotra, N.K., (2005). “Marketing Research - An Applied
Orientation”, 5th Edition, Pearson Education Inc
4. Patri, Digambar., Patri., D.N. (2011). Statistical Methods”,
Kalyani Publishers, New Delhi.
WEB SITES
www.wikipedia.com

ALLANA MANAGEMENT JOURNAL OF RESEARCH /JULY - DEC 2012 / PAGE NO. 044
TABLE 4 Male Vs. Female
Sl. No.
Description/Attributes
Male (N=57)
Female (N=31)
Z
Overall=
2.5
3.1
-7.3
1 Working of the BJD government
2.8
3.5
-3.0
2 Peace and Reconciliation
2.9
3.2
-0.9
3 Industrialization
3.0
3.2
-0.7
4 Agricultural Development
2.3
3.1
-2.5
5 Combating Corruption 2.4 2.6 -0.7
6 Infrastructure Development 3.0 3.2 -0.7
7 State Restructuring through Governance 2.5 2.8 -1.1
8 Employment Generation 2.3 2.8 -1.9
9 Poverty Eradication
2.5
3.1
-1.8
10 Mainstreaming the Maoists
2.5
2.4
0.2
11 Social Change
2.4
3.1
-3.0
12 Justice
2.7
3.3
-2.8
13 Expansion of Education & Literacy
2.7
3.5
-3.5
14 Functioning of Health System 2.8 3.1 -1.0
TABLE 5
<than 30 Yrs Vs. >than 30 Yrs
Sl. No.
Description/Attributes
<than 30 Yrs (N=55)
>than 30 Yrs
(N=33)
Z
Overall=
2.8
2.7
2.2
1 Working of the BJD government
3.1
2.9
0.9
2 Peace and Reconciliation
3.1
3.0
0.2
3 Industrialization
3.1
2.9
0.6
4 Agricultural Development 2.7 2.3 1.5
5 Combating Corruption 2.3 2.7 -1.2
6 Infrastructure Development 3.1 3.2 -0.5
7 State Restructuring through Governance 2.7 2.5 0.8
8 Employment Generation 2.5 2.3 1.0
9 Poverty Eradication
2.9
2.4
1.6
10 Mainstreaming the Maoists
2.4
2.5
-0.2
11 Social Change
2.7
2.5
0.9
12 Justice
2.9
2.8
0.6
13 Expansion of Education & Literacy
3.2
2.5
2.6
14 Functioning of Health System
2.9
3.0
-0.2
ANNEXURE - I
ANNEXURE - II

TABLE 7 Graduates sVs. Post Graduates
Sl. No.
Description/Attributes
Graduates (N=56)
Post Graduats
(N=32)
Z
Overall=
2.8
2.7
2.1
1 Working of the BJD government
3.1
2.8
1.3
2 Peace and Reconciliation
3.2
2.7
1.9
3 Industrialization
3.2
2.8
1.6
4 Agricultural Development
2.7
2.3
1.2
5 Combating Corruption 2.5 2.3 0.8
6 Infrastructure Development 3.1 3.1 0.2
7 State Restructuring through Governance 2.5 2.7 -0.7
8 Employment Generation
2.5
2.3
0.5
9 Poverty Eradication
2.7
2.8
-0.5
10 Mainstreaming the Maoists
2.5
2.4
0.3
11 Social Change
2.6
2.7
-0.3
12 Justice
3.0
2.7
1.0
13 Expansion of Education & Literacy
3.0
2.9
0.4
14 Functioning of Health System 3.0 2.9 0.3
TABLE 6 <than 20000 MHI Vs. >than 20000 MHI
Sl. No. Description/Attributes
<than 20000 MHI
(N=44)
>than 20000 MHI
(N=44)
Z
Overall=
2.9
2.7
3.1
1 Working of the BJD government
3.2
2.9
1.3
2 Peace and Reconciliation
3.2
2.9
1.2
3 Industrialization
3.3
2.8
2.1
4 Agricultural Development
2.6
2.5
0.2
5 Combating Corruption 2.5 2.4 0.3
6 Infrastructure Development 3.3 2.9 1.7
7 State Restructuring through Governance 2.6 2.5 0.5
8 Employment Generation
2.7
2.2
1.8
9 Poverty Eradication
3.0
2.4
2.2
10 Mainstreaming the Maoists
2.5
2.4
0.2
11 Social Change
2.6
2.7
-0.2
12 Justice
2.9
2.9
0.0
13 Expansion of Education & Literacy
3.0
2.9
0.3
14 Functioning of Health System 3.0 2.9 0.2
ALLANA MANAGEMENT JOURNAL OF RESEARCH /JULY - DEC 2012 / PAGE NO. 045
ANNEXURE - III
ANNEXURE - IV

ALLANA MANAGEMENT JOURNAL OF RESEARCH /JULY - DEC 2012 / PAGE NO. 046
MARKETING
MANAGEMENT
INTRODUCTION
The market particularly sales is mostly cut throat
competitive. It is difficult to survive in such market
without appropriate competitive strategies over the
competitors. Normally people do not prefer sales jobs and they
believe that it is tough, heavy mental and physical pressure, and
most common is Targets. But there are people in the market who
are working in the sales field for many years and enjoying their
jobs by accepting new work challenge every day. Usually the
term cold calling refers to call or face the customers to their
commercial places and households for face-to-face for first time
without prior appointment. Cold calling is also known as
canvassing or door knocking. “in the essence of cold calling is the
art of approaching someone, professionally, openly and
meaningfully, with a sensible preposition.” Cold calling is an
important technique in sales process. It is useful in many aspects
of business and work communication apart from the sales
activities and sales functions.
REVIEW OF THE LITERATURE
A research report named 'Lead Generation Insight for 2007' by
Mike Schulz, Andrea Meachan Rosal and Johan Doerr concluded
that “Cold Calling is second only to referrals a the number one
lead generation tactic.” Stefan Torques suggested that cold
calling must be targeted and appropriate. Some prevalent
misconceptions about cold calling are Cold Calling is a number
game. Per day make 100 calls and eventually somebody will
respond as 'yes'. Go through the numbers and hang up until you
finally get response from the customer. Prospect can be anyone,
“COLD CALLING - 'THE STRATEGIC
WAY OF SELLING TO UNKNOWN
POTENTIAL PROSPECT'”
JIGNESH R. VAJA
HOD, ASST. PROFESSOR
SARVODAY COLLEGE OF MANAGEMENT
& TECH.(MBA), LIMBDI, GUJARAT
PRAKASHRAJ P. KUMAVAT
ASST. PROFESSOR
SARVODAY COLLEGE OF MANAGEMENT
& TECH.(MBA), LIMBDI, GUJARAT

ALLANA MANAGEMENT JOURNAL OF RESEARCH /JULY - DEC 2012 / PAGE NO. 047
just open the phone book or directory and start
calling, manipulate the prospect into agreeing and
finally ABC- Always Be Closing.
A book named 'Cold Calling' by Fank J. Rumbauskas, Jr.
described the cold calling strategy as wastage of time
and money. In his book the author Stephan Schiff man's
Sales Essentials has discuss the three types of
potential customers in the world of sales which are a
customer, an account or a client with whom a sales
person has closed the sales, a lead, suspect,
candidate, opportunity are the someone a sales
person want to talk with, a prospect is a person whom
sales person has already sold and servicing him. In
addition to this the author has also suggested the
various types of saying No as an objection and the
strategies to handle such objections. Schiff man has
also discussed the key principles of cold calling to
convert the prospect into sales. These principles are;
people respond in kind, some response can be
anticipated, communicate people through stories.
There is a formula that is more important to be
successful sales people than any other; A=P=S. In other
words, Appointments give you Prospect give you Sales.
If you have no new appointments today, what is your
chance of getting the new prospect? It is nonexistent.
If you have no new prospect, what is your chance of
making a sale? That is too nonexistent (Stephan Schiff
man, 2008).
Cold Calling for Chickens (Cyan Communications,
London), sales trainer Bob Hetherington writes, “fact;
in any market 85 percent of the available new business
goes to the 5 percent of sales people who know the
secret of successful cold calling”. Though
Hetherington uses the term cold calling, like most of
those who teach the successful way to do it, the call is
not that cold at all. Scott-Vincent Borba, CEO of
Borba, sells a line of high-end unique skin care
products that are applied as well as ingested. In his
first full year of business, Borbadid $ 5 million in sales,
and every deal he made started with a cold call. His
products are carried by such companies as Saks,
Sphere, Four Seasons Hotes, Victoria's Secret.
THE STATEMENT OF PROBLEM
Cold calling is to be considered as one of the toughest
activity for the sales department. Normally, initially
the sales personnel are quiet negative towards this
activity. Since cold calling does not give surety of sales
but it just can generate leads and the pipeline of
customers in the sales directory. This technique of
marketing is extensively used by the various service
industries as well as the production firms. In this
technological advanced world the business firms are
using several tools to generate business or leads from
the unknown prospects. These tools are internet,
feedback form, registration process etc. This research
article is purely prepared on secondary data and the
purpose of doing so is diagnose the importance and
also the limitation of this method. This article is
prepared to understand the problems face by sales
executives while undertaking cold calling activities.
OBJECTIVES OF RESEARCH
The major objective behind this research is to
evaluate the effectiveness of Cold Calling process over
the sales of the business firms. The marketers are not
only concern with results but also concern with
increased cost and time involved in this process of
marketing. Cold Calling is one of the important tools
for the marketers to generate leads and create
pipeline for future prospects. In addition to this the
aim of this research is to evaluate the past results and
real cases of cold calling.
METHODOLOGY
This research article is mainly based on secondary
data and available information through various
sources. For doing this research several books,
magazines, old research articles and web references,
notes etc. are used. All the analysis and interpretation
is based on above mentioned sources of data.
THE ELEMENTS OF COLD CALLING
To make the call successful, the caller need to work
upon systematically. The below mentioned elements
of cold calling are helpful to design proper cold calling
script.
1. GET THE CLIENT'S ATTENTION
It is one of the important elements of cold calling to
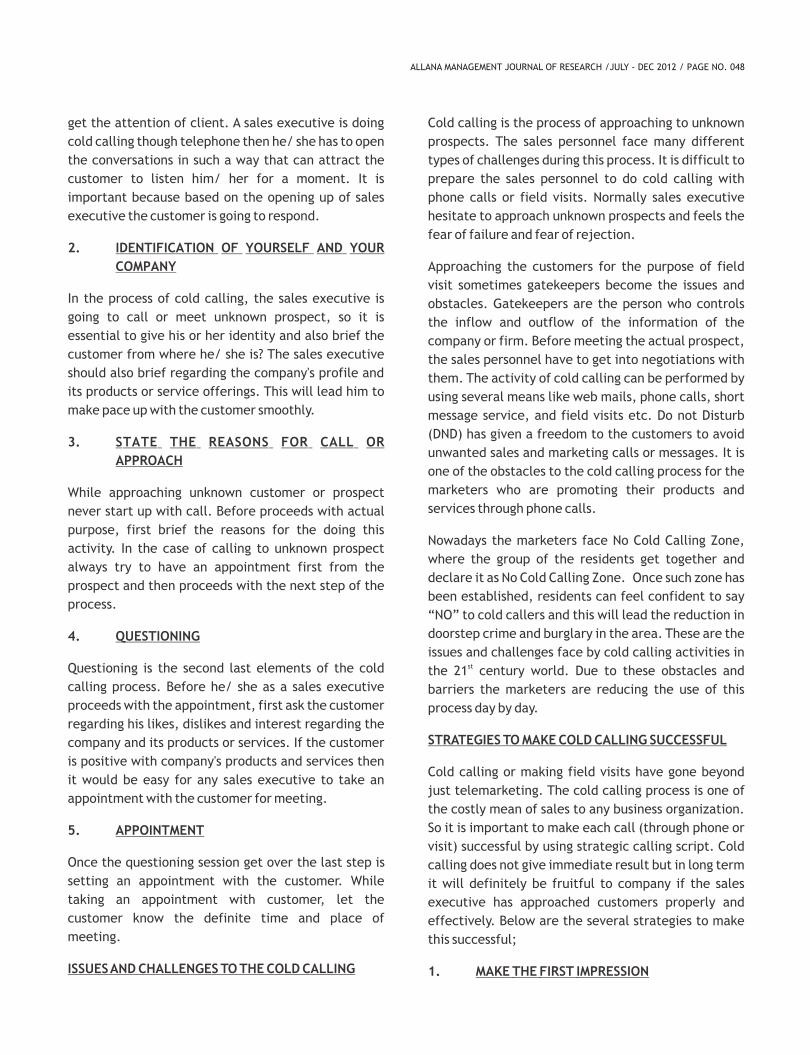
ALLANA MANAGEMENT JOURNAL OF RESEARCH /JULY - DEC 2012 / PAGE NO. 048
get the attention of client. A sales executive is doing
cold calling though telephone then he/ she has to open
the conversations in such a way that can attract the
customer to listen him/ her for a moment. It is
important because based on the opening up of sales
executive the customer is going to respond.
2. IDENTIFICATION OF YOURSELF AND YOUR
COMPANY
In the process of cold calling, the sales executive is
going to call or meet unknown prospect, so it is
essential to give his or her identity and also brief the
customer from where he/ she is? The sales executive
should also brief regarding the company's profile and
its products or service offerings. This will lead him to
make pace up with the customer smoothly.
3. STATE THE REASONS FOR CALL OR
APPROACH
While approaching unknown customer or prospect
never start up with call. Before proceeds with actual
purpose, first brief the reasons for the doing this
activity. In the case of calling to unknown prospect
always try to have an appointment first from the
prospect and then proceeds with the next step of the
process.
4. QUESTIONING
Questioning is the second last elements of the cold
calling process. Before he/ she as a sales executive
proceeds with the appointment, first ask the customer
regarding his likes, dislikes and interest regarding the
company and its products or services. If the customer
is positive with company's products and services then
it would be easy for any sales executive to take an
appointment with the customer for meeting.
5. APPOINTMENT
Once the questioning session get over the last step is
setting an appointment with the customer. While
taking an appointment with customer, let the
customer know the definite time and place of
meeting.
ISSUES AND CHALLENGES TO THE COLD CALLING
Cold calling is the process of approaching to unknown
prospects. The sales personnel face many different
types of challenges during this process. It is difficult to
prepare the sales personnel to do cold calling with
phone calls or field visits. Normally sales executive
hesitate to approach unknown prospects and feels the
fear of failure and fear of rejection.
Approaching the customers for the purpose of field
visit sometimes gatekeepers become the issues and
obstacles. Gatekeepers are the person who controls
the inflow and outflow of the information of the
company or firm. Before meeting the actual prospect,
the sales personnel have to get into negotiations with
them. The activity of cold calling can be performed by
using several means like web mails, phone calls, short
message service, and field visits etc. Do not Disturb
(DND) has given a freedom to the customers to avoid
unwanted sales and marketing calls or messages. It is
one of the obstacles to the cold calling process for the
marketers who are promoting their products and
services through phone calls.
Nowadays the marketers face No Cold Calling Zone,
where the group of the residents get together and
declare it as No Cold Calling Zone. Once such zone has
been established, residents can feel confident to say
“NO” to cold callers and this will lead the reduction in
doorstep crime and burglary in the area. These are the
issues and challenges face by cold calling activities in stthe 21 century world. Due to these obstacles and
barriers the marketers are reducing the use of this
process day by day.
STRATEGIES TO MAKE COLD CALLING SUCCESSFUL
Cold calling or making field visits have gone beyond
just telemarketing. The cold calling process is one of
the costly mean of sales to any business organization.
So it is important to make each call (through phone or
visit) successful by using strategic calling script. Cold
calling does not give immediate result but in long term
it will definitely be fruitful to company if the sales
executive has approached customers properly and
effectively. Below are the several strategies to make
this successful;
1. MAKE THE FIRST IMPRESSION

ALLANA MANAGEMENT JOURNAL OF RESEARCH /JULY - DEC 2012 / PAGE NO. 049
'The first impression is the last impression'. The first
few words from a sales executive to customer can
make a good or bad impression. No matter customer
respond you positively or not but we should not cross
our limit patient. Getting the listener hooked is the
biggest challenges for the sales personnel.
2. AWARE ABOUT THE COMPETITORS
Cold calling is the process of meeting unknown
customer without prior appointment, so as a sales
executive we have to learn the features of products
and services which differentiate your products with
the competitors. Discuss the positive characters of the
products and services against the competitor's
products.
3. BE POLITE AND RESPECTFUL
Politeness always impresses the customer at initial
stages of sales process. Talk with the customers and do
icebreaking of customer with respectful words so that
we can create positivity about our products and
services in the mind of the customer. Start the
conversations with the customer with politeness and
end too with it.
4. AVOID PUSHY BEHAVIOR
No customer want to be forced into listening to sales
person. Despite doing so, always try to recognize the
need and want of the customers. After doing so find
the suitable product from the available product range
to meet the customer's requirement. Always listen the
customer first and then start acknowledging the
customer's requirement.
5. UPDATE THE PRODUCT KNOWLEDGE
Normally it leads the most rejection of call over phone
or on field visit. The sales personnel should possess full
in depth knowledge of the products and services which
he/ she is communicating with the customers. Having
product knowledge helps sales people to handle the
objections and respond to the questions from the
customers positively.
6. FOLLOW UP
If customer ask any question or raise any objection
towards the product and services then a sales person
should understand that prospect is interested in his/
her product. It is always not possible to convert the
prospect into client or customer in the first visit or
call. If the prospect want to think over and says call
back then call the customer back in time because
prospects respect you if you respect their time.
CONCLUSION
Every day is a new day for sales personnel. It is
important to meet the daily, weekly, or monthly sales
targets to survive the sales job. If a sales person
achieves his/ her monthly sales targets then he/ she
will be highly appreciated and awarded. But to
continue with the constant performance the sales
person has to generate new customers in his/ her
pipeline. The cold calling process is one of the tools of
lead generation for future prospects. Though it is
tough, costly and time consuming process but it will
compensate in long term. The company should train
their sales executives well in advance before
undertaking such activity. The sales people normally
dislike this activity and they hesitate to do so. Some
sales personnel believe that cold calling is like
bagging. To be a good salesman it is important to
handle such situations because it will make you
shameless and hesitation free. This research article is
prepared on various published articles and notes and
books on Cold Calling. From this research article it can
be concluded that the role of cold calling is important
for any business firm to increase its sales. Due to the
development of technology and advancement in
various marketing communication means, cold calling
is losing its popularity day by day.
REFERENCES
[1] Stephan Schiff man, (2007), Cold Calling Techniques: That Really
Work, 20th Anniversary Edition
[2] Wendy Weiss, (2000), Cold Calling for Women: Opening Doors &
Closing Sales, 1st Edition
[3] Frank J. Rumbauskas, Jr., Never Cold Call Again: Achieve Sales
Greatness without Cold Calling
[4] Paul S. Goldner, (2006), Red-Hot Cold Call Selling: Prospecting
Techniques That Really Pay Off, 2nd Edition
[5] Lee Boyan, (1983), Successful Cold Call Selling: Over 100 New

ALLANA MANAGEMENT JOURNAL OF RESEARCH /JULY - DEC 2012 / PAGE NO. 050
Ideas, Scripts, and Examples from nation's Foremost Sales Trainer,
2nd Edition
[6] Mari Anne Vanella, (2008), 42 Rules of Cold Calling Executives : A
Practical Guide for Telesales, 2nd Edition
[7] George R. Walther, (2005), Heat Up Your Cold Calls: How to Make
Prospects Listen, Respond, and Buy
[8] Jerry Hocutt, (2007), Cold Calling for Cowards, 1st Edition
[9] Art Sobczak, (2010), Smart Calling: 'Eliminate the Fear, Failure,
and Rejection from Cold Calling’
WEB RESOURCES
[1] http://www.businessballs.com/cold_calling.htm
[2] http://www.inc.com/guides/sales/20677.html
[3] http://sales.about.com/od/glossaryofsalesterms/g/What-Is-
Cold-Calling.htm
[4] http://en.wikipedia.org/wiki/Cold_calling
[5] http://www.salesopedia.com/index.php?option=com_
content&task=view&id=2370
[6] http://www.sammanfer.com/Articles/ Coldcalling.htm
[7] http://www.salesgravy.com/sales-articles/prospecting/is-cold-
calling-dead-new-cold-calling-rules-for-the-21st-century.html
[8] http://fearless-selling.ca/tag/cold-calling-12/
[9] http://smallbusinessindia.intuit.in/customer-service/effective-
cold-calling
ALLANA MANAGEMENT JOURNAL OF RESEARCH /JULY - DEC 2012 / PAGE NO. 051HUMAN
RESOURCES
MANAGEMENT
INTRODUCTION
An effective performance appraisal system (PAS) is the
cornerstone of any good organization. Performance
appraisal can be seen as a formal evaluation of an
employee's job related performance in order to determine the
degree to which the employee is performing his task effectively.
The objective of performance appraisal is dual: evaluative and
developmental. The evaluative purpose is concerned primarily
with looking back at how employees have actually performed
over given time period, compared with required standards of
performance. The developmental, future-oriented performance
appraisal is concerned, for e.g. with the identification of
employees' training and development needs and the setting of
new targets. (Indeed, yet another goal of performance
appraisals may ultimately be to increase performance at the
individual and, subsequently, the organizational level (DeNisi &
Gonzalez, 2000; Meyer, Kay, & French, 1965).
There are a lot of benefits of having an effective performance
appraisal system. For development at the individual level,
Performance Appraisal results provide employees with
performance feedback (Reid & Levy, 1997; Narcisse & Harcourt,
2008), help define their career development needs (Hempel,
2001; Nickols, 2007) and determine their career paths and
goals(Spinks, Wells, & Meche, 2004;Law & Tam, 2008).
Performance appraisal can help identify training requirements
particularly for new employees (Broady-Preston and Steel, 2002,
Seldon et al. (2001), PA strongly relates to training. (Cleveland et
al., 1989). So performance appraisal system forms an integral
“EMPLOYEE PERCEPTIONS OF
PERFORMANCE APPRAISAL WITH
RESPECT TO FAIRNESS AND UTILITY
IN SELECT MANUFACTURING
COMPANIES IN AND AROUND PUNE”
PROF. NETRA NEELAM
ASSISTANT PROFESSOR,
SYMBIOSIS CENTRE FOR
MANAGEMENT STUDIES, PUNE
DR. DEEPA TANKSALE
ASSISTANT PROFESSOR,
SYMBIOSIS CENTRE FOR
MANAGEMENT STUDIES, PUNE

ALLANA MANAGEMENT JOURNAL OF RESEARCH /JULY - DEC 2012 / PAGE NO. 052
part of human resource management functions (Dulebohn & Ferris, 1999).Thus rightly administered PA system has a
great utility for the individual employee as well as organization.
However the success of Performance Appraisal System (PAS) largely depends on the support and acceptance of the
system users (rater and ratee) (Cascio, 1982). As a result, a PAS will not be successful unless concerned people
perceive it as a fair and effective system (Ilgen, Fisher, & Taylor, 1979; Murphy & Cleveland, 1991). Quite often
superiors and the HR department may feel that the PA system is effective, but the people who are actually going to be
affected by the Performance appraisal system think so is an important question of inquiry.
The perceptions of rate regarding the appraisal process are an important variable determining the success and
effectiveness of any appraisal system. It is now a widely accepted fact that perceptions of effectiveness and fairness
influence the way people think, feel, and act on the job (Bies and Shapiro 1987). Bretz, Milkovich and Read (1992)
have also indicated that perceived fairness of the appraisal system has emerged as the most important issue to be
faced by managers. Hence, perception of the performance appraisal system would influence performance appraisal
satisfaction which is further linked to job satisfaction, job involvement, citizenship behavior, organizational
commitment (Adams 1963; McFarlin and Sweeney 1992; Moorman, Niehoff and Organ 1993). Procedures used to
appraise performance, and the manner in which performance-related information is communicated play an integral
role in shaping employees' satisfaction with appraisal process (Keeping and Levy 2000; Jawahar 2007). Thus
perception of employees of PA system is vital variable for studying the effectiveness of PA in an organization.
The present paper which is a part of a larger study on effectiveness of performance appraisal system focuses on
employee perceptions of performance appraisal with respect to fairness and utility in select Manufacturing
Companies in and around Pune.
METHODOLOGY USED
A study was conducted of 100 employees at the middle level management of manufacturing industries working in
capacities of managers, assistant managers, deputy managers and officers. A questionnaire was designed and
responses were collected from superiors and subordinates on effectiveness of performance appraisal in select
manufacturing companies. The present paper focuses on their perceived fairness of performance appraisal system
in the organization. 15 items in the questionnaire measured perceptions of employees regarding performance
appraisal defined in terms of fairness, clarity, two way communication, trust, and utility. The questionnaire was
based on Likert five point scaling technique. Responses of 100 managers at middle and senior level across various
departments in 5 different manufacturing industries were collected. All these companies had a turnover of more
than 10 crore. The data was collected with the help of stratified random sampling method.
FOLLOWING WERE THE PARAMETERWISE QUESTIONS WHICH WERE A PART OF THE QUESTIONNAIRE
CRITERIA/PARAMETERS
STATEMENTS ASKED AS QUESTIONS IN THE QUESTIONNAIRE
A. Fairness The performance appraisal system is effectively designed andhighlights performance
Efforts are made by the boss to be objective in their appraisals Fair treatment received in last performance review The appraisal system has scope for correcting the biases of the reporting officer through a review process
B. Clarity The objective of the appraisal system is clarified The appraisal system in the organization provides an opportunity to have a clear understanding of what is expected by the reporting officer during the performance year

ALLANA MANAGEMENT JOURNAL OF RESEARCH /JULY - DEC 2012 / PAGE NO. 053
Secondary data were collected from different publications, reports, web sites, magazines, journals, working papers,
books and newspapers.
RESULTS AND DISCUSSION
An item wise analysis was done for each respondent and percentage of employees falling into each category of
response format (Completely true to Totally false) was calculated.
TABLE 1.1: EMPLOYEE PERCEPTIONS OF PERFORMANCE APPRAISAL SYSTEM REGARDING FAIRNESS
CRITERIA/PARAMETERS
STATEMENTS ASKED AS QUESTIONS IN THE QUESTIONNAIRE
C. Trust The appraisal system in organization helps at strengthening
appraiser-appraisee relationship through mutual co -operation and trust Performance appraisal system develops a negative perception in the minds of employees thereby creating a feeling of insecurity
D. Two way communication
The appraisal system encourages open communication between boss and subordinate through per formance review and discussion The appraisal system provides an opportunity for a discussionbetween superior and subordinates on the expectations, achievements, failures, constraints and improvements required The appraisal system provides an opportunity to express requirements for career growth
D. Utility Performance appraisal system in your organization aims at systematic talent management process The HR department follows up seriously the training needs identified during appraisals The appraisal data are used by the HR department for other development decisions like job-rotation, job enrichment etc Superior performers are given special rewards
FAIRNESS PERCENTAGE OF EMPLOYEES
Completely True
Mostly True (75%)
Somewhat True (50%)
Slightly True (25%)
Totally False
Total Employees
The performance appraisal system is effectively designed and highlights performance
37
25
22
11
5
100
Efforts are made by the boss to be objective in their appraisals
44
33
15
5
3
100
Fair treatment received in last performance review
42 25 14 13 6 100
The appraisal system has scope for correcting the biases of the reporting officer through a review process
33
26
25
4
12
100
150 109 76 33 26
Score 600 327 =927 152 33 0
Source: Primary Data of Authors Study
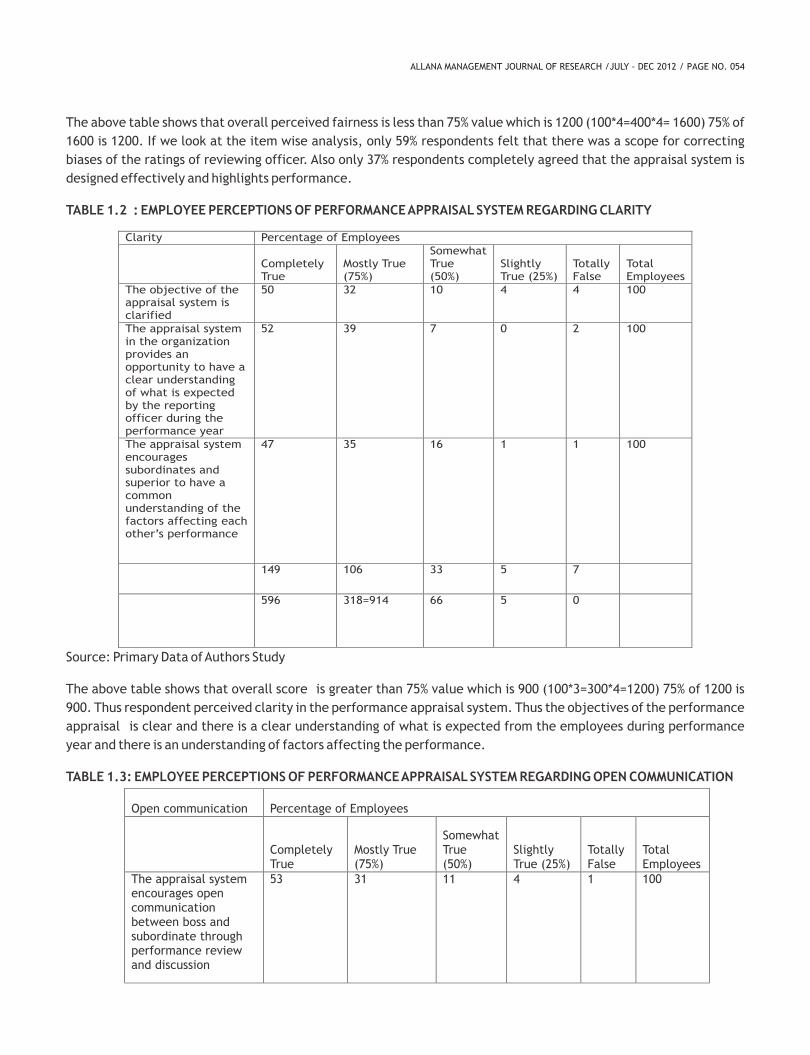
Open communication
Percentage of Employees
Completely True
Mostly True (75%)
Somewhat True (50%)
Slightly True (25%)
Totally False
Total Employees
The appraisal system encourages open communication between boss and subordinate through performance review and discussion
53 31 11 4 1 100
Clarity Percentage of Employees
Completely True
Mostly True (75%)
Somewhat True (50%)
Slightly True (25%)
Totally False
Total Employees
The objective of the
appraisal system is clarified
50
32
10
4
4
100
The appraisal system in the organization provides an opportunity to have a clear understanding of what is expected by the reporting officer during the performance year
52
39
7
0
2
100
The appraisal system encourages subordinates and superior to have a common understanding of the factors affecting
each other’s performance
47 35 16 1 1 100
149
106
33
5
7
596
318=914
66
5
0
ALLANA MANAGEMENT JOURNAL OF RESEARCH /JULY - DEC 2012 / PAGE NO. 054
The above table shows that overall perceived fairness is less than 75% value which is 1200 (100*4=400*4= 1600) 75% of
1600 is 1200. If we look at the item wise analysis, only 59% respondents felt that there was a scope for correcting
biases of the ratings of reviewing officer. Also only 37% respondents completely agreed that the appraisal system is
designed effectively and highlights performance.
TABLE 1.2 : EMPLOYEE PERCEPTIONS OF PERFORMANCE APPRAISAL SYSTEM REGARDING CLARITY
Source: Primary Data of Authors Study
The above table shows that overall score is greater than 75% value which is 900 (100*3=300*4=1200) 75% of 1200 is
900. Thus respondent perceived clarity in the performance appraisal system. Thus the objectives of the performance
appraisal is clear and there is a clear understanding of what is expected from the employees during performance
year and there is an understanding of factors affecting the performance.
TABLE 1.3: EMPLOYEE PERCEPTIONS OF PERFORMANCE APPRAISAL SYSTEM REGARDING OPEN COMMUNICATION

Trust Percentage of Employees
Completely
True
Mostly True
(75%)
Somewhat
True
(50%)
Slightly
True
(25%)
Totally
False
Total
Employees
The appraisal system
in organization helps
at strengthening
appraiser-appraisee
relationship through
mutual co-operation
and trust
43
29
17
5
6
100
Performance
appraisal system
does not develops a
negative perception
in the minds of
employees thereby
creating a feeling of
insecurity*
42
16
15
16
11
100
85*4=340 45*3=135 32*2=64 21*1=21 17*0=0
ALLANA MANAGEMENT JOURNAL OF RESEARCH /JULY - DEC 2012 / PAGE NO. 055
The above table shows that overall score of 872 is slightly less than 75% value which is 900 (100*3=300*4=1200) 75% of
1200 is 900. Nearly 84% of the respondents agreed that appraisal system encourages an open communication
between the boss and the subordinates through performance review. Only 41% completely agreed that the system
provides an opportunity to express their career needs, where as 32% felt that it was mostly true.
TABLE 1.4 : EMPLOYEE PERCEPTIONS OF PERFORMANCE APPRAISAL SYSTEM REGARDING TRUST
Open communication Percentage of Employees
Completely True
Mostly True (75%)
Somewhat True (50%)
Slightly True (25%)
Totally False
Total Employees
The appraisal system provides an opportunity for a discussion between superior and subordinates on the expectations, achievements, failures, constraints and improvements required
55 29 12 0 4 100
The appraisal system provides an opportunity to express requirements for career growth
41 32 16 5 6 100
149*4=596 92*3=276 39*2=78 9*1=9 11*0=0
Source: Primary Data of Authors Study

ALLANA MANAGEMENT JOURNAL OF RESEARCH /JULY - DEC 2012 / PAGE NO. 056
The above table shows that overall score of 475 is less than 75% value which is 600 (100*2=200*4=800) 75% of 800 is
600. Only 58% of the employees believe that appraisal system does not develop negative perception and feeling of
insecurity, though they feel that appraisal system in organization helps at strengthening appraiser-appraisee
relationship through mutual co-operation and trust.
TABLE 1.5: EMPLOYEE PERCEPTIONS OF PERFORMANCE APPRAISAL SYSTEM REGARDING UTILITY
The above table shows that overall score of 646 is very less than 75% value which is 1600 (100*4=400*4=1600) 75% of
1600 is 1200. Thus employees perceive poor utility of performance appraisal data for employee development or HR
related decisions. Only 145 employees completely believed that the data was used for job rotation and job
enrichment. A total of only 36% believed that HR department took up the training needs identified through
appraisals. However 44% were in complete agreement that superior performers did receive special rewards. Only
25% completely agreed that performance appraisal aims at talent management. Thus the utility aspect of PA system
is something that organizations need to look at. Thus the performance appraisal system should not be just a routine
annual procedure. The result again is line with earlier findings with regards to Asian organizations in which the use of
PA is already limited (Cheng & Cascio, 2004).
Utility Percentage of Employees
Completely
True
Mostly True
(75%)
Somewhat
True (50%)
Slightly
True
(25%)
Totally
False
Total
Employees
Performance
appraisal system in
your organization
aims at systematic
talent management
process
25
27
30
14
4
100
The HR department
follows up seriously
the training needs
identified during
appraisals
20
16
34
14
16
100
The appraisal data
are used by the HR
department for other
development
decisions like job-
rotation, job
enrichment etc
14 16 29 15 26 100
Superior performers
are given special
rewards
44
19
17
11
9
100
103*4=412 78*3=234 110*2=220 54 55
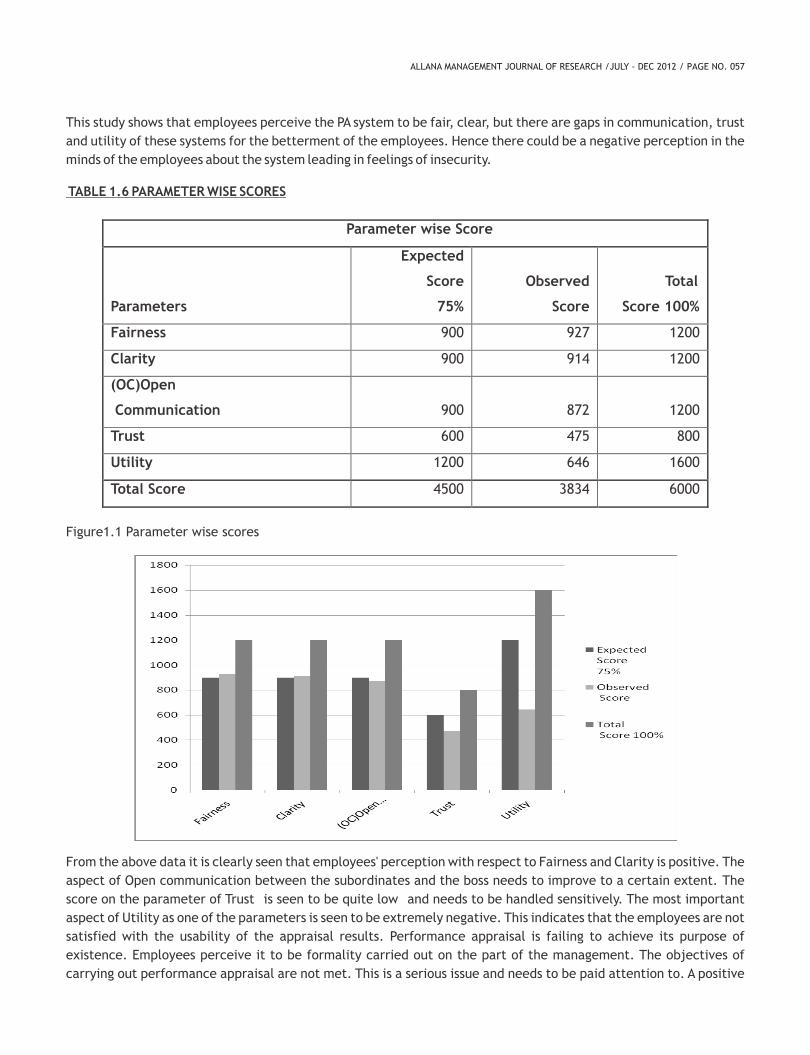
Parameter wise Score
Parameters
Expected
Score
75%
Observed
Score
Total
Score 100%
Fairness 900 927 1200
Clarity 900 914 1200
(OC)Open
Communication 900 872 1200
Trust 600 475 800
Utility 1200 646 1600
Total Score 4500 3834 6000
ALLANA MANAGEMENT JOURNAL OF RESEARCH /JULY - DEC 2012 / PAGE NO. 057
This study shows that employees perceive the PA system to be fair, clear, but there are gaps in communication, trust
and utility of these systems for the betterment of the employees. Hence there could be a negative perception in the
minds of the employees about the system leading in feelings of insecurity.
TABLE 1.6 PARAMETER WISE SCORES
From the above data it is clearly seen that employees' perception with respect to Fairness and Clarity is positive. The
aspect of Open communication between the subordinates and the boss needs to improve to a certain extent. The
score on the parameter of Trust is seen to be quite low and needs to be handled sensitively. The most important
aspect of Utility as one of the parameters is seen to be extremely negative. This indicates that the employees are not
satisfied with the usability of the appraisal results. Performance appraisal is failing to achieve its purpose of
existence. Employees perceive it to be formality carried out on the part of the management. The objectives of
carrying out performance appraisal are not met. This is a serious issue and needs to be paid attention to. A positive
Figure1.1 Parameter wise scores

Overall Score on all parameters
Overall
Parameters
Expected
Score
75%
Observed
Score
Total
Score 100%
Total Score 4500 3834 6000
ALLANA MANAGEMENT JOURNAL OF RESEARCH /JULY - DEC 2012 / PAGE NO. 058
score towards the parameters of fairness and clarity serves very little value when the score of Trust and Utility show
a negative response.
TABLE 1.7 TOTAL SCORE ON OVERALL PARAMETERS
Figure 1.2 Comparison of overall Observed score and Expected total score
The above data clearly shows the perception of the employees with respect to performance appraisal. The observed
score is way below the expected score. Employees' perception of performance appraisal is not very favorable.
This indicates that the companies should pay due attention to this important function of management and achieve
the purpose for the existence of performance appraisal. Companies should not consider it as a formality which or a
tick mark activity which needs to be completed every year.
SUMMARY AND CONCLUSIONS
This paper examined the opinion of managers or their perceptions about performance appraisals in some select
manufacturing industries. It leads to understanding their perception- negative or positive towards the parameters of
fairness, clarity, open communication, trust and utility of performance appraisal systems in the industries.
On the basis of the above study, one can conclude that employees have a positive perception of performance
appraisal with respect to fairness and clarity but their needs to be improvement in the communication between the
boss and the subordinates.
With respect to the parameter of trust, he score is observed to be distinguishably less than expected. This indicates
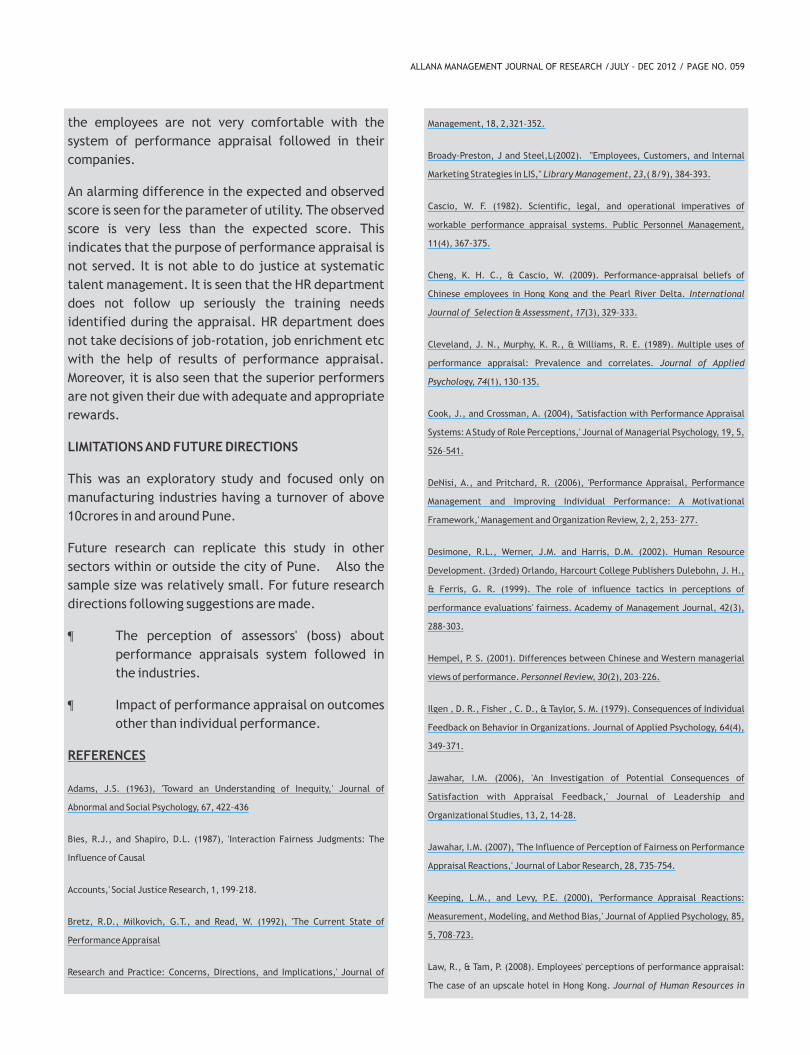
ALLANA MANAGEMENT JOURNAL OF RESEARCH /JULY - DEC 2012 / PAGE NO. 059
the employees are not very comfortable with the
system of performance appraisal followed in their
companies.
An alarming difference in the expected and observed
score is seen for the parameter of utility. The observed
score is very less than the expected score. This
indicates that the purpose of performance appraisal is
not served. It is not able to do justice at systematic
talent management. It is seen that the HR department
does not follow up seriously the training needs
identified during the appraisal. HR department does
not take decisions of job-rotation, job enrichment etc
with the help of results of performance appraisal.
Moreover, it is also seen that the superior performers
are not given their due with adequate and appropriate
rewards.
LIMITATIONS AND FUTURE DIRECTIONS
This was an exploratory study and focused only on
manufacturing industries having a turnover of above
10crores in and around Pune.
Future research can replicate this study in other
sectors within or outside the city of Pune. Also the
sample size was relatively small. For future research
directions following suggestions are made.
The perception of assessors' (boss) about
performance appraisals system followed in
the industries.
Impact of performance appraisal on outcomes
other than individual performance.
REFERENCES
Adams, J.S. (1963), 'Toward an Understanding of Inequity,' Journal of
Abnormal and Social Psychology, 67, 422–436
Bies, R.J., and Shapiro, D.L. (1987), 'Interaction Fairness Judgments: The
Influence of Causal
Accounts,' Social Justice Research, 1, 199–218.
Bretz, R.D., Milkovich, G.T., and Read, W. (1992), 'The Current State of
Performance Appraisal
Research and Practice: Concerns, Directions, and Implications,' Journal of
Management, 18, 2,321–352.
Broady-Preston, J and Steel,L(2002). "Employees, Customers, and Internal
Marketing Strategies in LIS," Library Management, 23,( 8/9), 384-393.
Cascio, W. F. (1982). Scientific, legal, and operational imperatives of
workable performance appraisal systems. Public Personnel Management,
11(4), 367-375.
Cheng, K. H. C., & Cascio, W. (2009). Performance-appraisal beliefs of
Chinese employees in Hong Kong and the Pearl River Delta. International
Journal of Selection & Assessment, 17(3), 329–333.
Cleveland, J. N., Murphy, K. R., & Williams, R. E. (1989). Multiple uses of
performance appraisal: Prevalence and correlates. Journal of Applied
Psychology, 74(1), 130–135.
Cook, J., and Crossman, A. (2004), 'Satisfaction with Performance Appraisal
Systems: A Study of Role Perceptions,' Journal of Managerial Psychology, 19, 5,
526–541.
DeNisi, A., and Pritchard, R. (2006), 'Performance Appraisal, Performance
Management and Improving Individual Performance: A Motivational
Framework,' Management and Organization Review, 2, 2, 253– 277.
Desimone, R.L., Werner, J.M. and Harris, D.M. (2002). Human Resource
Development. (3rded) Orlando, Harcourt College Publishers Dulebohn, J. H.,
& Ferris, G. R. (1999). The role of influence tactics in perceptions of
performance evaluations' fairness. Academy of Management Journal, 42(3),
288-303.
Hempel, P. S. (2001). Differences between Chinese and Western managerial
views of performance. Personnel Review, 30(2), 203–226.
Ilgen , D. R., Fisher , C. D., & Taylor, S. M. (1979). Consequences of Individual
Feedback on Behavior in Organizations. Journal of Applied Psychology, 64(4),
349-371.
Jawahar, I.M. (2006), 'An Investigation of Potential Consequences of
Satisfaction with Appraisal Feedback,' Journal of Leadership and
Organizational Studies, 13, 2, 14–28.
Jawahar, I.M. (2007), 'The Influence of Perception of Fairness on Performance
Appraisal Reactions,' Journal of Labor Research, 28, 735–754.
Keeping, L.M., and Levy, P.E. (2000), 'Performance Appraisal Reactions:
Measurement, Modeling, and Method Bias,' Journal of Applied Psychology, 85,
5, 708–723.
Law, R., & Tam, P. (2008). Employees' perceptions of performance appraisal:
The case of an upscale hotel in Hong Kong. Journal of Human Resources in

ALLANA MANAGEMENT JOURNAL OF RESEARCH /JULY - DEC 2012 / PAGE NO. 060
Hospitality & Tourism, 7(1), 25–43.
McFarlin, D.B., and Sweeney, P.D. (1992), 'Distributive and Procedural Justice
as Predictors of Satisfaction with Personal and Organizational Outcomes,'
Academy of Management Journal, 35, 3, 626 637.
Moorman, R.H., Niehoff, B.P., and Organ, D.W. (1993), 'Treating Employees
Fairly and Organizational Citizenship Behaviour: Sorting the Effects of Job
Satisfaction, Organizational Commitment and Procedural Justice,' Employee
Responsibilities and Rights Journal, 6, 3, 209–225.
Motadu Netra, (2008). An analysis of the Performance Appraisal System in
Selected Manufacturing Companies in Pune. M.Phil Research. University of
Pune.
Murphy, K.R., and Cleveland, J.N. (1991), Performance Appraisal. An
Organizational Perspective, Needham Heights, MA: Allyn and Bacon.
Narcisse, S., & Harcourt, M. (2008). Employee fairness perceptions of
performance appraisal: A Saint Lucian case study. The International Journal
of Human Resource Management, 19(6), 1152–1169.
Nickols, F. (2007). Performance appraisal: Weighed and found wanting in the
balance. Journal for Quality & Participation, 30(1), 13–16.
Raymond A Noe (1986). In Trainees' Attributes and Attitudes: Neglected
Influences on Training Effectiveness, The Academy of Management Review,
Vol. 11, No. 4: 736-749.
Reid, P., & Levy, G. (1997). Subordinate appraisal of managers: A useful tool
for the NHS ? Health Manpower Management, 23(2), 68–72.
Taylor, M. S., Tracy, K. B., Renard, M. K., Harrison, J. K., & Carroll, S. J.
(1995). Due process in performance appraisal: A quasi-experiment in
procedural justice. Administrative Science Quarterly, 40(3), 495-523.

ALLANA MANAGEMENT JOURNAL OF RESEARCH /JULY - DEC 2012 / PAGE NO. 061HUMAN
RESOURCES
MANAGEMENT
INTRODUCTION
great nation is built by institution with great cultural
Asupport. An institution is built by the society that cares
for values, ideologies and principles. The very fabric of
social development is rightly governed by a large numbers of
institutions that work in an integrated manner with a common
cause. Such institutions work long and work for a cause. Building
of such institutions is not the task as simple as it appears.
Institutions are not built by mere resources. A good institution is
inseparable. They are synonymous for each other. A good
institution is built by a good leader. The presumption about
leadership is explained in a very simple manner as follows.
“Good leaders build good institution, outstanding leaders
develops institutes that last long.' A true test of leadership is not
achieving instant and short term success but in providing a long
term vision that nurtures the course and direction of institution
growth. Visionary leaders set the direction which the institution
follows to achieve its targets and earn success in long term.
What is the true role of leadership in nurturing and building
institution is an important issue that needs to be discussed. The
present paper deals with the role of leadership in the exercise of
institution building in a competitive socio-economic scenario.
OBJECTIVES OF THE PAPER
The present paper discuss following important related with role
of leadership in institution building. Hence the principal
objectives of the paper are :
“LEADERSHIP FOR
INSTITUTION BUILDING”
DR. SANJAY KAPTAN,
HEAD, DEPARTMENT OF
COMMERCE AND RESEARCH
CENTRE, UNIVERSITY OF PUNE

ALLANA MANAGEMENT JOURNAL OF RESEARCH /JULY - DEC 2012 / PAGE NO. 062
(I) What is the true role of leader in cultivating
and nurturing institution building ?
(ii) To assess the manner in which a leader can
participate in the process of institution
building
(iii) To identify the challenges that a leader faces
in institution building
(iv) To understand why a leader should set a vision
in action to build an institution.
PREMISES OF THE PAPER
The concept of leadership is often equated in a
particular period. The function of leader is often
equated with prompted successes and quick gains
which may not be the right way to assess the
performance of a leader. Every leader need not offer
prompt and short term gains but every leader is
responsible for setting a vision for the institution,
which leads results in long term. From this point of
view, the leader has different functions to perform.
Conventionally, these functions may appear invisible
but they are very important and crucial for institution
in long term. The author has considered following
three premises for development of writing this paper.
(I) The true test of leadership cannot be equated
with performance alone, but it is related with
setting directions and envisioning the
appropriate future course of action.
(ii) In long term a leader is not remember for the
task he has performed but for the vision and
direction given to the institution.
(iii) Leadership is the principal factor for
institution building which cannot be replaced
by constituent.
DISCUSSION
(1) LEADERSHIP IS SETTING VISION
If one goes through the history of successful business
institution, he comes across a series of examples of
growth, fall, decline and rebirth of many business
organizations. Successful Corporation are no
exceptions to this rule. It is not the case that these
corporations have not witnessed critical situations
and crisis period. The real reason of success of these
organizations is associated with their capacity to
overcome these crises. These institutions have
visualized the critical situations, obstacles and
problems and have overcome these problems. This
inherent strength is provided to these institutions by
invisible but strong force popularly called
“Leadership”. Leadership is the potential, strength
and force that change the destiny of institution.
Leadership is the way; the institutes assess the likely
threats and help the organization to overcome it.
The large numbers of examples of institutional decay,
decline and death have disclosed the fact that the
failure of the institution was more human and due to
manmade and internal factors than any other reason.
After every decade, the leadership of one institute is
challenged by the other. This is not a mere material
change but a change that occurs in institutional
hierarchy and position due to the change in
leadership. With change in leadership, many things
change automatically. The principal change that
occurs is change in approach and thinking of the
institution. From this point of view, the real task of the
leader is to set vision and promote the growth
philosophy.
(2) PRINCIPAL TASK OF A LEADER IS
PARTICIPATION IN INSTITUTION BUILDING
The visible mortal structure is a brick structure. This
structure often appears impressive and creates a
feeling of greatness. However, behind this strong
physical structure, there is a strong invisible and
intangible force responsible for development of this
structure which is rightly called as 'Leadership'. The
principal task of leadership is not to assure success in
every endeavor. It is related with developing vision
that works for a mission which asures image and
identity. Leaders build values, design path and provide
directions which builds institutions. He provides a
right approach to think and set examples of facing
crisis which cultivates the spirit of an institution.
Hence, it is appropriate to say that leadership builds
institutions.

ALLANA MANAGEMENT JOURNAL OF RESEARCH /JULY - DEC 2012 / PAGE NO. 063
(3) INSTITUTION BUILDING IS AN UPHILL TASK
Institutions are not built in a day or two. Most of the
organizations are built by a lifetime contribution of a
leader. It is the devotion, dedication coupled with the
efforts and selfless commitment that helps the
institutions to grow, where in, many cases, a small foul
play on the part of leader destroys the long cherished
institutional structure. The string institutions have
strong ethical values. Often, many institutions appear
growing fast in a short period but there fall is also
equally fast and sharp. This happens due to leadership
failure. Hence, the real motive force behind
institution building is leadership.
(4) SETTING VISION : THE CRUX OF TRUE
LEADERSHIP
Many leaders are not attributed with success. There
are no remarkable achievements to their credit.
However, they are great leaders in true sense. Their
leadership is recognized and known not for their deeds
they have performed but for the dreams they have
seen. A great leader sets a great idea. The idea, whose
time has come, makes all the difference.
CONCLUSION
The above discussion helps to conclude that
leadership is the force that is responsible for
organizational development. It is the leader who sets
developmental processes. He is the key factor for
instructional growth. Hence, it will be appropriate to
say that the true purpose of leadership is institution
building without having good leaders; institutions
cannot attain their set long term targets. A leader
visualizes the future of the institutions and comes out
with an appropriate action plan to overcome odds and
ordeals. Therefore, institutions are also known by
outstanding leaders. Without leadership, it is
impossible to imagine the process of institution
building coming to a reality.

ALLANA MANAGEMENT JOURNAL OF RESEARCH /JULY - DEC 2012 / PAGE NO. 064HUMAN
RESOURCES
MANAGEMENT
In a neck cutting competitive era; the demand for skillful and
devoted employees has risen to great height. Management is
emphatically emphasizing on employee engagement, top
talent retention strategy, leadership practices, key performance
index, training for behavioral change- skill and capacity building
in the culture – functional competence. Along with it, the values
of the organization such as integrity, understanding, excellence,
unity, responsibility, creating a culture to get aspired- action
oriented – achiever.
As trainees are main focus; so is the case of trainers also.
It is not what we say; it is what we radiate. The approachability is
a function of rapport, response, role and knowledge. Coupled
with it; there must be a massive change and that too positive; in
feeling, association, experience, visualization and imagination.
To penetrate to this aspect we can say:: connection comes
before content. Choosing the right content as well as role of the
step, choosing the right sequence, knot, linking the flowers
tight, making the thread visible and making it serve the
participants' goal…..are important.
The participants the training program [ trainees] can very well
be categorized in different groups such as :: excited, enthused,
interactive, curious, skeptical and so on. As a result there is a
need for engaging all the five senses. Define the audience,
describe objectives, classify concern, freeze the content.
Handle the process, assess the outcome and prepare spreading.
New HR requires members to have a common set of values,
transparency and healthy debate around the values. It requires
“TRAINING AND DEVELOPMENT”
PROF. S.D. BAGADE
ASST. PROFESSOR,
AIMS, PUNE

ALLANA MANAGEMENT JOURNAL OF RESEARCH /JULY - DEC 2012 / PAGE NO. 065
continued and shared reflections around the systems
current processes. The manager in this set up requires
a strong command on a variety of communication
channels, a tremendous reserve of patience and the
ability to focus on outcome rather than output
Unquestionably the stress will be on innovation and
learning rather than on methods. We have to modify
the spotlight; center of attention from managing
talent to creating values.
Another hot topic is leadership. Leadership is never
easy. But it is increasingly tough now. The global
financial system is basically paralyzed. The recession
was the worst that we have witnessed. Trust in
institutions and people who escort and pilot them is all
time low .There is a necessity to hire, induct, train,
mould the best possible people to labor for you even
they fought with you for their jobs. Surround yourself
with a team of people who can challenge your thinking
and whose strength makes up for your deficit. Share
credit with your closest colleagues so that they are
fully committed to your mission. Be sure to
communicate often and authentically with your
people. If you are leading the organization; through
the downturn you are undoubtedly introducing major
changes and inevitably encountering resistance to
them. We sacrifice today for the better tomorrow.
Where we can become better? Teaching is a sticky
role. In fact we are transferring the obsession. To think
does not need other senses. We have to set right mind
set because problems are because of mind- set. For
the exemplary contribution; inspiration is essential.
The more higher you go; the more higher challenges
you have. That is why have more connect with the
subject and also with the people. For the development
and growth; there must be competency enhancement.
Self evaluation, participation in seminars, learning
does help in this program. The training and
development strategy should be three pronged. Viz.
strategic, tactical and operational.
When we talk about tactical; it covers two factors
namely; agility and ability to balance risk in a rapidly
changing environment. Given the mixed age groups;;
organizations are working with; handling generation is
to be taught. New HR requires members to have a
common set of values, transparency and healthy
debate on values. It requires continued and shared
reflections around the systems current processes. We
have to transform HR as a whole before HR can
transform the business. This means becoming
proactive function that understands the business,
management, direction of the future. The objective
over here is to increase the capabilities, to improve
the competition. This requires the talent to be
learning, open to new ideas, creating the behavior and
insight needed to add value to business. Outlook is
everything. The importance of maintaining a positive
attitude and of taking responsibility for once action
needs to be imbibed. Do not look back in regret. Move
on and try the next thing. The basic skill is absolutely
essential for success. Training should not be an
incubator of business talent. It is a place for
enthusiastic young people with great ideas to learn
and acquire practical business skill.
TRAINING AND DEVELOPMENTAL PROGRAM HAS GOT
MULTIPLE BENEFITS
A] Reduction in wastage and spoilage.
B] Improvement in method of work.
C] Reduction in machine breakages.
D] Reduction in supervision burden.
E] Reduction in maintenance cost.
F] Reduction in accident rate.
G] Improvement in quality of product.
H] Improvement in production rate.
I] Improvement in morale of the employees.
J] Reduction in grievances.
K] Improvement in efficiency and production.
L] Reduction in manpower obsolescence.
M] Enabling the organization to provide
increased financial incentives, opportunities
for internal promotions, raising of pay rates.
N] Personal growth.

ALLANA MANAGEMENT JOURNAL OF RESEARCH /JULY - DEC 2012 / PAGE NO. 066
O] Wider awareness among participants enlarged
skills.
THERE ARE SEVERAL METHODS OF DETERMINING THE
TRAINING NEEDS. THE TOTAL NEED CAN BE
DETERMINED BY ANALYZING :
Job requirement
Employees present skills.
Training needs.
THIS CAN BE DONE BY FOLLOWING WAYS
A] Analysis of an activity.
B] Analysis of a problem.
C] Analysis of an organization.
D] Appraisal of performance.
E] Analysis of behavior.
F] Brainstorming
G] Buzzing.
H] Card sorting.
I] Committee.
J] Comparison.
K] Confidence.
M] Consultant.
N] Counseling.
O] Incident pattern.
P] Informal tasks.
Q] Interviews
R] Observation.
S] Problem clinic.
T] Research.
U] Role playing.
V] Self analysis.
W] Skill Inventory.
X] Slip Writing.
Y] Studies
Z] Tests.
AA] Task Force.
BB] Questionnaire.
CC] Work shops.
THE OBJECTIVES OF TRAINING CAN BE STATED AS
BELOW
A] Induction Program [ To prepare for the
employees for the job meant for them while in
first appointment on training or on promotion
and impart to them required skill.]
B] To raise efficiency.
C] Succession planning.
D] Retirement planning.
Training is instrumental in treating the people who
have highest potential. When resources are
constrained; companies place attention in developing
and training the people to push and lead the
organization towards future. This is a guide for smart,
competent, hardworking, trustworthy employees who
are progressing through their careers with some
degree of satisfaction but are still wondering how to
get where they really want to go. Teaching, training,
coaching or mentoring assist to unearth : drive to
excel, catalytic learning capability, enterprising
spirit, dynamic sensors.
Those; who are highly motivated, devoted and always
succeed. in combating the stimulating situation. .
These people should hug and cuddle their respective
organizational culture and values. They are required
to radiate ;display self-assurance as well as self-
belief and have to gain knowledge of to gain the
admiration/ high opinion of others. This alteration;
revolution is possible only when the novice is having

ALLANA MANAGEMENT JOURNAL OF RESEARCH /JULY - DEC 2012 / PAGE NO. 067
the zeal and zest for making the self growth and
advancement. And they have the right path shown by
the teacher, coach, trainer and mentor. The job of a
trainer is like walking on a tight rope.
A couple of day before; I read a story of Eklavya. He
learnt archery by himself. He was perceived that he
would become the greatest archer. His so called
mentor Drona demanded his right hand thumb. The
message which he signaled is the art of 'how to learn'
with a tenacity; to ceaselessly scrutinize and pay
particular attention only to ultimate aim. Learning;
how to learn is in fact the essence of education. It
facilitates the growth of an incumbent ; his ability to
learn. It focuses on his commitment and capability to
realize the transformation dream. Inspiration to
idealism.
There are some trainers like this. Most often the best
work of these good people remains within the narrow
bounds of their area of work. The reasons attributing
to the same may be many. Syncretism, long sustained
period of their work, their performing alike a school
teacher, not limiting themselves to their problems on
hand, or a combination of all these.
We have diversified cultures. Organizations are big
and becoming still bigger. The new technique of
performance appraisal is 720 degree performance
appraisal. So the trainer has to build a humane and
equitable society and a good humankind.
If we want to define the people factor in the
achievement of the success in the business: it is to
assembling the great management teams that is
united by strong motivation, determination and
bravery is of immense value. The members must have
a vision, passion, and a real sense of ownership. The
leaders must have an ability to listen carefully.
Leaders must have the capability of taking tough
decisions they must possess the passion and capacity
to inspire the subordinates. When things go wrong; a
friendly and a proactive team can often win people
around averting a challenging situation. Always look
for the best in your people. Lavish praise. Never
criticize. People must find a real sense of warmth and
affection. Rather than focusing on mistakes; catch
the people doing right things every day. The leader has
to foster the culture of employee development. There
are crucial times; even in the life cycle of an
organization. Your knowledge of the people factor;
may make or break the organization. Hence
transforming the people as best in people
management is vital, essential, desirable. Trainer has
a vital role to play in this area.
Learning is an inseparable part of every human being
The expression 'learning' is having a close relation with
the concept of human capital. The transformation in
the attitude, development in the skill, enrichment of
knowledge and alertness in applying appropriately
with wisdom is the result of delivering the right kind of
training, level of assimilating by the trainees and
thereafter using the knowledge in real life situation
delivers the positive results. In other words up
gradation of value / worth of human capital
correspond to the quality of training imparted and
passion to learn as well as learn ability of the
concerned and his /her proficiency to exercise in
genuine factual situation tactfully. The outlay on
training and development is an investment in human
resource. Donald Kirkpatric Emeritis Professor
University of Wisconsin North America, designed a
highly influential model for training appraisal. It
constitutes four phases. Those are: Response or
Rejoinder [what they thought and felt about training],
Learning [ the consequential enhancement in data
comprehension and /or capability. Behavior [ scope
and level of behavioral (conduct) and potential
/aptitude step up and accomplishment. Results [ the
change or changed state occurring as a direct result of
action ; on the business / environment / performance.
In fact; the present circumstances warrant that
employees must be involved, committed and
contributive to the organizational target. By and
large; human capital represents the invrestment;
people make in themselves; that enhance their
economic productivity. Donald Kirkpatrick created a
model for training evaluation. It encircles four stages
of learning evaluation. Those are : 1] REACTION :
[what they thought and felt about the training]. 2]
LEARNING ; [ the resulting enhancement in knowledge
and capability. 3] BEHAVIOUR ;; [extent of behavior
and capability improvement and implementation /
application. 4] RESULTS ; [ the effect on the business /

ALLANA MANAGEMENT JOURNAL OF RESEARCH /JULY - DEC 2012 / PAGE NO. 068
environment resulting from the trainees
performance. After globalization ; there is a
spectacular change in organizational development
process in terms of training need, strategies, methods
and investment in training. KIRKPATRICKS's guidelines
and discussions on each of evaluation of training are
worth noticing.
In practice the various aspects related with the
training program are : course duration, course
content, library facilities, teaching aids, trainer, infra
structural facilities, relevance of training program,
handling of individual employees program, quality of
manager.
In my personal opinion; more emphasis is needed on
attitude changing and emotional intelligence. This is
only because; we are desiring people to contribute in a
multi cultural environment where the need is of multi
tasking and multi skilling. Emotional Intelligence is
the ability to identify and understand one's own
emotional reactions and those of others. It also
encircles the ability to regulate one's emotions and to
use them to make right as well as good decisions &
and effectively , efficiently. Emotional intelligence
provides many competencies which are critical while
performing the task at the work place.
Stress has been an inseparable, indispensable concern
in every activity. The transactional perspective of
stress makes an influential impact on the role of
cognitive appraisal and coping responses.
Undoubtedly stress has its origin on perception, your
inner strength, and determination to combat the
causes of commotion. The demographic variables such
as age, gender, education, type of family, religion, are
some of the factors which determine the intensity of
stress. Stress is an unavoidable characteristic of life
and work. Occupational stress describes physical,
mental, emotional wear and tear brought about by the
incongruence between the requirement of job and the
capabilities, resources, needs of employees to cope
up with job demands. The stressors were
compartmentalized into following aspects:: self,
child, spouse, financial, job and health. In a lighter
vein I state the stressors on the basis of type of
personality. “Swastha, Mastha , Trasta, Vyastha.”
Incidentally the reasons attributing to the stress can
be capsuled as Hurry, Worry . Curry , Marry , Sorry and
Brewery. These are stated concisely but are having
noteworthy value. Combating the causes of
commotion is an inseparable part of life. Philosophy
has thrown the light on this issue in the right
perspective. Briefly we can say: Self Awareness (The
awareness of one's own feeling and ability to
recognize and manage ones own feeling This factor
includes a degree of self belief in one's ability to
manage one's own emotions and control the impact on
environment.). Emotional Resilience (The ability to
perform consistently in a range of situations under
pressure and to adopt behavior accordingly .The
ability to balance the needs of the situation and takes
with needs and concerns of individuals involved.
The ability to focus on a course of action or need for
results in the phase of personal challenge or
criticism.) Motivation : ( It refers to the drive and
energy to achieve clear results & make an impact ,
balance with an ability to perceive demanding goals in
the phase of rejection or questioning.) Interpersonal
Sensitivity:: (It is the ability to be aware of & take
account of the means and perception of others in
arriving at decisions and proposing solutions to
problems and challenges The ability to build from this
awareness and achieve the commitment of others to
decision sand action ideas. ) Influence ( ability to
persuade others to change a view point based on
understanding of this position and recognition of the
need to listen to this perspective and provide a
rational for change) Imitativeness : (Institutive
perception of key issues and implication).
Conscientiousness: (Match words with deeds in
encouraging others to support the chosen direction )
The learner feels that inclusion of enhancement in
Emotional Intelligence and moral as well as ethical
aspect is essential for imbuing on the minds of
trainees.
CONCLUSION
1] The unit based training programs designed by
external experts are useful to some extent but
they are unaware of the internal climate,
culture type of leadership, methodology of
working. Hence a righter mix of internal &
external trainers is essential.
ALLANA MANAGEMENT JOURNAL OF RESEARCH /JULY - DEC 2012 / PAGE NO. 069
2] Relationship in between Emotional
Intelligence and stress be comprehended And
how to keep the mind in a stable and balanced
state needs to be taught thoroughly.
3] As age advances; the power of understanding]
perceptive/ appreciative/ tolerant]
increased but power of retention decreases.
Hence a concise and comprehensive
annotation/ comment note be provided to the
participants.
4] Learning is depending upon the interest taken
by the trainee in the training. Practicing the
principles learnt in real life helps to retain
the knowledge gained.
5] Whether technical or non technical cader
participants are; they are interested in
striking a balance in between relation and
work output.” The difference of opinion
should not result in enmity “ is an art.
And every one craves for this knack. It's inclusion
in proper perspective in every training
program is not only essential but
indispensable as well.
6] Emotional learning differs from cognitive
learning in a number of ways Hence training
and development efforts need to incorporate
a number of elements Those are capsuled
below :
Practice ( Opportunity to practice outside the typical
work environment;) Ongoing encouragement and
reinforcement from others.( Learners are required to
be repeatedly encouraged and reinforced to use the
new skills on the job.) Support from the superior (
Supervisors role influences transfer and maintain new
competencies.) Experimental Learning : (Experiential
activity results in effective social and emotional
learning)
Emotionally Intelligent Trainers and Coaches ( Care &
sensitivity should be a part and parcel of training
presented.) Anticipation and preparation for setbacks
(Learners will inevitably encounter setbacks.)
Training ; when; based on sound ; empirical based
methods will give promising results.
REFERENCES
Training & Development : Janakiram B Biztantra Publishers 2007
Employee Training & Development Raymond Tata McGraw Hill Publication
2008
Training & Development :: Landale Anthony Infinity Books 2004
MAIMT – Journal of IT & Management Vol 5 No. 2 ( November 2011 – April 2012 (
A journal of Maharaja Agrasen Institute of Management & Techonology
Jagadhri ( Harayana )
Harward Business Review issue June 2010.

ALLANA MANAGEMENT JOURNAL OF RESEARCH /JULY - DEC 2012 / PAGE NO. 070
GENERAL
MANAGEMENT
INTRODUCTION
mperative for success in Business, Industry has to strive to Ieliminate all safety and environmental incidents. Continued
improvement towards the goal of zero incidents primarily
requires effective investigation of the incidents that do occur to
prevent their recurrence. The secondary purpose of incident
investigation is to evaluate the other system elements. The task
of Incident investigators is to gather information, analyze the
facts surrounding the information and render report.
DEFINITION
Management, reporting and investigation of incidents, such as
but not limited to fires, explosions, spills, vehicle collisions,
malfunctions, treatment plant upsets, etc. that result in any of
the following negative outcomes :
Injury or illness to an employee, contractor.
Damage to property
Exceedance of an environmental permit or regulatory
limitation;
Release to the environment
The term “incident” may also include “near misses”, which are
unplanned, undesired events that could have resulted in
negative outcomes but did not.
INCIDENT OCCURANCE
“INCIDENT MANAGEMENT”
MR. P. R. RAMDAS
PLANT ENGINEERING & EHS, HEAD,
INTERNET INDIA PVT. LTD., PUNE

ALLANA MANAGEMENT JOURNAL OF RESEARCH /JULY - DEC 2012 / PAGE NO. 071
Incidents result from errors. An error can be
something simple, such as taking a shortcut to save
time, or it can be something of a more complex nature
involving poor design, lack of sufficient management
controls, or pressure to complete work with limited
time or resources. When hazards and errors come
together, incidents can occur.
Incident prevention is typically accomplished by
establishing successive barriers and defenses to
eliminate or reduce the impact of errors. The function
of these defenses is to minimize the potential impact
of undesired occurrences to colleagues, assets and the
environment.
In an ideal world safeguards, or defensive layers,
create an inherently safe, productive, and
environmentally friendly work site. In reality,
safeguards are not perfect and often have weaknesses
and shortcomings.
In the Swiss Cheese Model of incident causation shown
below, these weaknesses and shortcomings are
represented by the holes in the cheese. Each slice of
cheese represents a defensive layer. The presence of a
hole in any single layer may not result in an incident.
However, when the holes, or errors, in the layers align,
the risk of an incident is significantly increased.
The three slices of cheese in the model above
represent the three categories of safeguards or
defensive layers -- Organizational, Process, and
Behavioral. Incident investigations and prevention
efforts should seek to identify and correct flaws in
each of the layers.
INCIDENT INVESTIGATION
An effective incident investigation details :
What happened, when it occurred, and how it
occurred (i.e., timeline of events) All contributing
factors (i.e., deficiencies in Organizational, Process,
and Behavioral safeguards) that played a role in the
occurrence; and Corrective and preventive actions
necessary to prevent recurrence of similar incidents
(e.g., lessons learned). The problem with some
incident investigations is that they do not go far
enough. They only identify and address the behaviors
and conditions at the time of the incident. They do not
consider what prompted or allowed the identified
behaviors and conditions to exist in the first place.
Incident investigation is a powerful tool to identify
each of the failures that led to an incident so they can
be corrected to prevent similar incidents from
recurring. An effective incident investigation will
examine all the relevant organizational, process and
behavioral factors associated with the incident and
look for ways to enhance the prevention measures and
safeguards.
DE T E R M I N I NG A P P R O P R I A T E L E VE L O F
INVESTIGATION
It is good practice to investigate all incidents,
including “near misses”. Each incident that is not
investigated is potentially a missed learning
opportunity. The depth and detail of each
investigation usually corresponds with the perceived
severity. However, the objective to determine what
went wrong and what can be done better is the same,
regardless of severity. Even investigations of near
misses can be useful since it is often a matter of

ALLANA MANAGEMENT JOURNAL OF RESEARCH /JULY - DEC 2012 / PAGE NO. 072
circumstances such as time, distance, positioning, or
sequencing that determines the consequences of an
incident.
GATHERING THE INFORMATION
It is important to visit the incident scene and capture
information as soon as possible after an incident
occurs. The incident scene should not be disturbed
until the investigation has taken place. If necessary,
stop work and prevent unauthorized access. In certain
instances, the scene will need to be secured until
regulatory agencies have visited the scene and
authorized release of the area Describe the chain of
events leading up to and immediately following the
incident, recording the factors in chronological order.
VERIFICATION OF FACTS
Rely on the facts. Keep an open mind and consider
everything that might have contributed to the
incident. It is important to conduct the investigation
in a manner so that it is clear that the objective is to
determine the contributing factors and to identify
corrective and preventative actions, not to assign
blame.
IDENTIFY THE SITUATION PRIOR TO THE INCIDENT
Normally incidents occur because of several
contributing factors. Factors which initially appear
remote in terms of time or direct influence, can
increase in importance as the investigation proceeds.
Record these observations as early as possible during
the investigation process.
ASCERTAIN AND EVALUATE THE ACTIVITIES BEING
CARRIED OUT AT THE TIME ON INCIDENT
Provide a good description of the following items,
including all the relevant details :
The surroundings (internal, external,
manufacturing, utility area, waste treatment,
etc)
The condition of the working surface (clean,
wet, oily, sloping, etc)
The equipment/material being used – note all
details available
The position of valves, switches, equipment,
vehicles, tools , etc.
The number of persons engaged in the
activities and their actions and behaviors.
Photograph the scene. Take a general view and close-
ups of relevant items and equipment.
INTERVIEWS
It is crucial to get information from those directly
involved, their line management, witnesses, and
those observed in the area prior to the incident.
Interviews should take place in familiar surroundings;
the interviewee should feel comfortable. The style of
interviewing is critical. It should be frequently re-
stated that the purpose of the investigation is to
prevent a reoccurrence, through identifying and
correcting the contributing factors. The emphasis is
on prevention, not blame. Conduct separate
interviews to prevent individuals from influencing
each other. Questions, when asked, should not be
intimidating.
ANALYZING THE INFORMATION
The analysis of the information gathered should be
performed in a systematic way to ensure that it is
comprehensive and free from bias. Various tools and
techniques may be helpful for managing all of the
information and determining the contributing factors.
These tools are especially valuable as the complexity
of the investigation increases. Each method has its
strengths and weaknesses. These techniques include
but are not limited to Events and Causal Factors
Charting, Barrier Analysis, Change Analysis, and Root
Cause Analysis. The analysis should consider all
possible contributing factors. Keep an open mind with
the goal of a thorough, systematic and objective
review of the evidence.
IDENTIFYING THE CONTRIBUTORY FACTORS
It is essential to identify the factors that have
contributed to an incident. Most incidents will have
more than one contributing factor; consequently, the

ALLANA MANAGEMENT JOURNAL OF RESEARCH /JULY - DEC 2012 / PAGE NO. 073
causes of safety and environmental incidents need to
be examined from seemingly distinct, but usually very
much interrelated and interdependent perspectives.
To facilitate the investigative process, it is
recommended to use the following categories of
contributing factors :
Behavioral
Process
Organizational
When an incident occurs, normally the most visible
factors are the behaviors; however, organizational
and process factors have a significant influence on the
development of the behavioral layer. It is therefore
necessary to examine each of the layers for
contributory factors and not only the behavioral layer.
BEHAVIORAL FACTORS
Behavioral factors refer to what people do or do not
do. The greater the knowledge and skills, the greater
the likelihood of understanding potential hazards and
identifying the necessary actions that must be taken.
Positive mindset.
Knowledge, awareness, and constant
attention to the surroundings and potential
hazards
Adherence to applicable rules, standards,
procedures, critical behaviors precautions
and warnings
Evaluation and recognition of potential
consequences of personal actions
Seeking appropriate advice and assistance for
difficult tasks or unfamiliar situations
PROCESS FACTORS
Process factors refer to the equipment, materials and
surrounding environment, as well as the procedures
and established work sequence and flow.
Consider the following questions. If the answer to a
question is “YES”, regard this as a possible process
factor related to the incident. Design, layout and
access of work area and equipment Safety Devices
(guards, interlocks, alarms, etc) Organization and
planning of work
Selection and use of materials and equipment
Inspection and maintenance of tools,
equipment and work areas
Procedures and methods
Environmental and working conditions
Area hazards and poor housekeeping can have
a significant impact on the potential for an
incident.
ORGANIZATIONAL FACTORS
Organizational factors refer to the basic values,
norms, beliefs and practices that characterize the
functioning of an institution. They define the
expectations and the management system for the
safety and environmental culture that evolves. If gaps
are discovered in the organizational layer, they should
be viewed and handled as opportunities to enhance
and improve the effectiveness of the layer.
Organizational Factors to evaluate as part of the
incident investigation process include:
Vision, core values, SHE policy, strategy,
objectives, and expectations
Standards, regulations and other legal
requirements
Structure and responsibility
Training, awareness, communications and
ensuring competency
Supervision and operational control of work
Planning for hazard identification and control
of risks
Management of Change
Providing for participation and involvement
ALLANA MANAGEMENT JOURNAL OF RESEARCH /JULY - DEC 2012 / PAGE NO. 074
Performance measurement and monitoring
Observing and Coaching
Incident investigation and management of
corrective and preventative actions
The Availability of Professional Resources
HUMAN ERROR
Human error is frequently equated to personal
behavioral factors. In other words, if something goes
wrong, it seems obvious that an individual (or group of
individuals) must be responsible. However, human
error can occur across each of the defensive layers.
These errors can range from failures that have a short
time impact (e.g. lapses, fumbles, mistakes, and
procedural violations) to those that are more long-
lasting (e.g., untrustworthy alarms and indicators,
unworkable procedures, design and construction
deficiencies, etc).
BASIC ERRORS
Identifying the error types provides valuable
information that will help identify the corrective and
preventive actions necessary to prevent recurrence.
Learning and Memory Gap Errors.
Procedure Gap Error
Application Gap Errors
MINDSET ERRORS
In addition to the basic errors, humans are prone to
errors related to the lack of a proper mindset or
motivation. Individuals perform unsafe acts even
when they know the safe thing to do; however, they
sometimes lack the proper motivation and proper
mindset to make the right choice. The following
categories of mindset error traps can also lead to
safety and environmental incidents :
Inconsistent Assessment of Consequences
Normalization of Deviance
Group think
ASSIGNING PERSONAL ERROR AS THE SOLE FACTOR
Incident investigations which conclude that personal
error was the sole factor in an incident, without
looking at contributing factors underpinning this error,
are usually superficial and are rarely acceptable.
IDENTIFYING CORRECTIVE AND PREVENTIVE
ACTIONS
After all the contributing factors and error types have
been identified, the next step in the incident
investigation process is to determine the necessary
corrective and preventative actions. Corrective
actions are the actions that are needed to rectify the
existing situation. Preventative actions are the risk
control measures that need to be taken to block a
similar type of incident from recurring.
On the other hand, if knowledge of the hazard or
procedure is the problem, additional training, hazard
awareness communications or clarification of
procedures may be the best solution to address the
learning gap or procedure gap errors.
IMPLEMENTING CORRECTIVE ACTION PREVENTIVE
ACTION (CAPA)
The CAPA should consist of objectives that are
Specific, Measurable, Actionable, Realistic, and Time-
based. Actions with the highest priority should
generally be implemented the soonest. The highest
priority actions are those measures that ensure that
an incident does not recur today.
Relevant risk assessments should be reviewed
following an incident. The incident investigation
should highlight areas of the risk assessments
requiring improvement.
In addition to specific risk assessments, a general
review of the risk assessment program may be
required.
UNDERSTANDING INCIDENT COSTS
DIRECT COSTS
Medical expenses, Workers compensation, Damage to
machines and equipment, Insurance and Legal

ALLANA MANAGEMENT JOURNAL OF RESEARCH /JULY - DEC 2012 / PAGE NO. 075
Expenses.
INDIRECT COSTS
Lost Time – injured worker, Loss of efficiency and
production, Training costs, Replacement costs,
Hardship to family, Damage to the company image,
Loss of customers, Pain and suffering.
INCIDENT INVESTIGATION CLOSEOUT
The incident investigation should remain open until all
CAPA related items are closed and the risk assessment
has been updated.
CONCLUSION
A systematic and focused approach in investigation of
incidents paves the path for ensuring effective
corrective and preventive actions which can identify
and fix all grey areas and prevent recurrence of
incidents. Each “Incident” which may also include
“near misses”, which are unplanned, undesired events
that could have resulted in negative outcomes but did
not when investigated enable us to learn and pave way
for continuous improvements to overcome occurrence
of incidents. The detailed and in-depth
understanding of the Behavioral, Process and
Organizational factors will allow us to build in barriers
to block the occurrence of incidents. Incident
investigations are the single most important
component of incident prevention program because
they prevent reoccurrence. Unsafe acts and
conditions left uncorrected are likely to result in more
serious events. Investigations identify processes and
procedures that need modifications or improvements.
It can be concluded that the benefits of Incident
investigation and Management program prevents
incident reoccurrence, improves employee morale,
demonstrates Management commitment, improves
methods (or) process, meets regulatory requirement
and improves profitability.
REFERENCES
1) Guide to Accident / Incident Investigations – Colorado State
U n i v e r s i t y h t t p : / / w w w. b e r n a r d i n o . c o l o s t a t e . e d u / O H
SS/OHSSHandouts/ohss_Accident_Investigation.pdf
2) I nc ident Inves t i gat ion and Root Cause ana ly s i s

ALLANA MANAGEMENT JOURNAL OF RESEARCH /JULY - DEC 2012 / PAGE NO. 076
GENERAL
MANAGEMENT
1.0 INTRODUCTION
public Private Partnership (PPP) can take many forms
Athough it is generally defined as a contract where the
private sector is given the right by the public sector to
inter alia build, operate, manage and/or deliver a service for the
general public – roads, hospitals, schools, etc. PPP combine the
best of the public and private sector, while minimizing the
shortcomings of either the exclusive public sector delivery of
services or the “privatization” route. The intention is to develop
a better infrastructure wherein the Government plays the role of
a facilitator, setting the regulatory and legal frameworks in place
whereas the private sector offers financial, technical and
managerial support for such infrastructure projects.
1.1 BENEFITS OF PPP
The PPP have following benefits :
a. Inflow of Private Investment
b. Freeing up Government Resources
c. Increase In Efficiency
d. Sharing of Project Risks
e. Assured Maintenance
f. Better Viability
g. Innovative Design & Construction Practices
“GROWTH OF EDUCATION SECTOR
IN INDIA WITH PUBLIC-PRIVATE
PARTNERSHIP”
DR. VIKAS SARAF
PROFESSOR & ADDITIONAL DIRECTOR,
VIDYASAGAR INSTITUTE OF
MANAGEMENT (VIM), BHOPAL (M.P)
DR. MAHENDRA SINGHAI
ASSISTANT PROFESSOR,
GEETANJALI GIRLS P.G.
COLLEGE, BHOPAL(M.P)
MS. LATA YADAV
ASSISTANT PROFESSOR,
VIDYASAGAR INSTITUTE OF
MANAGEMENT (VIM), BHOPAL (M.P)

ALLANA MANAGEMENT JOURNAL OF RESEARCH /JULY - DEC 2012 / PAGE NO. 077
1.2 ESSENTIAL COMPONENTS
The essential concept of PPP is mentioned below :
a. Fixed Concession period
b. Pre-determined user charges/tariff
c. Pre-determined scope of work for the
Concessionaire
d. Pre-determined bidding parameters
e. Premium/Revenue Sharing/Lease Rent
f. All conditions, specifications
g. Agreements frozen prior to inviting bids
h. Land required for the project available
I. The Implementing Agency
2.0 PUBL IC PR IVATE PARTNERSHIP IN
EDUCATION IN INDIA
In response to the poor functioning of government run
schools across many countries, in recent years there
has been advocacy in favour of private public
partnerships in education, i.e. publicly funded but
privately produced/delivered education. Privately
run charter schools are an example of PPP in US
education. The main supposed advantage of PPPs is
that they are a more flexible way of producing
education, since the entity running the school, such
as the private management of a school, has
considerably more discretion about the running of the
school and disciplining staff than is possible in public
schools.
An extensive PPP system does operate in India at the
junior, secondary and higher levels but not so much at
the primary level. This is the system of government
grant-in-aid to privately managed schools. Grants to
aided schools account for a very substantial
proportion of the education budget, for example,
about 70% of the higher and 80% of the secondary
education budgets in Uttar Pradesh. PPPs are the
main mode of delivery of secondary and higher
education in much of India.
At the time India inherited this system from the British
at independence in 1948, aided schools shared many
of the features of the current US charter schools. For
instance, charter schools in the US avoid government
regulations and interference (e.g. they are not
obligated to hire unionized teachers, have more
autonomy than public schools in determining staff
disciplinary policies, and must attract students to
succeed otherwise they have to close down for
budgetary reasons). Aided schools in India operated on
quite a similar system: any recognized private school
could apply for government grant-in-aid and, once it
was granted aided status, it received a per student
subsidy from the state government. Its teachers were
paid out of school revenues and were thus accountable
to fee-paying parents and to the school manager. They
could be disciplined and hired/fired at the level of the
school.
3. PRIMARY EDUCATION AND PUBLIC–PRIVATE
PARTNERSHIPS
Education spending in India is about 4.1% of GDP, well
below spending in most OECD member countries.
While there has been considerable focus on building
the school network over the last 5 years, significant
gaps continue to hinder quality education across the
country. The team summarizes the top three
challenges in the education sector as :
Inadequate basic physical infrastructure at
primary and upper-primary schools, e.g.,
toilets, electricity, and drinking water;
Teacher apathy, absenteeism, and poor
quality of training; and lack of leadership and
ineffective management at school level.

ALLANA MANAGEMENT JOURNAL OF RESEARCH /JULY - DEC 2012 / PAGE NO. 078
The education industry is looking at an increased
public-private partnership (PPP) in educational and
training initiatives for matching skill-set demands of
the industry with the available talent. Education is
among a few sectors that has been insulated from the
impact of a global economic slowdown but faces a
huge challenge of reducing the gap of educated yet
unemployable talent.
“We would like to see more investment in PPP
programmes to improve education quality at the
bottom of the pyramid,” said Shantanu Prakash, Chief
Executive Officer and Managing Director, Educomp
Solutions Ltd, a leading private player in the sector.
“We would also like to see companies get fiscal
incentives for investments made in education
infrastructure projects.”
“Indian education and training sector has not received
the attention it deserves,” said Ninad Karpe, chief
executive officer and managing director, Aptech.
“There is a crying need for immediate investments in
vocational training while more funding in primary
education is essential from a long term perspective”.
The Confederation of Indian Industries has
recommended that the government should strengthen
initiatives to involve participation from foreign and
private universities for technical education. The
industry body has also said that there is a need to
introduce interdisciplinary projects, upgrade existing
MODELS Management contracts for:
Mentoring programs School management Teacher supply and training Information and communications
technology training centers
KEY FEATURES AND ISSUES
Addresses quality of teaching and education provision issues.
Relatively simple to procure and deliver. Allows the procurement of manageable contract
sizes. Limited by supply and quality of teachers and
support staff. Requires extensive stakeholder management with
teachers and other unions. Affordability is a key consideration.
Build, lease and maintain school building
Addresses the need to build and maintain scho ol to minimum national standards.
Provides a construction-led solution. Affordability may need to be considered. Freed up the time of school staff to deal with
education delivery and not with building management.
Involves wider stakeholder management issues. Requires public sector procurement and
contracting capacity.
Residential schools in rural areas Addresses the need for schools in rural areas. Allows private sector to build residential school
facilities with an option to mix government -allocated areas with fee-paying private places.
Allows for the use of a voucher -based scheme for the poor.
Needs to consider financial viability and affordability
NEXT STEPS

ALLANA MANAGEMENT JOURNAL OF RESEARCH /JULY - DEC 2012 / PAGE NO. 079
courses with industry requirement and introduce
independent accreditation systems.
Owing to constrained investment, the education
sector is unable to cope with growing market demand
and global competition. Increased private investment
is thus imperative to expand infrastructure and
provide greater access to quality higher education in
India. E&Y - FICCI report emphasizes that PPPs could
be an effective mechanism for attracting much
needed private sector investment in the Indian Higher
education system without diluting the regulatory
oversight of the Government and other regulators.
4. GAPING RESOURCE GAP
The Government of India has allocated INR 850 billion
for higher education in the 11th Five Year Plan.
However, considering that the Planning Commission
has identified a resource gap of INR 2.2 trillion, it is
unlikely that the Government alone can address
infrastructure needs in the higher education sector in
the near future.
While public expenditure on education has increased,
the percentage share of Gross Domestic Product (GDP)
spent on higher education has come down from 0.77%
in 1991 to 0.7% in 2008. Moreover, there is an unequal
outlay of resources for Higher Educational Institutions
across the Indian states.
5. PARTNERSHIP MODELS IN EDUCATION
The report presents basic modes of partnerships that
are possible between the government and the private
sector. Partnerships are established for varied reasons
including construction, financing, design and
maintenance of public infrastructure. PPP in social
sectors such as health and education are sometimes
referred to as Public-Social Private Partnership
(PSPP).
A number of PPP models can exist that range from
simple management contracts to build, own, operate,
transfer (BOOT) formats. BOOT is a public-private
partnership (PPP) project model in which a private
organization conducts a large development project
under contract to a public-sector partner, such as a
government agency. A BOOT project is often seen as a
way to develop a large public infrastructure project
with private funding. These formats vary in the kind of
benefits they yield. The report provides case studies
of different types of PPP arrangements in education
such as :
Public-private financing of higher education
Science/research parks
University-owned companies
The report underscores certain challenges that can be
expected while applying the PPP model to education.
For instance, the high cost of such projects, relatively
lower returns, and the current regulatory landscape
makes it difficult to attract participants/bidders for
education projects. Another challenge is the lack of
familiarity with the PPP procurement process.
The report suggests measures that can be
implemented to avoid these hurdles. The process of
attracting bidders should be framed to minimize the
bid costs with effective competition. Also, the
university/college can be protected by way of
monitoring the services offered by private players.
Certain cases of successful PPP projects in the
education sector from other countries have been cited
as examples, such as :
South bank Educational and Training Precinct
Development involved the development of
high standard facilities for the South bank
Educational and Training Precinct
Royal Northern College of Music in the UK
which involved development of about 160
study rooms, staff and guest accommodation,
car parking facility and a walkway.
6. REGULATORY FRAMEWORK FOR PPP
An Higher Education Institute in India can be set up as
a Trust, Society or as a Company registered under
Section 25 of the Companies Act, 1956 (though the last
is not recognised by the HRD Ministry). Several
regulatory bodies regulate the functioning of higher
education in India. These comprise the University
Grants Commission (UGC), All India Council for

ALLANA MANAGEMENT JOURNAL OF RESEARCH /JULY - DEC 2012 / PAGE NO. 080
Technical Education (AICTE), Medical Council of India,
etc.
The higher education system suffers from
several challenges that act as a hurdle in the
growth of the PPP concept in India. These
include the conditions imposed for setting up
the educational institute as a not-for-profit
entity; excessive regulations in the
functioning of the higher education institutes
(HEIs) and for the entry of foreign educational
institutions into India.
Despite these challenges, the PPP concept in
the education sector needs to be explored.
Since there are regulations with respect to
being a not-for-prof it ent ity, the
infrastructure for educational institutions can
be created through the PPP model.
6.1 COMMON MISCONCEPTIONS ABOUT PPPS
Public private partnerships are the same as
privatization.
By entering into a public private partnership,
public sector loses control over the provision
of services.
Public private partnerships apply only to
infrastructure projects.
The principal reason for government entering
into public private partnerships is to avoid
debt.
Public sector employee will lose under public
private partnerships The cost of service will
increase to pay for the private partner's
profit.
There are only two partners in a public private
partnership.
6.2 FUNDING AGENCIES
India has one of the largest populations of youth in the
world. "Education for all," a foremost development
goal for the country, is central to realizing the
potential of these youth. Still, at least 8 to 10 million
children are out-of-school, and a dearth of resources
limits educational quality across a vast public school
system. A public-private alliance is drawing together
educational innovators and technology leaders to
improve the quality of teaching, motivate children to
complete school, and ensure that skills of young
persons meet the needs of India's emerging economy.
6.3 NGOs
The basic idea of an education voucher15 is that the
government would fund students instead of schools
and that the money would follow the student and get
paid to whichever school that the child chooses to
enroll in. In such a situation, even the poorest parents
would be able to send their child to a private school if
they felt that it was superior to the public school, but
they would be just as free to send their child to the
government school if they felt that it was the best
option for their child. Thus, the claim is not that all
private schools are superior to government schools.
Rather, the aim is to think about ways of providing the
poorest and most disadvantaged sections of society
with the same set of choices faced by their better-off
counterparts. This is exactly what a voucher or
scholarship program would do.
7. CONCLUSION
Proponents of PPPs in education often claim cost-
effectiveness, equity, superior performance and cost
savings. To date, the record on impact is relatively
scarce.
Worldwide attention to the issue is increasing and we
are getting more results. While ideology continues to
play a role in the various debates, the issue is
becoming clearer given the recent increase in impact
evaluation studies. While the evidence base is small,
it is nevertheless growing. The current providers of
education in India indicate that there has been a shift
in the manner in which education is conceptualized.
The market based approach has regarded parents and
communities as purchasers of a commodity. The new
models of education provision seem to regard
strengthening of existing patterns of supply and
demand as a sufficient basis for education. There is
little attempt to address social inequities that might

ALLANA MANAGEMENT JOURNAL OF RESEARCH /JULY - DEC 2012 / PAGE NO. 081
skew the costs imposed on poor families. The ability to
access an education system is limited by hierarchical
social structures. The use of voice requires political
legitimacy otherwise it reproduces and reifies existing
differentiation. Current initiatives where there has
been the entry of corporate or other non-state players
might seem a more attractive solution to expanding
the educational net but these are likely to come
unstuck in the face of stark social inequities and there
is need to recognize the pivotal role of the teacher in
drawing on innovative pedagogy and curriculum to
realize the social transformative function of
education.
REFERENCES
[1]. Azim Premji Foundation (2005). Report on National Conference on
Teachers. Bangalore: Azim
[2]. Premji Foundation. 24th-25th October, Bangalore Balagopal, S.
(2003). Understanding Educational Innovation: The Case of
Ekalavya. Educational Dialogue, 1 (1), 97-121.
[3]. Ball, S. (2007). Education plc. London: Routledge. Charter
Schools, USA. http://www.charterschoolsusa.com
[4]. Chubb, J & Moe, M. (1988). Politics, Markets, and the
Organization of Schools. The American Political Science Review,
82 (4), 1065-1087.
[5]. Coady, D., & Parker, S. (2004). Cost-effectiveness Analysis of
Demand- and Supply-side Education.
[6]. Interventions: the Case of PROGRESA in Mexico. Review of
Development Economics, 8 (3), 440–451. Common, R.
(2000). The East-Asian Region: Do Public-Private Partnerships
make sense? In Osborne P. (2000). Public-Private Partnerships: Theory
and Practice in International Perspective. London: Routledge.
[7]. Day Ashley, L. (2005). From the Margins to the Mainstream: Private
School Outreach Inclusion for Out-of-School Children in India.
International Journal of Educational Development, 25 (2). De, A.,
and Dreze, J. (1999). Public Report into Basic Education in India.
[8]. Easterly,W. (2000). The middle class consensus and economic
development. Policy Research Working Paper Series 2346,
Washington, DC.: The World Bank.
[9]. Fennell, S. (2006). Future Policy Choices for the Education Sector
in Asia. Background paper for the DFID organised Asia 2015
conference, 6th-7th March, 2006, London. 17
[10]. H. M. Treasury (2001). Private Finance Initiative.
www.parliament.uk/commons/ lib/research/rp2001/rp01-
117.pdf
[11]. Hirschman, A. (1970). Exit, Voice and Loyalty: Responses to
Decline in Firms, Organizations and States, Harvard: Harvard
University Press.
[12]. Hirschman, A. (1978). Exit, Voice and the State. World Politics, 31
(1), 90-107.
[13]. Hoxby, C. (2003). School Choice and School Competition:
Evidence from the United States. Swedish Economic
Policy Review, 10, 9-65.
[14]. Kingdon, G. (1996). Quality and Efficiency of Private and Public
Education : A Case-Study of Urban
[15]. India, Oxford Bulletin of Economics and Statistics, Department of
Economics, University of Oxford, 58(1), 57-82.
[16]. Kumar, M., & Sarangapani, P. (eds.) (2005). Improving government
schools : What has been tried and what works. New Delhi: Books
for Change.
[17]. Levin, H. M. (1999). The Public Private Nexus in Education.
American Behavioral Scientist, 43 (1).

ALLANA MANAGEMENT JOURNAL OF RESEARCH /JULY - DEC 2012 / PAGE NO. 082
GENERAL
MANAGEMENT
INTRODUCTION
Hospital Management Systems (HMS) are expected to
improve the quality and management of clinical care
and health care management [3]. Managing the key
processes efficiently is critical to the success of the hospital for
effective healthcare. HMS is a comprehensive, integrated
information system designed to manage the medical,
administrative, financial and legal activities and related services
of a hospital. Electronic health record will be the part of any such
system.
These systems are to provide Internet-based access, help to the
hospital authorities in developing comprehensive health care
policies, enhances information integrity, reduces transcription
errors, and reduces duplication [6, 7,8]. A look into the literature
and software development world over shows that there are many
HMS available, some even freely downloadable. However none
of these seem to be incorporating temperament determination
and integrating the temperament in further diagnosis and
medical care, hence they cannot be used Unani hospitals. At
best the doctors can determine the Mizaj (Temperatment) using
manual processing.
Comparison between Unani _HMS and other HMS's :The main
difference between Unani_HMS and other HMS's is that, patient's
normal Mizaj needs to be stored as reference first. When the
patient reports for treatment with medical complaints his
current Mizaj is obtained. If the current Mizaj is different from
his normal Mizaj, health problem is indicated and different
measures are adopted as the treatment to bring the normal Mizaj
INTEGRATING THE PROCESS
OF DETERMINING MIZAJ
(TEMPRAMENT) IN A HOSPITAL
DRQSZMANAGEMENT SYSTEM”
SAEED AFROUGH
DEPT OF COMPUTER,
TIRAN BRANCH,
ISLAMIC AZAD UNIVERSITY,
TIRAN, IRAN
PROF. MURTAZA M. JUNAID
FAROOQUE
ASSOCIATE PROFESSOR,
AIMS, PUNE
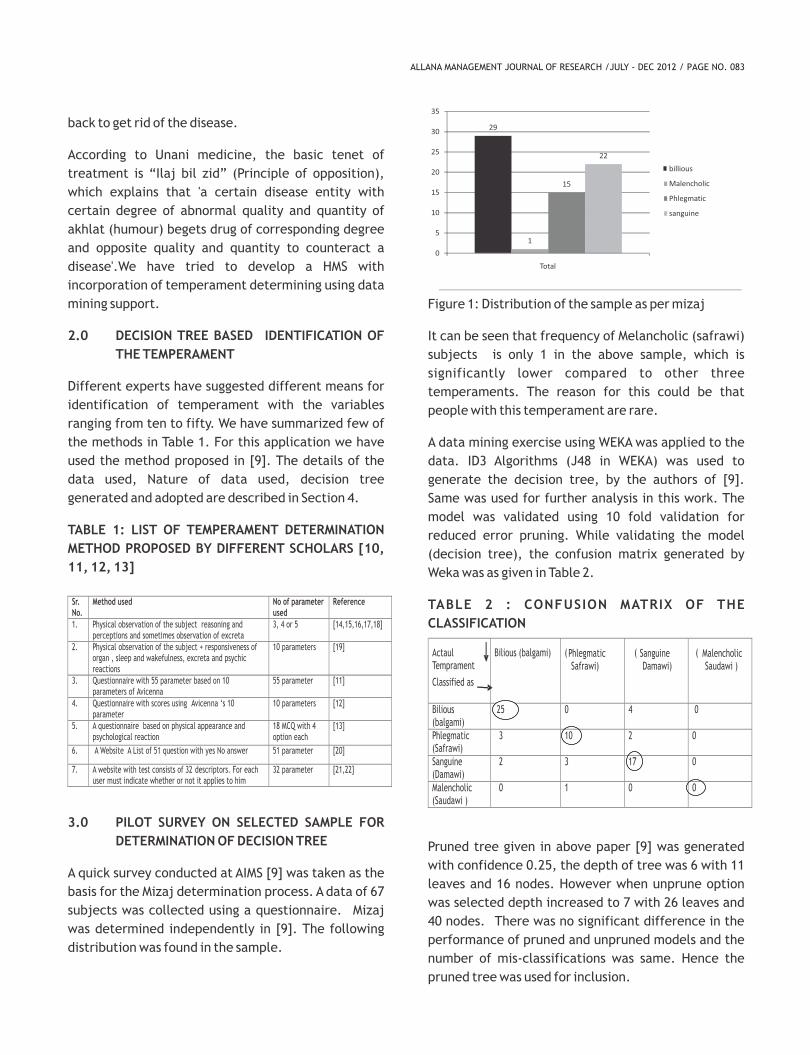
Actaul Temprament
Classified as
Bilious (balgami) Phlegmatic(Safrawi)
( SanguineDamawi)
( MalencholicSaudawi )
Bilious(balgami)
25
0
4
0
Phlegmatic(Safrawi)
3 10 2 0
Sanguine(Damawi)
2 3 17 0
Malencholic(Saudawi )
0 1 0 0
29
1
15
22
0
5
10
15
20
25
30
35
Total
billious
Malencholic
Phlegmatic
sanguine
Sr. No.
Method used No of parameter used
Reference
1. Physical observation of the subject reasoning and perceptions and sometimes observation of excreta
3, 4 or 5 [14,15,16,17,18]
2. Physical observation of the subject + responsiveness of organ , sleep and wakefulness, excreta and psychic reactions
10 parameters
[19]
3. Questionnaire with 55 parameter based on 10 parameters of Avicenna
55 parameter
[11]
4. Questionnaire with scores using Avicenna
‘s 10 parameter
10 parameters
[12]
5. A questionnaire based on physical appearance and psychological reaction
18 MCQ with 4 option each
[13]
6. A Website A List of 51 question with yes No answer 51 parameter [20]
7. A website with test consists of 32 descriptors. For each user must indicate whether or not it applies to him
32 parameter [21,22]
ALLANA MANAGEMENT JOURNAL OF RESEARCH /JULY - DEC 2012 / PAGE NO. 083
back to get rid of the disease.
According to Unani medicine, the basic tenet of
treatment is “Ilaj bil zid” (Principle of opposition),
which explains that 'a certain disease entity with
certain degree of abnormal quality and quantity of
akhlat (humour) begets drug of corresponding degree
and opposite quality and quantity to counteract a
disease'.We have tried to develop a HMS with
incorporation of temperament determining using data
mining support.
2.0� DECISION TREE BASED IDENTIFICATION OF
THE TEMPERAMENT
Different experts have suggested different means for
identification of temperament with the variables
ranging from ten to fifty. We have summarized few of
the methods in Table 1. For this application we have
used the method proposed in [9]. The details of the
data used, Nature of data used, decision tree
generated and adopted are described in Section 4.
TABLE 1: LIST OF TEMPERAMENT DETERMINATION
METHOD PROPOSED BY DIFFERENT SCHOLARS [10,
11, 12, 13]
3.0� PILOT SURVEY ON SELECTED SAMPLE FOR
DETERMINATION OF DECISION TREE
A quick survey conducted at AIMS [9] was taken as the
basis for the Mizaj determination process. A data of 67
subjects was collected using a questionnaire. Mizaj
was determined independently in [9]. The following
distribution was found in the sample.
Figure 1: Distribution of the sample as per mizaj
It can be seen that frequency of Melancholic (safrawi)
subjects is only 1 in the above sample, which is
significantly lower compared to other three
temperaments. The reason for this could be that
people with this temperament are rare.
A data mining exercise using WEKA was applied to the
data. ID3 Algorithms (J48 in WEKA) was used to
generate the decision tree, by the authors of [9].
Same was used for further analysis in this work. The
model was validated using 10 fold validation for
reduced error pruning. While validating the model
(decision tree), the confusion matrix generated by
Weka was as given in Table 2.
TABLE 2 : CONFUSION MATRIX OF THE
CLASSIFICATION
Pruned tree given in above paper [9] was generated
with confidence 0.25, the depth of tree was 6 with 11
leaves and 16 nodes. However when unprune option
was selected depth increased to 7 with 26 leaves and
40 nodes. There was no significant difference in the
performance of pruned and unpruned models and the
number of mis-classifications was same. Hence the
pruned tree was used for inclusion.

Correctly Classified Instances 52 (77.6119 %)Incorrectly Classified Instances 15 (22.3881 %)Kappa statistic
0.6538
Mean absolute error 0.1662Root mean squared error 0.2883Relative absolute error
50.3757 %
Root relative squared error 71.2505 %Total Number of Instances 67
ALLANA MANAGEMENT JOURNAL OF RESEARCH /JULY - DEC 2012 / PAGE NO. 084
A view of the tree is given in Fig 2. Hence the pruned tree was used for development of the information system.
Figure 2: Decision tree generated using WEKA (J48 Algorithm).
The error statistics is given in Table 3.
TABLE 3 : SUMMARY OF ERROR STATISTICS
INCORPORATION OF DECISION TREE IN HMS
The output of the generated decision tree was available as a text file named Weka-Tree.txt Which needs to be read
by the Unani_HMS before it can be interpreted for identification of the Mizaj of the particular patient. The
identified MIZaj now needs to be entered into the patient database for further clinical decision making.
Read
Weka
(Data Mining
Tool)
Text file (decision
tree)
C:\wamp/www/hmsOutput Store
Insert_wekafileinto_ta
ble()
C:\wamp\bin\mysql\Ttempr
ament
Determine_t
emperamentRead
Store
Patient ‘s EHR
Patient
Record
Mizaj
Figure 3 Incorporating Mizaj into patient’s EHR
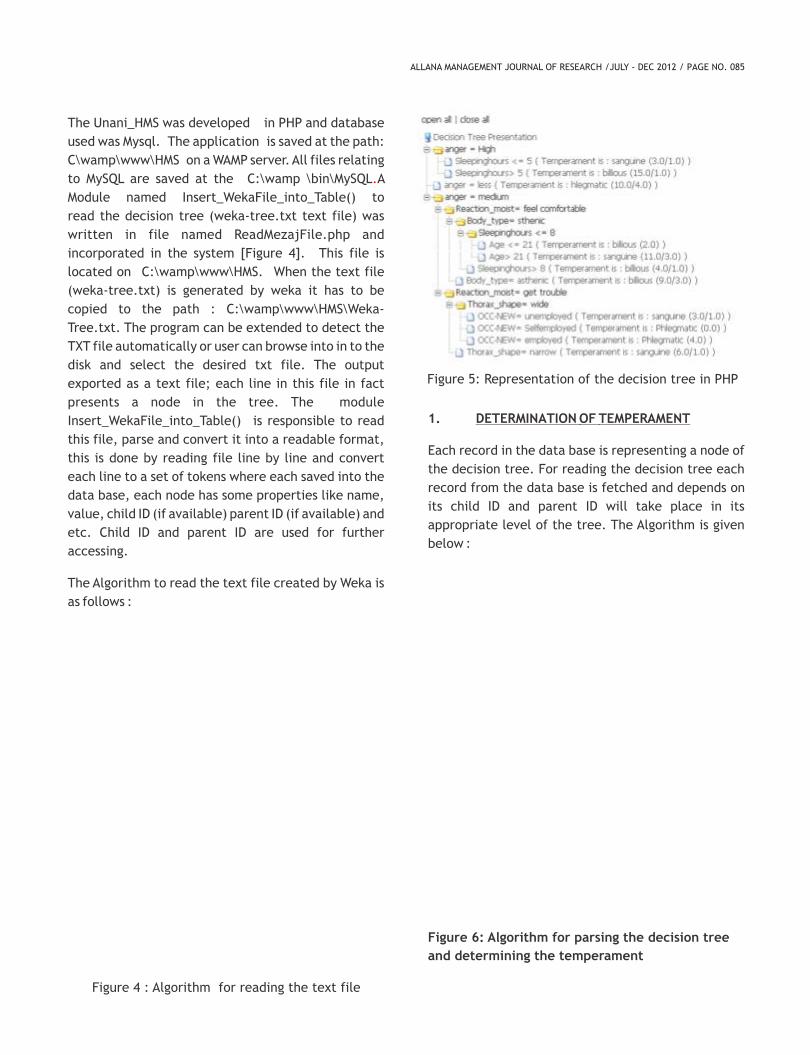
ALLANA MANAGEMENT JOURNAL OF RESEARCH /JULY - DEC 2012 / PAGE NO. 085
The Unani_HMS was developed in PHP and database
used was Mysql. The application is saved at the path:
C\wamp\www\HMS on a WAMP server. All files relating
to MySQL are saved at the C:\wamp \bin\MySQL A .
Module named Insert_WekaFile_into_Table() to
read the decision tree (weka-tree.txt text file) was
written in file named ReadMezajFile.php and
incorporated in the system [Figure 4]. This file is
located on C:\wamp\www\HMS. When the text file
(weka-tree.txt) is generated by weka it has to be
copied to the path : C:\wamp\www\HMS\Weka-
Tree.txt. The program can be extended to detect the
TXT file automatically or user can browse into in to the
disk and select the desired txt file. The output
exported as a text file; each line in this file in fact
presents a node in the tree. The module
Insert_WekaFile_into_Table() is responsible to read
this file, parse and convert it into a readable format,
this is done by reading file line by line and convert
each line to a set of tokens where each saved into the
data base, each node has some properties like name,
value, child ID (if available) parent ID (if available) and
etc. Child ID and parent ID are used for further
accessing.
The Algorithm to read the text file created by Weka is
as follows :
1. DETERMINATION OF TEMPERAMENT
Each record in the data base is representing a node of
the decision tree. For reading the decision tree each
record from the data base is fetched and depends on
its child ID and parent ID will take place in its
appropriate level of the tree. The Algorithm is given
below :
Figure 5: Representation of the decision tree in PHP
Figure 6: Algorithm for parsing the decision tree
and determining the temperament
Figure 4 : Algorithm for reading the text file
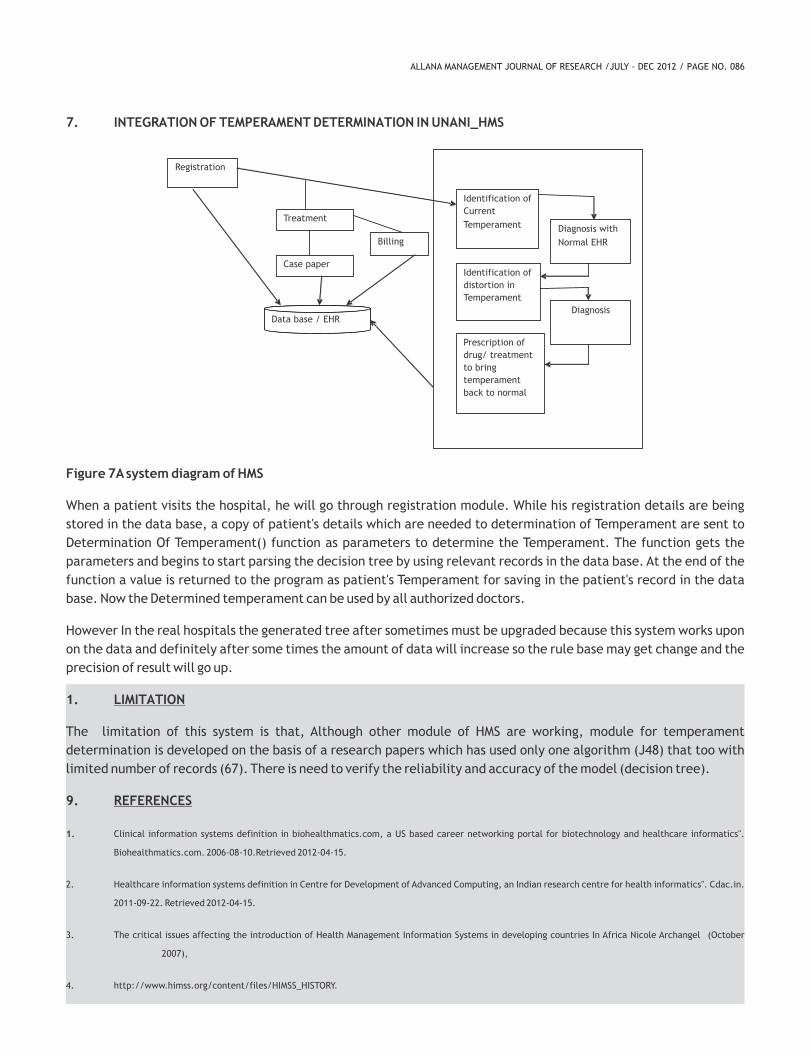
ALLANA MANAGEMENT JOURNAL OF RESEARCH /JULY - DEC 2012 / PAGE NO. 086
7. INTEGRATION OF TEMPERAMENT DETERMINATION IN UNANI_HMS
Figure 7A system diagram of HMS
When a patient visits the hospital, he will go through registration module. While his registration details are being
stored in the data base, a copy of patient's details which are needed to determination of Temperament are sent to
Determination Of Temperament() function as parameters to determine the Temperament. The function gets the
parameters and begins to start parsing the decision tree by using relevant records in the data base. At the end of the
function a value is returned to the program as patient's Temperament for saving in the patient's record in the data
base. Now the Determined temperament can be used by all authorized doctors.
However In the real hospitals the generated tree after sometimes must be upgraded because this system works upon
on the data and definitely after some times the amount of data will increase so the rule base may get change and the
precision of result will go up.
1. LIMITATION
The limitation of this system is that, Although other module of HMS are working, module for temperament
determination is developed on the basis of a research papers which has used only one algorithm (J48) that too with
limited number of records (67). There is need to verify the reliability and accuracy of the model (decision tree).
9. REFERENCES
1. Clinical information systems definition in biohealthmatics.com, a US based career networking portal for biotechnology and healthcare informatics".
Biohealthmatics.com. 2006-08-10.Retrieved 2012-04-15.
2. Healthcare information systems definition in Centre for Development of Advanced Computing, an Indian research centre for health informatics". Cdac.in.
2011-09-22. Retrieved 2012-04-15.
3. The critical issues affecting the introduction of Health Management Information Systems in developing countries In Africa Nicole Archangel (October
2007),
4. http://www.himss.org/content/files/HIMSS_HISTORY.
Registration
Treatment
Case paper
Data base / EHR
Billing
Identification of
Current
Temperament
Identification of
distortion in
Temperament
Prescription of
drug/ treatment
to bring
temperament
back to normal
Diagnosis with
Normal EHR
Diagnosis

ALLANA MANAGEMENT JOURNAL OF RESEARCH /JULY - DEC 2012 / PAGE NO. 087
5. http://en.wikipedia.org/wiki/Hospital_information_system
6. Hospital information systems definition given by US based".
Emrconsultant.com. Retrieved 2012-04-15.
7. Healthcare information systems definition in Centre for
Development of Advanced Computing, an Indian research centre
for health informatics". Cdac.in. 2011-09-22. Retrieved 2012-04-
15.
8. Hospital information systems definition given by US based".
Emrconsultant.com. Retrieved 2012-04-15.
9. Murtaza M. Junaid Farooque, sayyed abidurrahman, Farhana
Sarkhawas Identification of Mizaj (Temperament) based on Tibbi
Fundamentals using Classification as Tool (Proceedings of national
conference on data mining 2011)
10. F.S. Sherani, Forooq Ahmed Dar, Khalid zaidi , Unimed Kulliyat(
March 2007) vol 2 Issue II
11. Hakim sayed Istiaq Ahmed,(1980) Introduction to Al-umur Al
Tabiyah (Principles of human physiology in Tibb)
12. Prof. Jamil Ahmed, Hakim Ashraf Qadeer (1998)Unani The science
of greeco-Arabic medicine, Lustre Press Pvt. Ltd
13. Randy Rolfy, The Four Temperaments - A Rediscovery of the
Ancient Way of Understanding Health and Character. Avalon Books
- Marlowe & Co. 2002.
14. David Lester(1999) Galen 's Four temperament and four theories
of personality, DOI, 2, 10,& 40
15. Majoosi Ali ibne Abbas (1889) “kamelus sana” urdu transalation by
Ghulam Hussain kantori Matab Munshi Naval kishore lucknow pg,
24-25
16. Razi Abu bakar Mohammed bin zakaria (1991) “ Kitabul Mansoori”
Translated in urdu by CCRUM, New Delhi, pg 59,62
17. A Qader, “Matab aur shakshi mizaj Shahanasi”, “Jahan-e-Tibb”,
(2001), CCRUM New Delhi April-June
18. A Abdurrehmanov (1976) new information about the Arabic
translation of the “conica of Appolonius of perga(Russian),
Taskent, Gos university
19. Ibne-sina Abu Ali Hasan bin Abdullah “ Al Qanoon fil Tib” Book 1,
English Tranlation by the critical Arabic test , Jamia Hamdard
New Delhi.
20. http://www.openjs.com/scripts/tempfind.php
21. http://personality-testing.info/tests/4T.php
22. Martin, R. A., Puhlik-Doris, P., Larsen, G., Gray, J., & Weir, K.
(2003). Individual differences in uses of humor and their relation
to psychological well-being: Development of the Humor Styles
Questionnaire. Journal of Research in Personality, 37, 48-75.

1. Research articles with original findings are welcome. Researcher should state his / her name in full,
present designation, permanent and temporary address, phone number, fax number and his / her e-mail
address.
2. The area of research such as Commerce / Technology / Management / Computer Science along with the
sub area should be specified. A research article should not exceed 6000 words. Minimum number of
words; 3000. A hard copy along with a soft copy of the article should be submitted.
3. Abstract (1 page or ½ page) consisting of not more than 150 words, should be attached to the article.
4. Abstract should proved the following details in brief, pointing out the essentials only.
The substance of research, stating the main objectives of the research paper.
Contribution of the researcher; by way of a new finding, with its originality; that is hitherto unknown and
unexplored by the other researchers, to the best of the knowledge of the researcher.
Overall significance of the new findings along with appropriate scope, trends, indications or suggestions
for further research in that direction should be mentioned.
5. The researcher should certify that the research paper is his / her own and no material has been copied
from any other available published sources such as newspaper, journals, books or internet. Researchers
should enclose a passport size colour photo.
6. Reference pertaining to journals, books, periodicals, reports or reliable records, etc., should be
provided at the end of the research paper, in an alphabetical order as per the norms to be followed for
stating references.
7. Every contributor to this journal should attach the following declaration to his / her article:
“This is to certify that the contents of my research paper are original. No part of it has been taken from
any published journal, Indian or Foreign or from any available records. The material has also not been
taken from any internet source”.
- Name and signature, with date
This journal ISSN 2231-0290 will be available for subscription from January - June 2011 issue. The rate of annual
subscription is Rs. 300/- (Rs. Three Hundred Only) payable by Demand Draft drawn in favour of “Director, Allana
Institute of Management Sciences, Pune”.
The authors are responsible for the views expressed in their articles. Allana Institute of Management Sciences,
Pune and Editorial Board does not accept or take the responsibility for such views and details therein.
GUIDELINES FOR SUBMISSION OF RESEARCH PAPER
C E N T R E F O R M E N T A L H Y G I E N E

2390-B, K.B. Hidayatullah Road, Azam Campus, Camp, Pune - 411001
RNI TC No. MAHENG 12554/13/1/2010 - TC
Decl. No. SDM/Pune/110/2010 dtd. 27-07-2010
M.C.E. Society’s
Allana Institute of Management Sciences, Pune
Tel.: (020) 26440491 Fax No.: (020) 26449824
E-mail : [email protected] Website : www.aimspune.org