Integrating Rural Household Surveys November, 2004 Fred Vogel The World Bank.
25
Integrating Rural Household Surveys November, 2004 Fred Vogel The World Bank
-
Upload
brian-horn -
Category
Documents
-
view
215 -
download
0
Transcript of Integrating Rural Household Surveys November, 2004 Fred Vogel The World Bank.

Integrating Rural Household Surveys
November, 2004
Fred VogelThe World
Bank

Overview/purpose of paper
• “Encourage international and national statistical organizations to join forces in integrating their data requirements into a sustainable statistical system”
• “Provide framework to integrate agricultural and rural statistics centered on the household as the unit of measure”

Why is this important?
• United Nations Millennium Declaration of 2000– Commitment to the eradication of poverty,
to sustainable human development, to gender equality, right to development--
– Adopted by 147 heads of states and 189 states
• 8 Millennium Development Goals• MDG’s

What are the MDGs ?
1. Eradicate extreme poverty and hunger
2. Achieve Universal Primary Education
3. Promote Gender Equality
4. Reduce Child Mortality
5. Improve Maternal Health
6. Combat HIV/Aids, other diseases
7. Ensure Environmental Sustainability
8. Develop Global Partnership for Development

Why should we be interestedin MDG’s ???
Why should millennium goals be a concern at a conference on Agricultural and Rural Statistics???

The Reality
• “Three quarters of world’s poor live in rural areas of developing countries depending on agriculture for livelihood” (report of UN Secretary-General 02/04/2003)

The Issues
• What actions needed to make progress towards meeting the goals?
• How monitor the progress?
• How determine which actions made a difference?
• How know when the goals are met?

The Challenge
• Define the problem
• Determine the indicators
• Evaluate the indicators via statistical measurements
• Establish sustainable statistical system to repeat measurements over time

What has been done?
• 8 goals—MDG/s
• 18 targets--examples– Halve the proportion of people whose
income is less that one dollar a day (PPP)– Halve prop suffering from hunger– Eliminate gender disparity in education
• 50 +indicators

What is being done?
• Multiple Indicator Cluster Surveys – UNICEF sponsored household surveys– situation of women and children
• Demographic and Health Surveys– USAID sponsored household surveys– Health/nutrition of women & Children
• Living Standard Measurement Surveys– World Bank sponsored household surveys– Measure and understand poverty
Note these are Household Surveys

So,What is the Problem?
• Most Measures at National Level– Need at rural level– Data available on periodic basis– Each only measure part of problem
• Lack of Statistical Capacity in countries– Periodic efforts by international agencies not
adding to SUSTAINABLE statistical capacity

What Else is the Problem ?
• Agricultural statistics focus on farms and production
• Agricultural statistics not integrated with other national and international statistical systems and needs
• Resource problems—national governments struggle to meet different statistical needs

What do About It?
• Look at major uses of statistics and connect them with MDG indicators– Facilitate Policy
• Income, employment, health, education, equality, and sustain the environment
– Enhance Investment• Infrastructure, health, education
– Promote Efficient Markets• Food security vs marketing surplus/more income

What Else Do About It?
• Identify major users/donors of statistical system– International organizations– National ministries
• Collectively, jointly assess their needs/resources
• Agree on framework of cooperation

And??????
• Recognize that the core statistics needed by all can best be provided by a system of household surveys
• Why? Because that is how the independent needs are now being met
• Recognize the need to improve statistical capacity and put it on a sustainable footing

How Get Started?• Seek to integrate core economic, social,
demographic indicators in national statistical system with those to monitor progress toward meeting MDG’s
• Recognize do not need all data all of the time
• Recognize data requirements are related
• Recognize some things change faster than others
• Recognize some things need more detail

Frequency and Level of Geographic Detail
Frequency National Regional
State/ Province
County
GIS Referenced
Decennial
Quinquennial “There is a necessary trade-off
Between frequency and level ofGeographic detail”
Bi Annual
Annual
Semi Annual
Quarterly “Need to prioritize issues and economic variables by importance
and determine frequency and detail for each”
Monthly

Putting It Together
• Core Statistics– Need annually because change rapidly– Needed for short term policies
• Supplemental– Needed less frequently, but need to
understand how related to other economic, social, demographic issues

Model for Data Integration
CoreStatistics
MDG 1. Poverty, Hunger,
MDGs 4,5,&6 Health
MDG 7,&8
Environment
Development
MDGs 2 and 3
education
employment/ -

Model for Data Integration
Core and related Statistics—Household as Unit of measure
provides analytical Framework across issues
MDG 1. Poverty, Hunger
MDGs 4,5,&6 Health
MDG 7, 8EnvironmentDevelopment
MDGs 2 and 3
education employment
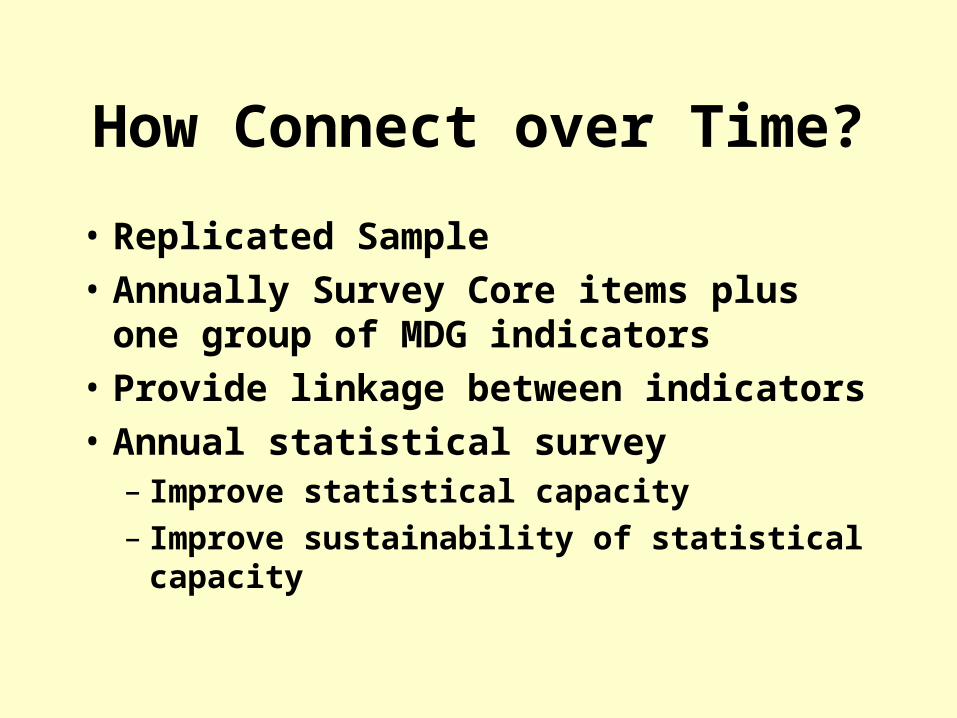
How Connect over Time?
• Replicated Sample
• Annually Survey Core items plus one group of MDG indicators
• Provide linkage between indicators
• Annual statistical survey– Improve statistical capacity– Improve sustainability of statistical capacity

Table 2. Description of distribution of sample replicates by year and detailed questionnaire to be used.Replicate
Rep Rep Rep Rep Rep Rep Rep Rep Rep Rep Rep Rep
1 2 3 4 5 6 7 8 9 10 11 12Year
1 A A A A A2 B B B B B3 C C C C C4 D D D D D5 A A A A A6 B B B B B7 C C C C C8 D D D D D9 A A A A
10 B B B11 C C12 D
Core everyYear plusa detailed Q
A.MDG 1B.MDG 2&3C.MDG 4,5&6D.MDG 7

Is this possible?
• Depends on the will of the international and national statistical organizations
• Depends on ability to agree and cooperate
• Depends on national statistical system to want to build sustainable statistical capacity.
Thanks for listening—questions ??????????