Integrating neural, fuzzy logic, and neuro-fuzzy ...
14
Bollettino di Geofisica Teorica ed Applicata Vol. 60, n. 4, pp. 569-582; December 2019 DOI 10.4430/bgta0281 569 Integrating neural, fuzzy logic, and neuro-fuzzy approaches using Ant Colony Optimisation for continuous domains to determine carbonate reservoir facies R. MOHEBIAN and M.A. RIAHI Department of Earth Physics, Institute of Geophysics, University of Tehran, Iran (Received: 23 November 2018; accepted: 7 May 2019) ABSTRACT It is a well-established fact that the determination of reservoir facies and zones with high-quality plays a pivotal role in reservoir modelling and future drilling in developing gas fields. As an index that varies in line with changes in the reservoir characteristics, Flow Zone Indicator (FZI) could be an influential factor in determining the reservoir facies. The present study attempts to propose a modern, improved model by combining intelligent systems to estimate the FZI cube in the entire oil/gas field. This Committee Machine Inference System (CMIS) integrates the predicted results obtained from the intelligent neural, fuzzy, and neuro-fuzzy systems with proper weights. Optimal weights for each method are predicted using Ant Colony Optimisation for Continuous Domains (ACOR). To apply the aforementioned approaches, well logs and seismic data were extracted from one of the gas fields in south of Iran. At the first stage, seismic attributes which establish a stronger correlation with the target data (FZI) were selected through the application of stepwise regression. Subsequently, a 3D FZI cube in the entire field was estimated. At the final step, various facies were delineated by means of Fuzzy C-Means clustering algorithm. The results illustrate that CMIS, which utilises ACOR, outperforms other single systems acting alone. Key words: reservoir facies, Flow Zone Indicator (FZI), Fuzzy C-Means (FCM) clustering, neuro-fuzzy systems, Ant Colony Optimisation for continuous domains (ACOR). © 2019 – OGS 1. Introduction What significantly contributes to the development of oil and gas fields in the analysis of the facies, is taking into consideration the relationship between the reservoir parameters and the seismic attributes. A glance over the literature suggests that investigating such an issue has enjoyed the close attention of researchers for a long time; to name but a few, Carr and Oliver (1996) depicted different parts of reservoir analysing seismic attributes in Caddo Conglomerate in the Boonsville (Bend Conglomerate) gas field. Michelena et al. (1998) benefited from self-organising maps with seismic attributes as the inputs to delineate the reservoir facies. Moreover, to produce seismic facies classes, Barnes (2000) combined a set of seismic attributes, including amplitude variance, spacing, parallelism, continuity, divergence, and hummockiness based on the descriptions of the seismic stratigraphic reflection patterns. Additionally, West et al. (2002) classified seismic facies of stack and AVO (Amplitude Versus Offset) data using the textural attributes and neural network.
Transcript of Integrating neural, fuzzy logic, and neuro-fuzzy ...
Bollettino di Geofisica Teorica ed Applicata Vol. 60, n. 4, pp. 569-582; December 2019
DOI 10.4430/bgta0281
569
Integrating neural, fuzzy logic, and neuro-fuzzy approaches using Ant Colony Optimisation for continuous domains to determine carbonate reservoir facies
R. Mohebian and M.a. Riahi
Department of Earth Physics, Institute of Geophysics, University of Tehran, Iran
(Received: 23 November 2018; accepted: 7 May 2019)
ABSTRACT It is a well-established fact that the determination of reservoir facies and zones with high-quality plays a pivotal role in reservoir modelling and future drilling in developing gas fields. As an index that varies in line with changes in the reservoir characteristics, Flow Zone Indicator (FZI) could be an influential factor in determining the reservoir facies. The present study attempts to propose a modern, improved model by combining intelligent systems to estimate the FZI cube in the entire oil/gas field. This Committee Machine Inference System (CMIS) integrates the predicted results obtained from the intelligent neural, fuzzy, and neuro-fuzzy systems with proper weights. Optimal weights for each method are predicted using Ant Colony Optimisation for Continuous Domains (ACOR). To apply the aforementioned approaches, well logs and seismic data were extracted from one of the gas fields in south of Iran. At the first stage, seismic attributes which establish a stronger correlation with the target data (FZI) were selected through the application of stepwise regression. Subsequently, a 3D FZI cube in the entire field was estimated. At the final step, various facies were delineated by means of Fuzzy C-Means clustering algorithm. The results illustrate that CMIS, which utilises ACOR, outperforms other single systems acting alone.
Key words: reservoir facies, Flow Zone Indicator (FZI), Fuzzy C-Means (FCM) clustering, neuro-fuzzy systems, Ant Colony Optimisation for continuous domains (ACOR).
© 2019 – OGS
1. Introduction
What significantly contributes to the development of oil and gas fields in the analysis of the facies, is taking into consideration the relationship between the reservoir parameters and the seismic attributes. A glance over the literature suggests that investigating such an issue has enjoyed the close attention of researchers for a long time; to name but a few, Carr and Oliver (1996) depicted different parts of reservoir analysing seismic attributes in Caddo Conglomerate in the Boonsville (Bend Conglomerate) gas field. Michelena et al. (1998) benefited from self-organising maps with seismic attributes as the inputs to delineate the reservoir facies. Moreover, to produce seismic facies classes, Barnes (2000) combined a set of seismic attributes, including amplitude variance, spacing, parallelism, continuity, divergence, and hummockiness based on the descriptions of the seismic stratigraphic reflection patterns. Additionally, West et al. (2002) classified seismic facies of stack and AVO (Amplitude Versus Offset) data using the textural attributes and neural network.
570
Boll. Geof. Teor. Appl., 60, 569-582 Mohebian and Riahi
Taner and Treitel (2004) used the instantaneous amplitude spectral information obtained from seismic sub-band analyses as the input of the Kohonen Self Organizing Map (SOM) neural networks to produce seismic lithology and facies map. Farzadi and Hesthammer (2007) integrated hierarchical classification facies technique and Principal Component Analysis (PCA) to classify seismic facies in the Meishrif gas bearing formation, southern Persian Gulf.
Furthermore, Harilal et al. (2008) interpreted massive buildups, buildups, and off-buildups by studying seismic stratigraphy and applying seismic attributes in the central graben within the Mumbai Basin of the west coast of India.
There is basically not a known relationship between seismic attributes and reservoir parameters; this can contribute to the increased uncertainty in the estimation of reservoir properties. In recent years, researchers have paid close attention to fuzzy approaches, which have proved to be appropriate to deal with the nature of system uncertainty and the human errors. In a fuzzy system, function membership and if-then rules are used to calculate the weight factors which are extracted from the nature of the input data. The results are combined and defuzzified, finally.
Amongst those researchers working in the central Iranian oilfield, Rastegarnia and Kadkhodaie (2013) followed the fuzzy rules and integrated the seismic attributes to estimate the reservoir parameters. What is more, Diogo and André (2013) benefited from fuzzy rules to recognise reservoir facies from well logs. Following them, also, Yarmohammadi et al. (2014) delineated high porosity and permeability zones using the seismic-derived Flow Zone Indicator (FZI) data at Shah Deniz sandstone packages.
In addition, the neuro-fuzzy approach, i.e. the improved version of the fuzzy algorithm, is one of the advanced algorithms which can be used to extract the reservoir facies. In this algorithm, fuzzy system parameters are optimised by the neural networks. Mohebian et al. (2017) used the neuro-fuzzy method to determine reservoir facies from well log and seismic attribute in an Iranian oil field. Their other research has shown the different application of this approach (Mohebian et al., 2018).
As a result, what will go under the close scrutiny in the current study is the individual operation of each system together with the integration of these systems in order to determine the facies in the form of a Committee Machine Inference System (CMIS). The CMIS, which is used to integrate different approaches, benefits from Ant Colony Optimisation algorithms. Such an algorithm was initially used for discrete space, however, it has recently undergone some changes and this has led to the development of Ant Colony Optimisation for Continuous Domains (ACOR) algorithm whose superior performance and robustness over other similar algorithms in this area is well-established (Socha and Dorigo, 2008).
The current study seeks to apply neural, fuzzy, and neuro-fuzzy systems and combine the obtained results using ACOR to analyse the reservoir facies. To do so, the aforementioned algorithms are applied to real data (i.e. one of the Iranian southern offshore gas fields) and the results are validated against the well log data. Moreover, the results obtained from the CMIS are compared with those of single approaches so as to shed light on its superior efficiency and robustness over others. Having extracted the FZI in the entire field by the CMIS, the reservoir facies are delineated by means of the Fuzzy C-Means (FCM) clustering algorithm and the results are compared with thin sections analyses.

Continuous domains to determine carbonate reservoir facies Boll. Geof. Teor. Appl., 60, 569-582
571
2. Methodology and procedure
The proposed methodology for this study consists of three stages. At the first stage, the optimum seismic attributes that correspond more strongly with the target data (FZI) are selected by a stepwise regression algorithm. Second, the intelligent approaches such as neural, fuzzy, and neuro-fuzzy systems are applied to the seismic attributes, and the achieved FZI cube is calculated for the entire field. Next, to combine the results obtained from the previous approaches, a CMIS will be employed using ACOR. At the final stage, the FCM algorithm is applied to the CMIS outputs and various facies are delineated.
2.1. Back Propagation Neural NetworkA Back Propagation Neural Network (BP-NN) is a supervised training technique. Back
propagation is shorthand for “the backward propagation of errors”, since an error is computed at the output and distributed backwards throughout the network’s layers. It is commonly used to train deep neural networks (Nielsen, 2015).
The error is propagated backwards through the net and the weights are adjusted through a number of iterations. The training ceases when the calculated output values best approximate the desired values (Bhatt and Helle, 2002). A flowchart of the training procedure in a supervised neural network is depicted in Fig. 1.
Fig. 1 - Flowchart of the training procedure in a supervised neural network (Matlab User’s Guide, 2004).
2.2. Fuzzy systemThe term fuzzy logic was first introduced by Zadeh (1965). Fuzzy logic uses the concept of
fuzzy sets to solve ill-posed problems.Fuzzy inference is the process of formulating a given input data to an output data using fuzzy
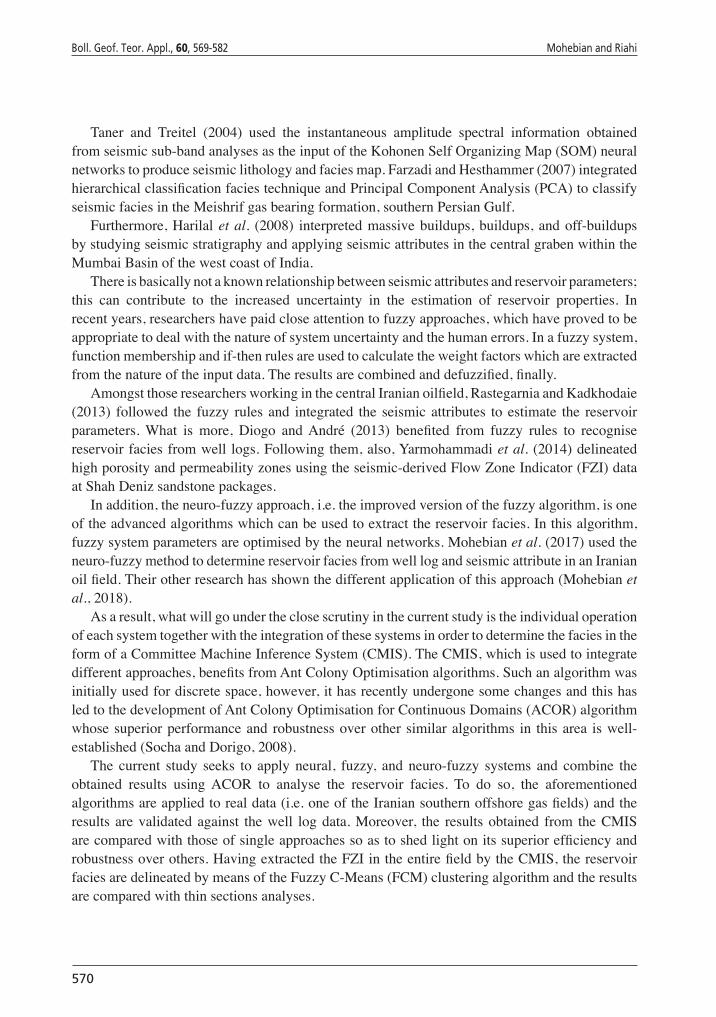
logic. There are three different types of fuzzy inference systems which are described in the works of Mamdani and Assilian (1975) and Sugeno (1985). These methods attempt to organise a system by synthesising a set of linguistic control rules obtained from experienced human operators. The Fuzzy Interference System (FIS) consists of three major parts, i.e. the Fuzzifier, the Inference Engine (fuzzy rule base), and the Defuzzifier (see Fig. 2).
572
Boll. Geof. Teor. Appl., 60, 569-582 Mohebian and Riahi
2.3. Neuro-fuzzy systemIn recent years, considerable attention has been devoted to the use of fuzzy logic and hybrid
neural network techniques. Neuro-fuzzy modelling is a technique for describing the behaviour of a system using a neural network structure in order to optimise fuzzy inference rules (Nikravesh et al., 2003). Applying a given output/input data set, Adaptive Neuro-Fuzzy Inference System (ANFIS) constructs a FIS whose membership functions (MF) parameters are tuned using a back propagation algorithm (Matlab User’s Guide, 2004).
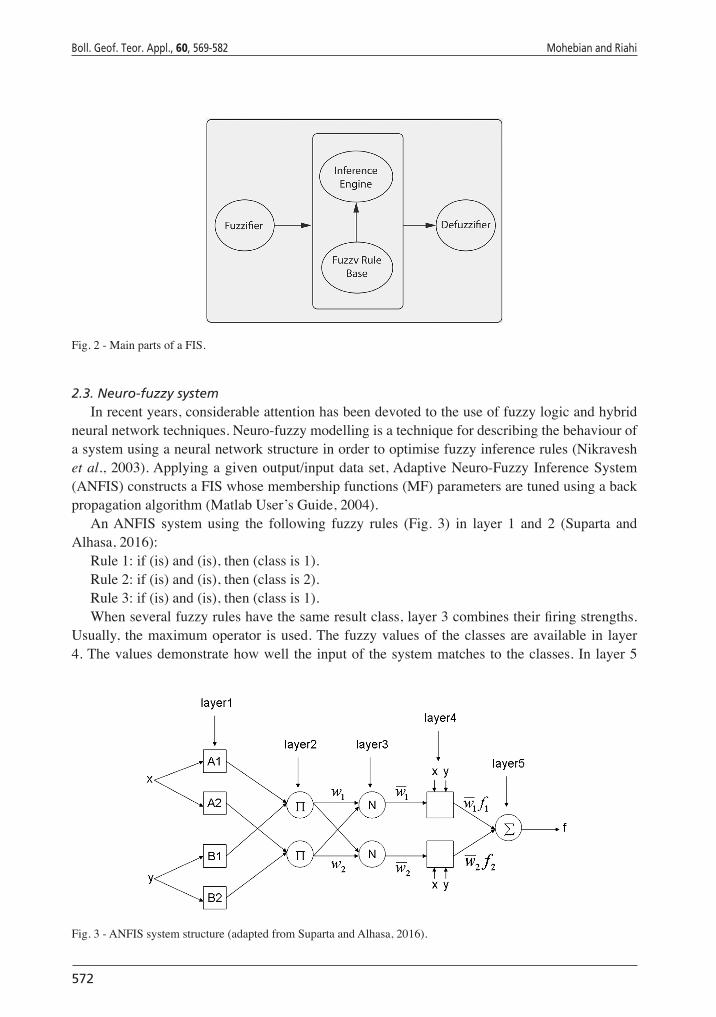
An ANFIS system using the following fuzzy rules (Fig. 3) in layer 1 and 2 (Suparta and Alhasa, 2016):
Rule 1: if (is) and (is), then (class is 1).Rule 2: if (is) and (is), then (class is 2).Rule 3: if (is) and (is), then (class is 1).When several fuzzy rules have the same result class, layer 3 combines their firing strengths.
Usually, the maximum operator is used. The fuzzy values of the classes are available in layer 4. The values demonstrate how well the input of the system matches to the classes. In layer 5
Fig. 2 - Main parts of a FIS.
Fig. 3 - ANFIS system structure (adapted from Suparta and Alhasa, 2016).
Continuous domains to determine carbonate reservoir facies Boll. Geof. Teor. Appl., 60, 569-582
573
the best-matching class for the input is chosen as output if the crisp classification is needed (i.e. defuzzification).
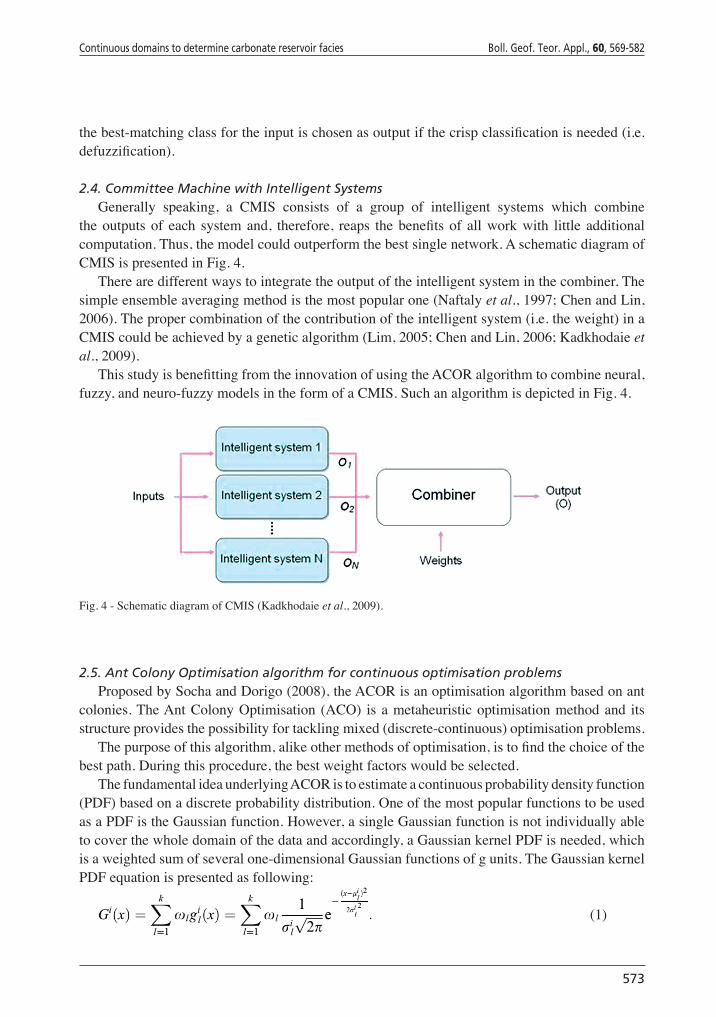
2.4. Committee Machine with Intelligent SystemsGenerally speaking, a CMIS consists of a group of intelligent systems which combine
the outputs of each system and, therefore, reaps the benefits of all work with little additional computation. Thus, the model could outperform the best single network. A schematic diagram of CMIS is presented in Fig. 4.
There are different ways to integrate the output of the intelligent system in the combiner. The simple ensemble averaging method is the most popular one (Naftaly et al., 1997; Chen and Lin, 2006). The proper combination of the contribution of the intelligent system (i.e. the weight) in a CMIS could be achieved by a genetic algorithm (Lim, 2005; Chen and Lin, 2006; Kadkhodaie et al., 2009).
This study is benefitting from the innovation of using the ACOR algorithm to combine neural, fuzzy, and neuro-fuzzy models in the form of a CMIS. Such an algorithm is depicted in Fig. 4.
Fig. 4 - Schematic diagram of CMIS (Kadkhodaie et al., 2009).
2.5. Ant Colony Optimisation algorithm for continuous optimisation problemsProposed by Socha and Dorigo (2008), the ACOR is an optimisation algorithm based on ant
colonies. The Ant Colony Optimisation (ACO) is a metaheuristic optimisation method and its structure provides the possibility for tackling mixed (discrete-continuous) optimisation problems.
The purpose of this algorithm, alike other methods of optimisation, is to find the choice of the best path. During this procedure, the best weight factors would be selected.
The fundamental idea underlying ACOR is to estimate a continuous probability density function (PDF) based on a discrete probability distribution. One of the most popular functions to be used as a PDF is the Gaussian function. However, a single Gaussian function is not individually able to cover the whole domain of the data and accordingly, a Gaussian kernel PDF is needed, which is a weighted sum of several one-dimensional Gaussian functions of g units. The Gaussian kernel PDF equation is presented as following:
(1)
574
Boll. Geof. Teor. Appl., 60, 569-582 Mohebian and Riahi
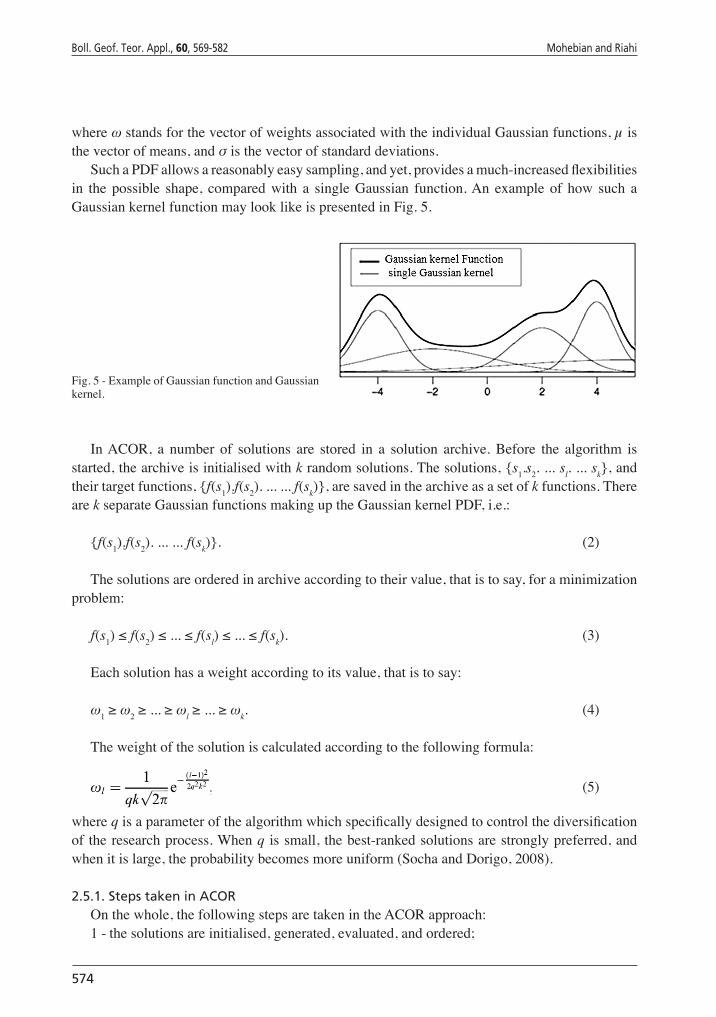
where ω stands for the vector of weights associated with the individual Gaussian functions, µ is the vector of means, and σ is the vector of standard deviations.
Such a PDF allows a reasonably easy sampling, and yet, provides a much-increased flexibilities in the possible shape, compared with a single Gaussian function. An example of how such a Gaussian kernel function may look like is presented in Fig. 5.
Fig. 5 - Example of Gaussian function and Gaussian kernel.
In ACOR, a number of solutions are stored in a solution archive. Before the algorithm is started, the archive is initialised with k random solutions. The solutions, {s1.s2. ... sl. ... sk}, and their target functions, {f (s1).f (s2). ... ... f (sk)}, are saved in the archive as a set of k functions. There are k separate Gaussian functions making up the Gaussian kernel PDF, i.e.:
{f (s1).f (s2). ... ... f (sk)}. (2) The solutions are ordered in archive according to their value, that is to say, for a minimization
problem:
f (s1) ≤ f (s2) ≤ ... ≤ f (sl) ≤ ... ≤ f (sk). (3)
Each solution has a weight according to its value, that is to say:
ω1 ≥ ω2 ≥ ... ≥ ωl ≥ ... ≥ ωk. (4)
The weight of the solution is calculated according to the following formula:
(5)
where q is a parameter of the algorithm which specifically designed to control the diversification of the research process. When q is small, the best-ranked solutions are strongly preferred, and when it is large, the probability becomes more uniform (Socha and Dorigo, 2008).
2.5.1. Steps taken in ACOROn the whole, the following steps are taken in the ACOR approach:1 - the solutions are initialised, generated, evaluated, and ordered;

Continuous domains to determine carbonate reservoir facies Boll. Geof. Teor. Appl., 60, 569-582
575
2 - weight factors and probabilities for each solution are computed;3 - a probabilistic model is generated for each solution;4 - each iteration of the algorithm and specific numbers of the random solutions are
probabilistically constructed:
X ~ G = (G1, ... ... . Gn);
5 - new and available solutions in the archive are integrated and ordered. Then, the worst solutions are removed from the archive;
6 - the best solutions are updated with the generated solutions;7 - if the final conditions are not met, the process is iterated from Step 3 onwards; otherwise,
the algorithm ends.
3. Application of methods on real data
The present study aims at determining reservoir facies by using ACOR as the CMIS. In so doing, 3D seismic data and well log data were extracted from 4 wells in one of the Iranian offshore gas fields, the Arab (Upper Surmeh) reservoir. Altogether, 400 data samples were used, 300 of which were used to construct the model and 100 to validate it. As aforementioned, at the first step, the stepwise regression algorithm was used to select the most optimal seismic attributes that establish stronger correlations with the target data (FZI). The results are displayed in Table 1. As it is evident from the table, by adding the 4th attributes the validation error starts to increase; this suggests that acoustic impedance, integrated absolute amplitude, and average frequency are optimal/improved attributes for this operation. It was done via the instrumentality of Hampson Russell Software (Russell, 2004).
Subsequently, neural, fuzzy, and neuro-fuzzy systems were provided with the selected seismic attributes as the input data, and the 3D FZI model for each approach was generated. The approaches were applied in Matlab Software.
3.1. Integration of approaches using CMIS (ACOR)Here, in order to combine the outputs obtained from neural, fuzzy, and neuro-fuzzy approaches,
a Committee machine is constructed using the ACOR algorithm. As a cumulative optimisation technique, the ACOR is able to compute the weights of every single approach to be used in the
Table 1 - The list of selected seismic attributes to estimate FZI.
Target Final Attributes Training Error Validation Error
1 Log(FZI) Inversion Result 1.205663 1.316607
2 Log(FZI)
Integrated Absolute 1.154679 1.297056
Amplitude
3 Log(FZI) Average Frequency 1.048055 1.247190
4 Log(FZI) Apparent Polarity 1.006541 1.533980
5 Log(FZI) Filter 45/50-55/60 0.791833 1.531778

576
Boll. Geof. Teor. Appl., 60, 569-582 Mohebian and Riahi
CMIS and obtain the final results by integrating the above-mentioned approaches with optimal weights.
In this study, the mean square error (MSE) is used as criteria for optimisation by the ACOR and is represented by:
(6)
Here, the MSE value for the CMIS model is calculated, where β1, β2, and β3 stand for weight factors corresponding to outputs from the neural, fuzzy, and neuro-fuzzy approaches, respectively. The Oi and Li are the target values, and k is the number of the test data (100 samples). A schematic representation of the FZI extraction using the Committee FIS (CFIS) is illustrated in Fig. 6.
Parameters used in the ACOR are explained as follows:1) the number of solution variables: 3;2) initial population size: 10;3) sample size: 50;4) intensification factor: 5;5) deviation-distance ratio: 1;6) highest number of iteration: 100.
Fig. 6 - The relationship between cost function and the number of iterations in ACOR.
Finally, the CFIS outputs for each neural, fuzzy, and neuro-fuzzy were calculated by weights predicted using the ACOR. The final estimation of the FZI from the obtained weights can be represented by the following equation:
FZICFIS = 0.15 × FZIPNN + 0.24 × FZIF + 0.61 × FZINf (7)
Fig. 7 schematically demonstrates steps to predict FZI from the seismic data by the CFIS.
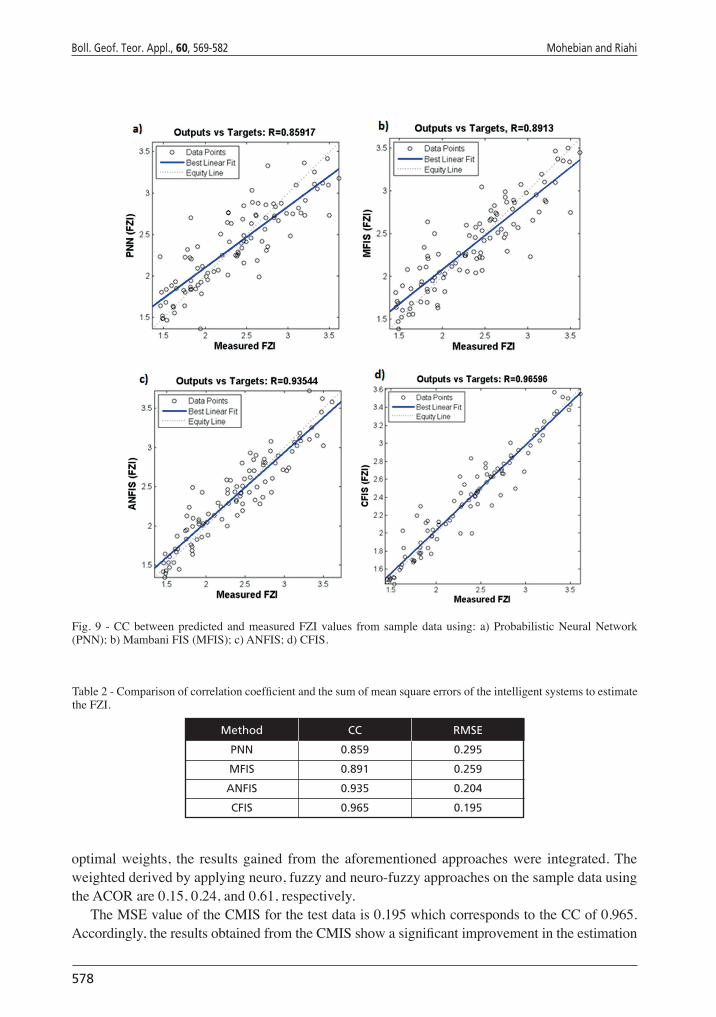
3.2. Results and discussionGraphical comparison and correlation coefficient (CC) between predicted and measured FZI
values using neural, fuzzy, and neuro-fuzzy approaches and the CMIS applied on the sample data are demonstrated in Figs. 8a to 8d and 9a to 9d, respectively.
Continuous domains to determine carbonate reservoir facies Boll. Geof. Teor. Appl., 60, 569-582
577
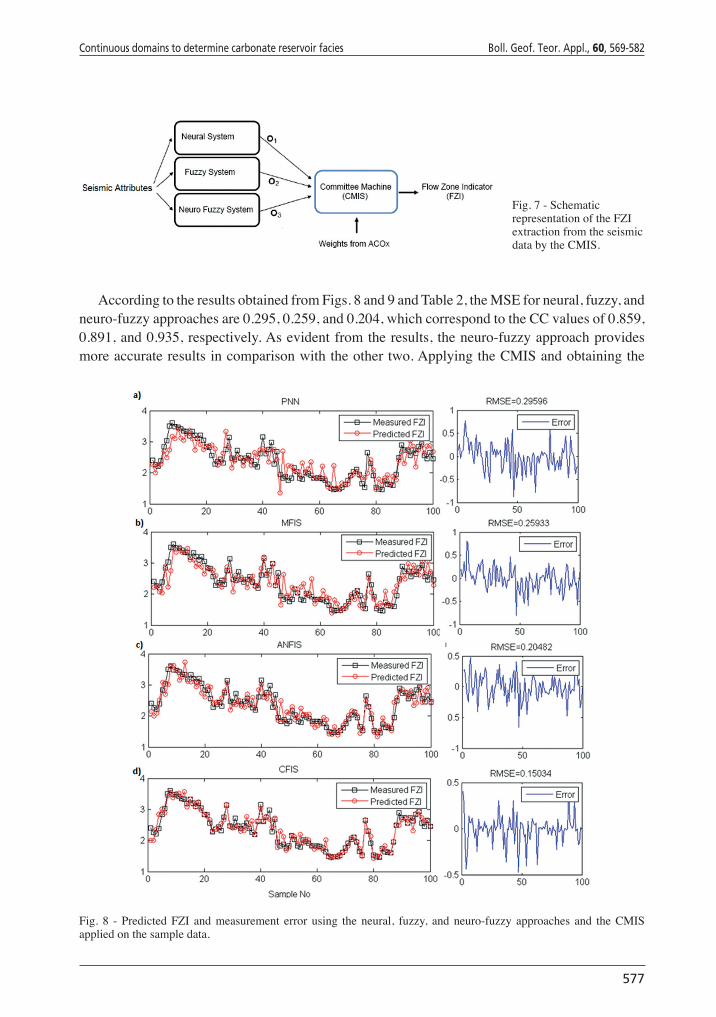
According to the results obtained from Figs. 8 and 9 and Table 2, the MSE for neural, fuzzy, and neuro-fuzzy approaches are 0.295, 0.259, and 0.204, which correspond to the CC values of 0.859, 0.891, and 0.935, respectively. As evident from the results, the neuro-fuzzy approach provides more accurate results in comparison with the other two. Applying the CMIS and obtaining the
Fig. 7 - Schematic representation of the FZI extraction from the seismic data by the CMIS.
Fig. 8 - Predicted FZI and measurement error using the neural, fuzzy, and neuro-fuzzy approaches and the CMIS applied on the sample data.
578
Boll. Geof. Teor. Appl., 60, 569-582 Mohebian and Riahi
optimal weights, the results gained from the aforementioned approaches were integrated. The weighted derived by applying neuro, fuzzy and neuro-fuzzy approaches on the sample data using the ACOR are 0.15, 0.24, and 0.61, respectively.
The MSE value of the CMIS for the test data is 0.195 which corresponds to the CC of 0.965. Accordingly, the results obtained from the CMIS show a significant improvement in the estimation
Fig. 9 - CC between predicted and measured FZI values from sample data using: a) Probabilistic Neural Network (PNN); b) Mambani FIS (MFIS); c) ANFIS; d) CFIS.
Table 2 - Comparison of correlation coefficient and the sum of mean square errors of the intelligent systems to estimate the FZI.
Method CC RMSE
PNN 0.859 0.295
MFIS 0.891 0.259
ANFIS 0.935 0.204
CFIS 0.965 0.195

Continuous domains to determine carbonate reservoir facies Boll. Geof. Teor. Appl., 60, 569-582
579
Fig. 10 - Maps showing the FZI obtained from CMIS: a) inline number 25; b) time-slice from 674 ms.
And finally, in order to delineate the reservoir facies from the 3D FZI cube produced in the previous stage, the FCM technique was applied. Specifying the optimal numbers of clusters is an important factor to be considered in using the FCM clustering algorithm. In the current study, a cumulative density plot for the FZI value was established to obtain the optimal numbers of Hydraulic Flow Units (HFUs). This cumulative density plot for the test data is displayed in Fig. 11 according to which 6 HFUs are recognised. These HFUs suggest 6 separate facies in Surmeh (Arab) reservoir estimated from the cumulative density plot:
of the FZI from the seismic attributes. The CMIS turns out to be far more efficient than other individual systems. After confirming the efficiency of the committee machine by using ACOR, such an approach was applied in converting 3D seismic data to the FZI cube in Surmeh (Arab) reservoir. Maps showing the FZI values for this approach in various directions are depicted in Fig. 10.
Fig. 11 - Cumulative density plot for the FZI value based on which 6 HFUs were recognised.
580
Boll. Geof. Teor. Appl., 60, 569-582 Mohebian and Riahi
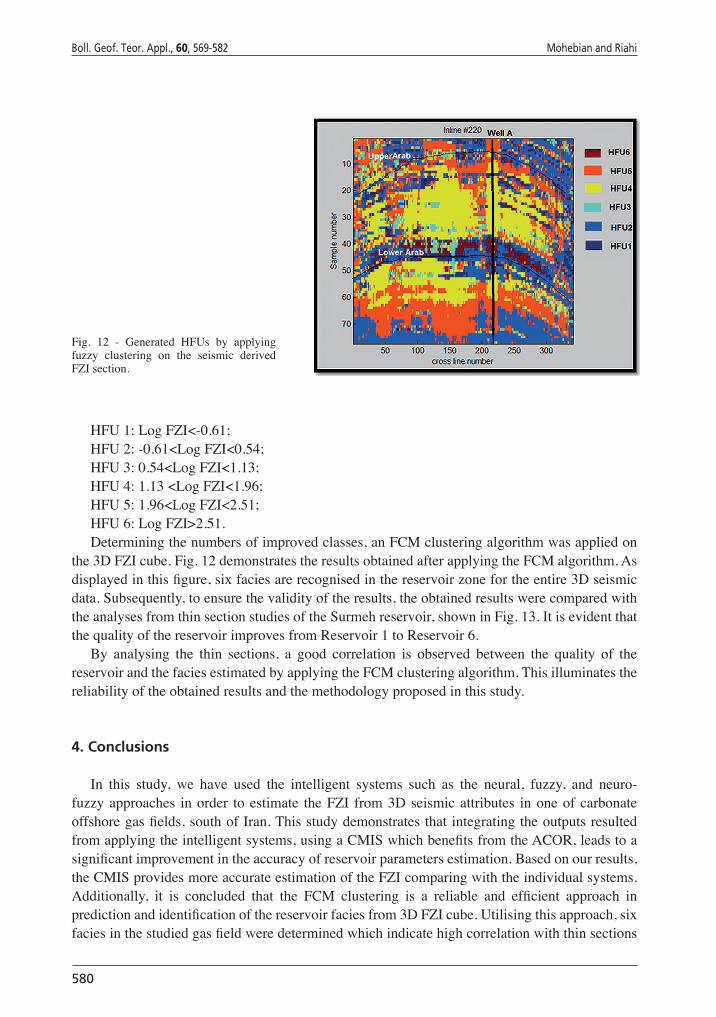
HFU 1: Log FZI<-0.61;HFU 2: -0.61<Log FZI<0.54;HFU 3: 0.54<Log FZI<1.13;HFU 4: 1.13 <Log FZI<1.96;HFU 5: 1.96<Log FZI<2.51;HFU 6: Log FZI>2.51.Determining the numbers of improved classes, an FCM clustering algorithm was applied on
the 3D FZI cube. Fig. 12 demonstrates the results obtained after applying the FCM algorithm. As displayed in this figure, six facies are recognised in the reservoir zone for the entire 3D seismic data. Subsequently, to ensure the validity of the results, the obtained results were compared with the analyses from thin section studies of the Surmeh reservoir, shown in Fig. 13. It is evident that the quality of the reservoir improves from Reservoir 1 to Reservoir 6.
By analysing the thin sections, a good correlation is observed between the quality of the reservoir and the facies estimated by applying the FCM clustering algorithm. This illuminates the reliability of the obtained results and the methodology proposed in this study.
4. Conclusions
In this study, we have used the intelligent systems such as the neural, fuzzy, and neuro-fuzzy approaches in order to estimate the FZI from 3D seismic attributes in one of carbonate offshore gas fields, south of Iran. This study demonstrates that integrating the outputs resulted from applying the intelligent systems, using a CMIS which benefits from the ACOR, leads to a significant improvement in the accuracy of reservoir parameters estimation. Based on our results, the CMIS provides more accurate estimation of the FZI comparing with the individual systems. Additionally, it is concluded that the FCM clustering is a reliable and efficient approach in prediction and identification of the reservoir facies from 3D FZI cube. Utilising this approach, six facies in the studied gas field were determined which indicate high correlation with thin sections
Fig. 12 - Generated HFUs by applying fuzzy clustering on the seismic derived FZI section.

Continuous domains to determine carbonate reservoir facies Boll. Geof. Teor. Appl., 60, 569-582
581
analyses. It is concluded that the proposed methodology in this study, which benefits from the integration of the results achieved by applying the CMIS and FCM clustering algorithms, can be utilised as a reliable and efficient approach for reservoir facies delineation.
Acknowledgements. The authors acknowledge the research council of the University of Tehran. This research did not receive any specific grant from funding agencies in the public, commercial, or not-for-profit sectors.
REFERENCES
Barnes A.; 2000: Attributes for automating seismic facies analysis. SEG Technical Program, Expanded Abstracts, 19, pp. 553-556, doi: 10.1190/1.1816121.
Bhatt A. and Helle H.B.; 2002: Committee neural networks for porosity and permeability prediction from well logs. Geophys. Prospect., 50, 645-660.
Carr D.L. and Oliver K.L.; 1996: Surface-bounded reservoir compartmentalization in the Caddo Conglomerate, Boonsville (Bend Conglomerate) Gas Field, Fort Worth Basin, Texas. In: Abstract, Annual Convention Program, American Association of Petroleum Geologists and the Society for Sedimentary Geology: Global Exploration and Geotechnology, San Diego, CA, USA, vol. 5.
Fig. 13 - Representative photomicrographs of the HFUs identified in the Arab Formation, south of Iran: a) HFU1: anhydrite; b) HFU2: stromatolite boundstone (Dolomitic); c) HFU3: Dolomitic mudstone with evaporite clasts; d) HFU4: bioclastic wackestone to packstone (Dolomitic); e) HFU5: Dolomitised ooid/peloid packstone to grainstone; f) HFU6: Dolomitised bioclast/peloid grainstone.
582
Boll. Geof. Teor. Appl., 60, 569-582 Mohebian and Riahi
Chen C.H. and Lin Z.S.; 2006: A committee machine with empirical formulas for permeability prediction. Comput. Geosci., 32, 485-496.
Diogo M.R.L. and André A.; 2013: Facies identification by Fuzzy Inference. In: Proc., 13th International Congress of the Brazilian Geophysical Society & EXPOGEF, Rio de Janeiro, Brazil, pp. 11-16, doi: 10.1190/sbgf2013-003.
Farzadi P. and Hesthammer J.; 2007: Diagnosis of the Upper Cretaceous palaeokarst and turbidite systems from the Iranian Persian Gulf using volume-based multiple seismic attribute analysis and pattern recognition. Pet. Geosci., 13, 227-240.
Harilal S.K., Biswal A. and Rangachari V.; 2008: Identification of reservoir facies within a carbonateand mixed carbonate-siliciclastic sequence: application of seismic stratigraphy, seismic attributes, and 3D visualization. The Leading Edge, 27, 18-29, doi: 10.1190/1.2831675.
Kadkhodaie A., Rahimpour-Bonab H. and Rezaee M.R.; 2009: A committee machine with intelligent systems for estimation of total organic carbon content from petrophysical data: an example from the Kangan and Dalan reservoirs in South Pars gas field, Iran. Comput. Geosci., 35, 459-474.
Lim J.S.; 2005: Reservoir properties determination using fuzzy logic and neural networks from well data in offshore Korea. J. Pet. Sci. Eng., 49, 182-192.
Mamdani E.H. and Assilian S.; 1975: An experiment in linguistic synthesis with a fuzzy logic controller. Int. J. Man Mach. Stud., 7, 1-13.
Matlab User’s Guide; 2004: Matlab CD-Room. The MathWorks, Natick, MA, USA.Michelena R.J., Gonzalez E. and Capello P.M.; 1998: Similarity analysis: a new tool to summarize seismic attributes
information. The Leading Edge, 17, 545-548.Mohebian R., Riahi M.A. and Kadkhodaie A.; 2017: Characterization of hydraulic flow units from seismic attributes
and well data based on a new fuzzy procedure using ANFIS and FCM algorithms, example from an Iranian carbonate reservoir. Carbonates and Evaporites, Online First Articles, 10 pp., doi: 10.1007/s13146-017-0393-y.
Mohebian R., Riahi M.A. and Afjeh M.; 2018: Detection of gas bearing zone in a carbonate reservoir using multi-class relevance vector machines (RVM), compare its performance to SVM and PNN. Carbonates and Evaporites, 33, 347-357, doi: 10.1007/s13146-017-0411-0.
Naftaly U., Intrator N. and Horn D.; 1997: Optimal ensemble averaging of neural networks. Comput. Neural Syst., 8, 283-296.
Nielsen M.A.; 2015: “Chapter 6 (Deep learning)”. Neural Networks and Deep Learning, Determination Press, USA, pp. 167-210.
Nikravesh M., Aminzadeh F. and Zadeh L.A. (eds); 2003: Soft computing and intelligent data analysis in oil exploration. Part 1: introduction: fundamentals of soft computing. Elsevier Science, Amsterdam, The Netherlands, 744 pp.
Rastegarnia M. and Kadkhodaie A.; 2013: Estimation of flow zone indicator distribution by using seismic data: a case study from a central Iranian oilfield. Iran. J. Oil Gas Sci. Tech. (IJOGST), 2, 12-25.
Russell B.H.; 2004: The application of multivariate statistics and neural networks to the prediction of reservoir parameters using seismic attributes. Ph.D. Thesis in Philosophy, University of Calgary, Alberta, Canada, 392 pp.
Socha K. and Dorigo M.; 2008: Ant colony optimisation for continuous domains. Eur. J. Oper. Res., 185, 1155-1173.Sugeno M.; 1985: Industrial applications of fuzzy control. Elsevier Science, Amsterdam, The Netherlands, 277 pp.Suparta W. and Alhasa K.M.; 2016: Modeling of tropospheric delays using ANFIS. Springer International Publishing,
Berlin, Germany, 125 pp., doi: 10.1007/978-3-319-28437-8.Taner M.T. and Treitel S.; 2004: Harmonic attributes. In: Expanded Abstracts, 74th Annual Meeting SEG, Denver, CO,
USA, pp. 1547-1550, doi: 10.1190/1.1845137.West B., May S., Eastwood J. and Rossen C.; 2002: Interactive seismic facies classification of stack and AVO data using
textural attributes and neural networks. The Leading Edge, 21, 1042-1049, doi: 10.1190/1.1518444.Yarmohammadi S., Kadkhodaie-Ilkhchi A., Rahimpor H.R. and Shirzadi A.; 2014: Seismic reservoir characterization
of a deep water sandstone reservoir using hydraulic and electrical flow units: a case study from the Shah Deniz gas field, the south Caspian Sea. J. Pet. Sci. Eng., 118, 52-60.
Zadeh L.; 1965: Fuzzy sets. Inf. Control., 8, 338-353.
Corresponding author: Mohammad Ali Riahi Department of Earth Physics, Institute of Geophysics, University of Tehran Tehran, Iran Phone: +98 21 61118219; e-mail: [email protected]