Integrating large scale seawater desalination plants ...
19
Desalination xxx (2007) 1–18 Presented at the conference on Desalination and the Environment. Sponsored by the European Desalination Society and Center for Research and Technology Hellas (CERTH), Sani Resort, Halkidiki, Greece, April 22–25, 2007. 0011-9164/06/$– See front matter © 2006 Elsevier B.V. All rights reserved. doi:10.1016/j.desal.0000.00.000 Integrating large scale seawater desalination plants within Israel’s water supply system Y. Dreizin a , A. Tenne a , D. Hoffman b * a Desalination Division, Israel Water Commission b ADAN Technical & Economic Services Ltd., Tel Aviv, Israel email: [email protected] Received 10 January 2007; accepted 13 January 2007 Abstract The paper lists and reviews the issues, considerations and factors that faced planners in Israel in introducing large scale seawater desalination plants within the national and regional water supply systems. Most importantly, the paper quantifies the cost and benefit consequences of these factors, thereby establishing their relative weight, importance and significance. Cost consequences relate not only to the effect each factor had on desalinated water costs at their inlets to the national or regional water supply grids, but also to its effect on overall investments and operating costs related to expanding the entire water supply system to meet projected increases in demand, including seasonal, multi-seasonal and local storage capacities, distribution line sizes, pumping energy requirements, etc., and to dealing with deteriorating groundwater quality, including rehabilitation of salinized and/or contaminated wells, etc. Benefits included factors such as potable water supply reliability and quality enhancement, expanded and environmentally safer water reuse potential, etc. As will be shown, the challenge was to create a master plan which accounts for all these factors and optimizes their overall cost-benefit ratio both short and long term. Keywords: 1. Introduction These days, as I speak to you, Israel’s second large seawater desalination plant, a 30 million m 3 /year SWRO plant, is being put into operation in Palmachim. This plant’s output, together with the output of the 100 million m 3 /year Ashkelon plant, which started operating in 2005, will raise Israel’s total seawater desalination capacity to 130 million m 3 /year, which are about 8% of the country’s total potable water resources. By 2010 desalination capacity will reach 315 million m 3 /year, or about 17% of total potable water supply. By 2020 we expect these figures to rise to 650 million m 3 /year and 30%, respectively. This growing dependency on seawater desali- nation, not only for meeting projected shortfalls due to increased demand, but also for improving drinking water quality, to counter the continuous deterioration in groundwater quality, had been *Corresponding author. GRCE0035.fm Page 1 Thursday, April 19, 2007 1:55 PM
Transcript of Integrating large scale seawater desalination plants ...

Desalination xxx (2007) 1–18
Presented at the conference on Desalination and the Environment. Sponsored by the European Desalination Societyand Center for Research and Technology Hellas (CERTH), Sani Resort, Halkidiki, Greece, April 22–25, 2007.
0011-9164/06/$– See front matter © 2006 Elsevier B.V. All rights reserved.doi:10.1016/j.desal.0000.00.000
Integrating large scale seawater desalination plants within Israel’s water supply system
Y. Dreizina, A. Tennea, D. Hoffmanb* aDesalination Division, Israel Water Commission
bADAN Technical & Economic Services Ltd., Tel Aviv, Israelemail: [email protected]
Received 10 January 2007; accepted 13 January 2007
Abstract
The paper lists and reviews the issues, considerations and factors that faced planners in Israel in introducinglarge scale seawater desalination plants within the national and regional water supply systems. Most importantly,the paper quantifies the cost and benefit consequences of these factors, thereby establishing their relative weight,importance and significance. Cost consequences relate not only to the effect each factor had on desalinated watercosts at their inlets to the national or regional water supply grids, but also to its effect on overall investments andoperating costs related to expanding the entire water supply system to meet projected increases in demand, includingseasonal, multi-seasonal and local storage capacities, distribution line sizes, pumping energy requirements, etc.,and to dealing with deteriorating groundwater quality, including rehabilitation of salinized and/or contaminatedwells, etc. Benefits included factors such as potable water supply reliability and quality enhancement, expandedand environmentally safer water reuse potential, etc. As will be shown, the challenge was to create a master planwhich accounts for all these factors and optimizes their overall cost-benefit ratio both short and long term.
Keywords:
1. Introduction
These days, as I speak to you, Israel’s secondlarge seawater desalination plant, a 30 millionm3/year SWRO plant, is being put into operationin Palmachim. This plant’s output, together withthe output of the 100 million m3/year Ashkelonplant, which started operating in 2005, will raiseIsrael’s total seawater desalination capacity to
130 million m3/year, which are about 8% of thecountry’s total potable water resources. By 2010desalination capacity will reach 315 millionm3/year, or about 17% of total potable watersupply. By 2020 we expect these figures to riseto 650 million m3/year and 30%, respectively.
This growing dependency on seawater desali-nation, not only for meeting projected shortfallsdue to increased demand, but also for improvingdrinking water quality, to counter the continuousdeterioration in groundwater quality, had been*Corresponding author.
GRCE0035.fm Page 1 Thursday, April 19, 2007 1:55 PM

2 Y. Dreizin et al. / Desalination xxx (2007) 1–18
forecast already fifty years ago, in the late 1950’s.The government’s response at the time was longrange — to sponsor and support R&D in novelcost reducing desalination processes which couldserve the country’s needs in the future. A widerange of technologies was investigated, supportedby budgets that, though modest in absolute termscompared to other national efforts, were probablythe highest, world-wide, as a percent of the grossnational product or overall annual governmentbudget.
The original and unique processes and designsgenerated by these government sponsored effortsare familiar to all the veteran desalination experts.They include vacuum freezing - vapor compres-sion (VFVC), also known as the Zarchin Process,secondary refrigerant freeze desalination (SRFD),low temperature mechanical vapor compression(LT-MVC), low-temperature thermal vapor com-pression (LT-TVC) and low-temperature multi-effect distillation (LT-MED). Hundreds of theseenergy-efficient and reliable seawater desalinationplants were sold over the years throughout theworld, wherever markets were politically open toIsraeli exports.
In Israel itself, however, desalination waslimited for many years to relatively small brack-ish water reverse osmosis desalination plantsserving remote settlements in the southern, aridArava area not reached by the national watersupply grid. The largest of these plants was builtin Eilat, at the northern tip of the Red Sea’s Gulfof Aqaba and, after gradual expansion, producestoday 45,000 m3/day from brackish water sourcesand 10,000 m3/day from seawater. Elsewhere inthe country, water conservation measures, thetransport of Sea of Galilee water from the northvia the National water carrier (NWC), expandedutilization of local aquifers through a growingweb of wells and the effective distribution ofthese blended surface and ground waters to allconsumers through regional grids that includedredundant loops to ensure reliability, combinedwith increased agricultural water use efficiency
and the partial shifting of agricultural irrigationto recycled treated wastewater, succeeded in put-ting off the need for seawater desalination.
By the mid-1990s, however, after severalmulti-year cycles of drought and over-pumpingof natural water reservoirs, it became clear to theIsraeli Water Commission (IWC), which isthe official government agency charged withnational water resources, that all lower cost alter-natives have been exhausted and the time hascome to start introducing and integrating largescale seawater desalination plants into the country’swater supply system. The task of planning andmanaging the implementation of this mega-scaledesalination program was assigned to the IWC’sPlanning Division. To assist it, the Planning Divi-sion contracted the services of ADAN Technical& Economic Services Ltd., a Tel Aviv consult-ing company which specializes in desalination,water and wastewater treatment, energy and theenvironment.
The issues, considerations and factors thatfaced this planning team, their costs, benefits, rela-tive importance, significance and effect on thelong range desalination master plan (DMP) thatwas subsequently drawn, the DMP’s implementa-tion process and its current status are the topicsof this paper. They are presented and discussedwithin the following outline: • the IWC’s overall goal • the DMP planning methodology • the key planning issues • factors and considerations relating to each
planning issue • resultant planning figures and DMP details • the DMP’s implementation • status of ongoing projects and current plans • summary and closing comments
2. The IWC’s overall goal
The goal of the IWC was to assure that desali-nated water will be available, reliably and at lowestcost, in the quantities, locations, quality and
GRCE0035.fm Page 2 Thursday, April 19, 2007 1:55 PM

Y. Dreizin et al. / Desalination xxx (2007) 1–18 3
schedule required to meet the projected gapsbetween supply and demand and compensatefor the continuing deterioration in groundwaterquality.
3. The DMP planning methodology
Studies pertaining to the preparation of theDMP were initiated in 1996 [1]. The earliestoutline of the DMP was completed in 1997[2]. The methodology used in preparing theDMP was: • The first step was to estimate the desalinated
water needs throughout the planning horizonand establish the optimal sizes and distributionof plants that will satisfy the total requirementat the end of this planning period. The objec-tive was to derive, before-hand, the layout ofplants that will have the best desalinated watercost-benefit ratio for the eventual total desali-nated water production capacity, and use thislayout as the target and guide in planning thestep-by-step buildup of this capacity.
• A 20 year planning horizon was selected. • Three water demand development scenarios
were examined. The most probable scenariowas selected for planning the final, optimallayout of plants.
• Potential desalination plant sites along Israel’sMediterranean Sea coast were identified,examined, rated and ranked by order of pref-erence according to the criteria described inSection 5.2.
• The minimal and maximal desalination plantcapacities at each site were established onthe basis of the considerations described inSection 5.3.
• Optimal desalinated water quality was estab-lished, as described in Section 6.4.
• The costs that were examined and minimizedwere not only the costs of producing the desali-nated water and delivering it to the nationaland/or regional water supply grids, but also all
other investments and operating costs relatedto expanding the entire water supply system tomeet the projected demands, including sea-sonal, multi-seasonal and local storage capaci-ties, downstream distribution lines, pumpingenergy requirements, etc. Thus, potentialsavings and/or postponement of investmentsin some of this infrastructure, external to thedesalination plants’ “black boxes” or “islands”,also played a role in establishing the desalina-tion plants’ distribution, sizes and installationschedules.
• The benefits examined and maximized relatednot only to the incomes generated by increased(or non-curtailed) water-consuming economicactivities and productivity, but also benefitsderived by all sectors from the resultantimprovement in overall water supply quality.
• The final step, once the desired final layout ofplants was established, was to plan the step bystep program, the “road-map”, for achievingthis layout. The program was flexible, gearedto supplying the needs as they actually devel-oped, i.e. the time scale for each plant instal-lation could differ from the plan, but the endresult would still be the same.
4. The key planning issues
The key issues in the planning process were,therefore, to determine: (1) the desalinated water requirements through-
out the planning horizon; (2) the optimal geographic distribution of the total
desalination capacity required at the end ofthe planning horizon;
(3) the minimal and maximum capacities appli-cable at each geographic location;
(4) the optimal desalinated water quality, cost-benefit wise;
(5) the preferred desalination process(es); (6) the optimal desalination plants’ installation
schedule.
GRCE0035.fm Page 3 Thursday, April 19, 2007 1:55 PM

4 Y. Dreizin et al. / Desalination xxx (2007) 1–18
5. Factors and considerations relating to each planning issue
5.1. Total desalinated water requirements
The factors relevant to this determinationwere: • Total projected water supply capacities from
all sources and at all qualities, including brack-ish water, flood water catchments, wastewaterreuse, etc.;
• Domestic water demand, based on projectedpopulation and per capita demand growth rates;
• Industrial water demand, including use, wherepossible, of brackish and treated wastewater;
• Agricultural allocations, including treatedmunicipal wastewater and, where possible,brackish water;
• Demand by other users, e.g. nature conserva-tion, aquifer rehabilitation and neighboringentities.
The three different water demand developmentscenarios were mainly a result of: • different assumptions for population growth
rates — between 1.7 and 3.5% per year; • different assumptions for domestic per capita
demand growth and growth rate — between107 and 120 m3/year/capita;
• different values for the amounts of wastewateravailable for reuse — between 50 and 70%of total municipal water supply;
• different allotments of potable water to agricul-ture — between 400 and 600 million m3/year.
Desalinated water requirements were estab-lished on the basis of the amounts required tomake up for the growing gap between supplyand demand, so as to assure a 90% water supplyreliability goal to all consumer sectors.
The available water supply sources, the pro-jected demands of various consumer groups andthe desalinated seawater capacities for the mostprobable scenario which served as the basis forthe DMP are shown in Section 6.1.
5.2. Geographic distribution of desalination plants
The main facts and considerations relevant toplanning the geographic distribution of the desali-nation plants were: • Israel’s main population and industrial centers,
which require high quality water and whosesteady growth in demand is the driving forcebehind the country’s developing water short-ages, are spread out along the MediterraneanSea coast, i.e. relatively close to potentialdesalination plants’ sites.
• So are the country’s main power generationplants, which utilize the seawater as coolantand have the potential to share existing infra-structures and services with the desalinationplants (seawater intake, brine disposal line,workshops and service facilities, securityarrangements, etc.) and, most importantly,low cost energy. It should be noted that at thetime the DMP was initially drawn thermaldesalination technologies were predominantand the ability to utilize low grade steam thatcould be cogenerated in these power stationswas deemed highly important.
• Israel has interconnected and integratednational and regional water supply systems,i.e. water shortages and needs are not local.Local needs can be supplied through thesegrids from a variety of sources at a variety ofqualities. This means that only large blocs ofwater are relevant to national planning andthese can be supplied through a relatively smallnumber of large mega-plants, each enjoyingeconomies of scale (the capacity at each plant,however, can be developed gradually, in incre-mental phases).
• Israel’s power stations are, similarly, largeand few and connected by a national grid. Theyare mostly sufficiently removed from nearbycities so that they have the added benefits ofrelatively low land costs and easier environ-mental permitting.
GRCE0035.fm Page 4 Thursday, April 19, 2007 1:55 PM

Y. Dreizin et al. / Desalination xxx (2007) 1–18 5
• The skeleton of the integrated water supplysystem is the National Water Carrier (seemap in Fig. 1), which delivers Sea of Galileewater, blended along the way with inputsfrom various underground water sources, tothe arid south. Tying directly into the NWCwill enable the desalination plants to operatecontinuously at their nominal capacities, withonly minimal investments in on-site opera-tional storage, and, if the points where thiswater is introduced into the NWC are chosenproperly, it will be possible to use its fullexisting delivery and distribution capabilitiesefficiently, postponing the need to invest inenlarging its main trunk and/or adding down-stream delivery lines. Lowest desalinated watercosts require such continuous plant operation,to minimize the desalinated water’s fixed costcomponent. The NWC’s water flow will thenbe adjusted to meet demand only by varyingits inputs from its various natural watersupply sources — the Sea of Galilee and theaquifers becoming, essentially, the system’scapacitance.
• The most favorable points for tying into theNWC with large blocs of water are its existingpumping stations and operational reservoirs.The capacities that the NWC could absorb atthese potential junction points throughoutthe planning period were, therefore, a keyconsideration.
The above noted facts guided the selection ofa series of locations alongside or near existingpower stations and other utilities that could alsoshare infrastructures and services. These locationswere examined and rated on the basis of: • Their actual distance to the nearest potential
NWC junction point and the type and owner-ship of properties through which the inter-connecting lines would have to cross, i.e.estimated product delivery costs;
• Their actual proximity to the power stationsand other utilities and their available infra-structures and services, i.e. estimated poten-tial savings in the desalination plants’ owninfrastructures;
• Their proximity to the major coastal urbancenters, whose water supply quality would beimproved most by the plants’ product, i.e.maximizing the benefits from such water qual-ity improvement (see Section 5.4);
• Their distance downstream from the NWC’snorthern pumping station i.e. maximizing thesavings in energy currently consumed topump the Sea of Galilee water southward;
• Their distance from existing sources ofseawater contamination (e.g. Haifa bay) orpotential sources for such contamination(e.g. oil spills, wastewater and floodwaterdischarges);
• The availability of specific plots within theselocations with: (1) sufficient area, including reserves for
future expansions; (2) minimal land use and other statutory
permitting problems, including the need
??????
Hadera
Ashdod
Shomrat
Schafdan
Ashkelon
Netanya National Water Carrier (NWC)
Sea of GalileeHaifa
Jerusalem
Tel Aviv
Gaza
Population centers
Desalination plant sites
Fig. 1. DMP selected plants locations.
GRCE0035.fm Page 5 Thursday, April 19, 2007 1:55 PM

6 Y. Dreizin et al. / Desalination xxx (2007) 1–18
for archeological rescue excavations, envi-ronmental constraints, etc.;
(3) reasonable land purchase or leasing costs; (4) reasonable accessibility (no need to invest
in lengthy access roads); (5) reasonable distances to the sea and poten-
tial seawater intake sites; (6) minimal need for arranging and/or paying
for rights of way for seawater supply, brinedisposal and product delivery pipelinesthrough private properties.
The ranking of these potential plant locationsby order of preference was then determined onthe basis of the actual cost-benefit ratio of eachsite (see Section 6.2).
5.3. Minimal and maximal capacities at each geographic location
The maximal capacities of plants at each poten-tial location were determined on the basis of: • The maximum desalinated water absorption
capacity of the NWC and or regional grid attheir projected input junction points;
• Site area limitations, if any;
The minimal capacities of plants at eachpotential location were determined on thebasis of: • The economies of scale of the potentially
acceptable desalination processes — too smallan initial capacity would be uneconomical andcould eliminate some processes (e.g. thermaldistillation plants, that have better economiesof scale than membrane processes) and/orbeneficial schemes (e.g. hybrid thermal andmembrane plants);
• The economics of starting with a smallerplant and expanding plant capacity in phases,according to actual growth in demand, therebybenefiting from postponed investments,vis-à-vis over-sizing and benefiting frominitial economies of scale.
5.4. Desalinated water quality
It was foreseen that the blending of highquality desalinated water with NWC water couldsignificantly reduce the TDS, chloride and sodiumconcentrations in the regional water supplies,and most importantly their hardness and nitratelevels, thereby providing distinct benefits to allthe water consuming sectors: • Domestic consumers will benefit from the
softened water supply through (a) reducedscaling and extended lifetimes of electric andsolar water heaters and piping, particularly hotwater piping; (b) savings in soap and deter-gents, ion-exchange softening resins andregeneration salts; (c) avoiding dried spotson dishes; and (d) softer and cleaner launderedclothes.
• Industrial consumers will save on their watersoftening and demineralization costs (1/3 ofall the water used by Israeli industry is cur-rently softened) and particularly on the highcosts of disposing spent ion exchange regen-eration solutions to approved sites (dischargeto sewers is forbidden by law), on heatexchanger, hot water pipes and other equip-ment maintenance costs, and on coolingtowers inhibitor costs.
• The agricultural sector will benefit from thelower salinity municipal water supply since itwill reduce the chloride and sodium levels inthe municipal wastewater which is destinedto be reused for irrigation. This will avoiddamaging crops and soils and wastewaterusage could be reduced by 15–20% fromcurrent requirements, which include such anexcess in order to rinse salt concentrationsfrom the crops’ root zones.
The low nitrate levels will enable, throughblending, the use of high nitrate well water. Thesewells would otherwise require nitrate removal byelectro-dialysis (ED), ion exchange or reverseosmosis. Israel’s drinking water standard for
GRCE0035.fm Page 6 Thursday, April 19, 2007 1:55 PM
Y. Dreizin et al. / Desalination xxx (2007) 1–18 7
nitrates has recently been tightened from 90 to70 ppm max. These limits make 30% of allcoastal aquifer wells non-potable.
The questions that had to be resolved were:what is the optimal desalinated water quality forachieving all above benefits, what is the value ofthese benefits and how much is it worth invest-ing in or paying for higher desalinated productquality.
5.5. Preferred desalination process(es)
When the initial DMP was drawn, thermaldesalination plants were the most prevalent, reli-able and economic plants world-wide. The tech-nologies related to seawater reverse osmosisplants (pretreatment, membranes, energy recoverydevices, etc.) were rapidly developing, but therewas only minimal long-term experience with thesenewer technologies and no experience, in fact,in large SWRO plants, with scaled-up specialitems of equipment. Also, due to the foreseen newsources of relatively low cost and clean naturalgas in Israel, self generation of heat and/or powerfor hybrid thermal/membrane desalination plants,alone or within dual purpose water and powercogeneration stations, was deemed an attractivepossibility.
The study of alternative desalination processesand the selection only 2 preferred processes andenergy utilization schemes was meant to standard-ize the plants operating throughout the countryand limit them to only those tested and provenprocesses that are most relevant to the plantcapacities required in Israel and are most suitablefor its non-OPEC country energy costs. The largeinefficient thermal plants common in the OPECcountries, where internal energy costs are only afraction of world-wide prices, were deemed fromthe outset to be inappropriate.
Once the preferred processes were selected itwas possible to project, based on their specificcharacteristics, the potential plants’ performance
figures and their site, infrastructure and auxilia-ries requirements, including: • area requirements; • civil engineering works requirements; • seawater requirements (including cooling
water for thermal plants); • plants conversion ratios and resultant brine
rejection flows and salinities; • type(s) and sizes of energy supply systems; • sensitivity to possible escalations in fuel and
other key operating costs; • product quality range; • maximal single desalination unit sizes (based
on designs currently available and sufficientlytested and proven in commercial plants);
• typical economies of scale; • operational versatility and flexibility; • environmental constraints.
5.6. Optimal desalination plants’ installation schedule
Establishing the optimal desalination plantsinstallation schedule involved the followingfactors and considerations: • the ranking of all identified locations based
on site-related costs and benefits (see Sec-tion 6.2);
• the desalinated water absorption and trans-portation capabilities at each point in time atthe NWC junctions closest to the identifiedsites (as demand grows in the various popu-lation centers being supplied by the NWC,additional absorption and transport capacitieswill become free and available, at differentprojected rates, downstream of these con-sumption centers;
• projected difficulties and delays in gettingstatutory approvals and permitting at some ofthe preferred sites (in some cases rezoningand/or changing land usage permits wererequired).
GRCE0035.fm Page 7 Thursday, April 19, 2007 1:55 PM

8 Y. Dreizin et al. / Desalination xxx (2007) 1–18
6. Resultant planning figures and DMP details
6.1. Total desalinated water requirements
The initial total desalinated water require-ment estimates throughout the planning horizonwere updated periodically according to actualdeveloped demands by all user sectors. The lat-est demand projection, updated in 2004, is pre-sented in Table 1. The corresponding totalplanned desalinated seawater capacity is shownin Table 2.
6.2. Optimal geographic distribution of desalination plants
Six sites were found to be most suitable forinstalling large desalination plants according tothe considerations noted in Section 5.2 (seelayout of these sites and their connections to
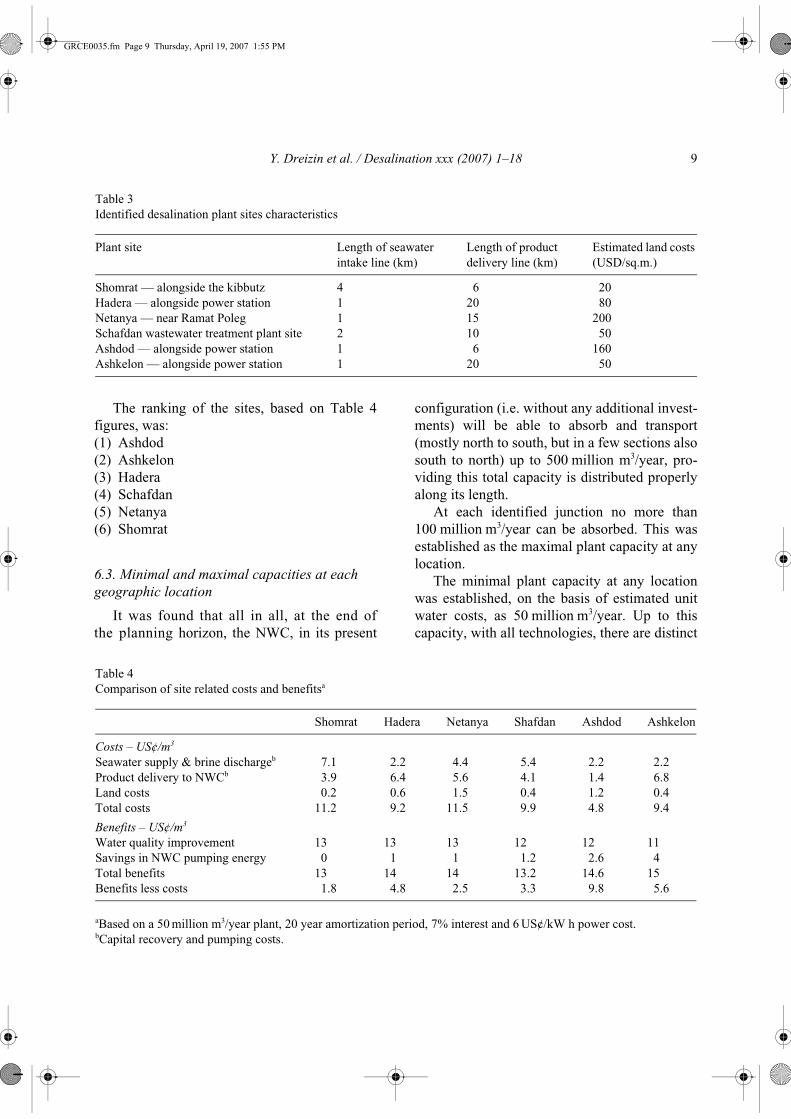
the NWC in Fig. 1). They and their main char-acteristics are presented, in order of their dis-tribution from north to south, in Table 3.
The estimated site-specific costs and benefitsassociated with each of these locations, for aminimal-size plant, 50 million m3/year (seeSection 6.3), are shown in Table 4. The costs ofother site-related infrastructure and civil engi-neering works were found to be, more or less,equal at all potential sites and are, therefore, notincluded in this comparative table.
As seen from Table 4, plant site can affect totaldesalinated water costs by anywhere from 5 to11 US¢/m3, their benefits from 13 to 15 US¢/m3
and their total cost-benefit equation by 2 to10 US¢/m3. Comparing these figures to the overalldesalinated water costs projected in Section 6.5for plants of this minimal capacity at a typicalsite, we see that the site related costs are on theorder of 7–18%, the benefits 18–25%, and theircombined total 3–16% of total water costs.
Table 1Projected water demand by consumer sectors — inmillion m3/year
Year 2005 2010 2015 2020
Agricultural Potable water 530 530 530 530Brackish water 160 140 140 140 Treated wastewater 300 500 600 700 Total 990 1170 1270 1370
Industrial Potable water 85 90 95 100 Brackish water 40 40 40 40 Treated wastewater 0 5 13 15 Total 125 135 148 155
Domestic Potable water 720 840 960 1080
Nature conservation 25 50 50 50
Aquifer rehabilitationPotable water 100 100 100 0
Neighboring entities 100 110 130 150
Total demand 2060 2405 2658 2805
Table 2Seawater desalination within Israel’s projected sourcesof water supply — in million m3/year
aCapacities required to assure 90% water supply reliabilityto all consumer sectors and rehabilitate the depletedaquifers with the allotments shown in Table 1. bDesalinated seawater capacity currently authorized bythe Israeli government.
Year 2005 2010 2015 2020
Potable water Natural sources 1470 1470 1470 1470Desalinated brackishwater
30 50 80 80
Desalinated seawatera 50 315b 500 650 Sub-total 1600 1835 2050 2200
Brackish water 160 140 140 140
Treated wastewater 300 450 520 600
Total 2090 2425 2710 2910
GRCE0035.fm Page 8 Thursday, April 19, 2007 1:55 PM
Y. Dreizin et al. / Desalination xxx (2007) 1–18 9
The ranking of the sites, based on Table 4figures, was: (1) Ashdod (2) Ashkelon (3) Hadera (4) Schafdan (5) Netanya (6) Shomrat
6.3. Minimal and maximal capacities at each geographic location
It was found that all in all, at the end ofthe planning horizon, the NWC, in its present
configuration (i.e. without any additional invest-ments) will be able to absorb and transport(mostly north to south, but in a few sections alsosouth to north) up to 500 million m3/year, pro-viding this total capacity is distributed properlyalong its length.
At each identified junction no more than100 million m3/year can be absorbed. This wasestablished as the maximal plant capacity at anylocation.
The minimal plant capacity at any locationwas established, on the basis of estimated unitwater costs, as 50 million m3/year. Up to thiscapacity, with all technologies, there are distinct
Table 3Identified desalination plant sites characteristics
Plant site Length of seawaterintake line (km)
Length of productdelivery line (km)
Estimated land costs (USD/sq.m.)
Shomrat — alongside the kibbutz 4 6 20Hadera — alongside power station 1 20 80Netanya — near Ramat Poleg 1 15 200Schafdan wastewater treatment plant site 2 10 50Ashdod — alongside power station 1 6 160Ashkelon — alongside power station 1 20 50
Table 4Comparison of site related costs and benefitsa
aBased on a 50 million m3/year plant, 20 year amortization period, 7% interest and 6 US¢/kW h power cost. bCapital recovery and pumping costs.
Shomrat Hadera Netanya Shafdan Ashdod Ashkelon
Costs – US¢/m3
Seawater supply & brine dischargeb 7.1 2.2 4.4 5.4 2.2 2.2Product delivery to NWCb 3.9 6.4 5.6 4.1 1.4 6.8Land costs 0.2 0.6 1.5 0.4 1.2 0.4Total costs 11.2 9.2 11.5 9.9 4.8 9.4
Benefits – US¢/m3
Water quality improvement 13 13 13 12 12 11Savings in NWC pumping energy 0 1 1 1.2 2.6 4Total benefits 13 14 14 13.2 14.6 15Benefits less costs 1.8 4.8 2.5 3.3 9.8 5.6
GRCE0035.fm Page 9 Thursday, April 19, 2007 1:55 PM

10 Y. Dreizin et al. / Desalination xxx (2007) 1–18
economies of scale. From this capacity on, upto about 100 million m3/year, added benefitsdiminish, and above 100 million m3/year econ-omies of scale become only marginal.
6.4. Optimal desalinated water quality
The maximum desalinated water chlorideconcentration was established initially as 150 ppm,so that after the expected addition of about100 ppm of chloride by domestic and industrialusers, its content in the treated municipal waste-water would not exceed 250 ppm. This is the limitset for agricultural irrigation, the main wastewaterreuse application. Sodium and boron concentra-tions were similarly limited by irrigation waterquality constraints and typical municipal usageadditions to 100 and 0.2 ppm, respectively.
The product’s pH, Langlier Index and turbid-ity limits were dictated by Mekorot, the nationalwater utility company that operates the NWC andmost of the regional water supply systems, as7.0–8.0, 0 to +0.5, and 0.5 NTU max, respectively.Mekorot was given the responsibility of accept-ing the product of all the desalination plants attheir’ battery limits, chlorinating and storingit operationally and pumping it to the NWC.
The original DMP’s goal was to minimizepost-treatment costs by blending the slightly corro-sive product with local marginal and even brack-ish well water. Such low grade water sources, allwith high natural hardness content, were identi-fied near most of the preferred desalination plantsites, and their blending with the high qualitydesalinated product would enable incorporatingthem into the potable water system without theneed to desalinate them first.
Studies performed by the IWC’s consultants,ADAN Technical & Economic Services Ltd.,determined that the value of softening watersupplies to domestic and industrial consumersranged from 5 to 15 US¢/m3, depending onthe local water quality, its blend ratio withdesalinated water and the main types of consumers
at each desalination plant site. It was also deter-mined that the benefits to agricultural users fromreducing product water’s chloride concentra-tion from 150 to 20 ppm and the boron concen-tration from 0.5 to 0.3 ppm was in the range of4 US¢/m3.
6.5. The preferred desalination process(es)
Two desalination technologies and plantschemes were identified as being most suitablefor the relevant plant capacities and for Israel’sspecific energy costs [3]: (1) A single-purpose seawater reverse osmosis
(SWRO) plant operating with grid suppliedpower;
(2) A hybrid SWRO and low-temperature multi-effect distillation (LT-MED) plant, with anindependent combined-cycle power stationutilizing natural gas, in two options: (a) a power station sized to supply only the
desalination plants’ heat and powerrequirements, without any export ofpower — the “Water Factory” concept;
(b) a power station sized to export power tothe grid during peak power demandperiods, thereby increasing its cogener-ated heat output and enabling the incor-poration of larger thermal desalinationplants, and, more importantly, reducingtotal water costs by crediting them withthe profits from exported power sales.
When the initial DMP was prepared, estimatedwater costs from 50 million m3/year plants basedon these technologies, at the plants’ battery limits,based on Israeli energy, capital and other relevantcosts prevailing at the time [3], were: (1) The single-purpose SWRO plant — 65–74
US¢/m3 (2) The hybrid LT-MED/SWRO plant without
power export — 61–65 US¢/m3 with NG and,should NG not be available, 72–75 US¢/m3
with LFO.
GRCE0035.fm Page 10 Thursday, April 19, 2007 1:55 PM

Y. Dreizin et al. / Desalination xxx (2007) 1–18 11
(3) The hybrid LT-MED/SWRO plant withpower export — reductions of up to 20 US¢/m3
from item 2 indicated costs, depending onthe designed power to water ratio.
Note: the above costs include typicallyexpected site-related costs such as land, civilworks, seawater supply and brine discharge (seeSection 6.2), but excluding the costs of productdelivery to the NWC.
6.6. The DMP’s desalination plants’ installation schedule
The initial DMP’s desalination plants’ capac-ity and installation schedule, based on the mostprobable water demand scenario foreseen at thetime, is shown in Table 5.
As can be seen, this schedule dealt with onlythe first 500 million m3/year of total desalinatedwater output, the capacity that could beabsorbed by the NWC without additional invest-ments in downstream infrastructure, as noted inSection 6.3. It spread this capacity evenly in theorder of the sites’ ranking, starting with thehighest ranked site, Ashdod. This ensured thatmore population and industry centers would
benefit soonest from the resultant water supplyquality improvement. Water quality improvement,as shown in Table 4, was the major benefit fromthe large desalination program and a prime factorin planning the layout of the plants.
The build-up of capacity was in incrementalsteps of 50 million m3/year, the smallest recom-mended plant size at any site as noted in Section6.3, reaching no more than 100 million m3/yearat any site, the maximum capacity that couldbe absorbed by the NWC at any single junctionpoint.
7. The DMP’s implementation
7.1. Reserving potential desalination plant sites
The first steps taken to implement the DMPwere to reserve within the National OutlineScheme (NOS) that was being drafted at thetime (as the master plan for all land uses inIsrael up to the year 2020) sites sufficient for theinstallation of desalination plants with a totalcapacity of at least 775 million m3/year (includ-ing the expansion of the existing SWRO plant inEilat to 20 million m3/year).
The distribution of this capacity within theNOS section devoted to water, code namedTAMA-34b, is shown in Table 6. As can beseen, the reserved sites did not include Netanya,since new permitting problems were discoveredwith this particular site, but included two new sites,one within Haifa Bay and the second anotherAshdod site. The large capacities at the Schafdanand Ashdod sites allowed for routing some of theproduct also directly into these nearby metropol-itan areas’ water distribution systems.
7.2. Contracting of plants to date
Typically, as with many other long-rangemaster plans, the original DMP had to be alteredand adapted to fit reality and the changing situa-tion on the ground.
Table 5Original desalinated water capacity build-up program
aThe current regional water system’s absorption capacitylimit.
Plant location Plant capacity — million m3/year
2005 2010 2015
Ashdod 50 50 100Ashkelon 50 100Hadera 50 100Schafdan 50 100Netanya 50 50Shomrat 30a 50
Total 50 280 500
GRCE0035.fm Page 11 Thursday, April 19, 2007 1:55 PM

12 Y. Dreizin et al. / Desalination xxx (2007) 1–18
The schedule in Table 5 was prepared beforea prolonged drought, combined with the continu-ing and even accelerating growth in the price-inflexible demand by the municipal sector, ledto a national water supply crisis. In spite of thesevere curtailment of water allotments to agri-culture, industrial and domestic users, water levelsin all the major natural water storage reservoirs fellbelow their minimal “red lines”, threatening theirquality through sea and brackish water intrusion.
As a result of this crisis, the Israeli govern-ment, on March 1999, authorized the initiationof a wide range of new water projects. Theserelated to water-use conservation, contaminatedwells rehabilitation, wastewater reuse, additionalbrackish water desalination, and, for the first time(over-ruling Ministry of Finance objections), alsolarge scale seawater desalination [4].
The initial seawater desalination authoriza-tion (with its all-important budget approvals)instructed the Water Commission to prepare inter-national tenders for the immediate installation,financing and operation, on a long-term basis, ofplants totaling 200 million m3/year, utilizingprivate sector financing and contracting. Thisfigure was later upped to 400 million m3/year and
today, as noted earlier, after a further revision,stands at 315 million m3/year by 2010.
The need to introduce, urgently, large quanti-ties of desalinated water forced the IWC tomodify its original DMP schedule. At the time ofthe government resolution, in 1999, there wasonly one site within the DMP’s list of preferredlocations that was available immediately forinstalling a large seawater desalination plant, i.e.required only minimal statutory approvals andpermits — an area within the Eilat-Ashkelon OilPipeline Company’s Mediterranean Sea terminalat Ashkelon (the National Outline Scheme TAMA-34b noted above was approved only in 2004).
A build, operate and transfer (BOT) tenderfor a 50 million m3/year plant was issued for thisspecific site in September 2000. Three bids werereceived and the contract with the winning bid-der, V.I.D., a special purpose company (SPC)formed by a consortia of IDE Technologies Ltd.,Veolia Water S.A. and Elran Infrastructures Ltd.,was signed on November 2001. A subsequentcontract, doubling the capacity to 100 millionm3/year, was signed in April 2002. Financialclosure for the complete project was reached inJanuary 2003 and the notice to proceed in con-struction (NTP) issued in April 2003.
The lack of additional sites at the DMP’s pre-ferred locations capable of being approved andpermitted rapidly meant that tenders for theother urgently needed plants had to be on thebasis of build, own and operate (BOO) schemes,whereby all bidders had to pre-qualify first, interalia, on the basis of their ability to offer theirown suitable and immediately available sites. Todraw a sufficient offering of such scarce sites,smaller sites, that could accommodate plantswith capacities below the preferred minimum,had to be allowed. The capacities of the plantsin the BOO-tender (issued in May 2001) were,therefore, reduced to 15–30 million m3/year.
Bids for six potential sites were received inresponse to this second tendering process. Theconstruction of four plants, each with a capacity
Table 6Sites reserved within the National Master Plan TAMA-34b
Desalination plantsite
Total projectedcapacity— million m3/year
Shomrat 30Haifa Bay 30Hadera Power Plant 100Shafdan 200Palmachim 100Ashdod Industrial Zone
150
Ashdod Power Plant 45Ashkelon 100Eilat 20
Total 775
GRCE0035.fm Page 12 Thursday, April 19, 2007 1:55 PM

Y. Dreizin et al. / Desalination xxx (2007) 1–18 13
of 30 million m3/year, was contracted in October2002 — at Shomrat, Haifa Bay, Palmachim andAshdod. Only the Palmachim project’s specialpurpose company (SPC), Via Maris DesalinationLtd., owned by Granit Hacarmel Investments Ltd.,TAHAL Consulting Engineers, OCIF Invest-ments and Developments Ltd, Middle East TubeCo. Ltd. and Oceana Marine Research Ltd.,managed to arrange the necessary financingand receive the NTP.
In November 2006, following a lengthytendering process, a BOT contract was signedfor a 100 million m3/year plant to be installedalongside the large power station complex, atHadera. The plant will be built by H2ID, an SPCowned by IDE Technologies Ltd. and Housingand Construction Holding Co. Ltd.
7.3. Contracted plants’ designs
The main design features of the plants’ con-tracted to date are: • All designs are based on the seawater reverse
osmosis (SWRO) process (reflecting the largeimprovements in this technology over thepast few years).
• The plants utilize various multi-pass desalina-tion schemes to reduce both boron and chlorideconcentrations in the product (see resultantproduct quality in Section 7.3).
• The plants utilize advanced energy-recoverydevices to reduce specific energy consumptionsto below 4 kW h/m3.
• The plants rely on conventional multi-mediagravity filters, in lieu of UF, for feed pre-treatment.
• Where possible on-site self-generation ofpower, utilizing newly available natural gassupply sources, was selected, in lieu ofpurchasing power from the national electriccompany.
7.4. Contracted plants’ water quality
As a result of incentives (bonuses) built intoall tenders [4], the actual bid and contractedproduct qualities, after post-treatment, were asexhibited in Table 7. The benefits from thisextremely high quality water are already evi-dent in the towns downstream of the operatingAshkelon plant, as shown in Section 7.5.2.
Meanwhile, following further deliberationsand considerations, particularly relating to thepossible adverse effects from introducing thedesalinated water into the local water supplysystems (the possible dissolution of some ofthe protective scale coatings and the release ofentrapped corrosion products and the forma-tion of “red water”), new requirements havebeen imposed on all existing and new seawater
Table 7Contracted and actual desalinated water quality
Quality parameter Units Contractual requirements Ashkelon actual quality
Ashkelon Palmachim Hadera
Chlorides ppm 20 80 20 10–15 Boron ppm 0.4 0.4 0.3 0.2–0.3 PH ppm 7.5–8.5 7–8 7.5–8.3 8–8.5 LSI ppm 0.2–0.5 0.5–0.5 0–0.5 0–0.5 Alkalinity (CaCO3) ppm – – 80< 45–50 Hardness (CaCO3) ppm 60> 75–100 80–120 90–110 Turbidity NTU 0.5 0.8 0.5 0.15–0.2
GRCE0035.fm Page 13 Thursday, April 19, 2007 1:55 PM

14 Y. Dreizin et al. / Desalination xxx (2007) 1–18
desalination plants post-treatment sections. Theseare summarized in Table 8.
As can be seen from Table 8, the qualitativecorrosivity–passivity Langlier Index require-ment was replaced by the quantitative calciumcarbonate precipitation potential (CCPP) require-ment and a minimum alkalinity requirement wasadded.
7.5. Contracted plants’ water prices
Table 9 presents the water prices at theplants’ battery limits for the three plants con-tracted so far, at the time of contracts signingand in December 2006, including adjustmentsdue to recognized cost escalations. The exhibitedprices are in US¢/m3, at the New Israeli Shekelto US Dollar exchange rates prevailing at thesetimes.
The low initial water costs (i.e. at contractsigning dates) vis-a-vis the costs projected within
the DMP (see Section 6.5 above) are duemainly to:• the large improvements in SWRO plants’
energy consumption and main components’costs;
• the economies of scale gained with the verylarge plants;
• the assumptions by the government of criticalproject risks, to attract lower cost financing [5];
• the long water purchase periods of the BOTand BOO agreements (25 years).
The higher current water prices, which aremore in line with the DMP’s estimates, reflect thelarge escalations in energy costs over the pasttwo years.
7.6. Contracted plants’ benefits
7.6.1. Water supply reliability
The importance of the desalination plants’output to the water supply system is borne outby the supply and demand statistics of the pastyear, which was a below average rainfall year.These show that in spite of all the new projectsrelating to water-use conservation, wastewaterreuse, etc. authorized by the government in 1999(see Section 7.1 above) and executed since thenby the IWC, potable water demand exceedednatural replenishment by about 250 million m3.This gap is about equal to the combined outputsof the Ashkelon, Palmachim and Hadera plants.
Table 8New product quality requirements after post-treatment
Quality parameter
Units Recommendedvalues
Alkalinity ppm as CaCO3 >80Calcium ppm as CaCO3 80–120CCPP ppm as CaCO3 3.0–10pH <8.5
Table 9Contracted desalination plants water prices
aAverage for two separate 50million m3/y contracts.
Contracted water price — US¢/m3
Plant Ashkelona Palmachim Hadera
Contract date December 2006 Contract date December 2006 Contract date December 2006
Total price 50.9 65.5 56.2 73.6 59.5 60.9
GRCE0035.fm Page 14 Thursday, April 19, 2007 1:55 PM

Y. Dreizin et al. / Desalination xxx (2007) 1–18 15
It is clear that without the 100 million m3/year contributed by the Ashkelon plant, the onlyplant operating so far, water levels in all the nat-ural reservoirs would have fallen dangerouslylow, making necessary new water allotmentreductions, with all their economic implications.
Based on the incomes generated with theresultant non-curtailed water supply by the leastprofitable economic activity, agriculture, with thelowest value crops (which would be the first to beeliminated), we have estimated these implications,i.e. the benefits from the desalinated water input,at 1.2–2.5 US¢/m3, depending on type of crop andwater productivity, and, for the total annualoutput of the Ashkelon plant, at 12–25 millionUSD [5].
Had we calculated these benefits on the basisof potential losses in income due to curtailmentof water supply to other, more profitable crops,let alone to commercial and/or industrial con-sumers, whose incomes from water relatedproductivity are significantly higher, they wouldhave been proportionately larger.
7.6.2. Water supply quality improvement
Table 10 exhibits actual improvements inwater supply quality at the major domestic andindustrial centers downstream of the Ashkelondesalination plant. The variations in the dataare due to different blending ratios between
Table 10Water supply quality before and after blending with Ashkelon plant product
Location Season TDS Hardness Cl
ppm Reduction ppm as CaCO3
Reduction ppm Reduction
ppm % ppm % ppm %
Beer Sheba Winter Before 647 266 41 323 132 41 193 105 54After 381 191 88
Summer Before 573 148 26 267 57 21 180 71 39After 425 210 109
Kiriat Gat Winter Before 633 87 14 338 65 19 165 26 16After 546 273 139
Summer Before 478 148 31 212 46 22 145 80 55After 330 166 65
Ofakim Winter Before 598 265 44 310 141 46 168 102 61After 333 169 66
Summer Before 429 121 28 195 38 24 119 61 51After 308 157 58
Shderot Winter Before 475 183 39 250 105 42 150 94 63After 292 145 56
Summer Before 393 30 8 185 17 9 99 15 15After 363 168 84
Netivot Winter Before 557 288 52 277 138 50 170 125 74After 269 139 45
Summer Before 374 97 26 177 35 20 89 42 47After 277 142 47
GRCE0035.fm Page 15 Thursday, April 19, 2007 1:55 PM

16 Y. Dreizin et al. / Desalination xxx (2007) 1–18
the desalinated water and NWC and localwells’ water, driven by seasonal demandvariations.
The following figures illustrate the conse-quential improvement in the wastewater qualityat two of these municipalities’ wastewater treat-ment plants (WWTP):
Beer Sheba WWTP Conductivity before operation of the desalina-tion plant — about 2.0 dS/m. Conductivity after operation of the desalinationplant — about 1.5 dS/m. Improvement – 25%
Shderot - Shaar Hanegev WWTP Chloride concentration before operation of thedesalination plant — 330–400 ppm. Chloride concentration after operation of thedesalination plant — 240–280 ppm. Improvement — 27–30%
It is seen that, as predicted, the domestic andindustrial consumers are benefiting from reducedwater supply hardness (reduction of up to 46%during the winter) and the agricultural sector,which reuses the treated wastewater, is bene-fiting from its lower salinity (reductions of upto 74% in chloride content and up to 50% inTDS, which lower the wastewater salinity by25–30%). There is no doubt that as largerquantities of desalinated water are introducedupstream into the NWC, these figures willimprove further.
7.7. Main environmental protection issue encountered to date
The main environmental issue encounteredto date (environment being the major theme ofthis conference) has been the high iron contentof the brine discharge stream at Ashkelon aftermixing with the filters’ backwash water. Theplant doses the seawater feed with about 15 ppmof ferric sulfate coagulant and the reject brine
stream, after mixing with the filters’ backwashwater, contains about 28 ppm of ferric sulfate,of which about 5 ppm are ferric ions. Thoughthe brine is mixed with the Ashkelon powerstation cooling water discharge, it discolors thesea with a red plume. The Israeli Ministry ofEnvironment (as will be discussed in anotherpaper at the conference) views this, as well asthe total annual discharge of iron to the sea,about 450 tons per year, as problematic anddemands its resolution.
8. Status of ongoing projects and current plans
The current situation, status of ongoingprojects and plans are: • Total approved desalination capacity
315 million m3/year by 2010 • Current distribution, capacity and status of
contracted plants Ashkelon — 100 million m3/year — operat-ing since 2005 Palmachim — 30 million m3/year — startingoperation in May 2007 Hadera — 100 million m3/year — expectedoperation — end of 2009
• Current projects in pre-tendering phase Ashdod — 45 million m3/year Added capacity by expansion of existingplants — 40 million m3/year
• Current projects in longer term planning (by2015) Schafdan — 100 million m3/year Added capacity by expansion of existingplants — 85 million m3/year
Table 11 summarizes the above informa-tion. Fig. 2 presents the layout of the plants.Figs. 3 and 4 show recent aerial photos of theAshkelon and Palmachim plants. Fig. 5 showsa three-dimensional artist’s concept of theHadera plant.
GRCE0035.fm Page 16 Thursday, April 19, 2007 1:55 PM

Y. Dreizin et al. / Desalination xxx (2007) 1–18 17
9. Summary and closing comments
Planning for the introduction and integrationof large scale seawater desalination in Israelbegan in earnest about ten years ago, in the mid-1990s. The planning methodology consisted ofconducting a series of studies into the mainissues related to the huge investments and oper-ating costs associated with this new nationalwater source, and deriving, on the basis of these
studies’ findings, an optimal long-range desali-nation master plan (DMP).
The execution of this plan was initiallyblocked by the Israeli Ministry of Finance,which looked at seawater desalination as a lastresort of action to be adopted only after the devel-opment and utilization of all other water supplysources and after a water pricing reform wouldreduce agricultural demand. It was subsequentlyrushed through on a fast-track basis due to evolvedwater supply shortages. Though these politicallydriven constraints and postponements requiredrepeated updating of the DMP, it has proven,nonetheless, to be a valuable, flexible tool.
It was used to guide a multi-project tenderingand site permitting process which resulted not
Table 11Current and programmed desalinated water capacity
aAs expansion, by existing plant owners-operators.
Plant location
Plant capacity — million m3/year
2007 2010 2015
Ashkelon 100 100 100Palmachim 30 30 30Hadera – 100 100Ashdod – 45 45Schafdan – – 100To be bida – 40 125
Total 50 315 500
Hadera
Ashdod
Schafdan
Ashkelon
National Water Carrier (NWC)
Sea of GalileeHaifa
Jerusalem
Tel Aviv
Gaza
Palmachim
Netanya
Fig. 2. Current & planned plants locations.
Fig. 3. 100 million m3/year Ashkelon plant.
Fig. 4. 30 million m3/year Palmachim plant.
GRCE0035.fm Page 17 Thursday, April 19, 2007 1:55 PM

18 Y. Dreizin et al. / Desalination xxx (2007) 1–18
only in the ordering of plants capable of produc-ing very high quality and low cost desalinatedseawater, but in maximizing the benefits fromthis high-quality product by distributing itpreferentially to the consumers that stand togain the most from their water supply’s qualityimprovement.
The Israeli Water Commission will continueto update and utilize this tool in the coming years,expanding its planning horizon and adding furtherdesalination capacity, until, as we expect, desali-nated seawater will eventually constitute asmuch as 50% of total potable water supply.
References
[1] Daniel Hoffman and Amnon Zfati, Consider-ations governing the selection and design of opti-mal seawater desalination plants for integrationwithin conventional water supply systems, in: TheInternational Conference on Water ResourcesManagement Strategies in the Middle East inmemory of the late Prime Minister Yitzhak Rabin,Herzelia, Israel, 24–26 November 1996.
[2] Amnon Zfati, A framework for integrating large-scale seawater desalination into the water supplysystem, Submitted to the Planning Division, theIsrael Water Commission, February 1997 (inHebrew).
[3] Amnon Zfati and Daniel Hoffman, Techno-economic evaluations and characterization of theoptimal desalination plants for Israel, Submittedto the Planning Division, the Israel Water Com-mission, January 1998 (in Hebrew).
[4] Yosef Dreizin and Oded Fixler, Large seawaterdesalination tenders — the Water Commission’sobjectives, approach and requirements, Israel WaterCommission, in: The 7th Annual Israel DesalinationSociety Conference, Tel Aviv, Israel, 2–3 March2005.
[5] Yosef Dreizin, Ashkelon seawater desalinationproject — off-taker’s self costs, supplied watercosts, total costs and benefits, Desalination, 190(2006) 104–116.
Fig. 5. An artist’s concept of the 100 million m3/yearHadera plant.
GRCE0035.fm Page 18 Thursday, April 19, 2007 1:55 PM

Ver No.:100
Author Query Sheet W.E.F 2nd Jan 2006 Quality Management System Page 1 of 1
Customer Name
Book / Journal Code
Name of the Book / Journal Article ID
Balaban GRCE Desalination 0035
Copy Editing:
1. Kindly provide the full affiliation details.
2. Kindly check whether the corresponding author is identified correctly. Also provide telephone details.
3. Kindly provide a set of keywords for your manuscript.
4. Kindly check if references are Ok as edited.
Graphics:
1. Please provide high resolution for Figures 3, 4, and 5.
Pagination / QC:
Nil
Remarks:
Nil