“Integrating HRSG & Catalyst Design For High Performance … 2014/Joshua D... · “Integrating...
60
“Integrating HRSG & Catalyst Design For High Performance & Low Cost” Mr. Joshua D. Gillespie July 15, 2014
Transcript of “Integrating HRSG & Catalyst Design For High Performance … 2014/Joshua D... · “Integrating...
THE POWER OF CATALYSIS
“Integrating HRSG & Catalyst Design For High Performance & Low Cost”
Mr. Joshua D. GillespieJuly 15, 2014

THE POWER OF CATALYSIS
2013 ABMA Annual MeetingEnvironmental Session
2

THE POWER OF CATALYSIS3
Range of ApplicationsEmeraChem is an OEM developer and manufacturer of catalytic products to control air pollution from
…in the power generation and natural gas markets
large gas turbines
large reciprocating engines
Industrial boilers
THE POWER OF CATALYSIS4
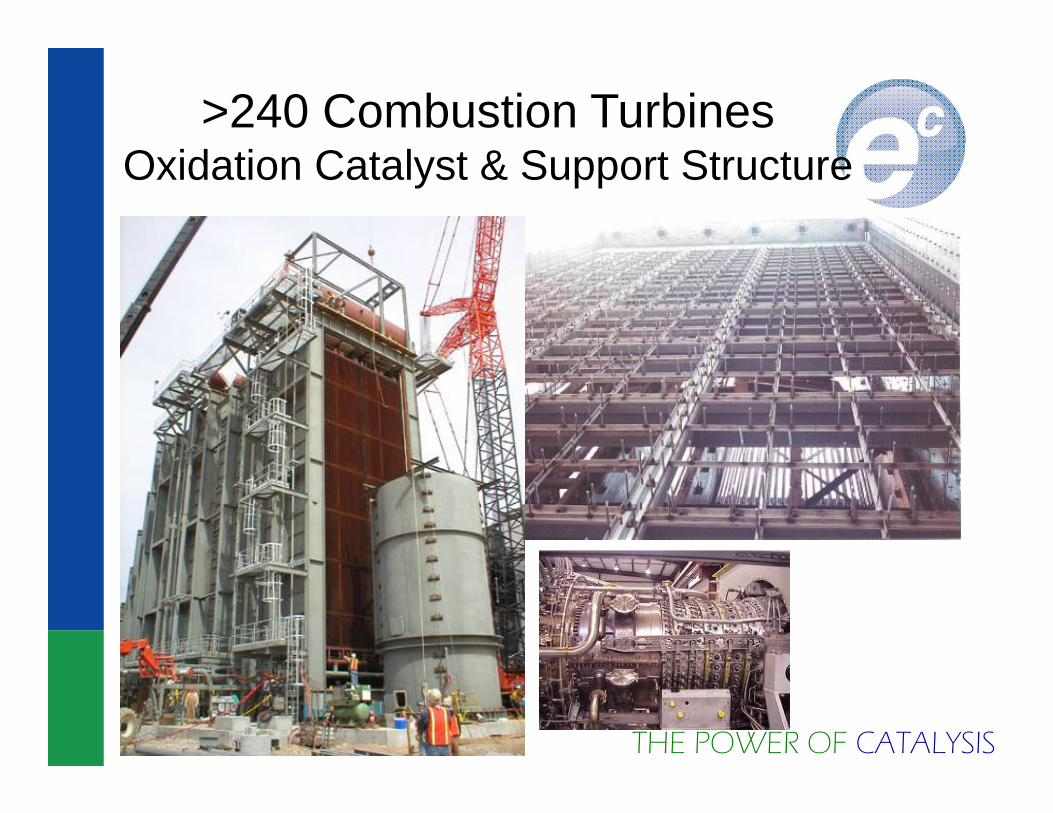
>240 Combustion TurbinesOxidation Catalyst & Support Structure

THE POWER OF CATALYSIS
GE 7H 2GE 7FA 33GE 7EA 3GE FRAME 6 F 5GE FRAME 6 B 1GE LM6000 64GE LM 5000 1GE LM 2500 6Mitsubishi 501D 2Mitsubishi 501F 20Mitsubishi 501G 6Siemens SGT 5000 5Siemens SGT 800 2Siemens SGT 400 5Pratt & Whitney FT-8 25Alstom GTX 100 6Solar TITAN 130 4Solar TAURUS 70 7Solar TAURUS 60 8Solar CENTAUR 40 2Solar SATURN 20 3Rolls Royce TRENT 60 2Westinghouse W251B 1AVON MK 1533 1VS-7 1Unspecified GTs 33
>240 Catalyst Systems for GTs
Individual projects ranging from 24 to 2400 catalyst elements
>40,000 MWcontrolled by
EmeraChem catalyst

THE POWER OF CATALYSIS
Starting Point: Application Design(system variables that affect emissions)
• Information input– engine name and model– fuel type(s) and sulfur content– water injected or evap cooling? (water quality)– HRSG or simple cycle (no. starts/stops/yr.)– Duct firing? Fuel type.– exhaust mass flow rate, catalyst operating temp, – % flow and temperature variation– Inlet emissions, (CO, VOC, NO/NO2, SO2)– performance requirements
• (% reduction CO, VOC, NO-NO2, SO2-SO3)• Start-up & shutdown performance included?
– desired warranty period and service life– installation information;
• NEW or REPLACEMENT• Gas Path Size • allowable pressure drop
6
It’s possible to “over specify”:• low temperature• very high performance• very low pressure drop• small gas path• lot’s of starts & stops• long warranty period• “cheap”

THE POWER OF CATALYSIS7
Catalyst Design(catalyst variables that affect emissions)
• substrate cell geometry and geometric surface area
• wash coat formulation & loading• precious metal formulation• precious metal loading• method of applying precious metals• gas hourly space velocity

THE POWER OF CATALYSIS8
Substrate Design Variables• Cell structure geometry and surface area• Cell density• Pressure drop• Diffusion bonded (10-yr mechanical warranty)
“discrete cell”

THE POWER OF CATALYSIS9
40
50
60
70
80
90
100
110
120
200 220 240 260 280 300 320 340 360 380 400
Geo
met
ric
Surf
ace
Are
a (in
2/in
3)
Cell Density (CPSI)
ceramic
metal
Geometric Surface Area as a Function of Cell Density
76
96
116

THE POWER OF CATALYSIS10
70
75
80
85
90
95
100
100 125 150 175 200 225 250 275 300 325 350
Cat
alys
t Per
form
ance
Eff
icie
ncy(
%)
Cell Density (CPSI)
metal substrate, at a given temp,
GHSV and formulation
Performance as a Function of Cell Density

THE POWER OF CATALYSIS11
metal substrate
Pressure Drop as a Function of Cell Density
300 cpsi
260 cpsi
230 cpsi

THE POWER OF CATALYSIS12
Variations in Cell Structure & Geometry
• “discrete cell”– diffusion bonded; 10-yr warranty
• “tortuous path”– loosely layered “herringbone”
“discrete cell”
THE POWER OF CATALYSIS
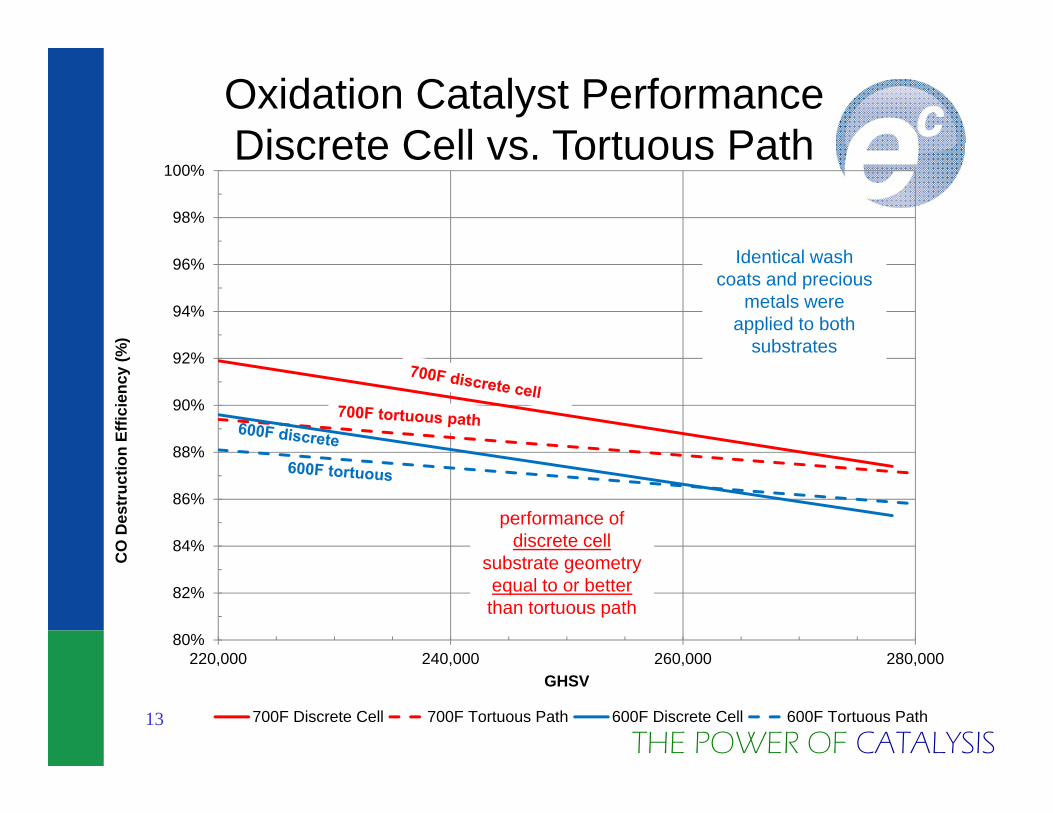
Oxidation Catalyst PerformanceDiscrete Cell vs. Tortuous Path
13
80%
82%
84%
86%
88%
90%
92%
94%
96%
98%
100%
220,000 240,000 260,000 280,000
CO
Des
truc
tion
Effic
ienc
y (%
)
GHSV
700F Discrete Cell 700F Tortuous Path 600F Discrete Cell 600F Tortuous Path
Identical wash coats and precious
metals were applied to both
substrates
performance of discrete cell
substrate geometry equal to or better than tortuous path

THE POWER OF CATALYSIS
What is a VOC?
14

THE POWER OF CATALYSIS15
U.S. EPA Definition of VOC40 CFR Ch. 1, Subpart F - Procedural Requirements, Section 51.100 – Definitions, Paragraph (S) - VOCs, Subparagraph (1)
(s) Volatile organic compounds (VOC) means any compound of carbon, excluding carbon monoxide, carbon dioxide, carbonic acid, metallic carbides or carbonates, and ammonium carbonate, which participates in atmospheric photochemical reactions.
(1) This includes any such organiccompound other than the following,which have been determined to havenegligible photochemical reactivity:methane; ethane; methylene chloride(dichloromethane); 1,1,1-trichloroethane(methyl chloroform); etc.
origin of “NMNEHC”
THE POWER OF CATALYSIS
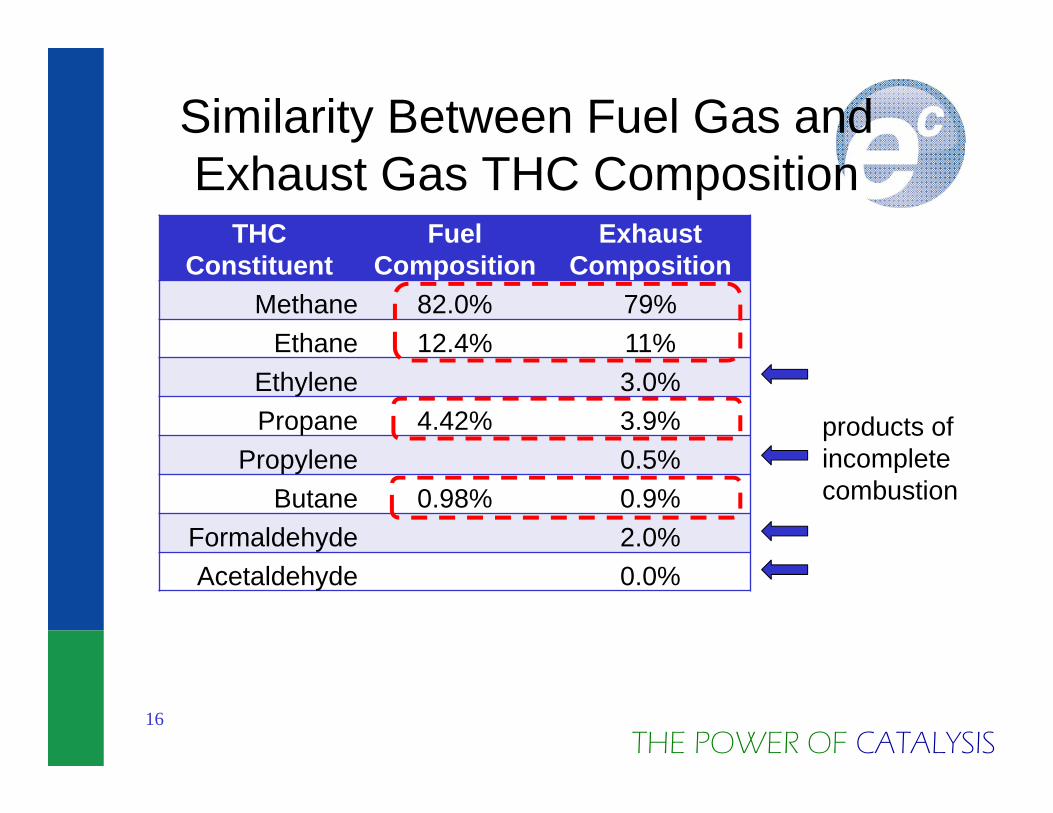
Similarity Between Fuel Gas and Exhaust Gas THC Composition
THC Constituent
FuelComposition
ExhaustComposition
Methane 82.0% 79%Ethane 12.4% 11%
Ethylene 3.0%Propane 4.42% 3.9%
Propylene 0.5%Butane 0.98% 0.9%
Formaldehyde 2.0%Acetaldehyde 0.0%
16
products of incomplete combustion
THE POWER OF CATALYSIS
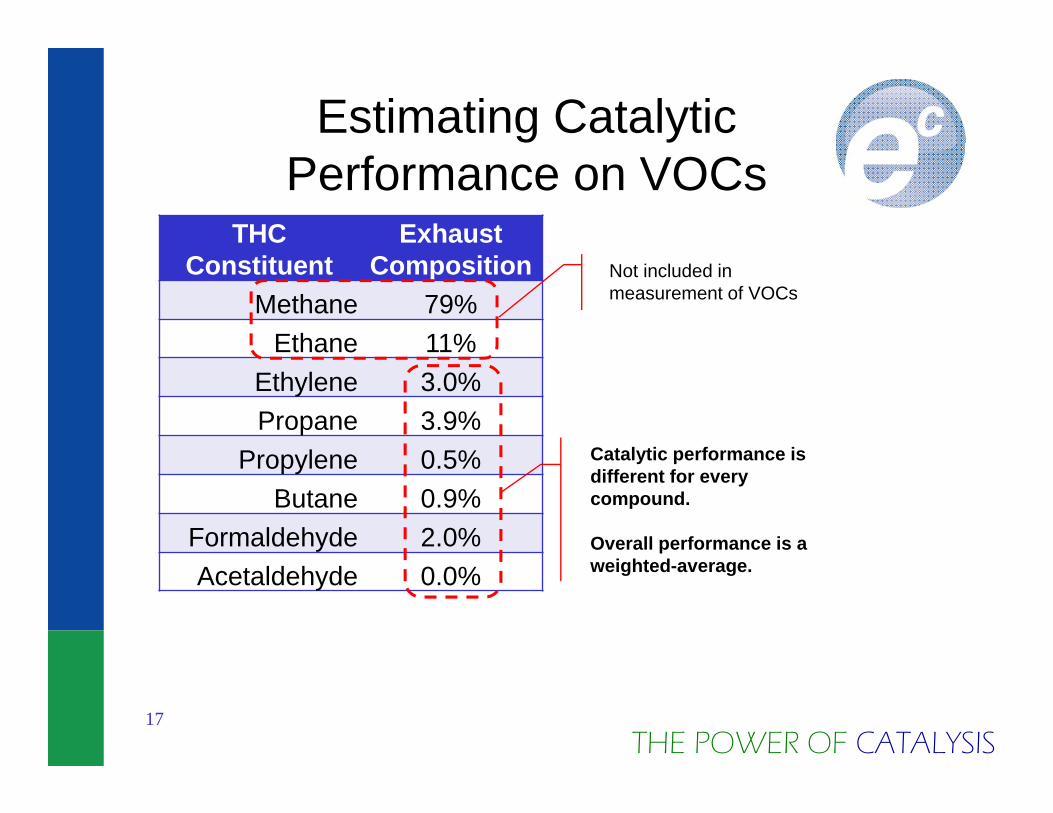
Estimating Catalytic Performance on VOCs
THC Constituent
ExhaustComposition
Methane 79%Ethane 11%
Ethylene 3.0%Propane 3.9%
Propylene 0.5%Butane 0.9%
Formaldehyde 2.0%Acetaldehyde 0.0%
17
Not included in measurement of VOCs
Catalytic performance is different for every compound.
Overall performance is a weighted-average.

THE POWER OF CATALYSIS18
50
55
60
65
70
75
80
85
90
95
100
Cat
alys
t Per
form
ance
Eff
icie
ncy(
%)
Gas Hourly Space Velocity
At 700oF and a given cell density and
formulationpropane
toluene
formaldehyde
CO
Oxidation Performance for CO & VOC Families
HIGH FLOWLOW FLOW

THE POWER OF CATALYSIS
0%
10%
20%
30%
40%
50%
60%
70%
80%
90%
100%
200 300 400 500 600 700 800 900 1000
HC Co
nversion
(%)
Catalyst Temp F
propylene ethylene formaldehyde butane propane methane
METHANE
PROPANE
BUTANE
ETHYLENE
PROPYLENE
FORMALDEHYDE
At a given GHSV, cell
density and & formulation
Hydrocarbon Conversion over Pt Oxidation Catalyst

THE POWER OF CATALYSIS
Estimating Catalytic Performance on VOCs
THC Constituent
ExhaustComposition
Ethylene 3.0%Propylene 0.5%
Formaldehyde 2.0%Butane 0.9%
Propane 3.9%
20
High oxidation efficiency
More difficult to oxidize
Most stable and most difficult to oxidize
Overall performance is a weighted-average

THE POWER OF CATALYSIS400
450
500
550
600
650
700
750
800
850
900
950
1000
1050
1100
Cat
alys
t Ope
ratin
g Te
mpe
ratu
re (F
)Field Experience >240 GTs

THE POWER OF CATALYSIS
Low Catalyst TempsImpose Other Risks to Owner
• BEWARE: Below 600oF a number of contaminants are prone to accumulation– Even common masking agents (sulfur) could be
problematic– If mixed with high temp cases, desorption is possible
• Of >240 installations the few that experienced high levels of contamination– All below 600oF– All accumulated enormous amounts of sulfur and
phosphorous
22

THE POWER OF CATALYSIS
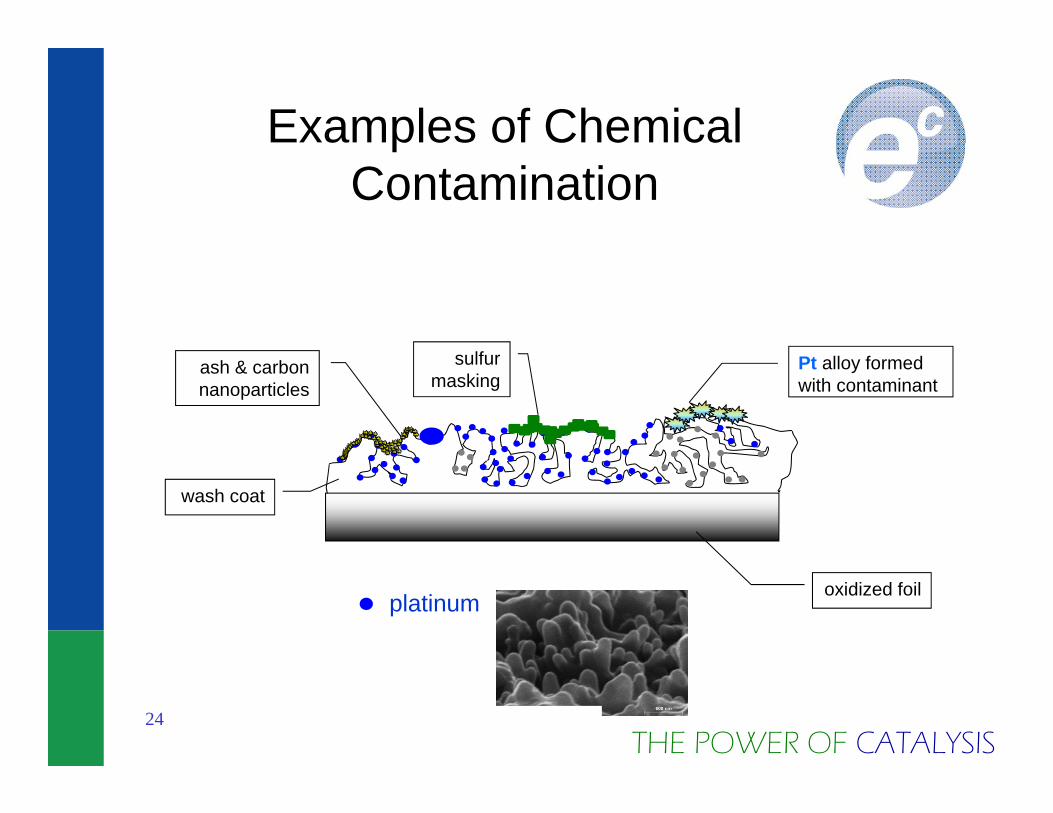
High Surface Area Coatings
55 football fields of surface areain every cubic foot of catalyst!
THE POWER OF CATALYSIS24
Pt alloy formed with contaminant
platinumoxidized foil
wash coat
Examples of Chemical Contamination
sulfur masking
ash & carbon nanoparticles

THE POWER OF CATALYSIS25
Turbine Make & Model GE 7EACatalyst Operating Temperature 505 (unfired) - 615F (fired)
Catalyst GHSV 106,000 - 163,000
• Operation typically <600F• Pipeline quality natural gas• H2S in evap water
Case Study #1: Sulfur Accumulationat Low Temperature
Sulfur Accumulation
14,613 mg S/ft3after 250 hours (10 days)(exacerbated by carbon
buildup)

THE POWER OF CATALYSIS26
14,613 mgsulfur
accumulated on every ft3 of catalyst
in 250 hours (10 days)!!
THE POWER OF CATALYSIS27
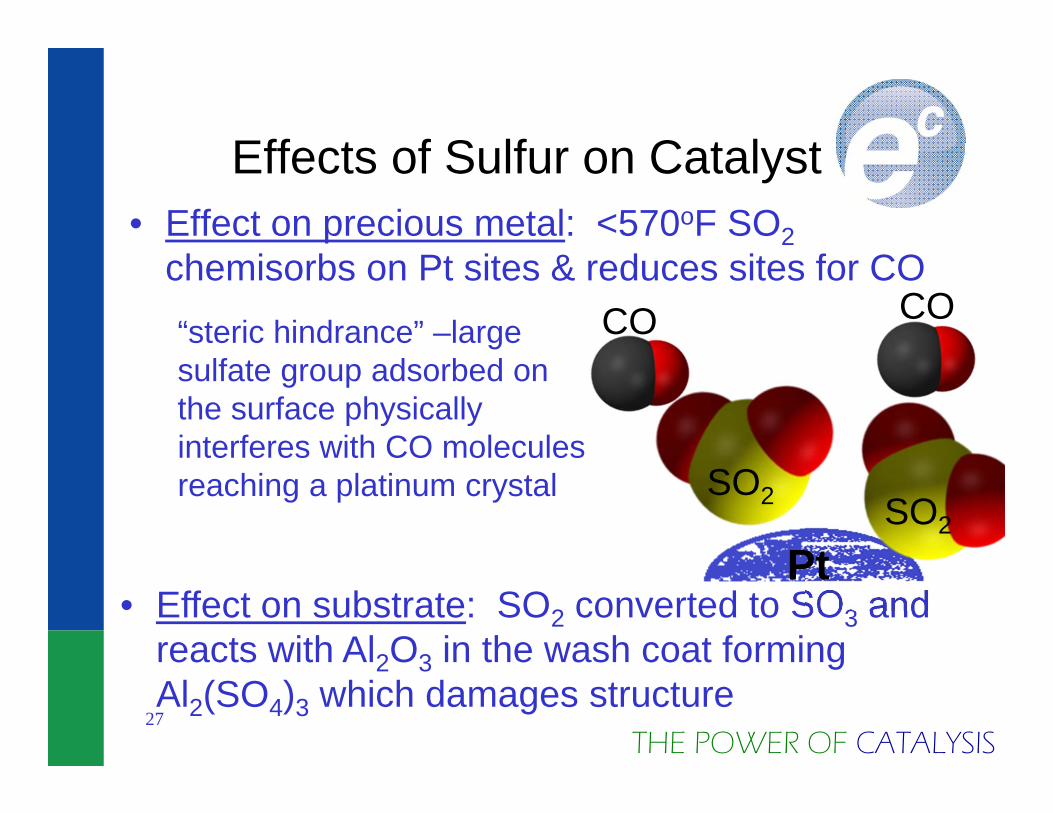
Effects of Sulfur on Catalyst• Effect on precious metal: <570oF SO2
chemisorbs on Pt sites & reduces sites for CO
“steric hindrance” –large sulfate group adsorbed on the surface physically interferes with CO molecules reaching a platinum crystal
• Effect on substrate: SO2 converted to SO3 and reacts with Al2O3 in the wash coat forming Al2(SO4)3 which damages structure
SO2
PtSO2
COCO
THE POWER OF CATALYSIS
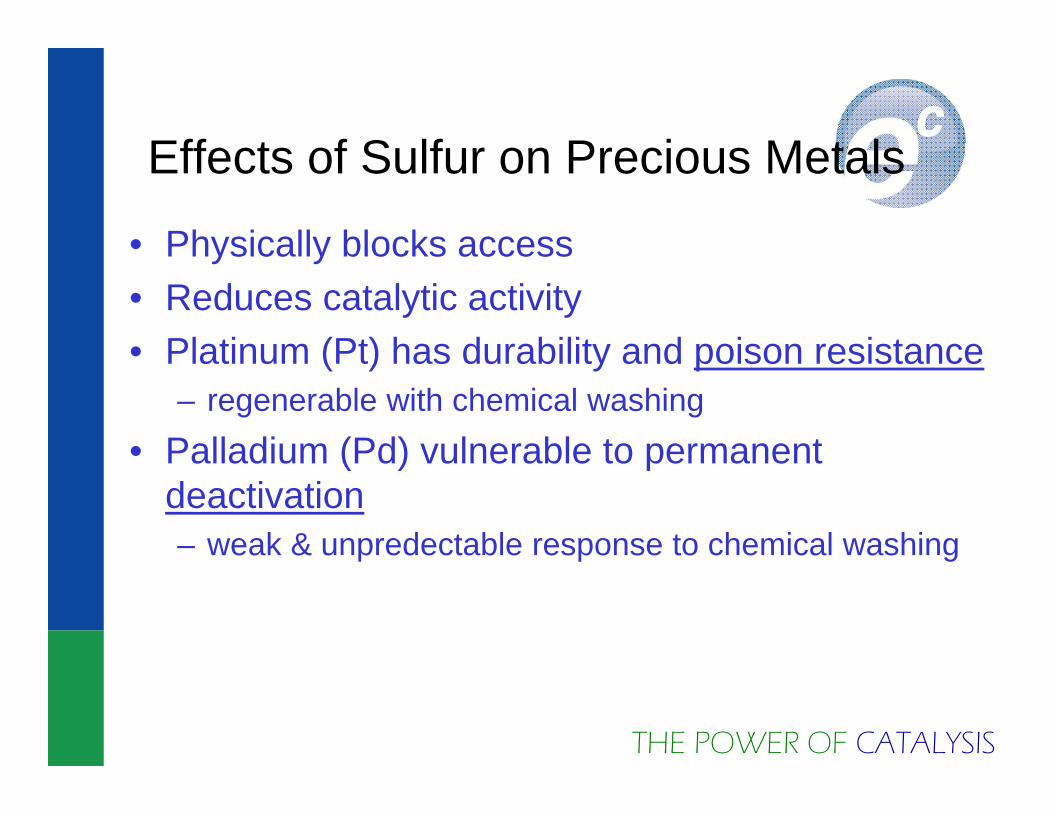
Effects of Sulfur on Precious Metals
• Physically blocks access• Reduces catalytic activity• Platinum (Pt) has durability and poison resistance
– regenerable with chemical washing• Palladium (Pd) vulnerable to permanent
deactivation– weak & unpredectable response to chemical washing
THE POWER OF CATALYSIS
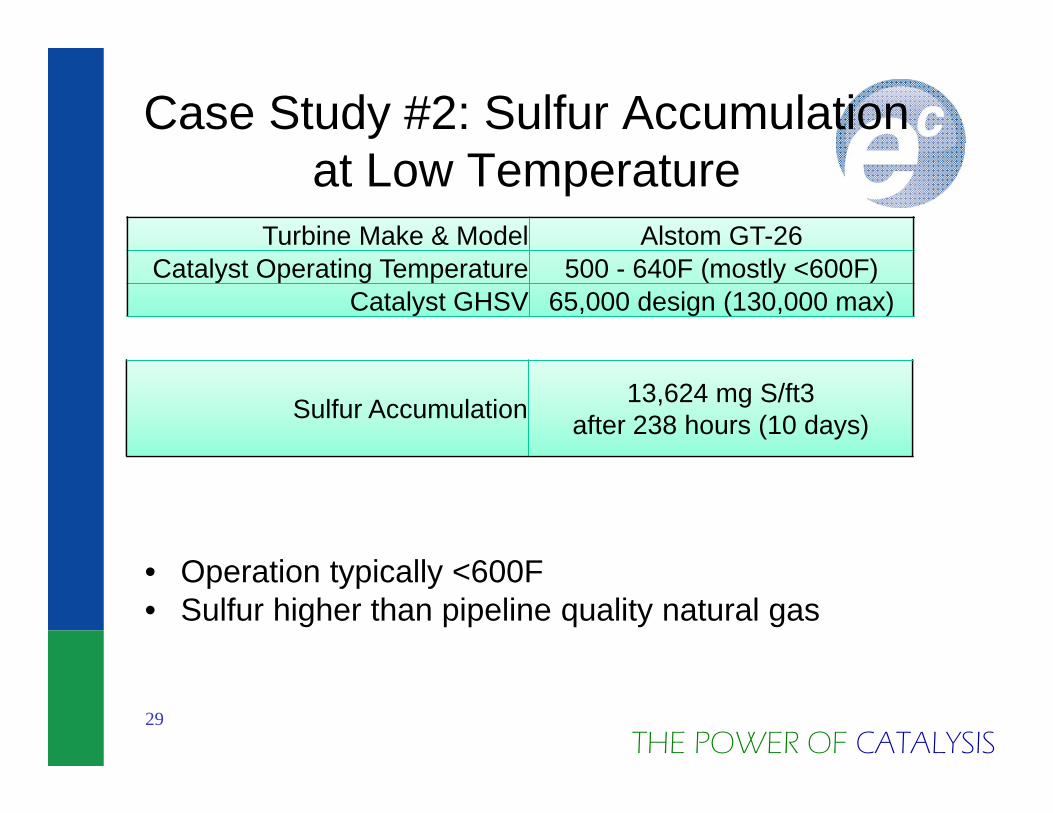
Case Study #2: Sulfur Accumulationat Low Temperature
29
Turbine Make & Model Alstom GT-26Catalyst Operating Temperature 500 - 640F (mostly <600F)
Catalyst GHSV 65,000 design (130,000 max)
• Operation typically <600F• Sulfur higher than pipeline quality natural gas
Sulfur Accumulation 13,624 mg S/ft3after 238 hours (10 days)

THE POWER OF CATALYSIS30
Turbine Make & Model GE 7FACatalyst Operating Temperature 504 (unfired) - 647F (fired)
Catalyst GHSV 118,000 - 197,000
• Operation typically <600F• pipeline quality natural gas
Case Study #3: Sulfur AccumulationAt Low Temperature
Sulfur Accumulation 19,036 - 20,943 mg S/ft3after 22 days
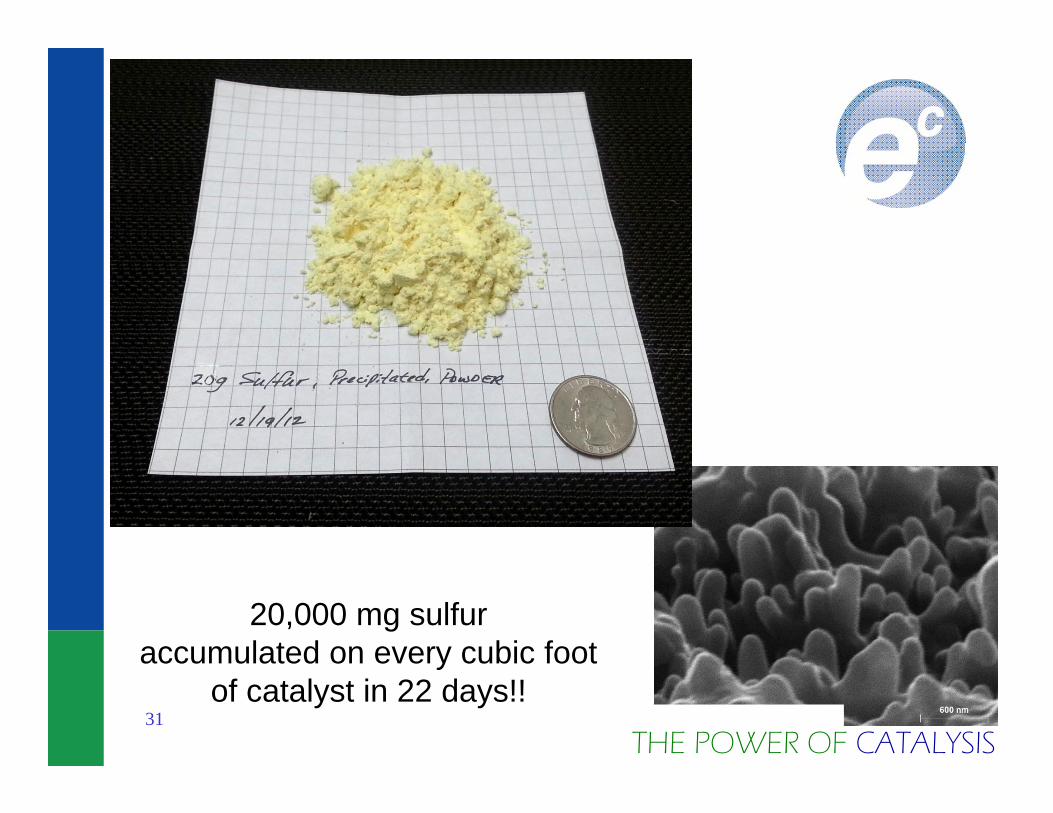
THE POWER OF CATALYSIS31
20,000 mg sulfuraccumulated on every cubic foot
of catalyst in 22 days!!

THE POWER OF CATALYSIS
Platinum Catalyst Responds to Chemical Washing
GHSV Pre-Wash CO Performance
Post-Wash CO Performance
357,000 6.4% 62.5%200,000 12.7% 85.8%150,000 15.7% 93.8%
Catalyst Manufacturer: EmeraChem, LLCDate of Manufacture: June 2000
Catalyst Type: Platinum Oxidation Condition: Temp = 525 F
(HI-flow)
(LO-flow)
THE POWER OF CATALYSIS33
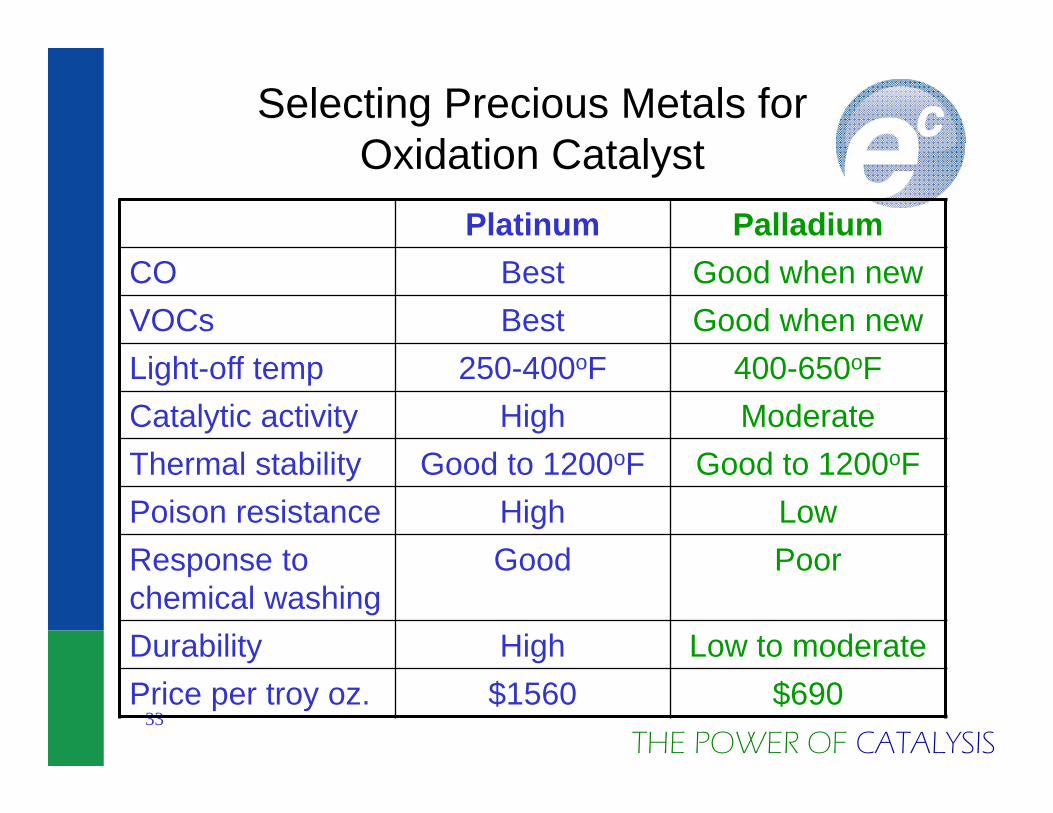
Selecting Precious Metals for Oxidation Catalyst
Platinum PalladiumCO Best Good when newVOCs Best Good when newLight-off temp 250-400oF 400-650oFCatalytic activity High ModerateThermal stability Good to 1200oF Good to 1200oFPoison resistance High LowResponse to chemical washing
Good Poor
Durability High Low to moderatePrice per troy oz. $1560 $690
THE POWER OF CATALYSIS
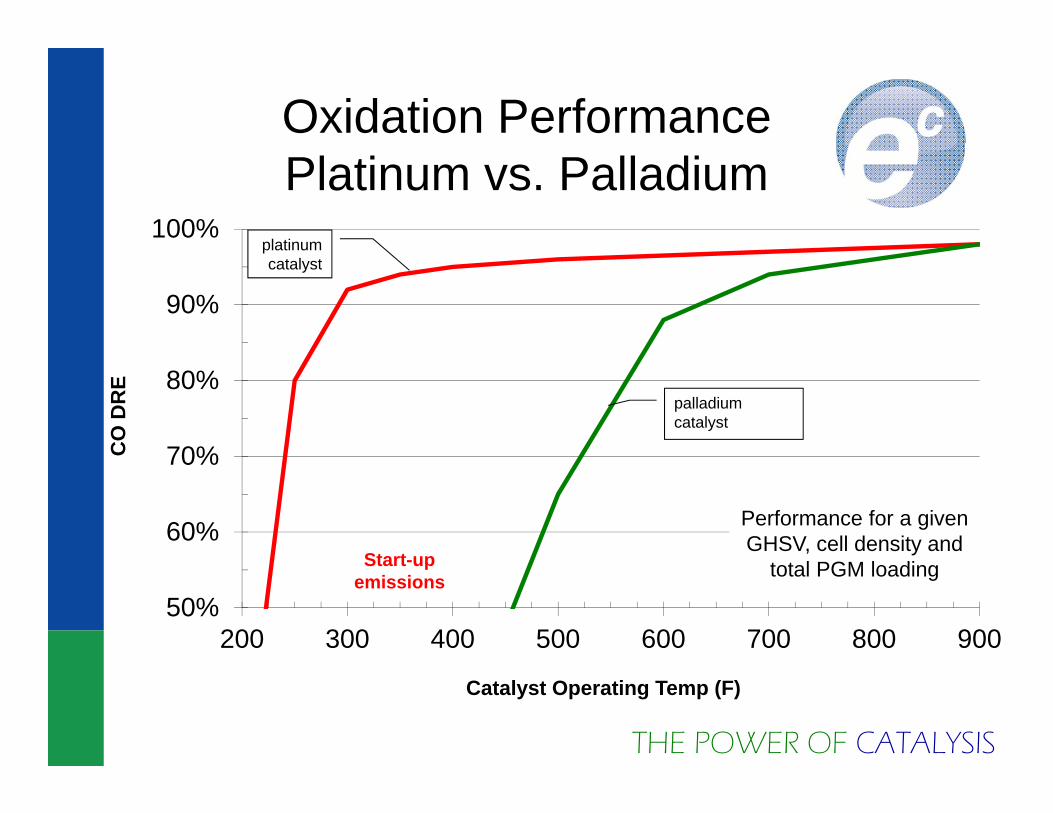
Oxidation PerformancePlatinum vs. Palladium
50%
60%
70%
80%
90%
100%
200 300 400 500 600 700 800 900
CO
DR
E
Catalyst Operating Temp (F)
platinum catalyst
palladium catalyst
Performance for a given GHSV, cell density and
total PGM loadingStart-up emissions

THE POWER OF CATALYSIS35
70
75
80
85
90
95
100
0.5 0.6 0.7 0.8 0.9 1 1.1 1.2 1.3 1.4 1.5
Cat
alys
t Per
form
ance
Eff
icie
ncy(
%)
Precious Metal Loading (normalized)
more durable
more economical
At a given temp, GHSV and cell
density
Performance as a Function of Precious Metal Loading
THE POWER OF CATALYSIS
What effect has platinum escalation
had on catalyst design and price?
THE POWER OF CATALYSIS
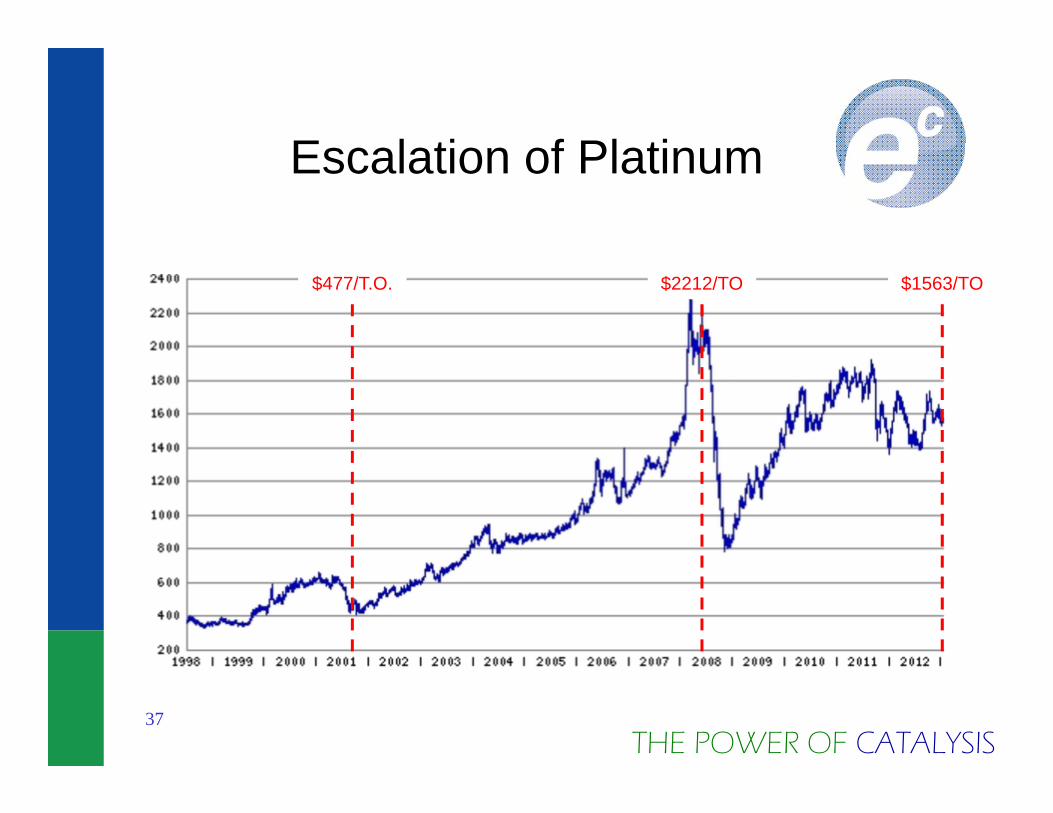
Escalation of Platinum
37
$477/T.O. $2212/TO $1563/TO
THE POWER OF CATALYSIS
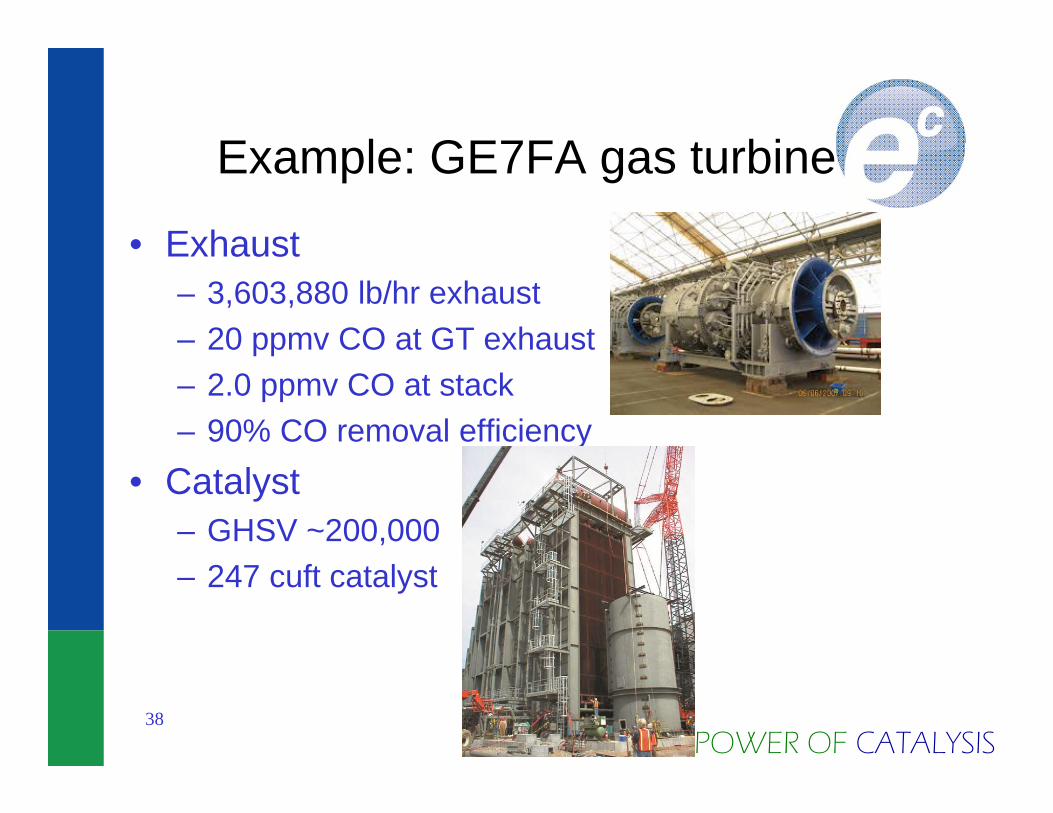
Example: GE7FA gas turbine
• Exhaust– 3,603,880 lb/hr exhaust– 20 ppmv CO at GT exhaust– 2.0 ppmv CO at stack – 90% CO removal efficiency
• Catalyst– GHSV ~200,000– 247 cuft catalyst
38

THE POWER OF CATALYSIS
Effect of Pt Price on Catalyst Design and Price
• August 2001– Platinum was similar in cost to the foil substrate– Catalyst companies used more platinum rather than
more substrate volume– Platinum loading of 28 to 42 g/ft3 was common– Extremely durable
• High-performance• Low-temperature light-off• Sulfur tolerant & regenerable• Tolerant of many start/stop cycles• 10-year life
– Pt cost for the GE 7FA was ~$136,000 for 36 g/ft3 39

THE POWER OF CATALYSIS
Effect of Pt Price on Catalyst Design and Price
• August 2001– Pt loading 36g/ft3 costs $136,000
• May 2008– Same Pt loading would have cost ~$633,000– Outcry from end users! “No way!”– Holding cost to $136,000 would buy <8 g/ft3
• Too risky; vulnerable to low-T and sulfur; low durability
– Some catalyst companies switched to palladium • $459/TO vs. $2,212 for platinum• Light-off temp higher than Pt (poor for startup emissions)• Poisoned by sulfur; not responsive to washing• Low durability40

THE POWER OF CATALYSIS
Effect of Pt Price on Catalyst Design and Price
• August 2001– 36 g/ft3 loading for $136,000
• May 2008– 36 g/ft3 for $633,000; <8 g/ft3 for $136,000
• Today, January 2013– Pt loading of 36 g/ft3 would cost ~$447,000 (too costly)– Spending $136,000 would buy 11 g/ft3 (too low)– Improved substrate & wash coat– Improved Pt application techniques (Pt size,distribution)– Restrictions on low-temp, sulfur, no. starts/stops– 10-yr expected life reduced to 3+ years41
THE POWER OF CATALYSIS
Simultaneous Collateral Reactions
• NO-NO2 Oxidation– Favors NO2 at low temps; NO at high temps– Effects SCR reactions, NH3 consumption– Destroys sulfur bound carbon nanoparticles
• SO2-SO3 Oxidation– Increases with temperature– Precursor to particulate matter– Ammonia slip reacts to form bi-sulfate particulate
after SCR• Catalyst formulations can suppress these

THE POWER OF CATALYSIS
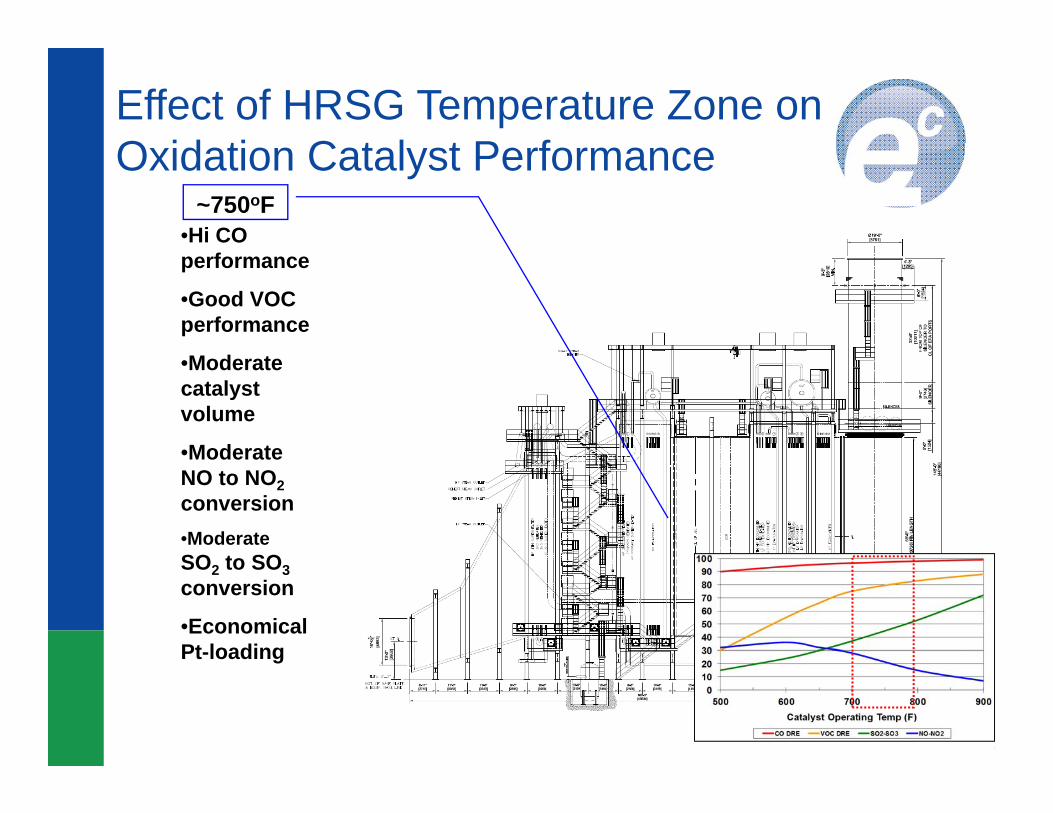
Overall Effect of Operating Temp on Catalyst Reactions
0102030405060708090
100
500 600 700 800 900
Con
vers
ion
Effic
ienc
y
Catalyst Operating Temp (F)CO DRE VOC DRE SO2-SO3 NO-NO2
For a given GHSV, cell density & formulation
CO
VOC
SO3
NO2

THE POWER OF CATALYSIS
Putting it all together…
How does HRSG temperature effect catalyst design and price?
44

THE POWER OF CATALYSIS
Effect of HRSG Temperature Zone on Oxidation Catalyst Performance
•Hi CO performance
•Hi VOC performance
•Lowest catalyst volume
•Lo NO to NO2conversion
•Hi SO2 to SO3conversion
•Lower Pt
•Lowest cost catalyst
~1000oF
THE POWER OF CATALYSIS
Effect of HRSG Temperature Zone on Oxidation Catalyst Performance
•Hi CO performance
•Good VOC performance
•Moderate catalyst volume
•Moderate NO to NO2conversion•Moderate SO2 to SO3conversion
•Economical Pt-loading
~750oF

THE POWER OF CATALYSIS
Effect of HRSG Temperature Zone on Oxidation Catalyst Performance
•Risk of sulfur accumulation with decreased life
•Increase Pt for low-T lightoff and protection from masking & poisoning
•Good CO performance
•Lo VOC performance
•Larger catalyst volume
•High NO to NO2conversion
•Low SO2 to SO3conversion
•Highest catalyst $$
500-550oF
THE POWER OF CATALYSIS
Effect of HRSG Temperature Zone on Catalyst System Price
• Examine EmeraChem catalyst in >70 large GTs – GE 7H, 501G– 7FA, 501F– 7EA, 501D5A
• Three temperature ranges– 500-650oF– 700-825oF– 850-1000oF
• Example of a GE7FA.05 at 3 temperatures
48
THE POWER OF CATALYSIS
Effect of HRSG Temperature Zone on Catalyst System Price
• Flow rate: 4,024,000 lb/hr• 90% CO reduction (10 to 1 ppm)• 67% VOC reduction (3 to 1 ppm)• Gas path: 72’x27’• Consider three temperature options:
– 550oF– 790oF– 1000oF
49

THE POWER OF CATALYSIS
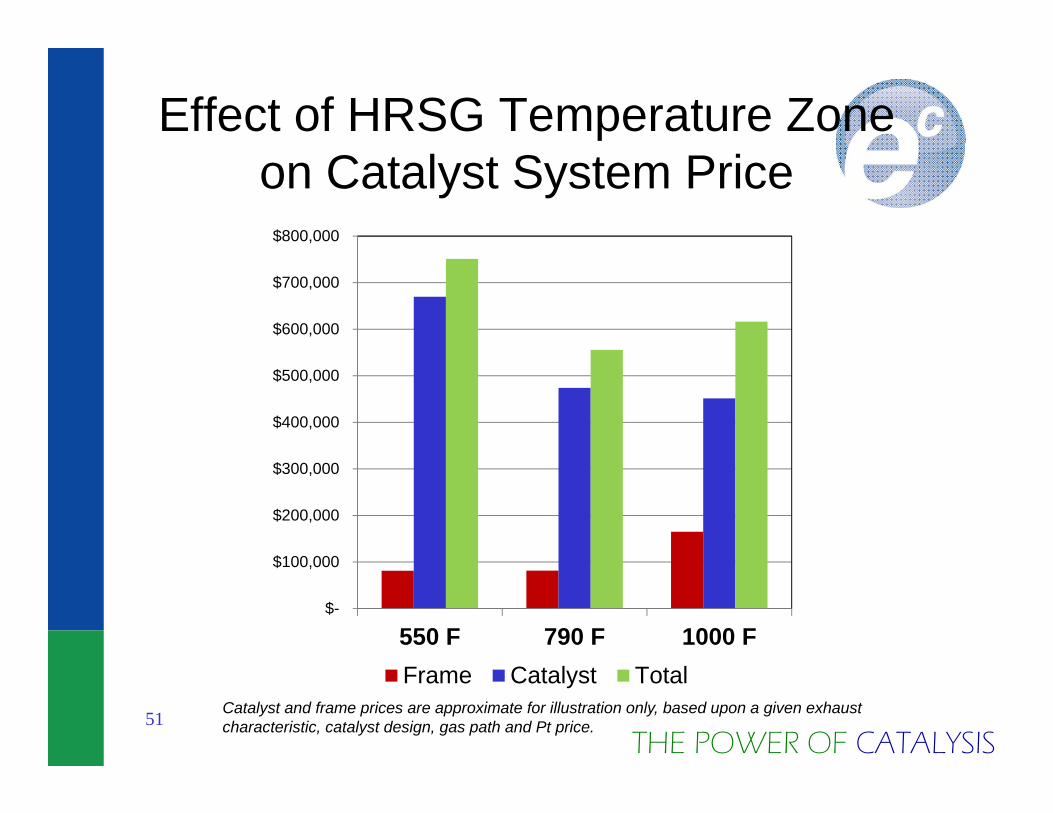
Effect of HRSG Temperature Zone on Catalyst System Price
550 F 790 F 1000 FCatalyst GHSV* 175,000 200,000 215,000Catalyst Volume 310 ft3
most catalyst due to lower activity
270 ft3 250 ft3least catalyst due
to high activity
Platinum Loading ~1.5Xmore Pt due to
likely accumulation of contaminants
X X
Frame Material carbon steel carbon steel stainless steel
50
* Catalyst GHSV is approximate for illustration only, based upon a given cell density and formulation.
THE POWER OF CATALYSIS
Effect of HRSG Temperature Zone on Catalyst System Price
51
$-
$100,000
$200,000
$300,000
$400,000
$500,000
$600,000
$700,000
$800,000
550 F 790 F 1000 FFrame Catalyst Total
Catalyst and frame prices are approximate for illustration only, based upon a given exhaust characteristic, catalyst design, gas path and Pt price.

THE POWER OF CATALYSIS
Evaluate all operating cases(temp, flow, performance)
52
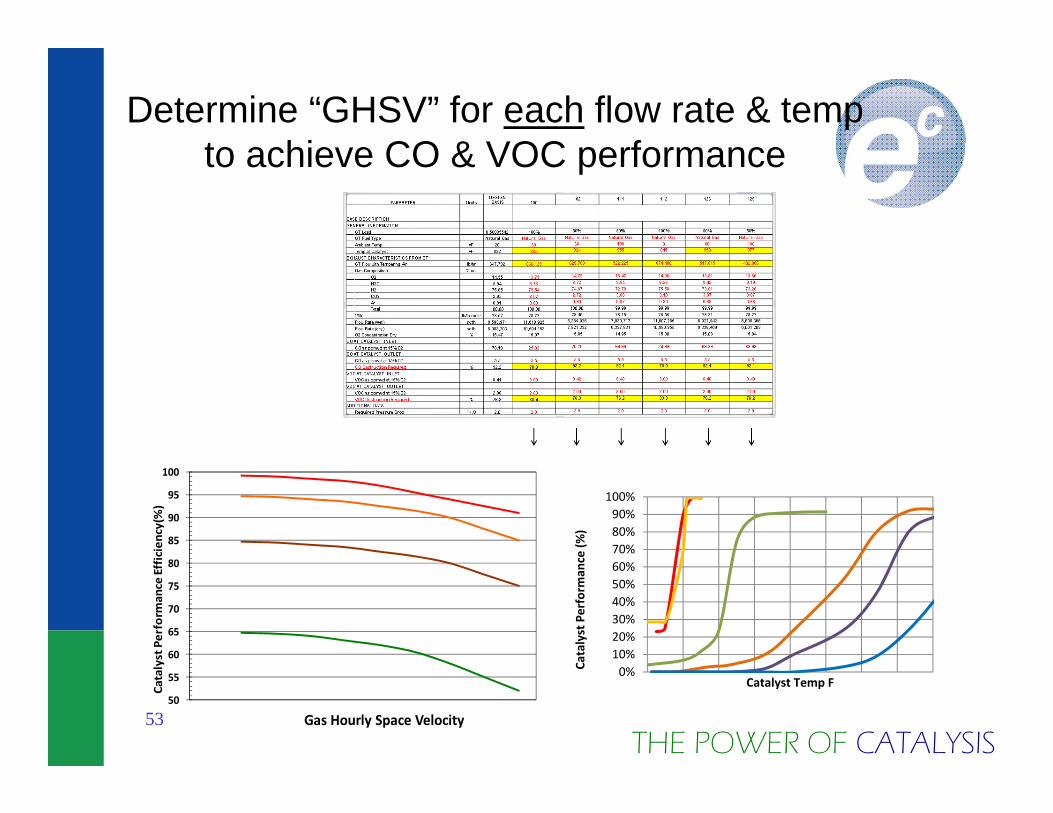
PARAMETER UnitsDESIGNBASIS 100
102 111 112 126 129
CASE DESCRIPTIONGENERAL INFORMATION
GT Load 0.50035542 100% 50% 50% 100% 50% 50%
GT Fuel Type Natural Gas Natural Gas Natural Gas Natural Gas Natural Gas Natural Gas Natural Gas
Ambient Temp oF 20 60 60 100 0 80 100
Temp at Catalyst oF 832 835 824 955 845 958 977
EXHAUST CHARACTERISTICS FROM GTGT Flow with Tempering Air lb/hr 647,792 866,129 629,703 522,225 874,486 517,015 492,086
Gas Composition % volO2 14.55 13.75 14.79 13.47 14.06 13.81 13.66
H2O 5.94 8.76 6.72 9.85 6.26 8.42 9.19
N2 75.65 73.54 74.87 72.70 75.58 73.81 73.20
CO2 2.95 3.07 2.72 3.09 3.19 3.07 3.07Ar 0.91 0.89 0.90 0.87 0.90 0.88 0.88
Total 100.00 100.00 100.00 99.99 99.99 99.99 99.99
MW lb/lb-mole 28.57 28.27 28.46 28.15 28.55 28.31 28.22
Flow Rate (wet) scfh 8,593,971 11,610,925 8,384,926 7,030,717 11,607,285 6,922,442 6,608,366
Flow Rate (dry) scfh 8,083,203 10,594,153 7,821,332 6,337,931 10,880,855 6,339,469 6,001,203
O2 Concentration Dry % 15.47 15.07 15.85 14.95 15.00 15.08 15.04
CO AT CATALYST INLETCO as ppmvd at 15% O2 70.10 25.02 70.20 69.99 24.99 69.99 69.99CO Flow lb/hr 38.6 19.4 34.7 33.1 20.1 32.3 30.8
CO AT CATALYST OUTLETCO as ppmvd at 15% O2 5.5 5.5 5.5 5.5 5.5 5.5 5.5
CO Destruction Required % 92.2 78.0 92.2 92.1 78.0 92.1 92.1
VOC AT CATALYST INLETVOC as ppmvd at 15% O2 8.41 3.00 8.42 8.40 3.00 8.40 8.40
VOC AT CATALYST OUTLETVOC as ppmvd at 15% O2 2.00 2.00 2.00 2.00 2.00 2.00 2.00
VOC Destruction Required % 76.2 33.4 76.3 76.2 33.3 76.2 76.2ADDITIONAL DATA
Required Pressure Drop "H2O 2.0 2.0 2.0 2.0 2.0 2.0 2.0
Expected Pressure Drop "H2O 0.7 1.0 0.7 0.7 1.0 0.7 0.7
DETERMINE “GHSV” FOR EACH FLOW RATE AND TEMPERATURETO ACHIEVE REQUIRED CO & VOC PERFORMANCE
THE POWER OF CATALYSIS
Determine “GHSV” for each flow rate & tempto achieve CO & VOC performance
5350
55
60
65
70
75
80
85
90
95
100
Catalyst Perform
ance Efficiency(%)
Gas Hourly Space Velocity
0%10%20%30%40%50%60%70%80%90%
100%
Catalyst Perform
ance (%
)
Catalyst Temp F
THE POWER OF CATALYSIS54
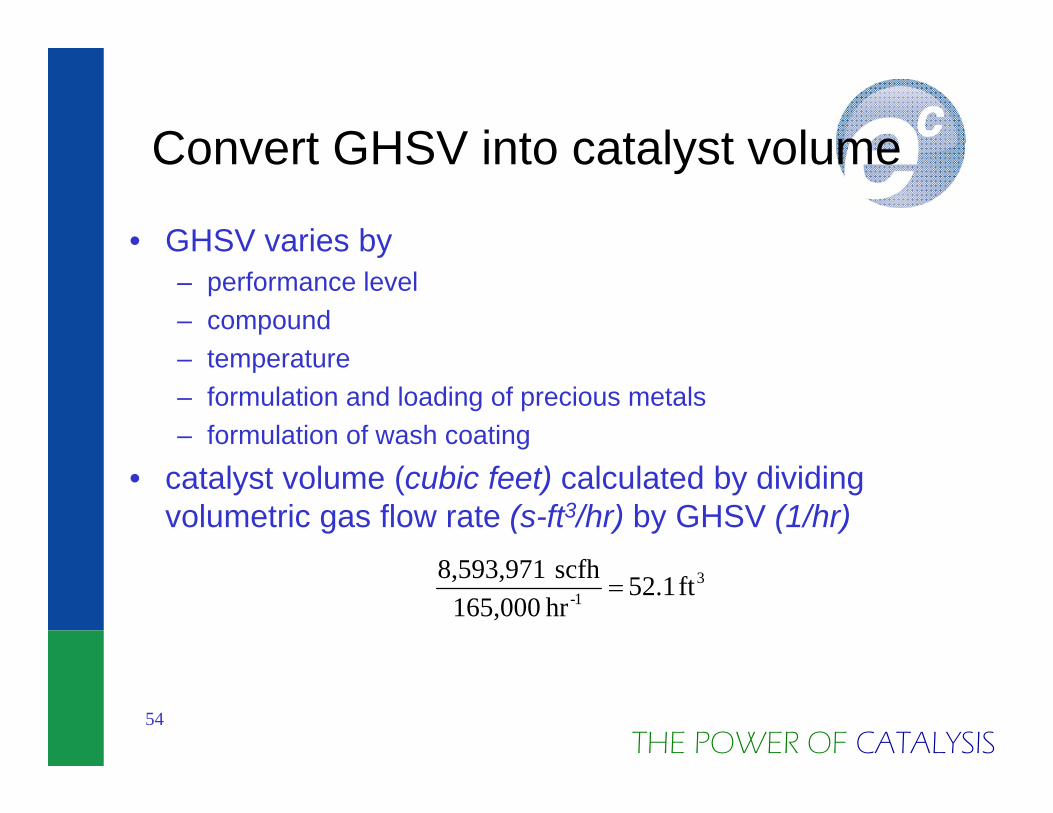
Convert GHSV into catalyst volume
• GHSV varies by – performance level– compound– temperature– formulation and loading of precious metals– formulation of wash coating
• catalyst volume (cubic feet) calculated by dividing volumetric gas flow rate (s-ft3/hr) by GHSV (1/hr)
31- ft 52.1
hr 165,000scfh 8,593,971

THE POWER OF CATALYSIS
Calculate the required catalyst volume for each case
55
31- ft 52.1
hr 165,000scfh 8,593,971
IDENTIFY CASE
REQUIRINGHIGHESTCATALYSTVOLUME
“DESIGN CASE”
THE POWER OF CATALYSIS
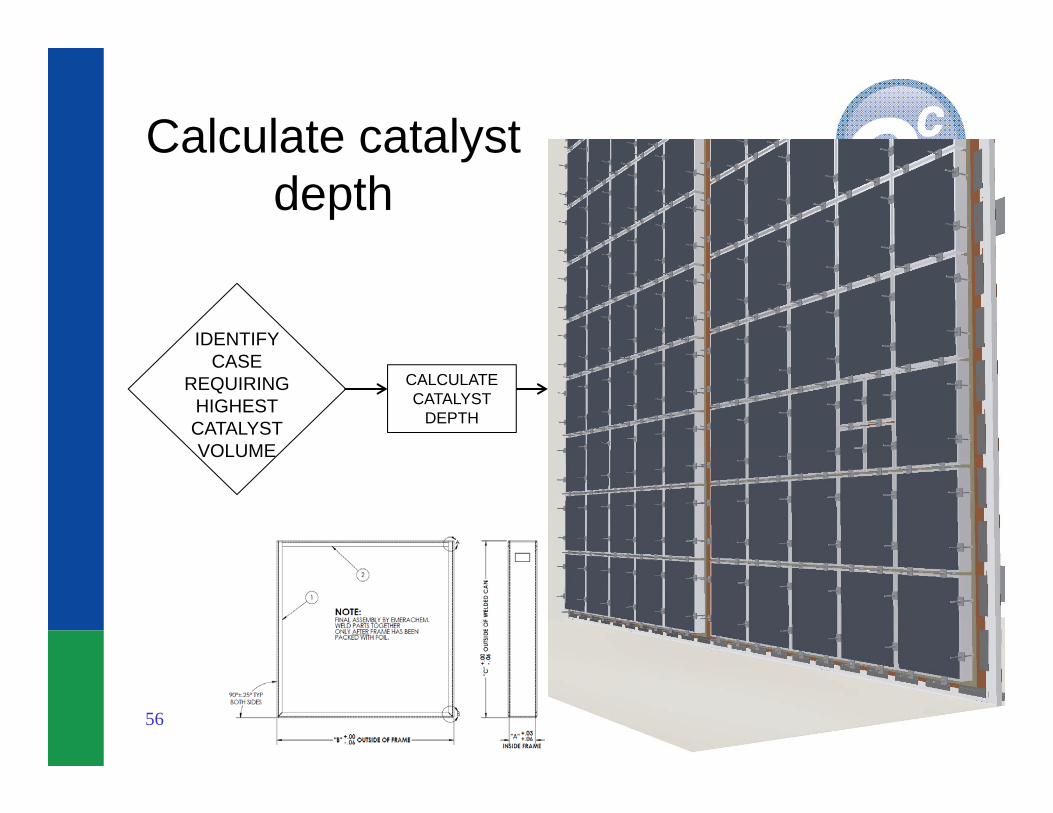
Calculate catalyst depth
56
IDENTIFY CASE
REQUIRINGHIGHESTCATALYSTVOLUME
CALCULATE CATALYST
DEPTH
THE POWER OF CATALYSIS
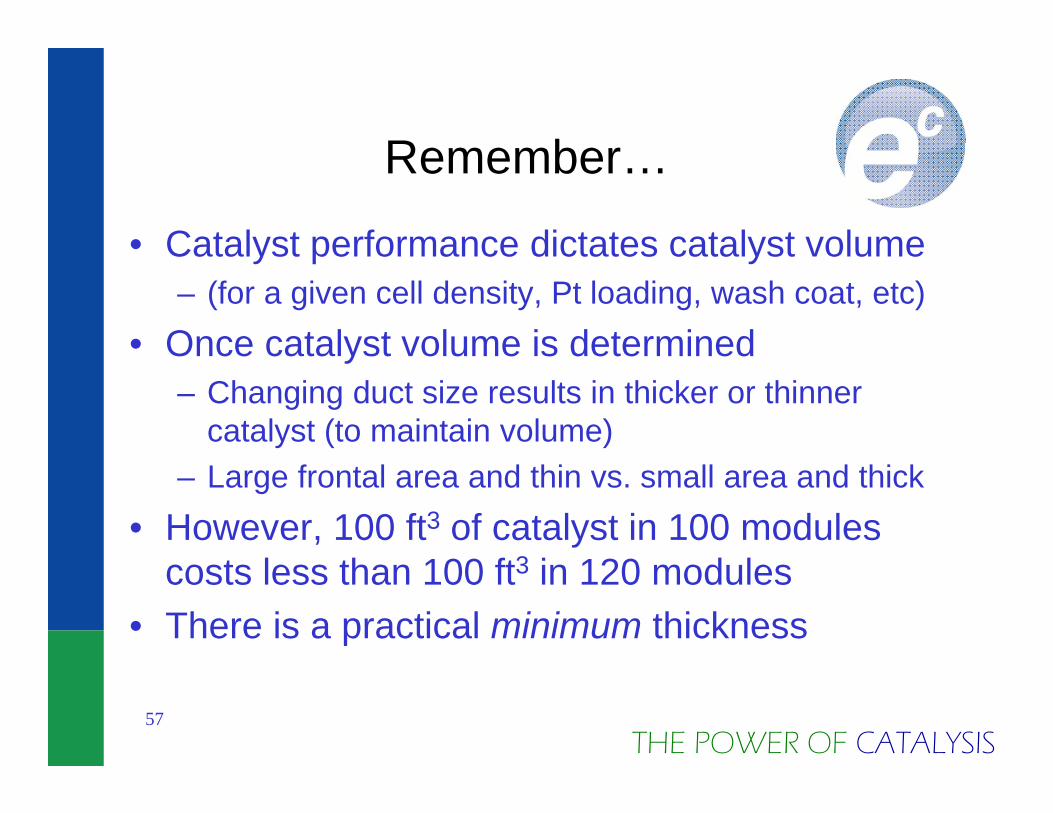
Remember…
• Catalyst performance dictates catalyst volume– (for a given cell density, Pt loading, wash coat, etc)
• Once catalyst volume is determined– Changing duct size results in thicker or thinner
catalyst (to maintain volume)– Large frontal area and thin vs. small area and thick
• However, 100 ft3 of catalyst in 100 modules costs less than 100 ft3 in 120 modules
• There is a practical minimum thickness
57
THE POWER OF CATALYSIS
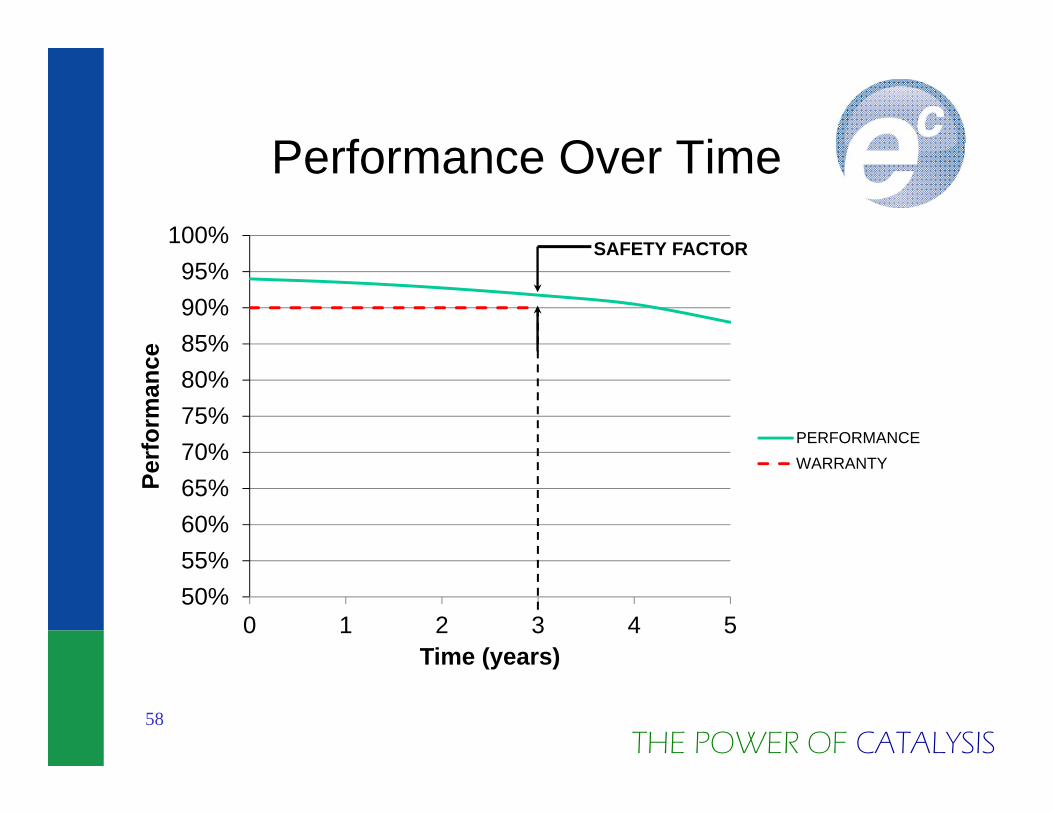
Performance Over Time
50%55%60%65%70%75%80%85%90%95%
100%
0 1 2 3 4 5
Perf
orm
ance
Time (years)
PERFORMANCEWARRANTY
58
SAFETY FACTOR

THE POWER OF CATALYSIS
Origin of “Safety Factor”
• Emission performance over time is a function of system variables– type of combustion turbine– start-up profiles (no. starts/stops/yr.) – water injection & evap cooling– exhaust gas temperature– engine fuel composition – particularly Sulfur– seals, leakage and bypass– contaminants present in engine exhaust – effect of engine lube oil on catalyst
• Owners don’t report data over time for every combination
59
THE POWER OF CATALYSIS
Thank you from EmeraChem