A special issue on Kano's Methods for Understanding Customer ...

Integrating Grey Theory into Kano's QFD Based on Data Mining to Enhance Supply Market Survey with Purchasing
CHIH-HUNG HSU1*, AN-YUAN CHANG2, HUI-MING KUO3,
1*Institute of Lean Production Management, Hsiuping Institute of Technology
11, Gungye Road, Dali, Taichung County 412, TAIWAN, R.O.C. *Corresponding author’s e-mail: [email protected] http://chhsu.tw
2Institute of Industrial Engineering and Management, National Formosa University
No.64, Wunhua Road, Huwei, Yunlin County 632, TAIWAN, R.O.C.
3Department of Logistics Management, Shu-Te University 59, Hun Shan Road, Yen Chau, Kaohsiung County 824, TAIWAN, R.O.C.
[email protected] [email protected]
Abstract: - Supply Market survey, which contain hard to find market survey information, including market value, market volume, competitor analysis and market forecasts. These information will enable purchaser to understand the key market drivers within the supplies industry and gain insight into the key issues and leading companies within the market. Data mining has been successfully applied in many fields. However, little research has also been applied to evaluate service quality for the mobile phone of various brands using the integrated approach involving grey relational analysis, Kano's model and quality function development. This study attempts to evaluate service quality for helping decision makers to guide improvement efforts in strengthening their important customer attributes and technical characteristics, and to facilitate decision analysis by using an integrated approach. By applying the proposed approach, service quality can be found to improve supply market survey with purchasing. The results of this study can provide an effective procedure of enhance competitiveness in the marketplace.
Key-Words: - Supply market survey with purchasing, Data mining, Grey relational analysis, Kano's model, Quality function deployment, Technical characteristics. 1 Introduction
Supply market survey assist procurement planning and the ongoing management of supply arrangements by identifying structure of the market, market behaviours, supply chain, barriers to market entry, environmental factors, ethical considerations and the buyer’s value in the market [19]. Successful supply market survey can establish a competitive advantage in the marketplace by reducing supply costs and risks. The goal of supply market survey is to identify and assess how changing elements of the marketing mix impacts customer behavior. Supply market survey is often partitioned into two sets of categorical pairs, either by target market [16]:
Customer, and Business-to-business (B2B).
Customers have an expectation about the service quality. If their actually experience than their expectations, then they will feel satisfy. If not, then they will feel not satisfy. Therefore, satisfaction is a tool to measure in each field of
people's feelings of service quality, and it is widely used and is also an approval measure index [23]. In Taiwan, the penetration rate of mobile phones was the highest in the world [10]. Mobile phone is a high value-added product, so the service quality is critical issue for the purchasers and manufacturers. Service quality of a mobile phone is always considered as one of very necessary steps in the mobile phone development and marketing procedure. In order to fulfill high service quality, the service quality should be identified and analyzed.
In related service quality studies, most literature on service quality is based upon the traditional one-dimension quality model. That is, the result is restricted that if a service provider delivers what customers expected well, the customers are satisfied. If not, the customers are not satisfied. This traditional one-dimension quality model is not enough [14, 23]. On the other hand, the Kano's two-dimension quality model (Kano's model) argues that quality element's sufficiency may not enough
WSEAS TRANSACTIONS on INFORMATION SCIENCE and APPLICATIONS Chih-Hung Hsu, An-Yuan Chang, Hui-Ming Kuo
E-ISSN: 2224-3402 37 Issue 2, Volume 9, February 2012

to satisfy the customer's quality expectation. Sometimes it may be result in unsatisfied or no feeling for the customer. This is the core concept of the Kano's model. Focused on the service quality, Witell [3], Matzler [15], Tan [13], Jane [2], Chen and Lee [23] agree that the Kano's model has more profits.
In addition, data mining has been successfully applied in many fields and plausible in prediction [6], biomedical technology [20], investment risk [9], human resource management [17], manufacturing [5], production schedule [7], marketing [16] and others [19]. However, little research has also been applied to evaluate service quality for the mobile phone of various brands using the integrated approach involving grey relational analysis, Kano's model and quality function development (QFD). The penetration rates of mobile phones for Brand N, Brand M and Brand S were the top three in Taiwan, so this study proposes an integrated approach, using a large questionnarie database, to evaluate service quality of three brands for the professional bussiness purchaser in Taiwan. By applying the proposed approach, service quality can be found to enhance supply market survey with purchasing competitiveness in the mobile phone marketplace.
2 Kano's Model and QFD 2.1 Kano's Model Kano et al. (1984) established a model to categorize the customer attributes of a product or service based on how well they are able to satisfy customer needs [13, 18, 21]. The Kano's categories of perceived quality are as follow.
(1) Attractive quality element
Attractive quality elements can be described as surprise and delight attributes; they provide satisfaction when achieved fully, but do not cause dissatisfaction when not fulfilled [3, 21].
(2) One-dimensional quality element
For these customer needs, customer satisfaction is a linear function of the performance of the product / service attribute. High attribute performance leads to high customer satisfaction [13].
(3) Indifferent quality element
Indifferent quality element refers to asoects that are neither good nor bad. The attribute performance do not result in either customer satisfaction or customer dissatisfaction [3].
(4) Must-be quality element
For these customer needs, customers become dissatisfied when performance of the product / service attribute is low. However, customer satisfaction does not rise above neutral even with a high performance of the product / service attribute [13].
(5) Reverse quality element
For these needs, customers become dissatisfied when performance of the product / service attribute is high. It refers to a low degree of achievement resulting in satisfaction.
The following diagram is the popularly named Kano's categories as Figure 1.
Fig. 1. Kano's categories.
WSEAS TRANSACTIONS on INFORMATION SCIENCE and APPLICATIONS Chih-Hung Hsu, An-Yuan Chang, Hui-Ming Kuo
E-ISSN: 2224-3402 38 Issue 2, Volume 9, February 2012

2.2 Quality Function Development QFD is a Japanese development and design technology. QFD was first introduced by Akao in 1972 at Mitsubishi’s Kobe shipyard site, and then Toyota and its suppliers developed it further for a rust prevention study [8]. After the concept of QFD was introduced in the US through auto manufacturers and parts suppliers, many US firms, such as AT&T, Digital Equipment, Ford, GM, Hewlett-Packard, Procter & Gamble, and Raychem, applied QFD to improve product development and communication [1, 4, 17].
QFD has been widely applied to fulfil customer attributes and improve customer satisfaction in
many industries, because it is a cross-functional planning tool which is used to ensure that the voice of the customer is deployed throughout the product planning and design stages. Because the voice of customer is essential, the house of quality (HOQ) converts each customer attribute into one or more technical characteristics in the phase of QFD. The main goal of HOQ is to identify customer attributes and weights for the product (WHATs) and then to convert these requirements into technical characteristics (HOWs) [10, 18]. The components of HOQ are shown in Figure 2.
Fig. 2. Components of HOQ.
2.3 Grey Relational Analysis One of the most important grey theory techniques is grey relational analysis. Let the original reference sequence and comparability sequences be represented as and , i = 1, 2, . . .,m; k = 1, 2, . . ., n, respectively.
Data preprocessing is normally required since the range and unit in one data sequence may differ from the others. Data preprocessing is also necessary when the sequence scatter range is too large, or when the directions of the target in the sequences are different. Data preprocessing is a process of transferring the original sequence to a comparable sequence. Depending on the characteristics of data sequence, there are various methodologies of data
preprocessing available for the grey relational analysis [11, 12, 22].
If the target value of original sequence is infinite, then it has a characteristic of “the-larger-the-better”. The original sequence can be normalized as follows:
(1)
when the-smaller-the-better is a characteristic of the original sequence, then the original sequence should be normalized as follows:
WSEAS TRANSACTIONS on INFORMATION SCIENCE and APPLICATIONS Chih-Hung Hsu, An-Yuan Chang, Hui-Ming Kuo
E-ISSN: 2224-3402 39 Issue 2, Volume 9, February 2012
(2)
However, if there is a definite target value to be achieved, then the original sequence will be normalized in the form:
(3)
Or, the original sequence can be simply normalized by the most basic methodology, i.e. let the values of original sequence are divided by the first value of the sequence:
(4)
where is the original sequence, the sequence after the data preprocessing, max the largest value of and min the smallest value of .
After data preprocessing is carried out, a grey relational coefficient can be calculated with the preprocessed sequences. The grey relational coefficient is defined as follows:
(5)
where is the deviation sequence of the reference sequence and the comparability sequence.
(6)
The grey relational grade is a weighting-sum of
the grey relational coefficient [21]. It is defined as follows:
(7)
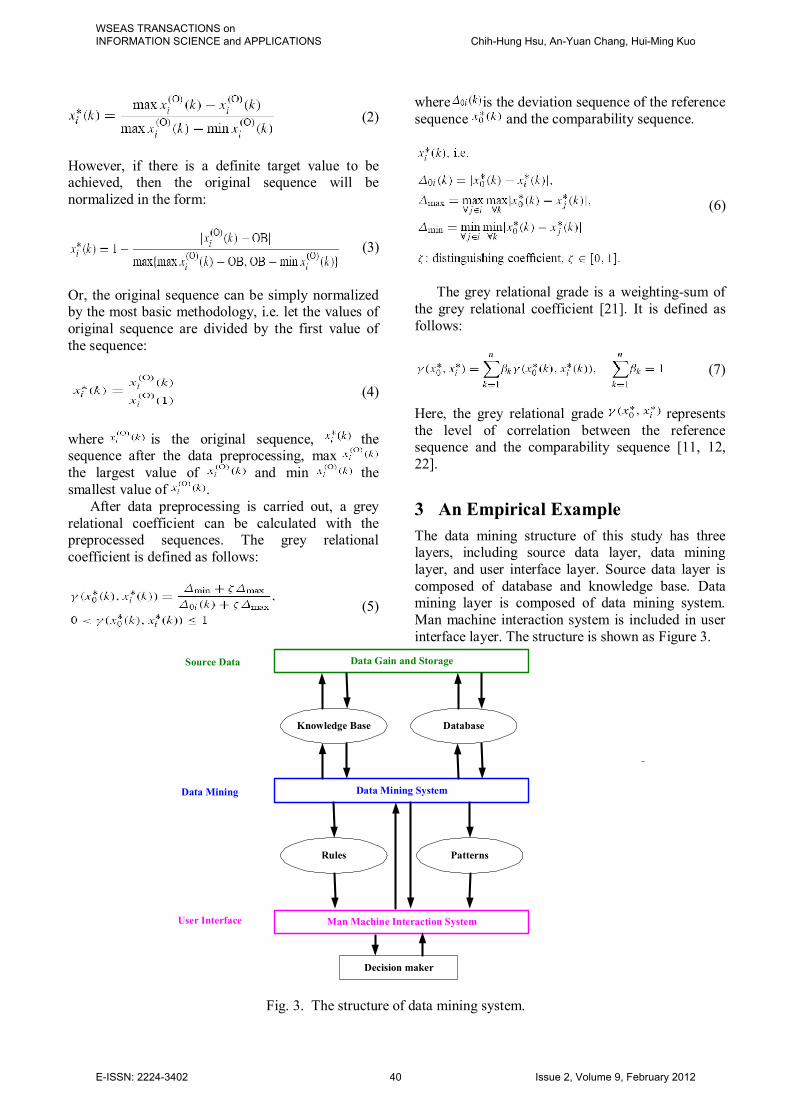
Here, the grey relational grade represents the level of correlation between the reference sequence and the comparability sequence [11, 12, 22]. 3 An Empirical Example The data mining structure of this study has three layers, including source data layer, data mining layer, and user interface layer. Source data layer is composed of database and knowledge base. Data mining layer is composed of data mining system. Man machine interaction system is included in user interface layer. The structure is shown as Figure 3.
Man Machine Interaction System
Decision maker
Rules Patterns
Data Mining System
Knowledge Base Database
User Interface
Data Mining
Source Data Data Gain and Storage
Fig. 3. The structure of data mining system.
WSEAS TRANSACTIONS on INFORMATION SCIENCE and APPLICATIONS Chih-Hung Hsu, An-Yuan Chang, Hui-Ming Kuo
E-ISSN: 2224-3402 40 Issue 2, Volume 9, February 2012

The data mining cycle involves a series of activities, from defining the problem to evaluating and applying the results [19]. The previous steps can be served as the baseline reference for the next step, and the steps are described as follow. 3.1 Defining The Problem for Data Mining
Owing to the unknown customer attribute and the priority analysis of technical characteristics for mobile phones markets, a professional bussiness purchaser create a large marketing database in Taiwan, based on many customer questionnaires on website, this resulted in a huge amount of data continuously. Customers are asked to prioritize their needs. This study proposed an integrated approach to evaluate service quality of three brands for the professional bussiness purchaser. This professional bussiness purchaser has been purchasing Brand N for many years, so they want to gain more information to make the best procurement decisions by conducting supply market survey. Furthermore, two brands of mobile phones are chosen to make a competitive analysis, i.e. Brand M and Brand S. The integrated approach involves a series of activities, grey relational analysis, Kano's model, and QFD based on data mining, from classifying customer attributes to mine the priority analysis of technical characteristics, so the results and discoveries can be encouraged and beneficial for the professional bussiness purchaser.
3.2 Data Preparation for Data Mining
In order to enhance the efficiency and ensure the accuracy of the results, the data was processed. It had to be checked and processed before mining the data, with all abnormal or missing data being separated out [7, 9, 19]. As a result, of the 12,000 questionnaires, 578, which had missing or abnormal data, were deleted. Also, there are several customer attributes for each customer questionnaire and twenty-five technical characteristics for the mobile phones.
3.3 Data Mining by An Integrated Approach
3.3.1 Classifying Customer Attributes into Kano's Categories
After cautious data mining and gathering, ten main customer attributes and their corresponding raw importances were identified. The raw importances had been identified by using a 1-5 scale as shown in TABLE 1. Customers are asked to rate their satisfaction degree for both Brand N and two competitors' brands using a 1-5 scale for each customer attribute. Through this way, customer attributes, raw importances and competitive analysis are mined and identified. To implement the proposed integrative approach, customers are also asked to group properly their needs into Kano's categories. The results can also be shown in Table 1.
Table 1 The raw importances, competitive analysis and Kano's quality elements
Competitive analysis Customer attribute
Raw important Brand N Brand M Brand S
Quality element
Modeling 3.9 3.9 3.7 3.9 O
Call quality 3.9 4.1 3.8 3.9 O
Protection 3.8 3.9 3.5 3.8 M
Storage function 3.7 3.8 3.6 3.7 M
Screen and key 3.8 3.9 3.5 3.8 M
Diversions 3.8 3.7 3.3 3.8 M
Simple operation 3.8 4.1 3.5 3.8 O
Brand value 3.9 4.1 3.6 3.9 O
Service 3.8 3.9 3.6 3.8 O
Accessory 3.7 3.8 3.5 3.7 O M: Must-be; O: One-dimensional.
WSEAS TRANSACTIONS on INFORMATION SCIENCE and APPLICATIONS Chih-Hung Hsu, An-Yuan Chang, Hui-Ming Kuo
E-ISSN: 2224-3402 41 Issue 2, Volume 9, February 2012
According to Table 1, this study analyze the whole customer attributes of three brands by using Kano's categories. By categorizing ten customer attributes, this study find that no one can be sorted as "attractive quality element". There are four essential customer attributes be classified as "must-be quality element" included "Protection", "Storage function", "Screen and key" and "Diversions". Six customer attributes are classified as "one-dimensional quality element" included "Modeling", "Call quality", "Simple operation", "Brand value", "Service" and "Accessory".
3.3.2 Adjustment of Improvement Ratio by Using Kano's Model
To achieve the desired customer satisfaction level. The final adjusted importance may provide such useful information by using Kano's model. Kano's model can be integrated to adjust the raw importance. Based on Brand N current position in regard to its competitors, along with other factors (i.e. rate of importance, strategic goals, etc.), determine and record in the matrix where the customer satisfaction targets to be. In competitive analysis, this study set the highest level as the targets.
After setting the customer satisfaction targets, the traditional improvement ratio (IR) can be calculated by dividing where the customer satisfaction targets to be by where the Brand N is now as follow. IR = (Target) / (The current customer satisfaction value of Brand N).
After grouping customer attributes into proper Kano's categories and choosing the appropriate transformation function (k values), the adjusted improvement ratio can be calculated as [14]:
AIR= kIR1
(8)
AIR: Adjusted improvement ratio
IR: Improvement ratio
k: k values (transformation function)
M: Must-be (k=0.5);
O: One-dimensional (k=1);
A: Attractive (k=2).
The adjusted improvement ratio represents the desired increment of the customer satisfaction degree, while it represents what we should do more to achieve the desired customer satisfaction degree. Finally, multiplied by the adjusted improvement ratio, the raw importance for each customer attribute can be adjusted into the final importance. Taking customer attribute (Diversions) as an example, the adjusted importance is gained as follow: 3.8 (the raw importance) × 1.06 (Adjusted improvement ratio)= 4.0. The results can also be shown in Table 2. 3.3.3 The Priority Analysis of Technical
Characteristics by Using Grey Relational Analysis.
Determining the correlation between each customer attribute (WHATs) and each technical characteristic (HOWs) at the intersection of these whats and hows, record the correlation. The professional bussiness purchaser sets twenty-five technical characteristics for the mobile phones to conduct the priority analysis by using grey relational analysis, and each technical characteristic has its own strengths and weaknesses. Thus, a cross-functional team is made to further evaluate the relationship between the technical characteristics and the customer attributes. QFD represent the respective strong (with a weight of 9), moderate (with a weight of 3), and weak relationship (with a weight of 1), while the blank is zero. The matrix relationship is shown in Figure 4. Grey relational analysis is applied to mine the priority from these technical characteristics by carring out the formula. The computational steps include the normalization of the original data sets, the grey relational coefficient, the grey relational grade and the results of the degree of grey coefficient in order. When all computational steps are completed, the total score can be calculated to prioritize the importance of these technical characteristics described in Figure 4.
WSEAS TRANSACTIONS on INFORMATION SCIENCE and APPLICATIONS Chih-Hung Hsu, An-Yuan Chang, Hui-Ming Kuo
E-ISSN: 2224-3402 42 Issue 2, Volume 9, February 2012
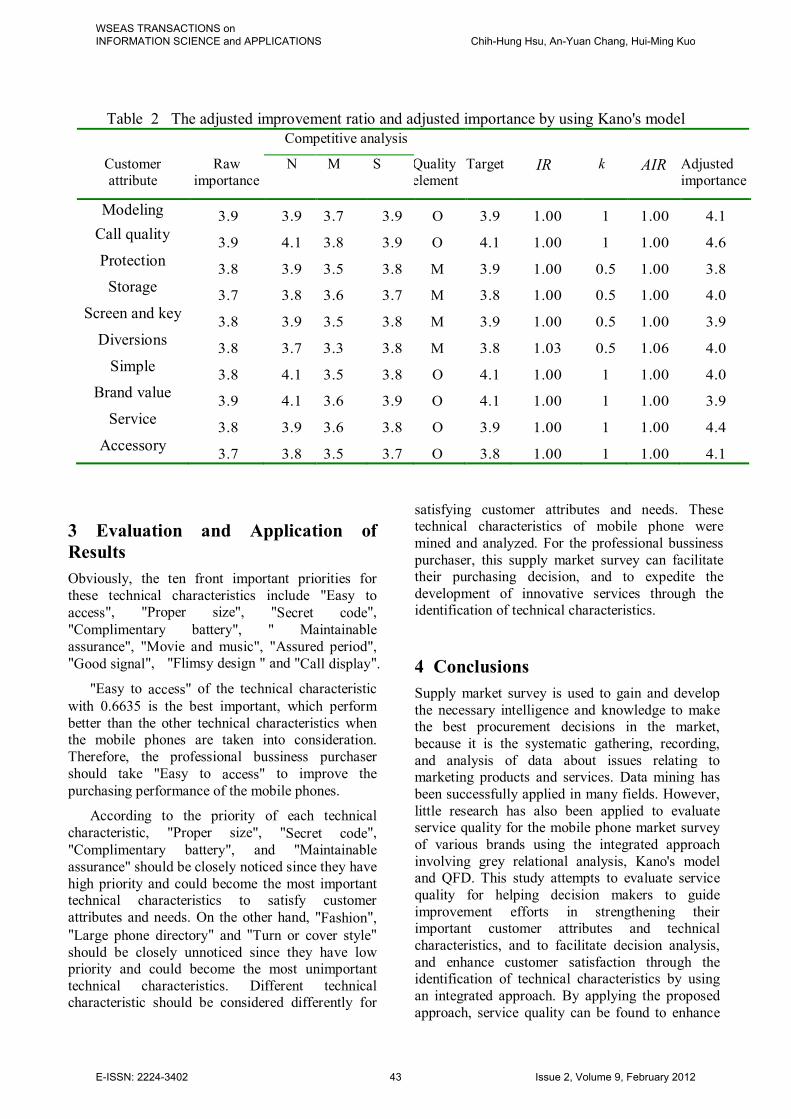
Table 2 The adjusted improvement ratio and adjusted importance by using Kano's model Competitive analysis
Customer attribute
Raw importance
N M S Quality element
Target IR k AIR Adjusted importance
Modeling 3.9 3.9 3.7 3.9 O 3.9 1.00 1 1.00 4.1 Call quality 3.9 4.1 3.8 3.9 O 4.1 1.00 1 1.00 4.6 Protection 3.8 3.9 3.5 3.8 M 3.9 1.00 0.5 1.00 3.8
Storage 3.7 3.8 3.6 3.7 M 3.8 1.00 0.5 1.00 4.0 Screen and key 3.8 3.9 3.5 3.8 M 3.9 1.00 0.5 1.00 3.9
Diversions 3.8 3.7 3.3 3.8 M 3.8 1.03 0.5 1.06 4.0 Simple 3.8 4.1 3.5 3.8 O 4.1 1.00 1 1.00 4.0
Brand value 3.9 4.1 3.6 3.9 O 4.1 1.00 1 1.00 3.9 Service 3.8 3.9 3.6 3.8 O 3.9 1.00 1 1.00 4.4
Accessory 3.7 3.8 3.5 3.7 O 3.8 1.00 1 1.00 4.1 3 Evaluation and Application of Results Obviously, the ten front important priorities for these technical characteristics include "Easy to access", "Proper size", "Secret code", "Complimentary battery", " Maintainable assurance", "Movie and music", "Assured period", "Good signal", "Flimsy design " and "Call display".
"Easy to access" of the technical characteristic with 0.6635 is the best important, which perform better than the other technical characteristics when the mobile phones are taken into consideration. Therefore, the professional bussiness purchaser should take "Easy to access" to improve the purchasing performance of the mobile phones.
According to the priority of each technical characteristic, "Proper size", "Secret code", "Complimentary battery", and "Maintainable assurance" should be closely noticed since they have high priority and could become the most important technical characteristics to satisfy customer attributes and needs. On the other hand, "Fashion", "Large phone directory" and "Turn or cover style" should be closely unnoticed since they have low priority and could become the most unimportant technical characteristics. Different technical characteristic should be considered differently for
satisfying customer attributes and needs. These technical characteristics of mobile phone were mined and analyzed. For the professional bussiness purchaser, this supply market survey can facilitate their purchasing decision, and to expedite the development of innovative services through the identification of technical characteristics.
4 Conclusions Supply market survey is used to gain and develop the necessary intelligence and knowledge to make the best procurement decisions in the market, because it is the systematic gathering, recording, and analysis of data about issues relating to marketing products and services. Data mining has been successfully applied in many fields. However, little research has also been applied to evaluate service quality for the mobile phone market survey of various brands using the integrated approach involving grey relational analysis, Kano's model and QFD. This study attempts to evaluate service quality for helping decision makers to guide improvement efforts in strengthening their important customer attributes and technical characteristics, and to facilitate decision analysis, and enhance customer satisfaction through the identification of technical characteristics by using an integrated approach. By applying the proposed approach, service quality can be found to enhance
WSEAS TRANSACTIONS on INFORMATION SCIENCE and APPLICATIONS Chih-Hung Hsu, An-Yuan Chang, Hui-Ming Kuo
E-ISSN: 2224-3402 43 Issue 2, Volume 9, February 2012

supply market survey with purchasing for the bussiness purchaser in the mobile phone marketplace.
Acknowledgment: The study was supported partially by the National Science Council, NSC 99-2815-C-164-006-H. References:
[1] Ansari and B. Modaress, Quality function development: the role of suppliers. International Journal of Purchase Management, Vol. 30, No. 4, pp.28-35, 1994.
[2] C. Jane and S. M. Dominguez, Citizens' role in health services: satisfaction behavior: ratio's model, Part2, Quality Management in Health Care, Vol. 12, No. 6, pp.72-80, 2003.
[3] C. Witell and S. M. Dominguez, Kano's theory of attractive quality and packaging, The Quality Management Journal, 12, pp.7-20, 2005.
[4] Griffin, Evaluating QFD’s use in US firms as a process for developing products. Journal of Product Innovation Management, Vol. 30, No.9, pp.171-187, 1992.
[5] F. Chien, A. Hsiao and I. Wang, Constructing semiconductor manufacturing performance indexes and applying data mining for manufacturing data analysis, Journal of the Chinese Institute of Industrial Engineers, Vol. 21, pp.313-327, 2004.
[6] X. Feng and X. Wang, Development of empirical models for surface roughness prediction in finish turning, International Journal of Advanced Manufacturing Technology, Vol. 20, pp.348-356, 2002.
[7] Y. Sha and C. H. Liu, Using data mining for due date assignment in a dynamic job shop environment, International Journal of Advanced Manufacturing Technology, Vol. 25, pp.1164-1174, 2005.
[8] G. S. Wasserman, On how to prioritise design requirements during the QFD planning process. IIE Transaction, Vol. 25, No. 3, pp.59-65,
1993.
[9] Becerra-Fernandez, S. H. Zanakis and S. Alczak, Knowledge discovery techniques for predicting country investment risk. Computer and Industrial Engineering, Vol. 43, pp.787-800, 2002.
[10] Kenichi and C. I. Wu, A comparative study of media cultures among Taiwanese and Japanese youth, Telematics and Informatics, Vol. 23, No. 2, pp.95-116, 2006.
[11] J. L. Deng, A Course on Grey System Theory, Huazhong University of Science and Technology Press, Wuhan, 1990.
[12] J. L. Deng, The Essential Methods of Grey Systems, Huazhong University of Science and Technology Press, Wuhan, 1992.
[13] K. C. Tan and T. A. Pawitra, Integrating SERVQUAL and Kano's model into QFD for service excellence development, Managing Service Quality, Vol. 1, No. 6, pp.418-430, 2001.
[14] K. C. Tan and X. X. Shen, Integrating Kano's model in the planning matrix of quality function deployment, Total Quality Management, Vol. 11, No. 6, pp.1141-1151, 2000.
[15] K. Matzler and H. H. Hinterhuber, How to make product development projects more successful by integrating Kano's model of customer satisfaction into quality function deployment, Technovation, Vol. 18, No. 8, pp.25-38, 1998.
[16] K. W. Wong, S. Zhou, Q. Yang and M. S. Yeung, Mining customer value: from association rules to direct marketing, Data Mining and Knowledge Discovery, Vol. 11, pp.57-79 , 2005.
[17] L. P. Sullivan, Quality function development (QFD): the beginning, the end, and the problem in between. A collection of presentations and QFD case studies. American Supplier Institute, 1987.
[18] L. ReVelle and M. Löfgren, The QFD Handbook, John Wiley, New York, 1998.
WSEAS TRANSACTIONS on INFORMATION SCIENCE and APPLICATIONS Chih-Hung Hsu, An-Yuan Chang, Hui-Ming Kuo
E-ISSN: 2224-3402 44 Issue 2, Volume 9, February 2012

[19] M. Berry and G. Linoff, Data mining techniques: for marketing, sales, and customer support, Wiley, New York, 1997.
[20] M. Maddour and M. Elloumi, A data mining approach based on machine learning techniques to classify biological sequences, Knowledge-Based Systems, Vol. 15, pp.217-223, 2002.
[21] N. Kano, F. Seraku, F. Takahashi and S. Tsjui, Attractive quality and must-be quality, Hinshitsu, Vol. 14, pp.147-156, 1984.
[22] T. C. Kuo and H. H. Wu, A green products development by applying grey relational analysis and green quality function deployment, International Journal of Fuzzy Systems, Vol. 5, No. 4, 2003.
[23] T. L. Chen and Y. H. Lee, Kano two-dimensional quality model and important performance analysis in the student's dormitory service quality evaluation in Taiwan, Journal of American Academy of Business, Vol. 31, No. 9, pp.324-331, 2006.
WSEAS TRANSACTIONS on INFORMATION SCIENCE and APPLICATIONS Chih-Hung Hsu, An-Yuan Chang, Hui-Ming Kuo
E-ISSN: 2224-3402 45 Issue 2, Volume 9, February 2012
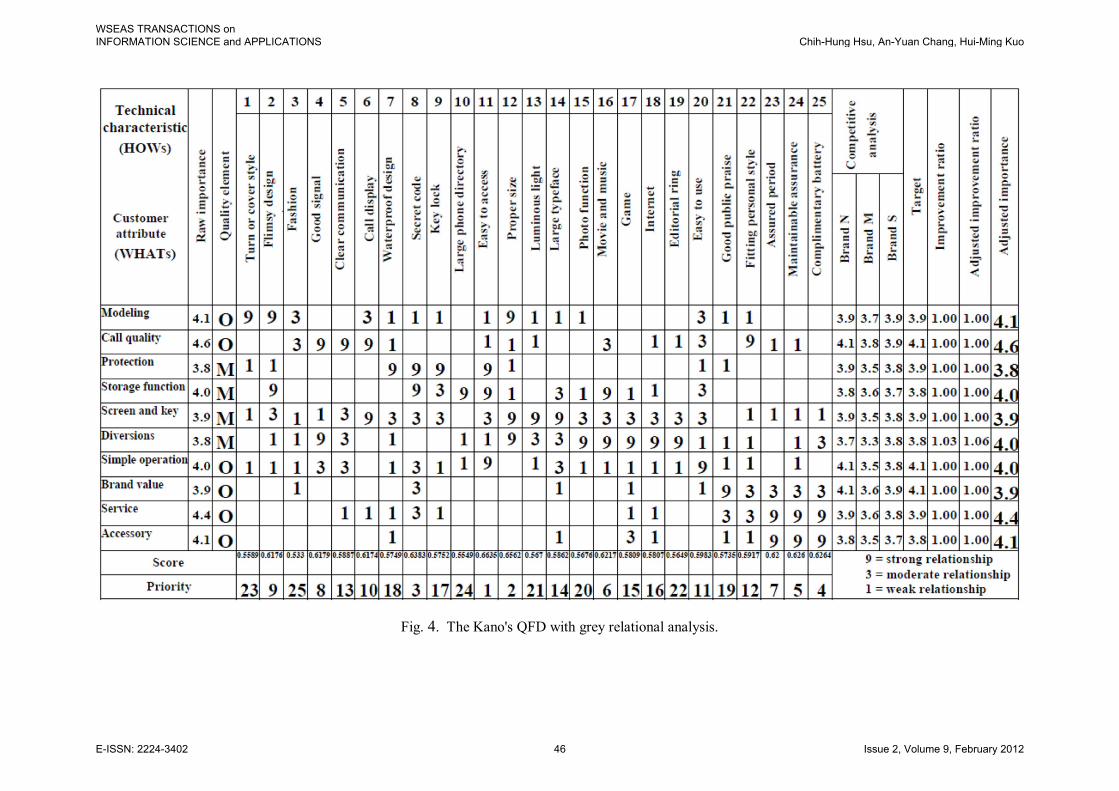
Fig. 4. The Kano's QFD with grey relational analysis.
WSEAS TRANSACTIONS on INFORMATION SCIENCE and APPLICATIONS Chih-Hung Hsu, An-Yuan Chang, Hui-Ming Kuo
E-ISSN: 2224-3402 46 Issue 2, Volume 9, February 2012

WSEAS TRANSACTIONS on INFORMATION SCIENCE and APPLICATIONS Chih-Hung Hsu, An-Yuan Chang, Hui-Ming Kuo
E-ISSN: 2224-3402 47 Issue 2, Volume 9, February 2012