INTEGRATING GREEN RATING SYSTEMS: A CASE · PDF fileFERRY TERMINAL STORMWATER PROJECTS By...
150
INTEGRATING GREEN RATING SYSTEMS: A CASE STUDY FOR FERRY TERMINAL STORMWATER PROJECTS By MICHAEL MARSHALL THOMPSON A thesis submitted in partial fulfillment of the requirements for the degree of MASTER OF SCIENCE IN CIVIL ENGINEERING WASHINGTON STATE UNIVERSITY Department of Civil and Environmental Engineering DECEMBER 2011
Transcript of INTEGRATING GREEN RATING SYSTEMS: A CASE · PDF fileFERRY TERMINAL STORMWATER PROJECTS By...

INTEGRATING GREEN RATING SYSTEMS: A CASE STUDY FOR
FERRY TERMINAL STORMWATER PROJECTS
By
MICHAEL MARSHALL THOMPSON
A thesis submitted in partial fulfillment of
the requirements for the degree of
MASTER OF SCIENCE IN CIVIL ENGINEERING
WASHINGTON STATE UNIVERSITY
Department of Civil and Environmental Engineering
DECEMBER 2011

ii
To the Faculty of Washington State University:
The members of the Committee appointed to examine the
thesis of MICHAEL MARSHALL THOMPSON find it satisfactory and recommend that
it be accepted.
____________________________
Liv Haselbach, Ph.D., Chair
____________________________
Mike Wolcott, Ph.D.
____________________________
Cara Poor, Ph.D.

iii
ACKNOWLEDGMENTS
I would like to acknowledge myself for being incredibly awesome.

iv
INTEGRATING GREEN RATING SYSTEMS: A CASE STUDY FOR
FERRY TERMINAL STORMWATER PROJECTS
Abstract
By Michael Marshall Thompson M.S. Washington State University
December 2011
Chair: Liv Haselbach
Washington State Ferries (WSF) has unique challenges when it comes to dealing with
sustainability, particularly with stormwater pollution. WSF terminals are intermodal facilities, include
over water structures (trestles), and are close to the Puget Sound. These factors present difficulties
when (1) using sustainability rating tools, and (2) when mitigating stormwater runoff. Most developing
sustainability tools are use specific, and none specifically apply to ferry terminals. Stormwater pollution
from the terminals might affect environmentally sensitive species in Puget Sound. Conventional low
impact development practices (LID) for stormwater mitigation tend to promote dispersed practices,
which is difficult at terminals due to limited land availability and proximity to the water.
When considering sustainable construction, there are a multitude of different guides and rating
systems available, several of which may in part be related to WSF facilities from the marine side, at the
intermodal interface, for buildings and other infrastructure, and through upland transportation modes.
The five following rating systems were chosen as being representative for WSF: GreenLITES, LEED,
Sustainable Sites Initiative, the Port Authority of NY/NJ Sustainable Infrastructure Guidelines, and the
Marine Vessel Environmental Performance Assessment (MVeP). Integration of the five rating systems

v
and a proposed WSU Ferry Sustainability Guide with the Safety Management System (SMS) of the
agency was developed into a Green Rating Integration Platform (GRIP) through reorganization of the
systems and then incorporation into a spreadsheet presentation. Future work could expand the GRIP for
other intermodal applications, and to include regulations and standards, further helping WSF and other
agencies to make sustainable decisions.
Stormwater focused aspects of sustainability through LID were then investigated through two
innovative strategies proposed for the Vashon Island Terminal; (1) a reverse slope on the trestle with
capture and treatment landside, and (2) the use of a pervious concrete trestle overlay in conjunction
with high efficiency sweeping. Different design options were analyzed for each of these strategies, and a
decision support tool created relating design to water quality implications and other factors. Both
strategies were further analyzed using the GRIP to see what credits they would be eligible for in each of
the selected rating systems.
vi
TABLE OF CONTENTS
ACKNOWLEDGMENTS…………………………………………………………………………………………………………………………….iii
ABSTRACT……………………………………………………………………………………………………………………………………………….iv
LIST OF TABLES………………………………………………………………………………………………………………….……………………ix
LIST OF FIGURES……………………………………………………………………………………………………………………..………………ix
DEDICATION…............................................................................................................................................xi
CHAPTER
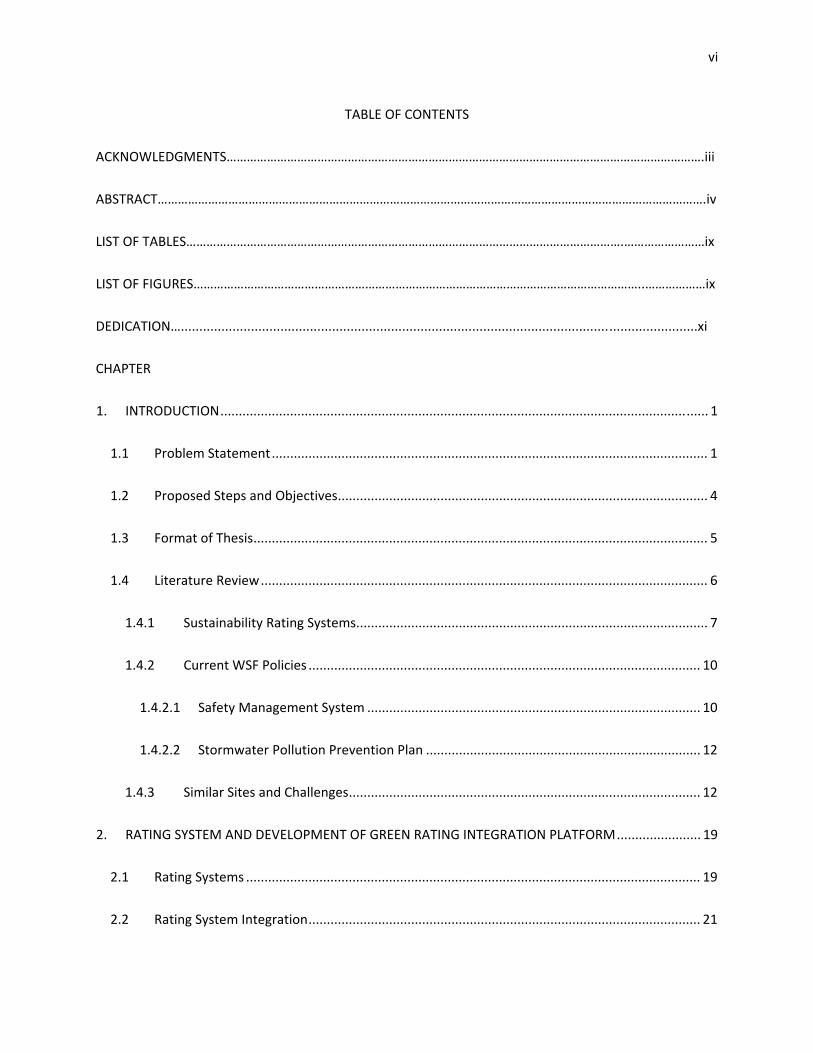
1. INTRODUCTION ..................................................................................................................................... 1
1.1 Problem Statement ....................................................................................................................... 1
1.2 Proposed Steps and Objectives ..................................................................................................... 4
1.3 Format of Thesis ............................................................................................................................ 5
1.4 Literature Review .......................................................................................................................... 6
1.4.1 Sustainability Rating Systems ................................................................................................ 7
1.4.2 Current WSF Policies ........................................................................................................... 10
1.4.2.1 Safety Management System ........................................................................................... 10
1.4.2.2 Stormwater Pollution Prevention Plan ........................................................................... 12
1.4.3 Similar Sites and Challenges ................................................................................................ 12
2. RATING SYSTEM AND DEVELOPMENT OF GREEN RATING INTEGRATION PLATFORM ....................... 19
2.1 Rating Systems ............................................................................................................................ 19
2.2 Rating System Integration ........................................................................................................... 21

vii
2.3 Stormwater Guidelines ............................................................................................................... 27
2.4 WSF Stormwater Pollution Prevention Plan ............................................................................... 31
2.5 Green Rating Integration Platform ............................................................................................. 32
3. VASHON ISLAND FERRY ....................................................................................................................... 34
4. REVERSE SLOPE‐LAND TREATMENT .................................................................................................... 40
4.1 Background ................................................................................................................................. 40
4.2 Hydrological Calculations ............................................................................................................ 42
4.3 Trestle Calculations ..................................................................................................................... 45
4.3.1 Option 1: Entire trestle replacement .................................................................................. 45
4.3.2 Option 2: Southern area trestle replacement ..................................................................... 48
4.3.3 Option 3: Extended southern area trestle replacement ..................................................... 51
4.4 Water Quality Implications ......................................................................................................... 56
4.5 Landside Calculations .................................................................................................................. 60
5. PERVIOUS CONCRETE‐SWEEPING ....................................................................................................... 64
5.1 Background ................................................................................................................................. 64
5.2 Options ........................................................................................................................................ 66
5.2.1 Option 1: Entire trestle overlay ........................................................................................... 66
5.2.2 Option 2: Holding lanes only ............................................................................................... 68
5.2.3 Option 3: Three out of four holding lanes .......................................................................... 70
6. GREEN RATING SYSTEM POINTS ......................................................................................................... 72
viii
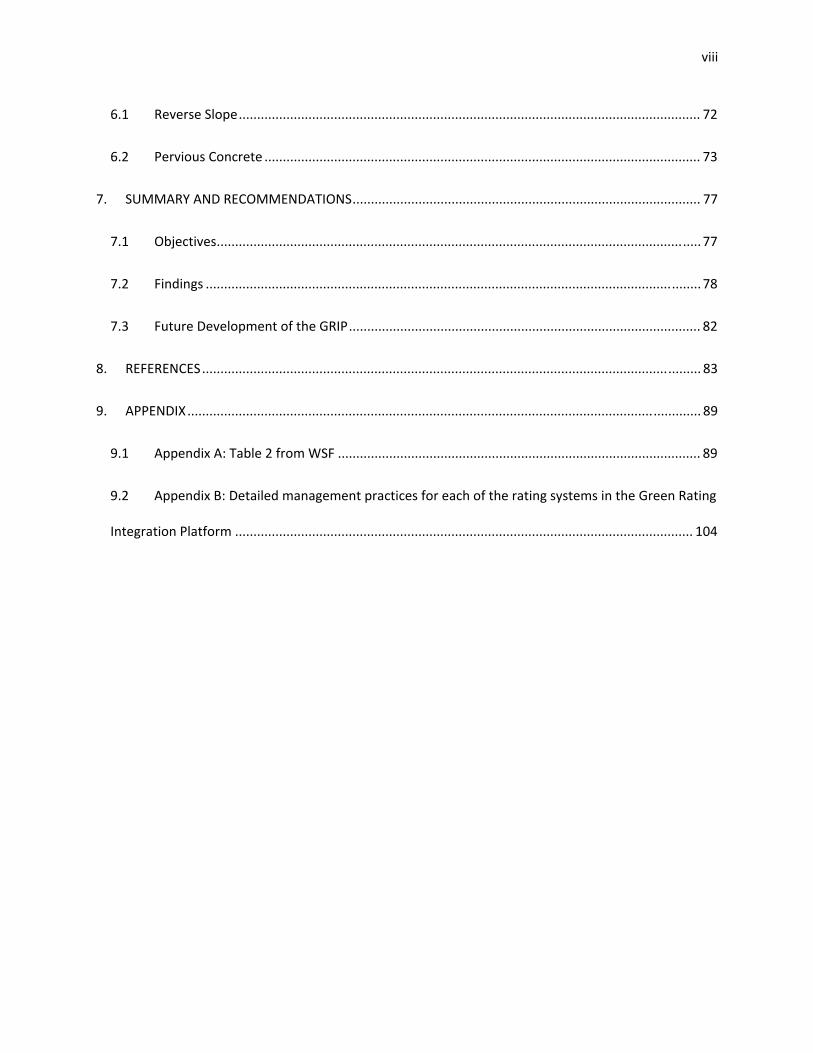
6.1 Reverse Slope .............................................................................................................................. 72
6.2 Pervious Concrete ....................................................................................................................... 73
7. SUMMARY AND RECOMMENDATIONS ............................................................................................... 77
7.1 Objectives .................................................................................................................................... 77
7.2 Findings ....................................................................................................................................... 78
7.3 Future Development of the GRIP ................................................................................................ 82
8. REFERENCES ........................................................................................................................................ 83
9. APPENDIX ............................................................................................................................................ 89
9.1 Appendix A: Table 2 from WSF ................................................................................................... 89
9.2 Appendix B: Detailed management practices for each of the rating systems in the Green Rating
Integration Platform ............................................................................................................................. 104
ix
LIST OF TABLES
Table 1.1: Summary of bioretention pollutant retention ........................................................................... 17
Table 2.1: Rating systems chosen for the Green Rating Integration Platform ........................................... 21
Table 2.2: Green Rating Integration Platform of five green rating systems with WSU Ferry Guidelines .. 26
Table 2.3: Stormwater guidelines across multiple green rating systems ................................................... 28
Table 2.4: WSU Ferry Guidelines stormwater BMPs for landside of terminal ........................................... 30
Table 2.5: WSU Ferry Guidelines stormwater BMPs for waterside of terminal ......................................... 31
Table 2.6: WSF current water management guidelines ............................................................................. 32
Table 2.7: Stormwater Green Rating Integration Platform with SMS and expanded WSU Ferry Guidelines
.................................................................................................................................................................... 33
Table 4.1: Option 1(full trestle replacement) required vault size for each design storm .......................... 48
Table 4.2: Option 2 (southern area trestle replacement) required vault size for each design storm ........ 51
Table 4.3: Option 3 (extended southern area trestle replacement) required vault size for each design
storm ........................................................................................................................................................... 54
Table 4.4: Summary of vault size for various design options ..................................................................... 56
Table 4.5: Percentage of pollutants on the trestle treated by each option ............................................... 59
Table 4.6: Hydrologic Soil Series for Selected Soils in Washington State (Ecology 2005) .......................... 61
Table 4.7: Runoff Curve Numbers for Selected Agricultural, Suburban, and Urban Areas (Ecology 2005) 62
Table 4.8: Required vault size for each design storm for upland area ....................................................... 63
Table 5.1: Summary of the three pervious concrete options presented ................................................... 70
Table 6.1: Possible credits for reverse slope option ................................................................................... 76
Table 6.2: Possible credits for pervious concrete overlay option .............................................................. 76
Table 7.1: Reverse slope decision support tool .......................................................................................... 80

x
Table 7.2: Pervious concrete decision support tool ................................................................................... 81

xi
LIST OF FIGURES
Figure 1.1: Side view of Kristar system at the Bainbridge Island terminal ................................................. 15
Figure 3.1: Looking east towards the Vashon Island terminal ................................................................... 34
Figure 3.2: Looking northwest towards the Vashon Island terminal ......................................................... 35
Figure 3.3: Western trestle partial replacement ........................................................................................ 37
Figure 4.1: Western Washington two‐year isopluvial (from: Ecology 2005) .............................................. 43
Figure 4.3: Reverse slope design for full replacement Vashon Island trestle ............................................ 47
Figure 4.4: Reverse slope design for southern portion replacement of Vashon Island trestle .................. 50
Figure 4.5: The automobile passenger holding area on the Vashon Island terminal ................................. 53
Figure 4.6: Plan for partial replacement of the southern trestle area of the Vashon Island terminal with
the proposed extension .............................................................................................................................. 55
Figure 4.7: Topographic area (ArcGIS) ........................................................................................................ 60
Figure 5.1: Pervious concrete overlay over the entire trestle .................................................................... 67
Figure 5.2: Pervious concrete overlay for the holding lanes only .............................................................. 69
Figure 5.3: Pervious concrete overlay on three out of the four holding lanes .......................................... 71

xii
Dedication
This thesis is dedicated to myself because I’ve always wanted a thesis to be dedicated to me.

1
1. INTRODUCTION
1.1 Problem Statement
Washington State Ferries (WSF) is faced with the difficult challenge of treating the stormwater
which falls on the ferry trestles. Ferry terminals are generally comprised mostly of over‐water
structures, and are extremely close to the Puget Sound. These factors present difficulties when
attempting to treat stormwater runoff for pollutants. Some of the rain falls on the building roofs while
other rain falls on the paved areas of the trestle. The precipitation which lands on the trestles is usually
directed into Puget Sound via through drains on the deck. A few terminals are set up with special catch
basins which filter some pollutants out of the stormwater before releasing into Puget Sound. The rain
water which lands on the terminal buildings is caught by gutters and then deposited into the Puget
Sound by roof drains which do not go through any filter system. It is important that the stormwater is
treated as the Puget Sound contains many environmentally sensitive species that would be adversely
affects by the addition of pollutants into their environment.
Stormwater runoff is defined as water that flows over land and does not percolate into the
ground. Stormwater is generated by precipitation in the form of rain or snow. There are four different
mechanisms which can contribute to overland runoff. Runoff can occur if the precipitation rate is
greater than the speed which water can infiltrate into the ground, assuming that any available
depression storage has already been filled. This is especially likely in paved areas. Runoff can also occur
due to saturation excess when the soil is so saturated it cannot infiltrate any more stormwater. A third
cause of runoff is a high antecedent soil moisture level, forcing the soil to become more quickly
saturated than is typical. Finally, subsurface return flow can cause runoff by water running laterally
though the soil, saturating the soil and sometimes even becoming runoff, usually at a downhill location.
2
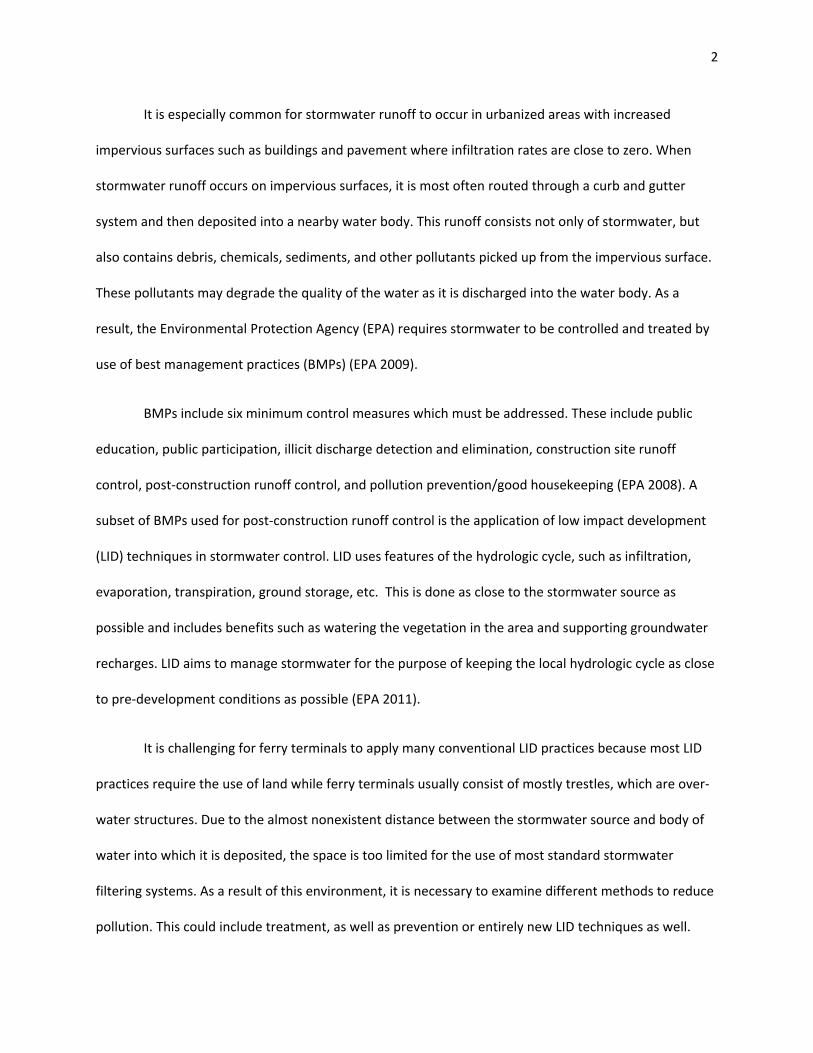
It is especially common for stormwater runoff to occur in urbanized areas with increased
impervious surfaces such as buildings and pavement where infiltration rates are close to zero. When
stormwater runoff occurs on impervious surfaces, it is most often routed through a curb and gutter
system and then deposited into a nearby water body. This runoff consists not only of stormwater, but
also contains debris, chemicals, sediments, and other pollutants picked up from the impervious surface.
These pollutants may degrade the quality of the water as it is discharged into the water body. As a
result, the Environmental Protection Agency (EPA) requires stormwater to be controlled and treated by
use of best management practices (BMPs) (EPA 2009).
BMPs include six minimum control measures which must be addressed. These include public
education, public participation, illicit discharge detection and elimination, construction site runoff
control, post‐construction runoff control, and pollution prevention/good housekeeping (EPA 2008). A
subset of BMPs used for post‐construction runoff control is the application of low impact development
(LID) techniques in stormwater control. LID uses features of the hydrologic cycle, such as infiltration,
evaporation, transpiration, ground storage, etc. This is done as close to the stormwater source as
possible and includes benefits such as watering the vegetation in the area and supporting groundwater
recharges. LID aims to manage stormwater for the purpose of keeping the local hydrologic cycle as close
to pre‐development conditions as possible (EPA 2011).
It is challenging for ferry terminals to apply many conventional LID practices because most LID
practices require the use of land while ferry terminals usually consist of mostly trestles, which are over‐
water structures. Due to the almost nonexistent distance between the stormwater source and body of
water into which it is deposited, the space is too limited for the use of most standard stormwater
filtering systems. As a result of this environment, it is necessary to examine different methods to reduce
pollution. This could include treatment, as well as prevention or entirely new LID techniques as well.
3
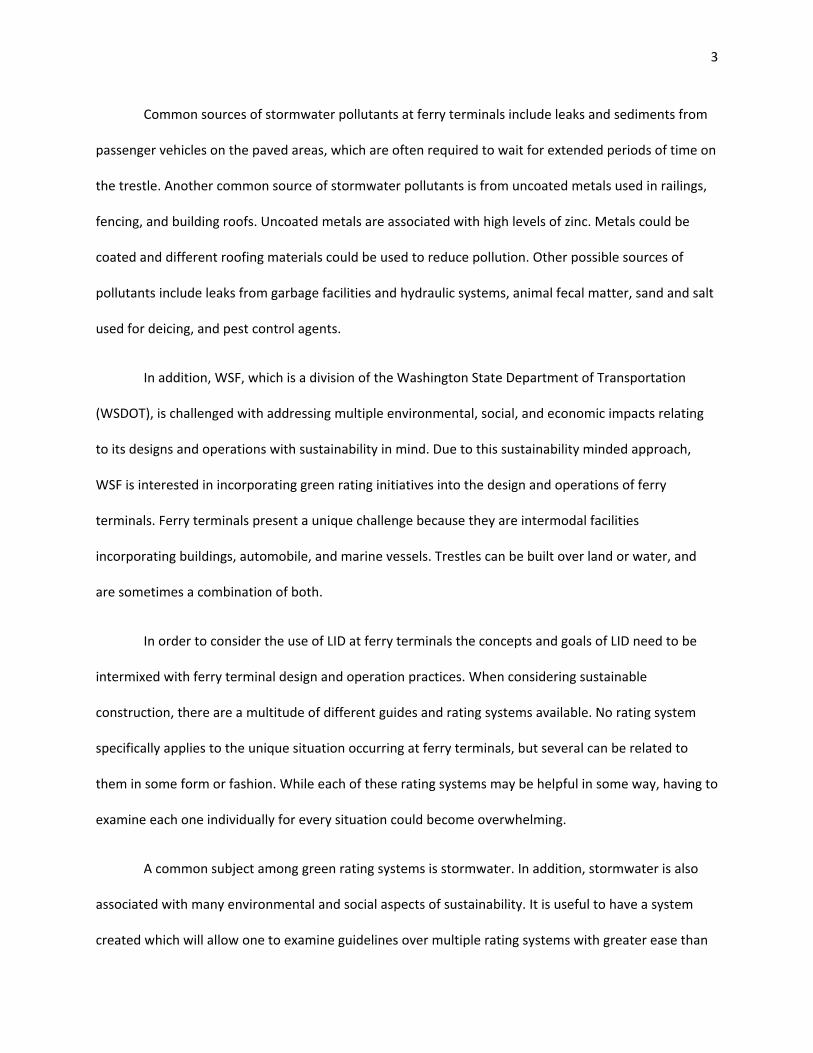
Common sources of stormwater pollutants at ferry terminals include leaks and sediments from
passenger vehicles on the paved areas, which are often required to wait for extended periods of time on
the trestle. Another common source of stormwater pollutants is from uncoated metals used in railings,
fencing, and building roofs. Uncoated metals are associated with high levels of zinc. Metals could be
coated and different roofing materials could be used to reduce pollution. Other possible sources of
pollutants include leaks from garbage facilities and hydraulic systems, animal fecal matter, sand and salt
used for deicing, and pest control agents.
In addition, WSF, which is a division of the Washington State Department of Transportation
(WSDOT), is challenged with addressing multiple environmental, social, and economic impacts relating
to its designs and operations with sustainability in mind. Due to this sustainability minded approach,
WSF is interested in incorporating green rating initiatives into the design and operations of ferry
terminals. Ferry terminals present a unique challenge because they are intermodal facilities
incorporating buildings, automobile, and marine vessels. Trestles can be built over land or water, and
are sometimes a combination of both.
In order to consider the use of LID at ferry terminals the concepts and goals of LID need to be
intermixed with ferry terminal design and operation practices. When considering sustainable
construction, there are a multitude of different guides and rating systems available. No rating system
specifically applies to the unique situation occurring at ferry terminals, but several can be related to
them in some form or fashion. While each of these rating systems may be helpful in some way, having to
examine each one individually for every situation could become overwhelming.
A common subject among green rating systems is stormwater. In addition, stormwater is also
associated with many environmental and social aspects of sustainability. It is useful to have a system
created which will allow one to examine guidelines over multiple rating systems with greater ease than

4
reading through each one separately. A format which could be used for this purpose was created and
will be presented later in this thesis with specific application to a more comprehensive LID stormwater
approach.
1.2 Proposed Steps and Objectives
Objective 1:
First, available rating systems should be examined to see what is available and what is applicable
to ferries. Currently there are a multitude of different rating systems which outline different low impact
development practices. In order to fulfill the proposed steps, a literature search will be done of rating
systems.
Objective 2:
These rating systems will be integrated in order to make them applicable for ferries. An outline
on a matrix for integrating LID practice decisions into other green design and operational goals of ferry
terminals will be developed.
Objective 3:
Next, for the purpose of this thesis, each rating system should be examined for the portions
which focus on stormwater pollution treatment and prevention. The stormwater aspects of the
integrated green rating systems will be detailed. Detail work will also be done on WSF’s Safety
Management System (SMS) and Stormwater Pollution Prevention Plan (SWPPP). This will make it
possible to integrate the green rating systems with the SMS and SWPPP provided by WSF.

5
Objective 4:
In addition, due to the unique combination of characteristics and challenges at WSF terminals,
novel LID prevention and treatment trains might need to be considered. As a result of the unique
circumstances surrounding stormwater and ferry terminals, it is important that creative approaches be
taken to the management of stormwater. This thesis is an investigation into two different strategies
which could be implemented at the Vashon Island Terminal located in Vashon, Washington. The two
strategies to be examined are reverse slope on the trestle with capture and treatment land side (reverse
slope‐land treatment) and the use of a treatment train on the trestle including pervious concrete and
high efficiency sweeping (pervious concrete/sweeping). Reverse slope is a technique suggested by WSF.
Objective 5:
Finally, these systems should be overlaid to relate to the stormwater practices that WSF already
has in place. Once the previously mentioned two approaches have been investigated, they can be
compared to various green rating systems to see what credits they may be eligible for.
1.3 Format of Thesis
The remainder of Chapter 1 in this thesis consists of a literature review. This literature review
will include several different rating systems which were analyzed to see if they are applicable to ferries,
fulfilling Objective 1. The literature review also includes a summary of the WSF SMS and SWPPP as well
as containing information about similar sites and current LID practices to lay the groundwork for
Objective 3.
Chapter 2 covers the selection of rating systems which best apply to ferry terminals and
integrates them together in fulfillment of Objective 2. The chapter goes on to look at the stormwater
6
guidelines of each of these rating systems and relates them to current WSF SMS procedures, creating a
Green Rating Integration Platform as discussed in Objective 3.
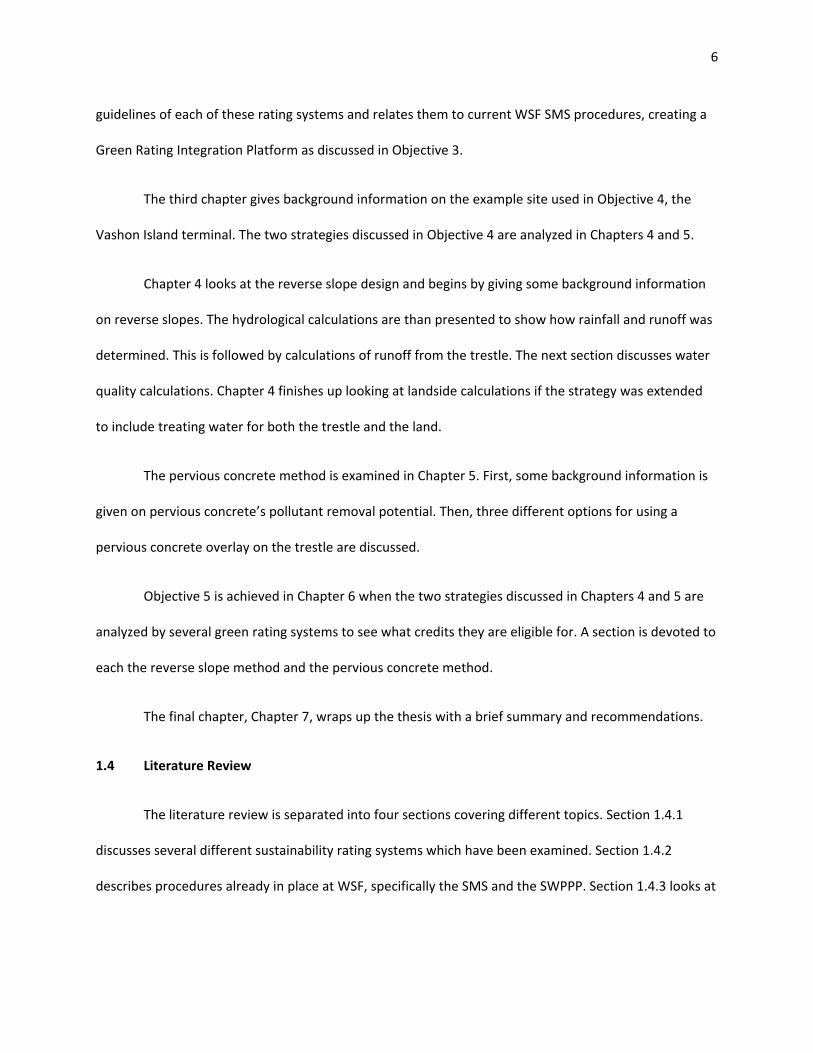
The third chapter gives background information on the example site used in Objective 4, the
Vashon Island terminal. The two strategies discussed in Objective 4 are analyzed in Chapters 4 and 5.
Chapter 4 looks at the reverse slope design and begins by giving some background information
on reverse slopes. The hydrological calculations are than presented to show how rainfall and runoff was
determined. This is followed by calculations of runoff from the trestle. The next section discusses water
quality calculations. Chapter 4 finishes up looking at landside calculations if the strategy was extended
to include treating water for both the trestle and the land.
The pervious concrete method is examined in Chapter 5. First, some background information is
given on pervious concrete’s pollutant removal potential. Then, three different options for using a
pervious concrete overlay on the trestle are discussed.
Objective 5 is achieved in Chapter 6 when the two strategies discussed in Chapters 4 and 5 are
analyzed by several green rating systems to see what credits they are eligible for. A section is devoted to
each the reverse slope method and the pervious concrete method.
The final chapter, Chapter 7, wraps up the thesis with a brief summary and recommendations.
1.4 Literature Review
The literature review is separated into four sections covering different topics. Section 1.4.1
discusses several different sustainability rating systems which have been examined. Section 1.4.2
describes procedures already in place at WSF, specifically the SMS and the SWPPP. Section 1.4.3 looks at

7
two similar sites; the SR 520 floating bridge and the Bainbridge Island terminal. Finally, Section 1.4.1
looks at LID practices which have been successfully used to reduce pollutants found in stormwater.
1.4.1 Sustainability Rating Systems
One of the most well known ratings systems is Leadership in Energy and Environmental Design
(LEED) for new construction and major renovation, which has been developed by the US Green Building
Council (USGBC 2009). This rating system applies mostly towards buildings on the land, making it useful
for the land side of a ferry terminal. LEED for retail is a subset of the LEED new construction system.
LEED retail is more consumer based and addresses parking issues as well as other additional criteria that
might fit well with WSF.
Another rating system, which was developed by the Green Building Initiative, is Green Globes
(GBI 2011). Green Globes easily applies to different project sizes and both new and existing buildings. It
has been specifically used for several public buildings. For ports, the most applicable sections are those
that address building design and maintenance and operations. However, the similarly applicable LEED
system is more commonly used in the United States.
Another possible rating system source is from the American Society of Heating, Refrigerating
and Air‐Conditioning Engineers (ASHRAE) set of standards. As the name suggests, ASHRAE is a good
source of energy system standards such as testing methods and performance criteria (ASHRAE 2011).
This could be applied to specific energy topics that WSF may need to address. ASHRAE standards are
also included in LEED.
The Sustainable Sites Initiative (SITES) is an interdisciplinary effort that provides guidelines for
sustainability in the areas of land design, construction, and management (SSI 2009). It focuses on how a
project can be sustainably beneficial when it is implemented into a community by enhancing social and
8
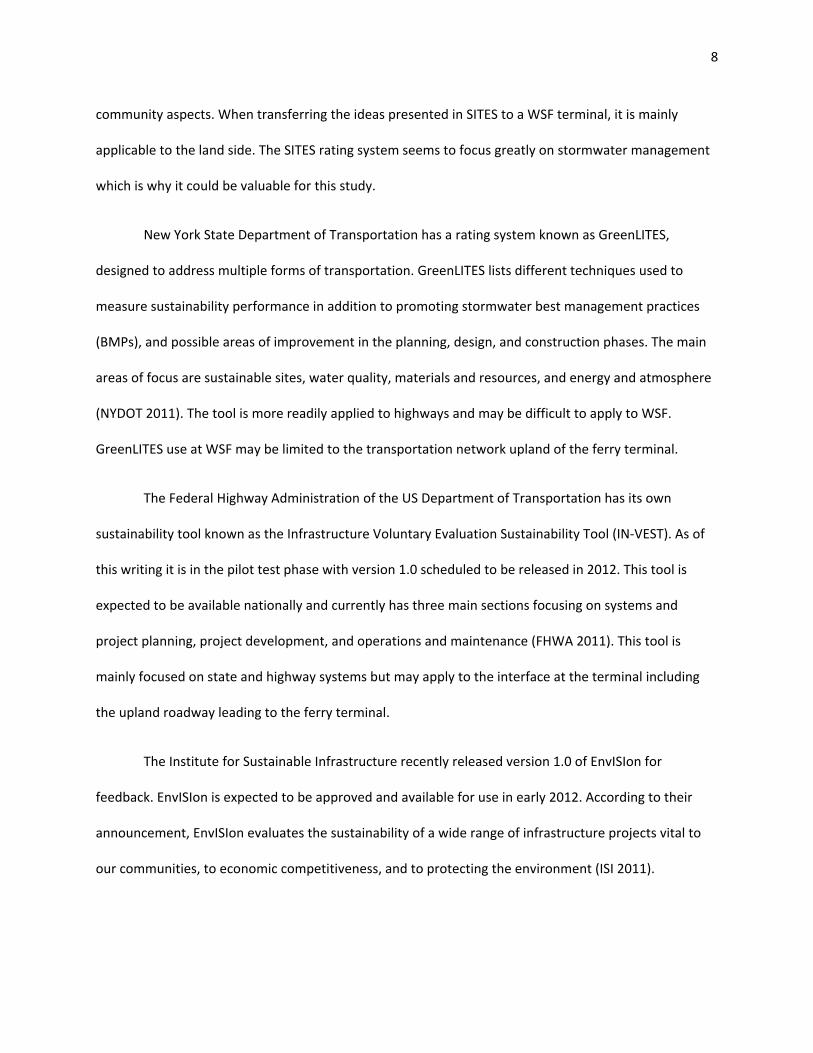
community aspects. When transferring the ideas presented in SITES to a WSF terminal, it is mainly
applicable to the land side. The SITES rating system seems to focus greatly on stormwater management
which is why it could be valuable for this study.
New York State Department of Transportation has a rating system known as GreenLITES,
designed to address multiple forms of transportation. GreenLITES lists different techniques used to
measure sustainability performance in addition to promoting stormwater best management practices
(BMPs), and possible areas of improvement in the planning, design, and construction phases. The main
areas of focus are sustainable sites, water quality, materials and resources, and energy and atmosphere
(NYDOT 2011). The tool is more readily applied to highways and may be difficult to apply to WSF.
GreenLITES use at WSF may be limited to the transportation network upland of the ferry terminal.
The Federal Highway Administration of the US Department of Transportation has its own
sustainability tool known as the Infrastructure Voluntary Evaluation Sustainability Tool (IN‐VEST). As of
this writing it is in the pilot test phase with version 1.0 scheduled to be released in 2012. This tool is
expected to be available nationally and currently has three main sections focusing on systems and
project planning, project development, and operations and maintenance (FHWA 2011). This tool is
mainly focused on state and highway systems but may apply to the interface at the terminal including
the upland roadway leading to the ferry terminal.
The Institute for Sustainable Infrastructure recently released version 1.0 of EnvISIon for
feedback. EnvISIon is expected to be approved and available for use in early 2012. According to their
announcement, EnvISIon evaluates the sustainability of a wide range of infrastructure projects vital to
our communities, to economic competitiveness, and to protecting the environment (ISI 2011).

9
Another land side application which focuses on roads and highways is the Greenroads rating
system. This system, like others, does a good job addressing stormwater treatment on roads which
could apply to the landside area of a ferry terminal. In addition to stormwater, Greenroads also focuses
on which materials would be more sustainable choices when constructing new projects (Greenroads
2011).
Another sustainability checklist referring to transportation was developed by Lochner and is
known as Sustainable Transportation Environmental Engineering and Design (STEED) guidelines. These
guidelines mainly cover roadways and separates the guidelines into the four stages processing, planning,
design, and construction (Lochner 2011). It would be difficult to relate the majority of the information in
these guidelines to WSF.
The State of Illinois has a guidance which lists practices that bring sustainable results to highway
projects known as the Illinois Livable and Sustainable Transportation (ILAST). It was developed by using
the NY State GreenLITES (IDOT 2010).
The International Organization for Standardization (ISO) has created the environmental series of
standards for the purpose of providing a framework for organizations when they are creating
environmental policy, plans, and actions (ISO 2011). This directly applies to WSF because the Safety
Management System (SMS) which WSF employs has incorporated the environmental management
system portion of ISO 14001 standards.
A good source for intermodal guidelines is the Port Authority of NY and NJ Sustainable
Infrastructure Guidelines. These guidelines were developed in 2006 for the purpose of addressing
projects that occur outside the building envelope (TPA 2010). Due to this intermodal approach, the
Sustainable Infrastructure Guidelines apply quite well to the WSF system, although it is not completely

10
comprehensive. However, the Sustainable Infrastructure Guidelines are currently still in draft status and
are still under development and review.
The Marine Vessel Environmental Performance Assessment (MVeP) which is under development
by the Society of Naval Architects and Marine Engineers (SNAME) applies to the waterside of WSF
(SNAME 2010). MVeP is expected to be the best set of guidelines for marine vessels and can be
implemented specifically for the ferries at WSF.
1.4.2 Current WSF Policies
Section 1.4.2 is further divided into two sections. Section 1.4.2.1 discusses the Safety
Management System (SMS) at WSF while Section 1.4.2.2 summarizes the purpose of the Stormwater
Pollution Prevention Plan (SWPPP) at WSF.
1.4.2.1 Safety Management System
WSF currently has a system in place which covers many best management practices. The safety
management system (SMS) is set up in such a way that one can pull out chapters as needed when the
appropriate situation arises. Some chapters of the SMS correspond well with the Stormwater Pollution
Prevention Plan (SWPPP) that WSF is currently applying for stormwater quality purposes. The chapters
that integrate into SWPPP are as follows:
DECK OPER 0170 &210 Transporting Livestock
DECK OPER 0200 Transporting Seafood
ENGR ENVN 0040 Sewage Pumping
ENGR ENVN 0050 Spill Response
ENGR ENVN 0060 Transfer of Hazardous/Potentially Hazardous Wastes

11
ENGR ENVN 0070 Oil Container Transfer and Disposal
ERM SAFE 0150 Ordering/Using Chemical Products
SMSM ENVN 0070 Transfer of Hazardous/Potentially Hazardous Wastes
SMSM ENVN 0100 Integrated Pest Management
SMSM ENVN 0110 Hazardous Materials Release
SMSM ENVN 0900 Solid Waste and Disposal Recycling
TERM EMER 0010 Emergency Response and Preparedness
TERM ENVN 0015 Hazardous Material Transport by Commercial Vehicles
TERM ENVN 0020 Hazardous Material Transport on Scheduled Trips
TERM ENVN 0025 Hazardous Material Charters
TERM ENVN 0030 Transfer of Hazardous/Potentially Hazardous Wastes
TERM ENVN 0035 Oil Container Transfer and Disposal
TERM ENVN 0040 Storm Drains and Scuppers
TERM ENVN 0050 Solid Waste and Disposal Recycling
TERM ENVN 0070 Spill Response
TERM ENVN 0080 Portable Spill Kits
TERM OPER 0030 Unique Loading and Off‐Loading Situations
TERM SAFE 0100 Housekeeping/Janitorial Supplies
TERM SAFE 0150 Ordering/Using Chemical Products
A table provided by WSF fully outlines how these SMS chapters integrate into the SWPPP. This table
can be found in Appendix A.

12
1.4.2.2 Stormwater Pollution Prevention Plan
The stormwater pollution prevention plan was created specifically for the following WSF terminals:
Anacortes
Bainbridge
Bremerton
Colman Dock (Seattle, Pier 52)
Edmonds
Fauntleroy
Mukilteo
Point Defiance
Southworth
Tahlequah
Vashon
The SWPPP covers different BMPs that have been or soon will be implemented at the previously
stated terminals. This was done to meet the requirements of the WSDOT Municipal Permit according to
the National Pollutant Discharge Elimination System (NPDES). This SWPPP is used as a training guide for
WSF employees on policies and procedures associated with stormwater management.
1.4.3 Similar Sites and Challenges
An example of managing stormwater on an over‐water infrastructure is the nearby State Route 520
floating bridge across Lake Washington. Washington State Department of Transportation (WSDOT)
recently developed alternatives for possible replacement of this bridge (WSDOT 2010). One of the
environmental concerns the SR 520 report focused on was the most effective stormwater treatment
13
available based on All Known, Available and Reasonable Technology (AKART). After initially examining 15
different technologies, four alternatives were selected for further investigation to see which one was
best applied. The four alternatives were:
Media filtration‐vaults
Catch basin media filtration
Modified catch basins/cleaning
High‐efficiency sweeping
The first three alternatives all make use of storing water for filtration underneath the bridge. In
many areas at this latitude storing water is accompanied with concerns about freezing possibilities.
However, due to the extremely close proximity to Lake Washington, freezing is not an issue when
storing water underneath the floating bridge. A ferry trestle on the Puget Sound is a similar situation in
this respect so the same solutions might be effectively applied at WSF.
The first alternative, media filtration‐vaults, focused on treating stormwater by the use of media
beds. These beds are stored horizontally on the deck underneath the highway. Different configurations
of this setup were attempted but all used a pre‐treatment to remove oil and grease followed by media
such as sand, pearlite, peat, and zeolite to treat major pollutants typically found in stormwater. The
media is periodically cleaned or replaced.
The catch basin media filtration alternative uses filters such as media pillows, filter bags, or
cartridges which are placed inside catch basins. These inserts are set up with overflow capabilities.
During high flows they will only treat the first flush of stormwater and allow the remaining flow to
bypass the filter so as to maintain an adequate draining speed. These require some maintenance in that
they must be replaced from time to time.

14
The third alternative is the modified catch basin sweeping and cleaning, including extra large catch
basins to increase the amount of sediments that can be trapped. Oil/grease trapping would occur due to
submerged outlets and large sumps would increase the residence time for sediments allowing for less
regular cleaning of the filters.
Finally, the fourth alternative refers to the Western Washington Stormwater Manual and its new
generation sweeping technology. This sweeping technology consists of a regenerative air sweeper and a
return vacuum. The sweeper blows air directly down onto the pavement while vacuuming up the air and
pollutants. This has been shown to reduce the dirt particles with a diameter of less than 250 microns by
25 to 50 percent (Sutherland 1998).
Of these four alternatives it was concluded that a combination of high‐efficiency sweeping and
modified catch basins and cleaning was the most applicable. Some benefits of this combination include:
It can provide an effective level of water quality protection for sediments and metals.
Its implementation is more visually apparent.
It takes advantage of the bridge’s flat gutterlines, which make it possible to retain sediments for
longer periods increasing the opportunity for their removal before they are discharged into
catch basins.
It does not have an unreasonable or unknown level of risk associated with operation and
maintenance—a characteristic of the other technologies.
Another example of stormwater treatment on a similar site can be seen at the WSF Bainbridge
Island terminal. It is at this terminal that the KriStar stormwater detention basin has been put in to treat
stormwater. The system is designed to capture and retain sediment, oils, and metals, reducing the total
discharge load. Data has shown that the system has been effective in removing pollutants associated

15
with stormwater runoff from the upland holding area. The Kristar system is made from polymeric
components and contains a polymer‐coated steel support screen which allows different media to be
used depending on the targeted pollutants. The system earned the General Use Level Designation from
the Washington State Department of Ecology (Kristar 2010). This system is an example of a type of
treatment/storage facility which could be implemented at other terminals where overland area is
available. A diagram illustrating the system setup at the Bainbridge Island terminal is shown in Figure
1.1.
Figure 1.1: Side view of Kristar system at the Bainbridge Island terminal
The Kristar stormwater vault collects rainwater running off of the holding area through the
already in place stormwater catch basins and pipes. After filtering out pollutants the water is than
released through a large pipe on the side of the hill. The hill is vegetated to allow the water to infiltrate
and take out other pollutants before entering the Puget Sound.
0+91.530+750+500+250+00
8
12
16
20
24
28
MHHWMHW
32
EXISTING GRADE
HIMALAYAN BLACKBERRY
26' @ 1% 18" SD
CB TYPE 2 48"Ø
4' @ 4% 18" SD
KRISTAR FILTER VAULT
PARKING LOT CURB
3' @ 4% 18" SD
CB TYPE 2 48"Ø
UPLAND DRAIN

16
1.4.4 LID practices
Several LID/BMP methods are applicable for ferry terminals. One of the possible LID techniques
that could be used is pervious pavement, which vertically infiltrates stormwater at the source or is used
as an overlay over existing pavement to filter the stormwater through horizontal flow. Pervious
pavement has the ability to store a significant amount of stormwater. This stormwater eventually
evaporates and does not contribute to runoff during smaller storm events. During larger events, the
runoff is significantly reduced (Rushton 2001; Battebo and Booth 2003; Bean et. al 2007). Due to the
tortuous pathways in pervious pavement, pollutants are also removed. In a study done by Barrett
(2008), he compared the stormwater pollutants from a typical impervious asphalt highway to the same
highway with a porous asphalt overlay. The study showed decreases in pollutant levels of 93% for Total
Suspended Solids (TSS), 36% for phosphorus, 52% for copper, 88% for lead, and 79% for zinc.
When land is available, an available LID technique is a bio‐retention pond or rain garden. These
are set up to retain water and allow stormwater pollutants to settle out and infiltrate over a period of
time. These are typically designed with an overflow system for large events, so that only the first flush is
treated.
Davis et al. (2003) did one of the first studies on the removal efficiency in bioretention ponds.
Synthetic runoff was applied to different bioretention areas and the effective removals were compared
between the two areas for the purpose of determining variability. The first area was in Greenbelt, MD
and resulted in a 16% retention rate for nitrate, 52% for Total Kjeldahl Nitrogen (TKN), 65% of total
phosphorus and 49% of total nitrogen. There was also over 95% retention of copper, lead, and zinc. The
second site looked at by Davis et al., in Largo, MD, had similar reduction rates for nitrogen and
phosphorous, but heavy metal retention rates ranged from 43% for copper to 70% for lead.

17
Dietz and Clausen (2006) constructed a replicate rain garden to treat roof runoff. The gardens were
constructed to hold one inch of runoff. The gardens were constructed in Haddam, CN and reduction
rates of all types of nitrogen ranged from 26% for TKN to 82% for ammonia. Phosphorous levels
increased.
Another field study was done by Rossen et al. (2006) to compare multiple LID designs.
Treatment strategies were uniformly sized to target a rainfall‐runoff depth equivalent to 90% of the
annual volume of rainfall. The pollutants examined in this study were total suspended solids, which was
reduced by 96%, and nitrate which was reduced by 27%.
Finally, Hunt et al. (2006) evaluated three different field sites with varying fill media type and
drainage configuration. The Greensboro, NC site resulted in a reduction in heavy metals between 81 and
99 percent with no reduction in nitrogen while the Chapel Hill, NC site resulted in reduction in nitrogen‐
based pollutants ranging from 13% for nitrate to 86% for ammonia. This data shows how the LID
techniques have a wide range of results depending on location and design. The results of the previously
stated studies are shown in Table 1.1.
Table 1.1: Summary of bioretention pollutant retention
Location TSS NO3‐N NH3‐N TKN TP TN ON Cu Pb Zn Reference
Haddam, CN ‐ 67 82 26 ‐108 51 41 ‐ ‐ ‐ Dietz and Clausen 2006
Greenbelt, MD ‐ 16 ‐ 52 65 49 ‐ 97 >95 >95 Davis et al. 2003
Largo, MD ‐ 15 ‐ 67 87 59 ‐ 43 70 64 Davis et al. 2003
Durham, NH 96 27 ‐ ‐ ‐ ‐ ‐ ‐ ‐ 99 Roseen et al. 2006

18
Greensboro, NC ‐170 75 ‐1 ‐5 ‐240 40 ‐ 99 81 98 Hunt et al. 2006
Chapel Hill, NC ‐ 13 86 45 65 40 ‐ ‐ ‐ ‐ Hunt et al. 2006
Another possible treatment method if there is adequate land available is constructed wetlands.
This is a low maintenance method which treats stormwater by allowing plants to take up and remove
pollutants from the water. Similar to bio‐retention ponds and rain gardens, wetlands also have a wide
variety in removal efficiencies. The effectiveness of constructed wetlands in removing pollutants varies
widely on a case by case basis, as well as seasonally, but some general numbers can be gleaned from a
collection of studies compiled by Kadlec and Wallace (2009). The median reduction of TSS is 87% with
fluctuations depending on the season. In terms of BOD, if the influent concentration was greater than
100 mg/L, there was about a 75% reduction. If the influent was below 100 mg/L the effluent was around
30 to 40 mg/L, indicating a 60‐70% reduction. Organic nitrogen was reduced by 50% on average, TKN by
38%, TN by 41%, ammonia nitrogen by 53%, and nitrate by 65%. Total phosphorus had a median
reduction rate of 53%. The effectiveness of wetlands in treating salts and metals is currently too limited
to draw any conclusions. It is thought that they will be successful in metals uptake at first, but the
accumulation of metals in the plants may eventually be maximized and the wetland will no longer
remove metals.
Bioinfiltration swales can be considered a best management practice or low impact
development technique that consists of some vegetation where sediments collect as the stormwater is
directed through the vegetation to a storm drain. These have been shown to reduce TSS by 81%, total
nitrogen by 84%, total phosphorus by 34%, copper by 51% and zinc by 71% (Winer 2000). A very similar
technique is a buffer strip which removes pollutants as stormwater flows through the vegetation before

19
going into a storm drain. A study by Sheridan et al. (1999) showed that grass buffer strips used along
highways reduce the total suspended solids in stormwater by around 80%. Karr and Schlosser (1997)
concluded in their article that an 85% reduction of phosphorus in stormwater can be achieved by use of
a vegetated buffer strip. Also, another study showed that buffer strips are also successful in removing
fecal matter at a 60% removal rate (Grismer, 1981).
In addition to the previously stated LID techniques, there are also a few best management
practices which can be applied to help with stormwater pollution prevention on the trestle. One practice
could be prohibiting dirty or leaking vehicles from parking on the trestle, or simply providing a wheel
wash at the entrance to minimize the pollutants located on tires from accumulating on the holding
areas. Another is silt curtains could be applied along the side of the trestle in front of the scuppers to
absorb some of the sediment before the stormwater is deposited directly into Puget Sound.
2. RATING SYSTEM AND DEVELOPMENT OF GREEN RATING INTEGRATION PLATFORM
This chapter first discusses the different rating systems that are applicable for ferry terminals in
Section 2.1. Section 2.2 integrates these rating systems together to show how credits relate across the
rating systems. Section 2.3 then further looks at the stormwater portion of this integration. Current WSF
procedures are added to this integration in Section 2.4. Finally, Section 2.5 combines all these together
to create one final stormwater Green Rating Integration Platform.
2.1 Rating Systems
Five of the rating systems detailed in section 1.4.1 were chosen as being applicable to WSF. The
GreenLITES system was chosen to focus on the upland area of ferry trestles due to its applicability with
multiple forms of transportation and its focus on highways, as well as its availability compared to the
other rating systems with a focus on transportation. The next rating system that seemed applicable was

20
the LEED retail system for new construction. As one of the most well known and recognizable systems, it
was important to include this system to help show how other rating systems are similar. The LEED
system is focused more on the landside of the ferry trestle, especially any terminal buildings that may be
located on the trestle. Sustainable Sites Initiative was the third rating system chosen due to its excellent
focus on stormwater management as well as integration of a construction project into a community.
This rating system will also be more focused on the land side of the ferry terminal.
The Port Authority of NY/NJ Sustainable Infrastructure Guidelines was chosen due to its
intermodal focus and thereby relevant to the WSF situation. While this is still in draft status and not
completely comprehensive, its focus on construction projects outside the building envelope makes it
valuable when developing a system for WSF. Finally, the MVeP guidelines were chosen for the marine
side of ferry trestles due to its focus on water vessels. The rating systems chosen are shown below in
Table 2.1.

21
Table 2.1: Rating systems chosen for the Green Rating Integration Platform
Rating System Focus Area Source
GreenLITES Upland New York DOT
LEED retail Landside US Green Building Council
Sustainable Sites Initiative Landside American Society of Landscape
Architects; University of Texas;
United States Botanical Garden
Sustainable Infrastructure
Guidelines
Intermodal Port Authority of NY/NJ
MVeP Waterside Society of Naval Architects and
Marine Engineers
2.2 Rating System Integration
All five of these rating systems were then organized based upon a previous work done by
Washington State University in 2009 for WSF (D’Agneaux 2009). The previous work was done by
graduate student Ines De Sainte Marie D’Agneaux under Dr. Wolcott and entailed creating a guideline
system for ferries. This report was split into seven areas of focus entitled:
Traffic and Parking
This section focuses on increasing capacity and customer satisfaction while decreasing the
negative impacts of vehicles on the surrounding area.
Integration in the Community

22
This category focuses on practices which supports positive impacts on the surrounding
community in order to increase general acceptance. Some examples include reducing light and
noise pollution and improving aesthetics of the terminal.
Energy Management
This category focuses on reducing energy use and energy related pollution while limiting the
dependence on the energy grid.
Water Management
This section focuses on both the use of potable water as well as limiting stormwater runoff.
Materials Management
This focus area attempts to limit the overall use of resources, and replace materials with reused
and recycled options when possible.
Site Selection
Mainly, the use of gray or brownfield sites where appropriate.
Air Quality
This focuses both on limiting the air pollution produced from the site as well as improving
indoor air quality in any buildings on the site.
For this report the site selection category was renamed construction phase and expanded to include
all aspects of construction instead of only being limited to site selection. The five rating systems were
separated into the above listed categories to help ease the integration across the systems. This Green
Rating Integration Platform is shown in Table 2.2.
The GreenLITES rating system is divided into the five categories of sustainable sites, water quality,
materials and resources, energy and atmosphere, and an unlisted innovation category. One of the
sustainable sites credits fit well into the construction phased category while the other four more address

23
the community/social aspects as opposed to the construction phase aspects. The water quality and
materials and resources sections transpose well into the water management and materials management
sections respectively. Finally, the energy and atmosphere section has two credits which may correlate
with the energy management section, two which fit with traffic and parking, and two which deal with
community/social aspects. GreenLITES lacks credits which fit specifically into the air quality section.
The LEED retail system is divided into seven separate categories. The five main categories of
sustainable sites, water efficiency, energy and atmosphere, materials and resources, and indoor
environmental quality are joined by two other areas of innovation and regional priority. The sustainable
sites category has credits applicable for four different sections outlined in the WSU Ferry Guidelines.
Three of the credits having to do with pollution prevention and site selection fit well with the
construction phase category. One credit about transportation went into the traffic/parking section while
two stormwater credits landed in the water management category. The majority (five) of the sustainable
sites credits were placed in the community and social section. All four of the water efficiency
prerequisites and credits transferred over into the water management section. A majority of the energy
and atmosphere credits went into the energy management section with the two atmosphere focused
credits were instead placed in the community/social section. Similar to the water efficiency section, all
of the materials and resources credits fit into the materials management category. Finally, indoor
environmental quality was divided with five credits fitting into the air quality category, three fitting into
community/social, and one credit in each of the material management and construction phase
categories.
Sustainable Sites Initiative (SITES) has the most applicable credits of any rating system examined in
this thesis as well as the most categories in which the credits are divided into. The eight categories in the
SITES rating system are: site selection, assessment and planning, water, soil and vegetation, materials

24
selection, human health and well being, construction, and operations and maintenance. Similar to
GreenLITES the site selection category contains elements which transfer to both the community/social
and construction phase sections of the WSU Ferry Guidelines. The assessment and planning category is
technically pre‐design but was included in the construction phase category. The water, materials, human
health and well being, and construction sections transfer completely to the water management,
materials management, community/social, and construction phase categories respectively. The soil and
vegetation section contains elements which fit in each of the community/social, energy management,
and construction phase categories. Finally, the operations and maintenance category contains BMPs
involving energy management, water management, materials management, and air quality. The
Sustainable Sites Initiative has its majority of credits fall into the community/social category and none
which fall into the traffic/parking category.
The draft Port Authority of NY/NJ Sustainable Infrastructure Guidelines (Port) has similar sections to
the WSU Ferry Guidelines. This rating system is divided into six categories of site, water, energy,
materials, construction, and maintenance and operations. The site section is the only section of the six
to be divided when transferred into the WSU Ferry Guidelines format. The Port site section has credits
which fall into the categories of traffic/parking, community/social, water management, materials
management, and construction phase. The Port water, energy, material, and construction sections
expectedly fit into the water management, energy management, materials management, and
construction phase categories in the WSU Ferry Guidelines. Finally, the maintenance and operations
category deals with watering landscaping and is thereby placed in the water management category. The
Port rating system also does not have credits which fit directly into the air quality category.
The MVeP rating system, which is focused on vessels and waterside, is divided into the four
categories of energy efficiency, air emissions, water emissions, and general measures. The energy

25
efficiency and water emissions can be placed entirely within energy management and water
management respectively. The air emissions category fits mostly into the air quality category with one
credit addressing ozone depletion fitting into the community/social category. Finally the general
measures section contains credits which fit into the community/social, water management, and
materials management categories. There are no credits regarding vessels which fit into traffic/parking or
construction phase categories.

26
Table 2.2: Green Rating Integration Platform of five green rating systems with WSU Ferry Guidelines
Upland Land Side Land Side Intermodal Intermodal Marine Side
GreenLITES LEED retail Sustainable Sites Initiative Port Authority WSU Ferry Guidelines MVeP
E‐1: Improve Traffic Flow SSc4‐Alternative Transportation IS‐17: Optimize Traffic Safety Promote HOV
E‐4:Bicycle/Pedestrian Facilities IS‐19:Enhance Intermodal Connectivity Encourage walk‐ons
IS‐20:Transportation System Management Encourage bicycle use
IS‐21:Transportation Technologies Facilitate drop‐off
Park‐and‐ride program
Shared‐car program
Optimize traffic flow
Reservation system
Peak periods prices
Allow future growth
S‐2: Context Sensitive Solutions SSc2‐Community Connectivity SSp1.2‐Protect floodplain functions IS‐5: Protect Ecological Health Architecturally blend GM3.1‐Aquatic Life Impact
S‐3: Land Use Planning SSc5.1‐Protect or Restore Habitat SSp1.3‐Preserve wetlands IS‐6:Maintain Absorbent Landscapes Visitor center GM3.2‐Shore Protection
S‐4: Protect Wildlife Habitat SSc5.2‐Maximize Open Space SSp1.4‐Preserve endangered species IS‐8:Utilize Appropriate Vegetation Include guided tours AE6‐Ozone‐Depleting
S‐5: Protect Plant Communities SSc7‐Heat Island Effect SSc1.6‐Select sites in communities IS‐14: Mitigate Heat Island Effect Prevent flood damage
E‐5: Noise Abatement SSc8‐Light Pollution Reduction SSc1.7‐Accessible to public transit IS‐15:Minimize Light Pollution Allow change in activity
E‐6: Stray Light Reduction EAp3‐Refrigerant Management SVp4.1‐Control invasive plants IS‐16: Optimize Public Environments No ozone depleting substances
EAc4‐Refrigerant Management SVp4.2‐Use non‐invasive plants Light Pollution Prevention
IEQc6‐Controllability of Systems SVp4.3‐Soil management plan Noise Pollution Prevention
IEQc7‐Thermal Comfort SVc4.5‐Preserve special status veg. Wildlife Considerations
IEQc8‐Daylighting and Views SVc4.6‐Daylighting and Views
SVc4.7‐Use native plants
SVc4.8‐Preserve native plants
SVc4.9‐Restore native plants
SVc4.12‐Reduce heat island effect
SVc4.13‐Reduce wildfire risk
HHc6.1‐Equitable site development
HHc6.2‐Equitable site use
HHc6.3‐Sustainability education
HHc6.4‐Protect historical places
HHc6.5‐Optimum site accessibility
HHc6.6‐Outdoor physical activity
HHc6.7‐Views of vegetation
HHc6.8‐Outdoor spaces
HHc6.9‐Reduce light pollution
E‐2: Reduce Electrical EAp2‐Minimum Energy Performance SVc4.10‐Minimize heating IE‐1: Optimize Energy Performance Produce renewable energy EE1.1‐Lighting
E‐3: Reduce Petroleum EAc1‐Optimize Energy SVc4.11‐Minimize cooling IE‐2:Electrical and Mechanical Systems Use waste heat from engine EE1.2‐HVAC
EAc2‐On‐site Renewable Energy OMc8.4‐Reduce energy consumption IE‐3: Utilize End Use Metering Use local material EE1.3‐Pump Systems
EAc5‐Measurement and Verification OMc8.5‐Use renewable energy IE‐4: Use On‐Site Renewable Energy Minimal embodied energy EE1.4‐Mechanical Equipment
EAc6‐Green Power IE‐5: Protect Ozone Layer Daylight harvesting EE1.5‐Hull/Propeller
IE‐6: Provide Alternative Fueling Stations High‐efficiency systems EE1.6‐Route Optimization
Individual control in offices EE1.7‐Vessel Speed
Automatic control in public EE1.8‐Energy Recovery
Automatically turn off lights EE1.9‐Hull Optimization
High reflectance EE2.1‐Other Fuels
EE2.2‐Renewable Energies
EE3‐Carbon Footprint
W‐1: Stormwater Management SSc6.1‐Stormwater Quantity Control Wp3.1‐Reduce landscape irrigation IS‐7: Utilize Pervious Pavement Emergency plan for spills WE1‐Oily Water
W‐2:BMPSs SSC6.2‐Stormwater Quality Control Wc3.2‐Reduce landscape irrigation IS‐9: Use Turfgrass Appropriately Oil separation equipment WE2‐Non‐Indigenous Species
WEp1‐Water Use Reduction Wc3.3‐Protect/Restore buffers IW‐1: Implement Stormwater BMPs Non toxic paint WE2.1‐Ballast Water/Sediment
WEc1‐Water Efficient Landscaping Wc3.4‐Rehabilitate streams IW‐2: Implement Rainwater Neutrality High‐efficiency fixtures WE2.2‐Hull Fouling
WEc2‐Innovative Technologies Wc3.5‐Manage stormwater on site IW‐3: Reduce Use of Potable Water Prevent leaks WE3‐Sanitary Systems
WEc3‐Water Use Reduction Wc3.6‐On‐site water resources IW‐4: Utilize End Use Metering Reduce potable water WE4‐Solid Waste
Wc3.7‐Use stormwater for landscape IO‐1:Sustainable Landscape Maintenance Reduce city water WE5‐Incidental Discharges
Wc3.8‐Maintain water features IO‐2: Maintain Soil Quality Treat wastewater on‐site WE6‐Protection of Oil
OMp8.1‐Sustainable maintenance Implement LIDs GM2‐Hotel Water Use
Collect runoff/rainwater
Treat water on boat
Maintain ballast tanks
Exchanges off‐shore
M‐1: Reuse of Materials MRp1‐Recyclables MSp5.1‐Eliminate threatened wood IS‐10: Amend and Reuse Existing Soils Reduce waste due to activity GM1‐Materials
M‐2: Recycle content MRc1.1‐Building Reuse‐Exterior MSc5.2‐Maintain often IS‐11: Balance Earthwork Recycling dumpsters GM4‐Inventory Program
M‐3: Locally Provided Material MRc1.2‐Building Reuse‐Interior MSc5.3‐Design for deconstruction IM‐1: Use Recycled Materials Sort waste for recycling GM5‐Ship Recycling
M‐4: Bioengineering Techniques MRc2‐Waste Management MSc5.4‐Reuse salvaged materials IM‐2: Use Local/Regional Materials Recycle bins
M‐5: Hazardous Minimization MRc3‐Materials Reuse MSc5.5‐Recycled content materials IM‐3: Reuse Materials High‐recyclable materials
MRc4‐Recycled Content MSc5.6‐Use certified wood IM‐4: Use Durable Materials Hazardous waste plan
MRc5‐Regional Materials MSc5.7‐Use regional materials IM‐5:Sustainably Harvested Wood Sustainable materials
MRc6‐Rapidly Renewable Materials MSc5.8‐Reduce VOC emissions IM‐6: Minimize Toxic Materials Low‐emitting materials
MRc7‐Certified Wood MSc5.9‐Sustainable plant production IM‐7: Enhance Pavement Lifecycle
IEQc4‐Low‐Emitting Materials MSc5.10‐Sustainable manufacturing IM‐8: Utilize Thin Surface Paving
OMp8.2‐Collect recyclables IM‐9: Utilize WMA Technology
OMc8.3‐Recycle organic matter
IEQp1‐Minimum IAQ OMc8.6‐Minimize tobacco smoke Outside air intake AE1‐NOx Reductions
IEQp2‐ETS control OMc8.7‐Minimize greenhouse gases Natural ventilation AE2‐Sox Reductions
IEQc1‐Outdoor Air Monitoring OMc8.8‐Reduce emissions Minimize chemical use AE3‐PM Reductions
IEQc2‐Increased Ventilation Reduce flying dirt AE4‐VOC
IEQc5‐Indoor Pollutant Control Limit engines running AE5‐GHGs
Avoid fossil fuel engines AE7‐Port Air Emissions
S‐1: Alignment Selection SSp1‐Pollution Prevention SSp1.1‐Limit farmland development IS‐1:Integrated Team Approach Brownfield site
SSc1‐Site Selection SSc1.5‐Select brownfields IS‐2: Prepare a Site Assessment Clean polluted water
SSc3‐Brownfield Redevelopment PDp2.1‐Pre‐design assessment IS‐3:Previously Developed Sites Reduce construction waste
EAp1‐Fundamental Commissioning PDp2.2‐Integrated site development IS‐4:Known Contaminated Sites Dredging
EAc3‐Enhanced Commissioning PDc2.3‐Engage users in site design IS‐12: Coordinate Utility Work
IEQc3‐Construction IAQ SVp4.4‐Minimize soil disturbance IS‐13: Utilize Trenchless Technology
Cp7.1‐Control construction pollutants IS‐18:Roadway Alignment Section
Cp7.2‐Restore disturbed soils IC‐1: Minimize Pollution
Cc7.3‐Restore disturbed soils IC‐2: Protect Existing Natural Systems
Cp7.4‐Divert materials from disposal IC‐3:Transportation Management
Cp7.5‐Reuse soil IC‐4:Green Construction Equipment
Cp7.6‐Minimize emissions IC‐5: Reduce Noise and Vibration
IC‐6:Waste Management
IC‐7:Integrated Pest Management
Materials
Air Quality
Construction Phase
Energy
Water
Traffic/Parking
Community/Social

27
With this integration setup one can quickly see how the credits relate across rating systems. This
integration only shows the title of each credit, more detailed management practices of each credit for
the rating systems is located in Appendix B. This Green Rating Integration Platform currently relates
different green rating systems together and integrates in guidelines as well. Future work could be done
with the Green Rating Integration Platform to expand this integration to include regulations and design
standards, further helping WSF to make design, construction, and operations and maintenance
decisions. This will be further expanded upon in Chapter 7.
2.3 Stormwater Guidelines
For the purpose of this thesis, the focus is on stormwater treatment of ferry terminals. Focusing
on the water section of Table 2.2 and the stormwater credits within that section, Table 2.3 shows
stormwater guidelines across the green rating systems with additional practices below each rating
credit, integrated with the WSU Ferry Guidelines.

28
Table 2.3: Stormwater guidelines across multiple green rating systems
Upland Land Side Land Side Intermodal Intermodal Marine Side
GreenLITES LEED retail Sustainable Sites Initiative Port Authority WSU Ferry Guidelines MVeP W‐1: Stormwater Management SSc6.1‐Stormwater Quantity Control Wc3.3‐Protect/Restore buffers IS‐7: Utilize Pervious Pavement Emergency plan for spills WE1‐Oily Water
Stormwater retrofitting Maintain predevelopment rates Design to avoid disturbance Use pervious concrete, asphalt, pavers Oil separation equipment Use separating equipment
Eliminate non‐SW discharge Protect streams from erosion Re‐establish vegetated areas Use vegetated bioswales or ditches Non toxic paint Monitor discharge
Reduce impervious area SSc6.2‐Stormwater Quality Control Manage invasive plant species Utilize salt‐splashes at roadway edge Treat wastewater on‐site WE2‐Non‐Indigenous Species
W‐2:BMPSs Reduce impervious cover Wc3.4‐Rehabilitate streams Use structural soil to enhance percolation Implement LIDs WE2.1‐Ballast Water/Sediment
Use highly permeable soils Promote infiltration Remove stream modifications IS‐9: Use Turfgrass Appropriately Collect runoff/rainwater Ballast water treatment system
Use wet or dry swales Capture and treat stormwater Don't disrupt sediment transport Resilient, resistant, low‐maintenance veg. Treat water on boat Reduce NIS vector
Use sand filters or filter bag Wc3.5‐Manage stormwater on site Substitute ground covers for turfgrass Maintain ballast tanks WE2.2‐Hull Fouling
Use oil/grit separators Consider entire hydrologic cycle IW‐1: Implement Stormwater BMPs Exchanges off‐shore Clean vessel exterior
Underground detention systems Minimize impervious cover Implement SW management plan Use hull coating
Catch basin inserts Reduce runoff Lower peak runoff rates WE3‐Sanitary Systems
Permeable pavement Wc3.6‐On‐site water resources Treat stormwater for TSS Improve quality of treated water
Reduce impervious cover Mark storm drains Reduce water discharge
Disconnect impervious cover Bioretention systems WE4‐Solid Waste
Provide depression storage Constructed stormwater wetlands Buy in bulk
Convey stormwater in swales Dry wells Re‐usable and washable items
Use biofiltration Extended detention basins Recycle
Exapotranspire Infiltration structures Low emission handling system
Infiltrate stormwater Manufactured treatment devices WE5‐Incidental Discharges
Minimize material pollutants Pervious paving WE6‐Protection of Oil
Reduce pollutant exposure to SW Sand filters Structural protection
Wc3.7‐Use stormwater for landscape Rain garden
Wc3.8‐Maintain water features IW‐2: Implement Rainwater Neutrality
Mimic natural environment Infiltrate stormwater
Maintain compatibility Mark storm drains
Estimate available rainwater IO‐2: Maintain Soil Quality
Collect/Reuse potable water Prevent soil pollution
Maintain as natural ecosystems Protect soil and minimize erosion
Biologically‐based water treatment Recycle organic waste
Manage snow/ice deicing or removal
Prepare a watering schedule

29
The WSU Ferry Guidelines section was expanded in a recent report developed by WSU for WSF
(Wolcott et al. 2011). The report detailed several different guidelines relating to stormwater on both the
landside and water side of the terminal. The additional techniques are divided into several categories for
both the landside and waterside and can be found in Tables 2.4 and 2.5.

30
Table 2.4: WSU Ferry Guidelines stormwater BMPs for landside of terminal
Fueling Landscape
Management
Treatment
System
Maintenance
Parking and
Storage
Roof/Building
Drains
LIDs
Emergency
plan for spills
PMP free of
pesticides
Oil/water
separator
Dispose
wastewater to
sewer
Analyze runoff
from buildings
Pervious
pavement
Slope fueling
pad
Use less toxic
pesticides
Clean regularly Sweep
regularly
Bio‐retention
ponds/swales
Spill
containment
pad
No pesticides
near water
Inspect and
repair
Oil removal
system
Constructed
stormwater
wetland
Roof over
fueling area
Mulch exposed
soils
Repair
promptly
Buffer strips
Prevent
sediment
discharge
Dispersion
Vegetated
roofs
Rainwater
harvesting
Path
disconnect

31
Table 2.5: WSU Ferry Guidelines stormwater BMPs for waterside of terminal
Loading and Unloading Maintenance of Vessels Mobile Fueling LIDs
Sweep areas Maintenance in a
covered area
Drip pan/pad Stormwater neutrality
Drip pans Store in a covered area Spill remedy kit Treatment
Marine Loading per
Coast Guard
Avoid toxic liquid
chemicals
Pollution prevention
Berm, slope or dikes
Curb along shoreline
Prevent pooling
2.4 WSF Stormwater Pollution Prevention Plan
WSF already has a Safety Management System in place which corresponds well with some elements
of the developing Stormwater Pollution Prevention Plan as detailed in Section 1.4.2. In the previously
mentioned table, provided by WSF and located in Appendix A, four activities relate well with stormwater
management. The four activities relating to water management covered in this table are:
Ramp Operations
Fuel and Hydrocarbon Use
Buildings & Grounds Operations and Maintenance
Dirt and Sediments

32
Each of these activities covers specific pollutant sources, lists possible BMPs, and states where the
activity is covered in the SMS. This information was reorganized as seen in Table 2.6 in order to help
ease the integration of current WSF practices with the above green rating systems.
Table 2.6: WSF current water management guidelines
2.5 Green Rating Integration Platform
The SMS (Table 2.6) was then combined with the five rating systems (Table 2.3) and the updated
WSU Ferry Guidelines (Tables 2.4 and 2.5) into one table so that all information could be cross‐
referenced. The stormwater section of the green rating integration platform is shown in Table 2.7.
Activity BMP Pollutant Source Environmentally friendly hydraulic oils Hydraulic System and Cables Charge hose with potable water Sewage Transfers Hose
Oil Container Transfers Designated area Fuel Storage & Transfers Park in covered area Terminal Bulls Drip pan or pad
Environmentally friendly fuel
Retrofit covered parking
Use coated materials Roofs, Gutter, & Downspouts Use coated materials Galvanized fencing Weekly inspection Stormwater Catch Basins Yellow circle around drains
Integrated pest management Vegetation Management Use approved herbicides
Mechanical control preferred
Bioswale maintenance
Supplies elevated and covered Maintenance and Cleaning Environmentally friendly supplies
No dumping of cleaning waters
Use containment Painting Cover drains
Vacuum holding area quarterly Windblown & tracked in Weekly terminal stormwater inspection
Daily holding area inspection/mop up
Ramp Operations
Fuel and Hydrocarbon Use
Buildings & Grounds Operations and Maintenance
Dirt and Sediments

33
Table 2.7: Stormwater Green Rating Integration Platform with SMS and expanded WSU Ferry Guidelines
Upland Land Side Land Side Intermodal SMS SMS SMS Intermodal Marine Side
GreenLITES LEED retail Sustainable Sites Initiative Port Authority Activity BMP Pollutant Source WSU Ferry Guidelines MVeP W‐1: Stormwater Management SSc6.1‐Stormwater Quantity Control Wc3.3‐Protect/Restore buffers IS‐7: Utilize Pervious Pavement Environmentally friendly hydraulic oils Hydraulic System and Cables Fueling WE1‐Oily Water
Stormwater retrofitting Maintain predevelopment rates Design to avoid disturbance Use pervious concrete, asphalt, pavers Charge hose with potable water Sewage Transfers Hose Emergency plan for spills Use separating equipment
Eliminate non‐SW discharge Protect streams from erosion Re‐establish vegetated areas Use vegetated bioswales or ditches Oil Container Transfers Slope fueling pad Monitor discharge
Reduce impervious area SSc6.2‐Stormwater Quality Control Manage invasive plant species Utilize salt‐splashes at roadway edge Designated area Fuel Storage & Transfers Spill containment pad WE2‐Non‐Indigenous Species
W‐2:BMPSs Reduce impervious cover Wc3.4‐Rehabilitate streams Use structural soil to enhance percolation Park in covered area Terminal Bulls Roof fueling area WE2.1‐Ballast Water/Sediment
Use highly permeable soils Promote infiltration Remove stream modifications IS‐9: Use Turfgrass Appropriately Drip pan or pad Landscape Management Ballast water treatment system
Use wet or dry swales Capture and treat stormwater Don't disrupt sediment transport Resilient, resistant, low‐maintenance veg. Environmentally friendly fuel Pest Management Plan Reduce NIS vector
Use sand filters or filter bag Wc3.5‐Manage stormwater on site Substitute ground covers for turfgrass Retrofit covered parking Less toxic pesticides WE2.2‐Hull Fouling
Use oil/grit separators Consider entire hydrologic cycle IW‐1: Implement Stormwater BMPs Use coated materials Roofs, Gutter, & Downspouts No pesticides 100' to water Clean vessel exterior
Underground detention systems Minimize impervious cover Implement SW management plan Use coated materials Galvanized fencing Pesticide alternatives Use hull coating
Catch basin inserts Reduce runoff Lower peak runoff rates Weekly inspection Stormwater Catch Basins Mulch exposed soils WE3‐Sanitary Systems
Permeable pavement Wc3.6‐On‐site water resources Treat stormwater for TSS Yellow circle around drains SW Maintenance Improve quality of treated water
Reduce impervious cover Mark storm drains Integrated pest management Vegetation Management Oil separation equipment Reduce water discharge
Disconnect impervious cover Bioretention systems Use approved herbicides Clean drainage systems WE4‐Solid Waste
Provide depression storage Constructed stormwater wetlands Mechanical control preferred Inspect BMP systems Buy in bulk
Convey stormwater in swales Dry wells Bioswale maintenance Perform repairs promptly Re‐usable and washable items
Use biofiltration Extended detention basins Supplies elevated and covered Maintenance and Cleaning Prevent heavy discharge Recycle
Exapotranspire Infiltration structures Environmentally friendly supplies Parking & Storage Low emission handling system
Infiltrate stormwater Manufactured treatment devices No dumping of cleaning waters Dispose to sanitary sewer WE5‐Incidental Discharges
Minimize material pollutants Pervious paving Use containment Painting Sweep parking lots WE6‐Protection of Oil
Reduce pollutant exposure to SW Sand filters Cover drains Oil removal system Structural protection
Wc3.7‐Use stormwater for landscape Rain garden Vacuum holding area quarterly Windblown & tracked in Roof/Building Drains
Wc3.8‐Maintain water features IW‐2: Implement Rainwater Neutrality Weekly terminal stormwater inspection Sample SW runoff
Mimic natural environment Infiltrate stormwater Daily holding area inspection/mop up Loading & Unloading
Maintain compatibility Mark storm drains Treat water on boat
Estimate available rainwater IO‐2: Maintain Soil Quality Sweep loading areas
Collect/Reuse potable water Prevent soil pollution Use drip pans
Maintain as natural ecosystems Protect soil and minimize erosion Loading per Coast Guard
Biologically‐based water treatment Recycle organic waste Berm, slope, dike loading
Manage snow/ice deicing or removal Curbs along shoreline
Prepare a watering schedule Prevent pooling
Vehicle Maintenance
Maintain ballast tanks
Ballast exchanges off‐shore
Maintain in covered area
Store in covered area
Use aqueous cleaners
Mobile Fueling
Place drip pan
Spill remedy kit
LIDs
Pervious pavement
Bio‐retention ponds/swales
Constructed SW wetland
Buffer strips
Dispersion
Vegetated roofs
Rainwater harvesting
Reverse slope sidewalks
Minimal excavation
Stormwater neutrality
Stormwater treatment
Pollution prevention
Ramp
Operations
Fuel and
Hydrocarbon
Use
Buildings &
Grounds
Operations
and
Maintenance
Dirt and
Sediments
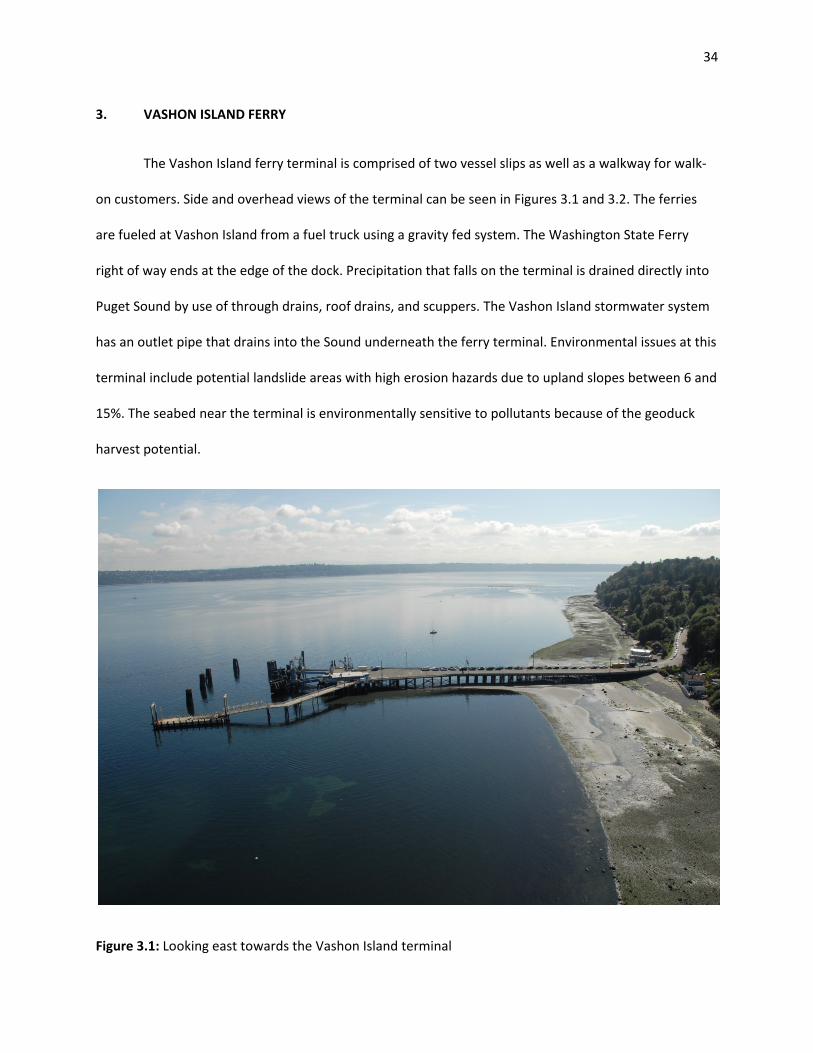
34
3. VASHON ISLAND FERRY
The Vashon Island ferry terminal is comprised of two vessel slips as well as a walkway for walk‐
on customers. Side and overhead views of the terminal can be seen in Figures 3.1 and 3.2. The ferries
are fueled at Vashon Island from a fuel truck using a gravity fed system. The Washington State Ferry
right of way ends at the edge of the dock. Precipitation that falls on the terminal is drained directly into
Puget Sound by use of through drains, roof drains, and scuppers. The Vashon Island stormwater system
has an outlet pipe that drains into the Sound underneath the ferry terminal. Environmental issues at this
terminal include potential landslide areas with high erosion hazards due to upland slopes between 6 and
15%. The seabed near the terminal is environmentally sensitive to pollutants because of the geoduck
harvest potential.
Figure 3.1: Looking east towards the Vashon Island terminal

35
Figure 3.2: Looking northwest towards the Vashon Island terminal
There are several challenges for dealing with stormwater treatment at the Vashon Island
terminal. One challenge is the trestle is almost entirely an over‐water structure, which limits the
stormwater treatment options. Another challenge is the slope leading to the trestle from the Island is
quite steep and thereby causes large amounts of upland water to make its way down towards the
trestle at the water‐land interface. Some of this is currently collected by the Vashon Island stormwater
system and is then released via the previously mentioned outlet pipe. A third challenge that may arise is
WSF is considering multiple construction funding and phasing options. This may result in only a partial
trestle replacement as opposed to the trestle being replaced in its entirety. The three proposed partial
replacement plans are a western trestle replacement, northern trestle replacement, and southern

36
trestle replacement as shown in Figures 3.3, 3.4, and 3.5. These figures were provided by WSF. If a
partial replacement is used it will restrict the stormwater treatment options that can be implemented.
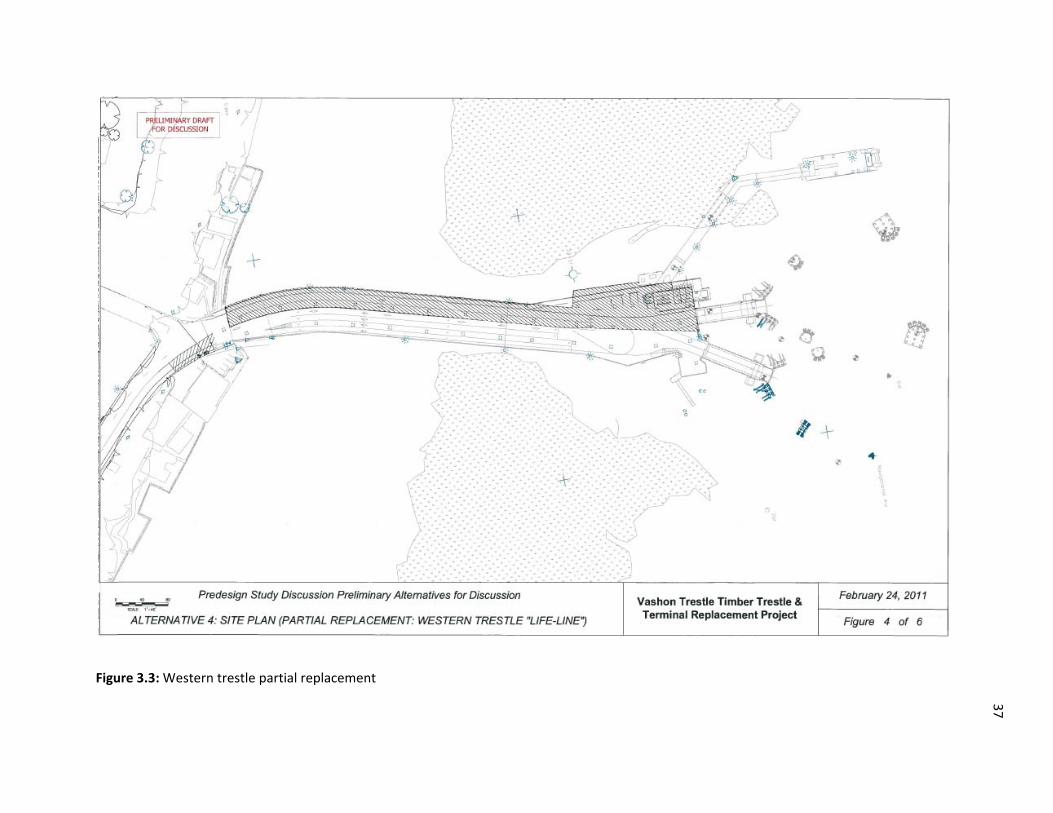
37
Figure 3.3: Western trestle partial replacement

38
Figure 3.4: Northern trestle partial replacement

39
Figure 3.5: Southern trestle partial replacement

40
4. REVERSE SLOPE‐LAND TREATMENT
This chapter begins with some background information about reverse slopes in Section 4.1.
Section 4.2 goes over the hydrological calculations used based on the Stormwater Management Manual
for Western Washington (Ecology 2005). Section 4.3 applies these calculations to the trestle and
analyzes multiple options for the implementation of a reverse slope design. Section 4.4 further analyzes
the options presented in Section 4.3 for the water quality effect each option will have. Finally, Section
4.5 analyzes the reverse slope technique if it treated stormwater coming from upland sources as well as
the trestle.
4.1 Background
Currently, only reverse slope sidewalks are covered by the Western Washington Stormwater
Manual. Reverse slope sidewalks are designed to drain onto vegetated areas as opposed to typical
sidewalks which are designed to drain into the road gutter (Ecology 2005). By invoking a reverse slope
onto the ferry terminal, this will allow precipitation which falls on the terminal to be redirected or
altered towards the land where LID practices can be used effectively. Most LID techniques are applicable
for land side treatment only and cannot be successfully applied on a ferry terminal that is over water.
This practice can be implemented when the terminal is replaced. When reconstructing the ferry
terminal, it could be built in such a way that a portion of the trestle would be a slight uphill slope going
from the land side of the trestle towards the water side of the trestle. This would cause the precipitation
that falls on the trestle to run back towards the land, where it could be contained in a stormwater vault
like the Kristar system used on Bainbridge Island and treated using landside LID techniques. The
remaining paved areas on the trestle would be handled by some innovative treatment catch basins. This
method forces water quantity regulations to be met in addition to water quality regulations. Originally,

41
since the trestle is an overwater structure, the water which falls on the trestle would normally fall into
the Sound anyway, negating the need to regulate how quickly the stormwater is released into Puget
Sound. With a landside stormwater basin, the quantity of water released into Puget Sound must be
taken into consideration in addition to the quality of the stormwater.
A challenge is presented when attempting to reverse slope the entire terminal because there
are constant heights which need to be maintained. The marine side is constrained by the distance
between the trestle and the mean high level water mark. Another constraint is on the other side where
the trestle meets the Vashon highway. The height of the trestle must be maintained so that it is above
tide levels and groundwater levels. Added construction would be required if the height was raised or
lowered.
Another point of concern is if the stormwater is treated on the land side, WSF may be treating
stormwater coming from Vashon Island as well. Stormwater from the island would greatly increase the
amount of stormwater needed to be treated as well as subject WSF to the associated liabilities. The
amount of water coming from land side is uncontrolled and arrives in very large amounts. It was decided
to analyze the reverse slope‐land treatment method for two different scenarios. First the volumes of the
stormwater running off the trestle needs to be analyzed and the considerations for water quality need
to be addressed. The hydrological calculations for stormwater falling on the trestle are shown in Section
4.2. This first scenario will be subdivided into three reverse slope options which are discussed in Section
4.3. Section 4.4 will calculate the water quality for each of the options addressed in Section 4.3. Finally,
Section 4.5 will discuss the second scenario of treating water coming to the trestle from the island.

42
4.2 Hydrological Calculations
The amount of water expected from the land side of the terminal was estimated using the
guidelines outlined in the Western Washington Hydraulics Manual. Based on the given Western
Washington isopluvials (Figure 4.1) for 24 hour storms it was determined that a 2, 10, and 100 year
storm would comprise of 2.25, 3.25, and 4.5 inches of precipitation respectively (Ecology 2005).

43
Figure 4.1: Western Washington two‐year isopluvial (from: Ecology 2005)
Impervious surfaces have a curve number of 98, based on this curve number the potential for
maximum natural detention is calculated using the equation (Ecology 2005):

44
S= (1000/CN)‐10
Where: S = Potential maximum natural detention (inches/area)
CN = Curve number
This gives a potential maximum natural detention of 0.20 inches per area. Runoff depth can
then be calculated using the equation (Ecology 2005):
Qd= (P‐0.2S) 2/ (P+0.8S)
Where: Qd = Runoff depth (inches/area)
P = Precipitation depth (inches/area)
The runoff depth for the 2, 10, and 100 year storms comes out to 2.03, 3.02, and 4.27
inches/unit area respectively.
It may not be necessary to design a detention vault for such high precipitation values. When a
large rainstorm occurs, most of the pollutants are contained in the first portion of the rainstorm, known
as the first flush. It is more important that this first flush receive treatment; the stormwater occurring
later in the storm will have lower pollutant levels.
One set of guidelines for the design water quality volume covered in LEED‐New Construction
under Sustainable Sites credit 6.2: Stormwater Management‐Quality Control. Vashon Island is
considered a semiarid environment by LEED because it receives an annual precipitation between 20 and
40 inches. Due to this characterization, a water quality volume of 0.75” over the total site will need to be
treated during each event (Haselbach 2008).
Another set of guidelines is discussed in the Stormwater Management Manual for Western
Washington (SMMWW). This guideline states that the water quality design storm value can be a sixth‐

45
month, 24 hour storm event. Also, a sixth month storm event is estimated as 72% of the two year storm
amount (Ecology 2005). For Vashon Island, the water quality volume according to this standard would
be 1.49”.
The design would also have an overflow set up for precipitation levels greater than 0.75” for
LEED guidelines or 1.49” for SMMWW guidelines. The overflow would be drained directly into the Sound
through scuppers just like the current setup is now.
4.3 Trestle Calculations
This section will discuss the required vault size for three possible options for applying reverse
slope on the trestle. The options discussed are an entire trestle replacement, a partial replacement of
the southern part of the trestle, and an extended partial replacement of the southern part of the trestle.
Each option will have two possibilities, one is putting a crown on the road and only treating the eastern
part of the trestle and the other is treating both the east and west sides of the trestle.
4.3.1 Option 1: Entire trestle replacement
In total, the trestle has a paved area of 58,935 square feet and a total impervious area of 59,095
square feet. A reverse slope would not be able to treat the entire trestle due to the elevation constraints
at either end. Due to these constraints the reverse slope will cause the trestle to slope upwards from
either end towards the middle, with the landside portion towards the south of the trestle collecting
stormwater in a vault and the waterside portion towards the north of the trestle draining into the Sound
as before. The holding area on the terminal where vehicles are parked for extended periods of time is
known as a pollution hotspot. Hotspots of this nature tend to have pollutant levels five times higher
than streets or residential parking lots (Schueler and Holland 2000). In order to treat the area of most
need, the reverse slope should be designed to treat all of the stormwater coming from the holding area.

46
Since the holding area is more than half of the length of the trestle, this will result in a slightly steeper
slope toward the water side to compensate for the shorter length (Figure 4.3).

47
Figure 4.3: Reverse slope design for full replacement Vashon Island trestle
LEGENDN
CREST(RAISED 2'-7.5")
CROWN
CROWN
VAULT
STORMWATERFLOW PATH
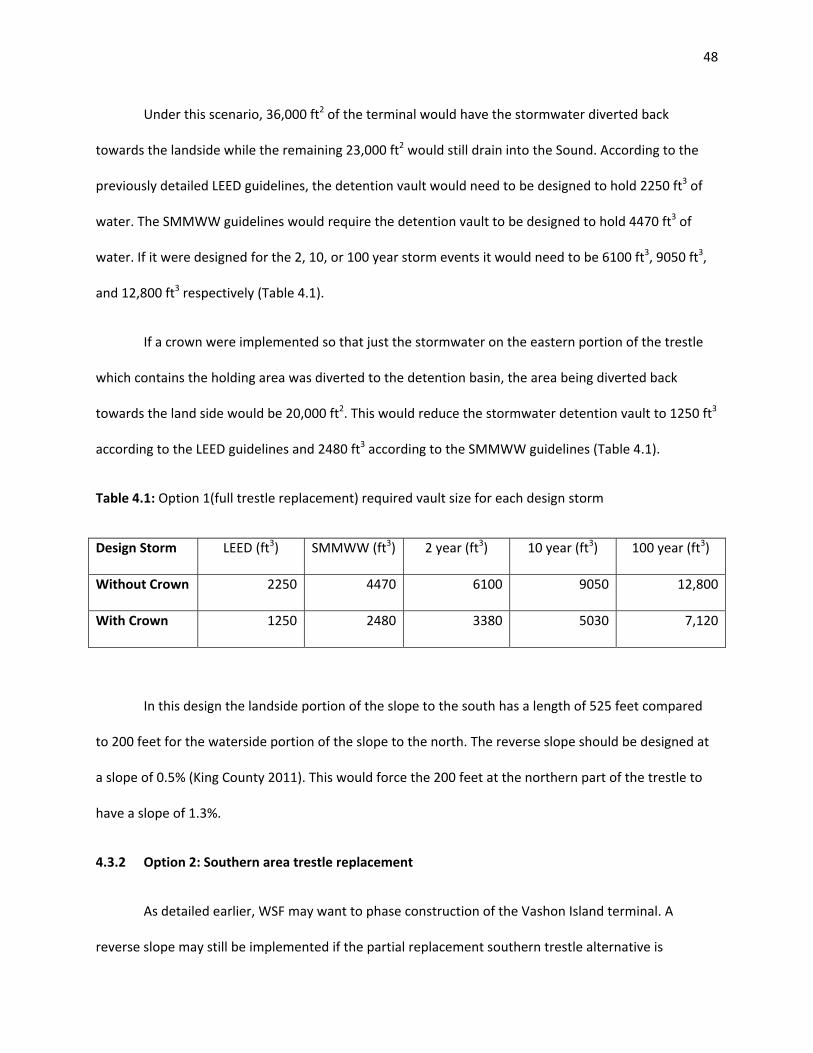
48
Under this scenario, 36,000 ft2 of the terminal would have the stormwater diverted back
towards the landside while the remaining 23,000 ft2 would still drain into the Sound. According to the
previously detailed LEED guidelines, the detention vault would need to be designed to hold 2250 ft3 of
water. The SMMWW guidelines would require the detention vault to be designed to hold 4470 ft3 of
water. If it were designed for the 2, 10, or 100 year storm events it would need to be 6100 ft3, 9050 ft3,
and 12,800 ft3 respectively (Table 4.1).
If a crown were implemented so that just the stormwater on the eastern portion of the trestle
which contains the holding area was diverted to the detention basin, the area being diverted back
towards the land side would be 20,000 ft2. This would reduce the stormwater detention vault to 1250 ft3
according to the LEED guidelines and 2480 ft3 according to the SMMWW guidelines (Table 4.1).
Table 4.1: Option 1(full trestle replacement) required vault size for each design storm
Design Storm LEED (ft3) SMMWW (ft3) 2 year (ft3) 10 year (ft3) 100 year (ft3)
Without Crown 2250 4470 6100 9050 12,800
With Crown 1250 2480 3380 5030 7,120
In this design the landside portion of the slope to the south has a length of 525 feet compared
to 200 feet for the waterside portion of the slope to the north. The reverse slope should be designed at
a slope of 0.5% (King County 2011). This would force the 200 feet at the northern part of the trestle to
have a slope of 1.3%.
4.3.2 Option 2: Southern area trestle replacement
As detailed earlier, WSF may want to phase construction of the Vashon Island terminal. A
reverse slope may still be implemented if the partial replacement southern trestle alternative is

49
implemented (Figure 3.5). This could occur if one of the previously mentioned constraints could be
altered. It may be possible to lower the elevation where the trestle intersects with Vashon highway. This
would be accomplished by continuing the highway a little bit farther down the hill which allows the
trestle to slope to a slightly lower elevation. This would allow the reverse slope method to be used if
only the southern part of the trestle is replaced, with the northern portion of the trestle remaining at its
current elevation (Figure 4.4).

50
Figure 4.4: Reverse slope design for southern portion replacement of Vashon Island trestle
LEGENDN
CREST
CROWNCROWN
VAULT
STORMWATERFLOW PATH
END LOWERED 2'-1.5"

51
The total area of the trestle to be replaced in this alternative is 29,000 ft2 of the 58,580 ft2 of
paved area on the trestle. This means that the detention vault must be around 1800 ft3 to capture and
hold all the water according to LEED guidelines and 3600 ft3 according to SMMWW guidelines. Results
for the design storms are shown in Table 4.2. The addition of a crown for this option would reduce the
treated area from 29,000 ft2 to 16,000 ft2 and the detention vault size would also reduce by a
corresponding amount (Table 4.2).
Table 4.2: Option 2 (southern area trestle replacement) required vault size for each design storm
Design Storm LEED (ft3) SMMWW (ft3) 2 year (ft3) 10 year (ft3) 100 year (ft3)
Without Crown 1800 3600 4900 7300 10,300
With Crown 1000 1990 2710 4030 5690
According to King County development standards, the slope should be a minimum of 0.5% (King
County 2011). Since the southern section of the trestle is 425 feet in length, the trestle would have to be
lowered at the land side by 2 feet, 1.5 inches. This could be done by making the trestle start slightly
closer towards the water and extending the road on the land until the natural elevation drop of the hill
decreases two feet. This would treat slightly over half of the terminal.
4.3.3 Option 3: Extended southern area trestle replacement
As stated previously, the highest pollution area is the holding area where the customer vehicles
are required to park for extended periods of time. Due to this area containing approximately five times
as many pollutants as other areas on the trestle, it is important to ensure as much of the holding area as
possible has the stormwater which runs off of it be treated. The holding area on the Vashon Island

52
terminal compromises approximately 16,310 ft2 towards the southeast portion of the terminal (Figure
4.5).

53
Figure 4.5: The automobile passenger holding area on the Vashon Island terminal
LEGEND
NHOLDINGAREA

54
This portion only makes up about 28% of the terminal but is the source of the majority of
pollutants. For this reason, treating stormwater which runs off of the holding area is a priority. The
pollutant levels would be reduced if the southern trestle replacement area was extended 100 feet
farther north in order to include the holding area in its entirety. If the partial construction alternative of
the southern portion of the terminal discussed in Option 2 is used, 13,000 ft2 of the holding area will be
renovated, roughly 80%. If the partial replacement plan for the southern trestle could be extended
another 100 feet over the water, increasing the total construction area to 36,000 ft2, the entire holding
area could be given the reverse slope treatment (Figure 4.6). This would increase the detention vault
size to 2250 ft3 for LEED and 3600 ft3 for SMMWW without and crown and 1250 ft3 for LEED and 2480 ft3
for SMMWW with a crown. The trestle would need to be lowered at the land side by 2 feet, 7.5 inches.
Results for the design storms are shown in Table 4.3.
Table 4.3: Option 3 (extended southern area trestle replacement) required vault size for each design
storm
Design Storm LEED (ft3) SMMWW (ft3) 2 year (ft3) 10 year (ft3) 100 year (ft3)
Without Crown 2250 4470 6100 9050 12,800
With Crown 1250 2480 3380 5030 7,120

55
Figure 4.6: Plan for partial replacement of the southern trestle area of the Vashon Island terminal with the proposed extension
LEGEND
N
CREST
CROWN
CROWN
VAULT
STORMWATERFLOW PATH
END LOWERED 2'-7.5"
SOUTHERN AREA
HOLDING AREA
PROPOSEDEXTENSION

56
By extending the area which is going to be replaced, the treated area matches what was
achieved in the entire trestle replacement discussed as Option 1. The vault sizes for all three options and
all five precipitation design criteria are summarized in Table 4.4. These data will be further presented in
a decision support tool in Chapter 7.
Table 4.4: Summary of vault size for various design options
Design Storm LEED
(ft3)
SMMWW
(ft3)
2 year
(ft3)
10 yr
(ft3)
100 yr
(ft3)
Lowered
Distance
Option 1: Full Trestle 2250 4470 6100 9050 12,800 0
‐With Crown 1250 2480 3380 5030 7,120 0
Option 2: Southern Portion 1800 3600 4900 7300 10,300 2’ 1.5”
‐With Crown 1000 1990 2710 4030 5,690 2’ 1.5”
Option 3: Extended Southern Portion 2250 4470 6100 9050 12,800 2’ 7.5”
‐With Crown 1250 2480 3380 5030 7,120 2’ 7.5”
4.4 Water Quality Implications
This section looks at the amount of pollutants treated by each of the options discussed in
Section 4.3. The effectiveness of each of the above options can be measured by the ratio of pollutants
which are treated by the vault. This can be determined based on the areas of the terminal and the
holding area comprised with the knowledge that the pollutant levels will probably be higher in the
holding area than the rest of the terminal (Schueler and Holland, 2000). The holding area is defined as a
hotspot area because it has a larger load of hydrocarbons and trace metals than other areas. Due to this,
it is necessary to weight the areas of the project with higher pollutant loads with a hotspot factor in
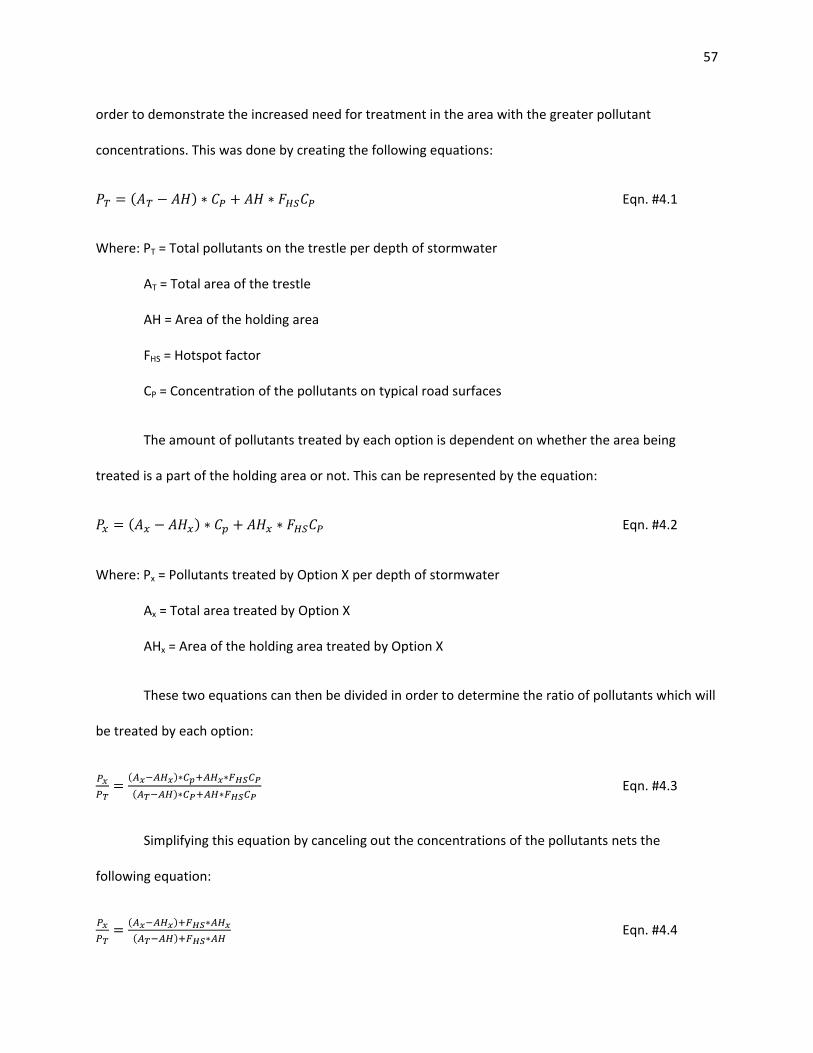
57
order to demonstrate the increased need for treatment in the area with the greater pollutant
concentrations. This was done by creating the following equations:
Eqn. #4.1
Where: PT = Total pollutants on the trestle per depth of stormwater
AT = Total area of the trestle
AH = Area of the holding area
FHS = Hotspot factor
CP = Concentration of the pollutants on typical road surfaces
The amount of pollutants treated by each option is dependent on whether the area being
treated is a part of the holding area or not. This can be represented by the equation:
Eqn. #4.2
Where: Px = Pollutants treated by Option X per depth of stormwater
Ax = Total area treated by Option X
AHx = Area of the holding area treated by Option X
These two equations can then be divided in order to determine the ratio of pollutants which will
be treated by each option:
Eqn. #4.3
Simplifying this equation by canceling out the concentrations of the pollutants nets the
following equation:
Eqn. #4.4
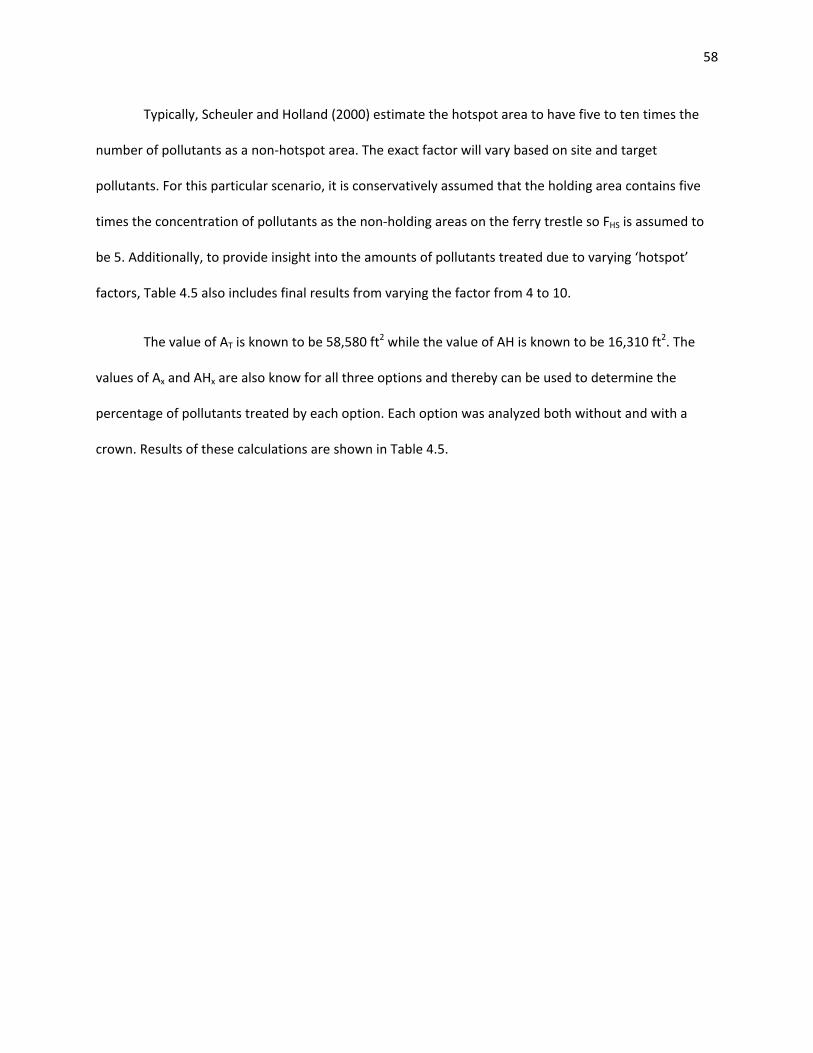
58
Typically, Scheuler and Holland (2000) estimate the hotspot area to have five to ten times the
number of pollutants as a non‐hotspot area. The exact factor will vary based on site and target
pollutants. For this particular scenario, it is conservatively assumed that the holding area contains five
times the concentration of pollutants as the non‐holding areas on the ferry trestle so FHS is assumed to
be 5. Additionally, to provide insight into the amounts of pollutants treated due to varying ‘hotspot’
factors, Table 4.5 also includes final results from varying the factor from 4 to 10.
The value of AT is known to be 58,580 ft2 while the value of AH is known to be 16,310 ft2. The
values of Ax and AHx are also know for all three options and thereby can be used to determine the
percentage of pollutants treated by each option. Each option was analyzed both without and with a
crown. Results of these calculations are shown in Table 4.5.

59
Table 4.5: Percentage of pollutants on the trestle treated by each option
Ax (ft2) AHx (ft
2) Px/PT (%)
if FHS = 4
Px/PT (%)
if FHS = 5
Px/PT (%) if
FHS = 10
Option 1 (full replacement) –
Without Crown
36,000 16,310 79 82 89
Option 1 (full replacement) –
With Crown
20,000 16,310 64 69 81
Option 2 (southern portion)
– Without Crown
29,000 13,000 63 65 71
Option 2 (southern portion)
– With Crown
16,000 13,000 51 55 65
Option 3 (extended southern
portion) – Without Crown
36,000 16,310 79 82 89
Option 3 (extended southern
portion ) – With Crown
20,000 16,310 64 69 81
By focusing on the holding area, the percentage of pollutants being treated will be greater than
the percentage of trestle being replaced. These data will be further presented in a decision support tool
in Chapter 7.
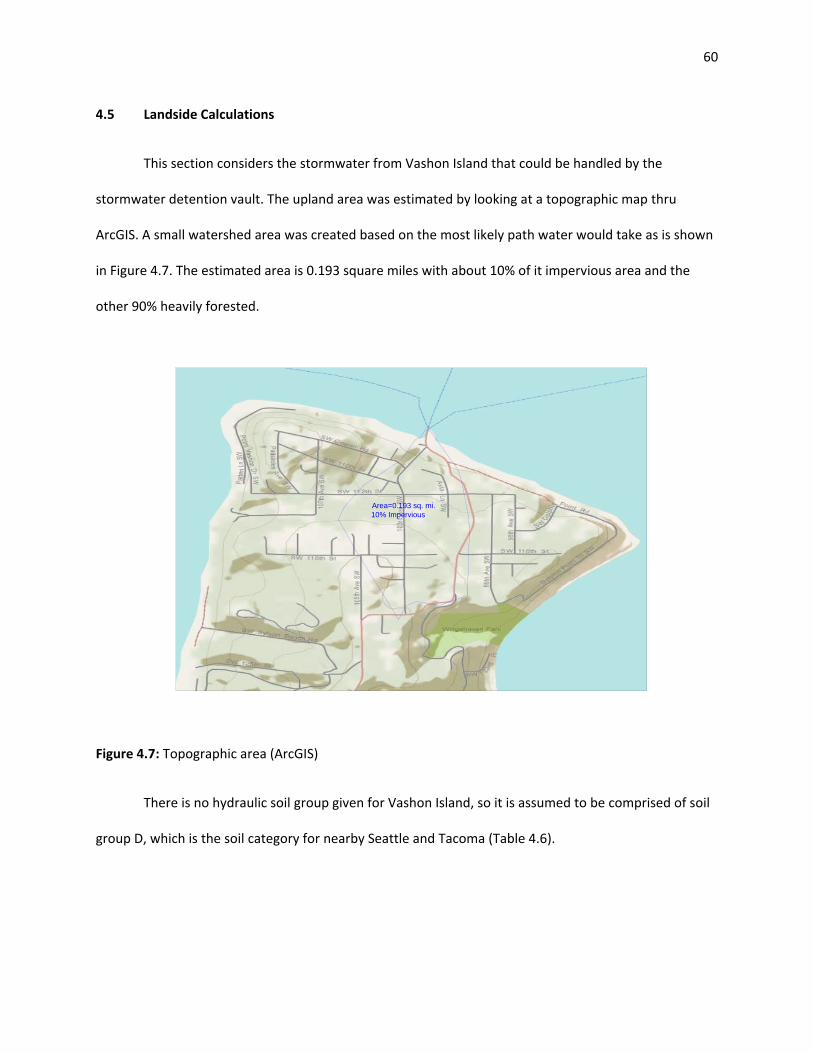
60
4.5 Landside Calculations
This section considers the stormwater from Vashon Island that could be handled by the
stormwater detention vault. The upland area was estimated by looking at a topographic map thru
ArcGIS. A small watershed area was created based on the most likely path water would take as is shown
in Figure 4.7. The estimated area is 0.193 square miles with about 10% of it impervious area and the
other 90% heavily forested.
Figure 4.7: Topographic area (ArcGIS)
There is no hydraulic soil group given for Vashon Island, so it is assumed to be comprised of soil
group D, which is the soil category for nearby Seattle and Tacoma (Table 4.6).
Area=0.193 sq. mi.10% Impervious
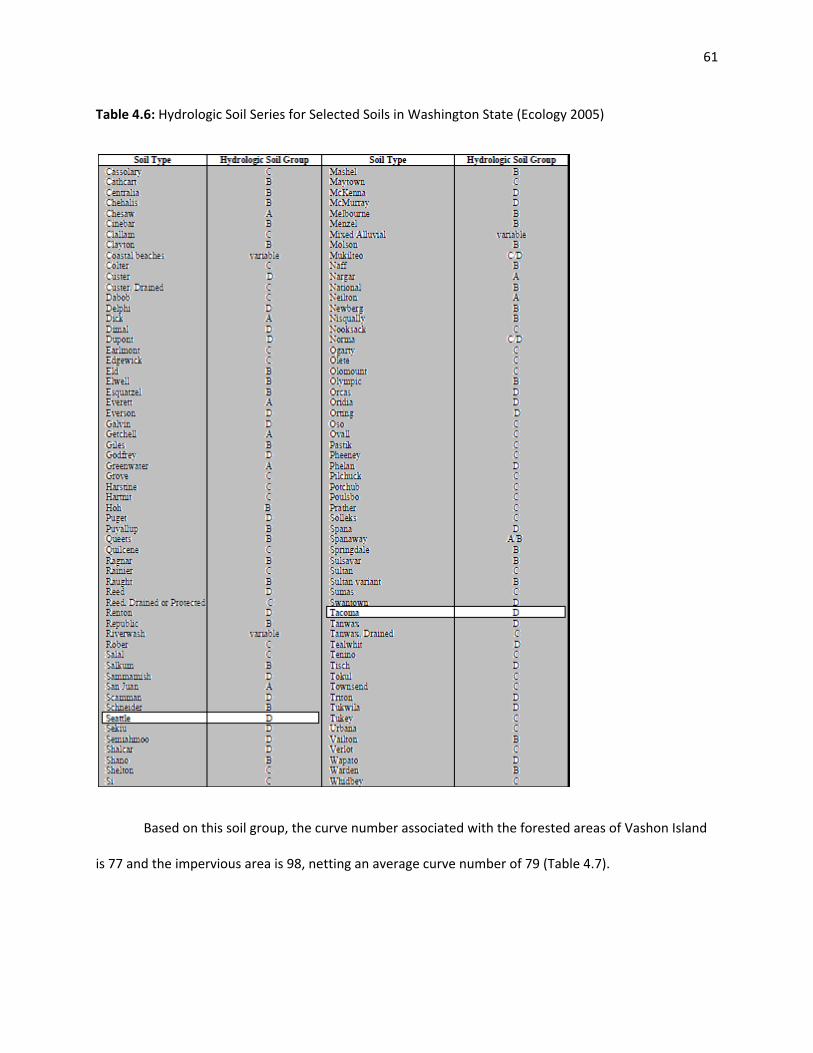
61
Table 4.6: Hydrologic Soil Series for Selected Soils in Washington State (Ecology 2005)
Based on this soil group, the curve number associated with the forested areas of Vashon Island
is 77 and the impervious area is 98, netting an average curve number of 79 (Table 4.7).
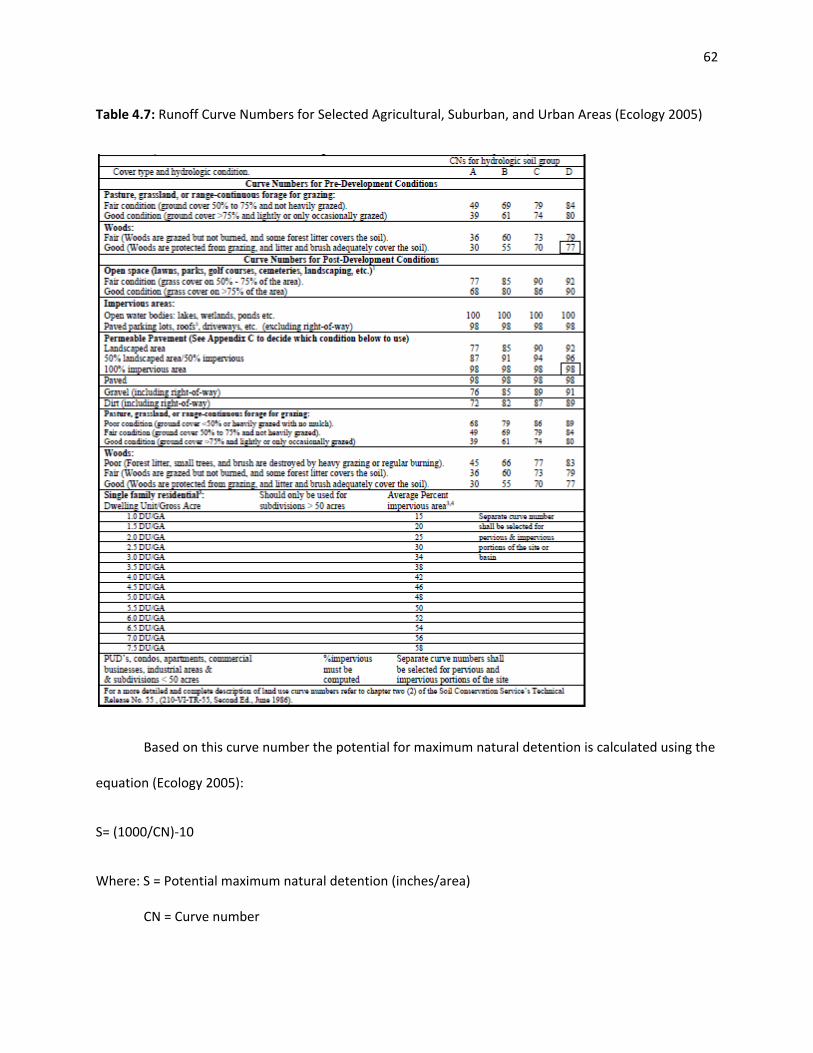
62
Table 4.7: Runoff Curve Numbers for Selected Agricultural, Suburban, and Urban Areas (Ecology 2005)
Based on this curve number the potential for maximum natural detention is calculated using the
equation (Ecology 2005):
S= (1000/CN)‐10
Where: S = Potential maximum natural detention (inches/area)
CN = Curve number

63
This gives the upland area a potential maximum natural detention of 2.66 inches per area.
Runoff depth can then be calculated using the equation (Ecology 2005):
Qd= (P‐0.2S) 2/ (P+0.8S)
Where: Qd = Runoff depth (inches/area)
P = Precipitation depth (inches/area)
S = Potential maximum natural detention (inches/area)
The runoff depth for the 2, 10, and 100 year storms is 0.67, 1.37, and 2.38 inches/area
respectively. Based on the upland area of 0.193 square miles or 5,380,500 square feet, the detention
vault would need to be about 140,000 cubic feet for a six month storm event using the SMMWW
guidelines. Results for the other design storms are shown in Table 4.8. These data will be further
presented in a decision support tool in Chapter 7.
Table 4.8: Required vault size for each design storm for upland area
Design Storm LEED (ft3) SMMWW (ft3) 2 year (ft3) 10 year (ft3) 100 year (ft3)
Vault Size (ft3) 450,000 140,000 300,000 615,000 1,075,000
An interesting observation is the required vault size for the SMMWW guideline is much smaller
than the vault size for the LEED guideline. When calculating the vault sizes for the trestle the LEED
guideline indicated a smaller vault than the SMMWW guideline. The reason for this is the SMMWW
calculations take into account the maximum natural detention and other hydrological processes upslope
from the trestle for the landside contributions, while the LEED guideline is a uniform 0.75” of rainfall
over the entire area regardless of what the surface detention or other processes might be. This is more
apparent on the upland calculations due to the presence of forest land. When comparing these two

64
guidelines for the trestle portion of the runoff, all of the area is impervious, causing the potential
maximum natural detention to be quite small and therefore making the land surface impacts similar in
the two approaches. The SMMWW estimate is larger for the trestle side since a greater rainfall depth of
1.49” is based specifically on rainfall patterns in the local area.
5. PERVIOUS CONCRETE‐SWEEPING
This section covers an alternative LID design integrating a pervious concrete overlay for a
portion or all of the paved trestle areas in combination with high efficiency sweeping and possibly
special catch basin inserts. Background information is presented in Section 5.1 and three design options
are presented in Section 5.2.
5.1 Background
The pervious concrete method would also be implemented during replacement, and consists of
applying a pervious concrete overlay to the existing pavement which would allow for horizontal flow of
stormwater through the medium to modified catch basins on the edge of the pavement prior to
discharge into the Sound. The pervious concrete would undergo maintenance involving high efficiency
sweeping. Catch basins are optional depending on the water quality improvement and the future water
quality requirements imposed on WSF. Pervious concrete differs from traditional pavements in that it
allows surface water to run through the pavement instead of on top of the pavement. As the water runs
through the concrete, most pollutants remain on the surface of the pavement, which can later be
removed by use of sweeping. It has been shown that a porous asphalt overlay is successful in removing
total suspended solids, phosphorus, and heavy metals such as copper, lead, and zinc (Barrett 2008).
Similar results can be expected with pervious concrete. Research has shown that pervious concrete in
conjunction with pavement cleaning is successful in removing particulates from stormwater (Sansalone

65
2008). A study was recently performed in the Pacific Northwest comparing durability of permeable
pavement to impermeable pavement. After six years of daily parking use, there were no major signs of
wear. Nearly all of the stormwater infiltrated into the permeable pavement, reducing runoff to near
zero (Rushton 2001; Battebo and Booth 2003; Bean et. al 2007). Motor oil was detected in 89% of the
samples taken from the impervious pavement but was not found in any water that had been infiltrated
through the permeable pavement (Brattebo and Booth, 2003).
As noted in the aforementioned studies, it is expected that a significant portion of the oil and
grit pollutants from the pavements would be retained by the pervious concrete, although some oil and
solids would still run through the concrete and therefore might be additionally treated using an oil/grit
separator type of catch basin (EPA 2006). The pervious concrete method should also be combined with
high efficiency sweeping, similar to what was concluded in the SR 520 study, to help with the reduction
of dirt particles. Sweeping will also help to prevent the pervious concrete from clogging and losing
effectiveness (Tennis et al. 2004).
Pervious concrete does not have as much strength and durability as traditional concrete for
heavy vehicle loading. For this reason, it may be beneficial, and perhaps more economical, to
strategically determine the most optimum places where a pervious concrete overlay can be used. In
particular, it is important to limit usage in areas where trucks and heavy vehicles will be parked, or at
those locations, specially design the pervious concrete to be able to withstand heavier than average
vehicle loads. Pervious concrete can still be used in areas with heavy vehicle loads; it would just need to
be designed for that purpose.
One advantage of using pervious concrete as a stormwater management technique is that it can
work with all of the replacement staging strategies proposed by WSF. It is not necessary to replace the
entire trestle to implement pervious concrete. Pervious concrete can simply be overlaid onto the

66
existing structure on the trestle subject to appropriate loading validations or structural improvements.
Three different overlay options will be examined in Section 5.2. These three look at an overlay for the
entire trestle, the holding lanes only, and three of the four holding lanes, those expected to not have
significant truck traffic.
5.2 Options
This section examines three different pervious concrete overlay options. The options are an
overlay over the entire trestle, an overlay of just the holding lanes, and an overlay of three out of the
four holding lanes.
5.2.1 Option 1: Entire trestle overlay
Pervious concrete could be overlaid over the entire existing pavement, totaling 58,580 ft2. The
concrete would need to have a greater strength (usually depth) in areas of moving traffic or where
heavy vehicles may be parked for extended periods of time (Figure 5.1). This option has the advantage
of treating stormwater for pollutants throughout the entire trestle but has the disadvantage of a higher
cost. All three options are summarized in Table 5.1.
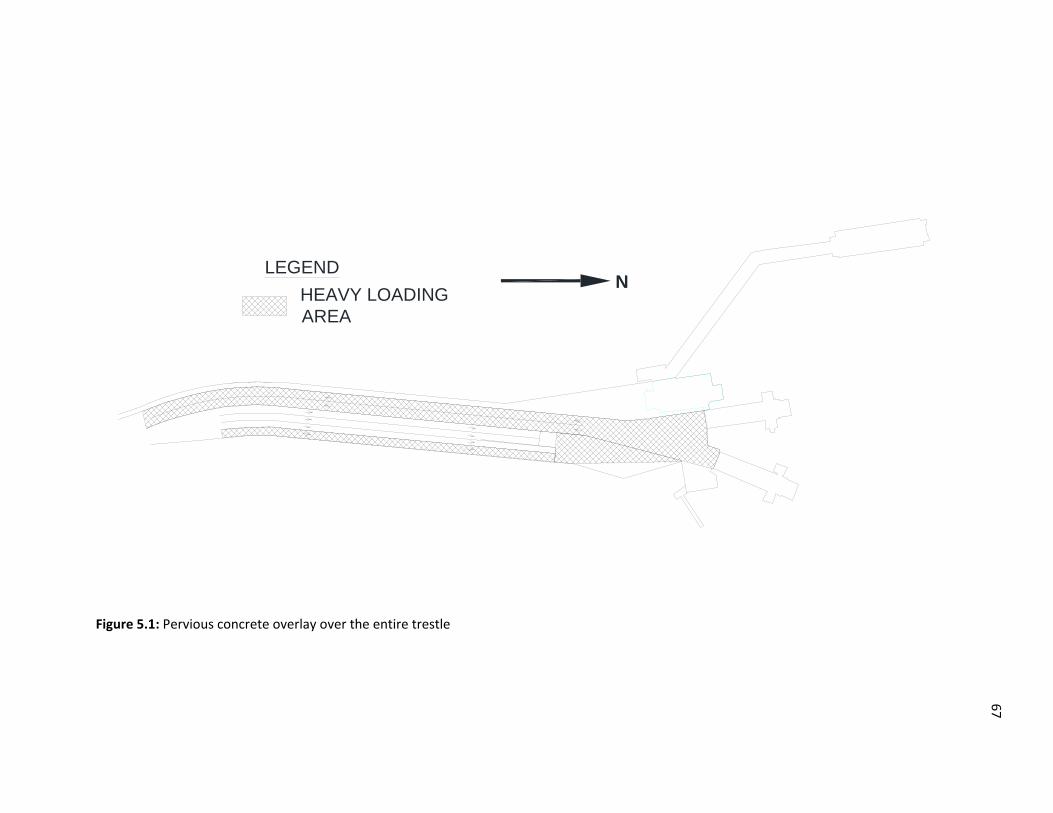
67
Figure 5.1: Pervious concrete overlay over the entire trestle
LEGENDN
HEAVY LOADINGAREA

68
5.2.2 Option 2: Holding lanes only
As previously mentioned, the holding lanes are the source of the highest pollutant loads. These
high pollutant loads are caused by vehicles being parked or idling at this location for extended periods of
time. As a result, the holding area should be the highest priority when treating stormwater for
pollutants. By overlaying pervious concrete on only the holding lanes, the efficiency of pollutants
treated versus area is as high as possible (Figure 5.2). When overlaying pervious concrete on all four
holding lanes, it may be necessary to specify one lane for heavy vehicles and use a thicker, stronger
pervious concrete for that lane. Using Equation 4.4 in Section 4.4, this option treats 66% of the
pollutants on the trestle (Table 5.1). Additionally, to provide insight into the amounts of pollutants
treated due to varying ‘hotspot’ factors, Table 5.1 also includes final results from varying the factor from
4 to 10.

69
Figure 5.2: Pervious concrete overlay for the holding lanes only
LEGENDN
PERVIOUS CONCRETE

70
5.2.3 Option 3: Three out of four holding lanes
A third option is applying a pervious concrete overlay to only three of the four holding lanes
(Figure 5.3). The fourth holding lane would then be used for all heavy traffic. In this option, a majority of
the heavy pollutant area is still treated and the pervious concrete will not have to be specially designed
for a heavy traffic load and is therefore the least expensive option. It is assumed that heavy vehicles
contribute the same amount of pollutants per area as the lighter vehicles. Using Equation 4.4 in Section
4.4, this option treats 49% of the pollutants on the trestle (Table 5.1).
Table 5.1: Summary of the three pervious concrete options presented
Options Total Pervious
Concrete Area (ft2)
Pervious Concrete Heavy
Loading Area (ft2)
Px/PT (%)
if FHS = 4
Px/PT (%)
if FHS = 5
Px/PT (%)
if FHS = 10
Entire trestle
overlay
58,580 28,190 100 100 100
Holding lanes
only overlay
16,310 4,080 61 66 79
Three holding
lanes overlay
12,230 0 46 49 60
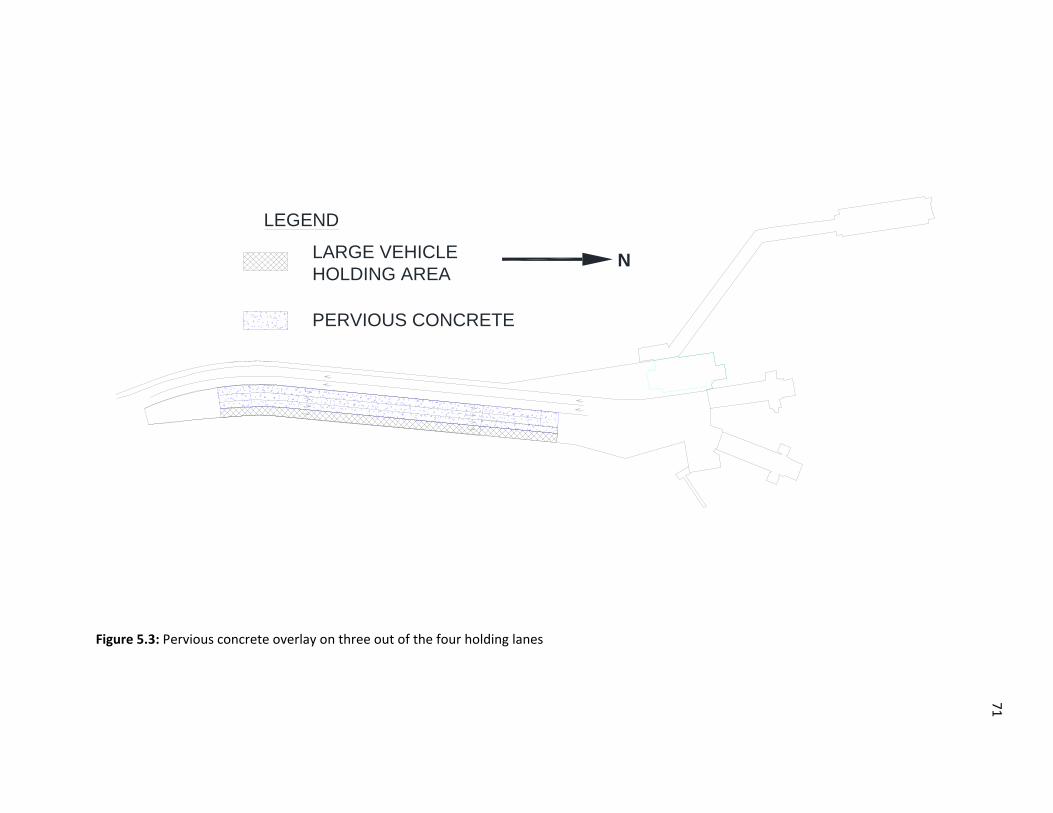
71
Figure 5.3: Pervious concrete overlay on three out of the four holding lanes
LEGEND
NLARGE VEHICLEHOLDING AREA
PERVIOUS CONCRETE

72
6. GREEN RATING SYSTEM POINTS
This section will make use of the Green Rating Integration Platform to identify which credits in
each of the rating systems are met by the two designs discussed in Chapters 5 and 6. Both the reverse
slope and the pervious concrete alternatives will be examined by each of the four land side rating
systems (GreenLITES, LEED, SSI and PANYNJ) and the appropriate points and credits will be assigned in
each rating system for the design. The reverse slope credits are summarized in Section 6.1 and Table 6.1
and the pervious concrete credits are summarized in Section 6.2 and Table 6.2.
6.1 Reverse Slope
The reverse slope design meets the requirements for two credits in the GreenLITES system, W‐1
and W‐2. W‐1 is the first water quality credit and focuses on both volume and quality of stormwater
management. The reverse slope design is worth two points for this credit as long as it is accompanied by
a model which demonstrates how the design will reduce the pollutant loading into Puget Sound. Credit
W‐2 of GreenLITES is focused on the use of BMPs. Reverse slope also earns two points in credit W‐2 for
the stormwater detention basin which the stormwater is diverted to.
The LEED retail system credit which can be met is Sustainable Sites credit 6.2. This credit focuses
on quality control of stormwater and is worth one point. In order to meet this credit 90% of the average
annual rainfall must be treated and 80% of the total suspended solids (TSS) must be removed from the
stormwater. This can be proven if the detention system is designed according to state or local
performance standards or if monitoring data is available. Unfortunately, none of the options outlined for
reverse slope would precisely meet these requirements because less than 90% of the terminal is
treated, but with a credit interpretation for the water quality criteria as meeting the intent of the credit,
it might be met for the Option 1 (full replacement) without a crown or Option 3 (extended southern
73
portion) without a crown. Also, LEED also has a credit for innovative design processes and the reverse
slope technique may earn a point in that area.
Sustainable Sites Initiative’s water credit 3.5 focuses on managing stormwater on site and is
worth between five and ten points. To qualify for this credit the initial and final runoff rates as well as
the target water storage volumes need to be documented. Also, it must be shown that the release of
water from the detention basin will not harm the ecology or cause safety concerns. Finally, it must be
documented that the design does not negatively affect the Puget Sound. The reverse slope design
should meet all these requirements without a problem and therefore be eligible for the maximum
number of points.
Implementing stormwater BMPs falls under credit IW‐1 for the Port Authority of New York and
New Jersey Sustainable Infrastructure Guidelines. This credit is currently worth one point in New Jersey
and three points in New York. For sites large than ¼ of an acre, which the Vashon Island terminal is, the
post‐development flow of stormwater must be reduced and the quality improved. Also, the 2, 10, and
100 year storm events must be 50%, 75%, and 80% of pre‐construction rates respectively. Similar to the
LEED credit, the stormwater detention basin must reduce TSS by 80% and if the upland stormwater is
included the TSS must be reduced by 50%. Finally, all catch basins must be marked to inform the public
that they drain directly into the Sound. The reverse slope technique can be made to meet all of these
requirements.
6.2 Pervious Concrete
Pervious pavement also meets both credits W‐1 and W‐2 in the GreenLITES rating system. The
reduction in overall impervious area achieved by using pervious pavements is worth two points for

74
credit W‐1. All types of permeable pavement are also worth two points in credit W‐2 as an appropriate
BMP.
The LEED credit is also the same for both design methods. The sustainable site LEED credit 6.2
focuses on quality control of stormwater and is worth one point. In order to meet this credit 90% of the
average annual rainfall must be treated and 80% of the total suspended solids (TSS) must be removed
from the stormwater. This can be proven if monitoring data is available. This can be met only if the total
overlay option is met.
For the Sustainable Sites Initiative green rating program, the pervious concrete design is eligible
for two different credits. The water credit 3.5 focuses on managing stormwater on site and is worth
between five and ten points. To quality for this credit the initial and final runoff rates need to be
documented. Also, it must be shown that the water runoff will not harm the ecology or cause safety
concerns. Finally, it must be documented that the design does not negatively affect the Puget Sound.
Water credit 3.6 is worth between three and nine points and focuses on water quality. The first
requirement for Wc3.6 is all exterior materials used in the construction must be chosen in order to
minimize the amount of pollutants that stormwater will pick up. An example of this is coating railings
which are a source of zinc. Second, a site maintenance plan must be enacted to ensure the pervious
pavement continues to function correctly. This may involve sweeping. Finally, TSS must be reduced to 25
mg/L, which pervious concrete is expected to achieve. If 80% of stormwater on the site is treated 3
points are earned, 90% of the site gets 5 points, and 95% of the site earns eight points for credit Wc3.6.
This credit will only be eligible for the pervious overlay of the total site, and should earn eight points for
the credit.
Pervious concrete is eligible for two credits under the Sustainable Infrastructure Guidelines as
well. Credit IS‐7 is specifically awarded for the use of pervious pavement. One point is awarded if

75
pervious pavement is used for 25% of the hardscape, two points for 50%, and three points for 75%.
Pervious concrete may also achieve the requirements for credit IW‐1. This credit is currently worth one
point in New Jersey and three points in New York. For sites large than ¼ of an acre, which the Vashon
Island terminal is, the post‐development flow of stormwater must be reduced and the quality improved.
Also, the 2, 10, and 100 year storm events must be 50%, 75%, and 80% of pre‐construction rates
respectively. The stormwater quantity issue may not apply to the trestle because it is an over‐water
structure and the rain which falls on it would normally enter the Puget Sound. This exempts the trestle
from being subject to water quantity guidelines. Similar to the LEED credit, the TSS in the stormwater
must be reduced by 80%. Finally, all catch basins must be marked to inform the public that they drain
directly into the Sound. Due to the TSS requirements, this credit would only be achieved by the total
overlay option.

76
Table 6.1: Possible credits for reverse slope option
Table 6.2: Possible credits for pervious concrete overlay option
Upland Land Side Land Side Intermodal
GreenLITES LEED retail Sustainable Sites Initiative Port Authority W‐1: Stormwater Management ‐ 2 points SSc6.2‐Stormwater Quality Control ‐ 1 point Wc3.5‐Manage Stormwater on Site ‐ 5 to 10 points IW‐1: Implement Stormwater BMPs ‐ 1 to 3 points
Eligible for all three options Possible credit for meeting intent: Eligible for all three options Eligible for all three options Demonstrate a reduction in pollutants Full trestle without crown Calculate storage capacities Implement SW management plan
W‐2:BMPSs ‐ 2 points Extended southern portion without crown Don't harm ecology or safety Lower peak runoff rates
Eligible for all three options IDc1‐Innovation in Design ‐ 1 point Cannot negatively effect Puget Sound Lower TSS by 80%
Use a structural BMP (detention basin) Eligible for all three options Mark storm drains
Achieve measurable environmental performance
Upland Land Side Land Side Intermodal
GreenLITES LEED retail Sustainable Sites Initiative Port Authority W‐1: Stormwater Management ‐ 2 points SSc6.2‐Stormwater Quality Control ‐ 1 point Wc3.5‐Manage Stormwater on Site ‐ 5 to 10 points IS‐7: Utilize Pervious Pavement ‐ 1 to 3 points
Eligible for all three options Eligible for full trestle option Eligible for all three options One point for holding lanes option Reduce overall impervious area Treat 90% of stormwater Calculate storage capacities Three points for full trestle option W‐2:BMPSs ‐ 2 points Remove 80% of TSS Don't harm ecology or safety Utilize pervious pavement
Eligible for all three options IDc1‐Innovation in Design ‐ 1 point Cannot negatively affect Puget Sound IW‐1: Implement Stormwater BMPs ‐ 1 to 3 points
Inclusion of permeable pavement Eligible for all three options Wc3.6‐Receiving water quality ‐ 8 points Eligible for full trestle option Achieve measurable environmental performance Eligible for full trestle option Implement SW management plan
Choose materials which minimize pollutants Lower peak runoff rates
Maintain site to reduce pollutants Lower TSS by 80%
Discharge less than 25mg/L TSS Mark storm drains

77
7. SUMMARY AND RECOMMENDATIONS
A recap of how each objective was completed is provided in Section 7.1 followed by a summary
of the findings in Section 7.2.
7.1 Objectives
Objective 1:
A literature review was performed on several common green rating systems. Background
information was provided on 13 green rating systems which outline different low impact development
practices in Section 1.4.1.
Objective 2:
Five rating systems (GreenLITES, LEED retail, Sustainable Sites Initiative, Port Authority of NY/NJ
Sustainable Infrastructure Guidelines, and MVeP) were determined applicable for some portion of a
ferry terminal in Section 2.1. Combined, these five rating systems addressed the upland, landside,
intermodal, and waterside areas. These five rating systems were organized into seven categories set up
using previous work done by WSU. A matrix, titled Green Rating Integration Platform (GRIP), was
created integrating the LID practices of all five rating systems and previous WSU research, illustrating
how credits relate across rating systems as found in Section 2.2.
Objective 3:
Since the detailed focus of this thesis is stormwater treatment, each of the rating systems
stormwater credits was more thoroughly examined in Section 2.3. The WSU Ferry Guidelines section
was expanded to include current research and new BMP techniques recommended by WSU for WSF
specifically in the area of stormwater treatment in Section 2.4. The WSF safety management system was

78
examined and activities which related to stormwater were reorganized to fit into the previously
developed GRIP matrix. The GRIP was then further expanded to include stormwater credits from all five
rating systems, expanded WSU Ferry Guidelines, and the current WSF safety management system
procedures in Section 2.5 (Table 2.7).
Objective 4:
This thesis then goes on to examine the Vashon Island terminal as a case study with respect to
stormwater challenges and sustainability in Chapter 3. Two different LID strategies used to reduce
stormwater pollutant levels were examined. The reverse slope method was explained and three
different implementation options were presented in Chapter 4. Each of the options resulted in different
required vault sizes and different levels of pollutants which are treated. The reverse slope also
presented the possibility of treating stormwater running onto the terminal from Vashon Island as well as
treating stormwater runoff from the terminal itself. The pervious concrete method was then explained.
It also has three different design options presented which resulted in different construction areas and
levels of treated pollutants, as is presented in Chapter 5. Both of these strategies are further
summarized in decision support tools later in this Chapter 7.
Objective 5:
In Chapter 6, these two LID techniques are analyzed using the Green Rating Integration Platform
in order to relate them to sustainability tools. The GRIP shows which credits each strategy may be
eligible for and what points can be earned.
7.2 Findings
Stormwater runoff contains pollutants which may need to be treated before being discharged
into a water body. Due to the close proximity of ferry terminals to the Puget Sound, most common

79
treatment techniques cannot be easily implemented. Two possible stormwater treatment techniques
for use at the Vashon Island ferry terminal have been investigated. The first of these techniques are a
reverse slope of a portion of the paved trestle area, directing stormwater back towards the land where
it is collected in a stormwater detention vault and appropriately treated. The second technique uses a
pervious concrete overlay on certain portions of the paved areas of the trestle. The overlay would trap
and treat many of the pollutants at the source and might be used in combination with specialized catch
basins for additional treatment.
A summary of the size of the treatment facilities, the percent of pollutants treated based on the
trestle side pavement loadings for water quality volumes as related to the LEED and the SMMWW
standards for the reverse slope method are listed in Table 7.1. Also listed is the additional critical
criterion for the change in elevation of the trestle at the edge of the land (lowered distance), which may
or may not be feasible depending on water levels, etc. Also, the additional waters that the vault would
need to handle if landside runoff is also directed are included in the additional landside row in Table 7.1.
(Note that the LEED requirement does not address the hydrological processes upslope on the land and
therefore the SMMWW volume is more realistic.)
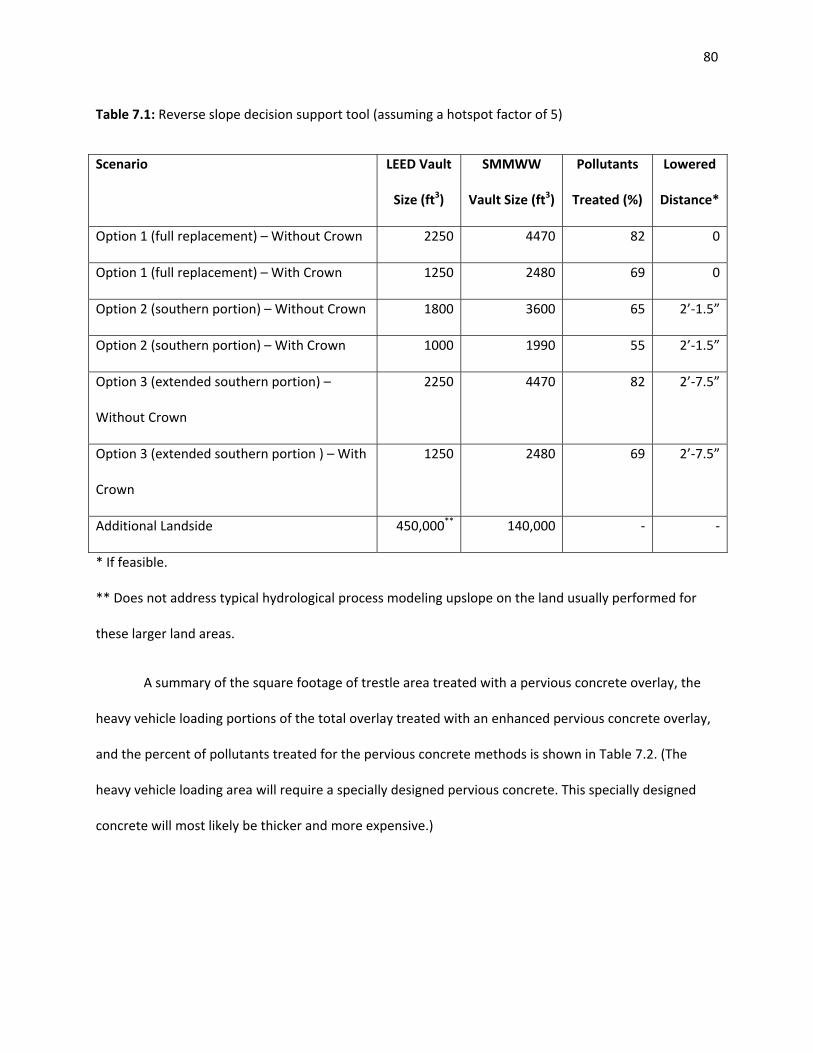
80
Table 7.1: Reverse slope decision support tool (assuming a hotspot factor of 5)
Scenario LEED Vault
Size (ft3)
SMMWW
Vault Size (ft3)
Pollutants
Treated (%)
Lowered
Distance*
Option 1 (full replacement) – Without Crown 2250 4470 82 0
Option 1 (full replacement) – With Crown 1250 2480 69 0
Option 2 (southern portion) – Without Crown 1800 3600 65 2’‐1.5”
Option 2 (southern portion) – With Crown 1000 1990 55 2’‐1.5”
Option 3 (extended southern portion) –
Without Crown
2250 4470 82 2’‐7.5”
Option 3 (extended southern portion ) – With
Crown
1250 2480 69 2’‐7.5”
Additional Landside 450,000** 140,000 ‐ ‐
* If feasible.
** Does not address typical hydrological process modeling upslope on the land usually performed for
these larger land areas.
A summary of the square footage of trestle area treated with a pervious concrete overlay, the
heavy vehicle loading portions of the total overlay treated with an enhanced pervious concrete overlay,
and the percent of pollutants treated for the pervious concrete methods is shown in Table 7.2. (The
heavy vehicle loading area will require a specially designed pervious concrete. This specially designed
concrete will most likely be thicker and more expensive.)

81
Table 7.2: Pervious concrete decision support tool (assuming a hotspot factor of 5)
Options Total Pervious
Concrete Area (ft2)
Pervious Concrete Heavy
Loading Area (ft2)
Trestle Pavement
Pollutants Treated (%)
Entire trestle overlay 58,580 28,190 100
Holding lanes only overlay 16,310 4080 66
Three holding lanes overlay 12,230 0 49
WSF can make preliminary decisions as to which approaches to use based on these decision
support tools, especially in conjunction with other project goals, phasing and economic constraints.
Table 6.1 or Table 6.2 may then be consulted to see which points and credits for which the choices are
eligible, in order to facilitate the decision process based on environmental priorities.
Once a decision has been made, the Green Rating Integration Platform (Figure 2.7) can be
addressed to determine which criteria or credits of the various guidelines the choice will meet and also
how it fits in with current SMS procedures.
It is recommended that either of the alternatives be implemented. The choice of which
alternative and option to use should be based on cost, project phasing, and pollutant reduction goals.
The tables in Chapter 6 and the Green Rating Integration Platform can be used to compare the
alternatives when analyzing the green building and pollutant reduction goals of WSF.
Using this approach for the Vashon Island decision process will aid in the validation of the
decision model. It will also provide information as to how the two proposed low impact development
schemes might be approached economically when implemented at future sites. It is also recommended
that water quality data be collected from the Vashon Island site implementation. This can provide a

82
basis for further refinement of the decision support tools when future water quality requirements are
implemented, and can help with decisions for future site designs.
7.3 Future Development of the GRIP
The GRIP presented in the thesis currently integrates five rating systems relevant to intermodal
facilities as well as a set of guidelines for ferry terminals previously developed by WSU. Ideally, future
work could be done to expand this integration beyond simply green rating systems and guidelines to
include regulations and standards as well.
Green rating systems are tools which are used to confirm a building is being designed and built
sustainably. They provide a metric which measures how sustainable a building or project is by assigning
a representative value which increases the more sustainable practices are used. This value is typically
assigned based on how many credits or criteria the project meets. These credits often fall into a wide
range of categories including site selection, water conservation, energy use, materials selection, and
operations and maintenance. Each credit that is achieved earns points towards the value which is
representative of how sustainable the project is.
Guidelines differ from green rating systems in that there is no value established which relates to
the sustainability of the project. Guidelines are simply in place to help set a principle and suggest
courses of action for the purpose of meeting the goal of building more sustainably. The WSU Ferry
Guidelines used in the GRIP provide a framework of sustainability practices which are specifically
tailored for passenger ferry terminals. These guidelines will assist in allowing WSF to achieve their
sustainability goals by identifying preventative or corrective measures in areas where sustainability can
be improved.
83
Regulations are laws established by the government which must be followed under penalty of a
fine. In the case of WSF, the overriding regulations which must be abided by are set by WSDOT
permitting. Other sources of regulations may come from the King County Surface Water Design Manual
and the Stormwater Management Manual for Western Washington. Another source which must be
followed is design standards. For WSF, these are set by the Washington State Public Building
Requirements, the International Building Code, and the International Green Building Code.
Additional standards which are not building standards include those set by other agencies such
as ASTM or ISO. These standards are sometimes used by green rating systems such as LEED to see if
credits have been successfully earned. Standards can be procedures used for measuring sustainability
and can be used to ensure the same methods are being used universally. The ISO 14000 level standards
specifically apply to environmental management and were actually incorporated into the WSF SMS.
8. REFERENCES
ASHRAE (American Society of Heating, Refrigerating and Air‐Conditioning Engineers) (2011), “ASHRAE
Standards and Guidelines.” <
http://www.techstreet.com/lists/ashrae_standards.tmpl?ashrae_auth_token=>
Barrett, Michael E., (2008). “Effects of a Permeable Friction Course on Highway Runoff.” Journal of
Irrigation and Drainage Engineering, 134(5), 646‐651.
Bean, Eban Zachary, Hunt, William Fredrick, and Bidelspach, David Alan, (2007). “Evaluation of Four
Permeable Pavement Sites in Eastern North Carolina for Runoff Reduction and Water Quality Impacts”
Journal of Irrigation and Drainage Engineering, 133(6), 583‐592.
Brattebo, B. O., and Booth, D.B. (2003). “Long‐term stormwater quantity and quality performance of
permeable pavement systems.” Water Resources, 37(18), 4369‐4376.

84
D’Agneaux, I. (2009). “Development of Sustainability Guidelines for Infrastructure and Their Application
to Passenger Ferry Terminals”, MS Thesis Washington State University Department of Civil an
Environmental Engineering.
Davis, A. P., Shokouhian, M., Sharma, H., Minami, C., & Winogradoff, D. (2003). “Water quality
improvement through bioretention: Lead, copper and zinc removal”. Water Environment Research,
75(1), 73–82.
Dietz, M. E., & Clausen, J. C. (2006). “Saturation to improve pollutant retention in a rain garden”.
Environmental Science & Technology, 40(4), 1335–1340.
Ecology, (2005). “Stormwater Management Manual for Western Washington: Volume III, Hydrologic
Analysis and Flow Control BMPs.” Washington State Department of Ecology Water Quality Program.
Publication Number 05‐10‐32, February 2005.
EPA (U.S. Environmental Protection Agency) (2006), “Catch Basin Inserts.”
<http://cfpub.epa.gov/npdes/stormwater/menuofbmps/index.cfm > (May 24, 2006)
EPA (U.S. Environmental Protection Agency) (2008), “National Menu of Stormwater Best Management
Practices.” < http://www.epa.gov/npdes/stormwater/menuofbmps> (Jan. 9, 2008)
EPA (U.S. Environmental Protection Agency) (2009), “National Pollutant Discharge Elimination System.”
< http://cfpub.epa.gov/npdes/index.cfm > (Mar. 12, 2009)
EPA (U.S. Environmental Protection Agency) (2011), “Low Impact Development (LID).” <
http://water.epa.gov/polwaste/green/index.cfm> (July 18, 2011)
FHWA (Federal Highway Administration) (2011), “Sustainable Highways Self‐Evaluation Tool.” <
http://www.sustainablehighways.org/>

85
GBI (Green Building Initiative) (2011), “Green Globes® ‐ Sustainability Assessment, Improvement, and
Certification for the entire Commercial Building Lifecycle.” < http://www.thegbi.org/commercial/?>
Greenroads, (2011). “Greenroad Manual”, Greenroads. Seattle, WA.
Grismer, M.E. (1981) Evaluating dairy waste management systems influence on fecal coliform
concentration in runoff. MSc, Oregon State University, Corvallis.
Haselbach, Liv (2008). The Engineering Guide to LEED‐New Construction. McGraw‐Hill, New York, NY.
Hunt, W. F., Jarrett, A. R., Smith, J. T., & Sharkey, L. J. (2006). “Evaluating bioretention hydrology and
nutrient removal at three field sites in North Carolina”. Journal of Irrigation and Drainage Engineering,
132(6), 600–608.
IDOT (2010). “I‐LAST: Illinois – Livable and Sustainable Transportation Rating System and Guide”. Illinois
Department of Transportation. Illinois.
ISI (Institute for Sustainable Infrastructure) (2011), “envision Sustainability Rating System.” <
http://www.sustainableinfrastructure.org/rating/index.cfm>
ISO (International Organization for Standardization) (2011). “Environmental Management Systems –
Requirements with guidance for use”. <
http://www.iso.org/iso/iso_catalogue/catalogue_ics/catalogue_detail_ics.htm?csnumber=31807>
Kadlec, Robert H. and Wallace, Scott D., (2009). Treatment Wetlands‐Second Edition. CRC Press, Boca
Raton, FL.
Karr, J. R., and I. J. Schlosser. 1977. Impact of Nearstream Vegetation and Stream Morphology on Water
Quality and Stream Biota. Document No. EPA‐600/3‐77‐097. U.S. Environmental Protection Agency.

86
King County (2011), “King County Code‐21A.18.120.” <
http://www.kingcounty.gov/council/legislation/kc_code.aspx>
Kristar Enterprises Inc. (2010), “The Perk Filter – Media Filtration Device”
<http://www.kristar.com/media‐filtration/the‐perk‐filter‐media‐filtration‐device#pages>
Lochner (2011), “Sustainability.” < http://www.hwlochner.com/Company/Pages/Steed.aspx>
NYDOT (New York Department of Transportation) (2011), “GreenLITES: Recognizing Leadership in
Transportation Environmental Sustainability.” < https://www.nysdot.gov/programs/greenlites>
Roseen, R. M., Ballestero, T. P., Houle, J. J., Avelleneda, P., Wildey, R., & Briggs, J. (2006). “Storm water
low‐impact development, conventional structural, and manufactured treatment strategies for parking
lot runoff”. Transportation Research Record: Journal of the Transportation Research Board, 1984, 135–
147.
Rushton, B. (2001). “Low‐impact parking lot design reduces runoff and pollutant loads.” Journal of
Water Resources Planning Management, 127(3), 172‐179.
Sansalone, J., Kuang, X. and Ranieri, V. (2008), “Permeable Pavement as a Hydraulic and Filtration
Interface for Urban Drainage”, Journal of Irrigation and Drainage Engineering, 134(5), 666‐674.
Schueler, Thomas R. and Holland, Heather K. (2000) “Hydrocarbon Hotspots in the Urban Landscape:
Can They Be Controlled?”, Watershed Protection Techniques, 1(1), 3‐5.
Sheridan, J.M., R. Lowrance, and D.D. Bosch. (1999), “Management effects on runoff and
sediment transport in riparian forest buffers”. Transactions of the American
Society of Agricultural Engineers 42(1): 55‐64.

87
SNAME, (2010), “Marine Vessel Environmental Performance Assessment Guide Template”. Society of
Naval Architects and Marine Engineers Technical & Research Panel EC‐10
SSI (Sustainable Sites Initiative) (2009), “Sustainable Site Initiative ‐ Guidelines and Performance
Benchmarks”
<http://www.sustainablesites.org/report/Guidelines%20and%20Performance%20Benchmarks_2009.pdf
>
Sutherland, Roger, High Efficiency Sweeping as an Alternative to the Use of Wet Vaults for
Stormwater Treatment, 1998.
Tennis, P. D., Leming, M. L., Akers, D. J., 2004. Pervious Concrete Pavements. Portland Cement
Association.
TPA (2010). “Sustainable Infrastructure Guidelines Draft”. The Port Authority of NY & NJ. New York, NY.
USGBC, (2009). “LEED 2009 for Retail: New Construction and Major Renovations Rating System”, US
Green Building Council. Washington D.C.
Winer, Rebeccas, (2000). “National Pollutant Removal Performance Database for Stormwater Treatment
Practices 2nd Edition” EPA Office of Science and Technology, March 2000.
Wolcott, Michael P., Poor, Cara, and Haselbach, Liv. (2011). “Sustainable Design Guidelines to Support
the Washington State Ferries Terminal Design Manual: Stormwater and Material Issues”. Report
Submitted by Washington State University Department of Civil an Environmental Engineering.
WSDOT, (2010). “AKART and Water Quality Studies for SR 520 Replacement Floating Bridge”, prepared
by CH2M Hill for Washington State Department of Transportation and the Federal Highway
Administration. April 2010.

APPENDIX

89
9. APPENDIX
9.1 Appendix A: Table 2 from WSF
Activity Pollutant Sources Associated SMS Procedure To Be Implemented Best
Management Practice(s);
Procedure; Retrofits
Waste Collection
Trash Compactors TERM ENVN 0050 Solid
Waste Disposal and
Recycling
SMSM ENVN 0090 Solid
Waste Disposal and
Recycling
Trash and recycling dumpsters
to be placed under cover where
possible.
Retrofit a cover for dumpsters
at all terminals
Retrofit self closing hydraulic
connections for trash
compactors
Address in Terminal Stormwater
Procedures
Recycle
Dumpsters
TERM ENVN 0050 Solid
Waste Disposal and
Recycling
SMSM ENVN 0090 Solid
Waste Disposal and
Recycling
SMS covers this source.

90
Compost
Dumpsters
TERM ENVN 0050 Solid
Waste Disposal and
Recycling
SMSM ENVN 0090 Solid
Waste Disposal and
Recycling
Seattle only at this time has a
compost program; anticipate
other terminals will be required
to compost in future;
Address in Terminal Stormwater
procedure or update SMSM
ENVN 0090
Hazardous Waste;
Hazardous Waste
Locker
TERM ENVN 0030 Transfer
of Hazardous/Potentially
Hazardous Wastes
TERM ENVN 0040 Storm
Drains and Scuppers
TERM EMER 0010
Emergency Response and
Preparedness
SMSM ENVN 0070 Transfer
of Hazardous/Potentially
Hazardous Waste
SMSM ENVN 0110
Hazardous Materials
Release T
SMS covers this source.

91
ERM SAFE 0150
Ordering/Using Chemical
Products
ENGR ENVN 0060 Transfer
of Hazardous/Potentially
Hazardous Waste
Oily Rags; SMSM ENVN 0070 Transfer
of Hazardous/Potentially
Hazardous Waste
SMS covers this source.
Chemical Product
Use
TERM SAFE 0150
Ordering/Using Chemical
Products
SMS covers this source.
Vendors Vehicles Address in Terminal Stormwater
procedure by prohibiting
vehicles that are repeat leakers.
Vendor Stormwater Compliance
Contract Clauses need to be
incorporated in future contracts
Vendor stormwater training

92
needs to be initiated
Waste Address in Terminal Stormwater
procedure. Contract clause that
Vendors must maintain area
free of items (or elevate and
cover) that could contact
stormwater and pollute.
Chemical Product
Use
Address vendors in Stormwater
procedure.
Address in vendor contracts.
Ramp Operations Hydraulic System
and Cables
MPET Scheduled Need to track developments in
the use of environmentally
friendly hydraulic fluid
lubricating oils (recent review
resulted in going to a less
human toxic formulation).
Sewage Transfers
Hose Leaks &
Connectors
TERM EMER 0010
Emergency Response and
Preparedness
ENGR ENVN 0040 Sewage
Pumping
Investigate if inspection is
adequate and whether or not
procedure needs to include
charging hose with potable
water before pumping

93
ENGR ENVN 0050 Spill
Response

94
Fuel and
Hydrocarbon Use
Oil Container
Transfers
Petroleum
products
TERM ENVN 0035 Oil
Container Transfer and
Disposal
TERM ENVN 0070 Spill
Response
TERM ENVN 0080 Portable
Spill Kits
TERM EMER 0010
Emergency Response and
Preparedness
ENGR ENVN 0070 Oil
Container Transfer and
Disposal
Covered in SMS procedures.
Fuel Storage &
Transfers 5 gallon
plastic containers
in paint locker
SMSM ENVN 0070 Transfer
of Hazardous/Potentially
Hazardous Waste
Need to designate area for
fueling in terminal’s Site Plan
Address in Terminal Stormwater
procedure
Terminal Bulls Address in Terminal Stormwater
procedure include:

95
o Park in covered area
o Place drip pad or pan
beneath terminal bulls if
leaking
o Use environmentally
friendly hydraulic fluid
Retrofit Covered Parking areas at
some terminals
Customer
Activities
Vehicles brought
on site
Address in Terminal Stormwater
Procedure
o Vehicle shutdown
required at holding lanes
o Have pan or pad
available if leak is
noticed
o Inspect holding area for
leaks and mop up daily
o Prohibit vehicles that are
repeat leakers
. Livestock hauling DECK OPER 0170 & 210 Address in Terminal Stormwater
Procedure

96
Transporting Livestock
TERM OPER 0030 Unique
Loading and Off‐Loading
Situations
Seafood Waste
Hauling
DECK OPER 0200
Transporting Seafood
Address in Terminal Stormwater
Procedure

97
Hazardous
Materials
Transport
TERM ENVN 0015
Hazardous Material
Transport by Commercial
Vehicles
TERM ENVN 0020
Hazardous Material
Transport on Scheduled
Trips
TERM ENVN 0025
Hazardous Material
Charters
TERM EMER 0010
Emergency Response and
Preparedness
SMSM ENVN 0070 Transfer
of Hazardous/Potentially
Hazardous Waste
Covered adequately by SMS
procedures
Patrons Pets
walked at
terminals
Address in Terminal Stormwater
Procedure
o Designate Pet Potty Area
o Provide waste station

98
o Educate the pet owners
Buildings &
Grounds
Operations and
Maintenance
Roofs, Walls,
Gutters &
Downspouts
Address in Terminal Design
Manual
o Use coated materials
on roofs and associated
conveyance systems
Galvanized
fencing and
railing for
perimeter and
vehicle control
Address in Terminal Design
Manual
o Use coated materials
when building new or
retrofitting

99
Stormwater Catch
Basins
Address in Terminal Stormwater
Procedure
o Weekly inspection
Retrofit by marking in yellow
circle all drains that directly go
into Puget Sound
Vegetation
Management
Vegetation management is
not included in the
integrated pest
management procedure.
Address bioswale management
in Terminal Stormwater
Procedure
o Integrated Pest
Management
o Use approved herbicides
o Mechanical control
preferred
o Bioswale maintenance
Maintenance and
Cleaning;
TERM SAFE 0100
Housekeeping/Janitorial
Supplies (Does not address
stormwater contact of
materials)
Address in Terminal Stormwater
Procedures
o Keep supplies elevated
and covered
o use environmentally
friendly supplies
o No dumping of cleaning

100
waters down storm
sewers
. Painting; paint
locker
EHBR SAFE 0200 Painting
and Surface Preparation
Address in Terminal Stormwater
Procedures
o Use containment
o Cover drains
Wildlife/Birds Potential roosting
sites
SMSM ENVN 0100
Integrated Pest
Management
Addressed in existing SMS
procedures

101
Dirt and
Sediments
Windblown from
surrounding area
& tracked in by
vehicles
Address in Terminal Stormwater
Procedures
o Vacuum sweep holding
area at least quarterly
and possibly monthly
depending on terminal
needs
o Weekly stormwater
inspection of terminal
o Daily stormwater
inspection of holding
areas and mop up
Deicing and
Sanding
Salt from
compound used
to deice ramp
during cold spells
Address in Terminal Stormwater
Procedure
o Use approved deicer
materials
o Store deicer in covered
area and on pallets or in
a manner that
stormwater will not run
onto it
o When to use

102
deicer/sand
Construction
Activities
Trash and
Recycling
Address in Terminal Stormwater
Procedure
Address in standardized
contract clauses re stormwater
o Trash Coverings
o Recycling
o Laydown Areas
o Use of pallets and
covers
o Daily and Weekly
Inspections
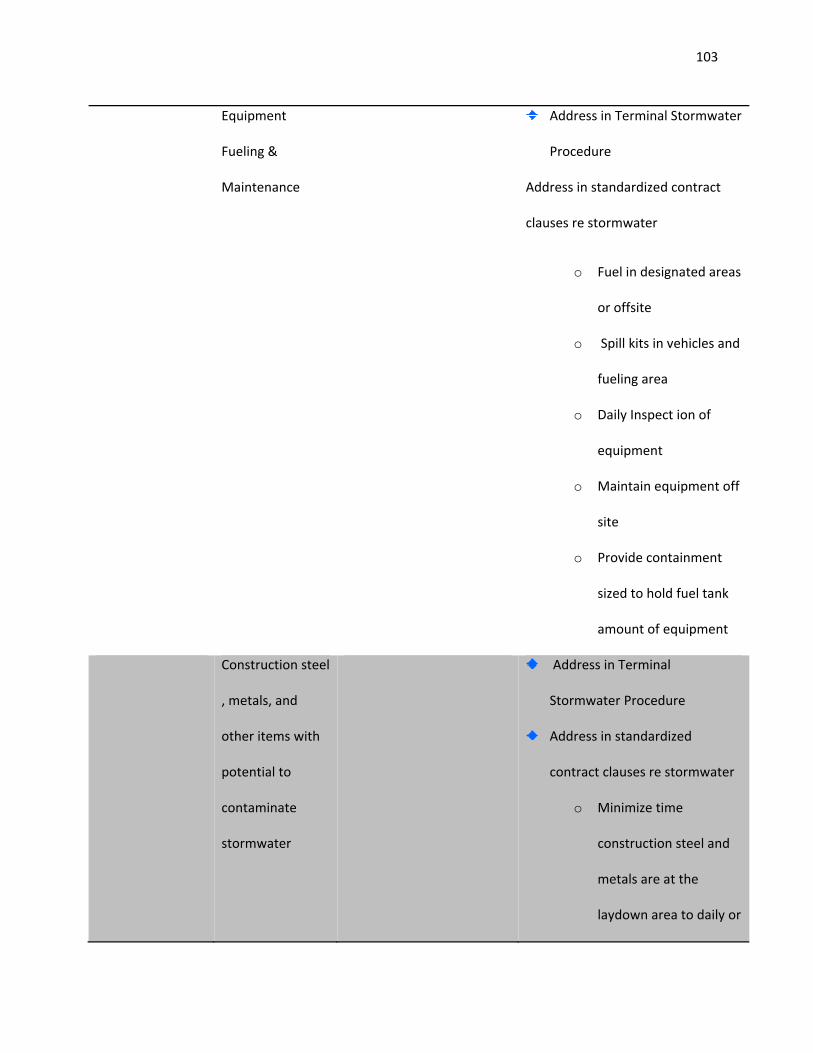
103
Equipment
Fueling &
Maintenance
Address in Terminal Stormwater
Procedure
Address in standardized contract
clauses re stormwater
o Fuel in designated areas
or offsite
o Spill kits in vehicles and
fueling area
o Daily Inspect ion of
equipment
o Maintain equipment off
site
o Provide containment
sized to hold fuel tank
amount of equipment
Construction steel
, metals, and
other items with
potential to
contaminate
stormwater
Address in Terminal
Stormwater Procedure
Address in standardized
contract clauses re stormwater
o Minimize time
construction steel and
metals are at the
laydown area to daily or

104
weekly use
o Place all items on
pallets and cover unless
in use
o Inspect at end of shift
and maintain signed
daily/weekly
stormwater inspection
log
9.2 Appendix B: Detailed management practices for each of the rating systems in the Green Rating
Integration Platform
GreenLITES:
1. Traffic and Parking
E‐1: Improve Traffic Flow
� Special use lane (HOV/Bus Express)
� Installation of a transit expresses system (queue jumper)
� Expansion of Traffic Management/ Traveler Information System operation
E‐4: Improve Bicycle and Pedestrian Facilities
� Separated bike path or shoulder widening to provide on‐road bike land
� Create or extend nearby existing sidewalks
2. Integration in the Community
S‐2: Context Sensitive Solutions

105
� Incorporate local or natural materials for substantial visual elements
� Site materials selection which reduces the overall "heat island" effect
S‐3: Land Use/Community Planning
� Use of more engaging public participation techniques
� Projects better enabling use of public transit
S‐4: Protect, Enhance, or Restore Wildlife Habitat
� Mitigation of habitat fragmentation
� Providing for enhancements to existing wildlife habitat
� Use of natural‐bottomed culverts
S‐5: Protect, Plant or Mitigate for Removal of Trees and Plant Communities
� Re‐establishment or expansion of native vegetation into reclaimed work areas
� Removal of undesirable/invasive plant species
E‐5: Noise Abatement
� Construction of a new noise barrier
� Incorporate traffic system management techniques to reduce prior noise levels
� Diamond grinding of existing PCC pavement
� Berms designed to reduce noise
� Provide planting to improve perceived noise impacts
E‐6: Stray Light Reduction
� Retrofit existing light heads with full cut‐offs, use cut‐offs on new light heads
3. Energy Management
E‐2: Reduce Electrical Consumption
� Solar/battery powered street lighting or warning signs
� Replace overhead sign lighting with high type retro‐reflective sign panels

106
� Use of LED street lighting
E‐3: Reduce Petroleum Consumption
� Provide park & ride lots
� Increase bicycle amenities
� Use of warm mix asphalt
� Improve shading to cut down on heat island effect and automotive air conditioning use
4. Water Management
W‐1: Stormwater Management (volume and quality)
� Improve water quality through use of stormwater retrofitting
� Detect and eliminate any non‐stormwater discharges
� Reduce overall impervious area
W‐2: Best Management Practices (BMPs)
� Design features that make use of highly permeable soils to remove surface pollutants
from runoff
� Use wet or dry swales
� Use sand filters or filter bag
� Use oil/grit separators and hydrodynamic devices
� Use underground detention systems or catch basin inserts
� Inclusion of permeable pavement where practical
5. Materials Management
M‐1: Reuse of Materials
� Design projects so that cut‐and fills are balanced
� Reuse of excess fill within the project corridor
� Specify rubblizing or crack and seating of PCC pavement

107
� Specify the processing of demolished concrete to reclaim scrap metals and aggregate
� Salvage removed trees for lumber
� Use surplus excavated material on nearby state highways
� Reuse of elements of the previous structure
M‐2: Recycle content
� Use tire shreds in embankments
� Use recycled plastic extruded lumber or recycle tire rubber
� Specify hot‐in‐place or cold‐in‐place recycling of hot mix asphalt pavements
� Specify the use of recycled glass in pavements and embankments
� Specify asphalt pavement mixes containing Recycled Asphalt Pavement (RAP)
� Specify Portland cement pavement mixes containing Recycled Concrete Aggregate (RCA)
� Use of Porous Pavement Systems in light duty use situations
M‐3: Locally Provided Material
� Specify locally available natural light weight fill
� Specify local seed stock and plants
M‐4: Bioengineering Techniques
� Utilize soil bioengineering treatments along water body
� Use vegetated crib wall, vegetated gabion, and vegetated mats
� Use biological control methods to reduce invasive species
M‐5: Hazardous Material Minimization
� Design project to minimize need for hazardous materials
� Design project to increase interval before reconstruction or improve durability
� Reduce VOCs or HAPs emitted during construction

108
6. Air Quality
7. Construction Phase
S‐1: Alignment Selection
� Avoid previously undeveloped lands
LEED retail:
1. Traffic and Parking
SSc4‐Alternative Transportation
� Preferred parking for low‐emitting and fuel‐efficient vehicles
� Install alternative fuel refueling stations
� Institute fuel‐efficient vehicle‐sharing program
� Preferred parking for carpools or vanpools
� Provide information about alternative transportation
2. Integration in the Community
SSc2‐Development Density and Community Connectivity
� Use a previously developed site
� Allow for pedestrian access between site and basic community services
� Preserve habitat and natural resources
SSc5.1‐Site Development‐Protect or Restore Habitat
� Use native or adapted vegetation (could be applied on green roofs)
SSc5.2‐Site Development‐Maximize Open Space
� Reduce development footprint
� Provide vegetated open space (including vegetated roofs)

109
SSc7‐Heat Island Effect
� Shade site hardscape
� Use paving materials with a high Solar Reflective Index (SRI)
� Use an open grid pavement system
SSc8‐Light Pollution Reduction
� Reduce power of interior lights which can be seen from outside
� Light exterior areas only as required for safety and comfort
EAp3‐Fundamental Refrigerant Management
� Zero use of CFC based refrigerant0073
EAc4‐Enhanced Refrigerant Management
� Select refrigerants that minimize ozone depleting compounds
IEQc6‐Controllability of Systems
� Provide lighting system control by individual occupants or by specific groups
IEQc7‐Thermal Comfort
� Provide a thermal environment that supports productivity and well‐being of building
applicants
IEQc8‐Daylighting and Views
� Achieve a low glazing factor
� Use daylight illumination
3. Energy Management
EAp2‐Minimum energy performance
� Establish the minimum level of energy efficiency
EAc1‐Optimize energy performance
EAc2‐On‐site renewable energy
110
� Use on‐site renewable energy systems to offset building energy cost
EAc5‐Measurement and Verification
� Provide ongoing accountability of building energy consumption
EAc6‐Green Power
� Purchase electricity from renewable sources
4. Water Management
SSc6.1‐Stormwater Design‐Quantity Control
� Maintain predevelopment peak discharge rates and quantity
� Protect receiving stream channels from excess erosion
SSC6.2‐Stormwater Design‐Quality Control
� Reduce impervious cover
� Promote infiltration
� Capture and treat stormwater
WEp1‐Water Use Reduction
� Use water efficient toilets and sinks
WEc1‐Water Efficient Landscaping
� Use native plants
� Improve irrigation efficiency
� Use captured rainwater
� Use recycled wastewater
� Install landscaping that does not require permanent irrigation systems
WEc2‐Innovative Wastewater Technologies
� Use water conserving fixtures
� Use non‐potable water

111
WEc3‐Water Use Reduction
� Use water efficient toilets and sinks
5. Materials Management
MRp1‐Storage and Collection of Recyclables
� Identify the top five waste streams
MRc1.1‐Building Reuse‐Exterior
� Maintain the existing building structure and envelope
MRc1.2‐Building Reuse‐Interior
� Use existing interior non‐structural elements
MRc2‐Construction Waste Management
� Recycle/salvage non‐hazardous construction materials
MRc3‐Materials Reuse
� Use salvaged, refurbished, or reused materials
MRc4‐Recycled Content
� Use materials with recycled content
MRc5‐Regional Materials
� Use building materials that have been extracted or harvested within 500 miles
MRc6‐Rapidly Renewable Materials
� Use materials harvested from plants with a 10‐year or shorter cycle
MRc7‐Certified Wood
� Use wood certified with the Forest Stewardship Council
IEQc4‐Low‐Emitting Materials
� Use adhesives, sealants, and primers with low VOCs
6. Air Quality

112
IEQp1‐Minimum Indoor Air Quality
� Meet minimum indoor ventilation requirements
IEQp2‐ETS control
� Prohibit smoking except for designated smoking areas
IEQc1‐Outdoor Air Delivery Monitoring
� Place CO2 sensors in densely occupied areas
IEQc2‐Increased Ventilation
� Increase breathing zone outdoor air ventilation rates
IEQc5‐Indoor Chemical and Pollutant Source Control
� Employ entryway systems to capture dirt and particulates
� Sufficiently exhaust space where chemicals are used
� Install new air filtration media in occupied areas
� Provide containment for hazardous waste
7. Construction Phase
SSp1‐Construction Activity Pollution Prevention
� Prevent loss of soil during construction by stormwater runoff and wind erosion
� Prevent sedimentation of storm sewer or receiving streams
� Prevent polluting the air with dust and particulate matter
SSc1‐Site Selection
� Choose location in order to reduce environmental impact
SSc3‐Brownfield Redevelopment
� Develop a site documented as contaminated or a brownfield
EAp1‐Fundamental Commissioning of the Building Energy Systems
� Designate a commissioning authority

113
� Develop commissioning requirements into the construction documents
� Develop a commissioning plan for HVAC, lighting, hot water, and renewable energy
EAc3‐Enhanced Commissioning
� Develop a systems manual
� Verify requirements for training operating personnel and building occupants is
completed
� Reviews within ten months of substantial completion
IEQc3‐Construction IAQ Management Plan
� Protect stored or installed absorptive materials from moisture damage
� Protect HVAC system, control pollutant sources, and interrupt contamination pathways
Sustainable Sites Initiative
1. Traffic and Parking
2. Integration in the Community
SSp1.2: Protect floodplain functions
� Design so as not to disturb floodplain
� Re‐establish areas of vegetated floodplain on greyfield or brownfield sites
� Manage invasive plants species
SSp1.3: Preserve wetlands
� Give preference to sites that do not include wetlands
� Design to minimize disruption to existing wetlands
SSp1.4: Preserve threatened or endangered species and their habitats

114
� Develop sites that do not include habitat for threatened or endangered plants and
animal species
� Design to minimize disruption of habitats
� Allow species connectivity through the site
SSc1.6: Select sites within existing communities
� Design within existing areas that have pedestrian access
� Include pedestrian access as part of the project
SSc1.7: Select sites that encourage non‐motorized transportation and use of public transit
� Select site near mass transit, sidewalks, and bicycle networks
SVp4.1: Control and manage known invasive plants found on site
� Contract local agencies or consultants for most effective management techniques of
invasive species
SVp4.2: Use appropriate, non‐invasive plants
� Select native plants that play a role in the local ecosystem
� Use ANSI A300 BMP for guide when planting trees
� Plant a diverse amount of plants
SVp4.3: Create a soil management plan
� Use compost blankets, berms, or socks for erosion and sediment control
� Reuse compost for amendment in soil restoration
SVc4.5: Preserve all vegetation designated as special status
� Minimize harm to special status trees and plants
SVc4.6: Preserve or restore appropriate plant biomass on site
� Design to minimize disruption of existing vegetation
� Use trees, green roofs, or vegetated structures to cover non‐vegetated areas

115
SVc4.7: Use native plants
SVc4.8: Preserve plant communities native to the ecoregion
SVc4.9: Restore plant communities native to the ecoregion
SVc4.12: Reduce urban heat island effects
� Use shade from plants
� Install light‐colored surfaces where possible
SVc4.13: Reduce the risk of catastrophic wildfire
� Use fire resistant plants appropriately spaced
� Adopt fuel management practices
HHc6.1: Promote equitable site development
� Develop the site to benefit a wide range of residents, beyond primary users
HHc6.2: Promote equitable site use
� Use the site to benefit a wide range of residents, beyond primary users
HHc6.3: Promote sustainability awareness and education
� Design educational and interpretive elements
HHc6.4: Protect and maintain unique cultural and historical places
HHc6.5: Provide for optimum site accessibility, safety, and wayfinding
� Identify techniques to address safety and accessibility concerns
� Improve legibility and understanding of site’s layout and uses
HHc6.6: Provide opportunities for outdoor physical activity
� Creatively design meandering pathways
HHc6.7: Provide views of vegetation and quiet outdoor spaces for mental restoration
� Design a variety of small spaces instead of one large space
� Design outdoor spaces away from distractions

116
� Minimize noise levels
� Create a sense of enclosure with low walls, fences, vegetation, or topography
HHc6.8: Provide outdoor spaces for social interaction
� Look for areas that could accommodate moderate and large groups
HHc6.9: Reduce light pollution
� Avoid off‐site lighting and night sky pollution
3. Energy Management
SVc4.10: Use vegetation to minimize building heating requirements
SVc4.11: Use vegetation to minimize building cooling requirements
� Use plants to increase shading
OMc8.4: Reduce outdoor energy consumption for all landscape and exterior operations
� Use energy efficient outdoor appliances
� Look for solar powered alternatives
OMc8.5: Use renewable sources for landscape electricity needs
� Use renewable energy
4. Water Management
� Wp3.1: Reduce potable water use for landscape irrigation by 50 percent from established
baseline
� Use low‐water‐demand vegetation
� Use high‐efficiency equipment and/or climate based controllers for irrigation systems
� Reuse graywater and captured rainwater
� Wc3.2: Reduce potable water use for landscape irrigation by 75 percent or more from
established baseline
� Use low‐water‐demand vegetation
117
� Use high‐efficiency equipment and/or climate based controllers for irrigation systems
� Reuse graywater and captured rainwater
� Wc3.3: Protect and restore riparian, wetland, and shoreline buffers
� Design to avoid disturbance of riparian, wetland, and shoreline buffers
� Re‐establish areas of vegetated floodplain
� Manage invasive plant species
� Wc3.4: Rehabilitate lost streams, wetlands, and shorelines
� Remove physical modifications to stream, wetlands, and shorelines
� Replace road crossings/dams which disrupt sediment transport
� Wc3.5: Manage stormwater on site
� Consider all components of the hydrologic cycle in design
� Minimize impervious cover
� Where infiltration is not desirable use other techniques to reduce runoff
� Wc3.6: Protect and enhance on‐site water resources and receiving water quality
� Reduce impervious cover
� Disconnect impervious cover
� Provide depression storage in the landscape
� Convey stormwater in swales to promote infiltration
� Use biofiltration to provide vegetated and soil filtering
� Exapotranspire
� Infiltrate stormwater
� Minimize materials that can be a source of pollutants

118
� Plan and implement maintenance activities that reduce the exposure of pollutants to
stormwater
� Wc3.7:Design rainwater/stormwater features to provide a landscape amenity
� Wc3.8: Maintain water features to conserve water and other resources
� Design water features that match or mimic water in the natural environment
� Avoid water features that are incompatible with the local ecological context
� Estimate volumes of rainwater available for use in water features
� Collect and reuse non‐potable water
� Design and maintain water features as natural ecosystems
� Water quality can be enhanced with biologically‐based water treatment
� OMp8.1: Plan for sustainable site maintenance
5. Materials Management
MSp5.1: Eliminate the use of wood from threatened tree species
� Identify suppliers who provide wood products from sustainably managed forests
� Use recycled plastic or composite lumber instead of wood
MSc5.2: Maintain on‐site structures, hardscape, and landscape amenities
� Identify opportunities to incorporate existing site materials into site design
MSc5.3: Design for deconstruction and disassembly
MSc5.4: Reuse salvaged materials and plants
MSc5.5: Use recycled content materials
� Specify plastic lumber made from recycled content
� Remove on‐site concrete pavement and crushing it for aggregate
� Utilize spent iron and foundry sand as fine aggregate in concrete
MSc5.6: Use certified wood
119
MSc5.7: Use regional materials
MSc5.8: Use adhesives, sealants, paints, and coatings with reduced VOC emissions
MSc5.9: Support sustainable practices in plant production
� Use plants from nurseries that reduce damage to the environment and conserve
resources
MSc5.10: Support sustainable practices in materials manufacturing
OMp8.2: Provide for storage and collection of recyclables
� Coordinate the size and function of the recycling areas with anticipated collection rates
OMc8.3: Recycle organic matter generated during site operations and maintenance
� Collect excess vegetation and divert to a compost facility
6. Air Quality
OMc8.6: Minimize exposure to environmental tobacco smoke
� Take into account prevailing winds when establishing smoking areas
� Use filters near air intakes and outdoor smoke rooms
OMc8.7: Minimize generation of greenhouse gases and exposure to localized air pollutants
during landscape maintenance activities
� Design to minimize gasoline‐powered maintenance equipment
� Select plants that require minimum maintenance
� Select equipment with low emissions
OMc8.8: Reduce emissions and promote the use of fuel‐efficient vehicles
� Provide alternative fuel refueling stations
� Consider sharing costs and benefits of refueling station with neighbors
7. Construction Phase

120
SSp1.1: Limit development of soils designated as prime farmland, unique farmland, and
farmland of statewide importance
SSc1.5: Select brownfields or greyfields for redevelopment
PDp2.1: Conduct a pre‐design site assessment and explore opportunities for site sustainability
� Evaluate the impact the design may have on sustainability during construction,
operations, and maintenance
PDp2.2: Use an integrated site development process
� Ensure multiple meeting with the project team for optimal interaction and
communication
SVp4.4: Minimize soil disturbance in design and construction
� Limit grading for planting mounds or other topological forms
� Establish clear construction boundaries
Cp7.1: Control and retain construction pollutants
� Temporary and permanent seeding
� Mulching
� Earth dikes
� Sediment traps
� Sediment basins
� Filter socks
� Compost berms and blankets
� Secondary containment
� Spill control equipment
� Hazardous waste manifests
� Overfill alarms

121
� Implement post‐construction stormwater management
� Account for weather conditions
Cp7.2: Restore soils disturbed during construction
� Stockpile and reuse existing site topsoils
� Amend soils in place
� Import a topsoil
Cc7.3: Restore soils disturbed by previous development
� Stockpile and reuse existing site topsoils
� Amend soils in place
� Import a topsoil
Cp7.4: Divert construction and demolition materials from disposal
� Reuse existing materials on site or recycle for on‐site use when possible
� Develop a construction waste management plan
Cp7.5: Reuse or recycle vegetation, rocks, and soil generated during construction
� Balance cut and fill
Cp7.6: Minimize generation of greenhouse gas emissions and exposure to localized air
pollutants during construction
� Select contractors with reduced diesel emissions
Port Authority of NY/NJ Sustainable Infrastructure Guidelines
1. Traffic and Parking
IS‐17: Optimize Traffic Safety
� Perform road safety audits
� Review traffic crash reports

122
IS‐19: Expand of Enhance Intermodal Connectivity
� Provide shelter at waiting areas and bus stops
� Provide infrastructure for transit information
IS‐20: Use Transportation System Management
� One‐way streets
� Reversible lanes
� HOV lanes
� Curb lane use control
� Parking management strategies
IS‐21: Use Transportation Technologies
� Integrate transportation technologies
� Deploy transportation technologies
2. Integration in the Community
IS‐5: Protect Ecological Health
� Installation of pollutant trap
� Re‐vegetation with native plant species
� Removal of aquatic weeds
� Manage stormwater on‐site
IS‐6: Protect and Maintain Absorbent Landscapes
� Construct a rain garden
IS‐8: Utilize Appropriate Vegetation
� Provide maintenance for landscaping
� Test soil prior to landscaping
� Use bio‐stimulants to enhance soil quality

123
� Add compost
� Restrict use of pesticides and fertilizers
IS‐14: Mitigate Heat Island Effect
� Use light‐colored landscape
� Use porous materials
� Use hardscape materials with a high SRI
� Use vegetated areas
IS‐15:Minimize Light Pollution
� Set street lights to prevent night‐sky pollution
� Enhance night‐time visibility
� Minimize light trespass and disturbance
� Coordinate lighting with security cameras
IS‐16: Optimize Public Environments
� Provide enhanced pedestrian crossing treatment
� Provide new sidewalks
3. Energy Management
IE‐1: Optimize Energy Performance
� Reduce energy consumption of infrastructure systems
� Reduce peak load
IE‐2: Commission Electrical and Mechanical Systems
� Develop an O & M manual
IE‐3: Utilize End Use Metering
� Install energy consumption sub‐meters
� Install a monitoring systems that tracks energy use

124
IE‐4: Use On‐Site Renewable Energy
� Use solar, wind, geothermal, hydro, biomass, or biogas
IE‐5: Protect Ozone Layer
� Use non‐CFC and non‐HCFC based refrigerants
� Use fire extinguishers that do not contain ozone‐depleting substances
IE‐6: Provide Alternative Fueling Stations
� Provide electric refueling stations for plug‐in hybrid vehicles
� Provide biodiesel pumping stations
� Provide compressed natural gas
� Provide ethanol fueling stations
4. Water Management
IS‐7: Utilize Pervious Pavement
� Use pervious concrete, asphalt, pavers
� Use vegetated bioswales or ditches
� Utilize salt‐splashes at roadway edge
� Use structural soil to enhance percolation
IS‐9: Use Turfgrass Appropriately
� Utilize resilient, resistant, low‐maintenance vegetation
� Substitute ground covers or meadow grass for turfgrass
IW‐1: Implement Stormwater BMPs
� Implement stormwater management plan
� Lower peak runoff rates
� Treat stormwater for TSS
� Mark storm drains
125
� Bioretention systems
� Constructed stormwater wetlands
� Dry wells
� Extended detention basins
� Infiltration structures
� Manufactured treatment devices
� Pervious paving
� Sand filters
� Rain garden
IW‐2: Implement Rainwater Neutrality
� Infiltrate stormwater
� Mark storm drains
IW‐3: Reduce Use of Potable Water for Irrigation
� Use harvested stormwater for irrigation
� Employ high efficiency irrigations systems
� Specify native or acclimatized site plantings
IW‐4: Utilize End Use Metering
� Install water meters
� Determine appropriate location for meters
� Install leak detection system
IO‐1: Implement Sustainable Landscape Maintenance
� Remove invasive species
� Recycle organic waste

126
� Use organic compost as fertilizer
� Reduce soil erosion/compaction from maintenance activities
� Use harvested stormwater for irrigation
� Computerized irrigation system
� Educate employees on sustainable maintenance
� Use low‐toxicity pest management
� Protect against sand and de‐icing chemicals in winter
IO‐2: Maintain Soil Quality
� Prevent soil pollution
� Protect soil and minimize erosion
� Recycle organic waste
� Manage snow/ice deicing or removal
� Prepare a watering schedule
5. Materials Management
IS‐10: Amend and Reuse Existing Soils
� Test soil prior to seeding
� Require compost testing
� Maximize on‐site reuse
IS‐11: Balance Earthwork
� Minimize bringing in new fill
IM‐1: Use Recycled Materials
� Use recycled materials
IM‐2: Use Local/Regional Materials
� Use materials within a 500‐mile radius

127
IM‐3: Reuse Materials
� Incorporate used, salvaged, or refurbished materials
IM‐4: Use Durable Materials
� Provide a life cycle cost analysis
IM‐5: Use Sustainably Harvested Wood
� Use wood approved by FSC
� Require COC number
IM‐6: Minimize Use of Toxic and/or Hazardous Materials
� Minimize exposure to toxic and hazardous materials
IM‐7: Enhance Pavement Lifecycle
� Employ preventive maintenance to extend pavement life
� Minimize manholes and access points
IM‐8: Utilize Thin Surface Paving
� Use thin surface overlay to extend pavement life
IM‐9: Utilize Warm‐Mix Asphalt Technology
� Use WMA with 20% RAP
6. Air Quality
7. Construction Phase
IS‐1: Utilize an Integrated Team Approach
� Identify stakeholders
� Create a sustainable infrastructure credit checklist
� Review sustainability goals
IS‐2: Prepare a Site Assessment
� Document existing natural features and conditions

128
IS‐3: Maximize Use of Previously Developed Sites
� Construct on previously developed sites
IS‐4: Maximize Use of Known Contaminated Sites
� Build on a brownfield site
IS‐12: Coordinate Utility Work
� Minimize pavement deterioration and disruption
IS‐13: Utilize Trenchless Technology
� Use least disruptive technologies for maintenance or replacement
IS‐18: Optimize Roadway Alignment Section
� Maintain a buffer between roadway and ecological sensitive areas
� Avoid disrupting existing utilities
� Protect natural site features
� Limit the alignment footprint
IC‐1: Minimize Pollution From Construction Activity
� Prevent discharge of pollutants from the site
� Identify ESC measures
� Collect and utilize stormwater for construction activities
� Proper disposal of construction site waste
� Control offsite vehicle tracking
IC‐2: Protect Existing Natural Systems
� Limit site disturbance
� Minimize exposure of bare ground
� Store equipment on compacted land
� Install permanent tree protection

129
� Stabilize areas to prevent erosion
IC‐3: Utilize Transportation Management During Construction
� Develop traffic control plan
� Minimize use of explosives
� Minimize staging areas
� Monitor mobility and safety of work zone
IC‐4: Utilize Green Construction Equipment
� Use low‐sulfur diesel fuel
� Use emission control devices using BAT
� Idling time for equipment limited to 3 minutes
� Use electric powered equipment where available
IC‐5: Reduce Noise and Vibration Abatement During Construction
� Cover debris containers with sound absorbing materials
� Pneumatic equipment should have intake and exhaust mufflers
� Inform public about upcoming work
� Use noise barriers
IC‐6: Implement Construction Waste Management
� Divert from landfills
� Implement on‐site sorting of demolition and construction debris
IC‐7: Implement Integrated Pest Management
� Reduce water and food sources for pests
� Use less toxic poisons
WSU Ferry Guidelines

130
1. Traffic and Parking
� Promote HOV by preferred rates or faster access
� Encourage walk‐on passengers by improving multi‐modal connectivity
� Encourage bicycle use
� Facilitate drop‐off
� Implement a park‐and‐ride program
� Implement a shared‐car or renting car program
� Optimize traffic flow with path finders and signals implemented around the site
� Implement a reservation system
� Increase peak periods prices
� Allow future growth of the port
2. Integration in the Community
� Architecturally blend the infrastructure into its area
� Create a visitor center about the activity and infrastructures of the port
� Include guided tours on trips
� Prevent damage from potential flood events and water table changes
� Allow future change in type of activity of the port
� No use of ozone depleting substances
Light Pollution Prevention
� Limit interior lighting exiting buildings and boats
� Limit exterior lighting to areas where needed for safety or comfort
� Limit all lightings to brightness needed
� Use lights under docks for fish

131
Noise Pollution Prevention
� Use bubble curtains during pile installation
� Use noise barriers around site
� Adjust the fog horn noise level to the conditions
� Limit noise level, especially during construction works
Wildlife Considerations
� Create fish paths around the facilities
� Include nesting platforms
� Include native trees
3. Energy Management
� Produce renewable energy with marine potential, solar panels, wind
� On boats, heat up water through the waste feat from engines' exhaust
� Use local material for construction and renovation, and local products for usual activity
� Use materials with minimal embodied energy
� Incorporate passive design, such as daylight harvesting
� Incorporate high‐efficient systems
� Use individual control of temperature, ventilation, and light in offices
� Use automatic control of temperature, ventilation, and light in public areas
� Automatically turn off unnecessary lights when there is no activity or when bright
enough
� Use surfaces with high reflectance
4. Water Management
� Implement an emergency plan in case of spills

132
� Oil separation equipment
� Use non toxic paint on boats and facilities
� Use high‐efficiency fixtures
� Prevent leaks
� Reduce unnecessary potable water use
� Reduce city water use by treating port water to use it
� Treat wastewater on‐site
� Implement LIDs
� Collect runoff and rainwater
� Treat released water on boats
� Good housekeeping of ballast tanks
� Limit exchanges to off‐shore locations
5. Materials Management
� Reduce waste due to activity
� Provide recycling dumpsters during construction and maintenance works
� Require boats to sort their solid waste for recycling
� Provide recycle bins inside and outside facilities
� Promote the use of high‐recycle/recyclable content materials
� Implement a hazardous waste handling and storage plan
� Promote the use of sustainable materials such as certified food
� Use low‐emitting materials and paints
6. Air Quality
� Increased outside air intake

133
� Increased natural ventilation
� Minimize the use of chemical when cleaning
� Reduce flying dirt during construction
� Limit the time during which passengers have their engines running
� Avoid fossil fuel engines
7. Construction Phase
� Rehabilitate a grayfield of brownfield site
� Clean polluted water area
� Improve reuse and reduce construction waste
Dredging
� Monitor dredging
� Perform dredging when no activity
� Help habitat after dredging
� Treat and use dredged material
MVeP:
1. Traffic and Parking
2. Integration in the Community
GM3.1‐Lighting and Underwater Noise Aquatic Life Impact
� Document what species will be in close proximity to the vessel's route
� Assess emitted light and noise
� Evaluate whether species will be harmed
GM3.2‐Wake Wash and Shore Protection

134
� Identify measures to reduce shore erosion
� Assess wake wash impacts
� Identify shore locations that should be avoided if possible
3. Energy Management
EE1.1‐Lighting
� Use CFL or LED lighting, motion sensing switches, isolation switches
� Identify opportunities to use natural lighting
EE1.2‐HVAC
� Use insulation factors, zone control, and demand based conditioning
� Use natural ventilation where applicable
EE1.3‐Pump and Piping Systems
� Use insulation factors, demand based controls, materials selection
� Use air‐cooled units, no flush toilets, gravity drains, and demand based control systems
EE1.4‐Mechanical Equipment Operations & Maintenance
� Equipment overhaul upon designated loss of efficiency
� Use conditional measures for operational adjustments
� Consistently maintain equipment
EE1.5‐Hull/Propeller Operations & Maintenance
� Maintain regular cleanings
� Reduce the amount or impact of hull and propeller fouling
EE1.6‐Route Optimization
� Plan voyages to promote safety of ship, crew, and environmentally sensitive areas
� Optimize routes to use weather patterns, currents, and wind to advantage
� Maximize cargo area utilization and reduce idle time in port

135
� Quantify potential reductions in fuel consumption
EE1.7‐Vessel Speed Optimization
� Determine optimal speed for fuel efficiency
� Relate speed to number of trips required
EE1.8‐Waste Heat and Energy Recovery
� Use engine cooling water for making water
� Use nitrogen generator instead of a combustion unit
� Use closed loop piping systems
EE1.9‐Hull Optimization
� CFD optimization for the hull form
� Find optimal size and block coefficient to move cargo most efficiently
EE2.1‐Other Fuels
� Categorize air emissions of alternate fuels relative to diesel
� Use hydrogen fuel cells or nuclear
EE2.2‐Renewable Energies
� Use wind‐assisted propulsion
� Generate power from a renewable source such as wind, solar, and ocean
EE3‐Carbon Footprint Reduction
4. Water Management
WE1‐Oily Water
� Use separating equipment and discharge monitoring equipment
WE2‐Non‐Indigenous Species Control
WE2.1‐Ballast Water & Sediment
� Use ballast water treatment system

136
� Reduce/eliminate the ballast water and sediment NIS vector
WE2.2‐Hull Fouling
� Periodically clean vessel exterior
� Use hull coating
WE3‐Sanitary Systems
� Improve quality of treated water being discharged
� Reduce the amount of contaminated water being discharged
WE4‐Solid Waste
� Buy in bulk to reduce packaging waste
� Trade off disposable items for re‐usable and washable items
� Recycle
� Low emissions handling system
WE5‐Incidental Discharges
WE6‐Structural Protection of Oil
� Structural protection will reduce accidental discharge of oil
GM2‐Hotel Water Use: Reduction/Reuse/Recycle
� Reduce water use per person
� Use low flow showers and sinks, low water use toilets
5. Materials Management
GM1‐Materials: Reduction/Reuse/Recycle Construction and Operations
� Use recycled materials (steel/aluminum, joiner panels, insulation)
� Reuse items recovered from scrapped ships
GM4‐Hazardous Materials Control‐Inventory Program
� Inventory material for proper storing, handling, and recycling

137
� Recommend preferred storage options
GM5‐Ship Recycling
� Be sure recycling is safe and environmentally friendly
� Identify materials and equipment that are likely to be re‐used
6. Air Quality
AE1‐Nitrogen Oxides (NOx) Reductions
� Designate minimum emissions standard
� Reduce pollutant emissions without significant impact on other emissions
AE2‐Sulfur Oxides (Sox) Reductions
� Designate minimum emissions standard
� Reduce pollutant emissions without significant impact on other emissions
AE3‐Particulate Matter (PM) Reductions
� Designate minimum emissions standard
� Reduce pollutant emissions without significant impact on other emissions
� Use higher efficiency engines and filters
� Use lower sulfur fuels
AE4‐Volatile Organic Compounds
� Use higher efficiency combustion engines
� Use vapor recovery systems on tank ships
� Designate minimum emissions standard
� Reduce pollutant emissions without significant impact on other emissions
AE5‐Other Greenhouse Gases (GHGs)
� Identify any regulations that may pertain to these gases
AE6‐Ozone‐Depleting Substances

138
� Refrigerants, cleaners, and fire‐suppressants should be free of ozone‐depleting
substances
AE7‐Port Air Emissions Reduction
� Reduce loads wherever possible
� Shoreside electrification
� Selective use of low sulfur fuels
� Capture and transfer of stack emissions with shoreside equipment
7. Construction Phase