Integrating Concepts in Biology PowerPoint Slides for Chapter 25: Homeostasis of Ecological Systems...
34
Integrating Concepts in Biology PowerPoint Slides for Chapter 25: Homeostasis of Ecological Systems Section 25.1: Is nutrient cycling a mechanism of homeostasis for ecological systems? 25.2 How does energy flow through food webs? 25.3 Do ecological systems filter wastes like individual organisms do? 25.4 How does increasing atmospheric carbon dioxide disrupt ecological systems? by A. Malcolm Campbell, Laurie J. Heyer, and Chris Paradise
-
Upload
homer-palmer -
Category
Documents
-
view
216 -
download
1
Transcript of Integrating Concepts in Biology PowerPoint Slides for Chapter 25: Homeostasis of Ecological Systems...
Integrating Concepts in BiologyPowerPoint Slides for Chapter 25:
Homeostasis of Ecological Systems
Section 25.1: Is nutrient cycling a mechanism of homeostasis for ecological systems?
25.2 How does energy flow through food webs?25.3 Do ecological systems filter wastes like
individual organisms do? 25.4 How does increasing atmospheric carbon dioxide
disrupt ecological systems? by
A. Malcolm Campbell, Laurie J. Heyer, and Chris Paradise
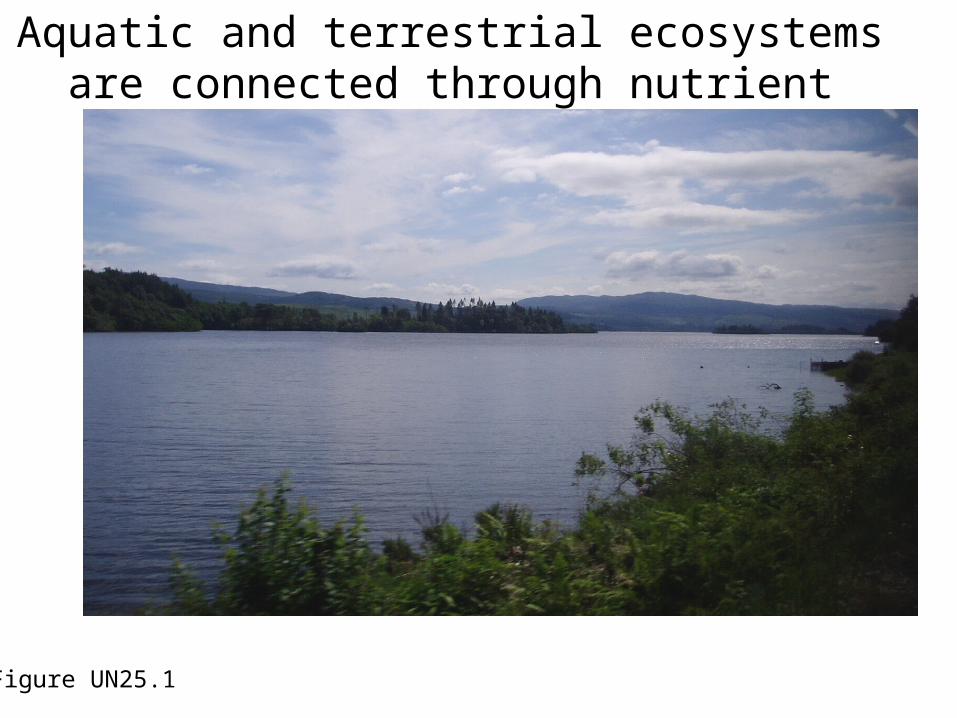
Aquatic and terrestrial ecosystems are connected through nutrient cycles and energy flows
Figure UN25.1

Biomass of minnows in two experiments on Tuesday Lake
Table 25.1
year 1 wet mass year 2 wet mass
no fish 0 0
low fish 32.5 (2) 46.7 (3)
medium fish 66.2 (4) --
high fish 113.9 (7) 97.7 (6)

Total phosphorus in the water column for Tuesday Lake, total particulate P in year 1, particulate P in seston and particulate P as zooplankton
Figure 25.1

Movement of phosphorus relative to the water column for enclosure experiment
Figure 25.2

Simplified schematic of the phosphorus cycle
Figure 25.3

Discharge, runoff, and concentrations and watershed losses for total nitrogen and phosphorus from a tropical forested watershed
Figure 25.4
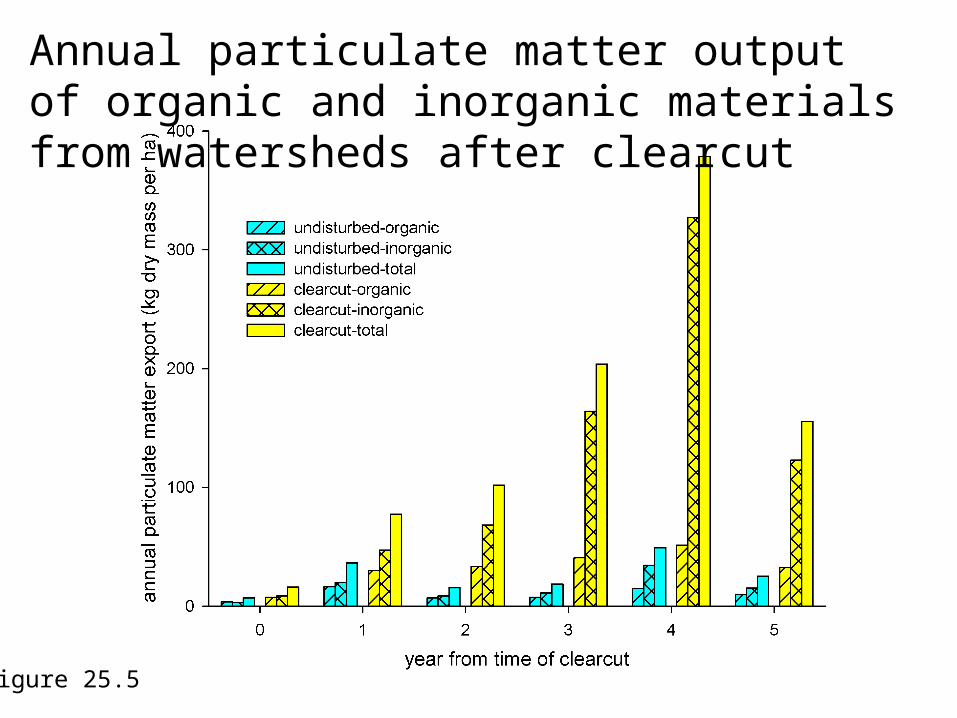
Annual particulate matter output of organic and inorganic materials from watersheds after clearcut
Figure 25.5

Mean annual export of various elements in organic and inorganic particulate matter, and net dissolved concentration in undisturbed and clearcut watersheds
Figure 25.6

Extent of the Mississippi River basin and Gulf of Mexico dead zone
Figure ELSI 25.1
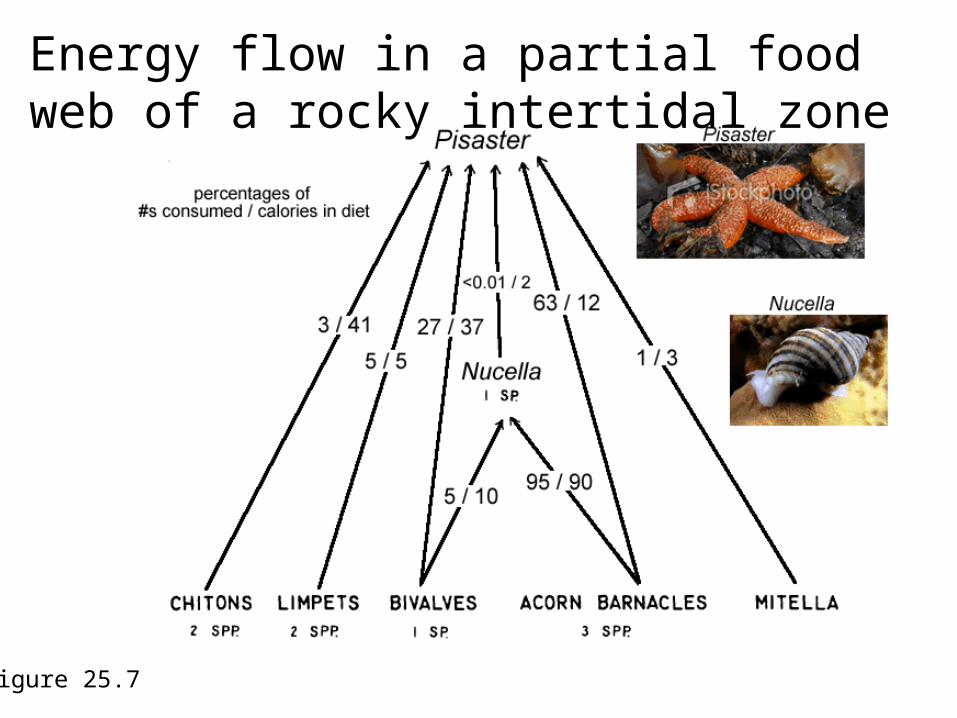
Energy flow in a partial food web of a rocky intertidal zone
Figure 25.7

Energy flow in a food web of a rocky intertidal zone off the northern Gulf of California coast
Figure 25.8
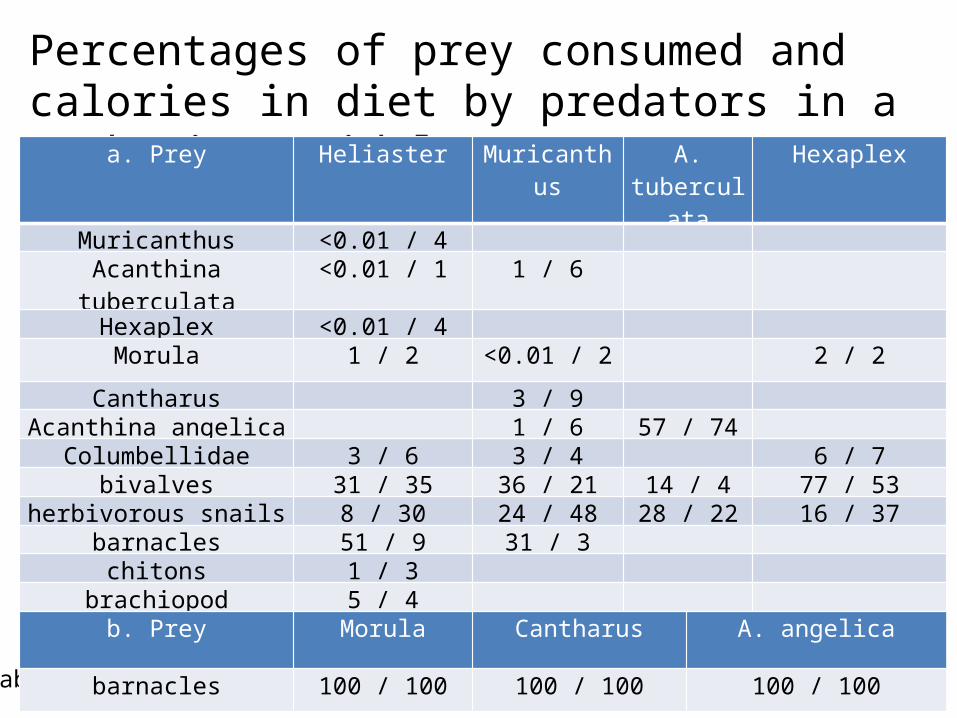
Percentages of prey consumed and calories in diet by predators in a rocky intertidal zone
Table 25.2
a. Prey Heliaster Muricanthus A. tuberculata
Hexaplex
Muricanthus <0.01 / 4 Acanthina tuberculata <0.01 / 1 1 / 6
Hexaplex <0.01 / 4 Morula 1 / 2 <0.01 / 2 2 / 2
Cantharus 3 / 9 Acanthina angelica 1 / 6 57 / 74
Columbellidae 3 / 6 3 / 4 6 / 7bivalves 31 / 35 36 / 21 14 / 4 77 / 53
herbivorous snails 8 / 30 24 / 48 28 / 22 16 / 37barnacles 51 / 9 31 / 3 chitons 1 / 3
brachiopod 5 / 4 b. Prey Morula Cantharus A. angelica
barnacles 100 / 100 100 / 100 100 / 100

Species present in presence or absence of Pisaster
Table 25.3
species present in plots (# possible)
Pisaster present
Pisaster excluded
notes on exclusion plot
bivalve (1) 1 1 dominant species
acorn barnacles (3) 3 3 barnacles being crowded out
limpets (2) 2 0
Mitella (1) 1 1 exist in scattered clumps
chitons (2) 2 0 algae (4) 4 1
anemone (1) 1 1 much reduced in density
sponge (1) 1 1 much reduced in density

Frequency distribution of predator-prey interaction strengths from a marine food web
Figure 25.9
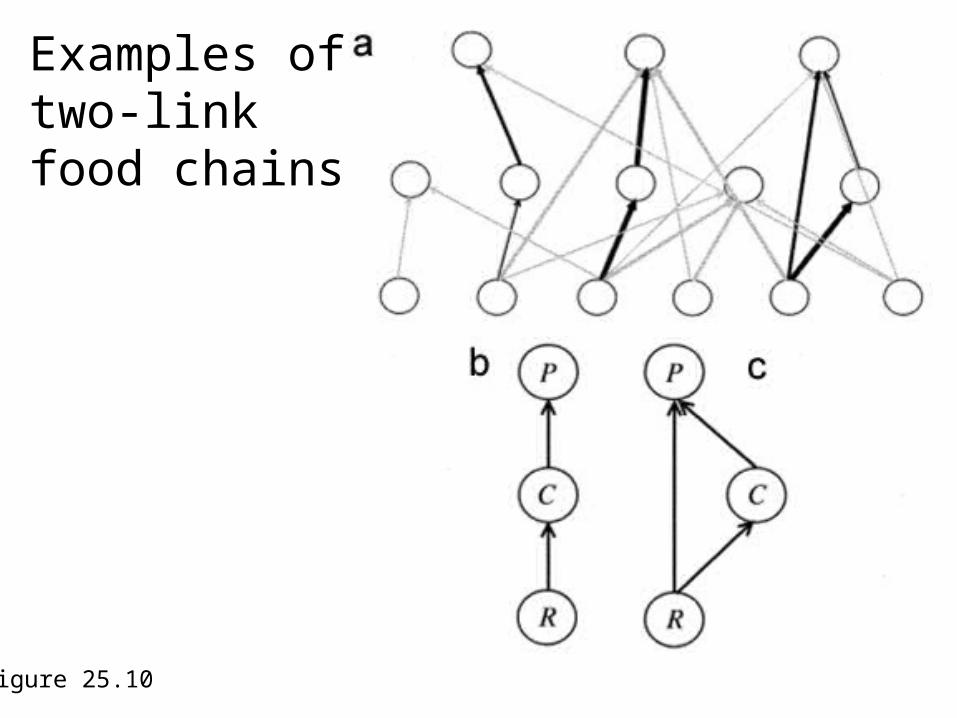
Examples of two-link food chains
Figure 25.10
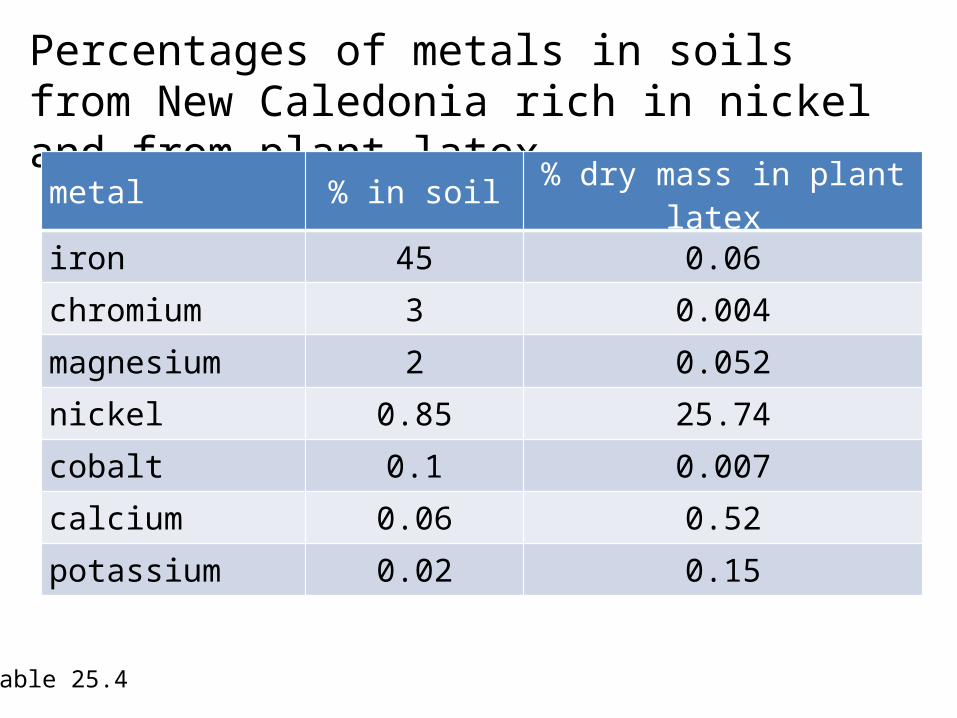
Percentages of metals in soils from New Caledonia rich in nickel and from plant latex
Table 25.4
metal % in soil % dry mass in plant latex
iron 45 0.06
chromium 3 0.004
magnesium 2 0.052
nickel 0.85 25.74
cobalt 0.1 0.007
calcium 0.06 0.52
potassium 0.02 0.15

Nickel concentrations in Sebertia acuminata compared with values for other plant species
Table 25.5
species tissue conc. of nickel localitySebertia acuminata latex
leavesbarkfruits
25.741.172.450.30
New Caledonia
Hybanthus floribundus leaves bark fruits flowers
0.710.170.130.48
Western Australia
Alyssum bertolonii leaves 0.80 Italy3 Homalium species leaves 0.69 - 1.45 New Caledonia2 other Hybanthus species leaves 0.60 - 1.38 New CaledoniaPsychotria douarrei leaves
barkfruitsflowers
3.405.242.302.40
New Caledonia
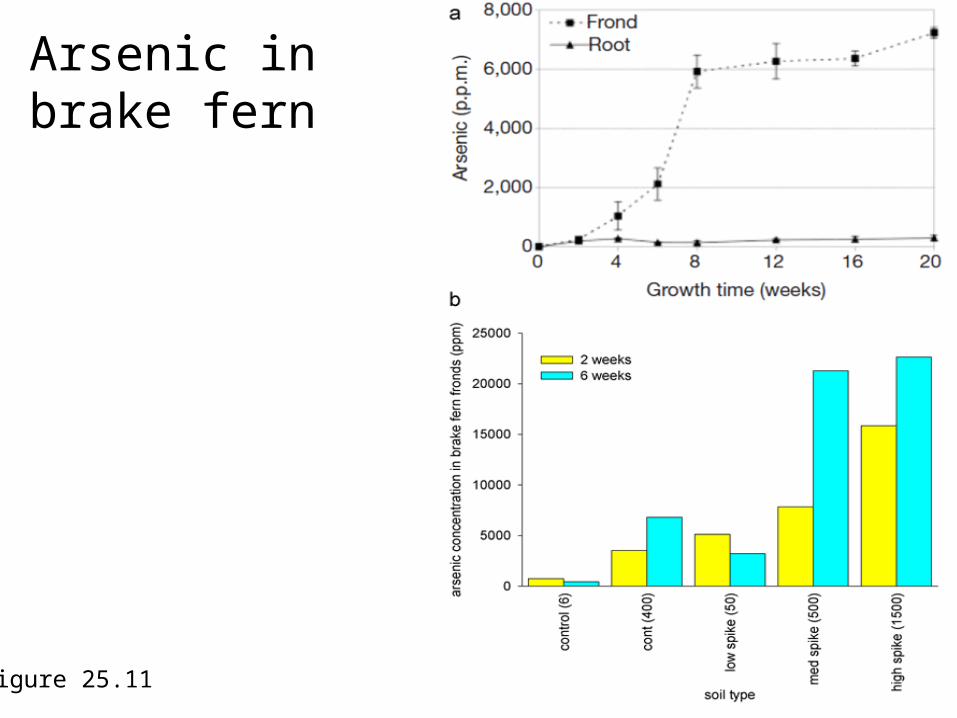
Arsenic in brake fern
Figure 25.11
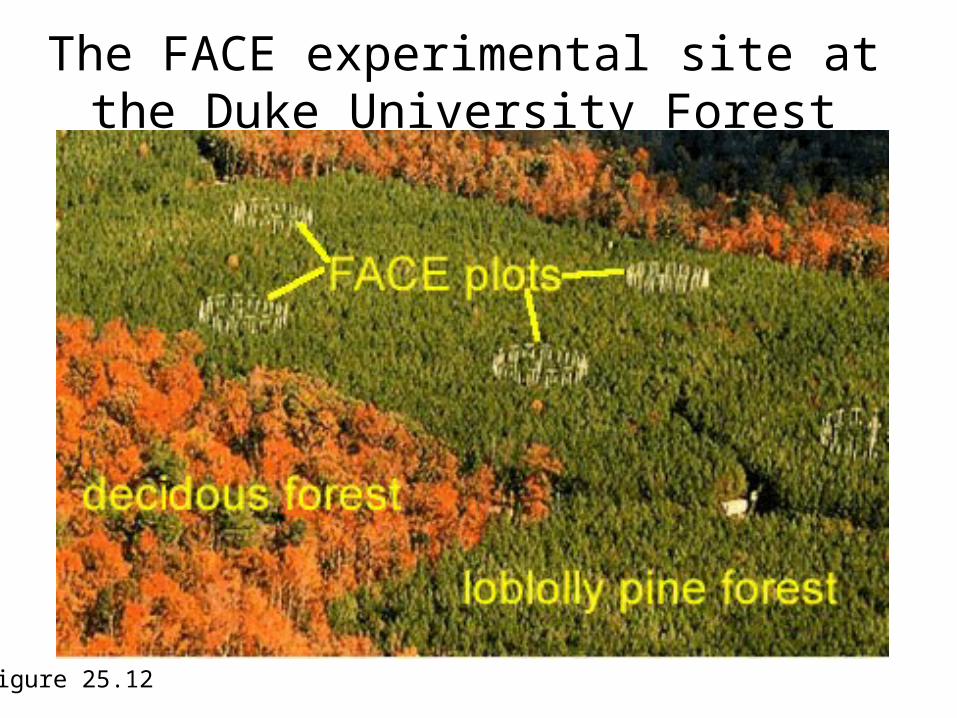
The FACE experimental site at the Duke University Forest
Figure 25.12

Characteristics of the four FACE experiments
Table 25.6
Characteristic NC FACE WI FACE TN FACE IT FACE
mean annual precipitation (mm) 1140 810 1390 818
mean annual temperature (oC) 15.5 4.9 14.2 14.1
growing season (days) 200 150 190 247
dominant vegetation
loblolly pine
aspen, maple, birch Sweetgum poplar

Responses of NPP and APAR to elevated [CO2] in FACE experiments
Figure 25.13
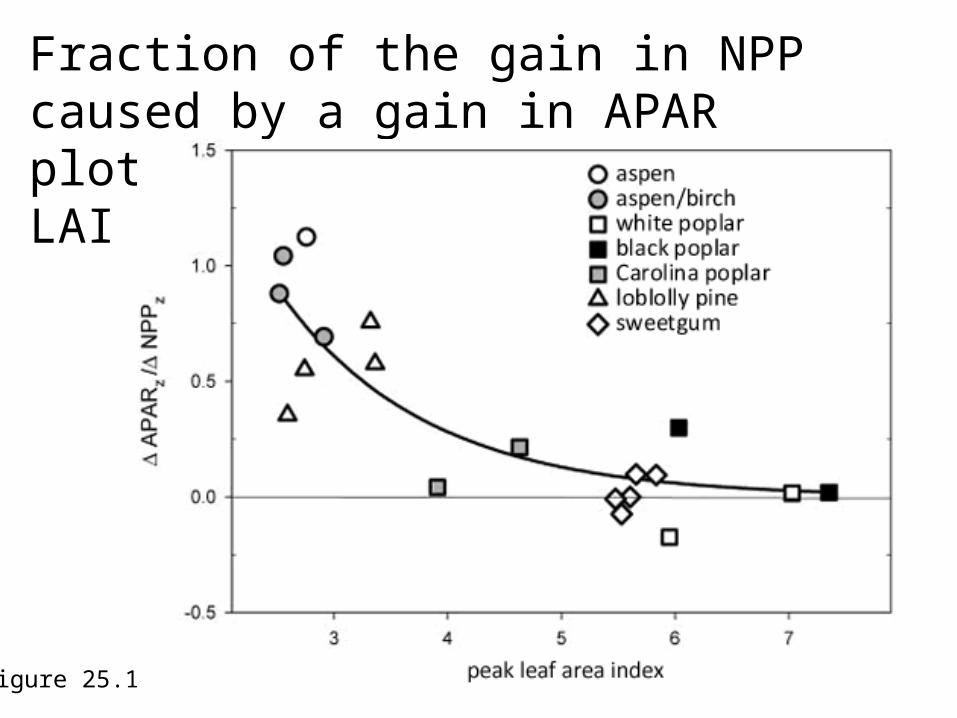
Fraction of the gain in NPP caused by a gain in APAR plotted against peak seasonal LAI
Figure 25.14

Mean annual temperature anomaly from 2000-’06 compared to the 1951-’80 average
Figure 25.15
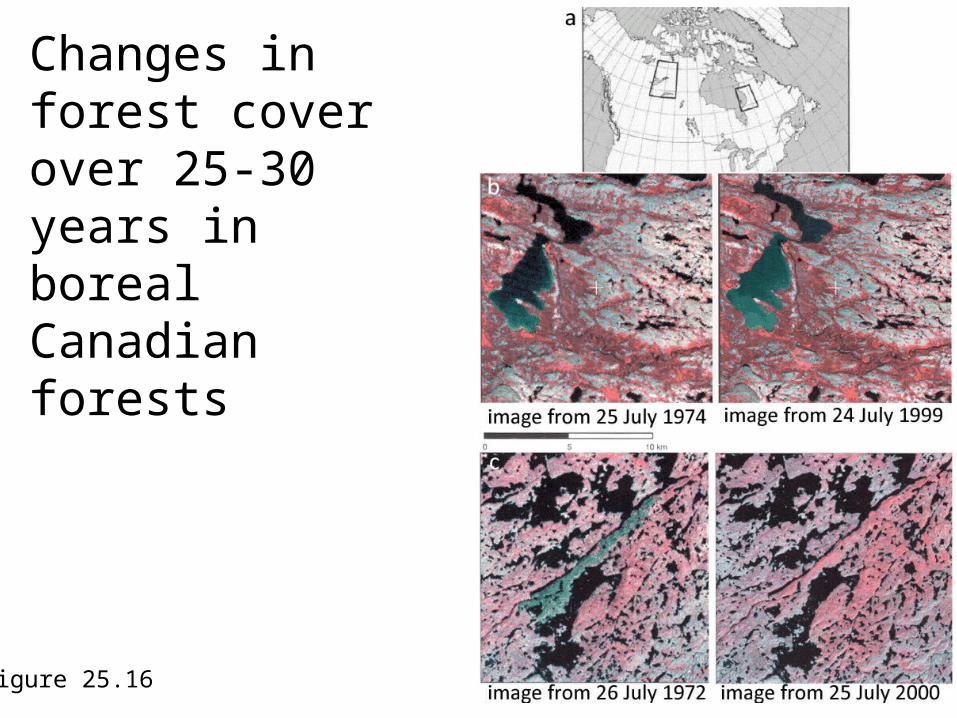
Changes in forest cover over 25-30 years in boreal Canadian forests
Figure 25.16

Mean NDVI and ΔNDVI profiles, where all transects for each region have been pooled
Figure 25.17

Results of regression analysis of changes in phenological events over a 60 year time span
Table 25.7
Response # of events range of slopes
statistically significant decrease 18 -0.476 to -0.128
statistically significant increase 1 0.231
decrease that was close to statistical significance 14 -0.299 to -0.074
increase that was close to statistical significance 2 0.136 to 0.244
no significant increase or decrease 20 -0.081 to 0.142
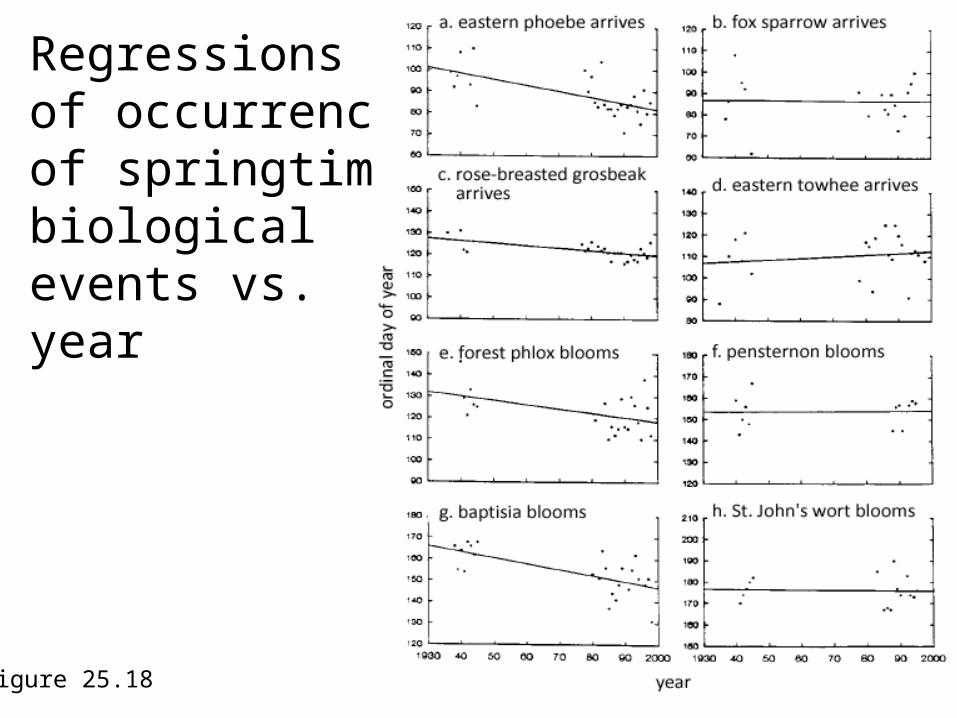
Regressions of occurrence of springtime biological events vs. year
Figure 25.18

Regressions of the ordinal day of year of ice melt against year and mean March temperature
Figure 25.19

Results of experiment to test effect of transplantation on epiphyte mats
Figure 25.20

Effects of transplantation of epiphyte mats from high to mid and low elevation sites
Figure 25.21

Moisture input to and moisture content of epiphyte mats
Figure 25.22

Results of greenhouse experiment on seed banks in epiphyte mats
Table 25.8
variable pruned unpruned
seedling abundance/mat* 127.6 27.1
total number of species* 37 25
% terrestrial species* 90.4 0.9

Anomalies for mean summer temperatures for Charlotte, NC
Figure ELSI 25.2