
INTEGRATING CHEMICAL HAZARD ASSESSMENT INTO...
153
INTEGRATING CHEMICAL HAZARD ASSESSMENT INTO THE DESIGN OF INHERENTLY SAFER PROCESSES A Dissertation by YUAN LU Submitted to the Office of Graduate Studies of Texas A&M University in partial fulfillment of the requirements for the degree of DOCTOR OF PHILOSOPHY December 2011 Major Subject: Chemical Engineering
Transcript of INTEGRATING CHEMICAL HAZARD ASSESSMENT INTO...

1
INTEGRATING CHEMICAL HAZARD ASSESSMENT INTO THE
DESIGN OF INHERENTLY SAFER PROCESSES
A Dissertation
by
YUAN LU
Submitted to the Office of Graduate Studies of Texas A&M University
in partial fulfillment of the requirements for the degree of
DOCTOR OF PHILOSOPHY
December 2011
Major Subject: Chemical Engineering

2
Integrating Chemical Hazard Assessment into the Design of Inherently Safer Processes
Copyright 2011 Yuan Lu

3
INTEGRATING CHEMICAL HAZARD ASSESSMENT INTO THE
DESIGN OF INHERENTLY SAFER PROCESSES
A Dissertation
by
YUAN LU
Submitted to the Office of Graduate Studies of Texas A&M University
in partial fulfillment of the requirements for the degree of
DOCTOR OF PHILOSOPHY
Approved by:
Chair of Committee, M. Sam Mannan
Committee Members, Rayford Anthony Zhengdong Cheng Debjyoti Banerjee Head of Department, Charles Glover
December 2011
Major Subject: Chemical Engineering
iii
iii
ABSTRACT
Integrating Chemical Hazard Assessment into the Design of Inherently Safer Processes.
(December 2011)
Yuan Lu, B.S., East China University of Science and Technology;
M.S., East China University of Science and Technology;
M.S., Texas A&M University
Chair of Advisory Committee: Dr. M. Sam Mannan
Reactive hazard associated with chemicals is a major safety issue in process industries.
This kind of hazard has caused the occurrence of many accidents, leading to fatalities,
injuries, property damage and environment pollution. Reactive hazards can be
eliminated or minimized by applying Inherently Safer Design (ISD) principles such as
“substitute” or “moderate” strategies. However, ISD would not be a feasible option for
industry without an efficient methodology for chemical hazard assessment, which
provides the technical basis for applying ISD during process design.
In this research, a systematic chemical hazard assessment methodology was developed
for assisting the implementation of ISD in the design of inherently safer process. This
methodology incorporates the selection of safer chemicals and determination of safer
process conditions, which correspond to “substitute” and “moderate” strategies in ISD.

iv
iv
The application of this methodology in conjunction with ISD technique can effectively
save the time and investment spent on the process design.
As part of selecting safer chemicals, prediction models were developed for predicting
hazardous properties of reactive chemicals. Also, a hazard index was adopted to rate
chemicals according to reactive hazards. By combining the prediction models with the
hazard index, this research can provide important information on how to select safer
chemicals for the processes, which makes the process chemistry inherently safer.
As part of determining safer process conditions, the incompatibility of Methyl Ethyl
Ketone Peroxide (MEKPO) with iron oxide was investigated. It was found that iron
oxide at low levels has no impact on the reactive hazards of MEKPO as well as the
operational safety. However, when iron oxide is beyond 0.3 wt%, it starts to change the
kinetics of MEKPO runaway reaction and even the reaction mechanism. As a result,
with the presence of a certain level of iron oxide (> 0.3 wt%), iron oxide can intensify
the reactive hazards of MEKPO and impose higher risk to process operations. The
investigation results can help to determine appropriate materials for fabricating process
equipment and safer process conditions.
v
v
DEDICATION
To my father: Jianan Lu
my mother: Yuluan Geng
and
my wife: Xiang Li
vi
vi
ACKNOWLEDGEMENTS
I would like to sincerely thank my advisor, Dr. M. Sam Mannan for his guidance,
understanding and encouragement during my past five year at Texas A&M University. It
was an honor for me to join his research group and work with him to make safety the
second nature. He encouraged me not only to figure out fundamentals of problems but
also always keep the big picture in mind: how can I apply my research to make industry
a safer place to work. He exposed me to various opportunities to make me grow as a
researcher as well as a professional ready to join industry. I cannot reach where I am
without his consistent support, help and guidance. I am indebted to him more than he
knows.
My sincere thanks and appreciation goes to my committee members, Dr. Rayford Gaines
Anthony, Dr. Debjyoti Banerjee and Dr. Zhengdong Cheng for their time, effort and
advice.
I gratefully acknowledge Dr. Dedy Ng, my former team leader and research scientist
with Mary Kay O’Connor Process Safety Center (MKOPSC), for his contribution and
friendship. The extensive discussions with him broadened my idea in research and
triggered my intellectual maturity. Also, his editorial advice was essential for my journal
publications as well as this dissertation.

vii
vii
I owe my most sincere gratitude to Dr. Victor Carreto Vazquez, my current team leader.
I have benefited by advice and training from him who also always generously grants me
his precious time and effort.
Also, many thanks go to all the member of MKOPSC for their help to make this research
project reach this final stage.
Last but not least, I am deeply grateful to my parents and my wife for their love,
understanding and support through the years.

viii
viii
NOMENCLATURE
APTAC Automatic Pressure Tracking Adiabatic Calorimeter
DSC Differential Scanning Calorimeter
MEKPO Methyl Ethyl Ketone Peroxide
QSPR Quantitative Structure-Property Relationship
MLR Multiple linear regression
PLS Partial least square
ISD Inherently safer design
DFT Density Functional Theory
RHI Reaction hazard index
TRI Thermal risk index
THI Thermal hazard index
HWS Heat-wait-search
HRS Heat-ramp-search
ASTM American Society for Testing and Materials
TST Transition State Theory
CHETAH Chemical Engineering Thermodynamics and Hazard Evaluation
CART Calculated Adiabatic Reaction Temperature
NFPA National Fire Protection Association
EP Explosion Potential
TMR Time to maximum rate

ix
ix
SADT Self Accelerating Decomposition Temperature
CSB U.S. Chemical Safety Board
x
x
TABLE OF CONTENTS
Page
ABSTRACT ................................................................................................................. iii
DEDICATION............................................................................................................... v
ACKNOWLEDGEMENTS .......................................................................................... vi
NOMENCLATURE ................................................................................................... viii
TABLE OF CONTENTS ............................................................................................... x
LIST OF FIGURES ..................................................................................................... xii
LIST OF TABLES ...................................................................................................... xiv
CHAPTER
I INTRODUCTION ................................................................................................. 1
II METHODOLOGY AND EXPERIMENTAL SETUP ........................................... 8
2.1 Research approach ............................................................................................ 8
2.2 Quantitative structure property relationship ...................................................... 8 2.2.1 Training set collection ......................................................................... 10
2.2.2 Selection of descriptors ........................................................................ 10 2.2.3 Regression method .............................................................................. 15
2.2.4 Validation test...................................................................................... 18 2.3 Computational quantum chemistry simulation ................................................ 20
2.4 Classification systems for reactive chemicals .................................................. 21 2.4.1 Reaction hazard index .......................................................................... 22
2.4.2 Thermal risk index ............................................................................... 23 2.4.3 Thermal hazard index .......................................................................... 24
2.5 Experimental setup ......................................................................................... 25 2.5.1 Differential Scanning Calorimeter........................................................ 25
2.5.2 Automatic Pressure Tracking Adiabatic Calorimeter ............................ 27 2.6 Calorimetry data analysis ............................................................................... 32
2.6.1 Kinetic modeling ................................................................................. 32 2.6.2 Model fitting ........................................................................................ 35
2.6.3 Thermal inertia .................................................................................... 36
xi
xi
CHAPTER Page
2.6.4 Non-condensable gas generation .......................................................... 38 III SELECTION OF SAFER REACTIVE CHEMICALS ........................................ 40
3.1 Introduction .................................................................................................... 40 3.2 Results ........................................................................................................... 44
3.2.1 Correlation analysis ............................................................................. 44 3.2.2 Development of prediction models....................................................... 45
3.2.3 Discussion ........................................................................................... 56 3.2.4 Hazard classification system ................................................................ 58
3.3 Conclusions .................................................................................................... 65
IV DETERMINATION OF SAFER PROCESS CONDITIONS ............................... 67
4.1 Introduction .................................................................................................... 67 4.2 Results and discussions .................................................................................. 70
4.2.1 Uncertainty analysis............................................................................. 70 4.2.2 Calorimetry study ................................................................................ 73
4.2.3 Non-condensable gas generation analysis............................................. 90 4.2.4 Kinetic investigation ............................................................................ 97
4.2.5 Evaluation of key safety parameters ................................................... 113 4.4 Conclusions and discussion .......................................................................... 122
V CONCLUSIONS AND RECOMMENDATIONS ............................................. 126
5.1 Conclusions .................................................................................................. 126
5.2 Recommendations for future work ................................................................ 127
REFERENCES .......................................................................................................... 129
APPENDIX ............................................................................................................... 136
VITA ......................................................................................................................... 137

xii
xii
LIST OF FIGURES
Page Figure 1.1 Total incidents by year, 1980-2001 ..................................................... 2 Figure 1.2 Consequences of incidents.................................................................. 3 Figure 1.3 Proposed chemical hazard assessment methodology ........................... 6 Figure 2.1 Research approach for developing the chemical hazard assessment methodology ...................................................................................... 9 Figure 2.2 PLS analysis procedure ...................................................................... 18 Figure 2.3 Schematic of DSC .............................................................................. 26 Figure 2.4 Schematic of APTAC ......................................................................... 28 Figure 2.5 Temperature-pressure profiles under HWS mode ............................... 29 Figure 3.1 Scattering diagram for experimental and calculated onset temperature using MLR model .............................................................................. 46 Figure 3.2 Scattering diagram for experimental and calculated onset temperature using PLS model................................................................................ 49 Figure 3.3 Scattering diagram for experimental and calculated heat of reaction using MLR model .............................................................................. 53 Figure 3.4 Scattering diagram for experimental and calculated heat of reaction using PLS model................................................................................ 55 Figure 3.5 Validation of hazard index for organic peroxides ................................ 63 Figure 4.1 Chemical structure of MEKPO ........................................................... 68 Figure 4.2 Experimental calorimetric data profiles of MEKPO with contaminant within low concentration range .......................................................... 76 Figure 4.3 Experimental calorimetric data profiles of MEKPO with contaminant within medium concentration range ................................................... 79

xiii
xiii
Page Figure 4.4 Experimental calorimetric data profiles of MEKPO with contaminant within high concentration range ......................................................... 83 Figure 4.5 Trends of calorimetric parameters over iron oxide concentration ........ 88 Figure 4.6 Non-condensable gas pressure ............................................................ 91 Figure 4.7 Gas generation rate profiles for MEKPO runaway reaction................. 93 Figure 4.8 Kinetic analysis using nth order reaction ............................................ 100 Figure 4.9 Kinetic analysis using autocatalytic reaction ....................................... 107 Figure 4.10 Trend of TMR over initial temperature ............................................... 116 Figure 4.11 TMR safety diagram........................................................................... 117 Figure 4.12 Determine SADT through reaction modeling for pure MEKPO in 25 gallon package .................................................................................. 121 Figure 4.13 Analysis of runaway reaction mechanism .......................................... 125

xiv
xiv
LIST OF TABLES
Page
Table 2.1 List of descriptors used in QSPR study ................................................ 11 Table 3.1 NFPA rating for selected organic peroxides ......................................... 43 Table 3.2 Experimental and calculated onset temperature of organic peroxides ... 47 Table 3.3 Validation of the prediction model for onset temperature ..................... 48 Table 3.4 Sensitivity analysis of the onset temperature prediction model obtained through PLS analysis ........................................................................... 50
Table 3.5 Experimental and predicted heat of reaction of organic peroxides ........ 52
Table 3.6 Validation of the prediction model for heat of reaction ........................ 54
Table 3.7 Sensitivity analysis of the heat of reaction prediction model obtained through PLS analysis ........................................................................... 56
Table 3.8 Estimated parameters used in the hazard indices .................................. 60
Table 3.9 Rating results of organic peroxide ........................................................ 61
Table 4.1 Uncertainty analysis for APTAC tests performed on pure MEKPO ...... 70
Table 4.2 Uncertainty analysis for APTAC tests performed on MEKPO with 5 wt% iron oxide ............................................................................................ 71
Table 4.3 Experimental details of APTAC tests ................................................... 73
Table 4.4 Calorimetric parameters of MEKPO runaway reaction......................... 85
Table 4.5 Self-heating rate and pressure rate data ................................................ 86
Table 4.6 Estimation of non-condensable gas generation ..................................... 92
Table 4.7 Parameters of non-condensable gas generation .................................... 97
Table 4.8 Estimation of kinetic parameters using nth order reaction model .......... 104
xv
xv
Page
Table 4.9 Estimation of kinetic parameters using autocatalytic reaction model ... 112 Table 4.10 Calculated TMR for MEKPO with different levels of iron oxide......... 115 Table 4.11 SADT test methods recommended by UN........................................... 119 Table 4.12 Determination of SADT for MEKPO in 25 gallon package ................. 122 Table A1 List of descriptors calculated for 16 organic peroxides used in this study ................................................................................................. 138

1
1
CHAPTER I
INTRODUCTION
Reactive chemicals are widely used in the chemical industry to manufacture a variety of
products due to their capacities to undergo chemical reactions. However, while this kind
of capability, also called reactivity, is critical important for the chemical industry, it can
also lead to significant risk if reactive hazards associated are not properly understood
and controlled. The U.S. chemical safety and hazard investigation board (CSB) reported
167 serious incidents occurred in the United States involving uncontrolled chemical
reactivity from 1980 to 2001 1. The distribution of these incidents over time is shown in
Figure 1.1. These incidents caused 108 fatalities and lots of injuries. Also, these
incidents led to a variety of consequences, such as fires, explosions, toxic gas release and
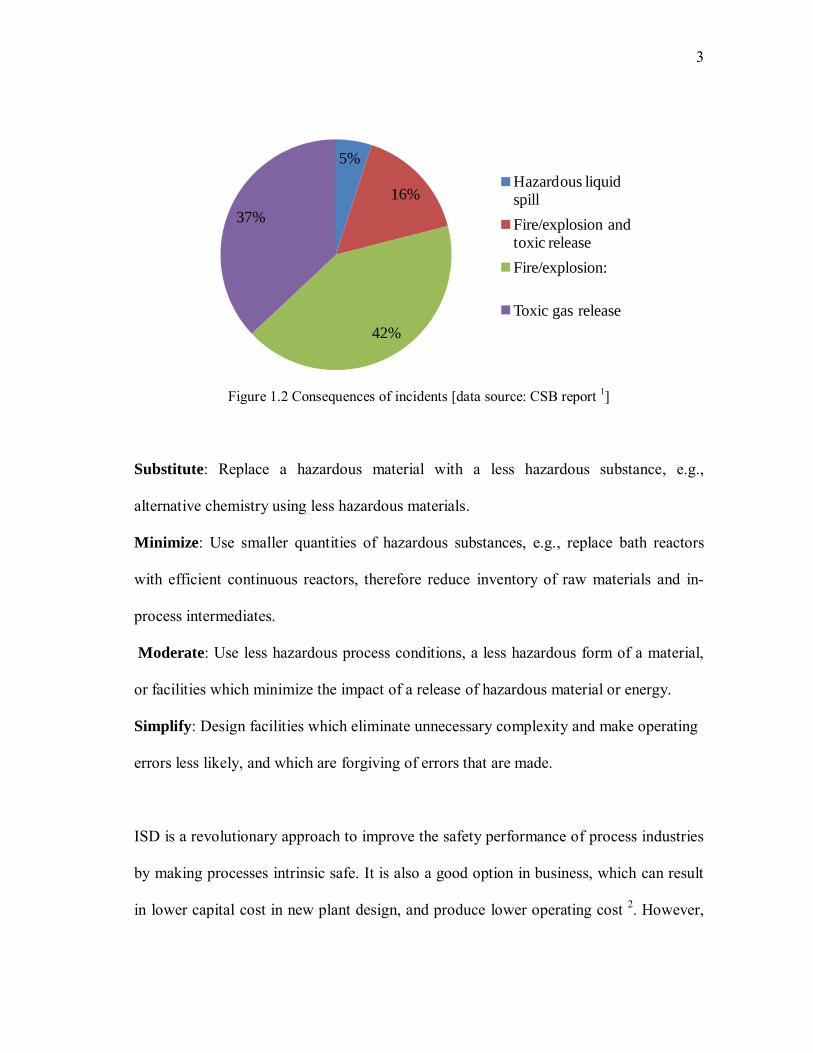
spills of hazardous liquids (Figure 1.2), which resulted in hundreds of millions of dollars
of properties damage and irreversible impact to the environment.
Facing the great hazards imposed by reactive chemicals to process industries, there is an
urgent need to effectively manage these hazards and eliminate them if possible. The
hazards associated with reactive chemicals are defined by multiple factors. First, reactive
hazards heavily depend on the nature of the chemicals used in processes. Chemicals with
higher reactivity normally impose greater hazards to the processes. Also, reactive
____________ This dissertation follows the style of Industrial & Engineering Chemistry Research.

2
2
hazards are affected by various process conditions, such as quantities of chemicals
handled, concentrations of chemicals, operating temperature and pressure, and the
presence of incompatible substances. Therefore, all these factors contributing to reactive
hazards should be taken under consideration when developing the global plan to
effectively reduce or manage the reactive hazards in process industries.
0
2
4
6
8
10
12
14
16
80 81 82 83 84 85 86 87 88 89 90 91 92 93 94 95 96 97 98 99 00 01
No
. of
inci
den
ts
Year Figure 1.1 Total incidents by year, 1980-2001[data source: CSB report 1]
An effective approach to handle reactive hazards associated with industrial processes is
to apply Inherently Safer Design (ISD) concept in the process design stage. ISD is a
fundamentally differently way of thinking about process design. It mainly focuses on the
elimination or reduction of a hazard rather than on management and control 2-6. There
are four widely accepted principles for ISD: minimize, substitute, moderate and simplify
2, 7. These principles are further explained as follows:
3
3
5%
16%
42%
37%
Hazardous liquid spill
Fire/explosion and toxic release
Fire/explosion:
Toxic gas release
Figure 1.2 Consequences of incidents [data source: CSB report 1]
Substitute: Replace a hazardous material with a less hazardous substance, e.g.,
alternative chemistry using less hazardous materials.
Minimize: Use smaller quantities of hazardous substances, e.g., replace bath reactors
with efficient continuous reactors, therefore reduce inventory of raw materials and in-
process intermediates.
Moderate: Use less hazardous process conditions, a less hazardous form of a material,
or facilities which minimize the impact of a release of hazardous material or energy.
Simplify: Design facilities which eliminate unnecessary complexity and make operating
errors less likely, and which are forgiving of errors that are made.
ISD is a revolutionary approach to improve the safety performance of process industries
by making processes intrinsic safe. It is also a good option in business, which can result
in lower capital cost in new plant design, and produce lower operating cost 2. However,

4
4
the application of ISD in the process design stage requires a comprehensive
understanding and evaluation of the reactive hazards associated with chemicals. For
example, when applying the principle “substitute”, it is important to evaluate the reactive
hazards of chemicals so the safer candidate can be selected. Also, when applying the
principle “moderate” in process design through adopting less hazardous process
condition, it is important to understand the effects of process conditions on the reactive
hazards associated with chemicals in the process. Therefore, in order to make ISD a
feasible approach to design inherently safer process, a chemical hazard methodology is
needed to understand and evaluate the reactive hazards associated with chemicals
employed in processes, based on which the right decisions can be made on the process
design.
An experimental approach is the common practice in chemical hazard assessment, where
calorimeters are the popular tools. Calorimeter such as Differential Scanning
Calorimeter (DSC) and Reactive System Screening Tool (RSST) can screen chemicals
based on reactive hazards 8, 9. More detailed studies on reactive hazards can be
conducted using apparatuses such as adiabatic calorimeters or isothermal calorimeters.
Besides calorimeter tests, other types of experimental methods have also been developed
for hazard assessment with specific purposes. Self accelerating decomposition
temperature (SADT) test was designed to provide the guidance on the safe transport of
organic peroxides 10. The consequence of an explosion scenario caused by reactive
chemicals can be studied through a pressure vessel test and lead pipe deformation test 11.
5
5
However, these experimental methods require high investment on test apparatus and
long test procedures, which become an obstacle for the application of ISD principles in
the process design stage.
This research aims at developing an efficient and relative economic methodology in
estimating reactive hazards, which can assist the implementation of ISD in the course of
process design. This methodology is composed of two major parts: selection of a safer
candidate out of a chemical family (e.g., organic peroxides or nitro compounds), and
determination of safer process conditions. In the chemical selection part, the prediction
models were derived for prediction of hazardous properties and the classification system
was developed to classify chemicals according to reactive hazards. In the process
conditions determination part, a systematic investigation was performed to quantify the
impact of the process contaminant on reactive hazards. Also, some key safety parameters
were estimated and analyzed for the purpose of determining safer operating conditions.
These two parts of the methodology corresponds to two important ISD principles,
“substitute” and “moderate”, and therefore serve as the important tools for the important
decision-making during the design of inherently safer processes by providing a solid
technical basis. The framework of this methodology and its relationship with ISD
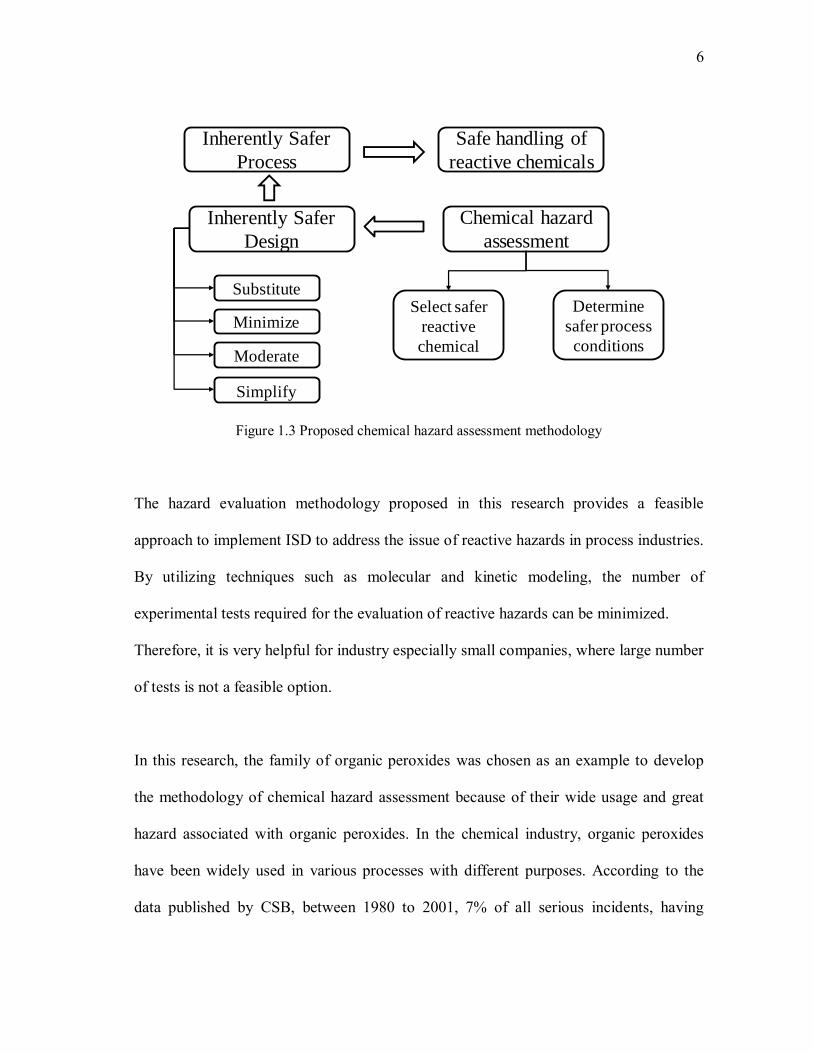
technique are depicted in Figure 1.3.
6
6
Inherently Safer
Process
Safe handling of
reactive chemicals
Inherently Safer
Design
Substitute
Minimize
Moderate
Simplify
Chemical hazard
assessment
Select safer
reactive
chemical
Determine
safer process
conditions
Figure 1.3 Proposed chemical hazard assessment methodology
The hazard evaluation methodology proposed in this research provides a feasible
approach to implement ISD to address the issue of reactive hazards in process industries.
By utilizing techniques such as molecular and kinetic modeling, the number of
experimental tests required for the evaluation of reactive hazards can be minimized.
Therefore, it is very helpful for industry especially small companies, where large number
of tests is not a feasible option.
In this research, the family of organic peroxides was chosen as an example to develop
the methodology of chemical hazard assessment because of their wide usage and great
hazard associated with organic peroxides. In the chemical industry, organic peroxides
have been widely used in various processes with different purposes. According to the
data published by CSB, between 1980 to 2001, 7% of all serious incidents, having

7
7
chemical reactivity involved, happened to US process industries are related to organic
peroxides 1. The methodology developed based on organic peroxides can be easily
applied for other chemical families.
In this dissertation, the term “safer” is frequently used, indicating the comparison
between ISD and regular strategies in the control of process hazards.
Chapter II presents the research methodology employed in this dissertation and all
important techniques involved. Chapter III introduces how to select safer chemical
according to reactive hazards, using organic peroxides as the chemical family. The
content of this chapter includes the development of the prediction models for reactive
hazards and the classification system. Chapter IV discusses the determination of safer
process condition, including calorimetry test, kinetic analysis and estimation of key
safety parameters. Chapter V summarizes this dissertation by stating the conclusions of
this research and recommendations for future work.

8
8
CHAPTER II
METHODOLOGY AND EXPERIMENTAL SETUP
2.1 Research approach
The research approach of this dissertation is presented in Figure 2.1. This approach is
composed of a theoretical part and an experimental part, corresponding to two major
objectives - select safer chemicals and determine safer process conditions. In this
approach, various techniques such as Quantitative Structure-Property Relationship
(QSPR), molecular modeling and kinetic modeling were employed in order to achieve
relative high efficiency and low cost in estimating chemical hazards. The details of these
methodologies/techniques are introduced in this chapter.
2.2 Quantitative structure property relationship
Quantitative structure property relationship (QSPR) was designed to investigate the
relationships between chemical structure and desired properties at the quantum
chemistry level. These relationships derived through QSPR can be used to make
predictions on the desired properties. QSPR methodology has been successfully applied
in the drug design field and has become an important tool in medicinal chemistry 12-15. In
recent years, QSPR methodology has been involved in predicting physical and chemical
properties for various types of substances and it has been demonstrated to be an effective
approach in this field.

9
9
C hem ical H azard
A ssessm ent
Theoretical Experim ental
M olecular
M odelingQ SPR Study
H azard R ating
SystemPrediction M odels
Safer C hem ical
C alorim etry Test
K inetic M odeling
K ey Safety
Param eters
Safer Process
C onditions
Figure 2.1 Research approach for developing the chemical hazard assessment methodology
The QSPR study starts from the collection of a training set, selection and calculation of
descriptors characterizing chemical structures. Then mathematic model regression is
performed to derive the correlation between the training set and descriptors. Validation
test is also required in the QSPR study to verify the quality of the correlation model. The
details of these elements in QSPR study are presented as follows.
10
10
2.2.1 Training set collection
Training set in this research includes the data of onset temperature and heat of reaction.
The data in the training set were collected from calorimetry test performed on 16 organic
peroxides. The details of the calorimetry test are presented in Section 2.5.1.
As seen in Table 3.2, chemicals in the training set covers the most important categories
of organic peroxides, such as dialkyl peroxide, peroxyester and hydroperoxide. The
ranges of the onset temperature (87 – 170 oC) and heat of reaction (65 – 664 kJ/mol) data
in the training set also cover most of the commercial grade organic peroxides.
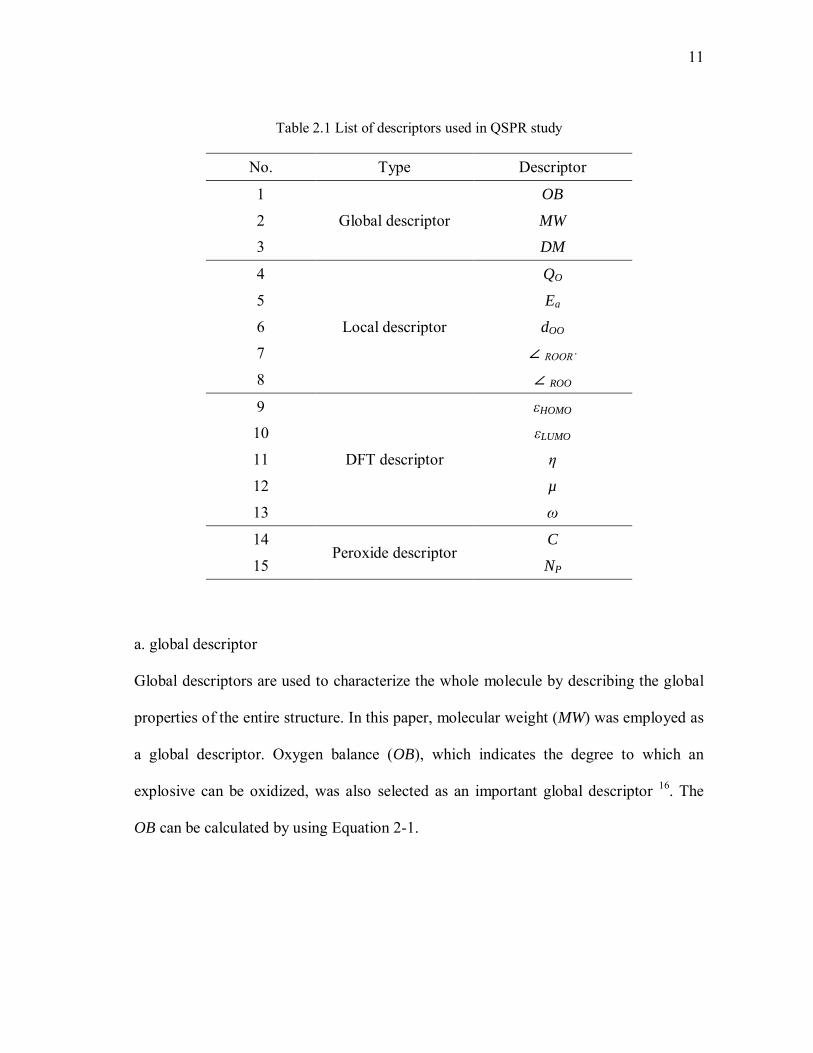
2.2.2 Selection of descriptors
In order to achieve good accuracy in predicting hazardous properties, different types of
descriptors were employed to characterize the properties of the organic peroxides,
including global descriptors, local descriptors, Density Functional Theory (DFT)
descriptors and descriptors specifically designed for organic peroxide. All the descriptors
applied in QSPR study are listed in Table 2.1 and the description of these descriptors is
presented in the following paragraphs.
11
11
Table 2.1 List of descriptors used in QSPR study
No. Type Descriptor
1
Global descriptor
OB
2 MW
3 DM
4
Local descriptor
QO
5 Ea
6 dOO
7 ∠ ROOR’
8 ∠ ROO
9
DFT descriptor
εHOMO
10 εLUMO
11 η
12 µ
13 ω
14 Peroxide descriptor
C
15 NP
a. global descriptor
Global descriptors are used to characterize the whole molecule by describing the global
properties of the entire structure. In this paper, molecular weight (MW) was employed as
a global descriptor. Oxygen balance (OB), which indicates the degree to which an
explosive can be oxidized, was also selected as an important global descriptor 16. The
OB can be calculated by using Equation 2-1.
12
12
MW
ZYXOB
)2/2(*1600
2-1
where X, Y, Z indicate the number of carbon atoms, hydrogen atoms and oxygen atoms
respectively.
Dipole moment (DM) is another physical property chosen as a global descriptor in this
research. It is defined as the amount of force that would be required to flip the molecule
in an externally applied electric field.
b. local descriptor
Local descriptors focus on a local area (e.g. functional group) within the molecular
structure by characterizing its local properties. In this research, relevant properties
describing electronic structure, geometry and energy of the peroxide functional group
were employed as local descriptors. For organic peroxides, the dissociation of the
oxygen-oxygen bond in the peroxide functional group is the first and also rate-
determining step of the decomposition reaction 17. The dissociation energy (Ea) of the
oxygen-oxygen bond is the energy barrier for initiating the decomposition reaction,
indicating how easily organic peroxides can decompose. Therefore, this parameter was
selected as a descriptor for QSPR study. In this dissertation, in order to reduce the
simulation work, it was simplify calculated as the energy difference between the
products and the reactants (Equation 2-2) 18. For organic peroxides with multiple

13
13
peroxide functional groups, this descriptor was defined as the dissociation energy of the
weakest oxygen-oxygen bond.
)'()'()(
''
ROOREOREROEE
ORROORRO
a
2-2
Some other important properties of the peroxide functional group were also employed as
local descriptors, such as oxygen-oxygen bond length (dOO), torsion angle ((∠ROOR’),
bond angle (∠ROO) and atomic charge of oxygen (QO). According to previous research,
some of these descriptors can influence the stability of organic peroxide, such as atomic
charge of oxygen and torsion angle 19-21. In this research, the bond angle was calculated
as the average of bond angles in the same peroxide functional group. Similarly, the
atomic charge of oxygen is also calculated as the average value of two oxygen atoms in
the peroxide functional group.
c. Density Functional Theory descriptors
Global descriptors estimated through density functional theory method can be used as
the index to characterize the molecular reactivity and have been successful applied in the
QSPR study of explosives 22-24. In this research, some Density Functional Theory (DFT)
descriptors were employed in the QSPR study of organic peroxides in order to achieve
good accuracy in prediction of reactive hazards.

14
14
DFT descriptors selected by this research include energy of lowest unoccupied
molecular orbital (εLUMO) and energy of the highest occupied molecular orbital (εHOMO).
Other DFT descriptors used in this research can be derived from these two descriptors,
such as electrophilicity index (ω) 25, chemical potential (µ) 26, and hardness (ŋ) 27. These
descriptors can be calculated using the following equations:
2
LUMOHOMO
2-3
HOMOLUMO 2-4
2
2
2-5
d. Peroxide descriptors
The number of peroxide functional groups (NP) is a descriptor specifically designed for
organic peroxides. According to the experimental observation in this research, it was
found that organic peroxides with multiple peroxide functional groups tend to have
lower thermal stability and higher heat of reaction. Therefore, in this research, NP was
applied in the QSPR study as a descriptor for the prediction of both onset temperature
and heat of reaction.
Concentration of organic peroxides, a non-intrinsic parameter, was employed as the
descriptor in the QSPR study because of its contribution to onset temperature. In this
study, reactive hazards data in the training set were collected from DSC tests, where the

15
15
concentration of organic peroxides varied from 34 to 98 wt%. Through previous research
and investigation conducted by MKOPSC, concentration was found to be a factor
contributing to the onset temperature of organic peroxide 28, 29. Therefore, this parameter
was also selected as a descriptor in this research.
2.2.3 Regression method
Two mathematic regression methods, partial least square (PLS) method and multiple
linear regression (MLR) method, were used in this research to develop the prediction
models for reactive hazards. The accuracy of these two methods was then compared to
determine the model with the better prediction power. The mathematic regression as well
as the validation test were performed using Materials Studio software package 30.
a. Multiple linear regression method
MLR is a relatively simple method and has been widely used in the model regression.
This method derives the relationship between explanatory variables and the response
variable through linear model fitting. The MLR method implemented in this research
incorporates a stepping algorithm, which selects a subset of explanatory variables based
on the contribution of these variables to the response variable. Therefore, the final model
only includes those explanatory variables significant for the response variable. The
general form of the regression model derived using MLR method is shown by Equation
2-6.

16
16
nn XAxAxAAY 22110 2-6
where xi are the descriptors characterizing molecular properties and Y is the desired
hazardous property, Ai are the corresponding regression constants for descriptors.
b. Partial least square method
PLS method uses principal component-like quantities derived from the explanatory
variables, also known as latent variables, to perform model regression. These latent
variables are orthogonal and are analyzed in conjunction with the response variable to
develop the prediction model 31. The general underlying model of PLS analysis can be
depicted by the Equation 2-7 and 2-8.
ETPX T 2-7
FTQY T 2-8
where X is an n × m matrix of explanatory variables, Y is an n × p matrix of response
variables, T is a n × l matrix of latent variable, P and Q are m × l and p × l loading
matrices, and matrices E and F are the error terms.
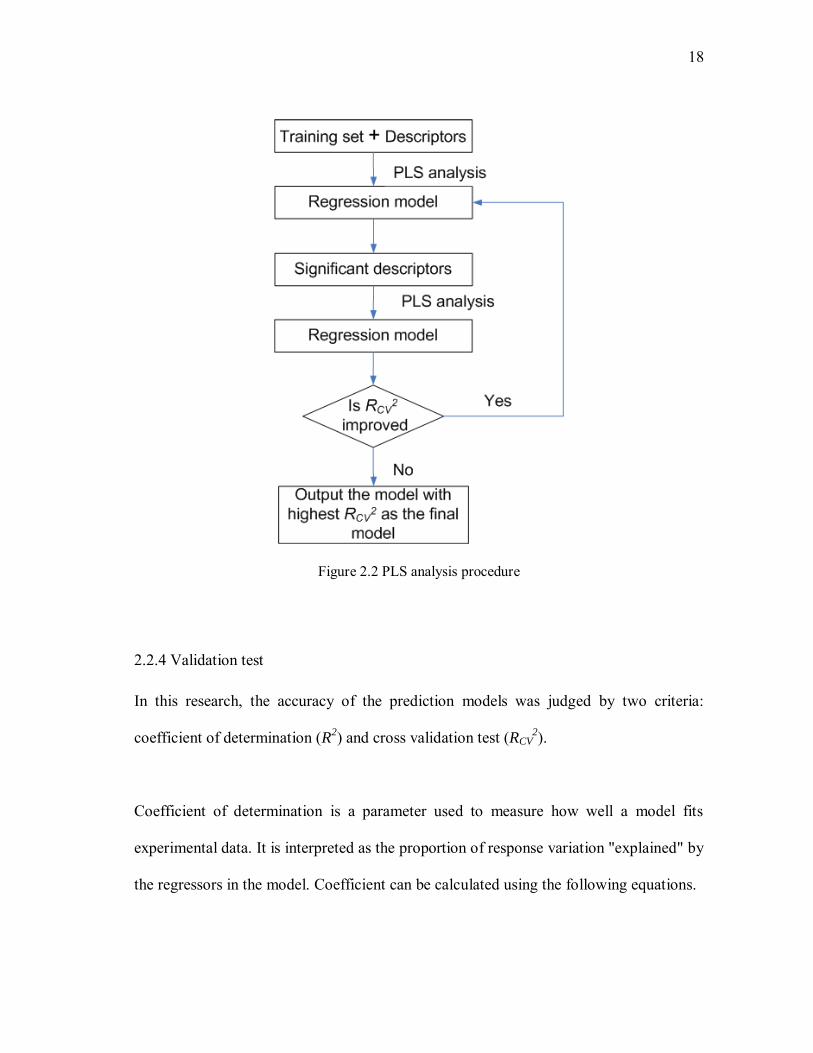
Different from MLR method, PLS method does not include the step wise selection of the
significant explanatory variables. As the result, all explanatory variables are included in
the final regression model developed using PLS method. In order to address this issue, a
methodology (Figure 2.2) was proposed here to exclude those insignificant explanatory
variables from the final regression model 32, 33. In this methodology, after each PLS
analysis, a sensitivity analysis is performed to determine the significance of explanatory

17
17
variables. Based on the sensitivity analysis results, the most insignificant explanatory
variable needs to be excluded from the further study. Then, PLS analysis is performed
again to develop another regression model. This iteration continues until the RCV2 of the
regression model cannot be improved further (The definition of RCV2 is introduced in
Section 2.2.4).
By eliminating the inter-correlation between explanatory variables, PLS method is a
particularly useful tool for data sets with a high level of redundancy due to collinearity
or multicollinearity 34. Since the number of latent variable are normally much less than
explanatory variables, PLS method has the capability to handle the case where the
number of explanatory variables is comparable to or greater than the number of data in
the training set.
18
18
Figure 2.2 PLS analysis procedure
2.2.4 Validation test
In this research, the accuracy of the prediction models was judged by two criteria:
coefficient of determination (R2) and cross validation test (RCV2).
Coefficient of determination is a parameter used to measure how well a model fits
experimental data. It is interpreted as the proportion of response variation "explained" by
the regressors in the model. Coefficient can be calculated using the following equations.

19
19
2)( i
itot yySS 2-9
2)(
i
iierr fySS 2-10
n
iyn
y1
1 2-11
tot
err
SS
SSR 12 2-12
where yi is the ith experimental data, fi is the ith predicted data and y is the mean value
of experimental data.
Cross validation is an important statistical tool used in this research to estimate the
predictive power of the models. This test can verify whether the regression model
represents the desired relationship or just a mathematic fitting. The prediction power of
the model is measured by RCV2, which can be calculated using the following equations.
TSS
PRESSRCV 1
2
2-13
n
i
ii yyPRESS1
2)'(
2-14
2
1
)(
n
i
i yyTSS
2-15
where yi is the ith experimental data, yi’ is the predicted value for yi, y is the mean value
of experimental data.

20
20
In the cross validation test, some data (yi) are removed from the training set before
performing model regression. Once the model has been built using the data left in the
training set, the data which have been removed can be used as the test set to evaluate the
performance of the model on making predictions. This procedure repeats until all the
data in the training set have been used as the test set. Here PRESS is prediction sum of
squares and TSS is total sum of squares.
2.3 Computational quantum chemistry simulation
Computational quantum chemistry simulation was employed in this research to
characterize molecular structure of organic peroxides and estimate values of descriptors.
This method is based on the quantum molecular theory, whose core idea is that the
motion and distribution of electrons can be described in term of probability distributions
or molecular orbitals. This method offers a mathematic description of behavior of
electrons, with Schrodinger's equation as the theoretical basis.
A variety of theoretical levels are available for computational quantum chemistry
simulation, such as the semi-empirical method, the Hartree-Fock method, the Density
Functional Theory method and the Complete Basis Set method. Out of these theoretical
levels, Density functional Theory (DFT) method was employed for the molecular
simulation in this research. DFT method was developed based on the density functional
theory, which assumes the ground state energy of an electron system is a function of the
electron charge density. Therefore, this method calculates the molecular energy using
electron density instead of wave functions. In the DFT method, the electronic energy is
partitioned into several parts and computed separately by functions: electron-nuclear

21
21
interaction, kinetic energy, the coulomb repulsion and exchange-correlation term
(account for the remainder for the electron-electron interaction). Because of the way to
calculate electron correlation, this method can achieve pretty good accuracy with
relatively low cost 18. B3LYP is a common theory level of the DFT method and was
utilized in this research 35, 36.
In this research, quantum chemistry simulation was performed using Gaussian-03
program package in the gaseous phase at 298 K and 1 atm pressure 37, 38. The 6-31G(d)
basis set 39, 40, including polarization function for angular flexibility 41, was used for
geometry optimization and frequency calculation. Geometry optimization calculation
was performed for each chemical to find the optimized molecular structures with the
lowest energy. The optimized structure was then verified by frequency calculation
results. Each optimized structure was characterized as a local minimum with no
imaginary frequency.
2.4 Classification systems for reactive chemicals
In the attempt to classify reactive chemicals based on their reactive hazards, several
hazard indices were employed by this research. The classification results of these hazard
indices were compared to select the most appropriate one for the family of organic
peroxides. The hazard indices involved in this research are introduced as follows.

22
22
2.4.1 Reaction hazard index
Reaction hazard index (RHI) is an empiric index developed by D.R 42. Stull. It utilizes
thermodynamic data to evaluate the hazards presented by flammable or explosive. RHI
is defined as:
am
m
ET
TRHI
30
10
2-16
where Tm is maximum adiabatic temperature reached by the reaction, Ea is the activation
energy of the reaction.
Tm can be calculated using the following equation.
P
rm
C
HTT
0 2-17
where T0 is the onset temperature of the decomposition reaction, ΔHr is the heat of
reaction and CP is the heat capacity of the reaction system.
Ea can be estimated by solving Equation 2.18

23
23
)exp(RT
E
hC
TkH
dt
dT a
P
Br
2-18
where kB is the Boltzmann’s factor, h is Planck’s constant, T is the temperature of the
reaction system and R is the gas constant. When calculating Ea, T is defined as T0, and
dT/dt is defined as 0.1 ° C/min, a common criterion for detecting an exothermic reaction.
2.4.2 Thermal risk index
Thermal risk index (TRI) is a rating system for reactive chemicals developed by Wang et
al. 43. It integrates the concept of risk, which is a function of probability and
consequence, into the rating system. This rating system classifies chemicals based on
two parameters: heat of reaction and time to maximum rate. These two parameters
indicate consequence and probability respectively. The definition of TRI is shown as
follows:
ad
ad
r
r
TMR
TMR
H
HTRI
'*
' 2-19
where TMRad is time to maximum rate at adiabatic condition, ΔHr is heat of reaction.
ΔHr’ and TMRad’ are parameters of the reference chemical.
For the reaction with relative high activation energy, TMRad can be calculated using
Equation 2-20 43.

24
24
a
Pad
qE
RTCTMR
2
2-20
where q is the heat release rate at temperature T, Ea is the activation energy, and CP is
the heat capacity of the reaction system.
2.4.3 Thermal hazard index
Thermal hazard index (THI) is designed to rate reactive chemicals when multiple safety
parameters need to be considered 44. In THI, the relative significance of each safety
parameters considered in rating system is quantified by the hazardous index W. The
general form to calculate W is shown by Equation 2-21.
min,max,
min,100ii
ii
ixx
xxW
2-21
where Wi is the hazardous index of parameter i, xi is the value of parameter i, xi,min and
xi,max are the minimum and maximum value of parameter i respectively.
The rating score of THI is calculated based on hazardous indices and their weight factors
(yi) (Equation 2-22).
i
n
i
i WyTHI 1
2-22
where yi is the weight factor of hazardous index Wi.

25
25
In this research, onset temperature and heat of reaction are considered to be equally
important to reactive hazards. Therefore, yi is defined as 1 for these two hazardous
indices.
2.5 Experimental setup
2.5.1 Differential Scanning Calorimeter
Differential Scanning Calorimeter (DSC) is an important screening test apparatus, which
measures a number of characteristic properties of the sample materials. It has been used
to study subjects such as crystallization, glass transition, oxidation and other chemical
reactions. In the process safety area, it has been widely used as a screening tool for
hazardous materials. It can determine whether a material undergoes an endothermic or
exothermic reaction 45.
The schematic of DSC is shown in Figure 2.3. DSC is equipped with two independent
heaters used to heat a sample and a reference respectively. During the test run, a sample
and a reference are placed in two identical sample pans and subjected to a continuously
increasing temperature. Meanwhile, heat is added to the reference to maintain it at the
same temperature as the sample. This added heat compensates for the heat loss or gained
as a consequence of an overall endothermic or exothermic reaction.

26
26
Figure 2.3 Schematic of DSC
A Pyris 1 DSC from PerkinElmer was used in this research to collect the data of reactive
hazards for organic peroxides. Stainless steel sample pans with O-rings were used to
contain sample material because of the high internal pressure during runaway reaction.
When running tests, nitrogen was used to purge the DSC vessel. During each
experiment, the sample was heated from 30 to 60 oC at the heating rate of 10 oC min-1,
and then the heating rate was switched to 4 oC min-1 from 60 to 250 oC. Onset
temperature and heat of reaction were determined by Pyris software based on the output
data of DSC tests. Each sample was tested three times to establish reproducibility.
27
27
2.5.2 Automatic Pressure Tracking Adiabatic Calorimeter
a. Apparatus description
Automatic Pressure Tracking Adiabatic Calorimeter (APTAC) is an important apparatus
used in this research to perform a calorimetry study. It is an adiabatic closed-cell
reaction calorimeter developed by Arthur D. Little. Because near-adiabatic conditions
are normally achieved by processes in commercial scale, APTAC is very useful in
simulating runaway reactions in real industrial processes. In this research, APTAC is
used to study the impact of process conditions on the reactive hazards of organic
peroxides.
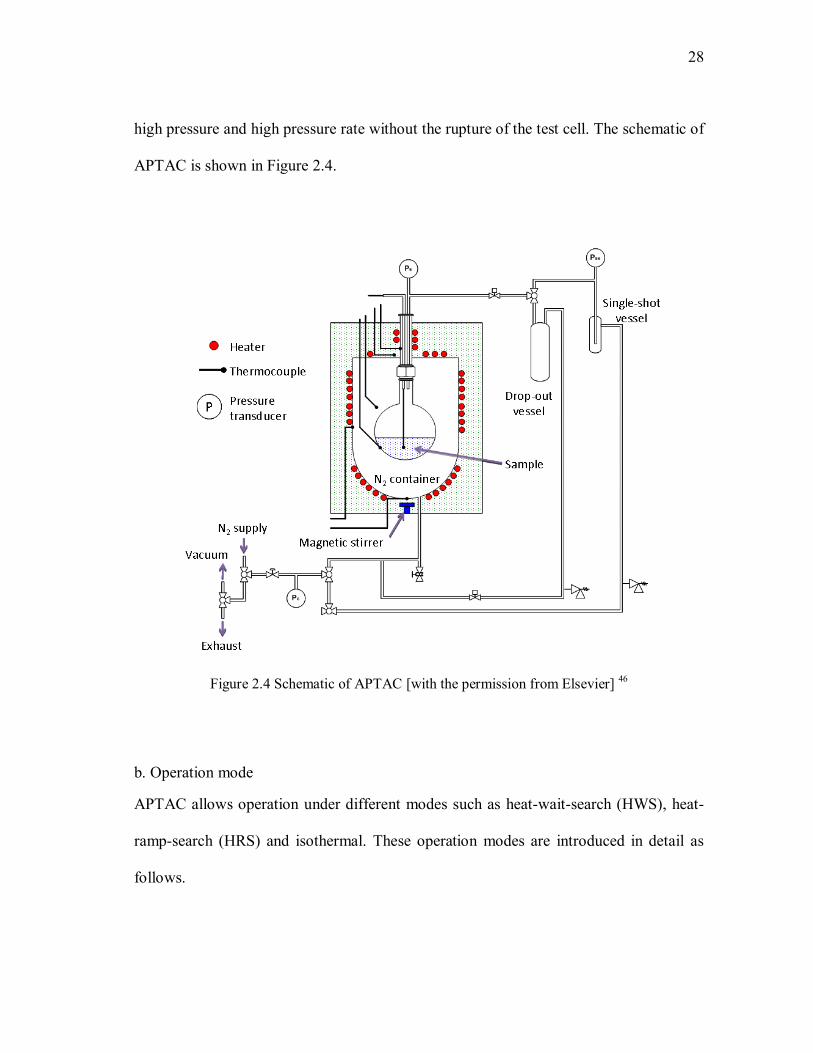
In APTAC, the sample material is placed in a small spherical test cell with a volume of
around 130 ml, which can be made of glass, stainless steel or titanium. This test cell is
surrounded by four main heaters: bottom, top, side, and tube heaters. These heaters can
compensate for the heat loss from the test call and therefore maintain the adiabatic
environment. The heaters and the reaction vessel are insulated and placed in a 500-ml
pressure vessel which can be pressurized up to 2,000 psig. Within the pressure vessel
space, seven type-N thermocouples continuously measure the temperature of four
heaters, nitrogen gas, sample material and the wall of the test cell. This temperature
measurement system enables continuous monitoring and control of adiabatic conditions.
During the test, nitrogen gas is injected into the pressure vessel at a rate sufficient to
keep a low differential pressure (normally less than 10 psi) across the wall of the test
cell. Because of this pressure compensation function, APTAC can be operated under
28
28
high pressure and high pressure rate without the rupture of the test cell. The schematic of
APTAC is shown in Figure 2.4.
Figure 2.4 Schematic of APTAC [with the permission from Elsevier] 46
b. Operation mode
APTAC allows operation under different modes such as heat-wait-search (HWS), heat-
ramp-search (HRS) and isothermal. These operation modes are introduced in detail as
follows.

29
29
Under HWS mode, the sample material is heated in small steps following a predefined
procedure. At each step, when the sample temperature reaches and stabilizes at the target
temperature, the exotherm search is performed. If the self-heating rate of the sample
material exceeds the pre-defined criteria, the heating mode shifts to an adiabatic mode.
After reaching the maximum temperature of the reaction, the HWS mode switches back
for further exotherm search until limits of time or temperature are exceeded where
sample is cooled down to the pre-defined value. The typical temperature and pressure
behaviors under HWS mode are presented in Figure 2.5.
-50.0
50.0
150.0
250.0
350.0
450.0
550.0
0.0
50.0
100.0
150.0
200.0
250.0
0 100 200 300 400 500 600 700
Pre
ssu
re (P
si)
Tem
per
atu
re (ºC
)
Time (min)
Temp
Press
Figure 2.5 Temperature-pressure profiles under HWS mode
30
30
Under heat ramp mode, the sample material is heated at a constant heating rate until the
end temperature is achieved. In isothermal mode, the sample material is heated to the
pre-determined temperature and maintained there until the time limit is reached.
In this research, calorimetry tests were performed under HWS mode to study the impact
of process contaminant on reactive hazards associated with organic peroxides.
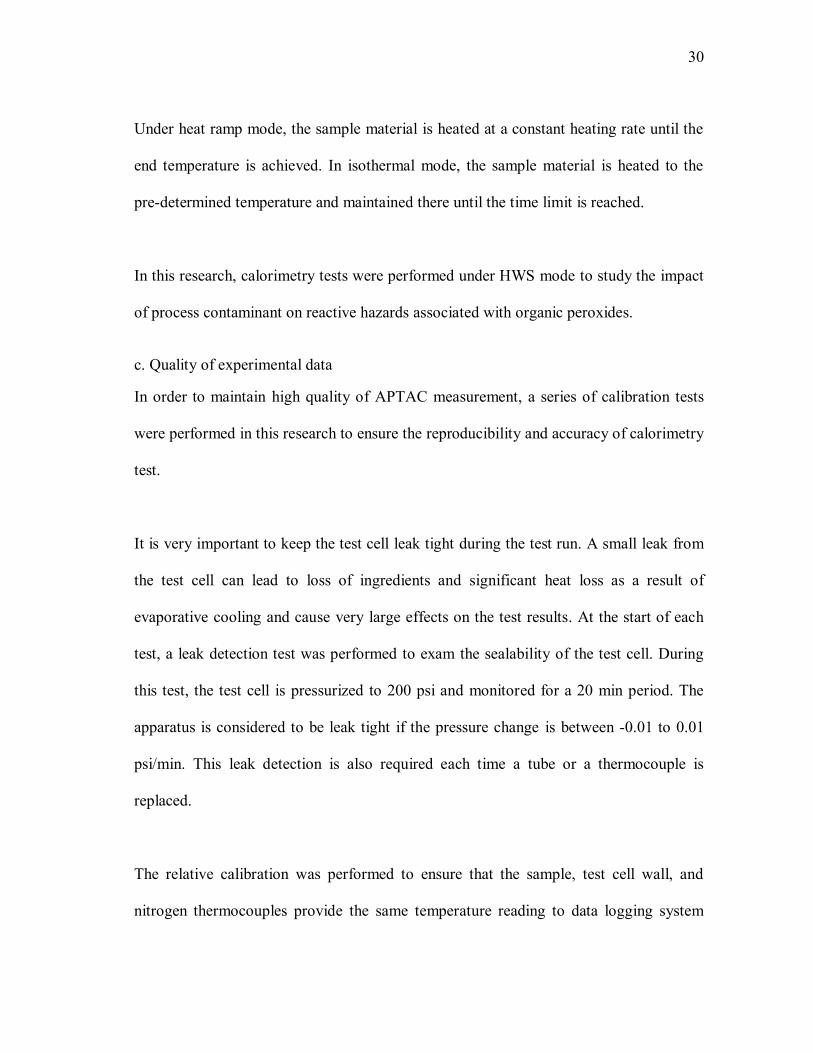
c. Quality of experimental data
In order to maintain high quality of APTAC measurement, a series of calibration tests
were performed in this research to ensure the reproducibility and accuracy of calorimetry
test.
It is very important to keep the test cell leak tight during the test run. A small leak from
the test cell can lead to loss of ingredients and significant heat loss as a result of
evaporative cooling and cause very large effects on the test results. At the start of each
test, a leak detection test was performed to exam the sealability of the test cell. During
this test, the test cell is pressurized to 200 psi and monitored for a 20 min period. The
apparatus is considered to be leak tight if the pressure change is between -0.01 to 0.01
psi/min. This leak detection is also required each time a tube or a thermocouple is
replaced.
The relative calibration was performed to ensure that the sample, test cell wall, and
nitrogen thermocouples provide the same temperature reading to data logging system
31
31
when reaching the same temperature. Any small deviation between these temperature
readings can lead to substantial error. Experience has shown that at modest pressure
within the containment vessel, 1oC temperature difference between nitrogen and sample
thermocouple will lead to a drift rate of about 0.1oC/min 47. This relative calibration test
can minimize the potential for either positive or negative drift when the machine is
running under exotherm search mode.
The relative calibration test was performed using an empty and clean test cell and
operated following the calibration wizard integrated in APTAC control interface. In this
research, the initial pressure in the test cell was set as 500 psi for relative calibration test.
The calibration test started from 50oC and ended at 410oC at the heating rate of 4oC/min.
After completing the calibration, the thermocouple offsets at 50oC intervals between 50
and 400oC were automatically stored. The offsets data were subsequently used by the
control program to adjust the sample thermocouple when running a standard experiment.
Absolute calibration for thermocouple was performed to ensure the accuracy of
temperature reading. In this research, absolute calibration was performed through ice
point check at 0oC, which adjusts the thermocouple zero point by placing the nitrogen,
wall and sample thermocouple in the ice/water mixture.
The pressure transducers were calibrated by measuring the water vapor pressure curve.
This calibration test was performed by heating 50 g pure water in a clean, evacuated test

32
32
cell and then cooled down to the ambient conditions. The experimental pressure curve
was then compared against experimental stem tables in the reference 48.
d. Experimental setup
In this research, in order to avoid any possible contamination, a glass cell was used in
this research as the test cell.
35 wt% MEKPO (diluted in 2,2,4-trimethyl-1,3-pentanediol diisobutyrate) purchased
from the Sigma-Aldrich and 99.999 wt% iron oxide purchased from Acros Organics
were used in this research. The particle size of iron oxide is 100 mesh.
2.6 Calorimetry data analysis
2.6.1 Kinetic modeling
Based on the experimental data obtained from calorimetry test, kinetic modeling was
performed to study the kinetics of runaway reactions, estimate important kinetic
parameters and develop kinetic models which can simulate the runaway reaction process
under various conditions. Two kinetic models were used in this research: nth order
reaction model and autocatalytic reaction model.
a. nth order reaction
Assuming the closed reaction system, constant volume, ideal thermal isolation and
negligible pressure effect, for nth order reaction with single reactant, the reaction rate
can be expressed as follows:

33
33
nkCrdt
dC 2-23
where, k is the reaction rate constant, n is the order of reaction, C is the reactant
contraction at time t.
For an exothermic reaction in an adiabatic environment, it is believed that the conversion
rate is proportional to the temperature increase. Therefore, the following equation can be
obtained.
0
0max
max CTT
TTC
2-24
where, C0 is the initial concentration of the reactant and T0 is the initial temperature of
the reaction system.
Here the maximum adiabatic temperature increase, ΔTad, is defined by Equation 2-25.
0max TTTad 2-25
Heat of reaction can be calculated as a function of ΔTad:
By differentiating Equation 2-24 with respect to t and then combining it with Equation
2-23, the following equation is obtained.
34
34
1
0
max
n
ad
n
ad
CTT
TTk
dt
dT 2-26
This equation can be rearranged as:
n
n
adn
TT
T
dt
dTkCk
max
1
1
0* 2-27
where, k* is a pseudo 0th order rate constant. This equation allows us to calculate k* based
on the data of dT/dt, Tmax, T and ΔTad, which can be obtained from calorimetry tests.
It is known that the reaction rate constant follows Arrhenius equation:
RT
EAk Aexp 2-28
where A is the frequency factor, Ea is the activation energy, and R is the gas constant.
The following equation can be derived by substituting Equation 2-28 into Equation 2-27.
RT
EACk an
1
0log*log 2-29
According to this equation, plotting logk* versus 1/T can yield a straight line. The slope
of the straight line represents Ea/R and its intercept represents log(AC0n-1
). Based on the
slope and intercept, Ea and A can be calculated.

35
35
b. autocatalytic reaction
Autocatalytic reactions are those in which at least one product also serves as a reactant.
This type of reaction can be simply depicted as follows. In this reaction, B is the product
but also acts as the reactant.
BBA 2
According to the experimental observation, the generalized autocatalytic reaction model
was employed for the simple single-stage reaction. The reaction model is shown as
follows 49.
)()1( 21 zkdt
d nn
2-30
where, α is conversion rate, n1 and n2 are reaction orders, z is a constant.
Because the reaction rate is a function of both reactant and product, the reaction rate of
autocatalytic reaction increases with the increase of conversion rate.
2.6.2 Model fitting
Identification of a kinetic reaction model is an important approach in the investigation of
reactive hazards for reactive chemicals. The kinetic reaction model can be used for the
simulation of runaway reactions under various conditions and the estimation of key
safety parameters in process operation.
36
36
Non-linear optimization method is a general approach in selecting the kinetic model and
evaluating kinetic parameters and was employed in this research. This method ensures
the best fit to the experimental data by minimizing the measure of residuals between
experimental and simulated responses. The majority of nonlinear optimization
algorithms are based on the Least Square Method (LSM), which uses the sum of squares
of residuals as the measure. In this research, the following objective function is
employed to perform the model fitting.
)(min),()exp(
2
1)(
2
)(
r
i i
ii PSStPYsimtY
PSS
2-31
where, Yexp(ti) is the experimental observation at time ti, Ysim( P ,ti) is the simulated
response at ti, Ɛ i is the experimental error for the ith observation, SS( P ) is the weighted
sum of the squares of the residuals.
In this research, all the modeling fitting and simulation of runaway reactions was
performed using MATLAB.
2.6.3 Thermal inertia
In the APTAC test, even though the adiabatic environment is maintained for the reaction
system, part of the heat generated by the reaction is used to heat up the test cell. Energy
balance of the system is established to describe the heat loss in calorimeter test
(Equation 2-32).

37
37
measadccssadjadss TCmCmTCm ,, )( 2-32
where, ms is sample mass, Cs is heat capacity of the sample, Cc is heat capacity of test
cell, ∆Tad,meas is measured adiabatic temperature rise of the overall system and ∆Tad,adj:
adjusted adiabatic temperature rise.
Thermal inertia is a term used to describe the property related to thermal conductivity
and volumetric capacity of the test cell, which cause the heat loss in a calorimetry test.
The thermal inertia factor, ф, is defined as:
)(
)()(
ss
ccss
Cm
CmCm
2-33
This factor can be used to perform the conversion between the adiabatic temperature rise
measured and the adjusted adiabatic temperature rise (Equation 2-34). Under perfect
adiabatic condition, ф equals to one, indicating no heat absorption by the test cell. The
more ф approaches 1, the closer the reaction system is to the adiabatic condition.
measadadjad TT ,, 2-34
38
38
The following equation can be derived by rearranging Equation 2-34. This equation can
convert the temperature between systems with different ϕ. By assigning 1 to ϕ2, the
temperature measured by APTAC can be converted to temperature in the adiabatic
condition.
1,1
2
12,2 OO TTTT
2-35
Self heating rate can also be converted to the data in adiabatic condition by applying
thermal inertia factor. Since Equation 2-34 is valid for any time interval, the following
equation can be derived:
measad dt
dT
dt
dT
2-36
where (dT/dt)ad is the self-heating rate in adiabatic condition and (dT/dt)meas is the
measured self-heating rate in calorimetry test.
2.6.4 Non-condensable gas generation
In many cases, the gas generated during the runaway reaction significantly contributes to
the pressure hazards. The non-condensable gas generation rate can be calculated based
on the calorimetry test results.
Normally, when calculating non-condensable gas generation based on the measured
pressure data, the vapor pressure in the reaction system needs to be taken under

39
39
consideration. The vapor pressure for the reaction system can be calculated with the
Antoine equation 50. However, for a runaway reaction, the contribution of vapor pressure
to overall pressure of the reaction system is negligible compared with other factors such
as thermal expansion and gas production. Therefore, in this research, non-condensable
gas generation rate can be calculated using Equation 2-37. This equation estimates the
non-condensable gas generation rate by removing the thermal expansion effect from the
measured overall pressure rate of the reaction system.
dt
dT
T
P
dt
dP
RT
V
dt
dn 2-37

40
40
CHAPTER III
SELECTION OF SAFER REACTIVE CHEMICALS
3.1 Introduction
Selecting the safer chemical is the initial and critical important step in the design of the
intensely safer process. This step is used to ensure that the process is inherently safe
from the perspective of process chemistry. This strategy is an important lessons learned
from Bhopal incident. This incident could be prevented if the alternative manufacturing
process was employed, which does not use methyl isocyanate (MIC) as intermediate 5, 51.
The right process chemistry can eliminate the potential hazards in the conceptual design
stage.
The selection of safer reactive chemical requires the collecting data about the reactive
hazards data and a classification system which can classify reactive chemicals based on
reactive hazards. This selection could cause a lot of work especially when the selection
needs to be made out of a large number of chemicals. Therefore, an efficient and
economic approach is needed to perform the selection of safer reactive chemical, which
can assist the application of ISD principles in the process design.
The common practice for the collection of reactive hazards data is through different
kinds of experiments. However, as mentioned in the Chapter I, the application of this
approach is limited by high investment on test apparatus and lengthy test procedure.

41
41
Since the chemical reactivity is significantly affected by the molecular structure, as the
alternative approach to estimate reactive hazards, investigation was performed in this
research on how to predict hazardous properties of organic peroxides based on the
molecular structure. Compared with the experimental approach, this methodology
requires much less experiment and therefore is a feasible option for the design of
inherently safer process.
A number of early works have already been reported in the field of prediction of
hazardous properties. Rules of thumb are the simplest possible methods for reactivity
screening, which can identify hazardous materials for further analysis. In this method,
chemicals containing functional groups such as nitro group and peroxide functional
group can be considered potentially reactive 52. Also, some programs have been
developed for hazard prediction and screening. CHETAH is a program available from
American Society for Testing and Materials (ASTM). This program employs “Benson
group contribution method” to estimate important hazardous properties such as heat of
formation and heat of combustion 53. CART is a another tool used to estimate adiabatic
temperature rise and to classify chemicals based on this parameter 54. In another work
done by Saraf et al, computational chemistry techniques were combined with Transition
State Theory (TST) for predicting calorimetry data of aromatic nitro compounds 55.
One promising method for estimating reactive hazards is Quantitative Structure-Property
Relationship (QSPR). This method employs statistic methodology to screen molecular

42
42
properties contributing to desired properties and further derive the correlations between
molecular properties and desired properties. Compared with other methods, QSPR can
be customized to integrate any molecular property into the prediction model
development and therefore is more advantageous in predicting complicated properties
such as chemical reactivity. In this research, QSPR was used to reveal the relationships
between molecular structure and runaway reaction at the quantum chemistry level and
develop prediction models for the desired hazardous properties. The models derived in
this research can be used to collect the data of reactive hazards in an efficient way.
Theoretical work has been done to study the molecular structure of organic peroxides
and their effects on desired properties. Such previous work serves as the technical basis
for the QSPR study on organic peroxides. Lobunez et al. studied electric moment of
diacyl peroxides and correlated it with conformational properties 56. Similar work was
done by Verderame et al. on peroxyesters 57. Theoretical calculation was conducted by
Litinskii to study the quantum properties of some organic peroxide including diacyl
peroxides. In his research, some properties such as atomic charge of oxygen in peroxide
functional group were identified to correlate with the stability of organic peroxides 58.
Kikuchi studied electronic structure and conformational structure of benzoyl peroxide
through quantum calculation 59.
In this study, based on the experimental data collected from DSC tests and previous
research on molecular structure of organic peroxides, QSPR study was performed to

43
43
develop prediction models for the hazardous properties of organic peroxides. Different
regression methods were employed in order to achieve the good accuracy of the
prediction results.
After the collection of hazardous properties, a rating system is needed to classify
chemicals according to the reactive hazards. The classification of reactive chemicals can
help industry to select safer chemical from the class with low hazard rating. One popular
rating system for reactive chemical is NFPA 704 60, which rates reactive hazards of
chemicals in the range from 0 to 4. However, this rating system is not suitable for some
chemical families such as organic peroxides. According to the data presented in Table
3.1, even though 2-butanone peroxide and cumene hydroperoxide present great
difference in thermal stability and heat of reaction, they are rated as the same class by
NFPA 704 rating system. This example indicates that NFPA 704 is not sensitive enough
for organic peroxides and a more suitable rating system needs to be developed.
Table 3.1 NFPA rating for selected organic peroxides
Chemical T0 (oC) ΔHr (kJ/mol) NFPA
2-butanone peroxide 87 483 3
Cumene hydroperoxide 170 253 3

44
44
In this research, several types of hazard indices proposed by other researchers were
applied on organic peroxides. The rating results were verified in order to determine the
one most suitable for organic peroxides. By combing this rating system with the
prediction models proposed in this research, this research provides industry an efficient
and economic approach to select safer chemical for the process and offers more
quantitative information for the decision-making during the design of inherently safer
process.
Part of the data in the chapter has been published in Industrial & Engineering Chemistry
Research (volume 50, issue 3).
3.2 Results
3.2.1 Correlation analysis
Before conducting QSPR study on organic peroxides, a correlation analysis was
performed to study the inter-correlation between descriptors. This analysis was used to
identify descriptors highly correlated with others, which were excluded from further
model regression in order to reduce the inter-correlation between explanatory variables.
According to the correlation coefficient (r) calculated, ɛ LUMO and η were excluded from
QSPR study because of their high correlations with other descriptors ( 9.0r ).
45
45
3.2.2 Development of prediction models
a. Onset temperature
All the descriptors listed in Table 2.1 were calculated for 16 organic peroxides using
Gaussian 03 software package and the calculation results were presented in Appendix A.
After excluding those highly correlated descriptors, all the remaining descriptors
selected for the QSPR study of onset temperature were applied to the regression analysis
using MLR and PLS methods.
i). MLR method
Through the MLR analysis, a linear model was obtained for the prediction of the onset
temperature with four descriptors (Equation 3-1). This regression model is a function of
dissociation energy, bond length of the oxygen-oxygen bond, number of peroxide
function group and molecular hardness.
65.819*41.202*70.8*65.657*92.17770 POOa NdET 3-1
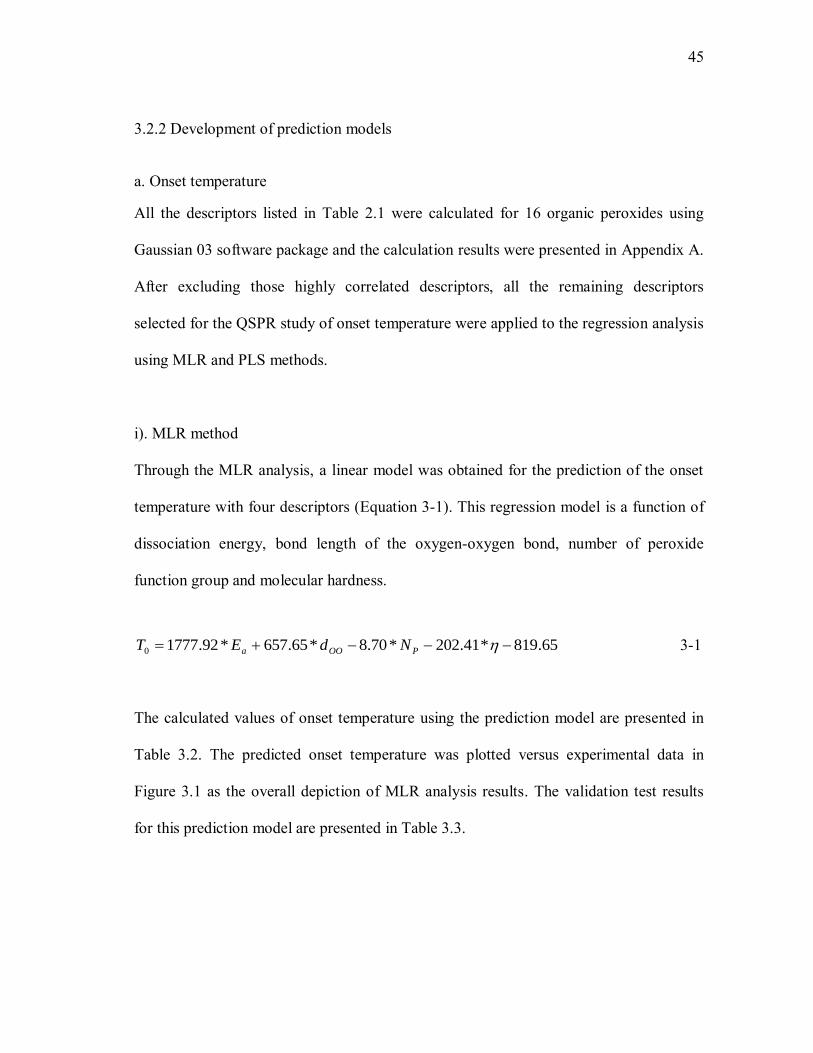
The calculated values of onset temperature using the prediction model are presented in
Table 3.2. The predicted onset temperature was plotted versus experimental data in
Figure 3.1 as the overall depiction of MLR analysis results. The validation test results
for this prediction model are presented in Table 3.3.

46
46
Figure 3.1 Scattering diagram for experimental and calculated onset temperature using MRL model
According to the data presented in Figure 3.1 and Table 3.3, the prediction model
derived using MLR method presents a pretty good linear fitting with the experimentally
detected onset temperature with R2 value of 0.916. This model is also proven to be
statistically significant according to the F value. However, the cross validation test result
(RCV2=0.108) indicates that this model is quite weak in prediction power. This low
prediction power implies the existence of over-fitting phenomena in MLR analysis.
Over-fitting normally occurs when the model is very complex, such as employing too
many parameters relative to the number of observations. In the case of over-fitting, the
regression model describes random error rather than the underlying relationship. In this

47
47
research, the over-fitting phenomena should be caused by the relatively large number of
descriptors (13 descriptors) compared to the limited training set size (16 data).
Therefore, the model obtained using MLR method cannot be used in predicting the onset
temperature of organic peroxides due to the poor prediction power.
Table 3.2 Experimental and calculated onset temperature of organic peroxides
No. Substance T0
(experimental) (ºC)
T0 (predicted) (ºC)
MLR PLS
1 Tert-butyl cumyl peroxide 150.3 145.7 145.0
2 Dicumyl peroxide 140.8 145.3 143.0
3 Di-tert-butyl peroxide 139.7 141.6 145.9
4 Benzoyl peroxide 105.9 104.5 106.4
5 Lauroy peroxide 87.0 92.2 90.0
6 Tert-butylperoxy benzoate 122.7 124.0 125.0
7 Tert-butyl peroxyacetate 101.6 116.0 106.6
8 11-bis(t-butylperoxy)-335-timethylclohexane 118.7 119.4 125.4
9 2,2-Bis(t-butylperoxy)butane 123.2 120.6 119.0
10 2,5-Bis(t-butylperoxy)-2,5-dimethylhexane 136.7 132.8 132.5
11 2,4-Pentanedione peroxide 117.3 117.4 114.7
12 Cumene hydroperoxide 169.9 168.2 171.4
13 Tert-butyl(peroxy 2-ethyl-hexyl) carbonate 125.2 106.3 113.7
14 1,1-Di(tert-butylperoxy)cyclohexane 121.2 120.4 118.0
15 2-butanone peroxide 87.2 90.6 90.6
16 Tert-butyl hydroperoxide 156.3 159.1 156.6

48
48
Table 3.3 Validation of the prediction model for onset temperature
R R2 RCV
2 F
MLR 0.957 0.916 0.108 29.932
PLS 0.978 0.957 0.859 -
ii). PLS method
As presented in the Section 2.2.3b, PLS method is pretty useful in handling the case with
the large number of x variables and relative small training set size. Therefore, a
mathematic regression was performed again using PLS method to derive the prediction
model for onset temperature. Following the procedure presented in Figure 2.2, the final
prediction model was obtained after several iterations when RCV2 cannot be further
improved (Equation 3-2). This prediction model is composed of all 13 descriptors
employed in the regression analysis. The calculated onset temperature is listed in Table
3.2 and plotted against experimental data in Figure 3.2. The results of the validation test
are presented in Table 3.3.
61.626*58.23*73.2*01.118*
75.202*82.3*11.0*30.3*04.0
*08.0*35.5*72.29*18.730*99.55
'
0
C
DMMW
OBNdEQT
HOMO
ROOROOR
POOaO
3-2
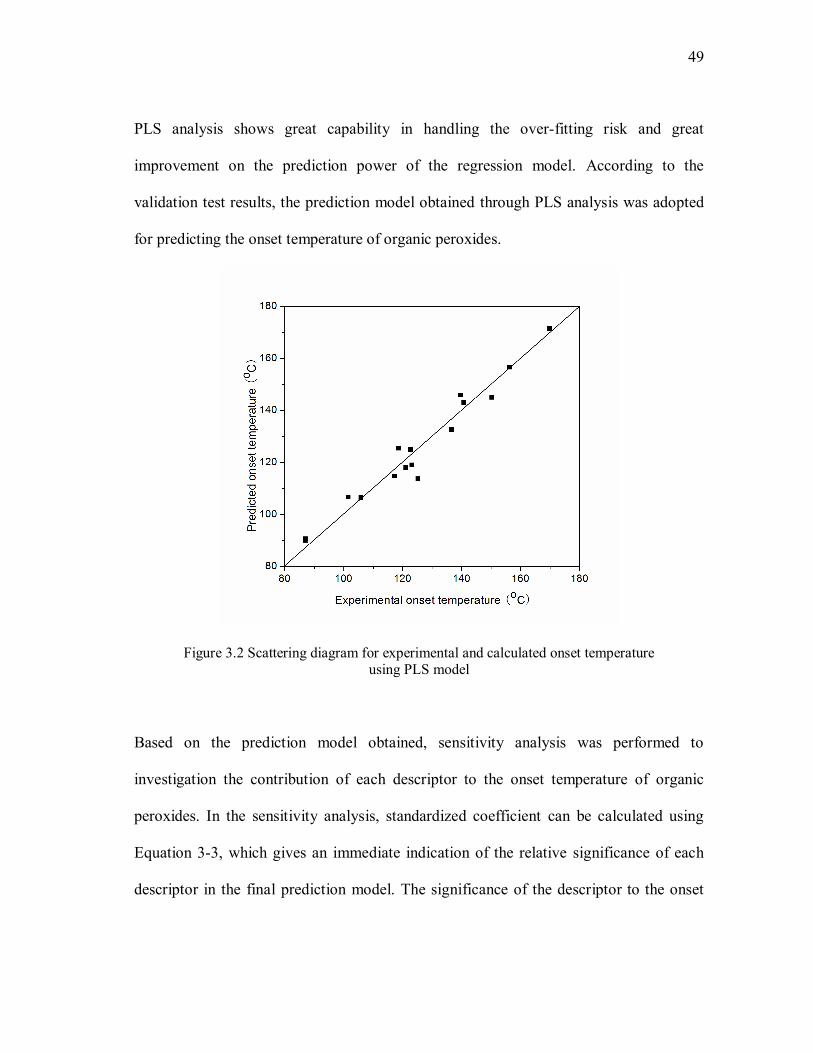
The prediction model derived using PLS method shows a good agreement with the
experimental data (R2=0.957). Also, this model presents adequate prediction power
according to cross validation test results (RCV2=0.859). Compared with MLR method,
49
49
PLS analysis shows great capability in handling the over-fitting risk and great
improvement on the prediction power of the regression model. According to the
validation test results, the prediction model obtained through PLS analysis was adopted
for predicting the onset temperature of organic peroxides.
Figure 3.2 Scattering diagram for experimental and calculated onset temperature using PLS model
Based on the prediction model obtained, sensitivity analysis was performed to
investigation the contribution of each descriptor to the onset temperature of organic
peroxides. In the sensitivity analysis, standardized coefficient can be calculated using
Equation 3-3, which gives an immediate indication of the relative significance of each
descriptor in the final prediction model. The significance of the descriptor to the onset

50
50
temperature is proportional to the absolute vale of standardized coefficient. According to
the calculated standardized coefficients listed in Table 3.4, out of the 13 descriptors,
bond angle in the peroxide functional group and dissociation energy of oxygen-oxygen
bond are two most significant factors contributing to onset temperature.
nn XAXAXAAY 22110
i
y
x
i AB i
3-3
Table 3.4 Sensitivity analysis of the onset temperature prediction model obtained through PLS analysis
Descriptor Coefficient Standardized coefficient
QO 55.987 0.158
Ea 730.178 0.358
dOO -29.723 -0.019
NP -5.349 -0.142
OB -0.086 -0.145
MW -0.035 -0.113
DM 3.301 0.108
∠ROOR’ 0.107 0.121
∠ROO -3.824 -0.315
ɛ HOMO 202.752 0.173
η -118.013 -0.144
ω -2.735 -0.002
C 23.580 0.233

51
51
b. Heat of reaction
Similarly, QSPR study was performed on heat of reaction of organic peroxides by using
both MLR and PLS methods. Besides the highly correlated descriptors, concentration of
organic peroxides, the descriptor specifically designed for onset temperature, was
excluded in the QSPR study on heat of reaction.
i). MLR
Through mathematic regression using MLR method, the prediction model for heat of
reaction was obtained and shown as follows:
1.1178*62.0*42.74*66.11153*53.1952 MWNEQH Paor 3-4 This model is a linear combination of four descriptors: dissociation energy of oxygen-
oxygen bonds, number of peroxide functional groups, atomic charge of oxygen and
molecular weight. These descriptors were identified as significant factors contributing to
the heat of reaction by MLR analysis. Table 3.5 lists all the calculated heat of reaction
for organic peroxide, which were plotted against the experimental data in Figure 3.3.
The results of validation tests for this model are shown in Table 3.6.

52
52
Table 3.5 Experimental and predicted heat of reaction of organic peroxides
No. Substance ΔHd
(Experimental) ( kJ/mol)
ΔHd (Predicted) ( kJ/mol)
MLR PLS
1 Tert-butyl cumyl peroxide -177.6 -202.1 -219.2
2 Dicumyl peroxide -223.9 -244.0 -283.4
3 Di-tert-butyl peroxide -158.3 -149.6 -155.1
4 Benzoyl peroxide -90.0 -87.8 -136.2
5 Lauroy peroxide -305.4 -353.0 -316.2
6 Tert-butylperoxy benzoate -239.1 -190.5 -178.9
7 Tert-butyl peroxyacetate -200.8 -180.5 -158.5
8 11-bis(t-butylperoxy)-335-timethylclohexane -426.9 -412.2 -407.4
9 2,2-Bis(t-butylperoxy)butane -308.4 -321.4 -317.8
10 2,5-Bis(t-butylperoxy)-2,5-dimethylhexane -296.5 -264.4 -291.2
11 2,4-Pentanedione peroxide -664.4 -637.7 -698.3
12 Cumene hydroperoxide -253.2 -195.7 -199.9
13 Tert-butyl(peroxy 2-ethyl-hexyl) carbonate -236.1 -276.7 -242.6
14 1,1-Di(tert-butylperoxy)cyclohexane -427.2 -356.1 -342.6
15 2-butanone peroxide -483.3 -535.7 -466.8
16 Tert-butyl hydroperoxide -64.7 -148.4 -142.0
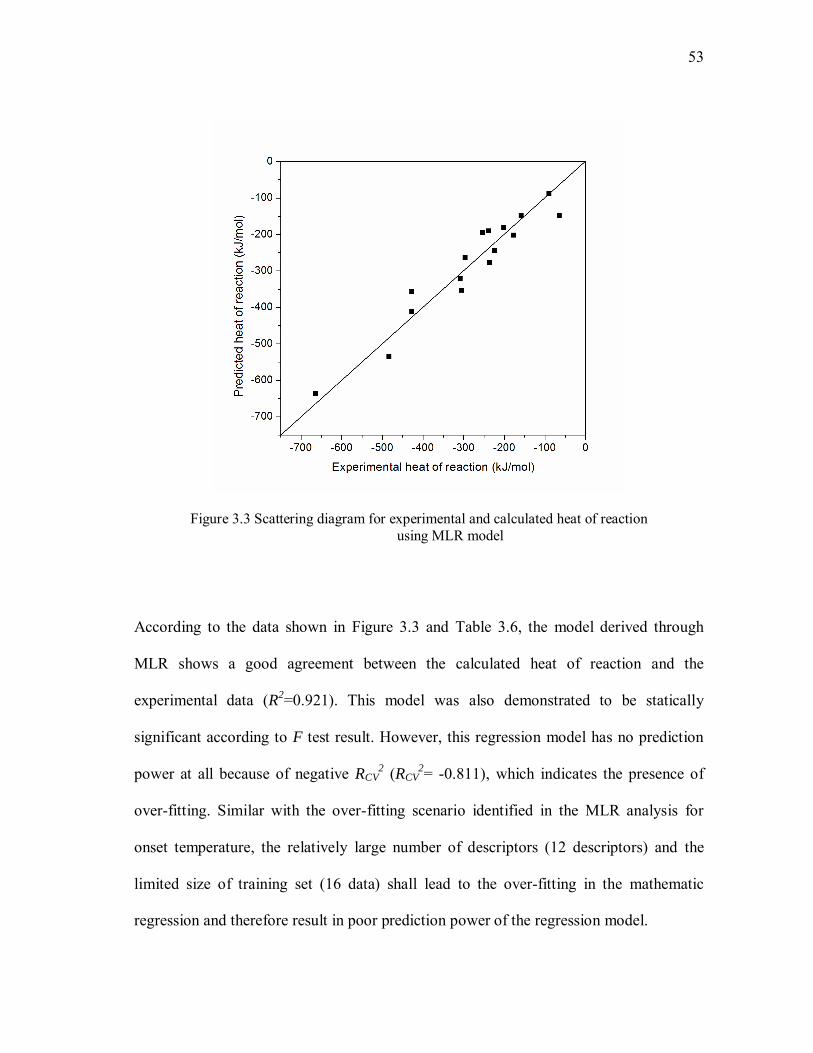
53
53
Figure 3.3 Scattering diagram for experimental and calculated heat of reaction using MLR model
According to the data shown in Figure 3.3 and Table 3.6, the model derived through
MLR shows a good agreement between the calculated heat of reaction and the
experimental data (R2=0.921). This model was also demonstrated to be statically
significant according to F test result. However, this regression model has no prediction
power at all because of negative RCV2 (RCV
2= -0.811), which indicates the presence of
over-fitting. Similar with the over-fitting scenario identified in the MLR analysis for
onset temperature, the relatively large number of descriptors (12 descriptors) and the
limited size of training set (16 data) shall lead to the over-fitting in the mathematic
regression and therefore result in poor prediction power of the regression model.

54
54
Table 3.6 Validation of the regression model for heat of reaction
R R2 RCV
2 F
MLR 0.916 0.921 -0.811 20.815
PLS 0.956 0.913 0.828 -
ii). PLS method
Following the proposed procedure for PLS shown in Figure 2.2, a model with optimized
RCV2 was derived for predicting heat of reaction of organic peroxides using PLS method.
This prediction model is a linear combination (Equation 3-5) of five descriptors,
including dissociation energy of oxygen-oxygen bond, molecular weight, oxygen
balance, energy of the highest occupied molecular orbital, and atomic charge of oxygen.
The predicted heat of reaction was presented in Table 3.5 and plotted versus
experimental data in Figure 3.4. The validation test results are presented in Table 3.6.
625.1893*034.2400
*210.1*450.1*592.8722*721.1713
HOMO
aOr MWOBEQH
3-5
As depicted by Table 3.6 and Figure 3.4, the heat of reaction predicted using PLS
method satisfactorily fits the experimental data with R2 of 0.913. This prediction model
presents a reasonable predictive power with RCV2 of 0.828, which is much better than
that of the model derived through MLR analysis. Based on the consideration of model

55
55
fitting and prediction performance, the model obtained through PLS analysis is
recommended in predicting the heat of reaction of organic peroxides.
Figure 3.4 Scattering diagram for experimental and calculated heat of reaction using PLS model
Sensitivity analysis was subsequently performed to study the significance of descriptors
in the prediction model. The standardized coefficient of all descriptors were calculated
and listed in Table 3.7. According to the data of standardized coefficient, atomic charge
of oxygen in the peroxide functional group and activation energy are most significant

56
56
descriptors contributing to heat of reaction. The atomic charge of oxygen presents
negative impact to the heat of reaction due to the negative standardized coefficient.
Table 3.7 Sensitivity analysis of the heat of reaction prediction model obtained through PLS analysis
Descriptor Coefficient Standardized coefficient
QO -1713.721 -0.732 Ea 8722.592 0.646 OB -1.450 -0.372 MW -1.210 -0.590
ɛ HOMO -2400.034 -0.309
3.2.3 Discussion
By comparing the prediction models obtained through QSPR approach, onset
temperature was found to be a hazardous property more related to the molecular
structure of organic peroxides. The involvement of all 13 descriptors in the prediction
model for onset temperature implies that all these molecular properties affect the onset
temperature of organic peroxides. Compared with onset temperature, heat of reaction is
less influenced by the molecular structure since only 5 descriptors get involved in the
prediction model. This phenomenon can be explained by the fact that heat of reaction
depends more on the reaction route rather than the molecular structure of the initial sate.
57
57
Some descriptors are recognized as significant properties contributing to the reactive
hazards of organic peroxides. Dissociation energy of oxygen-oxygen bond is one of the
most significant descriptors for onset temperature as well as heat of reaction prediction
models. This parameter indicates the easiness of undertaking the initial step of the
runaway reaction and is expect to greatly affect the thermal stability of organic
peroxides. Also, this result is in agreement with previous study on energetic materials,
which reported that heat of reaction is affected by the C-NO2 bond dissociation energy
24. The bond angle in peroxide functional group was identified by sensitivity analysis as
the second most important descriptor for onset temperature. The importance of bond
angle for onset temperature indicates the impact of molecular geometry on the thermal
stability of organic peroxides. Another important descriptor for onset temperature is
concentration, which is a non-intrinsic descriptor specifically designed for onset
temperature of organic peroxide. Sensitivity analysis determines that this descriptor
presents positive impact on onset temperature according to its standardized coefficient
(0.233). However, this conclusion is not consistent with the previous research results,
which found that a concentration increase can lead to a decrease of the onset temperature
28, 29. The possible explanation for this conflict is that the effect of concentration
identified in previous research was neglected in this QSPR study due to its limited
influence on onset temperature. It is possible that the concentration effect on onset
temperature identified in the this research indicates the intramolecular association
between peroxide molecules, which is positive for the thermal stability of organic
peroxides 61.

58
58
In most cases, validation of the regression model using external data is recommended in
order to ensure the prediction power of the model. However, given the fact that the data
of reactive hazards are only available for 16 organic peroxides, it is really difficult to
divide the data into the test set and training set. In fact, the main difficulty for
performing QSPR study on reactive chemicals is the availability of experimental data.
As the alternative approach, cross-validation can handle this challenge by using internal
data and has been widely used in the field of QSPR research 24, 62. In this research, the
cross-validation test was employed and the RCV2 was used to quantitatively estimate the
prediction power of the prediction models derived.
3.2.4 Hazard classification system
As mentioned in the introduction part of Chapter III, the selection of the safer reactive
chemicals not only requires the collection of reactive hazards data but also needs a
classification system based on reactive hazards. This classification system enables the
more quantitative ranking of chemicals according to their reactive hazards, especially
when multiple safety parameters need to be taken under consideration. Based on the
classification results, industry can decide which chemicals to employ in the processes,
which makes the process chemistry inherently safe.

59
59
In this research, three different hazard indices were employed to classify organic
peroxides based on the reactive hazards data. The description of these hazard indices are
presented in Section 2.4. These hazard indices were developed based on different
concept and through different approaches. The classification results were then verified in
this research in order to determine the one which is most suitable for the family of
organic peroxides.
Using kinetic equations listed in Section 2.4, parameters used in the hazard indices were
calculated and presented in Table 3.8. The application of these kinetic equations can
avoid the requirement of additional experiments.
By applying calculated parameters to the hazard indices, the rating results for 16 organic
peroxides using these three hazard indices were calculated and presented in Table 3.9
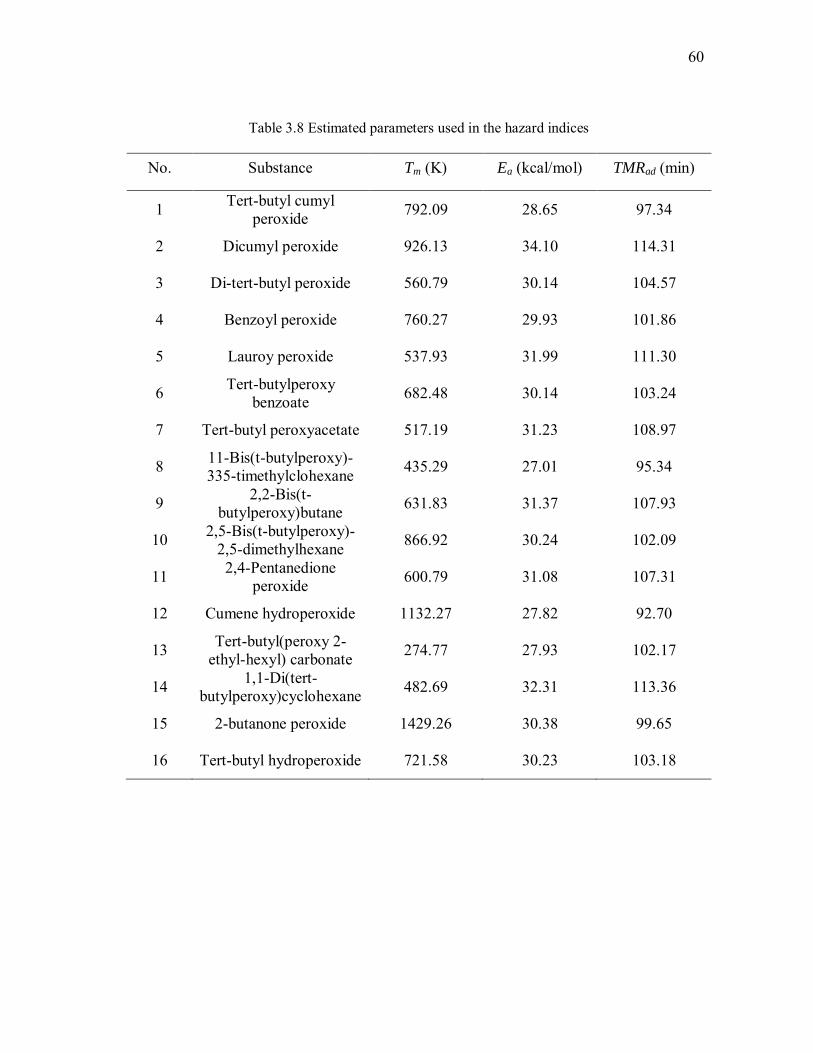
60
60
Table 3.8 Estimated parameters used in the hazard indices
No. Substance Tm (K) Ea (kcal/mol) TMRad (min)
1 Tert-butyl cumyl peroxide 792.09 28.65 97.34
2 Dicumyl peroxide 926.13 34.10 114.31
3 Di-tert-butyl peroxide 560.79 30.14 104.57
4 Benzoyl peroxide 760.27 29.93 101.86
5 Lauroy peroxide 537.93 31.99 111.30
6 Tert-butylperoxy benzoate 682.48 30.14 103.24
7 Tert-butyl peroxyacetate 517.19 31.23 108.97
8 11-Bis(t-butylperoxy)-335-timethylclohexane 435.29 27.01 95.34
9 2,2-Bis(t-butylperoxy)butane 631.83 31.37 107.93
10 2,5-Bis(t-butylperoxy)-2,5-dimethylhexane 866.92 30.24 102.09
11 2,4-Pentanedione peroxide 600.79 31.08 107.31
12 Cumene hydroperoxide 1132.27 27.82 92.70
13 Tert-butyl(peroxy 2-ethyl-hexyl) carbonate 274.77 27.93 102.17
14 1,1-Di(tert-butylperoxy)cyclohexane 482.69 32.31 113.36
15 2-butanone peroxide 1429.26 30.38 99.65
16 Tert-butyl hydroperoxide 721.58 30.23 103.18
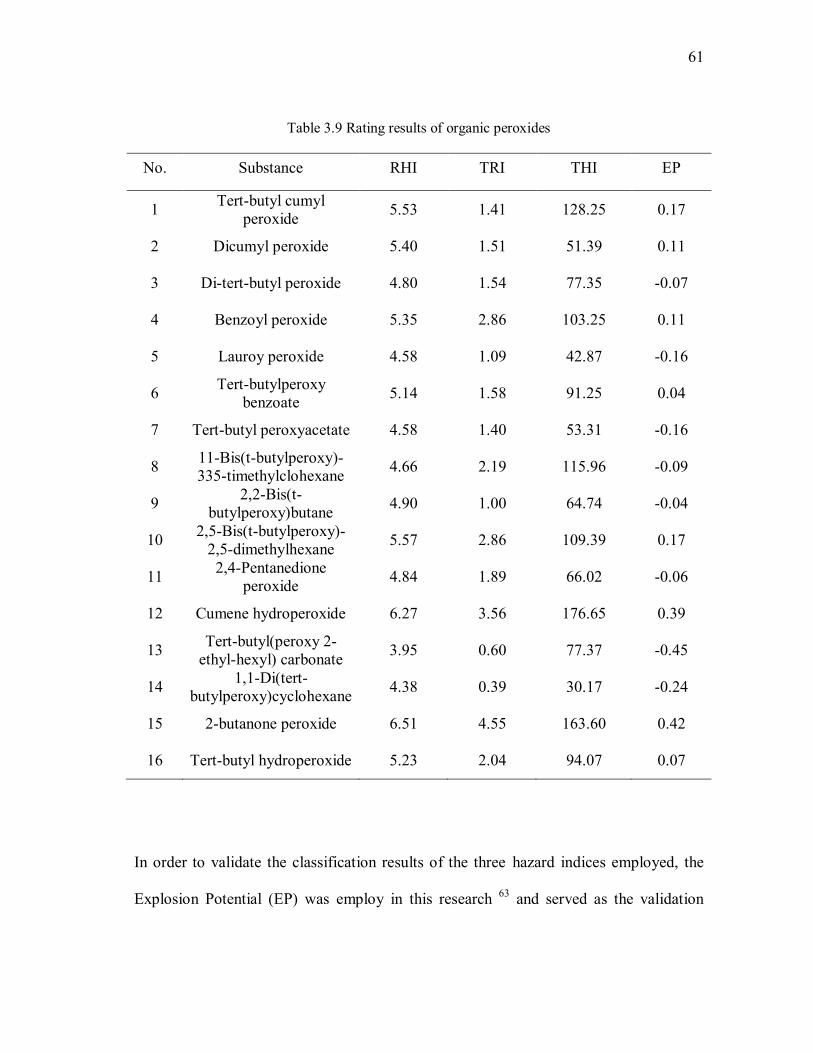
61
61
Table 3.9 Rating results of organic peroxides
No. Substance RHI TRI THI EP
1 Tert-butyl cumyl peroxide 5.53 1.41 128.25 0.17
2 Dicumyl peroxide 5.40 1.51 51.39 0.11
3 Di-tert-butyl peroxide 4.80 1.54 77.35 -0.07
4 Benzoyl peroxide 5.35 2.86 103.25 0.11
5 Lauroy peroxide 4.58 1.09 42.87 -0.16
6 Tert-butylperoxy benzoate 5.14 1.58 91.25 0.04
7 Tert-butyl peroxyacetate 4.58 1.40 53.31 -0.16
8 11-Bis(t-butylperoxy)-335-timethylclohexane 4.66 2.19 115.96 -0.09
9 2,2-Bis(t-butylperoxy)butane 4.90 1.00 64.74 -0.04
10 2,5-Bis(t-butylperoxy)-2,5-dimethylhexane 5.57 2.86 109.39 0.17
11 2,4-Pentanedione peroxide 4.84 1.89 66.02 -0.06
12 Cumene hydroperoxide 6.27 3.56 176.65 0.39
13 Tert-butyl(peroxy 2-ethyl-hexyl) carbonate 3.95 0.60 77.37 -0.45
14 1,1-Di(tert-butylperoxy)cyclohexane 4.38 0.39 30.17 -0.24
15 2-butanone peroxide 6.51 4.55 163.60 0.42
16 Tert-butyl hydroperoxide 5.23 2.04 94.07 0.07
In order to validate the classification results of the three hazard indices employed, the
Explosion Potential (EP) was employ in this research 63 and served as the validation
62
62
criteria. This is an empirically derived parameter used to separate compounds that can
undergo detonation or deflagration. The definition of EP is shown by Equation 3-6.
67.1)25log(38.0)log( DSCDSC TQEP 3-6
where QDSC and TDSC are heat of reaction and onset temperature of the exothermic
reaction.
Materials with EP > 0 are considered to have potential to explode, either by detonation
or deflagration. Therefore, if the hazard index can effectively classify reactive
chemicals, organic peroxides with positive EP should have higher rating than organic
peroxides with negative EP. In this study, EP is used to validate the effectiveness of
different hazard indices and finally determine which one is most effective in rating
organic peroxides according to reactive hazards.

63
63
y = 2.9747x + 5.0666
R² = 0.9814
3
3.5
4
4.5
5
5.5
6
6.5
7
-0.6 -0.4 -0.2 0 0.2 0.4 0.6
RH
I
EP
a. RHI
y = 4.1571x + 1.8498
R² = 0.7126
0
0.5
1
1.5
2
2.5
3
3.5
4
4.5
5
-0.6 -0.4 -0.2 0 0.2 0.4 0.6
TR
I
EP
b. TRI Figure 3.5 Validation of hazard index for organic peroxides

64
64
y = 143.1x + 88.474
R² = 0.5903
0
20
40
60
80
100
120
140
160
180
-0.6 -0.4 -0.2 0 0.2 0.4 0.6
TH
I
EP
c. THI
Figure 3.5 Continued
Three hazard indices were plotted against EP respectively to evaluate the effectiveness
of the classification of organic peroxides based on the reactive hazards (Figure 3.5). The
plot of hazard index against EP indicates that only RHI has the good linear relationship
with EP and can effectively classify organic peroxides based on reactive hazards. As
shown in Figure 3.5a, organic peroxides with potential of explosion (EP>0) have higher
rating than peroxide with no potential of explosion (EP<0). But for other two hazard
indices (Figure 3.5b and 3.5c), they cannot well distinguish peroxides with the potential
of explosion from other chemicals: some organic peroxides with negative EP have even
higher rating than chemicals with positive EP. According to the validation results, RHI is
determined to be the hazard index most suitable for organic peroxides.
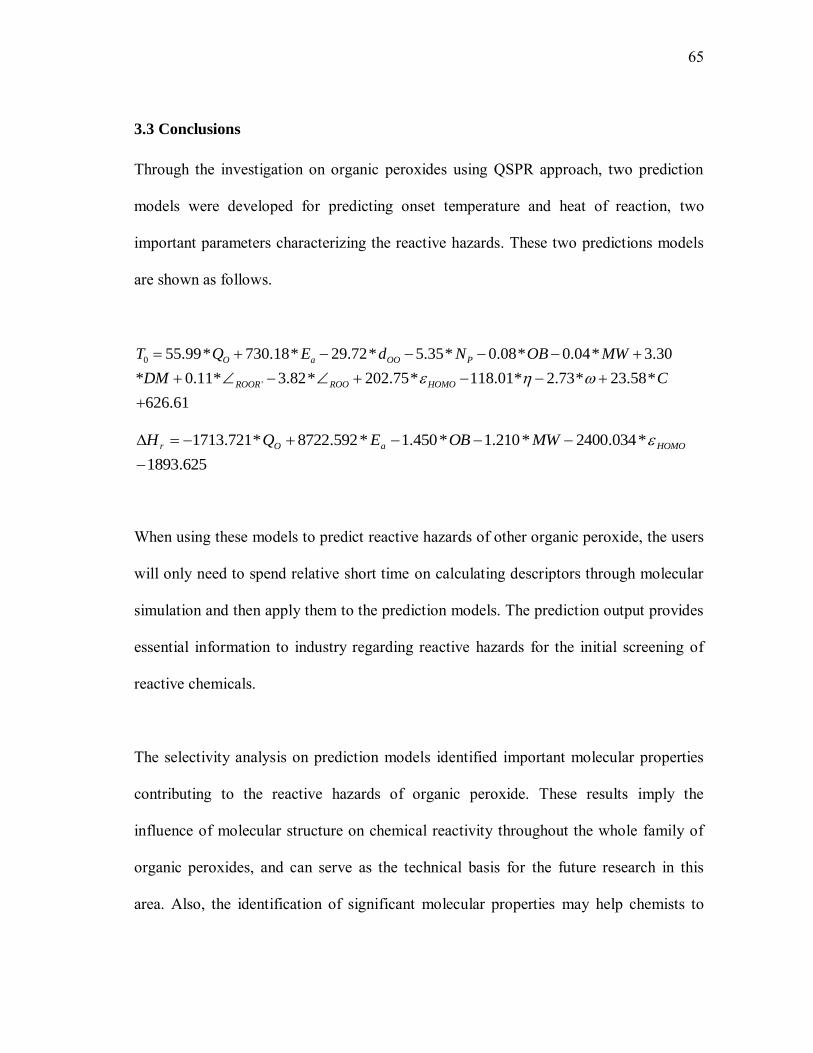
65
65
3.3 Conclusions
Through the investigation on organic peroxides using QSPR approach, two prediction
models were developed for predicting onset temperature and heat of reaction, two
important parameters characterizing the reactive hazards. These two predictions models
are shown as follows.
0
'
55.99* 730.18* 29.72* 5.35* 0.08* 0.04* 3.30
* 0.11* 3.82* 202.75* 118.01* 2.73* 23.58*
626.61
O a OO P
ROOR ROO HOMO
T Q E d N OB MW
DM C
625.1893
*034.2400*210.1*450.1*592.8722*721.1713
HOMOaOr MWOBEQH
When using these models to predict reactive hazards of other organic peroxide, the users
will only need to spend relative short time on calculating descriptors through molecular
simulation and then apply them to the prediction models. The prediction output provides
essential information to industry regarding reactive hazards for the initial screening of
reactive chemicals.
The selectivity analysis on prediction models identified important molecular properties
contributing to the reactive hazards of organic peroxide. These results imply the
influence of molecular structure on chemical reactivity throughout the whole family of
organic peroxides, and can serve as the technical basis for the future research in this
area. Also, the identification of significant molecular properties may help chemists to

66
66
find a direction in the design of safer chemicals. It is possible that chemists may
manipulate these molecular properties to minimize the reactive hazards associated.
In this research RHI was determined to be the most suitable hazard index for organic
peroxides. This hazard index can be applied in conjunction with the predictions models
derived: RHI can utilize the reactive hazards data generated by prediction models to rate
reactive chemicals according to reactive hazards associated. The output of this rating
system provides a quantitative technical basis to support the decision-making on
chemical selection during the design of inherently safer process.
67
67
CHAPTER IV
DETERMINATION OF SAFER PROCESS CONDITIONS
4.1 Introduction
“Moderate” is another major principle in the design of inherently safer process. After
selecting the safer chemicals for the process, it is also important to adopt the safer
process conditions to further mitigate the risk associated with the process. The process
may still face high risk if it is operated under improper process conditions, even if the
safer chemicals are employed in the process. In this part of research, process
contaminant, a very important process condition, was investigated. Contaminants in the
process may significantly affect the reactive hazards associated with processes by trace
amount. Therefore, when designing inherently safer process, it is critical important to
identify the incompatibility of possible contaminants with reactive chemicals employed
in the process and estimate the effects of contaminants on the reactive hazards. Based on
the research results, proper measures can be applied to control the risk imposed by the
incompatibility of contaminants with reactive chemicals.
In this research, the incompatibility of iron oxide with Methyl Ethyl Ketone Peroxide
(MEKPO) was investigated. MEKPO is a type of organic peroxide widely used as
initiator for polymerization reaction and hardener in glass-reinforced plastic manufacture
64. The chemical structure of MEKPO is shown by Figure 4.1. MEKPO is highly
hazardous and has caused several tragic accidents throughout the world. One incident

68
68
happened in Tokyo, Japan in 1964, which caused 19 fatalities and 114 injuries. Another
more severe incident happened in Taiwan in 1979, leading to 33 fatalities and 44 injuries
65.
Figure 4.1 Chemical structure of MEKPO
Iron oxide is one of the most common contaminants in process industries. This
contaminant has been proven to be incompatible with a variety of reactive chemicals 66-
68. Even though industry has realized that all materials organic peroxides come in contact
with in the process should be compatible 69, little work has been done to study the
incompatibility of MEKPO with iron oxide, a very common process contaminant.
Tseng studied the incompatibility of MEKPO with iron oxide through calorimetry test
and found iron oxide can weaken the thermal stability of MEKPO 70. However, there is
still a gap between the existing understanding on this incompatibility and the need to
apply the principle “moderate” in the process design. First, Tseng only performed
69
69
calorimetry test under single contaminant concentration. Therefore, it is still beyond our
understanding how this contaminant affects reactive hazards of MEKPO within a wide
range of contaminant concentration. Second, in previous research, reactive hazards of
MEKPO were investigated through DSC test under constant heating rate, whose purpose
is to conduct initial screening of reactive chemicals. The information obtained from DSC
tests is not enough for guiding the design of inherently safer process. Third, the impact
of this incompatibility on operational safety was not investigated in previous research.
In order to address this gap and provide better guidance on the design of inherently safer
process, the incompatibility of MEKPO with iron oxide was studied through a
systematic approach in this research. This approach is composed of calorimetry test,
kinetic modeling and analysis of key safety parameters. Through this research, it was
expected to reach the comprehensive understanding on the incompatibility of MEKPO
with iron oxide, including the effects on observable exothermic behavior, change on
kinetics and change on reaction mechanism. Then, based on this understanding, the
impact of the contaminant on operational safety was investigated by estimating and
analyzing key safety parameters.
Based on the conclusions drawn in this research, proper measures can be implemented in
the process design to minimize the hazards associated with processes. For example, if
iron oxide has little or no impact on the reactive hazards and operational safety, then
process equipment handling MEKPO can be fabricated by carbon steel. In this case,
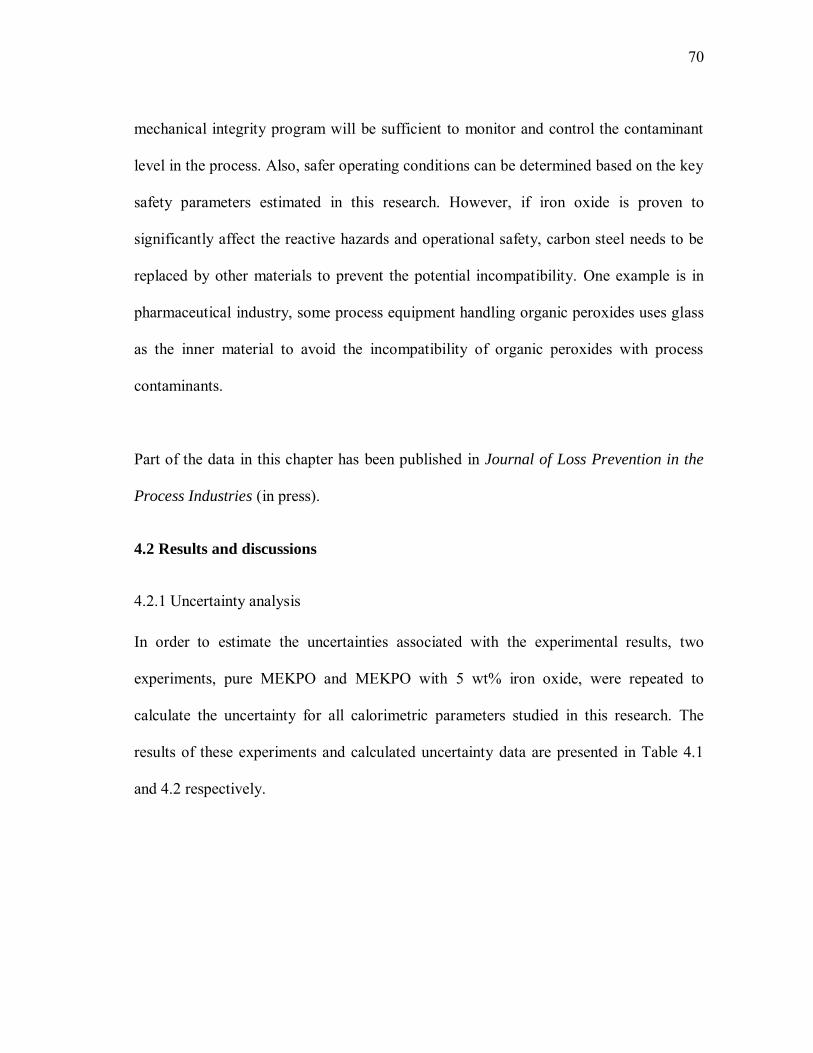
70
70
mechanical integrity program will be sufficient to monitor and control the contaminant
level in the process. Also, safer operating conditions can be determined based on the key
safety parameters estimated in this research. However, if iron oxide is proven to
significantly affect the reactive hazards and operational safety, carbon steel needs to be
replaced by other materials to prevent the potential incompatibility. One example is in
pharmaceutical industry, some process equipment handling organic peroxides uses glass
as the inner material to avoid the incompatibility of organic peroxides with process
contaminants.
Part of the data in this chapter has been published in Journal of Loss Prevention in the
Process Industries (in press).
4.2 Results and discussions
4.2.1 Uncertainty analysis
In order to estimate the uncertainties associated with the experimental results, two
experiments, pure MEKPO and MEKPO with 5 wt% iron oxide, were repeated to
calculate the uncertainty for all calorimetric parameters studied in this research. The
results of these experiments and calculated uncertainty data are presented in Table 4.1
and 4.2 respectively.
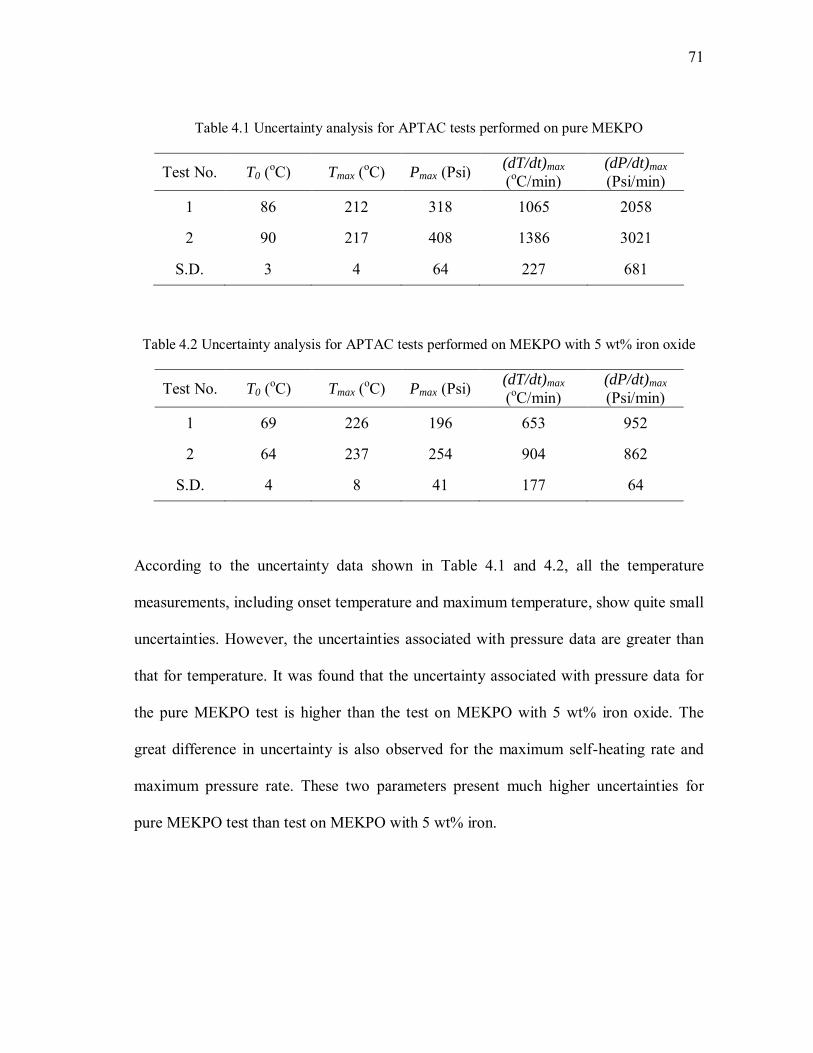
71
71
Table 4.1 Uncertainty analysis for APTAC tests performed on pure MEKPO
Test No. T0 (oC) Tmax (oC) Pmax (Psi) (dT/dt)max (oC/min)
(dP/dt)max (Psi/min)
1 86 212 318 1065 2058
2 90 217 408 1386 3021
S.D. 3 4 64 227 681
Table 4.2 Uncertainty analysis for APTAC tests performed on MEKPO with 5 wt% iron oxide
Test No. T0 (oC) Tmax (oC) Pmax (Psi) (dT/dt)max (oC/min)
(dP/dt)max (Psi/min)
1 69 226 196 653 952
2 64 237 254 904 862
S.D. 4 8 41 177 64
According to the uncertainty data shown in Table 4.1 and 4.2, all the temperature
measurements, including onset temperature and maximum temperature, show quite small
uncertainties. However, the uncertainties associated with pressure data are greater than
that for temperature. It was found that the uncertainty associated with pressure data for
the pure MEKPO test is higher than the test on MEKPO with 5 wt% iron oxide. The
great difference in uncertainty is also observed for the maximum self-heating rate and
maximum pressure rate. These two parameters present much higher uncertainties for
pure MEKPO test than test on MEKPO with 5 wt% iron.

72
72
Through the analysis on the working mechanism of APTAC, it is believed that the
uncertainties associated with the experimental data obtained from APTAC tests are
mainly caused by the failure of capturing the peak value of the temperature/pressure.
Since APTAC samples the process parameters (temperature, pressure) at a predefined
frequency, it is possible that APTAC may fail to capture the peak value of
temperature/pressure when self-heating rate/pressure rate is very high. The difference
between the measured peak value and the true peak value can be amplified by the
increase of the temperature/pressure rate. Therefore, the great differences of
uncertainties for calorimetric parameters (Table 4.1 and 4.2) should be caused by the big
differences of self-heating rate and pressure rate between these two tests.
According to the self-heating rate and pressure rate data presented in the table on page
86, experiments performed in this research can be classified into two categories: tests
performed under 0 – 0.075 wt% contaminant, and tests performed under 0.3 - 20 wt%.
The data of maximum self-heating rate and maximum pressure rate keeps in the similar
level within each category but presents big gap between these two categories. According
to the analysis presented in the last paragraph, calorimetric parameters should also show
similar uncertainties within the each category but show big difference in uncertainties
between the two categories. Therefore, the uncertainty data presented in Table 4.1 and
Table 4.2 can represents the uncertainty associated with the experimental results in these
two categories respectively and were applied in the analysis of experimental results in
this research.
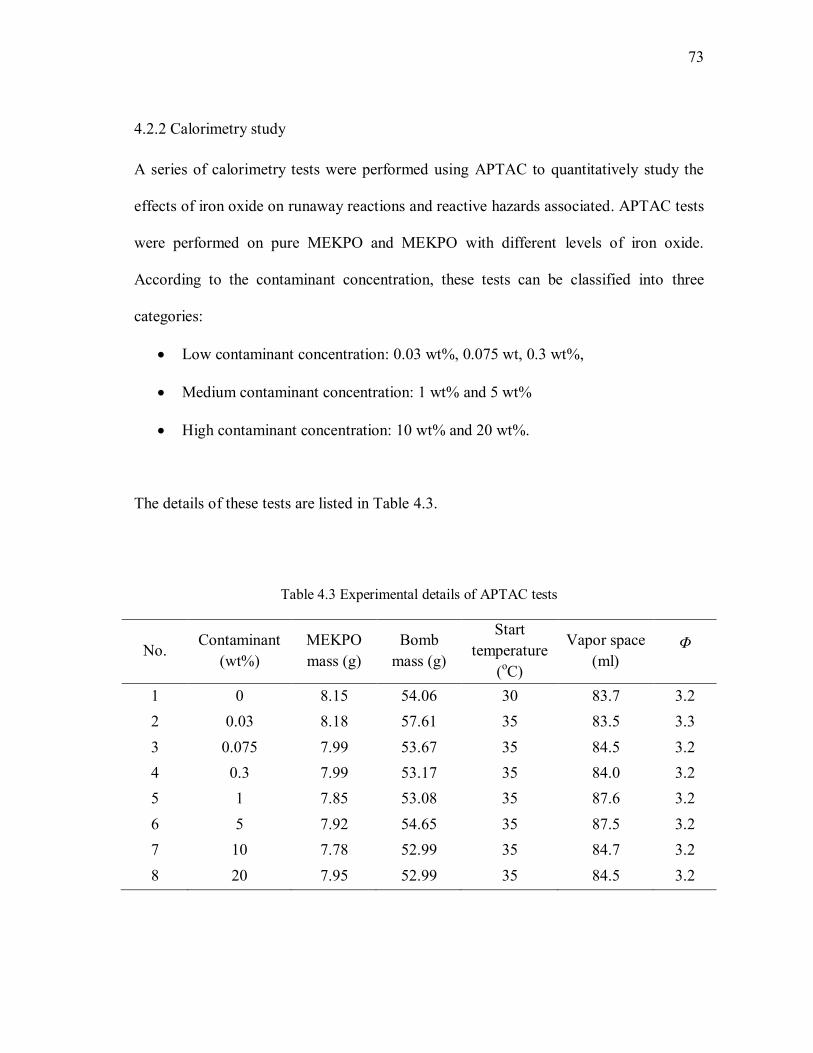
73
73
4.2.2 Calorimetry study
A series of calorimetry tests were performed using APTAC to quantitatively study the
effects of iron oxide on runaway reactions and reactive hazards associated. APTAC tests
were performed on pure MEKPO and MEKPO with different levels of iron oxide.
According to the contaminant concentration, these tests can be classified into three
categories:
Low contaminant concentration: 0.03 wt%, 0.075 wt, 0.3 wt%,
Medium contaminant concentration: 1 wt% and 5 wt%
High contaminant concentration: 10 wt% and 20 wt%.
The details of these tests are listed in Table 4.3.
Table 4.3 Experimental details of APTAC tests
No. Contaminant
(wt%) MEKPO mass (g)
Bomb mass (g)
Start temperature
(oC)
Vapor space (ml)
Φ
1 0 8.15 54.06 30 83.7 3.2 2 0.03 8.18 57.61 35 83.5 3.3 3 0.075 7.99 53.67 35 84.5 3.2 4 0.3 7.99 53.17 35 84.0 3.2 5 1 7.85 53.08 35 87.6 3.2 6 5 7.92 54.65 35 87.5 3.2 7 10 7.78 52.99 35 84.7 3.2 8 20 7.95 52.99 35 84.5 3.2

74
74
a. low contaminant concentration range
Temperature and pressure profiles of runaway reactions obtained from APTAC tests
within different contaminant concentration ranges are presented in Figure 4.2 – 4.4
respectively. Important parameters such as onset temperature and maximum temperature
can be directly obtained or derived from the experimental profiles and are shown in
Table 4.4. Based on the experimental results, other parameters such as self-heating rate
and pressure rate were calculated and are presented in Figure 4.2 – 4.4 respectively.
Important parameters for runaway reaction rate such as maximum self-heating rate and
maximum pressure rate are summarized in Table 4.5. Heat of reaction, an important
indicator for severity of runaway reaction, was calculated based on the adiabatic
temperature increase (Equation 4-1) and are also presented in Table 4.4.
)( 0max TTCH Pr 4-1
According to the data presented in Figure 4.2 and Table 4.4, iron oxide has no
significant impact on the thermal stability of MEKPO in the low concentration range.
With the increase of iron oxide concentration from 0 to 0.3 wt%, the onset temperature
of MEKPO kept around 86 oC. The only exception in this range is the test No.2
performed under 0.03 wt% contaminant. In this test, the onset temperature of MEKPO
surprisingly increased by 11 oC compared with pure MEKPO. This observation is an
outlier which does not follow the overall trend of onset tem[erature within this
concentration range. Also, this observation does not agree with the expectation that iron

75
75
oxide is a contaminant which may weaken the thermal stability of MEKPO. The further
analysis on this abnormal phenomenon is presented in Section 4.2.4.
The maximum temperature reached by the runaway reaction within the low contaminant
concentration range was between 210 and 220 oC, indicating no significant influence
imposed by iron oxide. Because of the little variation on onset temperature and
maximum temperature, within the low contaminant concentration range, runaway
reactions have the similar heat of reaction (around 1000 kJ/g). Again, the test No. 2 is an
outlier for heat of reaction data, whose heat of reaction is about 10% less than other tests
within this range. Similar with maximum temperature trend, the maximum pressure data
does not show definite change after applying the uncertainty data.
Self-heating rate and pressure rate are important parameters indicating the runaway
reaction rate. The maximum values of these two parameters reached during runaway
reaction imply the severity of runaway reaction and are widely used in the design of
pressure relief system 71. By taking account of the uncertainty data, both maximum self-
heating rate and maximum pressure rate keep in the same level within the low
contaminant concentration range (Table 4.5). The trends of these two parameters
indicate the insignificant impact of iron oxide on maximum reaction rate when
contaminant falls into this range. But decreasing trends were observed for these two
parameters when contaminant level reached 0.3 wt%.
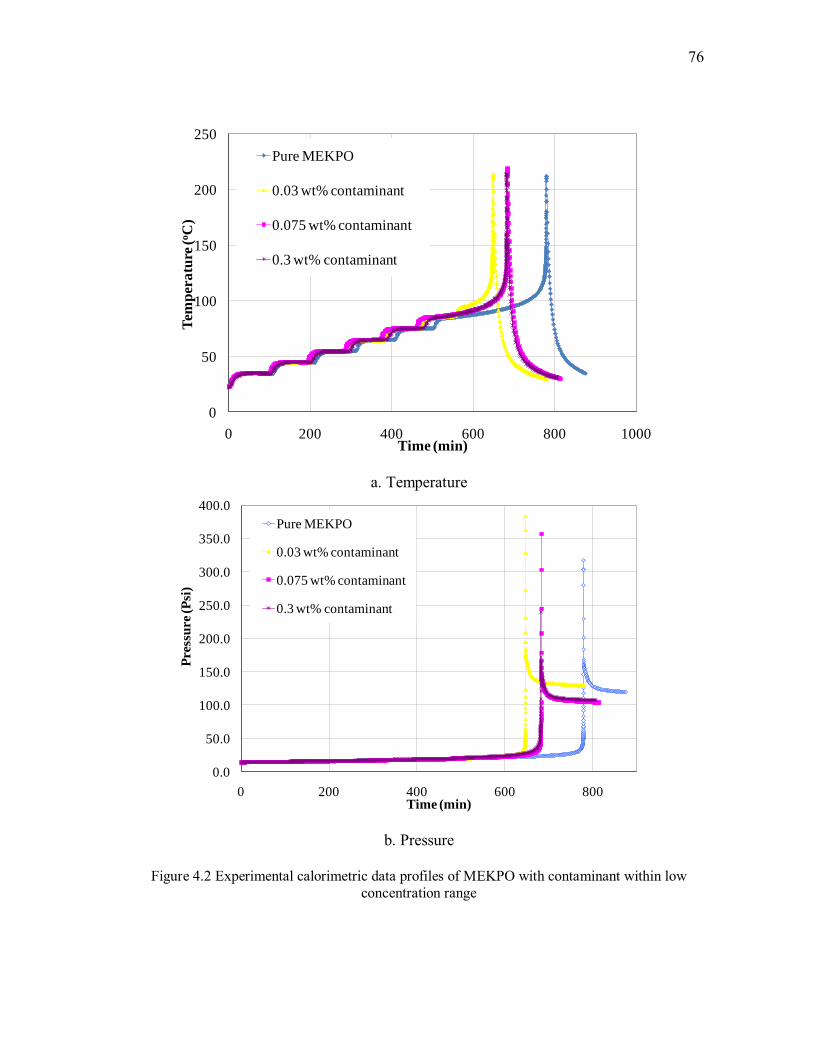
76
76
0
50
100
150
200
250
0 200 400 600 800 1000
Tem
per
atu
re (
oC
)
Time (min)
Pure MEKPO
0.03 wt% contaminant
0.075 wt% contaminant
0.3 wt% contaminant
a. Temperature
0.0
50.0
100.0
150.0
200.0
250.0
300.0
350.0
400.0
0 200 400 600 800
Pre
ssu
re (P
si)
Time (min)
Pure MEKPO
0.03 wt% contaminant
0.075 wt% contaminant
0.3 wt% contaminant
b. Pressure
Figure 4.2 Experimental calorimetric data profiles of MEKPO with contaminant within low concentration range

77
77
1.00E-02
1.00E-01
1.00E+00
1.00E+01
1.00E+02
1.00E+03
1.00E+04
30 50 70 90 110 130 150 170 190
dT
/dt (o
C/m
in)
Temperature (oC)
Pure MEKPO
0.03 wt% contaminant
0.075 wt% contaminant
0.3 wt% contaminant
c. Self-heating rate
1.00E-02
1.00E-01
1.00E+00
1.00E+01
1.00E+02
1.00E+03
1.00E+04
30 50 70 90 110 130 150 170
Pre
ssu
re r
ate
(oC
)
Temperature (oC)
Pure MEKPO
0.03 wt% contaminant
0.075 wt% contaminant
0.3 wt% contaminant
d. Pressure rate
Figure 4.2 Continued

78
78
b. Medium contaminant concentration range
In the medium contaminant concentration range, negative impact of iron oxide on the
thermal stability of MEKPO was observed. According to data presented in Table 4.4,
with the presence of 1 wt% iron oxide, the onset temperature decreased to 76 oC, which
is 10 oC lower than pure MEKPO. The onset temperature further decreased to 69 oC
when iron oxide increased to 5 wt%.
With the presence of medium level contaminant, runaway reaction can reach higher
maximum temperature compared with tests performed under low level of contaminant.
As seen in Table 4.4, the maximum temperature data increased by 10 to 20 oC when
contaminant reached medium concentration range. Because of the higher maximum
temperature and lower onset temperature, heat of reaction of MEKPO runaway reaction
increased by 10 to 20 %. Within this concentration range, maximum pressure of runaway
reaction is slightly lower than that in the low contaminant concentration range.
Both maximum self-heating rate and maximum pressure rate show significant reduction
compared with those in the low contaminant concentration range (Table 4.5). The
dramatic change of these two parameters indicates that the presence of iron oxide can
effective depress the maximum reaction rate within the medium concentration range.
When iron oxide increased from low level to medium level, even though the thermal
stability of MEKPO decreases, the consequence of the runaway reaction becomes less
severe.
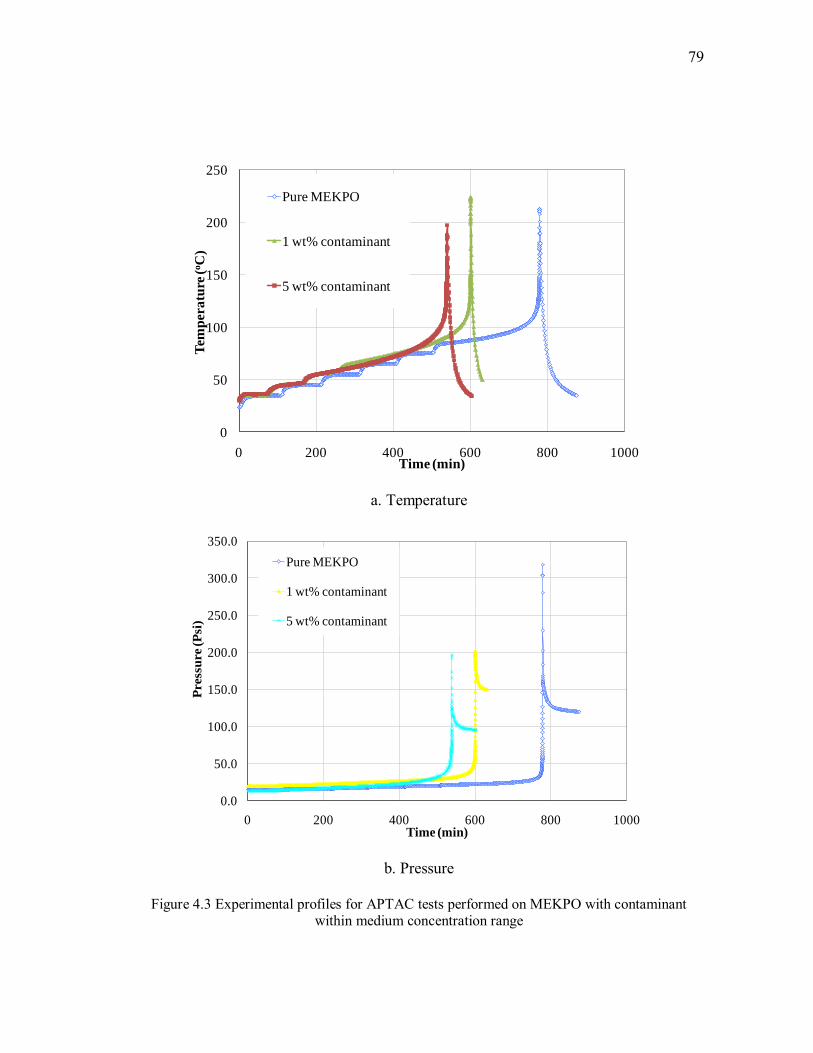
79
79
0
50
100
150
200
250
0 200 400 600 800 1000
Tem
per
atu
re (
oC
)
Time (min)
Pure MEKPO
1 wt% contaminant
5 wt% contaminant
a. Temperature
0.0
50.0
100.0
150.0
200.0
250.0
300.0
350.0
0 200 400 600 800 1000
Press
ure (P
si)
Time (min)
Pure MEKPO
1 wt% contaminant
5 wt% contaminant
b. Pressure
Figure 4.3 Experimental profiles for APTAC tests performed on MEKPO with contaminant within medium concentration range
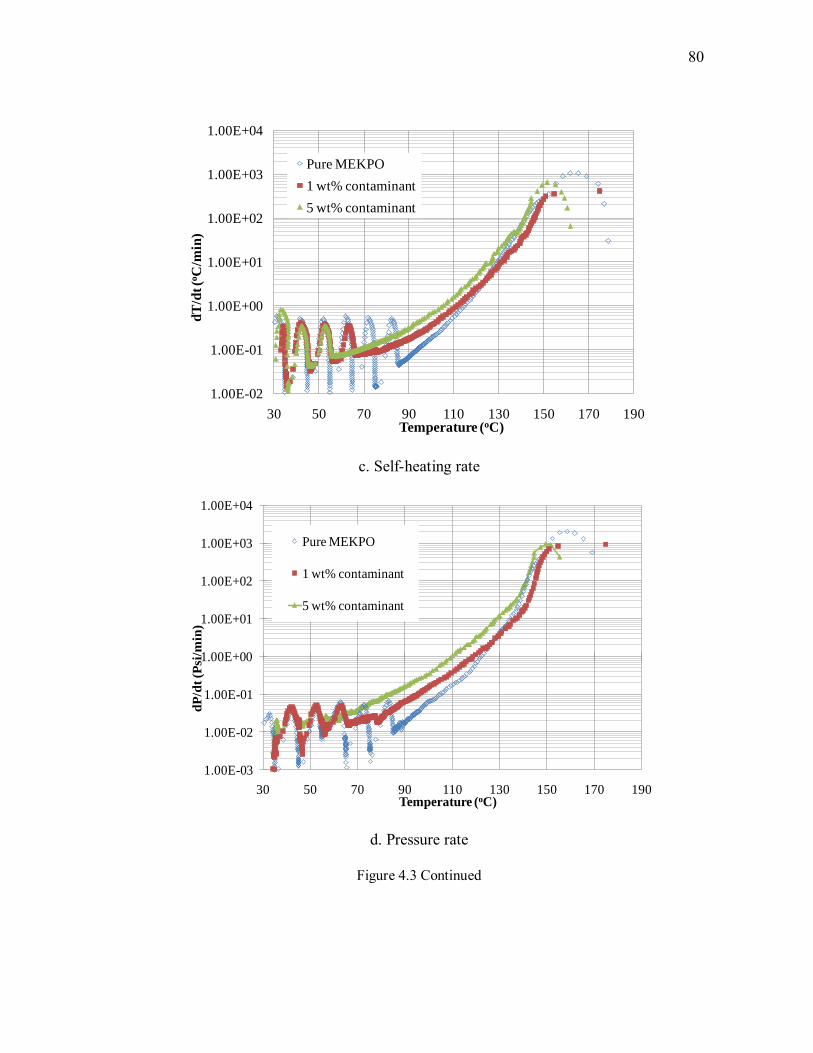
80
80
1.00E-02
1.00E-01
1.00E+00
1.00E+01
1.00E+02
1.00E+03
1.00E+04
30 50 70 90 110 130 150 170 190
dT
/dt (o
C/m
in)
Temperature (oC)
Pure MEKPO
1 wt% contaminant
5 wt% contaminant
c. Self-heating rate
1.00E-03
1.00E-02
1.00E-01
1.00E+00
1.00E+01
1.00E+02
1.00E+03
1.00E+04
30 50 70 90 110 130 150 170 190
dP
/dt
(Psi
/min
)
Temperature (oC)
Pure MEKPO
1 wt% contaminant
5 wt% contaminant
d. Pressure rate
Figure 4.3 Continued

81
81
c. High contaminant concentration range
With the further increase of iron oxide concentration, the temperature of MEKPO
decreased to 66 oC and 58 oC under 10 wt% and 20 wt% contaminant respectively (Table
4.4). The variation of onset temperature implies that the negative impact of iron oxide on
MEKPO is further enhanced by the increase of contaminant concentration.
Heat of reaction within this range is significantly higher than other tests. The heat of
reaction for MKEPO with 20 wt% iron oxide is almost twice as much as pure MEKPO
(Table 4.4). As the result, the maximum temperature of runaway reaction kept on
increasing over the high contaminant concentration range.
Within high contaminant concentration range, maximum pressure of runaway reaction
becomes much more significant and shows dramatic increase with the increase of
contaminant concentration. The maximum pressure for MEKPO with 20 wt% iron oxide
is almost three time as that for pure MEKPO (Table 4.4). The dramatic increase of the
pressure hazard should be the result of the increase of heat of reaction and non-
condensable gas generation. The detailed analysis of non-condensable gas generation is
presented in Section 4.2.3.
The maximum self-heating rate and pressure rate show different trends within this range.
According to data presented in Table 4.5, the maximum self-heating rate further
decreased to 200-300 oC/min with the increase of contaminant concentration, indicating

82
82
the further reduction of maximum reaction rate. However, the maximum pressure rate
shows an increase trend within this concentration range. With the increase of
contaminant concentration from 10 to 20 wt%,, the maximum pressure rate increased
from 600 to 838 psi/min (Table 4.5). It is known that the pressure rise of runaway
reaction is mainly caused by the thermal expansion effect and the generation of non-
condensable gas. So, since the self-heating rate shows decrease trend within this
concentration range, the increase of the maximum pressure rate should be the result of
non-condensable gas generation. The significant increase of gas generation can
compensate the reduction of self-heating rate, and therefore lead to the increase of
maximum pressure rate within this contaminant concentration range.
An interesting phenomenon observed in the high contaminant concentration range is the
appearance of the second peak for both self-hating rate and pressure rate profiles. This
peak was firstly observed (Figure 4.4c and d) in the test performed under 10 wt%
contaminant. The peak value of the second peak reached 12 oC/min and 263 psi/min
respectively for self-heating rate and pressure rate profile (Table 4.5). This peak
becomes more significant with the increase of contaminant concentration, whose peak
value reached 135 oC/min and 838 psi/min under 20 wt% contaminant. According to the
self-heating rate and pressure rate profiles presented in Figure 4.4c and d, in both tests,
the second peak started around 235 oC, which is higher than the maximum temperature
of other tests. The presence of the second peak in the both self-heating rate and pressure
rate profiles implies that another exothermic reaction was initiated by the first runaway

83
83
reaction. Compared with the main reaction represented by the first peak, the secondary
reaction presents minor thermal hazard because of lower maximum self-heating rate than
the main reaction. However, this reaction is associated with great pressure hazard
because of the higher maximum pressure rate compared with the main reaction.
0
50
100
150
200
250
300
0 200 400 600 800 1000
Tem
per
atu
re (
oC
)
Time (min)
Pure MEKPO
10 wt% contaminant
20 wt% contaminant
a. Temperature
Figure 4.4 Experimental calorimetric profiles for MEKPO with contaminant within high concentration range

84
84
0.0
100.0
200.0
300.0
400.0
500.0
600.0
700.0
800.0
900.0
0 200 400 600 800
Pre
ssu
re (P
si)
Time (min)
Pure MEKPO
10 wt% contaminant
20 wt% contaminant
b. Pressure
1.00E-02
1.00E-01
1.00E+00
1.00E+01
1.00E+02
1.00E+03
1.00E+04
30 50 70 90 110 130 150 170 190 210 230 250 270
dT
/dt (m
in)
Temperature (oC)
Pure MEKPO
10 wt% contaminant
20 wt% contaminant
c. Self-heating rate
Figure 4.4 Continued
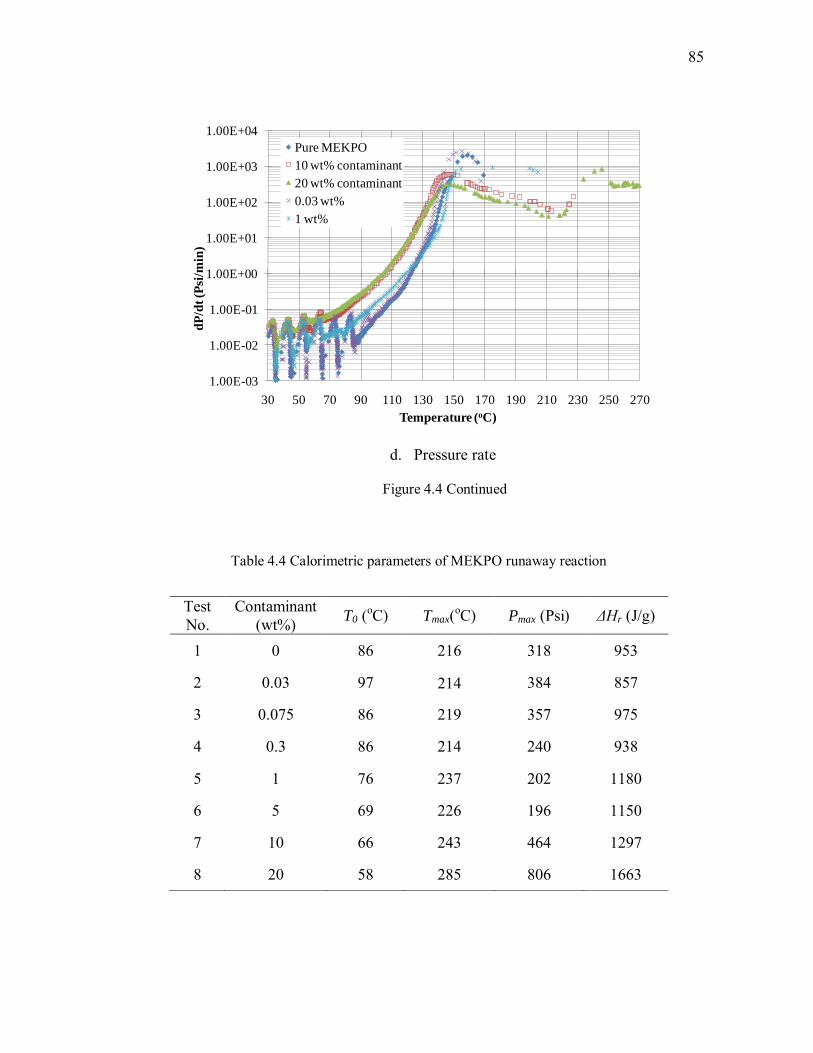
85
85
1.00E-03
1.00E-02
1.00E-01
1.00E+00
1.00E+01
1.00E+02
1.00E+03
1.00E+04
30 50 70 90 110 130 150 170 190 210 230 250 270
dP
/dt
(Psi
/min
)
Temperature (oC)
Pure MEKPO
10 wt% contaminant
20 wt% contaminant
0.03 wt%
1 wt%
d. Pressure rate
Figure 4.4 Continued
Table 4.4 Calorimetric parameters of MEKPO runaway reaction
Test No.
Contaminant (wt%) T0 (oC) Tmax(oC) Pmax (Psi) ΔHr (J/g)
1 0 86 216 318 953
2 0.03 97 214 384 857
3 0.075 86 219 357 975
4 0.3 86 214 240 938
5 1 76 237 202 1180
6 5 69 226 196 1150
7 10 66 243 464 1297
8 20 58 285 806 1663
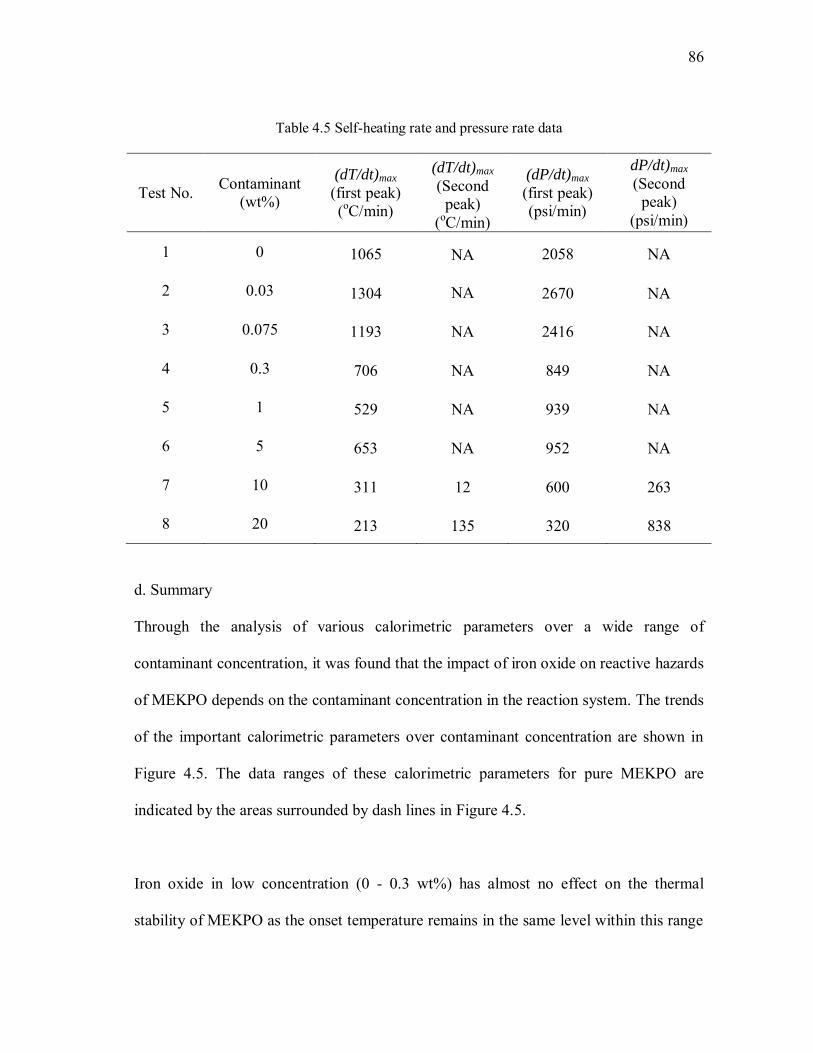
86
86
Table 4.5 Self-heating rate and pressure rate data
Test No. Contaminant (wt%)
(dT/dt)max (first peak) (oC/min)
(dT/dt)max (Second
peak) (oC/min)
(dP/dt)max (first peak) (psi/min)
dP/dt)max (Second
peak) (psi/min)
1 0 1065 NA 2058 NA
2 0.03 1304 NA 2670 NA
3 0.075 1193 NA 2416 NA
4 0.3 706 NA 849 NA
5 1 529 NA 939 NA
6 5 653 NA 952 NA
7 10 311 12 600 263
8 20 213 135 320 838
d. Summary
Through the analysis of various calorimetric parameters over a wide range of
contaminant concentration, it was found that the impact of iron oxide on reactive hazards
of MEKPO depends on the contaminant concentration in the reaction system. The trends
of the important calorimetric parameters over contaminant concentration are shown in
Figure 4.5. The data ranges of these calorimetric parameters for pure MEKPO are
indicated by the areas surrounded by dash lines in Figure 4.5.
Iron oxide in low concentration (0 - 0.3 wt%) has almost no effect on the thermal
stability of MEKPO as the onset temperature remains in the same level within this range
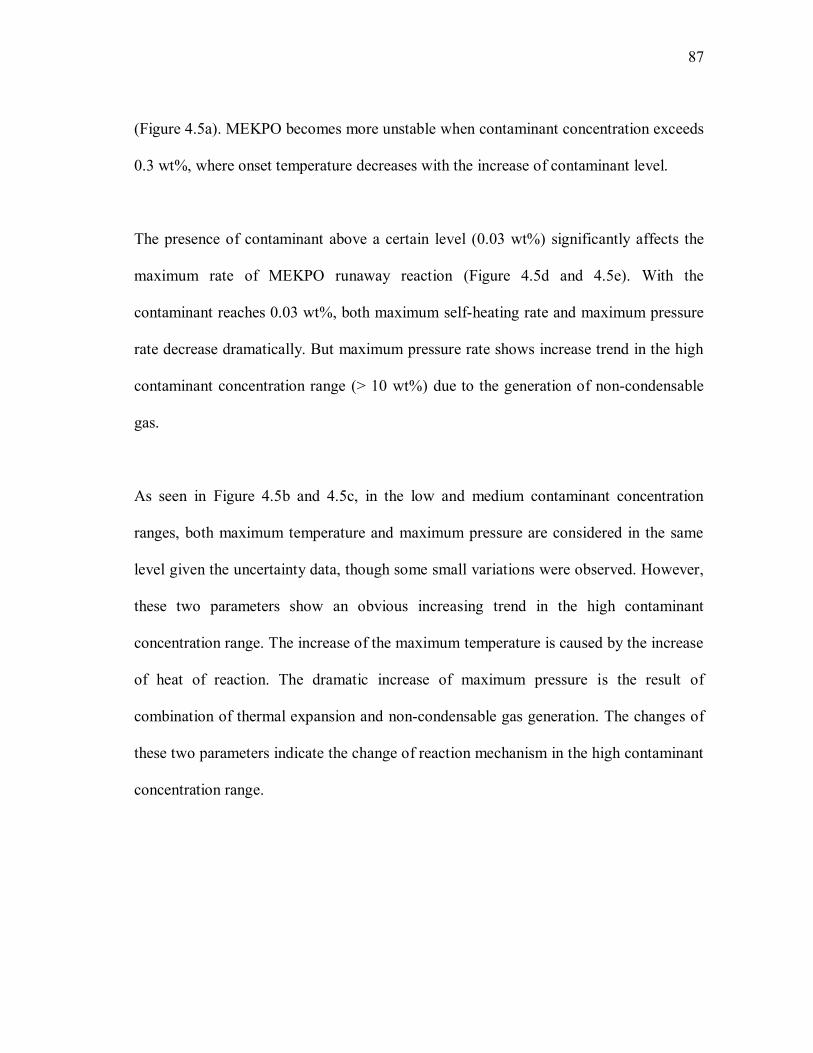
87
87
(Figure 4.5a). MEKPO becomes more unstable when contaminant concentration exceeds
0.3 wt%, where onset temperature decreases with the increase of contaminant level.
The presence of contaminant above a certain level (0.03 wt%) significantly affects the
maximum rate of MEKPO runaway reaction (Figure 4.5d and 4.5e). With the
contaminant reaches 0.03 wt%, both maximum self-heating rate and maximum pressure
rate decrease dramatically. But maximum pressure rate shows increase trend in the high
contaminant concentration range (> 10 wt%) due to the generation of non-condensable
gas.
As seen in Figure 4.5b and 4.5c, in the low and medium contaminant concentration
ranges, both maximum temperature and maximum pressure are considered in the same
level given the uncertainty data, though some small variations were observed. However,
these two parameters show an obvious increasing trend in the high contaminant
concentration range. The increase of the maximum temperature is caused by the increase
of heat of reaction. The dramatic increase of maximum pressure is the result of
combination of thermal expansion and non-condensable gas generation. The changes of
these two parameters indicate the change of reaction mechanism in the high contaminant
concentration range.
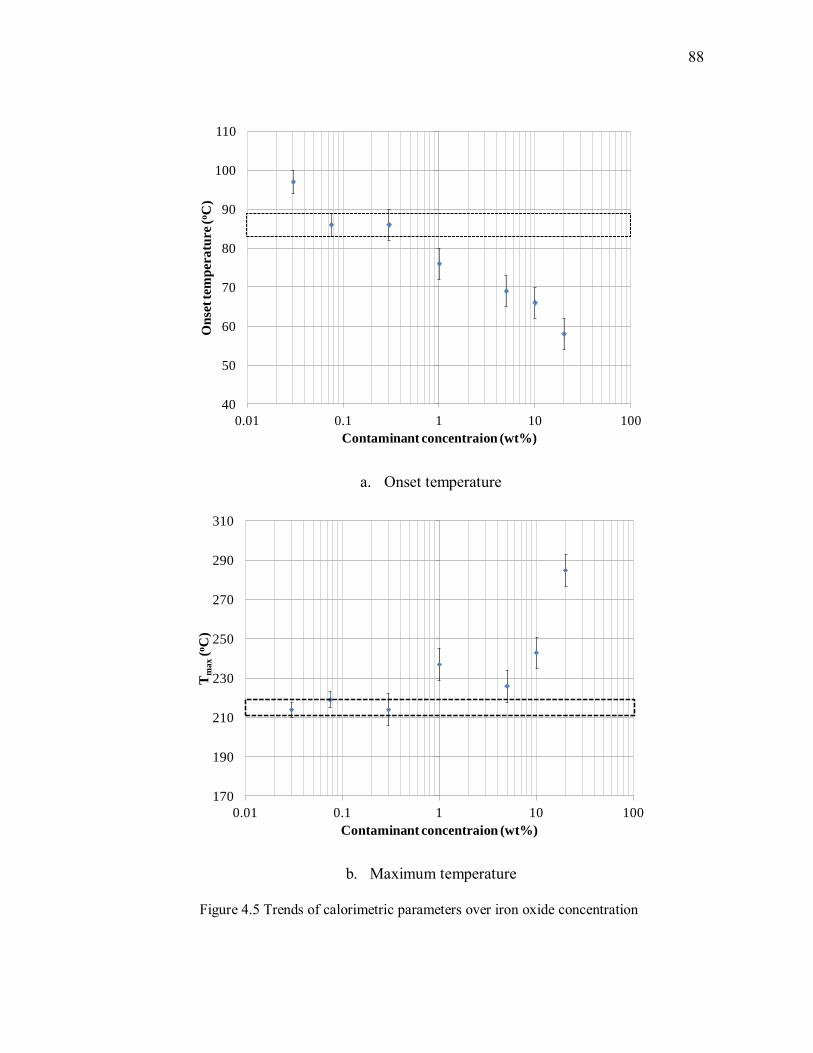
88
88
40
50
60
70
80
90
100
110
0.01 0.1 1 10 100
On
set te
mp
era
ture
(oC
)
Contaminant concentraion (wt%)
a. Onset temperature
170
190
210
230
250
270
290
310
0.01 0.1 1 10 100
Tm
ax
(oC
)
Contaminant concentraion (wt%)
b. Maximum temperature
Figure 4.5 Trends of calorimetric parameters over iron oxide concentration

89
89
0
100
200
300
400
500
600
700
800
900
1000
0.01 0.1 1 10 100
Pm
ax
(Psi
)
Contaminant concentration (wt%)
c. Maximum pressure
0
200
400
600
800
1000
1200
1400
1600
1800
0.01 0.1 1 10 100
(dT
/dt)
ma
x(o
C/m
in)
Contaminant concentraion (wt%)
d. Maximum self-heating rate
Figure 4.5 Continued
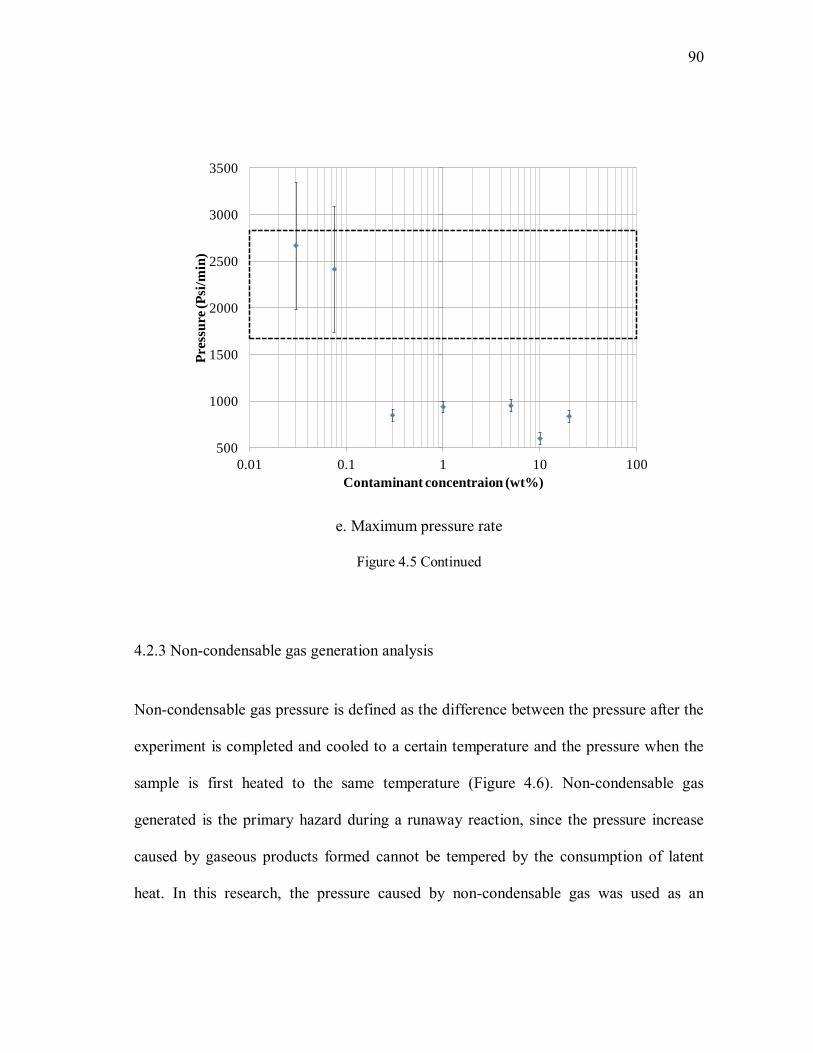
90
90
500
1000
1500
2000
2500
3000
3500
0.01 0.1 1 10 100
Pre
ssu
re (P
si/m
in)
Contaminant concentraion (wt%)
e. Maximum pressure rate
Figure 4.5 Continued
4.2.3 Non-condensable gas generation analysis
Non-condensable gas pressure is defined as the difference between the pressure after the
experiment is completed and cooled to a certain temperature and the pressure when the
sample is first heated to the same temperature (Figure 4.6). Non-condensable gas
generated is the primary hazard during a runaway reaction, since the pressure increase
caused by gaseous products formed cannot be tempered by the consumption of latent
heat. In this research, the pressure caused by non-condensable gas was used as an

91
91
important parameter for measuring pressure hazards and used to estimate the amount of
gaseous products produced.
0
50
100
150
200
250
300
350
0 50 100 150 200 250
Pre
ssu
re (P
si)
Temperature (oC)
ΔP
Figure 4.6 Non-condensable gas pressure
The generation of non-condensable gas can be calculated using Equation 4-2. Estimation
of parameters such as non-condensable gas pressure, moles of gaseous products and gas
produced per liter MEKPO are presented in Table 4.6.
RT
PVn
Equation 4-2

92
92
where ΔP is non-condensable gas pressure, V is the vapor space in the test cell, T is the
temperature under which pressure is measured.
According to the data presented in Table 4.6, it is obvious that pressure hazards caused
by non-condensable gas are much more significant in the high contaminant
concentration range than other ranges. Within the low and medium contaminant
concentration ranges, each liter reactant produces 3.4 – 5.1 mol gaseous products.
However, this parameter reached 7.8 mol/l under 10 wt% contaminant and further
increased to 11.8 mol/L under 20 wt% contaminant, which is an almost three-fold
increase. The dramatic increase of the non-condensable gas production implies the
change of reaction mechanism.
Table 4.6 Estimation of non-condensable gas generation
Contaminant (wt%) ΔP (Psi)
Gaseous product (mol)
Gaseous product per liter reactant
(mol/L) 0 117.7 0.039 4.8
0.03 115.2 0.038 4.6
0.075 89.3 0.029 3.7
0.3 92.4 0.030 3.8
1 123.7 0.040 5.1
5 82.3 0.027 3.4
10 236.2 0.078 10
20 358.3 0.118 14.8

93
93
The gas generation rate can be calculated by excluding the influence of thermal
expansion from the detected pressure rate using Equation 2-37. The calculated gas
generation rate was plotted against sample temperature in Figure 4.7. The gas generation
rate profiles can help to monitor the dynamic gas production process and further
investigate the reaction mechanism. The maximum gas generation rate of different tests
was summarized in Table 4.7.
1.00E-08
1.00E-07
1.00E-06
1.00E-05
1.00E-04
1.00E-03
1.00E-02
1.00E-01
1.00E+00
30 60 90 120 150 180
Ga
s g
ener
ata
tio
n r
ate
(m
ol/
min
)
Temperature (oC)
a. Pure MEKPO
Figure 4.7 Gas generation rate profiles for MEKPO runaway reaction
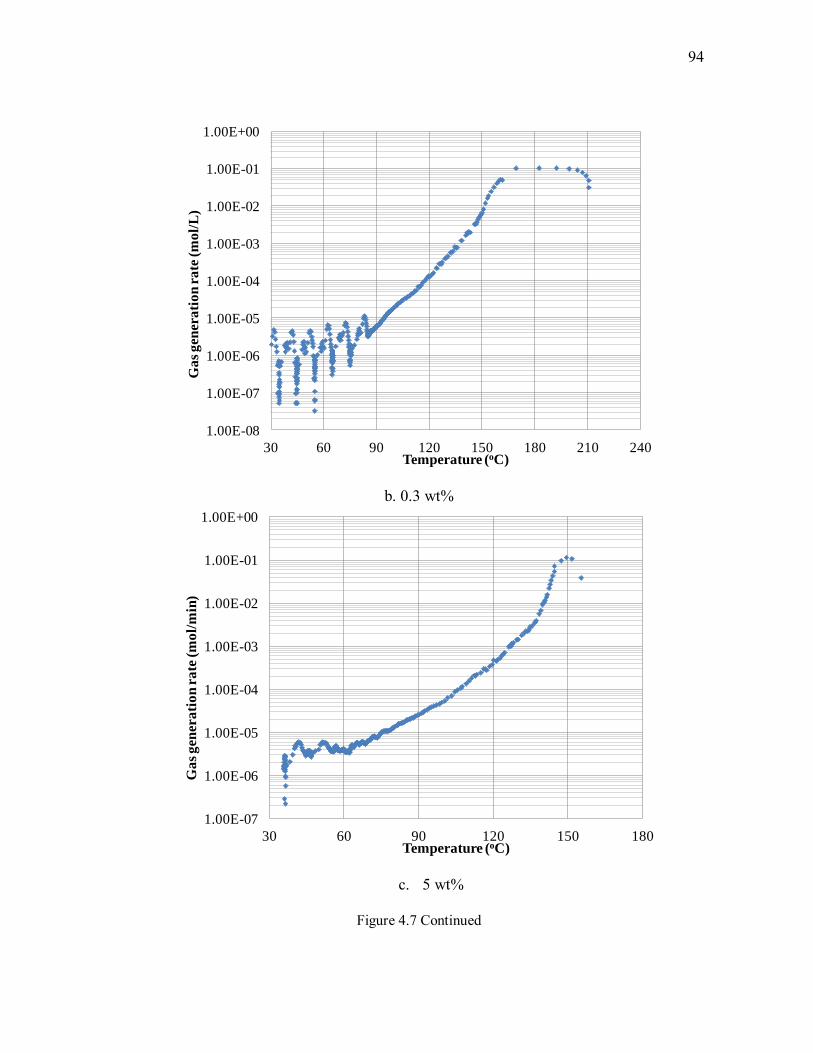
94
94
1.00E-08
1.00E-07
1.00E-06
1.00E-05
1.00E-04
1.00E-03
1.00E-02
1.00E-01
1.00E+00
30 60 90 120 150 180 210 240
Ga
s g
ener
ati
on
ra
te (
mo
l/L
)
Temperature (oC)
b. 0.3 wt%
1.00E-07
1.00E-06
1.00E-05
1.00E-04
1.00E-03
1.00E-02
1.00E-01
1.00E+00
30 60 90 120 150 180
Ga
s g
ener
ati
on
ra
te (
mo
l/m
in)
Temperature (oC)
c. 5 wt%
Figure 4.7 Continued

95
95
1.00E-06
1.00E-05
1.00E-04
1.00E-03
1.00E-02
1.00E-01
1.00E+00
30 60 90 120 150 180 210 240
Ga
s g
ener
ati
on
ra
te (
mo
l/m
in)
Temperature (oC)
d. 10 wt% contaminant
1.00E-06
1.00E-05
1.00E-04
1.00E-03
1.00E-02
1.00E-01
1.00E+00
30 60 90 120 150 180 210 240 270 300
Ga
s g
ener
ati
on
ra
te (
mo
l/m
in)
Temperature (oC)
e. 20 wt% contaminant
Figure 4.7 Continued

96
96
For pure MEKPO and MEKPO with low and medium levels of contaminant, as
presented in Figure 4.7, all the gas generation curves follow the similar trend as self-
heating rate (Figure 4.2c and 4.3c) and show only one peak during the runaway reaction.
According to the data presented in Table 4.7, the maximum gas generation rate remains
in the same range when the contaminant is below 0.3 wt% but shows dramatic reduction
when contaminant level reaches and exceeds 0.3 wt%. This trend of maximum gas
generation rate is quite similar with the trend for the data of maximum self-heating rate
(Table 4.5). The agreement between these two trends indicates the consistent reaction
mechanism for runaway reaction with the presence of low and medium levels of
contaminant. However, under high level of contaminant, the gas generation rate curve
shows two peaks, of which the second peak appears in the high temperature range
(Figure 4.7d and 4.7e). Within high contaminant concentration range, the maximum gas
generation rate of the second peak increases dramatically over contaminant
concentration and is higher than the first peak value under 20 wt% contaminant (Table
4.7). The presence of the second peak of gas generation rate results in the increase of the
amount of gas totally produced by the runaway reaction. Also, the gas produced from the
reaction corresponding to the second peak can compensate the decrease of reaction rate
of the first peak and therefore leads to the increase of the maximum pressure rate within
the high contaminant concentration range. The presence of the second gas generation
peak implies a possible change of reaction mechanism.

97
97
Table 4.7 Parameters of non-condensable gas generation
Contaminant (wt%) (dn/dt)max (first peak) (mol/min)
(dn/dt)max (second peak) (mol/min)
0 0.24 NA
0.03 0.31 NA
0.075 0.32 NA
0.3 0.10 NA
1 0.12 NA
5 0.12 NA
10 0.08 0.03
20 0.04 0.11
4.2.4 Kinetic investigation
When studying the impact of iron oxide on the reactive hazards of MEKPO, it is
important to understand the reaction kinetics behind the observable calorimetric
parameters. Investigation on reaction kinetics can help people to get a comprehensive
understanding of the runaway reaction and associated hazards from the fundamental
point of view and explain the experimental observation obtained from calorimetry test.
Also, the solid understanding of the kinetics of runaway reaction can serve as the
technical basis for further reaction modeling with different purposes.

98
98
In this research, based on the experimental data obtained from APTAC tests, kinetic
investigation was performed for MEKPO runaway reaction with the presence of
different levels of iron oxide. In previous research, three reaction models were proposed
for MEKPO runaway reaction: nth order reaction, autocatalytic reaction and consecutive
reaction 72. The consecutive model is normally used for runaway reaction with multiple
peaks. In this research, most of the runaway reactions present only one peak in the self-
heating rate profiles. Though under high level of contaminant, runaway reactions
presents two self-heating rate peaks, the first peak is still our major concern before of the
major thermal hazard associated. Based on the above considerations, consecutive model
was excluded from this research. The rest two types of kinetic models, nth order reaction
and autocatalytic reaction, were employed in this research. By fitting different type of
models to the experimental data, it was expected to identify the right kinetics for the
runaway reaction, estimate important kinetic parameters and evaluate the impact of iron
oxide on reaction kinetics.
a. nth order reaction
As introduced in Section 2.6.1, nth order reaction model was applied to the experimental
data by using the following equation.
RT
EAC
TT
T
dt
dTk an
n
n
ad
1
0
max
1
loglog*log Equation 4-3
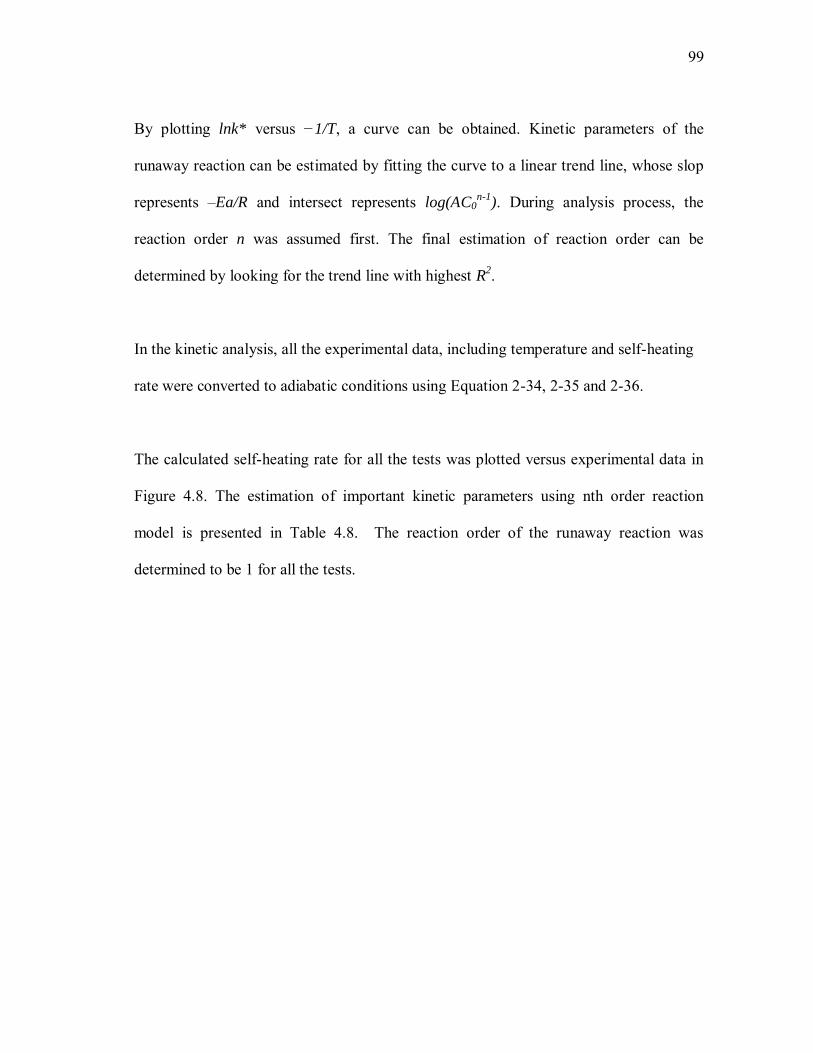
99
99
By plotting lnk* versus −1/T, a curve can be obtained. Kinetic parameters of the
runaway reaction can be estimated by fitting the curve to a linear trend line, whose slop
represents –Ea/R and intersect represents log(AC0n-1
). During analysis process, the
reaction order n was assumed first. The final estimation of reaction order can be
determined by looking for the trend line with highest R2.
In the kinetic analysis, all the experimental data, including temperature and self-heating
rate were converted to adiabatic conditions using Equation 2-34, 2-35 and 2-36.
The calculated self-heating rate for all the tests was plotted versus experimental data in
Figure 4.8. The estimation of important kinetic parameters using nth order reaction
model is presented in Table 4.8. The reaction order of the runaway reaction was
determined to be 1 for all the tests.
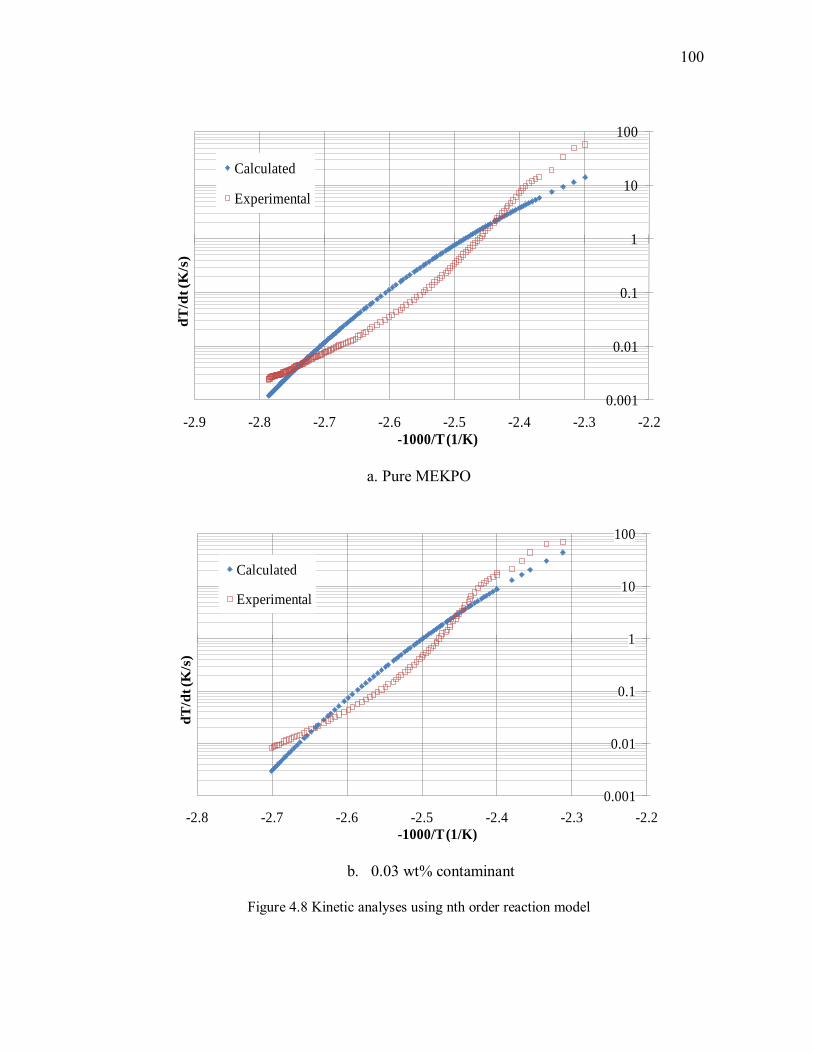
100
100
0.001
0.01
0.1
1
10
100
-2.9 -2.8 -2.7 -2.6 -2.5 -2.4 -2.3 -2.2
dT
/dt (K
/s)
-1000/T (1/K)
Calculated
Experimental
a. Pure MEKPO
0.001
0.01
0.1
1
10
100
-2.8 -2.7 -2.6 -2.5 -2.4 -2.3 -2.2
dT
/dt (K
/s)
-1000/T (1/K)
Calculated
Experimental
b. 0.03 wt% contaminant
Figure 4.8 Kinetic analyses using nth order reaction model
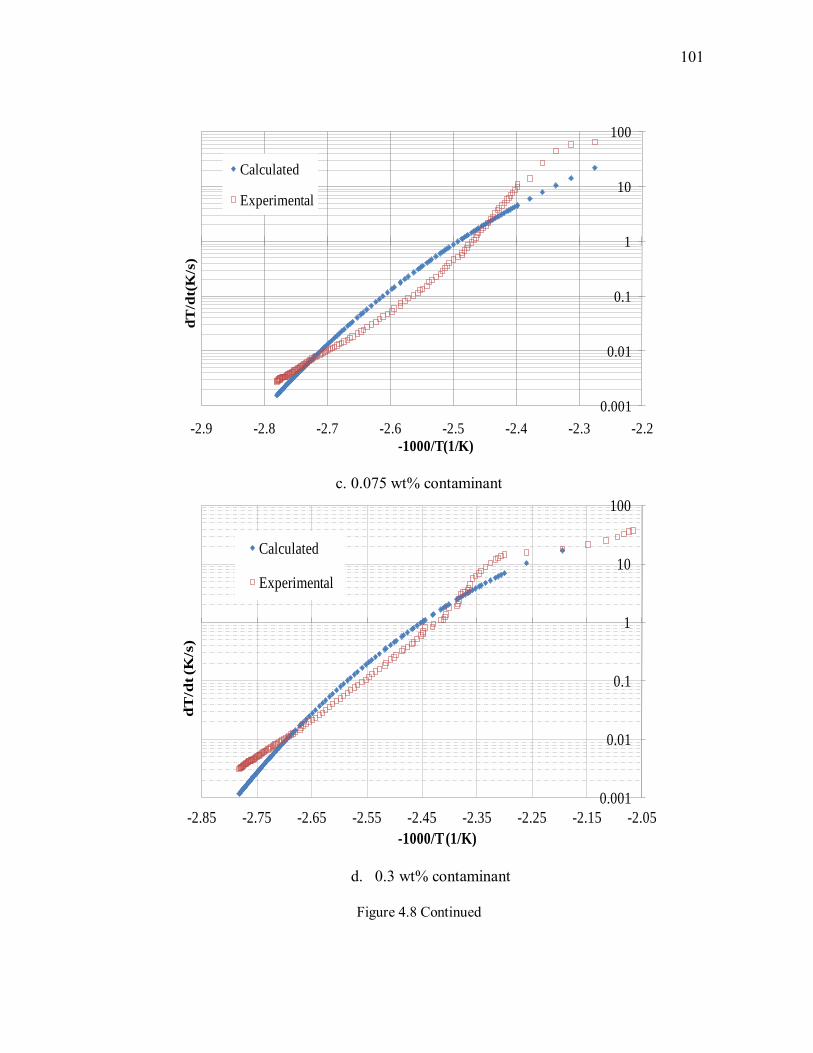
101
101
0.001
0.01
0.1
1
10
100
-2.9 -2.8 -2.7 -2.6 -2.5 -2.4 -2.3 -2.2
dT
/dt(
K/s
)
-1000/T(1/K)
Calculated
Experimental
c. 0.075 wt% contaminant
0.001
0.01
0.1
1
10
100
-2.85 -2.75 -2.65 -2.55 -2.45 -2.35 -2.25 -2.15 -2.05
dT
/dt (K
/s)
-1000/T (1/K)
Calculated
Experimental
d. 0.3 wt% contaminant
Figure 4.8 Continued

102
102
0.001
0.01
0.1
1
10
100
-3 -2.8 -2.6 -2.4 -2.2
dT
/dt (K
/s)
-1000/T (1/K)
Calculated
Experimental
e. 1 wt% contaminant
0.001
0.01
0.1
1
10
100
-3 -2.9 -2.8 -2.7 -2.6 -2.5 -2.4 -2.3 -2.2
dT
/dt (K
/s)
-1000/T (1/K)
Calculated
Experimental
f. 5 wt% contaminant
Figure 4.8 continued

103
103
0.001
0.01
0.1
1
10
100
-3 -2.9 -2.8 -2.7 -2.6 -2.5 -2.4 -2.3 -2.2
dT
/dt (K
/s)
-1000/T (1/K)
Calculated
Experimental
g. 10 wt% contaminant
0.001
0.01
0.1
1
10
100
-3.2 -3 -2.8 -2.6 -2.4 -2.2 -2
dT
/dt (K
/s)
-1000/T (1/K)
Calculated
Experimental
h. 20 wt% contaminant
Figure 4.8 Continued

104
104
Table 4.8 Estimation of kinetic parameters using nth order reaction model
Test No. Iron oxide (wt%) Ea (kJ/mol) lnA
1 0 74.5 12.2
2 0.03 89.2 17.2
3 0.075 74.0 12.2
4 0.3 68.9 10.6
5 1 57.8 7.5
6 5 52.6 5.7
7 10 48.3 4.5
8 20 41.1 1.9
The estimated kinetic parameters follow the trend of onset temperature over the
contaminant concentration range. According to the data presented in Table 4.8, reaction
system with lower onset temperature shows low activation energy and frequency factor.
However, by comparing the simulation results against experimental data in Figure 4.8, it
was found that the nth order reaction model could not well simulate the runaway
reaction process due to the gap between experimental and calculated data. Also, the
calculated maximum self-heating rate was found to be much lower than the experimental
data for all the tests. This phenomenon implies that the runaway reaction of MEKPO
might follow autocatalytic reaction model. The autocatalytic model normally can
achieve high self-heating rate because its reaction rate is the function of both reactants
and products.

105
105
According to the kinetic investigation results, nth order reaction is not the appropriate
reaction model representing the runaway reaction of MEKPO with the presence of iron
oxide. More advanced kinetic model needs to be developed to study the kinetics of the
MEKPO runaway reactions.
b. Autocatalytic reaction model
The basic autocatalytic model employed in this research is shown as follows 73.
)()1( 21/ nnRTEzAe
dt
da
4-4
where A is the frequency factor, Ea is the apparent activation energy, α is the conversion,
n1, n2 and z are parameters used to describe the catalytic effect of MEKPO. Because the
experiment was performed in a non-adiabatic environment, the self-heating rate can be
calculated using the following equation.
1**
dt
dmH
dt
dTmC rp 4-5
where CP is the heat capacity; m is the sample mass; ΔHr is heat of reaction; ϕ is thermal
inertia factor.
Equations 4-4 and 4-5 can be combined together

106
106
)(1*21/ zAe
C
H
dt
dT nnRTEa
P
r
4-6
After developing the reaction model, the non-linear optimization method (Equation 4-7)
was applied here to validate the model structure and estimate the kinetic parameters.
This method uses Least Square Method to achieve the best fit to the experimental data
by minimizing the measure of residuals between experimental and simulated responses.
The estimated kinetic parameters obtained through non-linear optimization method are
listed in Table 4.9. The calculated self-heating rate was plotted against experimental data
in Figure 4.9.
i
risimii PSStYtYwPSS )(min)()()(2
exp
Equation 4-7
As seen in Figures 4.9 a-h, the calculated self-heating rate curves show quite good fitting
to the experimental data under all contaminant levels, suggesting that an autocatalytic
reaction model can represent the runaway reaction of MEKPO and MEKPO
contaminated by different levels of iron oxide. A gap between experimental data and
kinetic modeling results was observed in the high temperature range. This gap is caused
by the fact that activation energy is a function of temperature, which decreases with the
increase of temperature. Since the activation energy was assumed to be consistent in the
kinetic investigation, in order to reach the same self-heating rate, reaction model needs
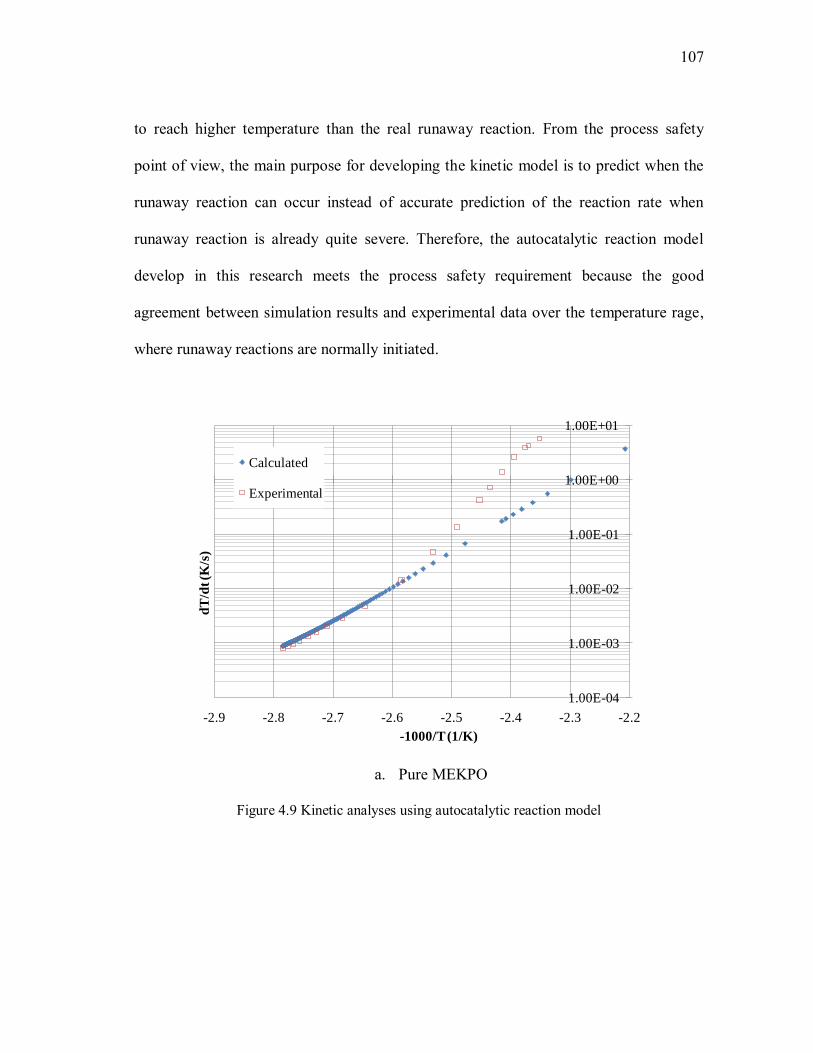
107
107
to reach higher temperature than the real runaway reaction. From the process safety
point of view, the main purpose for developing the kinetic model is to predict when the
runaway reaction can occur instead of accurate prediction of the reaction rate when
runaway reaction is already quite severe. Therefore, the autocatalytic reaction model
develop in this research meets the process safety requirement because the good
agreement between simulation results and experimental data over the temperature rage,
where runaway reactions are normally initiated.
1.00E-04
1.00E-03
1.00E-02
1.00E-01
1.00E+00
1.00E+01
-2.9 -2.8 -2.7 -2.6 -2.5 -2.4 -2.3 -2.2
dT
/dt (K
/s)
-1000/T (1/K)
Calculated
Experimental
a. Pure MEKPO
Figure 4.9 Kinetic analyses using autocatalytic reaction model

108
108
0.001
0.01
0.1
1
10
100
-2.8 -2.7 -2.6 -2.5 -2.4 -2.3 -2.2 -2.1 -2
dT
/dt (K
/s)
-1000/T (1/K)
Calculated
Experimental
b. 0.03 wt% contaminant
0.0001
0.001
0.01
0.1
1
10
100
-2.9 -2.7 -2.5 -2.3 -2.1
dT
/dt (K
/s)
-1000/T (1/K)
Calculated
Experimental
c. 0.075 wt%
Figure 4.9 Continued
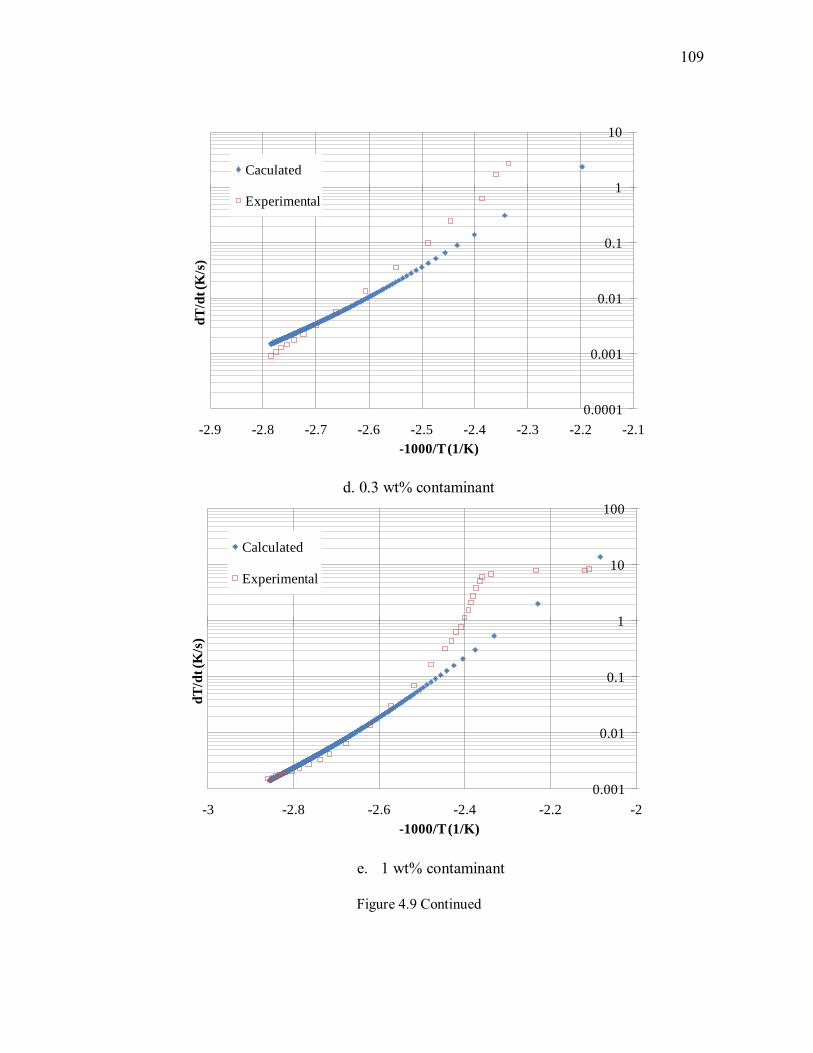
109
109
0.0001
0.001
0.01
0.1
1
10
-2.9 -2.8 -2.7 -2.6 -2.5 -2.4 -2.3 -2.2 -2.1
dT
/dt (K
/s)
-1000/T (1/K)
Caculated
Experimental
d. 0.3 wt% contaminant
0.001
0.01
0.1
1
10
100
-3 -2.8 -2.6 -2.4 -2.2 -2
dT
/dt (K
/s)
-1000/T (1/K)
Calculated
Experimental
e. 1 wt% contaminant
Figure 4.9 Continued
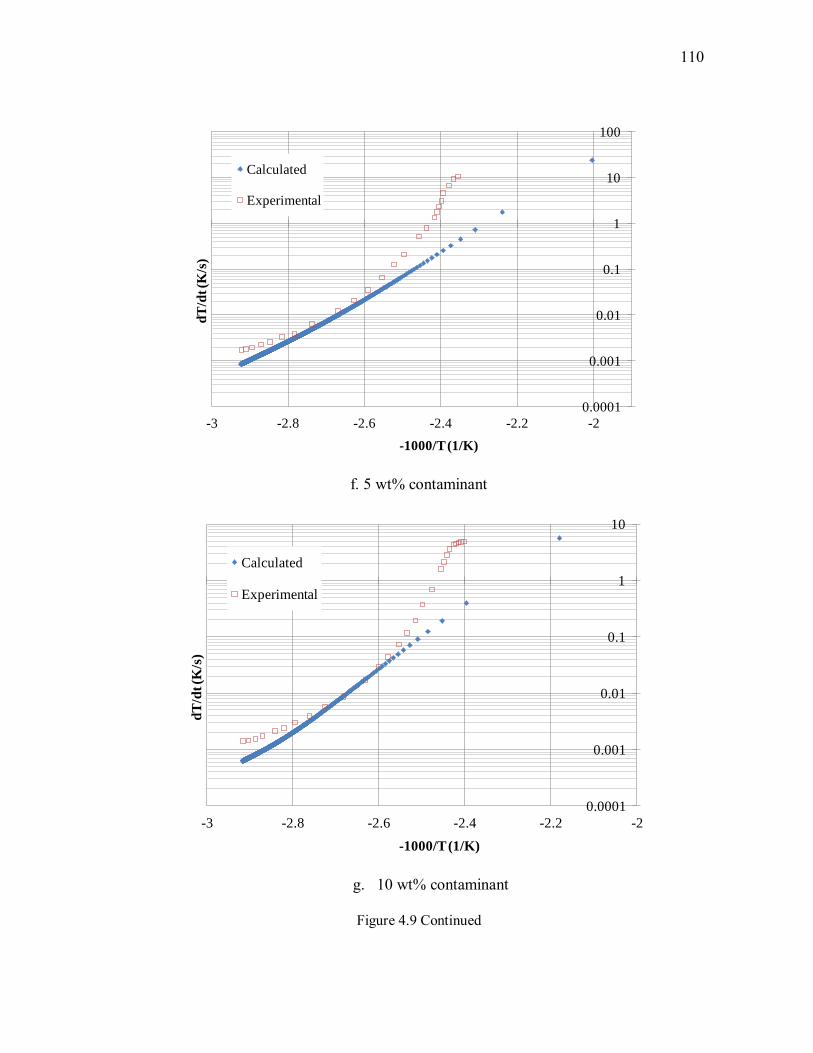
110
110
0.0001
0.001
0.01
0.1
1
10
100
-3 -2.8 -2.6 -2.4 -2.2 -2
dT
/dt (K
/s)
-1000/T (1/K)
Calculated
Experimental
f. 5 wt% contaminant
0.0001
0.001
0.01
0.1
1
10
-3 -2.8 -2.6 -2.4 -2.2 -2
dT
/dt (K
/s)
-1000/T (1/K)
Calculated
Experimental
g. 10 wt% contaminant
Figure 4.9 Continued
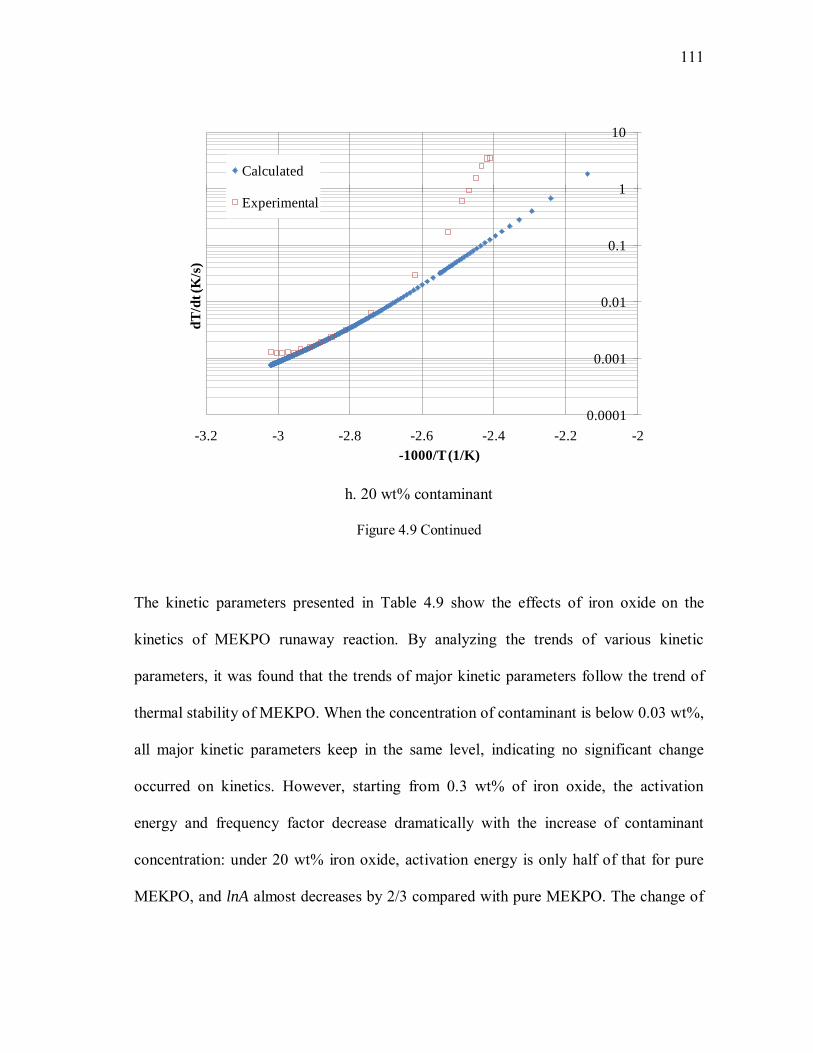
111
111
0.0001
0.001
0.01
0.1
1
10
-3.2 -3 -2.8 -2.6 -2.4 -2.2 -2
dT
/dt (K
/s)
-1000/T (1/K)
Calculated
Experimental
h. 20 wt% contaminant
Figure 4.9 Continued
The kinetic parameters presented in Table 4.9 show the effects of iron oxide on the
kinetics of MEKPO runaway reaction. By analyzing the trends of various kinetic
parameters, it was found that the trends of major kinetic parameters follow the trend of
thermal stability of MEKPO. When the concentration of contaminant is below 0.03 wt%,
all major kinetic parameters keep in the same level, indicating no significant change
occurred on kinetics. However, starting from 0.3 wt% of iron oxide, the activation
energy and frequency factor decrease dramatically with the increase of contaminant
concentration: under 20 wt% iron oxide, activation energy is only half of that for pure
MEKPO, and lnA almost decreases by 2/3 compared with pure MEKPO. The change of

112
112
major kinetic parameters leads to the change of reaction rate, and therefore causes the
reduction of thermal stability.
Table 4.9 Estimation of kinetic parameters using autocatalytic reaction model
Test No.
Contaminant concentration
(wt%)
T0 (oC) n1 n2
Ea
(kJ/mol) z lnA1
1 0 86 0.22 1.95 97.4 0.1 23.0
3 0.03 97 0.2 1.8 95.8 0.1 23.0
5 0.075 86 0.1 1.3 96.4 0.1 22.9
6 0.3 86 0.1 2.5 81.0 0.1 18.1
7 1 76 0.1 2.5 77.0 0.1 17.2
8 5 69 0.1 2.5 77.6 0.1 16.8
9 10 66 0.1 2.4 64.6 0.02 14.9
10 20 58 0.1 2.5 52.4 0.03 9.9
The phenomena observed earlier that the low level of contaminant (0.03 wt%) makes
MEKPO more stable can also be explained based on the kinetic study results. According
to the data presented in Table 4.9, in the low contaminant concentration range (0 to 0.3
wt%), all the major kinetic parameters keep in the same level. According to Equation 4-
6, if all the kinetic parameters keep in the same level, lower heat of reaction would lead

113
113
to lower self-heating rate. So, if we apply the same exotherm detection criteria (e.g.
dT/dt=0.05 oC/min), the exotherm can only be detected at higher temperature for
reaction with lower heat of reaction. This means for MEKPO under 0.03 wt% iron oxide,
whose heat of reaction is lower, it requires higher temperature to reach the same
exotherm detection criteria compared other tests. So, the abnormal increase of onset
temperature under 0.03 wt% should be caused by the reduction of heat of reaction.
4.2.5 Evaluation of key safety parameters
When a chemical is decided to be employed in the process, it is important to determine
the safe process conditions to ensure the compatibility between chemical and the process
environment. So, based on the investigation of the impact of iron oxide on the reactive
hazards of MEKPO, some key safety parameters were studied in this research for the
purpose of maintaining safety operation in industry. The estimation of these key safety
parameters can directly serve industry in determination of the safer process condition. In
this research, two safety parameters were investigated: time to maximum rate and self
accelerating decomposition temperature.
a. Time to maximum rate
Time to maximum rate (TMR) is defined as the time required for runaway reactions to
reach the maximum self-heating rate. This parameter indicates the time available for
taking defensive or mitigation measures in the case of process upset 74. TMR is a critical
important parameter used in the safety evaluation of processes where reactive chemicals
are used. TMR is normally determined through calorimetry test under an adiabatic
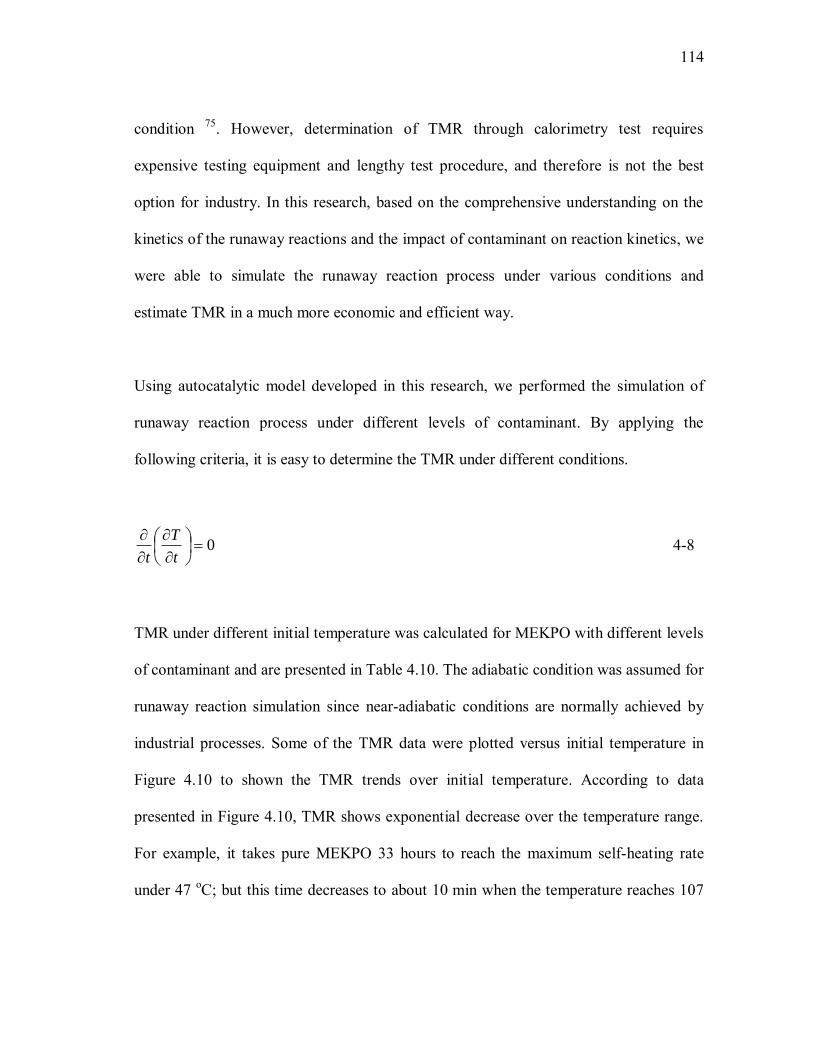
114
114
condition 75. However, determination of TMR through calorimetry test requires
expensive testing equipment and lengthy test procedure, and therefore is not the best
option for industry. In this research, based on the comprehensive understanding on the
kinetics of the runaway reactions and the impact of contaminant on reaction kinetics, we
were able to simulate the runaway reaction process under various conditions and
estimate TMR in a much more economic and efficient way.
Using autocatalytic model developed in this research, we performed the simulation of
runaway reaction process under different levels of contaminant. By applying the
following criteria, it is easy to determine the TMR under different conditions.
0
t
T
t 4-8
TMR under different initial temperature was calculated for MEKPO with different levels
of contaminant and are presented in Table 4.10. The adiabatic condition was assumed for
runaway reaction simulation since near-adiabatic conditions are normally achieved by
industrial processes. Some of the TMR data were plotted versus initial temperature in
Figure 4.10 to shown the TMR trends over initial temperature. According to data
presented in Figure 4.10, TMR shows exponential decrease over the temperature range.
For example, it takes pure MEKPO 33 hours to reach the maximum self-heating rate
under 47 oC; but this time decreases to about 10 min when the temperature reaches 107
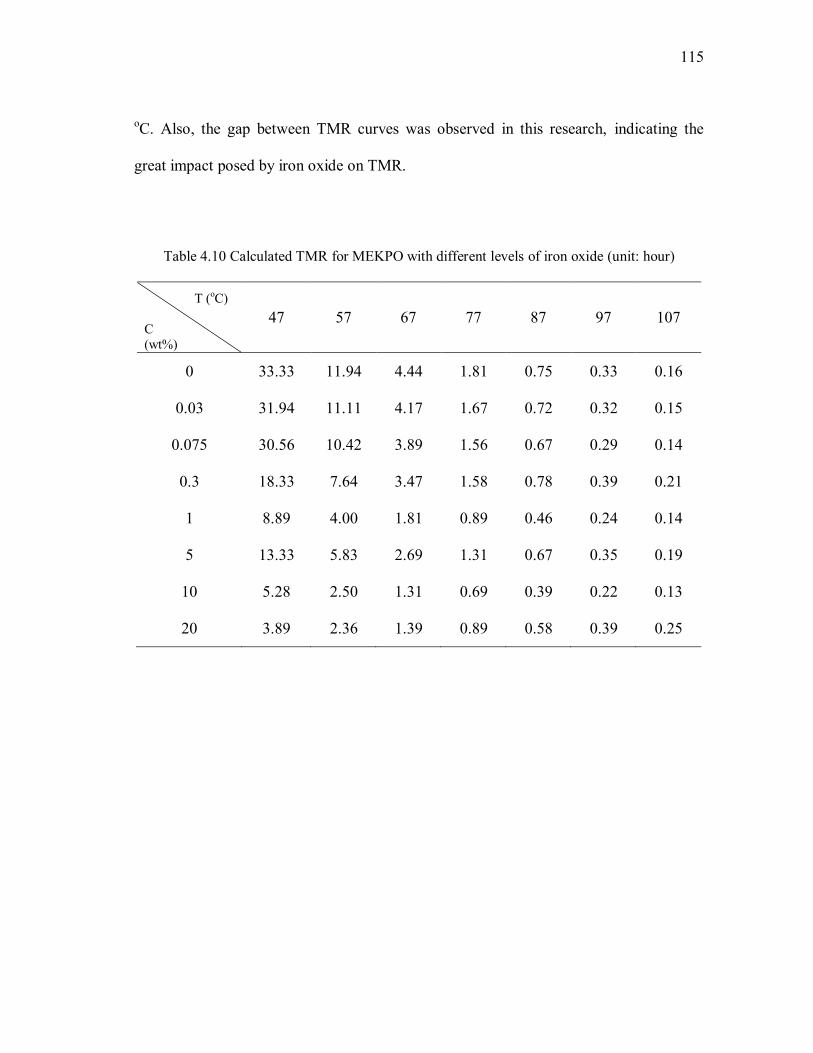
115
115
oC. Also, the gap between TMR curves was observed in this research, indicating the
great impact posed by iron oxide on TMR.
Table 4.10 Calculated TMR for MEKPO with different levels of iron oxide (unit: hour)
T (oC) C (wt%)
47 57 67 77 87 97 107
0 33.33 11.94 4.44 1.81 0.75 0.33 0.16
0.03 31.94 11.11 4.17 1.67 0.72 0.32 0.15
0.075 30.56 10.42 3.89 1.56 0.67 0.29 0.14
0.3 18.33 7.64 3.47 1.58 0.78 0.39 0.21
1 8.89 4.00 1.81 0.89 0.46 0.24 0.14
5 13.33 5.83 2.69 1.31 0.67 0.35 0.19
10 5.28 2.50 1.31 0.69 0.39 0.22 0.13
20 3.89 2.36 1.39 0.89 0.58 0.39 0.25
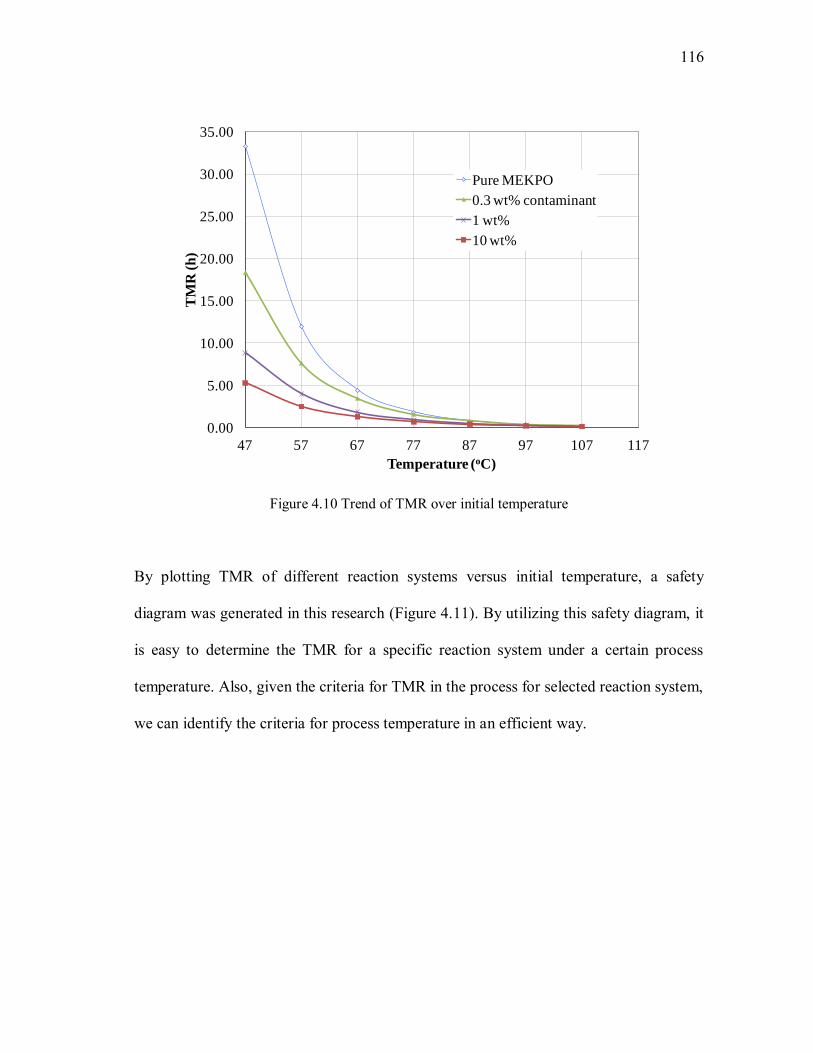
116
116
0.00
5.00
10.00
15.00
20.00
25.00
30.00
35.00
47 57 67 77 87 97 107 117
TM
R (
h)
Temperature (oC)
Pure MEKPO
0.3 wt% contaminant
1 wt%
10 wt%
Figure 4.10 Trend of TMR over initial temperature
By plotting TMR of different reaction systems versus initial temperature, a safety
diagram was generated in this research (Figure 4.11). By utilizing this safety diagram, it
is easy to determine the TMR for a specific reaction system under a certain process
temperature. Also, given the criteria for TMR in the process for selected reaction system,
we can identify the criteria for process temperature in an efficient way.

117
117
0.10
1.00
10.00
100.00
40 60 80 100 120
TM
R (
h)
Temperature (oC)
Pure
0.03 wt%
0.3 wt%
1 wt%
20 wt%
Figure 4.11 TMR safety diagram (Φ=1)
According to the TMR curves presented in Figure 4.11, in the contaminant concentration
range of 0 to 0.075 wt%, TMR does not show big difference between MEKPO with
different contaminant levels since these curves are quite close to each other. Under 0.3
wt% iron oxide, even though onset temperature of the reaction system is as the same as
pure MEKPO, significant reduction of TMR was observed: under the same temperature
(320 K), TMR is 18 hours for MEKPO with 0.3 wt% compared with 102 hours TMR for
pure MEKPO. This reduction of TMR is caused by the change of kinetic parameters,
which lead to the change of reaction rate. When contaminant concentration is beyond 0.3
wt%, TMR decreases dramatically with the increase of the contaminant concentration.
However, the gap between TMR curves becomes less and less significant with the

118
118
increase of the initial temperature. With the increase of the initial temperature, the
different of TMR between different reaction systems starts to decrease, indicating less
influence on TMR from iron oxide. This is because when the process temperature is
already high especially when it is above onset temperature, all reaction systems quickly
join runaway reaction and there is very limited time available to response.
The analysis of TMR of different reaction systems shows that certain level of iron oxide
(>0.3 wt%) can significantly decrease the TMR for the process and therefore intensify
the hazard associate with the process.
b. Self accelerating decomposition temperature
Self accelerating decomposition temperature (SADT) is a parameter developed by the
UN Recommendations for transportation process of organic peroxide or other self-
reactive substance packaged 10. It is defined as the lowest ambient temperature at which
the temperature increase of a chemical substance is at least 6 oC in a specified
commercial package during a period of seven days or less. Transportation temperatures
can be derived from the SADT according to the recommendations given by the UN
committee of Experts on Transport of Dangerous Goods. In common practice, SADT is
the maximum temperature allowed for short-term storage to avoid potential runaway
reaction.
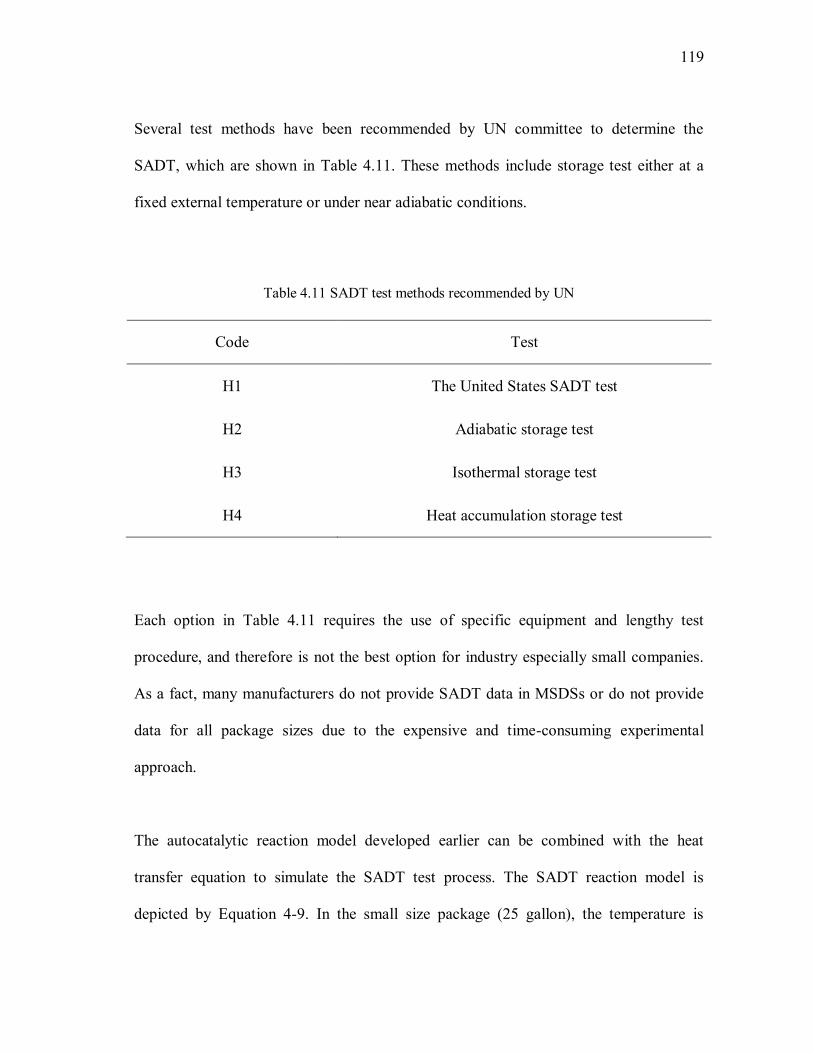
119
119
Several test methods have been recommended by UN committee to determine the
SADT, which are shown in Table 4.11. These methods include storage test either at a
fixed external temperature or under near adiabatic conditions.
Table 4.11 SADT test methods recommended by UN
Code Test
H1 The United States SADT test
H2 Adiabatic storage test
H3 Isothermal storage test
H4 Heat accumulation storage test
Each option in Table 4.11 requires the use of specific equipment and lengthy test
procedure, and therefore is not the best option for industry especially small companies.
As a fact, many manufacturers do not provide SADT data in MSDSs or do not provide
data for all package sizes due to the expensive and time-consuming experimental
approach.
The autocatalytic reaction model developed earlier can be combined with the heat
transfer equation to simulate the SADT test process. The SADT reaction model is
depicted by Equation 4-9. In the small size package (25 gallon), the temperature is

120
120
assumed to be uniformly distributed because of the relative large ratio of surface area to
volume. The value of parameters used in the heat transfer equation are collected from
literature 76.
)(0
0 aP TTUSdt
dHM
dt
dTMC
4-9
where ϕ is thermal inertia factor, Ta is the ambient temperature; CP is the heat capacity
of the reaction system, U is heat transfer coefficient, T is the temperature in the package,
S is wetted surface area, M is the mass of reactant, α is the conversion rate.
An example of determining SADT for pure MEKPO in 25 gallon package is shown in
Figure 4.12. In this approach, by utilizing the reaction model, SADT test process can be
simulated under different ambient temperature until finding the one which meets the
definition of SADT. The simulated SADT for pure MEKPO in 25 gallon is 354 K, and is
quite close to the experimental date obtained from the vendor (349 K). The small
difference between the calculated and experimental SADT implies that determining
SADT through reaction modeling is a reliable approach for some package sizes. The
calculated SADT for MEKPO with different levels of iron oxide is presented in Table
4.12.

121
121
345
350
355
360
365
370
375
0 2 4 6 8
Tem
per
atu
re (k
)
Time (day)
350 K
352 K
354 K
355 K
4.7 day
Figure 4.12 Determine SADT through reaction modeling for pure MEKPO in 25 gallon package
According to the data presented in Table 4.12, SADT shows little variation with the
increase of contaminant concentration. When contaminant concentration reached 10
wt%, SADT only decreased by 7oC. Compared with trend of onset temperature, SADT
shows less decrease over the contaminant concentration range. This phenomenon is
caused by the fact that SADT test is conducted in a non-adiabatic environment. Under
this condition, heat generated by the exothermic reaction can be transferred to the
environment and lead to the less impact on SADT. Only when the heat transfer
equilibrium is broken by the increase of reaction rate when contaminant concentration is
further increased (20 wt%), SADT started to decease significantly.

122
122
Table 4.12 Determination of SADT for MEKPO in 25 gallon package
Contaminant (wt%) SADT (oC) T0 (oC)
0 81 86
0.03 80 97
0.075 78 86
0.3 79 86
1 71 76
5 75 69
10 74 66
20 63 58
4.4 Conclusions and discussion
Through the analysis of calorimetric data, kinetic investigation and further estimation of
key safety parameters, the role played by iron oxide was studied and the impact imposed
by iron oxide on runaway reactions was evaluated. Based on the results of
comprehensive analysis, it was found that the role played by iron oxide depends on its
concentration and different reaction mechanisms were involved in the runaway reaction
of MEKPO.
Iron oxide has almost no effect on runaway reaction when the contaminant concentration
is below 0.075 wt%. Within this concentration range, the runaway reaction follows the
same reaction mechanism and kinetics as pure MEKPO. As the result, all the important
123
123
calorimetric parameters observed keep in the same level, indicating no change occurred
on reactive hazards. Also, the estimation of key safety parameters indicates that within
this range, iron oxide shows no impact on the safety of process operations where
MEKPO is employed.
Iron oxide starts to play a role in runaway reaction when its concentration reaches 0.3
wt%. Within the concentration range of 0.3 – 10 wt%, iron oxide acts as a catalyst for
the runaway reaction, leading to the decrease of the activation energy. The runaway
reaction still follows the same reaction mechanism as before according to consistent heat
of reaction and gas generation. Because of the change in kinetics, MEKPO becomes
more unstable but the reaction becomes less severe according to the maximum self-
heating rate and pressure rate data. According to the analysis of key safety parameters,
within this concentration range, we have less response time when the process upset
occurs because of the decrease of TMR. However, the transportation conditions are not
greatly affected by the presence of iron oxide within this range due to the small change
of SADT.
When iron oxide falls into the high concentration range (>10 wt%), the kinetics of the
runaway reaction keeps on changing with activation energy and frequency factor
decreasing. Therefore, the stability of MEKPO keeps on decreasing as well as the
maximum reaction rate. Within this range, heat of reaction is higher than other tests,
indicating the change of reaction mechanism. Because of the higher heat of reaction, the
124
124
reaction system can reach higher temperature and initiate another reaction. This reaction
is represented by the second peak in self-heating rate and gas generation rate curves
shown in Figure 4.13a and 4.13b. This secondary reaction is associated with lower
thermal hazard because of its relative low self-heating rate. However, this reaction
presents great non-condensable gas pressure hazard. The analysis of key safety
parameters indicates that high level iron oxide (>10 wt%) has great impact on TMR and
SADT and therefore affects the safety of process operations.
According to the investigation results, iron oxide does not present significant impact on
operational safety since it normally remains in a very low level in the process. In this
case, carbon steel still can be used to fabricate process equipment handling MEKPO.
Also mechanical integrity program should be employed by industry to monitor the level
of iron oxide through periodic inspection. The information presented in this chapter such
as TMR and SADT can help industry to determine the safer process conditions.

125
125
1.00E-07
1.00E-06
1.00E-05
1.00E-04
1.00E-03
1.00E-02
1.00E-01
1.00E+00
1.00E-04
1.00E-03
1.00E-02
1.00E-01
1.00E+00
1.00E+01
1.00E+02
1.00E+03
0 50 100 150 200 250
dn
/dt
(mol/
min
)
dT
/dt
(oC
/min
)
Temperature (oC)
Self-heating rate
Gas generation rate
a. 10 wt%
1.00E-07
1.00E-06
1.00E-05
1.00E-04
1.00E-03
1.00E-02
1.00E-01
1.00E+00
1.00E-02
1.00E-01
1.00E+00
1.00E+01
1.00E+02
1.00E+03
0 50 100 150 200 250 300
dn
/dt
(mo
l/m
in)
dT
/dt
(oC
/min
)
Temperature (oC)
Self heating rate
Gas generation
rate
b. 20 wt%
Figure 4.13 Analysis of runaway reaction mechanism

126
126
CHAPTER V
CONCLUSIONS AND RECOMMENDATIONS
5.1 Conclusions
A systemic methodology for chemical hazard assessment was developed in this research
through the combination of theoretical work and experimental work. This methodology
includes the selection of safer reactive chemicals for the process and the determination
of safer process conditions.
In the selection of safer chemical part, two prediction models were derived, which can
make predictions on onset temperature and heat of reaction of organic peroxides.
Through sensitivity analysis of these models, molecular properties such as activation
energy and atomic charge of oxygen were found to contribute to the reactive hazards.
Also, out of the three hazard indices examined in this research, RHI was determined to
be the one most suitable for organic peroxides. By combing prediction models and RHI,
we are able to quickly predict hazards properties for a large number of organic peroxides
and classify them according the reactive hazards associated.
In the part of determining safer process conditions, as a case study, the incompatibility
of MEKPO with iron oxide as the contaminant was investigated. We found that the
impact of iron oxide on reactive hazards and operational safety depends on the level of
iron oxide in the process. Iron oxide presents almost no impact on reactive hazards as
127
127
well as operational safety in low concentration (<0.075 wt%). However, once the
concentration of iron oxide exceeds 0.3 wt%, it starts to change kinetics of the runaway
reaction and make MEKPO more unstable. The impact of iron oxide also leads to the
shorter TMR. With the further increase of contaminant concentration (>10 wt%),
runaway reaction follows a different reaction mechanism, which leads to the increase of
heat of reaction. Also, within this concentration range, a secondary reaction is initiated
when reaction system reaches higher temperature. The secondary reaction presents great
non-condensable gas pressure hazard to the process. The presence of high level of iron
oxide shows great negative influence on TMR and SADT and therefore presents
significant effects on the safety of process operations.
This chemical hazard assessment methodology provides industry a feasible approach to
minimize the hazards associated with the process by selecting the right chemical and
determining the right process conditions. This methodology can be combined with ISD
principles in the process design to make the process inherently safe.
5.2 Recommendations for future work
In the further work, investigation on the reaction mechanism is recommended to study
the change of reaction mechanism occurred with the presence of high level of iron oxide.
The reaction mechanism of MEKPO runaway reaction can be studied by using
equipment such as Gas Chromatography (GC) and High Performance Liquid
Chromatography (HPLC). These equipment can analyze the composition of the residual
of the reaction system and gaseous products produced during the reaction process, based
128
128
on which the reaction pathway can be speculated. Molecular simulation can also be
employed in the future research to identify the elementary reactions involved in the
runaway reaction of MEKPO, which are difficult to be investigated through
experimental approach.
Integrating process optimization into the design of inherently safer process could be
another direction for future research in this area. By combing process optimization with
the ISD technique, it is expected to reach the balance between process safety and process
efficiency in the process design. For example, safety constraints such as onset
temperature and TMR obtained from this research can be applied in the process
optimization to ensure the process meets the safety criteria. Meanwhile, important
considerations in process optimization such as process efficiency and energy cost can be
used when selecting safer chemicals for processes.
129
129
REFERENCES 1. Improving Reactive Hazard Management; CSB: Washington, DC, 2002. 2. Overton, T.; King, G. M. Inherently safer technology: An evolutionary approach. Process Saf. Prog. 2006, 25, 116. 3. Carrithers, G.; Dowell, A.; Hendershot, D. It's never too late for inherent safety, International Conference and Workshop on Process Safety Management and Inherently Safer Processes, Orlando, FL, October 8-11, 1996; AICHE: New York, 1996. 4. Mannan, M. S. Challenges in implementing inherent safety principles in new and existing chemical processes. Mary Kay O'Connor Process Safety Center, Texas A&M
University, College Station, Texas, 2002. 5. Bollinger, R. E.; Crowl, D. A. Inherently Safer Chemical Processes: A Life Cycle
Approach; CCPS/AIChE: New York, 1997. 6. Kletz, T. A. Plant Design for Safety: A User-Friendly Approach; Taylor & Francis: London, 1991. 7. Khan, F. I.; Amyotte, P. R. How to make inherent safety practice a reality. Can.
J. Chem. Eng. 2003, 81, 2. 8. Fauske, H. K. The reactive system screening tool (RSST): An easy, inexpensive approach to the DIERS procedure. Process Saf. Prog. 1998, 17, 190. 9. Freire, E. Differential scanning calorimetry. Methods Mol. Biol 1995, 40, 191. 10. UN Recommendations on the Transport of Dangerous Goods. Manual of Tests
and Criteria; United Nations: New York and Geneva, 2002. 11. Noller, D.; Mazurowski, S.; Linden, G.; De Leeuw, F.; Mageli, O. A relative hazard classification of organic peroxides. J. Ind. Eng. Chem. 1964, 56, 18. 12. Buchwald, P.; Bodor, N. Computer-aided drug design: the role of quantitative structure-property, structure-activity, and structure-metabolism relationships (QSPR, QSAR, QSMR). Drugs Fut. 2002, 27, 577. 13. Hansch, C. The QSAR paradigm in the design of less toxic molecules. Drug
Metab Rev. 1984, 15, 1279.

130
130
14. Gao, H.; Katzenellenbogen, J. A.; Garg, R.; Hansch, C. Comparative QSAR analysis of estrogen receptor ligands. Chem. Rev 1999, 99, 723. 15. Bradbury, S. P. Quantitative structure-activity relationships and ecological risk assessment: an overview of predictive aquatic toxicology research. Toxicol. Lett. 1995, 79, 229. 16. Shanley, E. S.; Melhem, G. A. The oxygen balance criterion for thermal hazards assessment. Process Saf. Prog. 1995, 14, 29. 17. Benassi, R.; Folli, U.; Sbardellati, S.; Taddei, F. Conformational properties and homolytic bond cleavage of organic peroxides. I. An empirical approach based upon molecular mechanics and ab initio calculations. J. Comput. Chem. 1993, 14, 379. 18. Foresman, J. B.; Frisch, A. E.; Gaussian, I. Exploring Chemistry with Electronic
Structure Methods; Gaussian, Inc.: Pittsburgh PA, 1996. 19. Swain, C. G.; Stockmayer, W. H.; Clarke, J. T. Effect of structure on the rate of spontaneous thermal decomposition of substituted benzoyl peroxides. J. Am. Chem. Soc.
1950, 72, 5426. 20. Litinskii, A. O.; Shreibert, A. I.; Balyavichus, L. M. Z.; Bolotin, A. B. Electronic structure, stability, and reactivity of alkyl peroxides. Theor. Exp. Chem. 1974, 7, 673. 21. Khursan, S. L.; Antonovsky, V. L. Structure, thermochemistry, and conformational analysis of peroxides ROOR and hydroperoxides ROOH (R= Me, But, CF3). Russ. Chem. Bull. 2003, 52, 1312. 22. Chermette, H. Chemical reactivity indexes in density functional theory. J.
Comput. Chem. 1999, 20, 129. 23. Fayet, G.; Joubert, L.; Rotureau, P.; Adamo, C. On the use of descriptors arising from the conceptual density functional theory for the prediction of chemicals explosibility. Chem. Phys. Lett. 2009, 467, 407. 24. Fayet, G.; Rotureau, P.; Joubert, L.; Adamo, C. On the prediction of thermal stability of nitroaromatic compounds using quantum chemical calculations. J. Hazard.
Mater. 2009, 171, 845. 25. Parr, R. G.; Szentpaly, L.; Liu, S. Electrophilicity index. J. Am. Chem. Soc. 1999, 121, 1922. 26. Mulliken, R. S. A new electroaffinity scale; together with data on valence states and on valence ionization potentials and electron affinities. J. Chem. Phys. 1934, 2, 782.

131
131
27. Parr, R. G.; Pearson, R. G. Absolute hardness: companion parameter to absolute electronegativity. J. Am. Chem. Soc. 1983, 105, 7512. 28. Iwata, Y.; Momota, M.; Koseki, H. Thermal risk evaluation of organic peroxide by automatic pressure tracking adiabatic calorimeter. J. Therm. Anal. Calorim. 2006, 85, 617. 29. Lu, Y.; Ng, D.; Miao, L.; Mannan, M. S. Key observations of cumene hydroperoxide concentration on runaway reaction parameters. Thermochimica Acta
2010, 501, 65. 30. Materials Studio 2.2; Accelrys Inc.: San Deigo, CA, 2001. 31. Höskuldsson, A. PLS regression methods. J. Chemom. 1988, 2, 211. 32. Fang, L.; Huang, J.; Yu, G.; Li, X. Quantitative structure-property relationship studies for direct photolysis rate constants and quantum yields of polybrominated diphenyl ethers in hexane and methanol. Ecotoxicol. Environ. Saf. 2009, 72, 1587. 33. Roy, K.; Ghosh, G. QSTR with extended topochemical atom (ETA) indices. 12. QSAR for the toxicity of diverse aromatic compounds to Tetrahymena pyriformis using chemometric tools. Chemosphere 2009, 77, 999. 34. Wold, S.; Ruhe, A.; Wold, H.; Dunn III, W. The collinearity problem in linear regression. The partial least squares (PLS) approach to generalized inverses. SIAM J Sci
Stat Comp. 1984, 5, 735. 35. Becke, A. D. Density-functional thermochemistry. III. The role of exact exchange. J. Chem. Phys. 1993, 98, 5648. 36. Lee, C.; Yang, W.; Parr, R. G. Development of the Colle-Salvetti correlation-energy formula into a functional of the electron density. Phys. Rev. B: Condens. Matter
1988, 37, 785. 37. Frisch, M. J.; Trucks, G. W.; Schlegel, H. B.; Scuseria, G. E.; Robb, M. A.; Cheeseman, J. R.; Montgomery, J. A.; Vreven, T.; Kudin, K. N.; Burant, J. C.; Millam, J. M.; Iyengar, S. S.; Tomasi, J.; Barone, V.; Mennucci, B.; Cossi, M.; Scalmani, G.; Rega, N.; Petersson, G. A.; Nakatsuji, H.; Hada, M.; Ehara, M.; Toyota, K.; Fukuda, R.; Hasegawa, J.; Ishida, M.; Nakajima, T.; Honda, Y.; Kitao, O.; Nakai, H.; Klene, M.; Li, X.; Knox, J. E.; Hratchian, H. P.; Cross, J. B.; Bakken, V.; Adamo, C.; Jaramillo, J.; Gomperts, R.; Stratmann, R. E.; Yazyev, O.; Austin, A. J.; Cammi, R.; Pomelli, C.; Ochterski, J. W.; Ayala, P. Y.; Morokuma, K.; Voth, G. A.; Salvador, P.; Dannenberg, J. J.; Zakrzewski, V. G.; Dapprich, S.; Daniels, A. D.; Strain, M. C.; Farkas, O.; Malick, D. K.; Rabuck, A. D.; Raghavachari, K.; Foresman, J. B.; Ortiz, J. V.; Cui, Q.; Baboul, A.

132
132
G.; Clifford, S.; Cioslowski, J.; Stefanov, B. B.; Liu, G.; Liashenko, A.; Piskorz, P.; Komaromi, I.; Martin, R. L.; Fox, D. J.; Keith, T.; Laham, A.; Peng, C. Y.; Nanayakkara, A.; Challacombe, M.; Gill, P. M. W.; Johnson, B.; Chen, W.; Wong, M. W.; Gonzalez, C.; Pople, J. A. Gaussian 03, Revision C.02; Gaussian, Inc.: Wallingford, CT, 2003. 38. Ii, R. D.; Keith, T.; Millam, J.; Eppinnett, K.; Hovell, W. L.; Gilliland, R. GaussView, Version 3.09; Semichem Inc.: Shawnee Mission, KS, 2003. 39. Hehre, W. J.; Ditchfield, R.; Pople, J. A. Self-consistent Molecular Orbital Methods. XII. Further Extensions of Gaussian-type Basis Sets for Use in Molecular Orbital Studies of Organic Molecules. J. Chem. Phys. 1972, 56, 2257. 40. Krishnan, R.; Binkley, J. S.; Seeger, R.; Pople, J. A. Self consistent molecular orbital methods. XX. A basis set for correlated wave functions. J. Chem. Phys. 1980, 72, 650. 41. Frisch, M. J.; Pople, J. A.; Binkley, J. S. Self consistent molecular orbital methods 25. Supplementary functions for Gaussian basis sets. J. Chem. Phys. 1984, 80, 3265. 42. Stull, D. R. Linking thermodynamics and kinetics to predict chemical hazards. J.
Chem. Educ. 1974, 51, A21. 43. Wang, Q.; Rogers, W.; Mannan, M. Thermal risk assessment and rankings for reaction hazards in process safety. J. Therm. Anal. Calorim. 2009, 98, 225. 44. Zhimin, F.; Jinyin, H.; Liang, M.; Weiguo, Y.; Aihong, J. In Classification for
Thermal Stability of 17 Reactive Chemical Substances, Proceedings of the 2006 International Symposium on Safety Science and Technology, Shanghai, China, October, 24-27, 2006; China Occupational Safety and Health Association: 2006. 45. Höhne, G.; Hemminger, W.; Flammersheim, H. J. Differential Scanning
Calorimetry; Springer Verlag: New York, 2003. 46. Carreto-Vazquez, V. H.; Hernandez, I.; Ng, D.; Rogers, W. J.; Mannan, M. S. Inclusion of pressure hazards into NFPA 704 instability rating system. J. Loss Prev.
Process Ind. 2010, 23, 30. 47. APTAC Operation Manual; Arthur D. Little: Boston, 1999. 48. Incropera, F. P.; De Witt, D. P.; Bergman, T. L.; Lavine, A. S.; DeWitt, B.; Dewitt, D. P.; Van Hove, L.; DeWitt-Morette, C.; Cartier, P. Fundamentals of Heat and
Mass Transfer; John Wiley and Sons Inc.: New York, 1985.

133
133
49. Kossoy, A.; Akhmetshin, Y. Identification of kinetic models for the assessment of reaction hazards. Process Saf. Prog. 2007, 26, 209. 50. Yaws, C. L. Chemical Properties Handbook: Physical, Thermodynamic,
Environmental, Transport, Safety, and Health Related Properties for Organic and
Inorganic Chemicals; McGraw-Hill: New York, 1999. 51. Kletz, T. A. Process Plants: A Handbook for Inherently Safer Design; CRC: Boca Raton, FL, 1998. 52. Urben, P. G.; Pitt, M. J. Bretherick's Handbook of Reactive Chemical Hazards; Elsevier: Burlington, MA, 2007. 53. Seaton, W. H.; Freedman, E.; Treweek, D. N. CHETAH-The ASTM Chemical
Thermodynamic and Energy Release Evaluation Program; American Society for Testing and Materials: Philadelphia, 1974. 54. Melhem, G.; Shanley, E. On the estimation of hazard potential for chemical substances. Process Saf. Prog. 1996, 15, 168. 55. Saraf, S.; Rogers, W.; Mannan, M. S. Application of transition state theory for thermal stability prediction. Ind. Eng. Chem. Res. 2003, 42, 1341. 56. Lobunez, W.; Rittenhouse, J. R.; Miller, J. G. The electric mometns of organic peroxides. 1. Dialkyl peroxides, alkyl hydroperoxides and diacyl peroxides. J. Am.
Chem. Soc. 1958, 80, 3505. 57. Verderame, F. D.; Miller, J. G. Electric moments of organic peroxides 3. Peresters. J. Phys. Chem. 1962, 66, 2185. 58. Litinskii, A. O.; Rakhimov, A. I.; Shatkovskaya, D. B.; Bolotin, A. B. Estimation of the stability of functional organic peroxides from the electronic structure indices and the bond energy parameters within the framework of the modified indo method. J.
Struct. Chem. 1978, 19, 342. 59. Kikuchi, O.; Hiyama, A.; Yoshida, H.; Suzuki, K. Electronic-structure and homolytic dissociation of dibenzoyl peroxide Bull. Chem. Soc. Jpn. 1978, 51, 11. 60. NFPA 704: Standard System for the Identification of the Hazards of Materials
for Emergency Response; National Fire Protection Association: Quincy, MA, 2001. 61. Belyaev, V. A.; Yablonskii, O. P.; Vinogradov, A. N.; Bystrov, V. F. Self-association of hydrocarbon hydroperoxides. Theor. Exp. Chem. 1972, 6, 110.

134
134
62. Katritzky, A. R.; Rachwal, P.; Law, K. W.; Karelson, M.; Lobanov, V. S. Prediction of polymer glass transition temperatures using a general quantitative structure- property relationship treatment. J. Chem. Inf. Comput. Sci. 1996, 36, 879. 63. Yoshida, T.; Yoshizawa, F.; Itoh, M.; Matsunaga, T.; Watanabe, M.; Tamura, M. Prediction of fire and explosion hazards of reactive chemicals. I: Estimation of explosive properties of self-reactive chemicals from SC-DSC data. Kogyo Kayaku 1987, 48, 311. 64. Fu, Z. M.; Li, X. R.; Koseki, H.; Mok, Y. S. Evaluation on thermal hazard of methyl ethyl ketone peroxide by using adiabatic method. J. Loss Prev. Process Ind.
2003, 16, 389. 65. Yeh, P.-Y.; Shu, C.-M.; Duh, Y.-S. Thermal Hazard Analysis of Methyl Ethyl Ketone Peroxide. Ind. Eng. Chem. Res. 2002, 42, 1. 66. Wang, Y.-W.; Shu, C.-M.; Duh, Y.-S.; Kao, C.-S. Thermal Runaway Hazards of Cumene Hydroperoxide with Contaminants. Ind. Eng. Chem. Res. 2001, 40, 1125. 67. Peng, D.; Chang, C.; Chiu, M. Thermal analysis of RDX with contaminants. J.
Therm. Anal. Calorim. 2006, 83, 657. 68. Cisneros, L. O.; Rogers, W. J.; Mannan, M. S.; Li, X.; Koseki, H. Effect of Iron Ion in the Thermal Decomposition of 50 mass % Hydroxylamine/Water Solutions. J.
Chem. Eng. Data 2003, 48, 1164. 69. McCloskey, C. Safe handling of organic peroxides: An overview. Plant Oper.
Prog. 2004, 8, 185. 70. Tseng, J.; Shu, C.; Yu, Y. Thermal hazard simulations for methyl ethyl ketone peroxide induced by contaminants. Korean J. Chem. Eng. 2005, 22, 797. 71. Crowl, D. A.; Louvar, J. F. Chemical Process Safety: Fundamentals with
Applications; Pearson Education Canada: Toronto, Canada, 2011. 72. Tseng, J.-M.; Shu, C.-M.; Gupta, J. P.; Lin, Y.-F. Evaluation and modeling runaway reaction of methyl ethyl ketone peroxide mixed with nitric acid. Ind. Eng.
Chem. Res. 2007, 46, 8738. 73. Liu, L.; Wei, C.; Guo, Y.; Rogers, W. J.; Sam Mannan, M. Hydroxylamine nitrate self-catalytic kinetics study with adiabatic calorimetry. J. Hazard. Mater. 2009, 162, 1217. 74. Stoessel, F. Experimental study of thermal hazards during the hydrogenation of aromatic nitro compounds. J. Loss Prev. Process Ind. 1993, 6, 79.

135
135
75. Heemskerk, A.; Hordijk, A.; Lanning, A.; Lont, J.; Schell, H.; Schuurman, P. Guidelines for Chemical Reactivity Evaluation and Application to Process Design. AIChE, New York, USA 1995. 76. Lin, W.; Wu, S.; Shiu, G.; Shieh, S.; Shu, C. Self-accelerating decomposition temperature (SADT) calculation of methyl ethyl ketone peroxide using an adiabatic calorimeter and model. J. Therm. Anal. Calorim. 2009, 95, 645.

136
APPENDIX
Table A1. List of descriptors calculated for 16 organic peroxides used in this study
QO Ea dOO NP OB MW DM ∠ROOR’
∠ROO
εHOMO εLUMO Η µ ω C
1 -0.444 17.64 1.473 1 -261.16 208.3 0.498 156.21 107.68 -0.226 -0.005 0.220 -0.115 0.030 0.94
2 -0.450 16.84 1.474 1 -266.27 270.4 0.364 157.15 107.59 -0.228 -0.012 0.216 -0.120 0.033 0.98
3 -0.442 18.65 1.473 1 -251.71 146.2 0.438 160.31 107.59 -0.222 0.032 0.254 -0.095 0.018 0.98
4 -0.584 9.88 1.439 1 -191.58 242.2 0.019 177.41 108.80 -0.264 -0.058 0.206 -0.161 0.063 0.7
5 -0.507 8.90 1.445 1 -268.94 398.6 0.882 84.90 111.07 -0.282 -0.010 0.272 -0.146 0.039 0.97
6 -0.473 14.66 1.451 1 -214.21 194.2 2.677 116.24 110.21 -0.261 -0.047 0.213 -0.154 0.055 0.98
7 -0.450 15.54 1.454 1 -181.54 132.2 2.458 117.22 110.26 -0.269 0.007 0.276 -0.131 0.031 0.55
8 -0.447 13.03 1.474 2 -248.60 302.5 1.123 143.22 108.01 -0.227 0.018 0.245 -0.104 0.022 0.92
9 -0.461 14.24 1.471 2 -225.35 234.3 1.078 153.33 107.56 -0.227 0.020 0.248 -0.103 0.022 0.5
10 -0.471 18.29 1.473 2 -247.93 290.4 0.806 162.25 107.70 -0.222 0.030 0.252 -0.096 0.018 0.9
11 -0.362 2.97 1.483 1 -145.96 230.2 0.378 173.32 105.83 -0.251 -0.063 0.187 -0.157 0.066 0.34
12 -0.317 29.99 1.459 1 -231.27 152.2 1.536 114.07 104.31 -0.243 -0.007 0.236 -0.125 0.033 0.88
13 -0.458 13.27 1.450 1 -227.27 246.4 1.890 116.16 109.31 -0.271 0.009 0.280 -0.131 0.031 0.95
14 -0.442 15.32 1.469 2 -233.49 260.4 1.139 137.60 109.32 -0.233 0.023 0.256 -0.105 0.021 0.80
15 -0.440 7.77 1.464 3 -144.62 210.2 1.285 138.71 108.05 -0.254 -0.014 0.240 -0.134 0.037 0.35
16 -0.316 30.59 1.458 1 -195.34 90.1 1.789 110.95 104.48 -0.254 0.031 0.286 -0.112 0.022 0.61
137
137
VITA
Name: Yuan Lu
Address: Room 420, Jack E. Brown Building, 3122 TAMU, Texas A&M
University, College Station, TX 77843
Email Address: [email protected]
Education: B.S., Biochemical Engineering, East China University of Science and
Technology, 2003
M.S., Fermentation Engineering, East China University of Science
and Technology, 2006
M.S., Chemical Engineering, Texas A&M University, 2008