Integrating Biogeochemical and Price Forecasting...
17
Integrating Biogeochemical and Price Forecasting Models to Predict Bioenergy Crop Supply and Environmental Impacts S.M. Swinton, A. Egbendewe-Mondzozo, S. Kang, W.M. Post, W. Thompson & J.C. Binfield Michigan State U., U. Lomé, Oak Ridge Nat. Lab & U. Missouri
Transcript of Integrating Biogeochemical and Price Forecasting...
Integrating Biogeochemical and Price
Forecasting Models to Predict Bioenergy
Crop Supply and Environmental Impacts
S.M. Swinton, A. Egbendewe-Mondzozo, S. Kang, W.M. Post, W. Thompson & J.C. Binfield
Michigan State U., U. Lomé, Oak Ridge Nat. Lab & U. Missouri
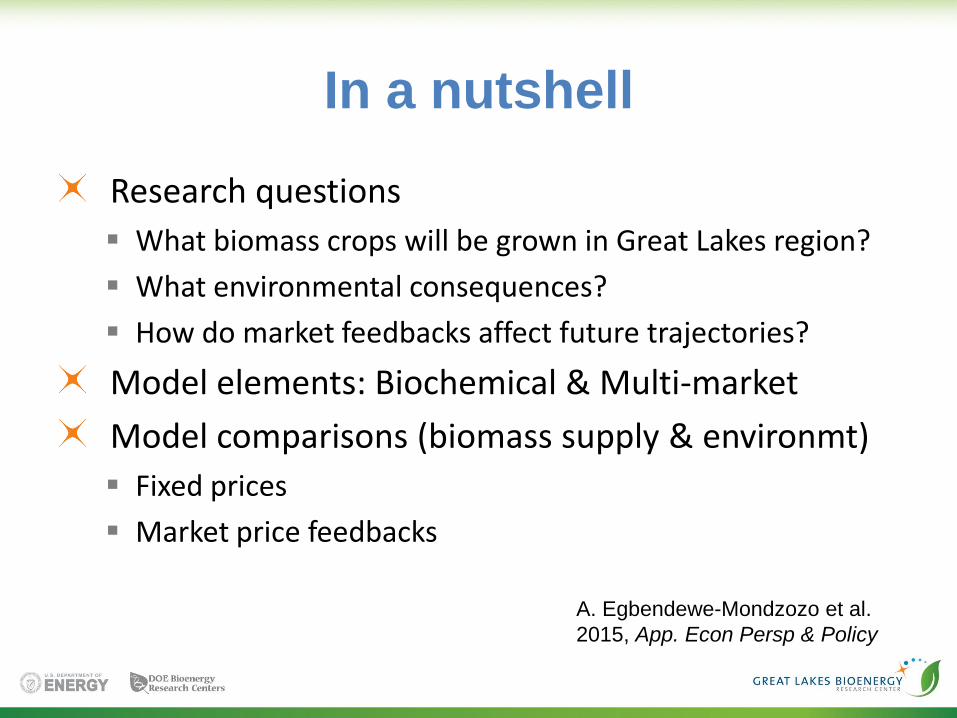
In a nutshell
Research questions
What biomass crops will be grown in Great Lakes region?
What environmental consequences?
How do market feedbacks affect future trajectories?
Model elements: Biochemical & Multi-market
Model comparisons (biomass supply & environmt)
Fixed prices
Market price feedbacks
A. Egbendewe-Mondzozo et al.
2015, App. Econ Persp & Policy
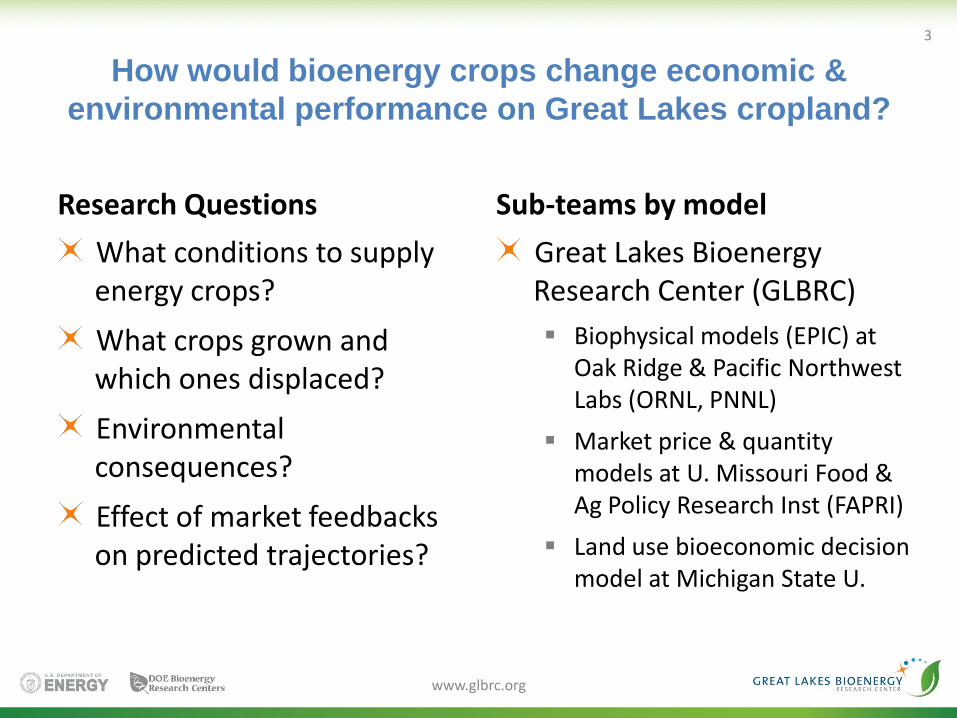
How would bioenergy crops change economic &
environmental performance on Great Lakes cropland?
Research Questions
What conditions to supply energy crops?
What crops grown and which ones displaced?
Environmental consequences?
Effect of market feedbacks on predicted trajectories?
Sub-teams by model
Great Lakes Bioenergy Research Center (GLBRC)
Biophysical models (EPIC) at Oak Ridge & Pacific Northwest Labs (ORNL, PNNL)
Market price & quantity models at U. Missouri Food & Ag Policy Research Inst (FAPRI)
Land use bioeconomic decision model at Michigan State U.
www.glbrc.org
3
www.glbrc.org
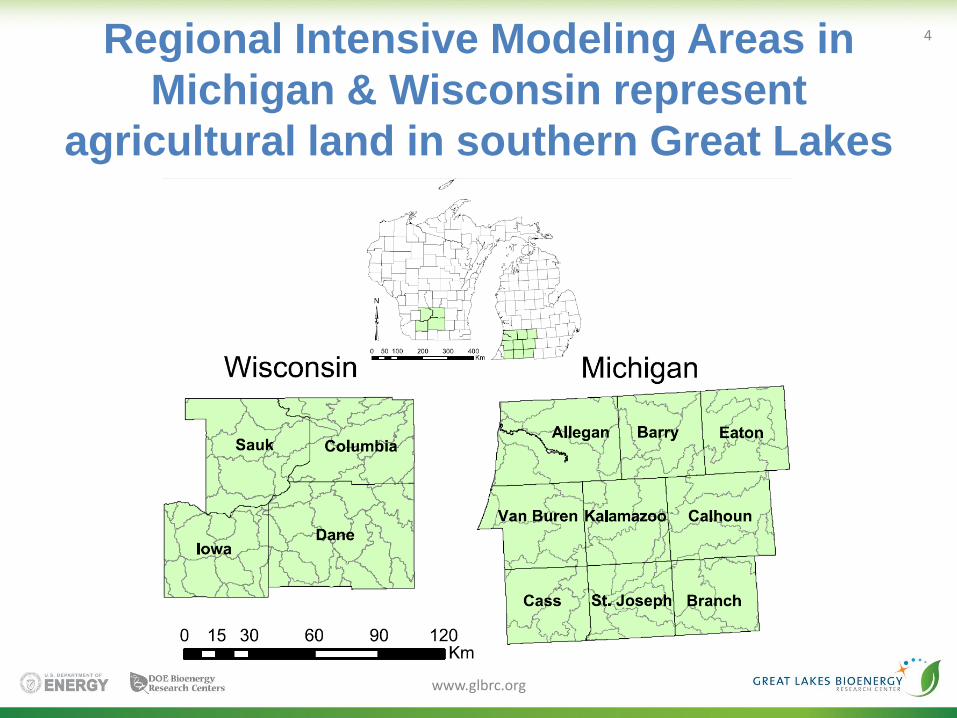
4 Regional Intensive Modeling Areas in
Michigan & Wisconsin represent
agricultural land in southern Great Lakes
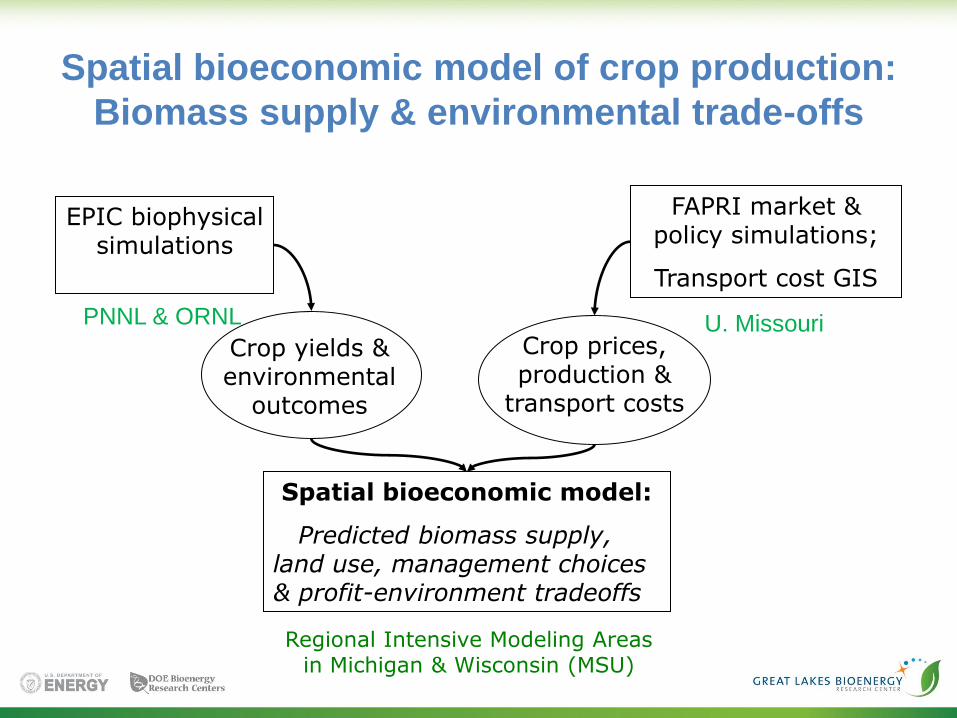
Spatial bioeconomic model:
Predicted biomass supply, land use, management choices & profit-environment tradeoffs
EPIC biophysical simulations
Crop yields & environmental
outcomes
Crop prices, production &
transport costs
FAPRI market & policy simulations;
Transport cost GIS
Spatial bioeconomic model of crop production:
Biomass supply & environmental trade-offs
PNNL & ORNL U. Missouri
Regional Intensive Modeling Areas in Michigan & Wisconsin (MSU)
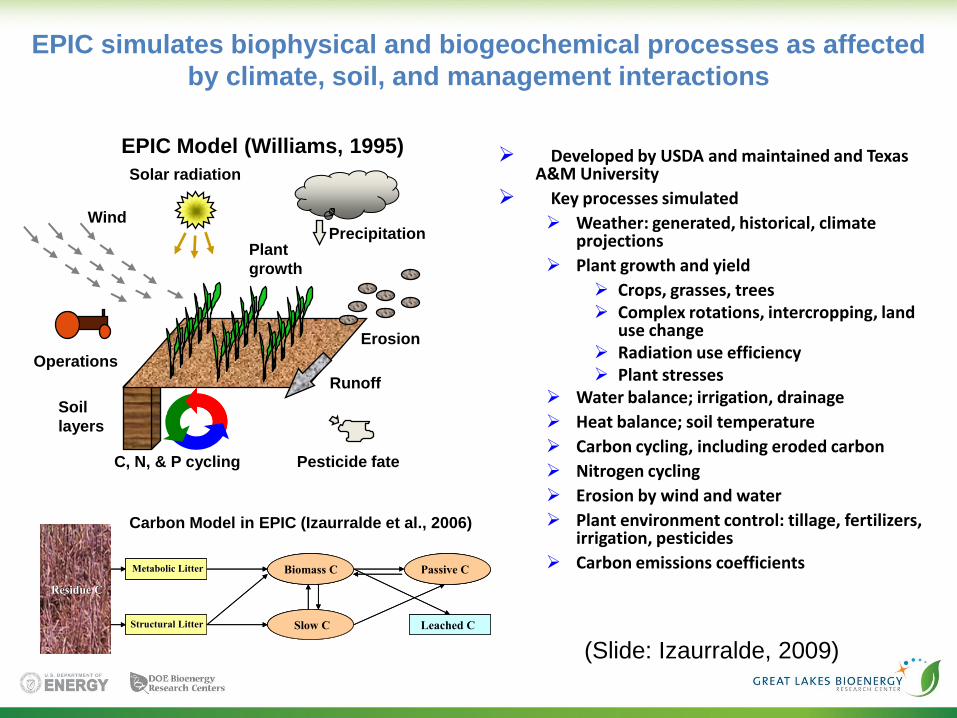
EPIC simulates biophysical and biogeochemical processes as affected
by climate, soil, and management interactions
Developed by USDA and maintained and Texas A&M University
Key processes simulated
Weather: generated, historical, climate projections
Plant growth and yield
Crops, grasses, trees Complex rotations, intercropping, land
use change Radiation use efficiency Plant stresses
Water balance; irrigation, drainage
Heat balance; soil temperature
Carbon cycling, including eroded carbon
Nitrogen cycling
Erosion by wind and water
Plant environment control: tillage, fertilizers, irrigation, pesticides
Carbon emissions coefficients
Erosion
Operations
Pesticide fate
EPIC Model (Williams, 1995)
Precipitation
C, N, & P cycling
Plant
growth
Soil
layers
Solar radiation
Runoff
Wind
Residue CResidue C
Metabolic LitterMetabolic Litter Biomass C Passive C
Slow C Leached CStructural LitterStructural Litter
Residue CResidue C
Metabolic LitterMetabolic Litter Biomass CBiomass C Passive CPassive C
Slow CSlow C Leached CLeached CStructural LitterStructural Litter
Carbon Model in EPIC (Izaurralde et al., 2006)
(Slide: Izaurralde, 2009)
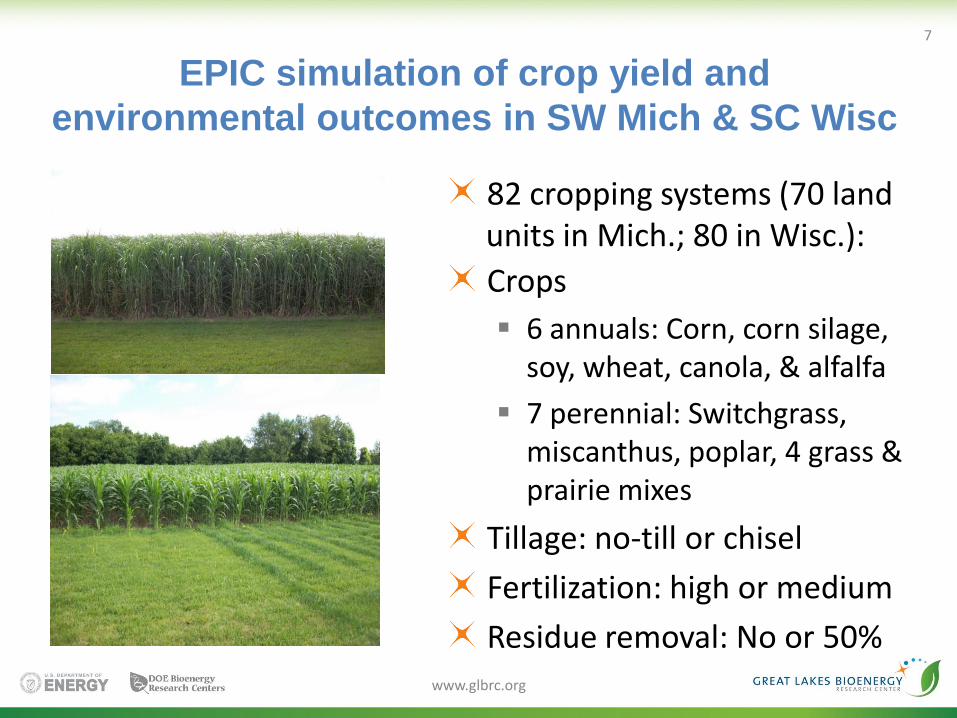
EPIC simulation of crop yield and
environmental outcomes in SW Mich & SC Wisc
82 cropping systems (70 land units in Mich.; 80 in Wisc.):
Crops
6 annuals: Corn, corn silage, soy, wheat, canola, & alfalfa
7 perennial: Switchgrass, miscanthus, poplar, 4 grass & prairie mixes
Tillage: no-till or chisel
Fertilization: high or medium
Residue removal: No or 50% www.glbrc.org
7
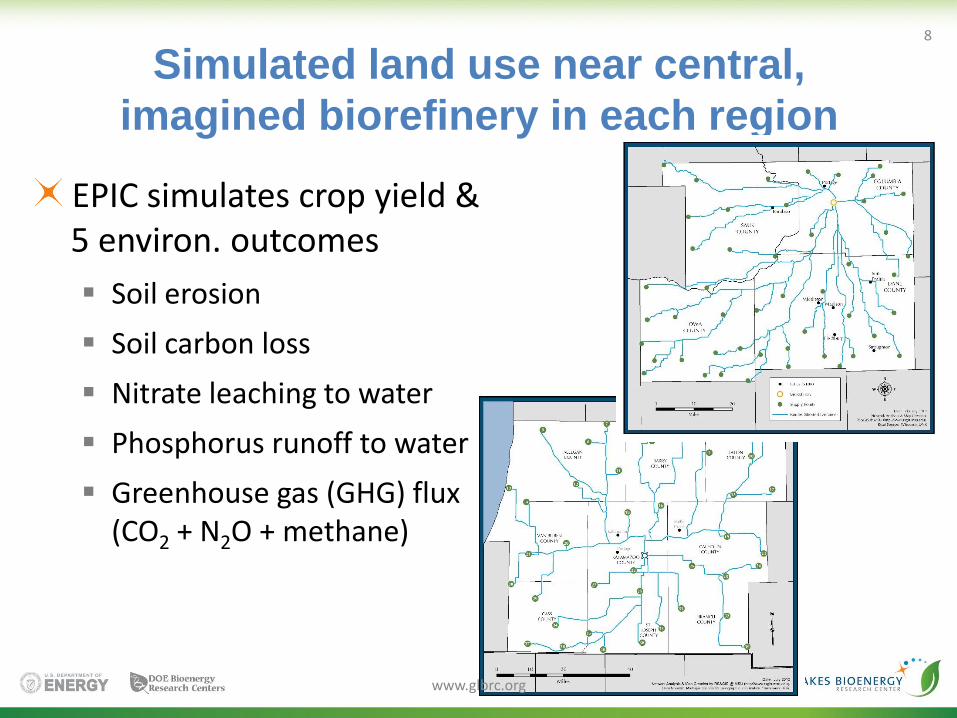
EPIC simulates crop yield & 5 environ. outcomes
Soil erosion
Soil carbon loss
Nitrate leaching to water
Phosphorus runoff to water
Greenhouse gas (GHG) flux (CO2 + N2O + methane)
www.glbrc.org
8
Simulated land use near central,
imagined biorefinery in each region
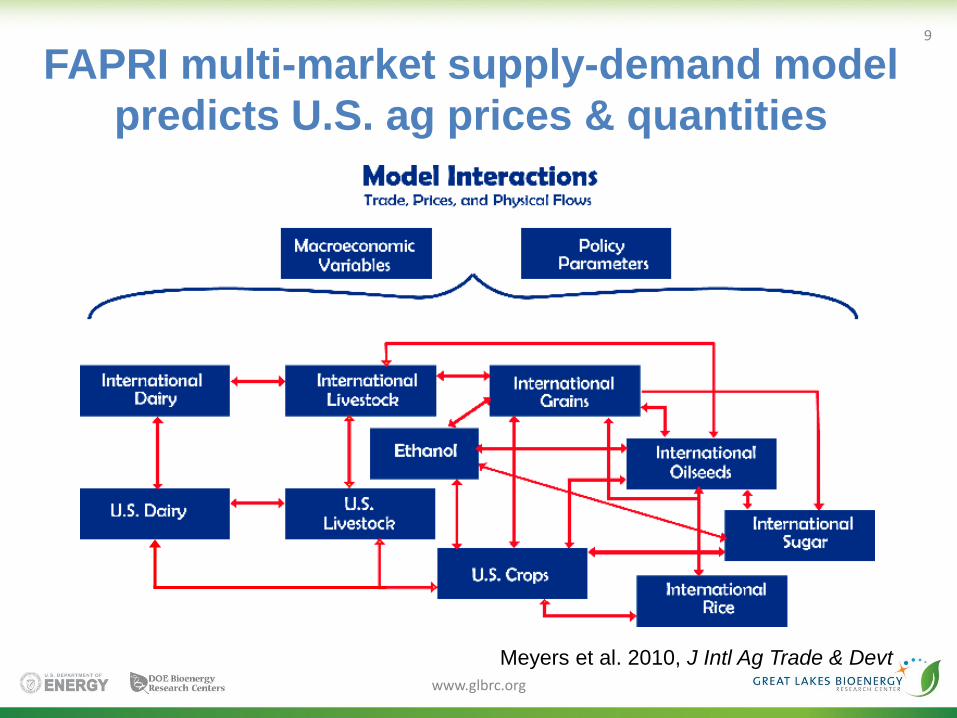
FAPRI multi-market supply-demand model
predicts U.S. ag prices & quantities
www.glbrc.org
9
Meyers et al. 2010, J Intl Ag Trade & Devt
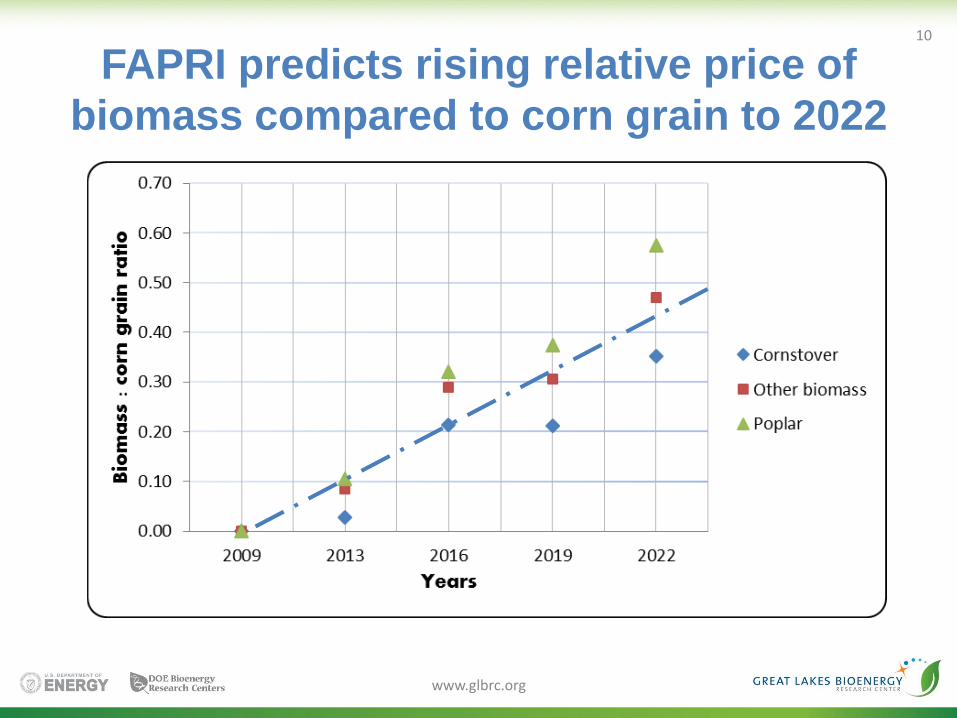
FAPRI predicts rising relative price of
biomass compared to corn grain to 2022
www.glbrc.org
10
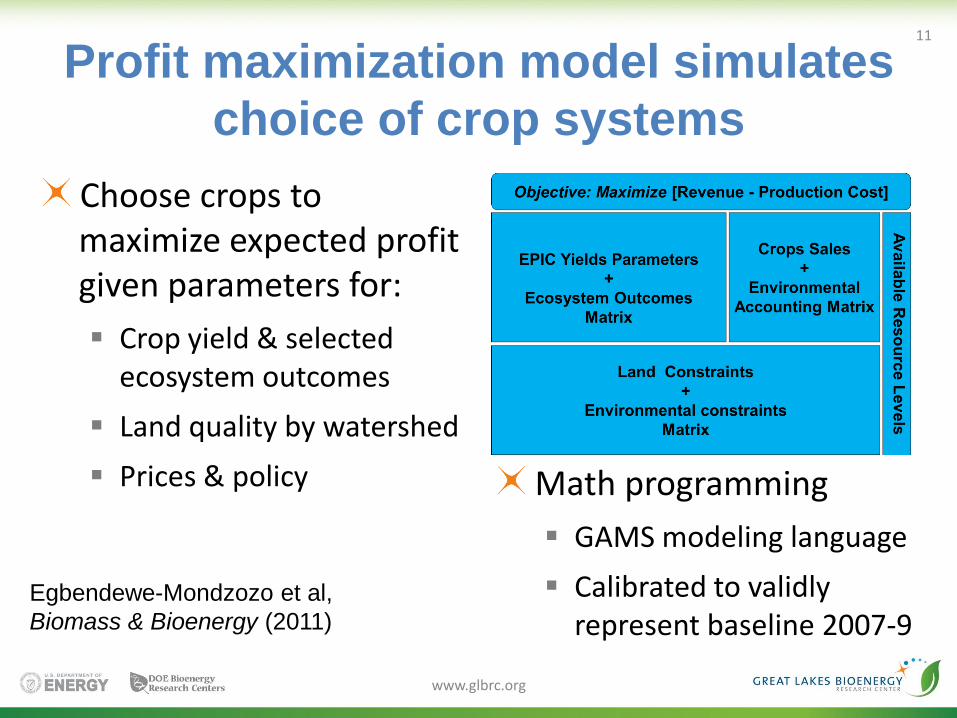
Profit maximization model simulates
choice of crop systems
Choose crops to maximize expected profit given parameters for:
Crop yield & selected ecosystem outcomes
Land quality by watershed
Prices & policy Math programming
GAMS modeling language
Calibrated to validly represent baseline 2007-9
www.glbrc.org
11
Egbendewe-Mondzozo et al,
Biomass & Bioenergy (2011)
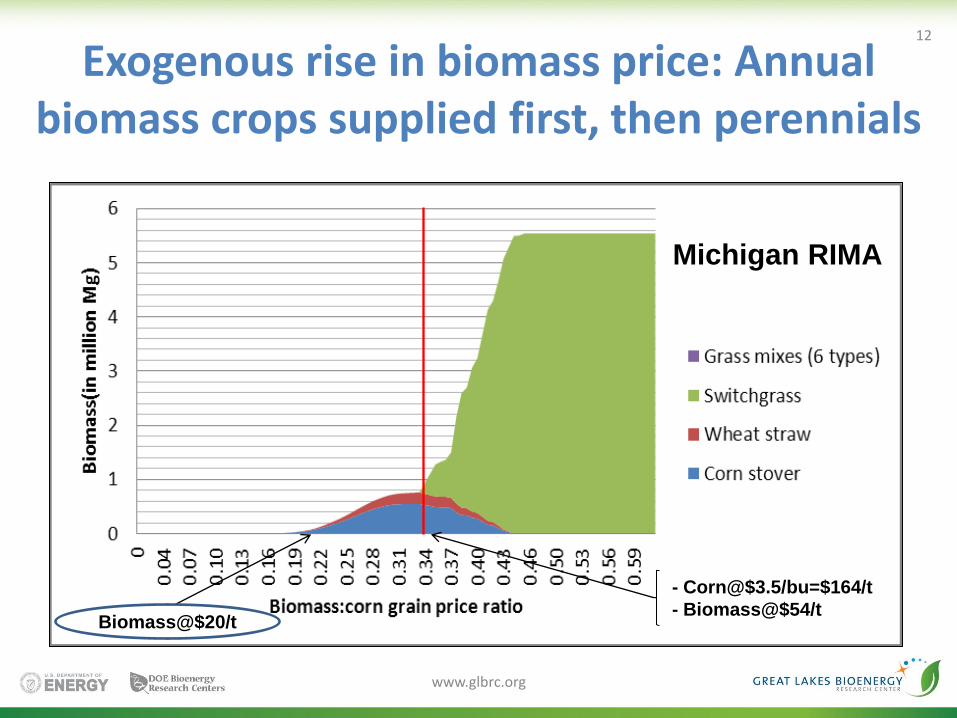
Exogenous rise in biomass price: Annual biomass crops supplied first, then perennials
www.glbrc.org
12
- Corn@$3.5/bu=$164/t
- Biomass@$54/t Biomass@$20/t
Michigan RIMA
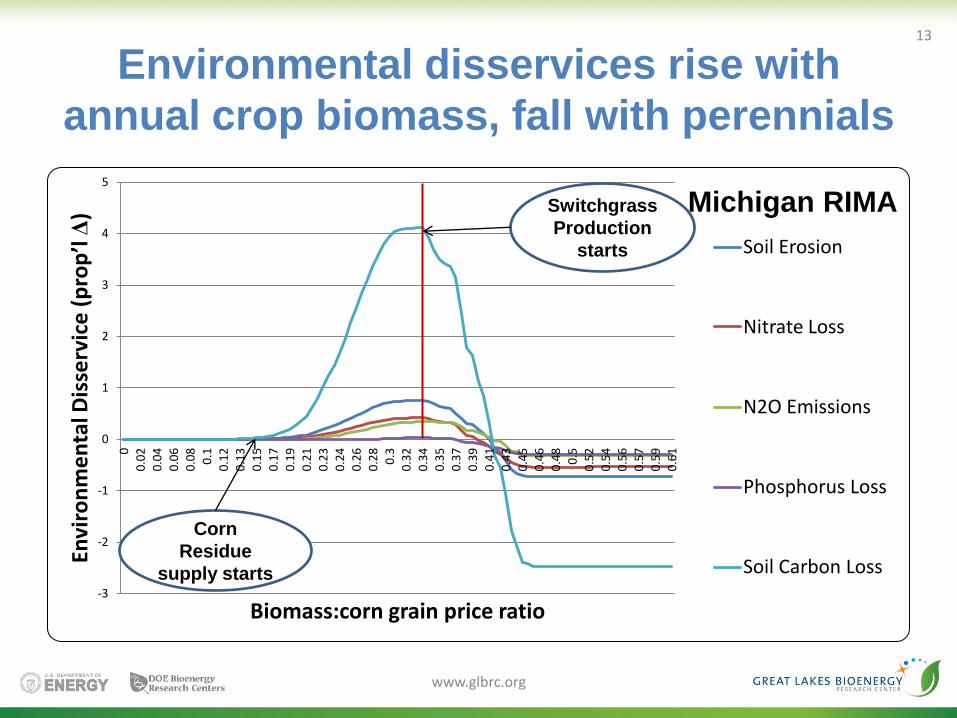
Environmental disservices rise with
annual crop biomass, fall with perennials
-3
-2
-1
0
1
2
3
4
5
0
0.0
2
0.0
4
0.0
6
0.0
8
0.1
0.1
2
0.1
3
0.1
5
0.1
7
0.1
9
0.2
1
0.2
3
0.2
4
0.2
6
0.2
8
0.3
0.3
2
0.3
4
0.3
5
0.3
7
0.3
9
0.4
1
0.4
3
0.4
5
0.4
6
0.4
8
0.5
0.5
2
0.5
4
0.5
6
0.5
7
0.5
9
0.6
1
Envi
ron
me
nta
l Dis
serv
ice
(pro
p’l
Δ)
Biomass:corn grain price ratio
Soil Erosion
Nitrate Loss
N2O Emissions
Phosphorus Loss
Soil Carbon Loss
Michigan RIMA
www.glbrc.org
13
Corn
Residue
supply starts
Switchgrass
Production
starts
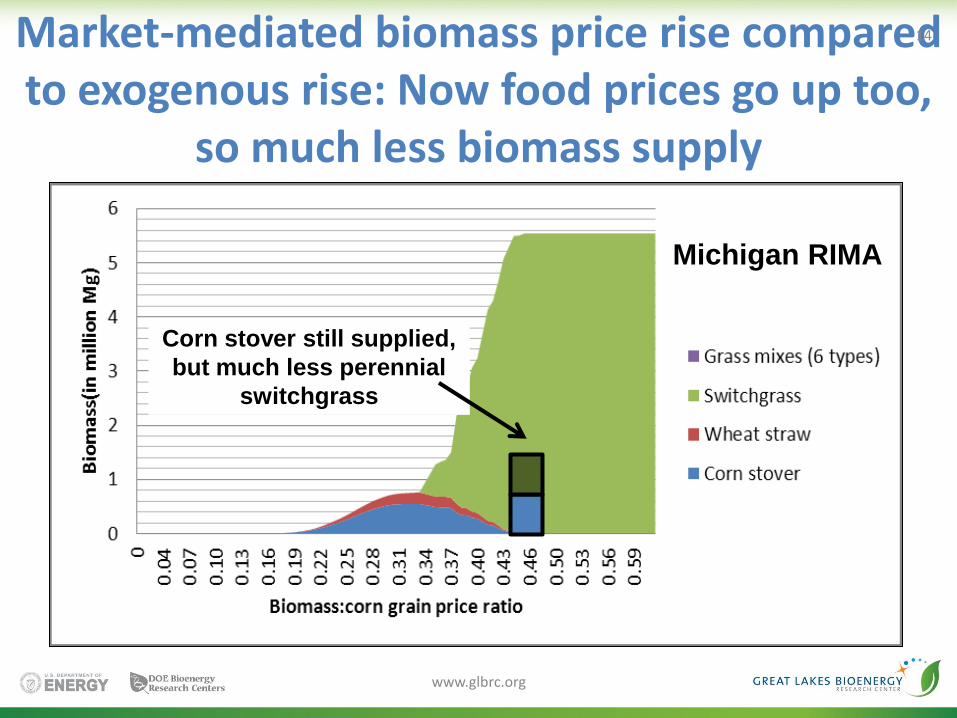
Market-mediated biomass price rise compared to exogenous rise: Now food prices go up too,
so much less biomass supply
www.glbrc.org
14
Michigan RIMA
Corn stover still supplied,
but much less perennial
switchgrass
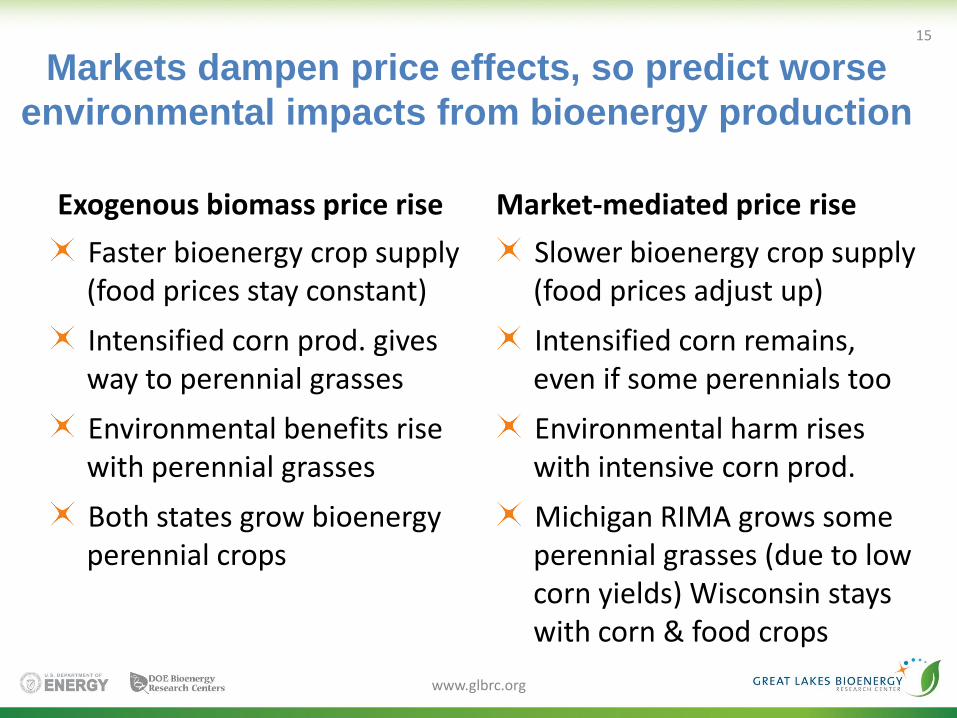
Markets dampen price effects, so predict worse
environmental impacts from bioenergy production
Exogenous biomass price rise
Faster bioenergy crop supply (food prices stay constant)
Intensified corn prod. gives way to perennial grasses
Environmental benefits rise with perennial grasses
Both states grow bioenergy perennial crops
Market-mediated price rise
Slower bioenergy crop supply (food prices adjust up)
Intensified corn remains, even if some perennials too
Environmental harm rises with intensive corn prod.
Michigan RIMA grows some perennial grasses (due to low corn yields) Wisconsin stays with corn & food crops
www.glbrc.org
15
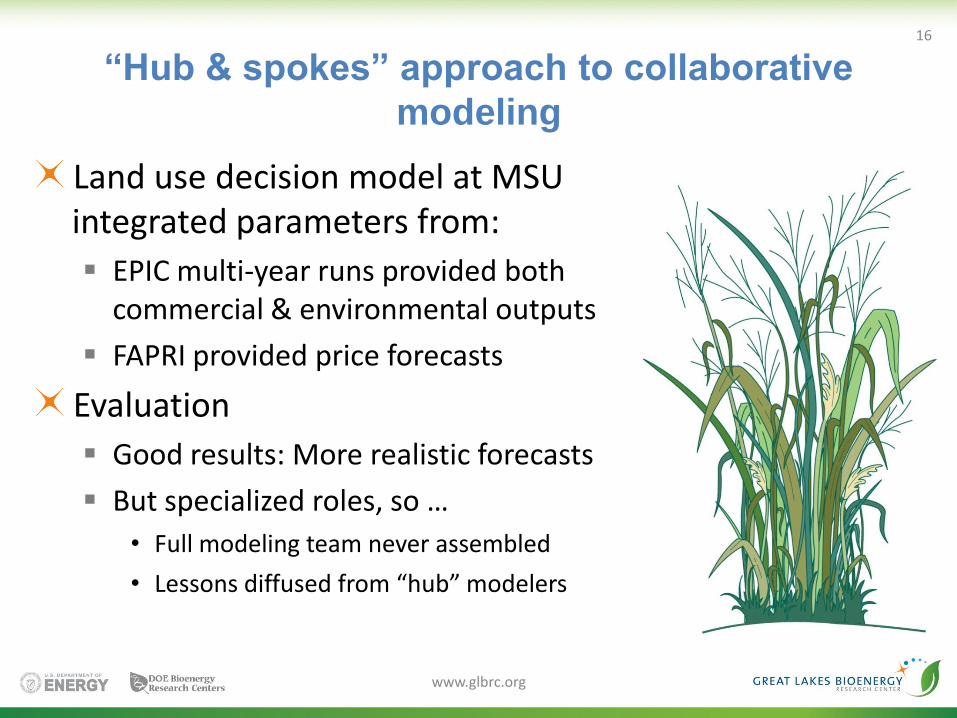
“Hub & spokes” approach to collaborative
modeling
Land use decision model at MSU integrated parameters from:
EPIC multi-year runs provided both commercial & environmental outputs
FAPRI provided price forecasts
Evaluation
Good results: More realistic forecasts
But specialized roles, so …
• Full modeling team never assembled
• Lessons diffused from “hub” modelers
www.glbrc.org
16
Looking for future
modeling collaborators. . .