Integrated Watershed Management in Urban...
53
Integrated Watershed Management in Urban Areas Robert Pitt, Ph.D., P.E. Department of Civil, Construction, and Environmental Engineering The University of Alabama Tuscaloosa, AL
Transcript of Integrated Watershed Management in Urban...
Integrated Watershed
Management in Urban Areas
Robert Pitt, Ph.D., P.E.
Department of Civil, Construction, and Environmental Engineering
The University of Alabama
Tuscaloosa, AL
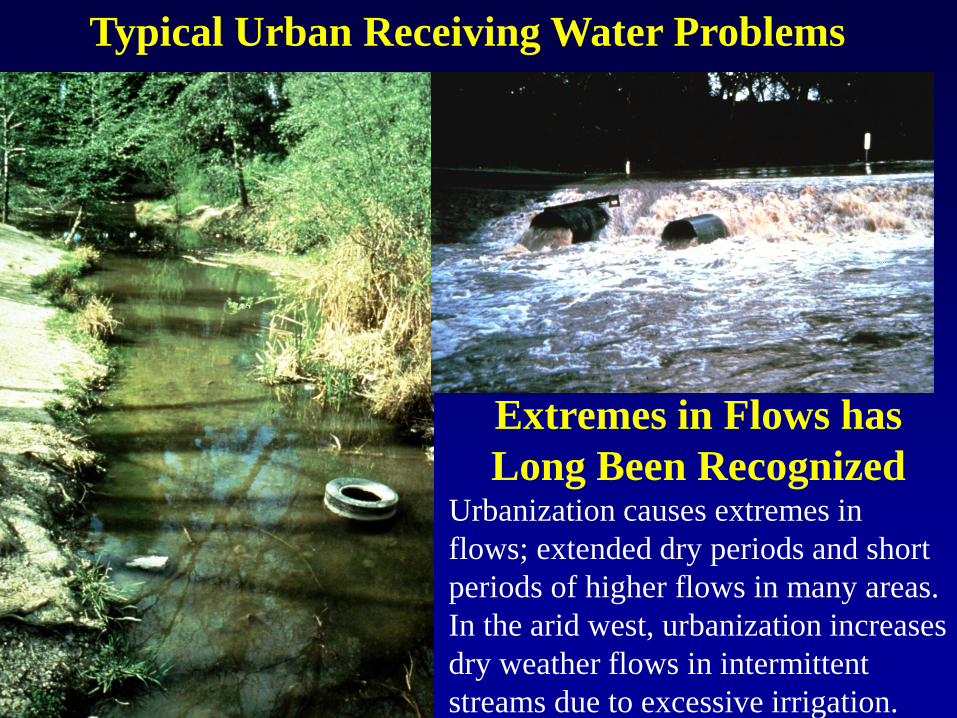
Extremes in Flows has
Long Been Recognized
Urbanization causes extremes in
flows; extended dry periods and short
periods of higher flows in many areas.
In the arid west, urbanization increases
dry weather flows in intermittent
streams due to excessive irrigation.
Typical Urban Receiving Water Problems
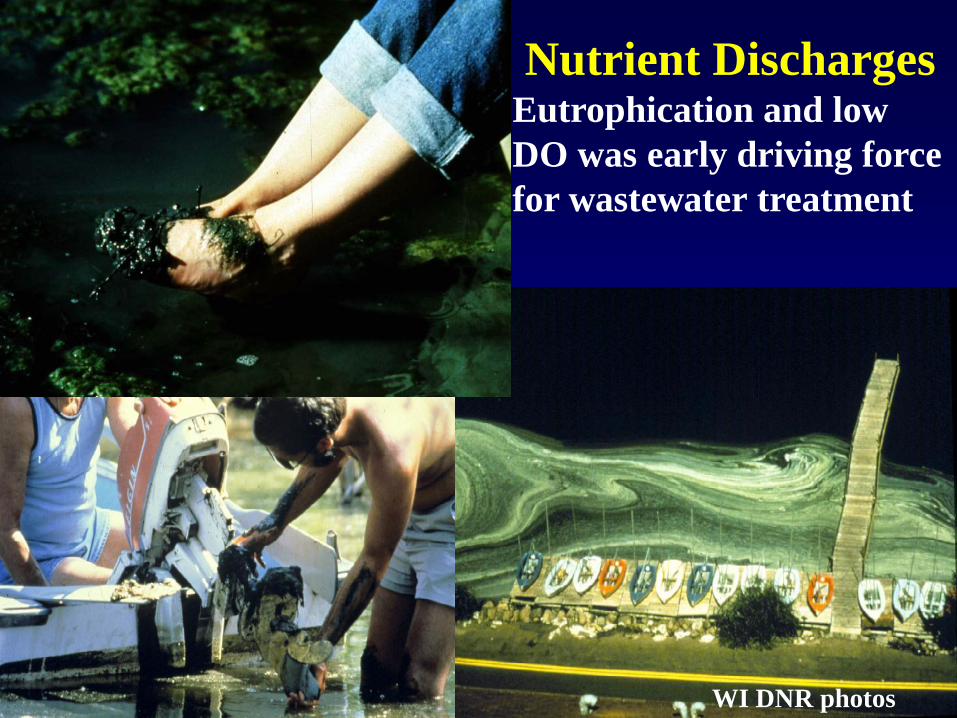
WI DNR photos
Nutrient Discharges Eutrophication and low
DO was early driving force
for wastewater treatment

Continuous, low volume
sanitary sewage leakage
into 5-Mile Creek,
Birmingham, source of
obvious pathogens due to
failing infrastructure.
Discharge of sanitary sewage
leak into Village Creek,
Birmingham
Failing Infrastructure

WI DNR photo
Urban Wildlife
and Sewage
Contamination Health effects due to
exposure to pathogens in
the urban receiving
waters can be serious.
However, kids still play in urban creeks
and swim near outfalls
Birmingham News (Alabama)
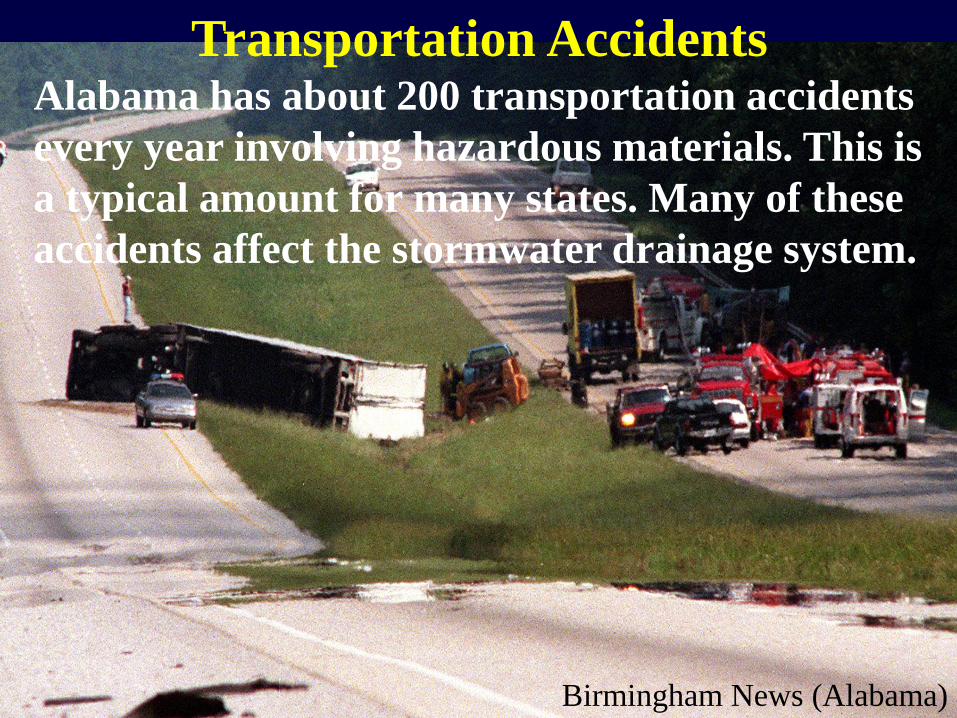
Transportation Accidents Alabama has about 200 transportation accidents
every year involving hazardous materials. This is
a typical amount for many states. Many of these
accidents affect the stormwater drainage system.

Stormwater Discharges to Groundwater
Moderate to High Groundwater Contamination Potential
Associated with Stormwater Infiltration (Example Conditions)
Injection after
Minimal
Pretreatment
Surface Infiltration
with no
Pretreatment
Surface Infiltration
after Sedimentation
Treatment
Lindane, chlordane Lindane, chlordane
1,3-dichlorobenzene,
benzo (a) anthracene, bis
(2-ethylhexl phthalate),
fluoranthene,
pentachlorophenol,
phenanthrene, pyrene
Benzo (a) anthracene, bis
(2-ethylhexl phthalate),
fluoranthene,
pentachlorophenol,
phenanthrene, pyrene
Fluoranthene, pyrene
Enteroviruses, some
bacteria and protozoa
Enteroviruses Enteroviruses
Nickel, chromium, lead,
zinc
Chloride Chloride Chloride

Stormwater can be a Resource
Ponds, rain barrels and cisterns for stormwater
storage for irrigation and other beneficial uses.
Many areas use roof runoff for all domestic
needs.
Much of the domestic water needs can be met with waters of
impaired quality (30% of in-home use, plus most of outside
irrigation uses and fire-fighting use).
“Design” Storms for Stormwater
Control not Obvious
• Large storms traditionally used for drainage
design have several problems when applied to
stormwater quality management:
- a few events cannot adequately represent the
wide range of problems that are associated with
stormwater quality.
- large design storms represent a very small
fraction of annual discharge.
• Some stormwater controls need to be initially sized according to runoff volumes (eg. wet detention ponds), while others need to be initially sized according to runoff flow rates (eg. filters).
• However, continuous simulations are needed to verify performance under the wide range of conditions that can occur, especially as a number of complementary stormwater controls must be used together in most areas as a treatment train.
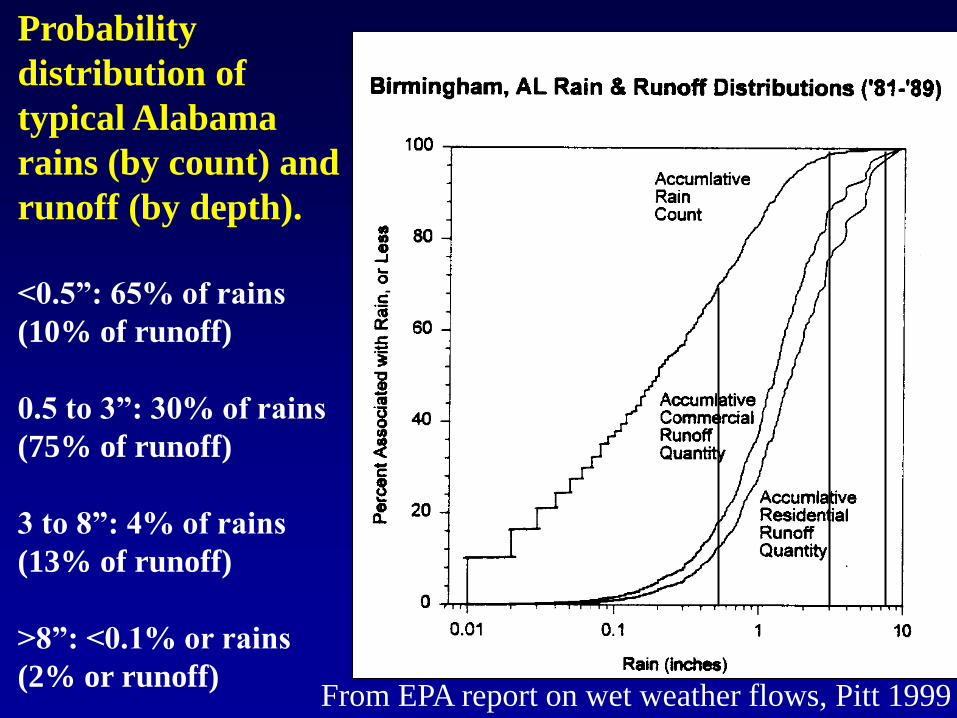
Probability
distribution of
typical Alabama
rains (by count) and
runoff (by depth).
<0.5”: 65% of rains
(10% of runoff)
0.5 to 3”: 30% of rains
(75% of runoff)
3 to 8”: 4% of rains
(13% of runoff)
>8”: <0.1% or rains
(2% or runoff) From EPA report on wet weather flows, Pitt 1999

0
50
100
150
200
250
300
350
400
450
0 20 40 60 80 100
Percent of Annual Flow Less than Flow Rate (Atlanta 1999)
Flo
w R
ate
(g
pm
per
acre
pavem
en
t)
0
10
20
30
40
50
60
70
80
90
100
10 100 1000
Treatment Flow Rate (gpm per acre of pavement)
Perc
en
t o
f A
nn
ual
Flo
w T
reate
d (
Atl
an
ta 1
999)
Continuous Simulation
can be used to
Determine Needed
Treatment Flow Rates: - 90% of the annual flow for
SE US conditions is about
170 gpm/acre pavement
(max about 450).
- treatment of 90% of
annual runoff volume would
require treatment rate of
about 100 gpm/acre of
pavement. More than three
times the treatment flow rate
needed for NW US.
Flow distribution for
typical Atlanta rain
year

Conservation Design Approach for
New Development
• Better site planning to maximize resources of site (natural drainageways, soils, open areas, etc.)
• Emphasize water conservation and water reuse on site
• Encourage infiltration of runoff at site (after proper treatment)
• Treat water at critical source areas
• Treat and manage runoff that cannot be infiltrated at site
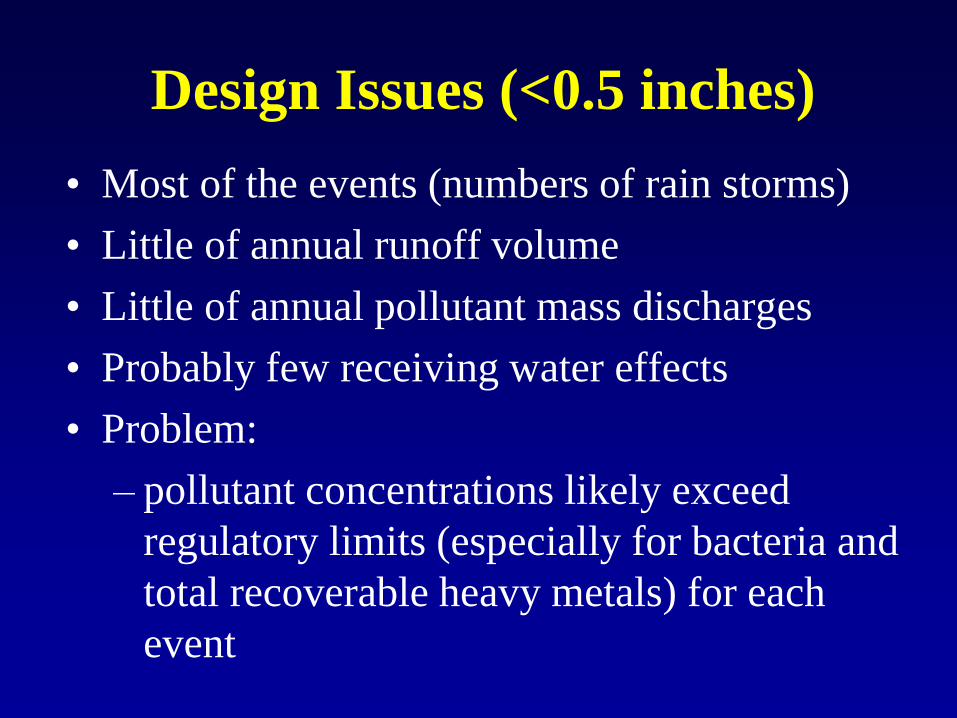
Design Issues (<0.5 inches)
• Most of the events (numbers of rain storms)
• Little of annual runoff volume
• Little of annual pollutant mass discharges
• Probably few receiving water effects
• Problem:
– pollutant concentrations likely exceed
regulatory limits (especially for bacteria and
total recoverable heavy metals) for each
event
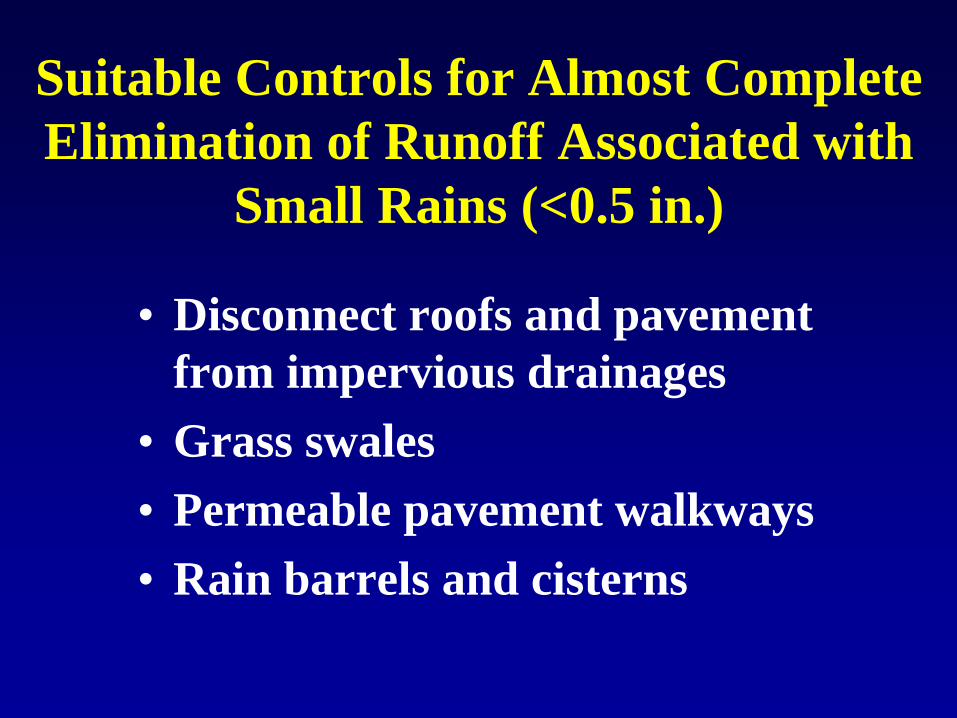
Suitable Controls for Almost Complete
Elimination of Runoff Associated with
Small Rains (<0.5 in.)
• Disconnect roofs and pavement
from impervious drainages
• Grass swales
• Permeable pavement walkways
• Rain barrels and cisterns
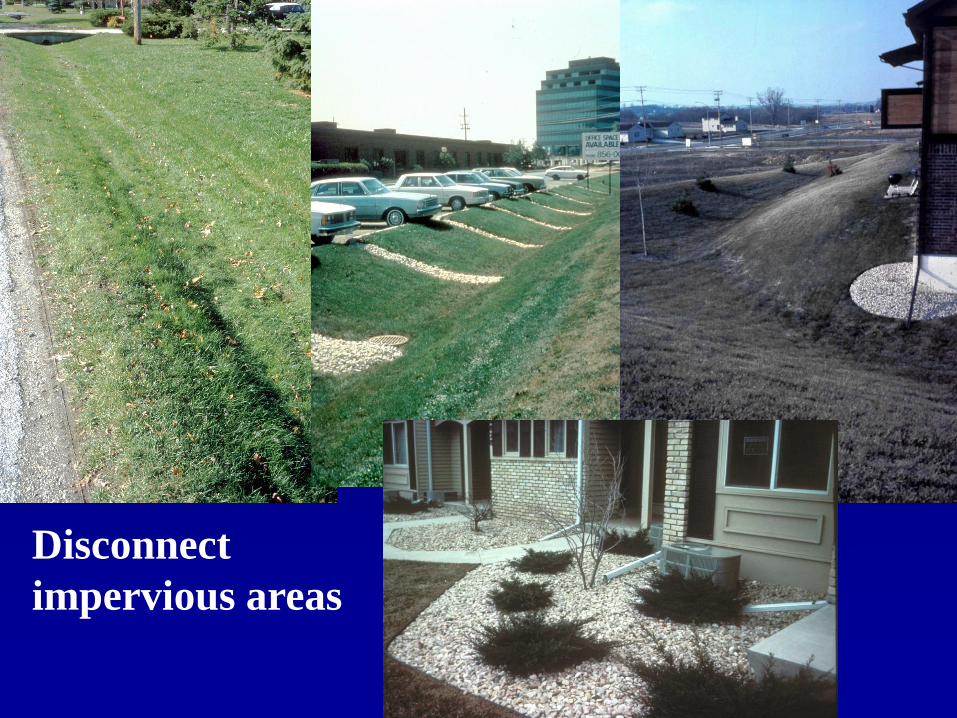
Disconnect
impervious areas
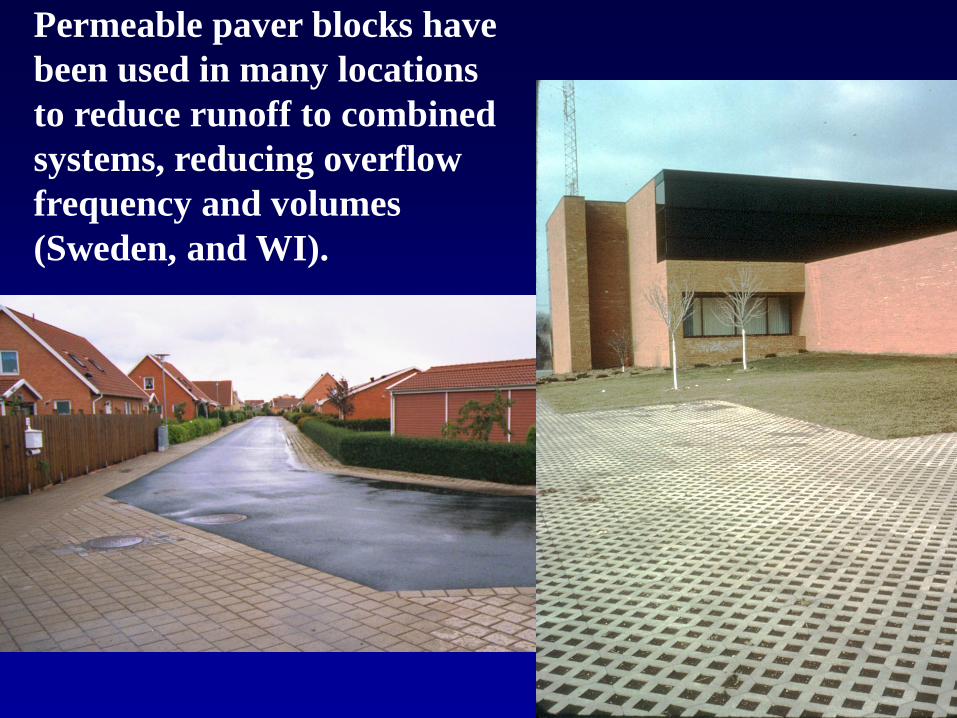
Permeable paver blocks have
been used in many locations
to reduce runoff to combined
systems, reducing overflow
frequency and volumes
(Sweden, and WI).
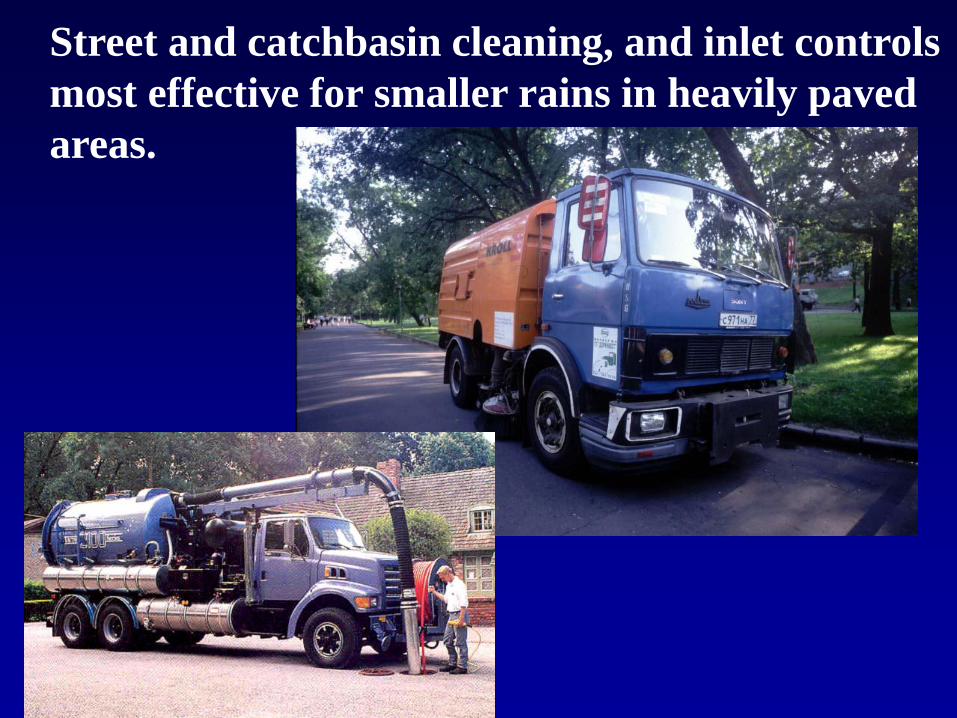
Street and catchbasin cleaning, and inlet controls
most effective for smaller rains in heavily paved
areas.

Design Issues (0.5 to 3 inches)
• Majority of annual runoff volume and
pollutant discharges
• Occur approximately once a week
• Problems:
• Produce moderate to high flows
• Produce frequent high pollutant loadings

Suitable Controls for Treatment
of Runoff from Intermediate-
Sized Rains (0.5 to 3 in.)
• Initial portion will be captured/infiltrated
by on-site controls or grass swales
• Remaining portion of runoff in this rain
category should be treated to remove
particulate-bound pollutants
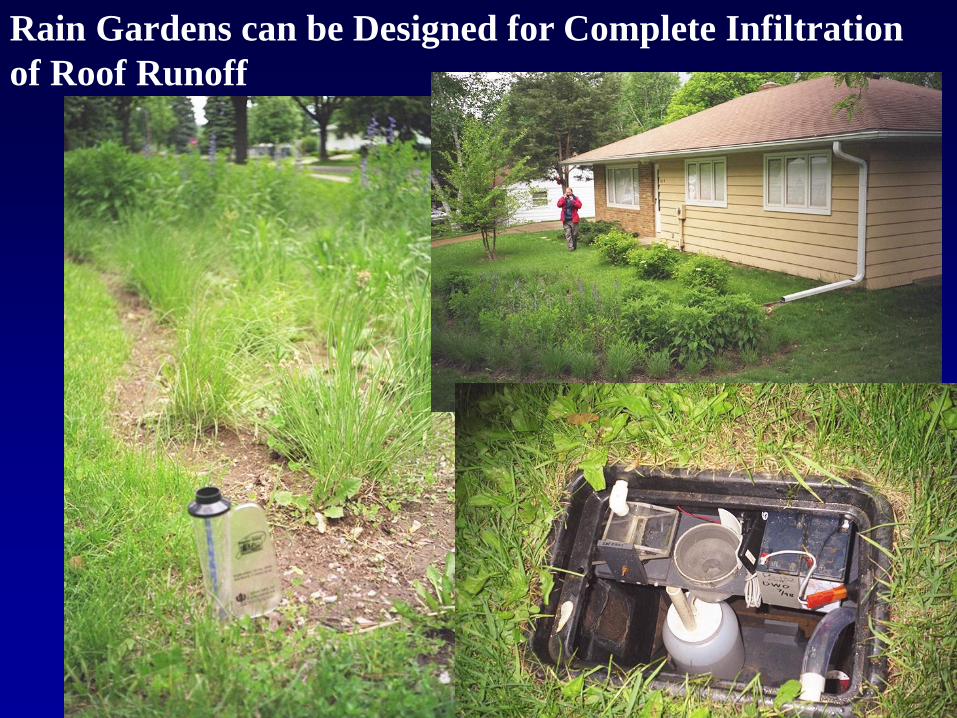
Rain Gardens can be Designed for Complete Infiltration
of Roof Runoff

Soil modifications for rain gardens and other
biofiltration areas can significantly increase
treatment and infiltration capacity compared to
native soils, plus provide substantial
evapotranspiration losses.
(King County, Washington, test plots)
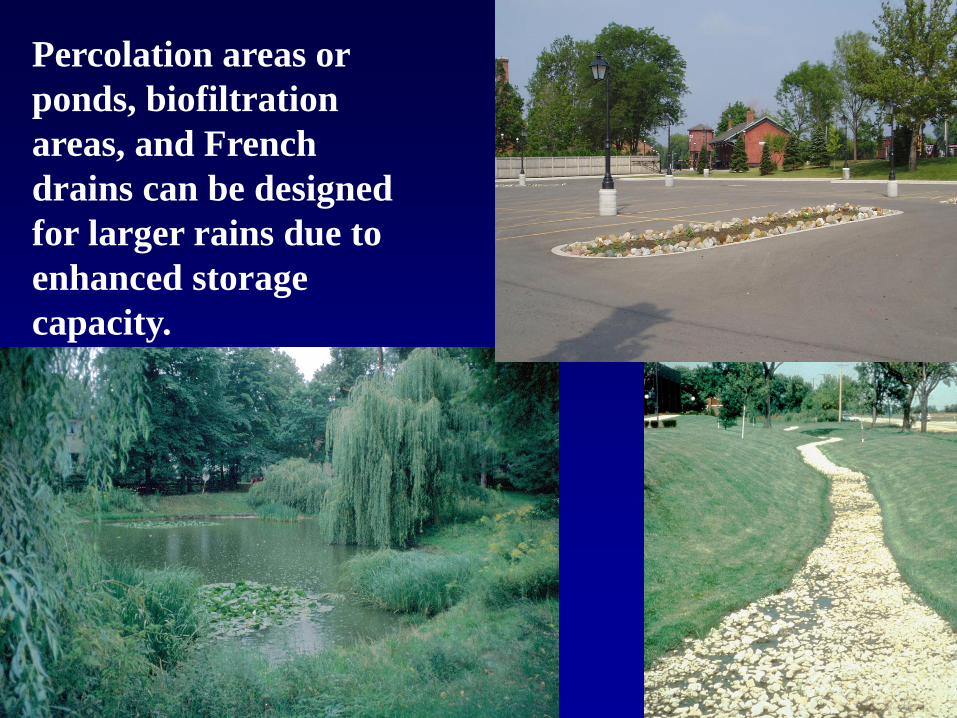
Percolation areas or
ponds, biofiltration
areas, and French
drains can be designed
for larger rains due to
enhanced storage
capacity.
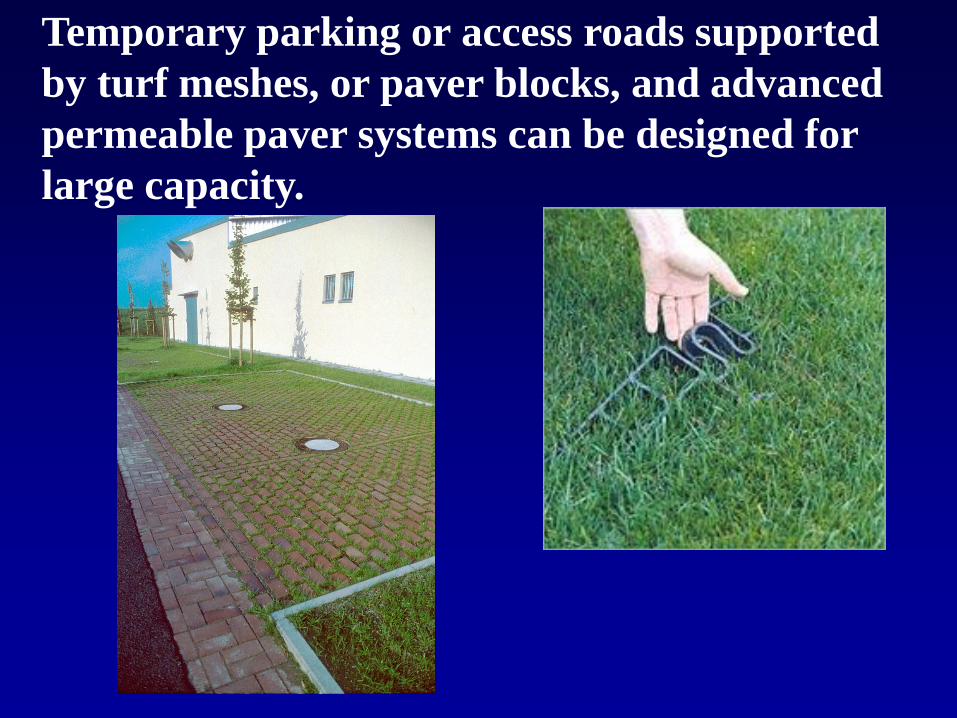
Temporary parking or access roads supported
by turf meshes, or paver blocks, and advanced
permeable paver systems can be designed for
large capacity.

Wet detention ponds,
stormwater filters, or
correctly-sized critical
source area controls are
needed to treat runoff
that cannot be
infiltrated.

Design Issues (3 to 8 inches) • This range of rains can include drainage-design storms
(depending on rain intensity and site time of concentration). Most of these storms last for one to two days. Drainage design storms of these depths would last only for a few hours.
• Establishes energy gradient of streams
• Occur approximately every few months (two to five times a year). Drainage design storms having high peak intensities occur every several years to several decades)
• Problems:
– Unstable streambanks
– Habitat destruction from damaging flows
– Sanitary sewer overflows
– Nuisance flooding and drainage problems/traffic hazards

Infrequent very high flows are channel-forming and
may cause severe bank erosion and infrastructure
damage.
MD and WI DNR photos

Controls for Treatment of Runoff
from Drainage Events (3 to 8 in.)
• Infiltration and other on-site controls will provide some volume and peak flow control
• Treatment controls can provide additional storage for peak flow reduction
• Provide adequate stormwater drainage to prevent street and structure flooding
• Provide additional storage to reduce magnitude and frequency of runoff energy
• Capture sanitary sewage overflows for storage and treatment
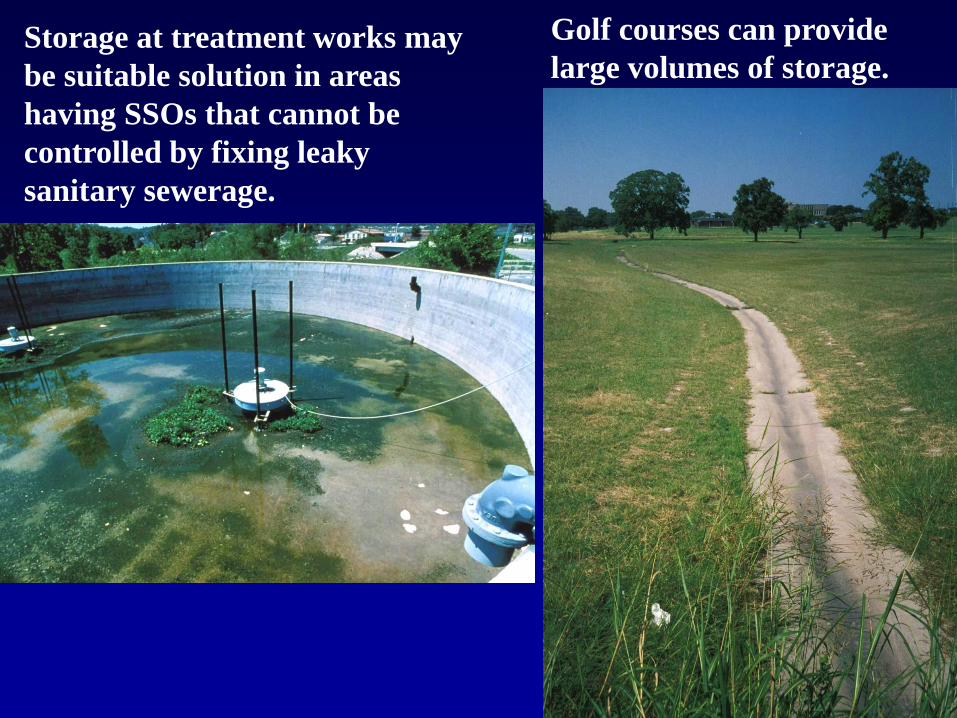
Storage at treatment works may
be suitable solution in areas
having SSOs that cannot be
controlled by fixing leaky
sanitary sewerage.
Golf courses can provide
large volumes of storage.

Design Issues (> 8 inches)
• Occur rarely (once every several years to once
every several decades, or less frequently). Three
rains were recorded that were >8 inches in the 37
years between 1952 and 1989 in Huntsville, AL.
• Produce relatively small fraction of the annual
pollutant mass discharges
• Produce extremely large flows and the largest
events exceed drainage system capacity
(depending on rain intensity and time of
concentration of drainage area)
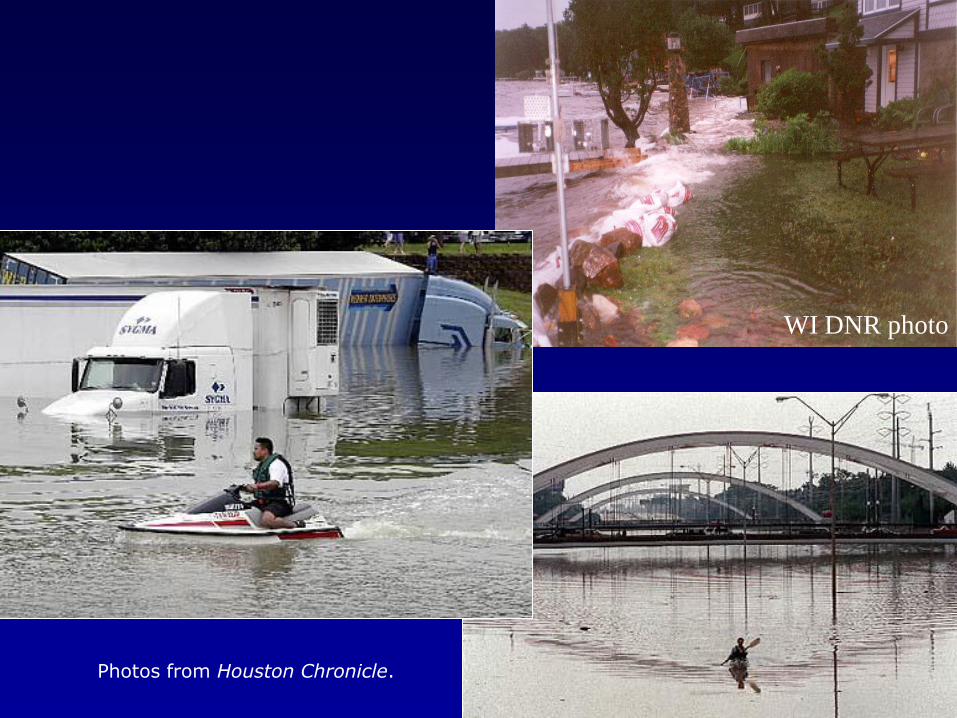
Photos from Houston Chronicle.
WI DNR photo

Controls for Treatment of
Runoff from Very Large
Events (> 8 in.)
• Provide secondary surface drainage
system to carefully route excess flood
waters away from structures and roadways
• Restrict development in flood-prone areas
A suitable urban watershed management
plan should incorporate many of the
features described above to meet the
many site objectives of interest.
• Good site design to fit site conditions (topography and natural drainage pattern; site soils; surrounding land uses and traffic patterns, etc.)
• Pollution prevention to minimize contamination due to material exposure (zinc roofing, for example)
• Combination of infiltration and sedimentation unit processes in large-scale treatment train
• Critical source area treatment (storage areas, loading docks, etc.)
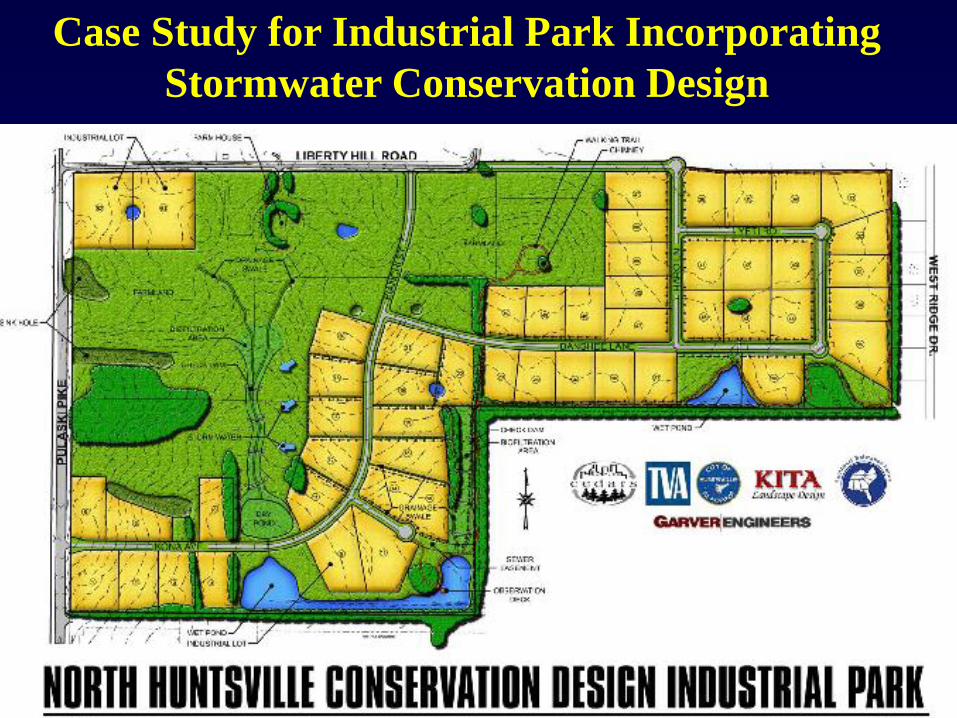
Case Study for Industrial Park Incorporating
Stormwater Conservation Design

Conservation Design Elements used at the
North Huntsville, AL, Industrial Park
• Grass filtering and swale drainages
• Modified soils to protect groundwater
• Wet detention ponds
• Bioretention and site infiltration devices
• Critical source area controls at loading docks, etc.
• Pollution prevention through material selection (no exposed galvanized metal, for example) and no exposure of materials and products.
• Berms and buffers around sink holes to prevent surface runoff from entering these direct connections to the groundwater.
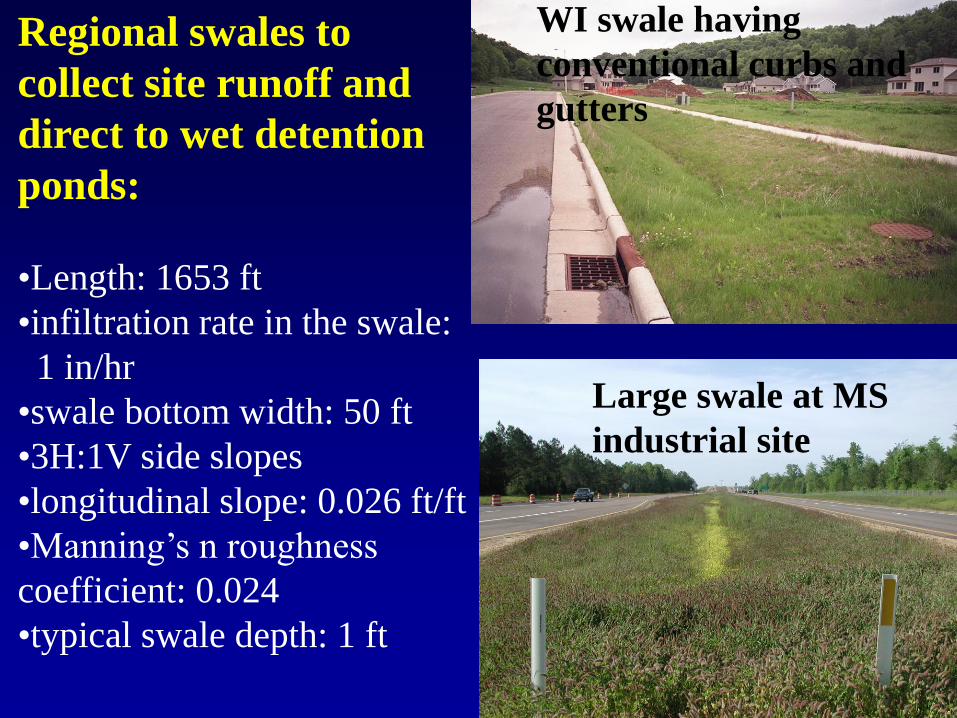
Regional swales to
collect site runoff and
direct to wet detention
ponds:
•Length: 1653 ft
•infiltration rate in the swale:
1 in/hr
•swale bottom width: 50 ft
•3H:1V side slopes
•longitudinal slope: 0.026 ft/ft
•Manning’s n roughness
coefficient: 0.024
•typical swale depth: 1 ft
WI swale having
conventional curbs and
gutters
Large swale at MS
industrial site
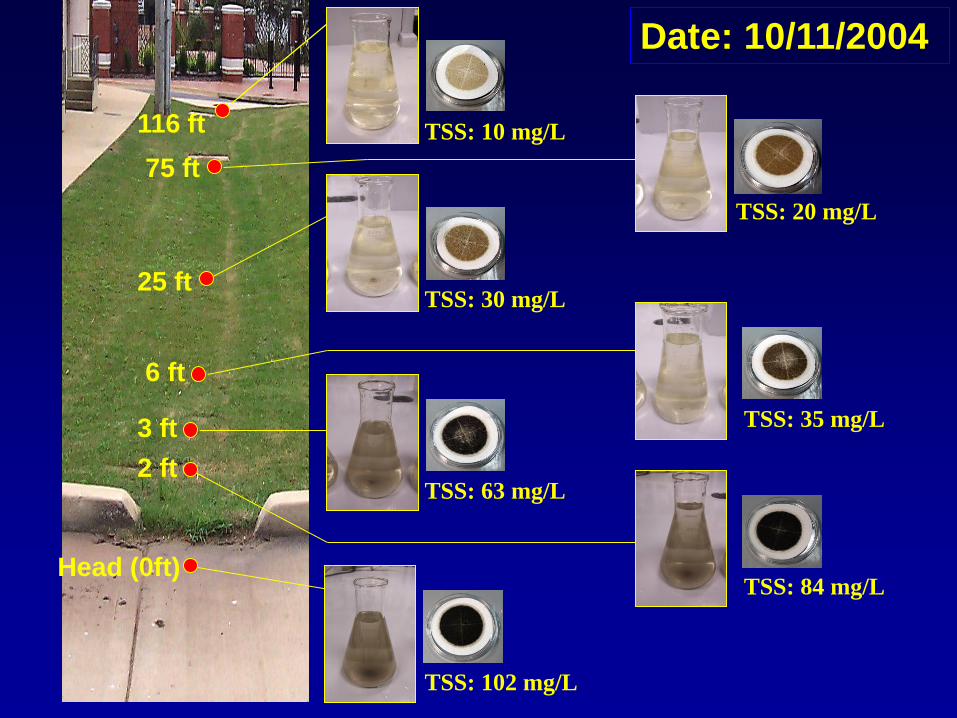
Head (0ft)
Date: 10/11/2004
2 ft
25 ft
6 ft
3 ft
116 ft
75 ft
TSS: 10 mg/L
TSS: 20 mg/L
TSS: 30 mg/L
TSS: 35 mg/L
TSS: 63 mg/L
TSS: 84 mg/L
TSS: 102 mg/L
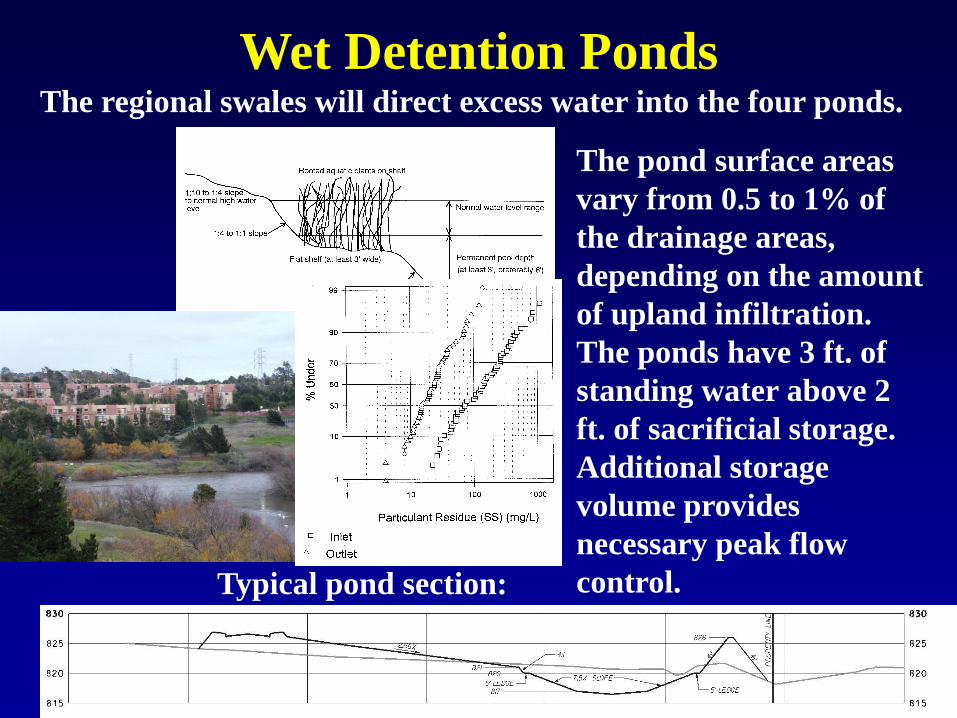
Wet Detention Ponds The regional swales will direct excess water into the four ponds.
Typical pond section:
The pond surface areas
vary from 0.5 to 1% of
the drainage areas,
depending on the amount
of upland infiltration.
The ponds have 3 ft. of
standing water above 2
ft. of sacrificial storage.
Additional storage
volume provides
necessary peak flow
control.

Biofilters to drain site runoff (paved parking
and roofs) to regional swales:
•Top area: 4400 ft2
•Bottom area: 2000 ft2
•Depth: 2 ft
•Seepage rate: 2 in/hr
•Peak to average flow ratio: 3.8
•Typical width: 10 ft
•Number of biofilters: 13
(one per site)
Parking lot
biofilter example,
Portland, OR

Critical Source Area Control
Covering
fueling area
Berm around
storage tanks
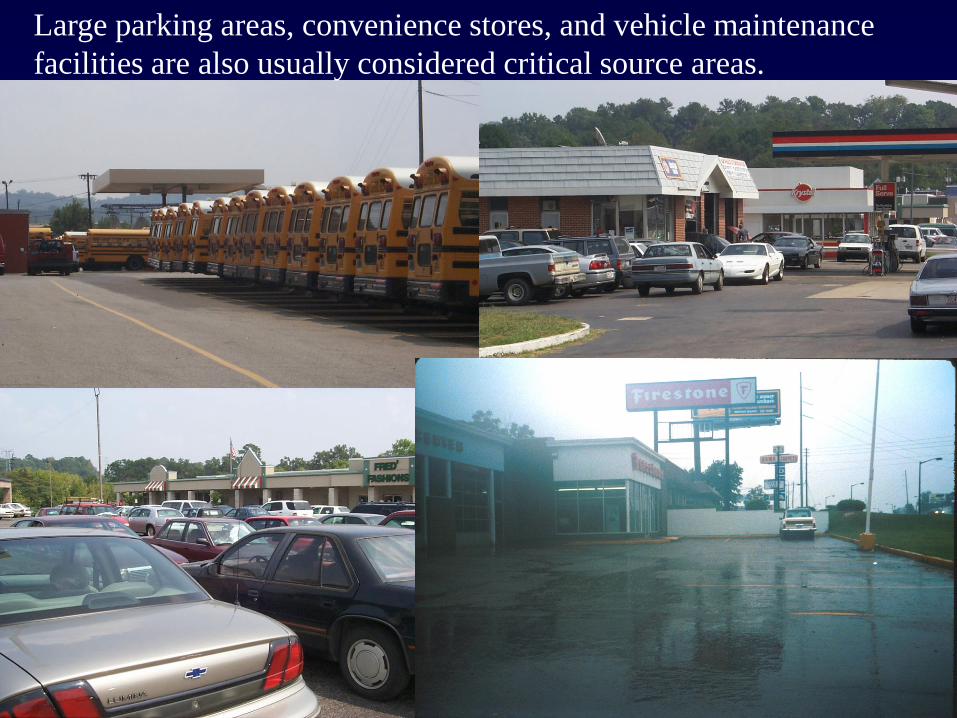
Large parking areas, convenience stores, and vehicle maintenance
facilities are also usually considered critical source areas.

Multi-Chambered Treatment Train (MCTT) for
stormwater control at large critical source areas Milwaukee, WI, Ruby Garage Maintenance Yard MCTT
Installation
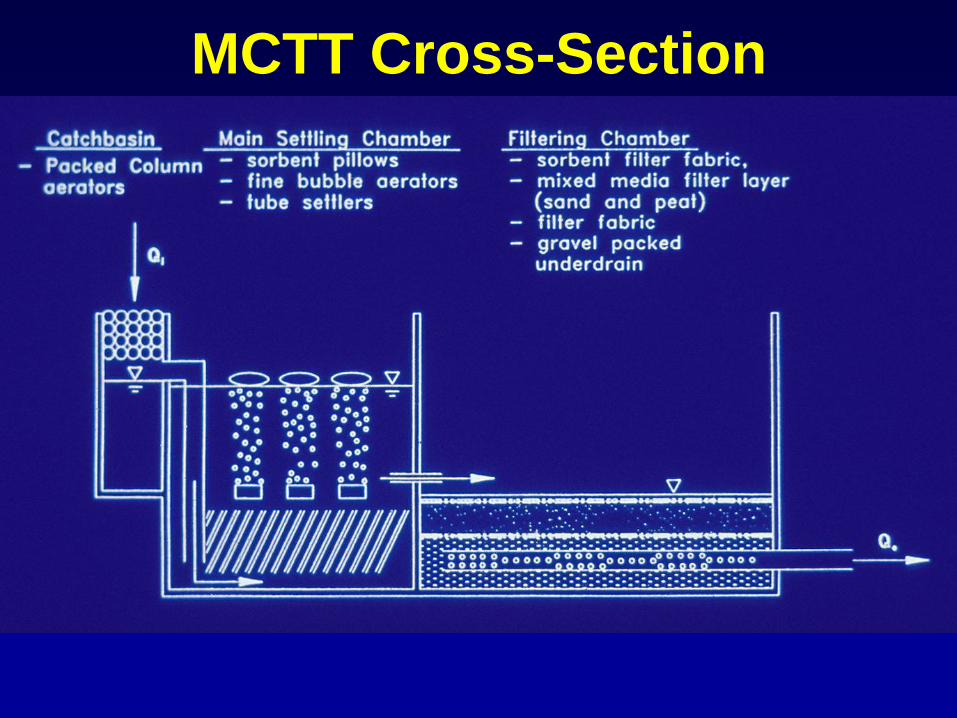
MCTT Cross-Section

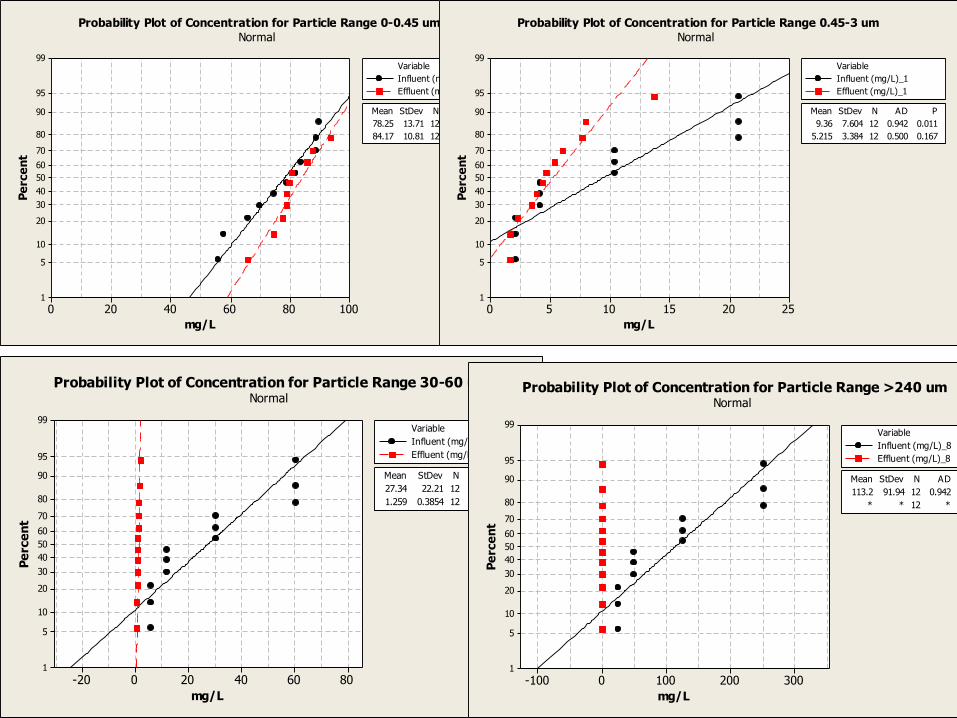
Pilot-Scale Test Results

Upflow filter insert for
catchbasins at smaller
critical source areas
Able to remove particulates and targeted
pollutants at small critical source areas.
Also traps coarse material and floatables
in sump and away from flow path.
Pelletized Peat, Activated Carbon, and Fine
Sandy = 2.0238x0.8516
R2 = 0.9714
0
5
10
15
20
25
0 5 10 15 20
Headloss (inches)
Flo
w (
gp
m)
Performance Plot for Mixed Media on Suspended Soilds for Influent
Concentrations of 500 mg/L, 250mg/L, 100 mg/L and 50 mg/L
0
100
200
300
400
500
600
Influent Conc. Effluent Conc.
Su
sp
en
de
d S
oil
ds
(m
g/L
)
High Flow 500
Mid Flow 500
Low Flow 500
High Flow 250
Mid Flow 250
Low Flow 250
High Flow 100
Mid Flow 100
Low Flow 100
High Flow 50
Mid Flow 50
Low Flow 50
Hydro International, Ltd.

Hydraulic Characterization
Assembling Upflow
Filter modules for lab
tests Initial CFD
Model
Results
High
flow
tests
Hydro International, Ltd.
mg/L
Pe
rce
nt
100806040200
99
95
90
80
70
60
50
40
30
20
10
5
1
Mean
0.771
84.17 10.81 12 0.402 0.302
StDev N AD P
78.25 13.71 12 0.224
Variable
Influent (mg/L)
Effluent (mg/L)
Normal
Probability Plot of Concentration for Particle Range 0-0.45 um
mg/L
Pe
rce
nt
2520151050
99
95
90
80
70
60
50
40
30
20
10
5
1
Mean
0.011
5.215 3.384 12 0.500 0.167
StDev N AD P
9.36 7.604 12 0.942
Variable
Influent (mg/L)_1
Effluent (mg/L)_1
Normal
Probability Plot of Concentration for Particle Range 0.45-3 um
mg/L
Pe
rce
nt
806040200-20
99
95
90
80
70
60
50
40
30
20
10
5
1
Mean
0.011
1.259 0.3854 12 0.311 0.507
StDev N AD P
27.34 22.21 12 0.942
Variable
Influent (mg/L)_5
Effluent (mg/L)_5
Normal
Probability Plot of Concentration for Particle Range 30-60 um
mg/L
Pe
rce
nt
3002001000-100
99
95
90
80
70
60
50
40
30
20
10
5
1
Mean
0.011
* * 12 *
StDev N AD P
113.2 91.94 12 0.942
Variable
Influent (mg/L)_8
Effluent (mg/L)_8
Normal
Probability Plot of Concentration for Particle Range >240 um

High Zinc Concentrations have been
Found in Roof Runoff for Many Years at
Many Locations
• Typical Zn in stormwater is about 100 g/L, with industrial area runoff usually several times this level.
• Water quality criteria for Zn is as low as 100 g/L for aquatic life protection in soft waters, up to about 5 mg/L for drinking waters.
• Zinc in runoff from galvanized roofs can be several mg/L
• Other pollutants and other materials
also of potential concern.
• A cost-effective stormwater control
strategy should include the use of
materials that have reduced effects on
runoff degradation. Penn State – Harrisburg test site

Example WinSLAMM input
screens. Model used to
calculate accumulative effects
of multiple stormwater controls
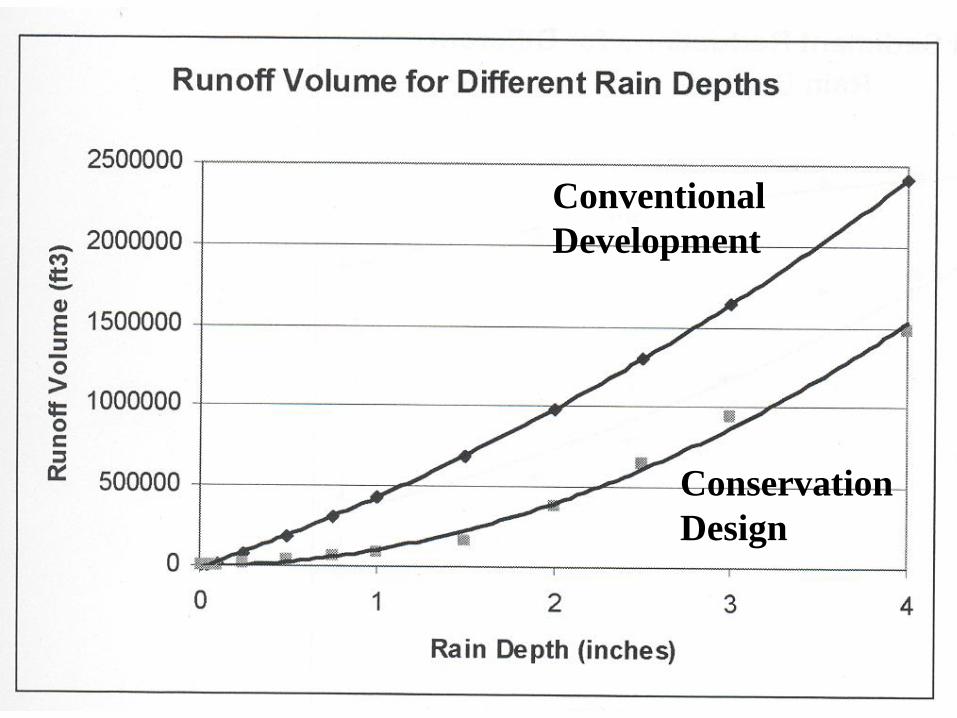
Conventional
Development
Conservation
Design
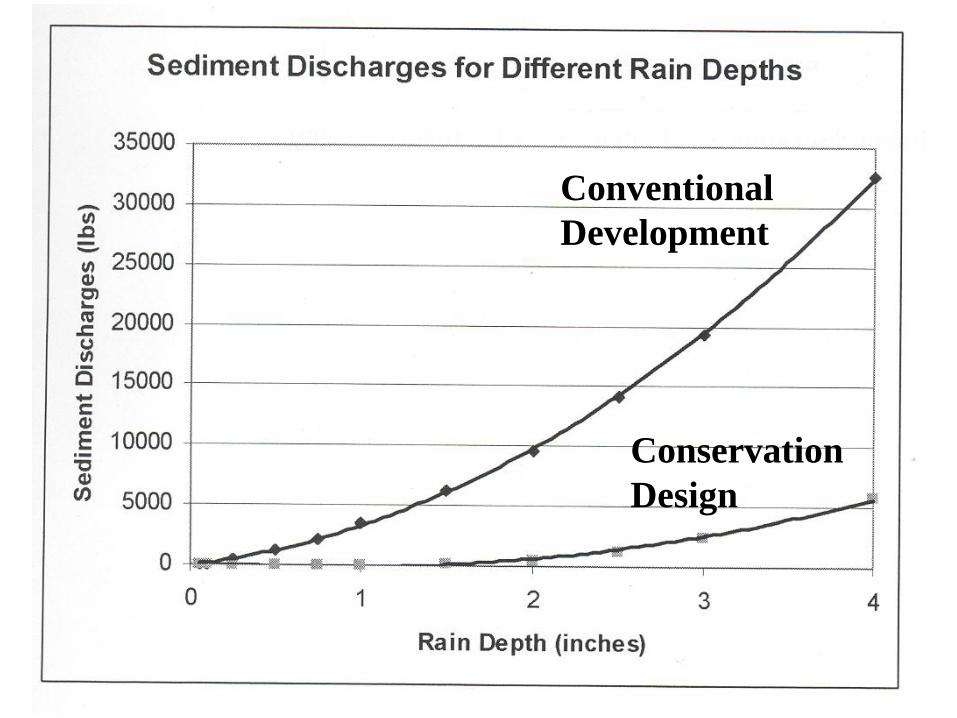
Conventional
Development
Conservation
Design

Conclusions: Combinations of Controls
Needed to Meet Many Stormwater
Management Objectives
• Smallest storms should be captured on-site for reuse, or infiltrated
• Design controls to treat runoff that cannot be infiltrated on site
• Provide controls to reduce energy of large events that would otherwise affect habitat
• Provide conventional flood and drainage controls

Acknowledgements
The support of the Tennessee Valley Authority (TVA),
Economic Development Technical Services, and the
Center for Economic Development and Resource
Stewardship (CEDARS) of Nashville, TN supported the
extensions to WinSLAMM to enable the use of a
decision analysis framework in evaluating alternative
stormwater management options. The Stormwater
Management Authority of Jefferson County, AL, is also
acknowledged for their recent support that enabled cost
analyses to be added to WinSLAMM