Integrated Value Chain Scenarios for Enhanced Mill Region
93
Integrated Value Chain Scenarios for Enhanced Mill Region Profitability Final Report Sugar Research and Development Corporation Project CSE010 Research Organisations CSIRO Sustainable Ecosystems CSR Sugar Sugar Research Institute Maryborough Sugar Factory Chief Investigators Dr Peter Thorburn CSIRO Sustainable Ecosystems Queensland Bioscience Precinct 306 Carmody Rd St. Lucia, Qld 4067 (07) 3214 2316 [email protected] Dr Phil Hobson Sugar Research and Innovation Queensland University of Technology 2 George St Brisbane, Qld 4001 (07) 3864 1240 [email protected] Dr Andrew Higgins CSIRO Sustainable Ecosystems Queensland Bioscience Precinct 306 Carmody Rd St. Lucia, Qld 4067 (07) 3214 2340 [email protected] Mr Robin Juffs Pioneer Mill CSR Sugar Ltd (07) 4752 6269 [email protected] Mr Peter Downs Maryborough Sugar Factory PO Box 119 Maryborough, Qld 4650 (07) 4121 1150 [email protected] Project funding Sugar Research and Development Corporation CSIRO Sustainable Ecosystems CSR Sugar Ltd Maryborough Sugar Factory The Research Organisation is not a partner, joint venturer, employee or agent of SRDC and has no authority to legally bind SRDC, in any publication of substantive details or results of this Project. 1
Transcript of Integrated Value Chain Scenarios for Enhanced Mill Region

Integrated Value Chain Scenarios for
Enhanced Mill Region Profitability
Final Report
Sugar Research and Development Corporation Project CSE010
Research Organisations CSIRO Sustainable Ecosystems CSR Sugar
Sugar Research Institute Maryborough Sugar Factory
Chief Investigators Dr Peter Thorburn CSIRO Sustainable Ecosystems Queensland Bioscience Precinct 306 Carmody Rd St. Lucia, Qld 4067 (07) 3214 2316 [email protected]
Dr Phil Hobson Sugar Research and Innovation Queensland University of Technology 2 George St Brisbane, Qld 4001 (07) 3864 1240 [email protected]
Dr Andrew Higgins CSIRO Sustainable Ecosystems Queensland Bioscience Precinct 306 Carmody Rd St. Lucia, Qld 4067 (07) 3214 2340 [email protected]
Mr Robin Juffs Pioneer Mill CSR Sugar Ltd (07) 4752 6269 [email protected]
Mr Peter Downs Maryborough Sugar Factory PO Box 119 Maryborough, Qld 4650 (07) 4121 1150 [email protected]
Project funding Sugar Research and Development Corporation CSIRO Sustainable Ecosystems
CSR Sugar Ltd Maryborough Sugar Factory
The Research Organisation is not a partner, joint venturer, employee or agent of SRDC and has no authority to legally bind SRDC, in any publication of substantive details or results of this Project.
1

Integrated value chain scenarios for enhanced mill region profitability
SRDC Project CSE010
Final Report
By
P.J. THORBURN1, A.A. ARCHER1, P.A. HOBSON2, A.J. HIGGINS1, G.R. SANDEL3, D.B.
PRESTWIDGE1, B. ANDREW1, G. ANTONY1, L.J. McDONALD4, P. DOWNS5 AND R. JUFFS4
1CSIRO Sustainable Ecosystems, Brisbane 2Sugar Research and Innovation, Brisbane
3Harvesting Solutions, Mackay 4CSR Sugar Ltd, Brandon
5Maryborough Sugar Factory Ltd, Maryborough
2

1 EXECUTIVE SUMMARY..................................................................................................................................... 5 2 BACKGROUND ..................................................................................................................................................... 7 3 PROJECT OBJECTIVES...................................................................................................................................... 9 4 STAKEHOLDER ENGAGEMENT AND IDENTIFICATION OF REGIONAL PRIORITIES.................. 10
4.1 INTRODUCTION ................................................................................................................................................... 10 4.2 STRUCTURE OF INDUSTRY GROUPS...................................................................................................................... 10 4.3 DEFINITION OF REGIONAL PRIORITIES ................................................................................................................. 11 4.4 ONGOING INTERACTIONS WITH THE REGIONAL GROUPS..................................................................................... 12 4.5 INTERACTIONS WITHIN THE RESEARCH TEAM...................................................................................................... 15
5 ACTION LEARNING - EVOLUTION OF THE VENTURE .......................................................................... 16 5.1 INTRODUCTION ................................................................................................................................................... 16 5.2 THE ‘CHALLENGE’ OF WHOLE CROP HARVESTING ............................................................................................... 16 5.3 DETAILS OF THE VENTURE IN EACH REGION ........................................................................................................ 17
5.3.1 Maryborough ............................................................................................................................................ 17 5.3.2 Burdekin.................................................................................................................................................... 17
5.3.2.1 Invicta mill region ............................................................................................................................................17 5.3.2.2 Pioneer mill region ...........................................................................................................................................19
5.3.3 General issues........................................................................................................................................... 19 6 VALUE CHAIN MODEL DEVELOPMENT AND APPLICATION.............................................................. 20
6.1 VALUE CHAIN MODELLING FRAMEWORK ............................................................................................................ 20 6.2 FUNCTIONAL MODEL DEVELOPMENT................................................................................................................... 20
6.2.1 Sugarcane production............................................................................................................................... 21 6.2.2 Harvest and in-field hauling ..................................................................................................................... 22 6.2.3 Cane transport .......................................................................................................................................... 23 6.2.4 Sugar factory ............................................................................................................................................ 23
6.3 APPLICATION OF THE VALUE CHAIN MODELLING FRAMEWORK ........................................................................... 23 6.3.1 Block data ................................................................................................................................................. 23 6.3.2 Scenarios and economic analyses............................................................................................................. 24
7 RESULTS OF VALUE CHAIN ANALYSES..................................................................................................... 27 7.1 MARYBOROUGH.................................................................................................................................................. 27
7.1.1 Maximising co-generation ........................................................................................................................ 27 7.1.2 Regional value of trash blankets............................................................................................................... 28
7.2 BURDEKIN........................................................................................................................................................... 29 7.2.1 Invicta ....................................................................................................................................................... 29
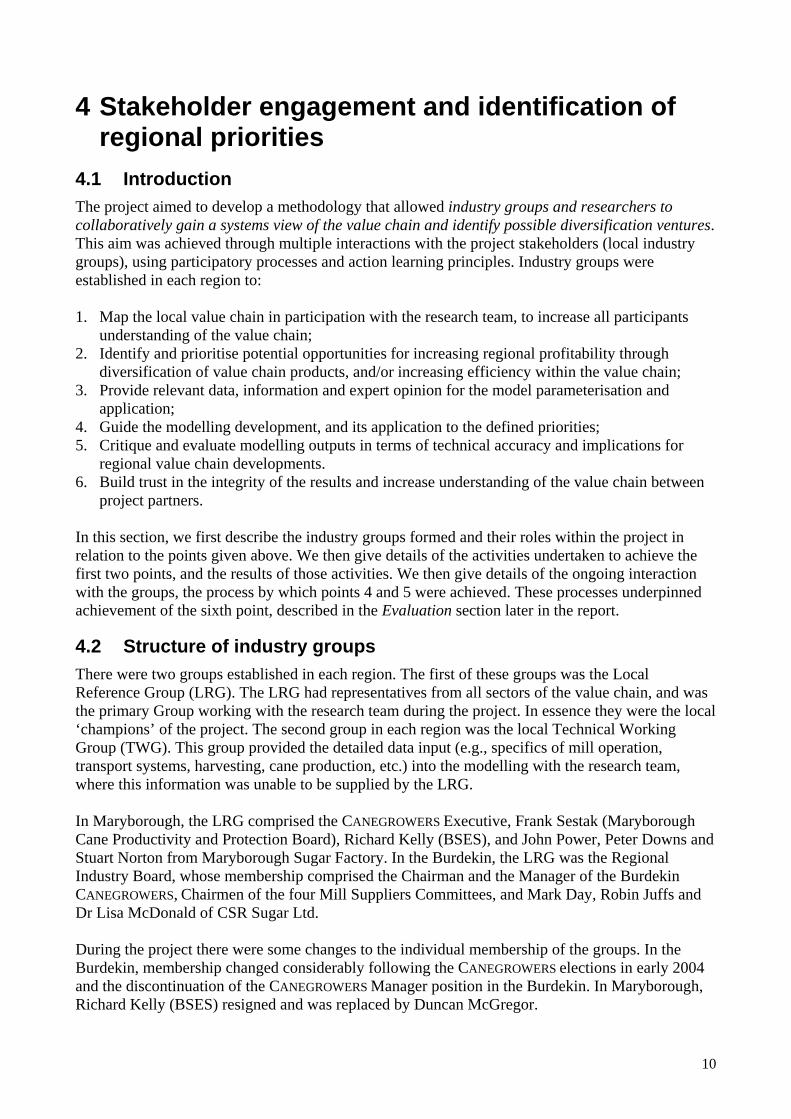
7.2.1.1 Whole crop harvesting in whole region ............................................................................................................29 7.2.1.2 Sensitivity of the outcomes to product prices ...................................................................................................30 7.2.1.3 Whole crop harvesting in areas close to the mill ..............................................................................................31 7.2.1.4 Sensitivity to different amounts of extraneous matter ......................................................................................32
7.2.2 Pioneer...................................................................................................................................................... 33 7.2.2.1 Net benefit of whole crop harvesting................................................................................................................33 7.2.2.2 Sensitivity of the outcomes to product prices ...................................................................................................34
7.2.3 Cost of trash as a fuel for co-generation .................................................................................................. 34 8 PROJECT EVALUATION .................................................................................................................................. 36
8.1 INTRODUCTION AND APPROACHES ...................................................................................................................... 36 8.2 SURVEY OF PERCEPTIONS .................................................................................................................................... 37
8.2.1 Details....................................................................................................................................................... 37 8.2.2 Survey scores ............................................................................................................................................ 37 8.2.3 Survey comments....................................................................................................................................... 39
8.3 ECONOMIC EVALUATION OF THE PROJECT........................................................................................................... 40 9 DISCUSSION ........................................................................................................................................................ 42
9.1 NEW INSIGHTS ON WHOLE CROP HARVESTING..................................................................................................... 42 9.2 REGIONAL RESPONSE TO RESULTS....................................................................................................................... 43 9.3 IMPACT ............................................................................................................................................................... 44
10 OUTPUTS AND OUTCOMES............................................................................................................................ 45
3

10.1 OUTPUTS............................................................................................................................................................. 45 10.2 PUBLICATIONS ARISING FROM THE PROJECT........................................................................................................ 45 10.3 OUTCOMES ACHIEVED AND EXPECTED ................................................................................................................ 46
11 FUTURE ISSUES.................................................................................................................................................. 49 11.1 POST-PROJECT ACTION PLANS ............................................................................................................................. 49 11.2 LARGE-SCALE IMPLEMENTATION OF THE METHODOLOGY................................................................................... 49 11.3 INTELLECTUAL PROPERTY .................................................................................................................................. 49 11.4 FUTURE RESEARCH NEEDS ................................................................................................................................. 50
12 RECOMMENDATIONS...................................................................................................................................... 51 13 REFERENCES...................................................................................................................................................... 52 14 APPENDIX 1: COMPILATION OF MODELS RELEVANT TO WHOLE-OF-VALUE CHAIN
RESEARCH EXISTING AMONGST THE PROJECT TEAM....................................................................... 54 15 APPENDIX 2: DETAILED DESCRIPTION OF THE VALUE CHAIN MODELLING APPROACH....... 61
15.1 INTRODUCTION ................................................................................................................................................... 61 15.2 VALUE CHAIN MODEL STRUCTURE AND FUNCTION ............................................................................................ 61
15.2.1 Introduction.......................................................................................................................................... 61 15.2.2 General description.............................................................................................................................. 61 15.2.3 Production Sector ................................................................................................................................ 63 15.2.4 Harvest Sector...................................................................................................................................... 63 15.2.5 Transport Sector .................................................................................................................................. 64 15.2.6 Mill Sector............................................................................................................................................ 66
15.3 MODELLING THE IMPACT OF TRASH REMOVAL ON SUGARCANE PRODUCTION IN THE MARYBOROUGH REGION .. 68 15.3.1 Introduction.......................................................................................................................................... 68 15.3.2 Modelling details.................................................................................................................................. 68
15.3.2.1 Soils ..................................................................................................................................................................68 15.3.2.2 Irrigation management......................................................................................................................................69 15.3.2.3 Trash removal ...................................................................................................................................................70 15.3.2.4 Cropping cycle..................................................................................................................................................70 15.3.2.5 General model configuration ............................................................................................................................70
15.3.3 Results .................................................................................................................................................. 70 15.3.4 References ............................................................................................................................................ 72
15.4 HARVESTER SHELL MODEL.................................................................................................................................. 73 15.4.1 Introduction.......................................................................................................................................... 73 15.4.2 Estimation of pre-harvest biomass....................................................................................................... 74 15.4.3 Estimation of biomass available to the system after harvest................................................................ 74 15.4.4 Estimation of delivery rate and the cost of harvest .............................................................................. 74
15.5 ROAD TRANSPORT PLANNING AND INTEGRATION INTO VALUE CHAIN MODELLING ............................................. 75 15.6 RAIL TRANSPORT PLANNING AND INTEGRATION INTO VALUE CHAIN MODELLING ............................................... 78
15.6.1 Introduction.......................................................................................................................................... 78 15.6.2 Modelling transport effects using ACRSS ............................................................................................ 79
15.6.2.1 Bin weight ........................................................................................................................................................79 15.6.2.2 Allotments ........................................................................................................................................................81 15.6.2.3 Delivery rate .....................................................................................................................................................81
15.6.3 The development of a simplified (‘functional’) model and implementation in the Value Chain Model82 15.6.3.1 Scenario ............................................................................................................................................................82
15.7 MODELLING FACTORY AND POWER PLANT PERFORMANCE FOR DIFFERENT TRASH RECOVERY SCENARIOS ......... 84 15.7.1 Introduction.......................................................................................................................................... 84 15.7.2 Factory model development and data collection.................................................................................. 84 15.7.3 Development of the simplified factory ‘shell’ model............................................................................ 86
15.7.3.1 Sugar and molasses predictions ........................................................................................................................87 15.7.3.2 Total and export power predictions ..................................................................................................................88
4

1 Executive Summary The Australian sugar industry has recently faced an unprecedented cost-price ‘squeeze’ from a run of poor seasons and the collapse of the sugar price. As a result there is impetus to consider diversifying products from the raw sugar production value chain. The chain is complex however, and alternative products will necessitate substantial changes to the chain, the impacts of which will be difficult to predict a priori. Modelling offers insights into the impacts of, and benefits from changes to value chains. Analyses of the chain should, ideally, be conducted in enough biophysical detail to allow the logistical challenges to be properly analysed. The application of these modelling techniques in a participatory environment would allow groups within mill regions to more thoroughly evaluate diversification options of their sugar value chains in their region, and so move forward with more confidence and greater understanding than occurs with other approaches. While participatory modelling has previously been undertaken for issues in one or two sectors of the Australian sugar value chain, it has not been attempted for the whole of the chain before. In this project we aimed to facilitate the improved economic efficiency of the sugar industry value chain through developing and participatively applying an innovative modelling capability that allowed industry groups to identify and evaluate sugar value chain diversification options. The project was conducted in partnership with all sectors of the Burdekin and Maryborough industries. The first phase of the project entailed working with the regional groups to identify and prioritise potential diversification options for their region. In both regions whole crop harvesting to maximise electricity co-generation was identified as the highest priority venture for consideration in the project. In the Burdekin, two contrasting mill regions (Invicta and Pioneer) were analysed to maximise the relevance of the results to the region. An agent-based modelling framework was then developed and used to analyse each mill region. Additional income from electricity and Renewable Energy Certificates sales was weighed against not only the costs of operating and, for some scenarios, constructing the co-generation facility, but also the costs associated with (1) productivity reduction associated with the loss of trash from the field, (2) harvesting and transporting to the mill the additional material, and (3) the impact of increased trash on sugar mill operations. In general, predicted impacts on the farming and milling sectors were greater than anticipated by stakeholders, because the farm impacts had not been fully considered previously and capital costs were higher than anticipated. Conversely, impacts on the harvesting and transport sectors were less than anticipated because of possible increases in logistical efficiency in these sectors in some regions. For Maryborough annual costs were predicted to be considerably greater than revenues, and the stakeholders in that region decided the venture was not viable. The economic benefit of this decision, which is at least partly attributable to the project, is in the order of $50M. This result alone gives the project a benefit cost ratio between 3 and 34, and an internal rate of return of 20 to 97 %, depending on the degree of attribution. For the two Burdekin mills co-generation plants with spare capacity do (or soon will) exist in these mills minimising additional capital costs. So revenues were predicted to be close to costs for both mill regions. Regional stakeholders did not proceed with these ventures, but are well placed to conduct more detailed feasibility studies should changes in economic conditions make the ventures more attractive. In the Maryborough and Invicta mill regions, possible improvements in efficiency in the harvest and/or transport sectors were identified and work is underway to refine and implement these in Maryborough.
5

In addition to the assessment of the co-generation ventures, other outputs from the project include the definition for the first time of: • The cost of trash as a fuel for co-generation when collected through the harvest and sectors in the
three mills, and • The regional net value of trash blanketing in the Maryborough. This information allows the regions to better assess issues such as the attractiveness of alternative uses for trash (e.g. stockfeed) or alternative methods of collecting trash (e.g. bailing operations). Additional outcomes from the project include increased understanding of the issues involved in maximising co-generation and the complexities of the sugar value chains amongst collaborators, as well as acceptance of value of value chain modelling and the outputs produced by these groups. Finally, this project has demonstrated that whole-of-value chain modelling can be undertaken in partnership with industry stakeholders to analyse significant, complex regional issues and produce knowledge and benefits that would not have otherwise been revealed.
6

2 Background The Australian sugar industry has recently faced an unprecedented cost-price ‘squeeze’ from a run of poor seasons, the collapse of the international price of raw sugar and a strengthening currency. While the situation has recently abated, there is no doubt that the long term outlook for sugar prices is more pessimistic than in recent decades. Faced with this situation, the industry must become more efficient at producing raw sugar and look for alternative activities, or undertake what Hamel and Prahad (1994) describe as “getting better and becoming different”. Much attention has been given to improving productivity and profitability in the industry, both through research (e.g. Wood et al. 2003) and extension (Juffs et al. 2004) – these efforts being aimed at getting better. One dimension of becoming different is consideration of alternative products from the raw sugar production value chain. For many years there has been substantial interest in diversification within the industry (e.g. Allen et al. 1997), with recent interest focusing on production of renewable energy from ethanol or electricity co-generation (Keating et al. 2002; Sutherland 2002). Undertaking these ventures entails new challenges for the traditional organisation of the sugar value chain. For example, feedstocks for these processes are required at different times and possibly from different sources from those associated with ‘traditional’ sugar production in Australia. Other possible new enterprises, such as the production of fibre-based products (paper, packaging, etc.) or lactic acid (Allen et al. 1997), pose similar challenges. Some of these changes may demand development and employment of new infrastructure, such as factory-based trash separation (Schembri et al. 2002). Others will challenge the traditional logistical operation of the value chain, such as whole crop harvesting to maximise co-generation. Further, some will substantially impact on the farming sector, such as growing sweet sorghum as an alternate feedstock for out of season ethanol production (Webster et al. 2004). What is required for the Australian sugar industry to evaluate the challenges of diversifying the supply chain? Many evaluations have focussed heavily on the economic aspects of diversification (e.g., Keating et al. 2002; Sutherland 2002), and included only broad assumptions about the changes to the organisation of the value chain. Ideally, evaluations should be conducted in enough biophysical detail to allow the logistical challenges to be properly analysed. It is likely that this will entail application of modelling and simulation techniques to describe the flow of material and products and their economic costs and value (Gigler et al. 2002; Van der Vorst et al. 2002). The modelling would provide an objective means of discovering benefits and disbenefits associated with each change or diversification option. Undertaking these modelling analyses using participatory methods, where participants in all sectors of the industry collaboratively explore and evaluate possible value chain changes, could build knowledge of, and confidence in the value chain (Gaucher et al. 1998). Such a process would build trust in any decisions regarding the value chain, such as diversification. Trust built would be highly desirable in Australian sugar supply chains which have a somewhat adversarial history (Milford 2002). Thus, coupling these participatory and modelling approaches could prove a powerful tool for evaluating diversification options of sugar supply chains. There have been many models developed within the Australian sugar industry. However, these models generally only consider activities or processes in a single sector (e.g. Table 1). It is only relatively recently that there has been development of multi-sector models, with these focussing on the interface between the harvesting and transport sectors (Grimley and Horton 1997; Higgins et al. 2004). To properly consider diversification options in the raw sugar value chain, all sectors of the value chain would need to be modelled. Ideally a whole-of-value-chain model would draw upon existing sector models, increasing the benefits derived by the industry from its previous investment in these models. Innovative modelling techniques (e.g. agent based modelling) are available to
7

facilitate development of practical models of complex systems, but are not yet common in value chain modelling, especially in the sugar industry. The application of these modelling techniques in a participatory environment would allow groups within mill regions to more thoroughly evaluate diversification options of their sugar value chains in their region, and so move forward with more confidence and greater understanding than would have occurred with previous approaches. Table 1. Examples of the processes that have been modelled within the different sectors of the Australian sugar industry. (Further details are given in Appendix 1.) Sugarcane production
Harvesting Transport Milling
• Cane and sugar growth, responding to: − Nitrogen − Irrigation − Trash blanket
dynamics • Statistical CCS and cane yield estimation
• Harvest haul model • Harvesting group roster optimisation
• Harvesting group-to-siding optimisation
• Capacity planning tools for transport
• Road transport schedule optimisation
• Siding location and pad optimisation
• Rail transport schedule optimisation and schedule checking simulation models
• Raw sugar manufacture
• Cane handling
• Trash separation • Co-generation
Underpinned by: − GIS techniques − Database techniques for whole-of-industry models − Miscellaneous information
8

3 Project objectives The objective of this project was to underpin improved economic efficiency of the sugar industry value chain through developing and participatively applying an innovative modelling capability that facilitates industry groups identifying and evaluating sugar value chain diversification options. This was achieved by: 1. Developing a methodology that: (i) allows industry groups and researchers to collaboratively
gain a systems view of the value chain and identify possible diversification ventures, and (ii) provides a modelling framework, describing the main biophysical and economic aspects of the region’s value chain, to explore the value chain consequences of adopting these ventures in a mill region.
2. Piloting the application of this methodology participatively with industry partners in the Burdekin and Maryborough regions and refine the methodology in light of the experience gained.
3. Having industry partners in the Burdekin and Maryborough regions identify benefits across all sectors of new value chain ventures analysed, and evaluate the attractiveness of the ventures to the region.
4. Identifying the requirements for large-scale implementation of the methodology, and develop a post-project action plan for this implementation.
Objective 1 has two parts; (i) a social objective of establishing collaboration between researchers and industry participants, and building a shared systems view of the value chain in the regions amongst these two groups; and (ii) a technical objective of developing a modelling framework that can describe the whole value chain. The processes used to address the social objective are described in Section 4. An important component of achieving this objective was the prioritisation of the diversification ventures in the region, leading to the definition of the venture to be analysed through value chain modelling. The result of the prioritisation is described in Section 4. The definition of the venture and its ‘evolution’ during the project in response to the action learning cycles (i.e. the outcome of the social objective) is described in Section 5. The technical objective, development of a value chain modelling framework, is described in Section 6. The process to achieve Objectives 2 and 3 is the evolution of the ventures’ details, as described in Section 5. The results of this process, that is definition of the benefits (or dis-benefits) and stakeholders’ appraisal of the attractiveness of the venture, is described in Section 7. Objective 4, the requirement for large-scale implementation and development of post-project action plans, is addressed in Section 11 (11.1 and 11.2). The project’s objectives were achieved. The achievements of the first three objectives are evaluated in Section 8 and discussed in Section 9 of the report, while the achievement of the fourth objective is given in Section 11.
9
4 Stakeholder engagement and identification of regional priorities
4.1 Introduction The project aimed to develop a methodology that allowed industry groups and researchers to collaboratively gain a systems view of the value chain and identify possible diversification ventures. This aim was achieved through multiple interactions with the project stakeholders (local industry groups), using participatory processes and action learning principles. Industry groups were established in each region to: 1. Map the local value chain in participation with the research team, to increase all participants
understanding of the value chain; 2. Identify and prioritise potential opportunities for increasing regional profitability through
diversification of value chain products, and/or increasing efficiency within the value chain; 3. Provide relevant data, information and expert opinion for the model parameterisation and
application; 4. Guide the modelling development, and its application to the defined priorities; 5. Critique and evaluate modelling outputs in terms of technical accuracy and implications for
regional value chain developments. 6. Build trust in the integrity of the results and increase understanding of the value chain between
project partners. In this section, we first describe the industry groups formed and their roles within the project in relation to the points given above. We then give details of the activities undertaken to achieve the first two points, and the results of those activities. We then give details of the ongoing interaction with the groups, the process by which points 4 and 5 were achieved. These processes underpinned achievement of the sixth point, described in the Evaluation section later in the report.
4.2 Structure of industry groups There were two groups established in each region. The first of these groups was the Local Reference Group (LRG). The LRG had representatives from all sectors of the value chain, and was the primary Group working with the research team during the project. In essence they were the local ‘champions’ of the project. The second group in each region was the local Technical Working Group (TWG). This group provided the detailed data input (e.g., specifics of mill operation, transport systems, harvesting, cane production, etc.) into the modelling with the research team, where this information was unable to be supplied by the LRG. In Maryborough, the LRG comprised the CANEGROWERS Executive, Frank Sestak (Maryborough Cane Productivity and Protection Board), Richard Kelly (BSES), and John Power, Peter Downs and Stuart Norton from Maryborough Sugar Factory. In the Burdekin, the LRG was the Regional Industry Board, whose membership comprised the Chairman and the Manager of the Burdekin CANEGROWERS, Chairmen of the four Mill Suppliers Committees, and Mark Day, Robin Juffs and Dr Lisa McDonald of CSR Sugar Ltd. During the project there were some changes to the individual membership of the groups. In the Burdekin, membership changed considerably following the CANEGROWERS elections in early 2004 and the discontinuation of the CANEGROWERS Manager position in the Burdekin. In Maryborough, Richard Kelly (BSES) resigned and was replaced by Duncan McGregor.
10

Membership of the TWG in each region is shown in Table 2. Table 2. Members of the Technical Working Groups in the Burdekin and Maryborough regions. Burdekin Maryborough Dr Lisa McDonald, CSR Peter Downs, MSF Peter Flanders, CSR Stuart Norton, MSF Greg Wieden, CSR Glyn Peaty, MSF Gary Stockham, Harvester and Grower Frank Sestak, MCPPB Robert Cocco, CANEGROWERS (to May 2004) Richard Kelly/ Duncan McGregor, BSES In addition to these local groups, a broader Industry Reference Group was established drawing its membership from organisations representing different sectors of the industry (e.g., ASMC, CANEGROWERS and QSL). This group ensured that the developments in the project are widely applicable within the industry and assisted in communicating the project’s achievements throughout the industry and with identifying post-project action plans.
4.3 Definition of regional priorities To fully understand the opportunities for improving regional profitability through value chain improvements (from product diversification and/or increasing efficiency), the systems nature of the value chain in each region needed to be defined. Having both regional stakeholders and the research team participate in this definition would result in a common understanding of the value chain, and provided a stronger foundation for communication between these groups during the project. Understanding the value chain is also important for identifying how changes in the value chain will contribute to regional priorities. The systems nature of the raw sugar value chain in each region was defined in the first workshop conducted in each region. A participative process was employed in which members of the LRG mapped their region’s value chain within the workshop. The result was construction of a flow diagram of the value chain (e.g. Figure 1) by the whole group. The flow diagram showed the important steps in the chain and how they related to each other, and so facilitated a discussion on how the chain could be improved upon. This process provided a common understanding of the region’s value chain of the issues amongst members of both the LRG and the research team, and provided the foundation for prioritising value chain-related issues for consideration in the project. Following the value chain mapping, both LRG’s were asked to define goals for their region, and identify new value chain ventures that they thought had potential to improve regional profitability, and fulfil these goals. In Maryborough, the LRG identified two goals for the region:
(1) Milling more than one million tonnes of cane each year, and (2) Maximising the value of trash1.
They rated use of trash as fuel for electricity co-generation through whole crop harvesting as the highest priority venture to be analysed in the project.
1 The term trash is used loosely in the industry, often meaning non-millable stalk and green leaf sheaths (sometimes referred to as tops) together with live and dead leaves. Live and dead leaves are sometimes also referred to as trash. We will generally use the first connotation of the term (i.e. all plant material in the cane supply other than cane), except where greater precision is required in defining the components of the cane supply.
11

Figure 1. Flow diagram of the Maryborough region raw sugar value chain as mapped by the Maryborough Reference Group.
the Burdekin, the Burdekin Regional Industry Board had identified a number of short- and ssues
be
4.4 Ongoing Interactions with the Regional Groups egional workshop, a
cilitated
and
teractions with the TWG’s were generally informal, while interactions with the LRG’s occurred at
arising from the late opening of Pioneer mill.
TRANSPORT
local governmentimpact
waiting timeimprove scheduling
communication
environmentaltransport
HARVESTINGpresentation
less downtime
cane loss / juice lossfinancial drivers
group sizeextraneous matter
ENVIRONMENTAL
bench marking
impact of GCTB
land clearing
positive messages
biodegradableplastics
INTERMILLTRANSFER
mill viability
transport cost
sugar qualityseason length
CCS WATER /IRRIGATION
off stream storage
irrigation costs
social attitude
CANEPRODUCTIVITY
water harvesting
varietiesgenetic
modification
soil health
farming systems
COOPERATINGGROUPS
cooperativestructures
lifestyle impacts
farming transportlinkages technology cost &
usagecost of notcooperating
CO-GEN
fuel supplyviability throughput
cane cleaning
upgrade millingtrain
whole of cropharvest
trash value onground
returns sharingbenefit
co gen transportcost
season length cogen
CANEPAYMENT
NIR
feedback tofarmers
alternativeincentives
quality
PLASTICS /DIET
PRODUCTS
ownership wholeof cane
value adding
capital costs
growing sugar canenot sugar
alternatives tosucrose
LEGUME /CASH CROPS
sugar beet
soil health benefits
zonal harvest - largecooperatives
incentives
ethanol & otheroportunities
green burn wateruse
Inmedium-term value chain issues that were important for the region prior to the project. These iincluded subjects such as benchmarking, business structures in the region, improving productivity, as well as opportunities for diversification (e.g., using trash for electricity co-generation, producing fuel ethanol). Mapping of the value chain was still undertaken to build a collaborative view of the raw sugar value chain in the Burdekin region. Following the mapping, the Burdekin LRG identifiedwhole crop harvesting to maximise fuel for electricity co-generation as the highest priority venture to be analysed in the project. Further, the Group proposed that two mill regions shouldanalysed to maximise the relevance of the results to the region. The regions chosen were Invicta and Pioneer, because of their contrasting cane transport system characteristics.
After identification of the venture to be analysed in the project at the first rprocess of regular interactions with the regional groups was needed to allow exchange of information between the research team and the regional stakeholders. These interactions fathe development of the value chain model and the analysis of the scenarios. Information was regularly obtained from both the LRG’s and TWG’s, to allow parameterisation of the model, the results of the analyses presented to the LRG’s for feedback. Inworkshops every three to four months (Table 3), except when a LRG requested a delay. A delay was requested in both regions in early 2005, when mill staff and growers’ representatives were negotiating mill supply contracts. This delay was compounded in the Burdekin by complications
12

Table 3. Dates of workshops held with the Local Reference Groups in each region during the project and details of Project Team interactions and value chain model formulation.
Date Maryborough Burdekin Project Team
2003 June Team and Burdekin LRG members Robin Juffs and Lisa McDonald meets to developing common understanding of project gaols and agree on methodology and operations
Aug-Sept Startup workshop held – regional priorities defined. Whole crop harvesting identified as top priority.
Startup workshop held – regional priorities defined. Whole crop harvesting identified as top priority
Modelling workshop I: Team develops modelling philosophy: Functional models linked to value chain (VC) shell. Starts development of functional models.
Nov Revisit priorities in light of Govt. announcement on renewable energy. Presentation of early (functional) model development.
Model development continues.
2004 Feb-Mar
Presentation on progress with value chain model shell and functional models. Feedback on early extraneous matter/fuel amount results.
Reference Group membership changes. Second start up workshop held – regional priorities defined. Whole crop harvesting (again) identified as top priority
Modelling workshop II: Detailed analyses of necessary material and financial ‘flows’ in the VC shell.
June Presentation of initial results of full VC analysis of scenario (trash used outside season). Feedback modifies scenario – larger co-gen plant, utilise trash within season, add wood chips as fuel.
Presentation on progress early DM results. Feedback on early extraneous matter/fuel amount results.
Team meets to prepare for regional workshops.
July Modelling workshop III: Finalising economic analyses. Checking for consistency in definitions and assumptions.
Sept Modelling workshop IV: Checking details of scenarios and consistency in definitions and assumptions.
13

Date Maryborough Burdekin Project Team
Oct Presentation of final C
co-en. Group accepts
that there is a net negative result. Feedback modifies scenario – implications of using trash for other purposes.
Presentation of initial ll VC
max co-gen. eedback on
information needed by the LRG to assess scenario results.
Team meets to prepare for ops. analysis of full V
analysis of max g
results of fuanalysis of F
regional worksh
Nov Presentation of final analysis of full VCanalysis of max co-geGroup accepts that thereis a net nega
n.
tive result.
Feedback modifies cenario – ‘remove’
capital from PNR; optimise system at INV, look at WCH in areas close to the mill at INV.
2005 Mar in due to
ract
LRG asks for delay in next workshop due to
ct
alyses
Modelling finalised.
s
Team meets to prepare for regional workshops.
LRG asks for delay next workshopcane supply contnegotiations.
cane supply contranegotiations. Results of new ansupplied to, and discussed with CSR staff.
Apr Presentation of final
ng
en.
Team meets to prepare for
Sept Presentation of final analysis of full VC implications of using trash for other purposes. Project evaluation
ndertaken
Team meets to prepare for regional workshops.
analysis of full VC implications of usitrash for other purposes. Project evaluation undertak
regional workshops.
u The information exchange occurred at two levels. The first was th ctor models. In this participative process, specific details were obtaine on with the TWG’s to model a specific sector (e.g., harvest-haul proc such as the cost of harvesting per tonne of cane in 2003, were presented to process resulted in sector-specific modelling that was both unders s. The second information exchange involved the clarification and evolution of the details of the scenario being analysed.
e technical specification of sed either from, or in collaboratiess). Then model outputs, the LRG’s for critiquing. Thistood, and accepted by the LRG’
14

4.5 Interactions within the research team As wel sta eed interaction b e re ract • Team mem in va v ue chain, and • Team mem diff ence in value chain analyses. As well, the comm alties needed for the project) and had never worke rable effort was put into team building and communicat function effectively. While much of this effort was informal, there were a rkshops undertaken throughout the project (Table 3) to achiev e Initially, these workshops were aimed lo standing of the approach taken to the research prob . Workshops then concentrated on the task of creating the original modelling needed to undertake the analyses required to address the stakeholder issues. Following this irected at defining and checking the modelling details. This proved importa st other things, the different terms used in the science and technology of the di sh on a farm becomes extraneous matter at the mill). Once whole-of-value chain results wer ions increasingly focussed on effectively comm ult n and what o p lat erm d to be coordinated, th These efforts nsure effec g of the project team, and to allow the project to progress at a pace that matched the expectations
l as interacting with industryetween members of th
bers had specialities bers had significantly
team was large (to acd together (as one team) bion to enable the team to series of project team wogoals.
keholders, there was nsearch team. These inte
rious sectors of the sugarerent amounts of experi
odate all the speciefore. So, conside
for a significant amount of ions were needed because:
al
e thes
at team building and develem (e.g. June 2003 Table
phase, workshops were dnt because of, amongfferent sectors (eg, tra
e being produced, interacts to the LRG’s. Each prese
p3)
ing a common under
unicating these resresenting and how it re
and the implications of
were vital to e
ter needed to understs and units used needethers were ed to his/her material, t
e results agreed upon.
tive functionin of the LRG.
15

5 Action learning - evolution of the venture 5.1 Introduction
o-gar
then ario as specified by the LRG’s, and results of the analyses presented back to
e e then describe the evolution of the scenarios in each mill region and reasons
ined
g
cane. Harvesting the whole crop slows the harvesting process, increases the amount of material to be transported from the harvester to the mill, and reduces the efficiency of sugar extraction in the milling process (Shaw and Brotherton 1992). At the mill, whole crop harvesting would require new infrastructure for (1) separation of trash and cane at the mill prior to crushing the cane (Schembri et al. 2002) to minimise the impact on mill efficiency, and (2) maximising electricity production (increased generation capacity, upgrading mill components, etc.). At the farm level, retaining trash on the soil surface trash increases sugarcane yields in many environments (Thorburn et al. 2004), and so its removal may impact the amount of material (cane and trash) available for processing, and hence products (sugar and electricity) available for sale. Thus, the LRG’s perceived that the challenge was to determine if the logistical problems of handling increased volumes of material in the harvesting and transport sectors and the negative impacts at the farm and mill factory were out weighed by the additional revenue from increased production of electricity for export and the Renewable Energy Certificates (RECs) associated with the generation of renewable power. While both LRG’s had identified whole crop harvesting as the priority for the project, there were considerable differences between the regions in each sector (summarised in Table 4) that affected the analyses. In the Burdekin region trash was burnt on the vast majority of farms, all of which were irrigated, and cane transported to the mill by a railway system. Further, there was (or would be) bagasse-fuelled co-generation plants with spare capacity at both Burdekin mills. In the Maryborough region, trash was retained on the soil in approximately 60% of farms, farms had varying access to irrigation water, cane transport was undertaken by road, and there was no existing co-generation capacity. Further, in Maryborough there was the possibility of additional fuel (wood chips for a local forestry operation) for a co-generation plant.
The venture defined by both LRG’s, whole crop harvesting to maximise fuel for electricity ceneration, is a complex undertaking entailing changes to and impacts on all sectors of the sug
value chain. This complexity meant that many concepts and details of the venture needed to be defined during the analysis. Initially, each LRG specified the details of the venture to be analysed, setting ‘big picture’ parameters for the analysis. Examples of these specifications included the new capital facilities that would be ‘constructed’ within the model, use of trash during the maintenance season (or not), etc. We use the term scenario to describe these specifications. Analyses were
ndertaken of the scenuthe LRG’s. Following these presentations, the LRG’s refined the scenarios seeking improved profitability and further analyses were performed. This was an action learning processe, and resulted in the scenarios in each region evolving during the project, as illustrated in Table 3. The process also resulted in much of the increased understanding of the regional values chains achieved by the project participants. In this section of the report, we summarise the potential impacts of whole crop harvesting on thugar value chain. Ws
for the changes. In general, the detailed discussion of results in subsequent sections will be confto the analysis of the final scenario, except where the evolutionary process illustrates an advantageof the methodologies used in the project.
.2 The ‘challenge’ of whole crop harvestin5Whole crop harvesting represents a substantial change to the traditional supply chain. Harvesters generally aim to minimise the amount of trash harvested with the
16

e based.
ment Transport Mills
Table 4. Differences in characteristics of the two regions in which the case studies wer Region Farm manage
Maryborough • Trash generally retained on • Road • Single mill the soil on farms
• Limited or no irrigation • No electricity co-generation capacity • Possible access to additional fuel (wood
chips) Burdekin • Trash generally burnt
• Full irrigation • Rail • Multiple mills
• Spare electricity co-generation capacity
5.3 Details of the venture in each region
5.3.1 Maryborough In Maryborough, the initial specification of the venture was for additional fuel from whole crop harvest to be used to fuel a co-generation plant operating during the maintenance season. Analysis of this scenario showed that storage of trash and bagasse would be problematical and there would be incomplete utilisation of the co-generation plant (Figure 2a). Thus the scenario would be
other markets for trash (e.g., esults of the project increasingly
d
been if the
ensive) Thus
t Invicta, the LRG proposed that the initial analyses should be conducted under the constraint of ge
nd ch haul-out.
e,
ne transport system. The lower bulk ensity of the harvested material resulted in a substantial reduction in weight of cane pulled by each
uneconomic. Wood chips are a potential source of fuel for an electricity co-generation plant in Maryborough, so the LRG suggested that the plant should be large enough to utilise all the trash and bagasse during the crushing season and then rely on wood chips during the maintenance season (Figure 2b). The result was that the overall utilisation of the co-generation plant was still too low (as described in detail below). During the project, the Maryborough LRG was also investigatinggarden mulch, stock feed, etc.). This investigation intensified as rindicated that maximisation of co-generation was unlikely to be profitable. The analyses conductein the project showed that trash blankets generally have a positive impact on production and profitability in the region. So, profits from any alternative use of trash needed to be judged against loss of regional profitability from removal of trash blankets. Within the LRG there had also ongoing debate about the net benefits of trash blanketing: In effect LRG members were askingagronomic benefits of trash blanketing were worth the disbenefits of difficult (and more expharvesting, less efficient transport and difficult milling associated with green cane harvesting?the LRG proposed that the regional value of trash blanketing be defined.
5.3.2 Burdekin As described above, the Burdekin LRG proposed that two mill regions should be analysed to maximise the relevance of the results to the region. The regions chosen were Invicta and Pioneer, because of there contrasting cane transport system characteristics.
5.3.2.1 Invicta mill region Ano new capital expended, other than a cane cleaning plant and expansion of existing bagasse storafacility. The analysis predicted that there would be two ‘bottle necks’ in transport of the whole cropfrom the field to the mill. The first, and most acute, was in-field hauling the cane (i.e. connecting the harvesters to the mill transport system) with whole crop harvesting. The additional volume (alower bulk density) of the harvested material reduced the mass of material carried by eaAs a result, harvesters were predicted to be spending a much greater proportion of their time idlwaiting for haul-outs, than happened when harvesting burnt cane. The second ‘bottle neck’ was predicted to be in the cane transport system. There are currents limits to the weight (and hence number of bins) that can be pulled by the locos in the Invicta cad
17

a
as fuel in the maintenance season, and (b) was used during the crushing season allowing the plant to be fuelled by
intenance season.
ubsequent analyses. These were increasing the number of haul-outs with each harvester and increasing the number of bins pulled by
ht pulled by the locos in this scenario was similar to that in the base
b
Figure 2. Schematic representation of the electricity co-generation scenarios at Maryborough assuming that additional material from whole crop harvesting was (a) used
wood chips in the ma loco with the maximum number of bins currently allowed. In discussion of these results, possible ways to overcome these bottle necks were identified and tested in s
the locos until the total weigcase. The Invicta mill region is ‘long and thin’, so distances between individual farms and the mill quite variable. Thus the LRG asked whether there might be greater net benefits in harvesting the whole crop in regions close to the mill, where transport distances, and hence costs, will be lowest. The analysis of whole crop harvesting in only part of the Invicta regions was undertaken assuming that all farms serviced by a particular branch line would harvest the whole crop. The analysis was initially conducted for the branch line closest to the mill, then additional branch lines successively further away from the mill were added.
Bagasse
Crushing season
Co-
gen
cac
apity PRODUCTS:
SugarMolassesmore Electricity
Whole-of-crop harvestBillets + ‘lots’ of EM
Cane cleaplant
ningCane cleaplant
ningCane cleaplant
ning
Trash UnusedTra
TrashstorageTrash
storage
sh Unused
TrashTrashUnusedUnusedWood chipsWood chips
BagasseCo-
gen
capa
city
Co-
gen
capa
city
Crushing seasonCrushing season
Whole-of-crop harvestBillets + ‘lots’ of EM
Cane cleaningplant
Cane cleaningplant
Cane cleaningplant
PRODUCTS:SugarMolassesElectricity for power supply
PRODUCTS:SugarMolassesElectricity for power supply
18

5.3.2.2 Pioneer mill region The initial scenario for Pioneer Mill was to have a stand-alone co-generation and cane cleaning plant fuelled by trash from whole crop harvesting. This scenario proved uneconomic because of the capital cost of establishing a co-generation plant for the amount of fuel generated by whole crop
vesting. Following this analysis it came to light that there would be spare capacity in the co-generation plant being constructed at Pioneer Mill, and the Burdekin LRG advised that the value in supplying that spare capacity from whole crop harvesting (Figure 3) be determined.
har
FiBu
5.As well as the evolution of the scenarios, there were specific issues identified by the two LRG’s for
t. e for
ited measurements, the LRG’s believed that trash
nships between sugarcane and trash yields. So the sensitivity of different relative amounts of
s
crop harvesting. These costs were estimated and presented to the LRG’s.
gure 3. Schematic representation of the final electricity co-generation scenario at the two rdekin mills, with additional material from whole crop harvesting was used as fuel to utilise the
spare capacity in co-generation plants existing at the mills.
3.3 General issues
Cur
rent
co-
gen
capa
city
Fuelled by bagasse
‘Spa
re’ c
apac
ity
Bagasse Cane cleaningplant
Cane cleaningplant
Whole-of-crop harvestBillets + ‘lots’ of EM
Trash
StorageStorage
Billets + some EM
Fuelled by trash
Extended co-generation
further analysis. An important issue was the amount of trash associated with the sugarcane planKnowing the amount of trash is important as it affects revenues (through the amount of bagassco-generation) and costs (through harvesting and transport inefficiencies). The latter effect arises because increased trash reduces the bulk density of the mixed cane supply (i.e. cane billets plus
ash). Based on anecdotal information and/or limtrwould be as high as 30% of the total mixed cane supply with whole crop harvesting. A method (described below) was developed for application of the value chain model to explicitly estimate the amount of trash in each block of cane in the region being studied. However, there is uncertainty in any estimation and other factors, such as varieties, may systematically effect
latioretrash in the mixed cane supply was explored with the Burdekin LRG for the Invicta region. Another issue was identifying the cost of trash (derived from whole crop harvesting) as a fuel for co-generation. There maybe alternative fuels for co-generation, such as wood chips in Maryboroughor coal in Mackay. There are also alternative ways of using trash as a fuel, such as bailing trash blankets after green cane harvesting, and transporting the bails to the co-generation plant. There wageneral interest in the cost comparison between these alternatives, as well as the regional differences in the cost of trash from whole
19

6 Value chain model development and application 6.1 Value chain modelling framework Value chains can be modelled in different levels of complexity, ranging from simple ‘back of the nvelope’ approaches to models that capture a great deal of the biophysical detail in the system. The rst approach suffers because the analyses contain simplistic assumptions about the biophysical and
logis
logissystinco
form
matter generated) and costs in individual sectors of the value chain (growing, harvesting, transport rols the
. Total revenue is calculated within the amework from the amount and price of the products (sugar, molasses and electricity) produced.
Greater details of the modelling framework are given in Appendix 2.
ls
as achieved one of two ways: (1) by fixing many of the variables and parameters in detailed models for the
iled
efi
tical attributes of the system, and these assumptions are ‘propagated’ through the analysis. Thus the results are almost entirely a product of the base assumptions and they provide little real insight into the complexities of the system. However, this approach is attractive because of (1) the speed with which the analysis can be undertaken, and (2) the ease with which it can be translated into a financial or economic analysis. The second approach, while capturing the biophysical and
tical detail of the system and providing a comprehensive and general representation of the em, can result in a large complex model, which takes a long time to develop and is virtually mprehensible to people outside the development group. We sought a compromise between
these two commonly employed approaches; that is to develop a model that captured adequate biophysical and logistical detail for the region being modelled, whilst being comprehensive to the LRG’s and developed rapidly.
The value chain model was developed on agent-based modelling philosophies. That is, agents were ulated which represented each of the sectors in the value chain, and the various linkages
between the sectors. In general the agents defined the physical outputs (i.e. the cane and extraneous
and processing). The ‘agents’ were embedded in a modelling framework (Figure 4) that continteractions between sectors; that is physical outputs and costs flowing down the chain, subject to feedback (such as logistical constraints) flowing up the chainfr
6.2 Functional model development The ‘agents’ embedded in the modelling framework were based on a functional model that represented the detailed biophysical, logistical and economic flows in each sector (sugarcane production, harvesting [and infield haulage], cane transport and the factory). Functional models were written in a spreadsheet format and were generally simplified versions of the detailed modeshown in Table 5. Apart from road transport, these detailed models previously existed in the sugar industry. The extraction of the simplified functional models from the detailed models winspecific conditions in the case study regions; or (2) by writing a simplified spreadsheet model that closely approximates the functionalities of the detailed model necessary for the analysis. The development of the functional models in each sector is summarised below, with a more detadescription of each functional model given in Appendix 2.
20

Production Harvest Transport Mill
Figure 4. The sugar supply chain modelling framework illustrating the relationship between the detailed existing models, functional models and agent models. Table 5. Models used to represent each sector in the modelling framework for the sugar supply chain. Sector Farm Harvesting Transport Factory APSIM-Sugarcane: Harvest-Haul model: Road: Higgins (2006)
l: Pinkney and Hobson and Wright (2002) Keating et al. (1999), Sandell and Rai
Thorburn et al. (2001, 2004, 2005)
Prestwidge (2004) Everitt (1997), Higgins and Davies (2005)
6.2.1 Sugarcane production The relationship between sugarcane yield and the amount of trash retained on the soil was predicted by simulating long-term sugarcane yields with and without a trash blanket using APSIM-Sugarcane(Keating et al. 1999; Thorburn et al. 2001, 2004, 2005). It is not practical (or possible) to accuratelycharacterise every block in a mill region. So, the range of soil types and irrigation managements were identified the Maryborough region based on expert opinion of the LRG. The result was
eneric classification of ‘good’, ‘average’ and ‘poor’ soils,
with parameters representing likely ater holding capacity, root depth and nitrogen fertility. Availability of water was seen as the main eterminant of irrigation scheduling, with irrigation water being either ‘unlimited’, ‘limited’ or ‘dry
land’ (i.e. unavailable). Rules for irrigation application were developed for these three circumstances. Long-term simulations of sugarcane yield were undertaken for each of the nine possible soil-irrigation conditions and a range of trash removals at harvest. Trash removal ranged from no removal (i.e. representing trash blanketing) to 95% removal, representing whole crop harvesting or
gwd
Agronomic ModelCrop modellingrelationships•Trash blanketing growth effects•Cane/Leaf growth proportion
Harvest ModelsBest harvest practice modelling•Standing cane modelling•Cane loss, and yield effects•Cost modelling
Transport ModelsDelivery rate modelling•Capacity•Cost modelling
Factory ModelMill modelling relationships•Material input/output processes
revenues
Unchanged mgt structurescosts
Inputs OutputsProcessing
Unchanged mgt structurescosts
Inputs OutputsProcessing
MainFunctional models
Existing Industry models
Cropping model
(APSIM)
Harvest Haulplanning and optimisation
model
Transport Scheduling and
Optimisationmodel
Sugar FactoryMillingModel
Conceptual Modelling FilterConceptual Model(Human activity systemModelling: industry group)
Agent models
Sugar supply chain framework
Unchanged mgt structurescosts
Inputs OutputsProcessing
Unchanged mgt structurescosts
Inputs OutputsProcessing
Unchanged mgt structurescosts
Inputs OutputsProcessing
Unchanged mgt structurescosts
Inputs OutputsProcessing
Unchanged mgt structurescosts
Inputs OutputsProcessing
Unchanged mgt structurescosts
Inputs OutputsProcessing
21

pre- and post-harvest burning. The long-term simulations were undertaken so that the trash management practice had been conducted for long enough that the soil crop system was in equilibrium. The result was simulation of average yield decrease (%) when trash was removed for each of the nine possible soil-irrigation conditions (Figure 5). Each block was classified into one of these nine soil-irrigation conditions by members of the LRG. If the block has a history of trash blanketing, the yield was reduced according to soil-irrigation conditions. Trash blankets also reduce weed controcosts, and the cost of weed control ($/ha) in the absence of trash blankets was estimated by the Land included in the analysis.
l RG
ave r e oils e d
.2.2 Harvest and in-field hauling ates of the scheduling and costs of harvesting and hauling the sugarcane to transportation pads
os were made using an adapted version of Sandell and
d
and block to llocations were obtained from mill productivity records. For the harvesting
and
0 20 40 60 80 10025
15
10
5
0
eld
Figure 5. Simulated (good, average and pooMaryborough.
rage reduction in sugar) and three irrigation r
cane yield due to trash rmite
moval across three s and dry land) at gimes (optimum, li
6Estimor sidings under the different scenariPrestwidge’s (2004) Harvest-Haul model. The model requires inputs for (1) the block being harvested (crop yield, block area, row length, distance to siding, allocation to siding, allocation to harvester group), and (2) the harvesting equipment (capital equipment type, size, specifications and value) in the region. A range of methods were used to gather these data and model parameters, as previously describeby Sandell and Prestwidge (2004) and Prestwidge et al. (2006). GIS techniques were used to estimate block row length (as the longest side of the block) and haul distance (the straight line distance from the block centroid to siding centroid, multiplied by √2 to account for travelling around block boundaries). Block productivity and area data, block to siding allocations
arvester group ahequipment, a survey was conducted in Maryborough to determine capital equipment type, sizespecifications. This information was already available in Pioneer and Invicta regions. The equipment was valued using a capital value schedule developed for the project.
20
Can
e Yi
Red
uctio
n (%
)
Poor / DryPoor / Opt.Poor / Lim.
Good / DrySoil / Irrig.Average / Dry
Good / Opt.Good / Lim.
Average / Opt.Average / Lim.
0 20 40 60 80 100Trash Removed (%)
0 20 40 60 80 100
22

A range of assumptions were made for the harvest haul modelling. Some, such as the time taturn at the end of a row of cane and fuel burn rates, were gathered from previous unpublishedata. Others, s
ken to d trial
uch as region-specific information on wage rates and repair and maintenance costs, upplied the LRG and TWG in each region.
he Harvest Haul model includes a routine to ensure that the optimum number and capacity of haul-uts are used when harvesting each block from the total number available to the harvester. For
whole crop harvesting scenarios in the Invicta Mill region it became apparent that additional haul-ass. For
this purpo
against im
ng only in those areas closer to th linking
6.2.3 Cane ated
infrastruc the modelling fram
with rail transport, s and vehicle
apacities. Another input, harvest group pour rates were averaged over the entire season. The
factory he Mill model, derived from the sugar mill production model (Hobson and Wright 2002),
city end-products from cane supply components (cane
ity
ts and corresponding revenues.
the field ring harvest of the
s The model also used inputs from the modelling framework, including the amount of cane and trash that were in the field prior to harvest, harvest losses, trash and dirt in the mixed cane supply. The model interacted with the Transport model by suppling harvester delivery rates and accepting time harvesters spent waiting for bin deliveries to the pad or siding. To
out capacity would enhance the efficiency of in-field transportation of the additional biomse this routine was enhanced to calculate the optimum number of haul-outs required for
each group (not constrained by the actual equipment available), balancing additional capital costs proved operational efficiency.
The Burdekin LRG suggested to consider the viability of whole crop harvestie mill were transport costs were lower. The model was adapted to do this by
blocks to branch lines so that different areas could be considered separately.
transport The road transport functional model was adapted from Higgins (2006). The model estim
ture requirements and transport costs given the input of cane tonnages (fromework). For rail transport, a functional model was developed as a set of linear equations from
the transport scheduling model of Pinkney and Everitt (1997). For the two millsthe LRG supplied data on transport distances to mill from pads, as well as capital costcaverage daily delivery rate to the mill was estimated as the total mixed cane supplied to the mill by the season length in days.
6.2.4 Sugar Testimated raw sugar, molasses and electristalk, t ash and dirt). CCS is predicted to r vary according to the proportions of cane and trash supplied to the factory. The model is configured to include the main infrastructure of the factory, including, where appropriate, trash separation, bagasse storage, bagasse handling and electricgeneration. Trash separation was evaluated assuming separation efficiencies associated with the implementation of factory based separation technology developed by Schembri et al. (2002). The mill component model also calculates sugar production, bagasse handling, bagasse storage and
ower generation cosp
6.3 Application of the value chain modelling framework
6.3.1 Block data All analyses were based on the 2003 crop, harvester groupings, and infrastructure for the three mills. The 2003 block productivity data recorded what was produced by the harvester (the sum of billets, extraneous matter and dirt), not what was presented to the harvester (i.e., standing in the field prior to harvesting). In order to assess the impacts of whole crop harvesting, the amount of cane and trash in the field needed to be predicted. This was done by estimating: (1) cane inprior to harvest, from cane losses and trash amounts that would have occurred du
23

2003 crop; and (2) amounts of trash that would have been present prior to harvest for the given amount of cane. Cane losses and trash amounts were predicted using Sandell and Prestwidge’s (2004) Harvest-Haul model, based on details of the harvesting groups and the specific conditions othe block (i.e. whether it was burnt or green).
f Amounts of trash present prior to harvest for the
iven amount of cane were predicted from relationships between cane yield the mass of trash
sh blanketed blocks were reduced as predicted with the crop modelling,
d with
of
uation methodology (Gittinger 1982). ental values of the assessed technology options
status-quo value gical and institutional structure of the base case, while medium-term
ut/output prices were used to generate the corresponding expected steady-
ss
g(Figure 6) developed from results of detailed physiological experiments stored in the SUGARBAG data base (Laredo and Prestwidge 2003).
0
10
30
mpo
n
Figure 6. The weight of tops (non-millable stalk and green leaf sheaths) and leaves (both live and dead) as a function of sugarcane yield from previous physiological experiments.
6.3.2 Scenarios and economic analyses Initially, the situation (i.e. trash management, harvester settings, transport scheduling, etc) that existed in the three regions in 2003 was first modelled to provide a ‘base case’ against which to define the whole crop harvesting impacts. Then whole crop harvesting was modelled, assuming that: • Sugarcane yields in tra• The yield of trash was related to sugarcane yield by the relationships shown in Figure 6,• Harvester settings were optimised to recover the whole crop, • Harvest rosters and transport schedules were optimised to minimise the costs associate
harvesting the whole crop, • Trash was separated at the factory and, where necessary, stored for later use, and • Additional capital costs were minimised where practical by matching the capacity
new/updated plant and equipment to the volume of biomass to be processed. The economic analysis followed standard project-evalIncrem were calculated as the difference between the gross margins of each technology option and the without-project base case. The chain gave the technoloexpectations about inpstate financial performance. Note that gross margins included all variable costs from a decision-making, rather than accounting, point of view, so all operating as well as capital expenses associated with assessed investment options were part of the analysis. Hence, the incremental gromargins shown in the analysis indicate the expected change in pre-tax profit attributable to the options. It was assumed that input and output prices will inflate at the same rate in the future, thus a
20
ent F
Co
W (t
/ha)
0 50 100 150 200 250
TopsLeaves
Cane Fresh Wt (t/ha)
24

formal inclusion of future inflation effects was not necessary in the analysis using 2004 dollar values. Prices for electricity, RECs and sugar constitute three crucial and uncertain parameters in the calculation of expected financial returns. Establishment of the national electricity market has lthe convergence of wholesale electricity prices in the interconnected eastern states of Australia (Table 6).
ed to
able 6. Average annual wholesale electricity price ($/MWh) (Source: NEMMCO undated). Year NSW Qld SA Sno
T
wy Tas Vic 1998-1999 33.13 51.65 156.02 32.34 36.33 1999-2000 28.27 44.11 59.27 2000-2001 37.69 41.33 56.39 2001-2002 34.76 35.34 31.61 31.59
27.96 26.35 37.06 44.57
30.97 2002-2003 32.91 37.79 30.11 29.83 27.56 2003-2004 32.37 28.18 34.86 30.8 25.38 2004-2005 39.33 28.96 36.07 34.05 190.38 27.62 2005-2006 44.03 31.28 39.43 34.21 69.21 31.51
Increasing competition means that the long-term wholesale electricity price is likely to be determined by the cheapest and most abundant source, currently that of coal-fired generation. Coombes and Corderoy (2000) estimate the cost of coal-fired electricity to fall between $24 and $36/MWh. In this study a price of $32/MWh was used for the expected medium-term wholesale lectricity price in Queensland.
ced a measure of long-term certainty about the
ted
liance. As this penalty is not tax deductible, the regulation has effectively put a price ceiling of 57 on RECs (Figure 7).
ed on market expectations in
fina ignificantly different values for all three price parameters.
e
The legislative framework (CoA 2000a, b) introdurenewable energy market in Australia. The legislation prescribed a gradual increase of required renewable electricity production to 2010 and its maintenance to 2020. Tradeable RECs were creaas the administrative vehicle of the policy. A penalty of $40/RECs was mandated for non-comp$ For Maryborough an expected medium-term RECs price of $30 was used, while the Burdekincalculation reflected CSR’s expectation of a $38 RECs price. Bas2004/05, medium-term sugar price was put at $250. Sensitivity analysis tested the robustness of
ncial results in the face of s
25

Figure 7. REC price
predictions (Source: IES 2002).
26

7 Results of value chain analyses 7.1 Maryborough
.1.1 Maximising co-generation For the scenario depicted in Fiproduced was predicted to decrease by 3.7% with wholimpact of removing trash blankets on yield. Howeand trash) produced after harvesting was predicamount of trash. This was due to the lower harvesharvesting compared with how the region was mbeen able to manage this additional mday. The cane transport systemmixed cane supply. The region would have needed up to an additional 15 trucks and 85 trailers, lthough this number would be reduced if an extended time window of harvest was adopted. These dditions could also be reduced by adopting improved transport scheduling. The amounts of sugar nd molasses produced were predicted to have decreased because of the reduction in sugarcane
grown. As expected, electricity production increased dramatically. Table 7. Summary of the predicted products from the different sectors for the base case (as the regions was managed) and for whole crop harvesting for the Maryborough region in 2003.
Sector Product Base case Whole crop harvest
Change from base case
7gure 2b, the total amount of trash free cane stalk (i.e. cane billets)
e crop harvesting (Table 7) because of the ver, the amount of mixed cane (i.e. cane billets
ted to increase by 11.5% because of the greater ter losses that were predicted with whole crop
anaged in 2003. The harvesting fleet would have aterial by harvesting for approximately 2 hours more each
in this region would have also been able to manage the additional
aaa
Farm Cane stalk (t) 786 854 757 913 - 3.7% Harvester Mixed cane (t) 876 230 976 616 11.5% Transport (t/day) 7 225 8 053 11.5% Mill Sugar (t) 122 177 117 768 - 3.6% ‘’ Molasses (t) 28 928 27 204 - 6.0%
‘’ Electricity (MWh) 3 055 151 447 4857%
The additional revenue predicted from electricity was less than the sum of the increased costs incurred with whole crop harvesting and the decrease in revenue from lower sugar and molasses production (Table 8). The largest costs were in the milling sector, and these were a result of (1) the interest on capital that would have been spent building the co-generation plant and trash separator, and upgrading the factory, and (2) the high capital cost and low maintenance season utilisation of the power plant if all trash was burnt in the crush. As outlined above, the alternative of trash storage was dismissed at an early stage for this region because there was no suitable site for bagasse storage close to the mill. In terms of utilisation, any new co-generation capacity added to produce power from trash harvested during the crushing season resulted in additional capacity that could not be utilised in the maintenance season due to constraints on the availability of alternative supplementary fuel (woodchip). The additional costs in the farming sector were associated with the increased cost of weed control in the absence of trash blankets.
27

Table 8. Gross marginal changes predicted for revenues and costs in the Maryborough if whole ation in 2003.
al revenue (M$) Additional cost (M$) Overall change (M$)
crop harvesting was undertaken to maximise revenue from co-gener Product/sector AdditionSugar -1.10 Molasses -0.07 Electricity 9.73 Farm 0.95 Harvester 1.10 Transport 0.76 Mill 11.11 -5.33
7.1.2 Regional value of trash blankets As described when outlining the evolution of the scenarios above, maximising co-generation through whole crop harvesting is only one possible use for trash in Maryborough. Given that trash generally has a positive impact on crop production in the Maryborough area, there might be negative consequences for the sugar value chain if trash blanketing was reduced as a result of upplying trash to alternative markets (such as sale for stockfeed). Ts hus, the project team were
sh cient
ansport and difficult milling associated with green cane
scenarios we at w ess these
sh blank le ugh region (with harvest best practice – HBP). trash bla the whole Maryborough region (with harvest b tice – HBP).
rtial trash bla ppro quivalent al of tops green leaf sheaNo trash blanket in the whole Maryborough region – r to trash rnt or completely rem
fined relative to the situation as it was in aryborough in 2003, and so include effects of both the different trash management practices as ell as the assumption of HBP. The regional net benefits of only changing trash management, from
burning trash on all blocks to full trash blanketing, is given by comparing the full trash blanketing and complete trash removal scenario results in Table 9. The result is a predicted regional net benefit
asked to identify the consequences on the whole sugar value chain of removing trash for other purposes. Also, the Maryborough LRG was interested to find out if the agronomic benefits of tra
lanketing were worth the disbenefits of difficult (and more expensive) harvesting, less effibtr harvesting. Three re identified th ould addr questions: 1. Full tra
artial eting in the who Maryboro
2. PPa
nketing in est pracnketing was a ximately e to remov (non-millable stalk and
ths).
oved. 3. i.e. simila being bu
The second scenario was included as there may be markets for tops, but not leaves. As done in previous analyses, the results were compared with the base case, i.e. the region as is was in 2003, with the trash management and harvesting as practiced in each block for that crop. Full trash blanketing (with HBP) was predicted to result in a net benefit for 2003 of $1.2M compared to the region’s trash and harvesting management used at that time (Table 9). Partial removal of trash resulted in similar net benefits to those in the region in 2003, showing that a ‘thin’ trash blanket across the whole regions gave similar outcomes as a full trash blanket over ~ 60% ofthe region. Complete removal of trash was predicted to result in reduced (-$1.3M) net benefits for 2003. In the previous analyses, net benefits have been deMw
28

of $2.5M from trash blanketing. This is the first time a mechanistic, whole of value chain analysihas been undertaken of the net benefits of green cane harvesting-trash blanketing.
s
ry o s t rough comp on as it was in 2003). The regional net value of
eting, def the difference between the complete trash removal and full trash cenarios own as well.
Additional revenue (M$)
Additional cost (M$)
Net benefit (M$)
Table 9. Summa f changed revenue and cost arising from different degrees of trash removal aMarybo ared to the base case (the regitrash blank ined asblanketing s ) is sh Scenario
Full trash blanketing 0.7 -0.5 1.2 Partial trash remova 0.3 0.0 0.3
omplete trash removal -1.1 0.2 -1.3 Regional net value of trash 1.8 -0.7 2.5
l C
blanketing
7.2 Burdekin Results for scenarios depicted in Figure 3 are given here for both the Invicta and Pioneer mill regions. As well, results of sensitivity analyses and optimisations undertaken to identify ways tominimise additional costs associated with whole crop harvesting are described.
7.2.1 Invicta
.2.1.1 Whole crop harvesting in whole region ower cane losses during
vn,
har
s nc ly would have necessitated some changes to these sectors compared to
rt system. This
e bulk
ng substantial electricity from bagasse in 2003. Mill costs (Table 11) were associated with
small amount (Table 11).
7The amount of cane stalk harvested increased by 1.4% as a result of lhar esting the whole crop (Table 10). This resulted in increased revenues predicted from sugar and molasses due primarily to reduced cane loss even after factory separation (Table 11). In this regiothere was little trash blanketing and full irrigation so the agronomic impact of whole crop
vesting would have been negligible compared with the base case, unlike in the Maryborough region. As expected, harvesting the whole crop increased the predicted amount of material being harvested and transported by 17.0% (Table 10). Efficient infield hauling and transport of thi
reased mixed cane suppitheir operation in 2003. For harvesting, the modelling predicted that there would have been a substantial ‘bottleneck’ in infield haulage, connecting the harvesters with the transpowas overcome in the modelling through optimising the number of haul-outs per harvesting group. Typically, five haul-outs per harvester was an optimal number. To increase the efficiency of the transport sector, the number of bins pulled by each loco was increased in the modelling (as thdensity of the cane decreased at higher proportions of trash) so that the total weight of mixed cane being pulled was equal to the weight pulled in 2003. (NB, a check was made to ensure that thelength of the locos and bins did not block passing loops.) The impact of these scenarios was that additional costs were predicted to be relatively small in the harvesting sector, but still substantial in the transport sector (Table 11). The percentage increase in electricity over base case was smaller (52%, Table 10) relative to that for Maryborough (4857%, Table 7) as the Invicta mill was already producithe interest on capital expenditure for the trash separator and increased operating and maintenance costs resulting from the greater utilisation of the co-generation plant. These costs were lower thanfor the Maryborough region because there was an existing bagasse storage facility and co-generation plant at this mill. The simulations indicated there was sufficient ‘spare’ co-generation capacity in the maintenance season to utilise all available trash produced through whole crop harvesting. The overall financial result was that revenues exceeded costs, but only by a relatively
29

Table 10. Summary of the predicted products from the different sectors for the base case (as the
gions was managed) and for whole crop harvesting for the Invicta region in 2003. re
Sector Product Base case Whole crop harvest
Change from base case (%)
Farm Cane stalk (t) 3 447 605 3 496 108 1.4 Harvester Mixed cane (t) 3 667 665 4 289 820 17.0
(t/day) 2Mill Sugar (t) 566 107 571 84 1.0
lasses (t) 121 078 124 244 2.5 ctricity
) 102 347 214 891 52.4
Transport 24 809 9 018 14.5 3
‘’ Mo
‘’ (MWhEle
Table 11. Gross marginal changes predicted for revenues and costs in the Invicta region if whole crop harvesting was undertaken to maximise revenue from co-generation in 2003.
) Product/sector Additional revenue (M$) Additional cost (M$) Overall change (M$Sugar 1.43 Molasses 0.16 Electricity 8.73 Farm Harvester
0 0.36 3.47 Transport
Mill 5.43 1.06
7.2.1.2 Sensitivity of the outcomes to product prices While the regional net benefit of whole crop harvesting was small under the assumed product (sugand renewable energy) prices, the LGR was interested in how the regional net benefit would increase with increases in product prices. Thus an analysis was undertaken to define the sensitivityof the benefit to product prices, and determine if the were non-linear interactions between the main products. Regional net benefit increased at a rate approximately $0.13M per $1 increase in the value of RE(Figure 8). The sensitivity to sugar price was negligible.
ar
two
Cs
30
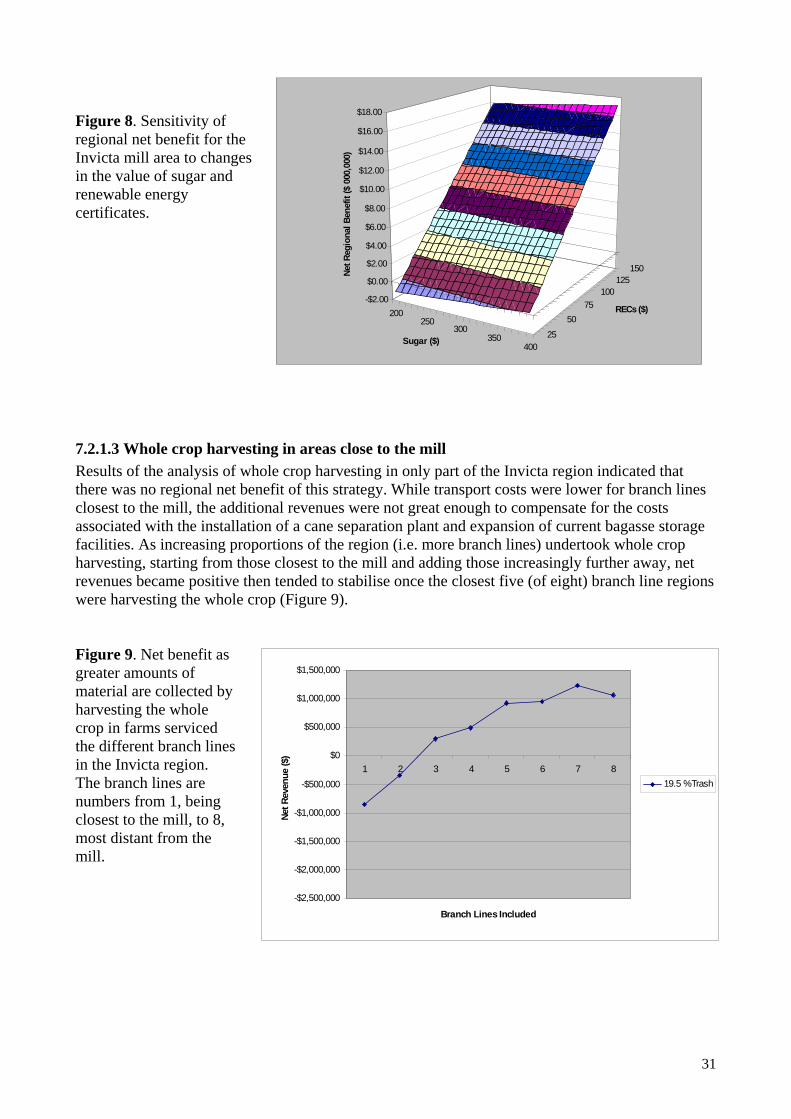
Figure 8. Sensitivity of regional net benefit for the
ill area tolue of suga
able energy .
ole crop areas close to the mill he analys hole crop harvesting in only part of the Invicta region indicated that
as no regiona net benefit of this strategy. While transport costs were lower for branch lines he mill, the additional revenues were not great enough to compensate for the costs with the installation of a cane separation plant and expansion of current bagasse storage
ies. As increas g proportions of the region (i.e. more branch lines) undertook whole crop arvesting, starting from those closest to the mill and adding those increas further away, net venues became positive then tended to stabilise once the closest five (of eight) branch line regions
were harvesting the whole crop (Figure 9).
hole rop in farms serviced
umbers from 1, being closest to the mill, to 8, most distant from the mill.
200250
300350
40025
50
100125
150
75-$2.00
00
0
0
$14.00
$0.
$2.0
Net R
$4.0
egio
$6
nal B .00
$8.00
ene
$10.00
fit ($
$12.00
000
,000
)
$16.00
$18.00
Invicta min the va
changes r and
renewcertificates
7.2.1.3 Wh harvesting in Results of t is of wthere w l closest to tassociated facilit inh ingly
Sugar ($)
RECs ($)
-$2,500,000
-$2,000,000
-$1,500,000
-$1,000,000
-$500,000
$500,000
4 5 6 7 8
Branch Lines Included
Net R
eve
re
Figure 9. Net benefit as greater amounts of material are collected by harvesting the w
$1,000,000
$1,500,000
cthe different branch lines in the Invicta region.
he branch lines are
$01 2 3
nue
($)
19.5 %TrashTn
31

7.2.1.4 Sensitivity to different ams described above, a comprehensive review of the amount of trash found in previous sugarcane
luding experiments undertaken in the Burdekin region) was used to k based on the block’s sugarcane yield. In the modelling undertaken in
rtion of trash across the whole Invicta region was predicted to be ortion in the other regions as well). However, it is quite possible that trash
r factors, varieties, water stress, etc., so there is value in determining the the regional net benefits to different amounts of trash.
Initially analyses were undertaken with increasing amounts of trash, with the harvesting and transport optimised for 19.5% trash. As trash increased from 19.5 to 27.8%, net benefits decreased (Figure 10) because costs increased more than revenues. The increase in costs at higher levels of trash occurred primarily due to inefficiencies in infield haulage in the harvesting sector. This negative overall result was not reversed by confining whole crop harvesting to areas close to the mill.
igure 10. Net benefit as greater amounts of
e lowest trash. (The ranch line numbering is
ly illustrates the inefficiencies that occur when harvesting and transporting ristics to that for which these sectors were optimised. Thus, analyses
the hauling and transport were optimised for each different amount of mill area was harvested, net benefits were similar for each level of trash
y, reducing the proportion of the mill region practicing whole crop reduced net benefits more at higher levels of trash.
ounts of extraneous matter Aphysiological studies (inccalculate trash for each blocthe project, the average propo19.5% (and a similar propwill vary with othesensitivity of
-$2,500,000
-$2,000,000
$1,500,000
Branch Lines Included
F$1,000,000
material are collected by harvesting the whole crop in farms serviced the different branch lines in the Invicta region with three different amounts of extraneous matter, assuming hauling and transport is optimised for
-$1,500,000
-$1,000,000
-$500,000
$0
$500,000
1 2 3 4 5 6 7 8
Net
Rev
enue
($)
19.5 %Trash22.8 %Trash27.8 %Trash
thbdescribed in Figure 9.)
However, the result mainmaterial of different charactewere undertaken assumingtrash. Provided the whole(Figure 11). Interestingl
arvesting
h
32

Figure 11. Net benefit as greater amounts of material are collected by harvesting the whole crop in farms serviced the different branch lines in the Invicta region with
ree different amounts of thextraneous matter, assuming hauling and transport is optimised for each amount of trash. (The branch line numbering is described in
igure 9).
le clt for the Pioneer region (Table 12) was generally similar to that of Pioneer was similar to that for Invicta, with the exception that bagasse was
-alone, high pressure and temperature boiler feeding a condensing steam capacity of this unit had been designed based on the availability of
adjoining mill. In this scenario the amount of trash available from whole inally in excess of the maintenance season fuel requirements of this plant. rvesting and transport sectors were relatively higher (data not shown)
was the costs were predicted to slightly exceed revenues in this region
able 12. Summary of changed revenue and costs arising from maximising co-generation through whole crop harvesting at the Pioneer Mill for utilisation of spare capacity in the 1st co-generation plant. Optimising the number of infield haul outs and increasing the rake size pulled by locomotives
also shown, as are results the scenario as initially defined (a stand-alone 2nd co-generation plant).
F
7.2.2 Pioneer
7.2.2.1 Net benefit of whoThe overall financial resuInvicta. The scenario for supplied to a smaller standturbine unit at Pioneer. Thesurplus bagasse from thecrop harvesting was margIncreases in costs in the hathan in Invicta. The result(Table 12).
rop harvesting
T
is
Scenario Additional revenue (M$)
Additional cost (M$)
Net benefit (M$)
Utilise 1st plant spare capacity 5.8 -6.3 -0.5 1st plant and optimal number of haul outs 5.8 -6.2 -0.4 1st plant and increase rake size 5.8 -6.1 -0.3 Initial scenario – stand-alone 2nd plant 5.9 -11.7 -5.8 As with the Invicta region, analyses were undertaken to reduce predicted bottle necks in in-field haulage and transport of cane to the mill. Enhancing the in-field hauling and transport operations resulted in relatively small increases in net revenue with the net benefits of doing both still being negative (Table 12). The result shows that the ‘bottle necks’ predicted for this region under whole crop harvesting were not as significant as for the Invicta region.
-$3,000,000
Branch Lines included
i
$2,000,000
-$2,500,000
-$2,000,000
-$1,500,000
-$1,000,000
Net
reg
-$500,000
$0
$500,000
$1,000,000
$1,500,000
1 2 3 4 5 6 7 8
onal
ben
efits
($)
19.5%Trash22.8%Trash27.8%Trash
33

It is interesting to comphe LRG; i.e. a separate, stand-alone 2nd plant, fuelled by the trash from
e sugarcane crop. The estimated net benefit of the initial scenario was much than the later scenarios, mainly due to the cost of capital for building the
this mill.
outcomes to product prices ta mill region, the sensitivity of the benefit to product prices was determined
termine at what product prices the net benefit would become positive. t increased at a lower rate, approximately $0.08M per $1 increase in the value of
in the Invicta region. This lower sensitivity to RECs prices in this mill f the small scale of the trash recovery and power generation operation at
cta. For the net benefit of whole crop harvesting to be positive, RECs prices $45 (i.e. $7 higher than the prices used in these analyses). As with Invicta, the
as negligible.
ity of for the
.2.3 Cost of trash as a fuel for co-generation t the only fuel that can be used fo o ry
sting is not the only of transportin to a co-ge n whether the cost of supplying for co-gene sting, the t-harvest raking ng and trans g
nswering this question first required the determination of the cost of trash supplied through whole
l equipment.
are the results of these scenarios with those for the scenario initially suggested for this mill by tharvesting the wholworse (-$5.8M, Table 12)2nd co-generation facility at
7.2.2.2 Sensitivity of theAs done in for the Invicfor the Pioneer region to deRegional net benefiRECs (Figure 12), thanregion occurred because oPioneer relative to Inviwould have to be sensitivity to sugar price w
Figure 12. Sensitivregional net benefitPioneer mill area to changes in the value of sugar and renewable energy certificates.
7Trash is no r co-ge n, as shneratio
m dwn in al Ma the fin
g hborough
n oscenario, and whole crop harve etho tras eratiplant. The Burdekin LRG was interested in
cane harvetrash ration
could be reduced through green n pos , baili portintrash to the co-generation plant. Acost harvesting for the Invicta and Pioneer mill regions. Marginal cost data for each sector were determined, and expressed per tonne of trash calculated in the scenario at a constant moisture content (50 %). The costs were higher for the Pioneer region (Table 13) because of a greater marginal cost in the harvesting sector. That is, the harvesting sector in this mill region was operating more efficiently in the base case, and so had little capacity to transport the additional
aterial from whole crop harvesting with the existing harvest-haum
200250
300350
40025
5075
100125
150
-$2.00
$0.00
$2.00
$4.00
$6.00
Net R
egio
nal B
enef
it ($
00
$8.00
$10.00
0,00
0)
Sugar ($)
RECs ($)
34

Table 13. Predicted costs (expressed in $/tonne of 50% moisture trash) associated with trashrecovery via whole of cane harvesting in the Burdekin region. Total cost expressed per tonne of dryfibre is also shown.
Item Operation Regional costs
($/tonne) Invicta Pioneer Additional costs Farming 0.00 0.00 Harvesting 0.83 6.08 Transport 6.66 5.49 Separation and conveying to stockpile 5.86 6.60 Total cost 13.35 18.17 Total cost (dry fibre) 27 36 Data for the cost of baling and transporting trash from the field came from a study by Ridge and
obson (2000) of a ‘large scale’ (10,000 bales/year, 700 kg/bale) raking, baling and transport peration at Rocky Point (Table 14). Ridge and Hobson (2000) assumed a ground trash density of 2.5 tonnes/ha, an initial post-harior to baling of 10%, and used 1998 cost data. Costs were inflated to 2004 dollars by the
ce Index. The cost of transporting to a co-generation plant (Table 13) are se for post-harvest raking and bailing, which essentially requires double
tonne of 10% moisture trash, of post harvest trash operation (Ridge and Hobson 2000). Total cost expressed per tonne of dry fibre is also shown. Operation Cost component Cost ($/tonne)
Ho2 rvest trash moisture content of 60% and a subsequent moisture pappropriate Consumer Prisubstantially lower than thohandling of the material. Table 14. Cost, expressed in $/
Baling Maintenance 7.94 Wages 1.73 Fuel 0.86 Twine 3.46 Capital 9.31 Raking and loading Maintenance 0.52 Wages 4.06 Fuel 0.98
Capital 5.27 artage 6.90
Total cost 41.03 46
C
Total cost (dry fibre) However, given that bailed trash has a lower moisture content than trash from whole crop harvesting, a more meaningful comparison would be achieved if total costs were expressed in termsof dry fibre. Even with this adjus
tment, the total cost of trash recovery by whole of cane harvesting
nd factory separation (Table 13) is still considerably higher than the costs for post-harvest raking
p ith crop
o-from drier fuel.
aand baling as analysed for Rocky Point (Table 14). The above analysis does not include the impacts of (1) the lower cane with between whole croharvesting than green cane harvesting, or (2) the increased boiler efficiency using drier fuel wbailed trash. The additional revenues from additional sugar and molasses revenue with wholeharvesting are estimated to be $7 per tonne of dry. However, these are similar to the additional cgeneration revenue of $8 per tonne of dry fibre from increased boiler efficiency
35
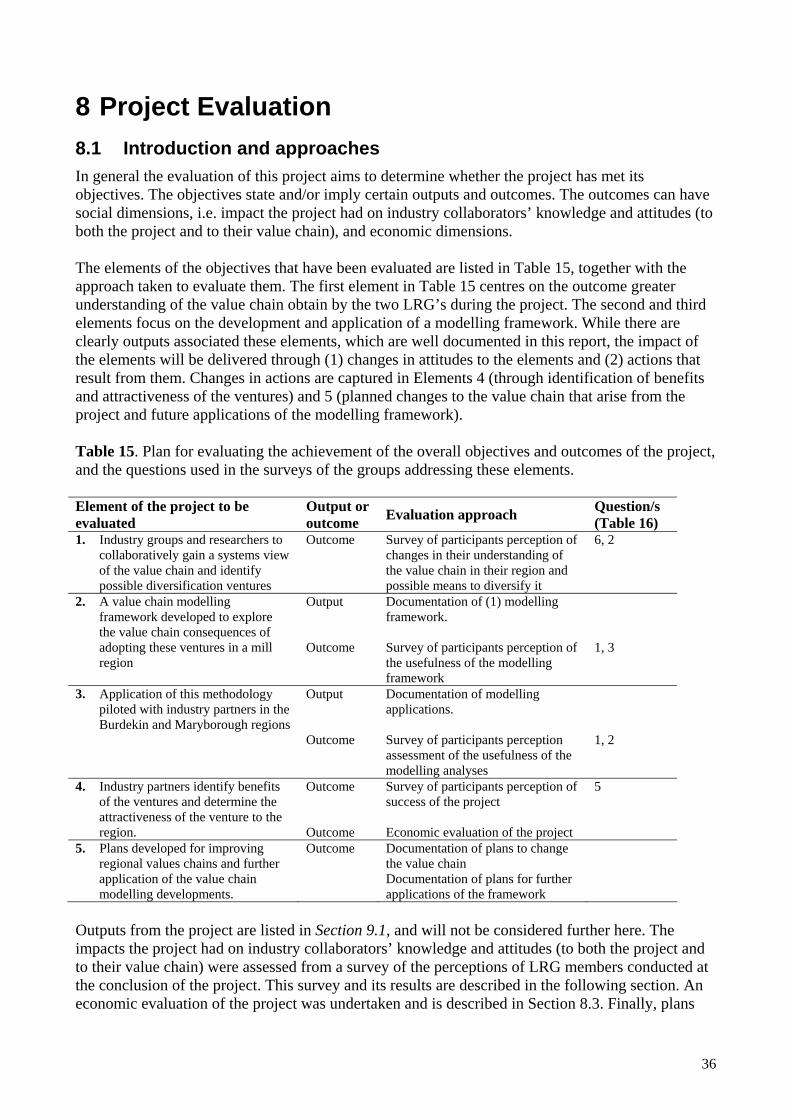
8 Project Evaluation 8.1 Introduction and approa
general the evaluation o this project aims to determine whether the project has met ijectives /or imply certain outputs and outcomes. The outcomes can have
ocial dimensions, i.e. impact the project had on industry collaborators’ ledge and a s (to oth the project and to the ain), and economic dimensions.
ts of the objec ves that have been evaluated are listed in Ta together w at them. The first element in Table 15 centres on the outcome greater
nderstanding of the value chain obtain by the two LRG’s during the project. The second and third lements focus on the development and application of a modelling framework. While there are
hat
ddressing these elements.
ches In f ts objectives. The ob state ands know ttitudeb ir value ch The elemen ti ble 15, ith theapproach taken to evalu e ueclearly outputs associated these elements, which are well documented in this report, the impact ofthe elements will be delivered through (1) changes in attitudes to the elements and (2) actions tresult from them. Changes in actions are captured in Elements 4 (through identification of benefits and attractiveness of the ventures) and 5 (planned changes to the value chain that arise from the project and future applications of the modelling framework). Table 15. Plan for evaluating the achievement of the overall objectives and outcomes of the project, and the questions used in the surveys of the groups a Element of the project to be evaluated
Output or outcome Evaluation approach Question/s
(Table 16) 1. Industry g
boratroups and researchers to Out articipants perc
collaof th
ively gain a systems view e value chain and identify
possible diversification ventures
heir understandue chain in their region an
possible means to diversify it
come Survey of pes in t
eption of ing of
6, 2 changthe val
d
2. A value chain modelling framework developed to explore the value chain consequences of
res in a mill
Out Outc
Documentation of (1) modelling framework.
of participants perceptionfulness of the modelling
framework
, 3 adopting these venturegion
put
ome Surveythe use
of 1
3. Application of this methodology piloted with industry partners in the
kin and Maryborough regions
Out Outc me
Documentation of modelling applications. Survey of participants perceptioassessment of the usefulness of tmodelling analyses
2 Burde
put
o n he
1,
4. Industry partners identify benefits of the ventures and determine the
Outcome
Survey of participants perception of success of the project
5
attractiveness of the venture to the region.
Outcome
Economic evaluation of the project
5. Plans developed for improving regional values chains and further application of the value chain modelling developments.
Outcome Documentation of plans to change the value chain Documentation of plans for further appli
cations of the framework Outputs from the project are listed in Section 9.1, and will not be considered further here. The impacts the project had on industry collaborators’ knowledge and attitudes (to both the project andto their value chain) were assessed from a survey of the perceptions of LRG members conducted at the conclusion of the project. This survey and its results are described in the following section. An economic evaluation of the project was undertaken and is described in Section 8.3. Finally, plans
36

for improving the value chain in the region or post-project application of the value chain framework
he surveys consisted of six uestions (Table 16) that were linked to the elements identified in the evaluation framework (Table
G
s thought important to obtain this formation because of the changes in membership of the Burdekin LRG in response to regional
urvey scores were collated and expressed as a percentage of responses within the five possible ommen r estion we d from
forms and analysed.
8.2s survey we rally oug more so in
Ma . Al LRG members surveyed in Maryborough thought the out ere , as e ber of the Burdekin L ively r ofranged from 3.3 to 4.5, with the average score fo stion again being generally lower for the
r G. The nal one (36% of respondents) to all seven (9 e w ati etween the number of workshops attended and responses to ul; P = 0.09) and,
ch s; i t be caused by peo of ack of inter survey results are biased by the sco llowed the process to com
ipati er w later in the project’s e icipation because of waning intere
sug n of the project’s a he industry participant was hindered by the inconsistent representation in the Burdekin region.
res
are considered in Section 9.2.
8.2 Survey of perceptions
8.2.1 Details As part of the project’s evaluation, members of the two LRG’s were surveyed at the conclusion of the final workshop (Table 3) in the project to determine the impact the project had on their knowledge and attitudes to both the project and to their value chain. Tq15). Participants were asked to respond to the question on a scale of 1 (not at all) to 5 (completely/very), and encouraged write comments to each question. There were 10 and 11 LRmembers present at the final workshop (Table 3) in the Maryborough and Burdekin regions, respectively, and all completed in the survey. The surveys were completed anonymously. The Maryborough LRG was surveyed first and, based on their feedback (discussed below), Question 4 (Table 16) was not included in the Burdekin survey. In the Burdekin this question was replaced with one on how many (of the seven) project workshops had been attended by the workshop participant, i.e. the final members of the LRG. It wainissues (described above). Sanswer categories (1 to 5). Cthe survey
ts made by espondents on each qu re transcribe
.2 Survey scores Re ults of the evaluation
ryborough than the Burdekincomes/results of the project w
RG responded negat
re gene very positive (Table 17), alth hl positive to eithe
was their participation. Only on these issues. Average scores (on a scale of 1 to 5) r each que
mem
Bu dekin than Maryborough LR
number of workshops attended
by the fi%). Ther
members of the Burdekin LRG ranged fromas a significant positive correl Question 2 (participation usef
on b
particularly, Question 3 (project aple leaving the group becauseres of keen participant who fo
ieved aim P = 0.04). Often such a result mest, etc., and so the
gh l
pletion. That is unlikely to be the case in this study, because those partic
lif , and so did not have low partgest that a true appreciatio
ng in few orkshops had joined the LRGst. Thus the results more likely
chievements and the value to t
To further explore the impact of workshop attendance on attitude to the project, the average scoto the survey questions were partitioned into those who attended majority of the seven workshops and those who attended fewer. Those who attended the majority of workshops scored markedly higher in five of the six questions (Table 17): Their scores were much closer to those of the Maryborough LRG, and even higher for Question 3 (project achieved aims).
37
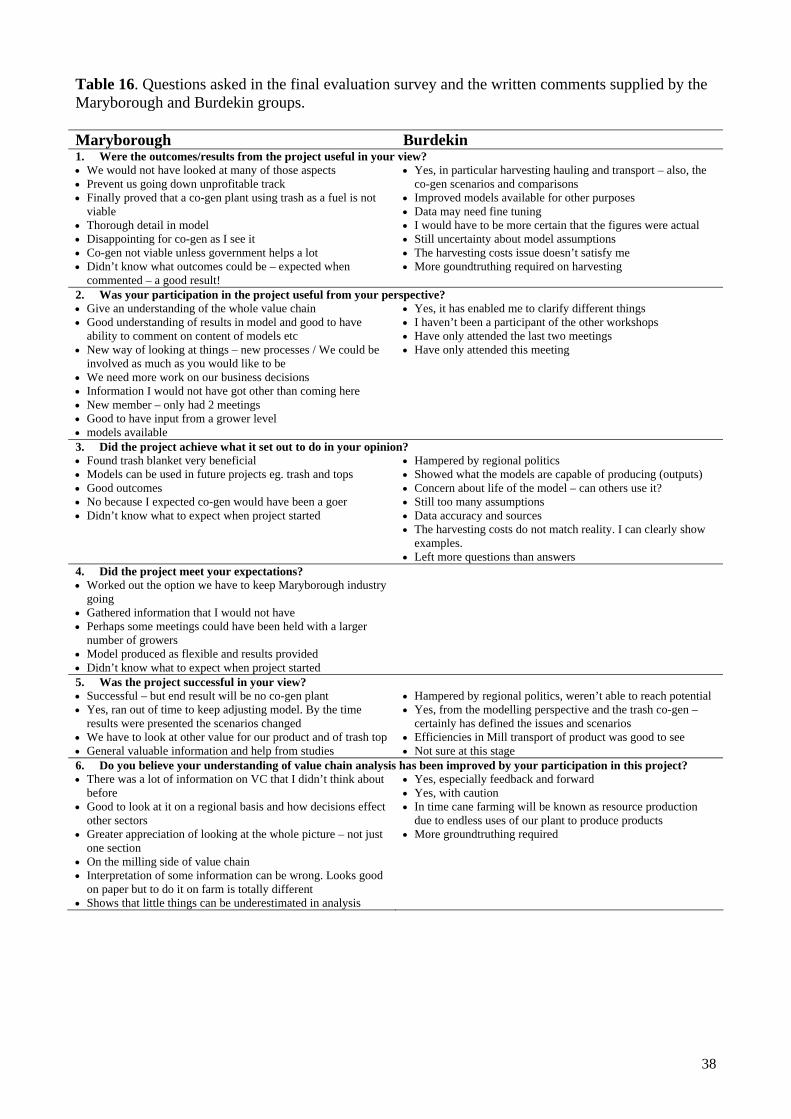
Table 16. Questions asked in the final evaluation survey and the written comments supplied by the Maryborough and Burdekin groups.
Burdekin Maryborough 1. Were the outcomes/results from the project useful in your view? • We would not have loo• Prevent us going down
ked at many of those aspects • Yes, in particular harvesting hauling and transport – also, the unprofitable track
• Finally proved that a co-gen plant using trash as a fuel is not viable
• Thorough detail in model • Disappointing for co-gen as I see it • Co-gen not viable unless government helps a lot • Didn’t know what outcomes could be – expected when
commented – a good result!
co-gen scenarios and comparisons • Improved models available for other purposes • Data may need fine tuning • I would have to be more certain that the figures were actual • Still uncertainty about model assumptions • The harvesting costs issue doesn’t satisfy me • More goundtruthing required on harvesting
2. Was your participation in the project useful from your perspective? • Give an understanding of the whole value chain • Good understanding of results in model and good to have
ability to comment on content of models etc
• Yes, it has enabled me to clarify different things • I haven’t been a participant of the other workshops • Have only attended the last two meetings
• New way of looking at things – new processes / We could be involved as much as you would like to be
• We need more work on our business decisions • Information I would not have got other than coming here • New member – only had 2 meetings • Good to have input from a grower level • models available
• Have only attended this meeting
3. Did the project achieve what it set out to do in your opinion? • Found trash blanket very beneficial
Models can be used in future projects eg. trash and tops • Hampered by regional politics • Showed what the models are capable of producing (outputs)
• The harvesting costs do not match reality. I can clearly show examples.
• Left more questions than answers tations?
• • Good outcomes • No because I expected co-gen would have been a goer • Didn’t know what to expect when project started
• Concern about life of the model – can others use it? • Still too many assumptions • Data accuracy and sources
4. Did the project meet your expec• Worked out the option we have to keep Maryborough industry
going • Gathered information that I would not have • Perhaps some meetings could have been held with a larger
number of growers • Model produced as flexible and results provided • Didn’t know what to expect when project started 5. Was the project successful in your view? • Successful – but end result will be no co-gen plant
Yes, ran out of time to keep adjusting model. By the time • Hampered by regional politics, weren’t able to reach potential • Yes, from the modelling perspective and the trash co-gen – •
results were presented the scenarios changed • We have to look at other value for our product and of trash top • General valuable information and help from studies
certainly has defined the issues and scenarios • Efficiencies in Mill transport of product was good to see • Not sure at this stage
6. Do you believe your understanding of value chain analysis has been improved by your participation in this project? • There was a lot of information on VC that I didn’t think about
before • Good to look at it on a regional basis and how decisions effect
other sectors • Greater appreciation of looking at the whole picture – not just
one section • On the milling side of value chain • Interpretation of some information can be wrong. Looks good
on paper but to do it on farm is totally different Shows that little things can be underestimated in analysis
• Yes, especially feedback and forward • Yes, with caution • In time cane farming will be known as resource production
due to endless uses of our plant to produce products • More groundtruthing required
•
38

Table 17. Results of the project evaluation survey for each of the two regions. (Questions are given in Table 16). Question Q1 Q2 Q3 Q4 Q5 Q6
Percentage of positive (score 4 or 5) responses
Maryborough 100 100 5 90 100
60 6 75
nses
0 80
Burdekin 70 0 na 60
Percentage of negative (score 1 or 2) respo
Maryborough 0 0 15 0 0 0
10 1 0
A
Burdekin 0 5 15
verage score
M 4.2 aryborough 4.2 3.3 4.0 4.0 4.5
3.5 3.3 na 3.3 3.9
function of number
Burdekin 3.7
Burdekin average score as a of workshops attended
Attended 4+ 4.0 4.2 4 4.0
3
.0 na 3.8
Attended <4 3.6 3.1 .0 na 3.1 3.9
n (Table 16) centre on various themes. As onclusions reached from the analysis of the survey
scores. For example there were comments that participants developed a greater understanding of esting and co-generation, consistent with the positive mments were also made by the Burdekin LRG (Table 16)
l politics ption
t the Question 3 eH was
projects objectives – som nts clearly roject was a concrete one, to make the scenario work, rather than to
in it. Thus, the results that maximising any of the mills studied were interpreted as a lack of
roject achievement. Clearly, the acceptance by the LRG’s that maximising co-generation was not an attractive venture in any of the mill regions reflected in the comments indicates that the project achieved the objective of defining the attractiveness of this venture for the LRG’s. Other comments were positive (Table 16), identifying that through the project members of the LRG’s:
8.2.3 Survey comments ommC ents made by respondents on each questio
expected, some of these themes supported the c
the issues surrounding whole crop harvoresponses to Question 6 (Table 17). C
that the project was hampered by regiona and not able to reach its potential. These comments supported the conclusion that disru of the Burdekin LRG membership affected theproject’s impact. From the comments it was apparent that some respondents had the view that the project did not achieve its objectives (Table 16). This is consisten with the relatively low score to(Table 17). As described above, in the Burdekin th scores to this question were affected by the
wever, from the comments (Table 16) itrespondents’ previous involvement in the project. evident that there were mixed impressions of the
oe participa
thought the objective of the panalyse the likely outcomes of the venture before investing co-generation was unlikely to be profitable inp
39

• Were exposed to information, concepts and ideas that they would not have otherwise been, and • Thought the modelling framework developed had wider applicability.
omments m centred epticism e modell esults in th sence of xperience. Comments on this issue, which were more prevalent in t urdekin L
did not understand the abstract process of modelling – that the analyses were not definitive answers, but indicators of the possible outcomes
scena of practical experience. Greater exposure to the modelling s outlook.
mic e aluation the pro t resulted in its the LRGs c nducive to f al cost-benefit
analysis. While in the Burdekin the project has mainly confirmed existing plans and contributed to the best option, the survey of perceptions (described above) suggest its impact in
portant part in the decision of gar F ry and the Maryborough to abandon plans to maxim o-generat
of the proj howed that this decision is expected to avoid an annual loss of to regional stakeholders, com ed to a projection of the technological status
the thus uncommitted able, ways. However, the latter benefits are not included in the
alysis, re such in ible bene s increased knowledge about the value chain ents by eholders e two reg .
he economic benefits of the project can be evaluated under an assumption of the amount of the Maryborough industry to abandon plans to
the annual total project costs as stipulated in the contracted budget t in a
the project was partially responsible for the decision to abandon plans for maximising co-
Negative cpractical e
ainly on sc of th ing r e abhe B RG,
possibly indicate that some members of the LRG
for the assumed rio, in the absence process may overcom
e thi
8.3 Econo v of jecThe project measurable future benef for o orm
the selection of Maryborough was dramMaryborough Su
atic. The project results playacto
ed an imise c ion.
The results approximately $5.3m
ect spar
quo (Table 8). A further, indirect, benefit of the project is the option to use biomass byproduct in other, profitcost-benefit an nor a tang fits aand its compon
stak in th ions
Tinfluence the project had on the decision of maximise co-generation. Taking(Table 18) and a discount rate of 8%, an expected annual benefit of $5.3 over 20 years resulflow of costs and benefits (Figure 13). Under the extreme assumption is that the project was whollyresponsible for this decision, the measures of project returns are: • Internal Rate of return (IRR), 97 % • Net Present Value (NPV), $50.7M • Benefit/Cost Ratio (B/C ratio), 34:1 Ifgeneration, the measures of project returns would obviously be proportionately decreased. For example, even if annual project benefits attributable to the project were one-tenth of those calculated in Figure 13, the project would still have an IRR of 26%, a NPV of $3.7m and a B/C ratio of 3:1. These returns are very high and comparable to those of the most successful cases of agricultural research worldwide (Echeverría 1990) and in Australia (Mullen and Cox 1995). Table 18. Annual total project costs as documented in the project contract. Year 2,003 2,004 2,005 2,006 Cost 327,164 596,572 269,407 134,703
40

Figure 13. Flows of project costs and quantified benefits
These results of the analyses are obviously affected by changes in the price of inputs and products. It is beyond the scope of this section to undertake a full analysis of the sensitivity of estimated project benefits to all these possible changes. However, it is worth considering what the impact of changes in the prices of the major products produced in the scenarios (i.e., sugar and electricity)
ight be. The price of sugar used in the project ($250) wm as towards the lower range of historical uction oject
prices. Given the negative impact whole-crop-harvesting was predicted to have on sugar prodin Maryborough higher prices would increase the predicted annual loss, and so increase the prbenefits. As pointed out before, REC price is effectively capped at $57 under the current regulatory regime (Figure 7). The Maryborough whole crop harvesting-co-generation scenario has negative returns at that RECs price, with a RECs price over $60 needed for breaking even financially. Thus itis likely that the project benefits would still be substantial under quite a range of prices for these
ajor products. m
-10,000,000-3 -2 -1 0 1 2 3 4 5 6 7 8 9 10 11 12 13 14 15 16 17 18 19 20
Year
0
10,000,000
00020,000,
30,000,000
40,000,000
50,000,000
$
60,000,000Annual nominal costs/benefitsCumulative discounted costs/benefits
41
9 Discussion hts oethods developed for whole-of-value chain analysis in this project has
roduced new insights on the consequences of whole crop harvesting for maximising co-generation. The predicted impacts of harvesting the whole crop to maximise co-generation differed considerably across the mill regions examined in this project. These differences highlight the complexity of interaction and site-specific nature of factors influencing the costs and revenues associated with power generation from trash in the sugar industry. Obvious differences between the regions included the presence or absence of an existing co-generation plant with spare capacity and the cost effectiveness of bagasse storage. A simpler analysis might have identified these limitations, which were significant for the Maryborough region. As described above however, prior to this study the prime concern of the LRG in each region was the challenge of harvesting and transporting the increased volume of material produced when harvesting the whole crop, suggesting these ‘obvious’ issues were not so obvious prior to this study.
any factors contributed to the depth of understanding of whole crop harvesting impacts, and the larification of the factors determining these impacts. Accessing data from previous detailed
n, d
istical problems of harvesting and transporting the additional volumes of material ssociated with the trash were not as great as previously imagined by the two LRG’s. This was ainly due to two factors: an ‘optimistic’ assessment of these volumes that existed prior to the
roject (which also resulted in ‘optimistic’ assessments of potential revenue from electricity sales) and the identification in the study of possible improvements in the logistical efficiency in harvesting and/or transport. In the Maryborough region, the estimates of trash volumes derived from previous physiological studies have subsequently been verified by mill staff (P. Downs and J. Power, pers comm.). These data have contributed to more accurate assessments of the value of these resources for uses other than electricity co-generation. As well as providing these insights into whole crop harvesting, this project has clarified the circumstances when whole crop harvesting for maximising fuel for co-generation is most likely to be feasible. These are when: • There already exists a relatively efficient power generation plant in the region, • The mill already has efficient (i.e. > 65%) boilers and high pressure and temperature steam
supply ( i.e. > 40 bar abs, 360oC), and • Trash has little or no opportunity cost in the region.
9.1 New insigThe piloting of the m
n whole crop harvesting
p
Mcsugarcane physiological experiments provided good estimates of the amount of trash associated with a given sugarcane yield. Also, consideration of the changes in total regional cane productiodue to (1) agronomic consequences of trash removal from trash blanketed blocks and/or (2) changecane losses during harvesting the whole crop, further refined estimates of the volume of material produced. These estimates not only underpinned the analysis of the logistics of harvesting and transporting the increased volume of material, they were crucial for determining the size of the co-generation plant (or utilisation of spare capacity in existing plants), which in turn determined bagasse storage needs, capital costs and additional revenues. Information of this detail has not been used in previous assessments of sugar value chain diversification options (e.g., Sutherland 2002; Keating et al. 2002), but are crucial for a proper examination of this issue. In general, the logamp
42

The first two points relate to minimising the capital costs associated with such a venture, while the l agronomic impacts of trash removal, that have not been quantified s for using/selling trash.
t, the f
usiness cases for alternative use of trash, such as for
n xamine whether the
at harvest indicates that, generally, trash is on the
on regional costs of green cane harvesting-trash blanketing are vital r burning in the c
com ine the regional triple bottom line impacts
t ber 2005)
Thus, apart from the obvious benefit of allowing the LRG’s to more accurately determine the viability of maximising co-generation, other benefits flowed to the region from this work. The
last relates to either potentiabefore, or other opportunitie
9.2 Regional response to results In both regions, the LRG’s decided to not proceed with whole crop harvesting for maximising go-generation based on the results of the value chain modelling (Table 8, 11 and 12). In Maryborough, assuming the region would have moved forward with this venture in the absence of the projecfinancial impact of this decision is significant, as indicated by the project’s Net Present Value oover $50M (Figure 13). Clearly the project has enhanced mill region profitability in this instance. Apart from the decision against proceeding with whole crop harvesting, there were other impacts and benefits of the project in Maryborough. Possible improvements in transport efficiency were identified within the region. Plans are in place to further develop and implement these improvements within the region (e.g., through the new SRDC project FPP111 aimed at implementing the transport model), leading to ongoing improvements in regional profitability. The definition of the regional value of trash in Maryborough (Table 9) also provides the region with a
enchmark for assessing the attractiveness of bbfeedstock or producing more valuable end-products (like liquid biofuels). Clearly, any new vulturethat removed trash from the region would need to produce a net benefit of $2.5M just to ‘break even’ at a regional scale. The situation is somewhat different in the Burdekin. While the Burdekin LRG did not feel that maximising co-generation was an attractive diversification option during the final workshop, that judgement might change if the value of RECs were to increase substantially in the future, e.g. under different Government Policies on renewable energy or a more active global carbon trading market. Also, there would need to be further analysis and testing of the ways to overcome some of the ‘bottle necks’ identified in the harvesting and transport sectors before whole crop harvesting could be efficiently implemented in the region. The Burdekin LRG is well informed of that issue now and can pursue feasibility studies if the value of REC start to increase or some form of carbomission trading is implemented. It may also be valuable for the region to ee
efficiency of the current ‘coupling’ of harvesting and transport systems could be improved. Apart from whole crop harvesting, should the Burdekin region choose to examine business cases for alternative use of trash (as described above), the results from this study will form the definitive source of data for the costs associated with trash recovery. Equally relevant to the alternative uses of trash is the result that collection of trash in the region (for some other use) would be significantly cheaper in done via whole crop harvesting and factory separation compared with post-harvest raking (Table 14). The possible agronomic benefits of trash were not considered in the Burdekin because widespread
urning of trash at harvest by Burdekin farmers bconsidered to have no agronomic value in the region. However, there is community pressureBurdekin sugar industry to cease burning trash because of the impacts of the process on the urban community within the region (Small and Windle 2001), a trend that happening across many of the
orld’s sugar industries. Datawfo the industry to be able to assess and communicate its position on the practice of fa e of community concerns. This project has provided, for the first time, a methodology for assessing the regional benefits (e.g. Table 9). This advance has been recognised by the Burdekin
munity, and is the basis for a funding proposal to deff rash blanketing (SRDC Proposal PRPEA012, Novemo
43

project has clearly played a part in these regions “getting better” and exploring how to “become different” (Hamel and Prahad 1994).
9.3 Impact the previous section of the project, it is valuable to
ct (as
et arch techniques are common in agricultural research (Jakku and
horburn 2006), they are less widely applied in value chain research. Thus the project’s design and .
7),
in
tract
the een enhanced by a fuller discussion of the ‘philosophical’ approach being
mployed in the project; its strengths and weaknesses. This may have avoided the situation where
While the impact of the project was evaluated in consider how the impact might have been increased. Interactions with regional groups provided a mechanism for obtaining locally relevant information to inform the value chain modelling process and for continually ‘ground-truthing’ the modelling results and outputs. It also gave the LRG members an opportunity to gain a more detailed understanding of all sectors of their value chain through assessing results on all sectors of the value chain in their region, and participating in the scrutiny of results of the analyses by members of the different sectors of the chain. The result was an action learning process, by which: 1. The details of the scenarios being represented by the model evolved during the proje
described in Section 5), and 2. The understanding of the regions’ value chains increased amongst the industry collaborators
(Q6, Table 17) as well as the research team. These are the outcomes expected from participative action research (PAR) approaches (Gaucheral. 1998). While PAR reseTconduct aimed to maximise impact, but were somewhat novel for whole-of-value chain research While industry participants generally thought that the project’s results were useful (Q1, Table 1the project’s impact in the Burdekin was likely to have been affected by the disruption to the LRG membership during the project. For example newer members of the Burdekin LRG who attended fewer regional workshops scored lower on the project evaluation survey than those who had beenthe LRG since the beginning of the project. Thus, impact of the project would have been increasedwith more consistent regional representation. This regional stability should be considered before undertaking similar projects in the future. Another factor that evolved during the project was the ability of participants to separate the absaspects of the project’s aims and methods, from the concrete reality of getting actual results frominvestments in new value chain ventures. Models are by definition an abstraction of reality, and so the modelling process necessarily involves simplifications and assumptions. It can be quite difficult for people who have not been involved in modelling to appreciate these issues. Thus, impact ofproject might have bethe project’s objectives were perceived ‘to make whole-crop-harvesting work’, rather than to provide detailed and relatively sophisticated insights into how likely it was ‘to work’.
44

10 Outputs and outcomes ject include modelling frameworks, results and information, and publications.
ogy and framework capable of being configured to a wide range of value chain issues.
stem im ting for maximising co-generation, trash blanketing, or related
• A road transport capacity planning model to assess the vehicle and trailer requirements (and costs) of the different scenarios explored.
,
ly applicable to the Australian industry.
d
l
e Maryborough region. Specific advice to the Maryborough and Burdekin LRGs about the expected profitability of a
5). Towards farming-systems change from value-chain optimization in the Australian sugar industry. Australian Farm Business Management Journal, 2: 1-9.
Higgins, A.J, 2006. Scheduling of road vehicles in sugarcane transport: A case study at an
Australian sugar mill. European Journal of Operations Research, 170: 987-1000. Thorburn, P.J., Archer, A.A., Hobson, P.A., Higgins, A.J., Sandel, G.R., Prestwidge, D.B., Andrew,
B, Antony, G., McDonald, L.J., Downs, P. and Juffs, R. (2006). Value chain analyses of whole crop harvesting to maximize co-generation. Proceedings Australian Society Sugar Cane Technologists, 28: 37-48.
Outputs from the proThe modelling frameworks, results and information developed in the project are comprehensively described in the various sections of the report, above. However, it is valuable to summarise the outputs here. Publications arising from the project are also listed.
10.1 Outputs Outputs from the project include the following: • A value chain modelling methodol
• A value chain modelling framework (in spreadsheet form) for analysing the whole-of-sypacts of whole crop harves
issues. This spreadsheet has been supplied to members of the LRG’s.
• Simplified, functional models of sugarcane growth (as a function of trash retention) harvestingtransport (road and rail) and milling.
• Definition of the impact of trash blanketing on sugarcane yield in the Maryborough region. • An empirical model of the amount of trash associated with a sugarcane crop that is wide
• Identification of improved efficiency in the transport sector of the Maryborough mill. • Identification of improved efficiency in the harvesting and haulage sector of the Invicta mill. • Definition of the cost of trash as a fuel for co-generation, supplied through the harvesting an
transport system. • A new knowledge base of the value chain in each of the two case study regions, which the loca
industries can build upon when exploring future value chain opportunities. • A current harvester capital schedule for th•
range of investment and technology options.
10.2 Publications arising from the project Archer A. A., Higgins A. J., Thorburn P. J., Hobson P.A., Antony G. and Andrew W. (2004).
Employing participatory methods and agent-based systems modelling to implement agricultural supply chains systems. In proceedings of the 2nd Annual Supply Chain Management Symposium. Toronto, Canada (on CD).
Antony, A., Prestwidge, D., Sandell, G., Archer, A., Thorburn, P. and Higgins, A. (200
45

Thorburn, P.J., Archer, A.A., Hobson, P.A., Higgins, A.J., Sandel, G.R., Prestwidge, D.B., Antony, sugar supply chains: whole crop harvesting
o al Conference on Management in AgriFood
and others expected in the future. te (Table 19) include the regional economic outcomes of preventing fitable ventures and moves to adopt more efficient transport schedules in the
rofitability within the region in the future, ompared with the situation if this project had not been conducted.
T come arising from this project and evidence supporting the outcome.
O
G. (2006). Evaluating diversification options for t maximize co-generation. Proc. 7th InternationChains and Networks, Ede, The Netherlands (in press).
10.3 Outcomes achieved and expected There have been several outcomes achieved by the project to date,Those achieved to dainvestments in unproMaryborough region. These will lead to greater pc
able 19. Summary of the out
utcome Evidence P on survey and economic revention of the Maryborough sugar • Results of the evaluati
industry investing in a potentially unprofitable venture
evaluation, detailed above.
• Results of the evaluation survey, detailed above. Maryborough LRG recognise opportunities • Moves to adopt improved transport schedules by
project proposal (FPP111) to extend
ve.
SRDC EOI on whole of value chain benefits of
5) e-of-value chain analysis
type of analysis can be done. New researchers (Archer, Thorburn) involved in
in R&D.
fee
n for e
gan to a
ios
ill.
for increased efficiencies in the road MSF. transport sector • Development and submission of a SRDC full
implementation of this work. • Results of the evaluation survey, detailed abo
• Inclusion of the approach (and project team) in an
trash blanketing in the Burdekin (SRDC Proposal PRPEA012, November 200
Increased capacity for undertaking • First detailed wholquantitative value chain analyses within the sugar industry.
undertaken – providing an example of how this
•
value chaMaryborough sugar industry exploring
additional scenarios for producing animal d from sugarcane tops.
• After the analysis showed losses to the regiothe original co-generation scenario (due to thhigh milling capital), the local region beseriously look t opportunities in producing animal feed, which does not require a large milling capital investment.
• The transport tools developed in this project were subsequently used to explore detailed scenarfor the purchase of different types of vehicles (that Maryborough Sugar Factory were considering) to transport the cane tops to the m
Other outcomes achieved (Table 19) centre on changes in knowledge and attitudes of the LRG’s
ers and increased capacity within the sugar industry to undertake quantitative value chain ses, especially for the whole value chain.
membanaly
46

The Maryborough sugar industry was prevented from investing in a potentially unprofitable venture: The Maryborough Sugar Factory and the Maryborough industry were seriously considering developing a co-generation plant and whole-crop-harvesting venture at the start othe project. The project results showed clearly that this v
f enture would not be profitable, with
an indicative annual loss of $5.3M per year (Table 8). Staff of Maryborough Sugar Factory sults of the project (J. Power and P. partially attribute abandoning that venture to the re
Downs, personal communication). This outcome is also supported by the anonymous comments made in the evaluation survey (Table 16): “Prevent(ed) us going down unprofitable track”; “Finally proved that a co-gen plant using trash as a fuel is not viable”. The economic impact of this outcome, evaluated above, was substantial with the accrued benefits attributable to the project to the region being up to $50M (Figure 13).
Understanding of the issues involved in maximising co-generation through whole crop
harvesting has increased amongst members of the Local Regional Groups: Responses to the evaluation survey (Table 16) show that f the Groups now have a better
d in this and scena s
ve looked at
cha
members ocoappreciation of the issues involve
“Certainly has defined the issuesgood to see”; “We would not ha
mplex value chain diversification venture: rio”; “Efficiencies in mill transport of product wa many of those aspects”.
General understanding of the sugar value in has increased amongst members of the Local
ation survey (Table 17, Q6) show that a substantial Regional Groups: Responses to the evmajority of members of the Groupthe local suga
alus (all in M of
r value chains through partici : “Gave an understanding of the whole value n on VC that I didn’t think about before”; “Greater ajust one section”.
Members of the Local Regional Groups genera
aryborough) now have a better understanding pation in the project. Specific comments includechain”; “There was a lot of informatioppreciation of looking at the whole picture – not
lly accept the value of value chain modelling Groups generally accepted that the application and the outputs produced: Members of the
is project was r tionuts)”; ;
sed in future projects eg. trresponses were made in response to other
ns of valut fitte of
Capacity for undertaking quantitative value ch
Australian sugar industry: Capacity for unincreased in three ways. Firstly, this projecanalyses can be undertaken in a timely, partiexample to the industry of how this can be d . Secondly, this project has introduced new scresearch, increasing the human capacity in rinvolved in the project now have a better appreciation of all the sectors of the sugar value
d losses to the region for the original co-generation
scenario (due to the high milling capital), the local region began to seriously look at
of the value chain model in thother projects. Responses to the evaluamodels are capable of producing (outp“Models can be u
valuable and that the models could be used fo survey (Table 16) include: “Showed what the
“Improved models available for other purposes”ash and tops”. It is worth noting that these
questions, not to a question specifically aiming to define the Group member’s opiniooutcome is that an Expression of Interesanalyses of a value chain issue was submthe project.
e chain models. Further evidence for this or funding from SRDC that included modelling
d by the Burdekin region following completion
ain analyses has increased within the dertaking quantitative value chain analyses has
t has demonstrated that whole of value chain cipatory manner. In doing so, it provides an one, making future projects in this area simplerientists (Archer and Thorburn) into value chain esearch provision. Thirdly, all researchers
chain, not just those in which they previously specialised. Maryborough sugar industry exploring additional scenarios for producing animal feed from
sugarcane tops: After the analysis showe
47

opportunities in producing animal feed, which does not require a large milling capital investment. The transport tools developed in this project were subsequently used to explordetailed scenarios for the purchase of different types of vehicles (that Maryborough Sugar Factory were considering) to transport the cane tops to the mill.
borough sugar industry adopting the transport model for transport and harvest scheduling to reduce logistics costs: The road transport scheduling model, partly deas a component model for the value chain model (and partly through SRDC project CSE005), will be used in 06/07 to improve harvester-transport logistics within the Maryborough region. The participatory action research in CSE010 not only validated the model for the wcrop venture but also as a stand-alone scheduling tool, which now has t
e
Mary
veloped
hole-of-he local industry
support for adoption. This model will be developed further and piloted in 2006 and 2007
These of the sugar
through the new “industry-led” SRDC proposal FPP111.
outcomes will underpin enhanced capacity and capability to improve the profitability value chain in the collaborating regions.
48

11 1.1
g outpuoppormade imple Durin the main dology developed within the project an be adapted to address other value chain issues that mill regions across the sugar industry are
e alue chain projects need to be communicated to the
broader sugar industry. We plan to undertake this communication in two ways: Firstly, members of the project team will be involved in a small follow-up project Increasing the Capacity to Identify and Action Value Chain Integration Opportunities (CSE013), funded by SRDC and CSIRO. The project aims to develop a review of current and past value chain research in sugar industries (not limited to the Australian sugar industry), and provide learnings/recommendations for the future. This review will be communicated to industry through a workshop and paper at the 2006 conference of the Australian Society of Sugar Cane Technologists. Second, the specific achievements of this project will also be communicated to industry through a workshop and paper at the 2006 conference of the Australian Society of Sugar Cane Technologists. A paper has been accepted into the conference as listed in the Outputs Section of this report.
11.2 Large-scale implementation of the methodology This study has highlighted the value that can be derived from combining comprehensive biophysical analyses with more common economic evaluations of diversification options for the sugar value chain. The modelling philosophy developed in the study (Figure 4) could be applied to analyse other value chain issues, such as mill rationalisation. Provided the underlying science and quantification, as embodied in the existing industry models (Figure 4), exists, analyses of the supply chain modelling could be completed quickly. The most time consuming steps would be the specification and refinement of the biophysical system and assumptions. These are ongoing activities that require meaningful input by the local stakeholders through participatory processes. However, they result in co-learning by the stakeholders and the research team and, ultimately, are the real legacy of these types of studies.
11.3 Intellectual Property The modelling approach and framework developed in this project, depicted in Figure 4, is unlikely to generate any intellectual property (IP). As described in the Outputs section, the approach has been published in the open literature by the project team and specific spreadsheets made available to the LRG’s. In developing the modelling approach, the project team were cognisant that many of the existing industry models needed to describe various parts of the sugar value chain (Figure 4) are subject to IP constraints. The approach provides a means whereby information can be obtained from those models, with the collaboration and/or consent of the IP owners, without infringing IP. Thus we
Future issues Post-project action plans 1
There are a number of post-project actions that have occurred regarding adopting or extendints from this project. These were detailed in the section on outcomes. Other post-project tunities arising from this project centre on communication of the achievements and advances in this project, and the opportunities for value chain research, development and mentation within the Australian sugar industry.
g the life of this project, Maryborough and the Burdekin focused whole crop harvesting asvalue chain scenario to be addressed. However, the metho
ccurrently struggling with. It is clear, as recognised by the Industry Reference Panel, that thachievements in this and other sugar industry v
49

hope that this project will enable the benefit of the sugar industry’s investment into process models
ues e-
s flexibility. The
ciency of the project. However,
me may provide characteristics, such as
e er
will be maximised.
11.4 Future Research Needs Future research needs can include both industry issues and technical developments. Industry isscould include matters such as optimising season length, rationalising mill numbers, assess wholof-system benefits of different varietal characteristics, etc. While the project team can see the need for research in these, and other, areas, we will confine our comments to research needs on technicaldevelopments. In this project, a multi-agent approach has been taken to link existing sector-specific models for a sugar industry value chain model. The result was a model was built specifically for analysing the impacts of whole crop harvesting in Maryborough and Burdekin. As shown above, analysis of related issues (such as whole-of-system impacts of trash blanketing) were/are able to be undertaken very efficiently. However, analysis of other, less related issues would require assembly of another agent-based model. While this would be done more quickly and efficiently by the project team
ecause of the experience gained in this project, the approach is still limited in itbsugar industry may get greater advantages through development of a more flexible tool for analysing value chains. In forestry, which has many logistical and spatial analogies to sugar, modularised value chain models are well developed (Frayret et al. 2005) and used within the industry. Strategic investment in such a system would be of great value for the sugar industry. The priorities identified by the LRG’s in this project were generally underpinned by existing ndustry models, and the existence of these models increased the effii
there are other value chain issues for which well developed modelling capabilities do not exist. An example is the whole-of-system benefits/disbenefits of higher fibre in sugarcane crops. While fibre is currently selected against by plant breeders, the increasing development of co-generation capacity within the industry may make higher fibre more attractive to the milling sector. High fibre canes may lodge less, yield more and so benefit the farming sector. But this outcologistical challenges for the harvesting and transport sectors. Many varietalthe relationship between fibre, lodging and yield, are not sufficiently well understood to bquantified and so incorporated into sector or value chain models. This applies to issues within othsector of the value chain as well. There is a need to consider strategic opportunities for improving the value chain within the Australian sugar industry, and invest in the research required to provide the tools to underpin analyses of these opportunities.
50

12 Recommendations
l
ve to produce, work is needed to assess the potential benefits of developing such a
st
s ar p
alue ct in
G’s to
r
pply contracts, season start activities) often detracts focus away from the project by some members of the LRG, thus slowing it. Whilst outside influences are often difficult to foresee or do much about, it is recommended that ways be sought to lessen their impact. Future multi-organisational value chain projects should have a funded project manager: The management of the project, involving multiple industry and R&D organisations, was complicated and time consuming. It would benefit significantly from having a specialist project manager, who would free up valuable time for the senior researchers and principal investigators.
The feasibility of developing a more generic value chain model should be explored: The valuechain model developed in CSE010 was dedicated to the whole-of-crop venture, utilising sub-modelsthat already existed in the industry. Other value chain issues (e.g. season length, milrationalisation) would require a different value chain model to be developed, with the likely development of some sub-models. Whilst a generic value chain model (that is adaptable) is likely to
e more expensibmodel versus its likely costs. A further analysis should be conducted to benchmark the Maryborough case study againthe NSW sugar region: The Maryborough case study showed a net loss, whilst the NSW sugarregion are rapidly moving ahead in whole-of-crop harvesting with confidence of a region-widebenefit. By applying the value chain model to the NSW region, specific details can be confirmed ato why there are such big differences in benefits between Maryborough and NSW. The wider sugindustry can then learn from this, and will be valuable if other regions move towards whole-of-croharvesting. An investment needs to be made in improving the understanding of “cutting edge” vhain research in the Australian sugar industry: The CSE010 was a cutting edge projec
terms of the modelling process for whole-of-crop harvesting. It was often difficult for the LRunderstand the abstract nature of the modelling process or the objectives of the project, particularly in its early stages. This sometimes made it difficult for some members of the LRG’s to appreciate the value of the project and drive it forwards. Whilst considerable ground was made during the life of CSE010 to overcome this issue, a continued investment needs to be made to improve understanding, particularly if the industry was to engage in these types of “cutting edge” projects. Strategies need to be investigated to better manage/accommodate outside influences withinsuch a project: Outside influences have fallen in the following categories (though there areprobably others): changes in energy and sugar prices; changes in the LRG; and conflicting regional issues/priorities. The recent rise in sugar price (vs energy) will have an impact on the benefits of whole-of-crop harvest and the regional enthusiasm in such a venture. Membership of the BKN LRGevolved rapidly which impacts the participatory action research process and slows progress. Otheissues and priorities within the region (e.g. cane su
51

13 References Allen, C.J., Mackay, M.J., Aylward, J.H. and Campbell, J.A., 1997. New technologies for sugar milling and by-product
. ISNAR, The Hague, pp 1-34.
1982. Economic analysis of agricultural projects. Johns Hopkins University Press, Baltimore. d Horton, J.F., 1997. Cost and service improvements in harvest/transport through optimisation
S, 2002. Modelling the price of renewable energy certificates: A report for the office of the renewable energy
e chains in the Australian sugar industry-an assessment and initial study. Proc. Aust. Soc. Sugar : 56-62.
st. Soc. Sugar Cane
restwidge, D.B, Lamb, B., Higgins, A.J., Sandell, G.R. and Beattie, R., 2006. Optimising the number and location of new cane delivery pads in the NSW sugar region. Proc. Aust. Soc. Sugar Cane Technol., 28 (in press).
Ridge, D.R. and Hobson, P.A., 2000. Analysis of field and factory options for efficient gathering and utilisation of trash from green cane harvesting, Final report on SRDC project BS518S.
Sandell, G.R. and Prestwidge, D.B, 2004. Harvest haul model – the cost of harvesting paddocks of sugarcane across a sugar milling region. Proc. Aust. Soc. Sugar Cane Technol., 26 (on CD).
Schembri, M.G., Hobson, P.A. and Paddock, R., 2002. The development of a prototype factory-based trash separation plant. Proc. Aust. Soc. Sugar Cane Technol., 24: 12-18.
modifications. In: Keating, B.A. and Wilson, J.R. (Eds.), Intensive sugarcane production: Meeting the challenge beyond 2000. CAB International, Wallingford, pp 267-285.
CoA, 2000a. Renewable Energy (Electricity) Act 2000. Commonwealth of Australia, Canberra. CoA, 2000b. Renewable Energy (Electricity) (Carge) Act 2000. Commonwealth of Australia, Canberra. Coombes, P. and Corderoy, B., 2000. Biomass co-firing with coal. Proc. Bioenergy Conf., Broadbeach Queensland, 4-6
December. Echeverría, R.G., 1990. Assessing the impact of agricultural research. In: Echeverría, R.G. (Ed.), Methods for
diagnosing research system constraints and assessing the impact of agricultural research. Vol II, Assessing the impact of agricultural research
Frayret, J.M., A’Amours, S., Rouseau, A., Harvesy, S., 2005. Agent based supply chain planning in the forest products industry. Network Organisation Technology Research Centre, Universite Laval, Quebec, Canada.
Gaucher, S., Leroy, P., Soler L.G., and Tanguy, H., 1998. Modelling as a support for diagnosis and negotiation in the redesign of agro-food industries supplying organisation. In: Ziggers G. W., Trienekens, J.H. and Zuurbier, P.J.P. (Eds.), Proc. Third Int. Conf on Chain Management in Agribusiness and the Food Industry. Wageningen Agricultural Publishing, Wageningen, The Netherlands, pp 613-625.
Gigler, J. K., Hendrix, E. M. T., Heesen, R. A. van den Hazelkamp, V.G.W. and Meerdink, G., 2002. On optimisation of agri-chains by dynamic programming. Europ. J. Operat. Res., 139: 613-625.
Gittinger, J.P.,rimley, S.C. anG
modelling. Proc. Aust. Soc. Sugar Cane Technol., 19: 6-13. Hamel, G. and Prahad, C.K., 1994. Competing for the future. Harvard Business School Press. Higgins, A.J, 2006. Scheduling of road vehicles in Sugarcane transport: A case study at an Australian sugar mill. Europ. J.
Operat. Res., 170: 987-1000. Higgins, A.J., Antony, G., Sandell, G.R., Davies, I, Prestwidge, D.B. and Andrew, B., 2004. A framework for
integrating a complex harvesting and transport system for sugar production. Agric. Sys., 82: 99-115. Higgins, A.J. and Davies, I, 2005. A simulation model for capacity planning in sugarcane transport. Comp. Electron.
Agric., 47: 85-102. Hobson, P.A. and Wright, P.G, 2002. An extended model of the economic impact of extraneous matter components on
the sugar industry. Final Report, SRDC project SRI090, Sugar Research Institute Project Report Number 9/02. IE
regulartor. Intelligent Energy Systems. Jakku, E. and Thorburn, P.J. 2006. Sociological concepts for understanding the participatory development of
agricultural decision support systems. Agricultural Systems, submitted. Juffs, R.W, Garrard, S., Hesp, C.J. and Sgarbossa, P.M., 2004. Implementing best management practice on farms. Proc.
Aust. Soc. Sugar Cane Technol., 26 (on CD). Keating, B.A., Antony, G., Brennan, L.E. and Wegener, M.K, 2002. Can renewable energy contribute to a diversified
future for the Australian sugar industry? Proc. Aust. Soc. Sugar Cane Technol., 24: 26-39. Keating, B.A., Robertson, M.J., Muchow, R.C. and Huth, N.I, 1999. Modeling sugarcane production systems 1.
Development and performance of the Sugarcane module. Field Crops Res., 61: 253-271. Laredo, L.A and Prestwidge, D.B, 2003. Sugarbag – A database system for sugarcane crop growth, climate, soils and
management data. CRC Sugar Occasional Publication, Brisbane. Milford, B.J, 2002. Valu
Cane Technol., 24Mullen, J.D. and Cox, T.L., 1995. The returns from research in Australian broadacre agriculture. Aust J Agric Econ.,
39: 105-128 NEMMCO, undated. Average price tables. Published on the Internet:
http://www.nemmco.com.au/data/avg_price/averageprice_main.shtm#annaverageprice. Pinkney, A. and Everitt, P, 1997. Towards an integrated cane transport scheduling system. Proc. Au
Technol., 19: 420-425. P
52

Shaw, G.R. and Brotherton, G.A., 1992. Green cane harvesting – A dilemma. Proc. Aust. Soc. Sugar Cane Technol., 14:
nd grower attitudes to smoke, ash and green cane trash blanketing in the
production and
es with
Van de
Wood, hes to
1-7. Small, FG; Windle, J. (2001). Community a
Burdekin and Whitsunday districts. Proc. Aust. Soc. Sugar Cane Technol., 23:246-251. Sutherland, R.F, 2002. New energy options in the Australian sugar industry. Proc. Aust. Soc. Sugar Cane Technol., 24:
19-23. Thorburn, P.J., Horan, H.L. and Biggs, J.S., 2004. The impact of trash management on sugarcane
nitrogen management. Proc. Aust. Soc. Sugar Cane Technol., 26 (on CD). Thorburn, P.J., Meier, E.A. and Probert, M.E, 2005. Modelling nitrogen dynamics in sugarcane systems: Recent
advances and applications. Field Crops Res., 92: 337-352. Thorburn, P. J., Probert M.E. and Robertson, F. A., 2001. Modelling decomposition of sugarcane surface residu
APSIM-Residue. Field Crops Res., 70: 223-232. r Vorst, J.G.A.J., Beulens, A.J.M. and van Dijk, S. J, 2002. Modelling and simulating SCM scenarios in food supply chains. In: Trienekens, J.H. and Zuurbier, P.J.P. (editors), Proc. Fourth Int. Confon Chain Management inAgribusiness and the Food Industry. Wageningen Agricultural Publishing, Wageningen, The Netherlands, pp. 354-366.
Webster, A.J., Hoare, C.P., Sutherland, R.F. and Keating, B.A, 2004. Observations of the harvesting, transporting and trail crushing of sweet sorghum in a sugar mill. Proc. Aust. Soc. Sugar Cane Technol., 26 (on CD). A.W., Muchow, R.C., Higgins, A.J., McDonald, L.J. and Inman-Bamber, N.G., 2003. Innovative approacenhancing productivity and profitability: The contribution from the CRC Sugar. Proc. Aust. Soc. Sugar Cane Technol., 25 (on CD).
53

14 APPENDIX 1: Compilation of models relevant
Bello d to value chain research existing within the
to whole-of-value chain research existing amongst the Project Team
w is a summary of the models that could be applie
project team. The models are ordered by sector and/or issue addressed. Where available, references ven to the model and/or its application. are gi
SECTOR / ISSUE
MODEL/S DESCRIPTION AND REFERENCES ORGAN-ISATION
Sugarcane ction
Sugarcane production can be simulated with the Agricultural Productions Systems Simulator (APSIM). This model describes the dynamics of crop growth (for various
CSIRO produ
crops), soil water, soil nitrogen (N) and carbon (C), and plant residues (trash) as a function of climate, cropping history (e.g., crop type, sowing date) and soil management (e.g., tillage, fertilizer application) in a modular construction. The modules are one-dimensional and driven by daily climatic data. The sugarcane module uses intercepted radiation to produce assimilates, which are partitioned into leaf, structural stalk, roots and sugar. There are differences in these parameters between plant and ratoon crops, and these differences are captured in the sugarcane module. The processes represented in the sugarcane module are responsive to radiation and temperature, as well as water and N supply. The dynamics of water, N, C and roots are simulated in soil layers, with water (and associated nitrate) moving between layers where gradients exist. The soil organic matter is divided into three “pools”, with fom representing the fresh organic matter (ie, roots and incorporated plant residues), biom representing the active biomass in the soil, and hum representing the humified material. Part of the hum pool is considered inert. The most commonly used soil water module is a “cascading bucket” water balance model, with water between the drained upper limit (dul) and saturation draining to the layer below. The drainage rate is controlled by the parameter swcon, which was set to 0.4 in all layers. The lower limit of plant available water is defined by the parameter ll15. Evaporation from the soil follows Ritchie’s two-stage evaporation model. A Richards’ equation-based soils water model is also available. The presence of plant residues on the soil surface affects runoff (and hence infiltration) and evaporation. Residue decomposition is controlled by residue amount and quality, and environmental variables of water and temperature. Farming operations, such as fertilisation, planting, incorporation of crop residues through cultivation, or burning of crop residues, can be specified through the MANAGER module, to represent actual or hypothetical conditions. Specific developments to the model for sugarcane production systems include sugarcane-specific crop residue dynamics, the ability to model subsurface trickle irrigation and fertigation, and sugarcane specific manager commands, such one for ‘hilling up’. General APSIM references: McCown, R.L., Hammer, G.L., Hargreaves, J.N.G., Holzworth, D.P., Freebairn, D.M.
(1996). APSIM: a novel software system for model development, model testing and simulation in agricultural systems research. Agric. Sys., 50: 255-271.
Probert, M.E., Dimes, J.P., Keating, B.A., Dalal, R.C., Strong, W.M. (1998). APSIM’s water and nitrogen modules and simulation of the dynamics of water and nitrogen in fallow systems. Agric. Sys., 56:1-28.
Keating, B.A., Carberry, P.S., Hammer, G.L., Probert, M.E., Robertson, M.J., Holzworth, D., Huth, N.I., Hargreaves, J.N.G., Meinke, H., Hochman, Z.,McLean, G., Verburg, K., Snow, V., Dimes, J.P., Silburn, M., Wang, E.,Brown, S. Bristow, K.L., Asseng, S., Chapman, S., McCown, R.L., Freebairn, D.M., Smith, C.J., 2003. An overview of APSIM, a model designed for farming systems simulation. Europ. J. Agron., 18: 267-288.
54

SECTOR / ISSUE
MODEL/S DESCRIPTION AND REFERENCES ORGAN-ISATION
Developments specific to sugarcane: Keating, B.A., Robertson, M.J., Muchow, R.C., Huth, N.I. (1999). Modelling
sugarcane production systems I. Development and performance of the sugarcane . Field Crops Res., 61: 253-271. .J., Probert, M.E., Robertson, F.A. (2001). Modelling decomposition
moduleThorburn, P of
sugar cane surface residues with APSIM-Residue. Field Crops Res., 70: 223-232.
t, M.E. (2005). Modelling nitrogen dynamics in sugarcane systems: Recent advances and applications. Field Crops Res., 92: 337-
ts
The rm
Lisson, S.N., Inman-Bamber, N.G., Robertson, M.J. and Keating, B.A. The historical and future contribution of crop physiology and modelling research to sugarcane production systems. Field Crops Res., 92: 331-335.
Thorburn, P.J., Meier E. and Prober
351. Example applications in assessing trash impacts on sugarcane: Thorburn P.J., Probert M.E., Lisson S., Wood A.W. and Keating B.A. (1999). Impac
of trash retention on soil nitrogen and water: an example from the Australian sugarcane industry. Proc. South Afr. Sug. Technol. Assoc., 73: 75-79.
Thorburn, P.J., Van Antwerpen, R., Meyer, J.H. and Bezuidenhout C.N. (2002). impact of trash management on soil carbon and nitrogen: I Modelling long-teexperimental results in the South African sugar industry. Proc. South Afr. Sug. Technol. Assoc., 76: 260-268.
Thorburn, P.J., Horan, H.L. and Biggs, J.S. (2004). The impact of trash managementon sugarcane production and nitrogen management. Proc. Aust. Soc. Sugar Cane Technol. 26 (on CD).
Harvesting process or
ulate
some assumptions were made from previous research. Results of
that the region gains from the uptake of harvesting best
BSES & CSIRO
The Harvest Haul Model is a Microsoft Access® database application that calculates the cost of harvesting each paddock of sugarcane on a farm, in a harvesting group, across a sugar milling region. It evolved from the BSES Harvest Transport Model, which was developed to cost harvesting a single paddock. This was upgraded to associate harvesting groups expenses such as depreciation, wages, repairs and maintenance to all the paddocks within the group and to run multiple blocks and groups to calculate regional harvester performance. The initial purpose for the Harvest Haul Model was to show the overall gains to a region by changing from standard harvesting practice to harvest best practice methods (G. Sandell and J. Agnew 2002). Harvesting best practice encourages harvesters to reduce fan speed and elevator pour rate, which reduces cane loss while provide cane at the same or higher quality. Therefore more cane is processed through the mill and milling efficiency is improved. The model was also developed to run scenario analysis looking at the effects of changing harvesting hours; harvesting groupnumbers, content and size; and also changing cane railway siding locations.
As gathering region-wide data is an enormous task GIS methods were used to calcestimates for row length and haul-out distance for each block of cane in the region. Surveys were conducted to estimate the type and value of capital equipment used inhe region and t
scenario analyses have shown practice need a more equitable payment method, a losses are concentrated in the harvesting sector.
Sandell G. R. and Prestwidge D.B. (2004). Harvest Haul Model - the cost of harvesting paddocks of sugarcane across a sugar milling region. Proc. Aust. Soc. Sugar Cane Technol. 26: (on CD).
Harvesting optimisation Th
extThof t
a oit the geographical differences in CCS and TCh across
CSIRO Harvest schedule optimisation e harvest schedule optimisation models, SugarMax and VarietyMax, are an ension of the cane supply options work carried out through the life of CRC Sugar. e aim of SugarMax is to firstly provide a harvesting group with optimal schedules he proportion of each farm to be harvested in each harvest round during a harvest son. Doing this will explse
55

SECTOR / ISSUE
MODEL/S DESCRIPTION AND REFERENCES ORGAN-ISATION
harvest dates to increase sugar yield. Another main feature of SugarMax is that it le to
one r to S each variety to be harvested in each visit
harver ears, and the aim of the models
TC
iggins, A. J., Stafford, A., Muchow, R. C. and Rudd, A. V. (1999). Improving cane ne Technol., 21: 44-
Hig n.
Thrati g groups in a mill region. The objective of this model is to
inimise the movement distances of harvesters, maximise sugar scheduling
ar
rvesting and transport interface ng
to orkload
removing clashes of harvesters using sidings and to provide a best balance of
a
rfaces, 32: 15-25.
iggins, A. J. and Postma, S. (2004). Australian sugar mills optimise siding rosters to
allows a farmer or harvesting group to interactively modify the optimal schedu that is implementable from a risk and cash flow perspective. VarietyMax is similaugarMax, excepts schedules the tonnes of
by the harvester
SugarMax and VarietyMax use statistical models that estimate CCS and TCH across vest dates, given differences in variety, location, crop class, age, etc. A few sions of the models were developed over the past 6 y
is to produce to most accurate and unbiased estimates and predictions of CCS and H, especially given the complex spatial and temporal effects.
Hyield estimates for farm paddocks. Proc. Aust. Soc. Sugar Ca50. gins, A. J. (1999). Optimising cane supply decisions within a sugar mill regioJournal of Scheduling, 2: 229-244.
Jiao, Z., Higgins, A.J. and Prestwidge, D. B. (2003). An integrated statistical and optimisation approach to increasing sugar production within a mill region, Computers and Electronics in Agriculture, 48, 170-181.
Harvest group analyses is model deals with the optimal allocation of farms to the groups that is needed in onalisation of harvestin
mopportunities, maximise compatibility of farms to harvesting equipment, and minimiseclimate risks. The model was developed under CRC Sugar and SRDC CSE005. Prestwidge, D.B, Lamb, B., Higgins, A.J., Sandell, G.R. and Beattie, R. (2006).
Optimising the number and location of new cane delivery pads in the NSW sugregion. Proc. Aust. Soc. Sugar Cane Technol., 28, 86-95.
HaHarvester and siding roster models improve the chain logistics between the harvestiand transport interfaces. The harvest and siding roster models were initially developed to enhance the harvesting and transport planning in the Mackay region, which is the most logistically complex region. The harvester roster model determined the optimal RDO’s for each harvester, in order to produce a constant daily supply of cane to the mill and maximise utilisation of the transport. The siding roster model uses the harvester roster as input and produces the (near) optimal allocation of harvesterssidings each day across the harvest season. The purpose is to reduce the mill wofmaintaining equity and harvester movements. Both of these models are based on combinatorial optimisation and use principles of staff scheduling. Due to the large number of integer decision variables, moth models are solved to near optimum usingmeta-heuristic such as tabu search and GRASP. Higgins, A.J. (2002). Australian sugar mills optimise harvester rosters to improve
production. InteH
improve production. Annals Oper. Res., 128: 235-249.
Tactical and strategic
ls
A m was developed to estimate the number of comotives, shifts, bins required and delays to harvesters for each day of harvest
developed under the CRC Sugar and SRDC ic
CSIRO
planning toofor transport
odel, based on unscheduled traffic,lowithin a mill region. The model was CSE005 project. The model is based on principles of queuing theory and dynamsimulation of demand. A more strategic model was developed in CSE005 and with Mourilyan/Plane Creek tooptimise the location of sidings on a cane railway system or pad locations in a road
56

SECTOR / ISSUE
MODEL/S DESCRIPTION AND REFERENCES ORGAN-ISATION
system. The model is an extension of a P-Median problem and links with ArcViewThe intention of the model with Mourilyan, was that is the region was to rationalise isidings and upgrade the remainder, which sidings should be kept. The original model aimed at minimising total haulout distances, although issues in transport costs have been included.
. ts
d
iggins, A.J. and Laredo, L. (2006). Improving harvesting and transport planning
Premising the number and location of new cane delivery pads in the NSW sugar
Higgins, A.J., Antony, G., Sandell, G., Davies, I., Prestwidge D.B., and Andrew, B.
(2004). A framework for integrating and optimising a complex harvesting antransport system for sugar production. Agric. Sys., 82: 99-115
Higgins, A.J. and Davies, I. (2004). A simulation model for capacity planning in sugarcane transport. Comp. Electron. Agric, Vol 47, 85-102
Hwithin a sugar value chain. J. Opera. Res. Soc. 57: 367-376. stwidge, D.B, Lamb, B., Higgins, A.J., Sandell, G.R. and Beattie, R. (2006). Optiregion. Proc. Aust. Soc. Sugar Cane Technol., 28: 86-95.
. Road transport schedule optimisation
A m k up seq time at the mill. This will
turn reduce the transport infrastructure requirements. The model is applied to a 24 harvest movements to achieve the most efficient operations,
sport
iggins, A.J. (2006). Scheduling of road vehicles in Sugarcane transport: A case
CSIRO odel was developed (with Maryborough Sugar Factory) to optimise the picuence of full trailers by vehicles so as to reduce the queue
inhour planning horizon ofand is adaptable to any sugar region with road transport. The model can be used as a tactical planning tool to benchmark the costs of transporting different levels of trash-in-cane to the mill. It also can be used to identify efficiency gains gain in transuch as changing the hours of harvest. H
study at an Australian sugar mill, Europ. J. Oper. Res., 170, 987-1000.
Rail transport scheduling models
SR d a suite of computer rograms available to assist traffic officers and cane transport schedulers. The
sary for a complete scheduling system for cane
uals
ta maintained to guide the
r
f the network; a 'cut' facility allows allotments to be updated
SRI & CQU
I and Central Queensland University (CQU) have developepprograms cover the three areas necesrailway operations. These are to: • Generate schedules automatically; • Allow operators to generate, modify, check and display schedules; and • Support day-to-day cane transport operations. The tools which cover these areas are ACRSS, ACTSS and TOTools. ACRSS generates schedules, ACTSS checks and displays schedules and TOTools supports daily operations. These three software packages have been described in user manand numerous ASSCT papers. Further details are given below. TOTools: TOTools, or Traffic Officer Tools, is central to the scheduling system as it provides a common interface to all of the tools. TOTools has been developed to mirror the operations in most traffic offices. A
puter-based spreadsheet replaces tcom he daily ledger with deliveries and collections being shown as spreadsheet entries. Running balances between the allotments and
l deliveries and collections for individual harvesters are totraffic officers. Various functional tools support the operation of the ledger. A roster function determines whether particular harvesters are active on the specified day; a harvestelocation tool provides a convenient way of relocating harvesters either to an adjacentsiding or to other parts oin line with actual mill requirements and a print option allows locomotive running sheets to be printed on demand throughout the day. TOTools can also monitor the age of rakes to help reduce stale cane, and the availability of empty bins at sidings to help
57

SECTOR / ISSUE
MODEL/S DESCRIPTION AND REFERENCES ORGAN-ISATION
reduce harvesting delays. TOTools functions as a support system. While it indicates mismatches between allotments and total deliveries and collections to the traffic officer, the traffic officercan ignore these mis
matches and specify the size of deliveries and collections as
quired.
AC"op twork and
e
day SS attempts to use
AC rt times by calculating
ey schedule parameters such as cane age and bin fleet size, and uses priorities ecified by the user for these parameters to compare alternate run sequences.
egic planning tools, where the current ansport set-up is compared with various other scenarios to help determine what
est sys
le from a TOTools database and simulates the omplete day's harvest, transport and milling operation. It checks for violations such h ins, siding capacities being exceeded and u
h n be produced and the day's ane
he
e season.
re
RSS: ACRSS, or Automatic Cane Railway Scheduling System, generates timum" daily schedules based on data describing the railway ne
harvesting pattern.
ACRSS builds a set of locomotive runs to deliver and collect the bins required for th. The runs are designed for individual locomotives and ACR
the minimum number of locomotive shifts.
RSS uses a genetic algorithm to determine suitable run stakspACRSS then refines the schedule by making small changes to the schedule and assessing if there are improvements. The user can add extra locomotives and shifts at this stage to improve the schedule even further. Although ACRSS was developed primarily for rail transport systems it has also been successfully used to build schedules for road transport. ACRSS is predominately used as a strattrchanges should be made to improve the overall efficiency of the transport and harv
tem. ACTSS: ACTSS, or Animated Cane Transport Scheduling System, checks and animates a daily transport schedule. ACTSS reads the transport scheducas arvesters or the mill running out of bm ltiple locomotives on one section of track.
en the simulation is complete, various reports caWoperation can be animated. Many of the reports are in graphical form, such as cage histograms, locomotive and harvester utilisation charts and yard stock charts. Tanimation phase shows the locomotives traversing the track as well as the harvesting details for each minute of the day. ACTSS is predominately used as a pre-season scheduling tool, when factories are developing base schedules and determining harvest roster patterns and the number of
comotives and locomotive shifts required for thlo Pinkney, A. and Everitt, P, 1997. Towards an integrated cane transport scheduling
system. Proc. Aust. Soc. Sugar Cane Technol., 19: 420-425.
Raw sugar manufacture and cane handling model
ost aspects of the sugar production process in the mill are simulated. The specialized, led
s
l
SRI Models have been developed in which the material flow, energy, plant capacity and ccommercially available software (HYSYS.Process) is used to enable more detaisimulation of factory steam and power utilization in relation to integrated co-processesuch as large-scale co-generation. These models all have a financial overlay that enables tracking of associated costs and final revenues. The main features of the modeinclude: • Material flows: cane billet, tops, trash and dirt (organic and inorganic
components) with tracking of associated pol, brix, fibre, ash and water.
58

SECTOR / ISSUE
MODEL/S DESCRIPTION AND REFERENCES ORGAN-ISATION
• Energy flows: fuels, steam flows (high pressure and process) mechanical (factory drives) and electrical power.
tion
ply. ndling: Including tipper, shredder and milling stations. Milling
performance is based on correlations developed from SRI milling models and isture
power generation: An option is available to use HYSYS.Process
s of the front and back end of the
ated.
ort Number 9/02.
• Financial: Capital, operating and labour costs are estimated for each main stain the factory. An estimated component (based on a major industry survey) of all factory maintenance costs are attributed to the presence of dirt in the cane sup
• Cane ha
includes the effects on power consumption, extraction and final bagasse moof fibre, mill geometry, settings and operation.
• Steam cycle andto rapidly develop a detailed model of all components of the high pressure steam generation and consumption cycle including boilers, turbines, ducting, valves, de-aerators, de-superheaters, condensate handling etc.
• Process operations: Detailed process modelfactory (developed at SRI over many years) have been incorporated. In particular sophisticated evaporator and pan models enable the effects of configuration on low-pressure steam economy or cane quality on sugar recovery to be investig
Hobson, P.A. and Wright, P.G, 2002. An extended model of the economic impact of
extraneous matter components on the sugar industry. Final Report, SRDC project SRI090, Sugar Research Institute Project Rep
Integrated field to factory model
roduct. It is the result of an
stics), ld
h on fertiliser requirements, moisture
d ls, steam, mechanical and electrical
so
th the development of the sub-models have not .
actory options for efficient
o conomic impact of
SRI & BSES
The model simulates material flow, energy, plant capacity and cost aspects of the ugar production process from field operations to final ps
amalgamation of the • SRI cane handling and raw sugar manufacture models, • SRI cane transport model (describing costs associated with existing rail transport
operations and the effects of trash on cane bulk density, but not operational logi
• BSES harvesting and transport model (describing harvester performance, fielogistics, material inputs and outputs, capital labour and operating costs), and
BSES estimates of the effects of tras•retention and erosion.
The models all have a financial overlay that enables tracking of associated costs and final revenues. The main features of the model include tracking of materials (cane billet, tops, trash and dirt – both organic and inorganic components – and associate
ol, brix, fibre, ash and water) and energy (fueppower) flows in both the field and factory. Capital, operating and labour costs are alestimated for harvesting and each main station in the factory. The integrated model in its current form utilises SRI sub-models developed from sequences of past and current projects developed under numerous research programs.
eferences to reports associated wiRbeen included here and are in any case not generally available in the open literatureTwo SRDC reports, which describe the development of the integrated model, are:
idge, D.R. and Hobson, P.A. (2000). Analysis of field and fRgathering and utilization of trash from green cane harvesting, Final Report, SRDCproject BS157S, BSES report number SD00011. bson, P.A. and Wright P.G. (2002). An extended model of the eHextraneous matter components on the sugar industry. Final Report, SRDC projectSRI090, SRI project report number 9/02.
GIS techniques Unique GIS techniques have been developed to support value chain modelling. These
techniques include: • GIS techniques for overlaying cane paddock boundaries with rail and roads, also
location of sidings (or pads) • GIS technique for acquiring paddock and farm centroids (used in optim
programs) isation
CSIRO
59

SECTOR / ISSUE
MODEL/S DESCRIPTION AND REFERENCES ORGAN-ISATION
• GIS technique to approximate row lengths of all paddocks within a region GIS technique to approximate ha• ulout distances from paddocks to sidings (or pads)
• GIS technique for linking land attributes to farm level ie. Soil, topography, suitability class
Miscellaneous information
neous ral
• nd trash as a result of the
•
BSES • Bulk density equations that relate bin bulk density to percentages of extramatter, billet length and other parameters. Models exist for Mossman and seveother regions/crop type. Measurements of brix, pol etc placed on leaves aharvesting operation. These losses are primarily from the chopping operation. This process has given indications of juice losses due to mis-matched harvester feed systems. Early season CCS data
• Harvester machine performance parameters - machine operation, losses due topick-up, chopping, cleaning, engine operation. Many data sets of crop composition (billets, EM and/or tops and trash) before and after harvest. Billet length distributions from a variety of harvester chopper and feedtrain set-ups.
• A database of haulouts masses (loaded and unloaded load distributions) and operating parameters.
Database for o productivity data ame in several differing formats, some as rake data and some as block data, we
ores for the region historical block productivity data, current ar lists of variety and class de
Port (ie. txt, r for the different coding systems from each region for
rifor e
Hay , D.B. (2001a). Decision support framework for .
CSIRO Whole-of-Industry Models
Tc
work with models using data from different regions where block
developed a standardised database structure to handle these data. This was called “Databases for Whole of Industry Modelling”, shortened to DWIM. (ie. DWIMMossman). It stye s estimates, lists of farms, district and harvesting groups,co s and has the capacity to stores further data as further models are developed. The
Data program was written to import these data from differing files structuresxls, dbf), and also to cate
va ety, class and date of harvest. The DWIM databases provide a central data source ach the models developed.
nes, M.A. and Prestwidgegenerating improved sugarcane harvest schedules. Proc. 2001 Internat. Cong. ModSim., pp 1659 – 1664
60

15 APPENDIX 2: Detailed description of the value
d cIn the main body o l approach taken to modelling the value chain was described. Here e The value chain mo ral the agents defined the physical outputs (i.e. the cane and extraneous matter generated) and costs in individual sectors of the v e ’ were embedded in a mod ors; that is physical outputs and costs f raints) flowing up the cha nt and price of the products u
cti crription model to the mode , and between
ts repre e the development of ct.
15.2 Value
15.2.1 IntroduThe Value Chain M different sectors of the value chain. It is designed as a framework to enable representation of the different cenarios being considered. These scenarios require differing links, information and sector modules odels to be employed. Here the general structure and the function of each sector module in the CM is described.
The main goals of the VCM was to develop a framework where existing high-level models, capable of performing specific value chain functions described in the conceptual modelling, are linked together to simulate results to examine the strategically important scenarios described by the regions. Specifically these included examination of co-generation of electricity, whole crop harvesting for this purpose and inter-mill transfers.
15.2.2 General description Figure 1 shows a pictorial representation of the VCM for whole crop harvesting, showing each sector in the value chain and the specific functions (shown in the dashed boxes) that link them to each other. The specific functions are captured from the existing detailed models, and they represent the value adding step which makes the sector essential to the chain. Specific results are avoided here as they will be described in greater detail in later sections. The information flow through the VCM generally follows the sugar production system with some concessions to data sources and sub-models’ requirements. The process model is shown in Figure
chain modelling approach
15.1 Intro u tion f the report, the genera
w provide more detail of the modelling.
del was developed on agent-based modelling philosophies. In gene
alu chain (growing, harvesting, transport and processing). The ‘agentselling framework that controls the interactions between sect
lowing down the chain, subject to feedback (such as logistical constin. Total revenue is calculated within the framework from the amou
(s gar, molasses and electricity) produced.
In the first seThis descscenariosthe agen
on, the modelling framework, here termed the Value Chain Model, is des provided details on the overall approach taken to application of the
lled, and how the Value Chain Model controls information to and fromsenting the individual biophysical sectors. Subsequent sections describ the functional models from the detailed industry models used in the proje
Chain Model structure and function
ibed.
ction odel (VCM) is the overarching structure that links the modules of the
smV
61

2. Each stage shown here gives the change in the amount of billets passing through the system and t tthat simthe Production, Harvest-H dashed perimeters
odels developed and Transport nctional models were completely embedded in the VCM as represented here by the blue box
grey shaded area. The Harvest-Haul and Mill functional models were sical processing models, transforming in-field cane to cut billets of the
dels were developed in Microsoft Excel nd thus were integrated. In Maryborough the Mill functional model was completely embedded
scription of the value-adding processes in the sugar production Value Chain
he cos s associated with the processes involved. The square white boxes are modules in the VCM ulate the processes carried out in each sector. A single module was developed for each of
aul, Transport and Mill sectors. The blue boxes with from existing industry models. The Farm are the functional m
fubeing completely inside thepartly embedded. The phyHarvest-Haul model, were embedded in the VCM. However the HBP cost modelling were calculated separately and imported. The Mill functional moainterfacing the sector module to both physical process components and cost components. The Burdekin Mill functional models were not embedded but were linked to the VCM.
Figure 1. A pictorial deModel.
H-Block Production
Productionsectormodule
Financialmodule
Millsectormodule
Agronomicfunctionalmodels
H-Haulfunctionalmodels
Transportfunctionalmodels Mill
functionalmodels
Harvest-Haul
sectormodule Transport
SugarMolassesElectricity
sectormodule
farm data
mill data
Product informationEconomic informationFunctional
Legend
model data
62

Figure 2. The physical and financial information flows between functional models (blue) and framework modules (white) in the Value Chain Model. The interaction between sectors is represented with arrows. The heavy black arrows show the flowof product through the system. The dashed black arrows show the movement of required information in the system. And the dashed red arrows represent the flow of financial informatioand costs and revenues in the VCM. The blue boxes represent the functional models which providethe processing steps for each sector. With the exception of the Harvest-Haul, the functional modelare directly linked or are included in the VCM. The functional models are more completelydescribed elsewhere. The following sections outline the value chain processes from standing cane to sugar productiothrough the sectors in the VCM. While the specific processes relate to the scenario
n
s
n s considered, the
tructure and most functions are of more general interest.
the mill with
ation. As odels for the
ate the between
ocess involving functional models from Harvest Haul sector and e H-Block Prod: first back-calculating to determine the in-field cane using harvesting functional
ee Figure 3); then estimating the effects of trash removal using farm functional models;
results give the expected returns based on current cane payment formulae.
sector (see Figure 4).
traneous matter
productivity data.
d to have no sugar.) costs of processing in-field cane
ill occurs here ill.
the
ework required ade. This
s
15.2.3 Production Sector The Production sector supplies estimates of standing cane, tops and leaf produced in each block. The source data, the mixed cane data for the 2003 harvest [harvested cane supplied tonon-cane components (soil, tops, and trash)] resides in the H-Block Prod module. The original individual farm-block harvest information (yield, block area, soil category, irrigation category, and whether it is burnt or green harvested) is imported into the VCM individual block informwell as maintaining this information, H-Block Prod contains the functional farm mProduction sector and harvester group information. The Farm functional models estimeffects of removing the trash blanket for each farm-block and estimate the relationshipstanding cane (in-field) and trash and tops. In the Production sector the effect of removing the trash blanket on cane growth is applied at the block level. This is an intricate prthmodels (sand, finally, applying the models of tops and trash to the new estimates of in-field cane. The financial
15.2.4 Harvest Sector The in-field cane tops and trash estimates are the inputs to the Harvest Haul The Harvest Haul sector transforms standing in-field cane into cut cane ready to be transported to the sugar mill. The functional models estimate the cane quality with respect to ex(EM) the quantity of non-cane material (soil, leaf and tops) transported along with the cane to the mill. Sugar content of cane billets was assumed to be the same as in the original(However, the sugar content of the mixed cane supply was calculated under whole crop harvesting, allowing for the ‘dilution effects’ of the additional trash, which was assumeThe quantity of cane losses from harvesting is also estimated. The into cut cane are modelled and sent to the Production sector. EM sent to the massigning an average to block production expressed as a percent of total mass sent to the m Down-stream from this sector the results do not require block-level detail. The processing step in this sector requires block-level information for burnt or green harvesting differences fromProduction sector to determine harvest losses and harvest costs. The costs of harvest were calculated by an external module and then imported into the VCM. Thus the framhuman intervention whenever changes downstream from the Production sector were m
63

will limit development of dynamic framework interactions. Future iterations should embed Harvest-Haul modelling.
Figure 3. Example of the production sector module from the Framework showing cane, tops and leaf production per block, overall and financial for the base case and whole crop harvest scenarios.
15.2.5 Transport Sector The Transport module’s main function in the VCM is to determine the cost of transporting the cut cane harvested in the Harvest-Haul sector and, secondarily, setting the average daily delivery rate to
nsport rate the Transport module requires the cut cane harvested from the
d.
the mill. To determine traHarvest-Haul and the mill crush rate from the Mill sector. Both road and rail transport systems were modelled using the appropriate functional model as required for the two case studies. Mass balance is assumed throughout the model. For the road transport system in Maryborough, costs are determined in the Transport functional model (Figure 5) with block-level farm data; harvest group pour rates input from the H-Block module; and harvester roster data. Some generalisations about the information input were requireAn average over the whole season of harvest group pour rates was used.
64

Figure 4. An example of the Harvest-Haul agent in the model framework showing cane, trash, leaf and dirt block harvest and overall results and financial analysis for the baseharvest scenarios.
case and the whole crop
he average daily delivery rate approximates what one expects to be delivered to the mill through e crush as shown in Figures 6a and b. On any given day some harvesters will be rostered off and
y. Therefore a day in the roster that closely approximated the average delivery rate estimated from the total cane cut was selected as representative.
Figure 5. Example of the Transport Sector Module showing the daily transport rates and costs for base case and full trash scenarios. Tththe totals from blocks harvested varied widel
65

66
a. b.
Figure 6. Example of the approximate daily delivery by harvest group calculated by the Transport Sector Module for (a) base case (b) full trash scenarios. The rail transport system functional model used in the Burdekin mills. This Transport functional
odel required average siding roster delivery rates and average daily delivery rates to the mill as seen in Figure 7. However, the functional model was developed as a set of functions, based on an
unctional
m
external tool. Thus the only information input required from the VCM was the average daily delivery rate from the Transport module. While this makes handling the rail transport fmodel easier the road transport functional model is more responsive to subtle changes in upstreamchanges in the system. Figure 7. Example output from the transport model for the full trash scenario showing the quantity (t) and (%), capital equipment required and costs of transport.
15.2.6 Mill Sector The outputs of the transport sector, the calculated costs of transport and the average daily cane supply, are s
mixed ent to the Mill module. Transport costs are considered as a sub-section of the Mill

costs –no cost-benefit is considered for this sector—and it is sent to the Mill module to estimate tal costs of the Mill sector.
Mill module that takes in a mi y and processes it into the end-products of the value chain: raw sugar and mola scenarios investigated required that the Mill functional model consider the balance of thes ts particularly with respect to each other, the quality of the cane fed ing these tasks. The quality with respect to the amount of di cane were acquired from the Harvest-Haul sector where the quantity of these were dete ined as part of its processing step.
Figure 8. Example of the mill functional m ill region, the resulting products and the cotst for the base case and f The Mill Functional Module calculates end products and costs and corresponding revenues however not all output is used. The sugar, molasses and energy outputs calculations are fed into the Mill
functional model is used because the alculation of revenue received from electricity production is not all directly derived from energy roduced (see Modelling factory performance for different trash recovery scenarios for a more
f the
n length to estimate average daily mixed cane supplied to the mill.
he simulation considers strategic change to the value chain. To the VCM has erences between current practice and the er market options. The two scenarios
the ‘Base Case’ which is based on production in 003 cane crush, and various trash collection scenarios called ‘Full Trash,’ which considered
electricity co-production using the sugar supply chain. An example of the output from the VCM is shown in Figure 9 where the cost-benefit analysis of the Invicta Mill is given comparing the Revenues and Costs of the sugar value chain by sector for the Base Case and the Full Trash scenarios and the difference between them. These results show the regional net benefit of whole crop harvesting in this case is -$ 2.1 M when as the costs to the system are higher than the gains due
to Figure 8 shows the xed cane suppl
sses and electricity. The e outpu
into the process and the costs of performrt, leaf and tops in the
rm
odule showing the inputs from the mull trash scenarios.
module. The sugar and molasses prices from the Financial module is linked to produce total revenues. However the revenue estimates from the Mill cpcomplete description of energy revenue production). The Mill sector supports other sectors by providing supporting data. An average CCS is estimated in the mill sector weighted by block production over the whole region which feeds estimates ocane payment to producers used in the Production sector. It requires CCS estimates from the original data residing in the H-Block Production module. The Transport sector requires the Mill sector estimate of seaso T address this questionbeen developed as a comparative model to show the diffresults of changing the value chain in order to service othcompared in the VCM were current practice, called2
67

tion in the Maryborough region
or co-
e anagement impacts on yields (Thorburn
of
c
ls
or the rest of this report the soils will be referred to as good, average and poor for Bidwill, atalgan and Robur respectively.
Figure 9. Example of the data used in the comparison of the Value Chain Model results for the Base Case and Full Trash scenarios.
15.3 Modelling the impact of trash removal on sugarcane produc
15.3.1 Introduction ll or part of the green cane trash blanket would need to be removed to provide fuel fA
generation of electricity. The APSIM-Sugarcane cropping system model was used to assess the impact of removing the trash blanket on long-term average cane yields in the Maryborough region. This information is a required input for a whole-of-value-chain assessment of cogeneration.
15.3.2 Modelling details The approach taken was to simulate the effect of trash removal on sugarcane yields using APSIM-Sugarcane, because there were no comprehensive data available from field experimentation and th
odel has been shown to provide good estimates of trash mmet al. 2001, 2004, 2005). To determine the extent of cane yield reduction if long-term trash removal was adopted, a range of soils and management practices were investigated. The scenarios include three soils (designated good, average and poor), three irrigation schedules (optimum, limited and dry-land) and six rates
ash removal at harvest (0, 20, 40, 60, 80, and 95% removed). Full retention of trash represented by tr0% removal and complete removal of trash blanket represented by 95%.
15.3.2.1 Soils Three soils were selected by local Technical Working Group members to represent the range of soil quality (i.e., fertility, water holding capacity, hard setting surface, etc.) in the region; a Redoxihydrosol (Clayton), Red ferrosol (Bidwill), and Yellow-brown dermosol (Kepnock). Adequate information to parameterise APSIM for Clayton and Kepnock was not available and these soiwere substituted with the similar Robur and Watalgan soils, respectively, in consultation withTechnical Working Group members. Soil properties were determined from soil survey reports (Wilson 1997, Wilson et al. 1999) and properties of the selected soils are summarised in Table 1. FW
68

69
oval on Table 1. Summary of the properties of the soils selected for simulating impacts of trash remsugarcane yield. Attribute Soil Identifier
Good Average Poor
Regional mapping unit*
Bidwill Watalgan Robur
Soil classification* Red Ferrosol Red Dermosol Redoxic Hydrosol, Grey Sodosol
Great Soil Group* Krasnozem Red Podozolic Soloth, minor solodic soil
C:N 12.0 13.3 26.0
Rooting depth (cm) 150 90 60
Plant available water 175 151 52
Cowhen dry
Firm Hard Setting
High Medium Low
C in top 20cm (%) 2.0 2.1 0.5
capacity (mm)
ndition of surface Soft
Fertility
Water holding capacity High Medium Low * From Wilson (1997) and Wilson et al. (1999).
15.3.2.2 Irrigation management f
farms without access to irrigation water. The irrigated treatments shared e following in common:
• No irrigation for at least 8 days after significant rain (>25mm over 3 days).
um -
Irrigation was based on climate, with irrigation, where available, being applied following 70 mm opotential crop water use. Three different irrigation managements were defined to represent the full spectrum of management typical to the region: They were identified as optimum and limited irrigation, and dryland for th • A maximum allocation of 500 mm per season. • Application efficiency of 75%. • Application amount of 37 mm per irrigation. • Dry-off 98 days before harvest.
The optimum and limited irrigation managements were differentiated (Table 2) by a different date of commencement of irrigation within the season (optimum started earlier) and a different minimtime between irrigations (the optimum being shorter). The times between irrigation, termed turnaround time, represented different on-farm irrigation infrastructure limitations on irrigation scheduling.

15.3.2.3 Trash removal
e a certain proportion (from none to 95%) of trash after harvest. Complete (100%) t d was not con his would be impossible to achieve in practise. Table 2. agement used to characterise the optimum and limited i nts.
m Limited
Trash removal was represented by issuing a command (through the Management Module in APSIM) to removrash remove sidered because t
Attributes of irrigation rrigation managemeAttribute Optimu
man
Start date 1st December 1st January
Turn-around time (days) 14 22
1 ing cA a cro cle based on lant crop followed by four ratoon crops. Sugarcane was planted on the 4th 2 and both plant and ratoon crops were 1 ical ing Group ers identified this cropping cycle as representative of the ‘average’ for the region. Simulations were run for 30 years and results averaged over all c this d. Nitrogen fertiliser applications, which can be varied in the model, were taken as regional averages s y the Technical W g Group. N nce was or the possible interaction between trash presence and nitrogen fertiliser management because there was no evidence that g g n were cu their nit management in response to
General model configuration esent the management and growing conditions of each
e (http://www.nrm.qld.gov.au/silo/index.html
5.3.2.4 Cropp ycle ll scenarios assumed p cy a p
Septem2 months long. Techn
ber at a density of 10 plants/mWork memb
rops simulated during perio
upplied b orkin o allowa made f
rowers in the Maryborou h regio stomising rogen their trash management.
15.3.2.5APSIM-Sugarcane was configured to reprcombination. The configuration included the soil water module SOILWAT2 (Probert et al., 1998), the soil nitrogen module SOILN2 (Probert et al., 1998), the surface residue module RESIDUE2 (Thorburn et al., 2001) and the crop module, SUGARCANE (Keating et al., 1999). The model was run using historical climate data from the nearest long-term climate station for the period 1900 to 2003. The Maryborough station was selected (lat = -25.52, long =152.71) for the simulations and xtracted from the SILO Patch Point database ).
limiting constraints, such as weed competition, e this and try to represent the
ea o increase stalk death when the fresh cane yield
e tion. These yield results were in agreement with the general expectation of the Local
orking Group.
APSIM-Sugarcane does not capture all of the yield-insect damage, waterlogging and severe weather effects. To overcom‘r listic’ yields for the district we set the model thad reached 20 t/ha.
15.3.3 Results As expected the three soil types produced significant differences in maximum fresh cane yields (Figure 10), in line with the soil’s fertility rating and water holding capacity. Adding irrigation increased yields on average by 19 t/ha with the optimum being only marginally better than thlimited irrigaW
70

0 20 40 60 80 10050
75
150Poor / DryGood / Dry
Good / Opt.Good / Lim.
Soil / Irrig.Poor / Opt.Poor / Lim.
Average / DryAverage / Opt.Average / Lim.
100
125
Rea
listic
Can
e Yi
eld
(t/ha
)
0 20 40 60 80 100Trash Removed (%)
0 20 40 60 80 100
eld gation decreasing the impact of trash. There was also an effect
f soil type on the impact of trash removal on yields. Removal of 95% of trash in the dryland
um
ket is removed. If only a fraction of the trash is removed, for example 50%, then the impact on yield is greatly reduced, e.g. ~7.5% on the good and average soils with no
. This regional profitability when optimising the whole-of-
Figure 10. Simulated average effect of trash removal on fresh cane yields across three soils (good, average and poor) and three irrigation regimes (optimum, limited and dry-land) at Maryborough. Cane yields were reduced by the removal of trash. Removing trash had the greatest impact on yiin dryland crops, with increasing irrioscenario reduced yields by ~12% on the poor soil and more than 18 % on the average and good soils. The soil type-irrigation scheduling interaction means that removing trash on a soil with a good water holding capacity and fertility rating can be almost completely compensated by optimirrigation scheduling, whereas on a poor soil, irrigation can only prevent ~50% of the yield lost when the whole trash blan
irrigation could be considered to optimisevalue-chain system for cogeneration. For implementation in the value chain model, the yield results were expressed in relative terms, as yield relative to that with a full trash blanket (Figure 11). Then the curves in Figure 11 were quantified by fitting polynomial regressions into of nine equations, one for each combination of soiland irrigation, to determine the long-term loss in yield switching from a trash retained to trash removed system. The equations (Table 3) were calculated by fitting polynomial regressions to thedata.
71

0 20 40 60 80 10025
20
15
10
5
0
Can
e Yi
eld
Red
uctio
n (%
)
Poor / DryPoor / Opt.Poor / Lim.
Good / DryGood / Opt.Good / Lim.
Soil / Irrig.Average / DryAverage / Opt.Average / Lim.
0 20 40 60 80 100Trash Removed (%)
0 20 40 60 80 100
Figure 11. Reduction in fresh cane yields with increasing trash removal across three soils (good, average and poor) and three irrigation management practices (optimum, limited and dryland). Table 3. Polynomial regression equations of the yield reduction due to trash removal. Soil Irrigation Equation; Y = Yield factor; X = %Trash removed R2
Good Optimum ( ) ( ) ( )6421 10157.310116.110986.9 −−− ×−+××+××= XX 0.919
Good Limited ( ) ( ) ( )6421 10431.910879.110980.9 −−− ×−+××+××= XX 0.990
Good Dry-land ( ) ( ) ( )6421 10831.910379.810981.9 −−− ×−+××−+××= XX 0.999
verage Optimum A ( ) ( ) ( )652110979.9 − ××= 10472.710814.8 −− ×−+××+ XX 0.984
Average Limited ( ) ( ) ( )642 10804.810478.2000.1 −− ×−+××−+×= XX 0.997
Average Dry-land ( ) ( ) ( )5421 10843.110080.310978.9 −−− ×−+××−+××= XX 0.999
Poor Optimum ( ) ( ) ( )6421 10690.310409.310998.9 −−− ×−+××−+××= XX 1.000
oor P ( ) ( ) ( )6421 10031.410925.410997.9 −−− ×−+××−+××= XX Limited 1.000
oor Dry-land ( ) ( ) ( )6421 10914.610578.610992.9 −−− ×−+××−+××= XX P 0.999
15.3.4 References Keating, B.A., Robertson, M.J., Muchow, R.C. and Huth, N.I., 1999. Modelling sugarcane production systems I.
Development and performance of the sugarcane module. Field Crops Res., 61: 253-271. Probert, M.E., Dimes, J.P., Keating, B.A., Dahal, R.C. and Strong, W.M., 1998. APSIM’s water and nitrogen modules
and simulation of the dynamics of water and nitrogen in fallow systems. Agric Syst. 56: 1-28. Thorburn, P.J., Horan, H.L. and Biggs, J.S., 2004. The impact of trash management on sugarcane production and
nitrogen management. Proc. Aust. Soc. Sugar Cane Technol., 26 (on CD). Thorburn, P.J., Meier, E.A. and Probert, M.E, 2005. Modelling nitrogen dynamics in sugarcane systems: Recent
advances and applications. Field Crops Res., 92: 337-352. Thorburn, P. J., Probert M.E. and Robertson, F. A., 2001. Modelling decomposition of sugarcane surface residues with
APSIM-Residue. Field Crops Res., 70: 223-232.
72

Wilson, P.R., 1997. Soils and agricultural suitability of the Childers area, Queensland. Resources Bulletin Series. Queensland Department of Natural Resources, Brisbane.
Wilson, P.R., Anderson, H.M. and Brown, D.M., 1999. Soils and agricultural suitability of the Maryborough-Hervey Bay Area, Queensland. Land Resources Bulletin Series. Queensland Department of Natural Resources, Brisbane.
15.4 Harvester shell model
15.4.1 Introduction Source data for cane yield available to the project were block tonnages measured after harvest at the weighbridge. However, pre-harvest (or in-field) yields were required for the APSIM model so that whole crop yields could be estimated. To bridge this gap a harvester shell model describing the physical performance and losses of a harvester was developed (Figure 12). In this way harvester
sses were added to delivered tonnages to determine base case yield prior to harvest. Similarly for
igure 12. Initial version of Harvest Shell model.
ter shell model divides the machine into its component areas (forward feeding/base-r and extractors) and estimates losses attached to each component area.
know
-up
Chop was used. This is based on BSES Limited
lowhole crop scenarios losses were subtracted from in-field yields (estimated by APSIM) to derive delivered tonnes of biomass. These relationships were applied in the VCM model.
F The harvescutter, topper, choppeFunctional relationships were developed based on trial results, previous research and expert
ledge. These were:
ard feeding loss: A constant forward feeding loss of 1.5 t/ha was used to accouForw nt for pickloss, base-cutter losses and feeding losses. This is based on BSES Limited trial data.
per loss: A constant chopper loss of 4% of billetsresearch from the chopper test rig and assumes an optimised roller-train.
73

ctor cane loss – green cane: Extractor losses foExtra r green cane were calculate using an assumed
fan speed of 1050 rpm from (Norris, pers. comm. 2000),
Cane loss [%] = 0.0334 * ℮0.0048 * fan speed [rpm] ,
s. This equation is based on the collective data set of over ne loss trials.
xtractor cane loss – burnt cane: Extractor losses for burnt cane were assumed to be 0.4%. This e Burdekin during 2002 and 2003 (Mc Donald, Sandell
d report 2003).
s in the arvester to estimate the pre-harvest tonnage of clean cane (billets). Leaf and tops yield were added
to this with empirical data on amount of trash associated with sugarcane (described in the Section
te the clean
under a
timated as above, to estimate delivery rate, time
g the s) when whole crop was taken from the field.
son, pers.
which produces a loss of 5.2% of billetseventy BSES Limited mass balance caEwas assumed from trials data conducted in thand James, Unpublishe
15.4.2 Estimation of pre-harvest biomass Working at the block level, assumed extraneous matter (EM) levels were subtracted from the canedelivered to the mill to derive clean cane delivered to the mill. Extractor losses (for green or burnt, as appropriate) were added to the delivered clean cane tonnages. This was increased by 4% to account for chopper losses and then 1.5 t/ha was added to account for forward losseh
Application of the value chain modelling framework: Block data) to estimate the pre-harvest biomass.
15.4.3 Estimation of biomass available to the system after harvest Once the APSIM modelling estimated steady-state yield of tops, leaf and cane under continued full trash removal the following steps were applied to account for harvesting losses to estimacane available into the transport system:
1. Subtract 1.5 t/ha forward loss; 2. Reduce 1. by 4% chopper loss; 3. No extractor losses were removed – they are turned off under a full trash scenario;
Adding tops, leaf and dirt to this determined the biomass available into the transport systemfull trash removal scenario.
15.4.4 Estimation of delivery rate and the cost of harvest The Harvest Haul Model uses post harvest yields, esperformance, costs and other information. Bulk density drops dramatically between base case to whole crop scenarios and this has large impacts on hauling cane product from the harvester to the mill delivery point – more haul-out capacity is required. Changes were required to the Harvest Haul Model to handle the full trash scenarios. This involved calculating bin volumes for the different size bins and then changin
in haul capacity (in tonneb The volume of each haul-out bin was calculated using the known carrying capacity, the base case EM percentage assumed by each LRG and the following bulk density relationship (Hobcomm.);
bulkdensity [t/m3] = 0.0000682*EM2 - 0.0106*EM + 0.43882.
74

Bin volume was calculated as current bin capacity / bulk density. Haul-out capacity (in tonnes) was calculated for whole crop harvesting using the cane components estimat on and the bin volume calculated above.
ration into value chain
and scheduling tools needed to be developed ojects) to address the transport impacts of the co-generation
e capability to assess the transport impacts of
rush ithout having to aggregate from operational planning and scheduling. This also allows
e model to be fully integrated into the Value Chain Model (as a functional model) without being aff and
ed by the APSIM model, the bulk density equati
15.5 Road transport planning and integmodelling
ithin the Maryborough case study, capacity planning W
within the project (and other prscenario, but also to provide the case study with thother regional change issues. These issues include: 1) reduce transport costs through more efficient scheduling; and 2) increase mill crush rate through a more reliable cane supply. The transport models to perform the analysis were not available to the Maryborough region prior to the project. Two transport models were developed: 1) a strategic level capacity planning model, and 2) a tactical/operational level scheduling model to schedule the pick up of trailers from the farms for delivery to the mill. The main purpose of the strategic model (Figure 13) was to provide an accurate estimate of overall transport impacts/costs due to changes in trash levels, assigned land, mill cate (etc), wr
thrun separately. The model has been validated by Maryborough Sugar Factory stbenchmarked against the operational scheduling model.
Calculation of transport costs in Maryborough
Figure 13. Functional relationships for capacity planning in a road transport system.
Travel time of eachfarm to mill
Tonnes of cane ineach farm
l
Number of vehicle shifts per day
Waiting time atmill
Processing time oftrailer at mil
loading time atthe farm
Number of trailers required
Turn around rateper day of trailers
Averagequeue time for
crush
Costs of Road transport
Number of newtrailers required
Cost ofnew trailers
Number ofexisting trailersTime that trailer
spends at farm beingfilled
Average Trailerweight
Mill crushrate
Season length
Average vehround trip ti
icleme
Trailer pick-upsper day
Proportion of shiftunproductive
Calculation of transport costs in Maryborough
Vehicle shiftlength (hours)
Average distanceto mill Cost per tonne
per km
Base cost ofpickup
Tonnes of cane ineach farm
l
Number of vehicle shifts per dayTravel time of eachfarm to mill
Waiting time atmill
loading time at
Processing time oftrailer at mil
the farm
Number of trailers required
Turn around rateper day of trailers
Averagequeue time for
crush
Costs of Road transport
Number of newtrailers required
Cost ofnew trailers
Number ofexisting trailersTime that trailer
spends at farm beingfilled
Average Trailerweight
Mill crushrate
Season length
Average vehround trip ti
icleme
Trailer pick-upsper day
Proportion of shiftunproductive
Vehicle shiftlength (hours)
Average distanceto mill Cost per tonne
per km
Base cost ofpickup
75
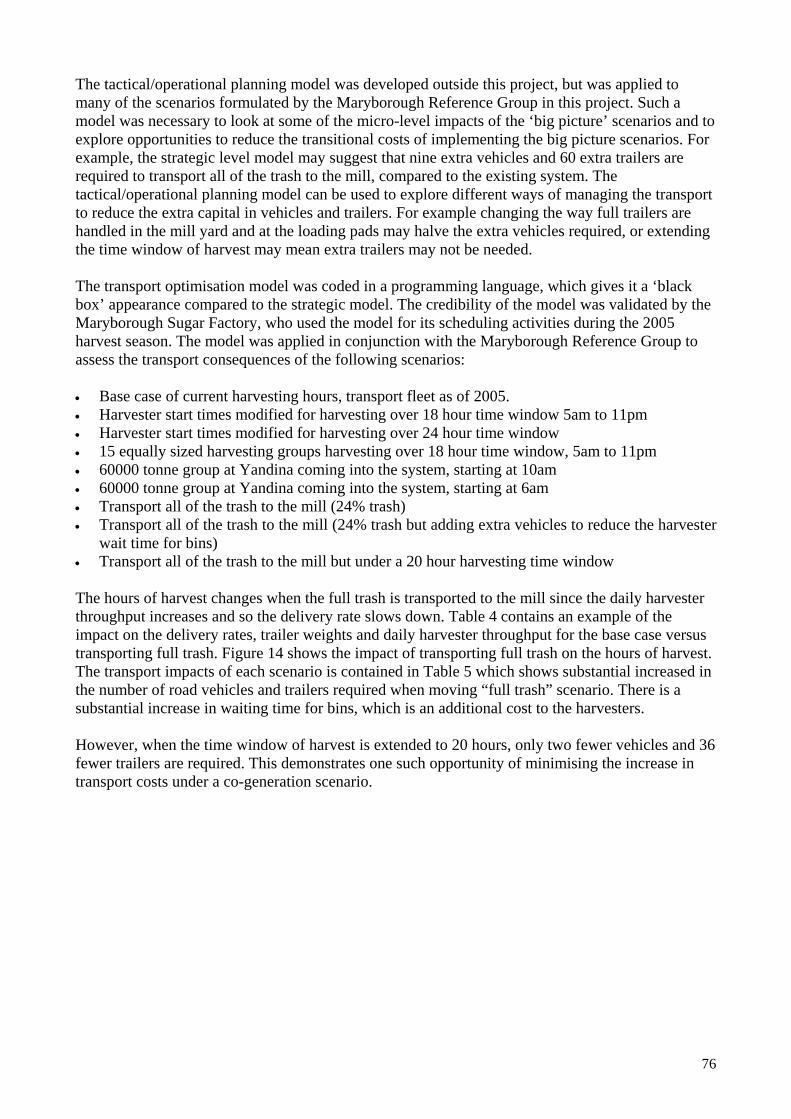
The tactical/operational planning model was developed outside this project, but was applied to roup in this project. Such a
odel was necessary to look at some of the micro-level impacts of the ‘big picture’ scenarios and to
quired to transport all of the trash to the mill, compared to the existing system. The tactical/operational planning model can be used to explore different ways of managing the transport
ailers are han yard and at the loading pads may halve the extra vehicles required, or extending
ay mean extra trailers may not be needed.
the
the harvester
many of the scenarios formulated by the Maryborough Reference Gmexplore opportunities to reduce the transitional costs of implementing the big picture scenarios. For example, the strategic level model may suggest that nine extra vehicles and 60 extra trailers are re
to reduce the extra capital in vehicles and trailers. For example changing the way full trdled in the mill
e window of harvest mthe tim The transport optimisation model was coded in a programming language, which gives it a ‘black box’ appearance compared to the strategic model. The credibility of the model was validated by Maryborough Sugar Factory, who used the model for its scheduling activities during the 2005 harvest season. The model was applied in conjunction with the Maryborough Reference Group to assess the transport consequences of the following scenarios: • Base case of current harvesting hours, transport fleet as of 2005. • Harvester start times modified for harvesting over 18 hour time window 5am to 11pm • Harvester start times modified for harvesting over 24 hour time window • 15 equally sized harvesting groups harvesting over 18 hour time window, 5am to 11pm • 60000 tonne group at Yandina coming into the system, starting at 10am • 60000 tonne group at Yandina coming into the system, starting at 6am • Transport all of the trash to the mill (24% trash) • Transport all of the trash to the mill (24% trash but adding extra vehicles to reduce
wait time for bins) • Transport all of the trash to the mill but under a 20 hour harvesting time window The hours of harvest changes when the full trash is transported to the mill since the daily harvester throughput increases and so the delivery rate slows down. Table 4 contains an example of the impact on the delivery rates, trailer weights and daily harvester throughput for the base case versus transporting full trash. Figure 14 shows the impact of transporting full trash on the hours of harvest. The transport impacts of each scenario is contained in Table 5 which shows substantial increased in the number of road vehicles and trailers required when moving “full trash” scenario. There is a substantial increase in waiting time for bins, which is an additional cost to the harvesters. However, when the time window of harvest is extended to 20 hours, only two fewer vehicles and 36 fewer trailers are required. This demonstrates one such opportunity of minimising the increase in transport costs under a co-generation scenario.
76

Table 4. Example of the impact of trash removal on key parameters for transport model.
Base Case Full Trash
Group Start time RosteredLoads per
dayAverage trailer
weight (t)Trailers per
hourLoads per
dayAverage trailer
weight (t)Trailers per
hour10 5.00 1 24 26.45 2.5 44 18.25 3.3611 6.30 0 16 24.07 2.22 29 16.6112 5.30 0 18 26.13 2.42 35 18.03 3.3313 11.30 1 18 24.65 2.44 36 17.01 3.6114 11.30 1 14 23.46 2.39 27 16.19 3.6115 12.00 1 14 22.97 2.28 26 15.85 3.2916 6.30 1 9 25.64 2.01 17 17.69 2.7817 6.30 1 13 23.34 2.61 25 16.1 3.320 5.00 1 19 29.65 1.85 36
3.09
20.46 2.7521 5.00 1 2 25.5 2.2 4 17.6 2.92
25 23.48 2.1626 20.67 3.42
4 18.24 2.944 16.49 3.46444
22 10.30 1 17 24.23 1.75 31 16.72 2.624 6.00 1 16 24.1 2.22 28 16.63 3.1630 5.00 1 20 24.99 2.06 36 17.24 2.931 7.30 1 8 31.76 1.79 16 21.91 2.4632 12.00 1 8 25.69 2.24 15 17.73 3.0533 10.30 1 8 34.14 1.62 16 23.56 2.4334 6.00 1 7 32.77 1.72 14 22.61 2.535 8.00 1 8 28.3 1.68 16 19.53 2.2736 5.00 1 14 34.03 1.540 6.00 1 13 29.95 2.431 12.00 1 10 26.44 2.13 192 12.00 0 23 23.9 2.34 453 10.30 1 8 33.21 1.87 17 22.91 2.555 13.30 1 10 24.82 2.29 19 17.13 2.99
2 3.227 13.30 1 9 25.1 2.29 18 17.3
Table 5. Example of transport impacts of each scenario.
Scenario VehiclesTrailers
usedTotal delays to harvesters (hrs)
Total vehicle hours
Quick hitches used
Base 24 146 2.1 373 50Base 23 147 9 374 50
Full trash 42 250 30 716 112
Full trash 46 249 14.5 742 113Full trash- 20 hr 44 214 7.1 771 103
77

0
4
8
12
16
20
24
10 11 12 13 14 15 16 17 20 21 22 24 30 31 32 33 34 35 36 40 41 42 43 45 47
Group
Hou
rs o
f har
vest
Figure 14. Hours of harvest for base case (top), full trash transport (bottom).
15.6 Rail transport planning and integration into value chain modelling
15.6.1 Introduction Development of the rail transport component of the value chain model has been undertaken in two stages: 1. Data collection and its appropriate implementation in the cane railway transport scheduling
software ACRSS (Automated Cane Railway Scheduling System). The ACRSS software was used to determine transport operational factors (number of locomotives, shifts, bins etc) associated with a schedule operating within site-specific constraints on infrastructure and cane supply (eg number of sidings, crop size and bulk density etc).
0
4
24
10 11 12 13 14 15 16 17 20 21 22 24 30 31 32 33 34 35 36 40 41 42 43 45 47
Group
Hour
s of
har
vest
20
8
12
16
78

2. The development of a simplified (‘functional’) model to adequately represent factory transport response to changes in the larger whole of Value Chain Model. A financial overlay was
due to changes in the
any proposed venture was modelled ios these all involved whole of
in terms of locos, ines schedules where the harvesting groups do
the siding
ta. The latest factory
CSR. For the purposes of this report, elow) using data relevant
the Invicta cane railway system.
order to model the cane railway transport system, ACRSS requires details of the rail network, the locom
•
•
•
ents and
ined using a trash-in-cane/cane 15). This bulk density figure was
for the various
developed for the transport ‘diamond’ model to determine marginal costs cane supply.
15.6.2 Modelling transport effects using ACRSS For a mill district, the effect on the factory transport system of using ACRSS. For any proposed venture (for the Burdekin scenarcane harvesting), ACRSS was used to determine the effect on the transport systemshifts, cane age and bins. ACRSS, by default, determnot wait for bins; that is the schedules ensure that each group always has empty bins inwhilst the group is in operation.
The Burdekin mill areas considered in this project are Pioneer and Invictransport details for these two mill areas were obtained fromthe procedure to model the effect of any proposed venture is illustrated (bto In
otive fleet, the sidings and operational details. As the levels of trash-in-cane change, the input details that vary are:
Bin weight (average for the mill area). Allotment for the group using the siding. Delivery rate of the group using the siding.
The input sheet for the (Invicta) sidings (2003 data) is shown in Table 6.
For changes in the levels of trash-in-cane, the input parameters of bin weight, allotmdelivery rates were changed in the following manner:
15.6.2.1 Bin weight The bin weight reduction with increasing trash-in-cane was determbulk density relationship utilised in previous SRI studies (Figure then used to determine bin weights and changes in the number of bins required
vels of trash-in-cane. le
79

Table 6. Siding input data used in the ACRSS modelling
Siding Allotment (t) Delivery rate (t/h)
Mill_Yard_1 590 60 Mill_Yard_2 668 70
50
769 72
942 100 Black_Rd_2 995 72
1007 88 4 70
70 200
Sherperd's_Rd 744 70
Mona_Pk_3 843 70
70 Clare_6 895 80
794 70 Mitchell_Rd_4 823 84 Millaroo_2A 933 80 Millaroo_3 720 60 Millaroo_4 144 45 Dalbeg_2 544 60 Dalbeg_4 410 60
Average bin weight 5.6 t
Shirbourne_2 578 Shirbourne_3 672 70
Upper_Hton_1 787 84 Upper_Hton_2 197 84 Upper_Hton4 756 75 McLain_Rd_1 537 60 McLain_Rd_2
Mc_Lain_Rd_4 732 72 McLain_Rd_5 793 68 McLain_Rd_6 942 70 Black_Rd_1
Black_Rd_3 781 78 Black_Rd_4 868 78
Cadio_1 Brown's_Rd__8 45Brown's_Rd__5 622 Brown's_Rd__7 1545
Mona_Pk_1 871 70
Clare_1 765 70 Clare_2 810
Clare_7 876 65 Mulgrave_Rd_2 756 70 Mitchell_Rd_2 823 90 Mitchell_Rd_5
80

0.2
0.
0
0.
0.4
0.45
6 8 10 12 4 16 18 20
Level of trash (%ca pply)
Bul
k de
nsity
(ton
nes.
m-3
)
25
.3
35
2 4 1
ne su
Figure ane bulk density re ship used to determine bin weight.
15.6.2.2 ents The (2003) base case daily crushing rate icta was 26,986 t. This of cane was used to calculat rvesting groups using the sidings. As the level of trash-in-cane changed nts also changed. The procedure to determine the change in the allotments with increasing trash was: 1. From the cane composition (for Invicta) of 3% trash, 5% tops, 1.5% dirt the fraction of clean
billets in the cane supply for the base case was determined (24,422 tonnes).
2. Th illets in (1) is used with the cane loss estimate (2.5%) to determine the total billets equivalent in the field (25,049 tonnes).
3. For Scenario 1 (by way of example), the total billets (25,049 t) plus the cane loss of Scenario 1 (4.1%) was used to determine the quantity of billets sent to the mill (24,022 tonnes).
4. This a f billets calculated in (3 s used with the estimated cane supply composition for Scenario 1 (5% trash, 5% tops, 1.0% dirt) to calculate the total crop sent to the mill. For Scenario 1 the daily cane supply was 26,991 tonnes.
5. The daily cane supply to the mill cAl where Allotment factor = Crop to mill/Base case p to mill,
6. The new allotm or Scenario 1 were determined by applying the Allotment Factor calculated in (5) to the base case allotments i.e Daily allotment = Base case allotment × Allotment factor.
The above procedure was repeated for the other scenarios.
15.6.2.3 very rate The effect on delivery rate with increasing trash-in-cane was estimated g the BSES harvest haul model. Eight harvesting groups typical of Invicta were developed and analysed using the Harvest-haul model. For ex oups the effect of full trash (20% trash-in-cane) on delivery
te was investigated. The average reduction in delivery rate was 75%. This procedure will be repeated in order to determine the effect on delivery rates for the other scenario levels of trash-in-cane.
15. Graph of c lation
Allotmat Inv mass
e the allotments for the ha the allotme
is amount of b
mount o ) wa
alculated in (4) for Scenario 1 was used to calculate an lotment Factor, cro
ents f
Deliusin
ample, for these grra
81

15.6.3 The development of a simplified (‘fthe Value Chain Model
The primary venture to be considered was transpnumber of correlations were developed using ACRSS in which composition were related to key transport capacity then implemented and linked to a financial overlay sheet in the larger shell mthese correlations, a range of trash-in-cane scenarios were deveeffect on the transport system (compared to base case) could be examscenario inputs used in developing correlations for the Invicta mTable 7. Table 7. Cane composition, cane loss and bin weight for scenarios used to
unctional’) model and implementation in
orting trash into the factory for cogeneration. A the effects of differing cane
and operational factors. These correlations were odel. To develop
loped, where for each scenario, the ined. The base case and
ill transport system are presented in
develop shell model
case 1 2 3 4 5 6 7
correlations
15.6.3.1 Scenario Base
Trash (%cane) 3.0 5.0 7.0 10.0 12.0 15.0 17.0 20.0
Tops (%cane) 5.0 5.0 5.0 6.0 6.0 6.0 7.0 7.0
Dir (%cane) 1.5 1.0 1.0 1.0 1.5 1.5 1.5 1.5
e loss (%billet) 2.5 4.1 3.2 2.5 0.9 0.3
t
Can 0.1 0.0
Bin 4.7 4.4 4.1 3.8 3.5 weight (tonnes) 5.6 5.3 5.1
base case (2003) scenario at Invicta represents extensive (95%) burnt cane harvestingThe with
thanot nstant for all the scenarios considered.
correspondingly low levels of trash in the cane supply. The cane loss through the cleaning fans was estimated at 2.5% reflecting the low fan speeds required in burnt cane harvesting conditions. Note
t at this stage the other harvesting losses such as gathering, base cutter and chopper losses were considered as these losses would remain relatively co
Levels of cane loss and trash-in-cane in each scenario were estimated from BSES and CSR data.
Correlations developed for the minimum number (as determined by the optimised ACRSS schedule) of locomotives, shifts and cane bins are shown graphically in Figure 16, Figure 17 and
ure 18 respectively. Fig
82

Figure 16. Graphical representation of correlation (from ACRSS generated data) used in the value
igure 17. Graphical representation of correlation used to determine the minimum number of shifts
Figure 18. Graphical representation of correlation used to determine the minimum number of bins as a function of trash in cane. When implemented in the larger value chain model the minimum values calculated from the correlations are compared with existing rolling stock to determine the additional capacity required to transport trash. In the case of Invicta there are sufficient locomotives to haul the additional bins required for all the additional trash scenarios considered. Additional locomotives therefore do not form a component of the capital cost associated with trash recovery at Invicta.
chain model to determine the minimum number of locomotives as a function of trash in cane.
Fas a function of trash in cane.
0
2
4
6
8
2 4 6 8 10 12 14 16 18 20
Trash (%cane)
Num
ber
of lo
com
10
otiv
es12
02 4
5Num
10
20
6 8 12 16 20
h (%cane
b s
h
15
er o
f
25
ifts
30
10 14 18
Tras )
0
1000
2000
Num
be
3000
2 4 6 8 10 12 14 16 18 20
Trash (%cane)
r
4000
5000
6000
of b
ins
83
Using the above correlations, the component costs assowere determined in the value chain model. The bins and locomotives) and variable costs, these being: • maintenance of cane bins, locomotives and railway lines, • finance of cane bins, locomotives, and • operator labour (pre shift).
15.7 Modelling factory and power plan
ciated with different levels of trash in cane component costs included capital costs (of new cane
t performance for different trash
15.7.1 Introduction odel has focussed on two main
odel to simulate, on a site-specific er and associated costs at participating
n as a function of mill throughput odel is to provide an adequate means of
hole of value chain (or ‘shell’) model.
nd extensively tested using factory data from aryborough Mill. The decision to use Maryborough as the initial test case was dictated by clear
years to simulate all the main actory specific inputs the model
al, operating and direct
urces of data used in this process
Previous SRI consulting reports (milling, factory steam, trash recovery)
e accounting, productivity, cane quality, material rates (cane, sugar, molasses, bagasse, mud), pol and impurity balances etc.
Weekly data – 2003
recovery scenarios
Development of the factory component of the value chain mactivities namely: i) The collection of data and setting up of the SRI factory m
basis, the production of sugar molasses and pow(Maryborough and CSR Burdekin) mills and
ii) The development of a simplified model of factory productioand cane quality. This simplified (or ‘diamond’) mrepresenting factory response in the larger w
The above overall methodology has been developed aMsignals early in the project that factory issues were a priority area for this stakeholder. An identical process and simplified factory model was later applied to the Burdekin Mills.
15.7.2 Factory model development and data collection The SRI factory model has been developed over a number ofprocesses involved in raw sugar production. In response to fpredicts material and energy flows, capacity and associated costs (capitlabour) for all major plant as well as factory revenues. This model has been set up to simulate Maryborough Mill. Soinclude:
For factory configuration o SRI 2002/2003 industry survey o
Maryborough factory records for process and operational details including: o Throughput, tim
•
• Annual totals/ averages - 1999 to 2002 o Statements of fuel quantity and type as well as total and export power generation
from the Office of the Renewable Energy Regulator o Stanwell/ PB Power analysis on Maryborough bagasse
84

Costs
aving implemented all appropriate data the model predictions were validated against factory example purity rise across the
ent between the model predictions and factory records s 3 crushing season. These parameters were then held constant for all
ubsequent simulations. The predicted corresponding molasses and power production for 2003 as ell as those for all factory product streams (sugar, molasses and power) for 2002 and 2001 were in
good agreement with factory productivity records. The comparisons between predicted and
igure 19. Predicted and recorded sugar production for Maryborough Mill.
. Predicted and recorded molasses production for Maryborough Mill.
o Maryborough factory operating maintenance and labour budgets for 2004 o Co-generation (tender documents, consulting, mill costings).
Hproductivity records. Factory specific parameters (such as for clarifier) have been adjusted to give agreemof ugar production for the 200sw
recorded production are shown in Figure 19, Figure 20 and Figure 21.
60000
140000
120000
80000
100000
Tonn
es IP
S
0
20000
40000
2003 2002 2001
Year
F
RecordedPredicted
Figure 20
0
5000
10000
2003 2002 2001
Year
15000
Tonn
es m
o 20000
25000
lass
es
30000
35000Recorded
Predicted
85

12.0
Recorded
igure 21. Predicted and recorded total power production for MaryborouF gh Mill.
odel is also required to predict sts. This latter capability is essential where
ting crushing season are investigated. Maryborough ese have been implemented on a station-
intenance and labour costs which agree with bution of these costs is shown in Figure 22.
In addition to being able to generate accurate revenues the massociated factory operating and maintenance coscenarios involving an extension of the exisMill has provided detailed breakdowns of such costs and thby-station basis to give predicted total operating mathose provided by the mill. The predicted relative distri
0.00
5.00
10.00
15.00
20.00
25.00
30.00
l)
35.00
Weigh & tip
Shredder & mills
Steam boiler & bagasse
Electrical and T/A sets
Instrumentation
Cooling tower & water pumps
Juice handling & heating
Filtration & Clarification
Evaporation
HG pan station
LG & Crystalization
Sugar dryer & bin
Effluent treatment & laboratories
Site & Buildings
Management & data process
Sugar transport
Cos
ts (%
of t
ota
Station
Person. CostsMaint. & Chem. costs
igure 22. Distribution of operating, maintenance and labour costs for Maryborough Mill.
15.7.3 Development of the simplified factory ‘shell’ model The SRI factory model set up as described above has been used to generate data for a series of look-up tables and correlations to predict sugar, molasses and power production at Maryborough Mill as a function of cane quality and throughput. The resulting data have been implemented in a relatively
F
0.0
2.0
4.0
6.0
2003 2002 2001
Year
Ener
gy (G
8.0
10.0
Wh)
Predicted
86

simple spreadsheet model with the object of providing a mlarger whole of value chain shell model.
15.7.3.1 Sugar and molasses predictions A relationship between sugar and molasses production established in the form of look-up tables. The surepresent these relationships. It should be emphasised that thesin any sense and are specific to the current Ma
eans of predicting factory outputs in the
and brix and pol in the cane supply has been rface plots shown in Figure 23 and Figure 24
e relationships are not universal ryborough cane supply and factory operations.
. Surface plot of look-up data used in the shell model to predict sugar recovery at Maryborough mill as a function of brix and pol in mixed cane supply.
Figure 23
12.0
0
12.5
0
13.0
0
14.0
0
15.5
0 16.00
17.0018.00
0.00
2.00
4.00
6.00
8.00
10.00
12.00
Molasses (% cane)
pol (% cane)
brix (% cane)
10.00-12.00
8.00-10.00
6.00-8.00
4.00-6.00
2.00-4.00
0.00-2.00
igure 24. Surface plot of look-up data used in the shell model to predict molasses production at
he use of a more fundamental two-parameter (brix and pol) relationship instead of a single more fects of extraneous
FMaryborough mill as a function of brix and pol in mixed cane supply. Tdirect (trash only) relationship allows additional flexibility in determining the efmatter on sugar and molasses production. Assigning brix and pol values to each component of the cane supply2 allows differentiation between the effects of trash and tops on cane quality. The
2 Brix and pol for tops and trash are taken from the mean of values collated by Ridge D R and Hobson P.A. Analysis of field and factory options for efficient gathering and utilisation of trash from green cane harvesting. Final report –
12.0
0
12.5
0
13.0
0
14.0
0
15.5
0 16.00
17.506.00
7.00
8.00
pol (% cane)
brix (% cane)
9.00
11.00
12.00
Cane/ sugar (mass ratio)
10.00
11.00-12.0010.00-11.009.00-10.008.00-9.007.00-8.006.00-7.00
87

relative proportions of tops and trash vary significantly between harvesting and factory cane separation.
l model in predicting changes to sugar and
comparisons (Figure 25 (a) to (d)) indicated a level of agreement deemed adequate for the purposes sugar and molasses production in response to
The veracity of the factory component of the shelmolasses due to impurities introduced by different extraneous matter components has been tested. The level of both tops and trash in the cane supply was varied for the Maryborough base case conditions and the corresponding predictions of molasses as a percentage of cane supply and cane/ sugar ratio predictions have been compared for both the shell and full SRI factory models. These
of utilising the shell model in identifying trends inchanges in cane quality.
(a) Sugar recovery as a function of tops in cane
7.357.407.457.507.557.607.657.707.757.807.85
2.00 4.00 6.00 8.00Tops (% cane)
Can
e/ s
ugar
(mas
s ra
tio)
Full simulationShell model
(b) Sugar recovery as a function of trash in cane
7.307.407.507.607.707.807.908.008.108.208.30
0.00 5.00 10.00 15.00Trash (% cane)
Can
e/ s
ugar
(mas
s ra
tio)
Full simulation
Shell model
(c) Molasses production as a function of tops in cane
3.45
3.50
3.55
3.60
3.65
3.70
2.00 4.00 6.00 8.00Tops (% cane)
Mol
asse
s (%
can
e)
Full simulation
Shell model
(d) Moalasses protra
duction as a function of sh in cane
3.403.503.603.703.803.904.004.10
0.00 5.00 10.00 15.00Trash (% cane)
Mol
asse
s (%
can
e)
Full simulationShell model
Figure 25. Comparisons of shell and full (SRI) model predictions.
15.7.3.2 Total and export power predictions orrelations were initially developed for predicting total and export power generation at
to
t converting (within the hell model) to an equivalent dry ash free fibre basis (ie subtracting moisture and ash).
CMaryborough Mill as a function of dry, ash-free fuel supply. In reality the fuel whether bagasse ortrash has moisture and ash both of which act simply as fuel diluents. The correlations can be used
etermine the power generation due to a wide range of fuel qualities by firsds A total of 8 correlations were developed for the prediction of power generation in the factory shell model. These correlations cover total and export power for 4 basic scenarios namely:
SRDC project BS157S. September 2000. Brix and pol for the remaining stalk are adjusted to give a total mixed cane supply CCS of 14.02 - equivalent to the 2003 season average at Maryborough.
88

1. Base case conditions for Maryborough Mill without a factory based cane separation plant2. Base cas
e conditions for Maryborough Mill with a factory based cane separation plant
. High pressure and temperature co-generation plant without3 a cane separation plant 4. High pressure and temperature co-generation plant with a cane separation plant The corresponding correlations developed using the SRI factory model are shown in Figure 26to (d)).
((a)
igure 26. Factory shell model - Correlations of electrical energy production per unit mass of fibre as a function of fibre in cane.
6 soon
h both ithin and beyond the crushing season.
ith
F
a) No cane cleaner, low pressure boiler
y = 0.0004x4.4827
y = 15.046x0.8498
0
20
40
60
80
100
120
140
160
180
10 11 12 13 14 15 16 17Fibre (daf %cane)
Elec
tric
al e
nerg
y (k
Wh/
tonn
e)
ExportGrossPower (Export)Power (Gross)
(b) Cane cleaner, low pressure boiler
y = 9.3922x1.0726
y = 307.53Ln(x) - 756.23
-50
0
50
100
150
200
10.00 11.00 12.00 13.00 14.00 15.00 16.00 17.00
Fibre (daf %cane)
Elec
tric
al e
nerg
y (k
Wh/
tonn
e)
ExportGrossPower (Gross)Log. (Export)
(c) No cane cleaner, high pressure boiler)
y = 204.8x0.439
y = 597.97x0.1228
500
550
600
650
700
750
800
850
900
10.00 11.00 12.00 13.00 14.00 15.00 16.00 17.00
Fibre (daf %cane)
Elec
tric
al e
nerg
y (k
Wh/
tonn
e)
ExportGrossPower (Export)Power (Gross)
(d) Cane cleaner, high pressure boiler)
y = 104.04x0.6999
y = 473.51x0.2196
500
550
600
650
700
750
800
850
900
10.00 11.00 12.00 13.00 14.00 15.00 16.00 17.00
Fibre (daf %cane)
Elec
tric
al e
nerg
y (k
Wh/
tonn
e)
ExportGrossPower (Export)Power (Gross)
The limitations associated with the power generation correlations represented by Figure 2became apparent in the early stages of the Maryborough co-generation analysis. As the scenario evolved, interest switched from simple factory integrated co-generation during the crushing season to a more complex scenario involving a stand-alone power plant with out of season power generation and the utilisation of supplementary woodchip, surplus bagasse and cane trasw
This additional complexity was catered for in the shell model by the subsequent development of an object based model (Figure 27 shows the model power generation summary sheet) interfacing wa more comprehensive set of input parameters (Table 8). New power generation capacity and
89

factory modification costs exported by the factory shell model are either supplied directly if available or estimated by scaling from a capital and fixed operating cost database in the model.
similar export
t for the co-eneration project that is exported to the larger value chain model.
in this statement are:
Total co-generation revenues (Export and RECs)
The model calculates total power generation and internal consumption to determine export revenues. A Renewable Energy Certificate (REC) calculator is incorporated into the modelto that issued to mills by the Office of the Renewable Energy Regulator. Revenues frompower and RECs are combined with costs to produce a basic profit and loss statemeng Inherent
Costs due to the use of non-cane derived supplementary fuels (eg woodchip) Cost of trash Fixed O&M costs ($M) Interest on capital charged at 8% Depreciation (linear) over 25 years Tax at a rate of 30% on profit
90

Figure 27. Fuel use, steam and power generation summary sheet from the upgraded factory shell model. The correlations for sugar and molasses production (Figure 19 and Figure 20) as well as the co-generation sheets described above have been implemented in an EXCEL based component shell model and subsequently integrated into the full value chain model. Interfacing with the larger value-chain model is managed through the front-end sheet of the factory shell model is shown in Figure 28.
91

Table 8. Scenario-specific energy related inputs to the factory shell model (Maryborough).
92

Figure 28
. EXCEL® based interface sheet for the factory shell model.