
Joint Baltimore City-CountyTrash TMDL briefing for Baltimore Urban Waters Partnership
1
INTEGRATED URBAN WATER MANAGEMENT IN
LARGE CITIES
A Practical Tool for Assessing Key Water Management Issues
in the Large Cities of the Developing World
Version 2.0 – July 2009
June - 2009

2
PREFACE
This paper was planned in order to advice the bank staff in the key issues and management on Urban waters in developing countries, together with some broad assessment and proposal which could be planned on supporting loans by the bank in cities of these countries.
The paper is organized in seven chapters. The first was planned to present an overview of the urban waters services and main issues and a background on the subject for those which would like to review and understand the integrated view of water management in the cities. In this chapter is presented the overall concepts of the components of urban waters with emphasis on the services and on developing countries. Urban development, social and economic and institutions aspects of the countries are the more important drives in management urban waters as boundaries conditions for a sound management in direction of the Integrated Urban Management (IUWM). This chapter presents these conditions, services, impacts from lack of services and the sustainable solutions.
Second chapter presents the framework of the methodology used in this document. The following chapter presents the first step of the methodology which is how to described the urban area (and country) characterization. Chapter fourth presents the main issues on a specific city by a matrix of potential issues. The following chapter presents a simple procedure based on indicators in order to quantify the issues of a city. Chapter six presents how to identify and present a first estimative of the main strategies for Integrated Urban Management for the city. Chapter seven presents the experience of two case studies which is developed with different level of information.
This document do not intend to cover all scenarios which can be found in this assessment, but should be seen as a first step in construct a comprehensive way in find the a reliable approach to help the cities in developing country in order to construct a modern and long sustainable city.
June/2009.
Carlos E. M. Tucci

3
CONTENTS
11.. IINNTTEEGGRRAATTEE UURRBBAANN WWAATTEERR MMAANNAAGGEEMMEENNTT ((IIUUWWMM)) ......................................................................... 7
1.1 Urban Systems ....................................................................................................................... 7
1.2 Conceptual framework for Integrated Urban Water Management (IUWM) ..................................... 9
1.3 Impacts of Urbanization in developing countries....................................................................... 10
1.4 Historical view of Urban Waters .............................................................................................. 12
1.5 Urban Waters in developing countries ..................................................................................... 15
1.6 Assessment of the urban water services ................................................................................. 17
1.6.1 Water Supply and Sanitation ........................................................................................... 17
1.6.2 Stormwater .................................................................................................................... 23
1.6.3 Total Solids ................................................................................................................... 31
1.6.3 Stormwater pollution ....................................................................................................... 37
1.7 Assessment of the additional impacts ..................................................................................... 40
1.7.1 Water Quality ................................................................................................................. 40
1.7.2 Water related diseases ................................................................................................... 41
1.7.3 Flood plains vulnerability ................................................................................................. 42
1.8 Developed and developing countries comparison ..................................................................... 45
1.9 Institutional Issues ................................................................................................................ 46
1.10 Integrated Urban Waters Management .................................................................................. 47
1.10.1 Goals and targets ......................................................................................................... 47
1.10.2 Plans and Strategies ..................................................................................................... 49
22.. MMEETTHHOODDOOLLOOGGYY................................................................................................................................... 51
2.1 Framework ........................................................................................................................... 51
2.2 Steps of the methodology ...................................................................................................... 52
33.. UURRBBAANN AARREEAA CCHHAARRAACCTTHHEERRIIZZAATTIIOONN ................................................................................................ 54
3.1 Urban area and population. .................................................................................................... 54

4
3.2 Economic, social aspects and institutional ............................................................................... 55
3.3 Urban waters information’s .................................................................................................... 57
44.. IIDDEENNTTIIFFIICCAATTIIOONN OOFF MMAAIINN TTHHEE WWAATTEERR IISSSSUUEESS ............................................................................... 59
4.1 Main Aspects in the IUWM ..................................................................................................... 59
4.2 Framework of the identification an analysis ............................................................................. 62
4.3 Step 1: Mission preparation:................................................................................................... 62
4.4 Step 2: Mission development ................................................................................................. 63
4.5 Step 3: Identification and Analysis .......................................................................................... 64
55.. QQUUAANNTTIITTAATTIIVVEE AASSSSEESSSSMMEENNTT ............................................................................................................ 65
5.1 Spatial discretization ............................................................................................................. 65
5.2 Indicators ............................................................................................................................. 66
5.2.1 Urban development indicators ......................................................................................... 66
5.2.2 Urban waters indicators .................................................................................................. 68
5.2.3 Urban waters impacts and goals indicators ....................................................................... 71
5.3 Assessment ......................................................................................................................... 73
66.. SSTTRRAATTEEGGIIEESS ......................................................................................................................................... 75
6.1 Plans and Strategies ............................................................................................................. 75
6.2 Action Plan ........................................................................................................................... 80
6.2.1 Short – term: Emergency ................................................................................................ 80
6.2.2 Medium – term: in three years ......................................................................................... 81
6.2.3 Long – term: in five years ................................................................................................ 82
6.3 Economic Assessment .......................................................................................................... 82
6.4 Institutional aspects .............................................................................................................................. 83
7. CASE STUDIES...................................................................................................................................... 86
7.1 Jakarta, Indonesia................................................................................................................. 86
7.1.1 Characterization ............................................................................................................. 86
7.1.2 Identification and Analysis of the Issues ........................................................................... 89
7.1.3 Strategies ...................................................................................................................... 96

5
7.1.4 Conclusions ................................................................................................................... 97
7.2 Medellin, Colombia ............................................................................................................... 98
7.2.1 Characterization ............................................................................................................. 98
7.2.2 Identification and Analysis ............................................................................................. 102
7.2.3 Strategies .................................................................................................................... 111
7.2.4 Conclusion .................................................................................................................. 114
8. CONCLUSIONS.................................................................................................................................... 116
AANNNNEEXX AA –– QUALITATIVE MATRIX OF ISSUES (QMI) .......................................................................... 122
A.1 Matrices............................................................................................................................. 122
A.1.1 Planning and Urban Services matrix QMI ....................................................................... 122
A.1.2 Goals matrix issue ....................................................................................................... 133
A.2 Instructions ........................................................................................................................ 136
A.2.1 Plan of the visit in the city ............................................................................................. 136
A.2.1 Instructions ................................................................................................................. 137
AANNNNEEXX BB -- EESSTTIIMMAATTIIOONN OOFF TTHHEE IINNDDIICCAATTOORRSS .................................................................................... 141
B.1 Urban Development indicators ............................................................................................. 141
B.1.1 Population ................................................................................................................... 141
B.1.2 Estimation of Urban Area .............................................................................................. 141
B.1.3 Urban density .............................................................................................................. 141
B.2 Water supply indicators ...................................................................................................... 144
B.2.1 Water demand ............................................................................................................. 144
B.2.2 Water avaliability ......................................................................................................... 144
B.3 Sewage Loads and indexes ................................................................................................. 147
B.4 Urban Drainage indicators (stormwater) ................................................................................ 148
B.4.1 Quantitative Indicator ................................................................................................... 148
B.4.2 Qualitative Indicator ..................................................................................................... 149
B.4.2 Support capacity (Sc) ................................................................................................... 151
B.5 Total solids ........................................................................................................................ 153

6
ANNEX C – COST OF INVESTMENTS AND OPERATION AND MAINTENANCE ................................. 156
C.1 Water Supply and Sanitation ............................................................................................... 156
C.2 Urban Drainage .................................................................................................................. 157
ANNEX D: WATER QUALITY PARAMETERS ....................................................................................... 159
7
11.. IINNTTEEGGRRAATTEE UURRBBAANN WWAATTEERR MMAANNAAGGEEMMEENNTT ((IIUUWWMM))
In this chapter is presented an overview of the main aspects integrating urban development, urban water facilities, impacts on the society and environment for an urban sustainable development as a conceptual umbrella of Integrate Urban Water Management.
The main purpose of this chapter is to introduce the main issues and aspects found in developing countries conditions which would be assessed in order to propose a long term investments and goals in a strategic framework of actions.
1.1 Urban Systems Urban systems are primordially areas of consumption and housing. It is bounded by areas of high population density, sustained by biophysical systems of larger coverage than the urban area (Rees, 2003). An urban system has different sizes or integrates various urban-rural spaces such as a Metropolitan Region.
In 1900, 13% of the global population was urban; in 2007 it increased to 49.4%, occupying only 2.8% of global territory (table 1.1). In 2050 it was forecasted to be 69.6% of the world’s urban population (UN,2009). The world is becoming increasingly urban as result of economic development and jobs distribution. In developed countries the population is stabilized and urban population is already large, but in developing countries the population is still growing and in 2050 the world population will be about 9 billion and most of its grow will be in the cities (UN,2009).
Table 1.1 World Population distribution (UN,2009).
Region
% urban
2007 2025 2050
World 49.4 57.2 69.6 More developed regionsa 74.4 79.0 86.0 Less developed regionsb 43.8 53.2 67.0 Least developed countriesc 27.9 38.1 55.5 Other less developed countriesd 46.5 56.4 70.3 Less developed regions, excluding China 44.1 52.1 65.7 Sub-Saharan Africae 35.9 45.2 60.5
a: Europe, Northern America, Australia, New Zealand and Japan; b- Africa, Asia (excluding Japan), Latin America and Caribbean); c: 34 Africa, 10 Asia, 5 Oceania; 1 Latin America and Caribbean; d comprise the less developed regions excluding the least developed countries; e – all Africa except Northern Africa with Sudan
Urban development accelerated in the second half of the 20th century with the concentration of the population in reduced space. Countries such as Brazil moved from 55% of urban population in 1970 to 83% nowadays, occupying only 0.29 of the country area with a mean urban density1 of 65 persons per hectare (6,500 per km2) (Embrapa,2008). However, the two largest countries in
1 Urban density is the amount of population in the urban areas and population density of a State, Country or region is total population divided by its area.

8
population, India and China are respectively with 29.2% and 42.2% of urban population and are moving up in this urbanization scenario (UN,2009).
Urbanization increases the competition for the same natural resources (air, land and water) in a small space for human needs on living, production and amenities. The environment of natural resources and population (socio-economic and urban) is a living and dynamic being that generates a set of interconnected effects, which if not controlled, can lead the city to a chaos.
Urban sustainable development has been a concept developed in order to cope with the economic and social pressure on the soil occupation with conservation of the natural resources and allowing an overall reasonable sustainable living.
The objective of sustainable urban development is to improve the quality of life of the population as well as environmental conservation. The standard of quality of life is only possible in a well conserved environment which can meet the needs of the population supporting the harmony of man and nature.
The principal components of the urban system are (figure 1.1):
Social and Economic: The social and economic processes are the main drives of the urban development in a country and its cities, since it creates opportunities for job and better living conditions, near to most of the facilities of modern live can deliver.
Land use planning and management: is related to the development of a Master Plan to advice how the city should be occupied and the corrections that need to be made in relation to the past and present;
Infra-structure: Road, water, energy, communication and transportation infrastructure:
planning and management of this infrastructure based on the soil use needs. It can be implanted by public or private agencies, but should be regulated by a municipality;
Figure 1.1 Components of Urban System
Social and
economic
Development
Infra-Structure
Water Facilities
Energy
Transport
Comunications
Urban
Development Plan
Social and
Environmental
Sustainability:
quality of life and conservation
Institutional development: policies, management and
legislation

9
Socio-environmental management: the management of the urban environment is conducted by municipal, state or federal entities, according to the institutional structure. The management involves the evaluation and approval of projects, monitoring, inspection and research so that urban development is socio-environmentally sustainable;
Institutional development: They are the instruments which implement de management by policies, legal framework and management of the cities.
1.2 Conceptual framework for Integrated Urban Water Management (IUWM)
In the urban environment the driving force is the urbanization. Urban water infra-structure generally includes both water supply & sanitation facilities (WSS). Usually Sanitation refers to domestic and industrial sewage collecting and treatment. Usually it does not include urban stormwater or solid waste management systems. Urban water related facilities provided by the cities include water supply, sanitation, stormwater and solid waste. They are components of a sustainable urban environment which includes the environment conservation, health and economic social aspects of the urban development.
The main problem related to the city and its elements has been the fragment way as the management is developed. The urban master plan usually does not take into account all the infra-structures such as urban waters. Urban water facilities are also fragmented, since usually there are not services covering all services by one institution or integrated. The outputs are poor and there are not indicators of efficiency
Urban Water facilities should deliver safe water to the population (water supply), collect and treat the sewage produced by the city before it is delivered back to the rivers, in order to protect environment and its source of waters (conservation for the future) avoiding the spread of diseases (sanitation). Develop stormwater systems for the rain water after the urban occupation and mitigate its effects. Collect the solid waste and its disposal avoiding the spreading of man waste in the natural system by the drainage (solid waste).
As it can be seen the main objectives of these services are related to security (urban drainage flood control), health and environment conservation. Environment in an urban ecosystem are related also to other environment actions in the relation of soil and air which are also related to water management.
Integrated Water Resource Management has been the main tool used to develop sound development of water at basin level. The city is part of a large basin or includes several small basins in its space. The city uses water from upstream in the basin for its supply and sends its effluent to downstream in the basin. These are external components of the city which should be managed together with the main basin which support these boundaries. In urban environment, IUWM is referred to specifically as Integrated Urban Water Management (IUWM).
IUWM includes the management of the water facilities and their interactions (figure 1.2). These interactions include urban development (driver based on economic and social development of the city), environment and health (main goals) and the Institutional components, represented by the legal framework, management, capacity building and monitoring.

10
Figure 1.2 Components of Integrated Urban Water Management (IUWM).
1.3 Impacts of Urbanization in developing countries
The main urban growth has been in the Metropolitan Regions (MR) and in the cities that became regional centers. The MRs has a principal nucleus (primary city) with various neighboring cities (secondary cities, figure 1.3). The growth rate of the nucleus of the MR is small, while the growth of the periphery is very high. In Brazil, cities with more than one million inhabitants grow at an average annual rate of 0.9%, while regional cities with population between 100,000 to 500,000 grow at a rate of 4.8% (IBGE, 1998). All the inadequate processes of urbanization and environmental impact found in the MRs are reproducing in the medium size cities. At world level, cities with populations above 500,000 persons account for 46% of its population. The secondary cities and villages are the interconnection of urban and rural environment and economic of development.
Urbanization increases with economic development, since jobs and incomes changes from agriculture to services and industry, together with the improving facilities for education, shopping, housing and overall facilities. Large cities have been developed since last century such as Metropolitan area of São Paulo in Brazil, which had about 200 thousand inhabitants in the beginning of twenty century and 17 millions in the end of the century, which represented a mean year rate of 8.5%. There are 388 cities in the world greater than 1 million inhabitants (McGranahan and Marcotulio, 2005) and 16 above 10 millions. It was forecasted that in 2010 will be 60 cities with population greater than 5 millions.
There is a strong correlation between population density and economic production, which explain the urban areas as centers of producers, buyers, sellers, firms and workers. The country GDP grows with the population increase in large settlements. High – Income countries have 52% of its population in large settlements (>1 million) and Low – income countries only 11%. When the country grows its GDP the tendency is to decrease the proportion of urban population share of consumption to total population, which is the rural – urban difference (World Bank,2009).
Water
supply
Sanitation
Solid
Waste
Urban
drainage
Water Facilities
Institutional:
legislation and
management
Urban Planning:
Soil use
Goals: Quality of
Live and
Environment
conservation

11
Figure 1.3 Metropolitan Areas (World Bank,2009).
During the past century, urban development created standards of urban concentration. In the large cities, there was a process of urban decentralization in direction of the periphery, leaving the centers of the cities unpopulated and in decline. Difficulties with transportation routes, increased traffic and deterioration in transportation have led to changes of attitude in this process.
In developing countries cities, part of the population lives in irregular or informal areas usually called slum. The growth in slums has been significant, and their increasing density is the cause of concern, since the greatest rate of population growth occurs particularly among the low income population. Slums are overcrowded dwellings of poor quality of low income population which occupy unregulated areas and without property rights. Therefore, there is the formal and the
informal city. Urban management usually reaches the former. This population is lacking most of the services such as water supply, sanitation, drainage and solid waste which develops and environment of spreading diseases. Figure 1.4 shows how the slum grows together with the population and how it decreases when the urbanization is very high. High urbanization is linked to the economic increase of the country/city. Delhi’s in India has 1,160 clusters of slums in a total population of 15.6 million persons (World Banck,2009).
Figure 1.4 Slum grows with the pace of urbanization, and fall with its level (World Bank, 2009).
The main problems related to infrastructure and urbanization in developing countries is:
Large population concentrations in small areas, with inadequate transportation systems, inadequate water supply and sanitation, water, air pollution and flooding. These unsuitable environmental conditions reduce health conditions and the quality of life of the population, cause environmental impacts and are the main limitations for sustainable development;

12
Increase of the city’s boundaries in an uncontrolled manner by rural migration in search of employment. For instance, Manaus in Amazon basin, in Brazil, received of about 40,000 migrants in 2004, attracted by jobs. This occupation occurs on the basins which usually supply the city with risk to contaminate this source. These neighborhoods generally lack security, traditional infrastructure for water, sewage, drainage, transportation and collection of solid waste and are dominated by criminal groups usually linked to drug trafficking.
Urbanization is spontaneous and urban planning is conducted for the portion of the city occupied by the middle and upper income population. The slums are developed by an informal market for public areas or area without control, which is invaded by the poor. Important part of it, are areas of risk such as those with flooding and mudslides, with frequent deaths during rainy periods.
Urban planning is conducted for the formal city, while the informal city is developed by spontaneous way, usually near to the source of jobs or market for low income population.
Limited institutional capacity of the communities with lack on: legislation, law enforcement, maintenance of the facilities, technical support and economical funds. Usually the cities manage the areas of economic income where legislation is enforced and property rights are regulated, called here as regulated city. On the unregulated city usually there are not enough services and facilities for the population. The cities are not prepared to plan and manage this complex human development;
Lack of Integrated Urban Water Management: most of the Water & Sanitation Management in the cities do not take into account all component of Urban Water Facilities, resulting in: interconnection of stormwater and sewers networks, Lack of domestic sewage treatment or inefficient sewage treatment, increase floods on the urban drainage2, losses in the water distribution systems, solids in the drainage, Erosion and occupation of risky areas of flood plains and hill sides (which has been the main causes of deaths during storm events), Limited garbage cleaning and education, among others.
1.4 Historical view of Urban Waters
Agricultural society was formed by small groups or centers that converged on today’s cities. Until the beginning of the 20th century, one of a great challenge in the cities was to avoid the proliferation of diseases, especially those caused by sanitary conditions created by sewage, which contaminated their drinking water sources, creating ideal conditions for the proliferation of infectious diseases.
The supply of water from secure sources and the collection of sewage and its release downstream (without treatment) from the city’s water source, was designed to avoid diseases and their effects, but transferring the impacts downstream. This is called the hygienist phase (table 1.2). Urban growth accelerated after the Second World War, when there was a population explosion known as the “baby boom”. This process was followed by accelerated urbanization,
2 Theses floods are created by the urbanization due to poor outdated engineering, corruptions related to high cost design and lack of institutional measures.

13
leading a high portion of the population to the cities, resulting once again in the collapse of the urban environment due to the non-treated effluents and from air pollution.
To control of these impacts, at the beginning of the 1970’s an important step was taken with the approval of the Clean Water Act in the United States, which impose that all effluents must be treated with the best available technology before it is dispose in rivers. Massive investments were made in residential and industrial sewage treatment, partially allowing a recovery of the water quality in rivers, lakes, reservoirs and along the coast. This actions improved environmental conditions, avoiding the proliferation of disease and the deterioration of drinking water supplies. In this same period, it was found that it was not sustainable to continue the construction of stormwater that increased the flow due to urbanization, such as the channeling of natural rivers and conduits. Attempts were made to revise procedures and use storage systems instead of channeling. This has been denominated the corrective phase of urban waters.
Table 1.2 - Phases of development of urban waters (Tucci, 2007)
Phase Characteristics Consequences
Pre-hygienist: until the beginning of the 20th century.
Sewage flows without collection or treatment and water was taken from the closest source, well or river
Diseases and epidemics, high mortality and flooding.
Hygienist: until 1970 Channel period
Save water, Transport of sewage far from people and channeling of flow
Reduction of diseases, but contamination of rivers, impacts on water sources and flooding.
Corrective: from 1970 – 1990 – storage period
Treatment of residential and industrial sewage, use of storage for stormwater management
Recovery of rivers, with diffuse pollution sources remaining, water projects and environmental impact.
Sustainable development: after 1990; infiltration period
Tertiary treatment; stormwater treatment; source control measures; the efficiency of the services and investments.
Low impact development, Environmental conservation, reduction of flooding and improved quality of life.
Despite these actions, it was found that part of the pollution persisted, due to urban and rural flooding, called pollution from diffuse sources. Since the 1990’s, these countries have invested in sustainable urban development policy based on treatment of urban and rural pluvial waters, conservation and pluvial flow and tertiary treatment of effluents for the removal of nitrogen and phosphorus that cause eutrophication of lakes.
The concept in the land use development is the implementation of urbanization in order to preserve the natural flow path and give priority to infiltration. This phase has been called sustainable development which received many different names in different continents such as Low Impact Development LID (NAHB,2004). The main strategies is developed “upstream” in the

14
planning and design of new areas, changing the traditional “end of pipe” planning and design. In this type of approach, the occupation has to take into account all the facilities and the environment, when land use is planned. Some of its principles and objectives of the sustainable urban development is present in box 1.1.
Box 1.1 Objectives and principles of urban sustainable development
objectives • Social justice and equity based on environmental sustainability;
• Maintenance of the environmental capital; • Rate of use of natural resources do not exceed the rate of reposition of these
resources;
• Rate of pollution emission cannot be greater than the capacity of absorption of natural systems: water, air and soil.
Principles • Conservation of the biodiversity and natural habitats; • Increase the use of public transportation and develop an efficient public
transportation with low gas emission from fossil fuels;
• Rational use of energy in public areas and programs of energy reduction;
• use of material ecologically certificated for construction together with recycle material; • rational use of the water, domestic and industrial treatment of the effluents
waste and priority for reuse; • reduction of garbage by recycling;
• planning the new development taking into account the environment conservation such as infiltration, water ways, soil conservation, reduction of diffusive pollution and preservation of flow of natural conditions;
• develop the preventive risk urban area zoning taking into account natural disasters such as floods and land slide; • use of economic incentives such environment certification in order to implement
the urban sustainability; • promotion of capacity building for decision makers, technical professionals and
population;
• Promotion of the knowledge development of sustainability of urban systems.
Cities in developing countries are found in various stages. Initially, when the population is small, water supply comes from wells or from a nearby body of water. Sewage was released in septic tanks. When the population grows the load increase because of population density (buildings or too many people at the same space), and the septic tanks spill sewage flow through stormwater network until the rivers or, when it does not exist, through streets.
It contaminates river water or groundwater, which are source of drinking water. Usually septic tanks are not efficient for high load, low infiltration capacity or high water table, transferring its load to streets or stormwater pipes, which in the end, flow to the rivers.

15
When the sewage flow through streets until the rivers the urban scenario is previous to the hygienist stage and produced the proliferation of water born disease. In this pre-hygienist stage, diseases such as diarrhea are the principal cause of child mortality.
1.5 Urban Waters in developing countries
Overview
The situation of the urban waters in developing countries is still in the hygienic or pre-hygienic stage as was described in the previous item. Urban development in cities usually is a geographic process, since in most of the cases the city urbanization moves from downstream to upstream in the basin and in coastal cities, from coast to continent.
Water is supplied by sources from upstream basin, neighbor’s basin or groundwater (or combination of these options). After the water is used by the population it is delivered in the streams or treated by septic tanks and delivered into groundwater which may overspill to drainage and rivers. This system of treatment in highly inefficient, leaving a very important load to the rivers and groundwater. In that way, the water from polluted river cannot be used as source for water supply. The water supply and sanitation practice uses clean water upstream (not so
actually!), dumping polluted water downstream. Since the urban development spreads upstream, most of the upstream basin is or will be polluted and the source of clean water lost. In addition, the urbanization could also compete with agriculture for space and for water.
Since the city, in many scenarios, does not have capacity to supply all the water, the population finds its own solution by pumping from groundwater which creates risk of pumping contaminated water (shallow aquifer) or salty (when near to the sea).
The urbanization increases impervious areas and channelization which increases the flood peak and the flood frequency for the same rainfall. The urbanization also increases the flow velocity and solids production (sediments and solid waste). Due to the lack of services, most of the solid waste arrives in the rivers, decreasing its flow capacity (and increase flood frequency) and increasing the pollution since most of storm water pollutions arrives in the rivers together with the solids. Pumping groundwater, together with the reduction of infiltration due to impervious areas, could create subsidence in low lands areas which decreases its drainage capacity by gravity and increase flood frequency. In this scenario the area can be flooded by upstream and by the sea (in coastal cities).
In summary, the urban waters in many developing countries are in a contamination cycle and the main issues are (figure 1.5):
• Contamination of water supply sources (streams and groundwater) by the developments and untreated sewage and diffusion loads. Deterioration of water quality due to lack sewage treatment has created potential risks to the water supply for the population in various conditions, and the most critical has been the occupation of the areas of contribution of urban supply reservoirs which, suffering from eutrophication, present health risks to the population.

16
• Lack of sewage treatment: a large part of the cities do not have sewage network and treatment plants. The sewage is released into storm sewers, which flow to urban streams;
• The urbanization increases the impervious areas which increases floods and decreases the infiltration to aquifers. Impervious areas and channelization of urban rivers, increase flood flow (about seven times) and its frequency, increase the erosion and degraded areas, the amount of solids to downstream affecting the quality of urban streams;
Figure 1.5. Contamination cycle on urban waters in developing countries.
• Occupation of risk areas such flood plain and hill slopes, suffering frequent floods and mudslides with frequent deaths. In Santa Catarina State in Brazil died 110 persons in a sequence of events in November of 2008.
• Water Contamination from stormwater and agricultural areas;
• The use of groundwater from population and the reduction of infiltration increases the land subsidence increasing flood condition to low areas;
• the lack of total solids management decreases the river flow capacity by sedimentations increasing the flood frequency;
The results of all these impacts are the high impact on the basin environment, coastal areas and in the health of the population. The combination of all this factors keeps this metropolitan region in risk for the future. Since the urban area is the economic engine of a country this unsustainable conditions is likely to create an important risk to its development.
Total solids
Water sources: surface and groundwater
Urban areas
Rain
floods Sewer
Storm water pollution

17
Main risks
This condition shows that the source of the problems is the uncontrolled and unsustainable way the urbanization is developed in the city. The main risks are:
I. Population health: some of the risks are:
• the lack of effluent treatment and appropriate solid waste collecting and disposal create an internal source of contamination which could help the spread of many types of diseases or even an epidemic scenario;
• The contamination of water sources such reservoir by nutrients creates the spreading of algae and the risk of toxicity in the water supply;
• spreading diseases related to eutrophication of reservoirs and toxins in the water, in floods events diseases such as leptospirose, hepatitis;
• contamination of groundwater and the water supply of population which uses this type of water;
II. Flood: increase the flood risk, frequency and the damage for the population and mainly for the poor. This vulnerability decreases the economic condition of the region and the country;
III. Environment deterioration: degraded areas by erosion, environments of the river and the coast are decreasing the resilience capacity with so much load deposit in the system. Usually environment put a price on it for the population. The population is
receiving environment subsidy;
IV. Decrease of the Safe water: the lack of safe water upstream and the capacity of distribution will leave no alternative to population, which will try to find out its own way which usually is more risky and it is more expensive. The international price of 1 m3 of safe water in the pipes usually is about US $ 1 to 3. In bottle of 20 liters comes to US$ 200 to 300/m3 and in a bottle of ½ liter in Amsterdam Metro is US$ 7,500/m3;
V. Overall: Population vulnerability is increasing and the resilience to urban waters issues is decreasing with this type of development without sustainability.
1.6 Assessment of the urban water services
The main urban water services are: water supply and sanitation, stormwater (urban drainage) and solid waste.
1.6.1 Water Supply and Sanitation
Background
Water Supply has three components (figure 1.6): (i) water sources and flow regularization; (ii) Water Treatment and (iii) water distribution to the consumers. The main sources are streams and aquifers. Flows from streams vary along the time and usually are regulated by a reservoir in order to meet the designed water supply discharge for the urban settlement. From this water source it is

18
transferred to the water treatment plant and treated before it is distributed to the population. The treatment depends of the water sources quality and conditions. Water from the treatment plant is distributed to the population by a network and regulated by reservoirs in function of the topography. The design of such network, try to use as much as possible the gravity, in order to decrease operational costs.
The key management and design aspects of such systems are: the protection of water sources from contamination, decrease the operational cost of water treatment and distribution, and minimize water lost in the network.
Figure 1.6. Water Supply and Sanitation lay-out.
Sanitation is developed by the following solutions: local and integrated systems. Local solution is when it is collected and treated at the development. This solution is used when the city did not develop a public integrated system for sanitation. Local solution could be: septic tank (infiltration in the soil) or local treatment by individual equipment or device. The issues could be: for septic
tank: when the soil is impervious (clay, for instance) the sewage spills into streets with high chances of contamination of the population. In addition, when the water table is high, the contamination is also high and the efficiency is low; Local treatment can be done for small load and it does not require network, but has maintenance issues due to distributed small size treatment plants. Local sanitation is an unsound solution for medium and large size cities since the sum of the loads can compromise the rivers and aquifers.
Integrate system have also three major components: (i) network of sewage collection, (ii) treatment plan, and effluent disposal. The system starts from the connection of the private effluent to the public services, which is a sewage network (separate system). The main issue is when the city comes from a local sanitation to a network. In this scenario the population resist in connect to the network since they have to pay for the service in comparison to previous conditions where they receive an environment subside.

19
There are many types of treatment plant and levels of treatment. Primary treatment usually is based on reducing the solids, which deals of about 50 – 65% of the BOD (Biochemical Oxygen Demand), secondary treatment which is biological and treat about 80 – 85% of the load of DBO and decreases pathogenic (coliform), but the reduction of phosphorus and nitrogen is small. The reduction is only obtained by tertiary treatment, which is based on filtration. Nitrogen and phosphorus are the main driving of lakes and reservoirs eutrophication.
After the effluent is treated it is disposed in a river or infiltrate in the soil, depending of the conditions of the stream or aquifer capacity to receive it and the environment license. The main issues related to this system are: connection of the building in the system, interconnection of sewage in the stormwater network and vice-versa, which dilutes the load for the treatment plant, operation of treatment plant and the efficiency of the operation, spill of the sewage to the streams without treatment, and lack of capacity of the natural streams.
There is always an optimum size for each condition, in relation to environment, social, political and economic indicators.
Scenarios in developing countries:
There are a few common issues in Water & Sanitation in developing countries, which are described below:
Lack of water supply: The main reasons for the lack of water supply are: (a) limited water sources; (b) limited investment in improving water supply; (c) contamination of the water sources.
There are many cities which have developed in upper part of the basin where the water yield is small. Urbanization has a limited amount of water for supply based in the water yield of the neighborhoods basins, together with other water users. In this scenario water scarcity has two major components: quantitative limit which is the physical limit of the existing water availability and qualitative limit: is deterioration of the water quality, decreasing the safe water. This scenario is critical when large cities are developed in the upper basin (for instance São Paulo in Brazil) or in semi-arid regions where water is the main issue (for instance Los Angeles, USA).
A scenario of contamination and lack of water is under development in many developing countries cities. When the city is small, municipal water supply is developed from a river or an aquifer nearby the supplied city. Local sanitation such as septic tank is often used for sewage, because of the cost and the small load to the environment, since the population concentration is small. As the city increases, the investments in water & sanitation are postponed by the administration and the city lacks water supply and sewage control. Since the development occurs in the municipal basins the water sources are contamined. This process is also aggravated by the illegal occupation of urban areas.
In these scenarios, part of the population with more resources implements deep wells using water from confined aquifers and with better water quality and the poor gets its water from shallow wells or contamined creeks, usually contamined by sewage from the septic tanks or others. The Metropolitan area of Jakarta with 22 million persons has only 50% of its population covered with water supply, the other part uses the wells and the sewage is treated by septic tanks without any efficiency, which leaves the loads in the aquifers and in the urban streams. Together with that, the

20
upstream river which is used for water source is contamined by new development without effluent control.
Lack of Sanitation: In many developing countries the water supply coverage is high (table 1.3), but the sanitation was not developed and the sewage flows through the stormwater networks until the rivers (table 1.3). In the expansion of the urbanization in the basin, the water sources are contamined. In that way, investments are done to find another source far way, but in metropolitan areas there is not “a far way and clean water” and the city starts to reuse part of its contamined water with risk of diseases for the population. Water Supply sources have been contamined in Jakarta and Los Angeles uses 20% of its supply from sewage treated (Duffy, 2008). Brazil during the 70’s was developed a “command-control’ legislation in order to preserve the water supply basin, but it resulted in the other way around (see box 1.2). Usually economic mechanism is more likely to give results in developing countries, were the institutions are weak.
Sanitation statistics of table 1.3 are not realistic for medium and large cities since the concept is based on local solution, but when the city grows, the additive effect of local sanitation is the transference of the impact from a part of the population to another downstream.
Table 1.3 - Proportion of urban population with improved1 water supply
and waste disposal in 2006 (%) (WHO,2008).
Region Water supply2 Waste disposal3
Northern Africa 92 76 Sub-Saharan Africa 82 55
Latin America and Caribbean 92 79 Eastern Asia 90 65 Southern Asia 87 33 Western Asia 90 84
Sub-Saharan countries 58 31 Oceania 50 52
Developed regions 99 99 Developing regions 84 53
1–improved water is a generic term of the water delivered without population contamination. It is not the same as “safe”, which is based on some specific indicators; 2 – water supply is understood as the water for the population; 3 – Waste disposal is understood as the disposal of the waste in a network or in the soil. It does not mean the treatment of the waste.
Bad Investments and management: Network and treatment plants are designed and constructed without connections to the houses because this investment was not planned. Population often does not want the connections because they have to pay for the connection and for the service. Since the institutional arrangement to enforce it was not developed, the investment has not a “cost recovery” and the sewage flow through drainage pipes without treatment to the rivers and the investment is lost. Ghana, after 20 years only 130 connections were made to sewer system designed for 2,000 connections (Wright, 1997).

21
Box 1.2 Legislation for water sources protection in Brazil
The legislation for protecting water sources (basin area) was approved in the 70’s in most of Brazilian States. For each city the potential areas for water supply is an Environment Protected Area, which does not allow any use of land which could change the natural environment.
With the city growth, these areas were under pressure for settlement by neighboring property values and the lack of owner’s interest in protecting the area, since its value dropped as result of legislation. These areas were invaded by low-income population or invited by the owner so as to be able to sell the property to the authorities. Nowadays the most developed and contamined areas are these spaces in most of the cities with the loss of water sources.
The society used a “command-control” measured which is difficult to enforce in a so dynamic land market. The use of an economic mechanism usually is more efficient. Since most of the communities do not have funds do buy the land and even if it has that money it is likely the invasion would occur, by social pressure from the poor on public land. There are two major options: (i) create market for the land by trading permission for construction on valued land by preservation of these areas; or (ii) rent the area as environment service, including the cost in the water price. The increase cost of water price because of the rent is about of 10% (Tucci,2007).
Another unsustainable scenario is when the construction of the sewer network is not followed by construction of treatment plants, the sewage load is concentrated in a section or reach of the main river increases the river local impact. These are some of the issue of fragmented investment without return for the society.
Water Rationalization: water could be scarce due to many issues in the basin. In dealing with scarcity there is a need for water rationalization and improving water services. Some of the consequences of the intermittence of the services in water supply could be the contamination of the pipes, damaging the infra-structure, economic and social impacts on the population.
The main aspects in the supply are:
• Scarcity due to seasonal or internanual flow variation due to climate variability or climate
change. In this scenario the flow regularization (storage) or the assessment of flow risk are not updated and require an improvement. There is a need in reviewing the water yield and reservation from the municipal water basin taking into account the climate change conditions on the hydrologic series and its supply flow; • Demand increase, which can be due to increase of population and/or due to lack of
efficiency or conservation3. Losses in water networks is lack of efficiency of the water service and level of consume is related to conservation. In table 1.4 is presented some data in relation to this condition. It can be seen that in cities of developing countries the non-revenue water is from 16 to 40 %, but with lower consume, but in developed
3 There is a difference in efficiency and conservation. Efficiency is when the services are badly developed with losses in the networks and low treatment of sewage. Conservation is when the resources are better used with decrease in consume of water.

22
countries the scenario is with more efficiency but less conservation. An interesting experience on conservation was developed in New York is described in the box 1.3.
Table 0.4. Water consumption (IBNET,2009)
Place Year Consumption litres / person /day
Non-revenue water1 %
Johannesburg, South Africa 2004 123 31 Fortaleza, Brazil 2007 232 16 Medellin, Colombia 2004 191 33 São Paulo, Brazil 2007 220 36 Sidney, Australia 2007 305 2 Singapore 2008 262 4 Rio de Janeiro, Brazil 2007 204 58
1 – Non-revenue water usually is physical losses and non-payment. Physical losses are related to the hydraulic head of the water distribution.
In sanitation the main lack of efficiency are related to the sewer networks (box 1.4) and the treatment plants. Urban sanitation networks are usually classified as separate or combined pipe networks. In the former, stormwater and sewage pipe networks are separate. In a combined network, sewage and stormwater flows are in the same pipe. The dimension of the flow capacity of a sewer network is smaller than of a stormwater. For instance, for 100,000 persons, with demand of 300 l/day/person and 80% return to sewer, the flow is 0.28m3/s. In the design of sewer networks is assumed that some amount of water will enter the pipes and the value is increased by a factor which may vary from 40 to 200%. It this example the design discharge could be up to 0.56m3/s. That population with a density of occupation of 50 persons/ha4 uses 2,000 ha. The peak flow of about 10 years return period for that area and urbanization is likely to be > 20 m3/s. It can be seen that stormwater design flow to sewage has a relation of 1: 36.
Box 0.3. Rationalization of water use (Marindale and Gleick, 2001)
In the early 90s the city of New York experienced a major water supply crisis and was about to plunge into chaos as the population grew. The city needed more than 90 million gallons (340 million m3) a day, about 7% of the city’s total consumption. The alternative was to spend more than a billion dollars to pump water from the Hudson river, but the city decided to reduce demand.
In 1994, a rationalization programme was launched, with an investment of US$ 295 million, to replace a third of all the city’s toilet installations. Each toilet had a cistern consuming around 5 gallons per flush, and these were replaced with cisterns of 1.6 gallons. On completion of the programme in 1997, 1.33 million cisterns had been replaced in 110 000 buildings, reducing each building’s water consumption by 29%, thereby cutting consumption by 70 to 90 million gallons a day.
When there is a combined system the load has a great variation along the time, mainly on rainy days. This variation is a problem in the operation of treatment plants since the load change along the time and the treatment parameters are changing which decreases its efficiency. In this
4 Person/ha – person per hectar

23
scenario there is a need for reservoirs in order to decrease this variation and improve the efficiency. The other limitation is the odour, vectors of disease in warm climate and during flooding, when overflows occur, there is a high potential for proliferation of some diseases (for instance, leptospirose).
Separate networks avoid part of the above problems, but the experience in developing countries is not good because of a bad management. There are the following scenarios:
• Separate system without drainage: In this scenario the city develops sanitation but did not construct a stormwater network. In this scenario rains water flows by streets until the creeks, which creates frequent floods when the urbanization increases. For instance, in Barranquilla, Colombia the population cannot leave home during rainy days.
• Separate system after the stormwater was developed. Most of the Brazilian cities developed stormwater but did not developed sewer systems. When the sewer network is developed the main difficulties is to find the interconnections of the networks and both have sewage which create the difficulties in the treatment plant and keep the rivers polluted.
Lack of stream capacity: Large cities have been developed in upstream basins where there is a lack of water yield and low capacity for dilution of the effluents. In this scenario even with the standard treatment of effluents the stream will be polluted and the city will have lack of water supply. The solution has been to move to neighborhoods’ basin for water supply or dispose, but the spreading of urban development is creating another problem since these basins will also need its own resources.
The standard design of collect clean water upstream and dispose treated water downstream are not realistic. It has to be changed for more sustainable solutions by: (i) increasing the efficiency of the services in reducing water supply losses; (ii) decrease the demand and (iii) reuse of the water with less treated volume and effluent to dispose in streams.
1.6.2 Stormwater
Background:
There are two main types of urban floods: (i) in the stormwater system, known also as local floods; (ii) natural events in the flood plains of a major river which cross the city.
Floods in stormwater may occur in the following situations: the rainfall is greater than the network design capacity; the urban development increases the peak flood; blockage of the network conveyance by sediments or others devices, among others conditions. In the stormwater the main issues are related to transference of impacts from upstream to downstream.
Floods Plain impacts are related to the occupation of the existing flood risk areas. Floods frequency may change along the time and population fill safe and occupy these areas. When the flood occurs the damages are higher. This subject is presented in the item 1.7.3.
Stormwater facilities are developed in order to allow the rain water flow in the urban environment. Urbanization changes the natural space with impervious surfaces such as roofs, walkways,

streets, among others (figure 1.7development, flows through impervious surfaces until gutters, pthan before. These two main changes in hydrologic cycleflow velocity, results in the following effects on the urban drainage
• Volume of the hydrographsshows the hydrographs before and after urbanization). The overland flow volume increases from about 5 to 15% of the rainfall to more than 60%. Peak flow increases from 3 to 7 times the discharge from natural conditions. These increases usually results in floods since the flow capacity of the channel do not change;
Figure 1.7 Change of soil use due to urban development
Figure 1.8 Hydrograph from natural basin and urbanized
• Decrease the evapotranspiration• Increase the amount of total solids
increase with the constructions and defresulted from the lack of housing collecting waste and street services. Surban areas are deposited in the river channels, decreasing its conveyance flow
5 Hydrographs is the variation of the flow along the time in a river section6 Total solids are defined as: sediments and solid waste from the population.7 conveyance is the flow capacity in a river section
Vazão Flow
24
(figure 1.7). The water which use to infiltrate in the soil, after the impervious surfaces until gutters, pipes, channels with speed higher
These two main changes in hydrologic cycle: increase of the impervious areas and following effects on the urban drainage:
raphs5: increase on overland flow and peak dischargeshows the hydrographs before and after urbanization). The overland flow volume increases from about 5 to 15% of the rainfall to more than 60%. Peak flow increases from
rge from natural conditions. These increases usually results in floods since the flow capacity of the channel do not change;
Change of soil use due to urban development.
Hydrograph from natural basin and urbanized.
Decrease the evapotranspiration, infiltration and the groundwater flow; Increase the amount of total solids6 in the drainage. The sediments in the drainage increase with the constructions and deforestation of the basin. Solid waste is mainly
ck of housing collecting waste and street services. Solids produced in deposited in the river channels, decreasing its conveyance flow
Hydrographs is the variation of the flow along the time in a river section solids are defined as: sediments and solid waste from the population.
veyance is the flow capacity in a river section
Tempo
rural
urbanizada urban
time
to infiltrate in the soil, after the ipes, channels with speed higher
the impervious areas and
: increase on overland flow and peak discharge (figure 1.8 shows the hydrographs before and after urbanization). The overland flow volume increases from about 5 to 15% of the rainfall to more than 60%. Peak flow increases from
rge from natural conditions. These increases usually results in
in the drainage. The sediments in the drainage . Solid waste is mainly
olids produced in deposited in the river channels, decreasing its conveyance flow7;

25
• Water quality degradation by washing urban surfaces: Degradation of the Water quality when the rain water washes the urban surfaces taking the substances deposited in the urban surfaces. Usually stormwater has metals concentration.
Urban development can also create obstructions to runoff, such as sanitary landfills, bridges, inadequate drainage, obstructions of runoff conduits and clogging.
The connection of flow increase and urbanization can be done by the flow coefficient8. It increases with impervious areas as it can be seen in figure 1.9 with data from Brazil and USA. There is a relationship between impervious area and urban density (urban development indicator). This relationship changes with the characteristics of the urban density as can be seen in the figure 1.10 for US and Brazilian cities.
Management of stormwater
The peak and volume increase in the urban basin, which results in hydrograph increase (figure 1.11 and 1.12) and floods at downstream reaches were the capacity of the flow is not enough to cope with the upstream urbanization and flow increase. Urbanization usually is from downstream to upstream as shown in figure 1.13 and the existing population pays the price (on floods) for the new development upstream. The population which creates the problem does not suffer from it. In that way there is a need for public management in order to cope with transference of impacts.
Figure 1.9 Flow coefficient and impervious areas.
Flood management policies in most of the developing countries are not adequate to minimize this type of problem, since the solutions often used, increase flow capacity by pipes and canals. This outdated design assumes the water has to be send to downstream as fast as possible (increase flow capacity), which increases the velocity of flow and transfer the floods to downstream areas. Canals usually are developed in the major drainage and pipes in the secondary drainage network. This type of solution only transfers the flood problem from one section of the basin to
8 Flow coefficient is the total flow divided by total rainfall.
0
0,2
0,4
0,6
0,8
1
1,2
0 20 40 60 80 100 120
impervious area (%)
C
USA
Brazil

another, with high costs. In addition, twater with a larger amount of solids and load of metals and other toxic components.
Figure 1.10 Urban density versus impervious area (data sources: Heaney et al, 1997, Tucci
Figure 1.11: The development was implemented and the flood peak increases.
0
10
20
30
40
50
60
70
80
90
100
0 20
Imp
erv
iou
s a
rea
(%
)
26
another, with high costs. In addition, the water quality impact is high, since the overflow is of water with a larger amount of solids and load of metals and other toxic components.
Urban density versus impervious area (data sources: Heaney et al, 1997, Tucci
and Campana (1996).
: The development was implemented and the flood peak increases.
20 40 60 80 100 120
urban density (person/hectar)
Ontario
New Jersey 567 municipalities
APWA
Washinton
Curitiba-S.Paulo-P.Alegre Brazil
, since the overflow is of
Urban density versus impervious area (data sources: Heaney et al, 1997, Tucci
: The development was implemented and the flood peak increases.
120

Figure 1.12 Increase of the Flow for the same rainfall for different levels of development in
Ochiai in Japan (Yoshimoto e Suetsugi,1990).
Figure 1.13 Increase flow level downstream with new developments
This process is illustrated in a sequence in figure 1.14the stage when there are floods at section A and not in B. The fragmented solution, usually used in the cities, increases channel capacity by reaches. In this examplecapacity of the channel in a short reach from A to Bsection B (scenario 1.14b). This is done because most of the time the manager does not have the concept of managing the basin and develops its project only by reaches, transferring the pfrom a part of the population to another. This management could create a potential responsibiof the damage by the municipalityby the city when the flood is transferred. Even if the
27
Increase of the Flow for the same rainfall for different levels of development in
Ochiai in Japan (Yoshimoto e Suetsugi,1990).
Increase flow level downstream with new developments
ted in a sequence in figure 1.14. The hydrographs of figure 1.14the stage when there are floods at section A and not in B. The fragmented solution, usually used in the cities, increases channel capacity by reaches. In this example, there is an increase
short reach from A to B. When it is done, the flood is transfeb). This is done because most of the time the manager does not have the
concept of managing the basin and develops its project only by reaches, transferring the pfrom a part of the population to another. This management could create a potential responsibiof the damage by the municipality administration, since the main causes of the floods is created
when the flood is transferred. Even if the municipality does not construct the channel
Increase of the Flow for the same rainfall for different levels of development in
Increase flow level downstream with new developments
The hydrographs of figure 1.14a shows the stage when there are floods at section A and not in B. The fragmented solution, usually used
, there is an increase the flood is transferred to
b). This is done because most of the time the manager does not have the concept of managing the basin and develops its project only by reaches, transferring the problem from a part of the population to another. This management could create a potential responsibility
administration, since the main causes of the floods is created municipality does not construct the channel

28
the public administration is responsible by the damage, since it approved the individual project without controlling the flow.
a–first stage the flood is occurring in A b–a channel was constructed to cope with the flood in A and the flood is transferred to B
Figure 1.14. Transference of Floods by bad management.
The cities in developing countries usually are short of money for investments and when they invest in urban drainage, this sequence showed that it is done in the wrong way, creating more problems than they had before, with loss of public money.
Sustainable management principles
The reliable experience in flood control of many countries has now led to some main principles in urban drainage management, which are:
• Flood control evaluation should be done in the whole basin and not only in specific flow sections;
• Urban drainage control scenarios should take into account future city developments;
• Flood control measures should not transfer the flood impact to downstream reaches, giving priority to source control measures such detention (storage) and infiltration;
• For new development, the priorities of sustainable solutions are to keep the natural functions of land and aquatic systems such as infiltration;
• The impact caused by urban surface wash-off and others related to urban drainage water quality should be reduced;
• More emphasis should be given to non-structural measures such the regulation, capacity building and other prevention programs;
• Management of the control starts with the implementation of Urban Drainage Master Plan in the municipality;
A
B
A
B
A
B
Q
t
A
B
t

29
• Public participation in the urban drainage management should be increased;
The development of the urban drainage should be based on the cost recovery investments.
Measures for urban drainage planning and design
The measures for urban drainage can be selected by the stage of the urban development. When the city is already established, the main objective is to correct the existing impacts or re-naturalized the river systems. In order to correct the existing problems the practice is to use measures at minor and major drainage. The re-naturalization requires more funds and wiliness since all aspects of urban waters have to be developed.
When the city is in its planning stage, the sustainable development of urban spaces is the best choice, since all the implementation moves in the direction to preserve the natural functions of the land and aquatic systems. In this scenario the source control measures are the recommended.
The measures can be classified by scale of interventions are:
Source control measures: there are measures inside of a development such a plot, shopping center, parking lot, parks, etc.;
Minor or major drainage: the measures used when in a basin or sub-basin scale of more than one development. It can be in size of small basin only with pipes or a major drainage of urban creeks.
The measures can also be classified by the way it affect the hydrograph of a basin. The main measures are:
Infiltration and percolation: This type of solution decreases the overland flow and the stormwater recovering the land infiltration, delaying the flow and decreasing the peak flow. Since urban development requires impervious areas, the infiltration can be recovered by using a combination of storage and infiltration of the left pervious surfaces.
Storage: temporary storage of the water can be developed in order to damp the peak flow. Figure 1.15 shows the hydrograph of natural basin, the potential hydrograph after urbanization and the hydrograph after the flow is dumped by the reservoir.
Increase flow conveyance: This is the measure often used in the unsound urban drainage of transferring impacts. Increasing the flow capacity of a section by a pipe, channel or increasing the natural flow conditions of a river by changing its sections or by decreasing flow slope. Sometimes this measure is required to transfer the hydrograph to a reservoir or to a section which supports the volume and peak increase;
Dike or pump station: this is a solution for a very specific area and flood conditions of urban areas.
Stormwater Plan
The framework of a Stormwater Plan is presented in figure 1.16 where the Policies are related to objectives, principles (see above) and strategies: urban development, water, sanitation and solids interface and risk assessment. The assessment identify the existing problems of floods and institutional in the city. From that is possible to develop solutions in two major lines of actions:

Non-structural measures:
stormwater. These are: regulation of consprivate to public areas; constructions sites management; water quality and erosion regulation; proposal for the public institutions management and development of the utility for stormwater and cost recovery. Thfuture development of the city and its management.
Figure 1.15 Hydrographs of natural conditions, after the development with impervious
areas and after the reservoir is constructed.
Figure 1.16
Structural measures: In the assessment were indentified the flood issues in the city. In order to solve these issues there is a need to develop a Stormwater Plan for each basin in
Flow
Rainfall
after development
Reservoir volume
30
structural measures: which are the legal and institutions aspects of the city stormwater. These are: regulation of constructions permits to avoid flow increase from private to public areas; constructions sites management; water quality and erosion regulation; proposal for the public institutions management and development of the utility for stormwater and cost recovery. The non-structural measures are mainly applied for the future development of the city and its management.
Hydrographs of natural conditions, after the development with impervious
areas and after the reservoir is constructed.
Figure 1.16 Framework of Stormwater Plan.
In the assessment were indentified the flood issues in the city. In order to solve these issues there is a need to develop a Stormwater Plan for each basin in
Time
natural
after development
After reservoir
natural
which are the legal and institutions aspects of the city tructions permits to avoid flow increase from
private to public areas; constructions sites management; water quality and erosion regulation; proposal for the public institutions management and development of the utility
structural measures are mainly applied for the
Hydrographs of natural conditions, after the development with impervious
In the assessment were indentified the flood issues in the city. In order to solve these issues there is a need to develop a Stormwater Plan for each basin in

31
the city in order to implement the solutions mentioned above. The Plan is design to eliminate the flood events for a risk (return period) taking into account the environment and economical assessment of the works planned. The structural measures are used to solve the existing impacts in the city.
The main outputs of the Plan are: Regulation of the stormwater for future development, economical sustainable management of the stormwater, plan of actions for each basin in the city to be implemented with its cost recovery, stormwater manual and a long term program for land and environment recovery.
1.6.3 Total Solids
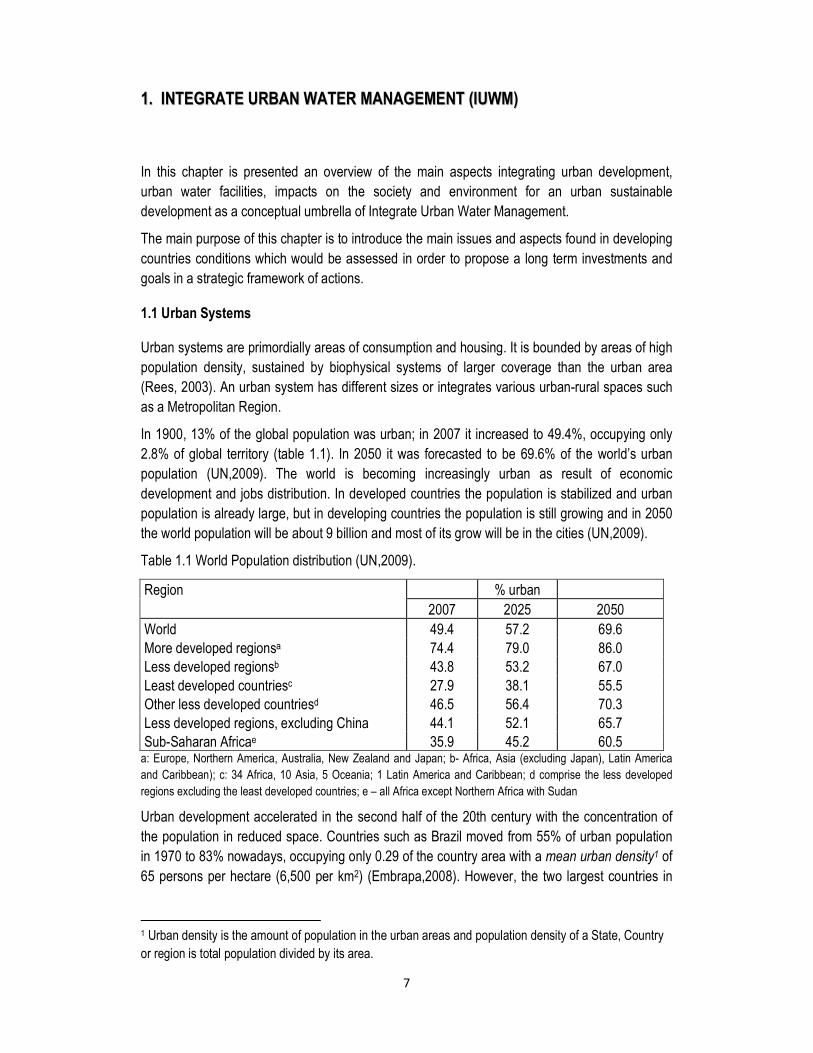
The types of solids produced in the urban environment are: (a) sediments and vegetation produced by rainfall and erosion (flow velocity) along the basin; (b) solid waste: residuals generated by the population such as plastic, papers and others. In the urban surface street cleaning, vegetation and sediments are collected together with the solid waste. Solids are important source of loads to the river systems since organic and chemicals arrives in the aquatic system aggregate to the solids. In addition, there are many types of garbage which take too long to disappear in the environment such as plastic.
In the urban development there are two main stages of total solids production which changes the source of the solids along the urban development (figure 1.17):
Figure 1.17 Sediment Concentration from urban basin along its development (Dawdy,1967)
(a) In the beginning of the developments there is a large amount of sediment as compared to the natural conditions because of the urban implementation and deforestation. The energy from the rainfall intensity and high water velocity, resulted from the overland flow from impervious areas, increases soil erosion and transport more sediments and vegetation to the urban creeks, creating degraded areas by erosion. Sedimentation of

32
the creeks decreases the conveyance capacity, increasing the flood frequency and magnitude;
(b) After the urbanization is settled, the sediments are still the main volumes, but the solids waste increases mainly due to human activities and lack of efficiency on the services of street cleaning and waste collecting together with low population education.
Urban sediments
Soil erosion in urban environment could be important in the following conditions: (a) high slopes and lack of drainage could destroy houses and jeopardy lives (1.18 a); (b) unprotected surfaces increases laminar erosion increasing the amount of sediments flow (figure 1.18b); (c) increase flow velocity from impervious surfaces, pipes and channels without hydraulic dissipation leads an increase of degraded area. Velocity and flow increases because of impervious areas and the constructed storm drainage. If this discharges flows into a downstream natural channel without energy dissipation, the erosion will occur creating a degraded area (1.18c); (d) high erosion rates in channels can affect the sewer or stormwater networks which are nearby the natural water systems.
(a) House in hill slope (source: Nereu de Almeida Data bank RBS Agency 12-10-2000)
(b) Laminar erosion in street (b) erosion from velocity increase (source: eng. Luiz Orsini) (source: prof. Nestor Campana)
Figure 1.18 Erosion in urban environment
Table 1.5 shows the amount of sediment dredge from some urban rivers in Brazil. It represents an important maintenance cost for the municipalities on dredging and disposal of these solids, in

33
order to maintain the conveyance of the natural and constructed drainage networks. Taking into account the volumes of table 1.5 the cost may vary from U$2-12 thousands.km-2.year-1. The overall public is paying through the municipality part of the cost of the new developments in the city when the urbanization does not manage the sediments produced during the construction phases.
Table 1.5 Volume of sediment yield in some urban basins
River and city Characteristics of the source
Volume m3. km-2.year-1
Reference
Tietê River in São Paulo Dredge sediment 393 Nakae e Brighetti (1993) Tietê River tributaries in São Paulo.
Bed sediment 1400 Lloret Ramos et al. (1993)
Pampulha Lake in B. Horizonte
Sediments from 1957 to 1994
2436 Oliveira e Baptista (1997)
Dilúvio Creek in Porto Alegre
Dredge sediment 750 DEP (1993)
The suspended sediment yields of some urban basins in Curitiba at different stages of urbanization are presented in figure 1.19. Atuba Basin was in urbanization, showing highest values of concentration for the same specific discharge. Palmital was a basin where the urban development was lower than Atuba and Pequeno was rural basin in most of its area. The main difference of the curves could be seen as the specific discharges increases together with concentration for urbanized areas.
1
10
100
1000
10000
0 0,01 0,02 0,03 0,04 0,05
q, m3 s-1km
-2
Concentration
mg.l-1
Palmital Atuba Pequeno
Atuba
Figure 1.19 - Suspended sediment concentration as a function of the specific
discharge for some Curitiba basins, Atuba (15% of impervious area); Palmital (7% of
impervious area) and Pequeno (almost rural) (Tucci and Porto, 2001).

34
Solid waste
Solid waste in an urban environment is the sum of the following terms:
TR = Tc + Tl + Tdr (1.1)
where TR = solid waste in volume or weight produced in a period of time; Tc is the amount collected in buildings; Tl is the total obtained by the street cleaning; Tdr is the amount arrived in the drainage. Table 1.6 shows sources and types of solid waste found in urban environment.
Table 1.6 Sources and types of solid wastes (Hoornweg and Thomas, 1999)
Source Typical waste generators Types of solid wastes Residential
Single and multi-family dwellings Food wastes, paper, cardboard, plastics, textiles, leather, yard wastes, wood,
glass, metals, ashes, special wastes (e.g. bulky items, consumer electronics, white
goods, batteries, oil, tyres), and household hazardous wastes
Industrial
Light and heavy manufacturing, construction sites, power and
chemical plants
Housekeeping wastes, packaging, food wastes, construction and fabrication,
demolition materials, hazardous wastes, ashes, special wastes
Commercial
Stores, hotels, restaurants, markets, office buildings, etc
Paper, cardboard, plastics, wood, food wastes, glass, metals, special wastes,
hazardous wastes Institutional
Schools, hospitals, prisons, government centres
Same as commercial
Construction and demolition
New construction sites, road repair, renovation sites, demolition of buildings
Wood, steel, concrete, dirt, etc.
Municipal services
Street cleaning, landscaping, parks, beaches and other
recreational areas; sludge water and wastewater treatment plants
Street sweepings; landscape and tree trimmings; general wastes from parks, beaches and other recreational areas
Process
Heavy and light manufacturing, refineries, chemical plants,
power plants, mineral extraction and processing
Industrial process wastes, scrap materials, off-specification products, slag,
tailings
TR increases with the population income, which requires more efficiency in managing the first two terms of right hand side in order to have a minimum value for Tdr, which has higher cost of cleaning and impact on the environment and in the flood frequency.
The management efficiency of the members Tc (collecting) and Tl (cleaning) of the equation 1.1 are based on: (a) population education; (b) coverage of the waste collecting and frequency. In
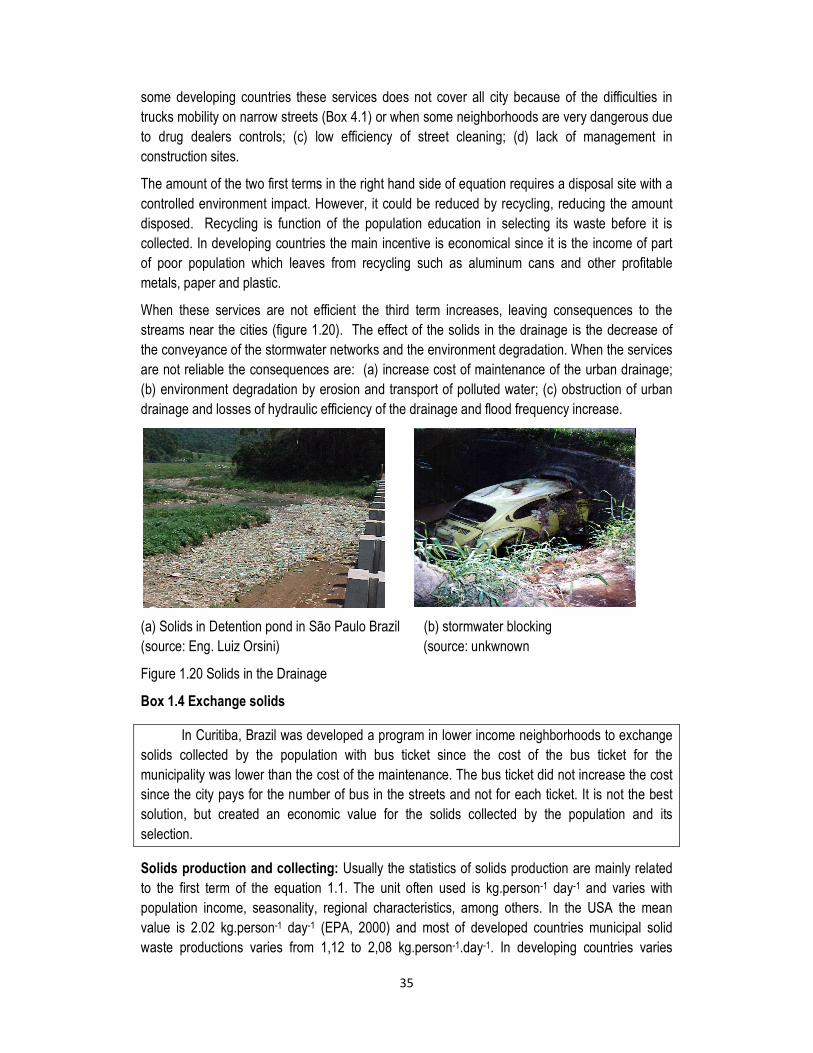
35
some developing countries these services does not cover all city because of the difficulties in trucks mobility on narrow streets (Box 4.1) or when some neighborhoods are very dangerous due to drug dealers controls; (c) low efficiency of street cleaning; (d) lack of management in construction sites.
The amount of the two first terms in the right hand side of equation requires a disposal site with a controlled environment impact. However, it could be reduced by recycling, reducing the amount disposed. Recycling is function of the population education in selecting its waste before it is collected. In developing countries the main incentive is economical since it is the income of part of poor population which leaves from recycling such as aluminum cans and other profitable metals, paper and plastic.
When these services are not efficient the third term increases, leaving consequences to the streams near the cities (figure 1.20). The effect of the solids in the drainage is the decrease of the conveyance of the stormwater networks and the environment degradation. When the services are not reliable the consequences are: (a) increase cost of maintenance of the urban drainage; (b) environment degradation by erosion and transport of polluted water; (c) obstruction of urban drainage and losses of hydraulic efficiency of the drainage and flood frequency increase.
(a) Solids in Detention pond in São Paulo Brazil (b) stormwater blocking (source: Eng. Luiz Orsini) (source: unkwnown
Figure 1.20 Solids in the Drainage
Box 1.4 Exchange solids
In Curitiba, Brazil was developed a program in lower income neighborhoods to exchange solids collected by the population with bus ticket since the cost of the bus ticket for the municipality was lower than the cost of the maintenance. The bus ticket did not increase the cost since the city pays for the number of bus in the streets and not for each ticket. It is not the best solution, but created an economic value for the solids collected by the population and its selection.
Solids production and collecting: Usually the statistics of solids production are mainly related to the first term of the equation 1.1. The unit often used is kg.person-1 day-1 and varies with population income, seasonality, regional characteristics, among others. In the USA the mean value is 2.02 kg.person-1 day-1 (EPA, 2000) and most of developed countries municipal solid waste productions varies from 1,12 to 2,08 kg.person-1.day-1. In developing countries varies

36
between 0.5 to 1 kg.person-1 day-1. For instance in Brazil it 0.74 kg.person-1 day-1 (IBAM,2001). These numbers increases with social and economic development and new products.
An important source of solid waste is the constructions sites and waste generated by cleaning, lawns and others. Part of this volume is unregulated disposed and could affect the drainage, mainly in areas of poor population and when the service of collecting of this waste is done by this population.
The solids recycle has been improved by education, economic incentives and enforcement. In developing countries solids recycle increases (reducing the waste in the drainage) when it has economic value since it is an occupation of part of the low income population. Aluminum cans have high rate of recycling (> 80%), but some types of plastic does not have economical value for recycle. In Brazil, the plastic content increased in last year, but organic matter still represents from 30 to 70%, paper 25 to 50%, metal, glass and plastic are about 10%. Plastic has been the solids most found in the environment and in the stormwater. It represented 59% of the collected waste in the cleaning coast program (EPA, 2004). In cities of South Africa, Australia and New Zeland, Marais and Armitage (2004) reported that plastic is the main solid waste found in the drainage. Improving the regulation in the use of these materials could decrease the amount of solids in the drainage.
Street Cleaning and drainage: Street cleaning is strongly dependent on the cleaning frequency in public area, education and rainy days. Armitage et al (1998) mentioned that in a area of 299 ha, with 85% of commercial and industrial area, 82.5% is cleaned by the service and 17.5% reaches the drainage. After the street cleaning resulted 0.8 kg.person-1 year-1 in the storm network of San Jose, Ca, USA (Larger et al, 1977).
A summary of the solids in drainage in some countries is presented in table 1.7. There is a large variability of these data because of other factors interconnected such as type of urbanization, efficiency of the services of collecting, street cleaning, site and urbanization regulation in order to control erosion and population education.
Table 1.7 - Total solids in the drainage
Area description Weight Kg. ha-1.year-1
Volume 10-3 m3.ha-1.year-1
Springs, South Africa , 299 ha is 85% is commercial and industrial e 15% is residential1.
67 0.71
Johannesburg – downtown – 8 km2, commercial, industrial and residential1.
48 0.50
Sidney, Australia 322,5 ha, commercial, industrial and residential.
22 0.23
Auckland – New Zealand Residential 5,2 ha Commercial 7,2ha Industrial 5,3ha
2.8 61.7% 26.1% 12.2%
0.029
Cape Town – downtown with 96% residential, 5% industrial3.
18 0.08
1 ARMITAGE et al. (1998) - 2 - ALLISON et al. (1998b) – 3 - ARNOLD and RYAN (1999)

37
Types of Drainage Solids: The composition of the garbage which arrives in the drainage varies in function of the urbanization, recycling and services efficiency. It can be seen that plastic is the main type of solids, mainly because of low recycling value of some types of plastic and its increase with the income.
During eight months Neves (2005) evaluated the amount of drainage which enters the drainage in a 1.92 km2 basin of Porto Alegre, Brazil where 42% of the area is residential, 21% is commercial and 37% is undeveloped. The outflow of the basin is in a detention pond. The type of solids which enters and leaves the drainage is presented in table 1.8. It shows plastic and papers are the main types of solid contents in the entrance (81.2%). In the output of the basin, there is a major change since paper disappears in the drainage and plastic remains as the main content.
The amount of garbage in the drains was measured by the balance of mass in the detention pond during the period of eight months (November 2003 to June 2004) representing 242 days. The per capita production in the basin is TR = 0.53 kg person−1 day−1 (in mass), taking into account all the components where the amount collected in the buildings (Tc) represents almost 99%. The amount that is cleaned from the streets is 1.95 kg person−1 year−1 (in mass) while 0.11 kg person−1 year−1 arrives in the drainage system (5.64% of the cleaned amount, representing nearly 95% efficiency for garbage). The amount that leaves the basin is 0.034 kg person−1 year−1, 30% of the garbage that arrived in the drainage.
Table 1.8 Characterization of human generated solids in the drainage
Type Entrance of the drainage % of total1
Output of the basin at the detention pond % of the total
Plastics, PET and Polypropelene2
42.1 81.77
Paper 39.1 0.76 Shoes & tissues 2.6 9.97
Glass 5.4 1.99 Aluminium & cans 6.5 2.25
Others 4.3 3.25 1 estimated by the street cleaning samples; 2 – 65.38% of plastic are supermarket packs and chips
For the urbanized basin, the amount that enters the drainage is 11.72 kg ha−1 year−1 (in mass) and the output is 3.5 kg ha−1 year−1. It can be seen that 31% of the garbage that enters the drainage system leaves the drainage system. Thus, it appears that 70% of the garbage that enters the drainage remains to block the pipes, but since the amount of paper that stays inside the pipes is about 40%, and it is likely that this is dissolved; the amount that blocks the pipes is also about 30%.
1.6.3 Stormwater pollution
Stormwater pollution can occur by one or more of the following process:
• Absorption of air pollutants by the rain. Of about 90% of air substances which drops in impermeable areas are transported to the rivers (Oberts, 1985);

38
• Wash of urban surfaces (pervious and impervious). In the urban areas the surfaces are contaminated by the population by chemistry compounds, organics, etc. It can be aggravated by the water acidity;
• Pollution accumulated in rivers and lakes by many years, after the system has is treatment, these deposits could come to suspension in water during large floods
• Wash of contaminated deposits.
On rainy days the surface wash-load is mainly from sediments, litter and other streets detritus (garbage). This water is polluted by organic matter and metals from the washing urban surfaces and aggregated to solids. Most of the loads come in the first part of the rain (in the first 20 to 35 mm of rain), when the days before of the event were dry (EPA, 1993) (figure 1.21). The water quality concentration (polutogram) and flow hydrograph are presented in figure 1.22a. For rainy days previous to event the concentration peak is lower and moves to the right of the peak flow (figure 1.22b).
Figure 1.21 Samples of stormwater water quality distributed as a watch where the first
sample is between 15 and 10 minutes before the hour. It can be seen by the colour shows
how polluted is the water in the beginning of the hydrograph.
The main difference on the load characteristics between sewage and stormwaters are that sewage are mainly organic with high BOD and Coliform, while stormwater has more metals such as Copper, Zinc and lead. Table 1.9 show some parameters concentration from stormwater of US cities and Porto Alegre, Brazil.
Table 1.10 shows median values of concentration and its variance coefficient obtained for each water quality parameter in a Program developed in USA in many cities. It can be seen how the metals concentration are important concentration. These values are only for stormwater. When the drainage flow receives also sewage from non-treated domestic sources or the connections to sewer system are not efficient the flow water quality is a combination of sewage and stormwater pollution.

39
a – previous days without rain a – previous days with rain
Figure 1.22 Hydrograph and polutogram (water quality concentration in time)
Table 1.9 Comparison of mean values of water quality parameters from stormwater in
several cities (mg/l)
Parameter Durham (1)
Cincinnati (2)
Tulsa (3)
P. Alegre (4)
APWA (5) Interval Lower Upper
DBO 19 11,8 31.8 1 700 Total solids 1440 545 1523 450 14,600 Ph 7.5 7,4 7.2
Coliform(NMP/100 ml) 23,000 18,000 1.5x10⁷ 55 11.2x10⁷
Iron 12 30.3 Lead 0.46 0.19 Ammonia 0.4 1.0
1.Colson (1974; 2 – Weibel et al. (1964); 3 – AVCO (1970), 4 – Ide (1984); 5 – APWA (1969)
Table 1.10 Mean Concentration of stormwater water quality (EPA,1993).
Type
(mg/l)
Residential
Median CV
Commercial
Median CV
Industrial
Median CV
Non-urban
Median CV
BOO 10.0 0.41 7.80 0.52 9.3 0.31 - - COD 73.0 0.55 65.0 0.58 57.0 0.39 40.0 0.78 TSS 101 0.96 67.0 1.10 69.0 0.85 70.0 2.90 Pb 0.144 0.75 0.114 1.40 0.104 0.68 0.03 1.50 Cu 0.033 0.99 0.027 1.30 0.029 0.81 - - Zn 0.135 0.84 0.154 0.78 0.226 1.10 0.195 0.66
TKN 1.900 0.73 1.290 0.50 1.180 0.43 0.965 1.00 NO2+3 0.736 0.83 0.558 0.67 0.572 0.48 0.543 0.91 TP 0.383 0.69 0.263 0.75 0.201 0.67 0.121 1.70 SP 0.143 0.46 0.056 0.75 0.080 0.71 0.026 2.10
BOD – Biochemical oxygen demand – COD – Chemistry Oxigen Demand, TSS – Total Suspend Solids – Pb – Plumb; Cu – copper; Zn – Zinc ; TKN Total Kjeldahl nitrogen; NO2+3 Nitrite and Nitrate; TP total phosphor ; SP soluble phosphor.
polutogram
hydrograph
Time
Flow
and
con
cent
ratio
n
polutogram
hydrograph
Time
Flow
and
con
cent
ratio
n

40
1.7 Assessment of the additional impacts
Some of the main impacts which will be described below are also result of the limited urban water services. They could be described above in assessment of the services, but it is presented here in order to deal with its synergic impacts. They are:
Water quality which is a result of sanitation services, stormwater management and solid waste;
Flood Plain management is related to urban occupation of risk areas and is different from the floods in stormwater. Floods in the urban drainage (stormwater) are regarded as a local since it involves small watersheds (< 100 km2, and very often < 10 km2). Besides that this type of flood is resulted from change in the environment and the impacts are downstream of the action. Flood plains are natural process and the impacts occur because the population occupy these areas. These two types of flood could happen in combined way, but usually urban drainage floods are more frequent (a few times in a year) and short duration. Flood Plain usually are less frequent (once in 10 years or more) but with long duration;
Water related diseases: there is a strong relationship among some diseases, water quality sanitation to the population and floods.
1.7.1 Water Quality
Water quality in the urban areas and downstream are the result of the urban water services in the city. The main potential sources of contamination are: (i) loads from non-treated and treated sewage send to pipes and rivers from houses, commercial and industrial facilities; Contamination by sediments and garbage: (ii) most of nutrients arrive in the water aggregated to sediments; (iii) Contamination by overland flow washing urban surfaces (stormwater water quality). Each of this contamination is related respectively to sanitation, solids and stormwater management services in the city.
In developing countries cities, the lack of the good urban water services results in polluted rivers with the following main critical scenarios: (i) Dry season when the flow is small and the river dilution capacity is also small, with important load untreated load, results in high concentration water quality parameters such as BOD (Biochemical Oxygen Demand and Coliform, among others). It is consequence of lack of sanitation; (ii) Rainy days when the stormwater loads are higher together with the sewage loads untreated; (iii) during dry weather periods inside of the cities in the small creeks the flow is mainly sewage. The natural flow is small, since during the rainy days the impervious surfaces do not allow infiltration which supplies groundwater flow.
These scenarios decrease the population quality of live, since there is a potential environment for disease proliferation together with loss of natural environment, drinking water safety (box 1.5) and risk o spreading diseases. Environment in the cities is mainly function of the efficiency of the public services on urban waters.
The assessment of water quality is dependent of the source of pollution and/or the water use of the stream. The parameters for water sources are mainly identified in order to assess the level of impacts from these sources and for water use the parameter are used for the safety of the uses. In annex C is presented the water quality parameters used taking into account the main

41
contamination sources. In the same annex is presented the required standard for the water quality parameters for some water use.
Box 1.5 – Water supply contamination by toxicity
When urbanization without sewage treatment, moves from downstream to upstream in the basin, the nutrients in the sewage flows into the water supply reservoir changing its trophic conditions. The reservoir will be eutrophic, allowing algae grow, which may produce toxicity in the water. Usually the water treatment for domestic supply does not eliminate toxicity which has accumulated consequences for human health along the time and may develop serious diseases.
1.7.2 Water related diseases
Some of the human main disease related to water supply, sanitation and drainage are: diarrhea, cholera, malaria, dengue and leptospirosis. More than 50 communicable diseases are associated with poor sanitation, which results in millions of deaths, mainly children. For instance, Bangladesh has twice the infant deaths in urban slums than in urban areas as a whole (Wright, 1997).
Diarrhea is a disease much more close to the related water supply quality and sanitation and represents 4.1 % of the total daily global burden of diseases and it is responsible for 1.8 million people every year (88% is attribute to unsafe water supply, sanitation and hygiene (WHO,2009). It is the main cause of children deaths in developing countries. Adequate water supply and sanitation decreases 55% the children mortality (World Resources Institute, 1992. Malaria is endemic in some countries and 40% of the word population has this disease, most of them Humid Tropics areas. Environmental conditions related to drainage which helps to spread malaria are: stagnant waters, deforestation, soil erosion and flooding. Dengue is a disease related to warm climate and the disease spread depends on the mosquito which lives in clean and stagnant water that are in detained in homes (tires, vases, etc) during rainy season. On-site detention should be careful designed in this type of climate in order to not create an environment for this kind of disease. It has been a major disease in tropical cities such as Rio de Janeiro and Belo Horizonte in Brazil. Malaria is a disease strongly related to humid tropic in which is a combination of forests (cloudiness), temperature, stagnant water among others. The vector is a mosquito, genus Anopheles, whose proliferation is directly related to watercourses, and its ideal conditions are clean water, shade and small flow velocity. In Brazilian humid tropics there were near a million cases in 2000 and 2001 (Santos, 2005).
Schistosomiasis has as intermediate host, a genus Biomphalaria which is the host of the larvae (miracidia) developed in the aquatic environment. Creeks, streams, lakes, wetlands, or artificial water systems such as irrigation canals, small impoundments with some plants, favor the development of the snail (Santos, 2005).
Building small dams, impoundments, mining and irrigation support the proliferation of the intermediate host, snails the disease transmission vectors in the tropics. The main action has been the development of the drainage as fast as possible which conflicts with some strategies of temperate climate which is storage as a main strategy.
In developing regions, the return on a US$1 investment in water supply and sanitation improvements was in the range US$5 to US$28 (Hutton and Haller,2004).

1.7.3 Flood plains vulnerability
Characteristics
There two type of floods: in the stormwater (item 1.6.3) mainly as result of the urbanization and natural flood plains which occurs in median and large basins as result of natural cycle of flood and draught periods. This last type of floods is described below.
Inundation in the floodplains occurs when the river overflow its banks as a natural process. It occurs with a frequency of 1.5 to 2 years return periodfeature of the river section and the floodplains.
a –
b-
Figure 1.23
The main natural causes of the floods are related to rainfall intensity and space distribution, basin soil and coverage, geomorphologic conditions such as basin area, slope, and river length. Artificial conditions could change the flood risk such as defore
9 Return period in the mean, the flood repeat in that period (usually years). It is the inverse of the probability of the flood occurrence in any year.
42
There two type of floods: in the stormwater (item 1.6.3) mainly as result of the urbanization and natural flood plains which occurs in median and large basins as result of natural cycle of flood
ds. This last type of floods is described below.
Inundation in the floodplains occurs when the river overflow its banks as a natural process. It occurs with a frequency of 1.5 to 2 years return period9. In figure 1.23 are presented the main feature of the river section and the floodplains.
River and floodplains cross-section
Plain view of river and floodplains
Figure 1.23 Characteristics of Floodplains
The main natural causes of the floods are related to rainfall intensity and space distribution, basin soil and coverage, geomorphologic conditions such as basin area, slope, and river length. Artificial conditions could change the flood risk such as deforestation, change in agriculture
in the mean, the flood repeat in that period (usually years). It is the inverse of the probability of the
banks
floodplains
There two type of floods: in the stormwater (item 1.6.3) mainly as result of the urbanization and natural flood plains which occurs in median and large basins as result of natural cycle of flood
Inundation in the floodplains occurs when the river overflow its banks as a natural process. It are presented the main
The main natural causes of the floods are related to rainfall intensity and space distribution, basin soil and coverage, geomorphologic conditions such as basin area, slope, and river length.
station, change in agriculture
in the mean, the flood repeat in that period (usually years). It is the inverse of the probability of the

43
practice, urbanization, reservoirs, and channel changes. The combinations of these factors are the main causes of the floods at a specific river section.
The impact is related to human and environment conditions. The human conditions impact could be:
• Loss of lives: usually due levels and velocity of the flow near to the rivers or hill slide which destroy houses;
• Direct economics: losses in houses, commercial and industrial buildings due to the affecting water depth and velocity, agriculture goods;
• Indirect economic losses: loss of: working hours, selling goods, industrial production and agriculture.
When no reliable urban plan and regulation exists, the population occupies the flood plain after a sequence of low flood years, since these areas have a flat topography and are near to the available economic job and services, valuable city land and have a low cost. When a larger flood occurs, flood damage increases and the municipality are requested to invest in flood protection in this area.
The main impacts on the population occur due to lack of: knowledge regarding the occurrence of flood levels, and planning for space occupancy according to the risks of flood events.
The common scenario of impact is due to the fact that the population occupies the flood plain during a sequence of years with low maximum annual levels, since the flat areas are favourable to settlement. When years with higher floods return, damages are significant and the population demands that governments take action to build control structures such as dams and others.
Planning the occupation of the floodplains is not new. Box 1.6 shows that over 3.000 years in the past there were planning over the floodplains areas in Egypt. The pressure of occupation of these areas has increased with population increase and economical grow with low flood frequency in some specific areas.
Box 1.6 Floodplain in Ancient Egypt
Aquenaton in 1340 aC selected a new capital, Amarna, which was planed taking into account the floods. “From East to West two dry floodplains areas were nothing was constructed because of the floods fears, sub-divided the city in three parts: downtown, residential neighbourhoods from North to South” (Brier, 1998).
It could change the sustainability of populations depending of its social and economic vulnerability. Climate change has been an additional issue since it could change the risk conditions. The increase of rainfall intensity could represent a higher increase in the flood risk for the same return period.
Flood Measures
The flood control measures are classified in structural and non-structural. Structural measures are related to the change of the basin and/or the river such as dams, dikes, channel conveyance, basin forestation, among others. Non-structural measures are based in measures related to flood mitigation such as: insurance, flood zoning, and flood forecasting. Structural solutions have

44
higher costs and it is feasible only when damages costs are greater than their development or due to intangible social aspects.
The structural measures are classified in extensive and intensive. The extensive measures are developed over the basin such a reforestation, soil conservation, among others. These measures usually can be developed only over small basins because of the cost of the intervention. The intensive measures are developed in the river such as: reservoirs, dikes, river section changes and slopes, river deviation. The table 1.11 presents a summary of the measures.
The structural measures are not designed for a full flood protection. It would require the protection to the largest flood which we do not know and the cost would not feasible. The dangerous of structural measures is to create in the population the feeling of complete safety which does not exist, avoiding the potential risks. The consequences could be the increase of the population in risk areas which could increases the future potential impacts for floods above the design risk.
The non-structural measures could be applied as an unique solution or combination of structural measures in order to deal with the flood in a specific place. Non-structural measures are less expensive, but there are some difficulties in their implementation because most of population does not want to live with floods but wants a full structural protection which in most of communities is hard task for decision makers. Some of the usual conflicts are:
Table 1.11 Intensive structural measures for flood control
Measure Descriptions Application Limitations Reservoirs for flood control
A reservoir can be of single or multiple purposes. A reservoir constructed for flood control is more effective. Flood control reservoir uses its volume to damp the peak flow to downstream.
Small and medium size basins
• For small frequency floods the effect of reservoir decreases;
• Use of land for reservoir volume.
Dike Local or specific control of the flood. Requires the use of pumping the flow from the drainage of protected areas. Increases the level for upstream and the velocity for downstream.
Large basins • Usually limited to six meters high;
• Risk of break which create more damage if it does not exists;
• Requires flood forecasting.
River section change
Decrease level in the area of interested increasing the flow capacity. It can be done by increasing river section, decreasing roughness or increasing river slope (cutting meanders or change channel bed).
small and medium size rivers
• environment impacts in the reach and downstream;
• high cost with a extended reach intervention.
River deviation Change the direction of the flow to other river basin. It decreases downstream flow for the existing basin.
Small and medium
• Environment impact in the receiving river.
• High cost of intervention.

45
• Real state owners will fight against regulation of their areas and usually have influence on the municipal politics;
• When flood occur the county receives a non-refundable loan from State and Federal governments. Under these circumstances there is no incentive for a prevention program.
• Usually structural measures are not economically feasible but have much more political visibility. Non-structural measure requires much effort from both the population and politicians. This is a difficult political task and politicians usually do not practice it.
1.8 Developed and developing countries comparison
In most developed countries water supply and sewage treatment and quantitative aspects of urban drainage are no longer an issue since its coverage is high. The main issues are the control of the stormwater water quality and managing flood hazard (table 1.12). However, for developing countries access to sanitation is still an important issue, urban waste disposal without treatment impacts the amount of clean water available for supply and new investments have to be made to maintain and improve supply.
Table 1.12 - Urban water management of developed and developing countries
Facility Developed country Developing country
Water Supply Total coverage with some risk from non-point sources
Lack of supply and Contamination of water sources by lack of sanitation
Basic Sanitation
High coverage of secondary treatment
Low coverage and low efficiency on existing treatment and network systems
stormwater Quantitative control: Floods are regulated non-structural measures and developed structural measures form existing impacts and;
water quality has been an important issue under development
• Lack of measures for water quantity of quality with high level of impacts;
• The cost of the impacts are transferred to the public or to environment;
• The investments are developed with high cost to increase floods.
Flood Plain mainly non-structural measures with insurance, zoning and flood alert
• occupation of flood plain without control;
• bad investments in structural solutions;
• occupation by the poor during drought season and high impact during flood season;
The cost and the development of sanitation still is a major challenge. The total coverage may look good, but most of the sanitation is for the wealthy areas of the cities and the poor lack all the

46
basic facilities for proper living. Sanitation coverage is one of the key indicators of urban poverty since overcrowded and unhealthy living conditions of the urban poor in developing countries are made even more degrading by the lack of adequate systems to dispose of human wastes (Wright, 1997). Table 1.12 shows the comparison of develop and developing countries for each aspect of water in urban areas.
In table 1.12 is presented the common scenarios found in developed and developing countries with important variation for less developed countries. Usually developing countries already have a large proportion of water supply for the cities and the coverage of sewage collection and treatment is low (hygienic phase). In less developed countries the water supply is still the main issue (pré-hygienic phase), with high risk of developing water related diseases.
1.9 Institutional Issues
Institutional aspects are related to:
• Legal framework which design the non-structural approach in order to achieve the sustainability; and
• The Institutions management in order to deliver the actions and implementation in the city in order to achieve the goals. In the Management there are important aspects related to capacity building, monitoring and maintenance of water services.
This two major components cannot be developed isolated, a sound institutional implementations of water services is based on the effective implementation of these components. Without a strong institutional construction the IUWM will not exist because it is a necessary condition for a sound plan development.
Urban development usually occurs without control in many cities of developing countries. The urban occupation has been developed without an urban Master Plan which takes into account the urban water sustainability. It is developed from downstream to upstream compromising water source and increasing flood conditions. Table 1.13 shows some relations of urban development and impacts.
Table 1.13 Relation of causes and impacts in urban waters.
Main cause Specific aspects Impacts Unsustainable Urban development
High density, impervious areas, unprotected surfaces and sediments
• Increase on flood frequency; • Sediments production;
• reducing river conveyance; Lack of urban water Services
population without water supply; lack of sewer collecting and treatment; lack of solid services; lack of urban drainage and flood control management
• Water sources contamination;
• Use of unsafe water and diseases; • Reducing river conveyance; • Environment losses;
• Land subsidence.
Bad management Unsustainable works such as canal, conduits, etc Lack of institutional arrangement
• Transferring floods; • Losses in investments; • Lack of urban water services

47
The management of urban waters is fragmented by many institutions in this metropolitan area. There are many different plan and projects which are in conflict to each other. The institutional development is complex because of the govern changes, water law and implementation of water resources authorities in the basins. It is a combination of institutions at various levels: central govern, provincial and local levels without integration. As a result the planning and development in the basin has been fragmented by isolated actions distributed in the area and for subjects.
The management had the following issues:
• Lack of institutional arrangement which allow to integrate the solutions in urban water is the metropolitan area and in the basin which supply the region;
• There were many fragmented investments in flood management without taking into account future urban grow and taking into account only one type of solution (and expensive) of transferring peak floods to downstream.
• Lack of strategic integrates investments for water supply and sanitation in the overall metropolitan area.
� Lack of knowledge: among the population and professionals in different fields who do not have suitable information about the problems and their causes. The decisions result in high costs, and some companies take advantage of this to increase their profits;
� Poor conceptual knowledge among engineering professionals for the planning and
control of the systems: an important portion of the engineers who act in urban areas do not have up to date information about environmental issues and generally seek structural solutions that alter the environment, creating an excess of impermeable areas and a consequent increase of temperature, flooding, pollution and other problems;
� Sectorial views of urban planning: planning and development of urban areas are conducted without considering factors related to the different components of water infrastructure. An important portion of the professionals who act in this area have a limited sectorial view;
� Lack of managerial capacity: municipalities do not have the structure for the planning and management of the different aspects of water in the urban environment.
1.10 Integrated Urban Waters Management
1.10.1 Goals and targets
The Urban water goals are the following:
• Deliver safe water for human, animal, industrial and commercial use;
• Improve conservation, avoid degraded area by erosion, treatment of sewage and stormwater effluents, minimize solids in the streams from urban settlements
• Reduce vulnerability to diseases and floods.

48
The main actions in order to develop a sound strategy for the integrated urban waters management are (figure 1.24):
• Sustainable urban development: Development of new urban development standards taking into account the sustainability on water issues: (i) limits for densification and impervious areas; (ii) reserve of areas for parks and flood management; (iii) restrictions and economic incentives for conservation of urban source basins;
• Protect the water supply sources: regulate the occupation of the water supply basin; control the load of water supply basin; improve its water quality;
• Improve de water supply distribution: development of a program of investment in order to increase the water supply network and improve the water supply quality;
Figure 1.24 Integrated urban waters management.
• Develop a system of waste treatment: investment on the collecting and treatment system for all urban areas;
• Flood Control Management: develop regulation for new development, controlling the future flood increase; develop flood management plan for each basin;
• Total Solids Management: develop sound services for total solids in order to decrease the amount of solids in the drainage;
• Water and environment conservation: storm water pollution control, environment recovery of selected environment;
These targets have to be achieved by integrated management and interrelated actions inside of a space which covers more than a basin. The development of this integrated plan requires a review of strategies over the three major water sources and the metropolitan area, together with large investments in a longer period. Every components of the plan requires specific goals and strategies.
Urban Master Plan
(land use)
Water supply sources
and distribution
Sewer collecting and
treatment
Flood Management: quantity
and quality
Total solids: sediments and
solid waste
Water and environment
conservation
Legal Framework
Management
Capacity
building
Monitoring
Economic Financial
Social

49
In order to achieve these goals there are following steps:
• Assessment of the urban water issues: identification of the problems in urban waters and the integrated aspects;
• Plans and Strategies: Development of the planning for solution of the problems in the urban water services in the city ;
• Action Plan: implementing strategies in urban waters in time taking into account the needs and the economical and financial aspects of the investments.
1.10.2 Plans and Strategies
The main Plans and strategies for the urban management in the city are (figure 1.25):
Figure 1.25 Framework of the main activities.
Emergency
actions: actions
required for
identified urgent
issues IUFMP- Integrated
Urban Flood
Management Plan:
Implementation: Implementation of planned measures along the time
Protection of Water
supply source
Improve Water
Supply Services
Develop the sewer
collecting and
treatment
Total solids
management
Environment
conservation and
recovery
Integrate Urban water Plan
Institutional: Development the regulation and management of institutions in the space which cover the basins and the Metropolitan Areas
Water & sanitation
Urban
Occupation

50
• Urban occupation: develop or review the Urban Master Plan in order to include the regulation related to urban waters;
• Water and Sanitation10: it is related to protection of water supply sources, provide the water supply and sewer collecting and treatment;
• Total solids: it is also a plan to improve the services and reduce the amount of solids from sediments and solid waste which reaches the drainage;
• Flood Management and urban drainage is the development of the measures described in the chapter 4 for a sound plan for flood control;
• Environment: it is a plan for recovery of degraded areas in the metropolitan area and for a long term recovery of the rivers and coast environment, after the services described in the other services are provided;
• In order that these plans would feasible in its implementation there is a need to an institutional construction of the water management in the basin and at county level.
The development of this integrated plan is an important challenge since most of these plans used to be developed in an independent way without connections and sometimes with conflicting conditions. The main difficulty is to identify professional of skill to understand the overlapping aspects and issues which should be solved in an integrated way.
10 Sanitation usually includes sewer systems, urban drainage and total solids, but often is used from sewer systems. In this part of the text we used for it only.

51
22.. MMEETTHHOODDOOLLOOGGYY
2.1 Framework
This chapter presents the structure of the overall procedure designed in order to assess the urban issues of the city or the Metropolitan area, in order to develop a sustainable long term plan of investments. Figure 2.1 presents the framework planed and described in this publication.
There are four major steps in the methodology:
A. Characterization of the urban system;
B. Identification and Analysis of urban water issues;
C. Quantification of water issues;
D. Strategies and Plans for urban waters
Three of them related more to the assessment and the last one presents the Strategy in order to develop sustainable solutions for the city. These steps are supported by two basic supporting tools, developed from existing information’s and experience, which are:
I. A qualitative matrix of issues (QMIs) and impacts (QMI);
II. Urban planning and urban waters indicators
This methodology is applied in some case studies, which will be the adding experience which is under development in the World Bank. It was called here the Case Study box where will be deposited this experience.
Figure 2.1 Steps of the procedures in the methodology.
A. Characterization of the urban
system
B. Identification Analysis of urban
water issues
C.Quantification of water issues
Qualitative Matrix of issues
D. Strategies Plans
Urban Planning and Urban Waters
Indicators
Supporting tools
Steps
Cases studies box

52
2.2 Steps of the methodology
The steps of the methodology are:
A. Characterization of the urban system: This step is developed in order to understand: (i) the dimensions of the city (space and time), (ii) the overall economic and social development which assess the external boundaries related to the country development and the metropolitan area; (iii) urbanization; (iv) urban water resources; (v) institutional aspects. This step allows a first overall picture of the existing urban waters system (see chapter 3).
B. Identification and Analysis of urban water issues: The previous step is a learning step about the area. After that, and based on the matrix of impacts designed in this report, are identified the main issues of the urban area, related to urban waters. In this procedure, there are the visit to the city with site assessment and interview of the services city managers. Some judgment in the selection is assumed, but it is likely that the selected main issues would be common to many professionals (see chapter 4). In this chapter is proposed a matrix of potential issues and from that list the consultant can identify which are the main important for case in study;
C. Quantification of water Issues: After the selection of the issues, some data from the area will needed in order to assess the importance of the impacts. This is a difficult step, since to obtain the required information take time and effort which in a short visit will be difficult to obtain. It is likely that the first assessment is obtained with a combination of local data with indicators existing in the literature. In this document are presented some indicators which will be updated with future projects of the World Bank and others in order to allow the assessment (see chapter 5).
D. Strategies and Plans for water issues: After the identification of the issues, is developed a Strategic Plan for the city in order to solve all aspects. The actions in time which could be developed, taking into account the existing institutional condition in the country. In water resource there are measures which should come first in the planning and implementation because of the basin physical conditions. Together with that, there are important constraints related to the Institutional aspects in order to be successful in the strategies. For instance, Stormwater management has to be developed from upstream to downstream, but this management requires updated professionals and institutions (see chapter 6).
The supporting tools planed were:
I. Qualitative matrix of Issues (QMIs): This matrix was developed taking into account all problems which could be present in an urban environment, related to urban waters. Of course it is impossible to cover all the alternatives. In that way, any new experience could be used in order to update the matrix. Based on the exhaustive scenarios of issues, a procedure was recommended for application in each case (see chapter 4).

53
II. Urban Planning and Urban Waters Indicators: In the quantitative assessment of the issues, when there is not much data from the area, it is possible to choose some indicators in order to develop a first assessment. Besides that, in development of the strategy is possible to use some cost indicators in order to assess the investment requirements related to the strategies. The selected indicators are useful for a first assessment and the development of the strategies (chapter 5 and 6). The tendency is to select a large number of indicators, but it is not efficient and reliable. Usually is important to use parsimony in selecting the indicators. Fewer indicators usually are more efficient in order to better understand the issues and the requirements.
III. Case Studies box: It has two major entrances: Case studies developed which could be used as example; specific action or measure which was successful or a failure. These contents support the development of the planning of future strategies (chapter 7).
This document should be updated along the time with the experience of developed studies together with a follow up document which brings the experiences of the implementation of IUWM.

54
33.. UURRBBAANN AARREEAA CCHHAARRAACCTTHHEERRIIZZAATTIIOONN
Characterization of the urban area is a summary of the main facts about the fundamental aspects related to urbanization, economic and social aspects together with water resources characteristics. It is used to have an overall background of the city and country processes which could help in developing the assessment and plan the strategy to solve the issues. It is based on some basic information’s which are usually easy to find in the internet, supplied by the client, World Bank data or other means. It gives a first perspective of the country and urban conditions.
Below is presented some of the main aspects which could be used to describe the city and its development. Together with that is presented an example.
The main information’s, quantitative or descriptive, which could give this background are:
• Urban area and population;
• Economics of the Country GDP, together with per capita;
• Social distribution of the incomes, proportion of slums, basin area (one or more) in which the urbanization is in development;
• Urban waters: Climate characteristics such as temperature, rainfall and discharges (when there are); water uses and main environment assets.
3.1 Urban area and population.
Urban development is the main external condition in the planning urban waters. Most of the conditions are related to urban density, existing and future space occupation in the basin, together with its physical characteristics such as topography, geology, streams network, among others.
Urban area is the space of the urban occupation and not the total administrative area of the city. Urban population usually explains the residential areas, but not the industrial and commercial spaces. These aspects are studied when some major industrial or commercial component is one of the issues, such as a petrochemical complex.
The information about urban population, its trend and forecast can be found in some sites in the internet such as: http://www.demographia.com/db-intlua-cover.htm and the United Nation site on population with many statistics of the city and countries on the population: http://esa.un.org/unpp/. In each specific country it is possible to have more updated data from the country statistical organization.
Urban density is an indicator of the urbanization and it is used for urban planning. This parameter explain some of the key aspects of the urban development (WDI, 2009).The temporal and spatial modification of the urbanization shows how its process and its trend for future. It is also important to compare this process with the country. Table 3.1 shows that recent cities in developed countries use to have urban density below 25 persons/ha, old European cities are in a

55
larger range, but developing countries are usually above 70 persons/ha and the cities with highest density are in Asian Countries.
The overall density does not describe most of the city, since there is a large difference of density between a regular neighborhood and a slum. Usually the density increases by vertical construction such as building with many apartments in a same area as compared to houses and by irregular occupation such as slums which usually has a very high horizontal concentration.
Based in a density is possible estimate the area of the urban settlement. For instance if in a city the urban density is about 50 people/ha a city of 500,000 uses a space of about11 10,000 ha or 100 km2. The statistics data usually does not have the space of the urbanization area. It is estimated based on all geographic area of the country. It does not reflect the urban development. The procedure to estimate the urban area and density based on limited information is described in the annex A.
Table 3.1 Large Cities densities12 Region Density
People/ha US and Australian cities < 25
European cities 25 – 75 Tokyo 110
Hong Kong 360 São Paulo 72 Mexico City 85
Seoul 100,5 Lagos 86
3.2 Economic, social aspects and institutional
Economic
The overall economic and social information’s of the city and the country allow a first perspective of the country in terms of investments, population grows and conditions, facilities such as water & sanitation, slums development and governance. Some of these information’s are in the table 3.2.
Urban governance can be defined as the sum of the many ways individuals and institutions, public and private, plan and manage the common affairs of the city13. UN-HABITAT is currently developing and testing an index to measure the quality of urban governance in order to get a global and local view. The main principles used are the: effectiveness, equity, participation and accountability. In relation of the basic information’s on governance the main information’s at this stage of the assessment are: levels of the country administration, city and urban waters management. Assembling this information’s gives the first perspective of the issues.
11 Area = population/density and 1km2 = 100 ha. 12 Combine sources: http://www.demographia.com/db-intlua-cover.htm and Newman et Kenworthy, 1989; Atlas Environnement du Monde Diplomatique 2007. 13 http://www.unhabitat.org
56
Table 3.1 Country basic information’s
Index or indicator Description
City Population and its annual grow
Usually population grows is strong correlated to urbanization. It’s grows decreases with urban population. A country stabilized its population when there a mean of 2.1 children’s per couple.
City Proportion of urban population and the proportion of informal population
The urban population is important to understand the dimension of population concentration. The proportion of informal population is needed in order to understand this social issue related to water services.
Urban population density It is the population which occupies the urban area. It gives an idea of the mean urban development and soil use. For high density the complexity of urban waters aspects are higher.
Income per capita (country and city)
The amount of mean income of the population, which GNP/population. It is not a good indicator, since it can have high standard deviation, but is used a beginning information.
Income of lowest 20% of population
It is an indicator to understand the level of poverty of the city.
Gini indicator It is a social inequality indicator
Social
A social indicator of the urban development is the amount of slums in the urban environment as compared to the city. The table 3.2 shows the slum population as a proportion of the urban population in major global regions. The tendency is the decrease of the slum proportion with increase of economic income of the country. This information is from 2001 and its projection until 2020 is in UNHABITAT, (2009).
Informal population is the part of the population which occupies unregulated areas, do not pay tax or services. Informality in the city is an important issue for water since most of that population does not have conditions for planned services and may need some type of subsidy.
Slums are the main type of informality which has been found in major cities. Figure 1.5 (chapter 1) shows how this type of dwelling grows with population and how it decreases with urban population, but essentially it is related to the social and economic development of the country. Major cities of developing and poor countries are those which have the largest proportion. Table 3.2 shows that Latin America, Northern Africa, Eastern Asia, South-eastern Asia and Western Asia are almost at same levels varying from 28.2 to 36.4 % of the population. However, Sub-Saharan African and South Asia are in another level, with 71.9 and 59 % respectively. In water services this type of informality requires innovative type of solutions in supporting the population with safe water sanitation and in reducing vulnerability to natural disasters. Most of the time the social and economic conditions of the population is outside of management conditions of water services, but an important part of the improving living conditions are inside of the water management.

57
Table 3.2 Slums distributions by global regions in 2001 (UNHABITAT, 2009) Region Total population
In thousand Urban population
in % Slum population in % of Urban
Nothern Africa 145,581 52 28.2 Sub-Saharan Africa 667,022 34.6 71.9 Latin America & Caribbean 526,592 75.8 31.9 Eastern Asia 1,364,438 39.1 36.4 South Asia 1,419,417 29.6 59.0 South-eastern Asia 529,764 38.3 28.0 Western Asia 175,322 65.7 35.3
3.3 Urban waters information’s
The main information’s related to urban waters issues are:
• water and sanitation coverage in the area of interest;
• solid waste coverage
• descriptive of extreme events drought and frequency of floods;
• Affected people and diseases.
• Environment impacts
Some of this information’s are descriptive and other are quantitative such as water and sanitation coverage. This information’s can be related to social and economic conditions of the country or the city. Figure 3.1 shows how water and sanitation coverage changes with the country income per capita. Income per capita does not show the great social difference, but in some way gives the total capacity of city or country in investment.
Water and sanitation statistics together health statistics can be found by country in the following site: http://www.who.int/whosis/en/index.html. It is important to take the indicators careful. The United Nations statistics are mainly for local solution which is efficient for small communities. When the small village grows until became a city and after that when it became a large metropolitan area, these solutions are not more reliable, because of the synergic effect of the load increases. Since the soil does not have capacity to receive the load it flows to rivers it flows to the drainage. It is transferred from some houses to the rivers and affect other population downstream. For instance, Argentina has 91%, Brazil has 77%14 and Indonesia 52%15 of sanitation, but cities of these countries are completely polluted with important risk for disease. This pollution is result of lack of sewage treatment and local solutions in major cities.
These statistics does not reflect the reduction of the contamination, but the transference of it to downstream by rivers or groundwater. Since in large metropolitan areas, downstream of the source load there are other dwellings, they are affected by this untreated waste. In that way this 14 Taking into account the amount BOD load, still 89.3% return to the water systems in Brazil. 15 In Jakarta, Indonesia the river are completed polluted and there is less than 5% of sewage collect and treated.

58
statistics are unrealistic for a healthy population and environment sustainability of median and large cities (> 100 thousands persons). A sound statistic would measure how much load still comes back to the river after it is used and/or the supporting capacity of the water systems.
Figure 3.1 Population with sustainable access to improving drinking water and improved sanitation (source: World Assessment Progam,2009)

59
44.. IIDDEENNTTIIFFIICCAATTIIOONN OOFF MMAAIINN TTHHEE WWAATTEERR IISSSSUUEESS
This chapter has as main objective to describe how to identify the main issues related to Urban Water Management in a Large Metropolitan Area. It is a purely qualitative assessment based on meeting/interview with local staff. It is mostly a check list of the well known urban waters issues.
In the first item is presented the framework of IUWM which is the background of this assessment. In the following items of this chapter are presented the step by step procedure recommended for the consultant in order to identify the main issues in the city. In order to help the assessment, in annex A is presented, a potential matrix of issues related to urban waters. The matrix was called the Qualitative Matrix of Issues (QMI).There are two main groups of matrices: Services and Goals.
The literature is full of tools for selection of issues and decisions, but since this it is a short mission it is recommended that assessment keeps as simple as possible. The main purpose of the report is to support the development of major line of investments in integrated urban water policies, plans and projects for a social, environmental and economic sustainability of the cities.
4.1 Main Aspects in the IUWM
The main impacts in a basin are illustrated in figure 4.1. As it can be seen an important part of these impacts are related to urban development such as: urban stormwater and domestic waste water, groundwater urban contamination, urban erosion and change channels.
It is important to mention that IUWM is an important part of the integrated water resource management (IWRM) at the basin level. In the assessment the urbanization may cover a few basins and the internal management of the city has to be compatible with the management at basin level.
From the concepts developed in the first chapter of this document the main aspects used here for IUWM are the (figure 4.2):
Planning and Urban Water Services:
A. URBAN DEVELOPMENT: soil use development in the urban environment
B. URBAN WATER SERVICES: services provided by the municipal, State or National govern to the population, which are:
• Water supply: supply the population and the aspects related water sources, distribution, conflicts and quality;
• Sanitation: collect, treatment and disposal of the sewage;
• Urban drainage: stormwater in the urban areas,

• Total solids: urban erosion and sediment, population. In relation of the services of collecting, cleaning urban spaces and disposal.
Figure 4.1 Basin related impacts (EPA, 1977)
C.INSTITUTIONAL: legal and management aspects of dealing with all above services and control. Most of the institutional aspects are cross cutting and are developed in each component, but some are overall to the city development.
Goals for the services
D. SOCIETY QUALITY OF LIVE: Improve health; minimize floods, reduction of economic and social vulnerability and amenities. Health is the result of management developed in the services and should be a goal for these services. Minimize floods: is mainly relplains management where the precreational and landscape conditions
E. ENVIROMENT: improve water quality; reduce degradation areas, aquifer contamination; improve fauna and flora preservation and conservation.
Most of the above aspectsintegrated approaches. In the analysis it is important to identify the overlapping among the services and the issues in other to deal with it in an integrate way.
60
: urban erosion and sediment, solid waste generated by the population. In relation of the services of collecting, cleaning urban spaces and
Figure 4.1 Basin related impacts (EPA, 1977)
C.INSTITUTIONAL: legal and management aspects of dealing with all above services and trol. Most of the institutional aspects are cross cutting and are developed in each component,
but some are overall to the city development.
D. SOCIETY QUALITY OF LIVE: Improve health; minimize floods, reduction of economic and al vulnerability and amenities. Health is the result of management developed in the
services and should be a goal for these services. Minimize floods: is mainly related to flood plains management where the population is vulnerable. Amenities are the developmentrecreational and landscape conditions, integrate to the water services.
E. ENVIROMENT: improve water quality; reduce degradation areas, aquifer contamination; improve fauna and flora preservation and conservation.
Most of the above aspects mentioned above have interconnected aspects which require integrated approaches. In the analysis it is important to identify the overlapping among the services and the issues in other to deal with it in an integrate way.
solid waste generated by the population. In relation of the services of collecting, cleaning urban spaces and
C.INSTITUTIONAL: legal and management aspects of dealing with all above services and trol. Most of the institutional aspects are cross cutting and are developed in each component,
D. SOCIETY QUALITY OF LIVE: Improve health; minimize floods, reduction of economic and al vulnerability and amenities. Health is the result of management developed in the
ated to flood development of
E. ENVIROMENT: improve water quality; reduce degradation areas, aquifer contamination;
mentioned above have interconnected aspects which require integrated approaches. In the analysis it is important to identify the overlapping among the

61
Figure 4.2. Framework of Integrated Urban Waters management.
URBAN PLANNING
Planning occupation Law enforcement Slums City expansion Governance
WATER SUPPLY
Water availability Contamination of Water Sources Water Storage and Distribution Governance
SANITATION
Sewage in the source Network Treatment Disposal Governance
URBAN DRAINAGE
Drainage in the source Network and storage Measures in the major drainage Governance
SOLIDS
Solid waste collecting Cleaning streets Management Erosion and sediments Transport and disposal Governance
INSTITUTIONAL
National framework Basin level Water administration Urban Waters Environment
SERVICES
QUALITY OF LIVE
Access to quality services Improve Health Reduce vulnerability Amenities
ENVIRONMENT Conservation Preservation
GOALS

62
4.2 Framework of the identification an analysis
The selection of the issues is always a subjective process, but it is likely that at this stage the selected aspect could very common to many of the consultant and professionals. The proposal present in this document has the steps (figure 4.3) described in the following items.
Figure 4.1 Step of the identification and analysis of the assessment.
4.3 Step 1: Mission preparation:
This step is used to have a first insight about the city and its main characteristics and issues. The usually required steps are:
A. Review the existing information such as:
Mission
Preparation
Interviews
Sites
assessment
Identification
and analysis
Service Matrix of
Issues (annex A)
Characterization,
previous reports and
support maps
MISSION
Goals Matrix of
issues (annex A)
Plan the interviews
and visiting sites
STEP 1
STEP 2
STEP 3
Indicators
Supporting tools
Basic information
Strategies

63
• previous reports about the country and water issues existing in World Bank or other sources;
• basic information existing in the internet such as in the Wikipedia about the country and city characterization;
• Select maps with the urbanization, drainage and basin.
B. Identification of the main group of people to be interview. The main group could be from the service providers of:
• water services: water, sanitation, stormwater and total solids; • urban development and planners; • Environment conservation and licensing;
• water resource management;
• Regulators and city managers.
In annex A is presented the QMI Qualitative Matrix of Issue which can support your interview. In the same Annex is presented instructions which can be used for the interview. At this stage is important to prepare the trip which is going to help you during the mission. The instructions about it is also presented at this annex.
C. Identification of the sites to be visited: From the first document it is possible to have a first evaluation of the main aspects. The more important sites to be visited are related to: municipal water sources; major urban drainage; floods sites; driving in the city is possible to see how good is the solid waste services; poor population and informality areas; conditions of the treatment facilities and the overall city environment. One or two days driving in the city give you a first picture of its conditions.
In this visit is important to locate in map and take photos which are going to help you in the assessment to demonstrate your assessment.
4.4 Step 2: Mission development
A. Interview: If there is in underway a World Bank project or was developed is recommended to get a briefing from the manager. In the annex A there are some supporting contents for these interviews. Usually is important to ask to each manager what he thinks are the main issues related to its business. You can show the matrix or use it as support for the questions. In the following item, there is a matrix for each main service and management. It would be a good reference to interview the entities which are responsible for each one of this component in the city. It will be also valid to have the opinion from NGOs and others from outside of the administration and services.
B. Sites: As it was described above, it is important to drive through the city looking for flood places, water quality of major drainage (creeks and rivers), detention sites, and solid waste in the streets and in the drainage, source of urban water and treatment facilities. It gives a sample perspective in relation to the output of the services. This visit should have a sample from valuable neighborhoods and from low income in order to have a perspective of social and difference in services. A few years ago, visiting a coastal and touristic area of Brazilian Northeast, it could be

64
seen that until three blocks near to the beach the services are fair, but after that, there were garbage in the streets and pollution in the stormwater.
4.5 Step 3: Identification and Analysis
In this step the information and local assessment are assembled in other to identify the selected main issues related to urban waters. From the interviews you already have a first insight from the manager about it.
Using the obtained information from interviews and the documents it is possible to develop the first assessment, filling the sheets: selected issues and cause-effect (annex A).
Step 3.1 Prepare the selected issues matrices, which are:
(a) Services: where in each line there are the urban development and water services aspects (matrices in Annex A for each component). For each one selected in the line the main issues of this case study. Never uses more than a line;
(b) Goals matrices: in the same as above, but in each line the goals aspects. In the same way select the main issues.
Step 3.2 Cause-effect relationship is the relation of above matrices. Identify for each goal (effect) issue which are the services issues as main causes
Step 3.3 For each cause-effect relationship prepare a short text to justify your finding taking into account the followings highlights:
• Description of the issue • Who did the identification and his justification and evidence;
• Main causes of the issue and potential impacts • Describe the potential solutions (if it was identified)
See instructions in Annex A and excel file issuesmatrix.xls.
The procedure described above is only a suggestion, since each consultant or bank manager has its way to work in that situation. The purpose is to get an overall feeling of the problems and does not miss any important issue.

65
55.. QQUUAANNTTIITTAATTIIVVEE AASSSSEESSSSMMEENNTT
This chapter presents some of the quantitative aspects of the assessment developed in the last chapter. The analysis presented in this chapter is related to the dimension of some issues related to urban waters, based on existing indicators of urban development and water services, together with the assessment of the impacts.
It is likely that the information required will not be possible to obtain in a short visit. The
quantitative assessment may need to be assessed in another step of the process where the
manager or consultant would have more time and will ask for information to develop the
assessment.
In the following item is presented how this assessment is developed in the space, taking into account the upstream – downstream effects in the basin and the urban development. In the second item is presented the selected indicators for urban water services assessment together with impact and goals indicators which are used for an overall assessment of the issues. In the third item is presented some suggested criteria’s based on the indicators to find the level of the issues and required measures.
The objective was to use the simplest methods in order to have a first step assessment, leaving the modeling and specific tools for other stages of project preparation. The importance of this analysis is to justify in quantitative terms the main issues, as a preparation for a strategic plan of investments.
5.1 Spatial discretization
There are the following analyses of the urban system and its water management:
(a) Overall schematic view of urban development and urban waters interaction. It is used to have a big picture of the space relation of urban waters;
(b) Spatial discretization of the assessment where the city urban water is sub-divided in basins and upstream - downstream relationship in the urban waters interactions.
Overall assessment: In order to have a big picture of the urban development and the water resources, a map with the following layers would be recommended: administrative borders, rivers networks, basins borders and space of urban occupation. Other layers could also be included but it could pollute the map view. This type of the map can be found in the city administration, but usually they do not include the basin limits which should be included. It can be drawn by hand taking into account topography or by GIS.
The map scale is function of its practical use, dimension of the basins and urbanization. Sometimes is impossible to have everything in the same map. In that way, it is possible to draw a map of water supply for the city and another map with the basin limits of the major drainage and the city, where the relationship of upstream and downstream has effect. Figure 7.3 is an example

66
of a schematic map of water supply (chapter 7). This type of map allows the mean assessment of water demand x supply in the space.
Spatial discretization: The mentioned above map could be sub-divided in sub-basin where the water supply, sanitation, urban drainage and solids are assessed, together with the impacts and goals for the city management.
Figure 5.1 shows as example the overall basins in the Federal District of Brazil, city of Brasília. The other maps would be the drainage and urbanization of each of these basins and the space relation of water supply x availability, source x impact in sanitation, urban drainage and total solids from upstream to downstream.
Figure 5.1 Basins in Federal District of Brazil, capital of Brazil, together with the urban occupation (SEDUMA,2008).
5.2 Indicators
Table 5.1 presents some indicators which could be used in the assessment developed in this document. In the coming items are described the meaning of this indicators and in the annex B the procedure which could be used in its estimation.
5.2.1 Urban development indicators
The main indicators in relation to urban development are:
Population of the city and population in informal areas: It describes the number or persons which needs the urban water services and are the source of the urban soil use and potential impacts;

67
Urban area: It is the space where the population lives in a city. It is important to distinguish from the total administrative area of the municipality, since it covers rural areas together with urban. Usually this information is not available. Some of the procedures used to estimate the urban area is in annex A.
Urban density: this indicator shows how the city develops its infrastructure. It may have a large variation inside of the city. Usually urban planning is done by the distribution of urban density.
Table 5.1 Indicators for urban waters assessment
Indicator1 Aspect Justification
Population of the city (P) and informal area p (%)
Urban development It is base for consume and impact in the urban area
Urban area (UA) (ha)
Urban development It is space or the urban settlement
Urban density (Ud) (persons/hectare)
Urban development Indicator how the infra-structure is developed and planned in the city
Total Water demand (L/s or m3/s)1
Water supply It is the base to estimation of water use for the city
Access to safe water (ASW) (%)
Water Supply Proportion of total population which has access to safe water in the city
Water availability (L/s or m3/s)
Water supply It is the existing water availability for city supply.
Access to basic sanitation (%) and Access to full sanitation (%)
Sanitation The proportion of the population which does not have minimum sanitation (septic tank or sewage collection) but without treatment; Full sanitation is assumed here as the proportion of population which has collection of sewage and treatment.
Sanitation Load Indexes
Sanitation Relates the load generated by the cities and its effective treatment
Detention volume Urban drainage Assess the require volume needed to mitigate the peak flow increase by urbanization.
Stormwater load Urban drainage Assess the load from the urban drainage for the same water quality parameters of sanitation and for metals.
Support Capacity Sanitation & urban drainage
Assess the capacity of the water bodies in receiving the city loads.
Sediment increase (LS)
Total solids The increase in sediment yield in relation to its natural conditions
Solid Waste in the drainage (Sw)
Solid Waste The proportion of solid waste in the drainage is an important indicator of the efficiency of the services.
1 – There are other indicators which could be used in order to support the assessment which are described inside of each item.

68
In higher urban density, the cost of water utilities and transport are lower, together with the unit cost of infrastructure and real estate profit maximization, but it may result in less quality of live (amenities and health). Some of the factors which could influence the quality of live are: (a) temperature (high density); (b) loss of time in traffic jam (high density); (c) increase cost of transport for long distance (low density); (d) large water supply and sanitation systems (low density); (e) frequent floods (high density); (f) high environment impacts (high density).
There is a need for equilibrium and innovative urban development in the way to find a balance in urban density, housing distribution and job areas (commerce and industry spaces) together with environment conservation. This is the process of development or renovation of a city and finding its sustainable balance.
5.2.2 Urban waters indicators
Urban waters indicators were selected for each service. They have connection with urban development based on urban density (or population).
Water Supply
There aspects selected are related to demand and water availability relationship. Some of the indicators are: Water demand, access to safe water and Water availability. Other indicators can be use in order to complement the assessment which are: intermittence, losses, coverage of low income population and others. The former parameters are selected to have a broad overview of the needs.
Water demand (Wd): the amount of water used in the city is usually obtained by the mean water consume per capita (Wu) (L/day/person) multiplied by the population. It could also be mapped taking into account the density through the city.
Demand usually covers not only the per capita consume, but also the lack of efficiency16 of the services in losses by the system such as the network (annex B shows the estimation of water demand). The Wu is also function of the conservation16 by the population. Usually in some developed country the efficiency is high but the conservation is low. In developing countries the efficiency usually is low because of the large amount of water lost in the networks distribution. Wd can be assessed by using information existing in the city or by the use of the population and the Wu estimated by comparison with other cities (see table in annex B).
Access to safe water (ASF): the proportion of the population which have safe water. This information should exist in the utility.
Water availability (Qa): it is the flow available in the water supply basin in order to attend the demand. The water availability is
Qa = Qy-Qe-Qod (5.1)
16 Efficiency is related to reduction of demand by the efficiency of the service; Conservation is related to the consume by the population

69
where Qy is the flow availability or water yield from the basin (natural ore regulated by a reservoir). The procedures to estimate the values are described in Annex A; Qe is the environmental flow which should be left in the river in order to allow environmental sustainability. This flow should have a variation along the time. The estimative of this flow, as a first guess for this assessment, can be a proportion of the mean flow (~3 - 10%, depending of the natural conditions); Qod is the sum of other water demand in the basin.
In addition, is important to understand the water rights in the basin and the distribution of the flow from upstream do downstream. In some countries the water rights is bought in the market (West of USA, Australia and Chile). In others the water rights are given based in many conditions where the human consume has the highest priority in the potential conflict (Brazil).
The analysis of water supply using the indicator should be in: (a) the existing lack coverage; (b) the available water and required coverage; (c) lack of infra-structure of regularization, treatment and distribution; (d) What are the required investments?
Sanitation
Sanitation assessment is based in the load from the city and the capacity of the water to receive this load. Sound solutions is to develop sanitation based only minimization of load left to the environment, but there are many stages and capacity of investment in a city/country in order to achieve its optimum sanitation. In that way it is important to estimate the capacity of the water body to receive this load and plan the strategy in order to achieve taking into account social and economic requirements.
Access to basic sanitation (ABS): the proportion of the population which has septic tank or sewage collection from network. In addition, the proportion of the population which has full sanitation (named used here) which represent the sewage collection and its treatment at least at secondary level.
Load Index: The load index is the relation between the loads left to environment to the gross generated load by the city. The best sanitation is obtained by minimizing its value. There are the following types of water body which receives the load: Groundwater (Gl) and Surfaces flow systems (rivers, lakes and reservoir) (Rl) and coastal:
Groundwater: The sewage can be disposed in the groundwater by septic tanks or infiltration systems used in the city
Surfaces: the sewage disposed in the streams, lakes, reservoirs and coastal.
These indicators are estimated as described in the annex A, and represent the amount of waste delivered to the water bodies.
Support capacity (Sc); It is the capacity of the natural system has to support the load. There is groundwater support capacity and surface support capacity.

70
Groundwater support capacity (GSC): This index is function of the load and the infiltration capacity of the soil. When the communities are small with a low urban density the contamination and the soil has capacity to infiltrate and dilute the sewage, it can be used as preliminary solution.
Stream support capacity (SSC): this index represents the receiving water body (stream or reservoir) load capacity. In this scenario the capacity has to be related with the total loads from sewage and stormwater mentioned below (see annex B).
Taking into account the existing conditions is important do access: (a) how much of treatment is required? (b) How much of the network is required? Based on the indicators is possible to estimate the required investment in treatment and network.
Urban Drainage
Urban drainage assessment is based in quantitative and qualitative indicators. The peak flow increase with urbanization, in order maintain the peak flow inside of the drainage capacity, avoiding floods, a detention volume is required. In this study the detention volume is defined as the required volume in order to decrease the urbanized peak flood to its existing capacity. It is used as an urban drainage quantitative indicator.
The qualitative indicator used is the load from stormwater which is delivered into major drainage and streams. This indicator is based on the load from the stormwater which is estimated for the same water quality parameters used in sanitation load. Annex B presents the methodology developed in order asses these indicators in the urban environment.
The main questions in this scenario are: Is there floods in the stormwater? Is the city moving from downstream to upstream without control of volume and peak increase? If the answers are positive for these questions, the indicators can give you the first guess of investments (see chapter 6).
Total Solids
Totals solids are the sum of land erosion which results in sediments on the streams together with degraded areas and Solid waste which are not collected by the services in the city, resulted from leaves, litter and waste produced by the population. As it was described in the chapter 1, the source of these types of solids is from different actions in the city. The erosion is developed by bad practices in the development of new construction, leaving the surfaces unprotected, which allow the erosion eroded by rain and flow velocity, after urbanization. This process usually is the source of the degraded areas in the city.
The Solid Waste is consequence of bad habits of the population, lack of sound services in collecting and cleaning streets and disposal.
The indicator used for the sediments is the change in the sediment yield in function of the urbanization in relation to its natural conditions (Ls). The indicator used for solid waste is the efficiency of the services or the proportion of solids in the drainage (Sd). Some information which can be used in the estimation of these indicators is presented in annex B.

71
These indicators are very difficult to find, but they were included in here in order to help plan the future monitoring and preparation studies for the projects.
5.2.3 Urban waters impacts and goals indicators
Urban water impacts and goals indicators shows if the there are sound services in the city. Assessing this information is possible to understand the city sustainability in short medium and long term goals. There are also indicators of efficiency which usually are specific to each service. The conservation indicators on urban waters are those which minimize the impacts on the environment and on the people.
The urban waters indicators proposed in this document will be difficult to assess at this stage because of the lack of information’s but they could be used as suggestion along the investment and future assessment and a guide and goals to measure the output of the investment. Table 5.2 presents the recommended indicators of goals.
Water quality
Most of the countries have legislation related to water quality downstream of the pollution source and classification of river for environment license. Water quality parameters such as BOD, OD and Coliform assess the conditions of rivers downstream of the treatment plants, taking into account river capacity and Nitrogen and Phosphorus for lakes and reservoirs (see tables at annex C).
Table 5.2 Urban waters Impacts and goals indicators
Indicator Justification Objective
Water quality Assess the management services of sewer, urban drainage and solids and water supply conditions of the
basins.
Sustainability of the urban services for the city
Flood frequency Minimize the floods places in the city by eliminating the events for a
selected risk
Reduce social and economical losses
Degraded areas Eliminate the degraded area in the city as result of pollution and
erosion or sedimentation. Improve amenities in these areas
Improve quality of live for citizens in degraded area with
amenities
Health Reduction to WHO standards the water related diseases such as
diarrhea, leptospirose, dengue,etc
Increase live expectation and reduction of children’s death
index

72
In order to assess the water quality along the city, as result of the urban water services is important to understand that there are two critical flow conditions:
(a) During draught the natural flow is small and the dilution capacity of the streams is small. For permanent loads such as from domestic and industrial sewers this is the critical condition. Assessment of water quality concentration has to take into account the flow in order to correctly assess the conditions of design the services related to sanitation.
(b) During storm conditions the load from stormwater is important, since in the beginning of the storm the pollution the load is high (see chapter 1) and even with more dilution capacity it is likely to have a high concentration downstream of the city. In the stormwater water quality parameters it is not the organic matter which are important but the metals which comes from washing surfaces.
Taking into account the above information it is recommended to ask for monitoring information from water quality parameters taking into account the discharge of the streams and level and volume of the reservoirs.
Flood Frequency
It can be assessed using existing information of the city such as:
(a) Mapping flood distribution and frequency in the city. Usually the municipalities have a map of the places which the flood is frequent;
(b) The sub- basins with urban occupation and flood map allow a qualitative evaluation the main source of the problems;
(c) Recommend a survey of the flood distribution by interviewing professionals, ONGs and population nearby the flood places. This information is very important in order simulate the previous floods and quantitatively assess its impacts.
The assessment and strategic plans goals is the elimination of the flood places and frequency for a specific where the investments are lower than the damage cost.
Degraded Area
In the urbanization process, if the velocity increase is not controlled, drainage develops erosions creating degraded area. A degraded area can also be developed by sediment deposition when the flow capacity to transport the sediments is small. The assessment is done by:
(a) Mapping of the existing degraded area;
(b) Identification of potential degraded areas based on the urbanization and starting process of erosion or sedimentation.
(c) Identification of the main causes which could be mitigated by non-structural mechanisms and structural recovering.
Health
Assessing the existing statistics related to diseases related to sanitation, as discussed in chapter 1, and its evolution in time, allow the evaluation of the results from the sanitation services. It is recommended to take into account:

73
(a) Identification of the main water related diseases taking into account the reported cases in the city;
(b) Identification of the main causes of the diseases, mainly developing the lack of the water services and the diseases numbers;
(c) Recommend the monitoring of indicators for assessment of the investments.
5.3 Assessment
Assessment is the assembling of the qualitative and quantitative assessment development which is
(a) Indentifying the main issues based on the instruments prepare in chapter 4 with the issue matrix (annex A). This matrix was developed based on frequent issues found in developing countries;
(b) After this qualitative assessment in this chapter was presented some indicators which could be use in order assess the magnitude of the problem. At this stage you may disregard the issues which are not quantitatively important;
(c) In some cities, some of the indicators could not be measured and is recommended to plan the future monitoring in order to get a future assessment of the existing problems and measure the result of the investments.
Some of the information’s would not be assessed at the first levels, but it is recommended to plan its evaluation and monitoring for the next phases of project. In this chapter the indicators has been identified in order to assessed quantitatively the issues, supporting or denying the issues found in the last chapter.
In the procedure (figure 5.2) the list of issues are consolidated at this step, together with the qualitative and quantitative descriptions of the issues, relating causes and impacts. In this assessment is important to identify the interrelation of the urban waters and developments to the issues. The final conclusion should support the following step of the methodology which is the strategy in the management of the solutions and actions, developed in the in order to solve these issues based in society real goals (see next chapter).
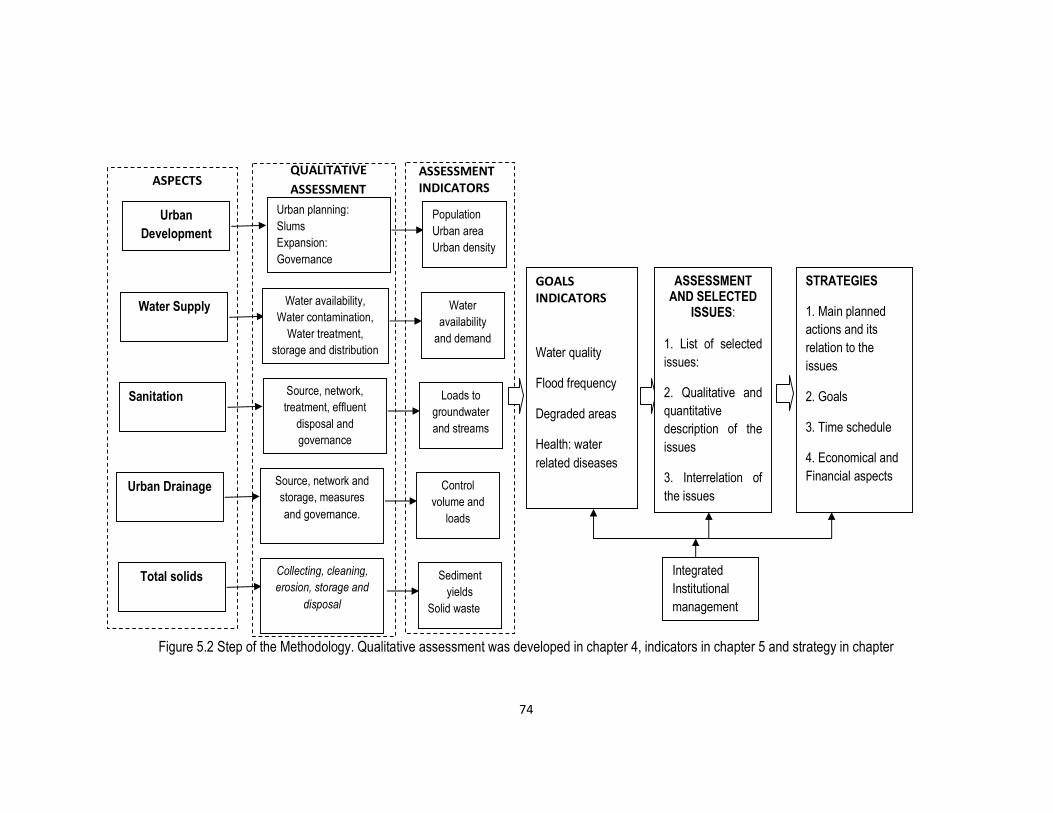
74
Figure 5.2 Step of the Methodology. Qualitative assessment was developed in chapter 4, indicators in chapter 5 and strategy in chapter
Urban
Development
Urban planning: Slums Expansion: Governance
Population Urban area Urban density
Water Supply Water availability, Water contamination,
Water treatment, storage and distribution
Water availability
and demand
Sanitation Source, network, treatment, effluent
disposal and governance
Loads to groundwater and streams
Urban Drainage Source, network and storage, measures and governance.
Control volume and
loads
Total solids Collecting, cleaning,
erosion, storage and
disposal
Sediment yields
Solid waste
ASSESSMENT AND SELECTED
ISSUES:
1. List of selected issues:
2. Qualitative and quantitative description of the issues
3. Interrelation of the issues
STRATEGIES
1. Main planned actions and its relation to the issues
2. Goals
3. Time schedule
4. Economical and Financial aspects
ASPECTS QUALITATIVE
ASSESSMENT
ASSESSMENT
INDICATORS
Integrated Institutional management
GOALS
INDICATORS
Water quality
Flood frequency
Degraded areas
Health: water related diseases

75
66.. SSTTRRAATTEEGGIIEESS
In the previous chapter the issues were identified and selected which are the main important. In chapter are discussed the development of strategies to solve this issues through policies, plans and projects. The strategy is based on the conceptual framework of the IUWM described in chapter 1. It is a combination of Integrated Plans and projects based on sound policies which should be developed in order to cope with the urban water issues.
In the following item is presented the IUWM Plan, strategies and goals and main concepts used in its development (figure 6.1). The Strategy may be developed by three major steps, scheduled in time, which are presented in the second item of this chapter (Action Plan). In addition, in the third item of the chapter, is described the assessment related to cost of investments and funding instruments.
Figure 6.1 Integrated urban Management
6.1 Plans and Strategies
In order to deals with the issues, it is required an IUWP Integrated Urban Water Plan (see chapter 1.10) which will address the urban waters aspects. Table 6.1 shows the overall relationship of the issues, planning strategies and mechanisms. Figure 6.2 shows the relationship of plans and goals.
The planning has two major measures: Structural and non-structural. The structural measures are projects in order to change the actual conditions, improving the coverage of water, sewer, urban drainage control and solid waste management. The non-structural measures are used in order to prevent the future impacts by improving institutional and management aspects of urban waters.
The main issues were identified in the last two chapters. Usually the main aspects in each component are the following:
• Urban planning: urban density distribution taking into account water demand and load, minimization of impervious areas;
• Water supply: protection of water supply basin, improve coverage, reduction of losses and improve water quality distributed;
Plans and Strategies
Action Plan:
Time
schedule
Economical
and Financial
plan
Integrated Urban Water Management

76
Figure 6.2 Plans and strategies
• Sanitation: improve sewer network coverage and housing collection together with its treatment and disposal, increasing reuse;
• Urban drainage: minimization of the floods in urban drainage and reduction of stormwater pollution;
• Solids: reduction of sediment yield by managing constructions sites, improve service for reduction of solid waste in drainage, develop recycling programs and minimize solid waste volumes.
• Institutional aspects: develop regulation for integrate urban water services through an Agency and outsourcing the services (preferences for only one company). Regulate the responsibility on impacts transference and control and develop economic mechanism for cost recovery.
• Environment planning: it requires a development of mitigation in degraded areas, water quality and integrated the urban environment by conservation of planned areas.
URBAN MASTER
PLAN
URBAN
DRAINAGE
WATER
SUPPLY
TOTAL
SOLIDS
SANITATION INSTITUTIONAL
REFORM
INTEGRATED URBAN WATER PLAN
GOALS:
Environment, health and amenities

77
Table 6.1 Relation among Issues and Plans
Areas of assessment
Main issues Planning strategies Mechanism
Unsustainable Urban development
High density and small area for public use, impervious areas, unprotected surfaces, high sediment yield (erosion) together with degraded areas
Non-structural measures Regulation new constructions development taking into account these potential impacts, economic incentives for conservation and preservation areas;
Structural measures: recuperation of degraded areas, rehabilitation of urban spaces
Review or development of the Urban Master Plan
Limited quality of urban water Services
Population without water supply; lack of sewer collecting and treatment; lack of solid services; lack of urban drainage and flood control management; contamination of water from the basins
Non-structural: economic incentives for water supply basin, regulation for urban drainage impact transference and for housing connections to sewer’s network. Develop programs for solid waste educational and recycling incentives.
Structural: water supply and sanitation investment planning to increase coverage taking into account all components; Urban drainage Plan in order to control the impacts in each city basin; Improving the Solid Waste services with specific goals.
Integrate Urban Waters Management Plan developed mainly by basins / areas of coverage in the city.
Lack of integration on the city management
Fragmented institutions without goals, client services assessment or integrated development.
New legislations and Reform of the Institutions dealing with Urban Waters management in the city
Institutional Reform Program

78
As it can be seen in table 6.1 there are three major planning to be developed which are the following: (a) Urban Master Plan; (b) Integrated Urban Water Plan; (c) Institutional Reform. Figure 6.2 presents the interconnections of the plans and the goals.
The overall framework of the Integrate Urban Water Plan is proposed in the figure 6.3 describing the combination of policies, plans, measures and outputs of the plans, which are:
Policies
In the policies are defined the principles and objective of the Plan, together with the goals and strategies related to most of the aspects. In a complex Plan such of IUWM management there are many strategies which should be defined based on goals and in the implementation.
The Urban Scenarios are the actual and the city expansion taking into account the slums and the informal city. The plan has to be done for periods of 10, 20 and 30 years in the future, taking into account the economical and social changes in the city based in the country development. The risk is related to design of water supply, receiving waters, urban drainage and other probabilistic risk assessment.
Assessment
In the assessment there are two major components as presented in the chapter 4 and 5, the urban water services: water supply, sanitation, urban drainage and solids; and the impacts related to the goals which are health, environment and amenities. This assessment has to be developed considering the services issues which are impacts, taking into account aspects such urban development, investments, institutional and goals.
Measures
Non-structural Measures: This measures are developed by implementing the new policy for Urban Waters by legislation and reform of managing institutions and practices in the city, including “command-control” (enforcement) and economic mechanisms for the services.
Structural Plans: in this group are the structural measures of implementing the water supply, sanitation, urban drainage and solids measures in order to achieve the goals of sustainability in the city.
Results or Products
The results of the plan are the implementing strategies in time and programs for medium and long terms activities. The implementing strategies are for non-structural and structural measures. The implementation of non-structural measures usually has the following steps:
(a) Proposal of the institutional reform on legislation or regulation and management
(b) Discussion and approval in the system;
(c) Implementation of reform in the institutions and/or improvement of the management practices.
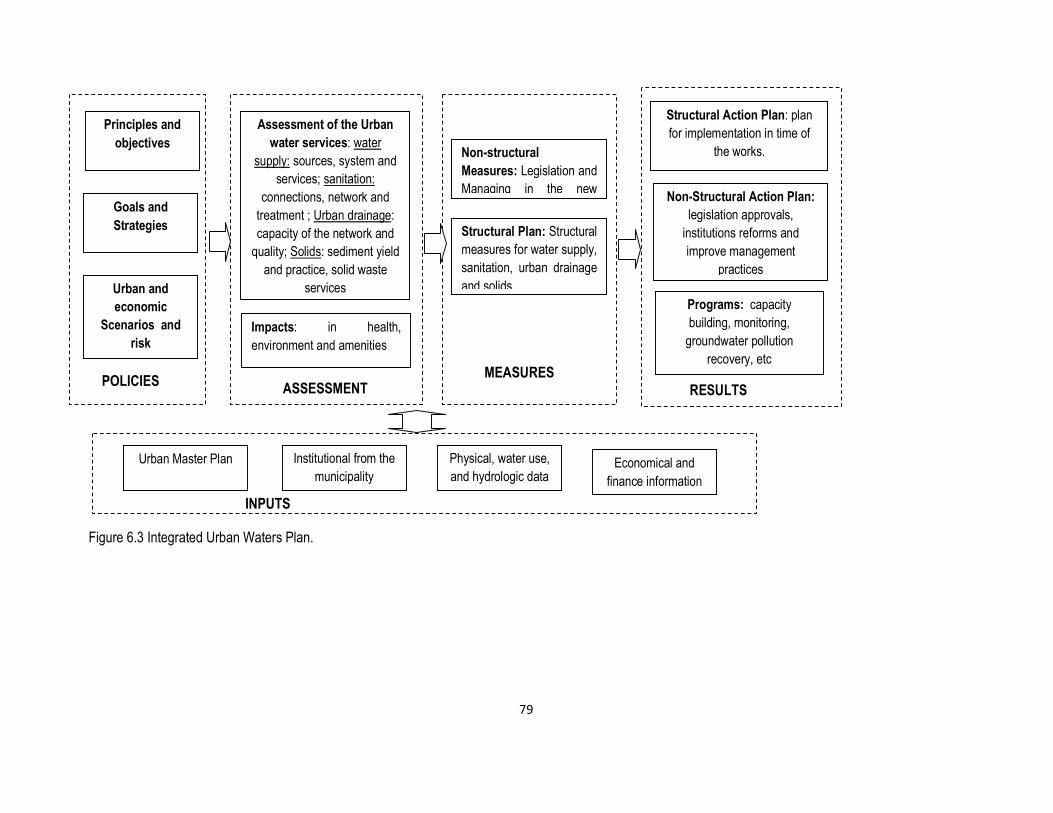
79
Figure 6.3 Integrated Urban Waters Plan.
Principles and
objectives
Goals and
Strategies
Urban and
economic
Scenarios and
risk
Assessment of the Urban
water services: water supply: sources, system and
services; sanitation: connections, network and
treatment ; Urban drainage: capacity of the network and
quality; Solids: sediment yield and practice, solid waste
services
Impacts: in health, environment and amenities
Non-structural
Measures: Legislation and Managing in the new
Structural Plan: Structural measures for water supply, sanitation, urban drainage and solids
Structural Action Plan: plan for implementation in time of
the works.
Non-Structural Action Plan:
legislation approvals, institutions reforms and improve management
practices
Programs: capacity building, monitoring, groundwater pollution
recovery, etc
Urban Master Plan Institutional from the municipality
Physical, water use, and hydrologic data
Economical and finance information
POLICIES ASSESSMENT
MEASURES
RESULTS
INPUTS
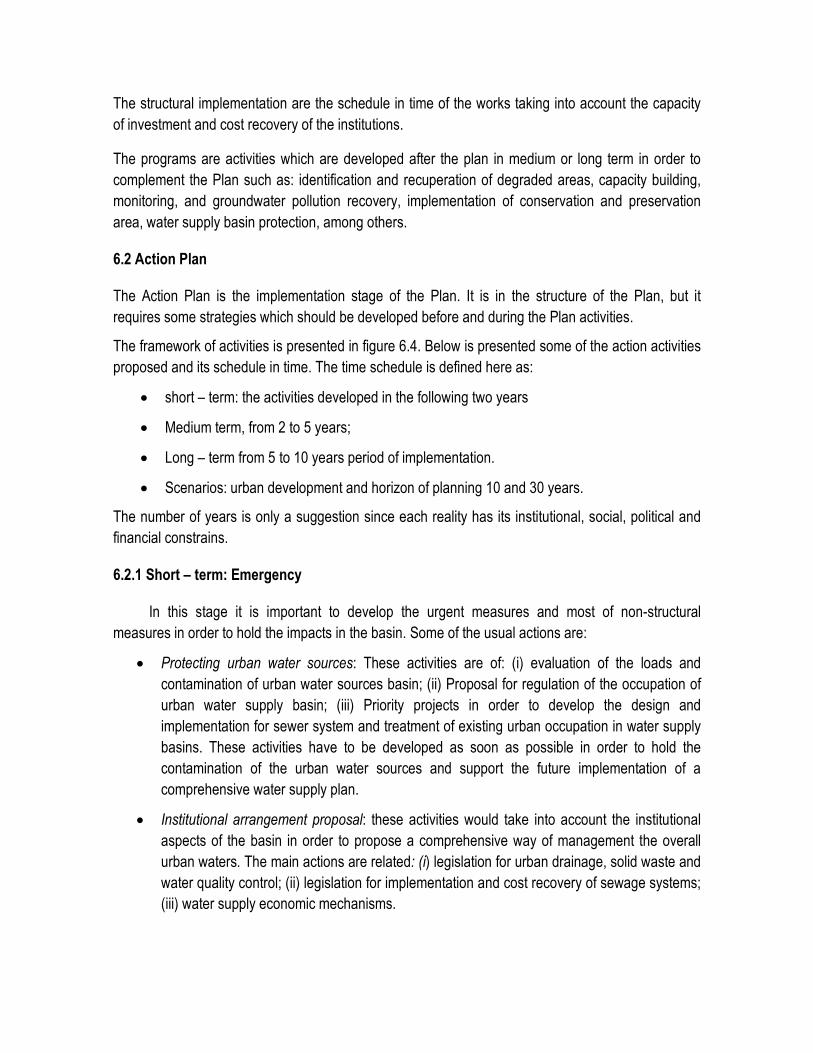
The structural implementation are the schedule in time of the works taking into account the capacity of investment and cost recovery of the institutions.
The programs are activities which are developed after the plan in medium or long term in order to complement the Plan such as: identification and recuperation of degraded areas, capacity building, monitoring, and groundwater pollution recovery, implementation of conservation and preservation area, water supply basin protection, among others.
6.2 Action Plan
The Action Plan is the implementation stage of the Plan. It is in the structure of the Plan, but it requires some strategies which should be developed before and during the Plan activities.
The framework of activities is presented in figure 6.4. Below is presented some of the action activities proposed and its schedule in time. The time schedule is defined here as:
• short – term: the activities developed in the following two years
• Medium term, from 2 to 5 years;
• Long – term from 5 to 10 years period of implementation.
• Scenarios: urban development and horizon of planning 10 and 30 years.
The number of years is only a suggestion since each reality has its institutional, social, political and financial constrains.
6.2.1 Short – term: Emergency
In this stage it is important to develop the urgent measures and most of non-structural measures in order to hold the impacts in the basin. Some of the usual actions are:
• Protecting urban water sources: These activities are of: (i) evaluation of the loads and contamination of urban water sources basin; (ii) Proposal for regulation of the occupation of urban water supply basin; (iii) Priority projects in order to develop the design and implementation for sewer system and treatment of existing urban occupation in water supply basins. These activities have to be developed as soon as possible in order to hold the contamination of the urban water sources and support the future implementation of a comprehensive water supply plan.
• Institutional arrangement proposal: these activities would take into account the institutional aspects of the basin in order to propose a comprehensive way of management the overall urban waters. The main actions are related: (i) legislation for urban drainage, solid waste and water quality control; (ii) legislation for implementation and cost recovery of sewage systems; (iii) water supply economic mechanisms.
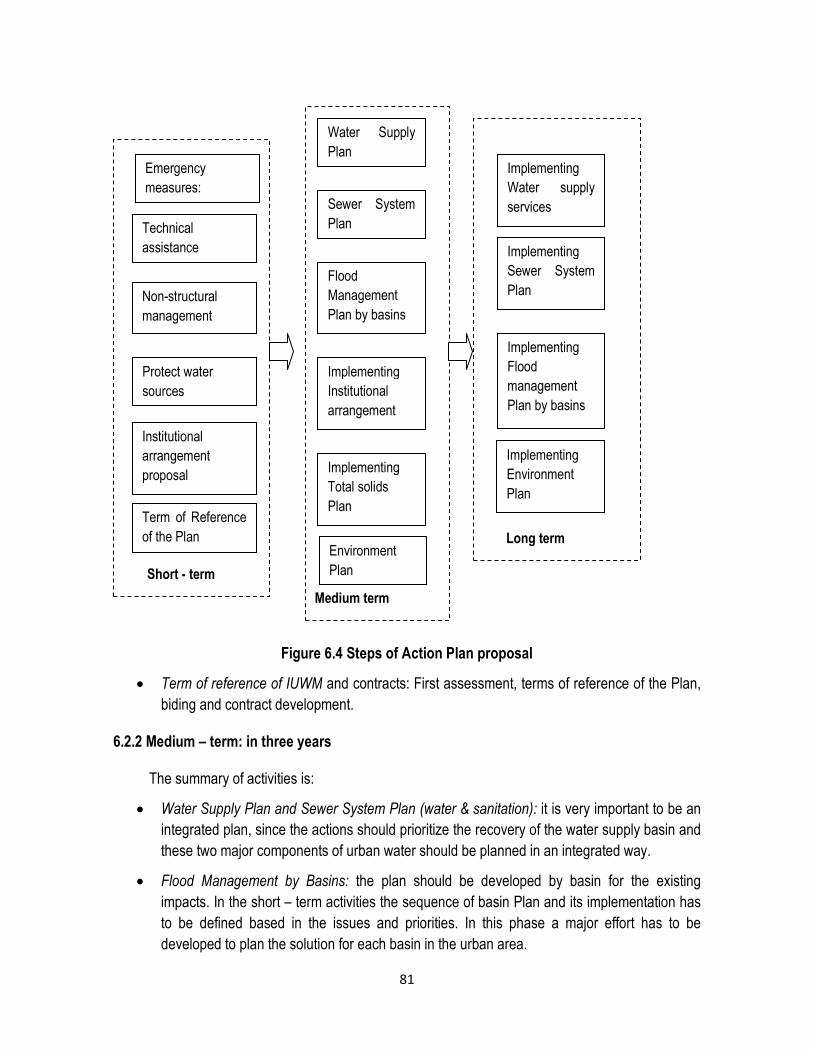
81
Figure 6.4 Steps of Action Plan proposal
• Term of reference of IUWM and contracts: First assessment, terms of reference of the Plan, biding and contract development.
6.2.2 Medium – term: in three years
The summary of activities is:
• Water Supply Plan and Sewer System Plan (water & sanitation): it is very important to be an integrated plan, since the actions should prioritize the recovery of the water supply basin and these two major components of urban water should be planned in an integrated way.
• Flood Management by Basins: the plan should be developed by basin for the existing impacts. In the short – term activities the sequence of basin Plan and its implementation has to be defined based in the issues and priorities. In this phase a major effort has to be developed to plan the solution for each basin in the urban area.
Emergency measures:
Technical assistance
Non-structural management
Protect water sources
Institutional arrangement proposal
Short - term
Water Supply Plan
Sewer System Plan
Flood Management Plan by basins
Implementing Institutional arrangement
Implementing Total solids Plan
Medium term
Implementing Water supply services
Implementing Sewer System Plan
Implementing Flood management Plan by basins
Long term Environment Plan
Implementing Environment Plan
Term of Reference of the Plan
Protect water sources

82
• Implementing Institutional Arrangements: In this phase the institutional arrangement planed in the short – term phase has to be implemented in order to cope with all development which is under development in the basin such as the Plans and the implementations.
• Implementing Total Solids Plan: The total solids Plan implementation could start in the previous phase, as a pilot, but in this phase the implementation should cover all the area. It should take into account the institutional structural reform of the previous component.
• Environment Plan: Development of a plan for the basin and cost in order to recover its natural assets and develop a conservation of the areas together an improvement of recreational conditions for the population.
In the development of the plan it is important to construct the overlapping aspects in order to develop integrated solutions. These plans should be developed together at the same time with the same company in order to develop the integrated components.
6.2.3 Long – term: in five years
This phase represents the step of the implementation of the measures designed in all plan. It is could start in 5 years or less (depending of planning investments). Assuming it would be developed by 10 years.
6.3 Economic Assessment
The first economical assessment of the former activities allow the decision makers to have an idea of its capacity of implementation in time and the required amount of funds it need to borrow from Central Govern and/or from International Banks. This is the first assessment of requirement investments and at this stage are overall estimative based data from other countries or other cities in the same country.
Cost of the Implementation and operation of the Services
In the annex B are presented tables of the unit cost for implementation and operation for water supply, sanitation, urban drainage. There are an important interval of variation of the costs because of the conditions of each city and the alternatives. These numbers are global and used as first estimation.
In water supply and sanitation the simplest estimation is obtained by the number of persons which is supplied by the services. In urban drainage indirect methods are used and there is the cost for implementation of a new drainage and cost to control the impacts of the floods existing in the drainage. In Solid Waste are dependent of the number of persons, extension of the public areas and distance of disposal sites.
Operation and maintenance costs are estimated based on the annual proportion of the investments.

83
Investment capacity
The investment capacity is related to city income in taxes and population income to support new investment and cost recovery in the development of the utilities. The water supply and sanitation bills together with urban drainage and total solids bills should represent a small proportion of income of the owner, allowing the investment and the services. There are many structures of cost recovery which could be used based on the social and economic conditions of the communities for investments and for services.
The cost recovery on the investment can be developed by:
Subsidy: the subsidy can be by Central Govern with nation overall taxes: cross – subsidy by larger income population paying for low income using different tariff by city areas or consume; by overall and uniform taxes independent of the use of the services (which maybe unfair and has low conservation of the resources);
Full cost recovery: In this scenario there are two major costs: investments and operation and maintenance. The investments costs are financed and charged along the time to the properties. The operation is the service cost which is permanent and for water, sanitation and solid waste is dependent of the use of the service, but urban drainage is dependent of impervious area and is fixed along the time per property. In some countries solid waste is also assumed as constant cost.
At this stage of assessment is important to evaluate the total cost of investment as mentioned before together with the cost of operation and assess the capacity of finance the investments and the recovery by the population together with the payment of the services.
6.4 Institutional aspects
Institutional construction of urban Waters is based two main components: (a) legal regulation which describe the main aspects of the policies adopted; and (b) governance of the services in the city taking into account the related economic aspects of services sustainability.
Some of main institutional main issues of urban waters have been described in chapter 4, but in here some of these selected aspects have to be solved in order that the investments in the service are sustainable. They are:
Governance
Governance of the services has to be planned in all services. Most of the cities in developing countries have a fragmented management since Water Supply and Sanitation usually has a service by public or private company, but Urban Drainage and Solid Waste do not have sound governance and cost recovery. In this scenario, the result is a large amount of garbage in streets and in rivers with frequent floods.

84
The best governance arrangement usually is to have in the same institution (private or public) all four services because of the following: (a) scale of economy in the services and in the charging services; (b) lack of dispute for interface conflicts such as: sewage in stormwater network and vice-versa, solid waste in the drainage, cleaning the networks and detention ponds, among others; (c) population easily identify the service providers and can follow its performance; (d) Services performance can be better measured and related to the institution.
When there are three institutions (water supply & sanitation), urban drainage and solid waste, the responsibility of the service is fragmented and it is common to have conflict among the institutions and professionals with loss of service performance.
In many cities the opportunities are that the existing water & supply institution assume all the service, but usually the cost recovery of the additional services were not developed and the funds are mixed in the overall budget of the municipality which changes every year with the existing administration.
In the way to solve this problem there is a need to develop the utility in urban drainage and solid waste. It is more frequent to find solid waste services established but urban drainage is uncommon. In Brazil, with more than 5,000 counties there are only two cities with Stormwater Utility (both public), but with a weak cost recovery. Usually the main difficulty is to include a new cost for the population. It is politically difficult for the decision makers.
The governance model is strongly dependent of the economic arrangement for stormwater and solid waste. The alternatives usually are:
• One institution for all four services:
• two institutions, one stormwater and solid waste, keeping water supply & sanitation in another and existing company;
• three institutions: stormwater, solid waste with one institution each and water & supply and sanitation with the third one;
There are also combinations of the above three alternatives, since the city may have its own institutional complications.
It is recommended that the governance together with economic sustainability should be a component of the investment for the city. The output should be an integrated governance and cost recovery of the institutions in the city
Economic sustainability
The cost recovery of the utilities has important differences in developing countries. In water supply & sanitation is possible to charge based on water use and the infrastructure of the projects are design taking into account the forecast consume of the population. Solid Waste is also based on the amount generated of garbage, but most of developing countries charge the service by a flat tariff per year which does not allow conservation or even efficiency of the services. In Stormwater the cost

85
should be based on the amount of overland flow generated by the proprieties which in the end is function of the impervious areas. However, most of the cities are funded by a common tax in the county budget which usually results in lack of maintenance and prevention to urban drainage floods.
In stormwater the utility is developed based in the cost recovery based on the impervious areas of the properties. Usually an impervious area generates 6 times more overland flow than a pervious area. The mean tariff in West Coast cities of United States is about US$ 6/month/propriety. In a city of about 1,000,000 persons with a density of 80 persons/ha, and mean size plot of 400 m2, with a mean tariff of US$ 5/propriety/month will have a budget of about US$ 18.750 million /year for the service.
In solid waste the cost should be related to the volume produced by the population, since it will increase conservation by the reduction of the amount and increase of recycling. One of the frequent economic mechanisms used in some countries is to charge the cost of the service in the packing used for the solid waste.
In the institutional aspects of the strategic plan is recommended to plan the improvement and implementation of the utilities of these services.
Legislation/Regulation
The legislation or regulation is a key aspect in giving support to the governance. Some of main aspects which should be address in the legislation are:
• Concession of the services and definitions of the indicators of performance with assessment by independent institution;
• Conditions for charging for the services as mentioned above. The jurisprudence of each country in the water services may change. In Brazil, tariff is for water supply and sanitation, for solid waste and drainage is tax. The first charge by consume and the tax is a flat value changing depending of the permanent use of the service;
• Legal incentives and Enforcement: In sanitation there are many systems in developing countries which do not work because of the lack of connections to the houses. Usually it is because of cost related, existing septic tank and lack of enforcement; in an urban drainage the legislation should not allow the increase of the flow to public network from individual urbanization; incentives do conservation of water supply basin areas by the owners; Penalties and economic incentives in solid waste.

86
7. CASE STUDIES In order to illustrate the assessment two cities in developing countries, with different level of sustainability, were selected in order to apply the procedures proposed. The first one was Jakarta in Indonesia which was part of a preparation project developed in August of 2008 and Medellin in Colombia developed in June of 2009.
7.1 Jakarta, Indonesia
7.1.1 Characterization
Indonesia is a country of 237.5 million inhabitants (2008) and 50% of urban population. Its PNB is US$ 837 billion (2007) with a per capita income of US$ 3,725. Urbanization is a main process in the larger cities of the country such its capital Jakarta (figure 7.1).
Figure 7.1 Population and urbanization in Indonesia
Urban areas and administration areas: The Greater Jakarta area covers a land area of 7,300 km2 and has a population of 24 million, up from 12 million in 1980, which makes it one of ten largest metropolitan areas in the world. Greater Jakarta is better known as Jabodetabek, after the five most important cities in the area: (i) DKI Jakarta (population 8.9 million); (ii) Kota Tangerang and Kabupaten Tangerang (combined population 4.7 million); (iii) Kota Bekasi and Kabupaten Bekasi (combined population 4.0 million); and (iv) Kota Bogor, Kabupaten Bogor and Kota Depok (combined population 6.0 million). Jabodetabek has a mean density of 31 inhabitant / hectare.
0
50
100
150
200
250
300
1940 1960 1980 2000 2020 2040
years
population, in millions
0
10
20
30
40
50
60
70
80
% de população urbana
population
urban
projection

87
Urban development of Jakarta Metropolitan Area has been very fast since the middle of last century. Jakarta population grew from less than a million to nowadays near to 8.9 millions. Figure 7.2 shows the population variation in the period of 1992 to 2002 (figure 7.2). This urbanization process is occurring in Indonesia which has near to 50% of urban population and moving fast to about 70% in 2030. Jakarta Metropolitan area will still increase its population in the following years. Figure 7.1 shows the evolution of Indonesia population and its proportion of urban population.
Figure 7.2 Scenarios of Urban Occupation in Metropolitan Area of Jakarta (source: Hongjoo Hahm and Jan Jaap Brinkman).
The administrative area of DKI Jakarta (administration area of the city) is enclosed by the Ciliwung River Basin. Within DKI, the river branches into dozens of smaller rivers, of which the Sunter, Angke, Cakung, Krukut and Grogol are the most important. Most of DKI Jakarta is flat and low. About 40% of the city (and most of North Jakarta) lies below sea level.
Water systems and urbanization: There are thirteen Rivers which flow through the Metropolitan area of Jakarta (overall basin of 1,100 km2), where Jakarta is inside of this area (650 km2) (Pichel, 2005). Ciliwung basin is the main basin with 337 km2 (at Manggarai) which flow through downtown Jakarta (figure 7.3) by two canals the WBC a constructed canal (in 1918) and the natural (Lower Ciliwung basin). The floods in the city have a long history of the events as has been described in many documents (NEDECO, 2004 and Pichel, 2005).
The urbanization has been developed from the coastal area to upstream and to West and East as shown in figure 7.2. It has forecasted that the process is going to continue with smaller rate of population increase for the coming years. The urban density of DKI is already about 136 inhabitant / hectare, which is very high for an urban area of that size.
Urban waters: With the population grow and urban density some important problems has decreased the quality of live and impact the environment because of the lack of water supply and sanitation,
1992 2002

88
frequent floods and high vulnerability of the population, lack of solid waste services and transference of impacts from upstream to downstream in that Metropolitan Area.
According to the Joint Monitoring Program by WHO and UNICEF access to improved water supply stood at 77% and access to improved sanitation at 55%. But other sources (SUSENAS) it mentioned that 47% of the urban and 51% of rural population have safe water supply. Disposal and treatment of sewage is available for less than 2% of the population.
Figure 7.3 Ciliwung basin.

89
7.1.2 Identification and Analysis of the Issues
The assessment developed for Jakarta was developed by 7 days during August/2009 with 4 days of driving in the city and in the other meetings and review of the documents. An assessment report was developed and this item presented is a synthesis of it.
Urban development
The main issues in the urban development are related to lack of urban master plan, large number of population in slum and very dense occupation, high expansion of urbanization in the upstream basins and areas of municipal basins (source of water supply).
Urban water services
Urban development in Jakarta has move from coast to continent and from downstream to upstream in the basin. Jakarta water supply sources are from upstream or neighbor’s basin. After the water is used by the population it is treated by septic tanks and delivered to the groundwater and by overspill of the tanks in the drainage. This system of treatment in highly inefficient, leaving a very important load to the rivers. In that way, the water from polluted river cannot be used as source for water supply. This water supply and sanitation practice is using clean water upstream (not so actually!) and delivering polluted water downstream. Since the urban development is spreading by Java Island and upstream, most of the upstream basin is going to be polluted and the source of clean water lost. In addition, the urbanization is competing with agriculture for space and for water. Irrigation for rice17 is one of the main crop and water use. Since the city does not have capacity to supply all the water, the population finds its own solution by pumping from groundwater which creates risk of pumping contaminated water (shallow aquifer) or salty (when near to the sea).
The urbanization increases impervious areas together with the flood peak and the flood frequency for the same rainfall. The urbanization also increases the solids production (sediments and solid waste). Due to the lack of services, most of the solid waste arrives in the rivers, decreasing its flow capacity (and the flood frequency) and increasing the pollution since most of storm water pollutions arrives in the rivers together with the solids. Pumping of groundwater together with the reduction of infiltration due to impervious areas is creating subsidence in low lands areas which decreases its drainage by gravity and flood conditions. In this scenario the area can be flooded by upstream and by the sea.
Water and sanitation: The main sources of supply are Citarum system, Bogol in Upstream Ciliwung Basin and Bantang area (see the distribution in figure 7.4 and table 7.1). The main water source is Citarum system with 82% of the water sources. It is estimated that the irrigation demand is 53% of the total and DKI is planned to use 86% from Citarum and 14 % from Batang area. In this scenario DKI will represent about of about 16% of the water sources. It can be seen that quantity is not the major issue since the irrigation are changing to urban and the demand of population is smaller than the irrigation.
17 Rice irrigation has a very high water demand, 1 L.s-1.ha-1, equivalent demand of about 400 inhabitant/day.

..
Figure 7.4 Water supply schematic configuration of supply and demand for 2025 (adapted from RIJKSWATERSTATT, 2003).
142
39.2
18.1 16.2
4.9
38.3
Citarum river
system
218.6 m3/s
31.2
10.8
1.7 5.4
17.3
3.3
22.2
6.0
2.2
9.1
26.2
42.1
Bogol
16.6 m3/s
Ciulung-Cileman
43.5 m3/s
West Java
Bantang
DKI Jakarta
irrigation
Water supply
reservoir

91
Table 7.1 Source of waters (assessment at 2025, source: RIJKSWATERSTATT, 2003) Water source Use Amount
m3/s % proportion of totals sources
DKI use % of the source
Citarum system Urban water Supply
77.5 29 36.1 86
Irrigation 142 53 - Sub-total 219.5 82 Upstream Ciliwung (Bogol)
Urban Water Supply
14.4 5.4 0 0
Batang area Urban water Supply
33.5 12.6 6 14
Total 267.4 100 42.1
The other major source is the groundwater which should be preserved. The water withdraw is from shallow aquifer and deep aquifer. The shallow aquifer in the urban areas is polluted by the urban sewers and septic tanks. This water is used by low income population because the cost of pumping is smaller but it is a source of spreading diseases. During a draught these wells are also dry which created a shortage for the population. The source of water which recharges the deeper aquifer is decreasing due to increasing urbanization and impervious areas together with the pumping volume for water supply. This situation is going to a collapse. The main consequence has been land subsidence in areas near the sea, increase of contamination risk of the deeper aquifer and salinization for low land areas near the coast.
The water distribution is limited to of about 50% of the population. The population which is not supplied by the network uses mainly groundwater. There is also a market of water by can and bottles. It has a very high cost which is paid by the poor. The water sources are of poor quality and the distributed water is not complete safe
Most of the load from domestic and industrial water uses is dumped in rivers and aquifer of the region without treatment. It can be seen that the flow dilution capacity of the river system are small in order to cope with the large load. RIJKSWATERSTATT (2003) estimated that in 2025 a load to be treated of 135 ton of BOD/day with a total cost of Rp 246 billions/year for 25 millions of inhabitants. It represents the operation and maintenance cost of the system not the investment.
This pollution is the source of contamination of water supply sources in Citarum System and most Ciliwung basin, which lost its source of water by contamination. It is amazing the lack of awareness of this type of problem, since it is the root of lack of safe water in this metropolitan area.
Stormwater: Stormwater is developed by outdated design, which assumes the water has to be send to downstream as fast as possible, which increases the velocity of flow and transfer the floods to downstream areas. The existing detention ponds are downstream near to the sea which did not decreases the peak flood which comes from upstream.
Some of the designed solutions for the urban drainage and flood control developed have been based in the design by reach instead a flood management taking into account the overall basin. The solutions were:

92
• Flow increase capacity in canals: Increasing the capacity of flow in a reach and transferring to downstream reaches;
• Deviation of river flow. When the flow of a river is deviated to other basins there is a need to cope with this increase in the other reach until the sea;
• Embankments and detention ponds: As it can be seen the largest detention pond are downstream near to sea. In this scenario the effect of the storage is limited to this short reach until the sea. If the detention would be upstream the effect of the storage would be for all downstream reaches;
• Bridge and embankments for roads sometimes decreases the channel flow capacity to downstream and creates local floods.
These works usually were developed to solve specific flood areas, sometimes transferring the flood to downstream areas without given an integrated solution for the basin. It happens not only in the rivers and major canal, but the minor drainage where upstream capacity is greater than downstream where if floods.
Total Solids: The main types of solids which are produced in the urban environment are: (a) sediments and vegetation produced by rainfall and flow velocity along the basin; (b) solid waste: residuals generated by the population such as plastic, papers and others. In the urban surface street cleaning, vegetation and sediments are collected together with the solid waste. Solids are important source of loads to the river systems since organic and chemicals arrives in the aquatic system aggregate to the solids. In addition, there are many types of garbage which take too long to disappear in the environment such as plastic.
The main effect of the solids in the urban drainage is the decrease flow capacity (conveyance), increasing the flood levels during floods. Bebassari (2008) evaluated that 4,000 m3/day of solids waste is spread out of in the city and part ends ups in rivers. It represents about 17.9% of total volume produced by the population. The total amount of solids in the rivers is 1.067 m3/day in which 921m3/day is from DKI Jakarta and 146 m3/day comes from upstream cities. This volume represents 9.1% of the river sedimentation.
Institutional
The management of urban waters is fragmented by many institutions in this metropolitan area. There are many different plan and projects which are in conflict to each other. The institutional development has been complex because of the changes in the central govern, water law and implementation of water resources authorities in the basins. It is a combination of institutions at various levels: central govern, provincial and local levels without integration. As a result the planning and development in the basin has been fragmented by isolated actions distributed in the area and for subjects. It can be seen that Water Resource planning is much more water allocation for irrigation and water supply. In the order way DKI is mainly dealing with floods and so on.
The management had the following issues:
• Lack of institutional arrangement which allow to integrate the solutions in urban water is the metropolitan area and in the basin which supply the region;
93
• There were many fragmented investments in flood management without taking into account future urban grow and taking into account only one type of solution (and expensive) of transferring peak floods to downstream.
• Lack of strategic integrates investments for water supply and sanitation in the overall metropolitan area.
Impacts
This condition shows that the source of the problems is the uncontrolled and unsustainable way the urbanization is developed in the city. The main risks are:
• Population health: some of the risks are: (i) the lack of effluent treatment and appropriate solid waste collecting and disposal create an internal source of contamination which could help the spread of many types of diseases or even an epidemic scenario; (ii) The contamination of water sources such reservoir by nutrients creates the spreading of algae and the risk of toxicity in the water supply; (iii) spreading diseases related to floods events such as leptospirose; (iv) contamination of groundwater and the water supply of population which uses this type of water;
• Flood risk: increase the flood risk, frequency and the damage for the population and mainly for the poor. This vulnerability decreases the economic condition of the region and the country. The population of Jakarta is occupying mainly the Ciliwung basin. The river flows from the mountains in direction to the coastal area in the sea. Important part of the population occupation occurred from downstream (coast) to upstream (higher elevation). It transfers the impact of flow increase, sediments yields and water quality to existing population living downstream. In coastal area the impact could be greater since the sea level is the hydraulic downstream control, together with the decrease in the river bottom slope and a smaller flow capacity. These conditions increased the flood frequency along the river and mainly downstream near to the coast.;
• Lost of environment: environments of the river and the coast are decreasing the resilience capacity with so much load deposit in the system. Usually environment put a price on it in the future for the population. The population is receiving environment
subsidy;
• Lost of safe water: the lack of safe water upstream and the capacity of distribution will leave no alternative to population, which will try to find out its own way which usually has more risk and it is more expensive. The international price of 1 m3 of safe water in the pipes usually is about US $ 1 to 3. In bottle of 20 liters comes to US$ 200 to 300/m3 and in a bottle of ½ liter in Amsterdam Metro is US$ 7,500/m3
Population vulnerability is increasing and the resilience to urban waters issues is decreasing with this type of development without sustainability.
In tables 7.2 ad 7.3 are presented the matrices and in table 7.4 the cause-effect relationships synthesize this assessment.

94
Table 7.1 Service Matrix
Main Aspects Selected Issues
Urban Planning
It is not taking into account urban waters
aspects
High proportion of slums, without
resettlement program and vulnerable
population to diseases and floods
There is no control on the expansion of the
metropolitan area and bad governance
Water Supply
Increasing water demand and conflict with irrigation in the upstream basins
Contamination of water sources by urban
development expansion without control of the
effluents
Larger part of the population without
water supply services and lack of plans
Use of groundwater with low quality and effect on land subsidence
Sanitation
Lack of awareness on sanitation services
Unsustainable Sources solution by septic tank
Lack of services
Urban Drainage The peak flow increase due to urbanization and
canal constructions
decreasing river flow capacity by
sedimentation of total solids
Sewage in the drainage Land subsidence
Lack integrated urban drainage assessment and planning
Solids Lack of collecting services
Lack of streets cleaning Lack sustainable disposable
Erosion High amount of sediments
Institutional There is no basin and administrative water
management
Lack of management control on urban
services
Lack of non-structural measures for urban
waters
Fragmented management
Lack of strategic investments on urban
waters

95
Table 7.2 Goals Matrix
Main Aspects Selected Issues
Health
High vulnerability of the population to diseases by water
contamination
Water supply contamined by
sewage: groundwater and upstream
sources
Flood diseases such as leptospirose
Floods
High frequency of flood impacts, mainly due to urbanization
Transference of flood impact from one part of the city to another
high amount of solids in the rivers
increasing risk
Lack of risk map and zoning
Lack of prevention and alert
Amenities
Small areas for amenities
Water systems contamined
Environment Rivers completed polluted with high level of loads and
solids
High level of air pollution and
contamination of surfaces
There is no plan or program for
conservation and preservation
Degraded areas

96
Table 7.4 Relation of causes and impacts
Main cause Specific aspects Impacts
Unsustainable Urban development
High density, impervious areas, unprotected surfaces and sediments
• Increase on flood frequency; • Sediments production; • reducing river conveyance;
Lack of urban water Services
50% of population without water supply; lack of sewer collecting and treatment; lack of solid services; lack of urban drainage and flood control management
• Water sources contamination; • Use of unsafe water and diseases; • Reducing river conveyance; • Lost of environment; • Land subsidence.
Bad management Unsustainable works such as canal, conduits, etc
Lack of institutional arrangement
• Transferring floods; • Lost of funds; • Lack of urban water services
7.1.3 Strategies
Targets and goals
The main targets in order to develop a sound strategy for the integrated urban waters management are:
• Sustainable urban development: Development of new urban development standards taking into account the sustainability on water issues: (i) limits for densification and impervious areas; (ii) reserve of areas for parks and flood management; (iii) restrictions and economic incentives for conservation of urban source basins;
• Protect the water supply sources: regulate the occupation of the water supply basin; control the load of water supply basin; improve its water quality;
• Improve de water supply distribution: development of a program of investment in order to increase the water supply network and improve the water supply quality;
• Develop a system of waste treatment: investment on the collecting and treatment system for all urban areas;
• Flood Control Management: develop regulation for new development, controlling the future flood increase; develop flood management plan for each basin;
• Total Solids Management: develop sound services for total solids in order to decrease the amount of solids in the drainage;
• Water and environment conservation: storm water pollution control, environment recovery of selected environment;
These targets have to be achieved by integrated management and interrelated actions inside of a space which covers more than a basin and three provinces. The development of this

97
integrated plan requires a review of strategies over the three major water sources and the metropolitan area, together with large investments in a longer period. Every components of the plan requires specific goals and strategies.
The framework presented in chapter 6 is totally applicable to this city in all steps because of the existing problems and required targets, as presented above.
Investments
The cost assessment present here is a very rough estimative based in international numbers which had as objective only to have a magnitude of funds required. In addition, the numbers are related to implementation which is the large amount required. There are costs for studies and O & M. The estimation was based on two space dimensions: the Jakarta DKI and Jabodetabek.
Table 7.5 shows the major number by sectors. The magnitude of the investments is US$ 2.225 and 6 billions for Jakarta and Jabodetabek, respectively. Assuming this investment would be done in the 10 years it would require about 0.5% per year of total gross production of city or the Metropolitan area.
Table 7.5 Investment required
Sector/data Jakarta DKI Jabodetabek
Population (millions) 8.9 24
Water supply1 (US $ millions) 267 720
Sewer network and treatment2 (US$ millions) 1,335 3,600
Urban drainage and Flood Management3 (US$ millions)
623 1690
Totals4 2,225 6,000
1 – Assuming requirement of 50% of population and R$ 60/person; 2 - assuming 100% of the population and US$ 150/person; 3 – assuming US$ 70/person for investment in controlling flood in urban drainage and flood control. It was checked with the cost by km2 of urbanized areas; 4 - Total solids services was not estimated because the investments are smaller and are inside of the error of this rough estimative.
7.1.4 Conclusions
Jakarta Metropolitan Area is an unsustainable urban area with many risks related to water and environment. This scenario is not important only for part of the population which is more poor or vulnerable, but also for the overall economical and social conditions of the country, since this is the main center of business and development.
Urbanization was developed with lack of integration of a sound infra-structure on urban waters and has move from coast to continent from downstream to upstream in the basin. Jakarta water supply sources are from upstream or neighbor’s basin. After the water is used by the population it is treated by septic tanks and delivered to groundwater and by overspill of the tanks in the

98
drainage. This system of treatment in highly inefficient, leaving a very important load to the rivers. In that way the water from polluted river cannot be used as source for water supply. This water supply and sanitation practice is using clean water upstream and delivering polluted water downstream. Since the urban development is spreading by Java Island and upstream, most of the upstream basin is going to be polluted and the source of clean water lost. Since the city does not have capacity to supply all the water, the population finds its own solution by pumping from groundwater which creates risk of pumping contaminated water (shallow aquifer) or salty (when near to the sea). The urbanization is also increasing impervious areas and the flood peak flood frequency for the same rainfall. Total solids is filling the rivers, reducing its capacity and also impacting the flood conditions. The pumping of groundwater together with the reduction of infiltration is creating subsidence in low lands areas which decreases its drainage by gravity and flood conditions.
This scenario shows that the source of the problems is the uncontrolled and unsustainable way the urbanization is developed in the city. The main risks are: population health: flood risk; lost of
environment and Lost of safe water. Population vulnerability is increasing and the resilience to urban waters issues is decreasing with this type of development.
The proposes solutions for this critical scenario is to develop an Integrated urban Water Management Plan which develop a Water & Sanitation plan to take into account the water supply and sewers collecting and treatment, a Flood Management and Total Solids Plans, Environment Plan and a institutional reform for the area cover for this Metropolitan area.
The development and implementation of this management is proposed in three major steps: in short- term are developed emergency actions in order to recover the capacity of the rivers and propose the non-structural measures to cope with the future developments, freezing the actual conditions. The second step in three years is to develop the main structural measures plans to cope of exiting problems which is planned to be implemented in the third phase, after five years. The all schedule is planned for 15 years time with a total investment of US $ 6 billions in 10 years after the studies, using of about 0,5% of GDP of the Metropolitan area yearly.
Sustainability is the obvious choice of a modern and progressive society which seeks a better social, economical and environment future and urban waters in one of main infra-structure for this sustainability.
7.2 Medellin, Colombia
7.2.1 Characterization
Urban areas and administration: Medellin is the second largest city of Colombia with population of 2.4 million and is the center of a Metropolitan area with 10 municipalities which has a population of 3.2 million with 94.3 % in urban area, covering near to 370 km2. This Metropolitan Area is part of Antioquia Department of Colombia. Medellin grew its population from 1.5 to 2.4 million from 1985 to 2005 (20 years), which represents a year rate of 1.5%. Colombia population grew from 57% of urban population in 1951 to 76% in 2005, becoming an urban country, as many others countries in Latin America.

99
Colombia has a GDP of US$ 442.8 billion (2007) by parity price and per capita of U$8.891. The Metropolitan Area of Medellin represents 11% of the GDP of Colombia which is about US$ 48.7 billion with a per capita of US$ 15,221. Industry represents 43.6 %, Services 39.7 % and commerce 7 % of the GDP. The proportion of the literate population is 96.3% and IDH is 0.808 (Wikepedia,2009). Income distribution shows an important inequality with high proportion of poor population. In the city of Medellin there is 8.5% of its population at the low level of poverty18. Gini coefficient in Medellin is 0.5 and in the Metropolitan area varies from 0.1 to 0.7. There is about 20% of informal occupation in the city of Medelllin (source; Medellin city planning secretary). Slums are about 10% of the population and occupy areas of risk in the hills.
Colombia uses six levels of income in order to classify the population, taking into account its housing conditions and surroundings such as: public transportation and others infra-structures and recreational conditions. Table 7.6 shows for 2006 the proportion of population in each level in Aburrá Valey and the income related to minimum income in Colombia. Until the level 3 the population receives subsidy from public services. It can be seen that 75.3% of the population are in this situation.
Table 7.6 Social levels based in housing conditions in Colombia and mean income based on minimum wage for Aburrá Valley (UNC,2006).
Level Income in proportion to minimum wage %
Proportion of population %
1 1.57 10.1 2 1.72 35.2 3 2.6 31.0 4 4.64 5 7.39 23.7 6 11.26
This Metropolitan area is located inside of the Aburrá Valley where the main River is the Medellin which crosses the city (figures 7.5 and 7.6). It is situated in a narrow valley with 1500 m and the city is surrounded by steep hillsides. Urbanization is moving to upstream climbing the hills in the sub-basin of Medellin River, mainly in the more dense area (figure 7.5). Urbanization is also developing in downstream and upstream directions following the Medellin River. Figure 7.6 shows the downtown Medellin and the river crossing the city.
Figure 7.7 shows the evolution of urbanization along the time and the limits of the county of the Metropolitan Area together with the limits of the basin. It can be seen that there is a small difference between this two geographical limits. It was forecasted a population of 4.8 million for 2020. There is an Urban Master Plan approved in 1999 with short (2 years) median (4 years) and long term planning scenarios. The actual govern presented a Development Govern Plan approved in 2006 for the 2008-2011 periods.
18 Low level of poverty is when the person receives less than US$ 1 per day (parity price).

100
Figure 7.5 Basin of Medellin-Aburrá and Metropolitan Region of Medellin and neighbor basin which are used to supply water for this region (Area Metropolitana,2009).
Water Resource: Aburrá-Medellin is the basin occupied by the Metropolitan area of Medellin. There is a Water Plan of the Medellin/Aburrá River Basin in which the Metropolitan Area of Medellin is located (Area Metropolitana, 2006). The MAM is in the Medellin River and the Valley is called Aburrá since before the Spanish period, it was the name of the River.
There are 10 cities in the Metropolitan Area and most of this area is inside of the Basin which has 1,250 km2 and the metropolitan area 1,156 km2. The river length is 104 km and the altitudes varying from 1300 to 2800 m. Mean year rainfall in the basin is from 1400 mm to 2800 mm in a tropical climate with temperatures medias varying from 20o C to 24 o C. Mean annual flow in the basin varies from 30 to 40 L/(s.km2) or 1150 to 1300 mm of mean flow (flow coefficient of about 0.55 t0 0.68) which are high as it is compared to other climate regions. The basin has steep slope and high flow variation from minimum to maximum flow. At Yarumito, 1,041 km2 of basin, downstream of Medellin, the 10 year minimum flow is 10 m3/s and for 10 year maximum flow it is 502 m3/s.

101
Figure 7.6 View of main areas of Medellin and Medellin River, crossing the city (Area Metropolitana,2009).
Figure 7.7 Development of urbanization (Area Metropolitana,2006)
Urban development
River
Basin
County limits

102
Urban Waters: Medellin has a sound development in urban waters, since it has strong institutions, urban water well developed with reduction of impacts and improvement of quality of live and environment. There is enough water for supply and there is not risk of contamination or conflict. Coverage of water supply is almost complete and Sanitation is under development and in a short period in the future the coverage will be near to 100%. Urban Drainage is the main challenge and shows many important issues related to its institutional aspects and development. Solid waste has a good service and improvement on that and on soil conservation can improve this service and environment protection.
The development of urban waters and management of issues is in another stage, since most of the investment and improvement has been done. The actual stage is to improve the existing service such as: urban drainage protection and water quality, recovery of environment aspects, improve the quality of life of the poor.
7.2.2 Identification and Analysis
The assessment developed in Medellin was done in the period of June 1 to June 6. During this period we were received by:
• EPM Empresas Publicas de Medellin which develops the services of water, sanitation and part of stormwater;
• Varias de Medellin is a municipal company which develops the services on Solid Waste; • Urban Planning and Environment Secretary of Medellin which develops the urban
planning and are concerning with major drainage of the city, respectively;
• Area Metropolitana of Aburrá Valley, which develops and license environment and water resource management of Metropolitan Area of Medellin.
These institutions and personal were very helpful in the assessment and discussion of the future development in the city.
Water Supply
Water sources for supply the city of Medellin is mainly from neighbor basin (83%) and storage (figure 7.1). These systems are:
• Rio Grande (reservoir of Rio Grande II);
• Pantanillo (Reservoir La Fé) and
• La Mosca Creek (reservoir Piedras Blancas).
Table 7.7 shows the reservoirs of the systems and the water treatment plant linked to this reservoirs and water sources. Figure 7.8 presents the lay-out of reservoir and treatment plants. The actual demand for water in the basin is 10 m3/s, with unit consume of about 211 L/person/day. The forecasted demand is 14 m3/s. As it can be seen the relation of demand and availability of water is not an issue, since the existing flow regulated is 26 m3/s and the treatment capacity is 17.25 m3/s (UNC,2006). In another source (EPM, 2009) the demand in December of 2008 supplied by the company was about 6 m3/s (193,000 m3) which is smaller than the value presented above.

103
Figure 7.8 Water Supply “lay-out’” for Metropolitan area of Medellin (red dots are the water treatment plants (source: EPM)
Table 7.7 Water Supply system (sources: EPM and Area Metropolitana,2009) River Reservoir Storage
106m3
Flow regulated m3/s
Treatment Plant
Treatment capacity of the treatment Plant m3/s
Rio Grande
Rio Grande II 165 18 Manantiales 6.0
Pantanillo La Fe 12.1 8.6 Ayurá 9.2 La Mosca P. Blancas 1.2 V. Hermosa 0.95 La Montana 0.38 Others Barbosa,
Caldas e V.Hermosa
1.21
Total1 26.6 17.25 1 – it is a partial total for the regulated flow since is missing the Medellin basin assessment and La Mosca.
The conclusion is that water sources and existing capacity for treatment is not an issue. Future issues of the water source could be:
• Sedimentation of the reservoir with reduction of design live;
• Contamination of the water and eutrophication of the reservoir.
The main impacts are the agriculture practices of the upstream basin of these sources. In order to prevent is recommended a program of water and soil conservation in the municipal basins. This type of program could use economic mechanisms. A new strategy has been to pay for environment services for the land owner if he develops sustainable practices, which give long live to the reservoir. This cost could be included in the long term water cost.
In relation of the services, there is not lack of water access, but social and economical issues. For the population which occupies irregular area, the county does not allow urban water services. Water losses are still important and in the last year it was 36%. From this total, 60% are physical

104
losses and 40 % commercial losses. There is a program for reduction of physical losses taking into account part of the network. It is a challenge to improve water supply network with mean hydraulic head of about 40 m.
In the first three levels of Colombia classification for population housing conditions (see table 7.7) there is some subsidy (78% of the consumers for Metropolitan Area in 2008). The level without subsidy is 4 (11% of the consumers) and 5 and 6 pays the subsidy for the others (total of 11%). The mean consume is 17.9 m3/month/residential unit. The mean price (without subsidy) is US$ 1.39/m3 for water supply and sanitation. In that cost 45% is water supply and 55% is sanitation. Table 7.8 shows the cost structure for the mean consume.
Table 7.8 Cost assessment for the mean consume (information’s from EPM)
Service Variable cost
US $
Fix cost
US $
Total cost1
US $
Unit cost1
US $
Proportion
%
Water 0,45 2,95 11,09 0,62 44,58
Sanitation 0,68 1,59 13,80 0,77 55,45
Total 24.89 1.39 100
Sanitation
The coverage of Sanitation is almost 100%. About 1% of population is not connected to the sanitation network. Part of this network is CSO (Combined Sewer Overflow) and part is separate, respectively 47% and 44% of the network system. There are collectors in the tributaries and interceptor along the main river, representing 9% of the network.
The wastewater treatment plants were designed taking into account that the Medellin River should be with DO (Dissolve Oxygen) > 5 mg/L. The distribution of the treatment plants are in figure 7.9. In table 7.9 there are some characteristics of these installations. It can be seen that in 2012 almost all sewage will be treated, which will improve the water quality of the Medellin River for DO as planned.
Figure 7.10 shows the DO profile along the Metropolitan Area of Medellin and the effect of wastewater treatment which improves it from 1 mg/L (scenario without treatment in the reach in Medellin) to 5 mg/L with the planned system. In this scenario there are conditions for fish development and others fauna species.
The focus of the wastewater treatment has been the load of DBO and the conditions of DO, but it not has been accessed the Coliform and COD (Chemical Oxygen Demand) and other indicators of industrial pollution.

105
Figure 7.9 System of sewage treatment plants for Metropolitan area of Medellin (source: EPM).
Table 7.9 Wastewater Treatment Plants (information’s from EPM,2009)
Treatment Plant Treatment Discharge
m3/s
Type of treatment
DBO efficiency
%
Operation
San Fernando 1.28 (1.8 in 2010) Secondary 83 In operation
Bello 5.00 Secondary In 2012
Girardota 0.2 Preliminary Planned
Barbosa 0.04 Preliminary Planned
Total 6.52 (7.04)
Solid Waste
Solid Waste in the city of Medellin is developed by Varias of Medellin which is a public company from the county of Medellin. In the other cities of the Metropolitan Area solid waste is developed by each city through public or private companies. However, the land fill is managed by Varias which receives 80% of the waste from Antioquia Department.
The social profile of the clients is similar of water & sanitation and the total number of clients is about 675,000 installations which could be a house or a building. Levels 1 to 3 represents 75%, level 4, represents 11% and levels 5, 6 and commercial the 14%.
The services provided by the company are: collect, transport, final disposal of solid waste, washing the public areas and cut the grass of the public areas gardens. The company covers 98% of the city, but it likely that the coverage is about the formal city. In the regions where the trucks cannot enter, the company contract people from the neighborhood for collection. The services developed by Varias do not take into account the cleaning of the rivers. They clean until

the entrance of drainage system. Their services do not coverconduit is cleaned by EPM in the minor drainage. The major drainage is developed by the municipalities.
Figure 7.10 Profile of DO Dissolved Oxygen for Medellin River along the Metropolitan Area of Medellin. Blue line shows the scenario withowastewater treatment planned for the basin.
The mean solid waste production in the city is 50 kgkg/person/day. The total collected is 130,000 ton/year. The mean1.36 ton/m3. The regular tariff is US$ 5.14/month/installation. For a population of 2.4 millions of people and 675 installations, each installation hasis US$ 1.45/ month.
The production of construction debris is 14,000 t/month. This amount is the amount of debris which the owner is not identified. There areproduction, etc. They have to present a environmental plan for dispowaste is 1.8 t/month with 745 clientscollection and disposal for hospital and clinics. covering 3,000 km of streets.
The company is in equilibrium in relation to cost of the services and the income. is US$ 45.5 million a year and 2,000 employee
Stormwater
Stormwater in Medellin is a combination of minor drainage in dense areas which flows in creekswhich comes from the hills. These creeks flow downstream to the Medellin River. Since the slopes are very high, flow velocity steep hydrograph with very small time of concentration. Together withthe flow brings a lot of sediments due to erosion and may develop a type of mud flood, when it
106
the entrance of drainage system. Their services do not cover the creeks, rivers and conduits. The conduit is cleaned by EPM in the minor drainage. The major drainage is developed by the
Figure 7.10 Profile of DO Dissolved Oxygen for Medellin River along the Metropolitan Area of Medellin. Blue line shows the scenario without wastewater treatment and black line with all the wastewater treatment planned for the basin.
production in the city is 50 kg/month which represents about 0.kg/person/day. The total collected is 130,000 ton/year. The mean relation in the disposal site is
. The regular tariff is US$ 5.14/month/installation. For a population of 2.4 millions of people and 675 installations, each installation has 3.55 persons. In that way the cost per person
production of construction debris is 14,000 t/month. This amount is the amount of debris ner is not identified. There are others users such large construction site, industrial
hey have to present a environmental plan for disposal. The collection of hospital waste is 1.8 t/month with 745 clients. There are other companies which develops the kind of collection and disposal for hospital and clinics. The waste collected in the streets is 13,300 t/year
The company is in equilibrium in relation to cost of the services and the income. The total budget 5 million a year and 2,000 employee.
Stormwater in Medellin is a combination of minor drainage in dense areas which flows in creekswhich comes from the hills. These creeks flow downstream to the Medellin River. Since the
flow velocity and rainfall with high intensity and low duration produce a with very small time of concentration. Together with that, during rainy season
flow brings a lot of sediments due to erosion and may develop a type of mud flood, when it
onduits. The conduit is cleaned by EPM in the minor drainage. The major drainage is developed by the
Figure 7.10 Profile of DO Dissolved Oxygen for Medellin River along the Metropolitan Area of ut wastewater treatment and black line with all the
/month which represents about 0.455 ion in the disposal site is
. The regular tariff is US$ 5.14/month/installation. For a population of 2.4 millions of the cost per person
production of construction debris is 14,000 t/month. This amount is the amount of debris users such large construction site, industrial
sal. The collection of hospital There are other companies which develops the kind of
streets is 13,300 t/year
The total budget
Stormwater in Medellin is a combination of minor drainage in dense areas which flows in creeks which comes from the hills. These creeks flow downstream to the Medellin River. Since the
and low duration produce a during rainy season
flow brings a lot of sediments due to erosion and may develop a type of mud flood, when it

107
has a large proportion of soil inside of the flow depth (See figure 7.11). The flood flow is dangerous to infra-structure and people, since it could be followed by land slide. Land slide occur with soil saturation during long period of rain. Saturation increases the soil weights which move it down the hill. The protection of these areas is a combination of prevention in improving the drainage and physical protection of the slopes.
(a) Flood in Medellin in 11/23/2007 (b) Via Las Palmas in Medellin 08/26/2008
Figure 7.11 Photos from movies of floods in Medellin.
Besides the risk related to sub-basin, with the increase in urbanization in the city a few main effects could be developed:
• Increase the peak floods in Medellin River. Urbanization increases the peak flow of about 6 – 7 times. Flood condition in Medellin River has been assessed by hydrologic series recorder in the River when the urbanization was small. With the change in soil use it could increase and increase the flood frequency, mainly in the confluence of more urbanized sub-basin with the main River;
• Urbanization in the sub-basin is increasing from downstream to upstream in the hills and sub-basin of downtown Medellin. It is too dangerous since it will aggravate the existing risk conditions and the peak and flood volume will increase, if it is no developed any flood management and urbanization control;
• Actually the cost of urban drainage impacts has been transferred to private urban population to public with the flood increase;
• Floods and landslides are an annual reality. Medellin is also in a high-risk zone for earthquakes;
Stormwater is a service which is developed by many institutions. EPM is in charge of the minor drainage which is CSO or only stormwater. The creeks and rivers of the sub-basins is a service developed by a Municipal Secretary. Sometimes when the Secretary requires some services EPM is asked to do that. The Medellin River is jurisdiction of Areas Metropolitana since it is the main river in Aburrá Valley. It is like there is a maintenance service only for minor drainage. In the other the action is taken when a problem occurs.

108
There is not any control on the construction and the impacts on the drainage and solid production to downstream. In that way it likely that the major drainage has its conveyance decreased mainly at downstream when the slope decreases. The effect of the urbanization on the flow is not reaching Medellin River due to decreasing capacity of the major drainage and flooding. If the strategy of flood control is to increase the flow capacity it is likely that the floods will reach Medellin River by peak increase. The cost of this solution will be much higher with bad results as it could be seen in Jakarta (item 7.1).
The city needs a Stormwater Plan together with Flood Plain management where the overall basin will addressed by an integrated solution by sub-basin with use of storage for decreasing flood velocity and a space distributed flow dumping.
Institutional
Table 7.10 shows a summary of the actual institutional arrangement for urban planning and urban water services, water resources and environment in the Medellin Metropolitan Area. The urban water services managed issues are:
• Urban planning needs to take into account the services and the impacts on risk areas. The region has important vulnerabilities related to natural and antropic natural disasters. It has already a planning taking into account these issues, but is important to improve the source of the impacts related to floods and stormwater aspects in the planning the space.
Table 7.10 Management in Medellin Metropolitan Area Aspect Medellin Metropolitan Area
Urban Planning City a Cities
Water Supply and Sanitation: supply, treatment and distribution; sewer collection, wastewater treatment and disposal for sanitation.
EPM EPM
Solid Waste: collecting, cleaning and disposal
Varias Private and public services in each county
Stormwater: development and maintenance
EPM for minor drainage;
City administration for major drainage.
EPM for minor drainage;
Major drainage managed by the cities
Water Resources: Main River and water permits
Area Metropolitana Area Metropolitana
Environment: conservation and license
Environment Secretary and Area Metropolitana
Area Metropolitana
EPM – Empresas Publicas de Medellin.

109
• Water Supply and Sanitation is well covered with only one company in the Metropolitan Area (EPM) is allows an integrated management of the services. These services have been very well managed with cost recovery and sustainability;
• Solid Waste is very well managed in Medellin by Varias which is a municipal company with a economic sustainability. However in the other cities of Metropolitan Area it is fragment by many institutions. It is a fragmented service taking into account the cities are connected with similar objectives and services.
• Stormwater: there is not an integrated service and it completely fragmented in space and type of service. There is a need to implement this service by a utility or integrate it to existing services;
• There is a council of Regional Authorities (three of them in this region) which formal decide about the planning and licensing, since the regional division are not the same of the basins.
• Area Metropolitana is an institution which develops studies, plans and projects for the Metropolitana area of Medellin covering the water permits and environment licensing. The main activities are: soil use, environment (projects of environment conservation), mass transport. The institution is supported by about US$ 30 million/year by a tax obtained from the counties for environment together with about US$ 15 million from the counties by volunteer bases. The institution develops plans and project and also give water and environment license which is a conflict of interest.
Impacts
The main aspects related to impacts in the Metropolitan area of Medellin are:
• Vulnerability to natural and antropic disasters such as: Land Slide during rainy days together with floods in the high slope basins of the tributaries of Medellin River; Earthquake area.
• Since 1987 landslide killed more than 500 and left 3500 homeless, city inhabitants have committed themselves to making Medellin safer from natural hazards. A new municipal system for prevention, response and rehabilitation has been able to integrate risk management strategies with municipal physical, social and economic planning. Community participation has changed local attitudes about reducing risks, and the new strategies are bearing fruit. Landslides have decreased from 533 in 1993, to 222 in 1994 and 191 in 1995 (Gonzalez, 1996 and Valdes, 1996);
• Disaster prevention and management strategies are incorporated in the Strategic Development Plan of Medellin, approved by the city council and by popular consensus. This strategy includes the creation of a Municipal System of Prevention, Response and Rehabilitation including education, planning, housing, response, rehabilitation, etc.) and a special financial management account within the municipal budget;
• Flood Plains and Stormwater floods related to urbanization when population increases the impervious areas;
• Water quality of Medellin River before the construction of wastewater treatment plant keep the river with low level of DO (figure 7.10). After the wastewater treatment plant of

110
Bello enters in operation DO will improve, but in this assessment there were not evaluated the COD and other parameters such as metals which came from stormwater;
• Contamination and sedimentation of water supply storage reservoir outside of Aburrá Valley by agriculture practices. These reservoirs are used to supply Medellin Metropolitan Areas;
• River protection and conservation and degraded areas by erosion in the Valley.
Tables 7.11 and 7.12 shows the summary of the issues presented in this identification and analysis of Integrated Urban Water Assessment of Metropolitan Area of Medellin. This urban area has a sound urban development beside its economical and social constraints. The institutions which develop urban services are public and with very good management practices with economical sustainability not found in many countries, even in developed countries. The investment has been done with cost recovery and subsidy is among income classes identified by housing facilities.
For some issues identified in the table 7.11, there are actions under way for solving it, developed in the institutions. The comments on the issues presented are:
Urban development: Improve the housing for the poor and avoid irregular development areas to control the urbanization in direction to upstream in the sub-basins; there is a need for sustainable urbanization in order to avoid flood impacts;
Water Supply: It is important to manage the municipal basin in order to increase the reservoirs life, reducing the sediments and nutrients by improving agriculture practices. It can be stimulated by a payment for environment services. The reduction losses program is already in place in EPM and the efficiency in service would improve also the costs.
Sanitation: There is still a small part of population leaving near the creeks where the cost of sanitation maybe high or physical conditions did not allow the sanitation. Usually they are poor neighborhoods which need special attention and subsidy; after the city reaches its total coverage on sanitation is important to assess other indicators in order to evaluate other potential impacts.
Stormwater: There is a need for manage the potential and existing floods in stormwater; Urbanization is under development from downstream to upstream increasing the peak flood and the impacts in many creeks in the sub-basins of Medellin. This process has to be controlled by non-structural and structural measures; Maintenance of creeks and main river is not developed, only after an impact.
Solid Waste: in order to improve the solids and reduce its impact in the drainage there are some measures which could be developed: (i) recycle programs; (ii) improve the cleaning the streets previous to rainfall days; (iii) restriction for use of some type of plastic.
Institutional: there is a lack of stormwater service in the city because its fragmentation in institutions and lack of cost recovery. In Solid Waste, there is a need for integration of the service in Metropolitan Area of Medellin. In addition, there is a lack of integration in the urban water services.

111
Table 7.11 Service Matrix
Main Aspects Selected Issues
Urban Planning
Lack of Urbanization for reduction flood flow
improve housing for the poor
Reduction of vulnerable population on the hills
Water Supply
Reservoir contamination and sedimentation from
agriculture areas
Important water Losses: physical and revenue
Sanitation
Part of the poor population still do not have sanitation
Lack of assessment of DBO and DO water
quality pollution indicators
Stormwater Manage de floods in stormdrainage
Impact of urbanization on flood flow increase
Lack of maintenance in major drainage
Solids Lack of recycle program and solid waste collection
Lack of prevention of street cleaning for
stormwater
Institutional Lack of Utility and cost recovery for stormwater
Fragmented management for Solid Waste and
Stormwater
Lack of Integrated management of Urban
water services
Table 7.2 shows the main impacts and goals for the society and environment in Metropolitan Area of Medellin which are mainly: vulnerability of floods and land slide, health in some specific poor neighborhoods’ lacking sanitation, environment conservation and potential impacts due to stormwater water quality.
Table 7.12 Goals Matrix
Main Aspects Selected Issues
Health
For the population without sanitation
Diseases related to floods
Floods
High frequency of flood impacts, mainly due to
urbanization
Mud flood and land slide
Amenities
Improve amenities in poor neighborhoods’
Environment Improve River conservation Degraded areas from land slide and erosion
Pollution from stormwater and
industrial
7.2.3 Strategies
In the previous item was developed the assessment where the main issues which need management actions are related to:
• Stormwater management and control of the floods impacts;

112
• Improve institutional arrangement to avoid fragmentation on urban water services. Two main actions are recommended in the strategy for the Metropolitan Area of Medellin:
A. Stormwater Master Plan
Plan Development: In figure 7.12 is presented the framework of a Stormwater Master Plan, based in the IUWM Plan described in chapter 1. This type of Plan has important definitions related to the policies, with definitions of Urban Master Plan scenarios, design risk which will adopt in the Stormwater Plan and other strategies related to the existing networks such as of CSO which has some interrelationship with Sanitation. Assessment is the second step of the Plan which is developed in order to identify risk the areas for actual and future scenario of urbanization for the selected risk.
There are two main types of measures: non-structural measures which control the future impacts by legislation and management and structural measures which develop the solutions for the existing floods based on study of alternatives which give priority to dumping the peak floods through detention ponds. The last group of actions is the implementation of the measures and the long term program.
Implementation: The non-structural measures should be developed first, since it is the base for the stormwater utility. Non-structural measures have the legislation which should give conditions for urban development and construction without transferring the impacts to public network and development of legal framework for cost recovery of stormwater utility. The Structural Plan can be developed by sub-basin, starting for the more important and which could have more floods impacts.
Investments: Using table C.4 in annex and the unit cost of 20,000/ha for implementation of the works as a mean for the urban area of the Metropolitan Area and 370 km2 for the impacted area of the cities the overall investment would be US$ 740 million. Before the Implementation of the works there is a need for the Stormwater Plan and the design of the works, since the plan presents the feasibilities of the works. The total cost of it is less than 1% of the works. Taking into account the 650,000 installations, which is the number of Solid Waste installations, the mean cost recovery for installation is US$ 1,130. The specific cost of each property can be calculated based on the impervious area, since an impervious area generates 6 times more flow than a pervious surface. This amount can be financed with 6% of year interested by 10 years which will represent a monthly cost of US$ .
In addition, to this cost there is a maintenance cost which can support the utility. The buildings which are exporting impacts to downstream would pay a tax based in its impervious area. An stormwater utility is usually supported for operation and maintenance19 by a monthly value of US$ 4 to 6 (price equivalent of the Solid Waste). The revenue will vary from US$ 31.2 million/year to 46.8 millions/year.
19 This is cost is based in utilities of USA West coast and two Brazilian cities.
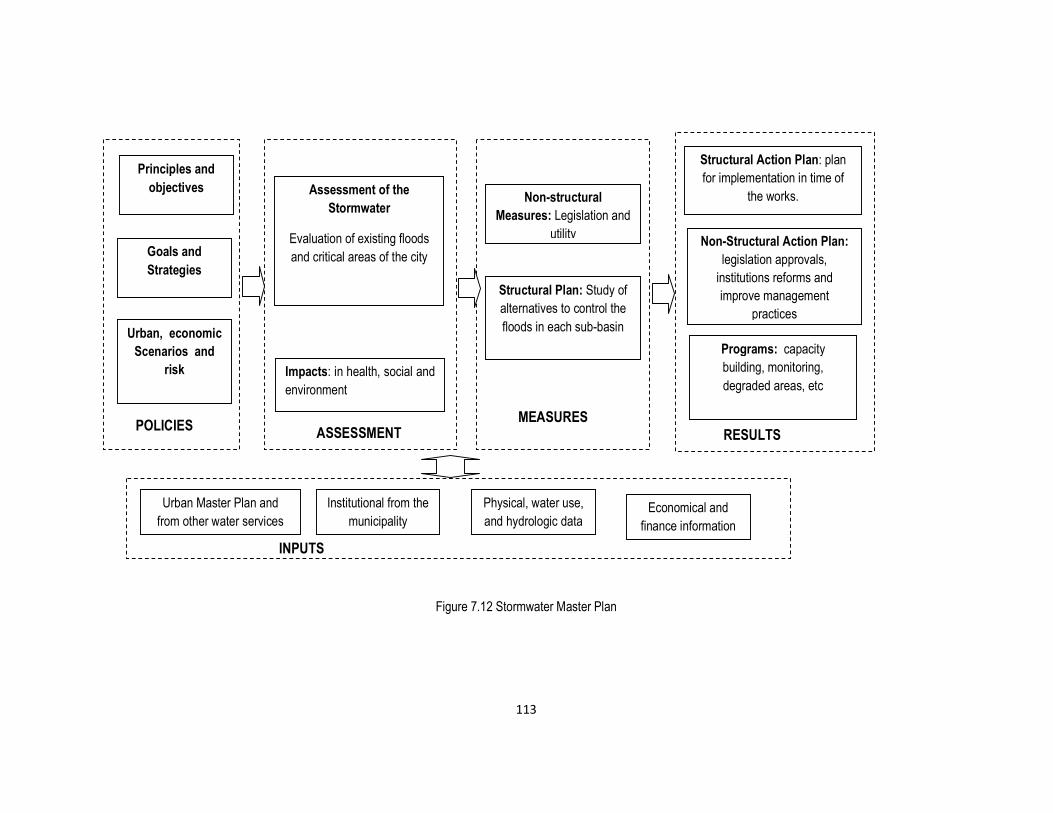
113
Figure 7.12 Stormwater Master Plan
Principles and
objectives
Goals and
Strategies
Urban, economic
Scenarios and
risk
Assessment of the
Stormwater
Evaluation of existing floods and critical areas of the city
Impacts: in health, social and environment
Non-structural
Measures: Legislation and utility
Structural Plan: Study of alternatives to control the floods in each sub-basin
Structural Action Plan: plan for implementation in time of
the works.
Non-Structural Action Plan:
legislation approvals, institutions reforms and improve management
practices
Programs: capacity building, monitoring, degraded areas, etc
Urban Master Plan and from other water services
Institutional from the municipality
Physical, water use, and hydrologic data
Economical and finance information
POLICIES ASSESSMENT
MEASURES
RESULTS
INPUTS

114
B. Institutional Reform on Urban Waters Management
Medellin has very efficient public institutions, but services are fragmented in many institutions in the Metropolitan Area such as:
• The services of water supply & sanitation and part of stormwater is developed by EPM for all Metropolitan Area;
• Solid Waste in Medellin is developed by Varias, but other institutions develops this service in the other city in the Metropolitan Area;
• Stormwater service is developed by a many institutions in the Metropolitan Area and some of the services are not done.
In order to improve the Institution framework for the services in Metropolitan Area of Medellin it is recommended that the development a new framework for the institutions with the objective of:
• Implement the stormwater utility for the Metropolitan Area with the development of all levels of the services and investments;
• Integrate the urban services in one institution or developed practices among the institutions in order to integrate the interface of the services.
The total budget of urban water services is estimated based on table 7.13 where are presented the mean cost of the urban water services, taking into account the information’s from Medellin. Based on these numbers the total monthly revenue could be about US$ 351 million/year taking into account 675,000 installations for Total Solids and Stormwater and 900,000 clients.
Table 7.13 Mean Urban Water Services Cost per installation Service Mean unit cost per
installation US$/installation/month
Mean unit cost per person
US$/person/month Water 11.09 3.12 Sanitation 13.80 3.89 Stormwater1 5.00 1.41 Solid Waste 5.14 1.45 total 35.03 9.87 1 – Based on cost interval presented in the text.
7.2.4 Conclusion
Metropolitan Area of Medellin has developed a sound development in its urban water services. It showed that with a large social difference in income in the city, with a large number of its poor population is also possible to have a very good water supply and sanitation and solid waste services by public institutions with economic sustainability. The main source of this efficiency and success is a good management and small political interference in the companies with long term administration stability.

115
This assessment presented here identify that the city has very good services in Water, Sanitation and Solid Waste, but its main issue in urban water services is related to lack in stormwater management. Since the Metropolitan Area of Medellin (MAM) site is in narrow Valley with high mountains and steep hill. The urbanization is moving up in the hill by irregular occupation it will increase the risk related to storms and land slide.
In order to improve these urban water developments to deal with these risks the strategy recommended is the development the Stormwater Urban Plan and a reform on the institution management for urban water management. These actions will move MAM to a complete Integrate Urban Water Management and achievement of the main goals of a modern city.

116
8. CONCLUSIONS
This report describes a proposal for assessment the issues and strategies in order to move the cities to a sound Integrated Urban Water Management (IUWM) in a way to meet the goals of the Sustainable Urban Development and Millennium Development Goals (MDG).
This assessment was planned based in a short visit in the city followed by analysis of reports and papers about the urban waters and urban planning of the metropolitan area. The assessment is a broad overview of the issues and main strategies as a first step of a long process of planning, design and implementation in urban water services. It is not a complete guide, but was prepared taking into account some of existing knowledge in relation of the issue and a small number of indicators20.
IUWM is part of Urban Sustainable strategies and should have goals related to society and environment and not only process goals as has been developed in the actual practice. The main issue is the fragment of the institutions and the services, with many institutions without any connections or common in the management of the services, without understand and interact with urbanization and its planning.
The procedure developed use two major steps: assessment of the issues based in a qualitative matrix of issues and selected quantitative indicators; and proposed strategies based in the Integrated Framework of Urban Water Plan.
In the assessment were presented some steps which could be followed during the visit in order to have the required information’s in the analysis. This procedure was developed taking the experience of two case studies developed and other studies developed in the field. However, each consultant or manager may find its own way in the assessment, since each reality may have different source of information’s, but the key aspect is to get reports which describes water resources, urban water, and urban development and institutions aspects of the cities. The interviews are often used to understand the local reality and to get complementary information in loco, but the existing reports about the city are the consolidated information which give you support in the assessment.
The proposed strategy is a combination of the needs and the local reality in social, economic, environment and political conditions. It is possible to propose and design the best technical, social and economic infrastructure, but is it feasible at this reality? This question has to be answer in the planned strategy. Sometimes the best standard of the goals are not feasible to be reached in short term, but is always possible to leave a door open for the future and develop a strategy schedule in the time.
Two case studies were assessed in two Large Metropolitan Regions of developing countries, Jakarta in Indonesia and Medellin in Colombia. Jakarta is a case of many issues in all the
20 It has to be a small number since it would not be na indicator. Use a large number will create a confusion in the assessment

117
services with a great number of impacts. Medellin is a case of sustainable service and good institutions moving fast to a complete Sustainable City. There common issues related to floods, and social and economical conditions, Medellin strength are its institutions and quality of services.
We recommend update this report after more case studies at different scenarios and issues, where the contents will be improved with these experiences and challenges.

118
REFERENCES
APWA,1969. Water pollution aspects of urban runoff. Water Quality Administration.(Water Pollution Control Research Series. Report N. WP-20-15.
AREA METROPLITANA, 2009. Gestión Integral del Recurso Hídrico. Experiencia del Area Metropolitana del Valle del Aburrá. Power point presentation from Area Metropolitana del Valle del Aburrá 2-june-2009.
ARMITAGE, Neil, ROOSEBOOM, Albert., NEL, Christo e TOWNSHEND, Peter 1998. The
removal of urban litter from stormwater conduits and streams. Water Research Commission. Report No. TT 95/98, Pretoria.
AVCO, 1970 Stormwater pollution from urban activity.Water Quality Administration. (Water Pollution Control Research Series. Report n. 11034 FKL.
BEBASSARI, SRI, 2008. Jakarta Emergency Dredging Initiative (JEDI) preliminary assessment of Solid Waste Generated in DKI Jakarta. World Bank, 22p.
CAMPANA, N.; TUCCI, C.E.M. 1994 Estimativa de Áreas Impermeáveis de macrobacias brasileira RBE Caderno de Recursos Hídricos V12 n.2 p79-94.
CHAPMAN, D.1996. Water Quality Assessments. A guide to the use of Biota, sediments and water in environmental monitoring. UNESCO. WHO UNEP E & FN SPON 625p.
COLSON, N.V,1974. Characterization and treatment of urban land runoff. EPA. 670/2-74-096.
CRUZ, M. A. S. 2004. Otimização do controle da drenagem em macrobacias urbanas. . [217]f. Tese (Doutorado). Universidade Federal do Rio Grande do Sul. Instituto de Pesquisas Hidráulicas. Programa de Pós-graduação em Recursos Hídricos e Saneamento Ambiental. Porto Alegre-RS. 2004
CRUZ, M.A.S., TUCCI, C.E.M. 2008. Avaliação dos cenários de Planejamento na drenagem urbana RBRH V13 n.3 2008 59-71.
CEPIS, 1990. Metodologias simplifcadas para la avaliacion de eutrophication en Lagos calidos tropicales. Centro Panamericano de Ingenieria Sanitaria y Ciencias del Ambiente.
DAWDY, D. R.,1967. Knowledge of sedimentation in urban environments. Journal of the
Hydraulic Division, ASCE, v.93, Ser. HY, n.6, p.235-245, Nov.
DUFFY,D.2008. Water efficiency. Journal of Water Conservation Professionals May-June-2008. http://www.waterefficiency.net/may-june-2008/ultmate-recylcing-program-3.aspx
EMBRAPA, 2008 http://www.urbanizacao.cnpm.embrapa.br/conteudo/discussao.html acessed in 12/12/2008.
EPA (1993) Guidance specifying Management Measures for Sources of Nonpoint Pollution in
Coastal Waters. Environmental Protection Agency. EPA 840-B-92-002. Washington, D.C. Disponível em (http://www.epa.gov/owow/nps/MMGI/index.html). Acessado em 2006

119
EPA 1997, New South Wales State of the Environment 1997, NSW Environment Protection Authority, Sydney [available at http://www.epa.nsw.gov.au/soe/97/] fig_2 3
EPA, 2004. A. Pollution Prevention Management Measure. Polluted Runoff (Nonpoint Source Pollution). U.S. Environmental Protection Agency. Disponível em (http://www.epa.gov/OWOW/NPS/MMGI/Chapter4/ch4-6.html). Acessado em 2004.
EPM,2009. EPM Waters. Empresas Publicas de Medellin, power point presentation.
FAN, CHI-YUAN, 2004. Sewer Sediment and Control : A Management Practices Reference Guide. National Risk Management Research Lab. EPA Cincinati.
GONZALEZ, L.F., 1996. Prevention of Disasters in Medellin, UNDP-City of Medellin, June 1996,
HEANEY, J.P.; HUBER, W.C., MEDINA, M.A., JR. MURPHY, M.P. NIX, S.J. AND HASSAN, S.M., 1977. “ Nationwide Evaluation of Combined Sewer Overflows and urban Stormwater Discharges Vol. II Cost Assessment and Impacts EPA -600/2-77-064. EPA Cincinati.
Hoornweg, D. and Thomas. L. 1999. What a Waste: Solid Waste Management in Asia. Urban and Local Government Working Paper Series No. 1. Washington, DC, World Bank.
HUTTON, G., 2007. Unsafe Water and Lack of Sanitation. In: Solutions for the World’s Biggest Problems: cost and Benefits edited by Bjorn Lomborg. Cambridge University Press.
HUTTON, G.; HALLER, L. 2004. Evaluation of the non-health costs and benefits of water and sanitation improvements at global levels. World Health Organization. WHO/SDE/WSH/04.04
IBAM,2001. Gestão integrada de resíduos sólidos: Manual de gerenciamento integrado. Rio de Janeiro.
IBGE, 1998 “Anuário Estatístico do Brasil – 1997”, Brazilian Institute of Geography and Statistics, Rio de Janeiro, 1998 (CD-ROM).
IDE, C,1984 Qualidade da drenagem pluvial urbana. dissertação de mestrado, Programa de pós-graduação em Recursos Hídricos e Saneamento, IPH/UFRGS, 137 p.
JMP.2002. Joint Monitoring Programme for Water and Sanitation WHO and UNICEF http://www.wssinfo.org/en/337_san_asiaW.html accessed on March 10,2006.
LARGER, J.ª; SMITH, W.G.; LYNARD, W.G.; FINN, R.M.; FINNEMORE, E.J. 1977 Urban
Stormwater management and technology: update and user’s guide. US EPA Report – 600/8-77-014 NTIS N. PB 275654.
LLORET RAMOS, C., HELOU, G.C.N. AND BRIGHETTI, G. 1993. Dinâmica do transporte sólido nos rios Tietê e Pinheiros na região metropolitana de São Paulo. Anais. X Simpósio brasileiro de recursos hídricos. Gramado.
MARINDALE,D.; GLEICK, P/.H., 2001 How we can do it. Scientific American, 284 (2) 38-41.
McGRANAHAN, G.; MARCOTULIO, P. 2005. Urban Systems. In: Ecosystem and Human Well-Being Current State and Trends. Volume 1. Island Press.

120
MEDELLIN, 1999. Plan de Ordenamiento Territorial POT y Sistema de Información Territorial Alcadia de Medellin.
MEDELLIN, 2008. Plan de Desarollo 2008-2011 Medellin Soolidaria y Competitiva. Alcadia de Medellin. 301p
NEVES, M.,2005. Avaliação da quantidade de resíduos sólidos na drenagem. Tese de Doutorado. Instituto de Pesquisas Hidráulicas. UFRGS.
NEDECO, 2004. Drainage management for Jakarta: Strategic Action Program Development. (WJEMP) executive summary.
PICHET, G. Jakarta Floods. In: Third International Symposium on Flood Defense - 25 - 27 May Nijmegen, Holland.
NAHB RESEARCH CENTER. 2004. Municipal Guide to Low Impact Development. Maryland. Disponível on-line em http://www.lowimpactdevelopment.org
RIJKSWATERSTATT, 2003 Basin Water Resources Planning. Twinning cooperation. Indonesia Water Resources Irrigation Reform Implementation Project, April 2003.
RIJKSWATERSTATT, 2004 Basin Water Resources management & Planning twinning cooperation. Indonesia Water Resources and Irrigation Reform Implementation project June 2004
REES, W.E., 2003. Understanding urban ecosystems: an ecologic economics perspective in: Understanding Urban Ecosystem: A new Frontier for Sciences and Education. A.R. Berkowitz, C.H. Nilon and K.S.Kollweg (eds) Sriger-Verlang, New York 115-136p.
SANTOS, J., 2005. Walter and Health. Workshops of Integrated Urban Water Management. Iguaçu Falls, April 2005.
SCHUELER, T. Controlling urban runoff A practical manual for Planning and designing urban BMP. Washington, DC Metropolitan Washington Council of Governments, 1987.
SEDUMA, 2008. PDOT Plano Diretor de Ordenamento Territorial do Distrito Federal. Secretaria de Desenvolvimento Urbano e Meio Ambiente. Distrito Federal.
TIETENBERG, T., 2003. Environmental and Natural Resource Economics. Addison Wesley. Boston 646p.
TUCCI, C.E.M. 2007. Inundações Urbanas. ABRH Rhama. 380p (in portuguese).
TUCCI, C. E. M.; PORTO, R. L. 2001. ‘Storm hydrology and urban drainage’. In: Tucci, C. Humid
Tropics Urban Drainage, Chapter 4. UNESCO.
URBONAS, B.; ROESNER, L.A., 1993. Hydrologic Design for Urban Drainage and Flood Control. In: Handbook of Hydrology. D.R. Maidment (ed.). Cap. 28.
UNESCO-WWAP, 2006. Water a shared responsibility The Unite Nations World Water Development Report 2

121
UN,2009 Urban and Rural http://www.un.org/esa/population/publications/wup2007/2007urban_rural.htm accessed in 01/16/2009.
UNC, 2006. Plan de Ordenación y Manejo de La Cuenca del rio Aburrá. Universidad Nacional de Colombia, Aguas Metropolitanas Conare and Corantioquia.
UNHABIITAT, 2009 http://ww2.unhabitat.org/programmes/guo/statistics.asp, access March 3,2009.
VALES, H.M., 1996 Disaster Mitigation in Medellin A Social Commitment, IDNDR Regional Office for Latin America/Caribbean, June 7996.
VOLLEWEINDER, R.A., 1975. Input-Output Models with special references for Phosphorus Loading in: Concepts in Limnology Schweiz Z. Hydrol. 37:53-83
WORLD BANK, 1999. World Development Indicators. Urbanization. World Bank.
WORLD BANK, 2009. World Development Report 2009. Reshaping Geography Economic. World Bank.
WRIGHT, A M. (1997) Toward a Strategic Sanitation Approach: Improving the sustentatibility of
urban Sanitation in Developing Countries. UNDP – World Bank 38p.
WHO, 2009 http://www.who.int/water_sanitation_health/diseases/burden/en/index.html accessed 23 of January of 2009.
WHITTINGTON, D., 2006. Reflections on the goals of Universal Access in the Water and Sanitation sector: lessons from Ghana, Senegal and Nepal. In: Liberalization and Universal Access to Basic Services chapter 5 OECD World Bank.
WORLD WATER ASSESSMENT PROGRAMME, 2009. The United Nations World Water Development Report 3: Water in a Changing World. Paris. UNESCO, and London: Earthscan.

122
AANNNNEEXX AA –– QUALITATIVE MATRIX OF ISSUES (QMI)
A.1 Matrices
In order to support the identification of the urban water issues was prepared a Qualitative Matrix of Issues (QMI). It is an extensive description of the problems which could be found in developing countries cities related to urban waters services. This is the first insight of the matrix which should be updated including future experiences.
There are two groups of matrices: Services matrix group; and Goals matrix group.
There is a natural interconnection of both groups, since as consequence of the lack of water services there are impacts on the main services goals, which are the Impact on the society and in the environment. This separation was made because is important to understand the separation of services processes and the identification of the impacts in the end objectives.
There are structural issues and specific issues. Structural issues are mainly those problems which require global solution from a big picture of the issues, such as Lack of Water and Sanitation Plan. Specific issues are aspects specific of each service such operational aspect of a treatment plant. In this document QMI presented more structural issues, not specific.
The matrices presented below were constructed by main aspects in each one of the above themes and the identification of the issues inside of it together with the interconnect aspects. Below is presented a summary of the identified issues presented in the matrix.
A.1.1 Planning and Urban Services matrix QMI
In the Tables A.1 to A.7 is presented QMI for each theme and some description of this issues is presented below by subject.
Urban development
In urban development the following aspects were identified (table A.1):
Urban development Master Plan (UDMP): This is the main tool for soil use planning in the city. It plans how the population will going to use its space for service, commerce, industrial and housing. The main questions are: Is this a UDMP? Is this new or old? Is this UDMP enforced? in what proportion? Is this reflecting the urban water services and environment?
Unregulated or informal occupation: Low income population used to develop long term unregulated occupation. What is the proportion of this occupation in the city? Is this any plan for this population? Is the population vulnerable? The population can be vulnerable to floods, water transmitted diseases or others. In this urban waters facilities in these areas?
Urban expansion: is related how the city is growing in the space and time. Usually the tendency is to grow in its borders by migration and decrease downtown by deterioration of space use by drug traffic and gangs which decreases the propriety value. The main questions are: Is the border expansion important? Is this done by unregulated development? in what proportion? The reasons can be related to the lack of income and social pressures, invasion of public areas, lack of investment in infra-structure. Impacts are in the contamination of water sources of the city.

123
Table A.1 Urban development Main Aspects Integrated
Sub-topiccs Legal Management Assessment Economic and
social
Water Environment Main aspects
1.1 Urban Planning
Urban Master Plan There is not a
Master Plan or the existing is outdate
The Master Plan is not enforced
There is not a monitoring of
the urban development and problems
There are two much pressure for
construction outside of Plan
limits
Urban Plan does not take into
account the water capacity and sustainability
There is not environment aspects in the Master Plan
Lack of regulation in a sustainable urban waters development
1.2 Informal
occupation
Proportion of informal/slum areas
There is not a policy for the informal
population
Informal population is outside of the city
management
There is not assessment of the population and conditions
The population is vulnerable: death
and health
Lack of most of the water services in the slums areas
High impacts on urban waters in small
spaces
1.3 Urban
Expansion
High proportion of unregulated urban
expansion
There is not management
actions in mitigation of unregulated developments
Lack of assessment on
the city expansion
Invasion of public and private lands by the poor; lack
of income
Lack of infrastructure: paved streets, energy, water
services
Contamination of water sources and
environment
Impact on the water supply and increase impacts related to
urban waters services
1.4 Governance at
local and
Metropolitan Level
Lack of legal : local level and
instruments for integrated planning in the Metropolitan
Areas
Bad management: at local levels and
lack of metropolitan coordination
Lack of assessment of
integrated impacts at
metropolitan and local levels
Weak institutions, lack of
investments and funds
Lack of qualification and
knowledge in planning
Lack of public participation

124
Governance: Is related how de urban development is management and regulated in the city. Usually the main issues are related to the: lack of legal instruments which is used to implement the policies. For instance there is an Urban Plan, but no legal instrument to implement it; Bad management: There is not goals, investments or efficiency on the services; Weak institutions and lack of funds; lack of political will and law enforcement; lack of qualification and knowledge. The implication for the other services is the difficulty in the control of the soil use and implementing the management of the urban water services.
Water Supply
In the table A.2 is presented the main aspects related to Water supply which are:
Water availability: it is the quantitative limitation to water availability for water supply in the city. The limitation and issues related to this aspect are: Lack of information about the water sources; the increase demand for the existing water yield; the decreasing capacity of the existing works by its design live or lack of maintenance; uncertainty of the water yield by change watershed conditions, climate change or climate variability; Lack of investments in increasing water availability; Irregular occupation on the municipal basins; Contamination of water sources: urban and rural pollution sources
The water source contamination can happen by loads (point pollution) from industrial, commercial and housing developments, if the effluents were not treated in a level which the water systems has the capacity to absorb. The loads could be from stormwater and agriculture lands (non-point pollution), contamined sediments and solid waste and land fill, which can produce long term contamination of aquifer and toxicity in surface systems such lakes and rivers. The main cause of that is lack of sanitation services and the impacts are in all other services, health and environment.
Water Access: the identified issues related to water access by the population are: lack of information of about the lack of water supply; Lack of projects for improvement of the water access; contamination at local level (surface and groundwater) when population uses alternatives sources; lack of education and hygiene; risk of spreading diseases; Lack of investments and funds in water access; Population without capacity to pay for the services and Reduction of water table by over-exploration
Water Treatment and Storage: Storage can be an issue when the system does not have enough volume for regulation during draughts resulting in lack of water. There are scenarios where the Water Company increase the treatment capacity, but does not increase the water yield or regularization from water sources, which results in lack of water during draught because the system has a demand greater than its source can supply.
The other main issues are: Lack of international standard treatment procedures; Lack of monitoring of the water supplied by the source’ and water quality treated; Lack of auditing in the procedures in water treatment, distribution and unsustainable disposal of the residuals from treatment. The quality of receiving water could not have conditions which require measures in the treatment in order to attend the water quality standard for the population. A common scenario is when the water source is contamined by nutrients, resulting in eutrophication and toxicity in water.
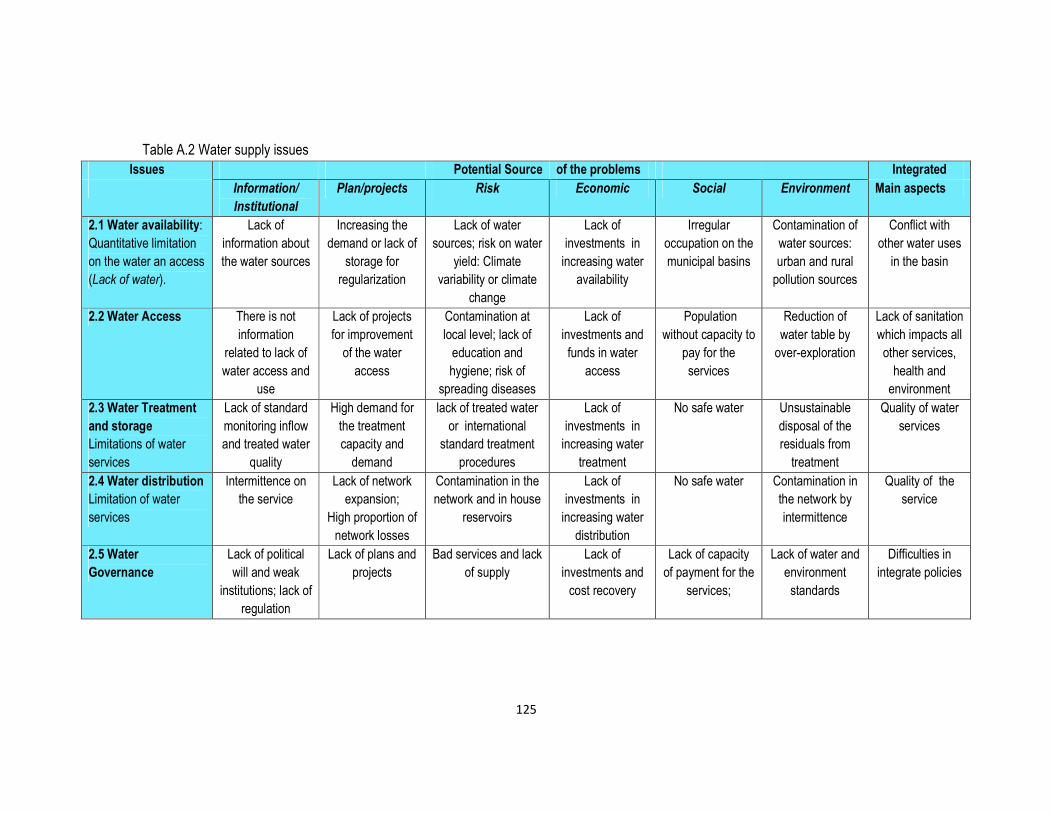
125
Table A.2 Water supply issues Issues Potential Source of the problems Integrated
Information/
Institutional
Plan/projects Risk Economic Social Environment Main aspects
2.1 Water availability: Quantitative limitation on the water an access (Lack of water).
Lack of information about the water sources
Increasing the demand or lack of
storage for regularization
Lack of water sources; risk on water
yield: Climate variability or climate
change
Lack of investments in increasing water
availability
Irregular occupation on the municipal basins
Contamination of water sources: urban and rural
pollution sources
Conflict with other water uses
in the basin
2.2 Water Access There is not information
related to lack of water access and
use
Lack of projects for improvement
of the water access
Contamination at local level; lack of
education and hygiene; risk of
spreading diseases
Lack of investments and funds in water
access
Population without capacity to
pay for the services
Reduction of water table by
over-exploration
Lack of sanitation which impacts all other services,
health and environment
2.3 Water Treatment
and storage
Limitations of water services
Lack of standard monitoring inflow and treated water
quality
High demand for the treatment capacity and
demand
lack of treated water or international
standard treatment procedures
Lack of investments in increasing water
treatment
No safe water Unsustainable disposal of the residuals from
treatment
Quality of water services
2.4 Water distribution
Limitation of water services
Intermittence on the service
Lack of network expansion;
High proportion of network losses
Contamination in the network and in house
reservoirs
Lack of investments in increasing water
distribution
No safe water Contamination in the network by intermittence
Quality of the service
2.5 Water
Governance
Lack of political will and weak
institutions; lack of regulation
Lack of plans and projects
Bad services and lack of supply
Lack of investments and cost recovery
Lack of capacity of payment for the
services;
Lack of water and environment standards
Difficulties in integrate policies

126
Water Distribution: is related to network and deliver to the end user. There are many issues related to this component in the water supply assessment which are: Intermittence on the service, when energy, treatment or water availability is limited, together with higher demand, the intermittence can be higher; High proportion of network losses: when the network is old or with construction problems or when there are use of water without payment; Contamination in the
network: it usually is linked to intermittence when the networks losses pressure and allow contamination of the water supplied; Contamination in house reservoirs: it is very common to use house reservoirs for regulate the water for a couple of days but it could be a source of contamination when it is not often cleaned. Usually it is not related to the service distribution but is user responsibility, but for uneducated population could be a source of diseases.
Governance in Water supply: Governance is strongly dependent of the service regulation. The usual issues related to management are lack of: project, plans and investment, which results and lack of coverage to attend the demand. It could be related the lack of cost recovery on the services and investment, which increase the difficulties of investments and is related to the lack of political will, resulting in weak institutions with weak technical capacity. It usually is developed when the there is not an independent auditing of the water services.
Sanitation
In the table A.3 are described the main issues based on the following aspects:
Sewage in the source: The main issues are related to: (i) when there is not sewage network, septic tank is often used. It can be source of contamination in the upper layer of the soil, where the population may uses for pump water for supply. Other critical scenario is when the soil does not have capacity of infiltration or the water table is too high. In this situation, sewage flows in the streets or through groundwater; (ii) When there is sewage network and the houses are not be connected to it, since the population does not want (or does not have capacity) to pay for the service. These scenarios results in stormwater contamination.
Sewer Networks: there are a few issues often found such as: separate network with sewage flowing in drainage and stormwater in the sewer network; Bad design and construction, frequent spill to the streams, collapse of the network by erosion of corrosion, bad smell and contamination during floods.
Sewage Treatment: Treatment of sewage could be developed in different levels and water quality parameters conditions, depending of the receiving water capacities for receiving it. For organic source of sewage and normal streams with some dilution capacity the secondary treatment with reduction of DBO and coliform usually are the standard design, but for receiving waters such as reservoir and lakes a tertiary treatment is required because of the risk of eutrophication.
The main issues are related to: lack of treatment; low load treated and efficiency; unsustainable residual treatment and disposal; treatment interruption and sewage flowing to the river; bad smell for neighbors.

127
Table A.3 Sanitation Issues Potential Source of the
problems
Integrated
Management Technical Economic Social Environment Main aspects
3.1 Sewage at the
source
Lack of house connection to
network
Low infiltration and high load with spill to
drainage
Population does not want
connections to network to avoid
the payment
Poor population without capacity
to pay for services
Contamination of wells and neighbor
areas
Contamination of surrounding and water sources
3.2 Sewer network
Bad design and construction;
Lack of maintenance
Separate system with Stormwater in the
network; Collapse due to external effects such
as erosion
Lack of networks due to
lack of funds and cost recovery
Floods from combined
system with diseases
Bad smell and overflow or combined
sewer system
Impacts in the streams and water
sources
3.3 Treatment
Lack of treatment; operation with bad
performance
Low load for treatment and efficiency
Lack of funds and cost
recovery for investments and
operation
Bad smell for neighbors;
space in the city for treatment
plant ’
Treatment interruption’s;
overflow; Unsustainable
residuals disposal
Impact on receiving waters
3.4 Effluent
disposal
Lack of monitoring the receiving waters
Concentration of load without treatment
Lack of investment in conservation
Potential diseases
development
Lake eutrophication; Lack of dilution capacity in the
receiving waters.
Health and environment risks
3.5 Governance Bad management: maintenance and
operation.
Lack technical capacity Lack of political will, investments
and cost recovery
Lack of services assessment and
goals; lack of subsidy.
reuse opportunities; Lack of managing industrial and high
risk loads
Difficulties in integrate policies

128
Effluent disposal: It is related to the water body which is receiving the effluent. When the sewage infiltrate, the contamination in the basin is diffuse and spread, but when it is collected by stormwater or sewer network and dispose without treatment in a water body, the impact is concentrated. The main aspect is the water body capacity in receive the load, treat or untreated. Low water body capacity requires more efficiency in treatment in order to have stream or lake conservation.
Governance: bad management in operation and maintenance, unqualified personal; lack of political will, investments and cost recovery (the price of the service is below the cost). There is not monitoring of river water quality and lack of independent assessment of the services and goals; No regulation of the services which assess its efficiency; the cost of the services is charged to the population when there is only collection of the sewage (sometimes even without it). In this scenario why this company will invest in order to have all the services?
Stormwater
Table A.4 presents the stormwater issues based on the following sub-divisions of it:
Drainage in the source: It is stormwater of the property which is managed by its owner. At this level the main impacts are related to the increase of impervious area, reduction of infiltration, soil erosion and solid waste which could lead to a degraded area and contamined surfaces.
Network and storage: Public stormwater systems usually have a network of channels, conduits and storages (detention or retention ponds) integrated in order to flow the rain water. The issues of this system are related to the following: sewage in the drainage network for separate systems. The high proportion of sewage in the drainage contaminating the receiving waters; Collapsing of the system by corrosion when there is sewage or by high velocity of drainage; High proportion of solid waste and sediment can decrease the flow capacity of the drainage allowing flood conditions; Floods in the networks as result of flow increase or bad measures upstream; for natural stream or storage the erosion and sedimentation together with sewer in the drainage may result in degraded areas.
Measures in major drainage: the main issue in the major drainage are floods for lack of storage or flow capacity which results from upstream flow increase, downstream level control, flow reduction capacity by solid waste and channelization upstream (bad solutions); Increasing total solids upstream during urbanization and lack of control of this sources which results in decreasing capacity of the flow in the network and storage together with degraded areas; Water quality of rain water after it flows in urban contamined surfaces such as roof, side walk, streets and commercial and industrial areas brings important load to the stream. For modern urban drainage management this water needs a treatment in retention or detention ponds together with a connection to treatment plants which requires an integrated lay-out.
Governance: Usually there is no a “utility” to develop urban drainage services. The municipality uses some existing department to attend some of the issues without any real management. The main issues are also: no regulation on source areas which deliver impacts to downstream, transferring the private responsibility to the public; bad management since there is not operation and maintenance and law enforcement; limited knowledge in urban drainage since most of the engineer does not identify the source of the problems.

129
Table A.4 Stormwater Issues Potential Source of the problems Integrated
Urbanization Technical Economic Social Environment Main aspects
4.1 Drainage in
the Source
At property level
High level of impervious areas and high density
Increasing flow and velocity,
erosion
Transference of impacts and cost from private to
public
High vulnerability to
floods
Degraded areas and water
quality contamination
Reduction of infiltration and
recharge
4.2 Network and
storage
Micro and major drainage
Obstruction in drainage due to bridges, building piles and others
urban constructions
Collapse of the network by erosion or corrosion;
sewage in the network
Lack of network due to lack of investments
Frequent floods in the networks
Bed erosion, sediment yield and solid waste
deposition
Impacts on population and
receiving waters
4.3 Measures in
the major
drainage
Lack of Integration of drainage solutions to
urbanization; lack of space for storage
Flood transference in the drainage;
Lack of funds for measures at
major drainage
Increasing flood vulnerability by
flood transference
Lack of sediment or water quality management
Impacts on environment and water sources
4.4 Governance
No regulation for source areas
impacts
Bad management: operation and
maintenance and law enforcement
There is not an utility for the
service and cost recovery
Limited knowledge in stormwater
management
There is not environment license for stormwater
projects
Difficulties in integrate policies

130
Total Solids
Total solids are the sediments from erosion and solid waste. Table A.5 shows the matrix with the main aspects, which are:
Solid Waste collecting services: It is related to the usual service to collect the waste in homes, offices and industrial installations. The collecting and disposal of highly contaminated waste is assumed as specific aspect to this report as mentioned above. There are many scenarios such as: most of the city without services of collecting or receiving centers; no home collecting services, low frequency services which increase the time of storage in the source, allowing diseases vectors, bad population habits which usually through solid waste to streams. There are also scenarios, where the city may have good services, but some areas are of difficulty access because of narrow or bad conditions of the streets, gangs and drug dealers control of the area.
Cleaning streets and public areas: it is the service which should be provided by the municipality. The issues related are the following (table 4.5): There is not service or low frequency of cleaning, bad management and dumping of waste by the population are the mains issues
Soil erosion and sediments: During the development of the urbanization there is a high increase of the sediments because the vegetation is removed and constructed streets without protection of the surfaces. During the rainy days the increase of laminar erosion in the unprotected surface due to flow velocity increases in the impervious areas. It also can generate concentrated erosion and degraded areas. Usually it happens when there is no land protection in the construction and in the urbanization, which should be enforced by the municipality.
Storage Transport and disposal of the solid waste and solids collected in the streets: After the home and street cleaner services were developed the solids are storage and transport to a disposal site. The logistic of these services is important in the development a sustainable service which lack of contamination in the storage and transportation and low cost. The land fill has to be developed in sustainable way in order to avoid contamination of the soil and surface waters
Governance: the main issues are related to a: the existence of a sustainable service with cost recovery, bad management of the existing services, lack of independent assessment of the service, policy or program for decreasing solid waste by recycling.
Institutional and integrated management
Along the analysis of the services in the former matrices the governance are identified since most of the institutional issues are cross-cutting issue. The overall Institutional issues is related mainly to integration of the governance and water resources management at basin and administration are presented here.
Table A.6 shows the main institutional aspects and integrated management issues related to the overall urban water services and its integration to Water Resource Management at National and Regional levels. The main aspects are:

131
Table A.5 Total Solids Issues Potential
Source
of the
problems
Integrated
Urbanization Service Economic Social Environment Main aspects
5.1 Solid waste
collecting service
Waste from construction
sites
There is no home services or low
frequency
Lack of funds and cost recovery services
Lack of education; use of drainage for solid disposal
Solid waste and degraded areas
Large amount of solids in receiving waters and
decreasing flow capacity and floods impacts
5.2 Cleaning streets
and public areas
Narrow streets No services or Low frequency of
cleaning
Bad management
services
Dumping waste by the population in the streets
High amount of solids in the streets and stormwater
Decreasing flow capacity of the rivers and environment
impact
5.3 Soil Erosion and
sediments
No construction practice for
erosion control
No design control for downstream
areas and streams protection
High cost of river cleaning
Solid waste near to
population and spreading diseases
Deforestation without protection; degraded areas
Degraded areas, pollution to downstream streams
5.4 Storage,
Transport and
Disposal
Lack of urban space
contamination of storage areas; Bad logistic
Lack of funds for services
Poor population collecting
waste
Land fill without monitoring or
maintenance or in recharge areas
Surface and Groundwater contamination, lost of funds
5.5 Governance No utility for the service and cost recovery
Bad management of the services
No policy or program for
recycle; lack of cost recovery
Lack of management of service of
poor population
Lack of license and environment
regulation
Difficulties in integrate policies

132
Table A.6 Institutional and Integrated aspects Issues Potential Source of the problems
Legal Management Economic Environment
6.1 National Water
Framework
No National water policy or integrate
legislation
No National Water Authority; fragmented
management
There is not sustainable
investment in water at national level
Limited environmental and institutions
6.2 Water Resource
Management at basin
Lack of national or regional legislation on urban waters
There is not basin organization
Conflicts of water use; lack of economic
support for basin management
Impact from the cities are exported to downstream in
the basin
6.3 Geographic and
water administrations
Conflict of jurisdiction on water
Conflicts of management
Institutional Economically weak
Conflict of jurisdiction on environment
6.4 Integrated Urban
Water services
management
Fragment services on urban waters; no
regulation
Different levels of management for
water in city
There is not cost recovery for the
services
Different levels of management for
environment in city 6.5 Environment
assessment and
enforcement
There is not legal framework of urban
waters impacts
Lack of monitoring and data for planning
No funding for environment
There is no environment assessment or
conservation in the city

133
National Water Framework: It is important for the urban management if the country has a policy for Water Resource and uses the concepts related to IWRM? Together with that the Country has a policy for urban waters? The country has a National Authority for Water? These are important aspects in order to construct a trend for solutions of the urban water issues.
Water Resource Management at basin level: It is important to know if there is any management at basin level, such basin committee and agency relate to the basin decision and support. In that way is important to understand if the basin organization applied any limits or incentives for the city’s urban water management and control of its impacts. In addition to that an important aspect is to find out if there are institutional conflicts among cities and how the impacts from one city to another are managed.
A.1.2 Goals matrix issue
The main aspects related to the impact on the society and environments are on the:
HEALTH OF THE POPULATION and related to diseases proliferation related to water sources and urban water lack of services. The water and sanitation diseases usually are related to lack of safe water and sanitation. Some common diseases related to this lack of services are: diarrhea, cholera, and other bacterial transmission.
The water related diseases can be classified by (Proust, 1993):
• Water borne diseases are related to water quality and they depend on water for their transmission. A few years ago cholera spread through South America mainly to areas where the coverage of safe drinking water was low, such as Peru, the Amazon and the Northeast of Brazil;
• Water-washed diseases are related to hygienic practices which depend mainly on the social and health improvement of the community. They are related to skin, ear and eye infections;
• Water-related and Water-based diseases in which the agent uses water. Prost (1993) reported that any project which increases water surface results in the development of the Anopheles mosquito vectors of malaria and of one of the fresh water snail vectors of schistosomiasis. Another example is leptospirosis a disease that can develop after a flood due to rat’s urine.
NATURAL FLOODS: when the river leaves its lower bed and floods the plains near it. The impact is the result of the occupation of risk areas near to streams by the population as a lack of soil use planning. Others risk area which can resulted in impact to the population are in hill slope since during flood season the soil in the hill moves down because of water weight damaging houses and killing many persons. The main aspects related to flood management were presented in table A.7 which are:
• Large part of the population occupying risk areas (flood plains and hill slopes). It is an issue when a city is crossed by a river which often overflows its natural banks. Poor population usually occupied these areas since it is public area and is near the jobs and facilities. In resettling this population other comes to the same space, which requires a long term sustainable regulation and planning of the space and social arrangements;

134
Table 4.7 Impacts in the Goals
Issues Potential Source of the problems
7.1 Health
Water borne diseases
Water-washed Water-related and Water-based
diseases
7.2 Natural Floods
Large population in flood plain risk
areas
Lack of risk area mapping
Lack of regulation and law
enforcement on the occupation of flood
plains
No alert system of management of the
impacts
Incentives by no refund funds without
prevention
7.3 Environment
No regulation on urban water environment
Lack of law enforcement
No Conservation and preservation
areas in the city or small part of the city
Rivers impacts: Long extension of rivers without fauna or
preservation of banks vegetation
Large extension of degraded areas
7.4 Amenities Small urban area for recreational use:
green and water related spaces
Large number of degraded
recreational areas
Risk of water use for recreation in the
urban space
There is no amenities related to water in the
city

135
• Lack of risk area mapping: without knowledge of the risk area and without including this issue in the urban plan (bad planning) it is natural that the population will occupy the space more flat, which usually is the risk one. In some cities with many hills the population with lowest income move to steep slopes without much infrastructure which could move down during floods.
• Lack of regulation or/and law enforcement in flood plains: The process mentioned above is mainly due to lack of regulation of the space or law enforcement when it exists.
• No alert system: The alert of the floods are used to mitigate the floods, informing the population in advance and give support to its difficulties. The lack of a system such as that will increase the impacts;
• Incentives by refund funds without prevention. Usually the countries try to mitigate the floods after it happens using no refund funds, but it will delay the prevention, since the local population knows that during the events.
ENVIRONMENT: There are many related to environment in urban areas. It is impossible to bring in the assessment all of the aspects. The main issues are:
• No regulation on urban water environment The primitive condition is a complete lack of legislation for environment control in the country and in the cities;
• Lack of law enforcement: Even when exists legislation it is common to find a lack of law enforcement and environment planning for the city;
• Small space for conservation and preservation areas: Urban environment conservation requires some spaces for the more important areas such as wetlands, hill slope, among others. These are conservation and preservation areas more sustain part of the environment. It is important to understand how the city deals with that.
• Rivers impacts: Rivers are the ultimate area where what is done in the basin reflects in its course. The common issues are the lack of oxygen and aquatic live, sometimes the river is closed in order to get more space for cars and to covers the pollution. How it is important in the city what is left from vegetation near the banks which supports its conditions, together with erosion and sedimentation.
• Degraded areas: The effect of soil erosion, urban development without soil protection, urbanization and velocity increase is likely to develop many degraded space in the city. It is important to understand how this issue is important for the assessed city.
AMMENITIES: Quality of live is related to the safe live, where the city services improve the service to eliminate the water related diseases, avoid floods impacts and improve environment. Another important component of the quality of live is the amenities which the city can offer to its population. Some of these amenities are related to water services in the city. Some of the main important are:

136
• Small area for recreational use: what is the space for population recreation, is it important? In the city urban perspective?
• Large number of recreational degraded areas: the existing recreational area are degraded by many reasons such as lack of maintenance and population lack of care;
• Risk on the recreational use of the water: the water is used for recreation, but there is a risk for health or even floods conditions.
• Lack of amenities related to water in the city: the limited existence of amenities related to water is a condition in the city and it is an important issue.
A.2 Instructions
A.2.1 Plan of the visit in the city
Before travel is recommended to have an overview of:
• City main aspects in relation to urban population and economic and social developments. I think this information we can get in the internet but they could have a summary.
• Urban waters: water supply, sanitation, urban drainage and total solids basic information which could be obtained in report summaries or send us some reports they think it give us information.
• Other documents and reports which addresses issues and planning in the city in the last years which could inform us. Internet survey gives information of floods and natural disasters, news about urban waters services. The main key words for survey are: name of the city followed by the subject such as urbanization, floods, land slide, water supply, sanitation, health, slums, poor, etc.
In planning the agenda the suggestions are:
• Schedule in order to interview representatives of the institutions in charge of Urban planning, water supply, sanitation, stormwater, solid waste, environment and water resource authorities;
• Schedule in order to interviews ONGs, outside of municipal govern consultants, World Bank specialists on the subject and Central Govern authorities
• Travel through the city looking for major drainage, high and low income neighborhoods together with main areas and take a overview of the main sub-basins.
• Some installation such as wastewater treatment plants and Water supply reservoirs and Water Treatment Plants would be recommended.
It is likely that all above recommendation is impossible to develop in a week. Sometimes would be better to stay a few days longer and improve the knowledge about the city.
In the end of each day is recommended a discussion among the persons in the mission. In the last day is important to have a complete discussion and a preparation of the outline of the report about the case study.

137
A.2.1 Instructions
An excel file called Issuesmatrcices.xls was prepared to help in the assessment. This file has the following tables (table A.8 to A.13) to support the development of the assessment. Others supporting table can be found in the file.
Table A.8 Instructions
A. What ? Description Support information for the task
Contents: In this file are presented the main matrix of issues
B. Matrices
The matrices are organized by main urban water aspects : urban planning, water supply, sanitation, urban drainage, total solids, institutional and qualitative matrix of impacts
C. Matrices contents
Previous identification of the main issues in urban planning and urban waters and its main impacts in society and environment
D. Procedures
1. Identify which issues are related to the specific case without given them priority. It is likely that most of the issues are found in the cities but you need to judge its importance;
In the analysis of the issues we recommend the interview of govern officials, NGOs and bank consultant in the country which have some knowledge about the city.
2. You can add new issues using the last line of each matrix.
From the interview you cand add more information to the matrix and send us to updated it.
3. In the end there is a sheet to be filled with the selected issues, called Selected issues.
The excel file is a support file prepare to help the filling and analysis. You can updated it with your own practice
4. Use colors in order to give priorities for each issue. RED for maximum priority; YELLOW for issues which are not a problem but could be in the future; GREEN for minor issues.
This is a subjective procedure and you can ask other people from the city if they agree with your assessment or fill it with them. Since it is subjective it is good to have another option about.
5. Identify and describe the issues which are related to more than one aspect (integrated issue)
This relationship of aspects (urban waters, institutional and urban planning) is important for identification the interconnection of problems in the city
6. Develop a cause-effect relationship together with the first guess of the measures
This description will give perspective and you could develop a flowchart relating the main causes, issues and impacts. In the end is important to propose some measures
E. Conclusions and findings
7. Describe your conclusion about the findings
The conclusions should be summary of the findings, selecting mainly the red issues and integrated aspects.

138
Table A.9 Some previous questions
Questions type
1. What do you thing are the main urban waters issues of the city? (Define the meaning of urban waters since most of professionals do not know) Geral
2. What do you think are the main institutional difficulties? Management
3. Do you think the administration has political will to invest in urban waters issues? Political
4.What do you think would be benefits of improving urban waters for your city?
Perception of the benefits
5. What level of priority the aspects of urban waters have for this administration ? Political
6. Do you know that Urban waters investments are for long term and the public perception of the results may occur after this administration? What should be reaction of this administration to this perception? Political
7. How much of the budget you think can be use for investments in these problems along the time? Financial
8. Do you know that in order to solve the problems you have to rise the taxes and charge more to the population? economic
9. Go through the matrices asking in his perception which are the more important issues urban waters
10. What are the reports and documents you think I should read?
11. Ask to him or her if there are any addition issues he would like to address urban waters Table A.10. List of interviewed persons
Name age background position Your comments

139
A.11 Some Information’s to obtain Type Description Urban Planning What are the main causes of population change?
What are the tendency of expansion and change in the city? What is the proportion of irregular areas in the city and slums? Is this any program for improvement? Is this difficulties in the Urban Master Plan enforcement ?
Water supply What are the source of water for the city and where they are located? What is the discharge regulated by the system (surface water or pumped from groundwater)? The reservoir or the aquifers have contamination? What is the water treatment capacity? What is the proportion of losses in the network? Is this intermittence in the service? What is the proportion of the population with lack of water supply? What is the cost of the services? Is this any subsidy? What is the economic condition of the company?
Sanitation What is the proportion of the population with septic tank and connected to networks? What is the proportion of separate network for waste water? What is proportion of collected waste water treated? What is the level of treatment and efficiency? The receiving water has capacity to receive the waste? What are the water quality variables used as indicators in the environment? What is the cost for sanitation? Is this any subsidy? What is the economic condition of the company?
Stormwater Is this planning a maintenance service in stormwater? Is this control in urbanization impact on the flow increase? Is this frequent flood in the stormwater of the city? What type of solutions has been used? What is population perception and importance? How much is the budget for stormwater services? Is this charged to the population?
Solid Waste Is this service of collecting solid waste in all city? What is the coverage? Is this service of cleaning streets? What is the coverage and frequency? Is this sustainable disposal site? Is this cleaning of detention ponds, creeks and conduits? Is this cost recovery of the services? What is the unit cost and profile of the price?
Institutional Is this an independent regulation of Urban water Services? Is this Water Resource and Environment management and licensing? Is this integration in the urban water services? Is this stormwater services?
Impacts What are the types of floods? Land Slide is an issue? What is relation of urban waters and health impacts? What is water quality in the creeks near the city? Do you have assessment of water quality indicators near the city? Is this degraded area as resulted of urbanization, erosion or other imnpacts?

140
Table A.12 Selected issues by interview
Name issues comments
Aspects Urban Planning Water Supply sanitation
Stormwater Total Solids
Institutional
Impacts Table A.13 Final selection
Aspects Issue 1 description issue 2 description
Urban Planning
Water Supply
sanitation
Stormwater
Total Solids
Institutional
Impacts Table A.14 Cause – Effect
N. Issues Aspects main causes impacts
Assessment of main required measures

141
AANNNNEEXX BB -- EESSTTIIMMAATTIIOONN OOFF TTHHEE IINNDDIICCAATTOORRSS
B.1 Urban Development indicators
B.1.1 Population
Population is the number of persons which leaves in the city. This information is basic information available in every city
B.1.2 Estimation of Urban Area
The urban area is the region of the municipality a density usually greater than 5 -10 persons/ha. The alternatives for estimation are:
a. Urban density is a known variable
Ud
PUa o
= (B.1)
where Ua is the urban area (ha); Po is the population; and Ud is de urban density in person/ha.
b.The urban density is not known. In this scenario there are two options:
(b.1) use the Google Earth or other satellite image and take a look on the urban space and estimate the area. It does not to need to be precise. It is only a rough estimative of the dimension of the space of the city;
(b.2) assume an urban density for the city based on the information from the site mentioned in
chapter 3 or the density typical of this type of city and region. For instance in Brazil Embrapa (2008) developed a study for the State of the country.
B.1.3 Urban density
Urban density may vary from 10 person/ha to 300 person/ha depending of some urban planning parameters which are:
(a) Proportion private areas based on the total or urban area (α);
(b) Number of persons per housing unit (P);
(c) Mean dimension of the plots, (s in m2);
(d) Mean number housing unit per plot (r).
The urban density is
Ud = α. P. r.10.000/s (B. 2)

142
Some of these parameters are standard for a region or a city, since the urban development could be similar. Table B.1 shows some of these values and in the file indicators.xls there is spread sheet for estimation of the density in function based on these parameters.
Figure B.1 shows the variation of density based for houses (one unit per plot) with variation of plot area and number of persons per unit. It shows that below 400 m2 of plot area the density is above 60 persons/ha in an occupation such as a house (assuming 65% of private area).
Table B.1 Indicators for urban density estimation
Parameter Simbol. Range1 Description Information
Proportion of private areas in relation to total area(%)
Α 15 – 40 It includes green public areas, sidewalk, streets, etc.
Old cities and poor countries it is usually near to lower limit (high density)
Mean number of person per housing unit
P 2 – 10 Residents in each unit
Decrease with the income
Mean size of the plots
(m2)
S 20 -1500 Plot araea Some countries have lower limit as 120 – 200 m2. It Decrease with the decrease of income. For buildings it requires also larger areas.
Mean housing unit per plot
R 1 – 100 Number of house or apartments in the same plot
It varies, depending on the combination of plot size and height of the building.
1 – In Brazil usually is α =35%; p = 3,5; s= 300 - 500 m2
Figure B.1 Urban density for size of plot and number of person for house unit for 65% of private area.
0,0
20,0
40,0
60,0
80,0
100,0
120,0
140,0
0 200 400 600 800 1000 1200
urb
an
de
nsi
ty,
pe
rso
n/h
á
Plot area, m2
p=3,5
p=3
p=4

143
Figure B.2 shows the variation of urban density with the increase mean number of units per plot, based on size of the plots. This figure gives an idea of the urban density with increase number of stores in the buildings.
This parameter does not take into account commercial and industrial area and some distortion could happen in assessment of the urban water services based in this indicator, but usually housing is the main space used in the city.
Figure B.2 Urban density for size of plot and number of units per plot. (3.5 person/unit and 65% of private areas).
The hydrologic indicator is the Impervious areas in the urban environment. It can be related to urban density. From this relation is possible to identify the amount or impervious areas/person. In Figure B.3 is presented some of these relantionship for USA and Brazilian cities. The slopes of relantionship for New Jersey cities, three Brazilian cities and APWA are almost the same which shows the trend of the relantionship of density and impervious areas.
The difference among the curves are the starting level, which is likely to represent part of the public areas. Using a straight line, the estimation of this coefficients in the range of urban density between 30 to 80 person/ha is presented in table B.2.
This relantionship can change for small areas, when there are parks and other occupations. The relantionship below is mainly used for overall assessment.
Table B.2 relantionship of urban density and impervious areas
Source A B
São Paulo /Curitiba/PortoAlegre (Brazil) 0.50 5
New Jersey cities 0.50 21
APWA 0.55 30.5
Impervious area (%) = A.[density in person/ha] + B
0,0
50,0
100,0
150,0
200,0
250,0
300,0
350,0
400,0
450,0
500,0
0 5 10 15 20
urb
an
de
nsi
ty,
pe
rso
n/h
á
number of units per plot
area=500m2
area=800 m2
area = 1000 m2

144
Figure B.3. Urban density and impervious areas for USA cities (567 municipalities of New Jersey, and APWA curve (Henley et al. 1977) and a mean of three major Brazilian cities: São Paulo,
Porto Alegre and Curitiba (Campana and Tucci, 1994).
B.2 Water supply indicators
B.2.1 Water demand
The water demand is calculated by
Wu
PWd o
.86400= (B.3)
Where Wd is de water demand in L/s; Po is the population in persons; Wu is the mean water consume per person in L/person/day. Table B.3 presents some data from cities. See indicators.xls sheet water & sanitation for calculations.
B.2.2 Water avaliability
In the main text was presented the equation which allows the estimation of water availability. In this annex is presented the procedure in order to estimate the members of the equation.
Water yield (Qy)
The maximum water yield from a basin it is the mean flow (Qm). But usually the water yield is a proportion of the mean flow β.
When there is not regularization (reservoir) the availability flow is based on the risk of occurrence of natural flow. The flow duration curve is used for that. It relates the flow and its proportion of duration in the time (probability). For instance, Q95 is the flow which in 95% of the time the values
0
10
20
30
40
50
60
70
80
0 20 40 60 80 100 120
Imp
erv
iou
s a
rea
, %
Density, person/hectar
New Jersey
APWA
Brazilian Cities

145
are greater than this value. Assuming that 95% is an acceptable risk Q95 = Qy. In a region is possible to develop a mean relationship of r = Q95/Qm. In this case
Table B.3 shows some values of mean water consume per capita in some cities around the world. City or country Year of assessment Mean unit consume
L/person/day Losses in the
network Canada 1984 431 15
USA 1990 666 12 Costa Rica 1994 197 25
Tokyo 1990 355 15 Santiago 1994 204 28 Bogota 1992 167 40
São Paulo 1992 237 40 Brasília 1989 211 19
Qy = Q95 = r. Qm
In this case β = r.
When there is a reservoir and regularization it is possible to regulate a flow as a proportion of the mean flow in the basin (β). For a temperate and tropical climate it could a maximum of 0.40 to 0.7 and for an arid climate is about 0.25. It also is function of the topography in the area.
The mean flow and its relation r mentioned above are usually estimated by data in the region with similar hydrologic conditions or by literature values. There are a few procedures which could be used to estimate these indicators based on the data. The methodology described below is simple and assume some error.
Use the existing flow series in order to estimate the mean flow of the gage with data (see figure B.4) and estimate the mean specific flow dividing by the basin area. Usually when there is not a large change in the rainfall along the space in the basin the mean specific discharge does not have a large variability.
The mean flow (Q) usually is obtained in m3/s or L/s and the basin Area is in km2. The specific discharge is [L/(s.km2], when the flow is in L/s.
A
Qq =
(B.4)
For each basin j with flow data will be a specific discharge qj. Mean of these values would be the
regional
n
j
b
∑=
(B.5)
The obtained value has to have some compatibility with the mean annual rainfall. The rainfall is usually obtained in mm, transforming the qb in mm, which is q (mm) = 31,536 qb (l/s.km2). Using the rainfall the flow coefficient is

146
P
qC b=
(B.6)
Figure B.4 Flow gages and flow demand
This coefficient usually varies in the range 0.10 – 0.45 (See table B.4) from a natural basin in climates such as tropical, temperate and cold. In semi-arid regions this coefficient can be near to zero (~0.04). Since this flow and rainfall are obtained from different sources, if the coefficient is outside of the range and could be result of bad data.
Table B.4 Flow coefficients
Type of Basin Rainfall Mm
Flow coefficient1
Tropical 1400 – 2400 0.25 – 0.45 Temperate 600 – 1200 0.20 – 0.35 Dry 400 – 600 0.02 - 0.10 1 – lower limit with high infiltration and evapotranspiration; 2 – upper limit with low infiltration.
The mean flow yield in the section where the demand is required is obtained by multiply the mean specific discharge of the basin by the basin area where it is required (see figure B.3).
Qm (i) = qb. A(i) (B.7)
where (i) is the required section.
The coefficient r can be obtained by the use of the same procedure described for the specific discharge.
When there are not data in the basin or in other representative basin in the region, from the rainfall is possible to estimate the mean flow and Q by the flow coefficient.
Sections j with flow records (Q)
A
B A and B demand Qm

147
B.3 Sewage Loads and indexes
The total sewage flow is a proportion of water supply in the city. It is estimated by
Qs = α. Wd (B.7)
Where α is the proportion of the water supply which return as sewage. Usually this value varies from 0.8 – 1.
The total load is product of the flow by the concentration of the water quality parameter, which is
Sl = 86.4 Ci. Qs (B.8)
Where Sl is in kg/day In the case of Coliform it result in Num; Ci is the concentration of the water quality parameter in mg/L. In the case of coliform it is Num/100mgL and coefficient is change to 8.64; and Qs is the sewage flow in m3/s.
The main water quality parameters and what it represents, in terms of source and impact, are presented in the table B.5 together its concentration from domestic sewage.
The total load may be infiltrating in soil by septic tanks or collected by sewer network or dumped in the drainage. The load in soil is
Gl = a. Sl (B.9)
Where a is the proportion of load which is sent to soil by septic tank (varies from 0 to 1).
The stream and reservoir loads is calculated by
Rl = [(1-kj). b+c) Sl (B.10)
where c is the proportion of the total load which is dumped in the streams without any level of treatment. It is the sewage flowing through stormwater pipes, delivered in the streets or directly on the streams; b is the proportion of the sewage which collected by sewer network; and kj is the proportion of load treated for this type of water quality parameter j.
The coefficients a, b, c and kj are obtained for each city and they should be a+b+c=1. It also can be obtained from state officials or estimated by interview. In some countries it is part of the statistics on water and sanitation.
The total load for each water quality parameter in groundwater and streams from the city is
GLi = 86.4.a.Ci.Qs (B.11)
Rli=86.4.[(1-k)b+c].Ci.Qs (B.12)
The relation of the total Load and the treated load can be estimated as an efficiency index for the city in each water quality parameter. There two indexes:

148
Table B.5 Values for water quality parameters in the untreated sewage
Parâmetro Indicator Untreateda
Sewage CSOb Stormwaterc
BOD – Biochemistry Oxygen Demand (mg/L)
Organic load 160
600-200
10-250 (30)
P – Phosphorus (mg/L) Nutrient 10 1-11 0.2 – 1.7 (0.6) N– Nitrogen (mg/L) Nutrient 35 3-24 3 – 10 Coliformes (Num/100ml)) Biological 107-109 105-107 103 – 108
Suspended solids
225 100-1100 3,000-11,000
(650) a- Novotny et al, 1989; b – CSO= Combined Sewer Overflow, Novotny (2003); c Novotny and Chesters (1981) and Lager and Smith (1974); (..) mean
1. The surface index (without groundwater), called here by ING. This index assesses only water surface contamination;
SLa
RlI�G i
j)1( −
= surface índex load (B.13)
2. Global index, IWG which identify from the total water delivered in the proportion of water left in the environment.
SL
RlIWG i
j = global index (1.14)
These are reliable indicators of sanitation of a city, since they assess the amount of the load which is treated from the total deliver from the population. In this scenario is almost impossible to reach 100%, but the goals are to decrease a and c and increase k, in order to reach levels of at least 20%.
B.4 Urban Drainage indicators (stormwater)
The main urban drainage indicators are: quantitative which measures the required volume need to decrease the peak flow due to urbanization (Sv) and the increase in the pollution load from urban drainage, which is qualitative indicator (Ls).
B.4.1 Quantitative Indicator
The flow increase in peak and volume in an urban area is dependent of the impervious areas and time of concentration of the basin, which is dependent of the existence of conduits or channels. This increase is dependent also of the basin characteristics and should be estimated by each basin in the city based on the impervious area, basin area and time of concentration for a specific rainfall risk. This parameter should be compared to the channel capacity for that risk in order to find out if there is a flood condition. This analysis has as requirement a few physical information’s about the basins which is not available at this level o f assessment.

149
In the development the solution of stormwater usually the goal is to obtain the volume needed to dump the peak to the conduits capacity. In high urbanization the required volume is greater than less urban area and it is an indicator of impact and of cost.
From our experience of a few cities in South America, the stormwater planning detention volume requirement for flood control is dependent of: impervious areas, existing flow capacity and rainfall risk. Table B.6 summarized some of our experience in Brazil. This information allows the assessment of the required volume and area for flood management. Table B.6 required detention volume for flood management in urban areas Description Volume
m3/ha Urban residential areas with ~ 60% of impervious areas 10 years 100-140 25 years 200-220 Urban Residential area with ~40% of impervious areas 10 years 70 – 100 Downtown with > 60% of impervious areas 10 years 200
The volume can be estimated also by the equation bellow as
94,0
05,1
Qc
AI.10460vt = (B.15)
Where vt is the specific volume (m3/ha); AI is the impervious area (between 0 and 1) and Qc is the existing flow capacity of the main section of the basin in L/(s.km2). It was developed by a 10 years rainfall for a city in South America with an annual rainfall of 1,400 mm.
Since in stormwater the depth varies from 0.8 to 1.3 m because of the major drainage and using 1.0 m as mean depth the required area for detention in the basin varies from 100 – 200 m2/ha, which is about 1 – 2 % of the basin area.
B.4.2 Qualitative Indicator
Stormwater is the source of pollution due to washing urban surfaces. The main aspects of this load are:
• The pollution source is the contents deposited in the urban surfaces which are later on washed to the stream after a rain period;
• In the rural areas the loads are related the use such as: agriculture, forest, or other; and in urban areas is dependent of air pollution which is mainly due to industrial emissions and to fossil fuels;
• 95% of the load from stormwater are carried out in the first part of the overland flow representing about 20 to 35 mm of total rainfall

150
The load from a stormwater can be estimated by the simple method was recommended by Schueller (1987)
..4,86 CQL = (B.16)
Where L is the load in (kg/day); Q is the flow of the storm events (m3/s) ; C is the mean concentration in mg/L. The flow can be estimated by
Qu = 31536
.. ACPr sm (B.17)
Where r is the proportion of rainfall which results in overland flow. There are many events which does not result in overland flow because of its low intensity. In order to take into account this events r is between 0.8 and 0.95. There are 5 to 20% of the daily rainfalls which will not produce overland flow. Usually r is assumed as 0.9; A is the basin drainage in km2; Pm is the total annual rainfall in mm; Cs is the flow coefficient, which is obtained by (Tucci, 2007) with data of Brazilian and USA urban basins (see figure B.5.)
Cs = 0,05 + 0,9.AI
Where AI is the proportion of impervious areas (between 0 and 1). The impervious areas can be obtained from urban density as explained above.
The load in kg/year is
CAIAPrL m ).9,005,0.(.. += (B.18)
The concentration of the parameters in urban drainage are presented in table B.5
Figure B.5 Flow coefficient and impervious area (Tucci,2007)
0
0,2
0,4
0,6
0,8
1
1,2
0 20 40 60 80 100 120
área impermeável (%)
C
EUA
Brasil

151
B.4.2 Support capacity (Sc)
The load effluent from the city is disposed in the water system: reservoir, river, ocean or groundwater. Each system has a capacity of dilution of the residual load from the urban development. There are scenarios where the load is too small for the water system capacity and in other the capacity is so small that even with high level of treatment the capacity is not enough to receive the load.
The assessment of assimilation capacity of the water system is dependent of system and load characteristics. Each region has its standard for water quality in water systems and licensing the disposals. In developing countries usually the cities develops without control and the impacts are often found in the rivers and environment enforcement is weak.
In this document it is covered only a basic indicator for river and reservoirs systems in order to have a first indicator between the load and water assimilation capacity. The assessment is different for a river or reservoir, as described below. In the river the main issues related to organic load are related to Dissolved Oxygen and BOD Biochemical Oxygen Demand for river sustainability and in the reservoir the eutrophic conditions are the main important. The eutrophic condition is assessed mainly based on the phosphorus concentration of the reservoir or lake.
For a river:
The Support capacity (SCi) for each water quality parameter should be greater than the total disposed in the river system for each water quality parameter. This support capacity is estimated by (figure B.6).
Sci = Qs.Ci = (Qs+QR)CLi-QRCRi
Sci = Qs CLi- QR(CLi-CRi) (B.15)
Figure B.6 – River reach characterization
Where Qs is the total discharge from the load (see above) and Ci the load concentration. The total load Qs.Ci should be the sum of the point type of pollution from domestic and industrial system and non-point (diffuse) pollution from agriculture and urban loads; CLi is the maximum concentration allowed in the river based on the legislation for the i water quality parameter; QR the existing upstream discharge in the river (for the assessment is often used a minimum
0
Load in section O
Qs – discharge Ci - water quality parameter concentration
Upstream Load
QR - upstream flow CRi - water quality parameter upstream o section O
C

152
discharge with some frequency, for instance minimum discharge of 10 years and 7 days duration); CRi is the concentration of the water quality parameter i, upstream of the disposal.
It can be calculated for the same group of water quality parameters presented in the load estimate. In addition, it is important to assess the DO -Dissolved Oxygen which consequence of the River BOD (Biochemical Oxygen Demand). A minimum DO concentration is required in order to support river fauna. The support capacity of DO is estimated based on DBO and some river characteristics (Streeter Phelps method) by
DOc = Dc + DOs (B.16)
Where DOc is the minimum value which usually occur downstream of the load entrance in the river; DOs is the DO of saturation in the water and Dc is the deficit of DO in the water (Dc=DO – DOs). The estimative o Dc is obtained by
vxk
o
vxkvxko eDeekk
LkDc /.2/./.
12
1 )[)(
.211 −−−
+−−
= (B.17)
Where Do is the deficit of OD in the section 0 (mg/L); Lo is the concentration of BOD at section o (mg/L) ; k1 is BOD decay coefficient (1/day); k2 is the reparation coefficient (1/day); v is the flow velocity of the river (km/day)and x is the distance from section 0 to critical section C (km), estimated by
]})(
1[ln{1
12
1
2
12 kL
kkD
k
k
kk
vx
o
o −−
−=
The coefficients k1 and k2 are estimated based in the data from the tables B.5 and B.6 and
DOs = 14.652 – 0.41022.T + 7.991.10-3.T2-7.774.10-5.T3
Table B.5 Reaeration coefficient k2 (Hann e Wiley, 1972) River k2
mg/L Upper limit
mg/L Pequenos Lagos e remanso 0,12 0,23 Rios Calmos e grandes lagos 0,23 0,34 Grandes rios com pequena velocidade 0,34 0,46 Rios ligeiros 0,69 1,15 Rios rápidos e cascatas 1,15
Table B.6 Decay coefficient k2 (Hann e Wiley, 1972)
Description k1
mg/L Upper limit
mg/L Load with slower degradation 0,10 0,20
Domestic load 0,20 0,25 Fast degradation load 0,25 0,5

153
For reservoirs:
The support capacity of a reservoir is mainly related to its eutrophic conditions. When a reservoir is poor in nutrients it is oligotrophic and when it is rich in nutrients it is eutrophic, which is an undesirable condition for water bodies, since it can create algae and the contamined the water for water supply.
This condition is controlled by the amount of Nutrients, phosphorus and Nitrogen in the reservoir, mainly the first. Table B.7 presents the limits and the classification of the reservoir based on this limits.
In order to assess the reservoir conditions the mean phosphorus concentration has to be calculated which are
10/
.
+=
tH
WeP
for a temperatre reservoir (B.14)
H
trWeP
.3
. 4/3
= for a tropical reservoir (B.15)
Where P is the phosphorus in mg/l; We is total load which enters the reservoir and it is estimated by the sum of point –pollution and non-point pollution as mentioned above [in g/(m2.year)]; H is the mean depth of the reservoir in m and t is residence time (V/Q) in years, where V is the volume and Q is the mean inflow to the reservoir.
Table B.7 Reservoir trophic conditions (Vollenweider, 1975 and CEPIS, 1990)
Climate Eutrophic Mesotrophic Oligotrophic
Temperate � 0,02 mg/L 0,01 < P < 0,02 mg/L < 0,01 mg/L
Tropical � 0,07 mg/L 0,03< P < 0,07 mg/L < 0,03 mg/L
B.5 Total solids
The origins of the solids can be from: (a) Sediment yield from basin eroded by stormwater; and (b) solid waste from population washed by the rain. In the urban environment both contents come together since the waster washes pervious and impervious surface. The main differences are the source of the solids. In table B.8 is presented a summary of the solids sources in the stormwater based in the type of urban development.
The assessment of sediments yield in an urban basin is dependent of the following: (a) stage of development of the basin; (b) soil conservation measures; (c) type of soil. Table B.9 shows some sediment yields from urban areas. Usually the upper values occurs when the city is under construction, decreasing after it is developed. In the Washington Manual for stormwater Total solids (Schueller, 1987) is estimated based on rural (28,8 t/mi2/ano), sub-urban (45 t/mi2/ano) and

154
urban (71 t/mi2/ano). In São Paulo Loret Ramos et al (1993) estimated for basin under development the sediment yield of about 10.000 m3/(km2.year), which is about 2600 t/mi2/ano.
Solid Waste assessment was presented in 1.6.3 and table 1.6 presents some of the amount of solid waste left in the streets. The key aspect related to solids is the amount left to drainage (see chapter 1.6.3). When the services are bad the amount left to the drainage can be about 18% of the total volume. In Jakarta was estimated that 4,000 m3/day was not collected (Berbassi,2008). When the services are better the amount left to drainage is less than 1%, but it maybe still high.
Neves (2006) in a urban basin of Porto Alegre Brazil of 1,9 km2 of reliable solid waste service estimated the amount that enters the drainage is 11.72 kg ha−1 year−1 (in mass) and the output is 3.5 kg ha−1 year−1. These are comparable values to those in Table 4.3. From these numbers it can be seen that 31% of the garbage that enters the drainage system leaves the drainage system. Thus, it appears that 70% of the garbage that enters the drainage remains to block the pipes, but since the amount of paper that stays inside the pipes is about 40%, and it is likely that this will be dissolved, the amount that blocks the pipes is also about 30%.
Table B.9 Sediment yield in some basins (Dawdy,1967)
River and place Area (mi2)
Sediment yield
(t/mi2.ano)
Use
Watts Branch, Rock., Md 3.7 516 rural Seneca Creek, Daw., Md 101 320 rural 21.3 470 rural Anacostia River, Col, Md 300 808 rural Gunpowder, Towson, Md 300 233 Rural Gunpowder Falls, H., Md 80 913 Rural 80 500 Rural Monocacy River, Fr.,Md 817 327 rural George Cr., Franklin, Md 72.4 207 Rural florestada Conococheaque Cr., Md\ 494 217 Rural Helton Branch, Ky 0.85 15 Florestada Oregon Run, Cock., Md 0.236 72000 Industrial Johns Hopkins Univ, Md 0.0025 140000 In construction –
commercial Minebank Run, Tow, Md 0.031 80000 Residential Kensington, Md 0.032 121000 Residential L.Barcroft, Fairfax, Va. 9.5 25000
Residential
Greenbelt Res., Md. 0.83 5600 Urban Anacostia Riv, Hy., Md 49.4 1200 Urban Anacostia Riv, Riv, Md 72.8 1000 Urban Cane Branch, Som, Ky 0.67 1147 Mining Rock Creek, S. D, W.DC 62.2 1600 Urban Little Falls Br ,Bet,Md 4.1 2320 Urban Gwynns Falls, Md 0.094 11300 Residential
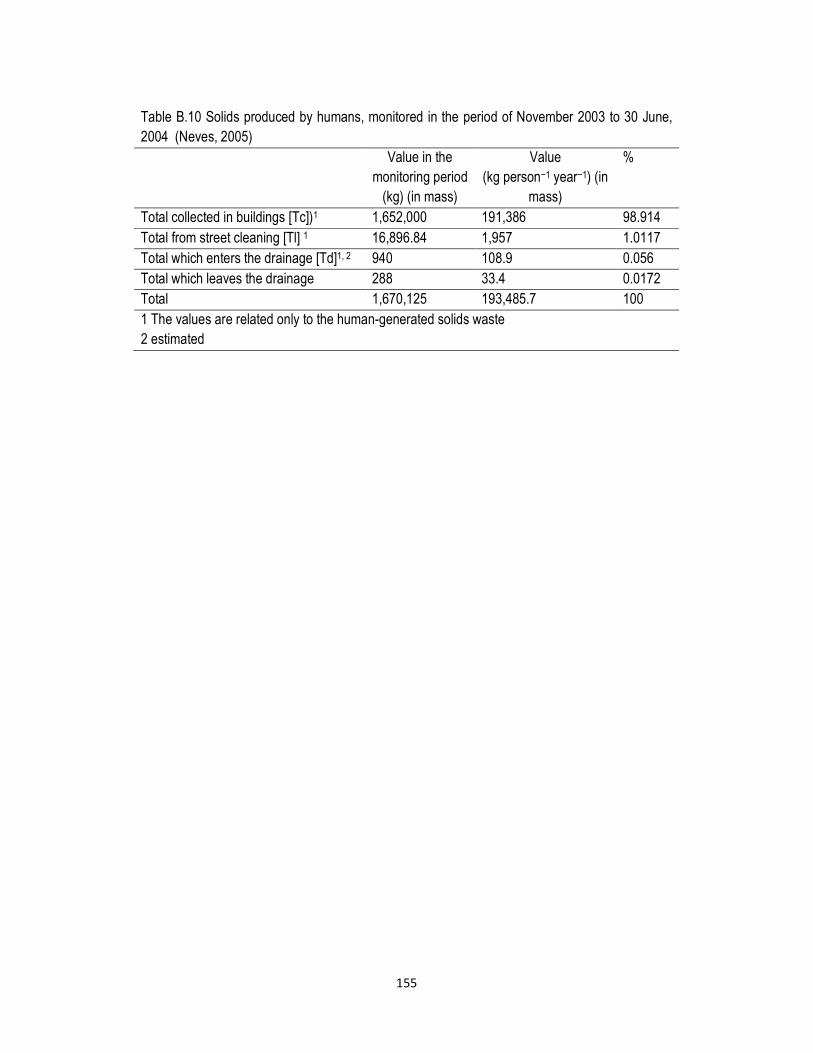
155
Table B.10 Solids produced by humans, monitored in the period of November 2003 to 30 June, 2004 (Neves, 2005) Value in the
monitoring period (kg) (in mass)
Value (kg person−1 year−1) (in
mass)
%
Total collected in buildings [Tc])1 1,652,000 191,386 98.914 Total from street cleaning [Tl] 1 16,896.84 1,957 1.0117 Total which enters the drainage [Td]1, 2 940 108.9 0.056 Total which leaves the drainage 288 33.4 0.0172 Total 1,670,125 193,485.7 100 1 The values are related only to the human-generated solids waste 2 estimated

156
ANNEX C – COST OF INVESTMENTS AND OPERATION AND MAINTENANCE
At this stage the requirement is to assess the require funds needed for the strategy. It is not a complete economical assessment, but only to find the order of magnitude of the investments in the development of the solutions.
In order to develop the cost in the annex is present the unit cost of the urban waters aspects based on the existing information. The costs can be related to three levels (a) Studies and preparation of the plans and projects; (b) Investments or improvement costs; (c) Operation and Maintenance.
C.1 Water Supply and Sanitation
Hutton (2007) presented a table of costs taking into account some different levels of improvements and regions of the word in an overall assessment of water and sanitation requirements. Table C.1 reflect this per capita costs and its conditions.
Table C.1 Estimates per capita costs, US$ from 2000 (Hutton,2007)
Type of Service Region Construction costs US$
Annual total costs per capita US$
Water Supply
Basic improvement1
Asia Africa Latin America & Caribe
17 – 64 21 - 49 36 - 55
1.26 - 4.95 1.55 - 3.62 3.17 - 4.07
Household connections2
Asia Africa Latin America & Caribe
92 102 144
4.78 - 5.70 5.30 - 12.75 7.48 - 15.29
Sanitation
Basic Improvement3 Asia Africa Latin America & Caribe
26 - 50 3 - 91 52 - 60
3.92 - 5.70 4.88 - 6.21 5.84 - 6.44
Septic Tank Asia Africa Latin America & Caribe
104 115 160
9.10 9.75 12.39
Household connections4
Asia Africa Latin America & Caribe
154 120 160
8.99 – 11.95 7.01 - 10.03 9.34 - 13.38
1 – Borehole, stand post, dug well, rainwater harvesting 2 – Lower estimate: piped water, not regulated; higher estimate: piped water 3 – VIP, small pit latrine, and pour flush 4 – Lower estimate: sewer connections; higher estimate: sewer connections, with partial treatment

157
Whittington (2006) presents the economic costs of providing a household with modern water and sanitation services. It is the sum of seven principal components presented in table C.2 with its unit costs. This values change with the scale of projects, available of water, disposal conditions and environment requirements. These costs include investments and operation.
Using this cost with water demand the total cost of investment and operation per person for a range of 150 – 250 L/person/day is US$ 9 – 22 per month/person. In a family of 4 it would represent US$ 36 – 88 per month/person. This value is high for many families in developing countries. There many economic mechanisms which could be use in order to mitigate this cost (see Whittington, 2006)..
Table C.2 Cost estimates: improved water and sanitation services (Whittington, 2006)
N. Component US$/ m3
1 Opportunity cost of raw water supply 0.05 – 0.20
2 Storage and Transmission to treatment plant 0.15 - 0.20
3 Treatment of drinking water standards 0.15 - 0.20
4 Distribution of water to households 0.50 - 0.70
5 Collection of wastewater from home and conveyance to wastewater treatment plant
0.80 - 1.00
6 Wastewater treatment 0.30 - 0.50
7 Damages associated with discharge of treated wastewater 0.05 - 0.20
Total 2.00 - 3.00
C.2 Urban Drainage
In Urban drainage there are many scenarios of investments because the decision along the time and the situation of each city. When the city still did not developed a Plan of BMPs (best management practices) the drainage (mainly in developing countries is developed increasing the flow to downstream and developing floods scenarios in the constrictions sections of the network. Table C.3 shows the network cost, which is US$ 105,072/ha. In order to develop flood control for the basin the cost would be about US $ 20,580/ha. The total cost of this scenario is US$ 125,652. But If the development was done using the basic BMPs the cost would be 47,900, representing 38% of the unsustainable cost. This cost may vary from a region to another based on land, labor and material costs.
Cruz (2004) using some detentions designs and basin characteristics obtained for Porto Alegre, Brazil the following equation
CT = 0,35 p – 3,4.A
Cost in millions of US$; pop is the population in thousand of persons and A is the basin Area in km2.

158
In developing countries the scenario of investments is a basin of frequent floods needing a flood management control. In that way, some estimative of costs are presented in table C.4, taking into account a few projects in Latin America.
Table c.3 Unit costs developed for Porto Alegre Assessment (Cruz and Tucci,2008).
Type Unit cost
US$/ha
Stormwater cost using Best management practices1
Stormwater network1
Diameter =40cm and 30% or rocks
Assuming 187 m/ha
38,400
Detention pond (assuming 200 m3/ha and 30% of rocks) 9,500
Total 47,900
Stormwater cost using future flood control3 105,072
Detention pond 20,580
Total 125,652
1 – Developed the drainage together with storage; 2 based on assumption of mean diameter and 30% of rocks; 2 - Development of the networks and after some floods the flood control measures is developed.
Table C.4 Estimated range for unit cost of urban basin based on the type of combined solution for flood control measures in stormwater1.
Type of flood measures Unit cost range
US$ 1,000 /ha
Only by channel and conduits 60 - 100
Underground detention, channels and conduits 30 - 50
Open detention , channels and conduits 10 – 25
Only open detention 8 – 12
1 This is not the cost for implementing the stormwater but for control its existing impacts

159
ANNEX D: WATER QUALITY PARAMETERS
The source of information in this annex is from Chapman (1996). The first table presents the recommended water parameters to be monitored and assessed based on the water use and second table presents the same group of parameters based on the source of contaminations. The third table presents the recommend interval of values of the parameters adopted from some countries. This information may change in each country based on its own environmental legislation.
Table D.1 Water quality variable which for assessment in relation to non-industrial water use (Chapman, 1996). Variable Agriculture
Background monitoring
Aquatic Life and Fisheries
Drinking water
sources
Recreation and health
Irrigation Livestock watering
General Temperature xxx xxx x Colour xx xx xx Odour xx xx Suspended solids xxx xxx xxx xxx Turbidity x xx xx xx Conductivity xx x x x Total dissolved solids x x xxx x pH xxx xx x x xx Dissolved oxygen xxx xxx x X Hardness x xx Chlorophyll a x xx xx xx Nutrients Ammonia x xxx x Nitrate/nitrite xx x xxx xx Phosphorus or phosphate
xx
Organic Matter TOC xx x x COD xx xx BOD xxx xxx xx Major ions Sodium x x xxx Potassium x Calcium x x x Magnesium xx x Chloride xx x xxx Sulphate x x x Other inorganic Fluoride xx x x Boron xx x Cyanide x x Trace Elements Heavy metals xx xxx x X Arsenic & selenium xx xx x X

160
Table D.1 (continued) Variable Agriculture
Background monitoring
Aquatic Life and
Fisheries
Drinking water
sources
Recreation and health
Irrigation Livestock watering
Organic Contaminants
Oil and hydrocarbons
x xx xx x x
Organic Solvents x xxx2 Phenols x xx Pesticides xx xx Surfactants xx x x x Microbiological indicators
Fecal Coliform xxx xxx xxx Total coliform xxx xxx x xx Pathogens xxx xxx x x - xxx : Low to high likehood that the concentration of the variable will be affected and the more important it is include the variable in a monitoring programme. Variables stipulated in local guidelines or standards for a specific water use should be included when monitoring for that specific use.
The selection of variables should only include those most appropriate to local conditions and it may be necessary to include other variables not indicated under the headings.
1 – background monitoring: is necessary to assess the suitability of water use and to detect future human impacts 2 – Extremely important for groundwater. TOC Total Organic carbon BOD Biochemical oxygen Demand COD Chemical oxygen Demand

161
Table D.2 Water Quality Variable for assessment in relation to non-industrial source of pollution (Chapman, 1996). Waste to
land Disposal
Variable Sewage and
municipal wastewater1
Stormwater Agricultural activities
Solid municipal
Hazardous chemicals
Long Range Atmospheric
Transport
General Temperature x x x Colour x x x x Odour x x x xx Residues x x xxx xxx xx Suspended solids xxx xx xxx xx xx Conductivity xx xx xx xxx xxx Xxx Alkalinity xx Xxx pH x x x xx xxx Xxx Eh x x x Dissolved oxygen xxx xxx xxx xxx xxx Hardness x x x x X Nutrients Ammonia xxx xx xxx xx Nitrate/nitrite xxx xx xxx xx Xx Organic Nitrogen xxx xx xxx xx Phosphorus compounds
xxx xx xxx x X
Organic Matter TOC x x x COD xx xx x xxx xxx BOD xxx xx xxx xxx xx Major ions Sodium xx xx xx xxx Potassium x x x Calcium x x x x X Magnesium x x x Carbonate Components
x
Chloride xxx xx xxx xx xx Sulphate x x x Xxx Other inorganic Sulphide xx xx x x Silica x x Fluoride x x Boron x Trace Elements Aluminium xx Cadium x xxx xxx x Chromium x xxx xx x Copper x x xx2 xxx xx x Iron xx xx xxx xx x Lead xx xxx xxx xx xx Mercury x x xxx2 xxx xxx Zinc x xx2 xxx xx x Arsenic x xxx2 xx xxx x Selenium x xxx2 x x

162
Table D.2 (continued) Waste to
land Disposal
Variable Sewage and
municipal wastewater1
Stormwater Agricultural activities
Solid municipal
Hazardous chemicals
Long Range Atmospheric
Transport
Organic Contaminants
Fats x x Oil and hydrocarbons
xx xxx xx x
Organic Solvents x x xxx xxx Methane xxx3 Phenols x xx xx Pesticides x xxx4 xx xxx xxx Surfactants xx x x Microbiological Indicators
Faecol Coliforms xxx xx xx xxx Other Pathogens xxx xx xxx
x - xxx : Low to high likehood that the concentration of the variable will be affected and the more important it is include the variable in a monitoring programme. The final selection of variables is also dependent on the nature of the water body 1 – Assumes negligible industrial inputs to the waste water 2 - Needs only be measured when used locally or occur naturally at high concentrations 3 – Important only for groundwater in localized industrial areas 4 – Specific Compounds should be measured according to their level of use in the region.

163
Table D.3 Maximum allowable concentrations of selected water quality variables for different uses (Chapman, 1996) Variable Drinking
water Fisheries and aquatic life
WHO EU Canada USA Russia EU Canada Russia Colour (TCU) 15 20 mg/LPt-
Co 15 15 20
Total dissolved solids (mg/L) 1,000 500 500 1,000 Total Suspend Solids (mg/L) 25 Inc. od 10 or
10%
Turbidity (NTU) 5 4JTU 5 0.5-1.0 pH <8.04 6.5-8.51 6.5-8.5 6.5-8.5 6.0 – 9.0 6.0 – 9.0 6.5 – 9.0 Dissolved Oxygen (mg/L) 4.0 5.0 -9.0 5.0 -9.5 4.05 – 6.0 Ammoniacal Nitrogen (mg/L) 2.0 0.04-1.0 0.5 Ammonium (mg/L) 0.5 2.0 0.05 Nitrate as N (mg/L) 50 10.0 10.0 Nitrate (mg/L) 50 50 45 40 Nitrite as N (mg/L) 1.0 1.0 Nitrite (mg/L) 3(P) 0.1 3.0 3.0-6.0 3 Phosphorus (mg/L) 5.0 BOD (mg/L) Sodium (mg/L) 200 150 120 Chloride (mg/L) 250 251 250 250 350 300 Chlorine (mgL) 5 0.002 Sulphate (mg/L) 250 250 500 250 500 100 Sulphide (mg/L) 0.05 Fluoride (mg/L) 1.5 1.5 1.5 2.0 <1.5 0.75 Boron (mg/L) 0.3 1.01 5.0 0.3 Cyanide (mg/L) 0,07 0.05 0.2 0.2(PP) 0.07 0.005 0.05 Trace Elements Aluminium (mg/L) 0.2 0.2 0.5 0.005-0.17 Arsenic (mg/L) 0.01(P) 0.05 0.05 0.05 Barium (mg/L) 0.7 0.11 1.0 2.0 0.7 Cadmium (mg/L) 0.003 0.005 0.005 0.005 0.003 0.0002-0.00188 0.005

164
Table D.3 (continued) Variable Drinking
water Fisheries
and aquatic life
WHO EU Canada USA Russia EU Canada Russia Chromium (mg/L) 0.05(P) 0.05 0.05 0.1 0.05 0.02-0.002 0.02-
0.005 Cobalt (mg/L) 0.1 0.1 Copper (mg/L) 2(P) 0.11-3.01 1.0 1 2.0 0.005-
0.1128,9 0.002-0.0048 0.001
Iron (mg/L) 0.3 0.2 0.3 0.3 0.3 0.3 0.1 Lead (mg/L) 0.01 0.05 0.05 0.015 0.01 0.001-0.0078 0.1 Manganese (mg/L) 0.5 (P) 0.05 0.05 0.05 0.5 0.01 Mercury (mg/L) .001 0.001 0.001 0.002 0.001 0.0001 0.00001 Nickel (mg/L) 0.02 0.02 0.05 0.02 0.025-0.158 0.01 Selenium (mg/L) 0.01 0.01 0.01 0.05 0.01 0.001 0.0016 Zinc (mg/L) 3 0.11-5.01 5.0 5 5.0 0.03-2.08,10 0.03 0.01 Organic Contaminants11 Oil and Petroleum products (mg/L) 0.01 0.1 `0.05 Total pesticides (µg/L) 0.5 100 Aldrin & Deldrin (µg/L) 0.03 0.7 4 ng/L dieldrin DDT (µg/L) 2 30.0 2./0 1ng/L Lindane (µg/L) 2 4.0 0.2 2.0 Methoxychlor (µg/L) 20 100 40 Benzene (µg/L) 10 5 300 Pentachlorophenol (µg/L) 9(P) 10 10 Phenol (µg/L) 0.5 2 1.0 1.0 1.0 Detergents (µg/L) 0.2 0.512 0.5 0.1 Microbiological variables Faecal coliforms (E coli) No. Per 100 ml)
0 0 0 0
Total coliforms (No. Per 100 ml) 0 1013 1 0.3

165
WHO World Health Organization 3 - i.e. above background concentrations of ≤ 100.mg/L or > 100 mg/L, respectively EU European Union 4 - for effective disinfection with chlorine TOC Total Organic carbon 5 – lower level acceptable under ice cover BOD Biochemical oxygen Demand 6 – total ammonia COD Chemical oxygen Demand 7 – Depending on Ph NTU – nephelometric turbidity units 8 – Depending on the hardness (P) – provisional value 9 – Dissolved only (PP) - provisional value 10 – Total zinc 11 – For some groups values are also set for individual cpmpounds 1 Guideline value 12 – Foaming agents 2 Some values not yet adopted but already applied 13 – For a single sample