Integrated Systems The Value of Integrated Software and ... · PDF fileThe Value of Integrated...
47
Integrated Systems The Value of Integrated Software and Hardware Steve Mills Senior Vice President and Group Executive, Software and Systems
Transcript of Integrated Systems The Value of Integrated Software and ... · PDF fileThe Value of Integrated...
Integrated SystemsThe Value of Integrated Software and Hardware
Steve MillsSenior Vice President and Group Executive, Software and Systems
© 2011 International Business Machines Corporation
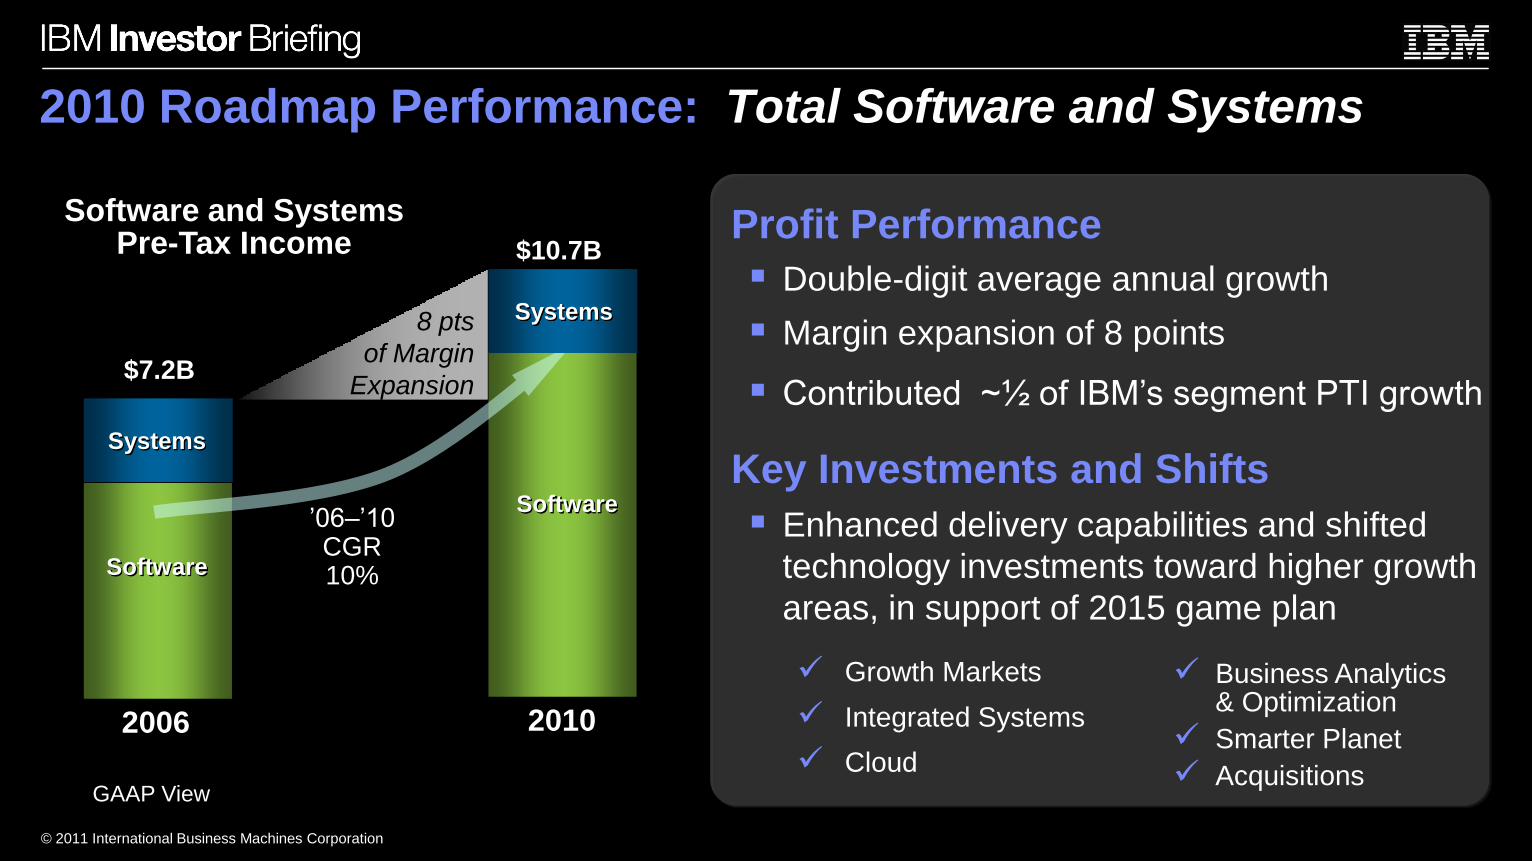
2010 Roadmap Performance: Total Software and Systems
2006 2010
$10.7B
8 pts
of Margin
Expansion
Software
Software and SystemsPre-Tax Income
’06–’10CGR10%
Profit Performance
Double-digit average annual growth
Margin expansion of 8 points
Contributed ~½ of IBM’s segment PTI growth
Key Investments and Shifts
Enhanced delivery capabilities and shifted
technology investments toward higher growth
areas, in support of 2015 game plan
Growth Markets
Integrated Systems
CloudGAAP View
Business Analytics & Optimization
Smarter Planet
Acquisitions
Systems
Systems
Software
$7.2B
© 2011 International Business Machines Corporation
GAAP View
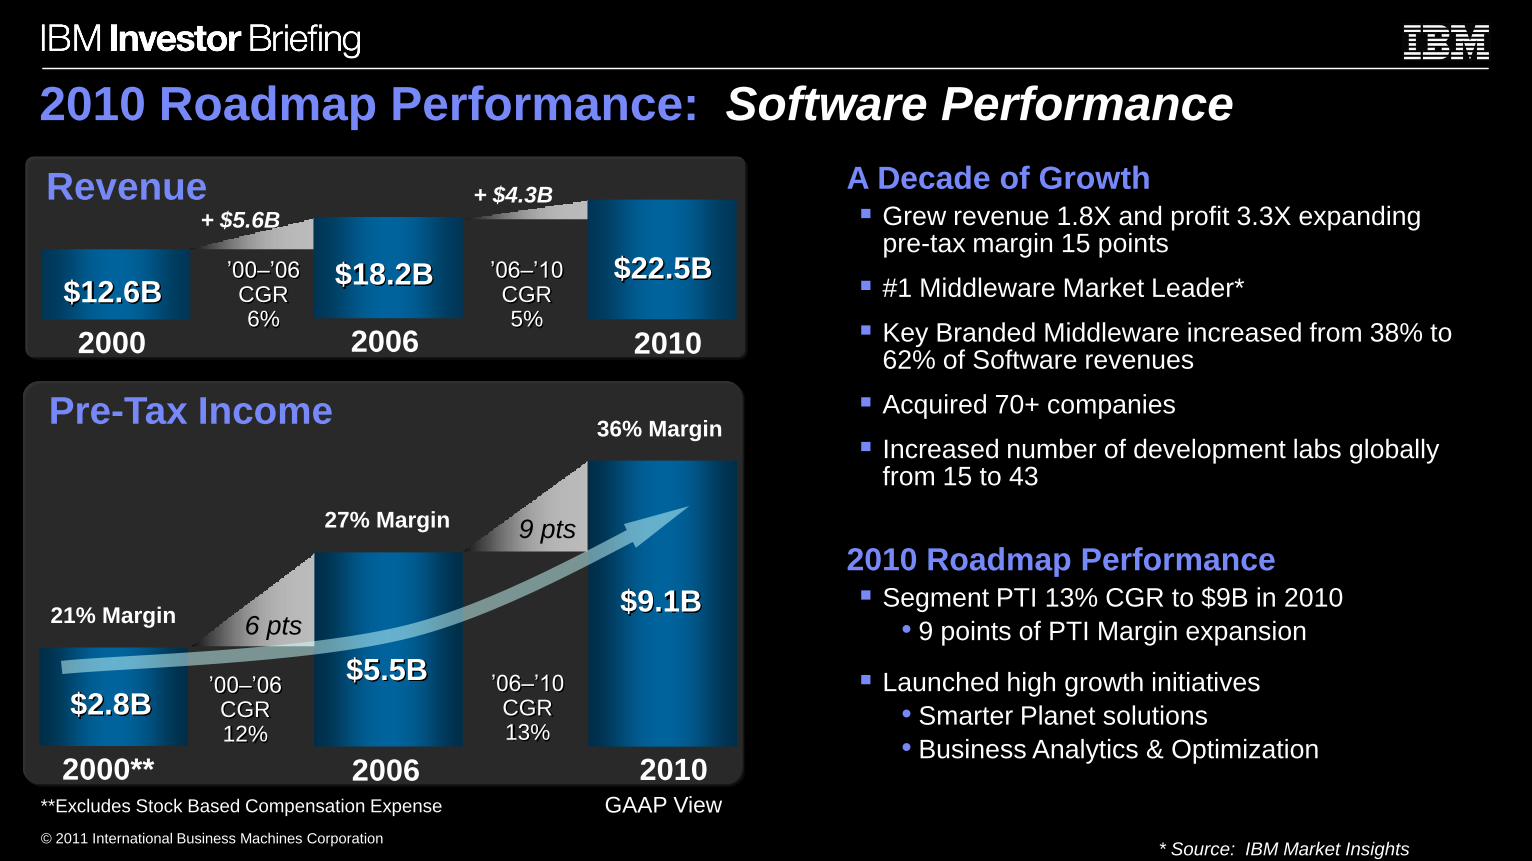
2010 Roadmap Performance: Software Performance
21% Margin
2000**
27% Margin
2006 2010
6 pts
36% Margin
9 pts
$2.8B$5.5B
$9.1B
Pre-Tax Income
2000 2006 2010
+ $5.6B
$12.6B$18.2B
Revenue
$22.5B
+ $4.3B
’06–’10CGR13%
’00–’06CGR6%
* Source: IBM Market Insights
’00–’06CGR12%
’06–’10CGR5%
**Excludes Stock Based Compensation Expense
A Decade of Growth Grew revenue 1.8X and profit 3.3X expanding
pre-tax margin 15 points
#1 Middleware Market Leader*
Key Branded Middleware increased from 38% to 62% of Software revenues
Acquired 70+ companies
Increased number of development labs globally from 15 to 43
2010 Roadmap Performance Segment PTI 13% CGR to $9B in 2010
• 9 points of PTI Margin expansion
Launched high growth initiatives
• Smarter Planet solutions
• Business Analytics & Optimization
© 2011 International Business Machines Corporation
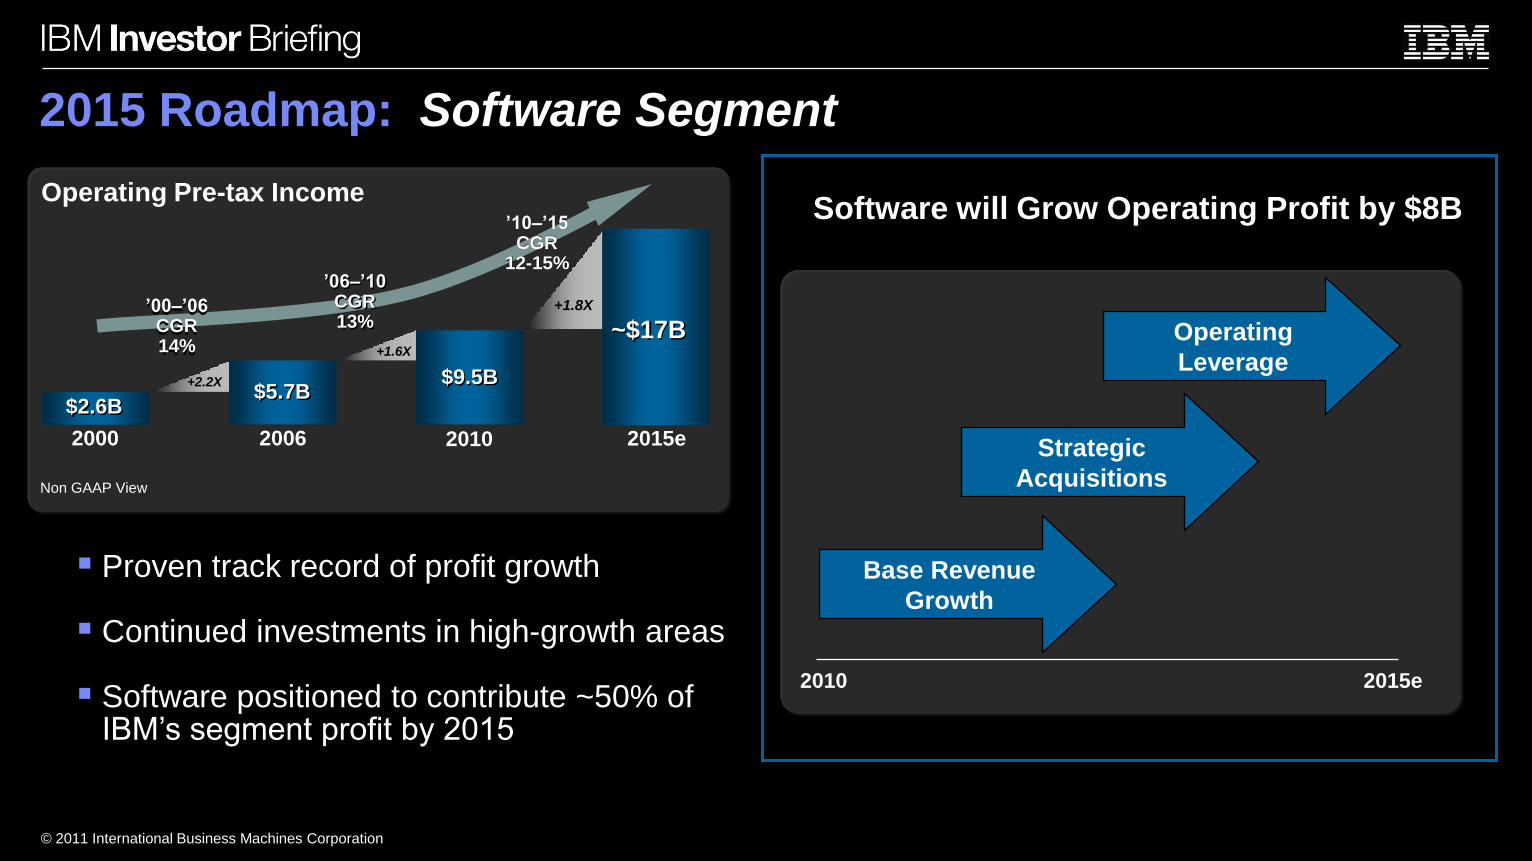
2015 Roadmap: Software Segment
Software will Grow Operating Profit by $8B
+1.4
XStrategic
Acquisitions
Base Revenue
Growth
2015e2010
Operating
Leverage
Proven track record of profit growth
Continued investments in high-growth areas
Software positioned to contribute ~50% of IBM’s segment profit by 2015
2000 2006 2010
$2.6B$5.7B
$9.5B
Operating Pre-tax Income
2015e
~$17B
Non GAAP View
+1.6X
’06–’10CGR13%
’00–’06CGR14%
’10–’15CGR
12-15%
+2.2X
+1.8X
© 2011 International Business Machines Corporation
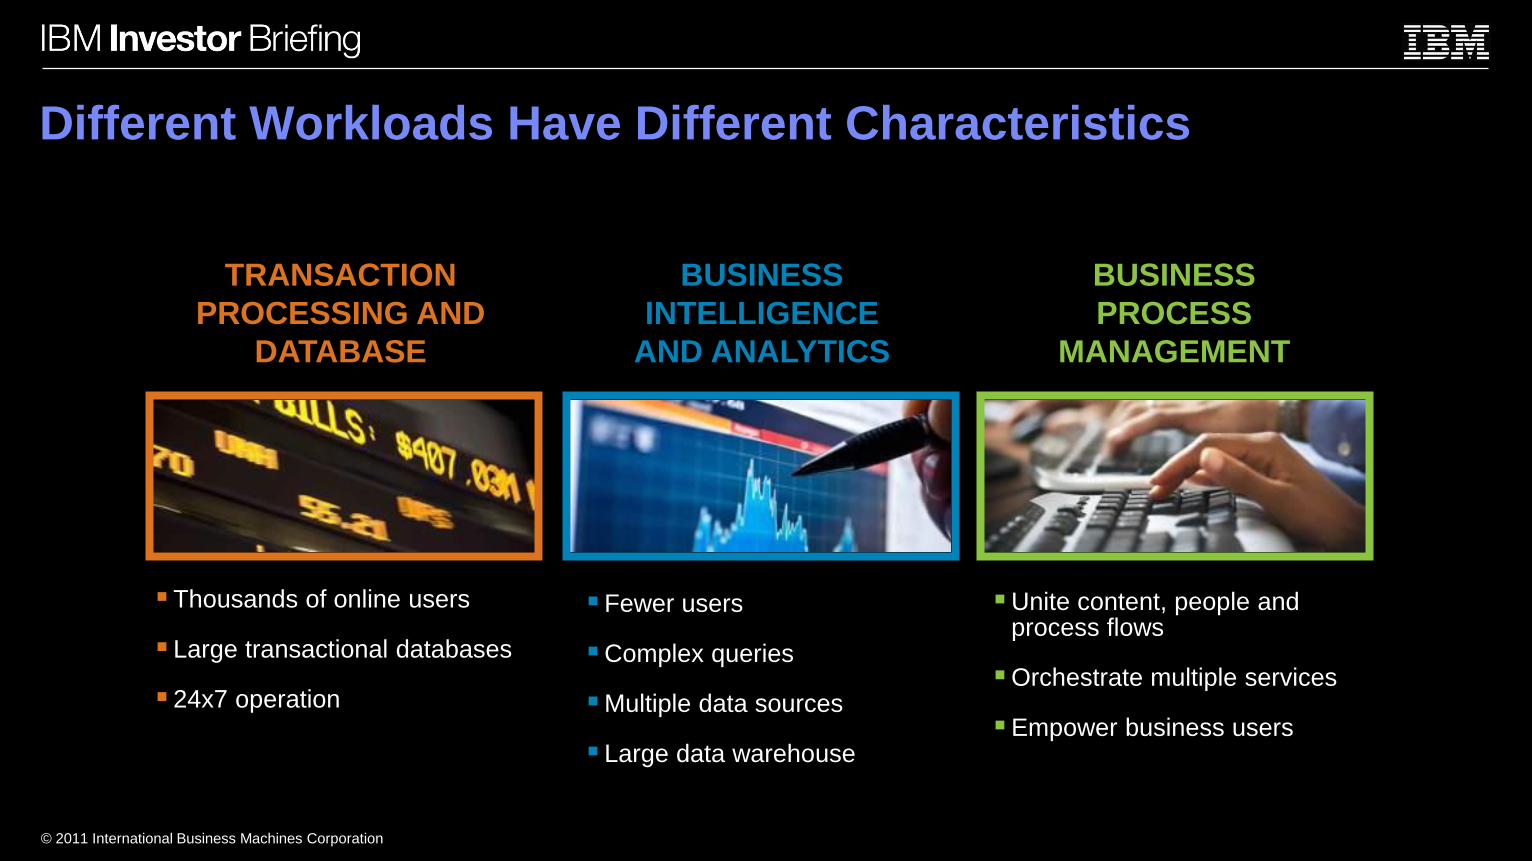
Different Workloads Have Different Characteristics
BUSINESS
INTELLIGENCE
AND ANALYTICS
TRANSACTION
PROCESSING AND
DATABASE
BUSINESS
PROCESS
MANAGEMENT
Fewer users
Complex queries
Multiple data sources
Large data warehouse
Thousands of online users
Large transactional databases
24x7 operation
Unite content, people and process flows
Orchestrate multiple services
Empower business users
© 2011 International Business Machines Corporation
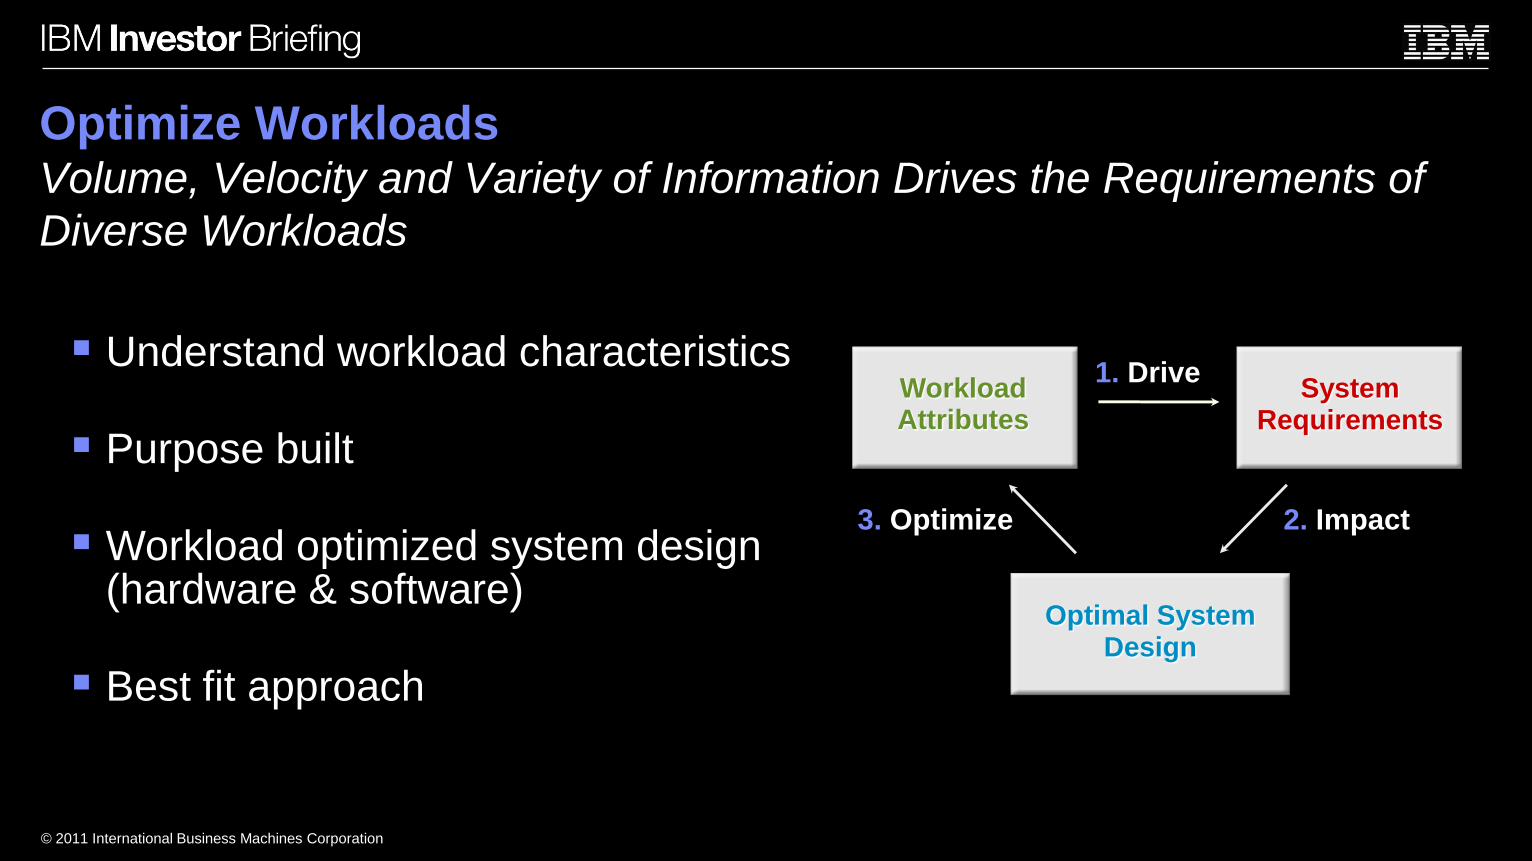
Optimize WorkloadsVolume, Velocity and Variety of Information Drives the Requirements of
Diverse Workloads
Understand workload characteristics
Purpose built
Workload optimized system design (hardware & software)
Best fit approach
WorkloadAttributes
System Requirements
Optimal System Design
1. Drive
2. Impact3. Optimize
© 2011 International Business Machines Corporation
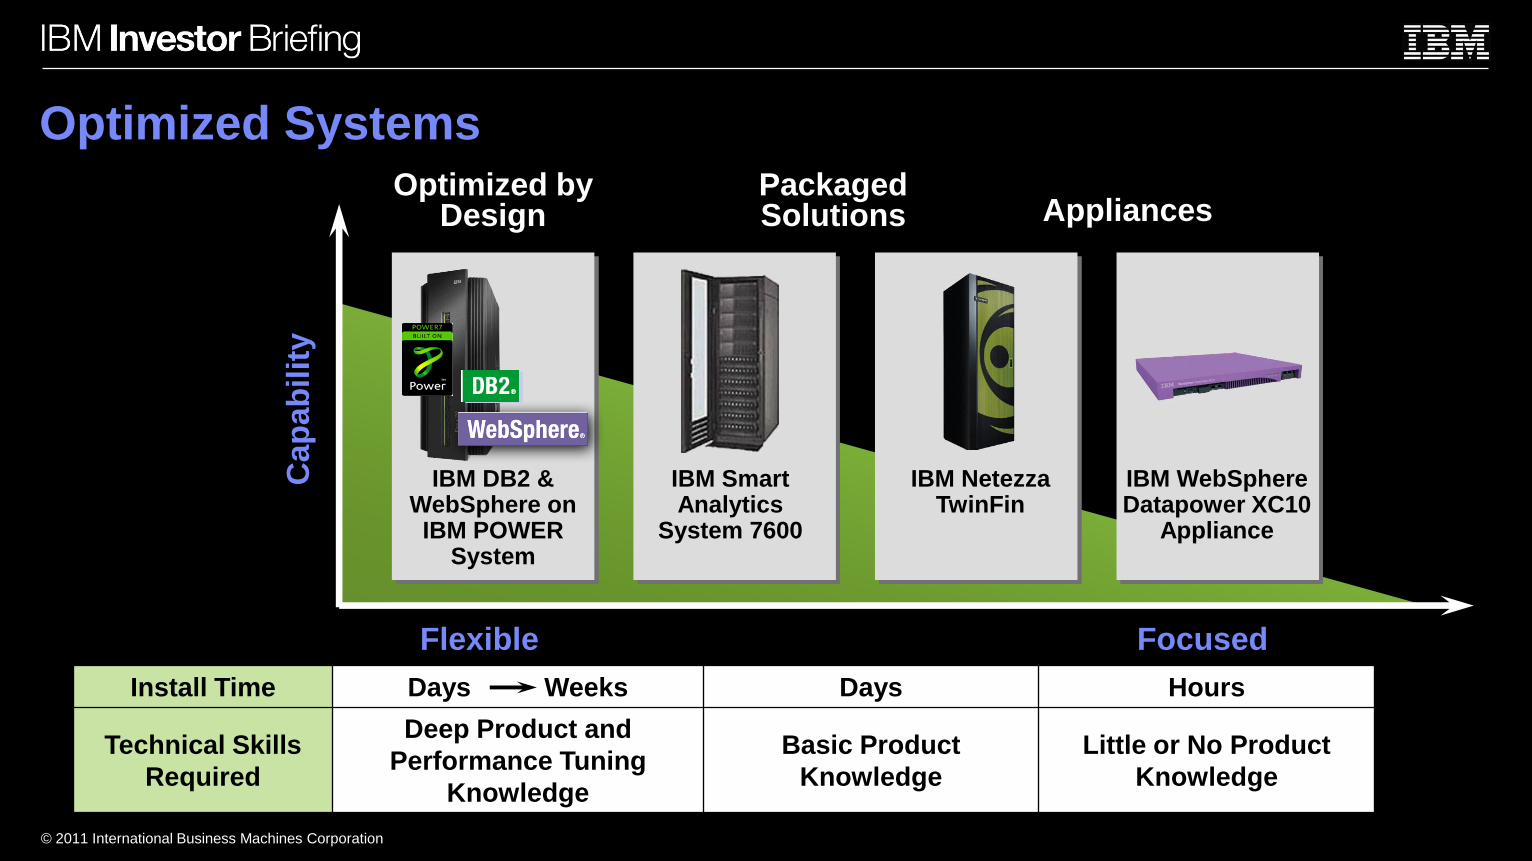
Optimized Systems
Flexible Focused
Optimized by Design
Packaged Solutions Appliances
Cap
ab
ilit
y
IBM WebSphere Datapower XC10
Appliance
IBM Netezza TwinFin
IBM Smart Analytics
System 7600
IBM DB2 & WebSphere on IBM POWER
System
Install Time Days Weeks Days Hours
Technical Skills
Required
Deep Product and
Performance Tuning
Knowledge
Basic Product
Knowledge
Little or No Product
Knowledge
© 2011 International Business Machines Corporation
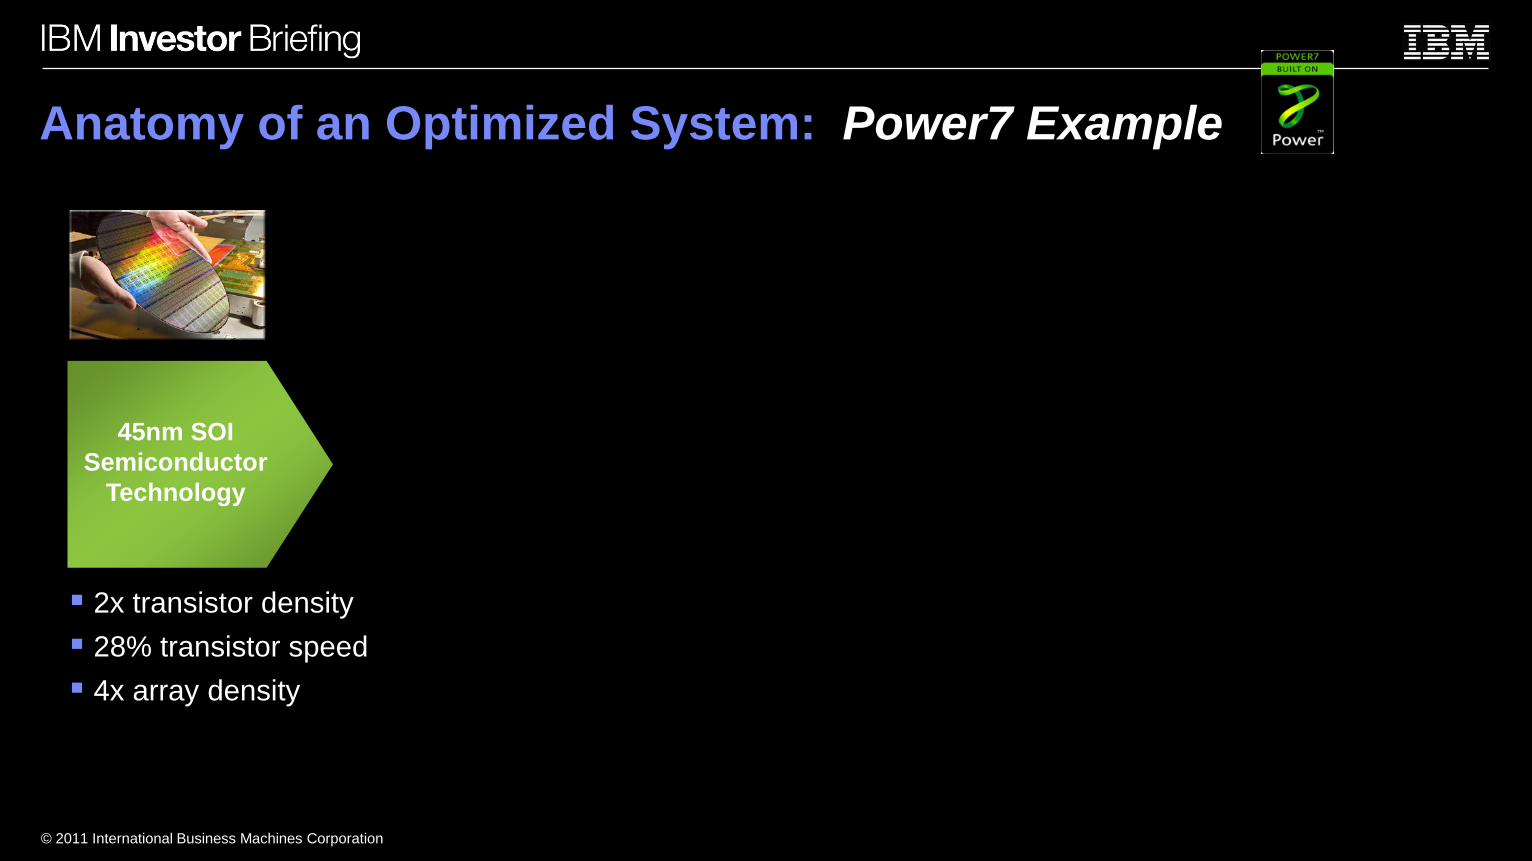
Anatomy of an Optimized System: Power7 Example
2x transistor density
28% transistor speed
4x array density
45nm SOI
Semiconductor
Technology
© 2011 International Business Machines Corporation
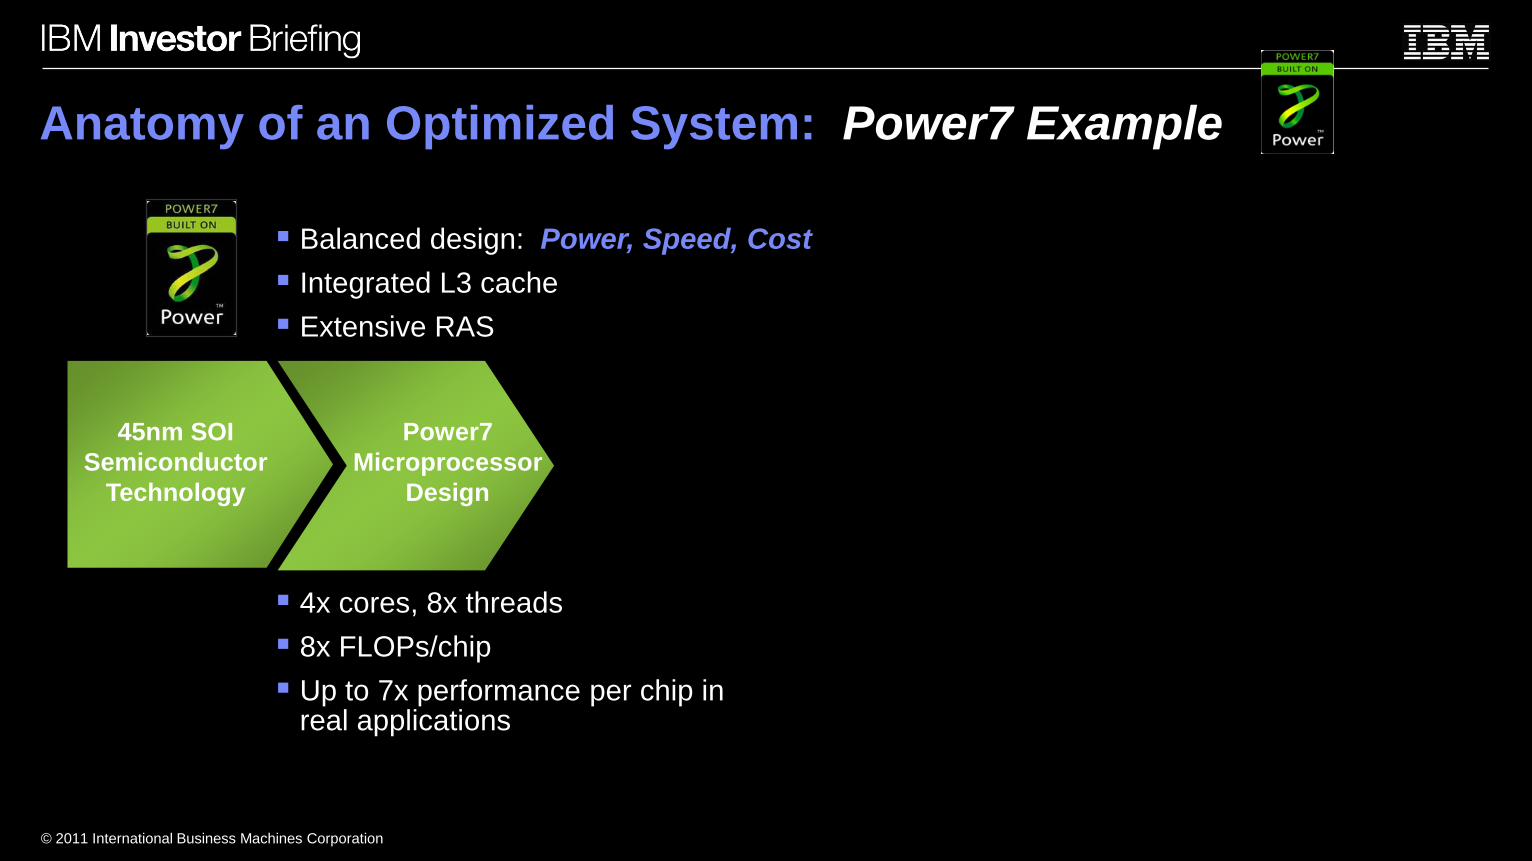
Anatomy of an Optimized System: Power7 Example
Balanced design: Power, Speed, Cost
Integrated L3 cache
Extensive RAS
4x cores, 8x threads
8x FLOPs/chip
Up to 7x performance per chip in real applications
45nm SOI
Semiconductor
Technology
Power7
Microprocessor
Design
© 2011 International Business Machines Corporation
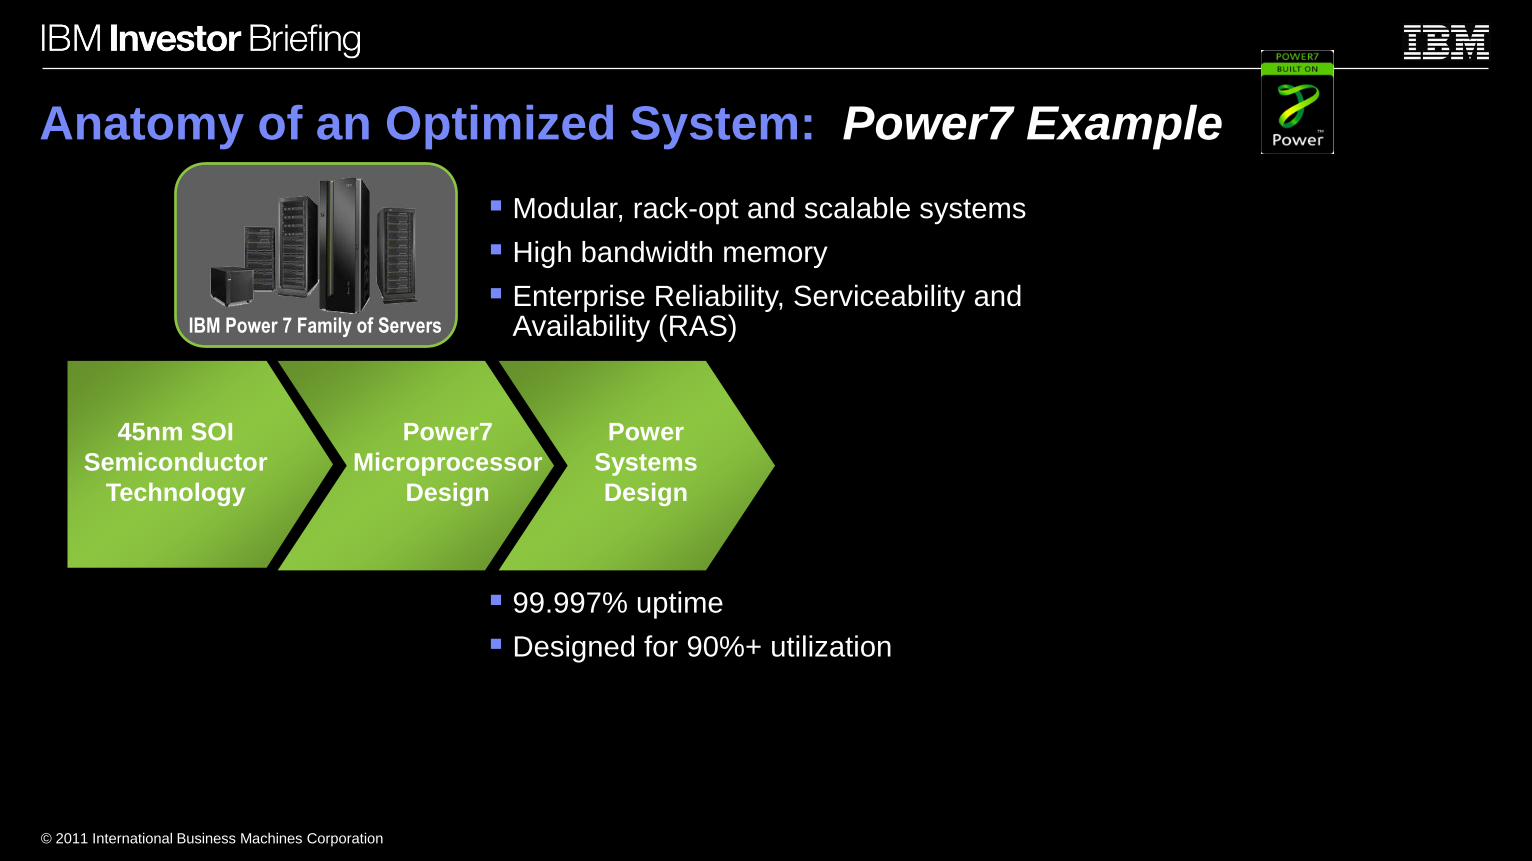
Anatomy of an Optimized System: Power7 Example
99.997% uptime
Designed for 90%+ utilization
45nm SOI
Semiconductor
Technology
Power7
Microprocessor
Design
Power
Systems
Design
Modular, rack-opt and scalable systems
High bandwidth memory
Enterprise Reliability, Serviceability and Availability (RAS)IBM Power 7 Family of Servers
© 2011 International Business Machines Corporation
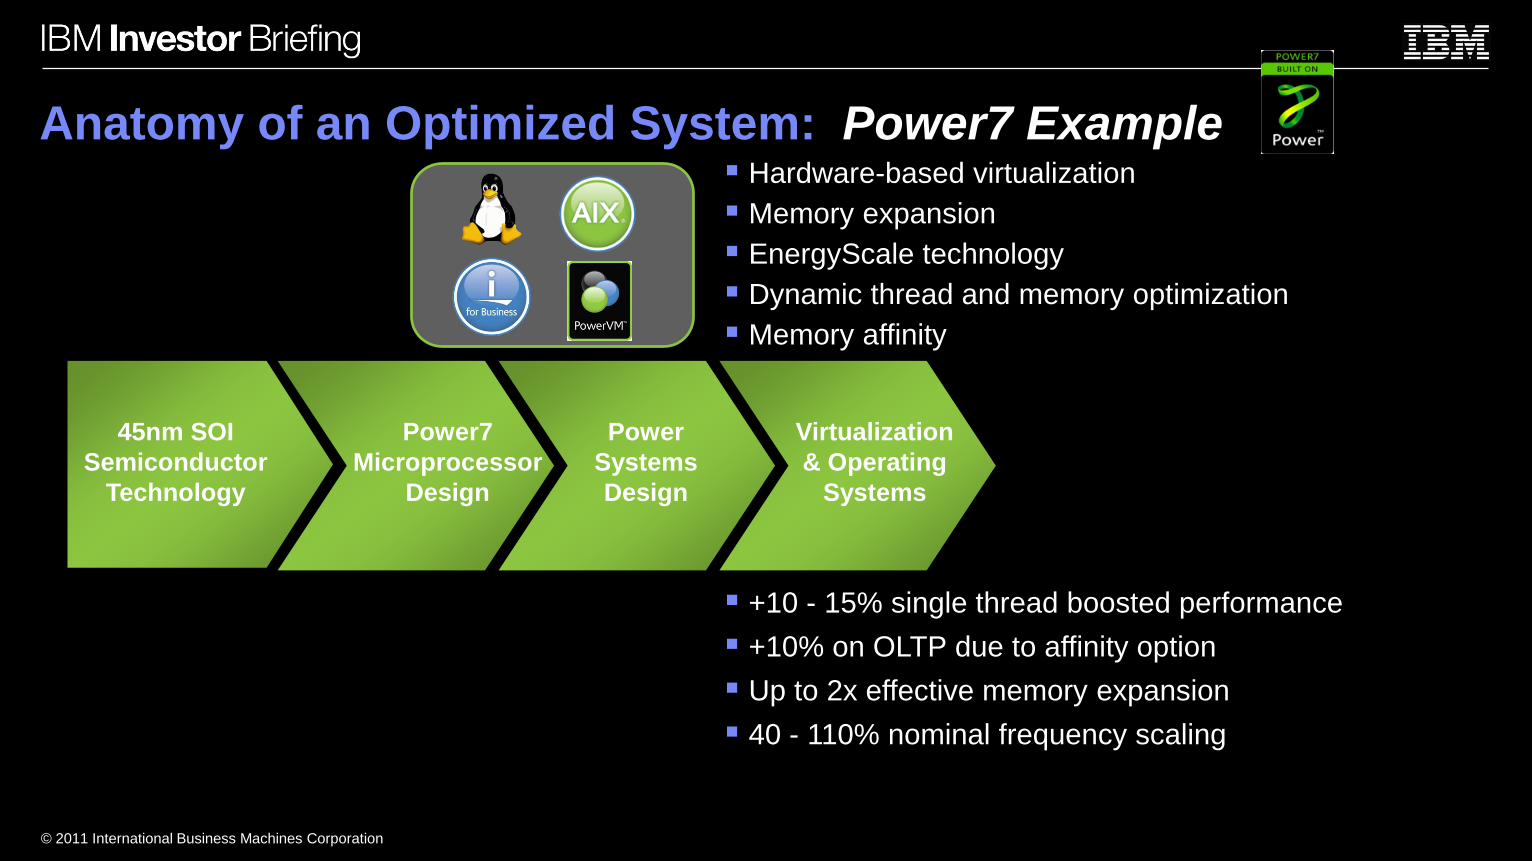
Anatomy of an Optimized System: Power7 Example Hardware-based virtualization
Memory expansion
EnergyScale technology
Dynamic thread and memory optimization
Memory affinity
+10 - 15% single thread boosted performance
+10% on OLTP due to affinity option
Up to 2x effective memory expansion
40 - 110% nominal frequency scaling
45nm SOI
Semiconductor
Technology
Power7
Microprocessor
Design
Power
Systems
Design
Virtualization
& Operating
Systems
© 2011 International Business Machines Corporation
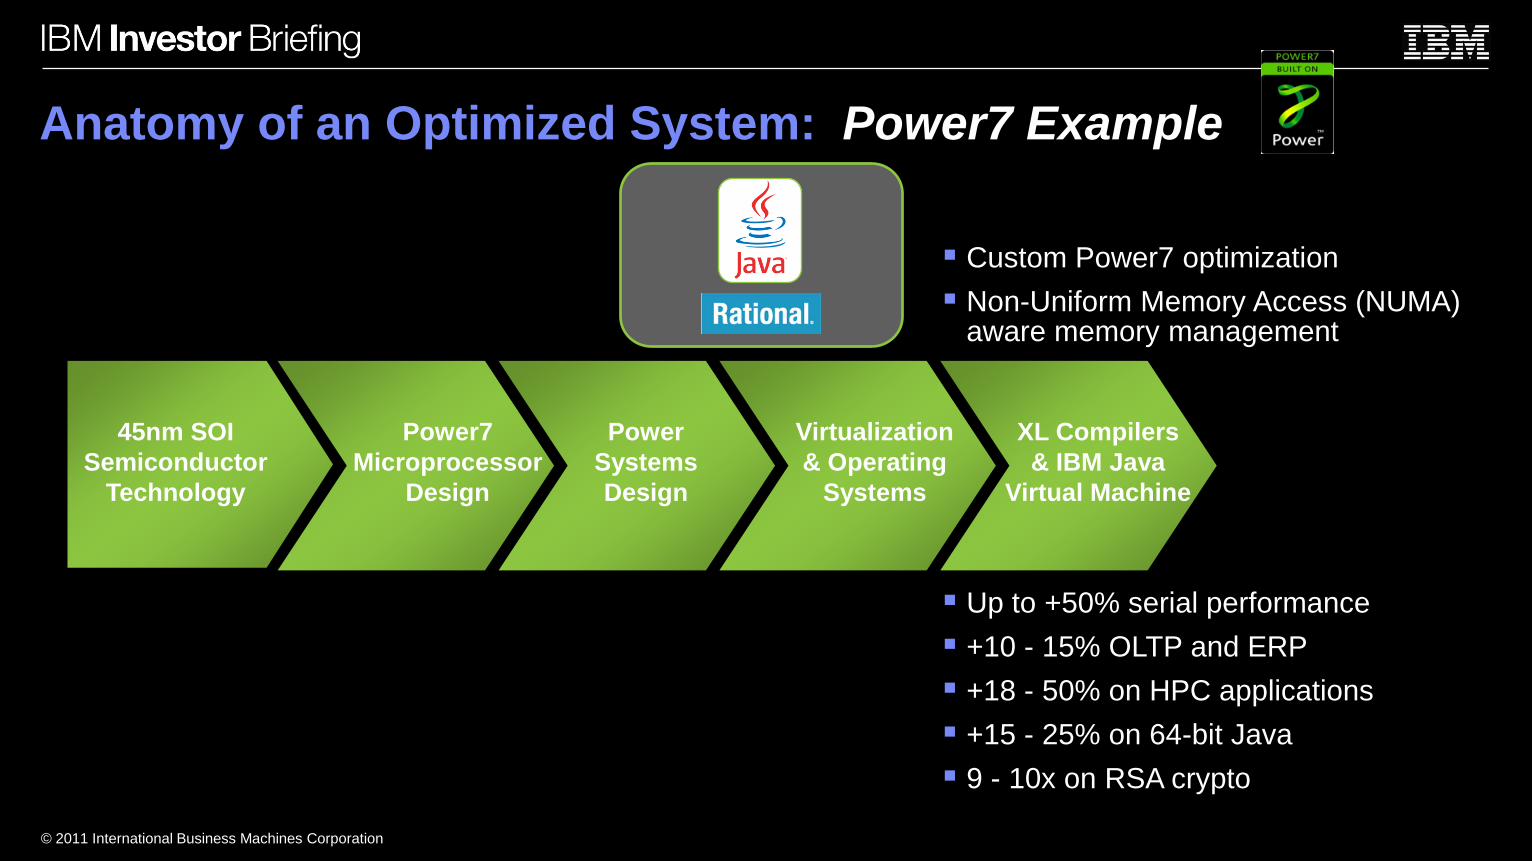
Anatomy of an Optimized System: Power7 Example
Custom Power7 optimization
Non-Uniform Memory Access (NUMA) aware memory management
Up to +50% serial performance
+10 - 15% OLTP and ERP
+18 - 50% on HPC applications
+15 - 25% on 64-bit Java
9 - 10x on RSA crypto
45nm SOI
Semiconductor
Technology
Power7
Microprocessor
Design
Power
Systems
Design
Virtualization
& Operating
Systems
XL Compilers
& IBM Java
Virtual Machine
© 2011 International Business Machines Corporation
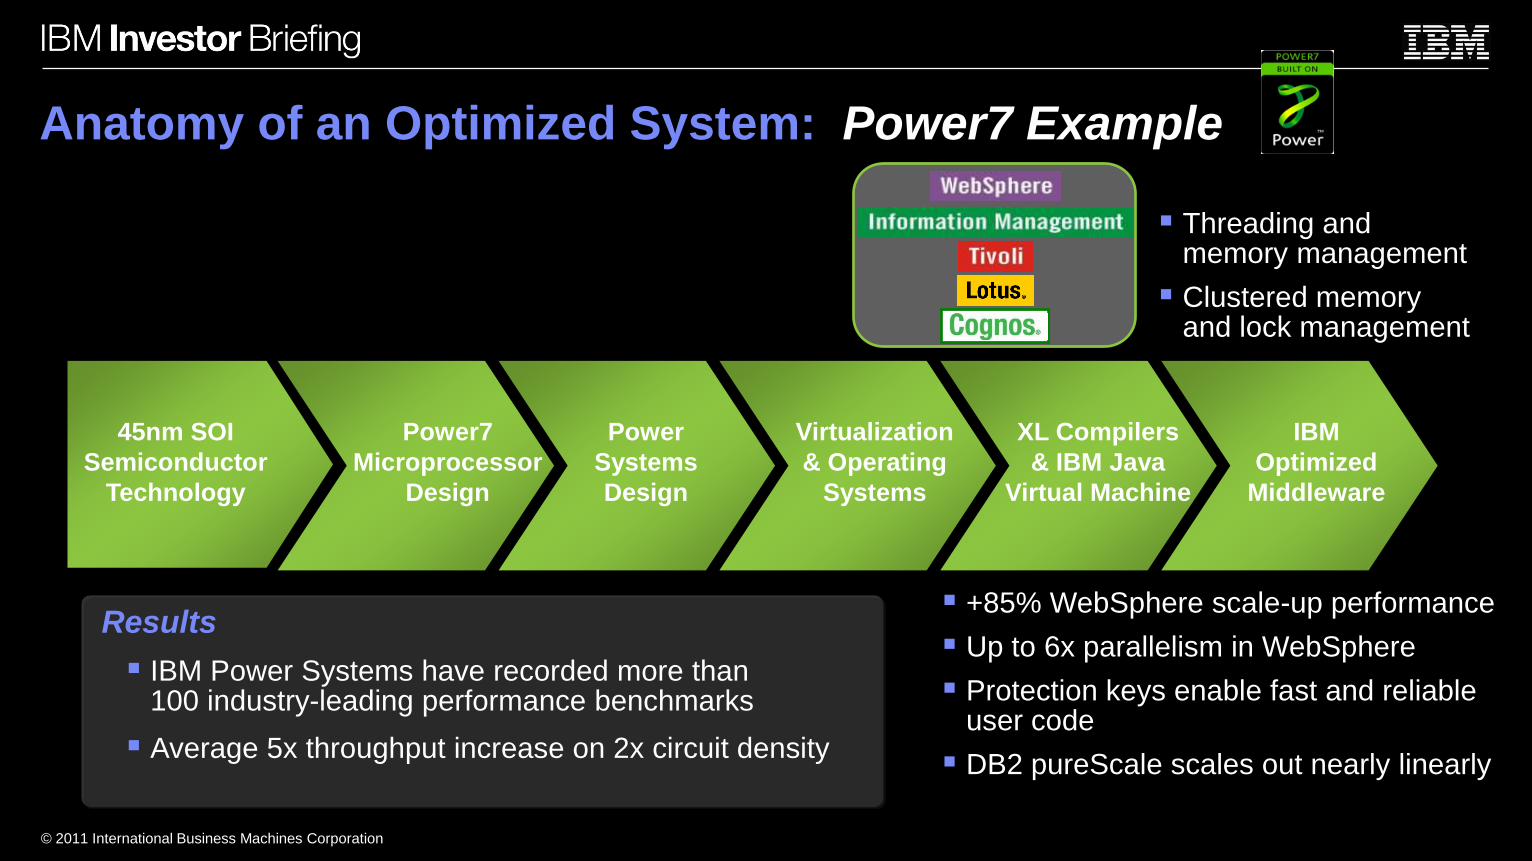
Anatomy of an Optimized System: Power7 Example
45nm SOI
Semiconductor
Technology
Power7
Microprocessor
Design
Power
Systems
Design
Virtualization
& Operating
Systems
XL Compilers
& IBM Java
Virtual Machine
IBM
Optimized
Middleware
Threading and memory management
Clustered memory and lock management
+85% WebSphere scale-up performance
Up to 6x parallelism in WebSphere
Protection keys enable fast and reliable user code
DB2 pureScale scales out nearly linearly
Results
IBM Power Systems have recorded more than 100 industry-leading performance benchmarks
Average 5x throughput increase on 2x circuit density
© 2011 International Business Machines Corporation
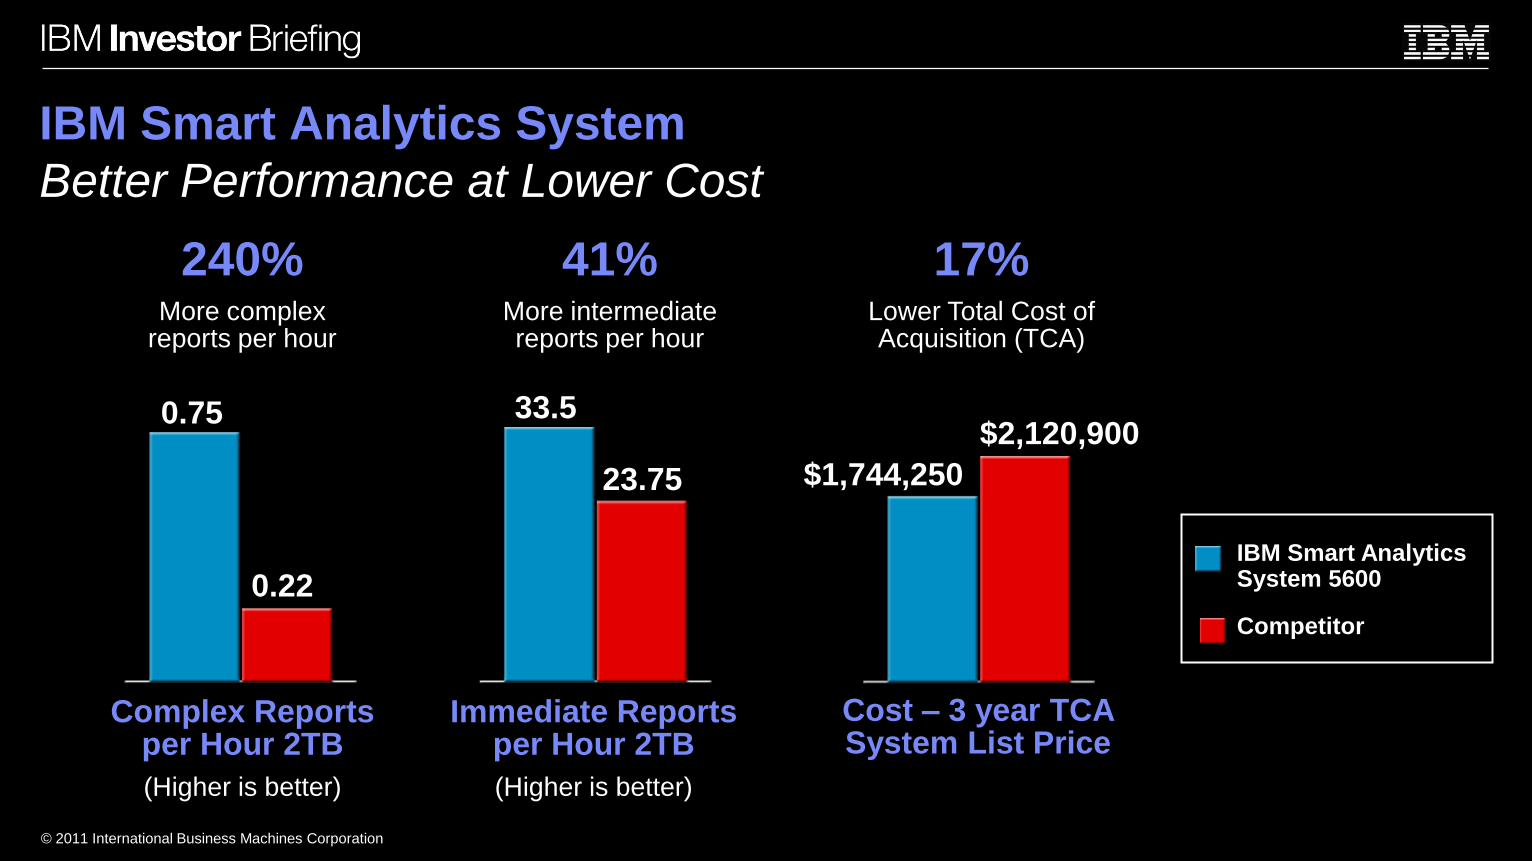
IBM Smart Analytics System
Better Performance at Lower Cost
240%More complex
reports per hour
41%More intermediate reports per hour
17%Lower Total Cost of Acquisition (TCA)
0.75
0.22
33.5
23.75 $1,744,250
$2,120,900
Complex Reports per Hour 2TB
(Higher is better)
Immediate Reports per Hour 2TB
(Higher is better)
Cost – 3 year TCA System List Price
IBM Smart Analytics System 5600
Competitor
© 2011 International Business Machines Corporation
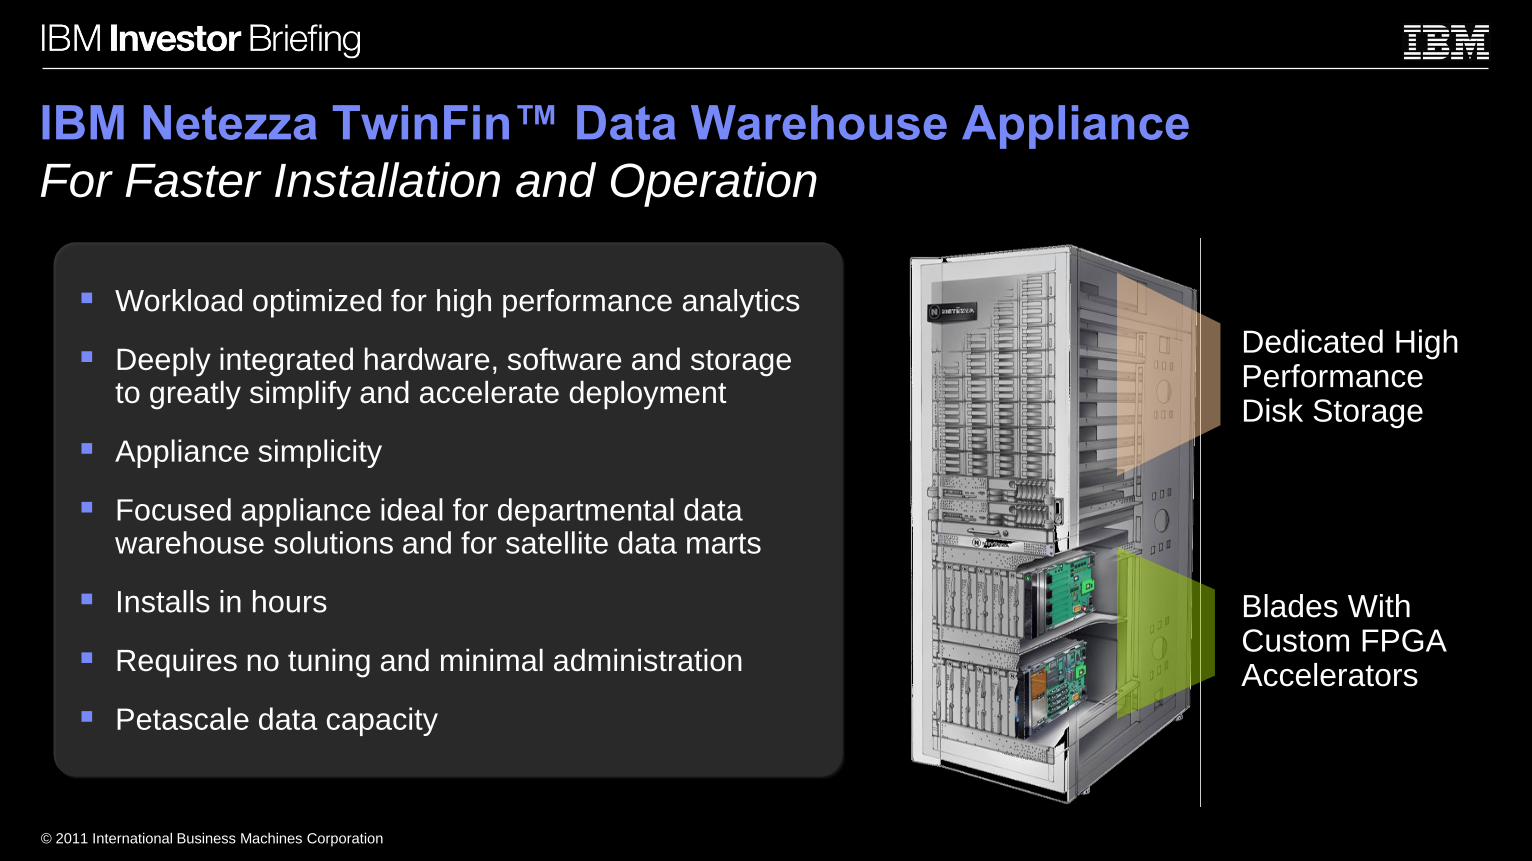
IBM Netezza TwinFin™ Data Warehouse Appliance
For Faster Installation and Operation
Dedicated HighPerformanceDisk Storage
Blades With Custom FPGAAccelerators
Workload optimized for high performance analytics
Deeply integrated hardware, software and storage to greatly simplify and accelerate deployment
Appliance simplicity
Focused appliance ideal for departmental data warehouse solutions and for satellite data marts
Installs in hours
Requires no tuning and minimal administration
Petascale data capacity
© 2011 International Business Machines Corporation
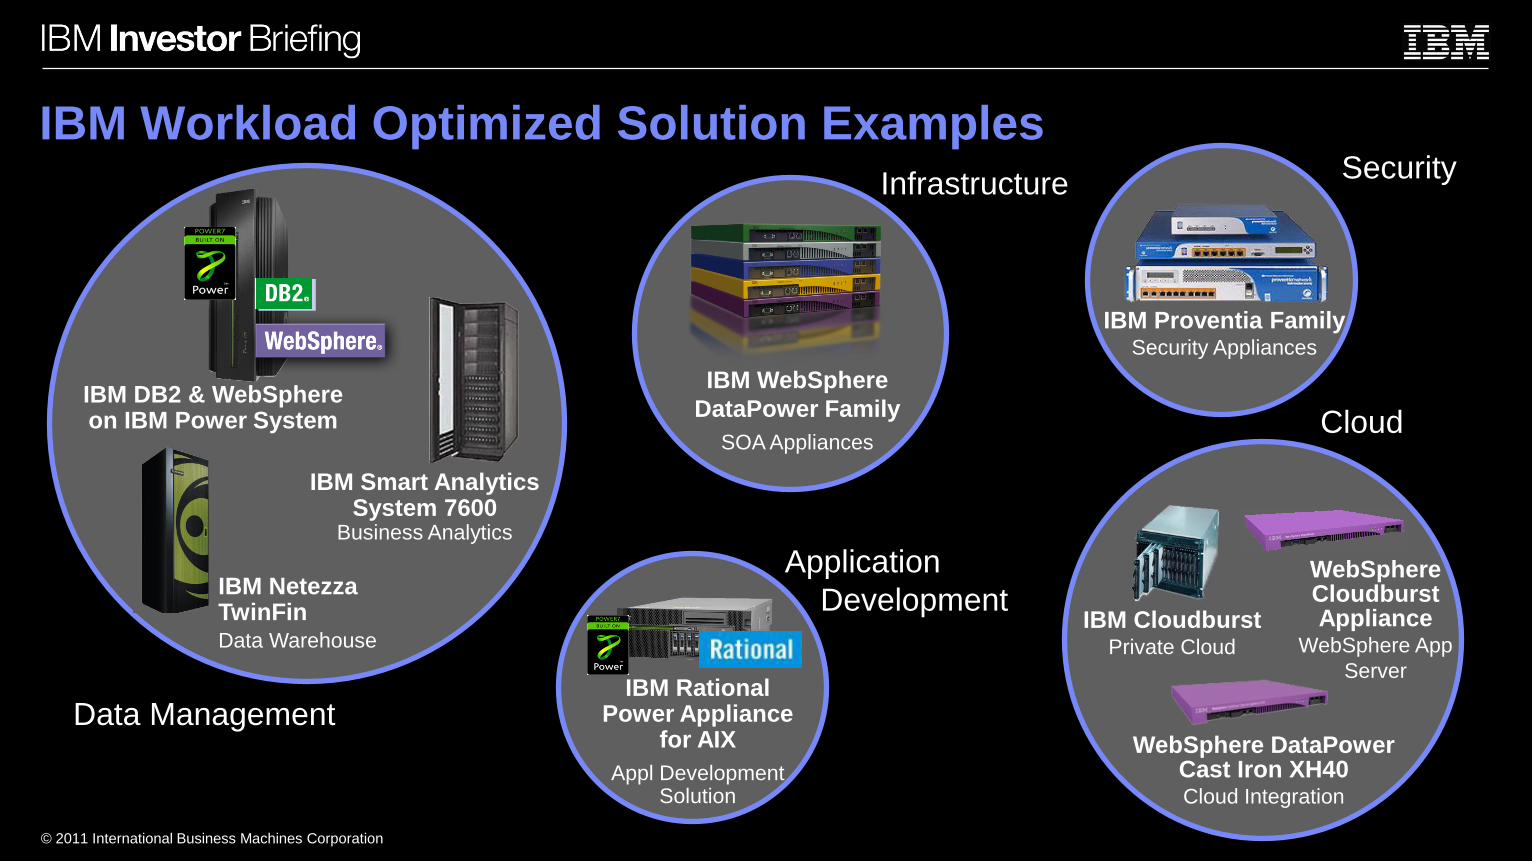
IBM Workload Optimized Solution ExamplesInfrastructure
Data Management
Application
Development
Cloud
Security
IBM CloudburstPrivate Cloud
WebSphere DataPower Cast Iron XH40Cloud Integration
IBM Smart Analytics System 7600
Business Analytics
IBM DB2 & WebSphere on IBM Power System
WebSphere Cloudburst Appliance
WebSphere App
ServerIBM Rational
Power Appliance for AIX
Appl Development Solution
IBM Proventia Family Security Appliances
IBM WebSphere
DataPower Family
SOA Appliances
IBM Netezza TwinFinData Warehouse
© 2011 International Business Machines Corporation
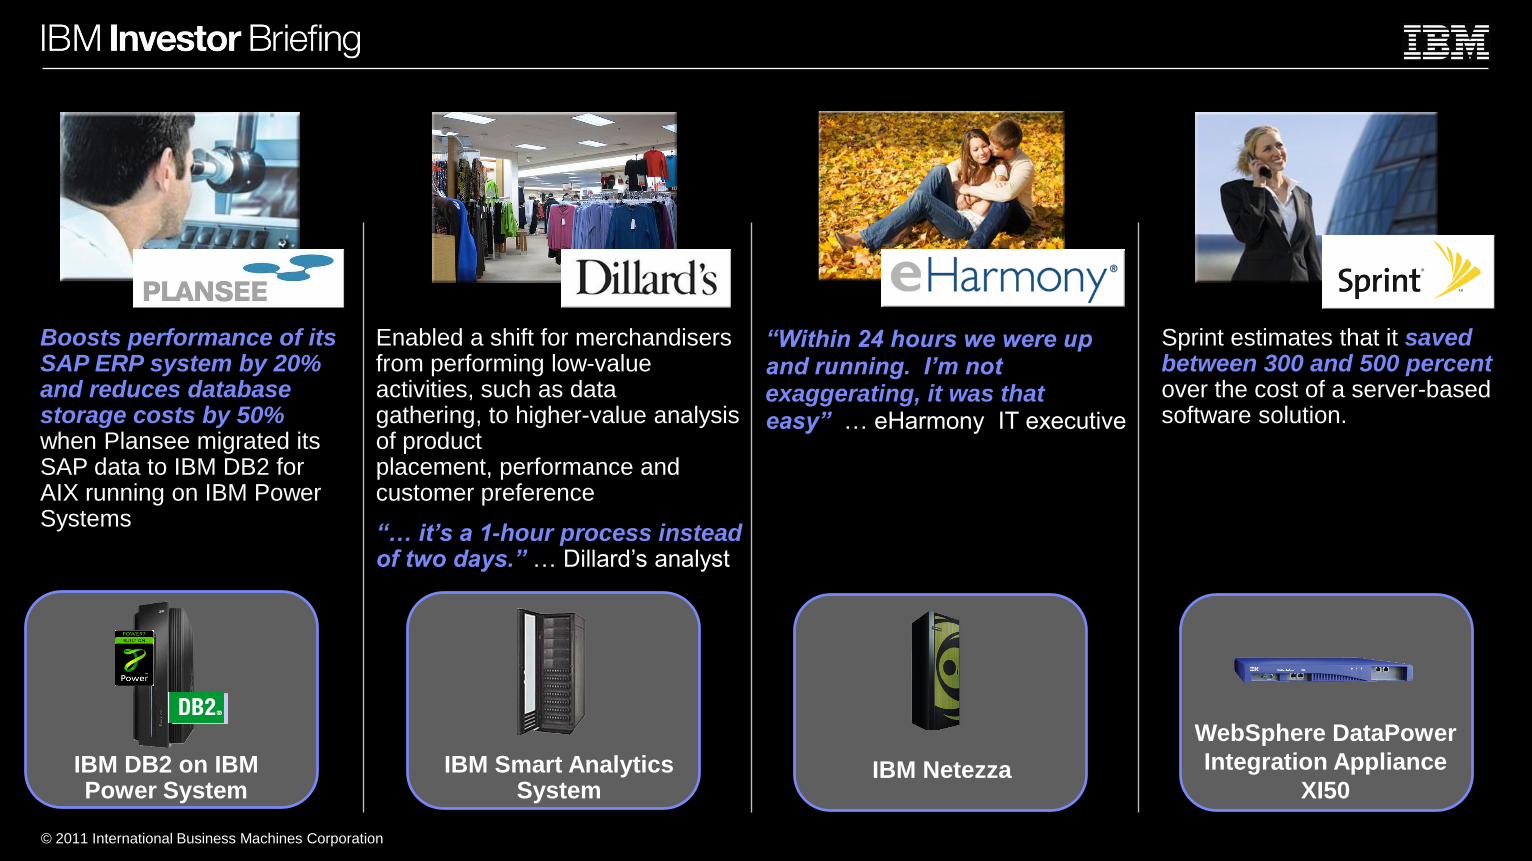
Sprint estimates that it saved between 300 and 500 percentover the cost of a server-based software solution.
WebSphere DataPower
Integration Appliance
XI50
“Within 24 hours we were up and running. I’m not exaggerating, it was that easy” … eHarmony IT executive
IBM Netezza
Boosts performance of its SAP ERP system by 20% and reduces database storage costs by 50%when Plansee migrated its SAP data to IBM DB2 for AIX running on IBM Power Systems
IBM Smart Analytics System
Enabled a shift for merchandisers from performing low-value activities, such as data gathering, to higher-value analysis of product placement, performance and customer preference
“… it’s a 1-hour process instead of two days.” … Dillard’s analyst
IBM DB2 on IBM Power System
© 2011 International Business Machines Corporation
Smarter Computing …
Use of hardware and software technologies
to increase operational efficiencies and
optimize workload performance
while reducing Total Cost of Ownership
Doing More for Less
MiddlewareTransforming Computing
Robert LeBlanc
Senior Vice President, Middleware Software
© 2011 International Business Machines Corporation
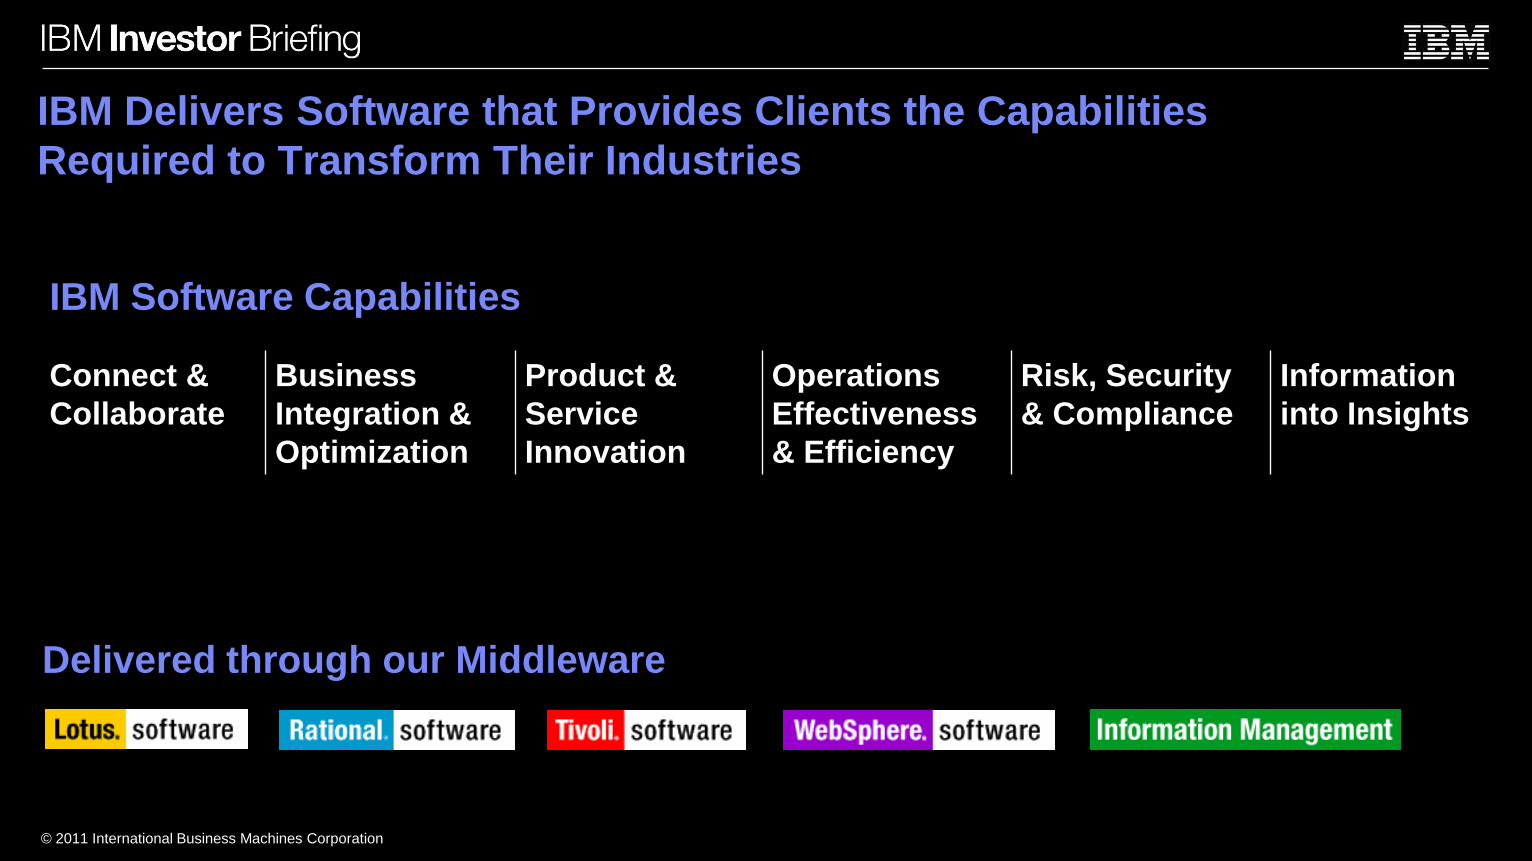
IBM Delivers Software that Provides Clients the Capabilities
Required to Transform Their Industries
IBM Software Capabilities
Connect &
Collaborate
Business
Integration &
Optimization
Product &
Service
Innovation
Operations
Effectiveness
& Efficiency
Risk, Security
& Compliance
Information
into Insights
sDelivered through our Middleware
© 2011 International Business Machines Corporation
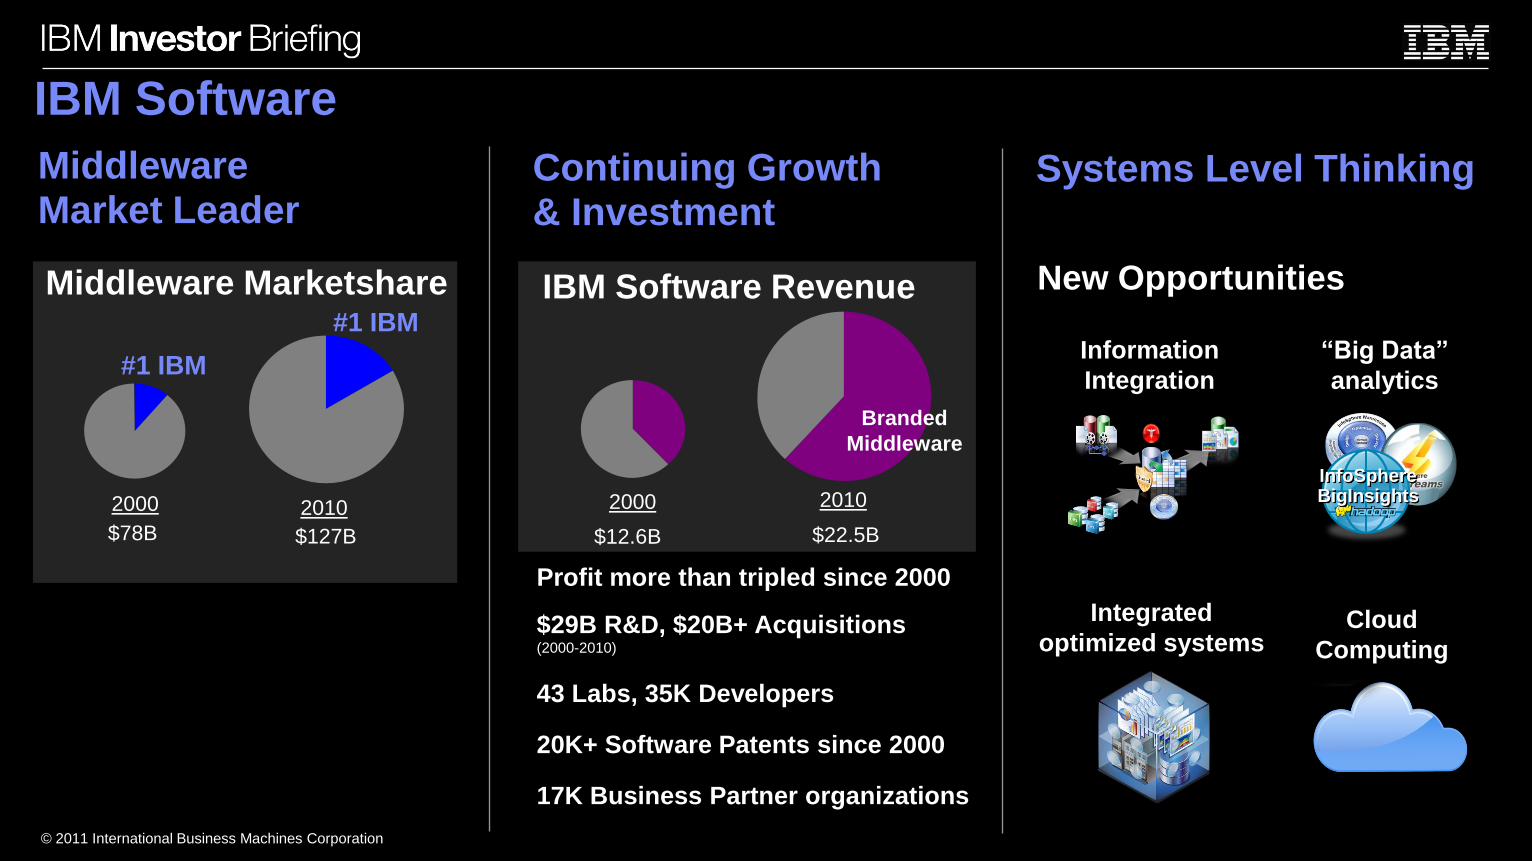
IBM Software
MiddlewareMarket Leader
$78B $127B
#1 IBM
#1 IBM
Profit more than tripled since 2000
$29B R&D, $20B+ Acquisitions(2000-2010)
43 Labs, 35K Developers
20K+ Software Patents since 2000
17K Business Partner organizations
Systems Level Thinking
“Big Data”
analytics
Information
Integration
Cloud
Computing
Integrated
optimized systems
InfoSphereBigInsights
Continuing Growth& Investment
2000 2010
Branded
Middleware
IBM Software Revenue
2000 2010
Middleware Marketshare New Opportunities
$22.5B $12.6B
© 2011 International Business Machines Corporation
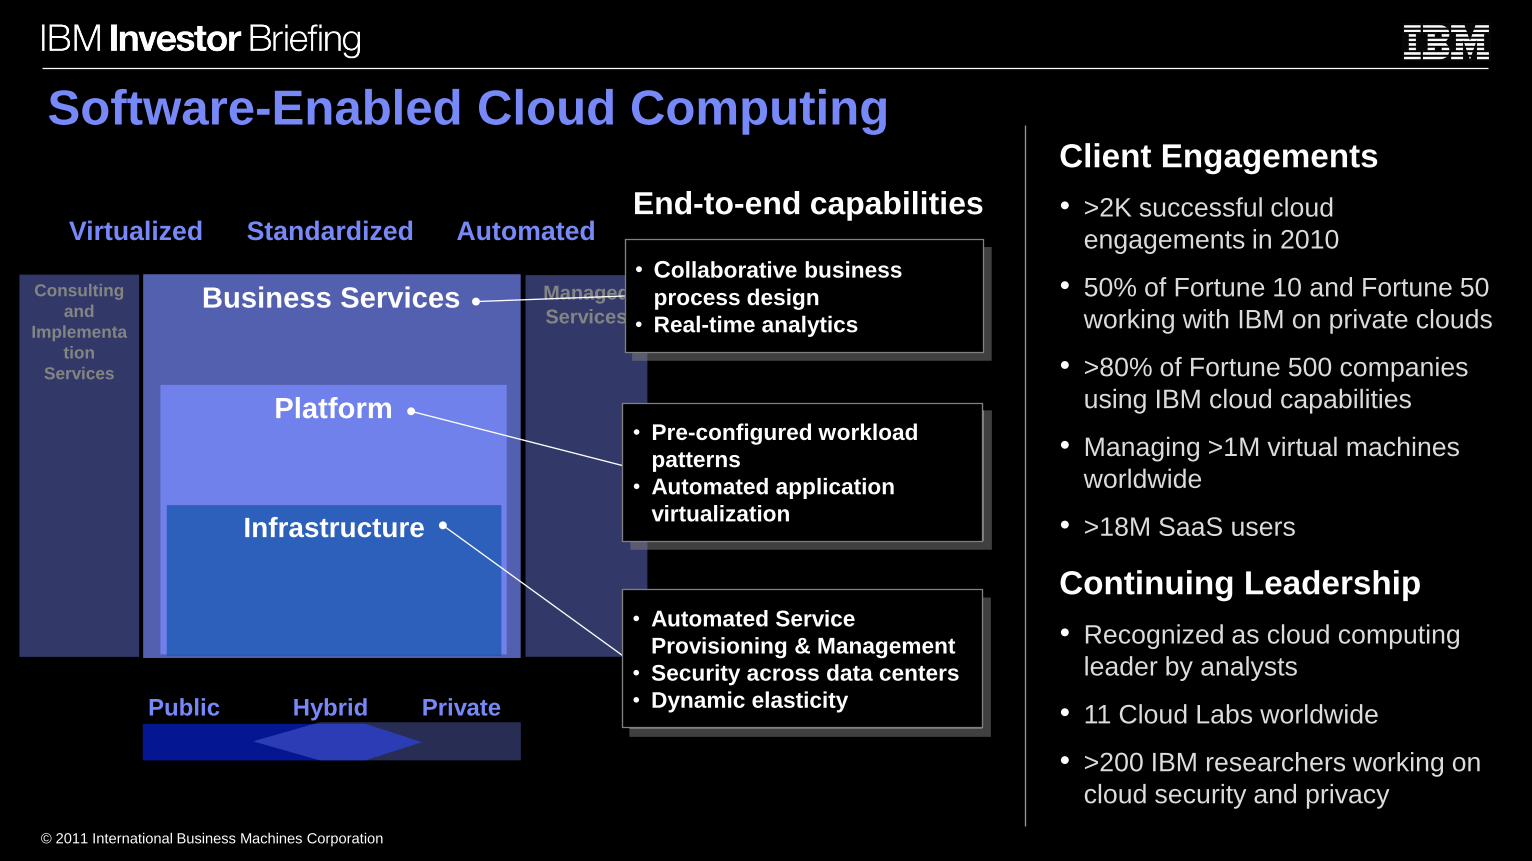
Virtualized Standardized AutomatedEnd-to-end capabilities
Public Hybrid Private
Business Services
Platform
Infrastructure
Managed
Services
Consulting
and
Implementa
tion
Services
• Collaborative business
process design
• Real-time analytics
• Pre-configured workload
patterns
• Automated application
virtualization
• Automated Service
Provisioning & Management
• Security across data centers
• Dynamic elasticity
Client Engagements
• >2K successful cloud
engagements in 2010
• 50% of Fortune 10 and Fortune 50
working with IBM on private clouds
• >80% of Fortune 500 companies
using IBM cloud capabilities
• Managing >1M virtual machines
worldwide
• >18M SaaS users
Continuing Leadership
• Recognized as cloud computing
leader by analysts
• 11 Cloud Labs worldwide
• >200 IBM researchers working on
cloud security and privacy
Software-Enabled Cloud Computing
© 2011 International Business Machines Corporation
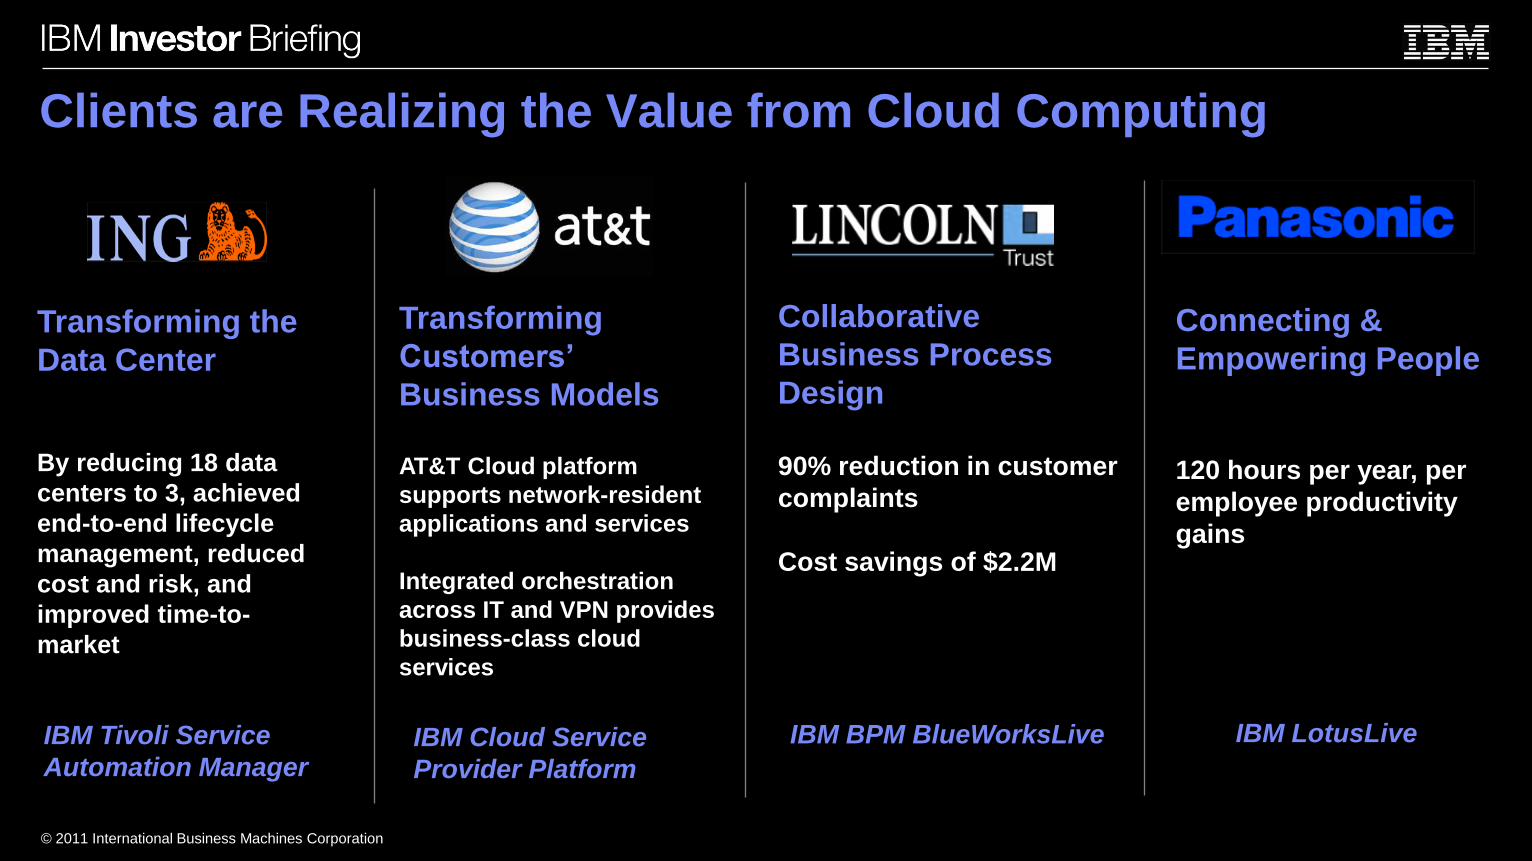
Clients are Realizing the Value from Cloud Computing
Connecting &
Empowering People
120 hours per year, per
employee productivity
gains
Transforming the
Data Center
By reducing 18 data
centers to 3, achieved
end-to-end lifecycle
management, reduced
cost and risk, and
improved time-to-
market
Collaborative
Business Process
Design
90% reduction in customer
complaints
Cost savings of $2.2M
Transforming
Customers’
Business Models
AT&T Cloud platform
supports network-resident
applications and services
Integrated orchestration
across IT and VPN provides
business-class cloud
services
IBM Cloud Service
Provider Platform
IBM BPM BlueWorksLive IBM LotusLiveIBM Tivoli Service
Automation Manager

© 2011 International Business Machines Corporation
Turning Information Into Insights
Information
Integration &
Governance
Content Management•Unstructured information
Database Software•Structured information
$8B 2015 Opportunity
Growth: +6% CAGR
Business Analytics & Optimization•Business intelligence•Advanced analytics•Financial performance management
$21B 2015 Opportunity
Growth: +2% CAGR
$28B 2015 Opportunity
Growth: +7% CAGR
$18B 2015 Opportunity
Growth: +8% CAGR
Source: 1H11 Market Insights CAGR 2010-15
Business Momentum• $14B in IBM Business Analytics &
Optimization acquisitions since 2005
• 5K Information Server installations
• >38K professionals gained recognized skills
across IM and BAO in 2010
• >1K Information Agenda client workshops
(2009-2010)
Leadership• Leader in 15 key analyst comparisons
across IM, ECM and BAO
• Watson leverages DB2, Content Analytics
and Information Integration capabilities
Competitive Edge• >1K Oracle Database customers chose
DB2 instead in 2010
• Netezza selected 84% of the time over
competition based on Proof of Concept
© 2011 International Business Machines Corporation
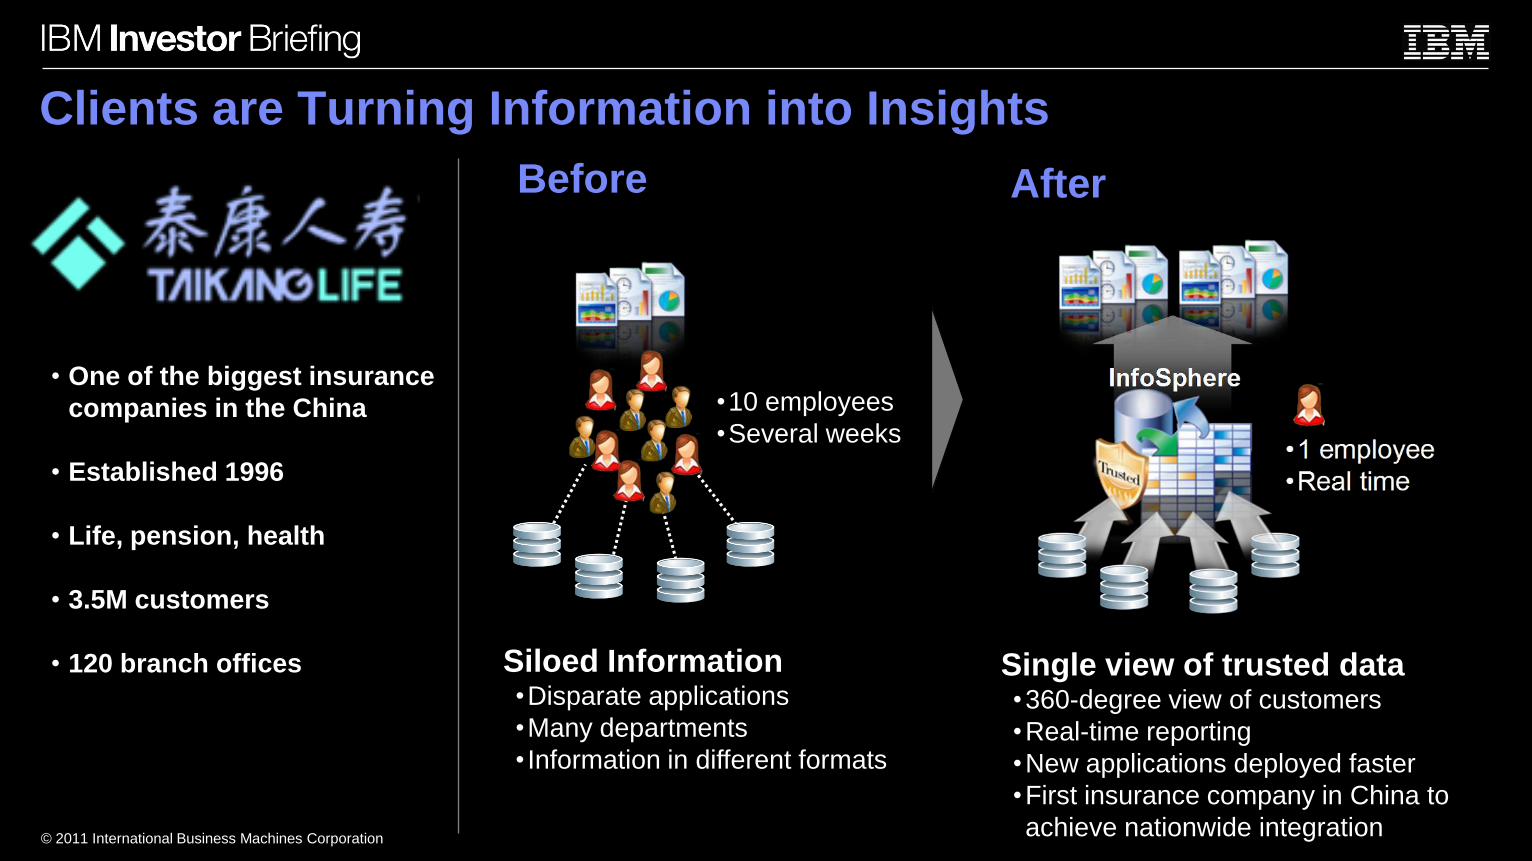
Clients are Turning Information into Insights
• One of the biggest insurance
companies in the China
• Established 1996
• Life, pension, health
• 3.5M customers
• 120 branch offices Siloed Information•Disparate applications
•Many departments
• Information in different formats
Before After
Single view of trusted data•360-degree view of customers
•Real-time reporting
•New applications deployed faster
•First insurance company in China to
achieve nationwide integration
•10 employees
•Several weeks

© 2011 International Business Machines Corporation
Information
Integration &
Governance
Unstructured InformationStructured Information
Business Analytics & Optimization
$10M-$20M Annual Savings from Cost Reduction, Fraud Prevention, New
Revenue, Service Improvement
Efficient Data InfrastructureDB2
•$340K annual savings
•12% lower environmental costs
Improved Customer ServiceFileNet, DataCap
• $3M annual savings
•~50% increase in productivity
Single View of the CustomerInfoSphere
•Saved $11M in first year & more to come
•Eliminated 14K cases of double billing
•600+ multiple customer instances
•22K instances wrong service delivery to customer
Real-time view of the businessCognos
•Saved $7M in first year & more to come
•Real time instead of days for reporting
Oakland, California-based
agency
Serves 1.5M
citizens, handling 200k
requests daily
Promoting the social and
economic well-being of their
citizens
Software Solutions Capturing the Growth
Mike Rhodin
Senior Vice President, Software Solutions
© 2011 International Business Machines Corporation
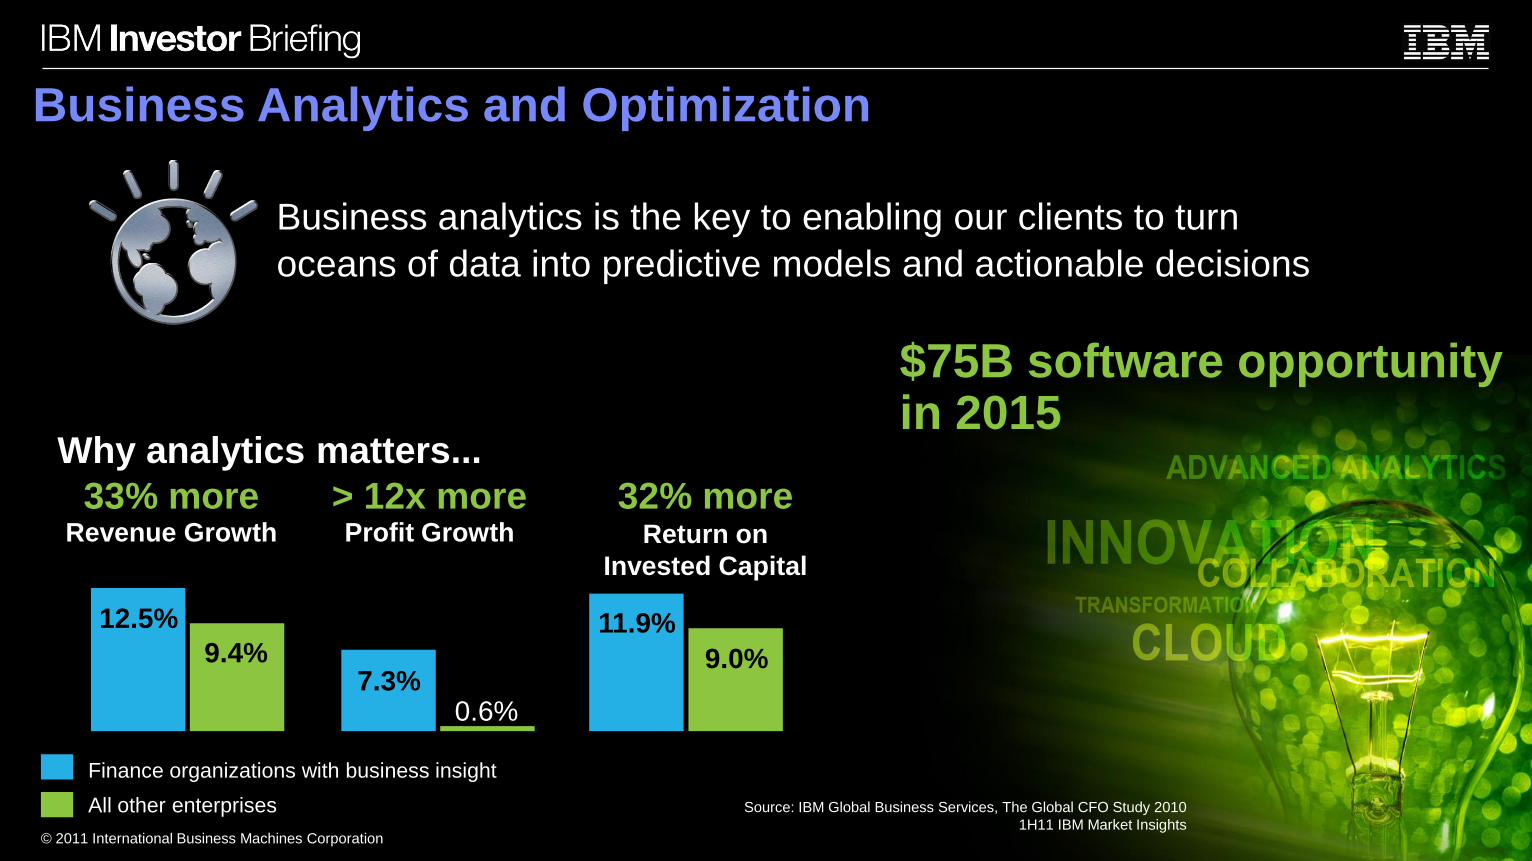
Why analytics matters...
Finance organizations with business insight
All other enterprises
> 12x moreProfit Growth
33% moreRevenue Growth
32% moreReturn on
Invested Capital
12.5%
9.4%7.3%
0.6%
11.9%
9.0%
Business analytics is the key to enabling our clients to turn
oceans of data into predictive models and actionable decisions
Business Analytics and Optimization
Source: IBM Global Business Services, The Global CFO Study 2010
1H11 IBM Market Insights
$75B software opportunity in 2015
© 2011 International Business Machines Corporation
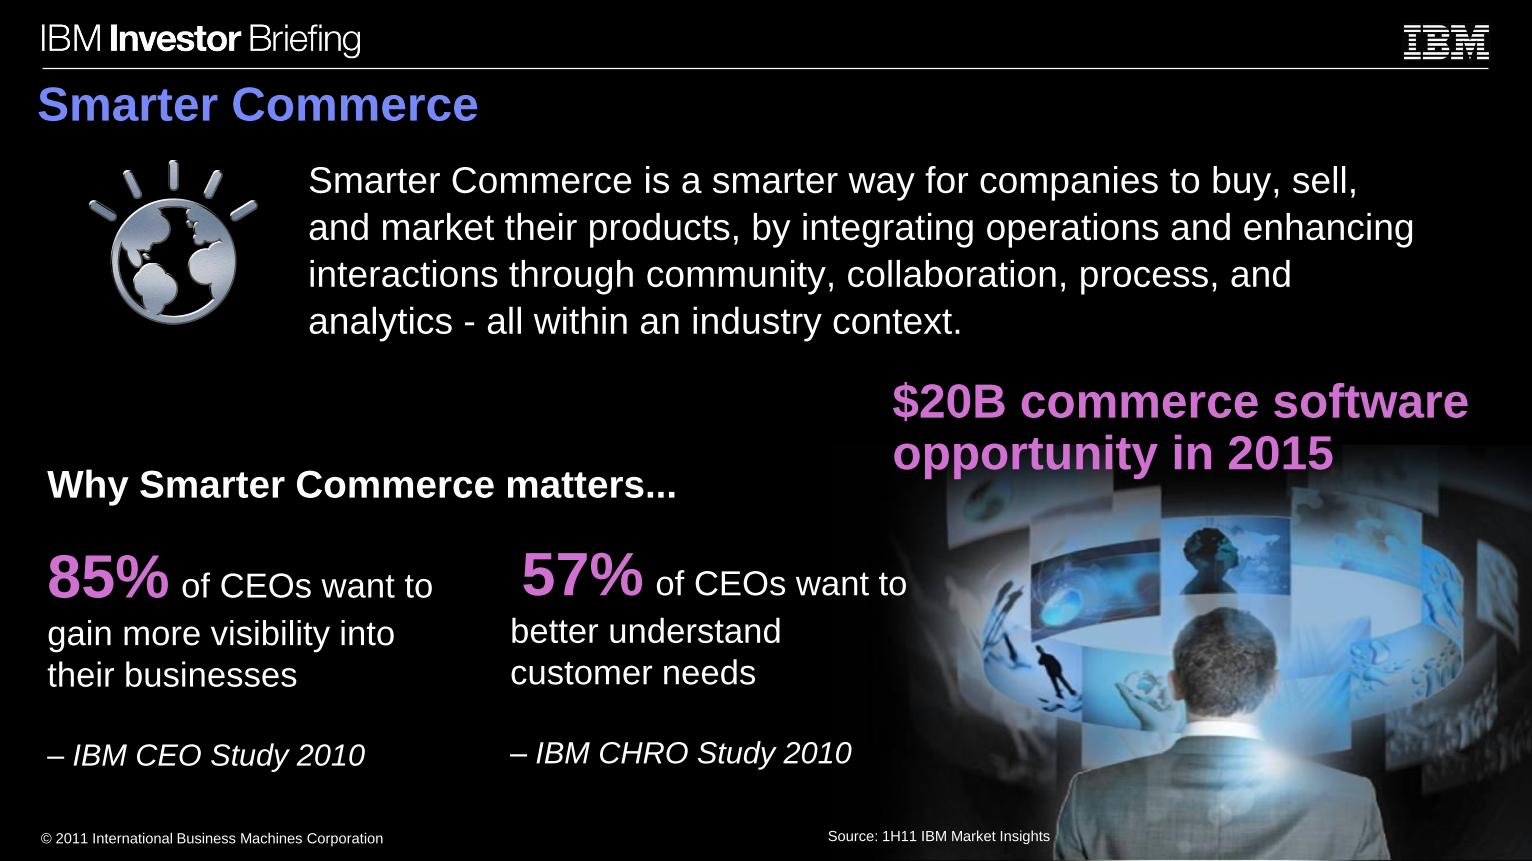
Smarter Commerce is a smarter way for companies to buy, sell,
and market their products, by integrating operations and enhancing
interactions through community, collaboration, process, and
analytics - all within an industry context.
85% of CEOs want to
gain more visibility into
their businesses
– IBM CEO Study 2010
57% of CEOs want to
better understand
customer needs
– IBM CHRO Study 2010
Why Smarter Commerce matters...
Smarter Commerce
$20B commerce software opportunity in 2015
Source: 1H11 IBM Market Insights
© 2011 International Business Machines Corporation
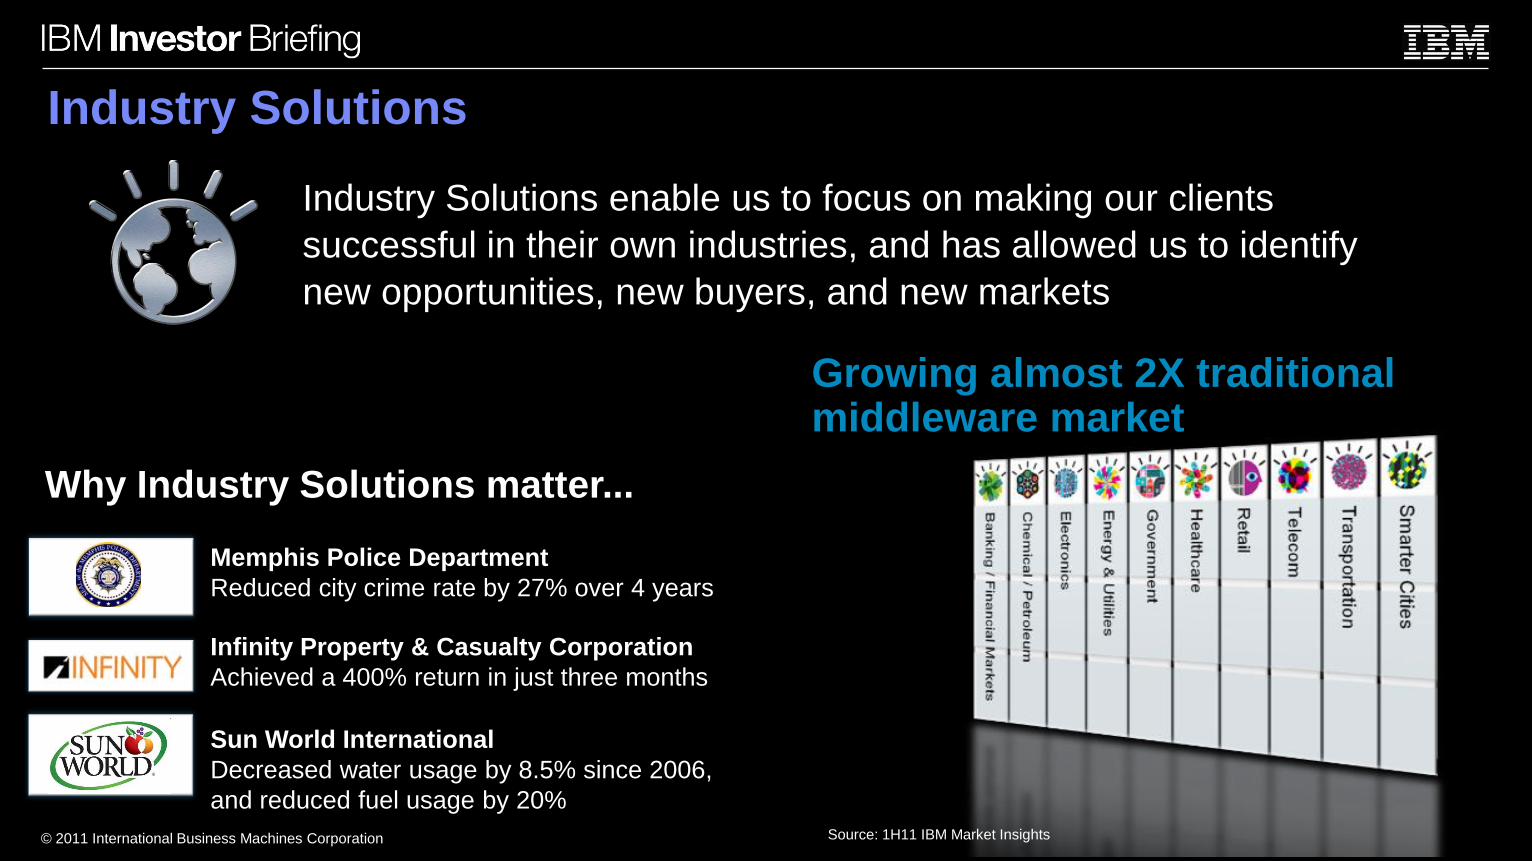
Industry Solutions enable us to focus on making our clients
successful in their own industries, and has allowed us to identify
new opportunities, new buyers, and new markets
Memphis Police Department
Reduced city crime rate by 27% over 4 years
Infinity Property & Casualty Corporation
Achieved a 400% return in just three months
Sun World International
Decreased water usage by 8.5% since 2006,
and reduced fuel usage by 20%
Why Industry Solutions matter...
Industry Solutions
Growing almost 2X traditional middleware market
Source: 1H11 IBM Market Insights
© 2011 International Business Machines Corporation
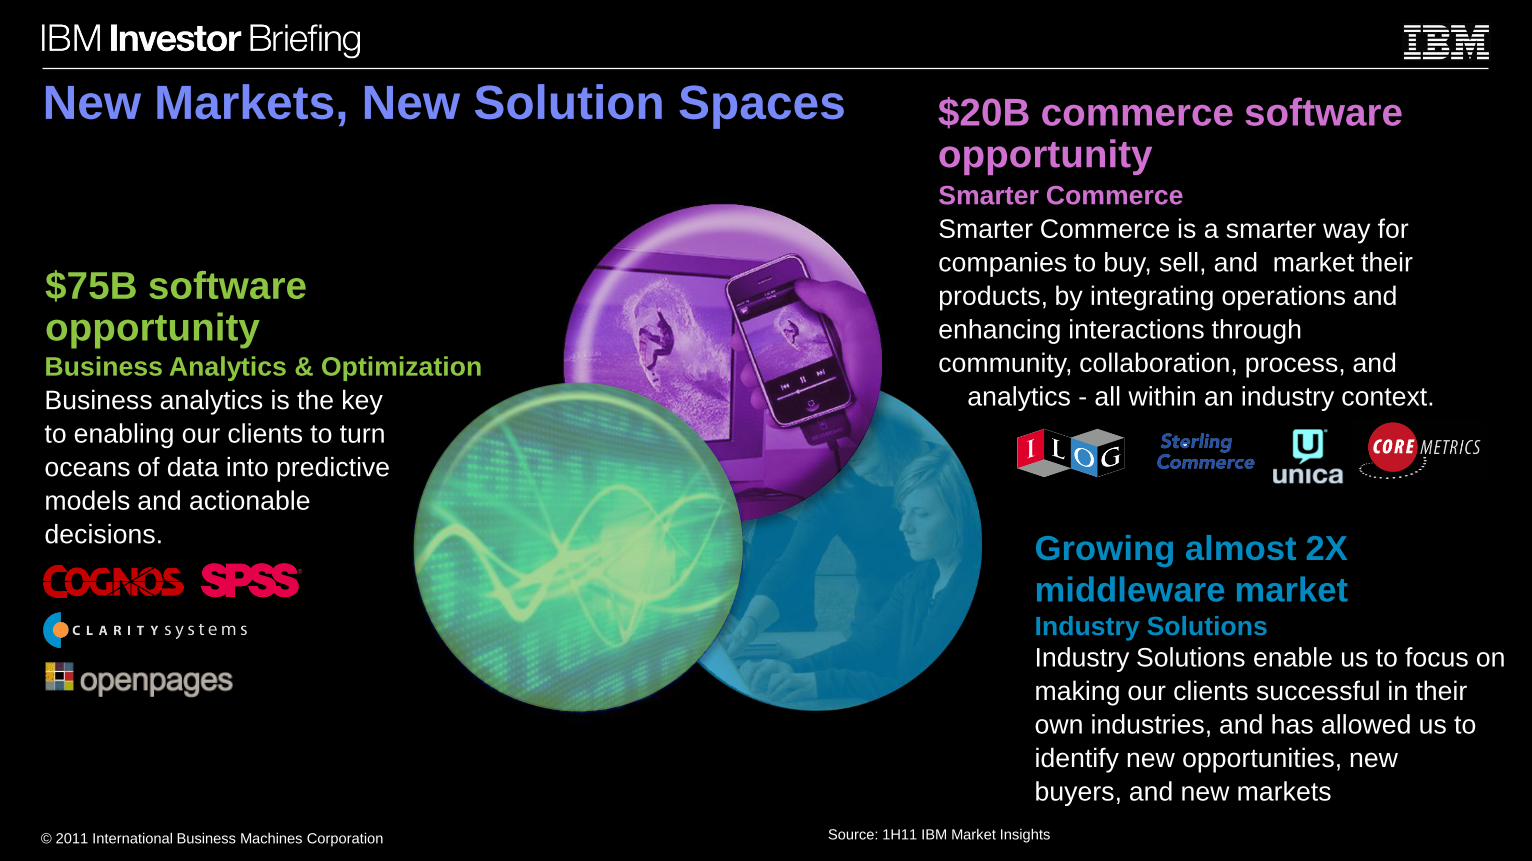
Growing almost 2X
middleware marketIndustry Solutions
Industry Solutions enable us to focus on
making our clients successful in their
own industries, and has allowed us to
identify new opportunities, new
buyers, and new markets
Smarter Commerce
Smarter Commerce is a smarter way for
companies to buy, sell, and market their
products, by integrating operations and
enhancing interactions through
community, collaboration, process, and
analytics - all within an industry context.Business Analytics & Optimization
Business analytics is the key
to enabling our clients to turn
oceans of data into predictive
models and actionable
decisions.
New Markets, New Solution Spaces
$75B software opportunity
$20B commerce software opportunity
Source: 1H11 IBM Market Insights
Systems and TechnologyContinued Innovation
Rod Adkins
Senior Vice President, Systems and Technology Group
© 2011 International Business Machines Corporation
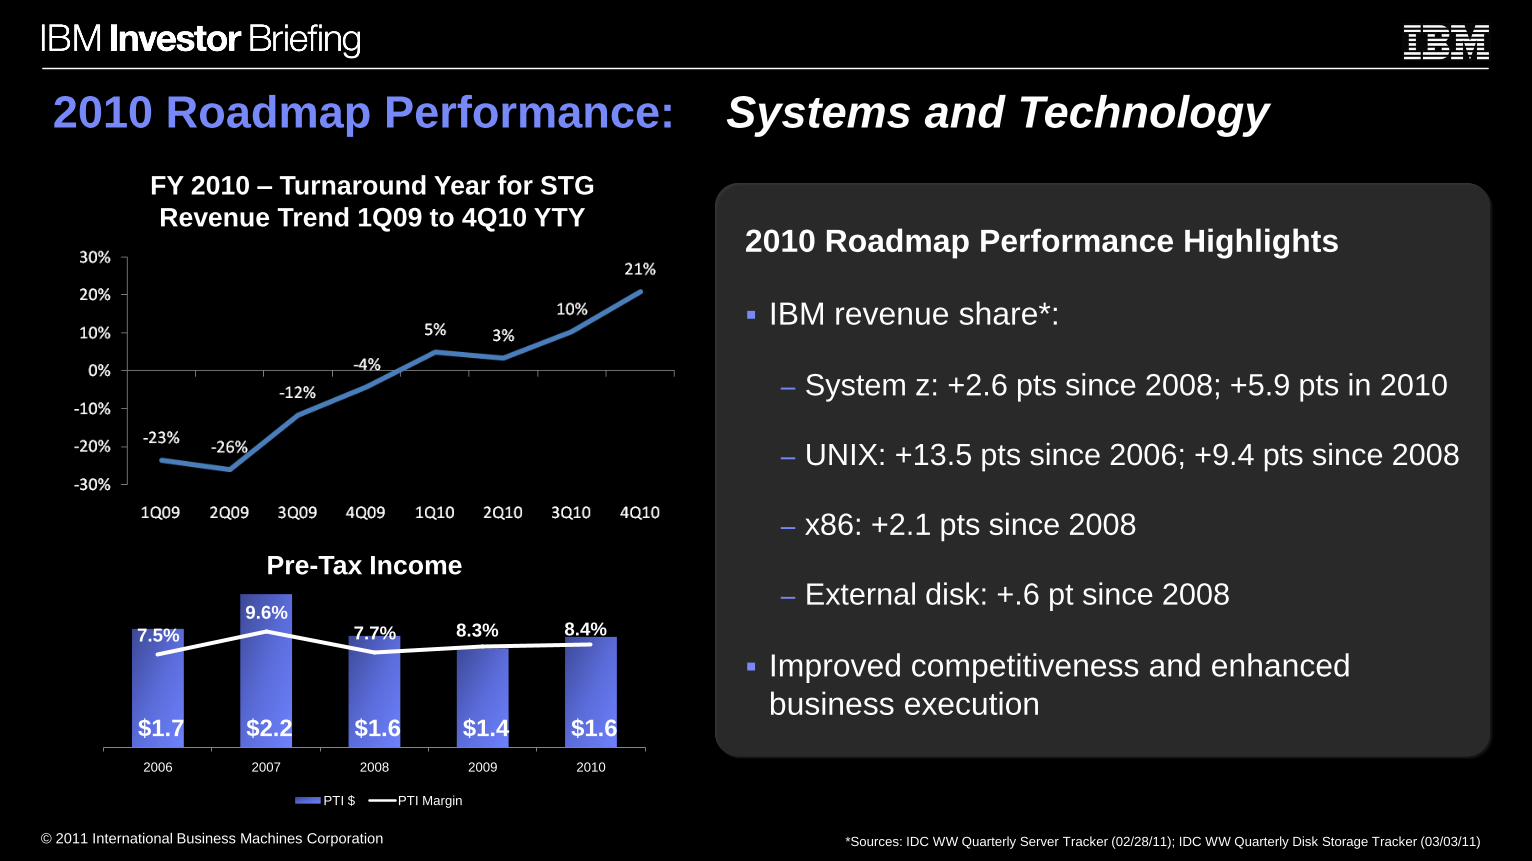
2010 Roadmap Performance: Systems and Technology
*Sources: IDC WW Quarterly Server Tracker (02/28/11); IDC WW Quarterly Disk Storage Tracker (03/03/11)
FY 2010 – Turnaround Year for STG
Revenue Trend 1Q09 to 4Q10 YTY2010 Roadmap Performance Highlights
IBM revenue share*:
– System z: +2.6 pts since 2008; +5.9 pts in 2010
– UNIX: +13.5 pts since 2006; +9.4 pts since 2008
– x86: +2.1 pts since 2008
– External disk: +.6 pt since 2008
Improved competitiveness and enhanced
business execution$1.7 $2.2 $1.6 $1.4 $1.6
7.5%
9.6%7.7% 8.3% 8.4%
-1.0%
1.0%
3.0%
5.0%
7.0%
9.0%
11.0%
13.0%
15.0%
$-
$0.5
$1.0
$1.5
$2.0
$2.5
2006 2007 2008 2009 2010
PTI $ PTI Margin
Pre-Tax Income
© 2011 International Business Machines Corporation
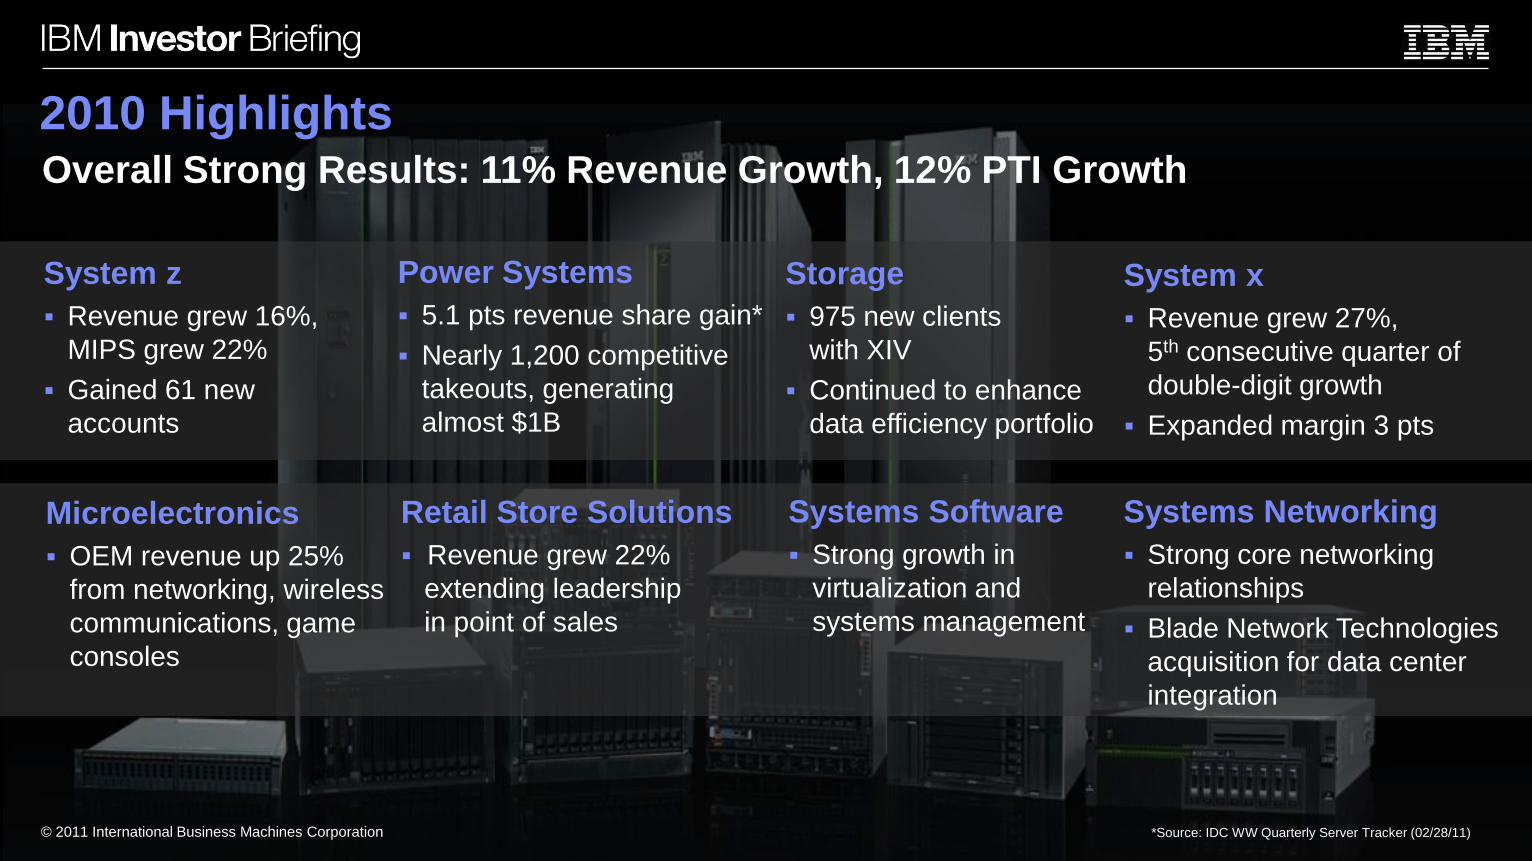
2010 Highlights
System z
Revenue grew 16%,
MIPS grew 22%
Gained 61 new
accounts
Power Systems
5.1 pts revenue share gain*
Nearly 1,200 competitive
takeouts, generating
almost $1B
Storage
975 new clients
with XIV
Continued to enhance
data efficiency portfolio
Microelectronics
OEM revenue up 25%
from networking, wireless
communications, game
consoles
Retail Store Solutions
Revenue grew 22%
extending leadership
in point of sales
Systems Software
Strong growth in
virtualization and
systems management
System x
Revenue grew 27%,
5th consecutive quarter of
double-digit growth
Expanded margin 3 pts
© 2011 International Business Machines Corporation
Overall Strong Results: 11% Revenue Growth, 12% PTI Growth
Systems Networking
Strong core networking
relationships
Blade Network Technologies
acquisition for data center
integration
*Source: IDC WW Quarterly Server Tracker (02/28/11)
© 2011 International Business Machines Corporation
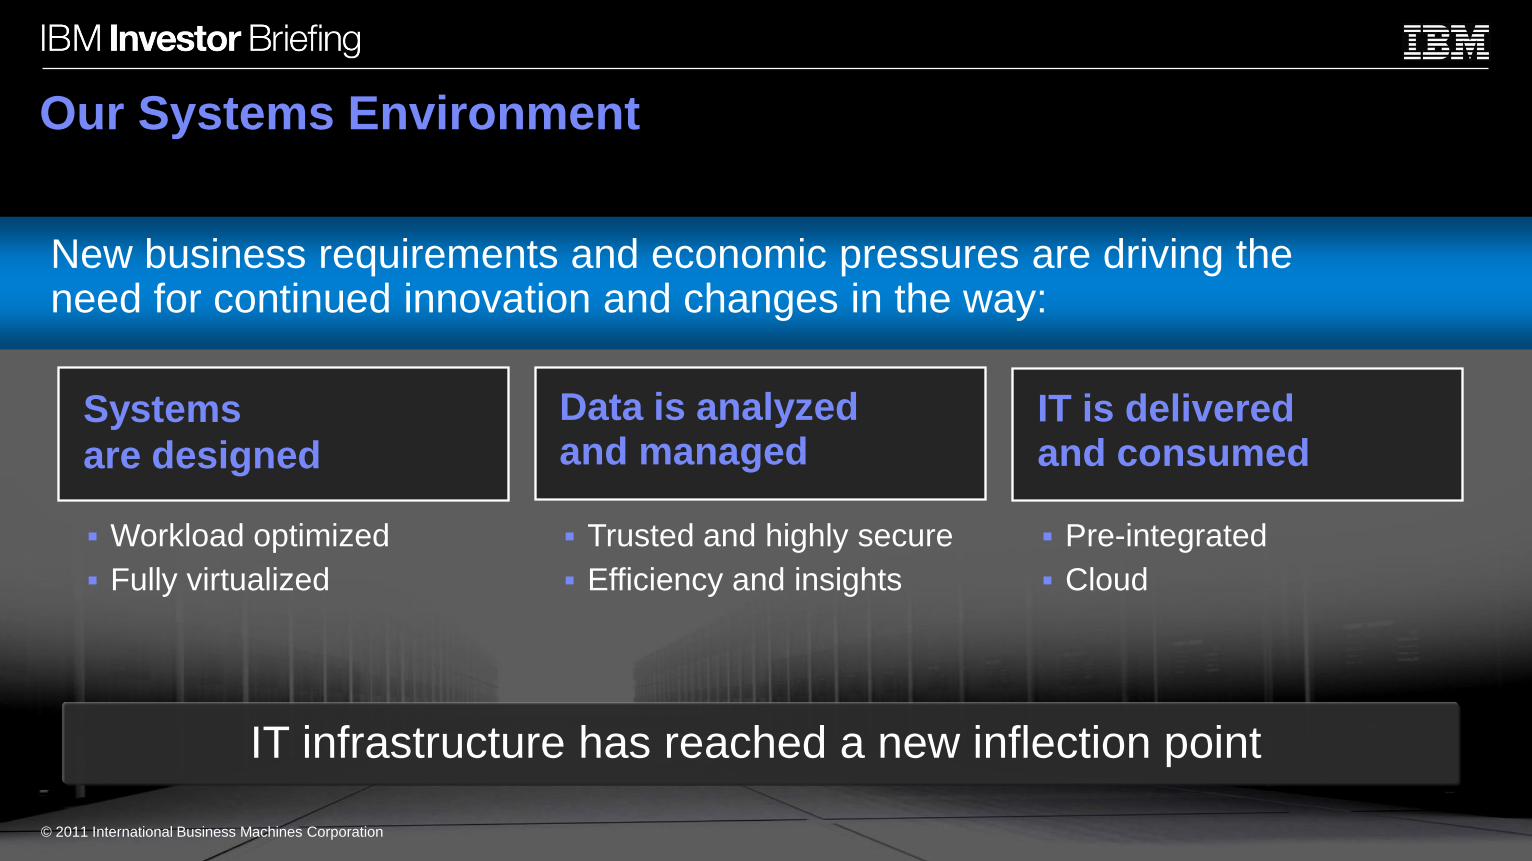
Systems
are designed
Data is analyzed and managed
IT is delivered and consumed
Our Systems Environment
IT infrastructure has reached a new inflection point
New business requirements and economic pressures are driving the need for continued innovation and changes in the way:
Workload optimized
Fully virtualized
Trusted and highly secure
Efficiency and insights
Pre-integrated
Cloud
© 2011 International Business Machines Corporation
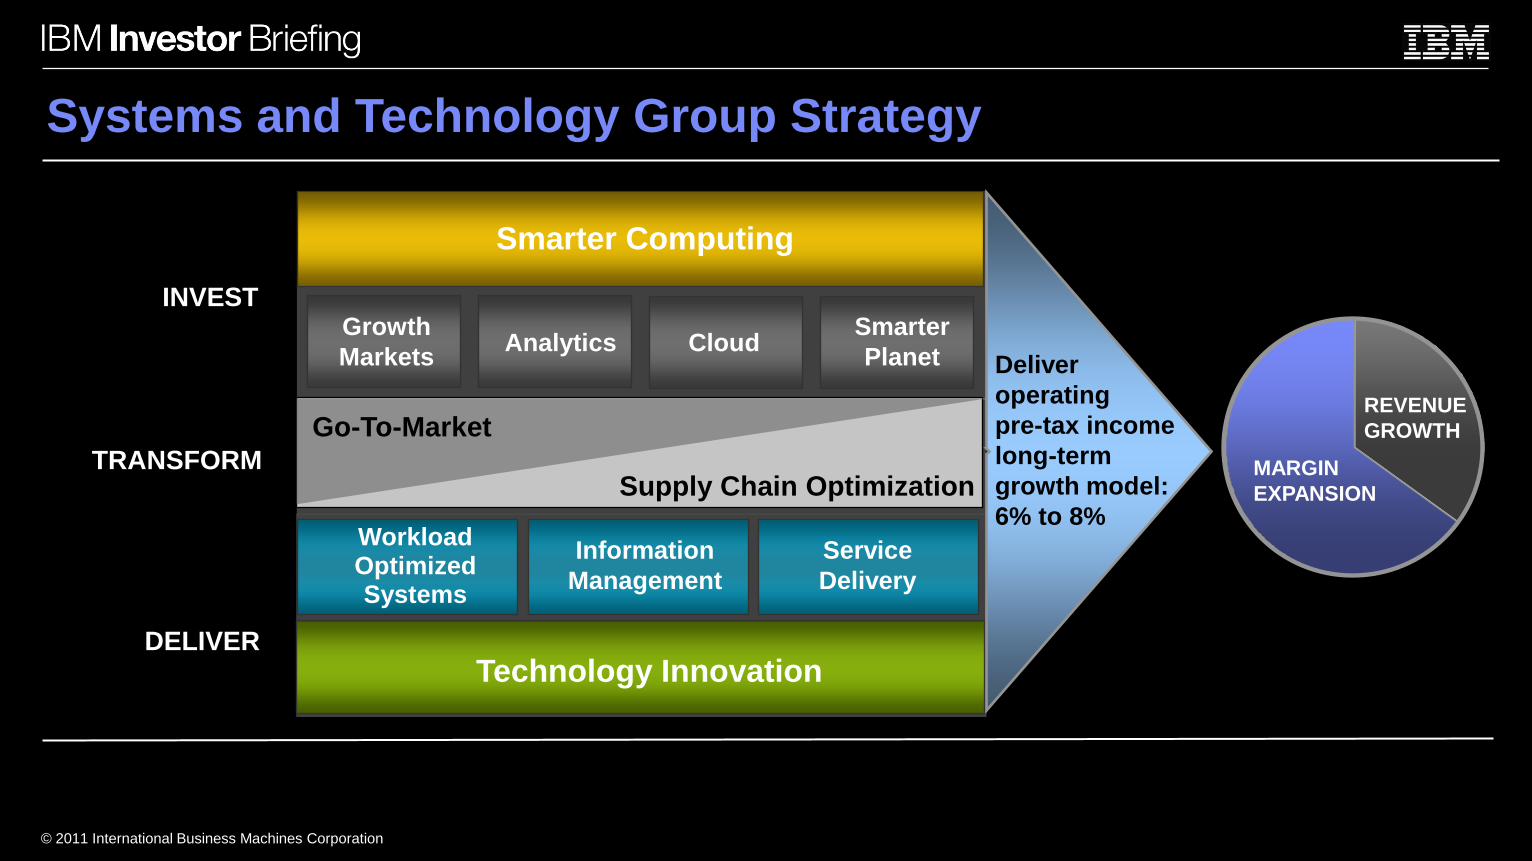
© 2011 International Business Machines Corporation
INVEST
Smarter Computing
Growth
MarketsAnalytics Cloud
Smarter
Planet
TRANSFORM
Go-To-Market
Supply Chain Optimization
Technology Innovation
Workload Optimized Systems
Information
Management
Service
Delivery
DELIVER
Systems and Technology Group Strategy
Deliver
operating
pre-tax income
long-term
growth model:
6% to 8%
MARGIN
EXPANSION
REVENUE
GROWTH
© 2011 International Business Machines Corporation
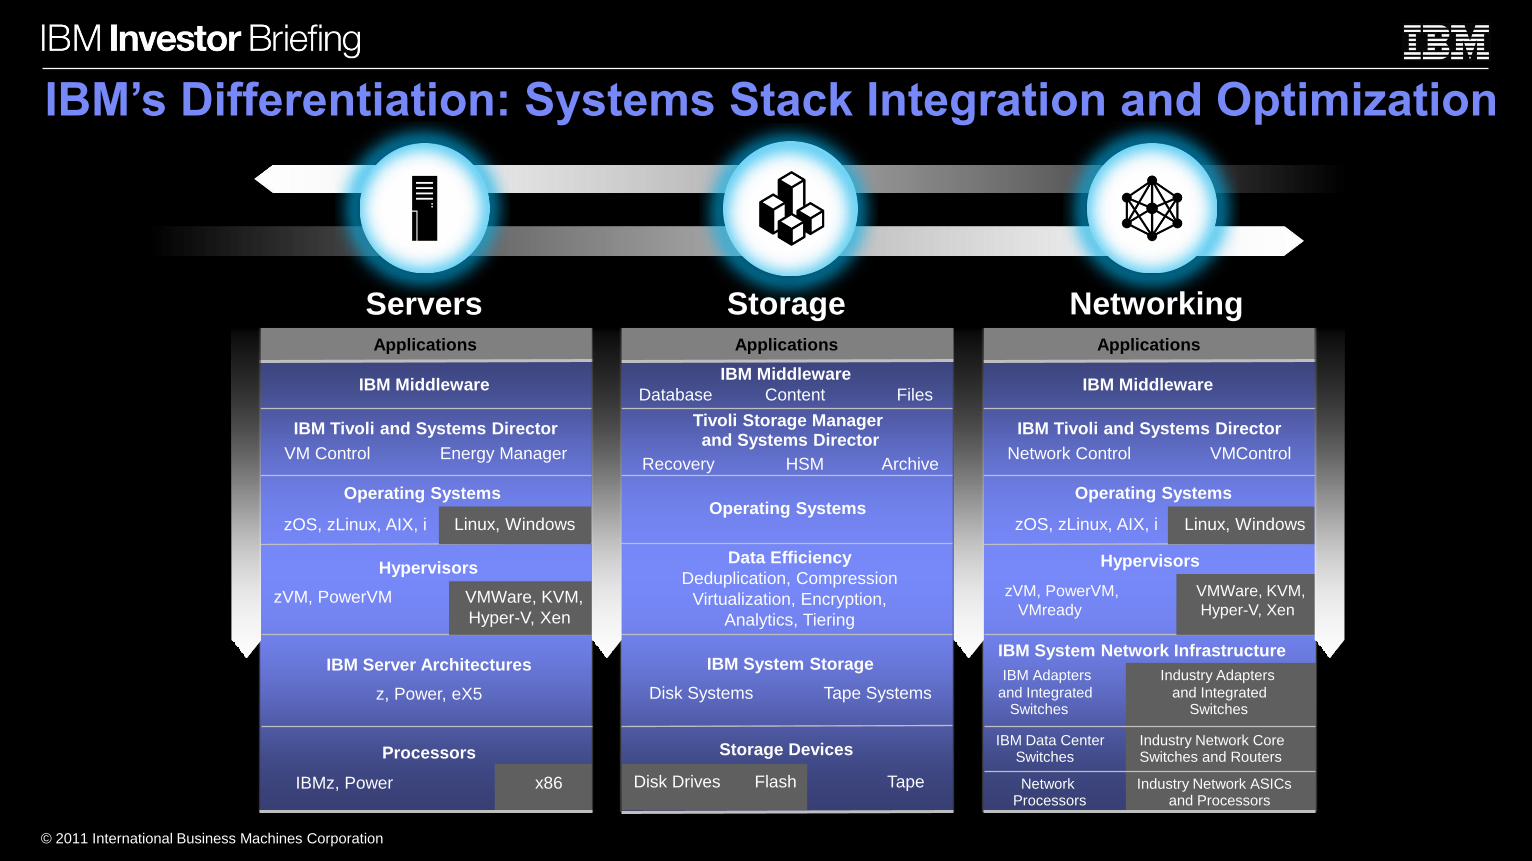
IBM’s Differentiation: Systems Stack Integration and Optimization
Storage NetworkingServersApplications
IBM Middleware
IBM Tivoli and Systems Director
VM Control Energy Manager
Hypervisors
zVM, PowerVM VMWare, KVM,
Hyper-V, Xen
IBM Server Architectures
z, Power, eX5
Processors
IBMz, Power x86
Applications
IBM Middleware
Database Content Files
Tivoli Storage Manager and Systems Director
Recovery HSM Archive
Operating Systems
Data Efficiency
Deduplication, Compression
Virtualization, Encryption,
Analytics, Tiering
IBM System Storage
Disk Systems Tape Systems
Storage Devices
Disk Drives Flash Tape
Applications
IBM Middleware
IBM Tivoli and Systems Director
Network Control VMControl
Linux, Windows
IBM System Network Infrastructure
IBM Adapters Industry Adapters
and Integrated and IntegratedSwitches Switches
IBM Data Center Industry Network CoreSwitches Switches and Routers
Network Industry Network ASICsProcessors and Processors
Hypervisors
zVM, PowerVM, VMWare, KVM,
VMready Hyper-V, Xen
zOS, zLinux, AIX, i
Operating Systems
zOS, zLinux, AIX, i
Operating Systems
Linux, Windows
© 2011 International Business Machines Corporation
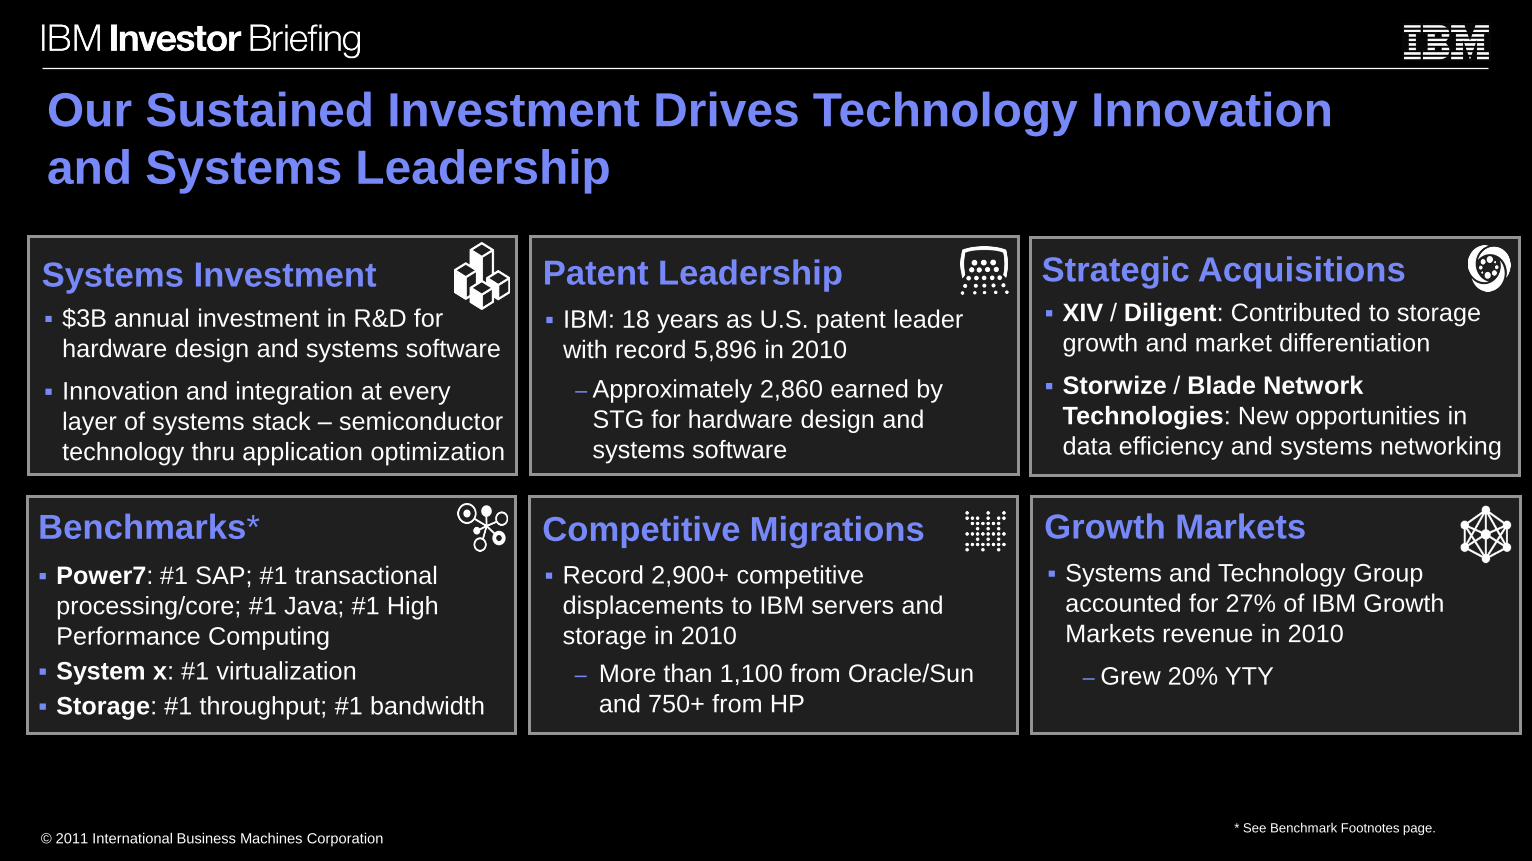
Our Sustained Investment Drives Technology Innovation
and Systems Leadership
Systems Investment $3B annual investment in R&D for
hardware design and systems software
Innovation and integration at every
layer of systems stack – semiconductor
technology thru application optimization
* See Benchmark Footnotes page.
Patent Leadership
IBM: 18 years as U.S. patent leader
with record 5,896 in 2010
– Approximately 2,860 earned by
STG for hardware design and
systems software
Strategic Acquisitions XIV / Diligent: Contributed to storage
growth and market differentiation
Storwize / Blade Network
Technologies: New opportunities in
data efficiency and systems networking
Benchmarks*
Power7: #1 SAP; #1 transactional
processing/core; #1 Java; #1 High
Performance Computing
System x: #1 virtualization
Storage: #1 throughput; #1 bandwidth
Growth Markets
Systems and Technology Group
accounted for 27% of IBM Growth
Markets revenue in 2010
– Grew 20% YTY
Competitive Migrations
Record 2,900+ competitive
displacements to IBM servers and
storage in 2010
– More than 1,100 from Oracle/Sun
and 750+ from HP
© 2011 International Business Machines Corporation
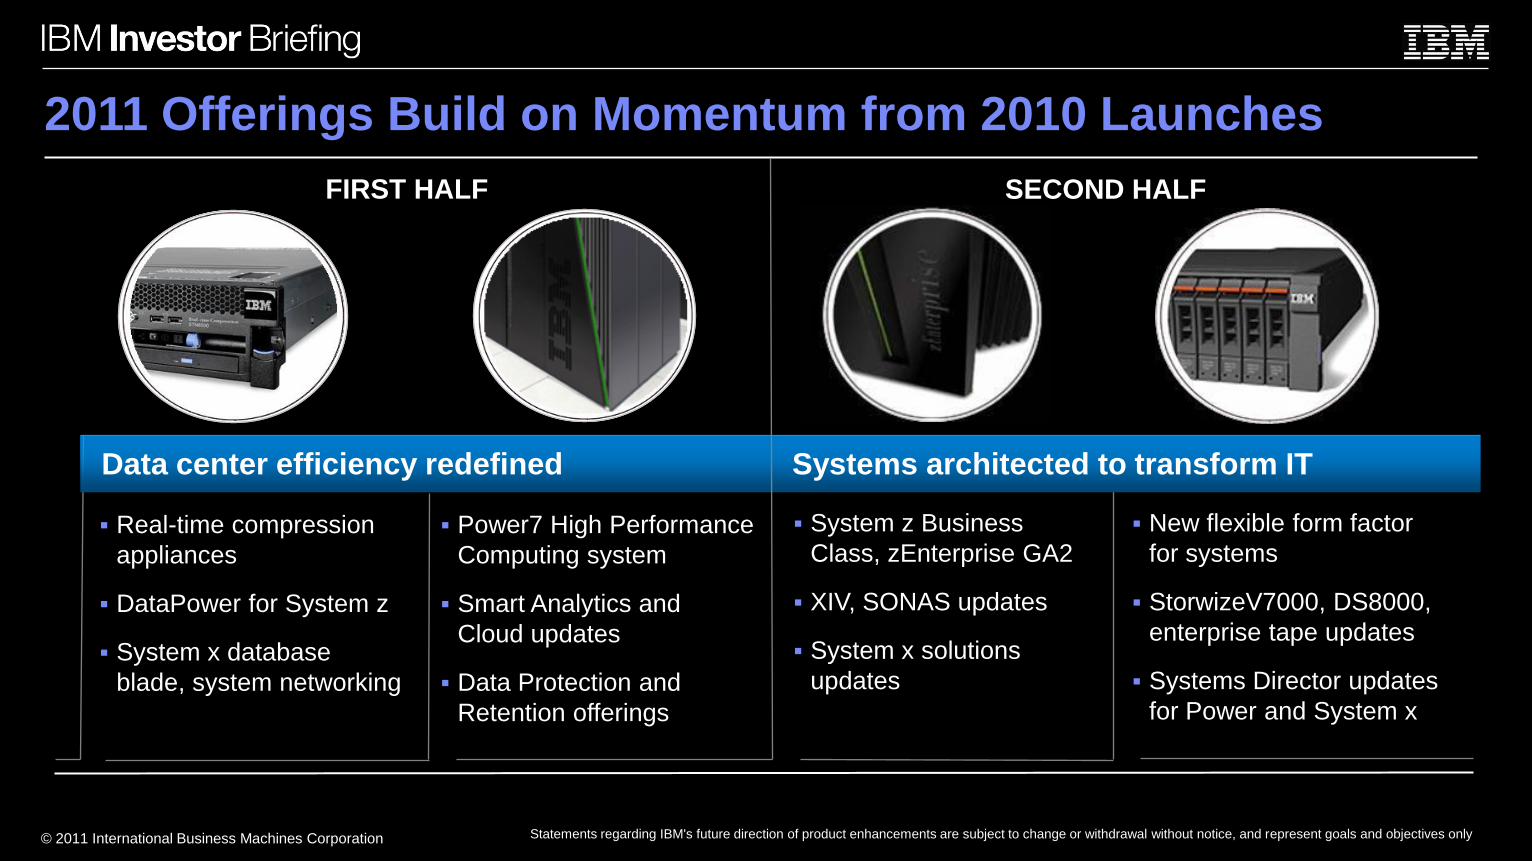
FIRST HALF
Real-time compression
appliances
DataPower for System z
System x database
blade, system networking
Power7 High Performance
Computing system
Smart Analytics and
Cloud updates
Data Protection and
Retention offerings
System z Business
Class, zEnterprise GA2
XIV, SONAS updates
System x solutions
updates
New flexible form factor
for systems
StorwizeV7000, DS8000,
enterprise tape updates
Systems Director updates
for Power and System x
2011 Offerings Build on Momentum from 2010 Launches
SECOND HALF
Data center efficiency redefined Systems architected to transform IT
Statements regarding IBM's future direction of product enhancements are subject to change or withdrawal without notice, and represent goals and objectives only
© 2011 International Business Machines Corporation
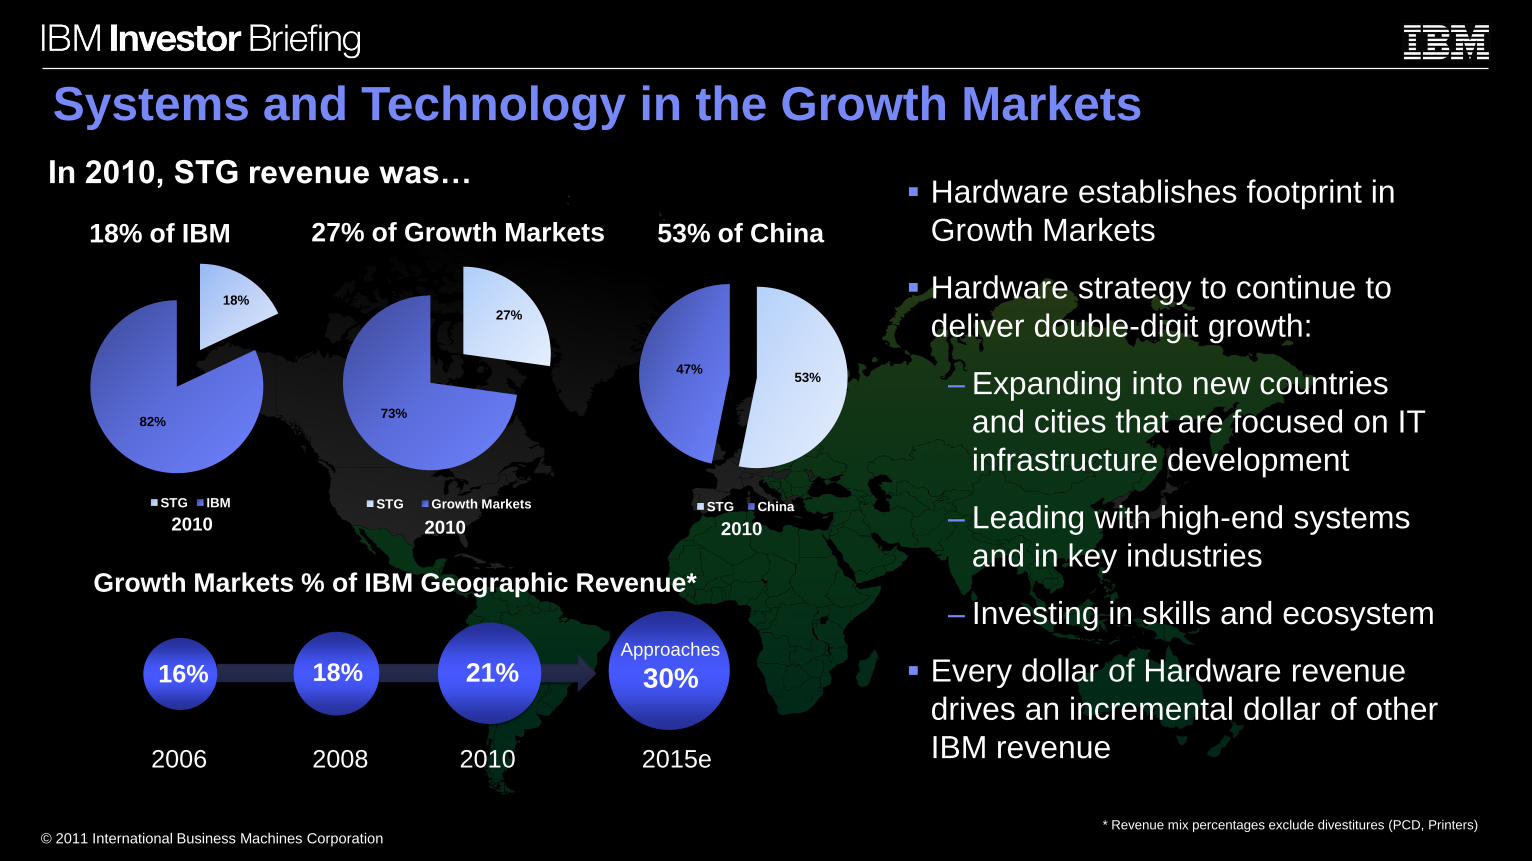
Systems and Technology in the Growth Markets
53% of China27% of Growth Markets18% of IBM
In 2010, STG revenue was… Hardware establishes footprint in
Growth Markets
Hardware strategy to continue to
deliver double-digit growth:
– Expanding into new countries
and cities that are focused on IT
infrastructure development
– Leading with high-end systems
and in key industries
– Investing in skills and ecosystem
Every dollar of Hardware revenue
drives an incremental dollar of other
IBM revenue
Growth Markets % of IBM Geographic Revenue*
18%
82%
STG IBM
27%
73%
STG Growth Markets
53%47%
STG China
2010 2010 2010
2006 2008 2010 2015e
16% 18% 21% Approaches
30%
* Revenue mix percentages exclude divestitures (PCD, Printers)
© 2011 International Business Machines Corporation
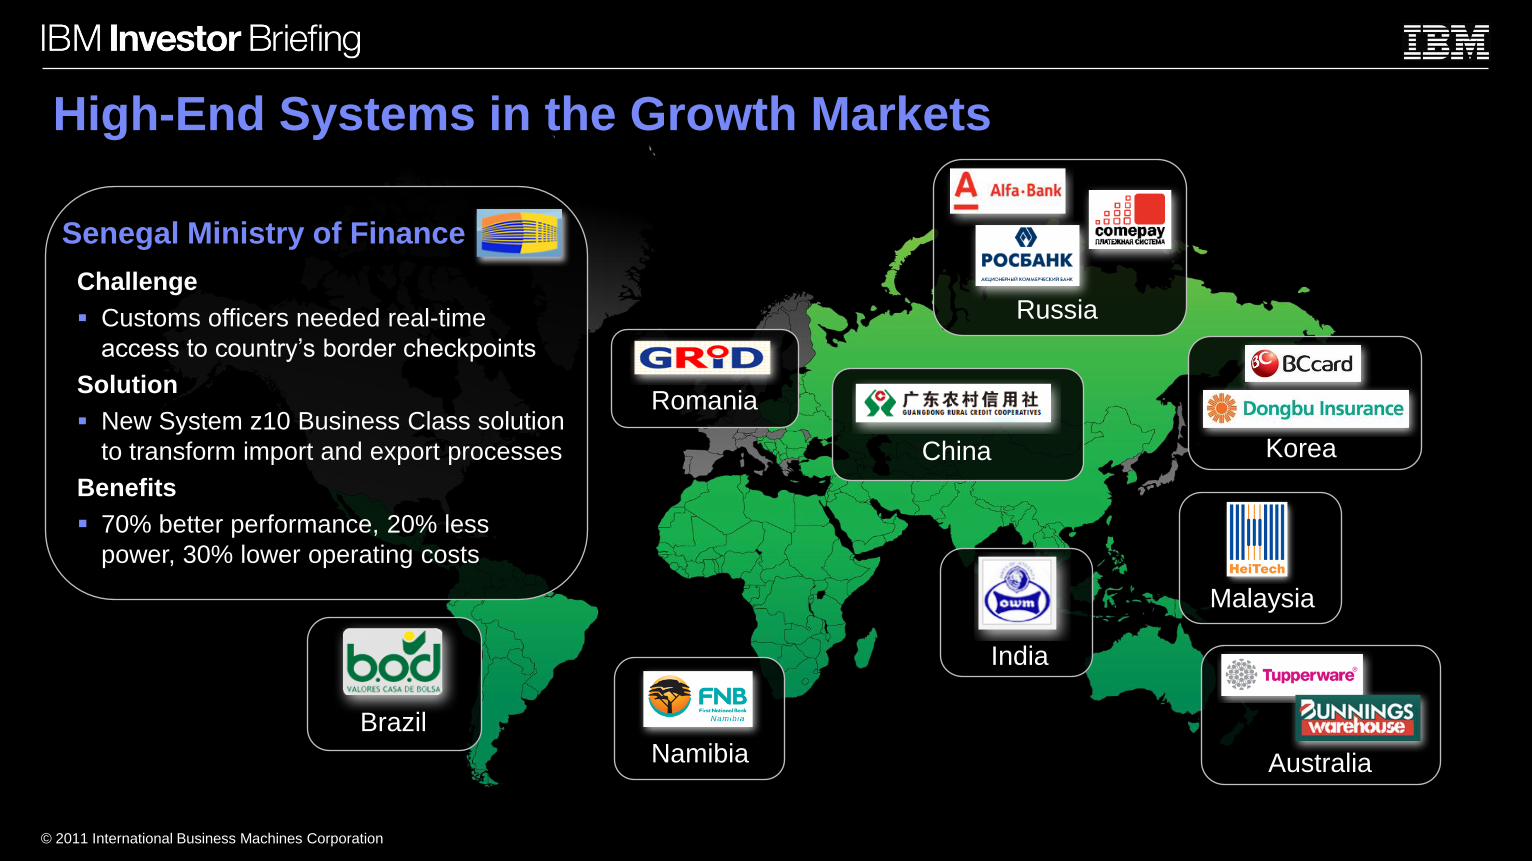
High-End Systems in the Growth Markets
Challenge
Customs officers needed real-time
access to country’s border checkpoints
Solution
New System z10 Business Class solution
to transform import and export processes
Benefits
70% better performance, 20% less
power, 30% lower operating costs
Senegal Ministry of Finance
Brazil
Australia
Korea
Namibia
China
India
Romania
Malaysia
Russia
© 2011 International Business Machines Corporation
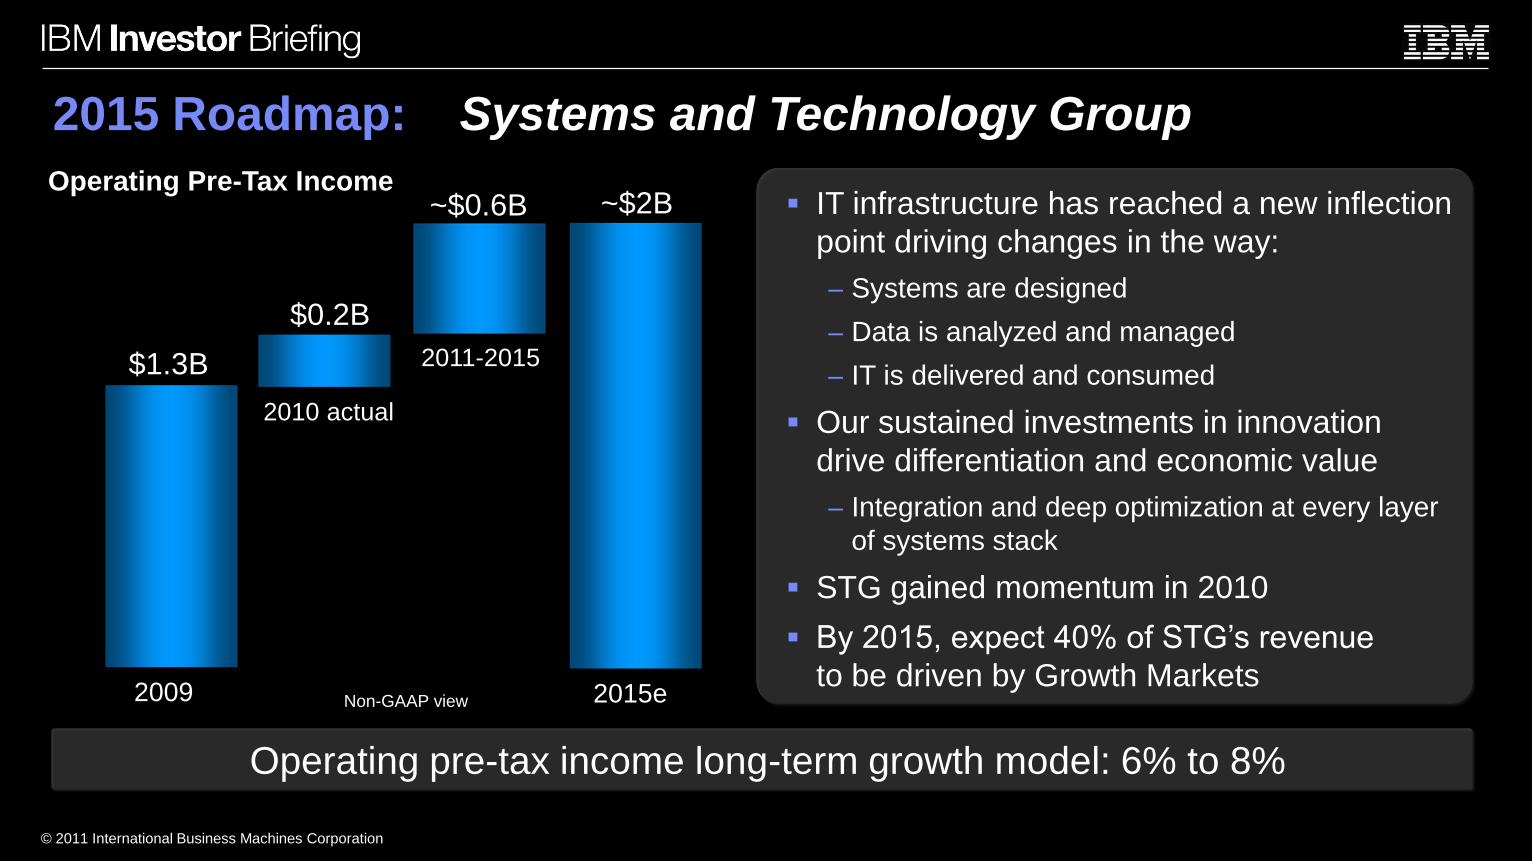
2015 Roadmap: Systems and Technology Group
~$2B
2009 2015e
$1.3B
2010 actual
Non-GAAP view
Operating Pre-Tax Income
2011-2015
$0.2B
~$0.6B
Operating pre-tax income long-term growth model: 6% to 8%
IT infrastructure has reached a new inflection
point driving changes in the way:
– Systems are designed
– Data is analyzed and managed
– IT is delivered and consumed
Our sustained investments in innovation
drive differentiation and economic value
– Integration and deep optimization at every layer
of systems stack
STG gained momentum in 2010
By 2015, expect 40% of STG’s revenue
to be driven by Growth Markets
© 2011 International Business Machines Corporation
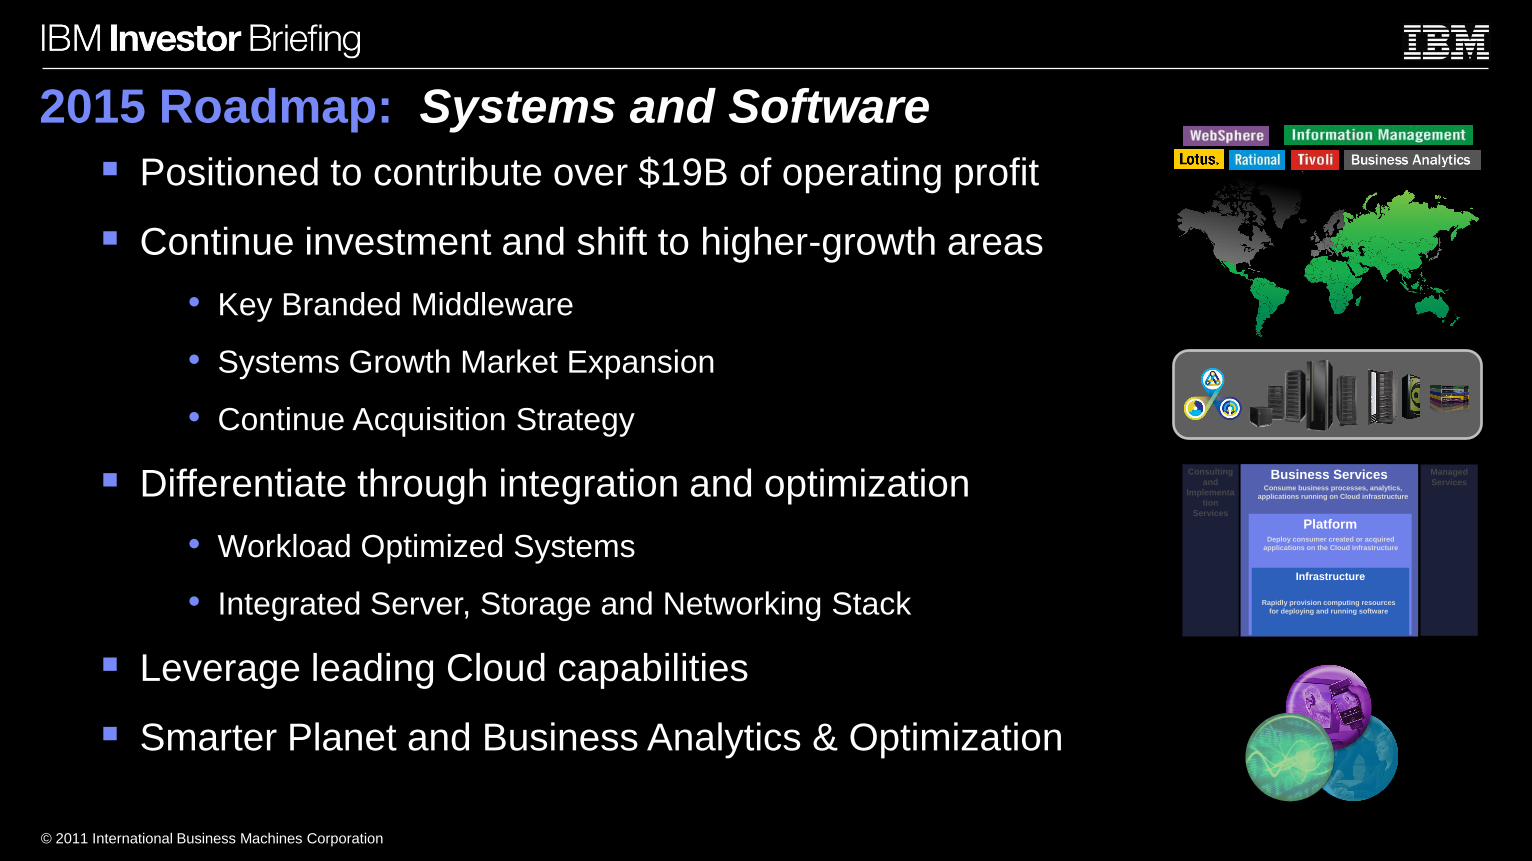
Positioned to contribute over $19B of operating profit
Continue investment and shift to higher-growth areas
• Key Branded Middleware
• Systems Growth Market Expansion
• Continue Acquisition Strategy
Differentiate through integration and optimization
• Workload Optimized Systems
• Integrated Server, Storage and Networking Stack
Leverage leading Cloud capabilities
Smarter Planet and Business Analytics & Optimization
2015 Roadmap: Systems and Software
Business Services
PlatformDeploy consumer created or acquired
applications on the Cloud infrastructure
Consume business processes, analytics,
applications running on Cloud infrastructure
Infrastructure
Managed
Services
Consulting
and
Implementa
tion
Services
Rapidly provision computing resources
for deploying and running software

© 2011 International Business Machines Corporation
© 2011 International Business Machines Corporation
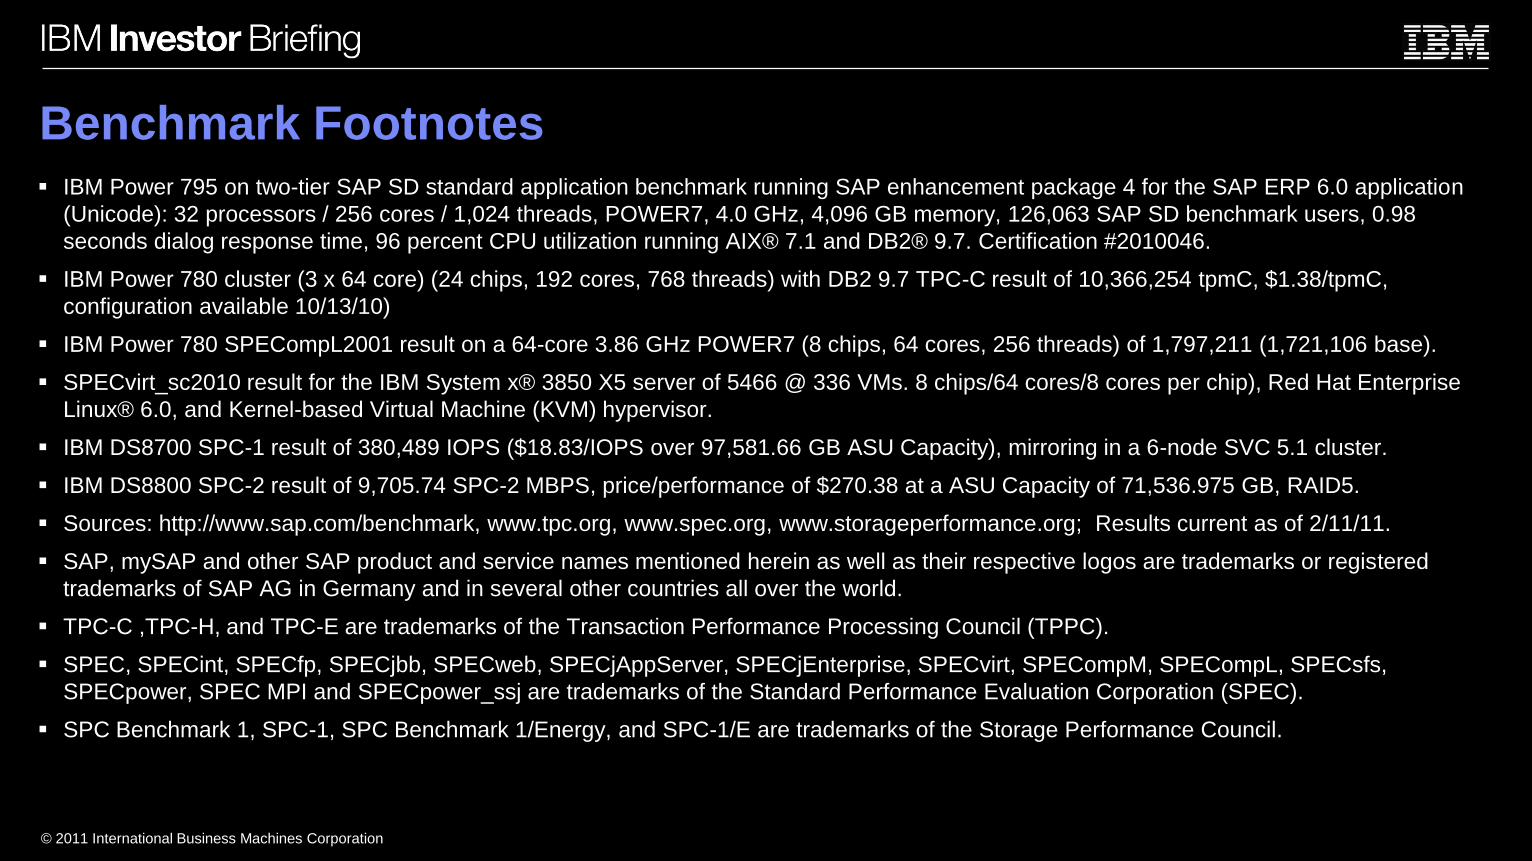
Benchmark Footnotes IBM Power 795 on two-tier SAP SD standard application benchmark running SAP enhancement package 4 for the SAP ERP 6.0 application
(Unicode): 32 processors / 256 cores / 1,024 threads, POWER7, 4.0 GHz, 4,096 GB memory, 126,063 SAP SD benchmark users, 0.98
seconds dialog response time, 96 percent CPU utilization running AIX® 7.1 and DB2® 9.7. Certification #2010046.
IBM Power 780 cluster (3 x 64 core) (24 chips, 192 cores, 768 threads) with DB2 9.7 TPC-C result of 10,366,254 tpmC, $1.38/tpmC,
configuration available 10/13/10)
IBM Power 780 SPECompL2001 result on a 64-core 3.86 GHz POWER7 (8 chips, 64 cores, 256 threads) of 1,797,211 (1,721,106 base).
SPECvirt_sc2010 result for the IBM System x® 3850 X5 server of 5466 @ 336 VMs. 8 chips/64 cores/8 cores per chip), Red Hat Enterprise
Linux® 6.0, and Kernel-based Virtual Machine (KVM) hypervisor.
IBM DS8700 SPC-1 result of 380,489 IOPS ($18.83/IOPS over 97,581.66 GB ASU Capacity), mirroring in a 6-node SVC 5.1 cluster.
IBM DS8800 SPC-2 result of 9,705.74 SPC-2 MBPS, price/performance of $270.38 at a ASU Capacity of 71,536.975 GB, RAID5.
Sources: http://www.sap.com/benchmark, www.tpc.org, www.spec.org, www.storageperformance.org; Results current as of 2/11/11.
SAP, mySAP and other SAP product and service names mentioned herein as well as their respective logos are trademarks or registered
trademarks of SAP AG in Germany and in several other countries all over the world.
TPC-C ,TPC-H, and TPC-E are trademarks of the Transaction Performance Processing Council (TPPC).
SPEC, SPECint, SPECfp, SPECjbb, SPECweb, SPECjAppServer, SPECjEnterprise, SPECvirt, SPECompM, SPECompL, SPECsfs,
SPECpower, SPEC MPI and SPECpower_ssj are trademarks of the Standard Performance Evaluation Corporation (SPEC).
SPC Benchmark 1, SPC-1, SPC Benchmark 1/Energy, and SPC-1/E are trademarks of the Storage Performance Council.
Certain comments made in the presentation may be characterized as forward looking under the Private Securities Litigation Reform Act of 1995. Those statements involve a number of factors that could cause actual results to differ materially. Additional information concerning these factors is contained in the Company's filings with the SEC. Copies are available from the SEC, from the IBM web site, or from IBM Investor Relations. Any forward-looking statement made during this event or in these presentation materials speaks only as of the date on which it is made. The Company assumes no obligation to update or revise any forward-looking statements.
These charts and the associated remarks and comments are integrally related, and are intended to be presented and understood together.
In an effort to provide additional and useful information regarding the Company’s financial results and other financial information as determined by generally accepted accounting principles (GAAP), certain materials presented during this event include non-GAAP information. The rationale for management’s use of this non-GAAP information, the reconciliation of that information to GAAP, and other related information is included in supplementary materials entitled “Non-GAAP Supplementary Materials” that are posted on the Company’s investor relations web site at http://www.ibm.com/investor/events/investor0311. The Non-GAAP Supplementary Materials are also included as Attachment II to the Company’s Form 8-K dated March 8, 2011.
© 2011 International Business Machines Corporation
© 2011 International Business Machines Corporation