Integrated Research Annual Report 2013 For personal use only · 2013. 10. 4. · Integrated...
88
ABN 76 003 588 449 Integrated Research Annual Report 2013 Providing Business Insight™ For personal use only
Transcript of Integrated Research Annual Report 2013 For personal use only · 2013. 10. 4. · Integrated...

ABN 76 003 588 449
Integrated Research
Annual Report 2013
Providing Business Insight™
Corporate HQ
Asia Pacifi c/Middle East/AfricaIntegrated Research Ltd
Level 9/100 Pacifi c HighwayNorth Sydney NSW 2060Australia
+61 (2) 9966 1066
+61 (2) 9966 1042
Americas - West CoastIntegrated Research Inc.
8055 East Tuft s AvenueSuite 950 Denver CO 80237USA
+1 (303) 390 8700
+1 (303) 390 8777
Americas ‑ East CoastIntegrated Research Inc.
1818 Library StreetSuite 500 Reston VA 20190USA
+1 (703) 956 3016
+1 (303) 390 8777
EuropeIntegrated Research UK Ltd
Orchard Lea, Drift RoadWinkfi eld, Windsor Berkshire SL4 4RP United Kingdom
+44 (0) 1344 894 200
+44 (0) 1344 890 851
Inte
gra
ted
Re
sea
rch
An
nu
al R
ep
ort 2
013
Visit our website at www.ir.com or our community blog at www.realtime.ir.com
GermanyIntegrated Research UK Ltd
Münchner Büro der Integrated Research UK LtdTerminalstrasse Mitt e 1885356 München, Germany
+49 (89) 97 007 132
SingaporeIntegrated Research (Singapore) Pte Ltd
3 Temasek AvenueLevel 21, Centennial Tower Singapore 039190
+65 6549 7038
+65 6549 7011
For
per
sona
l use
onl
y

Directors
Steve KilleleaChairman and Non-Executi ve Director
Mark BrayanManaging Director and CEO
Alan BaxterIndependent Non-Executi ve Director
Garry DinnieIndependent Non-Executi ve Director
Kate CostelloIndependent Non-Executi ve Director
Peter LloydNon-Executi ve Director
Clyde McConaghyNon-Executi ve Director
SecretaryDavid Purdue
Registered Offi ceLevel 9, 100 Pacifi c HighwayNorth Sydney, NSW, 2060Phone: (+61 2) 9966 1066
Share RegistryComputershare
AuditorsErnst & YoungErnst & Young Centre680 George StreetSydney, NSW, 2000
SolicitorsAshurstLevel 36, Grosvenor Place225 George StreetSydney, NSW, 2000
BankersWestpac Banking Corporati on
Securities Exchange ListingAustralian Securiti es ExchangeCode IRI
Country of IncorporationIntegrated Research Limited, incorporated and domiciled in Australia, is a publicly listed company limited by shares.
Notice of Annual General MeetingThe Annual General Meeti ng of Integrated Research Limited will be held at 3:00pm on Thursday, 14 November 2013, at the Museum of Sydney, Corner of Phillip and Bridge Streets, Sydney.
Corporate Directory
Designed by RDA Creati ve www.rda.com.au
Access your Annual Report 2013 online.
Visit www.ir.com/annualreport2013
This report is printed on Impress paper which is FSC‑certi fi ed.
Fibre is sourced from well‑managed forest plantati ons and controlled sources.
For
per
sona
l use
onl
y

Letter from the Chairm
anDirectors and Senior M
anagement
Directors’ ReportRem
uneration ReportCorporate Governance Statem
entFinancial Statem
entsIndependent Audit Report
Contents2013 Highlights 2
Letter from the Chairman 4
Review of Operations and Activities 12
Directors 18
Senior Management 22
Directors’ Report 24
Remuneration Report 29
Corporate Governance Statement 38
Financial Statements 43
Notes to the Financial Statements 49
Directors’ Declaration 78
Independent Auditor’s Report 79
Lead Auditor’s Independence Declaration 81
ASX Additional Information 82
Corporate Directory 85
For
per
sona
l use
onl
y

Financial Summary
In millions of AUD (except earnings per share)
Year ended 30 June 2013 2012 % Change
Revenue from licence fees 26.6 28.9 ↓ (8%)
Total revenue 48.9 48.6 ↑ 1%
Net profit after tax 9.1 9.0 ↑ 0%
Net assets 30.0 29.2 ↑ 3%
Cash at balance date 14.8 12.0 ↑ 23%
Americas revenue 34.4 31.9 ↑ 8%
Europe revenue 6.9 7.2 ↓ (3%)
Asia Pacific revenue 7.5 8.7 ↓ (14%)
Earnings per share (cents per share) 5.4 5.4 ↓ (0%)
In millions of local currency
Year ended 30 June 2013 2012 % Change
Americas revenue (USD) 35.2 33.1 ↑ 6%
Europe revenue (UK Sterling) 4.5 4.7 ↓ (4%)
Asia Pacific revenue (AUD) 7.5 8.7 ↓ (14%)
2013 Highlights
Inte
grat
ed R
esea
rch
and
its c
ontr
olle
d en
tities
• A
nnua
l Rep
ort 2
013
2
For
per
sona
l use
onl
y
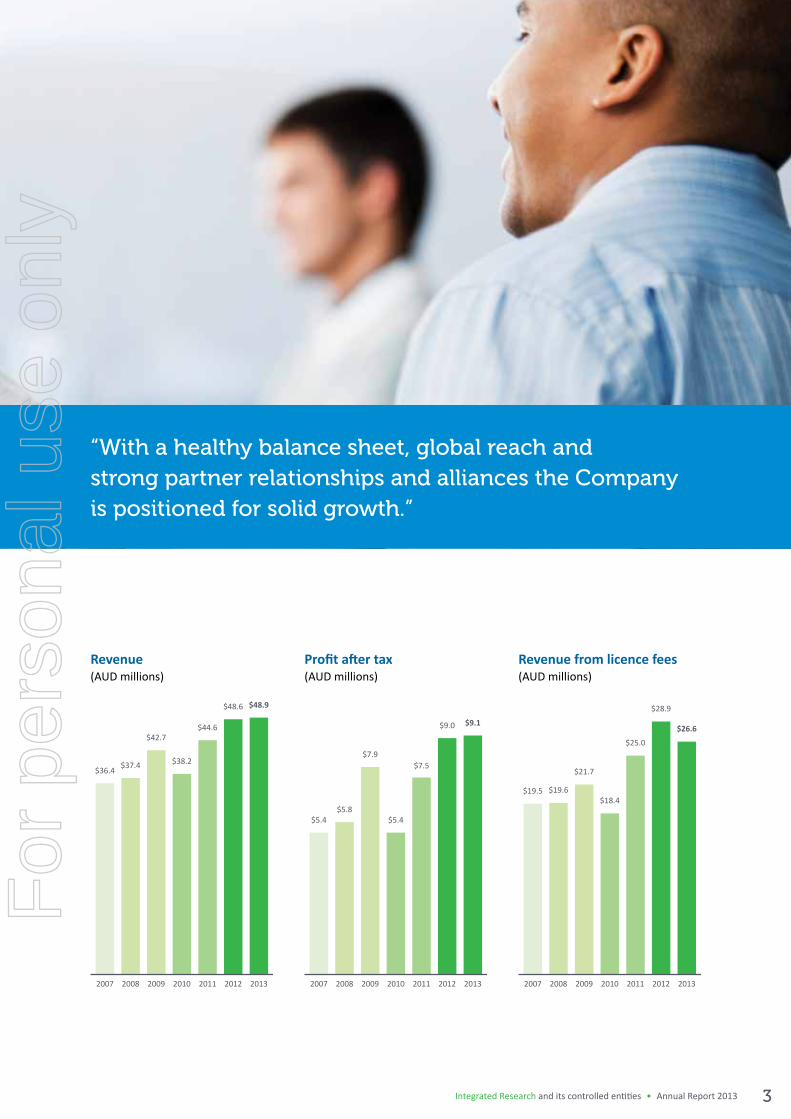
2007 2008 2009 2010 2011 2012 2013
$36.4 $37.4
$42.7
$38.2
$44.6
$48.6 $48.9
2007 2008 2009 2010 2011 2012 2013
$5.4$5.8
$7.9
$5.4
$7.5
$9.0 $9.1
2007 2008 2009 2010 2011 2012 2013
$19.5 $19.6
$21.7
$18.4
$25.0
$28.9
$26.6
Revenue(AUD millions)
Profit after tax(AUD millions)
Revenue from licence fees(AUD millions)
“With a healthy balance sheet, global reach and strong partner relationships and alliances the Company is positioned for solid growth.”
3Integrated Research and its controlled entities • Annual Report 2013
For
per
sona
l use
onl
y

Letter from the Chairman
Dear fellow shareholders,
I’m pleased to report another solid performance by Integrated Research for the financial year to June 2013. The Company achieved profit after tax of $9.1 million on revenue of $48.9 million. The Company continues to produce world-class products that manage the performance of its customers’ Unified Communications, Payments and IT infrastructure.
The Company achieved record second half profit of $6.3 million representing growth of 16% when compared to the equivalent prior period. This turnaround reversed the first half decline
in profit to produce a marginally improved profit result measured against the 2012 financial year. Company revenues were up 1% to $48.9 million with recurring maintenance revenue up 8% to
$17.7 million on the back of a strong customer retention rate of 95%.
The Company’s Consulting services business grew for a fourth consecutive year, with revenue increasing 35% to $4.5 million as customers increasingly look to extend their Prognosis solutions to provide greater insight into their Unified Communications and Infrastructure environments. Licence sales were down 8% to $26.6 million as a consequence of Avaya’s re-evaluation of their partner program. This was successfully
Letter from the Chairman
Inte
grat
ed R
esea
rch
and
its c
ontr
olle
d en
tities
• A
nnua
l Rep
ort 2
013
4
For
per
sona
l use
onl
y

Directors and Senior Managem
entDirectors’ Report
Remuneration Report
Corporate Governance Statement
Financial Statements
Independent Audit ReportLetter from
the Chairman
“The Company’s pipeline is strong and the fundamentals of its key markets are sound as it continues to expand the scope of its markets by creating quality products that embrace change and market direction.”
concluded in March 2013 with Avaya selecting Prognosis for Unified Communications (UC) for inclusion into the Avaya DevConnect Select Product Program. This program gives Avaya clients direct access to Prognosis through the Avaya price book thereby lowering overheads, expanding reach and reducing the time to purchase. Subsequent to this, Integrated Research was selected as the 2013 Avaya DevConnect Technology Partner of the Year, the only Company to be awarded this title.
The high margin Infrastructure product line (including HP NonStop) remained steady during the year with revenue of $19.6 million. Revenue from the Payments product line was down by 7% when compared to the prior year to $3.0 million because of the progression from a direct to an indirect sales model. Both the Company and ACI are working closely together to increase Prognosis sales through the ACI channel with additional resources and focus.
The Americas had a solid year with revenue up 6% compared to the prior year with nearly half of the revenue being sourced from Unified Communications. The Company’s European and Asia Pacific regions were disappointing, with revenue down 4% and 14% respectively.
The Company’s pipeline remains strong and the fundamentals of its key markets are sound as it continues to expand the scope of its markets by creating quality products that embrace change and market direction. In this way the Company can deliver profitable growth from existing markets, and create innovative products to open new ones.
Cashflow from operations increased by 19% over the preceding year to $17.5 million enabling the Company to maintain a strong balance sheet and facilitate consistency in dividend payments. The Board is pleased to announce a final dividend of 3.0 cents per share, franked to 40 per cent, bringing the total dividend for the year to 5.0 cents per share franked at 36%. This compares with total dividends of 5.0 cents per share, of which 58% was franked, for the prior financial year.
During the year we saw some changes on the Board - John Brown retired after five and a half years in December 2012. Mr. Brown has been a Director of Integrated Research Limited since July 2007 and was appointed Chair of the Audit and Risk Management Committee. Mr. Brown’s contribution to Integrated Research, including his active participation in Board Committees has been greatly appreciated.
In February 2013 the Company welcomed Mr. Garry Dinnie to the Board and looks forward to benefiting from his 25 years specialising in audit, advisory and IT services experience and valuable input to Integrated Research’s future prosperity.
I would especially like to thank you, our valued shareholders, for your continued support.
Steve Killelea Chairman
5Integrated Research and its controlled entities • Annual Report 2013
For
per
sona
l use
onl
y

IR S
tart
ed
1988 1994 1995 1997 1998 1999 2000 2001 2003
RESTON, VA
DENVER, CO
Founded in 1988, Integrated Research is an Australian company providing performance monitoring and diagnostics software solutions for business-critical computing environments worldwide. Headquartered in Sydney, the Company has over 200 employees with offices in the US, UK, Germany, Singapore and Australia serving over 1,000 customers in more than 50 countries.
Who we are
2013 marks IR’s 25th anniversary of delivering award-winning products.
What we do
Prognosis provides availability and performance management, diagnostics and insight for business-critical systems. These include Unified Communications, Payments and IT infrastructure.
These core systems must be managed in real time and our customers rely on Prognosis to ensure high systems availability and performance.
1988 � Steve Killelea founds IR in Sydney, Australia.
� < 10 employees. � 3 R&D Staff.
1994 � Denver, CO. US office opens.
� 6 R&D Staff.
1995 � Prognosis version 5 released.
� First Windows Graphical User Interface.
1997 � UK office opens. � 10 R&D Staff. � 378,644 lines of software code.
1998 � IR wins IT exporter of the year award.
1999 � Prognosis version 7 released.
� First Microsoft Windows version.
2000 � IR listed IRI:ASX. � Prognosis in > 40 countries.
� 6,000 HP NonStop licences.
� Prognosis IPT Manager launched for Cisco.
� Windows/Unix/Linux support launched.
� 31 products. � 90% of IR’s 300 customers are global.
� 85 employees.
2001 � IR wins Consensus software award.
� 40 R&D Staff.
2003 � IR wins ASOCIO ICT Minister’s iAward.
� IR wins Consensus software award.
UK
GERMANY
Inte
grat
ed R
esea
rch
and
its c
ontr
olle
d en
tities
• A
nnua
l Rep
ort 2
013
6
For
per
sona
l use
onl
y

2004 2005 2006 2009 2010 2011 2012 2013
As we celebrate 25 years of business we continue to grow our customer base, launch new products and services and add more talented people to our team.
Why we succeed
Prognosis increases operational maturity, minimises outages, optimises technology and ensures user satisfaction. Our customers include 9 out of 10 US banks, 5 of the world’s largest companies, 4 of the top 8 stock exchanges, 8 out of 10 telcos and 4 out of 5 oil and gas companies.
Why customers buy
IR the company behind Prognosis is profitable and debt-free and Prognosis is real-time, scalable, extensible and flexible. We deliver the competitive advantage of Prognosis through world-class R&D capabilities to extend support for an increasing number of business-critical applications and platforms.
2004 � East Coast US office opens.
� ATM Incident Manager launched.
� Web applications management launched.
� 50 R&D Staff.2005 � Prognosis in > 50 countries.
� Steve Killelea appointed Chairman.
2005 � Prognosis in > 50 countries.
� Steve Killelea appointed Chairman.
2006 � German office opens. � IR wins Consensus software award.
� Multiple VoIP vendor support launched.
� 130 employees.
2009 � Agile software development introduced.
� Prognosis shipped with every Avaya PBX.
2010 � Premier’s NSW Export Award - Highly commended.
� Prognosis for UC launched.
� Microsoft Lync support launched.
� ACI distribution agreement signed.
2011 � IR wins NSW State iAward for Sustainability and Green IT
2012 � First Microsoft Qualified Lync application.
� Finalist Premier’s NSW Export Award - Highly commended.
2013 � Prognosis in > 50 countries.
� IR is Avaya DevConnect Technology Partner of the Year.
� Finalist Enterprise Connect Orlando “Best of Enterprise Connect” Award.
� 1,000 customers. � 200 employees (Global). � 64 R&D Staff. � 4,000,000 lines of software code.
ASIA PACIFIC
SINGAPORE
7Integrated Research and its controlled entities • Annual Report 2013
For
per
sona
l use
onl
y

Integrated Research (IR) is the creator of Prognosis performance management software. Prognosis is sold and supported through IR offices in the USA, UK, Germany, Singapore and Australia and via our international network of partnerships, strategic alliances, resellers, systems integrators and service providers.
Some of the world’s best known brands, government departments, finance, payments and ICT service providers rely on Prognosis for high-availability, performance diagnostics and insight for their business-critical systems.
Integrated Research: Providing Business Insight™
Our customersLocated in more than 50 countries, IR’s more than 1,000 customers feature prominently in the Fortune 500 and Global 1000 and include:
$
9 out of 10 US Banks
4 out of 5 Oil and Gas Companies
5 of the World’s Largest
Companies
8 out of 10 Telecommunications
Companies
4 out of the 8 Top Stock ExchangesIn
tegr
ated
Res
earc
h an
d its
con
trol
led
entiti
es •
Ann
ual R
epor
t 201
3
8
For
per
sona
l use
onl
y

Some of the world’s
best known brands,
government departments,
finance, payments and
ICT service providers
rely on Prognosis
for high‑availability,
performance diagnostics
and insight for their
business‑critical systems.
Enterprises and service providers alike incorporate Prognosis real time performance monitoring as a key component of their comprehensive portfolio of products and services.
As well as building great software, our software engineers have been working with our customers to ensure we’re doing everything we can to deliver valuable products and keep customer satisfaction as high as possible.
Happy customers are everyone’s responsibility. Every day.
Most importantly, and not surprisingly, as customers increase reliance on Prognosis, the harder it is to replace. IR Consulting services can help them get the very most out of their investment by customising it to fit their needs exactly.
This leads to greater retention, happier customers and more revenue over the longer term.
Our peopleWe know the importance of making employees feel connected to the organisation’s goals, and aligned with the business through performance management and career development. IR employees include technical champions, inspirational leaders, customer advocates and are the instrumental forces behind our new products.
In FY2013 we invested in programmes to better understand our customers’ evolving business needs. This enables IR employees to design, develop and sell premium Prognosis solutions that meet customers’ needs today and into the future.
To help manage delivery and improve global resource management, we’ve created a Project Management Office that provides IR management and the consulting teams with a consolidated view of our projects.
9Integrated Research and its controlled entities • Annual Report 2013
For
per
sona
l use
onl
y
Our products
Prognosis for Payments & infrastructure
Worldwide Payments market growth fuelled by an increasing number of smart devices, micropayments and multiple-channel payment sources creates a strong demand for performance management.
Additionally cross-border transactions across developing economies require increased governance and regulation, making transaction monitoring of payments systems infrastructure critical.
Prognosis is ideally positioned to provide payments systems providers with highly scalable transaction insight monitoring and management. This enables them to manage performance and availability in retail and wholesale environments, and quickly identify and act to resolve problems as they arise.
Prognosis for Unified Communications
Solving UC management dilemmas is not something new to IR, with more than a decade’s ‘out-of the-box’ UC domain knowledge. Prognosis customers have end-to-end visibility of their UC environments and can effectively manage multi-vendor, single vendor and hybrid legacy environments through a single ‘pane of glass’.
Prognosis multi-vendor capabilities enable organisations to manage voice quality, UC applications and devices across Avaya, Microsoft Lync, Cisco and others, ensuring improved call quality, service reliability and proactive issue resolution.
Prognosis 10
While increasing our customers’ use of Prognosis is built on services and training, it’s also about usability. The more intuitive a product, the more it gets used.
In 2013 IR announced Prognosis 10 with a completely new intuitive user interface. It’s visually rich, easy to navigate, fast and accessible on any mobile device. Combined with new analytics and reporting, technical and business users can extract all the information they need to get value out of their environments.
Our alliances and partners
Integrated Research has partnered with leading enterprise software and solution providers to deliver solutions tailored to our customers’ needs, and develop innovative performance management solutions for current and future technologies.
We formed a strategic alliance with ACI over three years ago to provide an exclusive, joint offering for payment service monitoring.
Since 2009 IR has been in partnership with Avaya and in 2013 was strategically chosen from among hundreds of compliance-tested solutions for inclusion in the Avaya DevConnect SPP as it expands into Europe following its success in North America.
To round off IR’s successful partnership with Avaya this year, we were chosen by Avaya as 2013 DevConnect Technology Partner of the Year. This Avaya award recognises DevConnect Technology Partners for innovation and excellence.
IR also continues its relationship with Cisco as a registered developer, which enables us to have our software tested for interoperability with Cisco products.
IR continues its valued partnership with Stratus Technologies offering customers the continuous availability of Stratus® ftServer® systems, and the breadth, depth and scalability of Prognosis proactive monitoring, management and troubleshooting.
IR is an HP AllianceONE Partner and has worked closely with HP for 25 years delivering Prognosis solutions for HP NonStop and HP Integrity NonStop server technology. IR was the first HP NonStop Alliance Partner to be certified ‘Converged Infrastructure Ready’ validating that Prognosis supports modern standards and can be used in converged infrastructure environments.
Integrated Research is a long‑standing member of the VMware Technology Alliance Program and continues to build and enhance vSphere™ monitoring capabilities.
Suncorp Group’s Scott Fowler ‑
Team leader, Payments said
“Suncorp services more than
one million personal, agribusiness,
small business and commercial
banking customers.
“We use Prognosis to gain
insight into transaction volumes
and availability as well as deep
insight into the performance of
specific products. In this way we can
optimise performance, and track
usage and quality to create a great
experience for our customers.”
Inte
grat
ed R
esea
rch
and
its c
ontr
olle
d en
tities
• A
nnua
l Rep
ort 2
013
10
For
per
sona
l use
onl
y

Our achievements
Avaya DevConnect Technology Partner of the Year 2013
This Avaya award recognises DevConnect Technology Partners who deliver innovation and excellence.
“The DevConnect Technology Partner of the Year award formally recognises Integrated Research for embracing all aspects of The Power of We™,” said Eric Rossman, Vice President Developer Relations, Avaya.
“By working together, we help our mutual customers succeed in their operations. Prognosis software complements the Avaya portfolio and increases customer satisfaction by reducing UC and contact center complexity. The Integrated Research team has demonstrated exceptional commitments to Avaya customers and the Avaya DevConnect partnership.”
First Microsoft Qualified Lync application for health management and QoE
Microsoft selected Prognosis as the first application to be approved in the Quality of Experience category. Prognosis provides enhanced analysis and reporting capabilities for core Lync real‑time functionality like voice and video.
‘Highly Commended’ 2012 Premier’s NSW Export Awards
IR was one of four finalists in the 2012 Premier’s NSW Export Awards in Sydney. The awards recognise and celebrate companies that are taking Australian products and services to the world. IR continues to invest in NSW through its world class software development capability and graduate recruitment program.
Finalist Enterprise Connect Orlando’s ‘Best of Enterprise Connect’ Award
Enterprise Connect is the leading conference and exhibition for enterprise IP telephony, converged networks and Unified Communications in North America.
IR was announced as one of six finalists for the ‘Best of Enterprise Connect’ Award. The award jury included industry experts and veterans, and honours exhibitors who lead the industry and continue to present the latest in technological advancements.
11Integrated Research and its controlled entities • Annual Report 2013
For
per
sona
l use
onl
y

Review of operations and activitiesPrincipal activities
Integrated Research Limited’s principal activities are the design, development, implementation and sale of systems and applications management computer software for business-critical computing infrastructure and Unified Communications and Payments networks.
Group overviewIntegrated Research has a twenty-five year heritage of providing performance monitoring and diagnostics software solutions for business-critical computing environments.
Since its establishment in 1988, the Company has provided its core Prognosis products to a cross section of large organisations requiring high levels of computing performance and reliability.
The Prognosis product range is an integrated suite of monitoring and management software, designed to give an organisation’s technical personnel operational insight into their HP NonStop, IT infrastructure, Unified Communications (UC), and Payments environments and the business applications that run on these platforms.
Integrated Research has developed its Prognosis products around a fault-tolerant, highly distributed software architecture, designed to achieve high levels of functionality, scalability and reliability with a low total cost of ownership.
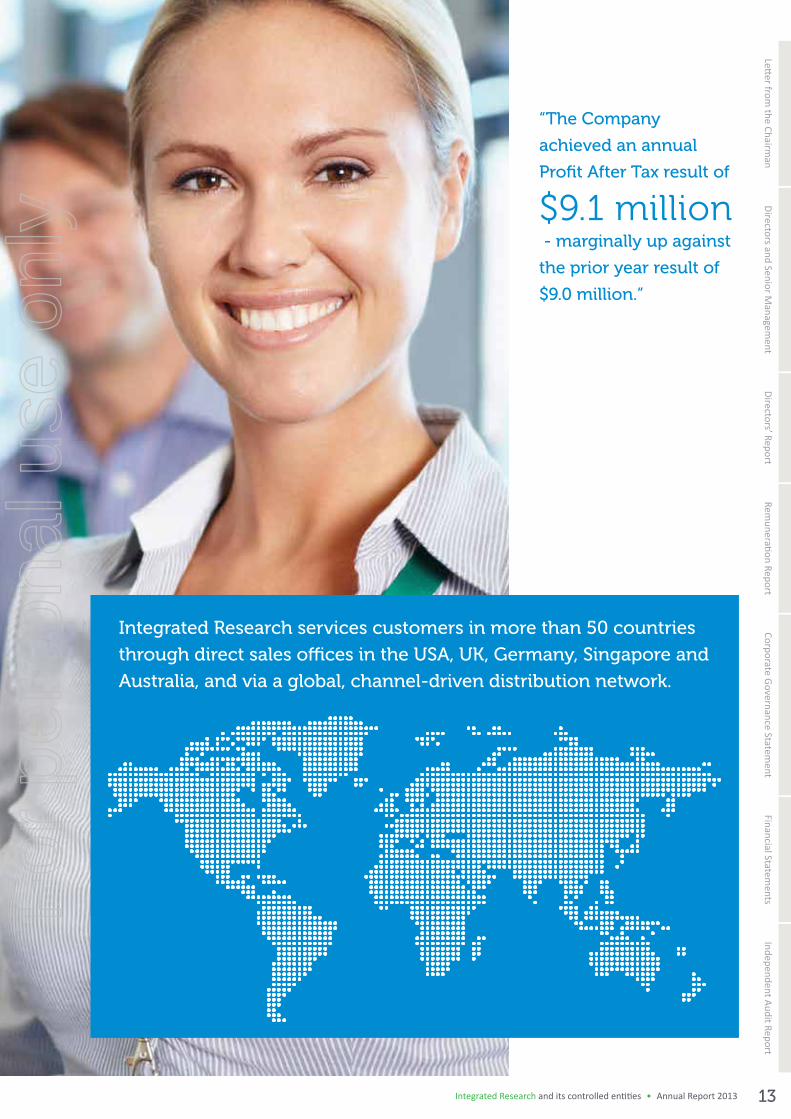
Integrated Research services customers in more than 50 countries through direct sales offices in the USA, UK, Germany, Singapore and Australia, and via a global, channel-driven distribution network. Integrated Research’s customer base consists of many of the world’s largest organisations and includes major stock exchanges, banks, credit card companies, telecommunications and computer companies and hospitals.
The Company generates its revenue from licence fees, recurring maintenance and consulting services. Revenue from the sale of licences where there is no post-delivery obligations is recognised in profit at the date of the delivery of the licence key. Revenue from maintenance contracts is recognised rateably over the service agreement, which is typically one year. Revenue from consulting services is recognised over the period the services are delivered.
Review of operations and activitiesIn
tegr
ated
Res
earc
h an
d its
con
trol
led
entiti
es •
Ann
ual R
epor
t 201
3
12
For
per
sona
l use
onl
y
Letter from the Chairm
anDirectors and Senior M
anagement
Directors’ ReportRem
uneration ReportCorporate Governance Statem
entFinancial Statem
entsIndependent Audit Report
“The Company
achieved an annual
Profit After Tax result of
$9.1 million
‑ marginally up against
the prior year result of
$9.0 million.”
Integrated Research services customers in more than 50 countries
through direct sales offices in the USA, UK, Germany, Singapore and
Australia, and via a global, channel‑driven distribution network.
13Integrated Research and its controlled entities • Annual Report 2013
For
per
sona
l use
onl
y
Review of operations and activities
Review and results of operations
Overview
The Company achieved an annual Profit After Tax result of $9.1 million - marginally up against the prior year result of $9.0 million. The Company’s overall financial performance was flat but contrasted by two distinct halves. Profitability in the first half was down 23% as a result of the delay in key service provider licence contracts. The second half was much stronger with profit growing 16% in this period as the key licence contracts were completed.
Over 95% of the Company’s revenues are derived outside of Australia. The Australian dollar remained high against other currencies for most of the year with the exception of June. Using prior year exchange rates, the Company’s results would not be materially different from the reported results. The Company should benefit from a lower exchange rate in 2014, although this will be partially offset by forward exchange contracts in place at 30 June 2013 as disclosed in Note 20.
Revenue
Revenue for the year was $48.9 million, an increase of 1% over 2012. Licence fees decreased by 8% to $26.6 million due to a poor first half. Notwithstanding the decrease in licence sales, maintenance revenues grew 8% over the previous corresponding year due in part to a strong retention rate of 95% and also due to the annualisation of growth from the installed base of Unified Communications customers. Revenue from Consulting services grew by 35% to $4.5 million as a result of a strong backlog at the commencement of the year and improved utilisation of consulting resources.
The following table presents Company revenues for each of the relevant product groups:
In thousands of AUD 2013 2012 % Change
Unified Communications 21,760 21,448 1%
Infrastructure 19,566 20,558 (5%)
Payments 3,023 3,261 (7%)
Consulting services 4,510 3,341 35%
Total revenue 48,859 48,608 1%
Unified Communications (UC) revenue rose 1% over the previous year as a consequence of lower licence sales offset by an increase in maintenance revenue with strong customer retention and growth in the installer base. Licence sales were down as a consequence of Avaya’s re-evaluation of their partner program. This was successfully concluded in March 2013 with Avaya selecting Prognosis for UC for inclusion into the Avaya DevConnect Select Product Program. This program gives Avaya clients direct access to Prognosis through the Avaya price book.
Infrastructure revenues declined by 5% over the previous year as a consequence of customers continuing to move toward new and evolving technological platforms that are not as reliant on fault tolerant high end systems such as HP NonStop.
Payments revenue was down 7% over the previous year because of the progression from a direct to an indirect sales model. Both the Company and ACI are working closely together to increase Prognosis sales through the ACI channel with additional resources and focus.
Consulting services showed strong growth for a fourth year in a row, with revenue increasing 35% to $4.5 million as customers increasingly look to extend their Prognosis solution to provide greater insight into their Unified Communications and Infrastructure environments.
Inte
grat
ed R
esea
rch
and
its c
ontr
olle
d en
tities
• A
nnua
l Rep
ort 2
013
14
For
per
sona
l use
onl
y

Letter from the Chairm
anDirectors and Senior M
anagement
Directors’ ReportRem
uneration ReportCorporate Governance Statem
entFinancial Statem
entsIndependent Audit Report
The following table presents Company revenues for each of the relevant geographic segments in underlying natural currencies:
2013 2012 % Change
Americas (USD’000) 35,247 33,137 6%
Europe (£’000) 4,519 4,687 (4%)
Asia Pacific (A$’000) 7,496 8,668 (14%)
The Americas represents 70% of overall Company revenue. The Americas grew by 6% over the previous year with nearly half of the revenue being sourced from Unified Communications. The region benefitted from a strong customer retention rate of 97% and higher revenue from consulting services. Licence fees were down at the half year but recovered in the second half.
Europe revenues were down 4% over the prior year as a result of a large licence sale deal slipping at the end of the financial year. Recurring maintenance revenue is reasonably stable and the consulting services practice continues to grow.
Asia Pacific revenue was down 14% to $7.5 million across each of the product lines. Investments in pipeline development in FY14 are being made to turnaround the trend. Many of the licence contracts are denominated in US dollars and consequentially should benefit from a lower Australian dollar going forward.
Expenditure
The Company continued to focus on expanding its capabilities and improving productivity. The number of staff at the end of the current year was 200 (2012: 186). Total expenses were $38.3 million, up 2% against the prior year with a higher investment in research and development. The following table presents the Company’s cost base compared to the preceding year:
In thousands of AUD 2013 2012
Research and development expenses 10,777 10,134
Sales, consulting and marketing expenses 23,279 23,004
General and administration expenses 4,280 4,278
Total expenses 38,336 37,416
Research and development expenditure of $10.8 million was 22% of total revenue and slightly higher than historical averages. The major development initiative that occurred during the 2013 financial year was on Prognosis 10 which is set to be released during the first half of the 2014 financial year. The new release will deliver a powerful web-based, mobile user experience, intelligent alerting, and business insight.
Net research and development expenses are represented as follows:
In thousands of AUD 2013 2012
Gross research and development spending 12,051 10,215
Capitalisation of development expenses (7,880) (6,730)
Amortisation of capitalised expenses 6,606 6,649
Net research and development expenses 10,777 10,134
Capitalisation of development costs are higher compared to the prior year due to the additional investment in Prognosis 10. Amortisation levels are flat compared to the preceding year since the new development work is yet to be commercialised.
Expenses in sales, marketing and administration remained relatively flat compared to the preceding year.
15Integrated Research and its controlled entities • Annual Report 2013
For
per
sona
l use
onl
y
Review of operations and activities
Shareholder returnsReturns to shareholders through the payment of partly franked dividends:
2013 2012 2011
Net profit ($’000) $9,078 $9,035 $7,465
Basic EPS 5.40¢ 5.41¢ 4.47¢
Dividends per share 5.0¢ 5.0¢ 4.0¢
Return on equity 30% 31% 27%
Financial positionThe following table presents key balance sheet items:
In thousands of AUD 2013 2012
Assets:
Cash and cash equivalents (current) 14,827 12,038
Trade and other receivables (current and non-current) 23,564 21,381
Intangible assets (non-current) 15,040 13,849
Liabilities:
Deferred revenue (current and non-current) 14,729 11,885
Equity 30,010 29,233
The Company’s balance sheet remains in a strong position with $14.8 million in cash and cash equivalents as a result of continuing strong cashflow from operations. Cashflow from operations increased by 19% over the preceding year to $17.5 million.
Trade and other receivables increased by 10% over the preceding year due to two main factors. Firstly, the Australian dollar declined during the year resulting in a higher translated receivables balance (especially for receivables denominated in US dollars). Secondly, an increase in deferred payment terms with key managed service providers who have a need to match payments with underlying cashflows from their customers.
The increase in intangible assets is a result of the capitalisation of development costs primarily on Prognosis 10 as referenced in preceding paragraphs.
The Balance Sheet presented at page 46 together with the accompanying notes provides further details.
Inte
grat
ed R
esea
rch
and
its c
ontr
olle
d en
tities
• A
nnua
l Rep
ort 2
013
16
For
per
sona
l use
onl
y

Letter from the Chairm
anDirectors and Senior M
anagement
Directors’ ReportRem
uneration ReportCorporate Governance Statem
entFinancial Statem
entsIndependent Audit Report
The Company provides performance management solutions based on its Prognosis software for business-critical computing environments.
Prognosis derives its competitive advantage from its unique design which enables real time monitoring, is extremely scalable, highly flexible and provides very deep visibility into the systems and applications that it manages. Prognosis is ideally suited to complex, high transaction and high traffic environments.
Competition exists in each of the markets in various forms. Firstly, some of the large telephony and payment vendors provide their own performance management software, although this is generally inferior to the capability of Prognosis and does not solve the problem where heterogeneous environments exist. Secondly, some of the large solution software vendors also provide performance management capabilities, but this is typically not their core specialisation. Lastly, the Company from time to time competes with smaller, start-up niche vendors. The Company remains focussed on sustaining its competitive advantage through continuing innovation that comes from its research and development program.
Through deep forensic analysis into the root cause of problems and extensive reporting on service levels, Prognosis enables proactive and rapid resolution of issues, and capacity and operational planning.
This provides insight into potential issues before they become business-critical. Prognosis helps users improve their operational maturity by proactively minimising expensive outages, improving user satisfaction and optimising IT operations and resources.
The Company’s growth strategy is to create, sell and support Prognosis‑based products and services that deliver profitable growth from existing markets and customers, as well as creating new products that open new markets.
The Company currently focuses on three core markets: Infrastructure, Unified Communications and Payments.
The Infrastructure market for Integrated Research includes users of high-end computing systems such as the HP NonStop platform for financial, telecommunication, trading, manufacturing and other high-volume, high-value transaction environments. NonStop is an important part of HP’s server strategy
and remains at the operational core of many of the world’s largest companies. The Company continues to invest in Prognosis for Nonstop to be aligned with HP and its customers. Prognosis for Distributed Systems (Windows, Unix and Linux) is mostly sold alongside the Company’s NonStop products as customers seek a common monitoring interface for all platforms, or convert applications from one platform to another.
The Unified Communications (UC) segment includes users of IP Telephony and Unified Communications applications such as video, messaging, mobility and presence. The Company anticipates growth in this segment through the ongoing shipment of IP phones and endpoints as well as the increasing value per endpoint through the use of UC applications. UC networks are becoming more pervasive, more critical and more complex and as such they require effective performance management and Prognosis is strongly positioned to benefit from this need. The Company will continue to invest in R&D to expand the suite of Prognosis for UC products to cover increased platforms, vendors and applications, and by doing so increase the Company’s addressable market and revenue potential.
The Company has expanded its suite of Payments products by adding new products for additional platforms, vendors and applications, including fraud management and wholesale money transfer applications. This expands the Company’s addressable market in the Payments segment and increases revenue potential. The Company will maintain this strategy in the Payments market. Our strategic alliance with ACI, the world’s largest payments software vendor, has delivered revenue in FY2013 and continues to be an important channel to market for the Company.
Consulting services provide Prognosis customers with implementation, customisation and training services to ensure that they get the most out of their investment in Prognosis. Consulting services also help IR develop unique and repeatable solutions that extend the use and value of Prognosis. Consulting services achieved profitability in FY2013 and the Company will continue to invest in people and processes to grow Consulting revenue and margin.
The Company continues to invest in its R&D capability through the addition of resources and its use of the Agile development methodology which has improved the rate and quality of software production for the Company.
Outlook and Strategy for 2014
17Integrated Research and its controlled entities • Annual Report 2013
For
per
sona
l use
onl
y

Directors and Senior Management
DirectorsThe Directors of the Company at any time during or since the end of the financial year are listed below:
Steve KilleleaAM
Non‑Executive Director and Chairman
Steve founded Integrated Research in August 1988 and held the position of Managing Director and Chief Executive Officer until retiring from his executive position in November 2004. He was appointed as a Non-Executive Director in November 2004 and elected Chairman in July 2005. Steve is also Chairman of the Institute for Economics and Peace and The Charitable Foundation and for activities involved with these he has received a number of international awards. He is also active in the financial community with investments in many high tech companies. Steve’s current term will expire no later than the close of the 2015 Annual General Meeting.
Listed company directorships held in the past three years: None.
Age: 64 years.
“The Company
continued to focus
on expanding its
capabilities and
improving productivity.
The number of staff at
the end of the current
year was 200”
Inte
grat
ed R
esea
rch
and
its c
ontr
olle
d en
tities
• A
nnua
l Rep
ort 2
013
18
For
per
sona
l use
onl
y
Letter from the Chairm
anDirectors’ Report
Remuneration Report
Corporate Governance Statement
Financial Statements
Independent Audit ReportDirectors and Senior M
anagement
Mark BrayanMBA
Managing Director and Chief Executive Officer
Mark Brayan joined Integrated Research in September 2007 and is responsible for the overall strategy and leadership of the Company. Mark has over twenty years experience in the software industry. Prior to joining Integrated Research he was COO of outsourcer Talent2 and previously CEO of the listed software company Concept Systems before its merger with Talent2. Mark has a strong understanding of the systems management market through his time with BMC Software. As Managing Director, Mark is not required to seek re-election to the Board.
Listed company directorships held in the past three years: None.
Age: 49 years.
Alan BaxterBSc, Dip Ed
Independent Non‑Executive Director
Alan was appointed as a Director in June 2009. Alan has over forty years experience in Information Technology covering a broad range of the industry’s activities. These include many years in a variety of roles with IBM Australia, CEO of DMR Consulting in Australia and COO of Fujitsu Consulting’s global operations from London. He was non-executive Chairman of Fujitsu Australia & New Zealand, a director of Mincom Ltd, non-executive Chairman of Konekt Limited and also of Innogence Limited. He is a non-executive director of CPT Global, a publicly listed technology consulting company. Alan’s current term will expire no later than the close of the 2015 Annual General Meeting.
Listed company directorships held in the past three years other than listed above: None.
Age: 68 years.
Kate CostelloLLB, FAICD
Independent Non‑Executive Director
Kate was appointed as a Director in August 2005. She is a lawyer and has over twenty years experience in corporate governance and strategy development. She is also a Director of Governance Matters Pty Ltd, LBT Innovations Ltd, and a number of other private companies. Kate’s current term will expire no later than the close of the 2014 Annual General Meeting.
Listed company directorships held in the past three years other than listed above: None.
Age: 60 years.
Directors continued
19Integrated Research and its controlled entities • Annual Report 2013
For
per
sona
l use
onl
y
Directors and Senior Management
Garry DinnieBCom, FCA, FAICD, FAIM, MIIA(Aust)
Independent Non‑Executive Director
Garry was appointed a Director in February 2013. He is a Director & Chair of the Audit Committee of CareFlight Limited, Inabox Group Limited and a Director of a number of private companies. He is also the Chair or member of a number of Audit & Risk Committees of NSW public sector and private sector entities. He was previously a partner with Ernst & Young for 25 years specialising in audit, advisory and IT services. Garry’s current term will expire no later than the close of the 2013 Annual General Meeting.
Listed company directorships held in the past three years other than listed above: None.
Age: 61 years.
Peter LloydNon‑Executive Director
Peter was appointed a Director in July 2010. He has 39 years experience in computing technology, having worked for both computer hardware and software solution providers. For the past 27 years Peter has been specifically involved in the provision of payments solutions for banks and financial institutions. He is also a Director of The Grayrock Group Pty Ltd and Limehouse Creative Pty Ltd. Peter’s current term will expire no later than the close of the 2013 Annual General meeting.
Listed companies directorships held in the past three years: None.
Age: 59 years.
Clyde McConaghyB.Bus., MBA, MAICD, MIOD ‑ UK
Non‑Executive Director
Clyde was appointed a Director in December 2007. He has three decades of international strategic market development experience in the technology, online and media industries. Clyde was a Board director of WMRC Plc (now IHS Global Insight) on the London Stock Exchange and a director of the Economist Intelligence Unit in London. Clyde is Managing Director of Optima Boards, a Board advisory firm for companies and not-for-profit entities. Clyde’s current term will expire no later than the close of the 2014 Annual General Meeting.
Listed company directorships held in the past three years: None.
Age: 51 years.
Directors (cont.)
Inte
grat
ed R
esea
rch
and
its c
ontr
olle
d en
tities
• A
nnua
l Rep
ort 2
013
20
For
per
sona
l use
onl
y

Letter from the Chairm
anDirectors’ Report
Remuneration Report
Corporate Governance Statement
Financial Statements
Independent Audit ReportDirectors and Senior M
anagement
Company Secretary David PurdueBEc, MBA, Grad Dip CSP, FCA, FCIS, FCSA, GAICD
David was appointed Company Secretary in July 2012. David is also the Company’s Global Commercial Manager and is responsible for the Company’s global commercial business. Prior to this, David spent three years at Integrated Research’s Colorado office to manage the Americas finance operations. David is a Chartered Accountant and Chartered Secretary with over 25 years experience in both professional practice and industry.
Resigning Director and Retiring Secretary during the year
John Brown(resigned December 2012), B Com, FCA, MAICD
Independent Non‑Executive Director
John was a Director from July 2007 to December 2012. He was a partner with KPMG for over 26 years and since retiring in 2006 has been appointed to be the chair or member of the audit committee of a number of NSW and Federal public sector entities. At his retirement from the Company’s Board in December 2012, John was also a Director and Chair of the Audit Committee of Sydney Water Corporation, a member of the National Health and Research Medical Council and a Director of The Gift Of Life Foundation.
Listed companies directorships held in the past three years: None.
Age: 65 years.
David Leighton(retired July 2012), MBA, FCPA, ACIS
David was Company Secretary from October 2000 up to his retirement in July 2012.
21Integrated Research and its controlled entities • Annual Report 2013
For
per
sona
l use
onl
y
Directors and Senior Management
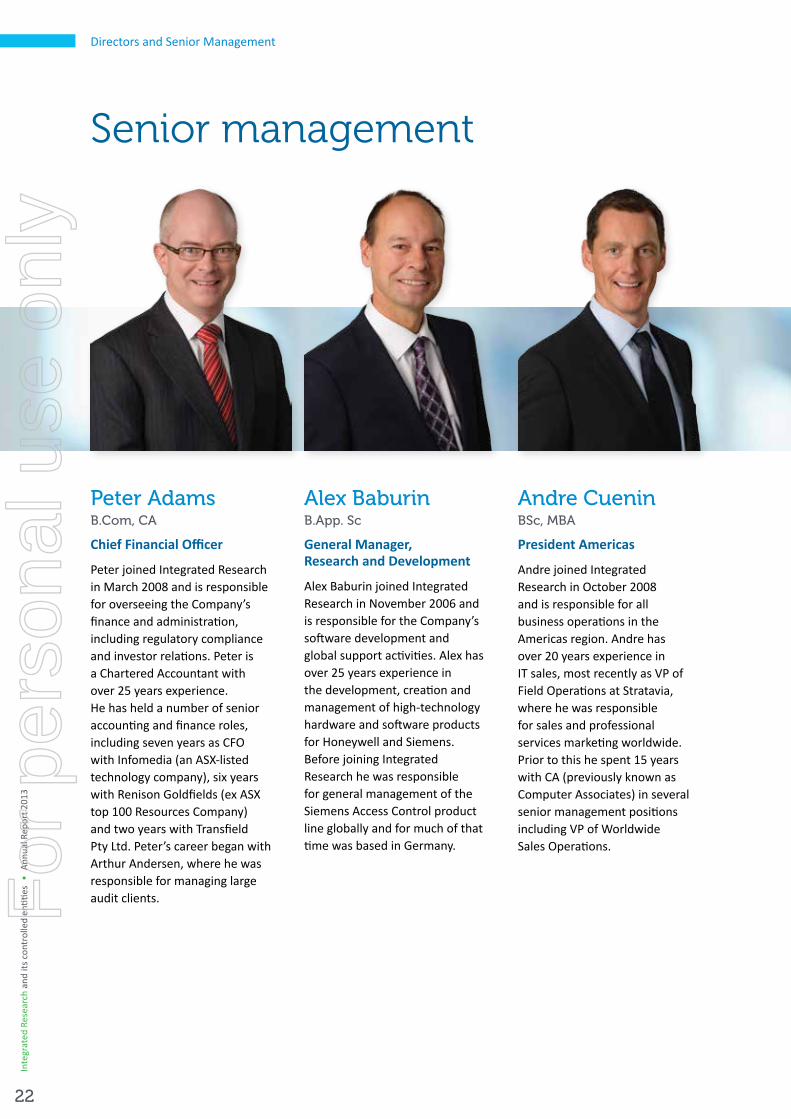
Peter AdamsB.Com, CA
Chief Financial Officer
Peter joined Integrated Research in March 2008 and is responsible for overseeing the Company’s finance and administration, including regulatory compliance and investor relations. Peter is a Chartered Accountant with over 25 years experience. He has held a number of senior accounting and finance roles, including seven years as CFO with Infomedia (an ASX-listed technology company), six years with Renison Goldfields (ex ASX top 100 Resources Company) and two years with Transfield Pty Ltd. Peter’s career began with Arthur Andersen, where he was responsible for managing large audit clients.
Alex BaburinB.App. Sc
General Manager, Research and Development
Alex Baburin joined Integrated Research in November 2006 and is responsible for the Company’s software development and global support activities. Alex has over 25 years experience in the development, creation and management of high-technology hardware and software products for Honeywell and Siemens. Before joining Integrated Research he was responsible for general management of the Siemens Access Control product line globally and for much of that time was based in Germany.
Andre CueninBSc, MBA
President Americas
Andre joined Integrated Research in October 2008 and is responsible for all business operations in the Americas region. Andre has over 20 years experience in IT sales, most recently as VP of Field Operations at Stratavia, where he was responsible for sales and professional services marketing worldwide. Prior to this he spent 15 years with CA (previously known as Computer Associates) in several senior management positions including VP of Worldwide Sales Operations.
Senior management
Inte
grat
ed R
esea
rch
and
its c
ontr
olle
d en
tities
• A
nnua
l Rep
ort 2
013
22
For
per
sona
l use
onl
y

Letter from the Chairm
anDirectors’ Report
Remuneration Report
Corporate Governance Statement
Financial Statements
Independent Audit ReportDirectors and Senior M
anagement
John DunneB.InfTech, MBT
General Manager, Products & Alliances
John is responsible for the Company’s global product strategy and alliances, ensuring the delivery of high-quality products aligned to customers’ strategic directions. He is an expert in systems monitoring and management with 15 years experience in the ICT industry, including seven years with Integrated Research. His current focus includes development of enterprise-class IP telephony management and reporting solutions to deliver business insight to global organisations and service providers.
Melanie NewmanGDip HR
General Manager, Human Resources
Melanie is responsible for the Human Resources function at Integrated Research which includes responsibility for aligning Strategic HR initiatives with the Business Strategy to support a high performance culture. Melanie has over 15 years HR Management experience mostly within global organisations in the Information Technology industry.
Jonathan SternB.Sc (Hons), M.Sc
Vice President Asia Pacific
Jonathan is responsible for Integrated Research’s business across Asia Pacific. He joined in April 2013 from Global Data Integration / Data Quality software vendor Informatica. During his time there, Jonathan was MD of the Australia / NZ business, doubling revenues over a 3 year period. Prior to that, Jonathan held a number of Executive positions at IBM Australia, including: GM WebSphere Software, GM Lotus Software and Channel Business Executive for Tivoli Software across Asia Pacific.
23Integrated Research and its controlled entities • Annual Report 2013
For
per
sona
l use
onl
y
Directors’ Report
Directors’ ReportThe Directors present their report together with the Financial Statements of Integrated Research Limited (“the consolidated entity”), being the Company and its controlled entities, for the year ended 30 June 2013 and the Auditor’s Report thereon.
ResultsThe net profit of the consolidated entity for the 12 months ended 30 June 2013 after income tax expense was $9.1 million.
DividendsDividends paid or declared by the Company since the end of the previous financial year were:
Cents per share
Total amount $’000
Date of payment
Final 2012 - Ordinary shares 70% franked 3.0 5,045 14 Sep 2012
Interim 2013 - Ordinary shares 30% franked 2.0 3,368 15 Mar 2013
Final 2013 - Ordinary shares 40% franked 3.0 5,053 13 Sep 2013
Principal activities and review of operationsDetail of the principal activities and review of operations of the consolidated entity, which forms part of this Directors’ Report, is set out on pages 12 to 17.
Events subsequent to reporting dateFor dividends declared after 30 June 2013 see Note 19 in the financial statements. The financial effect of dividends declared and paid after 30 June 2013 has not been brought to account in the financial statements for the year ended 30 June 2013 and will be recognised in subsequent financial statements.
No other transaction or event of a material or unusual nature has arisen in the interval between the end of the financial year and the date of this report which is likely, in the opinion of the Directors of the Company, to affect significantly the operations of the consolidated entity, the results of those operations, or the state of affairs of the consolidated entity, in future financial years.
Future developmentsLikely developments in the operations of the consolidated entity in future financial years and the expected results of those operations are referred to generally in the Review of Operations and Activities Report.
Further information on likely developments including expected results would in the Directors’ opinion, result in unreasonable prejudice to the Company and has therefore not been included in this Report.
Inte
grat
ed R
esea
rch
and
its c
ontr
olle
d en
tities
• A
nnua
l Rep
ort 2
013
24
For
per
sona
l use
onl
y
Letter from the Chairm
anDirectors and Senior M
anagement
Remuneration Report
Corporate Governance Statement
Financial Statements
Independent Audit ReportDirectors’ Report
Directors and Company SecretaryDetails of current Directors’ qualifications, experience, age and special responsibilities are set out on pages 18 to 20. Details of the Company Secretary and his qualifications are set out on page 21.
Officers who were previously partners of the audit firmNo officers of the Company were partners of the current audit firm during the financial year.
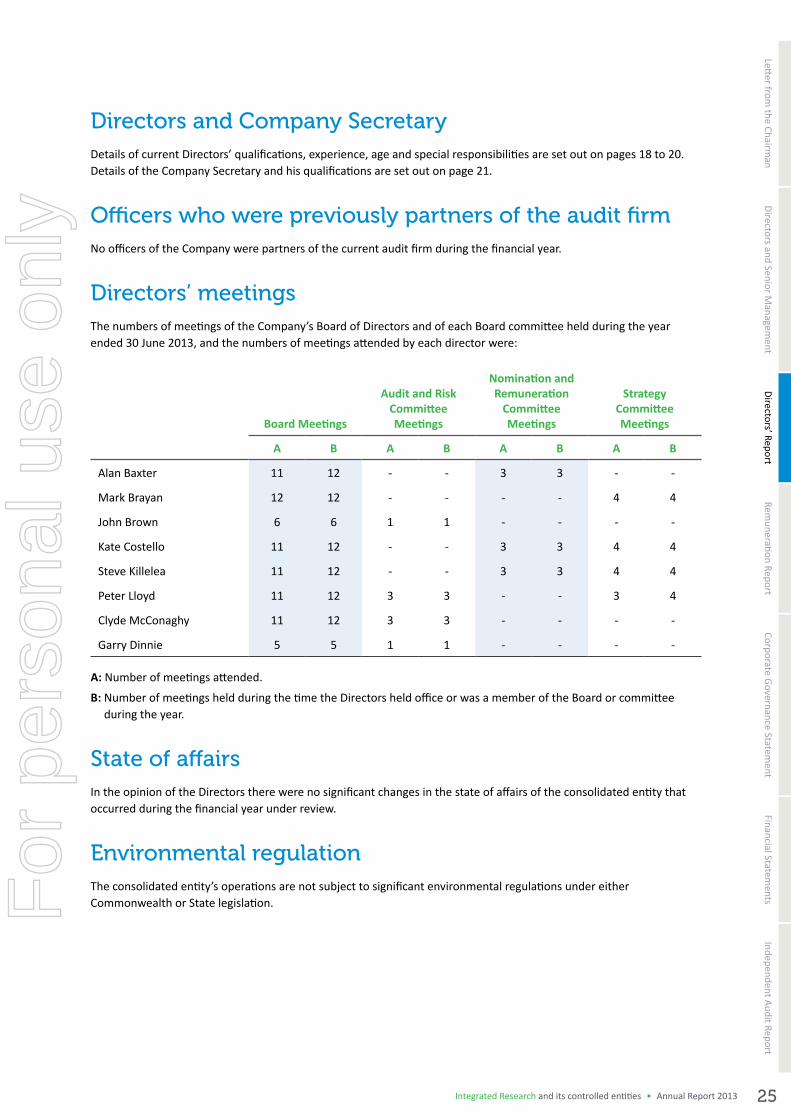
Directors’ meetingsThe numbers of meetings of the Company’s Board of Directors and of each Board committee held during the year ended 30 June 2013, and the numbers of meetings attended by each director were:
Board Meetings
Audit and Risk Committee Meetings
Nomination and Remuneration
Committee Meetings
Strategy Committee Meetings
A B A B A B A B
Alan Baxter 11 12 ‑ ‑ 3 3 ‑ ‑
Mark Brayan 12 12 ‑ ‑ ‑ ‑ 4 4
John Brown 6 6 1 1 ‑ ‑ ‑ ‑
Kate Costello 11 12 ‑ ‑ 3 3 4 4
Steve Killelea 11 12 ‑ ‑ 3 3 4 4
Peter Lloyd 11 12 3 3 ‑ ‑ 3 4
Clyde McConaghy 11 12 3 3 ‑ ‑ ‑ ‑
Garry Dinnie 5 5 1 1 ‑ ‑ ‑ ‑
A: Number of meetings attended.
B: Number of meetings held during the time the Directors held office or was a member of the Board or committee during the year.
State of affairsIn the opinion of the Directors there were no significant changes in the state of affairs of the consolidated entity that occurred during the financial year under review.
Environmental regulationThe consolidated entity’s operations are not subject to significant environmental regulations under either Commonwealth or State legislation.
25Integrated Research and its controlled entities • Annual Report 2013
For
per
sona
l use
onl
y

Directors’ Report
Directors’ interestsThe relevant interest of each director in the shares, options or performance rights over ordinary shares issued by the companies in the consolidated entity and other relevant bodies corporate, as notified by the Directors to the Australian Securities Exchange in accordance with S205G(1) of the Corporations Act 2001, at the date of this report is as follows:
Ordinary shares in Integrated Research OptionsPerformance
rights
Directly heldBeneficially
held TotalNumber of
optionsNumber of
rights
Alan Baxter ‑ 100,000 100,000 ‑ ‑
Mark Brayan ‑ 25,000 25,000 ‑ 340,000
Kate Costello ‑ 200,000 200,000 ‑ ‑
Garry Dinnie ‑ ‑ ‑ ‑ ‑
Steve Killelea 94,497,339 337,612 94,834,951 ‑ ‑
Clyde McConaghy ‑ ‑ ‑ ‑ ‑
Peter Lloyd ‑ ‑ ‑ ‑ ‑
Share options and performance rights
Options and performance rights granted to Directors and senior executives
During or since the end of the financial year, the Company granted performance rights for no consideration over unissued ordinary shares in Integrated Research Limited to the following named Directors and executive officers of the consolidated entity as part of their remuneration:
Number of performance
rights grantedPerformance
hurdle Exercise price Expiry date
Directors
Mark Brayan 170,000 Yes Nil Sep 2015
Executive Officers
Peter Adams 30,000 No Nil Sep 2015
Alex Baburin 30,000 No Nil Sep 2015
Andre Cuenin 50,000 No Nil Sep 2015
John Dunne 30,000 No Nil Sep 2015
Andrew Levido 56,250 Yes Nil Sep 2015
David Purdue 20,000 No Nil Sep 2015
Pim Van Der Poel 25,000 Yes Nil Sep 2015
The performance rights were granted under the Integrated Research Performance Rights and Option Plan (established November 2011). The performance rights vest on 31 August 2015 subject to applicable performance hurdles. The performance rights are automatically exercised upon vesting. The Company will issue shares upon vesting conditions being met for Executive Officers. The Company will make an on-market purchase for Mr Brayan upon his vesting conditions being satisfied.
Inte
grat
ed R
esea
rch
and
its c
ontr
olle
d en
tities
• A
nnua
l Rep
ort 2
013
26
For
per
sona
l use
onl
y

Letter from the Chairm
anDirectors and Senior M
anagement
Remuneration Report
Corporate Governance Statement
Financial Statements
Independent Audit ReportDirectors’ Report
Unissued shares under option and performance rightsUnissued ordinary shares of Integrated Research Limited under option or performance rights at the date of this report are as follows:
Options Performance rights
Expiry date Exercise price Number of shares Expiry date Exercise price Number of shares
Oct 2013 $0.31 265,000 Sept 2014 Nil 430,000
May 2014 $0.28 507,000 Nov 2014 Nil 815,000
Sept 2015 Nil 160,000
Total options 772,000 Total performance rights 1,405,000
Options and performance rights do not entitle the holder to participate in any share issue of the Company or any other body corporate.
Shares issued on the exercise of optionsDuring or since the end of the financial year, the Company issued ordinary shares as a result of the exercise of options as follows (there were no amounts unpaid on the shares issued):
Number of shares Amount paid on each share
248,000 $0.28
87,500 $0.38
75,000 $0.31
50,000 $0.35
500,000 $0.42
Indemnification and insurance of officers and auditors
Indemnification
The Company has agreed to indemnify the Directors of the Company on a full indemnity basis to the full extent permitted by law, for all losses or liabilities incurred by the director as an officer of the Company including, but not limited to, liability for negligence or for reasonable costs and expenses incurred, except where the liability arises out of conduct involving a lack of good faith.
Insurance
During the financial year Integrated Research Limited paid a premium to insure the Directors and executive officers of the consolidated entity and related bodies corporate.
The liabilities insured include costs and expenses that may be incurred in defending civil or criminal proceedings that may be brought against officers in their capacity as officers of the consolidated entity.
27Integrated Research and its controlled entities • Annual Report 2013
For
per
sona
l use
onl
y

Directors’ Report
Remuneration reportThe Company’s Remuneration Report, which forms part of this Directors’ Report, is on pages 29 to 37.
Corporate governanceA statement describing the Company’s main corporate governance practices in place throughout the financial year is on pages 38 to 42.
Non‑audit servicesDuring the year Ernst and Young, the Company’s auditor, has performed certain other services in addition to their statutory duties.
The Board has considered the non-audit services provided during the year by the auditor and in accordance with written advice provided by resolution of the Audit & Risk Committee, is satisfied that the provision of those non-audit services during the year by the auditor is compatible with, and did not compromise, the auditor independence requirements of the Corporations Act 2001 for the following reasons:
� All non-audit services were subject to the corporate governance procedures adopted by the Company and have been reviewed by the Audit & Risk Committee to ensure they do not impact the integrity and objectivity of the auditor, and
� The non-audit services provided do not undermine the general principles relating to auditor independence as set out in Professional Statement F1 Professional independence, as they did not involve reviewing or auditing the auditor’s own work, acting in a management or decision making capacity for the Company, acting as an advocate for the Company or jointly sharing risks and rewards.
A copy of the auditors’ independence declaration as required under Section 307C of the Corporations Act is on page 81 and forms part of the Directors’ Report.
Rounding of amounts to nearest thousand dollars The Company is of a kind referred to in ASIC Class Order 98/100 dated 10 July 1998 and in accordance with that Class order, amounts in the Financial Statements and the Directors’ Report have been rounded off to the nearest thousand dollars, unless otherwise stated.
This report is made in accordance with a resolution of the Directors.
Steve Killelea Mark Brayan Chairman Chief Executive Officer
Dated at North Sydney this 19th day of August 2013.
Inte
grat
ed R
esea
rch
and
its c
ontr
olle
d en
tities
• A
nnua
l Rep
ort 2
013
28
For
per
sona
l use
onl
y

Letter from the Chairm
anDirectors and Senior M
anagement
Directors’ ReportCorporate Governance Statem
entFinancial Statem
entsIndependent Audit Report
Remuneration Report
Remuneration policies Remuneration levels for key management personnel and secretary of the Company, and relevant key management personnel of the consolidated entity are competitively set to attract and retain appropriately qualified and experienced Directors and senior executives. The Nomination and Remuneration Committee obtains independent advice on the appropriateness of remuneration packages given trends in comparative companies both locally and internationally and the objectives of the Company’s remuneration strategy.
Key management personnel (including Directors) have authority and responsibility for planning, directing and controlling the activities of the Company and the consolidated entity.
The remuneration structures explained below are designed to attract suitably qualified candidates, reward the achievement of strategic objectives, and achieve the broader outcome of creation of value for shareholders. The remuneration structure takes into account:
� The capability and experience of the Directors and senior executives
� The Directors and senior executives ability to control the relevant segment’s performance
� The consolidated entity’s performance including:
� The consolidated entity’s earnings
� The growth in share price and returns on shareholder wealth
Remuneration packages include a mix of fixed and variable remuneration and short and long-term performance based incentives.
Fixed remuneration Fixed remuneration consists of base remuneration (which is calculated on a total cost basis and includes any FBT charges related to employee benefits including motor vehicles), as well as employer contributions to superannuation funds.
Remuneration levels are reviewed annually through a process that considers individual, segment and overall performance of the consolidated entity. In addition, external remuneration surveys provide periodic analysis to ensure the Directors’ and senior executives’ remuneration is competitive in the market place. A senior executive’s remuneration is also reviewed on promotion.
Performance‑linked remuneration Performance linked remuneration includes both short-term and long-term incentives and is designed to reward executive Directors and senior executives for exceeding financial and personal objectives. The short-term incentive (STI) is an “at risk” bonus provided in the form of cash, while the long-term incentive (LTI) is provided as either options or performance rights over ordinary shares of Integrated Research Limited under the rules of the share plans.
Short‑term incentive bonus
The Nomination and Remuneration Committee is responsible for setting the key performance indicators (KPI’s) for the Chief Executive Officer, and for approving the KPI’s for the senior executives who report to him. The KPI’s generally include measures relating to the consolidated entity, the relevant segment, and the individual, and include financial, people, customer, strategy and risk measures. The measures are chosen as they directly align the individual’s reward to the KPI’s of the consolidated entity and to its strategy and performance.
The financial performance objectives vary with position and responsibility and are aligned with each respective year’s budget. The non-financial objectives vary with position and responsibility and include measures such as achieving strategic outcomes and staff development.
At the end of the financial year the Nomination and Remuneration Committee assesses the actual performance of the CEO against the KPI’s set at the beginning of the financial year. A percentage of the predetermined maximum amounts for each KPI is awarded depending on results. The committee recommends the cash incentive to be paid to the CEO for approval by the Board.
Remuneration report (audited)
29Integrated Research and its controlled entities • Annual Report 2013
For
per
sona
l use
onl
y

Remuneration Report
Long‑term incentive
Prior to the 2012 financial year, options were issued to executive Directors and other senior executives under the Employee Share Option Plan. In November 2011, the Company established a new plan titled Integrated Research Performance Rights and Options Plan (“IRPROP”). Performance rights are issued to executive Directors and other senior executives under the IRPROP. The ability of executive Directors to exercise either options or performance rights is conditional on the consolidated entity achieving certain profit after tax (PAT) performance hurdles over the vesting period. PAT was considered the most appropriate performance hurdle given its intrinsic link to creating shareholder wealth.
Consequences of performance on shareholder wealth In considering the consolidated entity’s performance and benefits for shareholder wealth, the Nomination and Remuneration Committee has regard to the following indices in respect of the current financial year and the previous four financial years:
2013 2012 2011 2010 2009
New licences ($’000) 26,632 28,861 25,005 18,413 21,723
Net profit ($’000) 9,078 9,035 7,465 5,401 7,863
Dividends paid ($’000) 8,413 7,512 4,171 7,506 5,003
Closing share price $1.035 $0.665 $0.275 $0.40 $0.275
Change in share price $0.37 $0.39 ($0.125) $0.125 ($0.06)
Net profit and new licence sales are considered in setting the STI, as two of the financial performance targets are profit after tax and new licences.
The Nomination and Remuneration Committee considers that the above performance linked structure is generating the desired outcomes.
Key Management PersonnelThe following were key management personnel of the consolidated entity at any time during the reporting period and unless otherwise indicated were key management personnel for the entire period:
Directors (full year) Directors (part year)
Steve Killelea ‑ Chairman Garry Dinnie (appointed February 2013)
Mark Brayan ‑ Chief Executive Officer John Brown (resigned December 2012)
Alan Baxter
Kate Costello
Peter Lloyd
Clyde McConaghy
Other key management personnel (full year) Other key management personnel (part year)
Peter Adams ‑ Chief Financial Officer David Leighton ‑ Company Secretary
Alex Baburin ‑ GM ‑ Research & Development Jonathan Stern ‑ Vice President ‑ Asia Pacific
Andre Cuenin ‑ President Americas Pierre Semaan ‑ Vice President ‑ Asia Pacific
John Dunne ‑ GM ‑ Products & Alliances Pim Van Der Poel ‑ Vice President ‑ Europe
Andrew Levido ‑ GM ‑ Global Sales
David Purdue ‑ Company Secretary & Global Commercial Manager
Inte
grat
ed R
esea
rch
and
its c
ontr
olle
d en
tities
• A
nnua
l Rep
ort 2
013
30
For
per
sona
l use
onl
y
Letter from the Chairm
anDirectors and Senior M
anagement
Directors’ ReportCorporate Governance Statem
entFinancial Statem
entsIndependent Audit Report
Remuneration Report
Service agreements Service contracts for current executive Directors and current senior executives are unlimited in term but capable of termination by either party according to a period specified in the employment contract and the consolidated entity retains the right to terminate the contract immediately by payment in lieu of notice or a severance payment or an amount for redundancy equal to the scale of payments prescribed in the NSW Employment Protection Act.
Mr Mark Brayan, Chief Executive Officer, has a contract of employment with Integrated Research Limited dated 29 August 2007, which provides for specific notice and severance undertakings of up to four months’ compensation depending on the particular circumstances. Mr Brayan can terminate his employment by giving four months’ prior notice in writing.
Mr Peter Adams, Chief Financial Officer, has a contract of employment with Integrated Research Limited dated 23 January 2008, which provides for specific notice and severance undertakings of up to three months’ compensation depending on the particular circumstances. Mr Adams can terminate his employment by giving three months’ prior notice in writing.
Mr Alex Baburin, General Manager Research and Development, has a contract of employment with Integrated Research Limited dated 18 October 2006, which provides for specific notice and severance undertakings of up to one month’s compensation depending on the particular circumstances. Mr Baburin can terminate his employment by giving one month’s prior notice in writing.
Mr Andre Cuenin, President Americas, has a contract of employment with Integrated Research Inc dated 22 September 2008, which provides for specific notice and severance undertakings of one month’s compensation depending on the particular circumstances. Mr Cuenin can terminate his employment by giving one month’s prior notice in writing.
Mr John Dunne, General Manager Products and Alliances, has a contract of employment with Integrated Research Limited dated 29 August 2008, which provides for specific notice and severance undertakings of one month’s compensation depending on the particular circumstances. Mr Dunne can terminate his employment by giving one month’s prior notice in writing.
Mr Andrew Levido, General Manager Global Sales, had a contract of employment with Integrated Research Limited dated 7 May 2012, which provided for specific notice and severance undertakings of three months compensation depending on the particular circumstances. Mr Levido terminated his employment in July 2013.
Mr David Purdue, Company Secretary and Global Commercial Manager, has a contract of employment with Integrated Research Limited dated 27 May 2008, which provides for specific notice and severance undertakings of one month’s compensation depending on the particular circumstances. Mr Purdue can terminate his employment by giving one month’s prior notice in writing.
Mr Jonathan Stern, Vice President Asia Pacific, has a contract of employment with Integrated Research Limited dated 03 April 2013, which provides for specific notice and severance undertakings of one month’s compensation depending on the particular circumstances. Mr Stern can terminate his employment by giving one month’s prior notice in writing.
Mr Pim Van Der Poel, Vice President Europe, had a contract of employment with Integrated Research UK Limited dated 11 July 2012, which provided for specific notice and severance undertakings of one month’s compensation depending on the particular circumstances. Mr Van Der Poel terminated his employment at the end of the 2013 financial year.
31Integrated Research and its controlled entities • Annual Report 2013
For
per
sona
l use
onl
y

Remuneration Report
Non‑executive Directors Total remuneration for all non-executive Directors last voted upon at the Annual General Meeting in November 2012 is not to exceed $750,000 per annum.
Director’s base fees from October 2012 were $70,000 per annum inclusive of compulsory superannuation (prior to October 2012 was $54,500 inclusive of compulsory superannuation). The chairman receives the base fee by a multiple of two. Directors’ fees cover all main Board activities and committee membership. Directors can elect to salary sacrifice their Directors fees into superannuation.
Non-executive Directors do not receive performance related compensation or retirement benefits.
Directors’ and executive officers’ remuneration Details of the nature and amount of each major element of the remuneration of each of the key management personnel director of the Company and each of the executives and relevant group key management executives are reported below.
The estimated value of options and performance rights disclosed is calculated at the date of grant using the Binomial option pricing model, adjusted to take into account the inability to exercise options during the vesting period. Further details of options and performance rights granted during the year are set out below.
“Executive officers” are officers who are involved in, or who take part in, the management of the affairs of Integrated Research Limited and/or related bodies corporate. Remuneration for overseas-based employees has been translated to Australian dollars at the average exchange rates for the year.
No director or executive appointed during the year received a payment as part of his or her consideration for agreeing to hold the position.
Inte
grat
ed R
esea
rch
and
its c
ontr
olle
d en
tities
• A
nnua
l Rep
ort 2
013
32
For
per
sona
l use
onl
y

Letter from the Chairm
anDirectors and Senior M
anagement
Directors’ ReportCorporate Governance Statem
entFinancial Statem
entsIndependent Audit Report
Remuneration Report
Short termPost-
employment
Share-based
payments
Other compen-
sationProportion of remuneration
2013In AUD
Salary & fees
$Bonus
$
Non-cashbenefits
$
Superannu-ation
contribution$
Value of options
and rights$
Termi-nation
benefit$
Total$
Perfor-mance related
Value of options
and rights
Directors
Non‑executive
Alan Baxter 60,665 ‑ ‑ 5,460 ‑ ‑ 66,125 ‑ ‑
John Brown (Resigned 17 Dec 2012) 26,274 ‑ ‑ 2,365 ‑ ‑ 28,639 ‑ ‑
Kate Costello 60,665 ‑ ‑ 5,460 ‑ ‑ 66,125 ‑ ‑
Garry Dinnie (Joined 17 Feb 2013) 26,758 ‑ ‑ 2,408 ‑ ‑ 29,166 ‑ ‑
Peter Lloyd (also see Note 24) 60,665 ‑ ‑ 5,460 ‑ ‑ 66,125 ‑ ‑
Steve Killelea (Chairman) 121,330 ‑ ‑ 10,920 ‑ ‑ 132,250 ‑ ‑
Clyde McConaghy 60,665 ‑ ‑ 5,460 ‑ ‑ 66,125 ‑ ‑
Executive
Mark Brayan 449,653 40,434 4,532 16,470 22,365 ‑ 533,454 8% 4%
Executive officers (excluding Directors)
Peter Adams 264,510 39,381 4,532 16,470 8,429 ‑ 333,322 12% 3%
Alex Baburin 241,789 28,290 ‑ 21,761 6,730 ‑ 298,570 9% 2%
Andre Cuenin 222,047 188,803 ‑ 6,661 3,012 ‑ 420,523 45% 7%
John Dunne 200,018 23,381 ‑ 16,470 8,078 ‑ 247,947 9% 3%
David Leighton (retired July 2012) 3,750 ‑ ‑ 338 ‑ ‑ 4,088 ‑ ‑
Andrew Levido (resigned July 2013) 278,998 126,002 4,532 16,470 4,257 ‑ 430,259 29% 1%
David Purdue (appointed Company Secretary July 2012) 185,886 ‑ 2,644 16,470 4,433 ‑ 209,433 ‑ 2%
Pierre Semaan (resigned Dec 12) 140,364 46,195 2,266 8,235 ‑ ‑ 197,060 23% ‑
Jonathan Stern (appointed April 13) 45,851 22,927 ‑ 2,475 ‑ ‑ 71,253 32% ‑
Pim Van Der Poel (appointed Oct 2012 resigned July 2013) 147,930 79,218 ‑ ‑ 1,419 ‑ 228,567 35% 1%
Total compensation: key management (consolidated, including Directors) 2,597,818 594,631 18,506 159,353 58,723 3,429,031
33Integrated Research and its controlled entities • Annual Report 2013
For
per
sona
l use
onl
y

Remuneration Report
Short termPost-
employment
Share-based
payments
Other compen-
sationProportion of remuneration
2012In AUD
Salary & fees
$Bonus
$
Non-cashbenefits
$
Superannu-ation
contribution$
Value of options
and rights$
Termina-tion
benefit$
Total$
Perfor-mance related
Value of options
and rights
Directors
Non‑executive
Alan Baxter 9,500 ‑ ‑ 45,000 ‑ ‑ 54,500 ‑ ‑
John Brown 50,000 ‑ ‑ 4,500 ‑ ‑ 54,500 ‑ ‑
Kate Costello 50,000 ‑ ‑ 4,500 ‑ ‑ 54,500 ‑ ‑
Peter Lloyd 50,000 ‑ ‑ 4,500 ‑ ‑ 54,500 ‑ ‑
Steve Killelea (Chairman) 100,000 ‑ ‑ 9,000 ‑ ‑ 109,000 ‑ ‑
Clyde McConaghy 50,000 ‑ ‑ 4,500 ‑ ‑ 54,500 ‑ ‑
Executive
Mark Brayan 429,693 109,450 4,532 15,775 20,642 ‑ 580,092 19% 4%
Executive officers (excluding Directors)
Peter Adams 252,693 50,226 4,532 15,775 8,342 ‑ 331,568 15% 3%
Alex Baburin 231,193 37,762 ‑ 20,807 3,519 ‑ 293,281 13% 1%
Brian Bigley 175,603 68,804 ‑ 673 2,353 ‑ 247,433 28% 1%
Geoff Bryant (resigned Nov 2011) 133,290 13,115 7,219 10,138 ‑ ‑ 163,762 8% ‑
Andre Cuenin 206,250 200,549 ‑ 2,813 8,748 ‑ 418,360 48% 2%
John Dunne 189,908 36,314 ‑ 17,092 4,073 ‑ 247,387 15% 2%
David Leighton 45,000 ‑ ‑ 4,050 ‑ ‑ 49,050 ‑ ‑
Andrew Levido (appointed May 2012) 30,838 ‑ 378 1,992 ‑ ‑ 33,208 ‑ ‑
Pierre Semaan 219,693 89,467 4,532 15,775 4,725 ‑ 334,192 27% 1%
Total compensation: key management (consolidated, including Directors) 2,223,661 605,687 21,193 176,890 52,402 3,079,833
Inte
grat
ed R
esea
rch
and
its c
ontr
olle
d en
tities
• A
nnua
l Rep
ort 2
013
34
For
per
sona
l use
onl
y
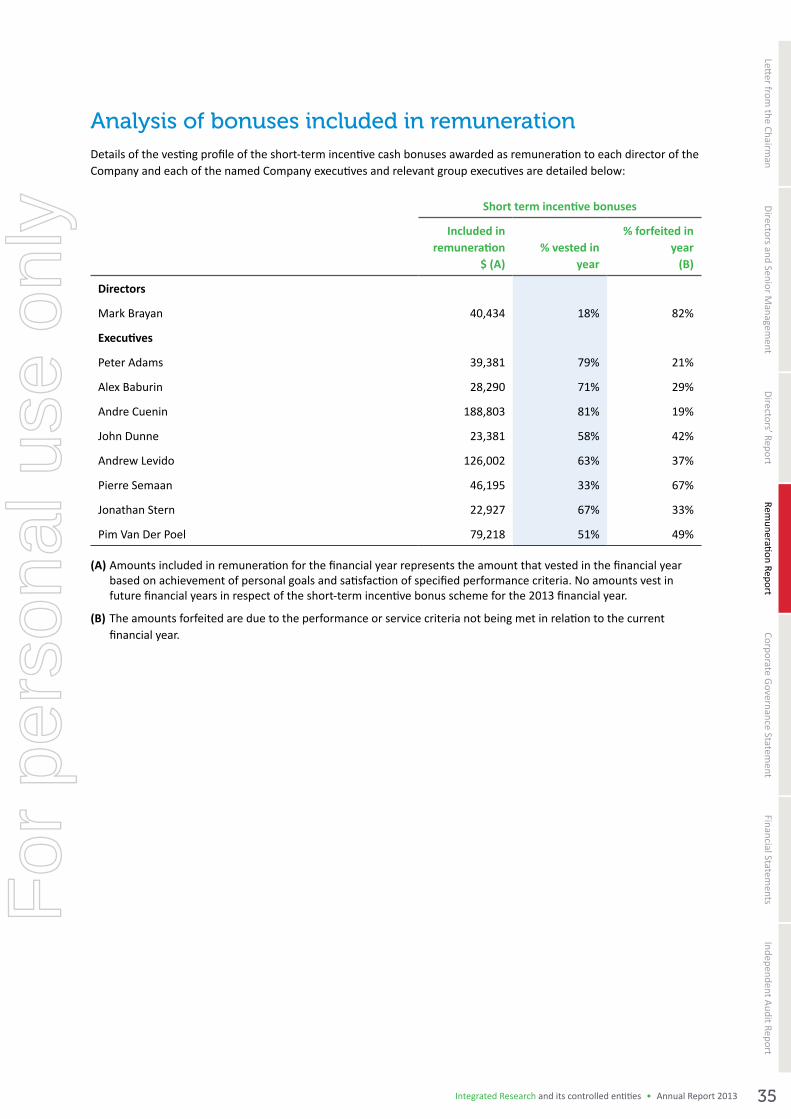
Letter from the Chairm
anDirectors and Senior M
anagement
Directors’ ReportCorporate Governance Statem
entFinancial Statem
entsIndependent Audit Report
Remuneration Report
Analysis of bonuses included in remuneration Details of the vesting profile of the short-term incentive cash bonuses awarded as remuneration to each director of the Company and each of the named Company executives and relevant group executives are detailed below:
Short term incentive bonuses
Included in remuneration
$ (A)% vested in
year
% forfeited in year
(B)
Directors
Mark Brayan 40,434 18% 82%
Executives
Peter Adams 39,381 79% 21%
Alex Baburin 28,290 71% 29%
Andre Cuenin 188,803 81% 19%
John Dunne 23,381 58% 42%
Andrew Levido 126,002 63% 37%
Pierre Semaan 46,195 33% 67%
Jonathan Stern 22,927 67% 33%
Pim Van Der Poel 79,218 51% 49%
(A) Amounts included in remuneration for the financial year represents the amount that vested in the financial year based on achievement of personal goals and satisfaction of specified performance criteria. No amounts vest in future financial years in respect of the short-term incentive bonus scheme for the 2013 financial year.
(B) The amounts forfeited are due to the performance or service criteria not being met in relation to the current financial year.
35Integrated Research and its controlled entities • Annual Report 2013
For
per
sona
l use
onl
y
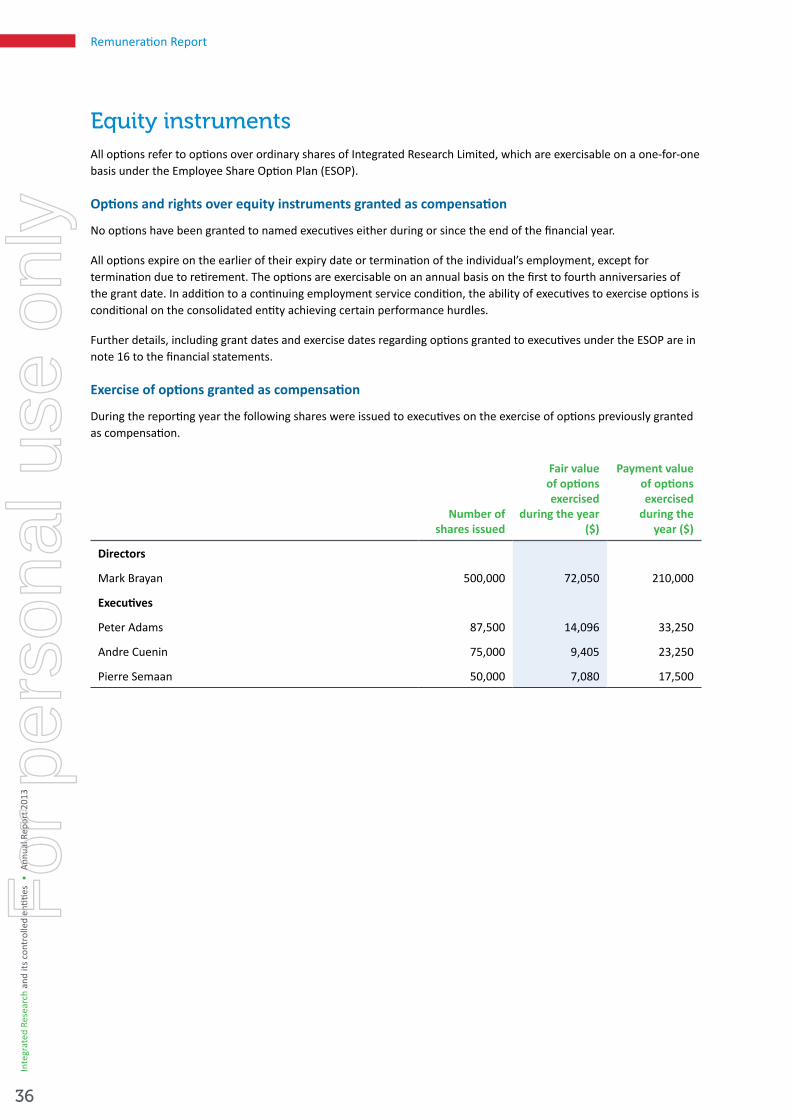
Remuneration Report
Equity instruments All options refer to options over ordinary shares of Integrated Research Limited, which are exercisable on a one-for-one basis under the Employee Share Option Plan (ESOP).
Options and rights over equity instruments granted as compensation
No options have been granted to named executives either during or since the end of the financial year.
All options expire on the earlier of their expiry date or termination of the individual’s employment, except for termination due to retirement. The options are exercisable on an annual basis on the first to fourth anniversaries of the grant date. In addition to a continuing employment service condition, the ability of executives to exercise options is conditional on the consolidated entity achieving certain performance hurdles.
Further details, including grant dates and exercise dates regarding options granted to executives under the ESOP are in note 16 to the financial statements.
Exercise of options granted as compensation
During the reporting year the following shares were issued to executives on the exercise of options previously granted as compensation.
Number of
shares issued
Fair value of options exercised
during the year($)
Payment value of options exercised
during the year ($)
Directors
Mark Brayan 500,000 72,050 210,000
Executives
Peter Adams 87,500 14,096 33,250
Andre Cuenin 75,000 9,405 23,250
Pierre Semaan 50,000 7,080 17,500
Inte
grat
ed R
esea
rch
and
its c
ontr
olle
d en
tities
• A
nnua
l Rep
ort 2
013
36
For
per
sona
l use
onl
y

Letter from the Chairm
anDirectors and Senior M
anagement
Directors’ ReportCorporate Governance Statem
entFinancial Statem
entsIndependent Audit Report
Remuneration Report
Analysis of options and rights over equity instruments granted as compensation
Details of vesting profile of the options granted to each director of the Company and each of the named executives are detailed below:
Options granted Value yet to vest ($)
Number Date
Percent vested in
year
Percent forfeited
in year (A)
Financial year in which grant expires
Min(B)
Max(C)
Executives
Alex Baburin 40,000 Oct‑08 ‑ 25% 2014 nil $1,254
Andre Cuenin 300,000 Oct‑08 ‑ 25% 2014 nil nil
John Dunne 30,000 May-09 25% ‑ 2014 nil $887
Performance rights granted Value yet to vest ($)
Number Date
Percent vested in
year
Percent forfeited
in year (A)
Financial year in which grant expires
Min(B)
Max(C)
Directors
Mark Brayan 170,000 Dec‑11 ‑ ‑ 2015 nil 65,212
170,000 Oct-12 ‑ ‑ 2016 nil 150,280
Executives
Peter Adams 100,000 Dec‑11 ‑ ‑ 2015 nil 38,360
30,000 Oct-12 ‑ ‑ 2016 nil 26,520
Alex Baburin 75,000 Dec‑11 ‑ ‑ 2015 nil 28,770
30,000 Oct-12 ‑ ‑ 2016 nil 26,520
Andre Cuenin 75,000 Dec‑11 ‑ ‑ 2015 nil 28,770
50,000 Oct-12 ‑ ‑ 2016 nil 44,200
John Dunne 75,000 Dec‑11 ‑ ‑ 2015 nil 28,770
30,000 Oct-12 ‑ ‑ 2016 nil 26,520
Andrew Levido 56,250 Oct-12 ‑ ‑ 2016 nil 49,725
David Purdue 14,500 Dec‑11 ‑ ‑ 2015 nil 5,562
20,000 Oct-12 ‑ ‑ 2016 nil 17,680
Pim Van Der Poel 25,000 Oct-12 ‑ ‑ 2016 nil 22,100
Pierre Semaan 65,000 Dec‑11 ‑ 100% 2015 nil nil
(A) The percentage forfeited in the year represents the reduction from the maximum number of options available to vest due to the performance hurdles not being achieved or due to the resignation of the executive.
(B) The minimum value of options yet to vest is $nil as the executives may not achieve the required performance hurdles or may terminate their employment prior to vesting.
(C) The maximum values presented above are based on the values calculated using the Binomial option pricing model as applied in estimating the value of options for performance rights for employee benefit expense purposes.
37Integrated Research and its controlled entities • Annual Report 2013
For
per
sona
l use
onl
y
Corporate Governance Statement
Board of Directors and its Committees
Role of the Board
The Board’s primary role is the protection and enhancement of long‑term shareholder value.
To fulfil this role, the Board is responsible for the overall corporate governance of the consolidated entity including evaluating and approving its strategic direction, approving and monitoring capital expenditure, setting remuneration, appointing, removing and creating succession policies for Directors and senior executives, establishing and monitoring the achievement of management goals and assessing the integrity of internal control and management information systems. It is also responsible for approving and monitoring financial and other reporting.
Board process
To assist in the execution of its responsibilities, the Board has established a number of Board committees including a Nomination and Remuneration Committee, an Audit and Risk Committee and a Strategy Committee. These committees have written mandates and operating procedures, which are reviewed on a regular basis. The Board has also established a framework for the management of the consolidated entity including Board-endorsed policies, a system of internal control, a business risk management process and the establishment of appropriate ethical standards.
The full Board currently holds twelve scheduled meetings each year and any extraordinary meetings at such other times as may be necessary to address any specific matters that may arise.
The agenda for its meetings is prepared in conjunction with the Chairman, Chief Executive Officer (CEO) and Company Secretary. Standing items include strategic matters for discussion, the CEO’s report, financial reports, key performance indicator reports and presentations by key executives and external industry experts. Board papers are circulated in advance. Directors have other opportunities, including visits to operations, for contact with a wider group of employees.
Director education
The consolidated entity follows an induction process to educate new Directors about the nature of the business, current issues, the corporate strategy and expectations of the consolidated entity concerning performance of Directors. In addition executives make regular presentations to the Board to ensure its familiarity with operational matters. Directors are expected to access external continuing education opportunities to update and enhance their skills and knowledge.
Independent advice and access to Company information
Each director has the right of access to all relevant Company information and to the Company’s executives and, subject to prior consultation with the chairman, may seek independent professional advice from a suitably qualified adviser at the consolidated entity’s expense. A copy of the advice received by the director is made available to all other members of the Board.
Composition of the Board
The names of the Directors of the Company in office at the date of this report are set out on pages 18 to 21 of this report.
The Company’s constitution provides for the Board to consist of between three and twelve members. At 30 June 2013 the Board members were comprised as follows:
� Mr Steve Killelea - Non Executive Director (Chairman)
� Mr Alan Baxter - Independent Non Executive Director
� Ms Kate Costello - Independent Non Executive Director
� Mr Garry Dinnie - Independent Non Executive Director
� Mr Peter Lloyd - Non Executive Director
� Mr Clyde McConaghy - Non Executive Director
� Mr Mark Brayan - Executive Director (Chief Executive Officer)
Corporate Governance StatementThis statement outlines the main corporate governance practices that were in place throughout the financial year, which comply with the ASX Corporate Governance Council recommendations, unless otherwise stated.
Inte
grat
ed R
esea
rch
and
its c
ontr
olle
d en
tities
• A
nnua
l Rep
ort 2
013
38
For
per
sona
l use
onl
y
Letter from the Chairm
anDirectors and Senior M
anagement
Directors’ ReportRem
uneration ReportFinancial Statem
entsIndependent Audit Report
Corporate Governance Statement
The election of Mr Killelea, who holds a majority of the Company’s issued shares, as non-executive chairman, does not comply with the ASX Corporate Governance Council recommendation that the Chairman be an independent director. However, the Board is satisfied that the Company benefits from Mr Killelea’s experience and knowledge gained through his long involvement with Integrated Research and his associations throughout the information technology industry. Mr Killelea founded Integrated Research in 1988 and was the CEO and Managing Director of the Company until his retirement in November 2004.
At each Annual General Meeting one-third of Directors, any director who has held office for three years and any director appointed by Directors in the preceding year must retire, then being eligible for re-election. The CEO is not required to retire by rotation.
The composition of the Board is reviewed on a regular basis to ensure that the Board has the appropriate mix of expertise and experience. When a vacancy exists, through whatever cause, or where it is considered that the Board would benefit from the services of a new director with particular skills, the Nomination and Remuneration Committee, in conjunction with the Board, determines the selection criteria for the position based on the skills deemed necessary for the Board to best carry out its responsibilities. The Committee then selects a panel of candidates and the Board appoints the most suitable candidate who must stand for election at the next general meeting of shareholders.
Nomination and Remuneration Committee
The Nomination and Remuneration Committee is a committee of the Board of Directors and is empowered by the Board to assist it in fulfilling its duties to shareholders and other stakeholders. In general, the Committee has responsibility to: 1) ensure the Company has appropriate remuneration policies designed to meet the needs of the Company and to enhance corporate and individual performance and 2) review Board performance, select and recommend new Directors to the Board and implement actions for the retirement and re-election of Directors.
Responsibilities Regarding Remuneration
The Committee reviews and makes recommendations to the Board on:
� The appointment, remuneration, performance objectives and evaluation of the CEO.
� The remuneration packages for senior executives.
� The Company’s recruitment, retention and termination policies and procedures for senior executives.
� Executive remuneration and incentive policies.
� Policies on employee incentive plans, including equity incentive plans.
� Superannuation arrangements.
� The remuneration framework and policy for non-executive Directors.
� Remuneration levels are competitively set to attract and retain the most qualified and experienced Directors and senior executives. The Remuneration Committee obtains independent advice on the appropriateness of remuneration packages, given trends in comparative companies and industry surveys. Remuneration packages include a mix of fixed remuneration, performance-based remuneration and equity-based remuneration.
Responsibilities Regarding Nomination
The Committee develops and makes recommendations to the Board on:
� The CEO and Senior Executive succession planning.
� The range of skills, experience and expertise needed on the Board and the identification of the particular skills, experience and expertise that will best complement Board effectiveness.
� A plan for identifying, reviewing, assessing and enhancing Directors’ competencies.
� Board succession plans to maintain a balance of skills, experience and expertise on the Board.
� Evaluation of the Board’s performance.
� Appointment and removal of Directors.
� Appropriate composition of committees.
The terms and conditions of the appointment of non-executive Directors are set out in a letter of appointment, including expectations for attendance and preparation for all Board meetings, expected time commitments, procedures when dealing with conflicts of interest, and the availability of independent professional advice.
The members of the Nomination and Remuneration Committee during the year were:
� Ms Kate Costello (Chairperson) - Independent Non-Executive
� Mr Alan Baxter - Independent Non-Executive
� Mr Steve Killelea - Non-Executive
The Nomination and Remuneration Committee meets at least twice a year and/or as required. The Committee met three times during the year under review.
39Integrated Research and its controlled entities • Annual Report 2013
For
per
sona
l use
onl
y
Corporate Governance Statement
Audit and Risk Committee
The Audit and Risk Committee has a documented charter, approved by the Board. All members must be non-executive Directors with a majority being independent. The Chairman may not be the Chairman of the Board. The Committee advises on the establishment and maintenance of a framework of risk management and internal control of the consolidated entity.
The members of the Audit and Risk Committee during the year were:
� Mr John Brown (Chairman till December 2012) - Independent Non-Executive (resigned December 2012)
� Mr Garry Dinnie - Independent Non-Executive (appointed February 2013)
� Mr Peter Lloyd - Non-Executive
� Mr Clyde McConaghy - Non-Executive (became Interim Chairman in February 2013)
During the year, the Audit and Risk Committee provided the Board with updates to the Company’s risk management register (with the Board approving this document).
The external auditor, CEO and Chief Financial Officer (CFO) are invited to Audit and Risk Committee meetings at the discretion of the committee. The committee met three times during the year and committee members’ attendance record is disclosed in the table of Directors’ meetings on page 25.
The external auditor met with the audit committee/Board three times during the year, two of which included time without the presence of executive management. The CEO and the CFO declared in writing to the Board that the Company’s financial reports for the year ended 30 June 2013 comply with accounting standards and present a true and fair view, in all material respects, of the Company’s financial condition and operational results. This statement is required annually.
The main responsibilities of the Audit and Risk Committee include:
� Serve as an independent party to monitor the financial reporting process and internal control systems.
� Review the performance and independence of the external auditors and make recommendations to the Board regarding the appointment or termination of the auditors.
� Review the scope and cost of the annual audit, negotiating and recommending the fee for the annual audit to the Board.
� Review the external auditor’s management letter and responses by management.
� Provide an avenue of communication between the auditors, management and the Board.
� Monitor compliance with all financial statutory requirements and regulations.
� Review financial reports and other financial information distributed to shareholders so that they provide an accurate reflection of the financial health of the Company.
� Monitor corporate risk management and assessment processes, and the identification and management of strategic and operational risks.
� Enquire of the auditors of any difficulties encountered during the audit, including any restrictions on the scope of their work, access to information or changes to the planned scope of the audit.
The Audit and Risk Committee reviews the performance of the external auditors on an annual basis and normally meets with them during the year as follows:
� To discuss the external audit plans, identifying any significant changes in structure, operations, internal controls or accounting policies likely to impact the financial statements and to review the fees proposed for the audit work to be performed.
� Prior to announcement of results:
� To review the half-year and preliminary final report prior to lodgement with the ASX, and any significant adjustments required as a result of the auditor’s findings.
� To recommend the Board approval of these documents.
� Review the results and findings of the auditor, the adequacy of accounting and financial controls, and to monitor the implementation of any recommendations made.
� To finalise half-year and annual reporting:
� Review the draft financial report and recommend Board approval of the financial report.
� As required, to organise, review and report on any special reviews or investigations deemed necessary by the Board.
Inte
grat
ed R
esea
rch
and
its c
ontr
olle
d en
tities
• A
nnua
l Rep
ort 2
013
40
For
per
sona
l use
onl
y

Letter from the Chairm
anDirectors and Senior M
anagement
Directors’ ReportRem
uneration ReportFinancial Statem
entsIndependent Audit Report
Corporate Governance Statement
Strategy Committee
The Strategy Committee has a documented charter, approved by the Board and is responsible for reviewing strategy and recommending strategies to the Board to enhance the Company’s long-term performance. The Committee is comprised of at least three members, including the Chairman of the Board and the CEO. The Board appoints a member of the committee to be Chairman.
The members of the Strategy Committee during the year were:
� Mr Steve Killelea (Chairman) - Non-Executive
� Mr Mark Brayan - Executive
� Mr Peter Lloyd - Non-Executive
� Ms Kate Costello - Independent Non-Executive
The Strategy Committee is responsible for:
� Review and assist in defining current strategy.
� Assess new strategic opportunities, including M&A proposals and intellectual property developments or acquisitions.
� Stay close to the business challenges and monitor operational implementation of strategic plans.
� Endorse strategy and business cases for consideration by the full Board.
The Committee met four times during the year under review.
Risk managementUnder the Audit and Risk Charter, the Audit and Risk Committee reviews the status of business risks to the consolidated entity through integrated risk management programs ensuring risks are identified, assessed and appropriately managed and communicated to the Board. Major business risks arise from such matters as actions by competitors, government policy changes and the impact of exchange rate movements.
Comprehensive policies and procedures are established such that:
� Capital expenditure above a certain size requires Board approval.
� Financial exposures are controlled, including the use of forward exchange contracts.
� Risks are identified and managed, including internal audit, privacy, insurances, business continuity and compliance.
� Business transactions are properly authorised and executed.
The CEO and the CFO have declared, in writing to the Board that the Company’s financial reports are founded on a sound system of risk management and internal compliance and control which implements the policies adopted by the Board.
Internal control framework
The Board is responsible for the overall internal control framework, but recognises that no cost effective internal control system will preclude all errors and irregularities. The Board has instigated the following internal control framework:
� Financial reporting - Monthly actual results are reported against budgets approved by the Directors and revised forecasts for the year are prepared monthly.
� Continuous disclosure - Identify matters that may have a material effect on the price of the Company’s securities, notify them to the ASX and post them to the Company’s website.
� Quality and integrity of personnel - Formal appraisals are conducted at least annually for all employees.
� Investment appraisals - Guidelines for capital expenditure include annual budgets, detailed appraisal and review procedures and levels of authority.
Internal Audit
The Company does not have an internal audit function but utilises its financial resources as needed to assist the Board in ensuring compliance with internal controls.
Ethical standardsAll Directors, managers and employees are expected to act with the utmost integrity and objectivity, striving at all times to enhance the reputation and performance of the consolidated entity. Every employee has a nominated supervisor to whom they may refer any issues arising from their employment.
Conflict of interest
Each Director must keep the Board advised, on an ongoing basis, of any interest that could potentially conflict with those of the Company. Where the Board considers that a significant conflict exists the director concerned does not receive the relevant Board papers and is not present at the meeting whilst the item is considered. The Board has developed procedures to assist Directors to disclose potential conflicts of interest. Details of director related entity transactions with the consolidated entity are set out in Note 25.
41Integrated Research and its controlled entities • Annual Report 2013
For
per
sona
l use
onl
y

Corporate Governance Statement
Code of conduct
The consolidated entity has advised each director, manager and employee that they must comply with the code of conduct. The code aligns behaviour of the Board and management with the code of conduct by maintaining appropriate core values and objectives. It may be reviewed on the Company’s website and includes:
� Responsibility to the community and fellow employees to act with honesty and integrity, and without prejudice.
� Compliance with laws and regulations in all areas where the Company operates, including employment opportunity, occupational health and safety, trade practices, fair dealing, privacy, drugs and alcohol, and the environment.
� Dealing honestly with customers, suppliers and consultants.
� Ensuring reports and other information are accurate and timely.
� Proper use of Company resources, avoidance of conflicts of interest and use of confidential or proprietary information.
Equal Employment Opportunity
The Company has a policy on Equal Employment Opportunity with the provision that commits to a workplace that is free of discrimination of all types. It is Company policy to hire, develop and promote individuals solely on the basis of merit and their ability to perform without prejudice to race, colour, creed, national origin, religion, gender, age, disability, sexual orientation, marital status, membership or non membership of a trade union, status of employment (whether full or part-time) or any other factors prohibited by law. The Board is satisfied that the Equal Employment Opportunity policy is sufficient without the need to further establish a separate policy on gender diversity as required by the ASX Corporate Governance Council recommendation.
Trading in Company securities by Directors and Employees
Directors and employees may acquire shares in the Company, but are prohibited from dealing in Company shares whilst in possession of price sensitive information, and except in the periods:
� From 24 hours to 28 days after the release of the Company’s half-yearly results announcement or following the wide dissemination of information on the status of the corporation and current results.
� From 24 hours after the release of the Company’s annual results announcement to a maximum of 28 days after the annual general meeting.
Directors must obtain the approval of the Chairman of the Board and notify the Company Secretary before they buy or sell shares in the Company, subject to Board veto. The Company advises the ASX of any transactions conducted by Directors in shares in the Company.
Communication with shareholdersThe Board provides shareholders with information using a comprehensive continuous disclosure policy which includes identifying matters that may have a material effect on the price of the Company’s securities, notifying them to the ASX, posting them on the Company’s website (www.ir.com), and issuing media releases. Disclosures under this policy are in addition to the periodic and other disclosures required under the ASX Listing Rules and the Corporations Act. More details of the policy are available on the Company’s website.
The CEO and the CFO are responsible for interpreting the Company’s policy and where necessary informing the Board. The Company Secretary is responsible for all communication with the ASX.
The Board encourages full participation of shareholders at the Annual General Meeting to ensure a high level of accountability and identification with the consolidated entity’s strategy and goals. Important issues are presented to the shareholders as single resolutions. The external auditor is requested to attend the Annual General Meetings to answer any questions concerning the audit and the content of the auditor’s report.
The shareholders are requested to vote on the appointment and aggregate remuneration of Directors, the granting of options and shares to Directors, the Remuneration Report and changes to the Constitution. Copies of the Constitution are available to any shareholder who requests it.
Inte
grat
ed R
esea
rch
and
its c
ontr
olle
d en
tities
• A
nnua
l Rep
ort 2
013
42
For
per
sona
l use
onl
y

Integrated ResearchFinancial Report 2013
For
per
sona
l use
onl
y

Financial Statements
Financial StatementsContents PageConsolidated statement of comprehensive income 45
Consolidated statement of financial position 46
Consolidated statement of changes in equity 47
Consolidated statement of cash flows 48
Notes to the financial statements 49
1. Significant accounting policies 49
2. Segment reporting 55
3. Finance income 56
4. Expenditure 56
5. Auditors’ remuneration 56
6. Income tax expense 57
7. Earnings per share 58
8. Cash and cash equivalents 58
9. Trade and other receivables 59
10. Other current assets 60
11. Other financial assets 60
12. Property, plant and equipment 60
13. Deferred tax assets and liabilities 61
14. Intangible assets 62
15. Trade and other payables 63
16. Employee benefits 63
17. Provisions 65
18. Other liabilities 66
19. Capital and reserves 66
20. Financial instruments 68
21. Operating leases 71
22. Consolidated entities 72
23. Reconciliation of cash flows from operating activities 72
24. Key management personnel disclosures 73
25. Related parties 77
26. Parent entity disclosures 77
27. Subsequent events 77
Inte
grat
ed R
esea
rch
and
its c
ontr
olle
d en
tities
• A
nnua
l Rep
ort 2
013
44
For
per
sona
l use
onl
y

Letter from the Chairm
anDirectors and Senior M
anagement
Directors’ ReportRem
uneration ReportCorporate Governance Statem
entIndependent Audit Report
Financial Statements
Consolidated statement of comprehensive incomeFor the year ended 30 June 2013
In thousands of AUD Notes
Consolidated
2013 2012
Revenue
Revenue from licence fees 26,632 28,861
Revenue from maintenance fees 17,717 16,406
Revenue from consulting services 4,510 3,341
Total revenue 48,859 48,608
Expenditure
Research and development expenses (10,777) (10,134)
Sales, consulting and marketing expenses (23,279) (23,004)
General and administration expenses (4,280) (4,278)
Total expenditure 4 (38,336) (37,416)
Other gains and losses
Currency exchange gains/(losses) 591 (133)
Profit before finance income and tax 11,114 11,059
Finance income 3 456 509
Profit before tax 11,570 11,568
Income tax expense 6 (2,492) (2,533)
Profit for the year 9,078 9,035
Other comprehensive income
Items that may be reclassified subsequently to profit
Loss on cash flow hedge taken to equity (777) (147)
Foreign exchange translation differences 415 125
Other comprehensive income (362) (22)
Total comprehensive income for the year 8,716 9,013
Profit attributable to:
Members of Integrated Research 9,078 9,035
Total comprehensive income attributable to:
Members of Integrated Research 8,716 9,013
Earnings per share attributable to members of Integrated Research:
Basic earnings per share (AUD cents) 7 5.40 5.41
Diluted earnings per share (AUD cents) 7 5.35 5.38
The consolidated statement of comprehensive income is to be read in conjunction with the notes to the financial statements set out on pages 49 to 77.
45Integrated Research and its controlled entities • Annual Report 2013
For
per
sona
l use
onl
y

Financial Statements
Consolidated statement of financial positionAs at 30 June 2013
In thousands of AUD Notes
Consolidated
2013 2012
Current assets
Cash and cash equivalents 8 14,827 12,038
Trade and other receivables 9 21,407 20,725
Current tax assets 29 163
Other current assets 10 781 953
Total current assets 37,044 33,879
Non-current assets
Trade and other receivables 9 2,157 656
Other financial assets 11 724 1,802
Property, plant and equipment 12 1,706 1,820
Deferred tax assets 13 1,187 453
Intangible assets 14 15,040 13,849
Total non‑current assets 20,814 18,580
Total assets 57,858 52,459
Current liabilities
Trade and other payables 15 4,190 4,285
Provisions 17 2,004 1,779
Income tax liabilities 1,349 1,653
Other current liabilities 18 13,086 9,832
Total current liabilities 20,629 17,549
Non‑current liabilities
Deferred tax liabilities 13 3,582 3,003
Provisions 17 756 621
Other non-current liabilities 18 2,881 2,053
Total non-current liabilities 7,219 5,677
Total liabilities 27,848 23,226
Net assets 30,010 29,233
Equity
Issued capital 19 1,501 1,175
Reserves 19 (1,721) (1,507)
Retained earnings 30,230 29,565
Total equity 30,010 29,233
The consolidated statement of financial position is to be read in conjunction with the notes to the financial statements set out on pages 49 to 77.In
tegr
ated
Res
earc
h an
d its
con
trol
led
entiti
es •
Ann
ual R
epor
t 201
3
46
For
per
sona
l use
onl
y

Letter from the Chairm
anDirectors and Senior M
anagement
Directors’ ReportRem
uneration ReportCorporate Governance Statem
entIndependent Audit Report
Financial Statements
Consolidated statement of changes in equityFor the year ended 30 June 2013
In thousands of AUD
Consolidated
Share capital
Hedging reserve
Translation reserve
Employee benefit reserve
Retained earnings Total
Balance at 1 July 2012 1,175 ‑ (1,783) 276 29,565 29,233
Profit for the year ‑ ‑ ‑ ‑ 9,078 9,078
Other comprehensive income for the year (net of tax) ‑ (777) 415 ‑ ‑ (362)
Total comprehensive income for the year ‑ (777) 415 ‑ 9,078 8,716
Share based payments expense ‑ ‑ ‑ 148 ‑ 148
Shares issued 326 ‑ ‑ ‑ ‑ 326
Dividends to shareholders ‑ ‑ ‑ ‑ (8,413) (8,413)
Balance at 30 June 2013 1,501 (777) (1,368) 424 30,230 30,010
Balance at 1 July 2011 845 147 (1,908) 266 28,007 27,357
Profit for the year ‑ ‑ ‑ ‑ 9,035 9,035
Other comprehensive income for the year (net of tax) ‑ (147) 125 ‑ ‑ (22)
Total comprehensive income for the year ‑ (147) 125 ‑ 9,035 9,013
Lapsed employee options ‑ ‑ ‑ (35) 35 ‑
Share based payments expense ‑ ‑ ‑ 127 ‑ 127
Shares issued 330 ‑ ‑ (82) ‑ 248
Dividends to shareholders ‑ ‑ ‑ ‑ (7,512) (7,512)
Balance at 30 June 2012 1,175 ‑ (1,783) 276 29,565 29,233
The consolidated statement of changes in equity is to be read in conjunction with the notes to the financial statements set out on pages 49 to 77.
47Integrated Research and its controlled entities • Annual Report 2013
For
per
sona
l use
onl
y
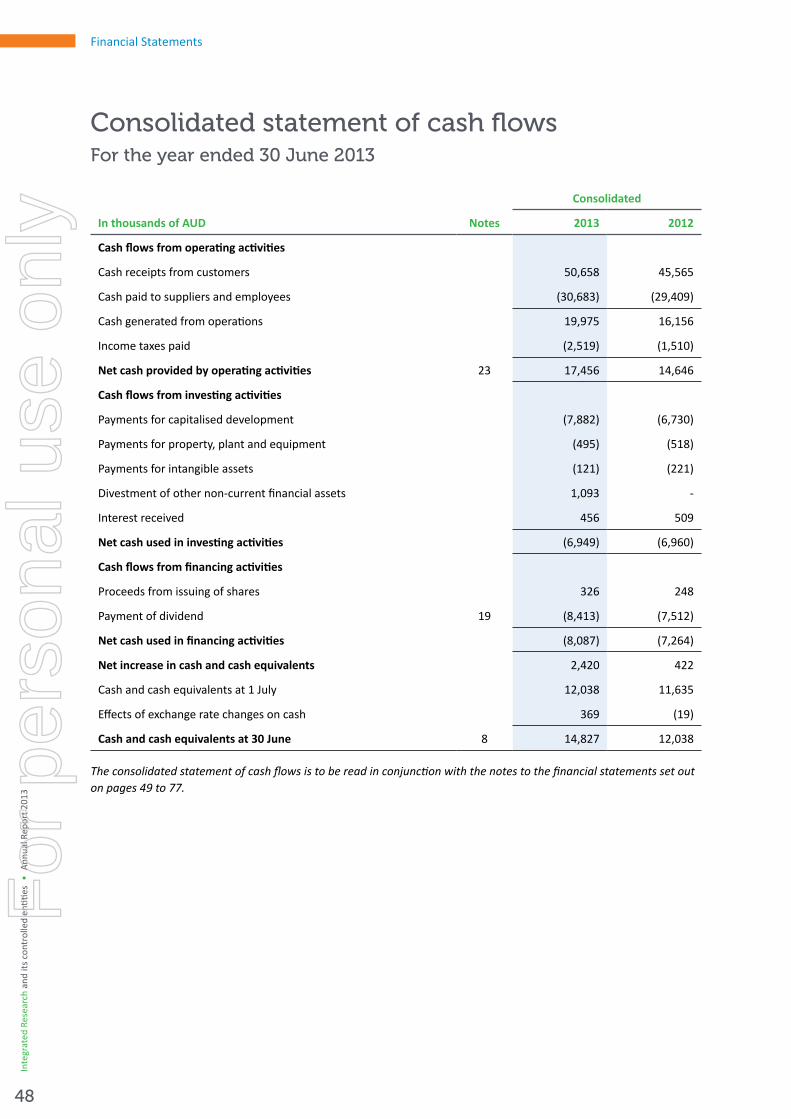
Financial Statements
Consolidated statement of cash flowsFor the year ended 30 June 2013
In thousands of AUD Notes
Consolidated
2013 2012
Cash flows from operating activities
Cash receipts from customers 50,658 45,565
Cash paid to suppliers and employees (30,683) (29,409)
Cash generated from operations 19,975 16,156
Income taxes paid (2,519) (1,510)
Net cash provided by operating activities 23 17,456 14,646
Cash flows from investing activities
Payments for capitalised development (7,882) (6,730)
Payments for property, plant and equipment (495) (518)
Payments for intangible assets (121) (221)
Divestment of other non-current financial assets 1,093 ‑
Interest received 456 509
Net cash used in investing activities (6,949) (6,960)
Cash flows from financing activities
Proceeds from issuing of shares 326 248
Payment of dividend 19 (8,413) (7,512)
Net cash used in financing activities (8,087) (7,264)
Net increase in cash and cash equivalents 2,420 422
Cash and cash equivalents at 1 July 12,038 11,635
Effects of exchange rate changes on cash 369 (19)
Cash and cash equivalents at 30 June 8 14,827 12,038
The consolidated statement of cash flows is to be read in conjunction with the notes to the financial statements set out on pages 49 to 77.
Inte
grat
ed R
esea
rch
and
its c
ontr
olle
d en
tities
• A
nnua
l Rep
ort 2
013
48
For
per
sona
l use
onl
y
Letter from the Chairm
anDirectors and Senior M
anagement
Directors’ ReportRem
uneration ReportCorporate Governance Statem
entIndependent Audit Report
Financial Statements
Note 1: Significant accounting policies Integrated Research Limited (the “Company”) is a Company domiciled in Australia. The financial report of the Company for the year ended 30 June 2013 comprises the Company and its subsidiaries (together referred to as the “consolidated entity”).
The financial report was authorised for issue by the Directors on 19 August 2013.
Integrated Research is a for-profit Company limited by ordinary shares.
a) Statement of Compliance
The financial report is a general purpose financial report which has been prepared in accordance with Australian Accounting Standards, and Interpretations and the Corporations Act 2001. Accounting Standards include Australian Equivalent to International Financial Reporting Standards (“IFRS”). Compliance with IFRS ensures the financial statements of the consolidated entity also comply with International Financial Reporting Standards and interpretations adopted by the International Accounting Standards Board.
b) Basis of Preparation
The financial statements are presented in Australian dollars and are prepared on the historical cost basis, with the exception of cash flow hedges, which are at fair value.
The Company is of a kind referred to in ASIC Class Order (CO) 98/100 dated 10 July 1998 (updated by CO 05/641 effective 28 July 2005 and CO 06/51 effective 31 January 2006) and in accordance with that Class Order, amounts in the financial report and Directors’ Report have been rounded off to the nearest thousand dollars, unless otherwise stated.
The preparation of financial statements in conformity with Australian Accounting Standards requires management to make judgements, estimates and assumptions that affect the application of policies and reported amounts of assets and liabilities, income and expenses. The estimates and associated assumptions are based on historical experience and various other factors that are believed to be reasonable under the circumstances, the results of which form the basis of making the judgements about carrying values of assets and liabilities that are not readily apparent from other sources. Actual results may differ from these estimates. These accounting policies have been consistently applied by each entity in the consolidated entity.
The estimates and underlying assumptions are reviewed on an ongoing basis. Revisions to accounting estimates are recognised in the period in which the estimate is revised if the revision affects only that period or in the period of the revision and future periods if the revision affects both current and future periods.
New accounting standards and Interpretations
Changes in accounting policy and disclosures:
The accounting policies adopted are consistent with those of the previous financial year except as noted below.
Standard/Interpretation
AASB2011-9 ‘Amendments to Australian Accounting Standards - Presentation of Items of Other Comprehensive Income [AASB 1, 5, 7, 101, 112, 120, 121, 132, 133, 134, 1039 & 1049].
This standard requires entities to group items presented in other comprehensive income on the basis of whether they might be reclassified subsequently to profit or loss and those that will not.
Notes to the Financial StatementsFor the year ended 30 June 2013
49Integrated Research and its controlled entities • Annual Report 2013
For
per
sona
l use
onl
y

Financial Statements
Note 1: Significant accounting policies (cont.)
Standards and Interpretations issued not yet effective
At the date of authorisation of the financial report, a number of standards and Interpretations were in issue but not yet effective.
Initial application of the following Standards is not expected to materially affect any of the amounts recognised in the financial statements, but may change the disclosures presently made in relation to the consolidated entity’s financial statements:
Standard/Interpretation
Effective for annual reporting periods
beginning on or after
Expected to be initially applied in the financial year ending
AASB9 ‘Financial Instruments’ 1 July 2015 30 June 2016
AASB 10 ‘Consolidated Financial Statements’ 1 July 2013 30 June 2014
AASB13 ‘Fair Value Measurement’ 1 July 2013 30 June 2014
AASB119 ‘Employee Benefits’ 1 Jan 2013 30 June 2014
AASB2012-2 ‘Amendments to Australian Accounting Standards - Disclosures - Offsetting Financial Assets and Financial Liabilities’ 1 Jan 2013 30 June 2014
AASB2012-3 ‘Amendments to Australian Accounting Standards - Offsetting Financial Assets and Financial Liabilities’ 1 Jan 2013 30 June 2014
The accounting policies set out below have been applied consistently to all periods presented in the consolidated financial statements.
c) Basis of consolidation
Subsidiaries are entities controlled by the Company. Control exists when the Company has the power, directly or indirectly, to govern the financial and operating policies of an entity so as to obtain benefits from its activities. In assessing control, potential voting rights that presently are exercisable or convertible are taken into account. The financial statements of subsidiaries are included in the consolidated financial report from the date that control commences until the date that control ceases.
Intragroup balances and any gains and losses or income and expenses arising from intragroup transactions, are eliminated in preparing the consolidated financial statements.
d) Foreign currency
In preparing the financial statements of the individual entities transactions in foreign currencies are translated at the foreign exchange rate ruling at the date of the transaction. Monetary assets and liabilities denominated in foreign currencies at the year end date are translated to Australian dollars at the foreign exchange rate ruling at that date. Foreign exchange differences arising on translation are recognised in profit or loss. Non-monetary assets and liabilities that are measured in terms of historical cost in a foreign currency are translated using the exchange rate at the date of the transaction. Non-monetary assets and liabilities denominated in foreign currencies that are stated at fair value are translated to Australian dollars at foreign exchange rates ruling at the dates the fair value was determined.
On consolidation, the assets and liabilities of foreign operations, including goodwill and fair value adjustments arising on consolidation are translated to Australian dollars at foreign exchange rates ruling at the year end date. The revenues and expenses of foreign operations, are translated to Australian dollars at rates approximating the foreign exchange rates ruling at the dates of the transactions. Foreign exchange differences arising on retranslation are recognised directly in other comprehensive income and accumulated in the translation reserve.
Inte
grat
ed R
esea
rch
and
its c
ontr
olle
d en
tities
• A
nnua
l Rep
ort 2
013
50
For
per
sona
l use
onl
y

Letter from the Chairm
anDirectors and Senior M
anagement
Directors’ ReportRem
uneration ReportCorporate Governance Statem
entIndependent Audit Report
Financial Statements
Note 1: Significant accounting policies (cont.)
e) Derivative financial instruments
The consolidated entity uses derivative financial instruments to hedge its exposure to foreign exchange risks arising from operational activities. In accordance with its treasury policy, the consolidated entity does not hold or issue derivative financial instruments for trading purposes.
Derivative financial instruments are recognised initially at cost. Subsequent to initial recognition, derivative financial instruments are stated at fair value. The gain or loss on remeasurement to fair value is recognised immediately in profit or loss. However, where derivatives qualify for hedge accounting, recognition of any resultant gain or loss depends on the nature of the item being hedged.
The fair value of forward exchange contracts is their quoted market price at the year end date, being the present value of the quoted forward price.
f) Hedging
On entering into a hedging relationship, the consolidated entity normally designates and documents the hedge relationship and risk management objective and strategy for undertaking the hedge. The documentation includes identification of the hedging instrument, the hedged item or transaction, the nature of the risk being hedged and how the entity will assess the hedging instrument’s effectiveness in offsetting the exposure to changes in the item’s fair value or cash flows attributable to the hedged risk. Such hedges are expected to be highly effective in offsetting changes in fair value or cash flows and are assessed on an ongoing basis to determine that they actually have been highly effective throughout the financial reporting periods for which they are designated.
For cash flow hedges, the associated cumulative gain or loss is removed from equity and recognised in profit or loss in the same period or periods during which the hedged forecast transaction affects profit or loss. The ineffective part of any gain or loss is recognised immediately in the profit or loss.
g) Property, plant and equipment
Items of property, plant and equipment are stated at cost or deemed cost less accumulated depreciation and impairment losses (see accounting policy (k)). The cost of acquired assets includes (i) the initial estimate at the time of installation and during the period of use, when relevant, of the costs of dismantling and removing the items and restoring the site on which they are located, and (ii) changes in the measurement of existing liabilities recognised for these costs resulting from changes in the timing or outflow of resources required to settle the obligation or from changes in the discount rate.
Where parts of an item of property, plant and equipment have different useful lives, they are accounted for as separate items of property, plant and equipment.
Depreciation is provided on property, plant and equipment. Depreciation is calculated on a straight line basis so as to write off the net cost of each asset over its expected useful life to its estimated residual value. Leasehold improvements are depreciated over the period of the lease or estimated useful life, whichever is the shorter, using the straight line method. The estimated useful lives, residual values and depreciation method are reviewed annually, with the effect of any changes recognised on a prospective basis.
The following useful lives are used in the calculation of depreciation:
Leasehold improvements 6 to 10 years
Plant and equipment 4 to 8 years
h) Intangible Assets
Research and development
Expenditure on research activities, undertaken with the prospect of gaining new scientific or technical knowledge and understanding, is recognised in profit or loss as incurred.
Expenditure on development activities, whereby research findings are applied to a plan or design for the production of new or substantially improved products and processes, is capitalised if the product or process is technically and commercially feasible and the consolidated entity has sufficient resources to complete development.
The useful lives of the capitalised are assessed as finite.
51Integrated Research and its controlled entities • Annual Report 2013
For
per
sona
l use
onl
y

Financial Statements
Note 1: Significant accounting policies (cont.)
The expenditure capitalised includes the cost of materials, direct labour and an appropriate proportion of overheads. Other development expenditure is recognised in profit or loss as an expense as incurred. Capitalised development expenditure is stated at cost less accumulated amortisation and impairment losses (see accounting policy (k)).
Amortisation is charged to profit or loss on a straight-line basis over the estimated useful life, but no more than three years.
Intellectual property
Intellectual property acquired from third parties is amortised over its estimated useful life, but no more than three years.
Computer software
Computer software is stated at cost and depreciated on a straight-line basis over a 2½ to 3 year period.
i) Trade and other receivables
Trade and other receivables are stated at their amortised cost less impairment losses. The carrying amount of uncollectible trade receivables is reduced by an impairment loss through the use of an allowance account.
Allowance for returns is offset against trade receivables for estimated warranty claims based upon historical experience.
j) Cash and cash equivalents
Cash and cash equivalents comprises cash balances and call deposits with an original maturity of three months or less.
k) Impairment
The carrying amounts of the consolidated entity’s assets are reviewed at each reporting date to determine whether there is any indication of impairment. If any such indication exists, the asset’s recoverable amount is estimated.
For intangible assets that are not yet available for use, the recoverable amount is estimated at each year end date.
An impairment loss is recognised whenever the carrying amount of an asset or its cash generating unit exceeds its recoverable amount. Impairment losses are recognised in profit or loss unless the asset has previously been revalued, in which case the impairment loss is recognised as a reversal to the extent of that previous revaluation with any excess recognised through profit or loss.
The recoverable amount of other assets is the greater of their fair value less costs to sell and value in use. In assessing value in use, the estimated future cash flows are discounted to their present value using a pre-tax discount rate that reflects current market assessments of the time value of money and the risks specific to the asset. For an asset that does not generate largely independent cash inflows, the recoverable amount is determined for the cash-generating unit to which the asset belongs.
l) Employee benefits
Superannuation
Obligations for contributions to defined contribution pension plans are recognised as an expense in profit or loss as incurred. There are no defined benefit plans in operation.
Long‑term service benefits
The consolidated entity’s net obligation in respect of long-term service benefits, other than pension plans, is the amount of future benefit that employees have earned in return for their service in the current and prior periods. The obligation is calculated using expected future increases in wage and salary rates including related on-costs and expected settlement dates, and is discounted using the rates attached to the Commonwealth Government bonds at the year end date which have maturity dates approximating to the terms of the consolidated entity’s obligations.
Share‑based payment transactions
The share option and performance rights programmes allows the consolidated entity’s employees to acquire shares of the Company. The fair value of options and performance rights granted are recognised as an employee expense with a corresponding increase in equity. The fair value is measured at grant date and spread over the period during which the employees become unconditionally entitled to the options or the performance rights. The fair value of the instrument granted is measured using a binomial option pricing model, taking into account the terms and conditions upon which the options were granted. The amount recognised as an expense is adjusted to reflect the actual number of share options or performance rights that are expected to vest.
Inte
grat
ed R
esea
rch
and
its c
ontr
olle
d en
tities
• A
nnua
l Rep
ort 2
013
52
For
per
sona
l use
onl
y

Letter from the Chairm
anDirectors and Senior M
anagement
Directors’ ReportRem
uneration ReportCorporate Governance Statem
entIndependent Audit Report
Financial Statements
Note 1: Significant accounting policies (cont.)
Wages, salaries, annual leave, and non‑monetary benefits
Liabilities for employee benefits for wages, salaries and annual leave represent present obligations resulting from employees’ services provided to the year end date, calculated at undiscounted amounts based on remuneration wage and salary rates that the consolidated entity expects to pay as at the year end date.
m) Provisions
A provision is recognised in the statement of financial position when the consolidated entity has a present legal or constructive obligation as a result of a past event, and it is probable that an outflow of economic benefits will be required to settle the obligation. Provisions are determined by discounting the expected future cash flows at a pre-tax rate that reflects current market assessments of the time value of money and, where appropriate, the risks specific to the liability.
Employee benefits
Provisions for employee benefits include liabilities for annual leave and long service leave and are measured at the amounts expected to be paid when the liabilities are settled.
Make good
The make good provision is for leases undertaken by the Company. For each provision raised a corresponding asset has been recognised and is amortised over the shorter of the term of the lease or the useful life of the asset.
n) Trade and other payables
Trade and other payables are stated at their amortised cost.
o) Revenue
The consolidated entity allocates revenue to each element in software arrangements involving multiple elements based on the relative fair value of each element. The typical elements in the multiple element arrangement are licence and maintenance fees. The Company’s determination of fair value is generally based on the price charged when the same element is sold separately.
Revenue from the sale of licences, where the consolidated entity has no post delivery obligations to perform is recognised in profit or loss at the date of delivery of the licence key.
Revenue from maintenance contracts is recognised rateably over the term of the service agreement, which is typically one year. Maintenance contracts are typically priced based on a percentage of licence fees and have a one year term. Services provided to customers under maintenance contracts include technical support and supply of software updates.
Revenue from multiple element software arrangements, where the fair value of an undelivered element cannot be reliably measured are recognised over the period the undelivered services are provided.
Revenue from consulting services is recognised over the period the services are provided.
No revenue is recognised if there are significant uncertainties regarding the recovery of the consideration due, the costs incurred or to be incurred cannot be measured reliably, there is a risk of return of goods or there is continuing management involvement with the goods.
p) Expenses
Operating lease payments
Payments made under operating leases are recognised in profit or loss on a straight-line basis over the term of the lease. Lease incentives received are recognised in profit or loss as an integral part of the total lease expense and spread over the lease term.
Financing income
Financing income comprises interest receivable on funds invested.
q) Income tax
Income tax on the profit or loss for the periods presented comprises current and deferred tax. Income tax is recognised in profit or loss except to the extent that it relates to items recognised directly in equity, in which case it is recognised in equity.
Current tax is the expected tax payable on the taxable income for the year, using tax rates enacted or substantively enacted at the year end date, and any adjustment to tax payable in respect of previous years.
53Integrated Research and its controlled entities • Annual Report 2013
For
per
sona
l use
onl
y

Financial Statements
Note 1: Significant accounting policies (cont.)
Deferred tax is recognised on temporary differences between the carrying amounts of assets and liabilities for financial reporting purposes and the amounts used for taxation purposes. The amount of deferred tax provided is based on the expected manner of realisation or settlement of the carrying amount of assets and liabilities, using tax rates enacted or substantively enacted at the year end date.
A deferred tax asset is recognised only to the extent that it is probable that future taxable profits will be available against which the asset can be utilised. Deferred tax assets are reduced to the extent that it is no longer probable that the related tax benefit will be realised.
Additional dividend franking deficit tax that arises from the distribution of dividends are recognised at the same time as the liability to pay the related dividend.
r) Goods and Services Tax
Revenue, expenses and assets are recognised net of the amount of goods and services tax (GST), or similar taxes, except where the amount of GST incurred is not recoverable from the taxation authority. In these circumstances, the GST is recognised as part of the cost of acquisition of the asset or as part of the expense.
Receivables and payables are stated with the amount of GST included. The net amount of GST recoverable or payable is included as a current asset or liability in the statement of financial position.
Cash flows are included in the statement of cash flows on a gross basis. The GST components of cash flows arising from investing and financing activities, which are recoverable or payable are classified as operating cash flows.
s) Significant accounting judgements, estimates and assumptions
The carrying amounts of certain assets and liabilities are often determined based on estimates and assumptions of future events. The key estimates and assumptions that have a significant risk of causing a material adjustment to the carrying amounts of certain assets and liabilities within the next annual reporting period are:
Intangible assets
An intangible asset arising from development expenditure on an internal project is recognised only when the consolidated entity can demonstrate the technical feasibility of completing the intangible asset so that it will be available for use or sale, its intention to complete and its ability to use or sell the asset, how the asset will generate future economic benefits, the availability of resources to complete the development and the ability to measure reliably the expenditure attributable to the intangible asset during its development. Following the initial recognition of the development expenditure, the cost model is applied requiring the asset to be carried at cost less any accumulated amortisation and accumulated impairment losses. Any expenditure so capitalised is amortised over the period of expected benefits from the related project commencing from the commercial release of the project. The carrying value of an intangible asset arising from development expenditure is tested for impairment annually when the asset is not yet available for use or more frequently when an indication of impairment arises during the reporting period.
Share based payment transactions
The consolidated entity measures the cost of equity-settled transactions with employees by reference to the fair value of the equity instruments at the date at which they are granted. The fair value is determined by using a binomial option pricing model and applying management determined probability factors relating to non-market vesting conditions.
Receivables
The consolidated entity assesses impairment of receivables based upon assessment of objective evidence for significant receivables and by placing non significant receivables in portfolios of similar risk profiles, based on objective evidence from historical experience adjusted for any effects of conditions existing at each reporting date. This assessment includes judgements and estimates of future outcomes the actual results of which may differ from the estimates at the reporting date.
Inte
grat
ed R
esea
rch
and
its c
ontr
olle
d en
tities
• A
nnua
l Rep
ort 2
013
54
For
per
sona
l use
onl
y

Letter from the Chairm
anDirectors and Senior M
anagement
Directors’ ReportRem
uneration ReportCorporate Governance Statem
entIndependent Audit Report
Financial Statements
Note 2. Segment reportingThe information reported to the CODM (being the Chief Executive Officer) for the purposes of resource allocation and assessment of performance is focused on geographical performance. The principal geographical regions are The Americas - Operating from the United States with responsibility for the countries in North, Central and South America, Europe - operating from the United Kingdom with responsibility for the countries in Europe, Asia Pacific - operating from Australia with responsibility for the countries in the rest of the world and Corporate Australia - includes revenue and expenses for research and development and corporate head office functions of the Company.
Inter‑segment pricing is determined on an arm’s length basis.
Segment profit represents the profit earned by each segment without allocation of investment revenue and income tax expense. This is the measure reported to the chief operating decision maker for the purposes of resource allocation and assessment of segment performance.
Information regarding these segments is presented below. The accounting policies of the reportable segments are the same as the Group’s accounting policies.
In thousands of AUD
Americas Europe Asia PacificCorporate Australia1 Eliminations Consolidated
2013 2012 2013 2012 2013 2012 2013 2012 2013 2012 2013 2012
Sales to customers outside the consolidated entity 34,432 31,890 6,939 7,183 7,496 8,668 (8) 867 ‑ ‑ 48,859 48,608
Inter‑segment sales ‑ ‑ ‑ ‑ ‑ ‑ 27,675 26,594 (27,675) (26,594) ‑ ‑
Total segment revenue 34,432 31,890 6,939 7,183 7,496 8,668 27,667 27,461 (27,675) (26,594) 48,859 48,608
Total revenue 48,859 48,608
Segment results 861 784 174 175 187 244 9,892 9,856 ‑ ‑ 11,114 11,059
Results from operating activities 11,114 11,059
Financing income (interest received) 456 509
Income tax expense (2,492) (2,533)
Profit for the year 9,078 9,035
Capital additions2 76 203 25 32 ‑ ‑ 515 504 ‑ ‑ 616 739
Depreciation and amortisation expenditure 96 67 27 20 ‑ ‑ 7,320 7,402 ‑ ‑ 7,445 7,489
Non‑current assets 3,513 1,048 128 108 ‑ ‑ 17,227 17,478 (54) (54) 20,814 18,580
In local currency3
Americas(USD)
Europe(GBP)
2013 2012 2013 2012
Sales to customers outside the consolidated entity 35,247 33,137 4,519 4,687
Inter‑segment sales ‑ ‑ ‑ ‑
Total segment revenue 35,247 33,137 4,519 4,687
Segment results 881 825 113 114
1 Corporate Australia includes both the research and development and corporate head office functions of the Integrated Research Limited. 2 Excludes internal development costs capitalised but includes third party assets acquired.3 Segment results represented in local currencies as reviewed by the Chief Operating Decision Maker.
55Integrated Research and its controlled entities • Annual Report 2013
For
per
sona
l use
onl
y
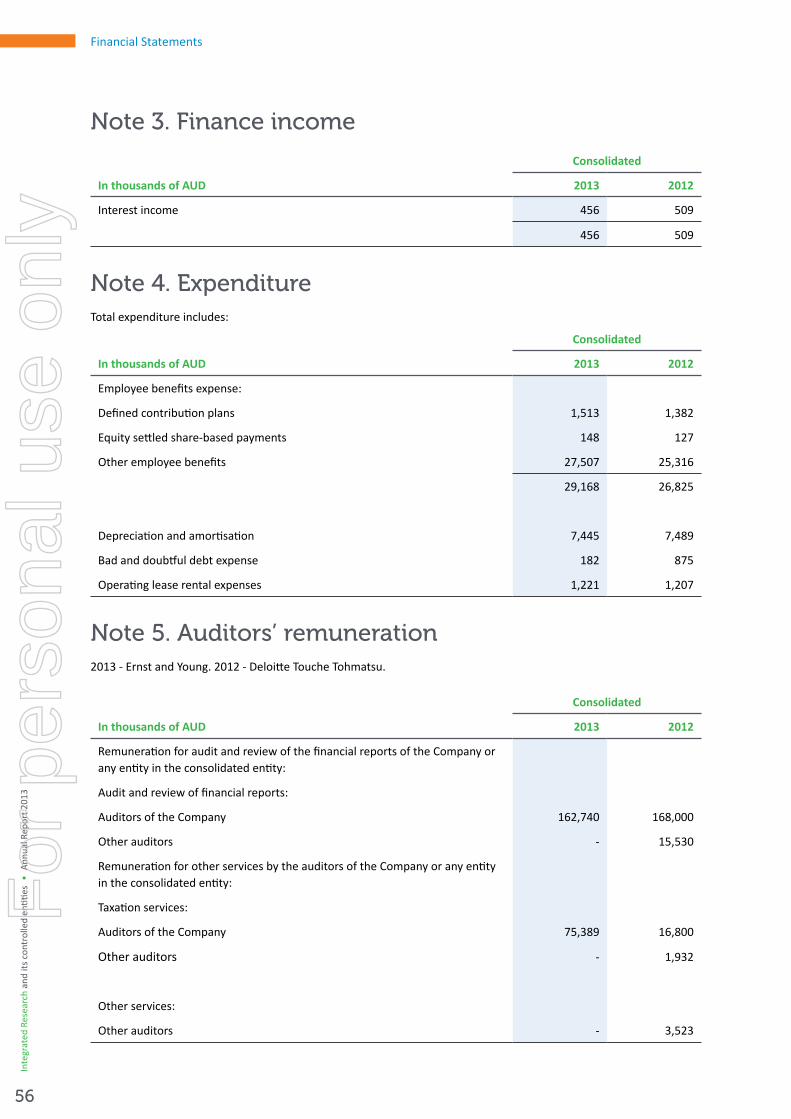
Financial Statements
Note 3. Finance income
In thousands of AUD
Consolidated
2013 2012
Interest income 456 509
456 509
Note 4. ExpenditureTotal expenditure includes:
In thousands of AUD
Consolidated
2013 2012
Employee benefits expense:
Defined contribution plans 1,513 1,382
Equity settled share-based payments 148 127
Other employee benefits 27,507 25,316
29,168 26,825
Depreciation and amortisation 7,445 7,489
Bad and doubtful debt expense 182 875
Operating lease rental expenses 1,221 1,207
Note 5. Auditors’ remuneration2013 - Ernst and Young. 2012 - Deloitte Touche Tohmatsu.
In thousands of AUD
Consolidated
2013 2012
Remuneration for audit and review of the financial reports of the Company or any entity in the consolidated entity:
Audit and review of financial reports:
Auditors of the Company 162,740 168,000
Other auditors ‑ 15,530
Remuneration for other services by the auditors of the Company or any entity in the consolidated entity:
Taxation services:
Auditors of the Company 75,389 16,800
Other auditors ‑ 1,932
Other services:
Other auditors ‑ 3,523
Inte
grat
ed R
esea
rch
and
its c
ontr
olle
d en
tities
• A
nnua
l Rep
ort 2
013
56
For
per
sona
l use
onl
y

Letter from the Chairm
anDirectors and Senior M
anagement
Directors’ ReportRem
uneration ReportCorporate Governance Statem
entIndependent Audit Report
Financial Statements
Note 6. Income tax expenseRecognised in profit for the year
In thousands of AUD Note
Consolidated
2013 2012
Current tax expense:
Current year 2,430 2,326
Prior year adjustments (93) (24)
2,337 2,302
Deferred tax expense:
Origination and reversal of temporary differences 13 155 231
Total income tax expense in profit and loss 2,492 2,533
Numerical reconciliation between income tax expense and profit before tax
In thousands of AUD
Consolidated
2013 2012
Profit before tax 11,570 11,568
Income tax using the domestic corporate tax rate of 30% 3,471 3,470
Increase in income tax expense due to:
Non-deductible expenses 105 79
Effect of tax rates in foreign jurisdictions 76 105
Decrease in income tax expense due to:
R&D tax incentive (1,144) (1,097)
Other 77 ‑
Prior year adjustments (93) (24)
Income tax expense 2,492 2,533
57Integrated Research and its controlled entities • Annual Report 2013
For
per
sona
l use
onl
y

Financial Statements
Note 7. Earnings per shareThe calculation of basic and diluted earnings per share at 30 June 2013 was based on the profit attributable to ordinary shareholders of $9,078,000 (2012: $9,035,000); a weighted number of ordinary shares outstanding during the year ended 30 June 2013 of 168,226,574 (2012: 166,977,446); and a weighted number of ordinary shares (diluted) outstanding during the year ended 30 June 2013 of 169,659,715 (2012: 168,086,211), calculated as follows:
In thousands of AUD
Consolidated
2013 2012
Profit for the year 9,078 9,035
Weighted average number of shares used as the denominator
(Number)
Consolidated
2013 2012
Number for basic earnings per share:
Ordinary shares 168,226,574 166,977,446
Effect of employee share plans on issue 1,433,141 1,108,765
Number for diluted earnings per share 169,659,715 168,086,211
Basic earnings per share (AUD cents) 5.40 5.41
Diluted earnings per share (AUD cents) 5.35 5.38
Note 8. Cash and cash equivalents
In thousands of AUD
Consolidated
2013 2012
Cash at bank and on hand 14,827 12,038
Inte
grat
ed R
esea
rch
and
its c
ontr
olle
d en
tities
• A
nnua
l Rep
ort 2
013
58
For
per
sona
l use
onl
y
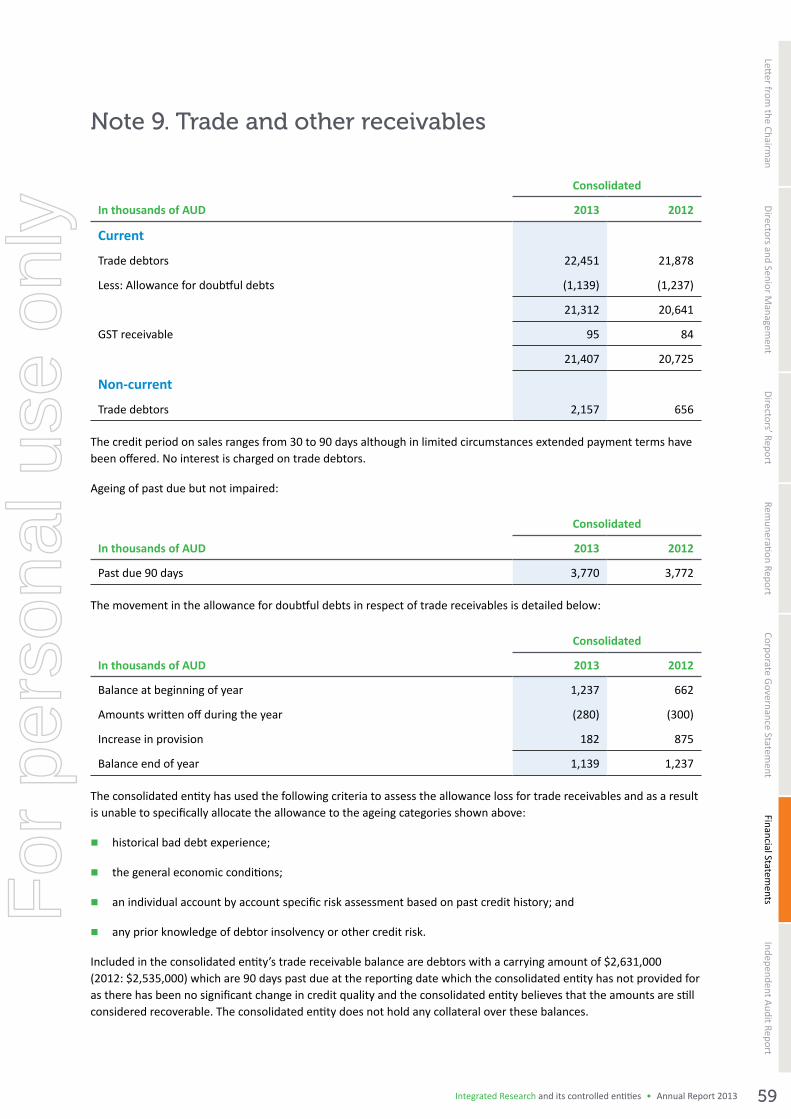
Letter from the Chairm
anDirectors and Senior M
anagement
Directors’ ReportRem
uneration ReportCorporate Governance Statem
entIndependent Audit Report
Financial Statements
Note 9. Trade and other receivables
In thousands of AUD
Consolidated
2013 2012
Current
Trade debtors 22,451 21,878
Less: Allowance for doubtful debts (1,139) (1,237)
21,312 20,641
GST receivable 95 84
21,407 20,725
Non-current
Trade debtors 2,157 656
The credit period on sales ranges from 30 to 90 days although in limited circumstances extended payment terms have been offered. No interest is charged on trade debtors.
Ageing of past due but not impaired:
In thousands of AUD
Consolidated
2013 2012
Past due 90 days 3,770 3,772
The movement in the allowance for doubtful debts in respect of trade receivables is detailed below:
In thousands of AUD
Consolidated
2013 2012
Balance at beginning of year 1,237 662
Amounts written off during the year (280) (300)
Increase in provision 182 875
Balance end of year 1,139 1,237
The consolidated entity has used the following criteria to assess the allowance loss for trade receivables and as a result is unable to specifically allocate the allowance to the ageing categories shown above:
� historical bad debt experience;
� the general economic conditions;
� an individual account by account specific risk assessment based on past credit history; and
� any prior knowledge of debtor insolvency or other credit risk.
Included in the consolidated entity’s trade receivable balance are debtors with a carrying amount of $2,631,000 (2012: $2,535,000) which are 90 days past due at the reporting date which the consolidated entity has not provided for as there has been no significant change in credit quality and the consolidated entity believes that the amounts are still considered recoverable. The consolidated entity does not hold any collateral over these balances.
59Integrated Research and its controlled entities • Annual Report 2013
For
per
sona
l use
onl
y

Financial Statements
Note 10. Other current assets
In thousands of AUD
Consolidated
2013 2012
Other prepayments 781 676
Fair value of hedge asset - forward foreign exchange contracts ‑ 277
781 953
Note 11. Other financial assets
In thousands of AUD
Consolidated
2013 2012
Deposits 724 1,802
The carrying amount of other financial assets is a reasonable approximation of their fair value.
Note 12. Property, plant and equipment
In thousands of AUD
Consolidated
2013 2012
Plant and EquipmentAt cost 4,899 4,321
Accumulated depreciation (3,972) (3,458)
927 863
Leasehold ImprovementsAt cost 2,021 2,068
Accumulated depreciation (1,242) (1,111)
779 957
Total property, plant and equipmentAt cost 6,920 6,389
Accumulated depreciation (5,214) (4,569)
Total written down amount 1,706 1,820
Plant and EquipmentCarrying amount at start of year 863 792
Additions 482 445
Effects of foreign currency exchange 11 6
Depreciation expense (429) (380)
Carrying amount at end of year 927 863
Leasehold ImprovementsCarrying amount at start of year 957 1,083
Additions 13 73
Effects of foreign currency exchange 9 (1)
Depreciation expense (200) (198)
Carrying amount at end of year 779 957Inte
grat
ed R
esea
rch
and
its c
ontr
olle
d en
tities
• A
nnua
l Rep
ort 2
013
60
For
per
sona
l use
onl
y
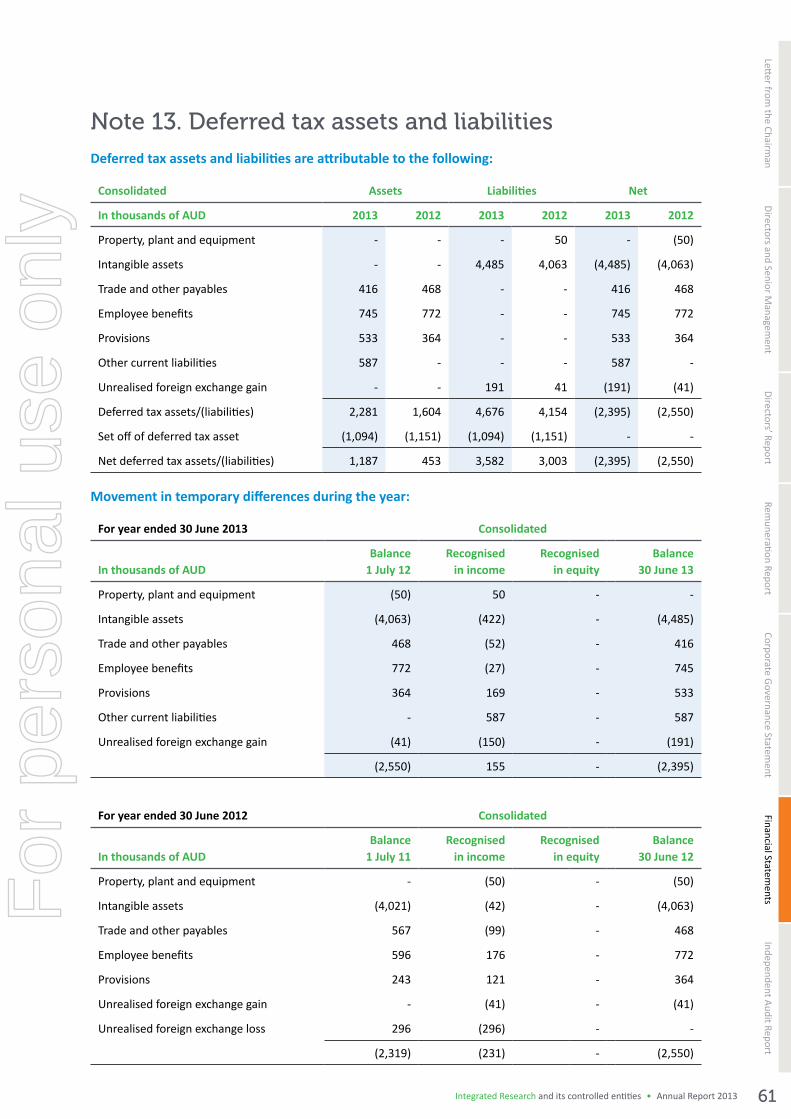
Letter from the Chairm
anDirectors and Senior M
anagement
Directors’ ReportRem
uneration ReportCorporate Governance Statem
entIndependent Audit Report
Financial Statements
Note 13. Deferred tax assets and liabilitiesDeferred tax assets and liabilities are attributable to the following:
Consolidated Assets Liabilities Net
In thousands of AUD 2013 2012 2013 2012 2013 2012
Property, plant and equipment ‑ ‑ ‑ 50 ‑ (50)
Intangible assets ‑ ‑ 4,485 4,063 (4,485) (4,063)
Trade and other payables 416 468 ‑ ‑ 416 468
Employee benefits 745 772 ‑ ‑ 745 772
Provisions 533 364 ‑ ‑ 533 364
Other current liabilities 587 ‑ ‑ ‑ 587 ‑
Unrealised foreign exchange gain ‑ ‑ 191 41 (191) (41)
Deferred tax assets/(liabilities) 2,281 1,604 4,676 4,154 (2,395) (2,550)
Set off of deferred tax asset (1,094) (1,151) (1,094) (1,151) ‑ ‑
Net deferred tax assets/(liabilities) 1,187 453 3,582 3,003 (2,395) (2,550)
Movement in temporary differences during the year:
For year ended 30 June 2013 Consolidated
In thousands of AUDBalance
1 July 12Recognised
in incomeRecognised
in equityBalance
30 June 13
Property, plant and equipment (50) 50 ‑ ‑
Intangible assets (4,063) (422) ‑ (4,485)
Trade and other payables 468 (52) ‑ 416
Employee benefits 772 (27) ‑ 745
Provisions 364 169 ‑ 533
Other current liabilities ‑ 587 ‑ 587
Unrealised foreign exchange gain (41) (150) ‑ (191)
(2,550) 155 ‑ (2,395)
For year ended 30 June 2012 Consolidated
In thousands of AUDBalance
1 July 11Recognised
in incomeRecognised
in equityBalance
30 June 12
Property, plant and equipment ‑ (50) ‑ (50)
Intangible assets (4,021) (42) ‑ (4,063)
Trade and other payables 567 (99) ‑ 468
Employee benefits 596 176 ‑ 772
Provisions 243 121 ‑ 364
Unrealised foreign exchange gain ‑ (41) ‑ (41)
Unrealised foreign exchange loss 296 (296) ‑ ‑
(2,319) (231) ‑ (2,550)
61Integrated Research and its controlled entities • Annual Report 2013
For
per
sona
l use
onl
y

Financial Statements
Note 14. Intangible assetsThe amortisation is recognised in the following line item in the statement of comprehensive income:
In thousands of AUD
Consolidated
2013 2012
Research and development expenses 6,816 6,911
6,816 6,911
In thousands of AUD
Consolidated
Software development
Third party software Total
CostBalance at 1 July 2011 21,419 1,483 22,902
Fully amortised & offset (7,242) ‑ (7,242)
Effects of foreign currency exchange ‑ 3 3
Internally developed 6,730 ‑ 6,730
Acquired 57 164 221
Balance at 30 June 2012 20,964 1,650 22,614
Balance at 1 July 2012 20,964 1,650 22,614
Fully amortised & offset (4,295) ‑ (4,295)
Effects of foreign currency exchange ‑ 14 14
Internally developed 7,882 ‑ 7,882
Acquired ‑ 121 121
Balance at 30 June 2013 24,551 1,785 26,336
AmortisationBalance at 1 July 2011 8,015 1,079 9,094
Fully amortised & offset (7,242) ‑ (7,242)
Effects of foreign currency exchange ‑ 2 2
Amortisation for year 6,649 262 6,911
Balance at 30 June 2012 7,422 1,343 8,765
Balance at 1 July 2012 7,422 1,343 8,765
Fully amortised & offset (4,295) ‑ (4,295)
Effects of foreign currency exchange ‑ 10 10
Amortisation for year 6,607 209 6,816
Balance at 30 June 2013 9,734 1,562 11,296
Carrying amountsBalance at 30 June 2012 13,542 307 13,849
Balance at 30 June 2013 14,817 223 15,040
Inte
grat
ed R
esea
rch
and
its c
ontr
olle
d en
tities
• A
nnua
l Rep
ort 2
013
62
For
per
sona
l use
onl
y

Letter from the Chairm
anDirectors and Senior M
anagement
Directors’ ReportRem
uneration ReportCorporate Governance Statem
entIndependent Audit Report
Financial Statements
Note 15. Trade and other payables
In thousands of AUD
Consolidated
2013 2012
Trade and other creditors 4,190 4,285
4,190 4,285
The average credit period on trade and other payables is 30 days.
Note 16. Employee benefits
In thousands of AUD
Consolidated
2013 2012
CurrentLiability for annual leave 1,549 1,314
Liability for long service leave 455 465
2,004 1,779
Non-currentLiability for long service leave 374 242
Pension plans
Employees of the consolidated entity accumulate pension benefits through statutory contributions by the entities in the consolidated entity as required by the laws of the jurisdictions in which they operate, supplemented by individual contributions.
Share based payments
Performance Rights
On 21 November 2011, the consolidated entity established the Integrated Research Performance Rights and Options Plan (IRPROP). The plan enables the Company to offer performance rights to eligible employees to obtain shares in Integrated Research at no cost contingent upon performance conditions being met. The performance conditions include either a service period with performance components or a service period with a net after tax profit hurdle. The performance rights are automatically exercised into shares upon the performance conditions being met. The following performance rights were granted during the period:
Grant date Number of rights Vesting date Expiry date
8 October 2012 411,250 31 Aug 2015 30 Sep 2015
The fair value of the performance rights including assumptions used are as follows:
Grant date 8 Oct 2012
Fair value at measurement date $0.884
Share price $1.10
Exercise price nil
Expected volatility 43.03%
Contractual life (expressed in days) 1,057
Expected dividends 7.5%
Risk-free interest rate (based on 3 year treasury bonds) 2.41%
63Integrated Research and its controlled entities • Annual Report 2013
For
per
sona
l use
onl
y
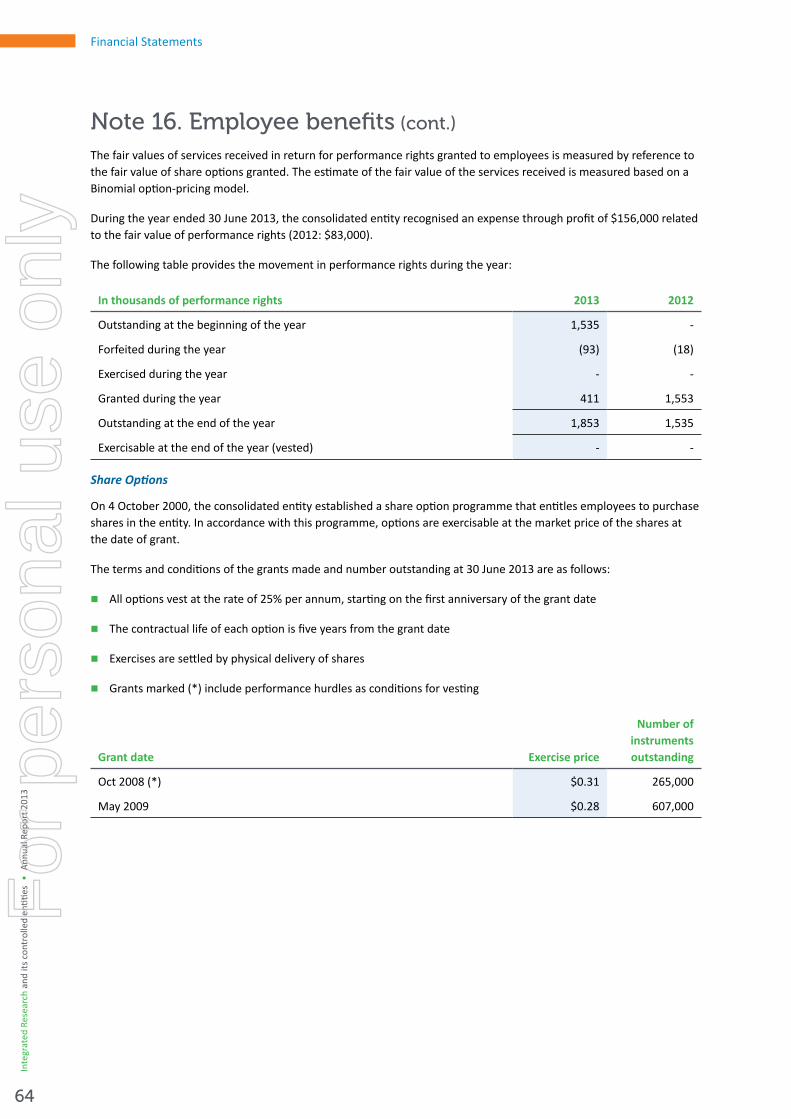
Financial Statements
Note 16. Employee benefits (cont.)
The fair values of services received in return for performance rights granted to employees is measured by reference to the fair value of share options granted. The estimate of the fair value of the services received is measured based on a Binomial option-pricing model.
During the year ended 30 June 2013, the consolidated entity recognised an expense through profit of $156,000 related to the fair value of performance rights (2012: $83,000).
The following table provides the movement in performance rights during the year:
In thousands of performance rights 2013 2012
Outstanding at the beginning of the year 1,535 ‑
Forfeited during the year (93) (18)
Exercised during the year ‑ ‑
Granted during the year 411 1,553
Outstanding at the end of the year 1,853 1,535
Exercisable at the end of the year (vested) ‑ ‑
Share Options
On 4 October 2000, the consolidated entity established a share option programme that entitles employees to purchase shares in the entity. In accordance with this programme, options are exercisable at the market price of the shares at the date of grant.
The terms and conditions of the grants made and number outstanding at 30 June 2013 are as follows:
� All options vest at the rate of 25% per annum, starting on the first anniversary of the grant date
� The contractual life of each option is five years from the grant date
� Exercises are settled by physical delivery of shares
� Grants marked (*) include performance hurdles as conditions for vesting
Grant date Exercise price
Number of instrumentsoutstanding
Oct 2008 (*) $0.31 265,000
May 2009 $0.28 607,000
Inte
grat
ed R
esea
rch
and
its c
ontr
olle
d en
tities
• A
nnua
l Rep
ort 2
013
64
For
per
sona
l use
onl
y

Letter from the Chairm
anDirectors and Senior M
anagement
Directors’ ReportRem
uneration ReportCorporate Governance Statem
entIndependent Audit Report
Financial Statements
Note 16. Employee benefits (cont.)
The number and weighted average exercise prices of share options is as follows:
In thousands of options
Weighted average
exercise priceNumber of
options
Weighted average
exercise priceNumber of
options
2013 2013 2012 2012
Outstanding at the beginning of the year $0.36 2,645 $0.37 3,872
Forfeited during the year $0.40 (912) $0.42 (572)
Exercised during the year $0.38 (861) $0.38 (655)
Granted during the year $‑ ‑ $‑ ‑
Outstanding at the end of the year $0.29 872 $0.36 2,645
Exercisable at the end of the year (vested) $0.28 467 $0.35 1,289
The options outstanding at 30 June 2013 have a weighted average exercise price of $0.29 and a weighted average of contractual life of five years from inception.
During the year ended 30 June 2013, 860,500 options were exercised (2012: 654,500).
The fair values of services received in return for share options granted to employees is measured by reference to the fair value of share options granted. The estimate of the fair value of the services received is measured based on the Binomial option-pricing model. The contractual life of the option (five years) is used as an input into this formula. Expectations of early exercise are incorporated into the Binomial formula.
There were no options granted during the 2013 financial year (2012:nil).
Note 17. Provisions
In thousands of AUD Note
Consolidated
2013 2012
Current
Employee benefits 16 2,004 1,779
2,004 1,779
Non-current
Employee benefits 16 374 242
Lease make good 382 379
756 621
65Integrated Research and its controlled entities • Annual Report 2013
For
per
sona
l use
onl
y
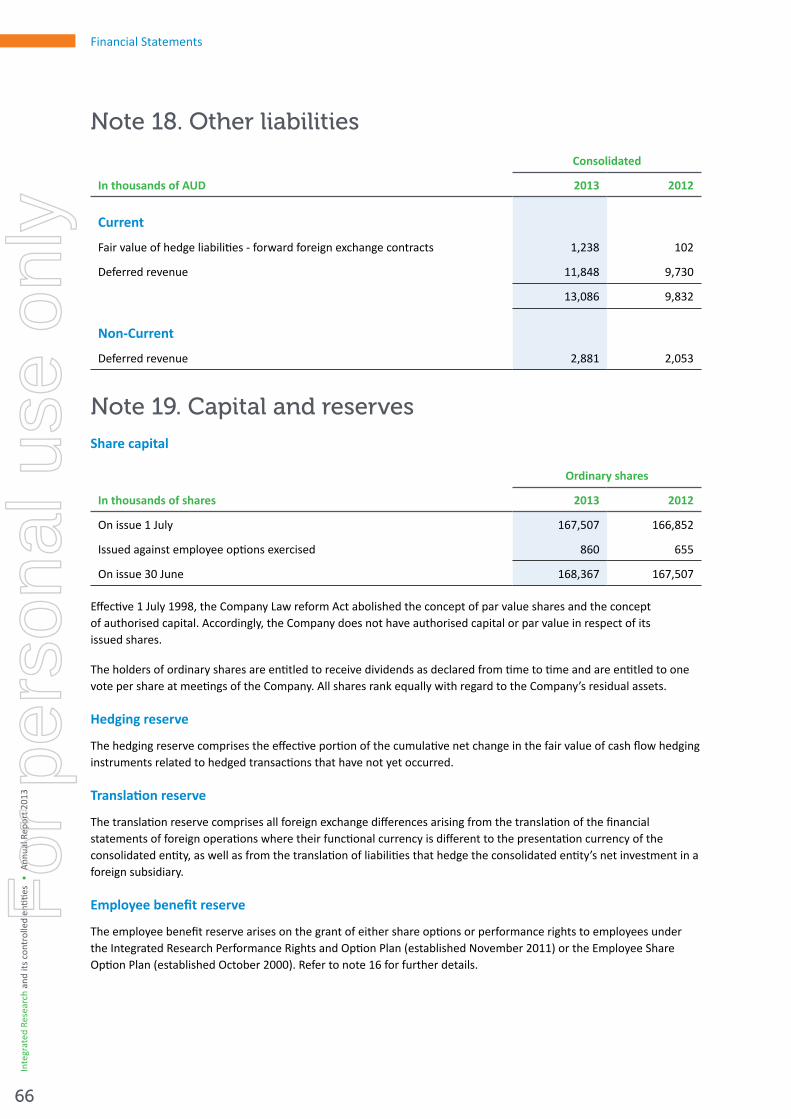
Financial Statements
Note 18. Other liabilities
In thousands of AUD
Consolidated
2013 2012
Current
Fair value of hedge liabilities - forward foreign exchange contracts 1,238 102
Deferred revenue 11,848 9,730
13,086 9,832
Non-Current
Deferred revenue 2,881 2,053
Note 19. Capital and reservesShare capital
In thousands of shares
Ordinary shares
2013 2012
On issue 1 July 167,507 166,852
Issued against employee options exercised 860 655
On issue 30 June 168,367 167,507
Effective 1 July 1998, the Company Law reform Act abolished the concept of par value shares and the concept of authorised capital. Accordingly, the Company does not have authorised capital or par value in respect of its issued shares.
The holders of ordinary shares are entitled to receive dividends as declared from time to time and are entitled to one vote per share at meetings of the Company. All shares rank equally with regard to the Company’s residual assets.
Hedging reserve
The hedging reserve comprises the effective portion of the cumulative net change in the fair value of cash flow hedging instruments related to hedged transactions that have not yet occurred.
Translation reserve
The translation reserve comprises all foreign exchange differences arising from the translation of the financial statements of foreign operations where their functional currency is different to the presentation currency of the consolidated entity, as well as from the translation of liabilities that hedge the consolidated entity’s net investment in a foreign subsidiary.
Employee benefit reserve
The employee benefit reserve arises on the grant of either share options or performance rights to employees under the Integrated Research Performance Rights and Option Plan (established November 2011) or the Employee Share Option Plan (established October 2000). Refer to note 16 for further details.
Inte
grat
ed R
esea
rch
and
its c
ontr
olle
d en
tities
• A
nnua
l Rep
ort 2
013
66
For
per
sona
l use
onl
y

Letter from the Chairm
anDirectors and Senior M
anagement
Directors’ ReportRem
uneration ReportCorporate Governance Statem
entIndependent Audit Report
Financial Statements
Note 19. Capital and reserves (cont.)
Dividends
Dividends recognised in the current year by the Company are:
In thousands of AUD Cents per share Total amountFranked/
unfrankedDate of
payment
2013
Final 2012 3.0 5,045 70% franked 14 Sep 2012
Interim 2013 2.0 3,368 30% franked 15 Mar 2013
Total amount 8,413
2012
Final 2011 2.5 4,172 75% franked 16 Sep 2011
Interim 2012 2.0 3,340 40% franked 16 Mar 2012
Total amount 7,512
After the end of the financial year, the following dividend was proposed by the Directors. The financial effect of this dividend has not been brought to account in the financial statements for the year ended 30 June 2013 and will be recognised in subsequent financial statements:
In thousands of AUD Cents per share Total amountFranked/
unfrankedDate of
payment
Final 2013 3.0 5,053 40% franked 13 Sep 13
The final dividend declared of 3.0 cents together with the interim dividend paid in March 2013 of 2.0 cents takes total dividends for the 2013 financial year to 5.0 cents.
Franking account disclosure:
In thousands of AUD
Company
2013 2012
Adjusted franking account balance 944 1,669
Impact on franking account balance of dividends not recognised (866) (1,510)
67Integrated Research and its controlled entities • Annual Report 2013
For
per
sona
l use
onl
y

Financial Statements
Note 20. Financial instrumentsCapital risk management
The consolidated entity manages its capital to ensure that controlled entities will be able to continue as a going concern while maximising the return to stakeholders through the optimisation of treasury management.
The capital structure of the consolidated entity consists of cash and cash equivalents and equity attributable to equity holders of the Company, comprising issued capital, reserves, and retained earnings as disclosed in Notes 8 and 19 respectively.
Significant accounting policies
Details of the significant accounting policies and methods adopted, including the criteria for recognition, the basis of measurement and the basis on which income and expenses are recognised, in respect of each class of financial asset, financial liability and equity instrument are disclosed in Note 1 to the financial statements.
Financial risk management objectives
The Board of Directors has overall responsibility for the establishment and oversight of the consolidated entity’s financial management framework. The Board has an established Audit and Risk Committee, which is responsible for developing and monitoring the consolidated entity’s financial management policies. The Committee provides regular reports to the Board of Directors on its activities.
The Audit and Risk Committee oversees how Management monitors compliance with risk management policies and procedures and reviews the adequacy of the risk management framework in relation to the risks.
The main risks arising from the consolidated entity’s financial instruments are currency risk, credit risk, liquidity risk and cash flow interest rate risk.
The consolidated entity seeks to minimise the effects of these risks, where deemed appropriate, by using derivative financial instruments to hedge these risk exposures. The use of financial derivatives is governed by the consolidated entity’s policies on foreign exchange risk, credit risk, the use of financial derivatives and non-derivative financial instruments, and the investment of excess liquidity. The consolidated entity does not enter into or trade financial instruments, including derivative financial instruments, for speculative purposes.
Market risk
The consolidated entity’s activities expose it primarily to the financial risks of changes in foreign currency exchange rates and cash flow interest rate risks. The consolidated entity enters into foreign exchange forward contracts to hedge the exchange rate risk arising from transactions not recorded in an entity’s functional currency.
Inte
grat
ed R
esea
rch
and
its c
ontr
olle
d en
tities
• A
nnua
l Rep
ort 2
013
68
For
per
sona
l use
onl
y
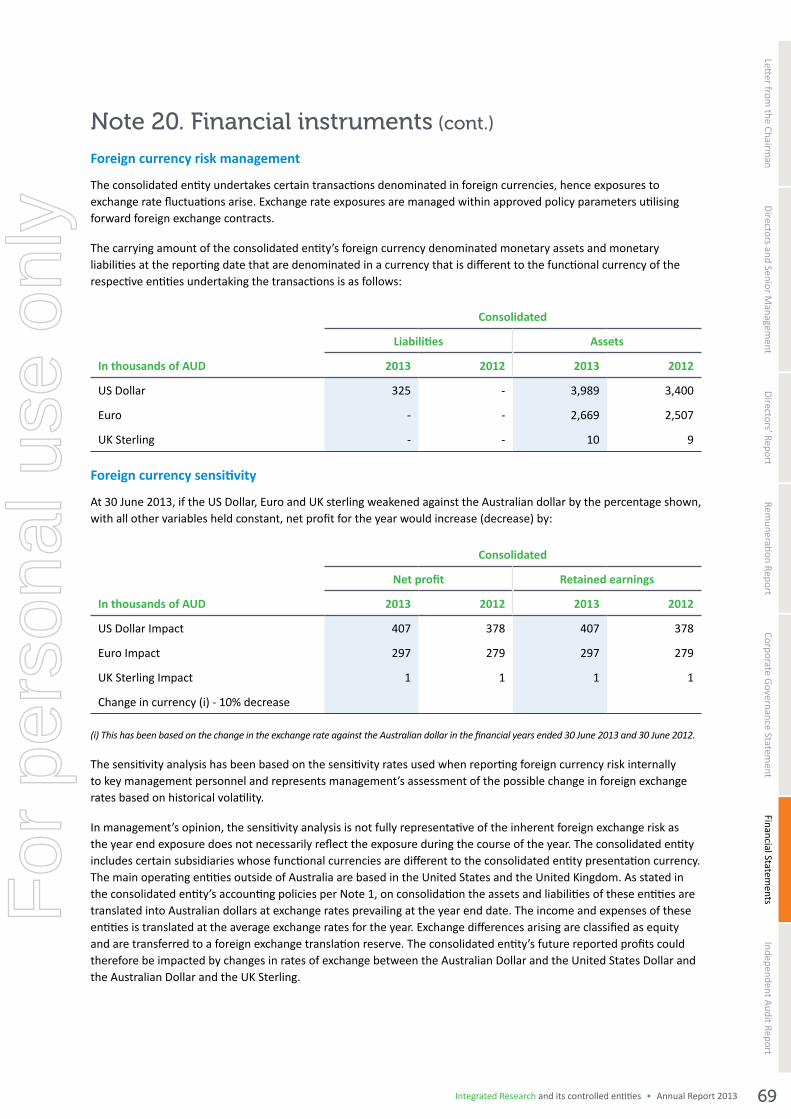
Letter from the Chairm
anDirectors and Senior M
anagement
Directors’ ReportRem
uneration ReportCorporate Governance Statem
entIndependent Audit Report
Financial Statements
Note 20. Financial instruments (cont.)
Foreign currency risk management
The consolidated entity undertakes certain transactions denominated in foreign currencies, hence exposures to exchange rate fluctuations arise. Exchange rate exposures are managed within approved policy parameters utilising forward foreign exchange contracts.
The carrying amount of the consolidated entity’s foreign currency denominated monetary assets and monetary liabilities at the reporting date that are denominated in a currency that is different to the functional currency of the respective entities undertaking the transactions is as follows:
In thousands of AUD
Consolidated
Liabilities Assets
2013 2012 2013 2012
US Dollar 325 ‑ 3,989 3,400
Euro ‑ ‑ 2,669 2,507
UK Sterling ‑ ‑ 10 9
Foreign currency sensitivity
At 30 June 2013, if the US Dollar, Euro and UK sterling weakened against the Australian dollar by the percentage shown, with all other variables held constant, net profit for the year would increase (decrease) by:
In thousands of AUD
Consolidated
Net profit Retained earnings
2013 2012 2013 2012
US Dollar Impact 407 378 407 378
Euro Impact 297 279 297 279
UK Sterling Impact 1 1 1 1
Change in currency (i) - 10% decrease
(i) This has been based on the change in the exchange rate against the Australian dollar in the financial years ended 30 June 2013 and 30 June 2012.
The sensitivity analysis has been based on the sensitivity rates used when reporting foreign currency risk internally to key management personnel and represents management’s assessment of the possible change in foreign exchange rates based on historical volatility.
In management’s opinion, the sensitivity analysis is not fully representative of the inherent foreign exchange risk as the year end exposure does not necessarily reflect the exposure during the course of the year. The consolidated entity includes certain subsidiaries whose functional currencies are different to the consolidated entity presentation currency. The main operating entities outside of Australia are based in the United States and the United Kingdom. As stated in the consolidated entity’s accounting policies per Note 1, on consolidation the assets and liabilities of these entities are translated into Australian dollars at exchange rates prevailing at the year end date. The income and expenses of these entities is translated at the average exchange rates for the year. Exchange differences arising are classified as equity and are transferred to a foreign exchange translation reserve. The consolidated entity’s future reported profits could therefore be impacted by changes in rates of exchange between the Australian Dollar and the United States Dollar and the Australian Dollar and the UK Sterling.
69Integrated Research and its controlled entities • Annual Report 2013
For
per
sona
l use
onl
y

Financial Statements
Note 20. Financial instruments (cont.)
Forward foreign exchange contracts
The consolidated entity is exposed to foreign currency risk on sales and purchases that are denominated in a currency other than the AUD. The currencies giving rise to this risk are primarily United States Dollar and UK Sterling.
The consolidated entity uses forward exchange contracts to hedge its foreign currency risk. The forward exchange contracts have maturities of less than two years after the year end date.
The consolidated entity classifies its forward exchange contracts hedging forecasted transactions as cash flow hedges and measures them at fair value. The following table details the forward foreign currency contracts outstanding as at reporting date:
Outstanding contracts
Average exchange rate Foreign currency Contract value Fair value
2013 20122013
FC’0002012
FC’0002013
A$’0002012
A$’0002013
A$’0002012
A$’000
Consolidated
Sell US Dollar
Less than 3 months 1.01 1.01 3,600 3,500 3,564 3,468 (357) 8
3 to 6 months 1.01 1.01 2,400 2,250 2,376 2,228 (257) (11)
6 to 9 months 1.00 1.01 2,550 3,250 2,561 3,205 (255) (51)
9 to 12 months 1.00 ‑ 2,000 ‑ 2,013 ‑ (209) ‑
Sell Euros
Less than 3 months 0.78 0.71 750 1,100 966 1,540 (104) 168
3 to 6 months 0.76 0.71 200 300 262 424 (26) 47
6 to 9 months 0.75 0.76 200 300 266 395 (20) 14
9 to 12 months 0.75 ‑ 100 ‑ 134 ‑ (10) ‑
(1,238) 175
These hedge assets are classified as a level 2 fair value measurement, being derived from inputs rather than quoted prices that are observable for the asset either directly (ie as prices) or indirectly (ie derived from prices).
Interest rate risk management
The consolidated entity is exposed to interest rate risk on the cash held in bank deposits. Cash in bank and term deposits of $15,551,000 were held by the consolidated entity at the reporting date, attracting an average interest rate of 3.26% (2012: 4.12%). If interest rates had been 50 basis points higher or lower and all other variables were held constant, the consolidated entity’s net profit would increase/(decrease) by $78,000 (2012: $69,000).
Inte
grat
ed R
esea
rch
and
its c
ontr
olle
d en
tities
• A
nnua
l Rep
ort 2
013
70
For
per
sona
l use
onl
y

Letter from the Chairm
anDirectors and Senior M
anagement
Directors’ ReportRem
uneration ReportCorporate Governance Statem
entIndependent Audit Report
Financial Statements
Note 20. Financial instruments (cont.)
Credit risk management
Credit risk refers to the risk that a counterparty will default on its contractual obligations resulting in financial loss to the consolidated entity. The consolidated entity has adopted a policy of only dealing with creditworthy counterparties and obtaining sufficient collateral where appropriate, as a means of mitigating the risk of financial loss from defaults.
Trade receivables consist of a large number of customers, spread across diverse industries and geographical areas. Ongoing credit evaluation is performed on the financial condition of accounts.
The consolidated entity does not have any significant credit risk exposure to any single counterparty or any consolidated entity of counterparties having similar characteristics. The credit risk on liquid funds and derivative financial instruments is limited because the counterparties are banks with high credit ratings assigned by international credit-rating agencies.
Liquidity risk management
Ultimate responsibility for liquidity risk management rests with the Board of Directors, who have built an appropriate liquidity risk management framework for the management of the consolidated entity’s short, medium and long-term funding and liquidity management requirements.
The consolidated entity manages liquidity risk by maintaining adequate reserves, by continuously monitoring forecast and actual cash flows and matching the maturity profiles of financial assets and liabilities.
All creditor and other payables shown in Note 15 for both 2013 and 2012 carry no interest obligation and have a maturity of less than three months.
Fair value of financial instruments
The carrying value of financial assets and financial liabilities of the consolidated entity is a reasonable approximation of their fair value.
Note 21. Operating leasesNon-cancellable operating lease rentals is for office space with payables as follows:
In thousands of AUD
Consolidated
2013 2012
Less than one year 1,197 1,140
Between one and five years 2,250 3,303
Greater than five years ‑ ‑
3,447 4,443
71Integrated Research and its controlled entities • Annual Report 2013
For
per
sona
l use
onl
y

Financial Statements
Note 22. Consolidated entities
Country of incorporation
Ownership interest
2013 2012
Parent entity:
Integrated Research Limited Australia
Subsidiaries:
Integrated Research, Inc USA 100% 100%
Integrated Research UK Limited UK 100% 100%
Integrated Research Singapore Pty Limited Singapore 100% ‑
Note 23. Reconciliation of cash flows from operating activities
In thousands of AUD
Consolidated
2013 2012
Profit for the year 9,078 9,035
Depreciation and amortisation 7,445 7,489
Provision for doubtful debts (98) 575
Interest received (456) (509)
Share-based payments expense 148 127
Net exchange differences (725) 117
Change in operating assets and liabilities:
(Increase)/decrease in trade debtors (2,085) (6,880)
(Increase)/decrease in future income tax benefit (734) (167)
(Increase)/decrease in other operating assets 261 580
Increase/(decrease) in trade and other payables (95) 920
Increase/(decrease) in other operating liabilities 4,082 2,628
Increase/(decrease) in provision for income taxes payable (304) (11)
Increase/(decrease) in provision for deferred income taxes 579 398
Increase/(decrease) in other provisions 360 344
Net cash from operating activities 17,456 14,646
Inte
grat
ed R
esea
rch
and
its c
ontr
olle
d en
tities
• A
nnua
l Rep
ort 2
013
72
For
per
sona
l use
onl
y

Letter from the Chairm
anDirectors and Senior M
anagement
Directors’ ReportRem
uneration ReportCorporate Governance Statem
entIndependent Audit Report
Financial Statements
Note 24. Key management personnel disclosuresThe following were key management personnel of the consolidated entity at any time during the reporting period and unless otherwise indicated were key management personnel for the entire period:
Directors (full year) Directors (part year)
Steve Killelea ‑ Chairman Garry Dinnie (appointed February 2013)
Mark Brayan ‑ Chief Executive Officer John Brown (resigned December 2012)
Alan Baxter
Kate Costello
Peter Lloyd
Clyde McConaghy
Other key management personnel (full year) Other key management personnel (part year)
Peter Adams ‑ Chief Financial Officer David Leighton ‑ Company Secretary
Alex Baburin ‑ GM ‑ Research & Development Jonathan Stern ‑ Vice President ‑ Asia Pacific
Andre Cuenin ‑ President Americas Pierre Semaan ‑ Vice President ‑ Asia Pacific
John Dunne ‑ GM ‑ Products & Alliances Pim Van Der Poel ‑ Vice President ‑ Europe
Andrew Levido ‑ GM ‑ Global Sales
David Purdue ‑ Company Secretary & Global Commercial Manager
Key management personnel compensation
The key management personnel compensation are as follows:
In AUD
Consolidated
2013 2012
Short-term benefits 3,210,955 2,850,541
Post-employment benefits 159,353 176,890
Equity compensation benefits 58,723 52,402
3,429,031 3,079,833
Individual Directors and executives compensation disclosures
Information regarding individual Directors and executives compensation is provided in the remuneration report on pages 29 to 37.
Other Transactions with Key Management Personnel
The consolidated entity received consulting services from The Grayrock Group Pty Limited, a company in which Peter Lloyd is a director. The total consulting services paid for the year ended 30 June 2013 was $125,940 and was on commercial terms (2012: $nil).
Apart from the details disclosed in this note, no director has entered into a material contract with the consolidated entity since the end of the previous financial year and there were no material contracts involving Directors’ interests existing at year-end.
73Integrated Research and its controlled entities • Annual Report 2013
For
per
sona
l use
onl
y

Financial Statements
Note 24. Key management personnel disclosures (cont.)
Key management personnel transactions with the consolidated entity
Information regarding individual key management personnel’s service contracts is provided in the remuneration report on pages 29 to 37.
Equity instruments
All options refer to options over ordinary shares of Integrated Research Limited, which are exercisable on a one-for-one basis under the Employee Share Option Plan (ESOP).
All performance rights refer to performance rights over ordinary shares of Integrated Research Limited, which are exercisable on a one-for-one basis under the Integrated Research Performance Rights and Option Plan (IRPROP).
Options over equity instruments granted as compensation
The movement during the reporting year in the number of options over ordinary shares in Integrated Research Limited held, directly, indirectly or beneficially, by each key management person, including their related parties, is as follows:
Current Year
Held at 1 July2012
Granted as compensation Exercised
Other changes*
Held at30 June
2013
Vested during the
year
Vested and exercisable at 30 June
2013
Directors
Mark Brayan 1,000,000 ‑ (500,000) (500,000) ‑ ‑ ‑
Executives
Peter Adams 350,000 ‑ (87,500) (262,500) ‑ ‑ ‑
Alex Baburin 40,000 ‑ ‑ ‑ 40,000 10,000 10,000
Andre Cuenin 300,000 ‑ (75,000) ‑ 225,000 ‑ ‑
Pierre Semaan 200,000 ‑ (50,000) (150,000) ‑ ‑ ‑
John Dunne 15,000 ‑ (7,500) ‑ 7,500 7,500 7,500
Prior Year
Held at 1 July2011
Granted as compensation Exercised
Other changes*
Held at30 June
2012
Vested during the
year
Vested and exercisable at 30 June
2012
Directors
Mark Brayan 1,000,000 ‑ ‑ ‑ 1,000,000 250,000 500,000
Executives
Peter Adams 350,000 ‑ ‑ ‑ 350,000 87,500 87,500
Alex Baburin 200,000 ‑ ‑ (160,000) 40,000 10,000 10,000
Andre Cuenin 300,000 ‑ ‑ ‑ 300,000 75,000 75,000
Pierre Semaan 200,000 ‑ ‑ ‑ 200,000 50,000 50,000
John Dunne 50,000 ‑ (35,000) 15,000 7,500 7,500
* Other changes represent options that expired or were forfeited during the year.
There were no options granted as compensation during the current year.
25% of options granted vest annually on the anniversary of the grant date, and may also be subject to the consolidated entity achieving certain performance hurdles. Options expire on the earlier of their expiry date or termination of the individual’s employment. No options have been granted since the end of the financial year. The options were provided at no cost to the recipients.
Inte
grat
ed R
esea
rch
and
its c
ontr
olle
d en
tities
• A
nnua
l Rep
ort 2
013
74
For
per
sona
l use
onl
y

Letter from the Chairm
anDirectors and Senior M
anagement
Directors’ ReportRem
uneration ReportCorporate Governance Statem
entIndependent Audit Report
Financial Statements
Note 24. Key management personnel disclosures (cont.)
Performance rights over equity instruments granted as compensation
The movement during the reporting year in the number of performance rights over ordinary shares in Integrated Research Limited held, directly, indirectly or beneficially, by each key management person, including their related parties, is as follows:
Current Year
Held at 1 July2012
Granted as compensation Exercised
Other changes*
Held at30 June
2013
Vested during the
year
Vested and exercisable at 30 June
2013
Directors
Mark Brayan 170,000 170,000 ‑ ‑ 340,000 ‑ ‑
Executives
Peter Adams 100,000 30,000 ‑ ‑ 130,000 ‑ ‑
Alex Baburin 75,000 30,000 ‑ ‑ 105,000 ‑ ‑
Andre Cuenin 75,000 50,000 ‑ ‑ 125,000 ‑ ‑
John Dunne 75,000 30,000 ‑ ‑ 105,000 ‑ ‑
Andrew Levido ‑ 56,250 ‑ ‑ 56,250 ‑ ‑
David Purdue 14,500 20,000 ‑ ‑ 34,500 ‑ ‑
Pierre Semaan 65,000 ‑ ‑ (65,000) ‑ ‑ ‑
Pim Van Der Poel ‑ 25,000 ‑ ‑ 25,000 ‑ ‑
Current Year
Held at 1 July2011
Granted as compensation Exercised
Other changes*
Held at30 June
2012
Vested during the
year
Vested and exercisable at 30 June
2012
Directors
Mark Brayan ‑ 170,000 ‑ ‑ 170,000 ‑ ‑
Executives
Peter Adams ‑ 100,000 ‑ ‑ 100,000 ‑ ‑
Alex Baburin ‑ 75,000 ‑ ‑ 75,000 ‑ ‑
Brian Bigley ‑ 65,000 ‑ ‑ 65,000 ‑ ‑
Andre Cuenin ‑ 75,000 ‑ ‑ 75,000 ‑ ‑
Pierre Semaan ‑ 65,000 ‑ ‑ 65,000 ‑ ‑
John Dunne ‑ 75,000 ‑ ‑ 75,000 ‑ ‑
* Other changes represent performance rights that expired or were forfeited during the year.
Performance rights expire on the earlier of their expiry date or termination of the individual’s employment. No performance rights have been granted since the end of the financial year. The performance rights were provided at no cost to the recipients.
75Integrated Research and its controlled entities • Annual Report 2013
For
per
sona
l use
onl
y

Financial Statements
Note 24. Key management personnel disclosures (cont.)
Movements in shares
The movement during the reporting period in the number of ordinary shares in Integrated Research Limited held, directly, indirectly or beneficially, by each key management person, including their related parties, is as follows:
Current YearHeld at
1 July 2012 Purchases
Received on exercise of
optionsOther
changes* Sales
Held at30 June
2013
Directors
Non‑executive
Alan Baxter 100,000 ‑ ‑ ‑ ‑ 100,000
John Brown 101,000 ‑ ‑ (101,000) ‑ ‑
Kate Costello 200,000 ‑ ‑ ‑ ‑ 200,000
Steve Killelea 94,834,951 ‑ ‑ ‑ ‑ 94,834,951
Executive
Mark Brayan 25,000 ‑ 500,000 ‑ (500,000) 25,000
Executive officers (excluding Directors)
Peter Adams ‑ ‑ 87,500 (82,500) 5,000
John Dunne ‑ ‑ 7,500 ‑ (7,500) ‑
Pierre Semaan ‑ ‑ 50,000 ‑ (50,000) ‑
Andre Cuenin ‑ ‑ 75,000 ‑ (75,000) ‑
David Purdue 18,750 ‑ ‑ ‑ ‑ 18,750
* Other changes represent net movement from ceasing to hold office.
Current YearHeld at
1 July 2011 Purchases
Received on exercise of
optionsOther
changes* Sales
Held at30 June
2012
Directors
Non‑executive
Alan Baxter 100,000 ‑ ‑ ‑ ‑ 100,000
John Brown 101,000 ‑ ‑ ‑ ‑ 101,000
Kate Costello 200,000 ‑ ‑ ‑ ‑ 200,000
Steve Killelea 94,834,951 ‑ ‑ ‑ ‑ 94,834,951
Executive
Mark Brayan 25,000 ‑ ‑ ‑ ‑ 25,000
Executive officers (excluding Directors)
John Dunne ‑ ‑ 35,000 ‑ (35,000) ‑
Shareholdings at the date of the Directors’ Report for existing Key Management Personnel remain unchanged.
Other transactions with the consolidated entity
There were no other transactions between the key management personnel, or their personally-related entities, and the consolidated entity.
Inte
grat
ed R
esea
rch
and
its c
ontr
olle
d en
tities
• A
nnua
l Rep
ort 2
013
76
For
per
sona
l use
onl
y

Letter from the Chairm
anDirectors and Senior M
anagement
Directors’ ReportRem
uneration ReportCorporate Governance Statem
entIndependent Audit Report
Financial Statements
Note 25. Related parties The consolidated entity has a related party relationship with its key management personnel (see note 24).
At 30 June 2013 Mr Steve Killelea, the Chairman of the Company, owned either directly or indirectly 56.33% of the Company (2012: 56.41%).
Note 26. Parent entity disclosures
In thousands of AUD
Parent entity
2013 2012
Financial PositionAssets
Current assets 20,085 19,055
Non‑current assets 17,211 17,479
Total Assets 37,296 36,534
Liabilities
Current Liabilities 6,828 6,672
Non-current liabilities 4,563 3,861
Total Liabilities 11,391 10,533
Net Assets 25,905 26,001
Equity
Issued Capital 1,501 1,175
Employee benefits Reserve 424 276
Hedging reserve (777) ‑
Retained Earnings 24,757 24,550
Total Equity 25,905 26,001
Financial PerformanceProfit for the year 8,621 8,470
Other comprehensive income (777) (147)
Total comprehensive income 7,844 8,323
Note 27. Subsequent events For dividends declared after 30 June 2013 see Note 19 in the financial statements. The financial effect of dividends declared and paid after 30 June 2013 have not been brought to account in the financial statements for the year ended 30 June 2013 and will be recognised in subsequent financial reports.
No other transaction or event of a material or unusual nature has arisen in the interval between the end of the financial year and the date of this report, which is likely, in the opinion of the Directors of the Company, to affect significantly the operations of the consolidated entity, the results of those operations, or the state of affairs of the consolidated entity, in future financial years.
77Integrated Research and its controlled entities • Annual Report 2013
For
per
sona
l use
onl
y

Directors’ Declaration
Directors’ DeclarationIn accordance with a resolution of the Directors of Integrated Research Limited, we state that:
1. In the opinion of the Directors:
(a) the financial statements and notes of Integrated Research Limited for the financial year ended 30 June 2013 are in accordance with the Corporations Act 2001, including:
(i) giving a true and fair view of the consolidated entity’s financial position as at 30 June 2013 and of its performance for the year ended on that date; and
(ii) complying with Accounting Standards and the Corporations Regulations 2001;
(b) the financial statements and notes also comply with International Financial Reporting Standards as disclosed in Note 1; and
(c) there are reasonable grounds to believe that the Company will be able to pay its debts as and when they become due and payable.
2. This declaration has been made after receiving the declarations required to be made to the Directors by the chief executive officer and chief financial officer in accordance with section 295A of the Corporations Act 2001 for the financial year ended 30 June 2013.
On behalf of the Board
Dated at North Sydney this 19th day of August 2013.
Steve Killelea Mark Brayan Chairman Chief Executive Officer
Inte
grat
ed R
esea
rch
and
its c
ontr
olle
d en
tities
• A
nnua
l Rep
ort 2
013
78
For
per
sona
l use
onl
y
Letter from the Chairm
anDirectors and Senior M
anagement
Directors’ ReportRem
uneration ReportCorporate Governance Statem
entFinancial Statem
entsIndependent Audit Report
79Integrated Research and its controlled entities • Annual Report 2013
For
per
sona
l use
onl
y
Independent Audit ReportIn
tegr
ated
Res
earc
h an
d its
con
trol
led
entiti
es •
Ann
ual R
epor
t 201
3
80
For
per
sona
l use
onl
y

Letter from the Chairm
anDirectors and Senior M
anagement
Directors’ ReportRem
uneration ReportCorporate Governance Statem
entFinancial Statem
entsIndependent Audit Report
81Integrated Research and its controlled entities • Annual Report 2013
For
per
sona
l use
onl
y

ASX Additional Information
ASX Additional InformationShareholder informationAnalysis of numbers of equity security holders by size of holding as at 2 September 2013
Class of equity security
Ordinary shares
Shares OptionsPerformance
rights
1 ‑1,000 535 ‑ ‑
1,001 ‑ 5,000 1,961 11 31
5,001 ‑ 10,000 1,007 12 48
10,001 ‑ 100,000 1,237 15 37
100,001 and over 70 1 2
4,810 39 118
Inte
grat
ed R
esea
rch
and
its c
ontr
olle
d en
tities
• A
nnua
l Rep
ort 2
013
82
For
per
sona
l use
onl
y

Letter from the Chairm
anDirectors and Senior M
anagement
Directors’ ReportRem
uneration ReportCorporate Governance Statem
entFinancial Statem
entsIndependent Audit Report
Equity security holdersTwenty largest quoted equity security holders
The names of twenty largest holders of quoted equity securities as at 2 September 2013 are listed below:
Ordinary shares
Number heldPercentage of issued shares
1 MR STEPHEN JOHN KILLELEA 94,497,339 56.08
2 MR ANDREW RHYS RUTHERFORD 3,505,869 2.08
3 CITICORP NOMINEES PTY LIMITED 1,647,205 0.98
4 SPECTROK PTY LTD <HEDLEY FAMILY A/C> 1,350,472 0.80
5 CUSTODIAL SERVICES LIMITED 1,217,150 0.72
6 KEY GLORY INVESTMENTS PTY LTD 1,000,000 0.59
7 FORSYTH BARR CUSTODIANS LTD 779,370 0.46
8 AUST EXECUTOR TRUSTEES SA LTD 765,092 0.45
9 ABN AMRO CLEARING SYDNEY NOMINEES PTY LTD 746,299 0.44
10 JP MORGAN NOMINEES AUSTRALIA LIMITED 718,311 0.43
11 SPECTROK PTY LTD <THE HEDLEY SUPER FUND A/C> 641,359 0.38
12 BELL POTTER NOMINEES LTD 532,000 0.32
13 HOWARD SECURITIES PTY LTD 400,000 0.24
14 FERGFAM NOMINEES PTY LTD 375,263 0.22
15 BRISPOT NOMINEES PTY LTD 371,100 0.22
16 BIPETA PTY LTD 337,612 0.20
17 MR RODNEY WALTER ROSS 334,600 0.20
18 MR COLIN GREGORY ORGAN 330,000 0.20
19 FARVEX CORPORATION PTY LIMITED 325,000 0.19
20 MS FIONA CATHERINE MURPHY 314,086 0.19
83Integrated Research and its controlled entities • Annual Report 2013
For
per
sona
l use
onl
y

ASX Additional Information
Unquoted equity securities
Number on issue
Number of holders
Option issued under the Integrated Research Limited Employee Option Plan to take up ordinary shares 737,000* 39
Performance Rights issued under the Integrated Research Limited Performance Rights and Option Plan to take up ordinary shares 1,745,000** 118
* Number of unissued ordinary shares under the Options.** Number of unissued ordinary shares under the Performance Rights.
On‑market buy‑back
There is no current on-market buy-back.
Substantial holders
Substantial holders in the Company are set below:
Number held Percentage
Stephen John Killelea* 94,834,951 56.28
* Include direct and indirect holdings.
Voting rightsThe voting rights attaching to each class of equity securities are set out below:
1. Ordinary shares.
On a show of hands every member present at a meeting in person or proxy shall have one vote and upon a poll each share have one vote.
2. Options.
No voting rights.
3. Performance rights.
No voting rights.
Other informationIntegrated Research Limited, incorporated and domiciled in Australia, is a publicly listed Company limited by shares.
Inte
grat
ed R
esea
rch
and
its c
ontr
olle
d en
tities
• A
nnua
l Rep
ort 2
013
84
For
per
sona
l use
onl
y

Directors
Steve KilleleaChairman and Non-Executi ve Director
Mark BrayanManaging Director and CEO
Alan BaxterIndependent Non-Executi ve Director
Garry DinnieIndependent Non-Executi ve Director
Kate CostelloIndependent Non-Executi ve Director
Peter LloydNon-Executi ve Director
Clyde McConaghyNon-Executi ve Director
SecretaryDavid Purdue
Registered Offi ceLevel 9, 100 Pacifi c HighwayNorth Sydney, NSW, 2060Phone: (+61 2) 9966 1066
Share RegistryComputershare
AuditorsErnst & YoungErnst & Young Centre680 George StreetSydney, NSW, 2000
SolicitorsAshurstLevel 36, Grosvenor Place225 George StreetSydney, NSW, 2000
BankersWestpac Banking Corporati on
Securities Exchange ListingAustralian Securiti es ExchangeCode IRI
Country of IncorporationIntegrated Research Limited, incorporated and domiciled in Australia, is a publicly listed company limited by shares.
Notice of Annual General MeetingThe Annual General Meeti ng of Integrated Research Limited will be held at 3:00pm on Thursday, 14 November 2013, at the Museum of Sydney, Corner of Phillip and Bridge Streets, Sydney.
Corporate Directory
Designed by RDA Creati ve www.rda.com.au
Access your Annual Report 2013 online.
Visit www.ir.com/annualreport2013
This report is printed on Impress paper which is FSC‑certi fi ed.
Fibre is sourced from well‑managed forest plantati ons and controlled sources.
For
per
sona
l use
onl
y

ABN 76 003 588 449
Integrated Research
Annual Report 2013
Providing Business Insight™
Corporate HQ
Asia Pacifi c/Middle East/AfricaIntegrated Research Ltd
Level 9/100 Pacifi c HighwayNorth Sydney NSW 2060Australia
+61 (2) 9966 1066
+61 (2) 9966 1042
Americas - West CoastIntegrated Research Inc.
8055 East Tuft s AvenueSuite 950 Denver CO 80237USA
+1 (303) 390 8700
+1 (303) 390 8777
Americas ‑ East CoastIntegrated Research Inc.
1818 Library StreetSuite 500 Reston VA 20190USA
+1 (703) 956 3016
+1 (303) 390 8777
EuropeIntegrated Research UK Ltd
Orchard Lea, Drift RoadWinkfi eld, Windsor Berkshire SL4 4RP United Kingdom
+44 (0) 1344 894 200
+44 (0) 1344 890 851
Inte
gra
ted
Re
sea
rch
An
nu
al R
ep
ort 2
013
Visit our website at www.ir.com or our community blog at www.realtime.ir.com
GermanyIntegrated Research UK Ltd
Münchner Büro der Integrated Research UK LtdTerminalstrasse Mitt e 1885356 München, Germany
+49 (89) 97 007 132
SingaporeIntegrated Research (Singapore) Pte Ltd
3 Temasek AvenueLevel 21, Centennial Tower Singapore 039190
+65 6549 7038
+65 6549 7011
For
per
sona
l use
onl
y