Integrated report - Mizuho Financial Group
336
Integrated report 2020 Annual Review April 2019 – March 2020 Mizuho Financial Group
Transcript of Integrated report - Mizuho Financial Group
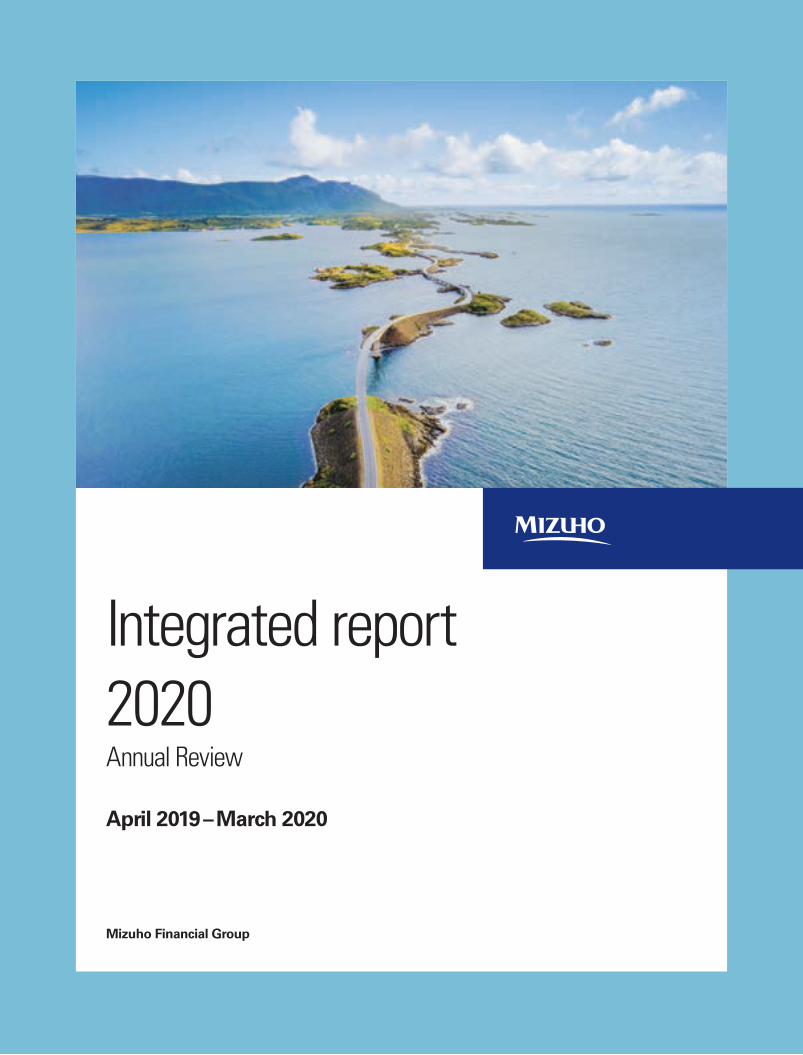
Integrated report 2020Annual Review
April 2019 – March 2020
Mizuho Financial Group
Mizu
ho
Finan
cial Gro
up
| Integ
rated R
epo
rt 2020
Globalization
Declining birthrate and aging population
DigitalizationGlobalization
Declining birthrate and aging population
Digitalization
At Mizuho we are swiftly addressing structural changes in society, the
economy, and industries, and are earnestly confronting the new
challenges that our customers and society will face in a post-COVID-19
world. By providing support as a united group, we will forge new forms
of partnerships with our customers as we aim to transition to the next
generation of financial services.
1 Mizuho Financial Group
090_7080587912009.indd 1 2020/09/10 10:38:29

Globalization
Declining birthrate and aging population
DigitalizationGlobalization
Declining birthrate and aging population
Digitalization22020 Integrated Report
090_7080587912009.indd 2 2020/09/10 10:38:30010_7080587912009.indd 2 2020/09/10 16:19:41

For our customers
COVID-19 related initiatives
¥1 trillion(total including fund No. 1 and No. 2)
Establishment of the Mizuho COVID-19 Support Fund
Established in response to new demand for short-term working capital due to the mounting economic damage and impact of the COVID-19 pandemic.
Establishment of the Mizuho Post-COVID-19 Assist Fund (Growth Strategy)
Established in response to the long-term financing needs of middle-market and SME clients for business portfolio restructuring and investing in growth, to be utilized for large-scale capital investments and other purposes.
¥200 billion
Over ¥100 billion
Capital support through quasi-equity financing and intermediary services
In addition to providing clients with mezzanine financing and quasi-equity loans, expand new financial intermediary services in capital markets including private capital.
¥5 billion ¥10 billion
Increased the total amount for Mizuho Life Science Fund No. 1
Increased the total amount of the fund to address funding needs of companies involved in the development of new medical technologies.
Establishment of the Mizuho Post-COVID-19 Assist Fund (Business Succession)
Established to support the smooth succession of businesses to the next generation of owners in the post-COVID-19 era.
¥10 billion
Launch of the Post-COVID-19 Support Project
Supporting initiatives for new ways of life for corporate and retail customers in the post-COVID-19 era.- Providing support for participating merchants to
transition to cashless check-out and improve efficiency using the “STORES Terminal for Mizuho” payment service.
- Participating together—Project supporting new lifestyles via financial services
Mizuho office initiatives
International
- We have made arrangements for employees to utilize remote technology according to the situation in each country, enabling us to maintain and continue the stable provision of financial services, and to respond to clients’ financing and settlement needs.
Japan
- Creation of an operations framework to support the smooth payment of government payouts
- Opened financing consultation windows at all Mizuho Bank branches
- Responding to urgent financing demand- Flexible response to new loans, revising loan
conditions, etc.
3 Mizuho Financial Group
010_7080587912009.indd 3 2020/09/10 16:19:42
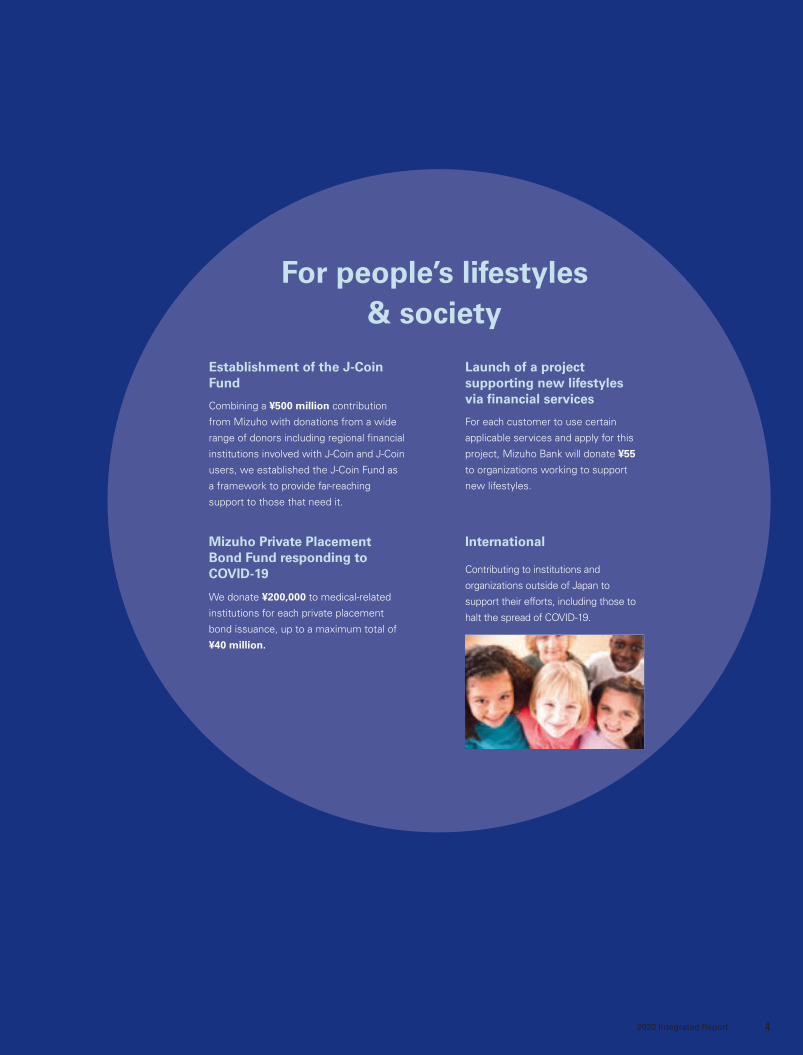
For people’s lifestyles & society
Establishment of the J-Coin Fund
Combining a ¥500 million contribution
from Mizuho with donations from a wide
range of donors including regional financial
institutions involved with J-Coin and J-Coin
users, we established the J-Coin Fund as
a framework to provide far-reaching
support to those that need it.
Mizuho Private Placement Bond Fund responding to COVID-19
We donate ¥200,000 to medical-related
institutions for each private placement
bond issuance, up to a maximum total of
¥40 million.
Launch of a project supporting new lifestyles via financial services
For each customer to use certain
applicable services and apply for this
project, Mizuho Bank will donate ¥55
to organizations working to support
new lifestyles.
International
Contributing to institutions and
organizations outside of Japan to
support their efforts, including those to
halt the spread of COVID-19.
42020 Integrated Report
010_7080587912009.indd 4 2020/09/10 16:19:42

Introduction
First of all, allow me to express my heartfelt sympathies for all of those who have contracted COVID-19 and the many people who have been impacted in various ways by the spread of the virus.
This crisis has caused major disruption to the economy and financial markets and has significantly impacted people’s daily lives and work styles. At Mizuho, the health and safety of our customers and employees is our top priority, and we are utilizing split operations, remote work, and other arrangements based on the situation in each region. This has enabled us to continue to stably provide financial services, such as settlements and lending, which are essential for our
customers and the economy, even when a state of emergency or other such response has been put in place by the local authorities. We are also attentively listening to the needs of corporate clients and individual customers requiring funding assistance, and are making every effort to meet these needs, including providing new loans and changing the conditions of existing loans. Although the situation is still uncertain and we cannot let down our guard, we will continue to work together as a united group to ensure that we can provide essential financial functions in times such as these going forward.
Additionally, we have established the J-Coin Fund and in addition to making an initial donation to the fund we are soliciting donations from a range of sources and offering to make an additional donation based on our clients’ total issue
Message from the Group CEO
5 Mizuho Financial Group
011_7080587912009.indd 5 2020/09/10 13:15:55
Tatsufumi SakaiMember of the Board of Directors
President & Group CEO
Mizuho Financial Group, Inc.
Becoming even stronger as we look ahead to a post-COVID-19 worldDue to the novel coronavirus (COVID-19) pandemic, we are faced with an unprecedented crisis with severe impacts on the real economy. Also, as we battle this virus, society as a whole is changing significantly to adjust to a post-COVID-19 world, including the way we live our lives and the way we do business.
I would like to take this opportunity to share Mizuho’s strategy for adapting to a world impacted by COVID-19 and the world as it will be after the pandemic ends. It is not that we cannot return to how things were before COVID-19, but rather that we choose not to. COVID-19 can be a catalyst to transform us into a stronger organization. In this unprecedented crisis, we are committed to making decisive forward progress.
amount of privately placed bonds. This is just one way that we are working to support people’s lifestyles and society as a whole, including health care workers and affected families and students.
A world impacted by COVID-19
Currently, countries around the world are facing a truly unprecedented crisis with the COVID-19 pandemic and its impacts such as a sudden drop in demand and severe deterioration to the real economy affecting economic growth and employment. Over half a year has passed since infections with this unknown virus were first discovered, yet it is still difficult to accurately predict the scope and severity of impact,
when the virus will be contained, and other factors. According to the IMF’s most recent World Economic Outlook (June 2020 edition), global growth is projected at -4.9% in 2020. This is significantly lower than the last time that growth was negative, which was -0.1% growth in 2009. From this we can perceive the extent to which this crisis is unusual and unprecedented.
Of course, the economic crisis will be contained at some point, but development of a vaccine is still in the early stages, and with concerns present regarding the risk of a second and third wave of infections, it has been posited that containment may take a significant amount of time. We must be aware of the potential for growth in the real economy to remain sluggish over the long term and for the accompanying impacts to be prolonged.
Message from the Group CEO
62020 Integrated Report
011_7080587912009.indd 6 2020/09/10 13:15:55
How is this different from the global financial crisis?In September 2008, Lehman Brothers filed for bankruptcy with $613 billion in total debt, a record in the US. The financial crisis that followed with its far-reaching impacts on economies and societies around the world was said at the time to be a “once in a hundred years” event. Although it is unavoidable that the current economic crisis will inflict more damage than the global financial crisis, this time it is different for financial institutions. The reason is that during this crisis our financial functions are operating as normal due to the following three points.
Firstly, the current crisis is not financial in origin. At the start of the global financial crisis, with the emergence of the subprime mortgage crisis, financial institutions were initially impacted and the reduction of their ability to provide financing sent shock waves through the real economy, which in turn led to further negative impacts on financial institutions’ operational status, creating a downward spiral. Secondly, central banks and governments around the world are quickly and resolutely implementing countermeasures based on experience gained in the previous crisis. These countermeasures have been effective and at present there are no concerns regarding the stability of the financial system. And thirdly, financial institutions have accumulated capital, enhanced risk management methods, improved portfolio
soundness, and made other efforts based on the lessons learned from the previous crisis and in response to the tighter regulations introduced afterward. As a result, financial institutions are prepared to continue providing financing even in the event of a crisis.
At Mizuho as well, our overall credit portfolio is significantly more sound compared to the time of the previous crisis. In structured products, where we recorded a large loss at the time, we have greatly improved the quality of our portfolio as a result of revising our policy and strengthening our risk framework. For example, around 80% of our real estate-related and commodity-related credit is equivalent to investment grade. Also, outside of Japan 80% of our portfolio is investment grade as a result of promoting our Global 300 strategy focused on blue-chip companies. In terms of investment, we currently do not hold any assets for which there is a concern of recording a large loss. As a result, I can say with confidence that Mizuho has the stress resistance necessary to overcome this challenging time.
With this in mind, where should we focus our efforts? I believe we should solidify our defenses in preparation for a worsening business environment while at the same time providing the financial functions which are more essential than ever. We must smoothly provide much-needed credit and
Message from the Group CEO
7 Mizuho Financial Group
011_7080587912009.indd 7 2020/09/10 13:15:57
ensure that liquidity, the lifeblood of the economy, continues to flow around, thereby avoiding a severe worsening of the economy or delay to recovery. It is our hope that as a result of these efforts our customers’ businesses and lifestyles can recover as soon as possible and that this in turn will help the economy. That is why it is vital that we go back to basics and provide the financial functions which are more essential than ever.
We are already beginning to experience a post-COVID-19 worldThe real economy has sustained profound damage from the impacts of COVID-19. At the same time, members of society are coming up with a variety of measures to cope with life amid the outbreak. During this time, various vulnerabilities have become apparent in the economies and societies of countries around the world and as a result we are making new discoveries and learning new things in a range of areas. These experiences are already leading to major changes, including in our lifestyles and the way we do business, as we transform into a post-COVID-19 society.
At Mizuho, we are focused on the “megatrends” that are likely to have a major impact on the finance industry—digitalization, the declining birthrate and aging population, and globalization—and we believe this general trajectory will not change after COVID-19 subsides. However, during the COVID-19 pandemic, a range of vulnerabilities have become even more apparent in the wake of these megatrends. In light of this, changes are arising in people’s way of thinking, actions, etc. and in the finance industry new movements are accelerating in preparation for a post-COVID-19 world.
Firstly in terms of digitalization, it has become apparent that Japan in particular is behind when it comes to digital infrastructure. The current situation has reaffirmed the challenges that municipal organizations, government, and private sector organizations like Mizuho face regarding digitalization. By facing this situation, issues that were previously thought to be especially difficult to overcome such as the shift to digital contracts and cashless transactions are being addressed with renewed speed. Also, for retail customers there has been a sudden shift from in-branch to remote transactions using digital technology. As for the declining birthrate and aging population, uncertainty regarding health and life after retirement is increasing. In the area of business succession for example, as uncertainty regarding the future grows, an increasing number of companies, even those with young CEOs, are taking this opportunity to implement succession measures at an earlier stage, including MBOs and delisting. In regard to globalization, the stall in business caused by the COVID-19 outbreak has created severe issues concerning the uneven distribution of supply chains. Additionally, there is the issue of the rise of
anti-globalism. However, globalization is not being reversed as a result, but rather globalization has become the norm and we are seeing the start of a movement to restructure and optimize supply chains. These are merely some examples of the ways in which COVID-19 has spurred change in society, and both society and customer needs are undergoing structural changes as we look ahead to a post-COVID-19 world. Such shifts are beginning to occur in any number of areas.
Acceleration of the transition to the next generation of financial services
Last fiscal year, Mizuho launched our 5-Year Business Plan: Transitioning to the Next Generation of Financial Services. The basic policy under this plan is to implement structural reforms in three areas—business structure, finance structure, and corporate foundations—in order to transition to the next generation of financial services and respond to customer needs as they undergo structural change against the backdrop of these megatrends. Up until now, financial institutions have designed their businesses around the value of money itself. However, the days are long in the past in which banks would accept deposits and return them without fail with an attractive level of earned interest all while maintaining robust infrastructure for operations, IT systems, compliance, etc. We must fully draw on the strengths that Mizuho has cultivated thus far and go beyond the conventional boundaries of finance to create new value incorporating both financial and non-financial products and services. In doing so, we can forge new forms of partnerships with our customers. That is the key strategy under our 5-Year Business Plan. Under our first action principle of “Open & Connected”, we are aiming to connect customer segments, regions, functions, and other aspects of our business in open partnerships within and outside the group in order to create new value chains spanning both finance and adjacent fields. And under our second action principle of “Passionate & Professional”, each member of the group will be encouraged to find a source of inspiration in the dreams and hopes of our customers, better connect with them, and draw on a high level of expertise to think, act, and deliver. Although traditional financial institutions are viewed as conservative, or “strong on defense but weak on offense”, through these efforts we can break out of our shell and work towards creating new value.
In fiscal 2019, the first year of our 5-Year Business Plan, in light of the impacts of COVID-19 we recorded reserves for possible losses on loans as a forward-looking and preventative measure. Due mainly to this factor, progress towards our target for Profit Attributable to Owners of Parent was 95%. However, overall performance was strong in each division, showing that our efforts are bearing fruit. Our structural
Message from the Group CEO
82020 Integrated Report
011_7080587912009.indd 8 2020/09/10 13:15:57

reform initiatives, which are positioned as the main priorities within our 5-Year Business Plan, are also proceeding well and exceeding our targets.
COVID-19 as a catalyst to transform us into a stronger organizationAs I already touched upon, vulnerabilities in society, the economy, and industries have manifested due to COVID-19. In turn, latent issues regarding Mizuho’s structural reforms have also become apparent. In that sense, although the necessity and direction of our structural reforms are unchanged, we believe it is important to further deepen these structural reforms in light of the challenges associated with responding to the pandemic.
These structural reforms will be implemented over a five-year period, but the most crucial period is the first three years, particularly this year when we must surmount the peak. While adapting to a post-COVID-19 society and economy, it is essential that we fundamentally change our operations and infrastructure, including retail branches, as well as the way we do business. Additionally, we must ascertain as early as possible these structural changes occurring within society and take resolute action, taking an offensive rather than defensive stance and expanding our business domain with an eye to the current situation.
In the area of digitalization, for example, COVID-19 is increasing the demand for contactless transactions. At Mizuho, we are enhancing efforts to shift to cashless payments via J-Coin Pay, a service offered in collaboration with regional banks and other financial institutions that boasts excellent safety, security, and convenience. Also, as smartphones become more and more essential to our lifestyles, through partnerships with a broad range of IT companies, we are seeking to integrate the financial capabilities that Mizuho has amassed thus far with the new lifestyles and economic spaces being formed via the use of smartphones. Furthermore, starting this fiscal year, information that customers enter into tablets available at retail branches will be sent directly to our new core banking system, MINORI. Among other benefits, this will increase the efficiency and speed of branch operations, further enhancing convenience for customers through the use of digital technology.
Strategic investment is another part of this. A strategy outlined in our 5-Year Business Plan is to enhance our risk-taking capabilities, collaborate with our clients on business strategy, and share risks as a business partner. The COVID-19 pandemic is producing demand for a fundamental transformation of clients’ business strategies and finance strategies. At the same time, the current business environment is likely to create downward pressure on capital
Megatrends DigitalizationDeclining birthrate & aging
populationGlobalization
Manifestation of vulnerabilities
due to the impacts of COVID-19
High dependence of face-to-face channels
Business processes/infrastructure hindering digitalization
Increased anxiety about the future due to unstable income and health concerns
Uneven distribution of supply chains
Rise of anti-globalism
Already seeing rapid structural changes in society, the economy, and industry due to the impacts of COVID-19
Post-COVID-19 world
Customers
Retail Corporate Markets
Pursuing safe and secure lifestyles based on the advancement of
digitalization
Fundamental transformation of business/finance strategies
High-volatility market structure with residual excess liquidity
Future initiatives
Strengthen remote transaction infrastructure Cashless payments Asset management and succession business
Provide quasi-equity financing Support for restructuring and asset sales Support changes to supply chains
Sales & Trading: Capture diverse investor needs
Banking: Flexibly shift allocation of assets
Message from the Group CEO
9 Mizuho Financial Group
011_7080587912009.indd 9 2020/09/10 13:15:57
for at least the next one to two years and clients will need to respond. By utilizing our strengths such as our industry research capabilities and financial/capital strategy execution capabilities, we will seek a range of opportunities to hold continual discussions with our clients’ senior management and work to further assist clients to grow their capital for both “defensive” and “offensive” purposes, including through the provision of quasi-equity financing.
We will also provide growth support. Our support for the growth of innovative startups involves not only funding but also support for the growth of the business itself, including providing talent. However, even companies with good technology and a good business model will find it very challenging to succeed in the current environment, so we will support them in a number of ways, including financing support via investment funds.
In terms of globalization, while companies are aiming to more evenly distribute uneven supply chains, we are seeing the start of a movement to optimize and rectify supply chains in a way that achieves both efficiency and security. At Mizuho, we are working to build high-level relationships with the senior management of global multinationals through our Global 300 strategy. Under the current environment, we are drawing on the collective capabilities of the Mizuho group to assist clients, including consulting regarding business strategy and providing research capabilities in order to support trade flow restructuring and other initiatives.
We are aiming to bring a can-do attitude and expand the ways we work together with clients. Continually pursuing such opportunities will surely lead to the creation of new value incorporating both financial and non-financial products and services.
It is not that we cannot return to how things were before COVID-19, but rather that we choose not to. COVID-19 can be a catalyst to transform us into a stronger organization. With a shared awareness of this throughout the group, we can resolutely accelerate our transition to the next generation of financial services.
Sustainability initiatives
In order for us to continually enhance our corporate value, we must focus not only on our own value but on creating value for a broad range of stakeholders, including our shareholders, customers, employees, and society as a whole. From that perspective, we define sustainability for Mizuho as Mizuho’s sustainable and steady growth, environmental conservation,
and the sustainable development and prosperity of the economy, industry, and society both in Japan and around the world. With this as our basic approach, we will work together as a united group to formulate strategic initiatives.
Based on our awareness that climate change is one of the most crucial global issues having the potential to impact the stability of financial markets, we have positioned addressing environmental issues and climate change as a key part of our corporate strategy and are continually bolstering our initiatives.
A key aspect of this is dialogue with stakeholders—in other words, engagement. In April of this year we tightened our Environmental and Social Management Policy for Financing and Investment Activity and through this process, which involved extensive dialogue with clients and a variety of other stakeholders, we were able to thoughtfully explain our thinking and gain their understanding while maintaining a deep understanding of our clients’ business strategies. Together we are working towards a low-carbon society.
Additionally, proactive disclosure is an important aspect of engagement. This year, in addition to our Integrated Report we have released a TCFD Report. We are aiming to engage in further dialogue with our stakeholders by proactively disclosing the conditions/assumptions behind our efforts and the results of various considerations.
Going forward, we will continue to deepen our engagement with our customers, investors, and other varied stakeholders, listening closely to your opinions, and working to improve our initiatives and disclosures as a result. And we will ensure that this mindset is adopted throughout the organization. As the Group CEO, I am committed to leading the way as we enhance our initiatives.
Delivering benefits to our stakeholders
In recent years the concept of stakeholder capitalism has become increasingly popular; however, we at Mizuho have already embraced this idea. Our Corporate Philosophy, which forms the basis of Mizuho’s corporate activities, articulates our commitment to creating lasting value for our customers and the economies and communities in which we operate.
Traditional finance industry business models, where the business is structured around the accumulation of deposits, are in need of fundamental change in light of recent developments such as structural changes in society, the economy, and industry as well as the continuation of low and
Message from the Group CEO
102020 Integrated Report
011_7080587912009.indd 10 2020/09/10 13:15:57
negative interest rates. Additionally, trends such as regulatory easing and digitalization have led to the rise of fintech and the entry of new players into the finance industry, creating an even more challenging competitive environment for traditional financial institutions.
At the same time, the issues arising from COVID-19 have once again made it clear that there are some things that only a financial institution like us can do as we maintain sufficient capital and can provide credit in this situation. However that is not all we bring to the table. The strengths we have cultivated include trustworthiness and dependability, a broad customer base and extensive network, advanced financial and non-financial functions, and our approach to business as a united group. We will fully draw on these strengths to go beyond the traditional boundaries of finance, consider how to journey with our customers into the post-COVID-19 future and share risks with them as needed, acting as an invaluable partner for
achieving the future they envision. This is our role going forward and now is the time for us to prove our true value.
In order to achieve this, we need a talent pool of specialists who are well-versed in both finance and non-finance fields, have universally recognizable skillsets, and who our customers can depend on. To this end, we are promoting a new HR strategy centered around a compensation system which rewards the exercise of expertise as well as providing career design support. An increasing number of employees are applying for internal job postings, concurrent assignments, and external part-time roles. In this way we are working to enhance employees’ expertise and expand the opportunities available to take on new challenges both within and outside the organization. Going forward we will continue to encourage employees to expand their professional fields in line with their expertise and to grow. We will do this by building a new framework for how we develop, evaluate, and compensate
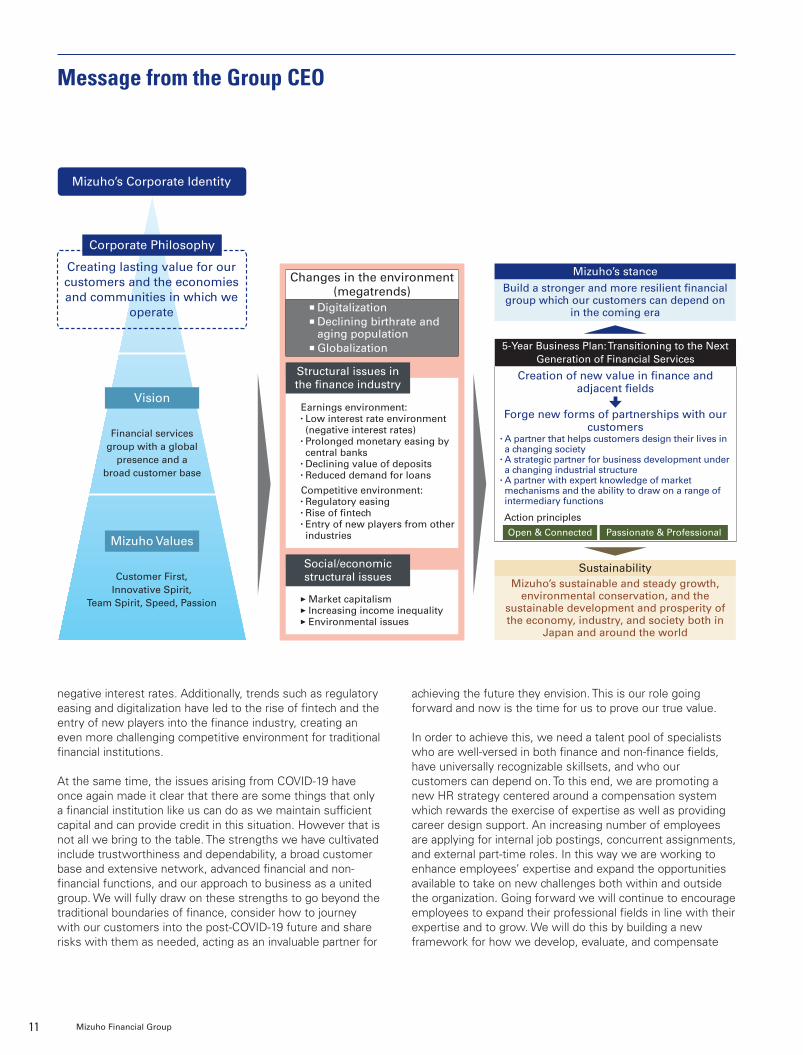
Changes in the environment (megatrends)
Digitalization Declining birthrate and aging population Globalization
Earnings environment:• Low interest rate environment (negative interest rates)
• Prolonged monetary easing by central banks
• Declining value of deposits• Reduced demand for loans
Competitive environment:• Regulatory easing• Rise of fintech• Entry of new players from other industries
Market capitalism Increasing income inequality Environmental issues
Structural issues in the finance industry
Social/economic structural issues
Mizuho’s Corporate Identity
Creating lasting value for our customers and the economies and communities in which we
operate
Corporate Philosophy
Vision
Financial services group with a global
presence and a broad customer base
Mizuho Values
Customer First, Innovative Spirit,
Team Spirit, Speed, Passion
Mizuho’s stanceBuild a stronger and more resilient financial group which our customers can depend on
in the coming era
5-Year Business Plan: Transitioning to the Next Generation of Financial Services
Creation of new value in finance and adjacent fields
Forge new forms of partnerships with our customers
• A partner that helps customers design their lives in a changing society
• A strategic partner for business development under a changing industrial structure
• A partner with expert knowledge of market mechanisms and the ability to draw on a range of intermediary functions
Action principles
Open & Connected Passionate & Professional
SustainabilityMizuho’s sustainable and steady growth,
environmental conservation, and the sustainable development and prosperity of the economy, industry, and society both in
Japan and around the world
Message from the Group CEO
11 Mizuho Financial Group
011_7080587912009.indd 11 2020/09/10 13:15:58
employees, among other considerations, as well as promoting the advancement and empowerment of diverse talent. Additionally, based on the experience of responding to the pandemic, we will work to achieve even more flexible work styles and enable employees to enhance their creativity and productivity while also ensuring their health and safety.
Through these efforts we will continue to deliver benefits to our varied stakeholders even as the times change, a mission embodied in the name Mizuho, which evokes images of a “bountiful harvest of rice” in Japanese.
In closing: Think, act, and deliver in order to rise up stronger than ever
This fiscal year is a critical moment for us as we face the unprecedented crisis brought about by COVID-19. The financial industry is said to be a mirror of the real economy in some ways and our performance may dip somewhat for at least this fiscal year. However, our customers and society expect great things of Mizuho. We must seize this critical moment and fully draw on our financial capabilities, including cash flow support and settlements, coming together as a united group in order to help society and the economy recover as early as possible.
Additionally, structural changes in society, the economy, and industry that will shape the post-COVID-19 world are occurring rapidly, such as digitalization and the shift to remote work and remote channels. In light of this, we will expand our business base, deepen our structural reforms, and otherwise further accelerate the transition to the next generation of financial services.
As the true value of financial services is being tested, this is a window of opportunity and if all of us at Mizuho can come together to think, act, and deliver, I am confident that we will rise up stronger than ever. The entire group is working together to achieve the objective I have outlined since I was appointed as Group CEO of “building a stronger and more resilient financial group which our customers can depend on in the coming era”. We appreciate your continued support and will do everything in our power to exceed your expectations.
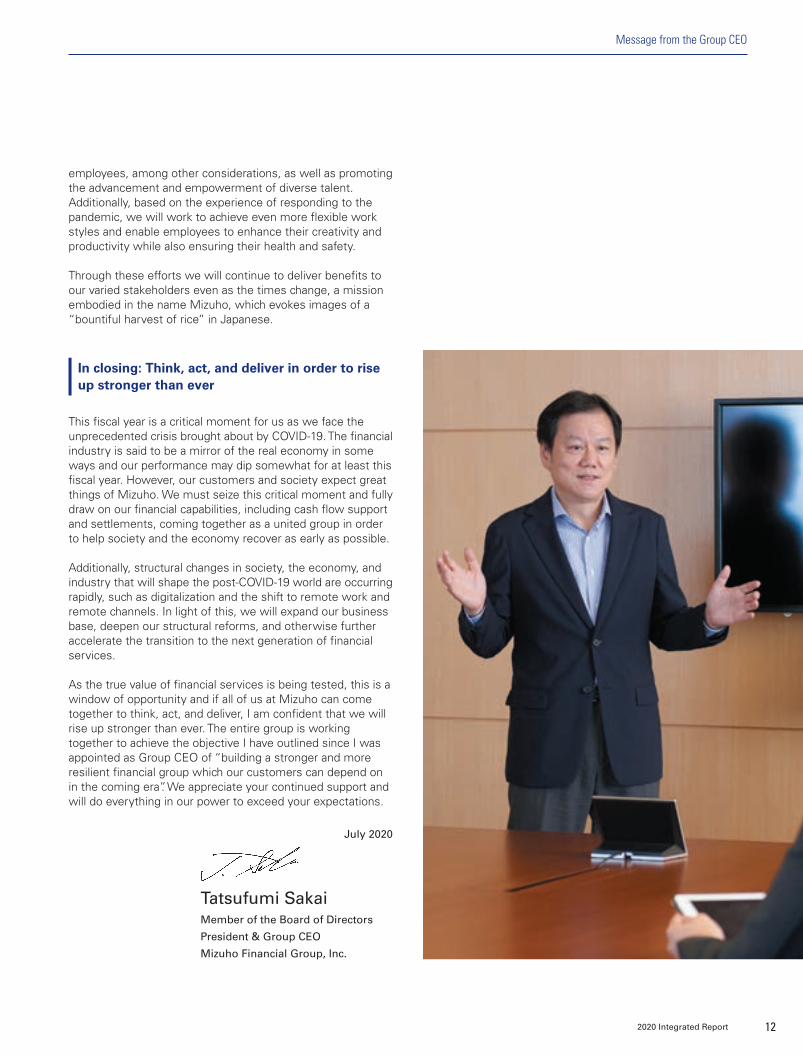
Tatsufumi SakaiMember of the Board of Directors
President & Group CEO
Mizuho Financial Group, Inc.
July 2020
Message from the Group CEO
122020 Integrated Report
011_7080587912009.indd 12 2020/09/14 17:50:14
This Integrated Report includes financial information as well as non-financial information on such subjects as ESG. The report presents information on Mizuho’s efforts related to strategies, governance, and other subjects along with information on how those activities are leading to the creation of value for our customers, society, and Mizuho over the short, medium, and long terms. It was edited with the intention of providing stakeholders with concise and clear explanations in a story-like form.
The content of this Integrated Report was reported to Mizuho Financial Group’s Audit Committee, which includes outside directors as members, and, after verification of appropriateness by the Disclosure Committee, the report was given final approval by the President & Group CEO.
We hope this report will further improve understanding of Mizuho and its goal of being “the most trusted financial services group with a global presence and a broad customer base, contributing to the prosperity of the world, Asia, and Japan.”
Editorial policy
International Integrated Reporting Council’s “International Integrated Reporting Framework” (published in December 2013)
Ministry of Economy, Trade and Industry’s “Guidance for Collaborative Value Creation” (published in May 2017)
Guidelines referred to
Period covered: From April 1, 2019 to March 31, 2020Also includes some information after April 2020Scope covered: In principle, Mizuho Financial Group and its subsidiaries and affiliates
Scope of the report
Date of issue: September 2020Publication information
CONTENTS
Importance/simplicity
Completeness
Non-financial
Financial
Integrated report 2020Annual Review
April 2019 – March 2020
Mizuho Financial Group
Mizu
ho
Finan
cial Gro
up
| Integ
rated R
epo
rt 2020
Mizuho Financial Group, Inc.1-5-5, Otemachi, Chiyoda-ku, Tokyo 100-8176, Japan
www.mizuho-fg.com
This PDF version of the Integrated Report is a digital version of the Forest Stewardship Council (FSC)-certified published version, which is printed on FSC-certified paper.
005_7080587912009.indd 1-3 2020/09/10 10:40:00
All figures contained in this report are calculated using accounting principles generally accepted in Japan (“Japanese GAAP”).Forward-Looking Statements
This Integrated Report contains statements that constitute forward-looking statements within the meaning of the United States Private Securities Litigation Reform Act of 1995, including estimates, forecasts, targets and plans. Such forward-looking statements do not represent any guarantee by management of future performance.
In many cases, but not all, we use such words as “aim,” “anticipate,” “believe,” “endeavor,” “estimate,” “expect,” “intend,” “may,” “plan,” “probability,” “project,” “risk,” “seek,” “should,” “strive,” “target” and similar expressions in relation to us or our management to identify forward-looking statements. You can also identify forward-looking statements by discussions of strategy, plans or intentions. These statements reflect our current views with respect to future events and are subject to risks, uncertainties and assumptions.
We may not be successful in implementing our business strategies, and management may fail to achieve its targets, for a wide range of possible reasons, including, without limitation: incurrence of significant credit-related costs; declines in the value of our securities portfolio; changes in interest rates; foreign currency fluctuations; decrease in the market liquidity of our assets; revised assumptions or other changes related to our pension plans; a decline in our deferred tax assets; the effect of financial transactions entered into for hedging and other similar purposes; failure to maintain required capital adequacy ratio levels; downgrades in our credit ratings; our ability to avoid reputational harm; our ability to implement our 5-Year Business Plan, realize the synergy effects of “One Mizuho,” and implement other strategic initiatives and measures effectively; the effectiveness of our operational, legal and other risk management policies; the effect of changes in general economic conditions in Japan and elsewhere; and changes to applicable laws and regulations. Further information regarding factors that could affect our financial condition and results of operations is included in “Item 3.D. Key Information—Risk Factors,” and “Item 5. Operating and Financial Review and Prospects” in our most recent Form 20-F filed with the U.S. Securities and Exchange Commission (“SEC”) and our report on Form 6-K furnished to the SEC on July 31, 2020, both of which are available in the Financial Information section of our web page at www.mizuho-fg.com and also at the SEC’s website at www.sec.gov.
The contents of this Integrated Report were prepared prior to the announcement of our financial results for the first quarter of fiscal 2020.
We do not intend to update our forward-looking statements. We are under no obligation, and disclaim any obligation, to update or alter our forward-looking statements, whether as a result of new information, future events or otherwise, except as may be required by the rules of the Tokyo Stock Exchange.
Integrated Report
On our website: Sustainability
https://www.mizuho-fg.com/csr/index.html
On our website: Financials and Presentationshttps://www.mizuho-fg.com/investors/
materials/index.html
• Company briefing materials
• Financial documents• IR event documents• Briefings for individual
investors
• Financial Statements• Securities Reports
(Japanese only)• SEC Filings• Financial Statements
(under US GAAP)
• Sustainability• Business Activities• Finance and Economic
Education• Employees• Human Rights
• Customers• Environment• Social Contributions• Governance• Communication
13 Mizuho Financial Group
P. 5 Message from the Group CEO
About MizuhoP. 14 Corporate IdentityP. 15 Value creation processP. 17 Mizuho’s journeyP. 19 Business domainP. 21 Financial dataP. 22 ESG-related data
— Opening feature —P. 3 COVID-19 related initiatives
P. 23 Message from the Group CFO
Our strategies for creating valueP. 31 Progress on the 5-Year Business PlanP. 33 Business strategies by company/unit
Retail & Business Banking Company Corporate & Institutional Company Global Corporate Company Global Markets Company Asset Management Company Global Products Unit Research & Consulting Unit
P. 47 DigitalizationP. 49 Employee engagementP. 53 Sustainability
Foundations for our corporate valueP. 69 Corporate governance
Board of DirectorsP. 79 Dialogue between the Group CEO
and Chairman of the Board of Directors
P. 83 Risk governanceP. 89 ComplianceP. 92 Fiduciary dutiesP. 93 Compliance with international
financial regulationsP. 94 Stakeholder communication
Data sectionP. 99 Eleven-year major financial data
(FY2009-2019)P. 101 Review and analysis for fiscal 2019P. 105 Five-year non-financial dataP. 106 ESG evaluation, Participation in
international initiativesP. 107 Mizuho’s global network
P. 108 Corporate profileP. 109 Group companies
AppendixP. 111 Compliance contactsP. 112 Support for SMEs and regional
revitalizationP. 113 Internal audit structureP. 114 Risk management structureP. 126 Business continuity managementP. 127 Senior executivesP. 128 Location of offices outside JapanP. 131 Investor informationP. 132 Financial Analysis [Under Japanese
GAAP]P. 140 Financial Data of Mizuho Financial
Group, Inc. [Under Japanese GAAP]P. 236 Non-Consolidated Financial
Statements of Mizuho Financial Group, Inc. and Three Subsidiaries [Under Japanese GAAP]
P. 250 Basel Regulatory DisclosuresP. 334 Disclosure Policy
012_7080587912009.indd 13 2020/09/10 19:24:50
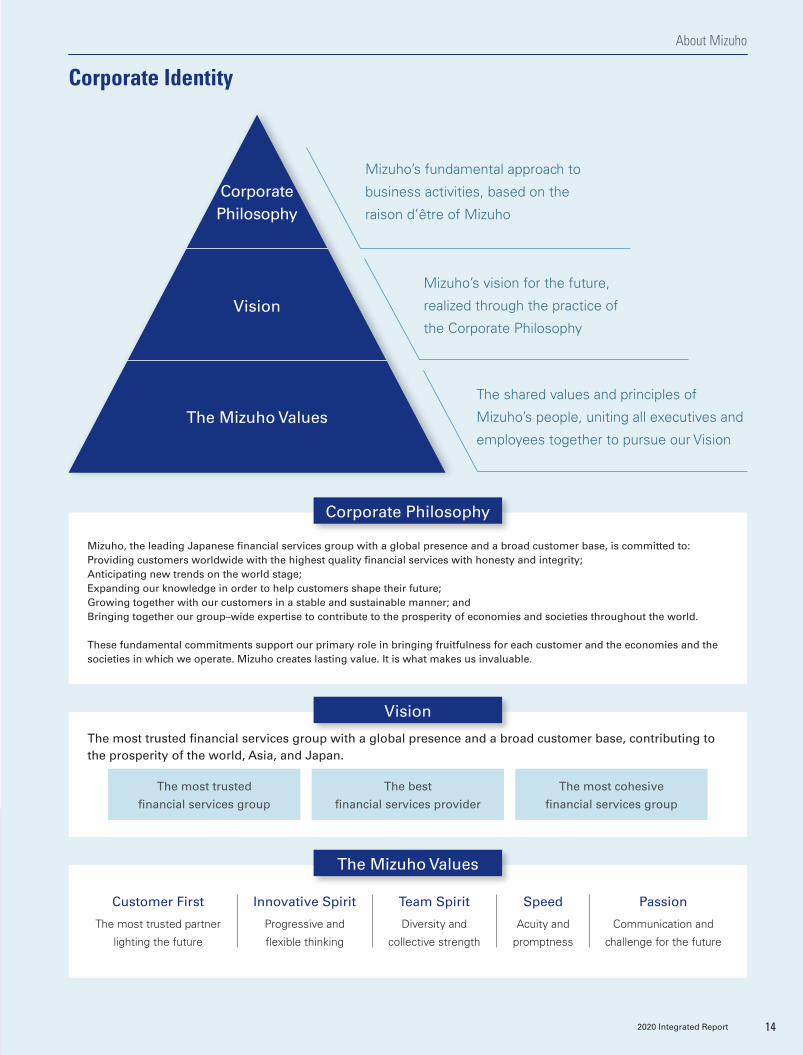
Corporate Philosophy
Vision
The Mizuho Values
The most trusted financial services group with a global presence and a broad customer base, contributing to the prosperity of the world, Asia, and Japan.
The most trusted
financial services group
The best
financial services provider
The most cohesive
financial services group
Corporate Philosophy
Vision
The Mizuho Values
Mizuho’s fundamental approach to
business activities, based on the
raison d’être of Mizuho
Mizuho’s vision for the future,
realized through the practice of
the Corporate Philosophy
The shared values and principles of
Mizuho’s people, uniting all executives and
employees together to pursue our Vision
Mizuho, the leading Japanese financial services group with a global presence and a broad customer base, is committed to:Providing customers worldwide with the highest quality financial services with honesty and integrity;Anticipating new trends on the world stage;Expanding our knowledge in order to help customers shape their future;Growing together with our customers in a stable and sustainable manner; andBringing together our group–wide expertise to contribute to the prosperity of economies and societies throughout the world.
These fundamental commitments support our primary role in bringing fruitfulness for each customer and the economies and the societies in which we operate. Mizuho creates lasting value. It is what makes us invaluable.
Team Spirit
Diversity and
collective strength
Speed
Acuity and
promptness
Innovative Spirit
Progressive and
flexible thinking
Customer First
The most trusted partner
lighting the future
Passion
Communication and
challenge for the future
142020 Integrated Report
Corporate Identity
About Mizuho
012_7080587912009.indd 14 2020/09/10 16:09:32
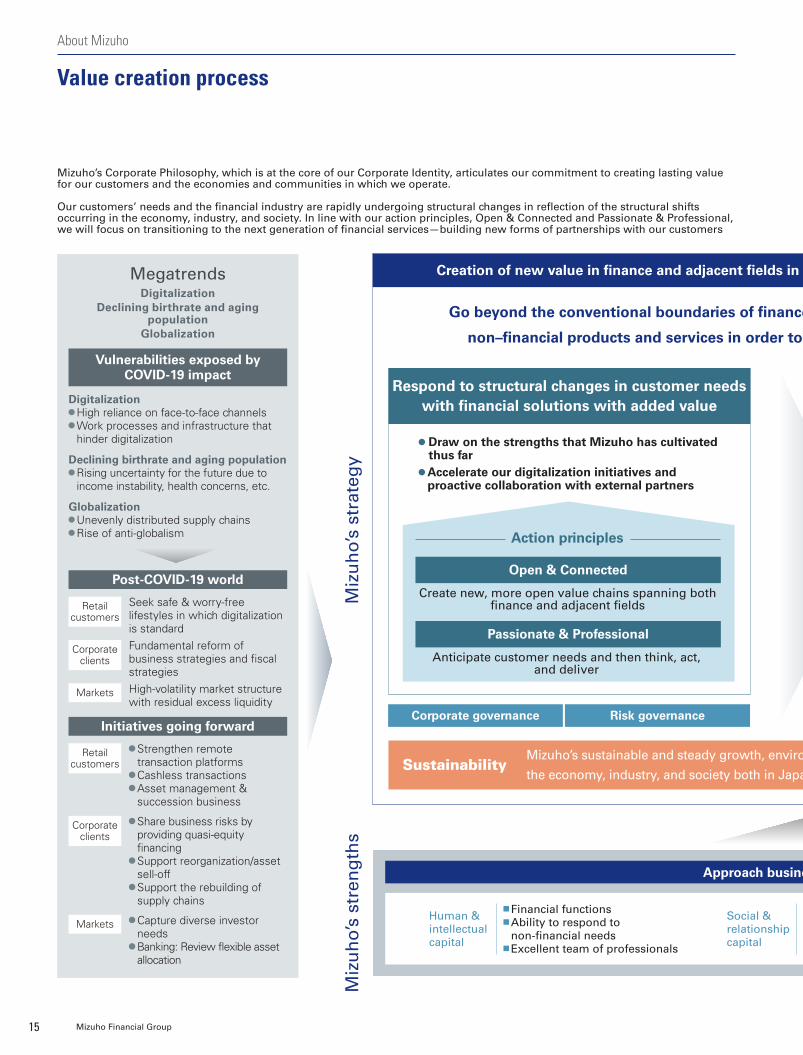
Mizuho’s Corporate Philosophy, which is at the core of our Corporate Identity, articulates our commitment to creating lasting value for our customers and the economies and communities in which we operate.
Our customers’ needs and the financial industry are rapidly undergoing structural changes in reflection of the structural shifts occurring in the economy, industry, and society. In line with our action principles, Open & Connected and Passionate & Professional, we will focus on transitioning to the next generation of financial services—building new forms of partnerships with our customers
Creation of new value in finance and adjacent fields in order to transition to the next generation of financial services
Open & Connected
Action principles
Passionate & Professional
Respond to structural changes in customer needs with financial solutions with added value
Post-COVID-19 world
Seek safe & worry-free lifestyles in which digitalization is standardFundamental reform of business strategies and fiscal strategiesHigh-volatility market structure with residual excess liquidity
Retail customers
Corporate clients
Markets
Initiatives going forward
Strengthen remote transaction platforms Cashless transactions Asset management & succession business
Share business risks by providing quasi-equity financing Support reorganization/asset sell-off Support the rebuilding of supply chains
Capture diverse investor needs Banking: Review flexible asset allocation
Corporate clients
Markets
Retail customers
MegatrendsDigitalization
Declining birthrate and aging population
Globalization
Go beyond the conventional boundaries of finance and create new value incorporating both financial and
non–financial products and services in order to forge new forms of partnerships with our customersVulnerabilities exposed by
COVID-19 impact
Digitalization High reliance on face-to-face channels Work processes and infrastructure that hinder digitalization
Declining birthrate and aging population Rising uncertainty for the future due to income instability, health concerns, etc.
Globalization Unevenly distributed supply chains Rise of anti-globalism
Create new, more open value chains spanning both finance and adjacent fields
Anticipate customer needs and then think, act, and deliver
Draw on the strengths that Mizuho has cultivated thus far Accelerate our digitalization initiatives and proactive collaboration with external partners
Financial functions Ability to respond to non-financial needs Excellent team of professionals
Customer base and network Trustworthiness and dependability Market presence
Human & intellectual capital
Social & relationship capital
Miz
uh
o’s
stre
ng
ths
Miz
uh
o’s
stra
teg
y
Corporate governance Risk governance
Approach business as a unified group
SustainabilityMizuho’s sustainable and steady growth, environmental conservation, and the sustainable development and prosperity of
the economy, industry, and society both in Japan and around the world.
15 Mizuho Financial Group
About Mizuho
Value creation process
012_7080587912009.indd 15 2020/09/10 16:09:32
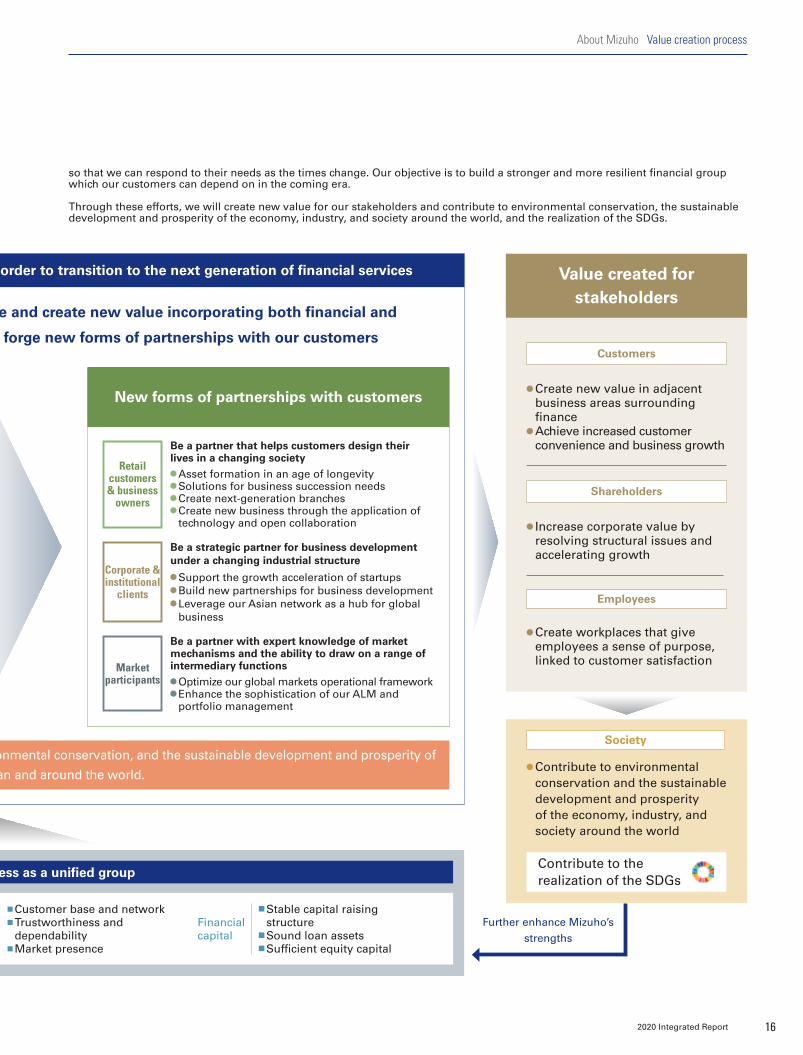
so that we can respond to their needs as the times change. Our objective is to build a stronger and more resilient financial group which our customers can depend on in the coming era.
Through these efforts, we will create new value for our stakeholders and contribute to environmental conservation, the sustainable development and prosperity of the economy, industry, and society around the world, and the realization of the SDGs.
Creation of new value in finance and adjacent fields in order to transition to the next generation of financial services
Go beyond the conventional boundaries of finance and create new value incorporating both financial and
non–financial products and services in order to forge new forms of partnerships with our customers
Value created for stakeholders
Create new value in adjacent business areas surrounding finance Achieve increased customer convenience and business growth
Customers
Increase corporate value by resolving structural issues and accelerating growth
Shareholders
Further enhance Mizuho’s strengths
Create workplaces that give employees a sense of purpose, linked to customer satisfaction
Employees
Contribute to the realization of the SDGs
Contribute to environmental conservation and the sustainable development and prosperity of the economy, industry, and society around the world
Society
Customer base and network Trustworthiness and dependability Market presence
Stable capital raising structure Sound loan assets Sufficient equity capital
Financial capital
New forms of partnerships with customers
Be a partner that helps customers design their lives in a changing society
Asset formation in an age of longevity Solutions for business succession needs Create next-generation branches Create new business through the application of technology and open collaboration
Retail customers & business
owners
Be a strategic partner for business development under a changing industrial structure
Support the growth acceleration of startups Build new partnerships for business development Leverage our Asian network as a hub for global business
Corporate & institutional
clients
Be a partner with expert knowledge of market mechanisms and the ability to draw on a range of intermediary functions
Optimize our global markets operational framework Enhance the sophistication of our ALM and portfolio management
Market participants
Approach business as a unified group
Mizuho’s sustainable and steady growth, environmental conservation, and the sustainable development and prosperity of
the economy, industry, and society both in Japan and around the world.
162020 Integrated Report
About Mizuho Value creation process
012_7080587912009.indd 16 2020/09/10 16:09:32

2003産業再生機構設置
2004銀行に証券仲介業務が解禁
2007サブプライムローン問題発生
2008リーマンショック発生
2010
2003Establishment of the Industrial Revitalization Corporation of Japan
2004Banks are permitted to act as securities brokerages
2007Sub-prime mortgage crisis
2008Global financial crisis
2010European debt crisis
Always standing at the forefront of our time, trailblazing is in our
The Dai-ichi Bank(photo: National Diet Library)
2002Establishment of Mizuho Bank and Mizuho Corporate Bank
1873 Establishment of The Dai-ichi Bank, 1971 Establishment of the Dai-ichi Kangyo Bank through a merger with Nihon Kangyo Bank
The Dai-ichi Kangyo Bank
1873
Yasuda Bank(photo: National Diet Library)
1880 Establishment of Yasuda Bank, 1948 Changed to The Fuji Bank
The Fuji Bank
1880
(photo: The Mainichi)
1902 Establishment as a public sector bank that not only offers long-term funding but also securities and trust banking services
The Industrial Bank of Japan
1902
2003Establishment of Mizuho Financial GroupEstablishment of Mizuho Trust & BankingMerger with Mizuho Asset Trust & Banking
2006Completion of public fund repaymentListed on NYSE
Establishment of Mizuho Holdings
2000 2005Announcement of business strategy: Channel to Discovery Plan
Announcement of medium-term policy: Mizuho’s Transformation Program
Aiming to be a financial partner that helps customers shape their future and achieve their dreams
Aiming to be the most trusted financial institution by its customers in and outside Japan by focusing on the core function of contributing to social and economic development
DNA
2010
17 Mizuho Financial Group
About Mizuho
Mizuho’s journey
1999Merger of our three predecessor banks
012_7080587912009.indd 17 2020/09/10 16:09:33
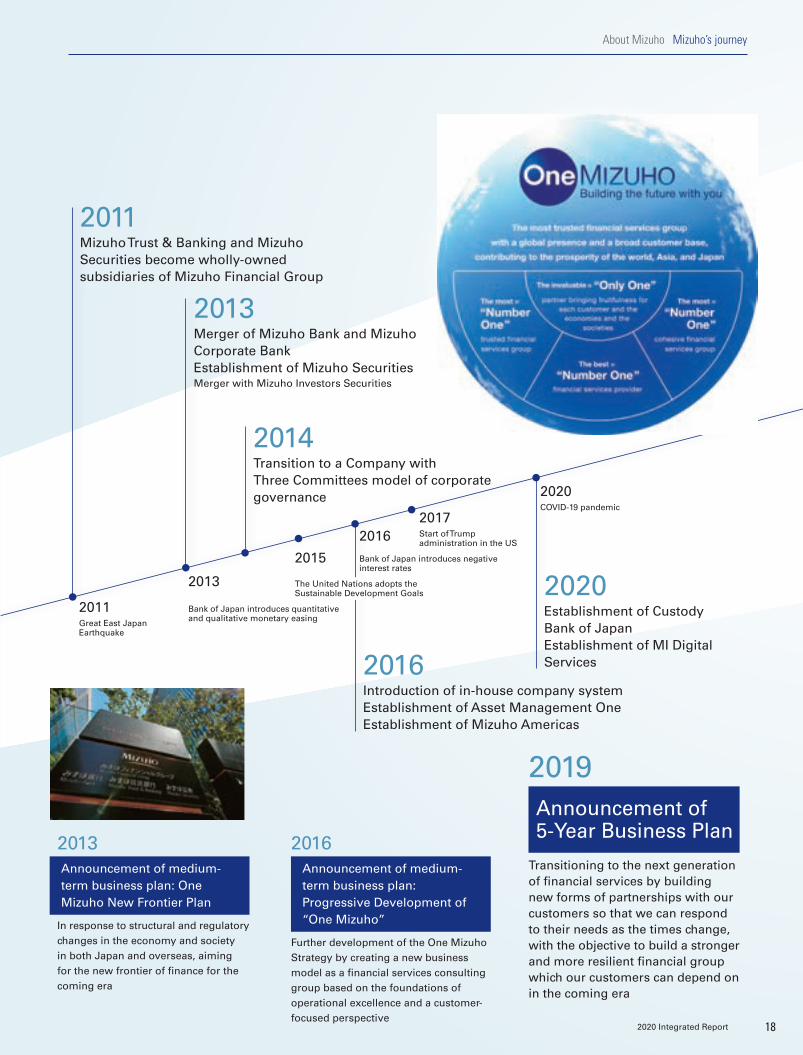
2011Great East Japan Earthquake
2013
Bank of Japan introduces quantitative and qualitative monetary easing
2017Start of Trump administration in the US
2015
2016Bank of Japan introduces negative interest rates
2011東日本大震災発生
2013日銀が「量的・質的金融緩和」導入
2017米国でトランプ政権発足
20152016日銀がマイナス金利政策導入
2020新型コロナウィルス 感染拡大2019
The United Nations adopts the Sustainable Development Goals
Announcement of medium-term business plan: One Mizuho New Frontier Plan
Announcement of medium-term business plan: Progressive Development of “One Mizuho”
Announcement of 5-Year Business Plan
2013Merger of Mizuho Bank and Mizuho Corporate BankEstablishment of Mizuho SecuritiesMerger with Mizuho Investors Securities
2016Introduction of in-house company systemEstablishment of Asset Management OneEstablishment of Mizuho Americas
2020Establishment of Custody Bank of JapanEstablishment of MI Digital Services
2011Mizuho Trust & Banking and Mizuho Securities become wholly-owned subsidiaries of Mizuho Financial Group
2014Transition to a Company with Three Committees model of corporate governance
In response to structural and regulatory changes in the economy and society in both Japan and overseas, aiming for the new frontier of finance for the coming era
Further development of the One Mizuho Strategy by creating a new business model as a financial services consulting group based on the foundations of operational excellence and a customer-focused perspective
Transitioning to the next generation of financial services by building new forms of partnerships with our customers so that we can respond to their needs as the times change, with the objective to build a stronger and more resilient financial group which our customers can depend on in the coming era
2020COVID-19 pandemic
2013 2016
2019
182020 Integrated Report
About Mizuho Mizuho’s journey
012_7080587912009.indd 18 2020/09/10 16:09:34
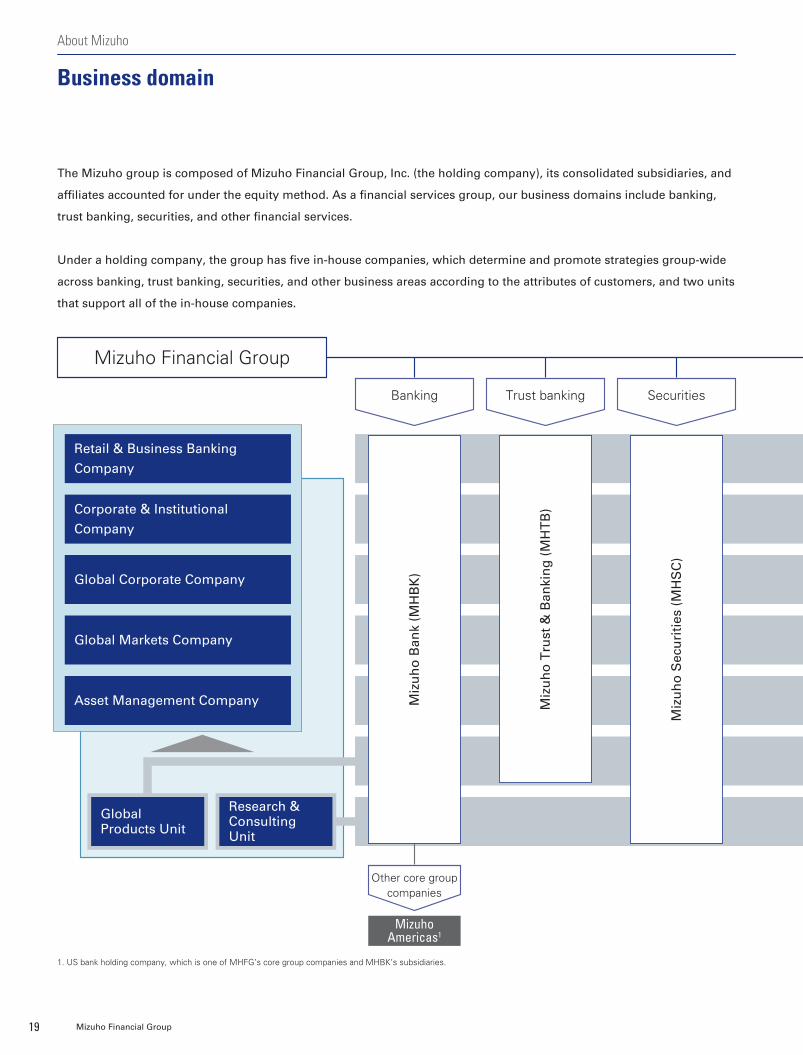
The Mizuho group is composed of Mizuho Financial Group, Inc. (the holding company), its consolidated subsidiaries, and
affiliates accounted for under the equity method. As a financial services group, our business domains include banking,
trust banking, securities, and other financial services.
Under a holding company, the group has five in-house companies, which determine and promote strategies group-wide
across banking, trust banking, securities, and other business areas according to the attributes of customers, and two units
that support all of the in-house companies.
Mizuho Financial Group
Banking
Other core group companies
Trust banking Securities
1. US bank holding company, which is one of MHFG’s core group companies and MHBK’s subsidiaries.
Miz
uh
o T
rust
& B
anki
ng
(M
HT
B)
Miz
uh
o S
ecu
riti
es (
MH
SC
)
Miz
uh
o B
ank
(MH
BK
)
Mizuho Americas1
Retail & Business Banking
Company
Corporate & Institutional
Company
Global Corporate Company
Global Markets Company
Asset Management Company
Global Products Unit
Research & Consulting Unit
19 Mizuho Financial Group
About Mizuho
Business domain
012_7080587912009.indd 19 2020/09/10 16:09:34
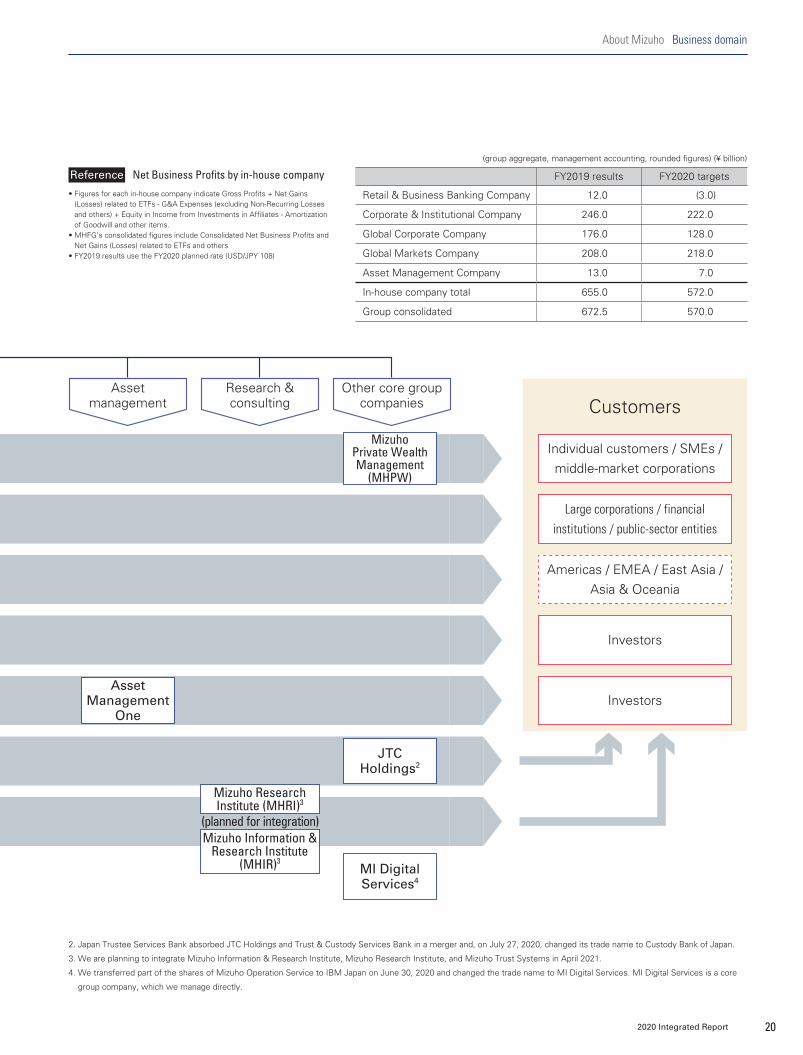
• Figures for each in-house company indicate Gross Profits + Net Gains (Losses) related to ETFs - G&A Expenses (excluding Non-Recurring Losses and others) + Equity in Income from Investments in Affiliates - Amortization of Goodwill and other items.
• MHFG’s consolidated figures include Consolidated Net Business Profits and Net Gains (Losses) related to ETFs and others
• FY2019 results use the FY2020 planned rate (USD/JPY 108)
Reference Net Business Profits by in-house company FY2019 results FY2020 targets
Retail & Business Banking Company 12.0 (3.0)
Corporate & Institutional Company 246.0 222.0
Global Corporate Company 176.0 128.0
Global Markets Company 208.0 218.0
Asset Management Company 13.0 7.0
In-house company total 655.0 572.0
Group consolidated 672.5 570.0
(group aggregate, management accounting, rounded figures) (¥ billion)
Asset management
Research & consulting
Other core group companies Customers
Individual customers / SMEs / middle-market corporations
Large corporations / financial institutions / public-sector entities
Americas / EMEA / East Asia / Asia & Oceania
Investors
InvestorsAsset
Management One
Mizuho Private Wealth Management
(MHPW)
JTC Holdings2
MI Digital Services4
Mizuho Information & Research Institute
(MHIR)3
Mizuho Research Institute (MHRI)3
(planned for integration)
2. Japan Trustee Services Bank absorbed JTC Holdings and Trust & Custody Services Bank in a merger and, on July 27, 2020, changed its trade name to Custody Bank of Japan.
3. We are planning to integrate Mizuho Information & Research Institute, Mizuho Research Institute, and Mizuho Trust Systems in April 2021.
4. We transferred part of the shares of Mizuho Operation Service to IBM Japan on June 30, 2020 and changed the trade name to MI Digital Services. MI Digital Services is a core
group company, which we manage directly.
202020 Integrated Report
About Mizuho Business domain
012_7080587912009.indd 20 2020/09/10 16:09:34
Other key indicators
Financial targets
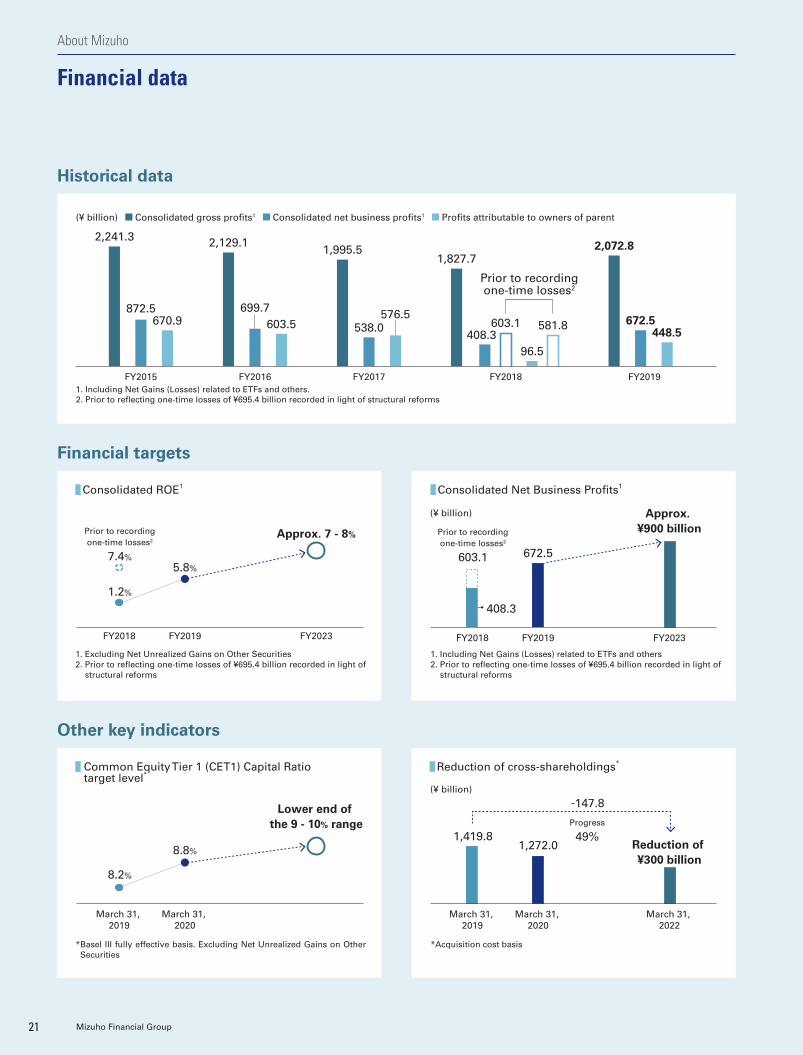
Historical data
FY2017 FY2018
2,072.8
672.5872.5
670.9699.7
603.5 538.0576.5
96.5
603.1 581.8
FY2019
448.5
FY2016
2,129.11,995.5
1,827.7
FY2015
2,241.3
408.3
(¥ billion) Consolidated gross profits1 Consolidated net business profits1 Profits attributable to owners of parent
Prior to recordingone-time losses2
1. Including Net Gains (Losses) related to ETFs and others.2. Prior to reflecting one-time losses of ¥695.4 billion recorded in light of structural reforms
1. Excluding Net Unrealized Gains on Other Securities2. Prior to reflecting one-time losses of ¥695.4 billion recorded in light of
structural reforms
1. Including Net Gains (Losses) related to ETFs and others2. Prior to reflecting one-time losses of ¥695.4 billion recorded in light of
structural reforms
Prior to recordingone-time losses2
7.4%
1.2%
FY2018 FY2019 FY2023
5.8%
Approx. 7 - 8% Prior to recordingone-time losses2
603.1
FY2018 FY2019 FY2023
672.5
Approx. ¥900 billion
408.3
(¥ billion)
* Basel III fully effective basis. Excluding Net Unrealized Gains on Other Securities
* Acquisition cost basis
8.2%
March 31, 2019
March 31, 2020
8.8%
Lower end of the 9 - 10% range
1,419.8Progress
49%
March 31, 2019
March 31, 2020
March 31, 2022
1,272.0 Reduction of ¥300 billion
-147.8(¥ billion)
Consolidated ROE1 Consolidated Net Business Profits1
Common Equity Tier 1 (CET1) Capital Ratio target level*
Reduction of cross-shareholdings*
21 Mizuho Financial Group
About Mizuho
Financial data
012_7080587912009.indd 21 2020/09/10 16:09:34
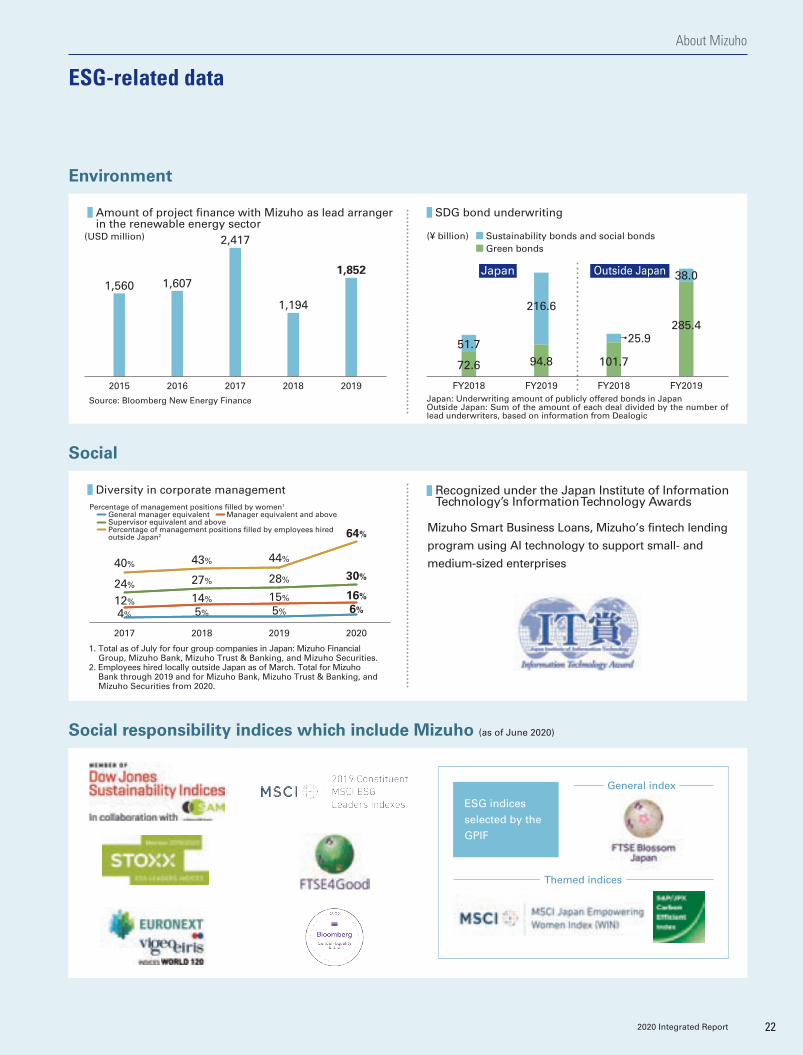
Social responsibility indices which include Mizuho (as of June 2020)
ESG indices selected by the GPIF
General index
Themed indices
Diversity in corporate management Recognized under the Japan Institute of Information Technology’s Information Technology Awards
Amount of project finance with Mizuho as lead arranger in the renewable energy sector
SDG bond underwriting
(USD million)
20192018201720162015
1,852
1,194
2,417
1,6071,560
Source: Bloomberg New Energy Finance
1. Total as of July for four group companies in Japan: Mizuho Financial Group, Mizuho Bank, Mizuho Trust & Banking, and Mizuho Securities.
2. Employees hired locally outside Japan as of March. Total for Mizuho Bank through 2019 and for Mizuho Bank, Mizuho Trust & Banking, and Mizuho Securities from 2020.
Japan: Underwriting amount of publicly offered bonds in JapanOutside Japan: Sum of the amount of each deal divided by the number of lead underwriters, based on information from Dealogic
FY2019FY2018FY2019FY2018
38.0
25.9
216.6
51.7
285.4
101.794.872.6
Japan Outside Japan
(¥ billion) Sustainability bonds and social bondsGreen bonds
2020201920182017
64%
44%43%40%
30%28%27%24%16%15%14%12%6%5%5%4%
Percentage of management positions filled by women1
General manager equivalent Manager equivalent and above Supervisor equivalent and above Percentage of management positions filled by employees hired
outside Japan2Mizuho Smart Business Loans, Mizuho’s fintech lending
program using AI technology to support small- and
medium-sized enterprises
Social
Environment
222020 Integrated Report
About Mizuho
ESG-related data
012_7080587912009.indd 22 2020/09/10 16:09:35

Financial management principles amid an unprecedented crisis
The spread of the novel coronavirus (COVID-19) has halted the movements of people and goods on a global scale and is having a drastic negative impact on the global economy including severe deterioration of consumer demand. Now, as the world faces this unprecedented crisis, there are strong expectations for financial institutions to respond to the rising financing needs of customers and fulfill our financial intermediary functions to enable a swift recovery for society and the economy.
We expect that the next one to two years will bring a challenging earnings environment for Mizuho as well. Our first objective is to reinforce our defenses and ensure disciplined control of Credit-related Costs and expenses, and I believe it is important to conduct proactive fiscal management that preempts changes that could be on the horizon, just as we recorded additional reserves for possible losses on loans in our fiscal 2019 financial results.
As global markets undergo structural changes due to megatrends including declining birthrate and an aging population, digitalization, and globalization, we must implement
structural reforms at Mizuho giving additional consideration to the impact of COVID-19. We will steadily advance the transition to the next generation of financial services through measures including revising our business portfolio and reallocating corporate resources.
Overview of fiscal 2019
In fiscal 2019, as the result of strong performance in both customer and markets divisions, we achieved Consolidated Net Business Profits (including Net Gains (Losses) related to ETFs1 and others) of ¥672.5 billion, for a year-on-year increase of ¥264.2 billion. Even after adjusting for losses recorded due to restructuring our securities portfolio last fiscal year, this still represents an increase of ¥69.4 billion.
We recorded ¥171.7 billion in Credit-related Costs including ¥80.4 billion in additional reserves for possible losses on loans from a forward-looking perspective in light of the impact that COVID-19 may have on our finances and based on the future outlook of certain loans. As for Net Gains (Losses) related to Stocks (not including Net Gains (Losses) related to ETFs1 and others), due to a drop in stock prices we posted ¥39.4 billion in unrealized losses
Supporting customers and
contributing to a swift economic
recovery by fulfilling our
financial intermediary functions,
we will enact finance structure
reforms to transition to the next
generation of financial services
Makoto Umemiya
Member of the Board of DirectorsSenior Managing Executive OfficerHead of Financial Control & Accounting Group (Group CFO)
23 Mizuho Financial Group
Message from the Group CFO
010_7080585842009.indd 23 2020/09/15 16:31:12

¥672.5 billion
+¥264.2 billion (year-on-year)108% of target
Fiscal 2019 Consolidated Net Business Profits
(including Net Gains (Losses) related to ETFs and others)
¥448.5 billion
+¥352 billion (year-on-year)95% of target
Fiscal 2019 Profit Attributable to Owners of Parent
on securities (with readily determinable fair values), but recorded a ¥126.5 billion gain mainly due to steady progress on reducing cross-shareholdings.
As a result of the above, we achieved Profit Attributable to Owners of Parent of ¥448.5 billion, reaching 95% of our initial fiscal year estimate of ¥470 billion, an increase of ¥352 billion compared to last fiscal year when we recorded impairment losses on fixed assets.
We are also making good progress on the financial targets and other objectives outlined in our 5-Year Business Plan, which we launched in fiscal 2019. As of the end of fiscal 2019 our Common Equity Tier 1 (CET1) Capital Ratio was 8.8%2 on a Basel III fully effective basis, and is increasing steadily toward our goal of the lower end of the 9 – 10% range. Also, regarding the reduction of cross-shareholdings, through diplomatic discussions with clients we successfully reduced ¥147.8 billion in cross-shareholdings compared to the end of fiscal 2018, marking 49% progress on our target of reducing ¥300 billion in cross-shareholdings over the three years to fiscal 2021. Additionally, as a finance structure reform initiative we are reducing the scale of our workforce, the number of branches and offices in Japan, as well as expenses, and currently each of these plans remain unaffected by the COVID-19 pandemic, with progress on workforce and expense reduction in particular exceeding the fiscal 2019 targets.
By reallocating the corporate resources secured through these initiatives to new business domains, business outside Japan, transaction banking, and other focus areas, we aim to improve risk & return and cost & return and accumulate stable revenue streams as the foundation for steady dividend payouts.1. Net Gains (Losses) related to ETFs (aggregate for
Mizuho Bank and Mizuho Trust & Banking) + Net Gains on Operating Investment Securities (Mizuho Securities consolidated).
2. Excluding Unrealized Gains (Losses) on Other Securities
Outlook for fiscal 2020
At present we are unable to accurately predict how widespread the impact of COVID-19 will be or for how long it will pose a serious threat. With this in mind, we have formed our fiscal 2020 business plan based on a scenario which assumes that the economy will bottom out in the first half of fiscal 2020, and enter a gradual recovery lasting until the end of 2021.
The negative impact of the pandemic will be particularly severe this fiscal year, and we estimate earnings of ¥570 billion in Consolidated Net Business Profits (including Net Gains (Losses) related to ETFs and others*), a reduction of approximately ¥100 billion year-on-year due to the impact of interest rate cuts outside of Japan and a reduction in retail investment business, among other factors. We expect that the impact
Other key indicators
March 31, 2020 -
CET1 Capital Ratio3 8.8% Lower end of the 9 – 10% range
(target)
Reduction of cross-shareholdings4
Reduction of ¥147.8 billion
Reduction of ¥300 billion (end-FY2018 to end-FY2021)
1. Excluding Net Unrealized Gains (Losses) on Other Securities2. Including Net Gains (Losses) related to ETFs and others3. Basel III fully effective basis. Excluding Net Unrealized Gains (Losses) on Other
Securities4. Acquisition cost basis
Financial targets
FY2019 FY2023
Consolidated ROE1 5.8% 7 – 8%
Consolidated Net Business Profits2 ¥672.5 billion approx. ¥900 billion
Progress on the 5-Year Business Plan
FY2020 targets
FY2019 FY2020
Consolidated Net Business Profits1 ¥672.5 billion ¥570 billion
Credit-related Costs - ¥171.7 billion - ¥200 billion
Net Gains (Losses) related to Stocks2 ¥126.5 billion ¥80 billion
Ordinary Profits ¥637.8 billion ¥400 billion
Net Income Attributable to Mizuho Financial Group3
¥448.5 billion ¥320 billion
1. Including Net Gains (Losses) related to ETFs and others2. Excluding Net Gains (Losses) related to ETFs and others3. Profit Attributable to Owners of Parent
* Net Gains related to ETFs (aggregate for Mizuho Bank and Mizuho Trust & Banking) + Net Gains on Operating Investment Securities (Mizuho Securities consolidated).
242020 Integrated Report
Message from the Group CFO
010_7080585842009.indd 24 2020/09/15 16:31:12
has been maintained throughout the current pandemic and the smooth provision of financing is underpinning the real economy, plus, the soundness of Mizuho’s credit portfolio has been greatly improved since the financial crisis.
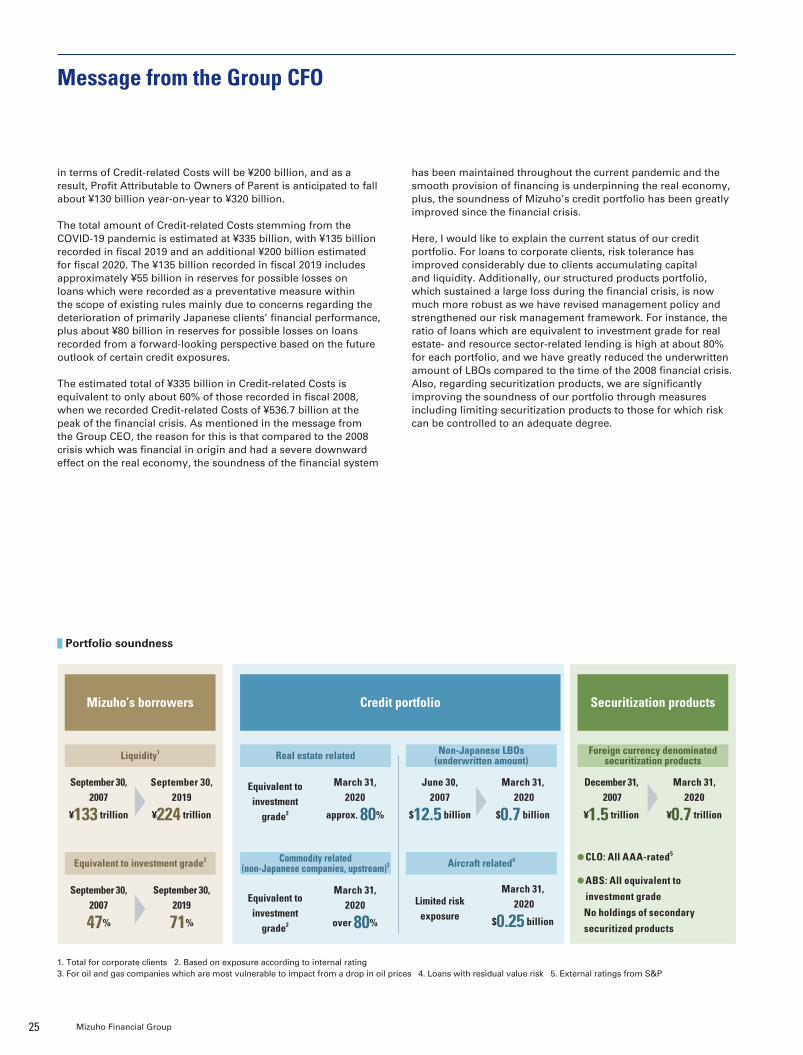
Here, I would like to explain the current status of our credit portfolio. For loans to corporate clients, risk tolerance has improved considerably due to clients accumulating capital and liquidity. Additionally, our structured products portfolio, which sustained a large loss during the financial crisis, is now much more robust as we have revised management policy and strengthened our risk management framework. For instance, the ratio of loans which are equivalent to investment grade for real estate- and resource sector-related lending is high at about 80% for each portfolio, and we have greatly reduced the underwritten amount of LBOs compared to the time of the 2008 financial crisis. Also, regarding securitization products, we are significantly improving the soundness of our portfolio through measures including limiting securitization products to those for which risk can be controlled to an adequate degree.
in terms of Credit-related Costs will be ¥200 billion, and as a result, Profit Attributable to Owners of Parent is anticipated to fall about ¥130 billion year-on-year to ¥320 billion.
The total amount of Credit-related Costs stemming from the COVID-19 pandemic is estimated at ¥335 billion, with ¥135 billion recorded in fiscal 2019 and an additional ¥200 billion estimated for fiscal 2020. The ¥135 billion recorded in fiscal 2019 includes approximately ¥55 billion in reserves for possible losses on loans which were recorded as a preventative measure within the scope of existing rules mainly due to concerns regarding the deterioration of primarily Japanese clients’ financial performance, plus about ¥80 billion in reserves for possible losses on loans recorded from a forward-looking perspective based on the future outlook of certain credit exposures.
The estimated total of ¥335 billion in Credit-related Costs is equivalent to only about 60% of those recorded in fiscal 2008, when we recorded Credit-related Costs of ¥536.7 billion at the peak of the financial crisis. As mentioned in the message from the Group CEO, the reason for this is that compared to the 2008 crisis which was financial in origin and had a severe downward effect on the real economy, the soundness of the financial system
Liquidity1
Equivalent to investment grade2
Mizuho’s borrowers
Foreign currency denominated securitization products
Non-Japanese LBOs (underwritten amount)
June 30, 2007
$12.5 billion
March 31, 2020
$0.7 billion
December 31, 2007
¥1.5 trillion
March 31, 2020
¥0.7 trillion
September 30, 2007
¥133 trillion
September 30, 2007
47%
September 30, 2019
¥224 trillion
September 30, 2019
71%
Aircraft related4
Limited risk exposure
March 31, 2020
$0.25 billion
Real estate related
Credit portfolio
Commodity related (non-Japanese companies, upstream)3
Equivalent to investment
grade2
Equivalent to investment
grade2
March 31, 2020
approx. 80%
March 31, 2020
over 80%
CLO: All AAA-rated5
ABS: All equivalent to
investment grade No holdings of secondary
securitized products
Securitization products
1. Total for corporate clients 2. Based on exposure according to internal rating 3. For oil and gas companies which are most vulnerable to impact from a drop in oil prices 4. Loans with residual value risk 5. External ratings from S&P
Portfolio soundness
25 Mizuho Financial Group
Message from the Group CFO
010_7080585842009.indd 25 2020/09/15 16:31:12
Capital management policy
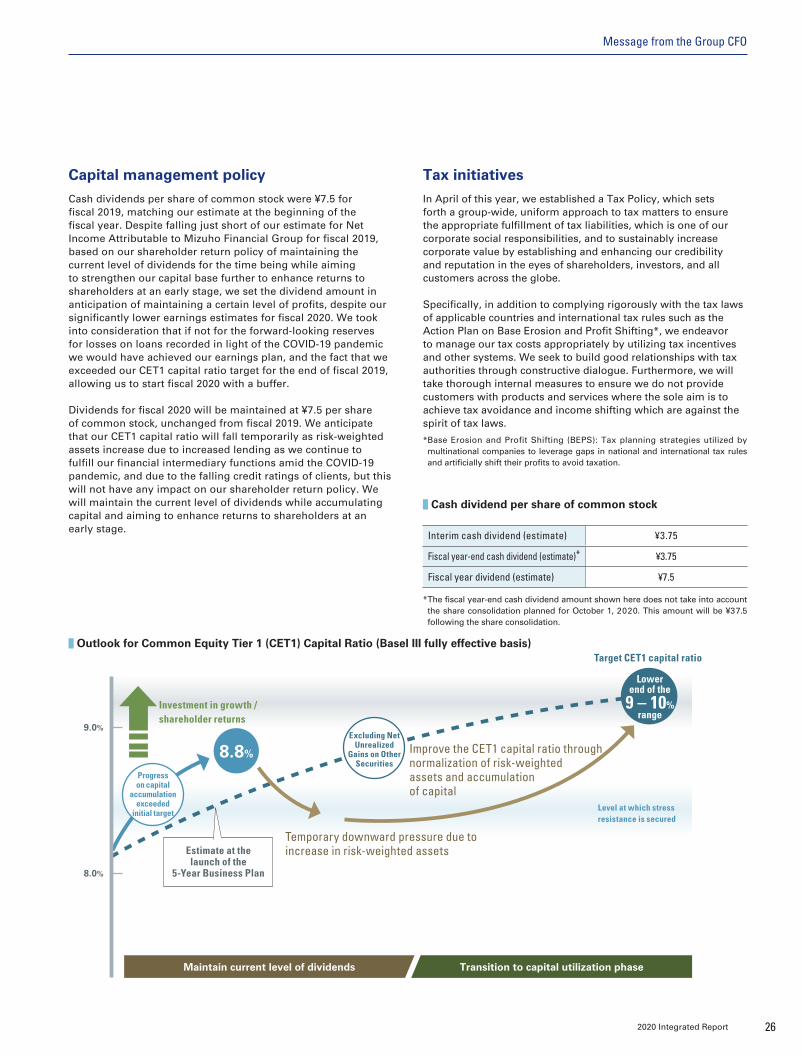
Cash dividends per share of common stock were ¥7.5 for fiscal 2019, matching our estimate at the beginning of the fiscal year. Despite falling just short of our estimate for Net Income Attributable to Mizuho Financial Group for fiscal 2019, based on our shareholder return policy of maintaining the current level of dividends for the time being while aiming to strengthen our capital base further to enhance returns to shareholders at an early stage, we set the dividend amount in anticipation of maintaining a certain level of profits, despite our significantly lower earnings estimates for fiscal 2020. We took into consideration that if not for the forward-looking reserves for losses on loans recorded in light of the COVID-19 pandemic we would have achieved our earnings plan, and the fact that we exceeded our CET1 capital ratio target for the end of fiscal 2019, allowing us to start fiscal 2020 with a buffer.
Dividends for fiscal 2020 will be maintained at ¥7.5 per share of common stock, unchanged from fiscal 2019. We anticipate that our CET1 capital ratio will fall temporarily as risk-weighted assets increase due to increased lending as we continue to fulfill our financial intermediary functions amid the COVID-19 pandemic, and due to the falling credit ratings of clients, but this will not have any impact on our shareholder return policy. We will maintain the current level of dividends while accumulating capital and aiming to enhance returns to shareholders at an early stage.
Tax initiatives
In April of this year, we established a Tax Policy, which sets forth a group-wide, uniform approach to tax matters to ensure the appropriate fulfillment of tax liabilities, which is one of our corporate social responsibilities, and to sustainably increase corporate value by establishing and enhancing our credibility and reputation in the eyes of shareholders, investors, and all customers across the globe.
Specifically, in addition to complying rigorously with the tax laws of applicable countries and international tax rules such as the Action Plan on Base Erosion and Profit Shifting*, we endeavor to manage our tax costs appropriately by utilizing tax incentives and other systems. We seek to build good relationships with tax authorities through constructive dialogue. Furthermore, we will take thorough internal measures to ensure we do not provide customers with products and services where the sole aim is to achieve tax avoidance and income shifting which are against the spirit of tax laws.
Outlook for Common Equity Tier 1 (CET1) Capital Ratio (Basel III fully effective basis)
Maintain current level of dividends Transition to capital utilization phase
8.8%
9.0%
8.0%
Estimate at the launch of the
5-Year Business Plan
Investment in growth / shareholder returns
Level at which stress resistance is secured
Improve the CET1 capital ratio through normalization of risk-weighted assets and accumulation of capital
Temporary downward pressure due to increase in risk-weighted assets
Target CET1 capital ratio
Progress on capital
accumulation exceeded
initial target
Excluding Net Unrealized
Gains on Other Securities
Lower end of the 9 – 10%
range
* The fiscal year-end cash dividend amount shown here does not take into account the share consolidation planned for October 1, 2020. This amount will be ¥37.5 following the share consolidation.
* Base Erosion and Profit Shifting (BEPS): Tax planning strategies utilized by multinational companies to leverage gaps in national and international tax rules and artificially shift their profits to avoid taxation.
Cash dividend per share of common stock
Interim cash dividend (estimate) ¥3.75
Fiscal year-end cash dividend (estimate)* ¥3.75
Fiscal year dividend (estimate) ¥7.5
262020 Integrated Report
Message from the Group CFO
010_7080585842009.indd 26 2020/09/15 16:31:12
Enhancing engagement with shareholders and investors
In recent years, the relationship between companies and their shareholders and investors is changing, with the interests of shareholders and investors expanding to include not only business strategy and capital management policy, but also the sustainable improvement of corporate value from a broad range of perspectives such as environmental sustainability. In light of this, we at Mizuho are making efforts to enhance engagement as well as our disclosure.
As one part of these efforts, at the Ordinary General Meeting of Shareholders held in June of this year, we resolved to conduct a share consolidation as well as amend the Articles of Incorporation regarding organizations that decide dividends from surplus. This share consolidation will enable us to set the amount of dividend per share more precisely, which will also enhance the flexibility of
dividends and our capital management, and furthermore aims to enhance constructive dialogue with shareholders and investors so that we can gather opinions with regard to dividend decisions.
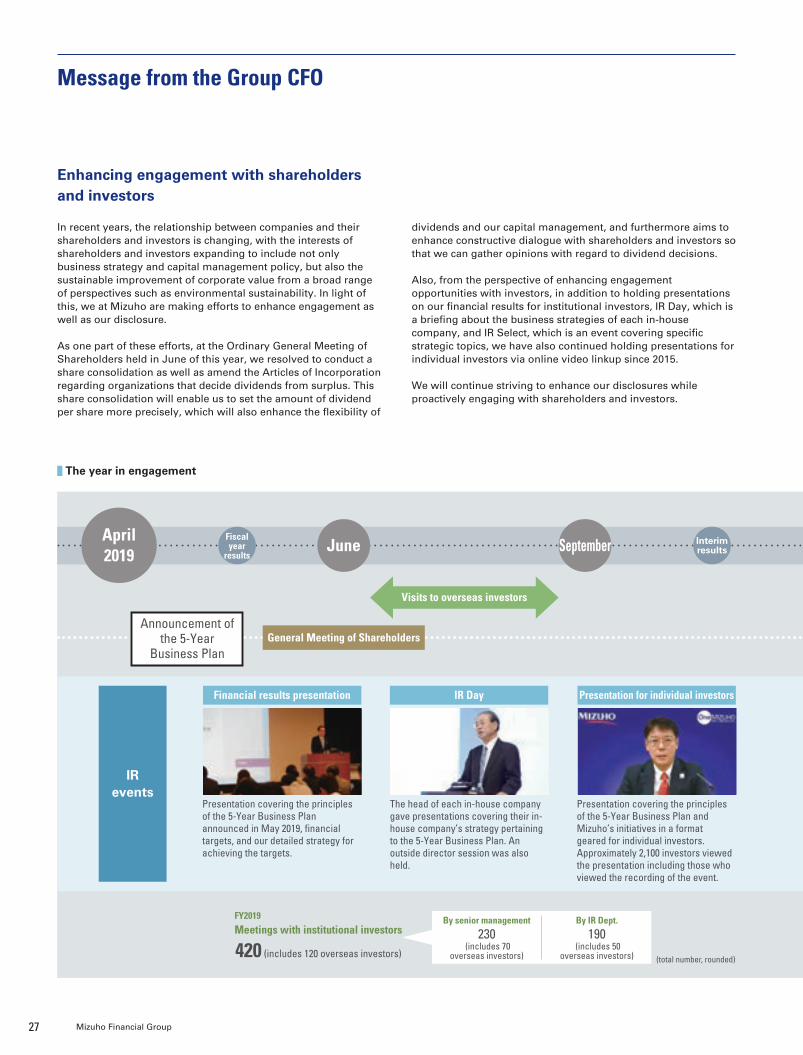
Also, from the perspective of enhancing engagement opportunities with investors, in addition to holding presentations on our financial results for institutional investors, IR Day, which is a briefing about the business strategies of each in-house company, and IR Select, which is an event covering specific strategic topics, we have also continued holding presentations for individual investors via online video linkup since 2015.
We will continue striving to enhance our disclosures while proactively engaging with shareholders and investors.
JuneFiscal year
results
Interim resultsSeptember
April 2019
230 (includes 70
overseas investors)
By senior management
190 (includes 50
overseas investors)
By IR Dept.Meetings with institutional investors
420 (includes 120 overseas investors)
FY2019
(total number, rounded)
Visits to overseas investors
IR events
General Meeting of Shareholders
The year in engagement
Presentation for individual investors
Presentation covering the principles of the 5-Year Business Plan and Mizuho’s initiatives in a format geared for individual investors. Approximately 2,100 investors viewed the presentation including those who viewed the recording of the event.
IR Day
The head of each in-house company gave presentations covering their in-house company’s strategy pertaining to the 5-Year Business Plan. An outside director session was also held.
Financial results presentation
Presentation covering the principles of the 5-Year Business Plan announced in May 2019, financial targets, and our detailed strategy for achieving the targets.
Announcement of the 5-Year
Business Plan
27 Mizuho Financial Group
Message from the Group CFO
010_7080585842009.indd 27 2020/09/15 16:31:13
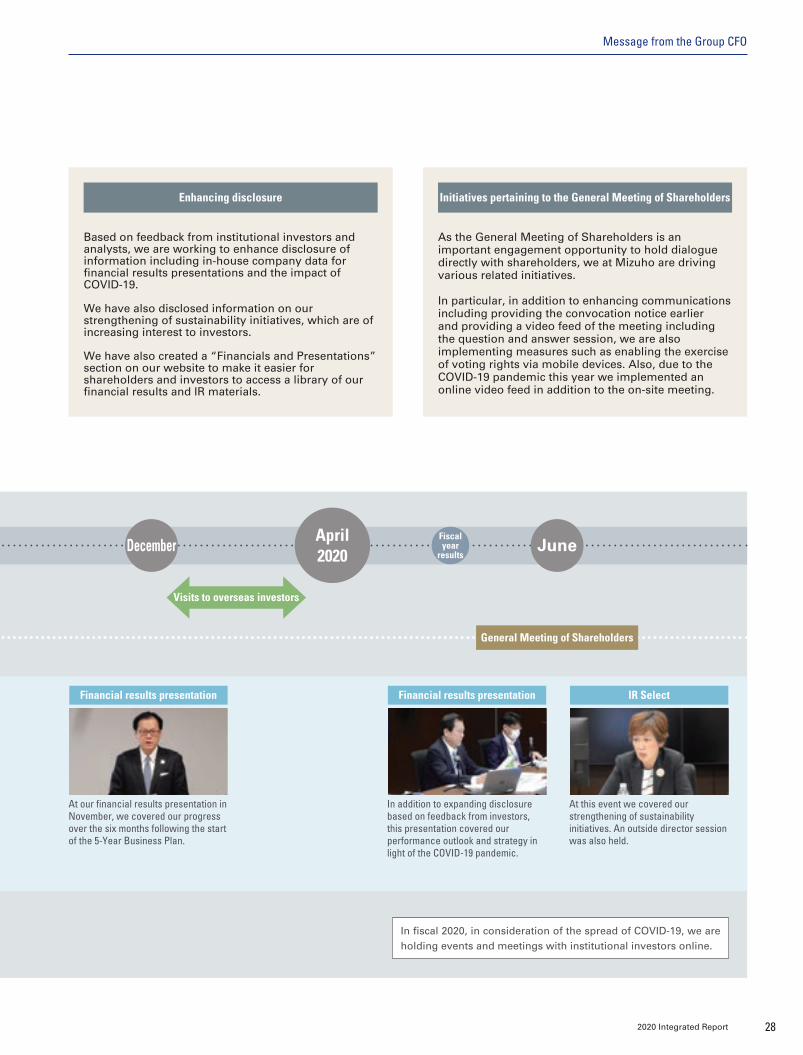
Fiscal year
resultsDecember June
April 2020
Enhancing disclosure Initiatives pertaining to the General Meeting of Shareholders
Based on feedback from institutional investors and analysts, we are working to enhance disclosure of information including in-house company data for financial results presentations and the impact of COVID-19.
We have also disclosed information on our strengthening of sustainability initiatives, which are of increasing interest to investors.
We have also created a “Financials and Presentations” section on our website to make it easier for shareholders and investors to access a library of our financial results and IR materials.
As the General Meeting of Shareholders is an important engagement opportunity to hold dialogue directly with shareholders, we at Mizuho are driving various related initiatives.
In particular, in addition to enhancing communications including providing the convocation notice earlier and providing a video feed of the meeting including the question and answer session, we are also implementing measures such as enabling the exercise of voting rights via mobile devices. Also, due to the COVID-19 pandemic this year we implemented an online video feed in addition to the on-site meeting.
Visits to overseas investors
In fiscal 2020, in consideration of the spread of COVID-19, we are holding events and meetings with institutional investors online.
Financial results presentation
At our financial results presentation in November, we covered our progress over the six months following the start of the 5-Year Business Plan.
Financial results presentation
In addition to expanding disclosure based on feedback from investors, this presentation covered our performance outlook and strategy in light of the COVID-19 pandemic.
IR Select
At this event we covered our strengthening of sustainability initiatives. An outside director session was also held.
General Meeting of Shareholders
282020 Integrated Report
Message from the Group CFO
010_7080585842009.indd 28 2020/09/15 16:31:14

090_7080585842009.indd 27-28 2020/08/13 18:09:40090_7080585842009.indd 27-28 2020/08/13 18:09:40
29 Mizuho Financial Group
011_7080585842009.indd 29 2020/09/10 11:47:59
090_7080585842009.indd 27-28 2020/08/13 18:09:40090_7080585842009.indd 27-28 2020/08/13 18:09:40
Our strategies for creating value
Progress on the 5-Year Business Plan ��P. 31Business strategies by company/unit
Retail & Business Banking Company �P. 33 Corporate & Institutional Company �P. 35 Global Corporate Company ������P. 37 Global Markets Company �������P. 39 Asset Management Company ����P. 41 Global Products Unit ����������P. 43 Research & Consulting Unit ������P. 45Digitalization ������������������P. 47Employee engagement �����������P. 49Sustainability �����������������P. 53
302020 Integrated Report
011_7080585842009.indd 30 2020/09/10 11:47:59
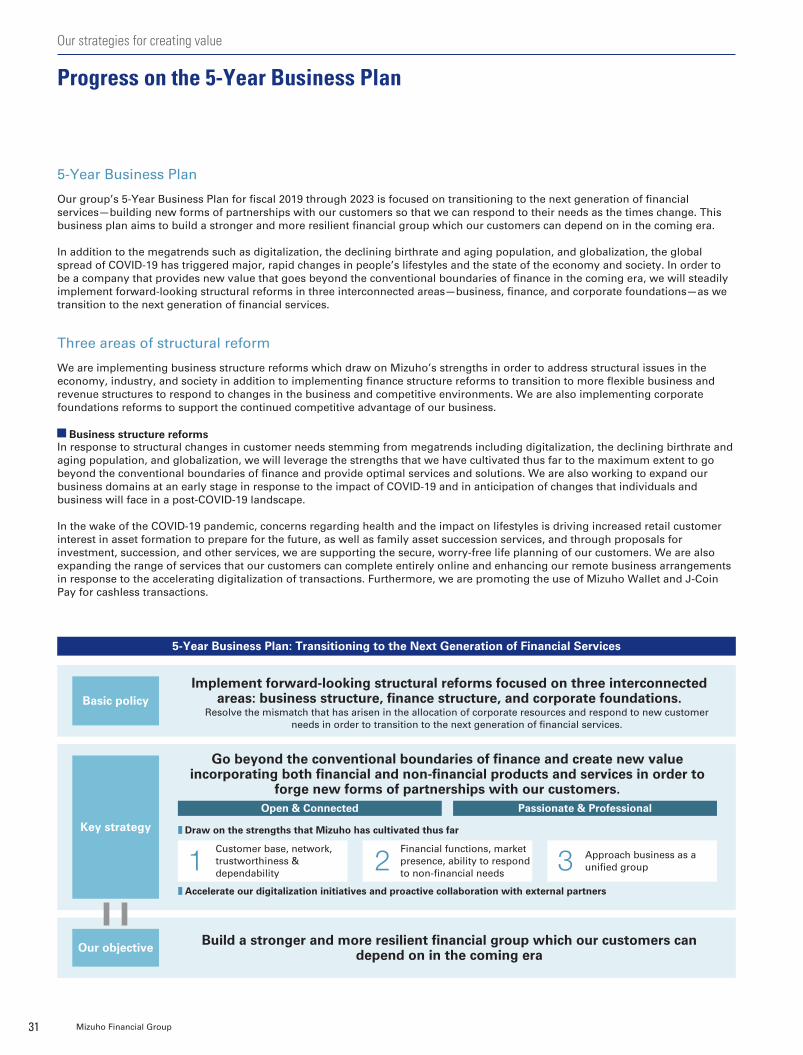
5-Year Business Plan
Our group’s 5-Year Business Plan for fiscal 2019 through 2023 is focused on transitioning to the next generation of financial services—building new forms of partnerships with our customers so that we can respond to their needs as the times change. This business plan aims to build a stronger and more resilient financial group which our customers can depend on in the coming era.
In addition to the megatrends such as digitalization, the declining birthrate and aging population, and globalization, the global spread of COVID-19 has triggered major, rapid changes in people’s lifestyles and the state of the economy and society. In order to be a company that provides new value that goes beyond the conventional boundaries of finance in the coming era, we will steadily implement forward-looking structural reforms in three interconnected areas—business, finance, and corporate foundations—as we transition to the next generation of financial services.
Three areas of structural reform
We are implementing business structure reforms which draw on Mizuho’s strengths in order to address structural issues in the economy, industry, and society in addition to implementing finance structure reforms to transition to more flexible business and revenue structures to respond to changes in the business and competitive environments. We are also implementing corporate foundations reforms to support the continued competitive advantage of our business.
Business structure reformsIn response to structural changes in customer needs stemming from megatrends including digitalization, the declining birthrate and aging population, and globalization, we will leverage the strengths that we have cultivated thus far to the maximum extent to go beyond the conventional boundaries of finance and provide optimal services and solutions. We are also working to expand our business domains at an early stage in response to the impact of COVID-19 and in anticipation of changes that individuals and business will face in a post-COVID-19 landscape.
In the wake of the COVID-19 pandemic, concerns regarding health and the impact on lifestyles is driving increased retail customer interest in asset formation to prepare for the future, as well as family asset succession services, and through proposals for investment, succession, and other services, we are supporting the secure, worry-free life planning of our customers. We are also expanding the range of services that our customers can complete entirely online and enhancing our remote business arrangements in response to the accelerating digitalization of transactions. Furthermore, we are promoting the use of Mizuho Wallet and J-Coin Pay for cashless transactions.
Resolve the mismatch that has arisen in the allocation of corporate resources and respond to new customer needs in order to transition to the next generation of financial services.
Basic policy
Key strategy
Our objective
Implement forward-looking structural reforms focused on three interconnected areas: business structure, finance structure, and corporate foundations.
Go beyond the conventional boundaries of finance and create new value incorporating both financial and non-financial products and services in order to
forge new forms of partnerships with our customers.
Build a stronger and more resilient financial group which our customers can depend on in the coming era
5-Year Business Plan: Transitioning to the Next Generation of Financial Services
Open & Connected Passionate & Professional
Draw on the strengths that Mizuho has cultivated thus far
Customer base, network, trustworthiness & dependability
1Financial functions, market presence, ability to respond to non-financial needs
2 Approach business as a unified group3
Accelerate our digitalization initiatives and proactive collaboration with external partners
31 Mizuho Financial Group
Our strategies for creating value
Progress on the 5-Year Business Plan
012_7080585842009.indd 31 2020/09/09 14:35:00

For corporate clients, in addition to supporting smooth financing, we are supporting the revision of business strategies and formulation of growth strategies looking ahead to a post-COVID-19 world, and supporting other corporate needs including business reorganization and investment in growth areas, M&A, and business succession. With a deep understanding of the current circumstances and viability of client businesses, we are accelerating strategic investment in equity and quasi-equity financing which are one part of the strategy outlined in our 5-Year Business Plan. Also, through repeated discussions with clients on the topic of strategy, we are supporting clients in both financial and non-financial aspects. Leveraging the strengths of our Global 300 strategy, which focuses on the top global companies in each sector, we are securing opportunities for multifaceted business at a steady pace. Reference For details on the specific business structure reforms, refer to the in-house company sections in this report (starting
from P33) Reference For our digitalization initiatives in response to new customer needs stemming from the COVID-19 pandemic, refer to
the section beginning on P47
Finance structure reforms Reference For the finance structure reforms refer to the Message from the Group CFO beginning on P23
Corporate foundations reformsIn July 2019, we completed the migration to our new core banking system, MINORI, which we have been addressing as one of our top management priorities. Utilizing this new IT system, we have embarked on initiatives to transform retail locations into next-generation branches, aiming to streamline operations at branches and strengthen face-to-face consulting capabilities among other matters. In addition, we have made steady progress on the transition to a new HR strategy, including introducing internal/external concurrent assignments and part-time work. Furthermore, we worked to accelerate the unification of group company operations, including expanding dual-hat appointments of directors and executive officers between the holding company and the group companies.
This year we have additionally decided to reorganize and merge subsidiary companies representing several of Mizuho’s strengths, namely research, consulting, and IT systems. By organically combining and merging the functions of these companies to create a core company outside of the realm of finance business, we are aiming to enhance our ability to provide new value beyond the conventional boundaries of finance. Also, construction of our new Marunouchi office building will be completed this year. The addition of this new office will allow us to consolidate and reorganize the Head Office and business promotion functions for Mizuho Bank, Mizuho Trust & Banking, and Mizuho Securities, enabling us to strengthen frameworks for unified group operations. Through arrangements such as free address seating we will promote flexible working styles at the new office and foster an environment that encourages employee communication and raises productivity. Reference For details on our new HR strategy, which is key for transitioning to the next generation of financial services, refer to
the Employee engagement section starting on P49
Reference Quantitative overview of our fundamental structural reforms
We are expanding our fundamental structural reforms initiatives announced in November 2017, and are promoting the early implementation of these measures under our 5-Year Business Plan. In fiscal 2019 we achieved steady progress toward our targets.
(estimates)
Wo
rkfo
rce
Japa
nese
br
anch
net
wor
kE
xpen
ses
FY2019
Reduction of approx.
19,000 people
(compared to the end of March 2017)
Reduction of approx.
130 branches
(compared to the end of March 2017)
Reduction excl. amortization expenses related to the new core banking system
Reduction of approx. ¥140 billion
(compared to FY20172)
Approx. 80,000 people
Approx. 500 branches
¥1.47 trillion1
-8,000 people
-100 branches
- ¥120 billion
-4,000 people
-38 branches
- ¥89 billion3
-3,000 people
-38 branches
- ¥58 billion3
-14,000 people
-130 branches
- ¥140 billion
-19,000 people
Target Results
-1,000 people
Progress toward target
- ¥31 billion
1. Group aggregate. New management accounting rules were applied from FY2019. Amount prior to change: ¥1.45 trillion.2. Compared to estimate for FY2017 at the announcement of the fundamental structural reforms (Nov. 2017).3. Excluding the effect of foreign exchange.
FY2021 FY2024FY2023 FY2026
322020 Integrated Report
Our strategies for creating value Progress on the 5-Year Business Plan
012_7080585842009.indd 32 2020/09/09 14:35:00

Retail & Business Banking Company Individual customers SMEs Middle market corporations
To realize the wishes, hopes, and growth of our customers, we will aim to be a partner that helps retail customers design their lives, and a strategic partner for corporate clients’ growth strategy and business succession needs.
As structural changes in customer needs accelerate, recently society as a whole has been undergoing considerable changes including changes to people’s lifestyles and the increasing adoption of remote technology. In such times, retail customers are in need of support for designing their lives in an era of increased longevity. And among SMEs and middle market clients, there is increasing demand for solutions in areas such as business continuity and support, in light of the uncertain
business environment. It is essential that we fully respond to these changing needs and advance initiatives to address the accelerating use of online communication. Amidst these changes in the business environment, we must seek to take advantage of these changes in customer needs in order to create new business opportunities while also allocating our finite corporate resources in a way that enables us to establish a stable revenue base.
Business environment and challenges
Profits—the highest since introducing the in-house company system in fiscal 2016—marking a sure step in the right direction in the first fiscal year of the structural reforms. We will continue implementing three types of structural reform in order to reduce fixed costs and expand our stable revenue base.
In fiscal 2019, while challenges such as the decline in retail investment earnings due to deteriorating market conditions still remain, our reduction of the number of branches and other efforts made it possible to reduce expenses more than originally planned. As a result we achieved ¥16.5 billion in Net Business
Trends in performance
We will aim to transition to a more stable revenue base through channel optimization and expansion into new business areas. Our basic policy is to realize the wishes and hopes of our retail customers and the continued growth of our corporate clients, working to build a sustainable retail business which is responsive to the needs of our customers in this new era. As we implement structural reforms in three interconnected areas—
business structure, finance structure, and corporate foundations—by focusing our investment of corporate resources in a way that enables us to better respond to new business and customer needs, such as alliances with other companies to expand data business, cashless transactions, and other services, we will create new value in both finance and non-finance domains.
Basic policy
Masahiro OtsukaHead of Retail & Business Banking Company
Naofumi FukeCo-Head of Retail &
Business Banking Company
(Group aggregate, management accounting, rounded figures, ¥ billion)
FY2018 FY2019 FY2020
Performance Performance Year-on-year Targets
Gross Profits 705.9 673.6 (32.4) 642.0
Net Business Profits 10.1 16.5 6.5 (3.0)
1. Gross Profits and Net Business Profits include Net Gains related to ETFs.2. Results are based on FY2019 management accounting rules, targets are estimates based on FY2020 management accounting rules.
33 Mizuho Financial Group
Our strategies for creating value
013_7080585842009.indd 33 2020/09/10 13:55:51

Key strategies
Retail & Business Banking Company Individual customers SMEs Middle market corporations
We have established a fund of over ¥1 trillion in order to fully respond to the financing needs of customers impacted by COVID-19 in this uncertain business environment. Furthermore, as demand for advanced medical technology increases amidst the pandemic, we have established the ¥10 billion Mizuho Life Science Fund to address the financing needs of companies involved in the development of state-of-the-art medical technology.
Highlights
In June 2020, Mizuho and SoftBank agreed to form a strategic alliance to develop the next generation of financial services tailored to new lifestyles. Through this alliance, SoftBank and Mizuho will strengthen collaboration in lending, mobile trading, and payment services, create the next generation of financial services combining finance business with lifestyles that are centered on mobile devices, and support the realization of new lifestyles for customers by providing new highly convenient online services.
Highlights Developing the next generation of financial services tailored to new lifestyles
Initiatives for smooth financing
Number of investment product users (million users)
2.58 2.65 2.72
1.4
0.10.9
(0.4)
1,2121,369
1,716
Asset inflows at securities companies (¥ trillion)
Business succession cases (No. of companies)
FY2017 results
FY2018 results
FY2019 results
Mizuho Securities (Retail & Business Banking Division)
Competitor A
Competitor B
Competitor C
FY2017 results
FY2018 results
FY2019 results
Prepared based on financial results disclosures of the respective companies.
FY2017
FY2018
FY2019
We will aim to be a partner that helps retail customers design their lives in an age of longevity. We provide consulting on asset formation/management and asset succession to match each individual customer’s unique goals, considering their financial objectives and future outlook according to their different stages in life. We are also aiming to be a strategic
partner for SMEs and middle market clients as they seek to maintain or expand their businesses in an uncertain business environment. By offering sophisticated solutions as a united group, we are supporting our clients’ sustainable growth and business succession needs.
Strengthen consulting Related SDGs
In light of changes in customer needs and the increasing adoption of remote technology, we will position our mobile and other related services as the primary channels and expand the convenient digital services we offer. At the same time, we will
transform branches into consulting spaces offering one-stop service for banking, trust banking, and securities, as well as remote consultations, allowing us to respond to a diverse range of customer consultation needs.
Build an optimal channel networkRelated SDGs
Utilizing open collaboration and the adoption of advanced technology through alliances with other companies, we are creating new value beyond the traditional boundaries of finance in fields such as online lending, cashless payments, and the data business in order to formulate a new business model
aligned to the ways that society and our customers are changing. By combining the non-finance mobile-based services of tech companies with our financial capabilities, we will also work to expand transactions with new customer demographics.
Expand into new business domainsRelated SDGs
342020 Integrated Report
Our strategies for creating value Retail & Business Banking Company
013_7080585842009.indd 34 2020/09/10 13:55:53

Corporate & Institutional Company Large corporations Financial institutions Public-sector entities
Seiji ImaiHead of Corporate & Institutional Company
Aiming to be the clear No. 1 business finance partner clients turn to in the corporate & institutional sector by providing financial and non-financial solutions for business challenges.
As public awareness of the SDGs and ESG topics increases, there are higher expectations that companies create non-financial value in addition to financial value.
Also, as a result of COVID-19 causing discontinuous change in the economic environment, the structural issues facing companies are manifesting earlier than anticipated and people’s perspectives and behaviors are changing, which is likely to suddenly accelerate the transformation of industrial structures.
The future competitiveness of not only Japanese companies but Japanese industry as a whole hinges on how adeptly these changes are addressed. Accordingly, we understand the importance of providing timely financial and non-financial solutions as our clients’ No. 1 partner.
Business environment and challenges
Profits targets. In fiscal 2020 there is increasing uncertainty in the business environment due to the impacts of COVID-19 and so we expect income and profits to decline. However, we will aim to achieve the targets of the 5-Year Business Plan by steadily implementing key strategies.
In fiscal 2019 our earnings decreased in comparison to the record-high earnings recorded in fiscal 2018. However, through calculated risk taking, increased lending income, and strong growth in non-interest income in areas such as trust banking and securities, we were able to achieve our initial Net Business
Trends in performance
We provide tailored solutions for diverse client needs by combining and drawing on top-class industry and products knowledge, consulting capabilities, risk-taking capabilities, and other strengths.
Additionally, as industry structures undergo major changes, we are providing not only traditional functions such as banking, trust banking, and securities but also working together with clients to create and share risk for new business opportunities
in order to act as a business finance partner co-creating value and operating businesses in partnership.
Through comprehensive support for the strategic management of Japan’s leading large corporations, financial institutions, and public sector businesses, we are aiming to contribute to the sustainable growth and development of industry, the economy, and society.
Basic policy
(Group aggregate, management accounting, rounded figures, ¥ billion)
FY2018 FY2019 FY2020
Performance Performance Year-on-year Targets
Gross Profits 473.4 462.4 (11.0) 437.0
Net Business Profits 268.2 248.9 (19.3) 222.0
1. Gross Profits and Net Business Profits include Net Gains related to ETFs.2. Results are based on FY2019 management accounting rules, targets are estimates based on FY2020 management accounting rules.
35 Mizuho Financial Group
Our strategies for creating value
013_7080585842009.indd 35 2020/09/10 13:55:54

Corporate & Institutional Company Large corporations Financial institutions Public-sector entities
Mizuho was selected as a mandated lead arranger as part of a consortium for the project finance of the largest airport concession in Japan, the Hokkaido Bundled 7 Airport Concession Project. The seven airports included in the project are essential to Hokkaido’s transportation infrastructure, and consolidating the operations of these airports is expected to spur economic activity within the prefecture. We at Mizuho will continue to draw on our knowledge of finance and public-private partnerships, working together with diverse stakeholders in order to contribute to regional revitalization in Japan.
Highlights
Mizuho Eco Finance is a financial product tied to environmental assessment, by which we provide financing to clients who meet a certain minimum score based on our scoring system. The scoring system utilizes an environmental assessment model developed by Mizuho Information & Research Institute to evaluate client initiatives and benchmarks via a globally accepted environmental verification and evaluation program (e.g. endorsement of the TCFD and commitment to SBTs).
Launched in June 2019, we have provided this product to a range of clients, including those shown to the right. At Mizuho, we are working as a united group alongside our clients to promote sustainability.
Highlights Mizuho Eco Finance
A ground-breaking multi-airport concession
M&A amount (deals related to Japanese companies) (rank)
FY2018results
FY2017results
FY2019results
FY2020targets
FY2018results
FY2017results
FY2019results
FY2020targets
Domestic straight bonds (underwriting amount) (rank)
FY2018results
FY2017results
FY2019results
FY2020targets
Total equity underwriting worldwide (underwriting amount) (rank)
4 43
4
1
2
1 1
56
3
5
In addition to responding to the current rise in clients’ need to secure cash flow, in light of the potential for prolonged impacts from the pandemic, we will proactively support clients’ capital base expansion needs that are likely to arise going forward, through mezzanine finance, equity underwriting, and other
means. Additionally, as industries undergo structural transformation and clients seek to adapt their business portfolios and restructure their supply chains, we will provide high level consulting and intermediary functions, including in real estate and M&A.
Adapting to the situation during and after COVID-19 Related SDGs
Related SDGs
We are aiming to enhance our business base in order to achieve sustainable growth and ensure that we can adapt to changes in the environment. Specifically, we are strategically developing personnel through collaborating with other in-house companies and units on medium- to long-term job rotations which enable
employees to develop knowledge in a range of sectors and products. Additionally, we are further optimizing our risk management framework and business portfolio strategy to best fit the direction we are taking going forward.
Enhance our business base
Key strategies
We newly established a Corporate Strategy Advisory Department in order to further expand the range of discussions we hold with clients at the senior management level in order to respond to their increased interest in creating value from both finance and non-finance perspectives.
Through the Corporate Strategy Advisory Department, in addition to collaboration with the Research & Consulting Unit, we are continually holding in-depth dialogue with clients’ senior management, aiming to provide support for strategy level decision-making as well as formulating specific financial and non-financial solutions.
Expand discussions with clients’ senior management Related SDGs
362020 Integrated Report
Our strategies for creating value Corporate & Institutional Company
013_7080585842009.indd 36 2020/09/10 13:55:57

Global Corporate Company Americas EMEA East Asia Asia & Oceania
We aim to be a strategic partner leveraging our global network and seamless financial solutions spanning banking, trust banking, and securities to support our clients’ global business development.
and by strengthening transaction banking. Furthermore, as a result of stringent cost control, we were able to achieve our targets for both Gross Profits and Net Business Profits. Going forward, we will steadily implement our key strategy and aim to achieve our targets for the 5-Year Business Plan.
The global economy is facing an unprecedented crisis due to deteriorating demand and a worsening real economy as a result of the COVID-19 pandemic. However, countermeasures were successfully implemented by national governments and central banks, and the stability of the financial system has been maintained. The Global Corporate Company continues to support our clients and the economy by fulfilling our financial intermediary function with calculated risk taking.
Also, the structural challenges that we previously identified, including increasing compliance costs pertaining to international regulations and non-JPY currency liquidity management, remain just as important as before. We will continue initiatives to increase the earnings power of our current business base, improve our cost structure, and optimize our business portfolio by focusing on core competencies.
Business environment and challenges
In fiscal 2019, we recorded strong Net Interest Income as a result of steadily capturing financing needs of clients around the world, including a large-scale financing deal with a Japanese company operating outside Japan. We also expanded our non-interest income through efforts in US capital markets
Trends in performance
As a strategic partner supporting our clients’ global business development, we will leverage our expansive network in high-growth Asian economic zones and our presence in the attractive US capital markets to provide comprehensive financial solutions to clients in each region.
We will build a stable and profitable business portfolio to enable sustainable growth while being aware of constraining
factors, including the external regulatory environment and the procurement of non-JPY currency, and provide clients with sophisticated financial services, making steady efforts to secure business opportunities related to changes in trade flows and industry reorganization in a post-COVID-19 era.
Basic policy
Hiroshi NagamineHead of Global Corporate Company
(Group aggregate, management accounting, rounded figures, ¥ billion)
FY2018 FY2019 FY2020
Performance Performance Year-on-year Targets
Gross Profits 400.2 417.8 17.5 384.0
Net Business Profits 169.2 178.7 9.5 128.0
1. Gross Profits and Net Business Profits include Net Gains related to ETFs.2. Results are based on FY2019 management accounting rules, targets are estimates based on FY2020 management accounting rules.
37 Mizuho Financial Group
Our strategies for creating value
013_7080585842009.indd 37 2020/09/10 13:55:59
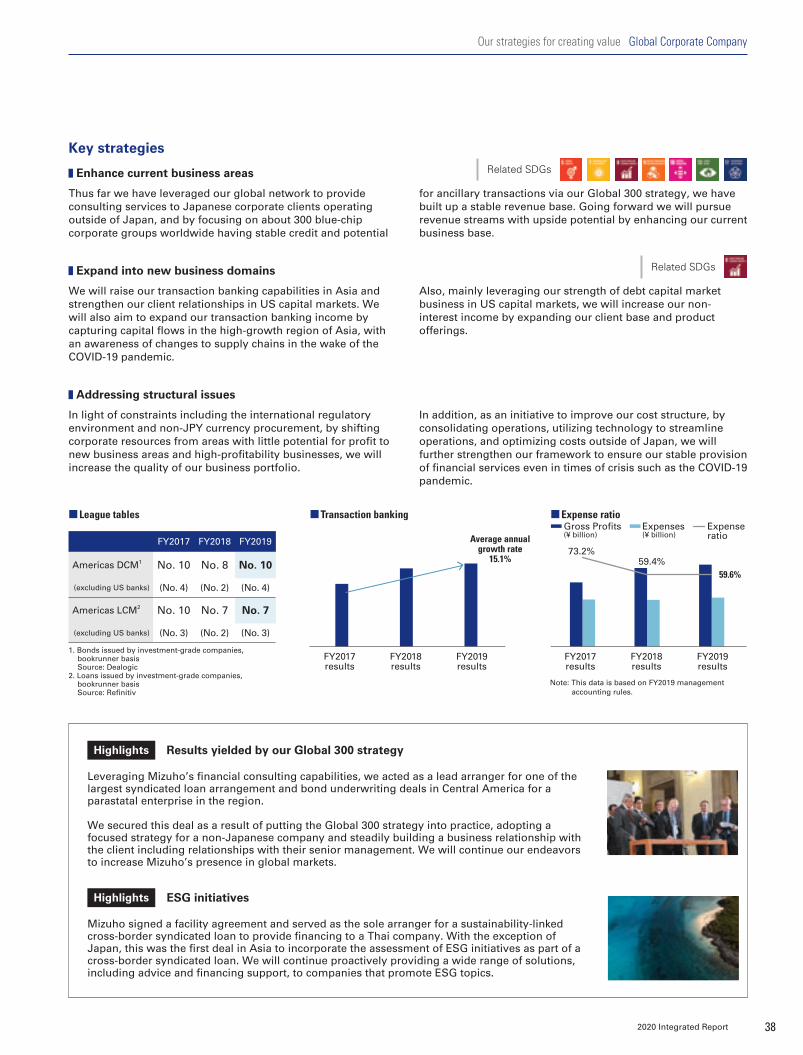
Thus far we have leveraged our global network to provide consulting services to Japanese corporate clients operating outside of Japan, and by focusing on about 300 blue-chip corporate groups worldwide having stable credit and potential
for ancillary transactions via our Global 300 strategy, we have built up a stable revenue base. Going forward we will pursue revenue streams with upside potential by enhancing our current business base.
In light of constraints including the international regulatory environment and non-JPY currency procurement, by shifting corporate resources from areas with little potential for profit to new business areas and high-profitability businesses, we will increase the quality of our business portfolio.
Key strategies
In addition, as an initiative to improve our cost structure, by consolidating operations, utilizing technology to streamline operations, and optimizing costs outside of Japan, we will further strengthen our framework to ensure our stable provision of financial services even in times of crisis such as the COVID-19 pandemic.
Enhance current business areas
We will raise our transaction banking capabilities in Asia and strengthen our client relationships in US capital markets. We will also aim to expand our transaction banking income by capturing capital flows in the high-growth region of Asia, with an awareness of changes to supply chains in the wake of the COVID-19 pandemic.
Also, mainly leveraging our strength of debt capital market business in US capital markets, we will increase our non-interest income by expanding our client base and product offerings.
Expand into new business domains
Addressing structural issues
Global Corporate Company Americas EMEA East Asia Asia & Oceania
Leveraging Mizuho’s financial consulting capabilities, we acted as a lead arranger for one of the largest syndicated loan arrangement and bond underwriting deals in Central America for a parastatal enterprise in the region.
We secured this deal as a result of putting the Global 300 strategy into practice, adopting a focused strategy for a non-Japanese company and steadily building a business relationship with the client including relationships with their senior management. We will continue our endeavors to increase Mizuho’s presence in global markets.
Highlights
Mizuho signed a facility agreement and served as the sole arranger for a sustainability-linked cross-border syndicated loan to provide financing to a Thai company. With the exception of Japan, this was the first deal in Asia to incorporate the assessment of ESG initiatives as part of a cross-border syndicated loan. We will continue proactively providing a wide range of solutions, including advice and financing support, to companies that promote ESG topics.
Highlights ESG initiatives
Results yielded by our Global 300 strategy
Related SDGs
Related SDGs
Gross Profits (¥ billion)
Expenses (¥ billion)
Expense ratio
League tables
73.2%59.4%
59.6%
Transaction banking Expense ratio
FY2017results
FY2018results
FY2019results
FY2017results
FY2018results
FY2019results
Average annual growth rate
15.1%
Note: This data is based on FY2019 management accounting rules.
FY2017 FY2018 FY2019
Americas DCM1 No. 10 No. 8 No. 10
(excluding US banks) (No. 4) (No. 2) (No. 4)
Americas LCM2 No. 10 No. 7 No. 7
(excluding US banks) (No. 3) (No. 2) (No. 3)
1. Bonds issued by investment-grade companies, bookrunner basis
Source: Dealogic2. Loans issued by investment-grade companies,
bookrunner basis Source: Refinitiv
382020 Integrated Report
Our strategies for creating value Global Corporate Company
013_7080585842009.indd 38 2020/09/10 13:56:01

(Group aggregate, management accounting basis, rounded figures, ¥ billion)
FY2018 FY2019 FY2020
Performance Performance Year-on-year Targets
Gross Profits 192.4 410.1 217.8 432.0
Net Business Profits (17.4) 198.9 216.3 218.0
1. Gross Profits and Net Business Profits include Net Gains Related to ETFs.2. Results are based on FY2019 management accounting rules, targets are estimates based on FY2020 management accounting rules.
Global Markets Company Investors
As a partner with expert knowledge of market mechanisms and the ability to draw on a range of intermediary functions, we will further integrate our banking, trust banking, and securities capabilities to offer the best products and services for our clients’ varied needs.
According to projections from the International Monetary Fund, the immense impact of the global outbreak of COVID-19 will cause global economic growth in 2020 to be -4.9%, representing a significant contraction. Global financial markets are seeing a rise in risk aversion, while around the world governments and central banks are implementing economic stimulus and liquidity measures in an attempt to stabilize markets and rein in economic uncertainty. These factors have created an extremely challenging investment environment. In addition, the structure of the market appears to be undergoing considerable changes
due to the tightening of global financial regulatory standards, the emergence in financial markets of algorithmic trading and passive funds, and other trends.
In this environment, we will strive to consistently respond to our clients’ increasingly varied risk hedging needs and investment needs. At the same time, in our banking operations, we will enhance the sophistication of our ALM and portfolio management through flexible asset allocation.
Business environment and challenges
We made solid progress on our various projects and accurately accounted for market fluctuations in our ALM and portfolio management. As a result, our fiscal 2019 Net Business Profits came to ¥198.9 billion, exceeding our target for the first fiscal year of the 5-Year Business Plan. Going forward, in our S&T operations, we will complete our strategy for integration of our banking and securities operations and, in doing so, realize
strategic effects and pursue efficiency. In our banking operations, we will improve our fundamental earnings power, maintain our early warning indicator management, and apply high-level market analysis to manage our portfolio flexibly in line with changes in the market environment. Through these efforts, we expect to achieve Net Business Profits of ¥218 billion in fiscal 2020.
Trends in performance
The Global Markets Company engages in sales and trading (S&T) in order to provide clients with market product-based solutions, and we also conduct banking operations, including asset and liability management, securities investment, and other related activities.
We have set out a basic strategy to develop a framework for offering optimal products and services, as well as to strengthen
our market presence, as part of maintaining our status as one of Asia’s major players in global markets.
In our S&T operations, by optimizing our global network and products framework, we will draw on a broad range of intermediary functions. In our banking operations, we will enhance the sophistication of our flexible ALM and portfolio management while maintaining a focus on achieving a balance between realized gains and unrealized gains/losses.
Basic policy
Masatoshi YoshiharaCo-Head of Global Markets Company
Yasuhiro ShibataCo-Head of Global Markets Company
39 Mizuho Financial Group
Our strategies for creating value
013_7080585842009.indd 39 2020/09/10 13:56:04

We will improve our price competitiveness and ability to provide solutions by completing the integration of banking and securities bases in each region and strengthening global collaboration between banking and securities services. We will also leverage the broad client base that we have developed
through our commercial banking business to further focus on and expand our securities business. In doing so, we will facilitate the realization of a positive cycle of funding between financial market participants and further raise our global market presence.
In order to continue providing high quality services to our clients in the future, we are allocating our corporate resources strategically towards building next-generation trading rooms, market IT systems, and market back offices in line with technological advancements. In this way, we are upgrading our
Key strategies
infrastructure, reducing our costs, and maintaining and heightening our competitiveness. Moreover, we are improving our employees’ digital literacy and supporting the growth and development of professionals with a high level of expertise in line with our new HR system reforms.
Advance global management
We will strengthen our risk-taking capabilities both by enhancing our early warning indicator management to anticipate changes in market conditions in advance and by enhancing the sophistication of our asset allocation. While paying attention to changes in the global economic and investment environment, we will engage in portfolio management with a focus on achieving a balance between
realized gains and unrealized gains/losses and make investment decisions with consideration for ESG areas and the SDGs. With respect to ALM, we will positively contribute to Mizuho’s overall business strategy through robust balance sheet management supported by more global and efficient cash flow operations and diversified funding sources.
Enhance the sophistication of our ALM and portfolio management
Build markets infrastructure and develop digital innovation professionals
Related SDGs
Related SDGs
Related SDGs
Sales & trading-related revenue (With FY2018 results as 100)
100 102 103
FY2018results
FY2019results
FY2020targets
Internal management accounting basis Internal management accounting basis Internal management accounting basis
Volume of Asian/emerging market currency transactions (With FY2018 results as 100)
100
82 85
FY2018results
FY2019results
FY2020targets
Volume of interest rate derivatives (With FY2018 results as 100)
100
144164
FY2018results
FY2019results
FY2020targets
In the data analysis practicum program of the Data Scientist School in the Graduate School of Information Science and Technology at the University of Tokyo, the graduate school, Mizuho Bank, and Mizuho Information & Research Institute developed an algorithm employing deep learning to uncover similarities in the chart shapes of recent and past time periods. The algorithm analyzes charts in almost the same way human beings do and enables quicker analysis than human beings can perform. Mizuho Bank has already begun using the algorithm in our market operations.
With electronic trading accounting for an increasing share of Japanese Government Bond trading volume, Mizuho Securities developed a system to automate quotes (autoquotes) for electronic trading inquiries and began using it for trades that fulfill certain conditions. By allowing for rapid quote provision, autoquotes are improving convenience and operational excellence. Going forward, we will continue to develop and enhance such functions and aim to further secure our competitive advantage.
Highlights
Highlights
Development of autoquote system for Japanese Government Bonds
Joint development of IT system applying cutting-edge technology to chart analysis
402020 Integrated Report
Our strategies for creating value Global Markets Company
013_7080585842009.indd 40 2020/09/10 13:56:06
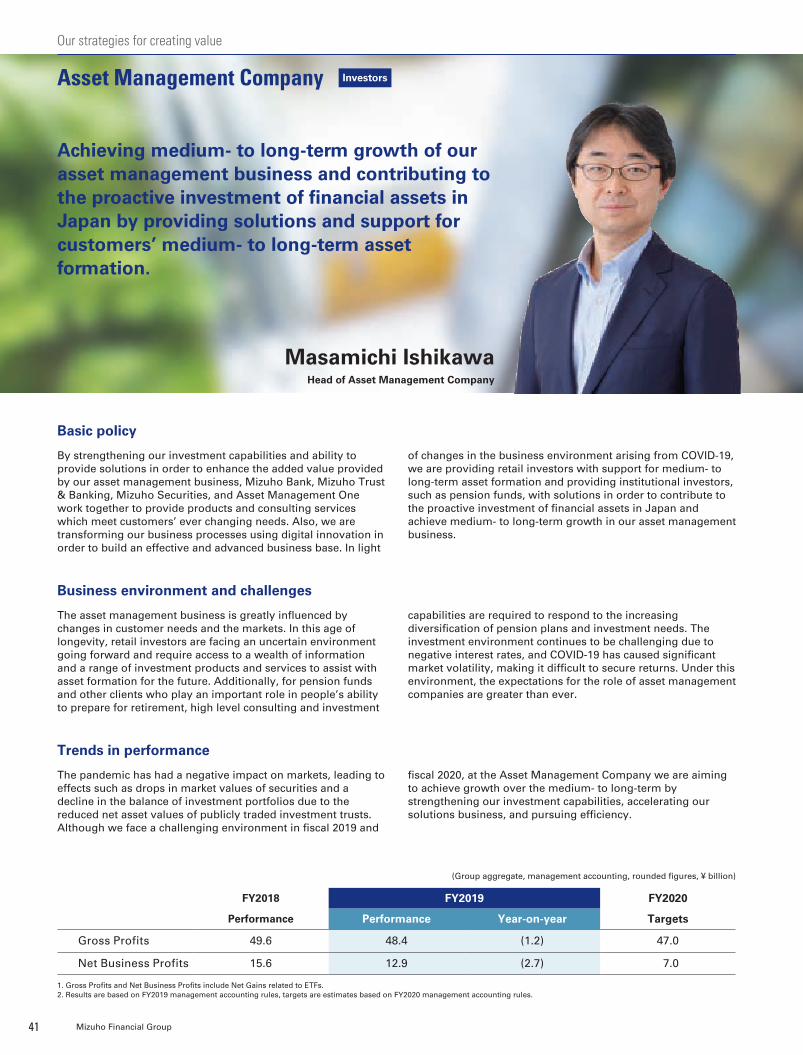
Asset Management Company Investors
Achieving medium- to long-term growth of our asset management business and contributing to the proactive investment of financial assets in Japan by providing solutions and support for customers’ medium- to long-term asset formation.
The asset management business is greatly influenced by changes in customer needs and the markets. In this age of longevity, retail investors are facing an uncertain environment going forward and require access to a wealth of information and a range of investment products and services to assist with asset formation for the future. Additionally, for pension funds and other clients who play an important role in people’s ability to prepare for retirement, high level consulting and investment
capabilities are required to respond to the increasing diversification of pension plans and investment needs. The investment environment continues to be challenging due to negative interest rates, and COVID-19 has caused significant market volatility, making it difficult to secure returns. Under this environment, the expectations for the role of asset management companies are greater than ever.
Business environment and challenges
The pandemic has had a negative impact on markets, leading to effects such as drops in market values of securities and a decline in the balance of investment portfolios due to the reduced net asset values of publicly traded investment trusts. Although we face a challenging environment in fiscal 2019 and
fiscal 2020, at the Asset Management Company we are aiming to achieve growth over the medium- to long-term by strengthening our investment capabilities, accelerating our solutions business, and pursuing efficiency.
Trends in performance
By strengthening our investment capabilities and ability to provide solutions in order to enhance the added value provided by our asset management business, Mizuho Bank, Mizuho Trust & Banking, Mizuho Securities, and Asset Management One work together to provide products and consulting services which meet customers’ ever changing needs. Also, we are transforming our business processes using digital innovation in order to build an effective and advanced business base. In light
of changes in the business environment arising from COVID-19, we are providing retail investors with support for medium- to long-term asset formation and providing institutional investors, such as pension funds, with solutions in order to contribute to the proactive investment of financial assets in Japan and achieve medium- to long-term growth in our asset management business.
Basic policy
Masamichi IshikawaHead of Asset Management Company
(Group aggregate, management accounting, rounded figures, ¥ billion)
FY2018 FY2019 FY2020
Performance Performance Year-on-year Targets
Gross Profits 49.6 48.4 (1.2) 47.0
Net Business Profits 15.6 12.9 (2.7) 7.0
1. Gross Profits and Net Business Profits include Net Gains related to ETFs.2. Results are based on FY2019 management accounting rules, targets are estimates based on FY2020 management accounting rules.
41 Mizuho Financial Group
Our strategies for creating value
013_7080585842009.indd 41 2020/09/10 13:56:08

We are strategically allocating specialist personnel and fundamentally transforming our cost structure to maximize the benefits of Asset Management One’s scale, as corporate resources related to the group’s asset management functions have been consolidated into this company. In addition, in order to enhance productivity and the added value we provide, we are
pursuing automation and greater efficiency in our operations as well as implementing remote work and otherwise transforming our work styles to foster a work environment where each employee can reach their maximum potential. These efforts are aimed at strengthening our foundations for business growth over the medium to long term.
Shifting to a more efficient business structure Related SDGs
Publicly traded investment trust assets under management balance (¥ trillion)
6.95.9
6.6 7.8 7.78.4
120
173
221
DB/DC pension assets under management balance (¥ trillion)
Number of individuals enrolled in individual-type defined contribution pension plans (iDeCo) (thousand)
FY2018results
FY2019results
FY2020targets
FY2018results
FY2019results
FY2020targets
FY2018results
FY2019results
FY2020targets
ETF balance excluding publicly traded investment trusts. Total balance of assets in defined benefit (DB) and defined contribution (DC) pensions (corporate and individual-type DC pensions).
To respond to the diverse needs of retail investors we are developing and offering a broad range of products, from those that are low-risk and focused on stability to those focused on returns which draw on our advanced investment capabilities. We are also optimizing investment in fund wraps and providing products tailored to defined contribution corporate pensions, individual-type defined contribution pension plans (iDeCo), and
installment-type NISA. Additionally, we are promoting the proactive investment of financial assets in Japan by disseminating educational materials on investing and information on products and markets as well as working together with distributors to provide after-sale services for retail investors.
Key strategies
Focusing on asset management services to respond to diverse customer needs Related SDGs
Related SDGs
Institutional investors are seeking to increase returns in a low interest rate environment and to respond to these needs as well as those concerning low liquidity assets, we are focusing our corporate resources on enhancing investment by utilizing our global platform, alternative investments, and ESG investments.
For corporate pension fund clients, Mizuho Trust & Banking is offering comprehensive solutions through our pension operations entrustment service which is tailored to meet clients’ needs in the areas of investment, pension plans, and operations.
Selection of and focus on solution services with high customer demand
At Asset Management One, we are expanding our line-up of products that utilize our Global Risk-factor Parity Strategy, which we have honed through our experience in pensions and which aims for stable returns by investing strategically across different asset classes and world regions. We are also focusing on the composition of our global equity products which prioritize returns in areas of growth in the world economy. Going forward, we will develop products which are aligned to the needs of retail investors and products aimed at long-term asset formation.
At Mizuho we are committed to responsible investment. Mizuho Trust & Banking has established a Policy on Responsible Investment and Asset Management One has established an Approach to ESG Investment. We are aiming to encourage the companies we invest in to enhance their corporate value sustainably through engagement, develop and offer products that appropriately incorporate ESG and other such factors, and achieve a positive cycle of sustainable development for society as a whole.
Customers
a. ESG investment (engagement & ESG integration)b. Medium- to long-term enhancement of corporate
value & solving social issuesc. Expanding customers’ medium- to long-term
investment returnsd. Realizing a virtuous cycle of sustainable
development for society
dc
b
a
Companies / Society
Highlights
Highlights
ESG investment initiatives
Expanding our fund line-up aimed at long-term asset formation for retail investors
422020 Integrated Report
Our strategies for creating value Asset Management Company
013_7080585842009.indd 42 2020/09/10 13:56:10

Global Products Unit Investment banking Transaction banking
We aim to utilize our sophisticated expertise as a team of specialists as we address the diverse needs of clients and provide group-wide, global support offering optimal solutions that are aligned with current trends.
Seiji ImaiHead of Global Products Unit
43 Mizuho Financial Group
Our strategies for creating value
At the Global Products Unit, our activities are primarily divided into two areas, investment banking and transaction banking, and we provide solutions for clients in a wide range of business areas.
We will continue fulfilling our corporate social responsibilities as a financial institution while supporting the strategies of in-house companies and the Mizuho group as a whole by providing optimized financial products as solutions for issues faced by our clients and society.
Also, to address the needs of clients and investors, we will draw on the sophisticated expertise of the group and increase Mizuho’s stable earnings power.
In addition, by allocating corporate resources without being constrained by established conventions, and through digitalization, we are aiming to improve efficiency and develop new solutions, which will enable us to increase productivity and expand medium- to long-term business opportunities.
The business environment that our clients are faced with is shifting at a rapid pace as uncertainty in the global economy rises, exacerbated by the impact of COVID-19. Confronted with this business environment, at the Global Products Unit we are focusing our attention on leveraging our sophisticated expertise as we continue offering optimal solutions that are aligned with diversifying client needs.
Specifically, by utilizing our financial product expertise to take measured risks when providing financing, providing trade finance based on changes in client supply chains, and using financing to promote sustainable business, we will support the financial product aspects of Mizuho’s strategy, and fulfill our corporate social responsibilities.
Business environment and challenges
Basic policy
We provide solutions as a united group to offer the best support for value chains that contribute to increased corporate value for clients.
We will enhance and expand our financial product line-up in order to draw on the strengths of the entire group and provide
optimal solutions for business succession, business restructuring, balance sheet review, and other client management and growth strategy topics stemming from shifts in the business environment and changing social habits.
Key strategies
Providing effective solutions across banking, trust banking, securities, and other group companies Related SDGs
013_7080585842009.indd 43 2020/09/10 13:56:12

In order to address client needs, which are diversifying and becoming more complex, and to support clients in resolving issues, Mizuho must create and provide solutions beyond those offered in our existing financial product line-up.
By utilizing our financial product expertise and digital technologies, as well as aiming to provide new solutions through collaboration with other companies, the Global Products Unit is endeavoring to expand business in new fields to capitalize on recent trends.
As our clients accelerate their global operations, we are addressing these needs by enhancing Mizuho’s services on a global basis.
We are boosting collaboration between products departments and regional offices to support our clients, especially for cash
management, settlements, and other transaction banking services, as well as services in the field of project finance.
We are also working to hone our expertise as an organization by strategically cultivating the pool of professional talent in each product field.
Enhancing our global operating framework and honing financial product expertise
Expansion into new business areas Related SDGs
Total publicly offered bonds (Japan)
4,163.23,718.8
2,749.13,195.2
2,285.1
Underwriting amount(¥ billion)
Share (%)
FY2015 FY2016 FY2017 FY2019FY2018
17.1 20.8 18.9 21.4 20.3
Source: Mizuho Securities FY2019 financial results available on the Mizuho Securities website
In fiscal 2019, a record setting year for the total issuance amount of publicly offered bonds in Japan, Mizuho Securities was No. 1 in market share for corporate bonds for the second consecutive year. Mizuho Securities also made proactive efforts on subordinated bonds and other products that are seeing increasing market demand.
In addition, Mizuho Securities also captured the top market share for Japan SDG bonds, an area in which we are actively involved as a part of our contributions to support the sustainable development of society as a financial institution.
In fiscal 2019, Mizuho Bank won the award for best trade finance bank in East Asia & the Pacific among Global Trade Review ’s choice of Leaders in Trade.
Our sophisticated product development and dedicated service, as well as customized product offerings addressing the needs of major players throughout the region, were critical factors in receiving this prestigious regional award for the fourth consecutive year.
We will strive to enhance our support for the management and financial strategies of clients who are expanding globally.
Highlights
Highlights Best trade finance bank in East Asia & the Pacific for 4th year running
Securing the top market share for publicly offered bonds in Japan for the 2nd consecutive year
4. Leaders in Trade Awards selected by Global Trade Review.5. Holding and managing securities for securities investments.
Custody bank survey rankings (in the Japanese market) in Global Custodian magazine.
Principal accomplishments in investment banking
1. Amount basis, bookrunner basis2. Underwriting amount basis (excluding our own bonds)3. Amount basis, asset-backed securities
FY2019 results
Syndicated loans1 No. 1
Japan publicly offered bonds2 No. 1
ABS lead underwriter3 No. 1
FY2019 results
Trade finance4 “Best trade finance bank in East Asia & the Pacific”
Custody Custody survey No. 1 (9 years in a row)5
Sub-custody survey No. 1 (14 years in a row)5
Principal accomplishments in transaction banking
Related SDGs
442020 Integrated Report
Our strategies for creating value Global Products Unit
013_7080585842009.indd 44 2020/09/10 13:56:13

Research & Consulting Unit
To respond to structural changes in client needs and fulfill our role as the starting point of Mizuho’s value creation, we are working to implement structural reforms in three areas—business structure, finance structure, and corporate foundations.
For our business structure reforms, in order to create value based on client needs, we are working to further enhance our research and consulting capabilities as well as transforming our client channels through the use of digital technology.
For the finance structure reforms, we are implementing revenue structure and expense structure reforms from a thorough stock perspective (in terms of “stock and flow”) through efforts such as optimizing business operations and resources.
In terms of corporate foundations reforms, we are working to enhance productivity and achieve the various synergy effects of group company restructuring and integrated group operations. Additionally, we are establishing an HR strategy aimed at developing personnel with a high level of expertise.
In addition to the advancement of megatrends such as digitalization, the declining birthrate and aging population, and globalization, the global outbreak of COVID-19 has made the challenges facing our clients and society even more multi-faceted and complex.
By adopting rapidly evolving digital technology and responding to the increased interest from society regarding ESG and SDG
topics, we are working to identify clients’ needs early, including needs related to business transformation focused on adapting to the situation during and after COVID-19. And we are working together as a unit to provide information backed by our high level of expertise and support businesses. In this way, we are strengthening our capabilities as a trusted partner sharing knowledge with our clients and society.
Business environment and challenges
Basic policy
By conducting thorough research with a clear sense of purpose and with the aim of enhancing Mizuho’s corporate strategy and expanding in-house companies’ business, we contribute to strengthening Mizuho’s earnings power as well as our brand and reputation.
We will strengthen our origination capabilities linking research to business with a focus on in-house company priority areas such as cross-sector and new business. We can accomplish this by strengthening our research capabilities via further collaboration within the unit.
Key strategies
Enhance research and origination capabilities Related SDGs
Yasuhiko UshikuboHead of Research & Consulting Unit
As the starting point of Mizuho’s value creation, we leverage our high level of expertise, including industry insight, to contribute to the creation of new value for our clients and society.
45 Mizuho Financial Group
Our strategies for creating value
013_7080585842009.indd 45 2020/09/10 13:56:15
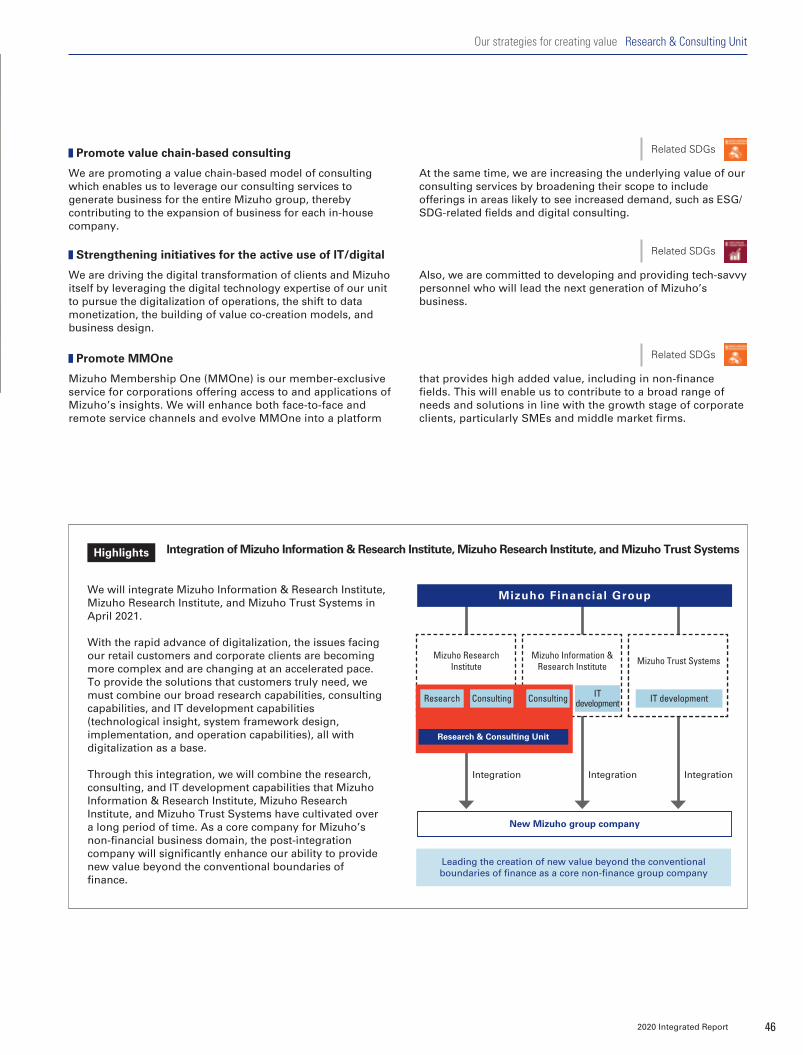
We are driving the digital transformation of clients and Mizuho itself by leveraging the digital technology expertise of our unit to pursue the digitalization of operations, the shift to data monetization, the building of value co-creation models, and business design.
Also, we are committed to developing and providing tech-savvy personnel who will lead the next generation of Mizuho’s business.
We are promoting a value chain-based model of consulting which enables us to leverage our consulting services to generate business for the entire Mizuho group, thereby contributing to the expansion of business for each in-house company.
At the same time, we are increasing the underlying value of our consulting services by broadening their scope to include offerings in areas likely to see increased demand, such as ESG/SDG-related fields and digital consulting.
Promote value chain-based consulting
Strengthening initiatives for the active use of IT/digital
Integration of Mizuho Information & Research Institute, Mizuho Research Institute, and Mizuho Trust SystemsHighlights
We will integrate Mizuho Information & Research Institute, Mizuho Research Institute, and Mizuho Trust Systems in April 2021.
With the rapid advance of digitalization, the issues facing our retail customers and corporate clients are becoming more complex and are changing at an accelerated pace. To provide the solutions that customers truly need, we must combine our broad research capabilities, consulting capabilities, and IT development capabilities (technological insight, system framework design, implementation, and operation capabilities), all with digitalization as a base.
Through this integration, we will combine the research, consulting, and IT development capabilities that Mizuho Information & Research Institute, Mizuho Research Institute, and Mizuho Trust Systems have cultivated over a long period of time. As a core company for Mizuho’s non-financial business domain, the post-integration company will significantly enhance our ability to provide new value beyond the conventional boundaries of finance.
New Mizuho group company
Leading the creation of new value beyond the conventional boundaries of finance as a core non-finance group company
Integration Integration Integration
IT development
Mizuho Trust Systems
Mizuho Financial Group
Research & Consulting Unit
Research Consulting
Mizuho Research Institute
Consulting IT development
Mizuho Information & Research Institute
Related SDGs
Related SDGs
Mizuho Membership One (MMOne) is our member-exclusive service for corporations offering access to and applications of Mizuho’s insights. We will enhance both face-to-face and remote service channels and evolve MMOne into a platform
that provides high added value, including in non-finance fields. This will enable us to contribute to a broad range of needs and solutions in line with the growth stage of corporate clients, particularly SMEs and middle market firms.
Promote MMOne Related SDGs
462020 Integrated Report
Our strategies for creating value Research & Consulting Unit
013_7080585842009.indd 46 2020/09/10 13:56:16
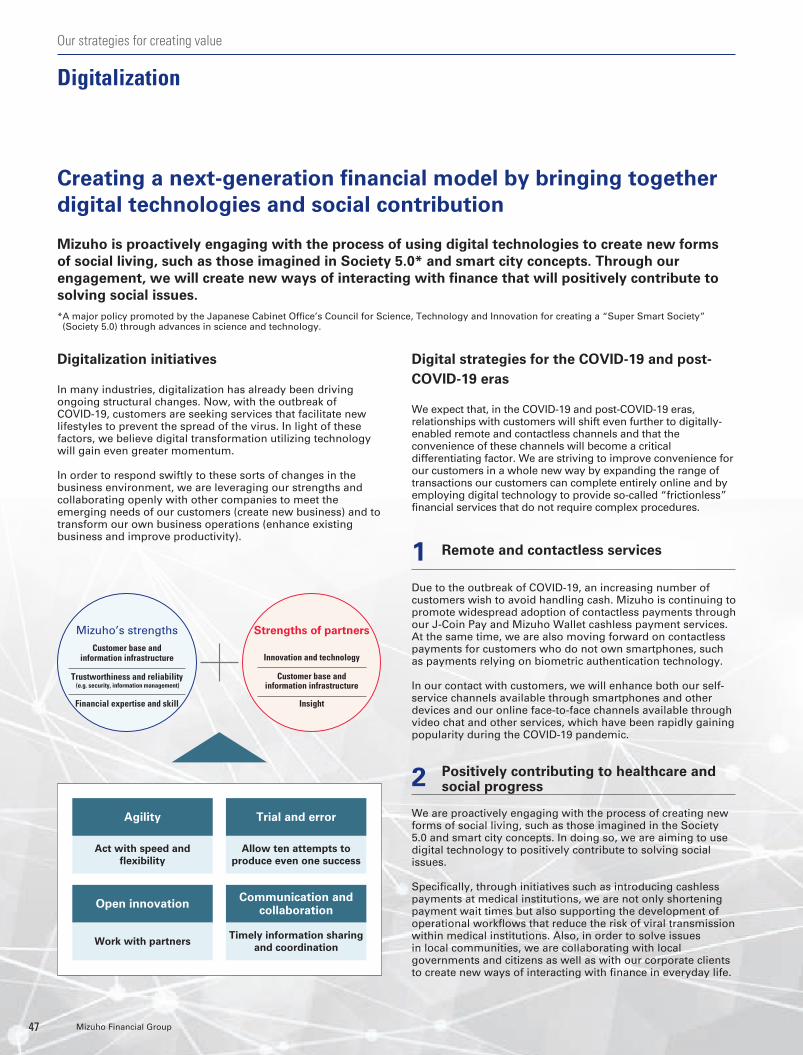
090_7080585842009.indd 29-30 2020/08/13 18:10:01090_7080585842009.indd 29-30 2020/08/13 18:10:01
Digitalization
Creating a next-generation financial model by bringing together digital technologies and social contribution
Mizuho is proactively engaging with the process of using digital technologies to create new forms of social living, such as those imagined in Society 5.0* and smart city concepts. Through our engagement, we will create new ways of interacting with finance that will positively contribute to solving social issues.
Digitalization initiatives
In many industries, digitalization has already been driving ongoing structural changes. Now, with the outbreak of COVID-19, customers are seeking services that facilitate new lifestyles to prevent the spread of the virus. In light of these factors, we believe digital transformation utilizing technology will gain even greater momentum.
In order to respond swiftly to these sorts of changes in the business environment, we are leveraging our strengths and collaborating openly with other companies to meet the emerging needs of our customers (create new business) and to transform our own business operations (enhance existing business and improve productivity).
Digital strategies for the COVID-19 and post-COVID-19 eras
We expect that, in the COVID-19 and post-COVID-19 eras, relationships with customers will shift even further to digitally-enabled remote and contactless channels and that the convenience of these channels will become a critical differentiating factor. We are striving to improve convenience for our customers in a whole new way by expanding the range of transactions our customers can complete entirely online and by employing digital technology to provide so-called “frictionless” financial services that do not require complex procedures.
Remote and contactless services
Due to the outbreak of COVID-19, an increasing number of customers wish to avoid handling cash. Mizuho is continuing to promote widespread adoption of contactless payments through our J-Coin Pay and Mizuho Wallet cashless payment services. At the same time, we are also moving forward on contactless payments for customers who do not own smartphones, such as payments relying on biometric authentication technology.
In our contact with customers, we will enhance both our self-service channels available through smartphones and other devices and our online face-to-face channels available through video chat and other services, which have been rapidly gaining popularity during the COVID-19 pandemic.
1
Positively contributing to healthcare and social progress
We are proactively engaging with the process of creating new forms of social living, such as those imagined in the Society 5.0 and smart city concepts. In doing so, we are aiming to use digital technology to positively contribute to solving social issues.
Specifically, through initiatives such as introducing cashless payments at medical institutions, we are not only shortening payment wait times but also supporting the development of operational workflows that reduce the risk of viral transmission within medical institutions. Also, in order to solve issues in local communities, we are collaborating with local governments and citizens as well as with our corporate clients to create new ways of interacting with finance in everyday life.
2Agility
Open innovation
Trial and error
Communication and collaboration
Act with speed and flexibility
Work with partners
Allow ten attempts to produce even one success
Timely information sharing and coordination
* A major policy promoted by the Japanese Cabinet Office’s Council for Science, Technology and Innovation for creating a “Super Smart Society” (Society 5.0) through advances in science and technology.
Customer base and information infrastructure
Trustworthiness and reliability (e.g. security, information management)
Financial expertise and skill
Mizuho’s strengths
Innovation and technology
Customer base and information infrastructure
Insight
Strengths of partners
47 Mizuho Financial Group
Our strategies for creating value
014_7080585842009.indd 47 2020/09/10 11:49:06
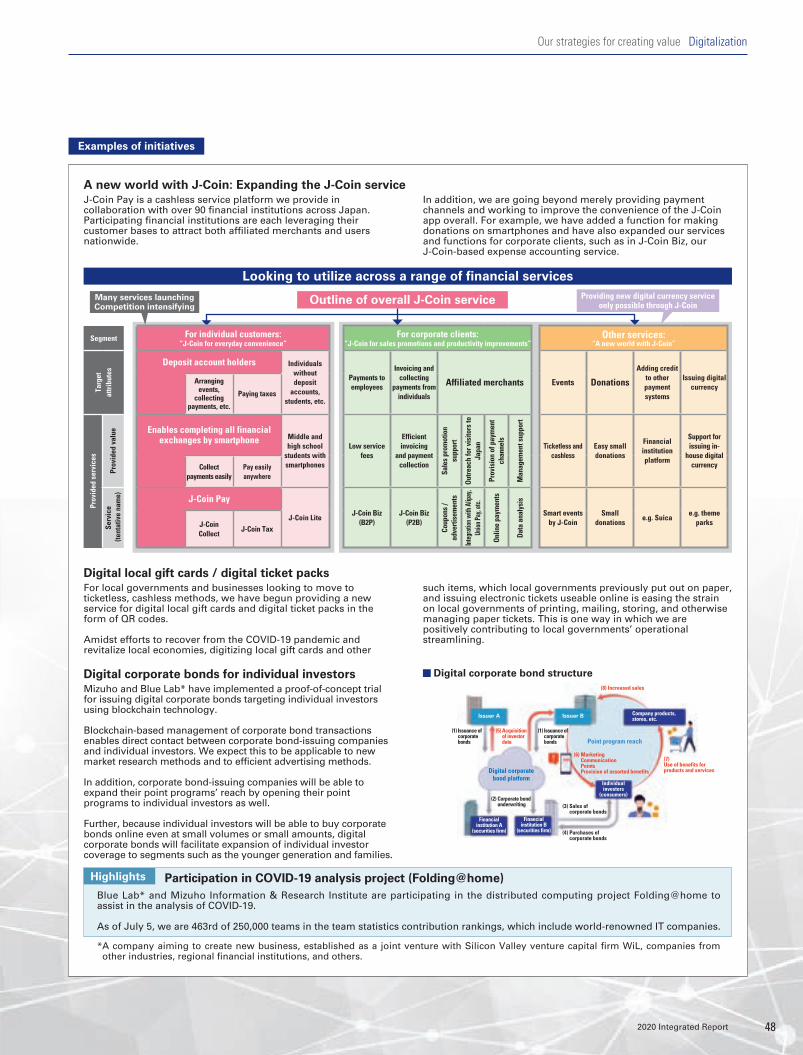
090_7080585842009.indd 29-30 2020/08/13 18:10:01090_7080585842009.indd 29-30 2020/08/13 18:10:01
Examples of initiatives
J-Coin Pay is a cashless service platform we provide in collaboration with over 90 financial institutions across Japan. Participating financial institutions are each leveraging their customer bases to attract both affiliated merchants and users nationwide.
In addition, we are going beyond merely providing payment channels and working to improve the convenience of the J-Coin app overall. For example, we have added a function for making donations on smartphones and have also expanded our services and functions for corporate clients, such as in J-Coin Biz, our J-Coin-based expense accounting service.
A new world with J-Coin: Expanding the J-Coin service
Mizuho and Blue Lab* have implemented a proof-of-concept trial for issuing digital corporate bonds targeting individual investors using blockchain technology.
Blockchain-based management of corporate bond transactions enables direct contact between corporate bond-issuing companies and individual investors. We expect this to be applicable to new market research methods and to efficient advertising methods.
In addition, corporate bond-issuing companies will be able to expand their point programs’ reach by opening their point programs to individual investors as well.
Further, because individual investors will be able to buy corporate bonds online even at small volumes or small amounts, digital corporate bonds will facilitate expansion of individual investor coverage to segments such as the younger generation and families.
Digital corporate bonds for individual investors
Blue Lab* and Mizuho Information & Research Institute are participating in the distributed computing project Folding@home to assist in the analysis of COVID-19.
As of July 5, we are 463rd of 250,000 teams in the team statistics contribution rankings, which include world-renowned IT companies.
Participation in COVID-19 analysis project (Folding@home)Highlights
Outline of overall J-Coin service
Looking to utilize across a range of financial services
Segment For individual customers:“J-Coin for everyday convenience”
For corporate clients:“J-Coin for sales promotions and productivity improvements”
Other services:“A new world with J-Coin”
Deposit account holders Individuals without deposit
accounts, students, etc.
Payments to employees
Invoicing and collecting
payments from individuals
Affiliated merchants Events Donations
Adding credit to other payment systems
Issuing digital currency
Arranging events,
collecting payments, etc.
Paying taxes
Enables completing all financial exchanges by smartphone Middle and
high school students with smartphones
Low service fees
Efficient invoicing
and payment collection
Ticketless and cashless
Easy small donations
Financial institution platform
Support for issuing in-
house digital currencyCollect
payments easilyPay easily anywhere
J-Coin Pay
J-Coin LiteJ-Coin Biz
(B2P)J-Coin Biz
(P2B)Smart events
by J-CoinSmall
donationse.g. Suica
e.g. theme parksJ-Coin
CollectJ-Coin Tax
Many services launchingCompetition intensifying
Providing new digital currency service only possible through J-Coin
For local governments and businesses looking to move to ticketless, cashless methods, we have begun providing a new service for digital local gift cards and digital ticket packs in the form of QR codes.
Amidst efforts to recover from the COVID-19 pandemic and revitalize local economies, digitizing local gift cards and other
Digital local gift cards / digital ticket packssuch items, which local governments previously put out on paper, and issuing electronic tickets useable online is easing the strain on local governments of printing, mailing, storing, and otherwise managing paper tickets. This is one way in which we are positively contributing to local governments’ operational streamlining.
* A company aiming to create new business, established as a joint venture with Silicon Valley venture capital firm WiL, companies from other industries, regional financial institutions, and others.
Digital corporate bond structure
Issuer A
Financial institution A
(securities firm)
Financial institution B
(securities firm)
Individual investors
(consumers)
Point program reach
Issuer B
(1) Issuance of corporate bonds
Digital corporate bond platform
(2) Corporate bond underwriting
(5) Acquisition of investor data
(6) Marketing Communication Points Provision of assorted benefits
(7)Use of benefits for products and services
Company products, stores, etc.
(8) Increased sales
(1) Issuance of corporate bonds
(3) Sales of corporate bonds
(4) Purchases of corporate bonds
Sale
s pr
omot
ion
su
ppor
tCo
upon
s /
adve
rtise
men
ts
Outre
ach
for v
isito
rs to
Ja
pan
Integ
ratio
n with
Alip
ay,
Union
Pay,
etc.
Prov
isio
n of
pay
men
t ch
anne
lsOn
line
paym
ents
Man
agem
ent s
uppo
rtDa
ta a
naly
sis
Targ
et
attr
ibut
es
Prov
ided
ser
vice
s
Prov
ided
val
ueSe
rvic
e (t
enta
tive
nam
e)
482020 Integrated Report
Our strategies for creating value Digitalization
014_7080585842009.indd 48 2020/09/10 11:49:06
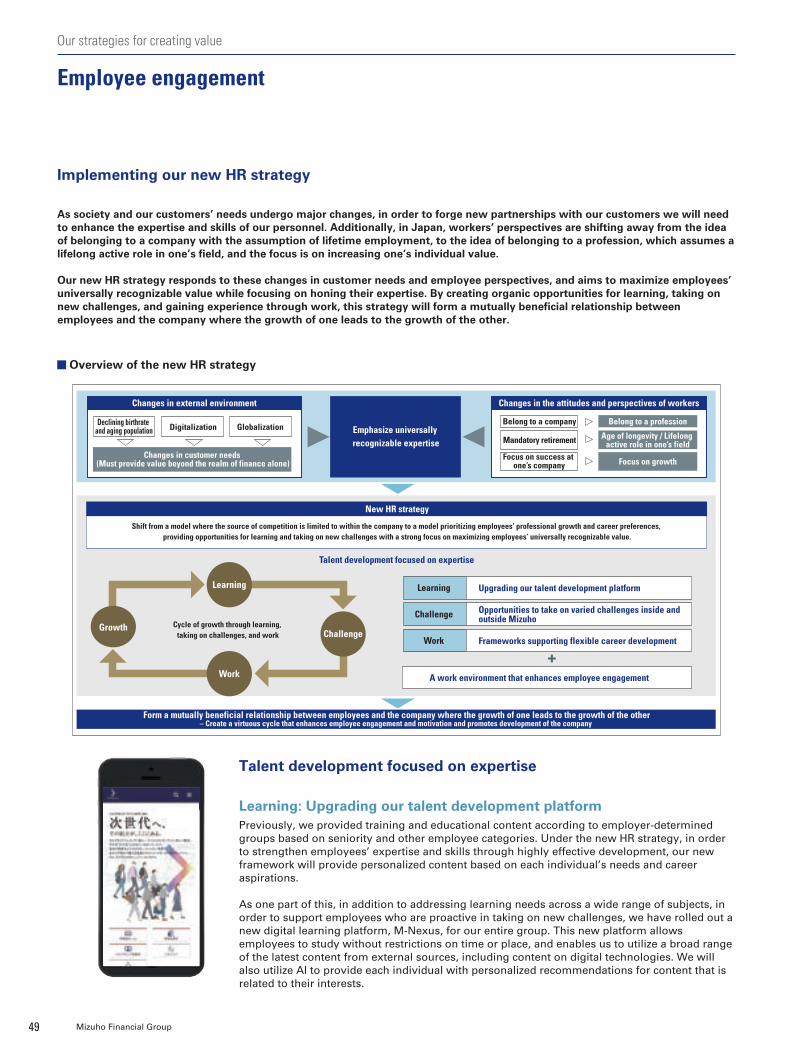
Implementing our new HR strategy
As society and our customers’ needs undergo major changes, in order to forge new partnerships with our customers we will need to enhance the expertise and skills of our personnel. Additionally, in Japan, workers’ perspectives are shifting away from the idea of belonging to a company with the assumption of lifetime employment, to the idea of belonging to a profession, which assumes a lifelong active role in one’s field, and the focus is on increasing one’s individual value.
Our new HR strategy responds to these changes in customer needs and employee perspectives, and aims to maximize employees’ universally recognizable value while focusing on honing their expertise. By creating organic opportunities for learning, taking on new challenges, and gaining experience through work, this strategy will form a mutually beneficial relationship between employees and the company where the growth of one leads to the growth of the other.
Overview of the new HR strategy
New HR strategy
Form a mutually beneficial relationship between employees and the company where the growth of one leads to the growth of the other– Create a virtuous cycle that enhances employee engagement and motivation and promotes development of the company
Talent development focused on expertise
Shift from a model where the source of competition is limited to within the company to a model prioritizing employees’ professional growth and career preferences, providing opportunities for learning and taking on new challenges with a strong focus on maximizing employees’ universally recognizable value.
Cycle of growth through learning, taking on challenges, and work
Learning
ChallengeGrowth
Work
Changes in external environment
Changes in customer needs (Must provide value beyond the realm of finance alone)
Declining birthrate and aging population Digitalization Globalization
Changes in the attitudes and perspectives of workers
Belong to a company Belong to a profession
Learning Upgrading our talent development platform
Challenge Opportunities to take on varied challenges inside and outside Mizuho
Work Frameworks supporting flexible career development
A work environment that enhances employee engagement
Mandatory retirement Age of longevity / Lifelong active role in one’s field
Focus on success at one’s company Focus on growth
Emphasize universally recognizable expertise
+
Talent development focused on expertise
Learning: Upgrading our talent development platformPreviously, we provided training and educational content according to employer-determined groups based on seniority and other employee categories. Under the new HR strategy, in order to strengthen employees’ expertise and skills through highly effective development, our new framework will provide personalized content based on each individual’s needs and career aspirations.
As one part of this, in addition to addressing learning needs across a wide range of subjects, in order to support employees who are proactive in taking on new challenges, we have rolled out a new digital learning platform, M-Nexus, for our entire group. This new platform allows employees to study without restrictions on time or place, and enables us to utilize a broad range of the latest content from external sources, including content on digital technologies. We will also utilize AI to provide each individual with personalized recommendations for content that is related to their interests.
49 Mizuho Financial Group
Our strategies for creating value
Employee engagement
015_7080585842009.indd 49 2020/09/10 13:58:31

Work: Frameworks supporting flexible career development New job track for expanded scope of involvement
Under the new HR strategy which emphasizes employee expertise, we will merge the existing job tracks to enable employees to be involved in a broader scope of work regardless of their job track, thus laying the foundations that will enable flexible career development (job tracks will be combined in fiscal 2021). This new, unified job track will focus more on the expertise that each employee exercises in their position rather than the improvement in their general work capabilities, and employee development, evaluations, and compensation will be conducted within this framework.
An evaluation system that encourages employees to gain expertise
This new evaluation system outlines the specific types of expertise and skills needed for each business field, which are key for talent management, and under the new job track framework we will expand opportunities to engage in a wide range of activities and gain expertise at an early stage.
Especially regarding personnel evaluations, which will be key for maximizing the value of each employee, we will strengthen and disseminate development-focused HR initiatives that consider evaluations not as assessments but as opportunities for growth.
For example, we will increase opportunities for communication between managers and employees in the course of the evaluation process, and in addition to providing thorough feedback on issues hindering growth and the employee’s actions, we will focus on enhancing training to improve managers’ skills as evaluators.
By shifting to a flexible compensation model that is more focused on job duties, placing an emphasis on each individual’s current performance and expertise rather than seniority or years of experience, we will draw out employees’ motivation and ambition and encourage proactivity.
3 days/wk
External company
Gain diverse perspectives and external insight
2 days/wk(secondment)
All types of work
Generalist track
(rotational)
Broader work opportunities
Focus on building expertise that will translate into business results
New “Generalist track”
Retail operations, corporate
operations, etc
Generalist track
(non-rotational)Retail
operations, corporate operations
Operations specialist track
Merge all job tracks
Curr
ent
Afte
r mer
ging
Next, in addition to utilizing this platform as a one-stop source for learning as well as information on internal job opportunities, we plan to expand functionality to utilize it as a foundation for creating an employee community and facilitating communication between employees.
496 522
820
FY2017 FY2018 FY2019
Challenge: Opportunities to take on new challenges inside and outside MizuhoWe are confident that an effective way to increase employees’ ambition and universally recognizable value is to provide more opportunities for employees to work in different fields and in different locations throughout Mizuho’s global business, taking on new challenges in order to achieve the career they envision for themselves. In order to achieve this, in addition to expanding internal job postings at Head Office targeting talent currently assigned to branch operations, we are also strengthening our support framework including training for ambitious employees interested in trying new types of work and contributing in a leading role at Mizuho in the future. The number of internal job applicants has increased by over 50% as a result of these initiatives.
We have also launched a concurrent assignment program which provides opportunities for employees to be involved in other roles or projects they are interested in while maintaining their primary duties, and in fiscal 2019, the first fiscal year of this program, we received applications from over 120 employees.
Additionally, we are creating a framework to enable employees to take on new challenges outside of Mizuho, and have added job postings for secondment opportunities at external companies including start-up firms. Also, in addition to adopting the concurrent assignment program via which employees work some days at Mizuho and other days at another company, we have newly added a part-time work program for employees to operate their own businesses outside of work hours, and so far around 120 employees are utilizing these new arrangements.
No. of applicants for internal job postings
Example of concurrent assignment outside Mizuho
502020 Integrated Report
Our strategies for creating value Employee engagement
015_7080585842009.indd 50 2020/09/10 13:58:31
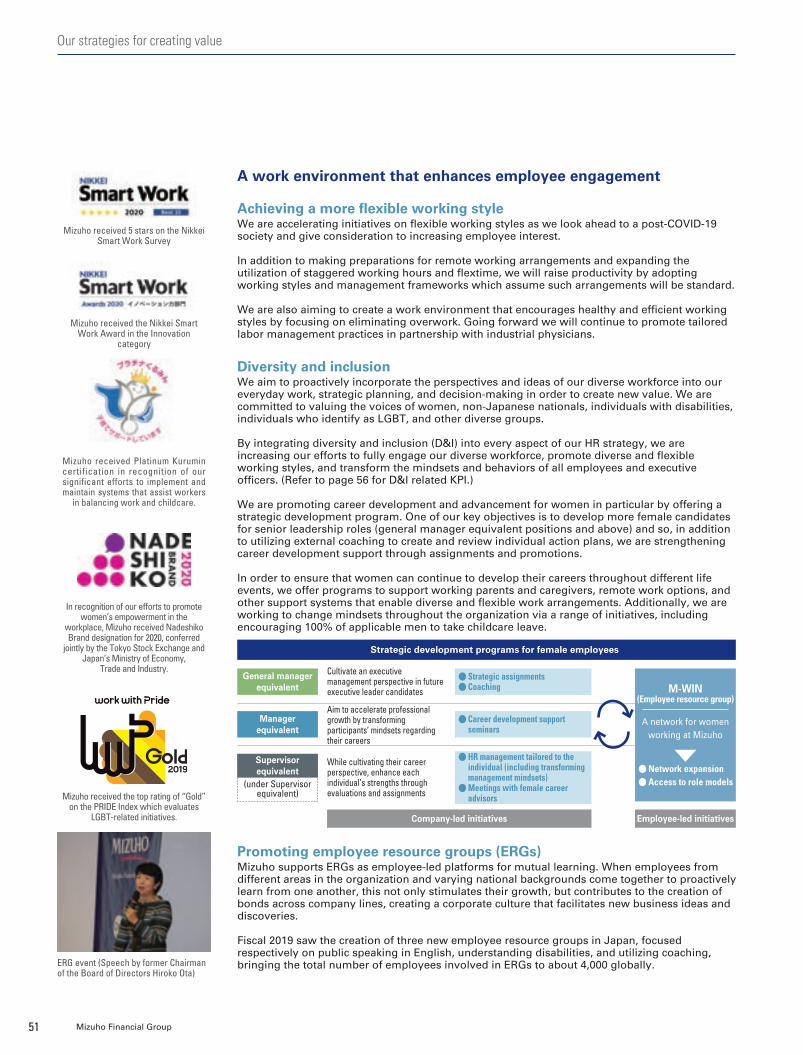
General manager equivalent
Manager equivalent
Supervisor equivalent
Employee-led initiativesCompany-led initiatives
Strategic assignments Coaching
Career development support seminars
HR management tailored to the individual (including transforming management mindsets) Meetings with female career advisors
Strategic development programs for female employees
While cultivating their career perspective, enhance each individual’s strengths through evaluations and assignments
Aim to accelerate professional growth by transforming participants’ mindsets regarding their careers
Cultivate an executive management perspective in future executive leader candidates M-WIN
(Employee resource group)
A network for women working at Mizuho
Network expansion Access to role models(under Supervisor
equivalent)
Mizuho received Platinum Kurumin certification in recognition of our significant efforts to implement and maintain systems that assist workers
in balancing work and childcare.
A work environment that enhances employee engagement
Achieving a more flexible working styleWe are accelerating initiatives on flexible working styles as we look ahead to a post-COVID-19 society and give consideration to increasing employee interest.
In addition to making preparations for remote working arrangements and expanding the utilization of staggered working hours and flextime, we will raise productivity by adopting working styles and management frameworks which assume such arrangements will be standard.
We are also aiming to create a work environment that encourages healthy and efficient working styles by focusing on eliminating overwork. Going forward we will continue to promote tailored labor management practices in partnership with industrial physicians.
Diversity and inclusionWe aim to proactively incorporate the perspectives and ideas of our diverse workforce into our everyday work, strategic planning, and decision-making in order to create new value. We are committed to valuing the voices of women, non-Japanese nationals, individuals with disabilities, individuals who identify as LGBT, and other diverse groups.
By integrating diversity and inclusion (D&I) into every aspect of our HR strategy, we are increasing our efforts to fully engage our diverse workforce, promote diverse and flexible working styles, and transform the mindsets and behaviors of all employees and executive officers. (Refer to page 56 for D&I related KPI.)
We are promoting career development and advancement for women in particular by offering a strategic development program. One of our key objectives is to develop more female candidates for senior leadership roles (general manager equivalent positions and above) and so, in addition to utilizing external coaching to create and review individual action plans, we are strengthening career development support through assignments and promotions.
In order to ensure that women can continue to develop their careers throughout different life events, we offer programs to support working parents and caregivers, remote work options, and other support systems that enable diverse and flexible work arrangements. Additionally, we are working to change mindsets throughout the organization via a range of initiatives, including encouraging 100% of applicable men to take childcare leave.
ERG event (Speech by former Chairman of the Board of Directors Hiroko Ota)
Promoting employee resource groups (ERGs)Mizuho supports ERGs as employee-led platforms for mutual learning. When employees from different areas in the organization and varying national backgrounds come together to proactively learn from one another, this not only stimulates their growth, but contributes to the creation of bonds across company lines, creating a corporate culture that facilitates new business ideas and discoveries.
Fiscal 2019 saw the creation of three new employee resource groups in Japan, focused respectively on public speaking in English, understanding disabilities, and utilizing coaching, bringing the total number of employees involved in ERGs to about 4,000 globally.
Mizuho received 5 stars on the Nikkei Smart Work Survey
In recognition of our efforts to promote women’s empowerment in the
workplace, Mizuho received Nadeshiko Brand designation for 2020, conferred
jointly by the Tokyo Stock Exchange and Japan’s Ministry of Economy,
Trade and Industry.
Mizuho received the top rating of “Gold” on the PRIDE Index which evaluates
LGBT-related initiatives.
Mizuho received the Nikkei Smart Work Award in the Innovation
category
51 Mizuho Financial Group
Our strategies for creating value
015_7080585842009.indd 51 2020/09/10 13:58:31

Promoting employee health and wellness In our response to the COVID-19 pandemic, we are prioritizing the health and safety of customers and employees, and in addition to basic measures such as wearing face masks and promoting hand washing, we have also encouraged employees to work remotely and conduct meetings online, and made consultations available for employees.
Through these and other initiatives promoting employees’ physical and mental health as well as their health literacy, we are aiming to enhance the performance of each individual and increase the productivity of the organization as a whole.
Mizuho was recognized under the 2020 Health & Productivity Stock Selection for a number of initiatives, including those aimed at preventing overwork, such as encouraging the use of paid leave, as well as efforts to prevent increases in the severity of health conditions through measures such as requiring employees to receive subsequent testing in the event of irregularities in their annual health exam. We were also recognized for the way in which we pursue these goals through an integrated framework enabling collaboration between the company, health insurance providers, and occupational health services providers.
The core of the new HR strategy launched last fiscal year under our 5-Year Business Plan is to cultivate the universally recognizable value of employees by encouraging them to take independent action and take on challenges.
To this end, we are working to expand opportunities for learning and taking on challenges so that each employee can design their own career, hone their expertise through learning, and experience growth by taking on challenges. As we work to expand such opportunities, an increasing number of employees are taking specific action with many utilizing new frameworks such as internal job postings, concurrent assignments, and external part-time work, and we are now feeling the impact of these initiatives as they begin producing results.
We will continue building the HR foundations needed to develop talent for the transition to the next generation of financial services including the creation of frameworks for flexible career development.
Furthermore, we will utilize the ideas and experience of employees from diverse backgrounds to further stimulate Mizuho’s growth, and continue promoting D&I initiatives such as the newly established Mizuho Diversity & Inclusion Month. And, in addition to responding to the COVID-19 pandemic, as physical and mental wellbeing are essential for each individual employee to be fully engaged at work, we will continue strengthening employee health management and other such initiatives aiming to ensure Mizuho’s sustainable growth.
Our HR strategy
Mizuho was selected under the 2020 Health & Productivity Stock Selection,
which is jointly administered by the Ministry of Economy, Trade
and Industry and the Tokyo Stock Exchange.
Exposure to a wide variety of ideas, holdings discussions and communicating, and broadening connections with others is transformative for the mindsets and behavior of Mizuho employees. In order to promote D&I’s aim of drawing on the diversity of our workforce to create new corporate value, we hosted an interactive project called Mizuho Diversity & Inclusion Month, which was held on a group-wide and global basis.
Fiscal 2019 was the first year for this event, which began with a discussion session with the Group CEO and also featured speeches, ERG events, and more for a total of over 40 events around the world over the course of one month. Approximately 7,000 employees participated in total.
We will host Mizuho Diversity & Inclusion Month on a continued basis to transform employee mindsets and behaviors, thus encouraging the creation of new corporate value on a broad scale across the group.
Mizuho Diversity & Inclusion Month
CEO Session
(Online video feed in Japan)
Hiroaki EharaGroup Chief Human Resources Officer
522020 Integrated Report
Our strategies for creating value Employee engagement
015_7080585842009.indd 52 2020/09/10 13:58:32
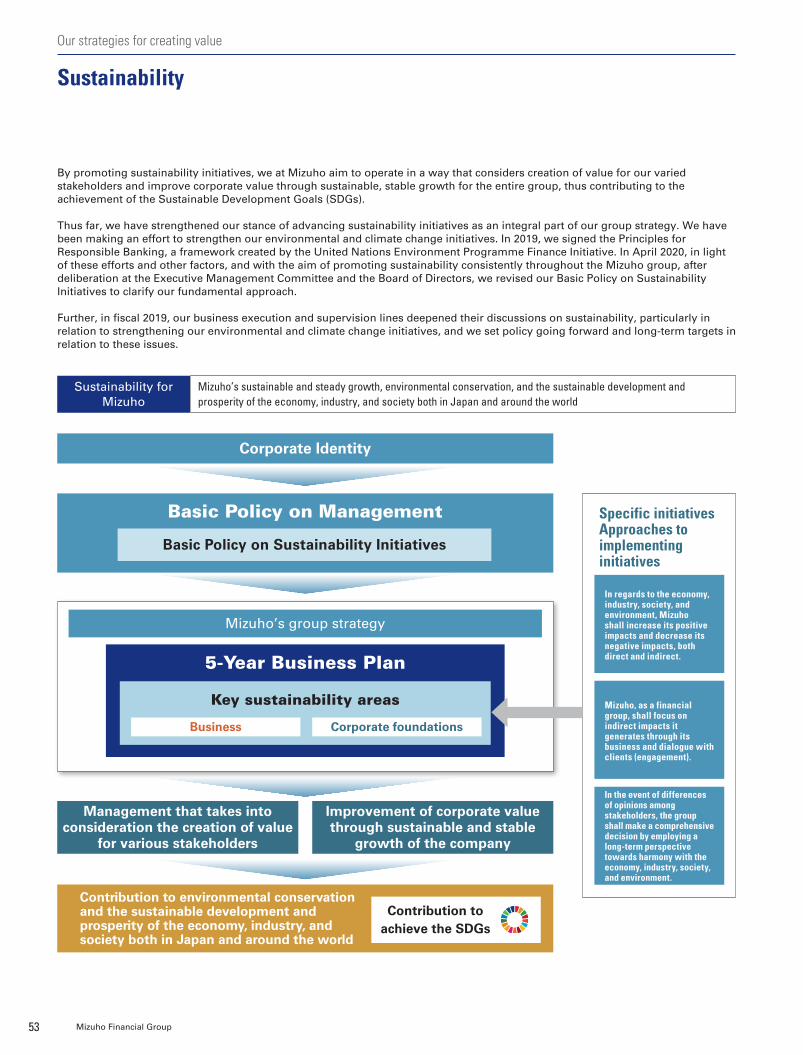
By promoting sustainability initiatives, we at Mizuho aim to operate in a way that considers creation of value for our varied stakeholders and improve corporate value through sustainable, stable growth for the entire group, thus contributing to the achievement of the Sustainable Development Goals (SDGs).
Thus far, we have strengthened our stance of advancing sustainability initiatives as an integral part of our group strategy. We have been making an effort to strengthen our environmental and climate change initiatives. In 2019, we signed the Principles for Responsible Banking, a framework created by the United Nations Environment Programme Finance Initiative. In April 2020, in light of these efforts and other factors, and with the aim of promoting sustainability consistently throughout the Mizuho group, after deliberation at the Executive Management Committee and the Board of Directors, we revised our Basic Policy on Sustainability Initiatives to clarify our fundamental approach.
Further, in fiscal 2019, our business execution and supervision lines deepened their discussions on sustainability, particularly in relation to strengthening our environmental and climate change initiatives, and we set policy going forward and long-term targets in relation to these issues.
Corporate Identity
Mizuho’s group strategy
Management that takes into consideration the creation of value
for various stakeholders
Improvement of corporate value through sustainable and stable
growth of the company
5-Year Business Plan
Key sustainability areas
Basic Policy on Management
Basic Policy on Sustainability Initiatives
Contribution to environmental conservation and the sustainable development and prosperity of the economy, industry, and society both in Japan and around the world
Contribution to achieve the SDGs
Corporate foundationsBusiness
Sustainability for Mizuho
Mizuho’s sustainable and steady growth, environmental conservation, and the sustainable development and prosperity of the economy, industry, and society both in Japan and around the world
Specific initiativesApproaches to implementing initiatives
In regards to the economy, industry, society, and environment, Mizuho shall increase its positive impacts and decrease its negative impacts, both direct and indirect.
Mizuho, as a financial group, shall focus on indirect impacts it generates through its business and dialogue with clients (engagement).
In the event of differences of opinions among stakeholders, the group shall make a comprehensive decision by employing a long-term perspective towards harmony with the economy, industry, society, and environment.
53 Mizuho Financial Group
Sustainability
Our strategies for creating value
016_7080585842009.indd 53 2020/09/15 16:42:24
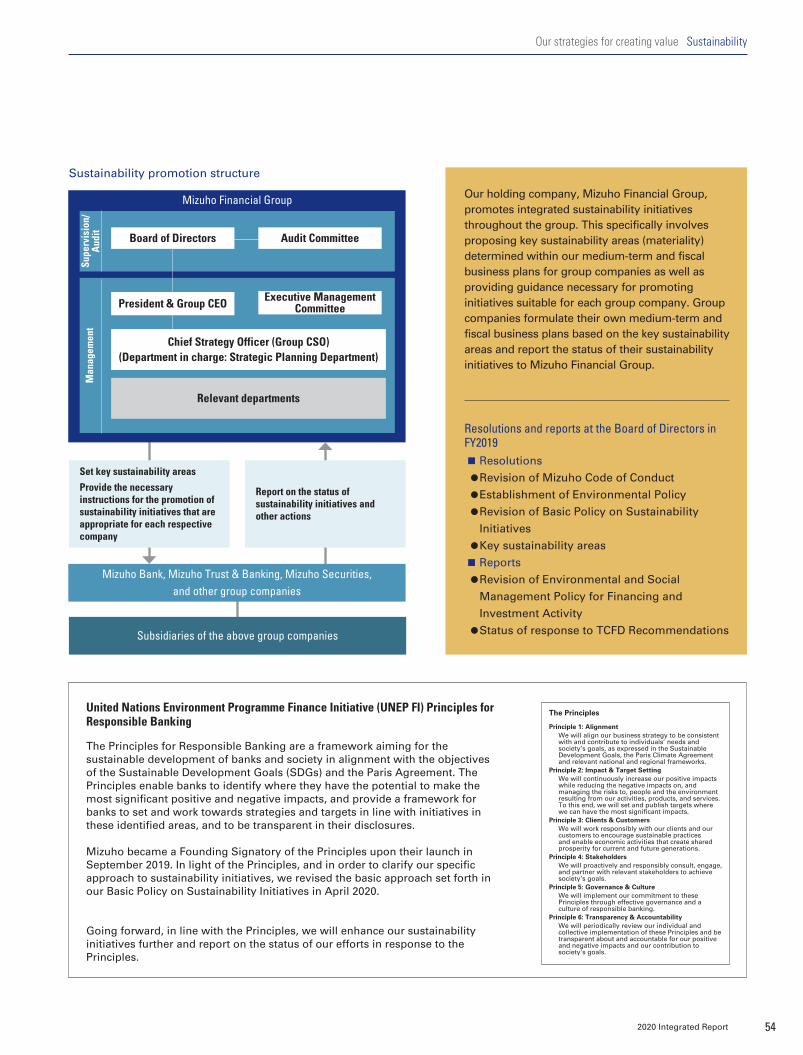
Mizuho Bank, Mizuho Trust & Banking, Mizuho Securities, and other group companies
Subsidiaries of the above group companies
Board of Directors
President & Group CEO
Chief Strategy Officer (Group CSO) (Department in charge: Strategic Planning Department)
Relevant departments
Set key sustainability areas
Provide the necessary instructions for the promotion of sustainability initiatives that are appropriate for each respective company
Report on the status of sustainability initiatives and other actions
Audit Committee
Executive Management Committee
Sustainability promotion structure
United Nations Environment Programme Finance Initiative (UNEP FI) Principles for Responsible Banking
The Principles for Responsible Banking are a framework aiming for the sustainable development of banks and society in alignment with the objectives of the Sustainable Development Goals (SDGs) and the Paris Agreement. The Principles enable banks to identify where they have the potential to make the most significant positive and negative impacts, and provide a framework for banks to set and work towards strategies and targets in line with initiatives in these identified areas, and to be transparent in their disclosures.
Mizuho became a Founding Signatory of the Principles upon their launch in September 2019. In light of the Principles, and in order to clarify our specific approach to sustainability initiatives, we revised the basic approach set forth in our Basic Policy on Sustainability Initiatives in April 2020.
Going forward, in line with the Principles, we will enhance our sustainability initiatives further and report on the status of our efforts in response to the Principles.
Resolutions and reports at the Board of Directors in FY2019
Our holding company, Mizuho Financial Group, promotes integrated sustainability initiatives throughout the group. This specifically involves proposing key sustainability areas (materiality) determined within our medium-term and fiscal business plans for group companies as well as providing guidance necessary for promoting initiatives suitable for each group company. Group companies formulate their own medium-term and fiscal business plans based on the key sustainability areas and report the status of their sustainability initiatives to Mizuho Financial Group.
Resolutions
Revision of Mizuho Code of Conduct
Establishment of Environmental Policy
Revision of Basic Policy on Sustainability
Initiatives
Key sustainability areas Reports
Revision of Environmental and Social
Management Policy for Financing and
Investment Activity
Status of response to TCFD Recommendations
Mizuho Financial Group
The Principles
Principle 1: AlignmentWe will align our business strategy to be consistent with and contribute to individuals’ needs and society’s goals, as expressed in the Sustainable Development Goals, the Paris Climate Agreement and relevant national and regional frameworks.
Principle 2: Impact & Target SettingWe will continuously increase our positive impacts while reducing the negative impacts on, and managing the risks to, people and the environment resulting from our activities, products, and services. To this end, we will set and publish targets where we can have the most significant impacts.
Principle 3: Clients & CustomersWe will work responsibly with our clients and our customers to encourage sustainable practices and enable economic activities that create shared prosperity for current and future generations.
Principle 4: StakeholdersWe will proactively and responsibly consult, engage, and partner with relevant stakeholders to achieve society’s goals.
Principle 5: Governance & CultureWe will implement our commitment to these Principles through effective governance and a culture of responsible banking.
Principle 6: Transparency & AccountabilityWe will periodically review our individual and collective implementation of these Principles and be transparent about and accountable for our positive and negative impacts and our contribution to society’s goals.
Supe
rvis
ion/
Aud
itM
anag
emen
t
542020 Integrated Report
Our strategies for creating value Sustainability
016_7080585842009.indd 54 2020/09/15 16:42:24

Note: Icons indicate relation to major Sustainable Development Goals (SDGs)
Declining birthrate and aging population, plus good health and lengthening lifespans
Industry development & innovation
Sound economic growth
Environmental considerations
Human capital
Environment & society
Corporate governance
Asset formation to prepare for the future Expand services that respond to a society with a declining birthrate and aging population
Convenient services in line with diversifying lifestyles P34, P42, P47 to 48
Smooth business succession Industry transformation Acceleration of innovation Growth in Asian economic zones Creating resilient social infrastructure P34, P36, P38, P44, P46
Strengthening capital markets functions Transition to a cashless society Environmentally conscious social programs P40, P42, P46
Promoting action to address climate change and supporting the transition to a low-carbon society
P59 to 62
Enhancing corporate governance Risk management, strengthening our IT infrastructure, and compliance Disclosure of information in a fair, timely, and appropriate manner, and holding dialogue with stakeholders
P27 to 28, P69 to 97
Talent development and creating workplaces that give employees a sense of purpose
P49 to 52
Environmental and human rights considerations for investment and lending
Addressing climate change Improving financial and economic literacy, and promoting activities that contribute to society based on regional and societal needs
P57 to 58, P63 to 66, P97
Key sustainability areas
We have defined key sustainability areas in our 5-Year Business Plan in line with the expectations and requirements of stakeholders and based on the importance and affinity of such initiatives with our strategy, as well as medium- to long-term impact on our corporate value, and each in-house company, unit, and group will establish a strategy incorporating sustainability initiatives. Additionally, we have set targets/KPIs based on our key sustainability areas. The key sustainability areas and other items are revised each fiscal year and reflected into our business plan.
Bu
sin
ess
Op
en p
artn
ersh
ips
and
co
llab
ora
tio
n w
ith
a d
iver
se r
ang
e o
f st
akeh
old
ers
Co
rpo
rate
fo
un
dat
ion
s
55 Mizuho Financial Group
Our strategies for creating value
016_7080585842009.indd 55 2020/09/15 16:42:24
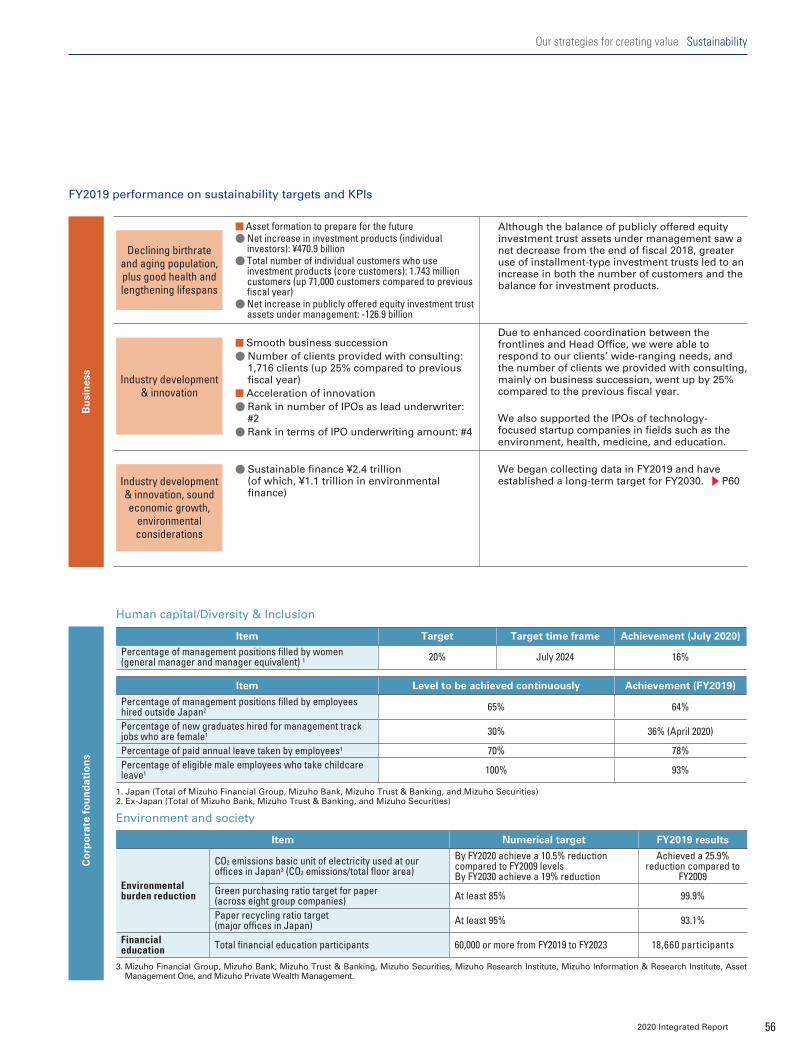
Declining birthrate and aging population, plus good health and lengthening lifespans
Industry development & innovation
Industry development & innovation, sound economic growth,
environmental considerations
Asset formation to prepare for the future Net increase in investment products (individual investors): ¥470.9 billion
Total number of individual customers who use investment products (core customers): 1.743 million customers (up 71,000 customers compared to previous fiscal year)
Net increase in publicly offered equity investment trust assets under management: -126.9 billion
Although the balance of publicly offered equity investment trust assets under management saw a net decrease from the end of fiscal 2018, greater use of installment-type investment trusts led to an increase in both the number of customers and the balance for investment products.
Smooth business succession Number of clients provided with consulting: 1,716 clients (up 25% compared to previous fiscal year)
Acceleration of innovation Rank in number of IPOs as lead underwriter: #2
Rank in terms of IPO underwriting amount: #4
Due to enhanced coordination between the frontlines and Head Office, we were able to respond to our clients’ wide-ranging needs, and the number of clients we provided with consulting, mainly on business succession, went up by 25% compared to the previous fiscal year.
We also supported the IPOs of technology-focused startup companies in fields such as the environment, health, medicine, and education.
Sustainable finance ¥2.4 trillion (of which, ¥1.1 trillion in environmental finance)
We began collecting data in FY2019 and have established a long-term target for FY2030. P60
FY2019 performance on sustainability targets and KPIs
Environment and society
Human capital/Diversity & Inclusion
Item Target Target time frame Achievement (July 2020)
Percentage of management positions filled by women (general manager and manager equivalent) 1 20% July 2024 16%
Item Level to be achieved continuously Achievement (FY2019)
Percentage of management positions filled by employees hired outside Japan2 65% 64%
Percentage of new graduates hired for management track jobs who are female1 30% 36% (April 2020)
Percentage of paid annual leave taken by employees1 70% 78%Percentage of eligible male employees who take childcare leave1 100% 93%
1. Japan (Total of Mizuho Financial Group, Mizuho Bank, Mizuho Trust & Banking, and Mizuho Securities)2. Ex-Japan (Total of Mizuho Bank, Mizuho Trust & Banking, and Mizuho Securities)
Item Numerical target FY2019 results
Environmental burden reduction
CO2 emissions basic unit of electricity used at our offices in Japan3 (CO2 emissions/total floor area)
By FY2020 achieve a 10.5% reduction compared to FY2009 levelsBy FY2030 achieve a 19% reduction
Achieved a 25.9% reduction compared to
FY2009Green purchasing ratio target for paper(across eight group companies) At least 85% 99.9%
Paper recycling ratio target (major offices in Japan) At least 95% 93.1%
Financial education Total financial education participants 60,000 or more from FY2019 to FY2023 18,660 participants
3. Mizuho Financial Group, Mizuho Bank, Mizuho Trust & Banking, Mizuho Securities, Mizuho Research Institute, Mizuho Information & Research Institute, Asset Management One, and Mizuho Private Wealth Management.
Bu
sin
ess
Co
rpo
rate
fo
un
dat
ion
s
562020 Integrated Report
Our strategies for creating value Sustainability
016_7080585842009.indd 56 2020/09/15 16:42:24
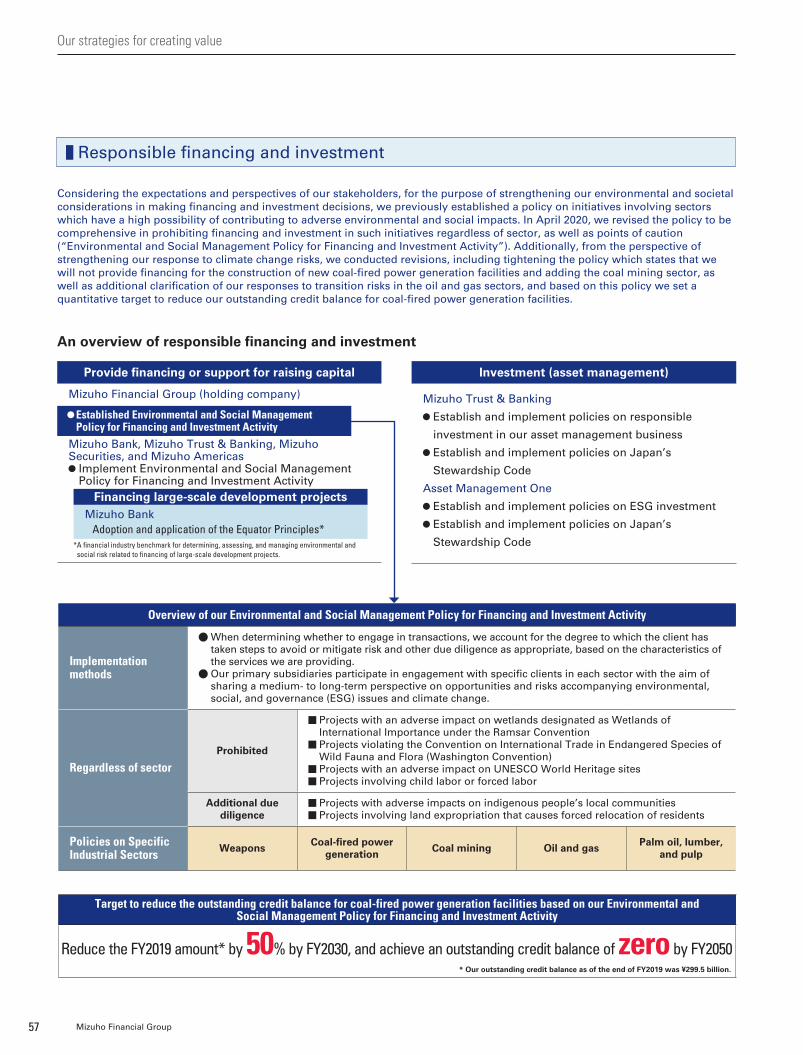
An overview of responsible financing and investment
Provide financing or support for raising capital
Mizuho Financial Group (holding company)
Mizuho Bank, Mizuho Trust & Banking, Mizuho Securities, and Mizuho Americas
Implement Environmental and Social Management Policy for Financing and Investment Activity
Investment (asset management)
Mizuho Trust & Banking
Establish and implement policies on responsible
investment in our asset management business
Establish and implement policies on Japan’s
Stewardship Code
Asset Management One
Establish and implement policies on ESG investment
Establish and implement policies on Japan’s
Stewardship Code
Established Environmental and Social Management Policy for Financing and Investment Activity
Target to reduce the outstanding credit balance for coal-fired power generation facilities based on our Environmental and Social Management Policy for Financing and Investment Activity
Reduce the FY2019 amount* by 50% by FY2030, and achieve an outstanding credit balance of zero by FY2050* Our outstanding credit balance as of the end of FY2019 was ¥299.5 billion.
Financing large-scale development projectsMizuho Bank Adoption and application of the Equator Principles*
* A financial industry benchmark for determining, assessing, and managing environmental and social risk related to financing of large-scale development projects.
Responsible financing and investment
Considering the expectations and perspectives of our stakeholders, for the purpose of strengthening our environmental and societal considerations in making financing and investment decisions, we previously established a policy on initiatives involving sectors which have a high possibility of contributing to adverse environmental and social impacts. In April 2020, we revised the policy to be comprehensive in prohibiting financing and investment in such initiatives regardless of sector, as well as points of caution (“Environmental and Social Management Policy for Financing and Investment Activity”). Additionally, from the perspective of strengthening our response to climate change risks, we conducted revisions, including tightening the policy which states that we will not provide financing for the construction of new coal-fired power generation facilities and adding the coal mining sector, as well as additional clarification of our responses to transition risks in the oil and gas sectors, and based on this policy we set a quantitative target to reduce our outstanding credit balance for coal-fired power generation facilities.
Overview of our Environmental and Social Management Policy for Financing and Investment Activity
Implementation methods
When determining whether to engage in transactions, we account for the degree to which the client has taken steps to avoid or mitigate risk and other due diligence as appropriate, based on the characteristics of the services we are providing.
Our primary subsidiaries participate in engagement with specific clients in each sector with the aim of sharing a medium- to long-term perspective on opportunities and risks accompanying environmental, social, and governance (ESG) issues and climate change.
Regardless of sectorProhibited
Projects with an adverse impact on wetlands designated as Wetlands of International Importance under the Ramsar Convention
Projects violating the Convention on International Trade in Endangered Species of Wild Fauna and Flora (Washington Convention)
Projects with an adverse impact on UNESCO World Heritage sites Projects involving child labor or forced labor
Additional due diligence
Projects with adverse impacts on indigenous people’s local communities Projects involving land expropriation that causes forced relocation of residents
Policies on Specific Industrial Sectors Weapons Coal-fired power
generation Coal mining Oil and gas Palm oil, lumber, and pulp
57 Mizuho Financial Group
Our strategies for creating value
016_7080585842009.indd 57 2020/09/15 16:42:24
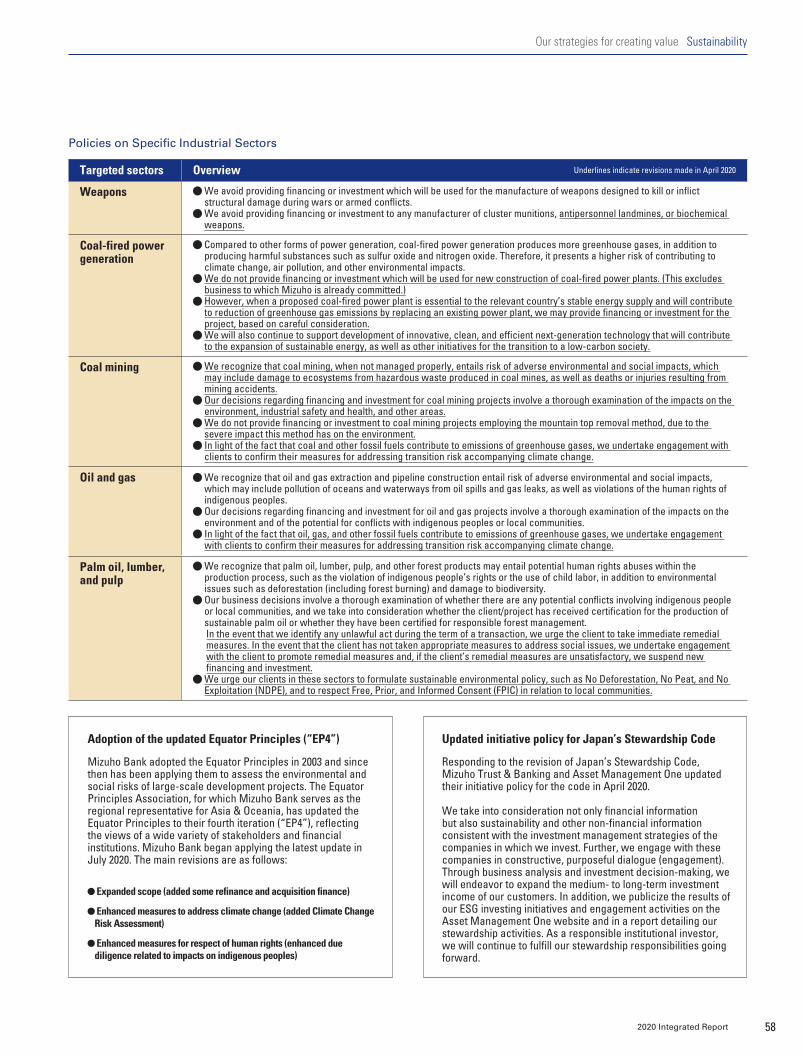
Policies on Specific Industrial Sectors
Adoption of the updated Equator Principles (“EP4”) Updated initiative policy for Japan’s Stewardship Code
Mizuho Bank adopted the Equator Principles in 2003 and since then has been applying them to assess the environmental and social risks of large-scale development projects. The Equator Principles Association, for which Mizuho Bank serves as the regional representative for Asia & Oceania, has updated the Equator Principles to their fourth iteration (“EP4”), reflecting the views of a wide variety of stakeholders and financial institutions. Mizuho Bank began applying the latest update in July 2020. The main revisions are as follows:
Expanded scope (added some refinance and acquisition finance)
Enhanced measures to address climate change (added Climate Change Risk Assessment)
Enhanced measures for respect of human rights (enhanced due diligence related to impacts on indigenous peoples)
Responding to the revision of Japan’s Stewardship Code, Mizuho Trust & Banking and Asset Management One updated their initiative policy for the code in April 2020.
We take into consideration not only financial information but also sustainability and other non-financial information consistent with the investment management strategies of the companies in which we invest. Further, we engage with these companies in constructive, purposeful dialogue (engagement). Through business analysis and investment decision-making, we will endeavor to expand the medium- to long-term investment income of our customers. In addition, we publicize the results of our ESG investing initiatives and engagement activities on the Asset Management One website and in a report detailing our stewardship activities. As a responsible institutional investor, we will continue to fulfill our stewardship responsibilities going forward.
Targeted sectors Overview Underlines indicate revisions made in April 2020
Weapons We avoid providing financing or investment which will be used for the manufacture of weapons designed to kill or inflict structural damage during wars or armed conflicts.
We avoid providing financing or investment to any manufacturer of cluster munitions, antipersonnel landmines, or biochemical weapons.
Coal-fired power generation
Compared to other forms of power generation, coal-fired power generation produces more greenhouse gases, in addition to producing harmful substances such as sulfur oxide and nitrogen oxide. Therefore, it presents a higher risk of contributing to climate change, air pollution, and other environmental impacts.
We do not provide financing or investment which will be used for new construction of coal-fired power plants. (This excludes business to which Mizuho is already committed.)
However, when a proposed coal-fired power plant is essential to the relevant country’s stable energy supply and will contribute to reduction of greenhouse gas emissions by replacing an existing power plant, we may provide financing or investment for the project, based on careful consideration.
We will also continue to support development of innovative, clean, and efficient next-generation technology that will contribute to the expansion of sustainable energy, as well as other initiatives for the transition to a low-carbon society.
Coal mining We recognize that coal mining, when not managed properly, entails risk of adverse environmental and social impacts, which may include damage to ecosystems from hazardous waste produced in coal mines, as well as deaths or injuries resulting from mining accidents.
Our decisions regarding financing and investment for coal mining projects involve a thorough examination of the impacts on the environment, industrial safety and health, and other areas.
We do not provide financing or investment to coal mining projects employing the mountain top removal method, due to the severe impact this method has on the environment.
In light of the fact that coal and other fossil fuels contribute to emissions of greenhouse gases, we undertake engagement with clients to confirm their measures for addressing transition risk accompanying climate change.
Oil and gas We recognize that oil and gas extraction and pipeline construction entail risk of adverse environmental and social impacts, which may include pollution of oceans and waterways from oil spills and gas leaks, as well as violations of the human rights of indigenous peoples.
Our decisions regarding financing and investment for oil and gas projects involve a thorough examination of the impacts on the environment and of the potential for conflicts with indigenous peoples or local communities.
In light of the fact that oil, gas, and other fossil fuels contribute to emissions of greenhouse gases, we undertake engagement with clients to confirm their measures for addressing transition risk accompanying climate change.
Palm oil, lumber, and pulp
We recognize that palm oil, lumber, pulp, and other forest products may entail potential human rights abuses within the production process, such as the violation of indigenous people’s rights or the use of child labor, in addition to environmental issues such as deforestation (including forest burning) and damage to biodiversity.
Our business decisions involve a thorough examination of whether there are any potential conflicts involving indigenous people or local communities, and we take into consideration whether the client/project has received certification for the production of sustainable palm oil or whether they have been certified for responsible forest management.In the event that we identify any unlawful act during the term of a transaction, we urge the client to take immediate remedial measures. In the event that the client has not taken appropriate measures to address social issues, we undertake engagement with the client to promote remedial measures and, if the client’s remedial measures are unsatisfactory, we suspend new financing and investment.
We urge our clients in these sectors to formulate sustainable environmental policy, such as No Deforestation, No Peat, and No Exploitation (NDPE), and to respect Free, Prior, and Informed Consent (FPIC) in relation to local communities.
582020 Integrated Report
Our strategies for creating value Sustainability
016_7080585842009.indd 58 2020/09/15 16:42:24
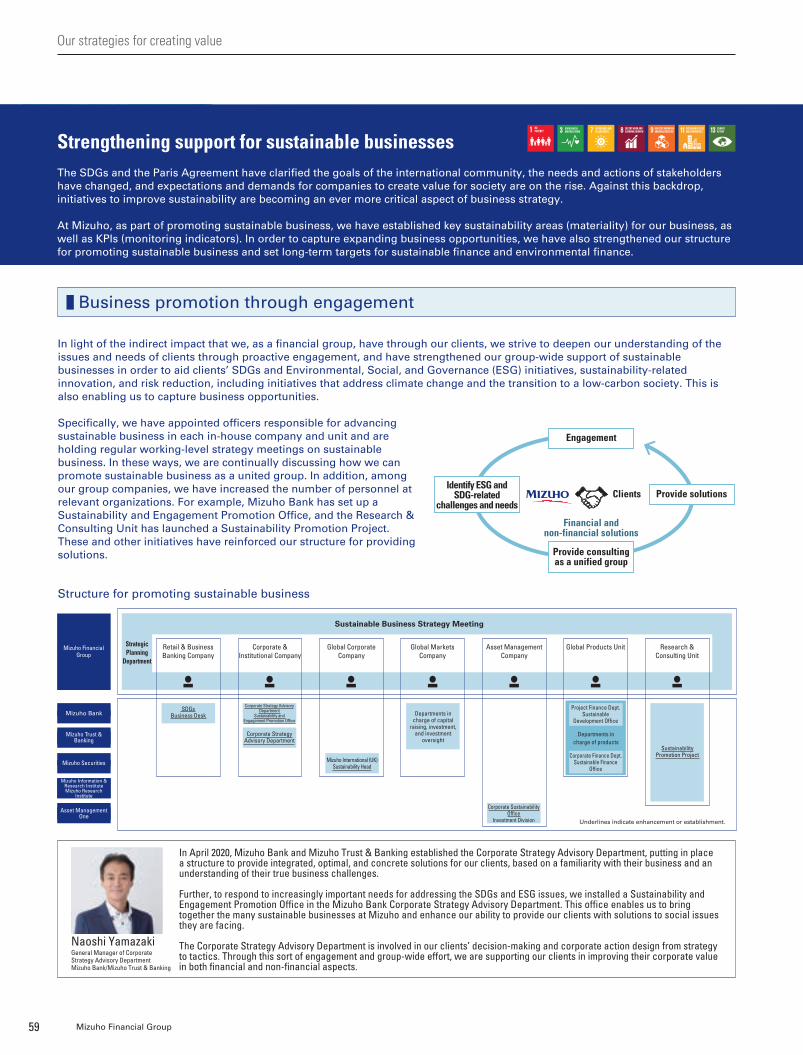
In April 2020, Mizuho Bank and Mizuho Trust & Banking established the Corporate Strategy Advisory Department, putting in place a structure to provide integrated, optimal, and concrete solutions for our clients, based on a familiarity with their business and an understanding of their true business challenges.
Further, to respond to increasingly important needs for addressing the SDGs and ESG issues, we installed a Sustainability and Engagement Promotion Office in the Mizuho Bank Corporate Strategy Advisory Department. This office enables us to bring together the many sustainable businesses at Mizuho and enhance our ability to provide our clients with solutions to social issues they are facing.
The Corporate Strategy Advisory Department is involved in our clients’ decision-making and corporate action design from strategy to tactics. Through this sort of engagement and group-wide effort, we are supporting our clients in improving their corporate value in both financial and non-financial aspects.
The SDGs and the Paris Agreement have clarified the goals of the international community, the needs and actions of stakeholders have changed, and expectations and demands for companies to create value for society are on the rise. Against this backdrop, initiatives to improve sustainability are becoming an ever more critical aspect of business strategy.
At Mizuho, as part of promoting sustainable business, we have established key sustainability areas (materiality) for our business, as well as KPIs (monitoring indicators). In order to capture expanding business opportunities, we have also strengthened our structure for promoting sustainable business and set long-term targets for sustainable finance and environmental finance.
Structure for promoting sustainable business
Business promotion through engagement
In light of the indirect impact that we, as a financial group, have through our clients, we strive to deepen our understanding of the issues and needs of clients through proactive engagement, and have strengthened our group-wide support of sustainable businesses in order to aid clients’ SDGs and Environmental, Social, and Governance (ESG) initiatives, sustainability-related innovation, and risk reduction, including initiatives that address climate change and the transition to a low-carbon society. This is also enabling us to capture business opportunities.
Specifically, we have appointed officers responsible for advancing sustainable business in each in-house company and unit and are holding regular working-level strategy meetings on sustainable business. In these ways, we are continually discussing how we can promote sustainable business as a united group. In addition, among our group companies, we have increased the number of personnel at relevant organizations. For example, Mizuho Bank has set up a Sustainability and Engagement Promotion Office, and the Research & Consulting Unit has launched a Sustainability Promotion Project. These and other initiatives have reinforced our structure for providing solutions.
Naoshi YamazakiGeneral Manager of Corporate Strategy Advisory DepartmentMizuho Bank/Mizuho Trust & Banking
Sustainable Business Strategy Meeting
Strategic Planning
Department
Departments in charge of capital
raising, investment, and investment
oversight
Project Finance Dept.Sustainable
Development Office
Retail & Business Banking Company
Corporate & Institutional Company
Global Corporate Company
Global Markets Company
Asset Management Company
Global Products Unit Research & Consulting Unit
Departments in charge of products
Corporate Finance Dept.Sustainable Finance
Office
Sustainability Promotion Project
Mizuho Bank
Mizuho Trust & Banking
Mizuho Securities
Mizuho Information & Research InstituteMizuho Research
Institute
Asset Management One
Underlines indicate enhancement or establishment.
Mizuho Financial Group
Corporate Strategy Advisory Department
Corporate Strategy Advisory Department
Sustainability and Engagement Promotion Office
SDGs Business Desk
Mizuho International (UK)Sustainability Head
Corporate Sustainability Office
Investment Division
Engagement
Provide solutionsIdentify ESG and
SDG-related challenges and needs
Provide consulting as a unified group
Financial and non-financial solutions
Clients
59 Mizuho Financial Group
Strengthening support for sustainable businesses
Our strategies for creating value
016_7080585842009.indd 59 2020/09/15 16:42:25
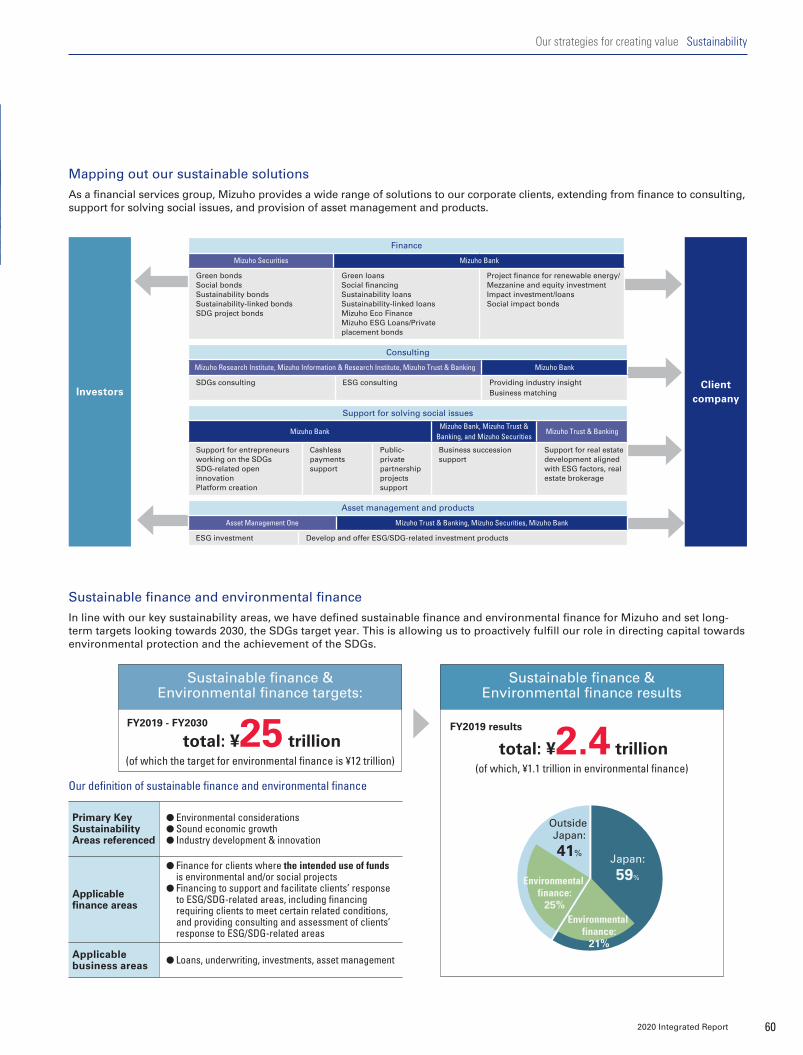
InvestorsClient
company
Finance
Mizuho Securities Mizuho Bank
Green bondsSocial bondsSustainability bondsSustainability-linked bondsSDG project bonds
Green loansSocial financingSustainability loansSustainability-linked loansMizuho Eco FinanceMizuho ESG Loans/Private placement bonds
Project finance for renewable energy/Mezzanine and equity investmentImpact investment/loansSocial impact bonds
Consulting
Mizuho Research Institute, Mizuho Information & Research Institute, Mizuho Trust & Banking Mizuho Bank
SDGs consulting ESG consulting Providing industry insightBusiness matching
Asset management and products
Asset Management One Mizuho Trust & Banking, Mizuho Securities, Mizuho Bank
ESG investment Develop and offer ESG/SDG-related investment products
Support for solving social issues
Mizuho BankMizuho Bank, Mizuho Trust &
Banking, and Mizuho SecuritiesMizuho Trust & Banking
Support for entrepreneurs working on the SDGsSDG-related open innovationPlatform creation
Cashless payments support
Public-private partnership projects support
Business succession support
Support for real estate development aligned with ESG factors, real estate brokerage
total: ¥25 trillion(of which the target for environmental finance is ¥12 trillion)
Sustainable finance & Environmental finance targets:
FY2019 - FY2030
Sustainable finance & Environmental finance results
FY2019 results
total: ¥2.4 trillion(of which, ¥1.1 trillion in environmental finance)
Primary Key Sustainability Areas referenced
Environmental considerations Sound economic growth Industry development & innovation
Applicable finance areas
Finance for clients where the intended use of funds is environmental and/or social projects
Financing to support and facilitate clients’ response to ESG/SDG-related areas, including financing requiring clients to meet certain related conditions, and providing consulting and assessment of clients’ response to ESG/SDG-related areas
Applicable business areas Loans, underwriting, investments, asset management
Sustainable finance and environmental financeIn line with our key sustainability areas, we have defined sustainable finance and environmental finance for Mizuho and set long-term targets looking towards 2030, the SDGs target year. This is allowing us to proactively fulfill our role in directing capital towards environmental protection and the achievement of the SDGs.
Mapping out our sustainable solutionsAs a financial services group, Mizuho provides a wide range of solutions to our corporate clients, extending from finance to consulting, support for solving social issues, and provision of asset management and products.
Our definition of sustainable finance and environmental finance
Japan:
59%
Environmental finance:
21%
Environmental finance:
25%
Outside Japan:
41%
602020 Integrated Report
Our strategies for creating value Sustainability
016_7080585842009.indd 60 2020/09/15 16:42:26
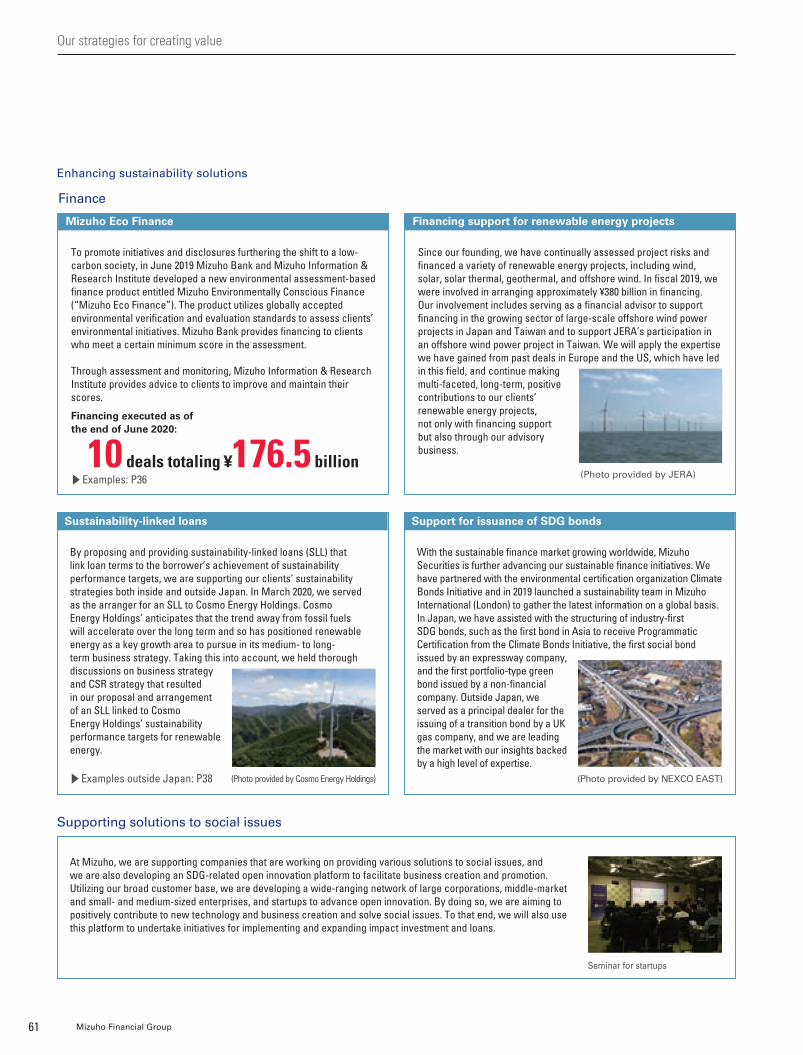
Mizuho Eco Finance
To promote initiatives and disclosures furthering the shift to a low-carbon society, in June 2019 Mizuho Bank and Mizuho Information & Research Institute developed a new environmental assessment-based finance product entitled Mizuho Environmentally Conscious Finance (“Mizuho Eco Finance”). The product utilizes globally accepted environmental verification and evaluation standards to assess clients’ environmental initiatives. Mizuho Bank provides financing to clients who meet a certain minimum score in the assessment.
Through assessment and monitoring, Mizuho Information & Research Institute provides advice to clients to improve and maintain their scores.
At Mizuho, we are supporting companies that are working on providing various solutions to social issues, and we are also developing an SDG-related open innovation platform to facilitate business creation and promotion. Utilizing our broad customer base, we are developing a wide-ranging network of large corporations, middle-market and small- and medium-sized enterprises, and startups to advance open innovation. By doing so, we are aiming to positively contribute to new technology and business creation and solve social issues. To that end, we will also use this platform to undertake initiatives for implementing and expanding impact investment and loans.
Finance
Supporting solutions to social issues
Financing support for renewable energy projects
Since our founding, we have continually assessed project risks and financed a variety of renewable energy projects, including wind, solar, solar thermal, geothermal, and offshore wind. In fiscal 2019, we were involved in arranging approximately ¥380 billion in financing. Our involvement includes serving as a financial advisor to support financing in the growing sector of large-scale offshore wind power projects in Japan and Taiwan and to support JERA’s participation in an offshore wind power project in Taiwan. We will apply the expertise we have gained from past deals in Europe and the US, which have led in this field, and continue making multi-faceted, long-term, positive contributions to our clients’ renewable energy projects, not only with financing support but also through our advisory business.
Support for issuance of SDG bonds
With the sustainable finance market growing worldwide, Mizuho Securities is further advancing our sustainable finance initiatives. We have partnered with the environmental certification organization Climate Bonds Initiative and in 2019 launched a sustainability team in Mizuho International (London) to gather the latest information on a global basis. In Japan, we have assisted with the structuring of industry-first SDG bonds, such as the first bond in Asia to receive Programmatic Certification from the Climate Bonds Initiative, the first social bond issued by an expressway company, and the first portfolio-type green bond issued by a non-financial company. Outside Japan, we served as a principal dealer for the issuing of a transition bond by a UK gas company, and we are leading the market with our insights backed by a high level of expertise.
Sustainability-linked loans
By proposing and providing sustainability-linked loans (SLL) that link loan terms to the borrower’s achievement of sustainability performance targets, we are supporting our clients’ sustainability strategies both inside and outside Japan. In March 2020, we served as the arranger for an SLL to Cosmo Energy Holdings. Cosmo Energy Holdings’ anticipates that the trend away from fossil fuels will accelerate over the long term and so has positioned renewable energy as a key growth area to pursue in its medium- to long-term business strategy. Taking this into account, we held thorough discussions on business strategy and CSR strategy that resulted in our proposal and arrangement of an SLL linked to Cosmo Energy Holdings’ sustainability performance targets for renewable energy.
Financing executed as of the end of June 2020:
10 deals totaling ¥176.5 billion
Enhancing sustainability solutions
(Photo provided by JERA)
(Photo provided by Cosmo Energy Holdings) (Photo provided by NEXCO EAST)
Seminar for startups
Examples: P36
Examples outside Japan: P38
61 Mizuho Financial Group
Our strategies for creating value
016_7080585842009.indd 61 2020/09/15 16:42:27

In the Asset Management Company, we are engaging in constructive, purposeful dialogue (engagement) with the companies in which we invest. In addition to supporting improvements in these companies’ corporate value and supporting sustainable growth for society, we are also pursuing ESG investment, making investment decisions with not only financial information but also ESG factors and other types of non-financial information. For example, we are offering ESG investment products, such as those using our ESG Low Volatility High Dividend Payment Strategy, in which we select stocks from an ESG perspective with a focus on dividend yields and low volatility and aim to produce stable returns, and our Sustainability Research Strategy, in which we consider positive contributions to solving social issues as revenue opportunities and employ selective investment.
Going forward, we will continue to practice ESG investment, with the goal of creating a positive cycle for society’s sustainable development.
Research & Consulting
Investment and products: ESG investment
Sustainability Promotion Project
In the Research & Consulting Unit, we have always offered expert insight into sustainability, as demonstrated by our extensive record of consulting in the field of energy and the environment. However, our insights tended to remain scattered within the unit across different entities, and we were looking to improve internal sharing of information and coordination on deals.
To solve this issue and support Mizuho in responding as a united group to clients’ varied sustainable business needs, beginning with the SDGs and ESG issues, in 2020 we launched the Sustainability Promotion Project.
The Sustainability Promotion Project is deepening the collaboration within the unit in both the research and consulting fields and, in doing so, enhancing and promoting our sustainable business initiatives, such as expanding the areas in which we can serve clients.
In terms of research collaboration, we are focusing on output usable in consulting and coordination among in-house companies, and we have formed a Task Force on Climate Change Research. In terms of consulting collaboration, we have taken client needs into account and launched a Task Force on Environmental Issues and a Task Force on Corporate/Business Strategy to make positive contributions to business through consulting.
The Task Force on Climate Change Research is composed of employees from Mizuho Research Institute and Mizuho Bank’s Industry Research Department and is researching climate change impacts from macroeconomic and industrial perspectives. The task force’s work is furthering initiatives that support Mizuho’s management and business. In June 2020, the task force published a One Think Tank Report on the true nature and future of climate change issues, discussing the unprecedented changes that interactions between various actors are driving in the business environment.
The Task Force on Environmental Issues is composed of members from Mizuho Information & Research Institute and Mizuho Trust & Banking’s Corporate Strategy Advisory Department and is focusing on business collaboration for the environment, with consulting as a starting point. The Task Force on Corporate/Business Strategy is composed of members from Mizuho Research Institute and Mizuho Information & Research Institute and is focusing on co-creation of value, beginning with consulting to promote incorporating the SDGs in corporate management.
622020 Integrated Report
Needs
Information sharing
Deal collaboration
Information and servicesFoundations for subsequent business
Clients
Task Force on Corporate/ Business Strategy
Task Force on Environmental Issues
Task Force on Climate Change Research
Consulting collaboration
Research collaboration
In-house companies, units,
and groupsManagementMizuho
Liaison functions (coordinating with Corporate Strategy Advisory Department)
Our strategies for creating value Sustainability
Secr
etar
iat
016_7080585842009.indd 62 2020/09/15 16:42:27
Establishment of Environmental Policy and enhancement of group-wide promotion structure
We conduct business activities and operations based on the Mizuho Code of Conduct to put the tenets of our Corporate Identity into practice, and the Code of Conduct states: “We will act independently and proactively with the awareness that environmental initiatives represent an essential precondition for the existence and activities of our company.”
Establishing our Environmental Policy alongside our Human Rights Policy under the Mizuho Code of Conduct in April 2020 clarified our stance on climate change as well as our environmental awareness and specific actions that we will take on environmental initiatives including those targeting climate change as we work toward transitioning to a low-carbon society. The Environmental Policy clearly states that oversight is provided by the Board of Directors, and in addition to building a strong corporate governance system that promotes environmental initiatives as an integral part of our strategy, Mizuho group companies will establish similar policies to enable us to engage in consistent environmental initiatives on a group-wide basis.
Efforts to address climate change
We recognize climate change as one of the most crucial global issues with the potential to impact the stability of financial markets, representing a threat to the environment, society, people’s lifestyles, and businesses.
At the same time, we believe there are new business opportunities arising from the need to transition to a low-carbon society, such as the field of renewable energy and other businesses and innovations which contribute to mitigating and adapting to the impact of climate change.
In light of this, we have included responding to climate change as a key pillar of our business strategy and will take the following actions in order to proactively fulfill our role as a financial services group in the effort to achieve a low-carbon society by 2050.
We will engage in proactive, constructive dialogue in response to our clients’ individual concerns and needs, and in support of their efforts to introduce climate change countermeasures and transition to a low-carbon society in both the medium and long term.
We will proactively develop and offer financial products and services designed to support clients’ efforts to introduce climate change countermeasures and transition to a low-carbon society.
We understand the importance of climate-related financial disclosures and we utilize the framework under the Recommendations of the TCFD in order to leverage growth opportunities and strengthen risk management as well as disclose information in a transparent manner regarding our progress.
At Mizuho, we have supported the intent and aims of the Task Force on Climate-related Financial Disclosures (TCFD)* Recommendations since 2017, and we are working to engage in initiatives and enhance disclosures in accordance with the recommendations. Based on our awareness that climate change is one of the most crucial global issues having the potential to impact the stability of financial markets, we have positioned addressing environmental issues and climate change as a key part of our corporate strategy and have bolstered the following initiatives as a result of numerous discussions at bodies including the Executive Management Committee, Risk Committee, and the Board of Directors.* A task force led by representatives of the private sector, established in December 2015 based on recommendations from the Financial Stability Board in order to enhance the availability of corporate
information related to climate change; issued final report (recommendations) in 2017.
63 Mizuho Financial Group
Establishment of Environmental Policy and enhancement of group-wide promotion structure
Support for clients’ environmental and climate change initiatives P59 to 62 Scenario analysis based on TCFD Recommendations
Strengthening the management of climate change risks Management of top risks Responsible investment and financing P57 to 58
Setting of targets pertaining to risks and opportunities P57, 60
Environmental and climate change measures
Governance
Governance
Strategy
Indicators and targets
Our strategies for creating value
Risk management
Stren
gthen
ing di
sclos
ure
016_7080585842009.indd 63 2020/09/15 16:42:27
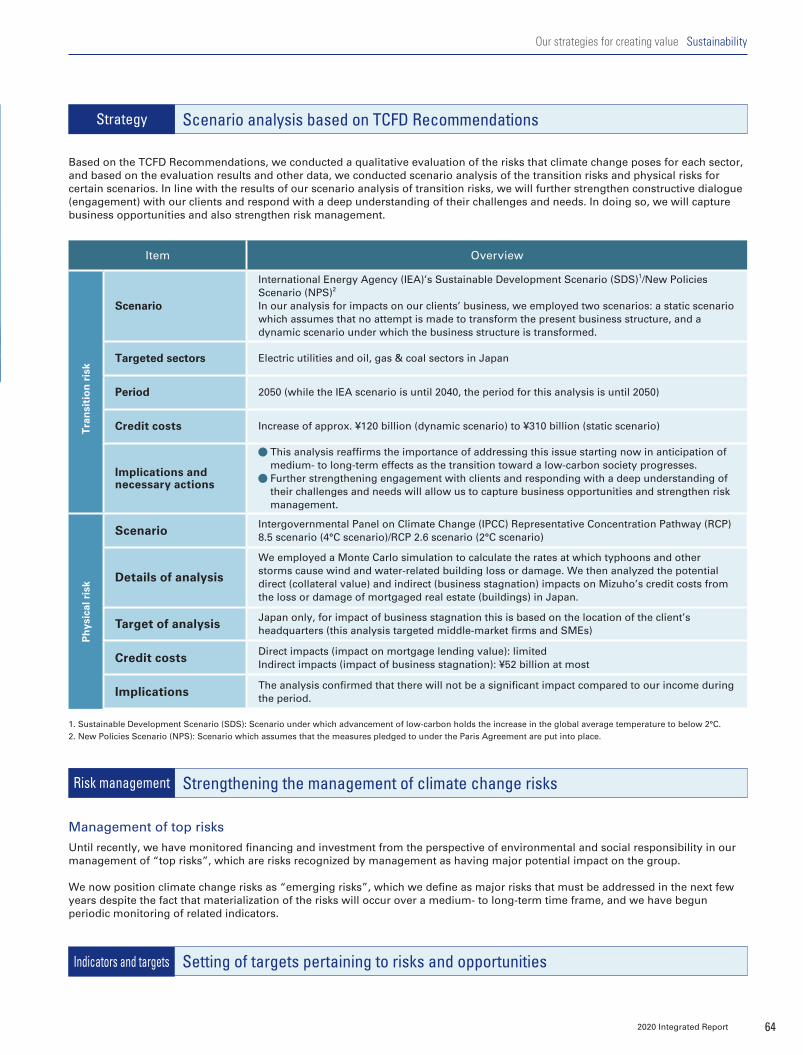
1. Sustainable Development Scenario (SDS): Scenario under which advancement of low-carbon holds the increase in the global average temperature to below 2°C.2. New Policies Scenario (NPS): Scenario which assumes that the measures pledged to under the Paris Agreement are put into place.
Item Overview
Scenario
International Energy Agency (IEA)’s Sustainable Development Scenario (SDS)1/New Policies Scenario (NPS)2
In our analysis for impacts on our clients’ business, we employed two scenarios: a static scenario which assumes that no attempt is made to transform the present business structure, and a dynamic scenario under which the business structure is transformed.
Targeted sectors Electric utilities and oil, gas & coal sectors in Japan
Period 2050 (while the IEA scenario is until 2040, the period for this analysis is until 2050)
Credit costs Increase of approx. ¥120 billion (dynamic scenario) to ¥310 billion (static scenario)
Implications and necessary actions
This analysis reaffirms the importance of addressing this issue starting now in anticipation of medium- to long-term effects as the transition toward a low-carbon society progresses.
Further strengthening engagement with clients and responding with a deep understanding of their challenges and needs will allow us to capture business opportunities and strengthen risk management.
Scenario Intergovernmental Panel on Climate Change (IPCC) Representative Concentration Pathway (RCP) 8.5 scenario (4°C scenario)/RCP 2.6 scenario (2°C scenario)
Details of analysis
We employed a Monte Carlo simulation to calculate the rates at which typhoons and other storms cause wind and water-related building loss or damage. We then analyzed the potential direct (collateral value) and indirect (business stagnation) impacts on Mizuho’s credit costs from the loss or damage of mortgaged real estate (buildings) in Japan.
Target of analysis Japan only, for impact of business stagnation this is based on the location of the client’s headquarters (this analysis targeted middle-market firms and SMEs)
Credit costs Direct impacts (impact on mortgage lending value): limitedIndirect impacts (impact of business stagnation): ¥52 billion at most
Implications The analysis confirmed that there will not be a significant impact compared to our income during the period.
Tra
nsi
tio
n r
isk
Ph
ysic
al r
isk
642020 Integrated Report
Management of top risksUntil recently, we have monitored financing and investment from the perspective of environmental and social responsibility in our management of “top risks”, which are risks recognized by management as having major potential impact on the group.
We now position climate change risks as “emerging risks”, which we define as major risks that must be addressed in the next few years despite the fact that materialization of the risks will occur over a medium- to long-term time frame, and we have begun periodic monitoring of related indicators.
Strengthening the management of climate change risksRisk management
Based on the TCFD Recommendations, we conducted a qualitative evaluation of the risks that climate change poses for each sector, and based on the evaluation results and other data, we conducted scenario analysis of the transition risks and physical risks for certain scenarios. In line with the results of our scenario analysis of transition risks, we will further strengthen constructive dialogue (engagement) with our clients and respond with a deep understanding of their challenges and needs. In doing so, we will capture business opportunities and also strengthen risk management.
Scenario analysis based on TCFD RecommendationsStrategy
Setting of targets pertaining to risks and opportunitiesIndicators and targets
Our strategies for creating value Sustainability
016_7080585842009.indd 64 2020/09/15 16:42:27
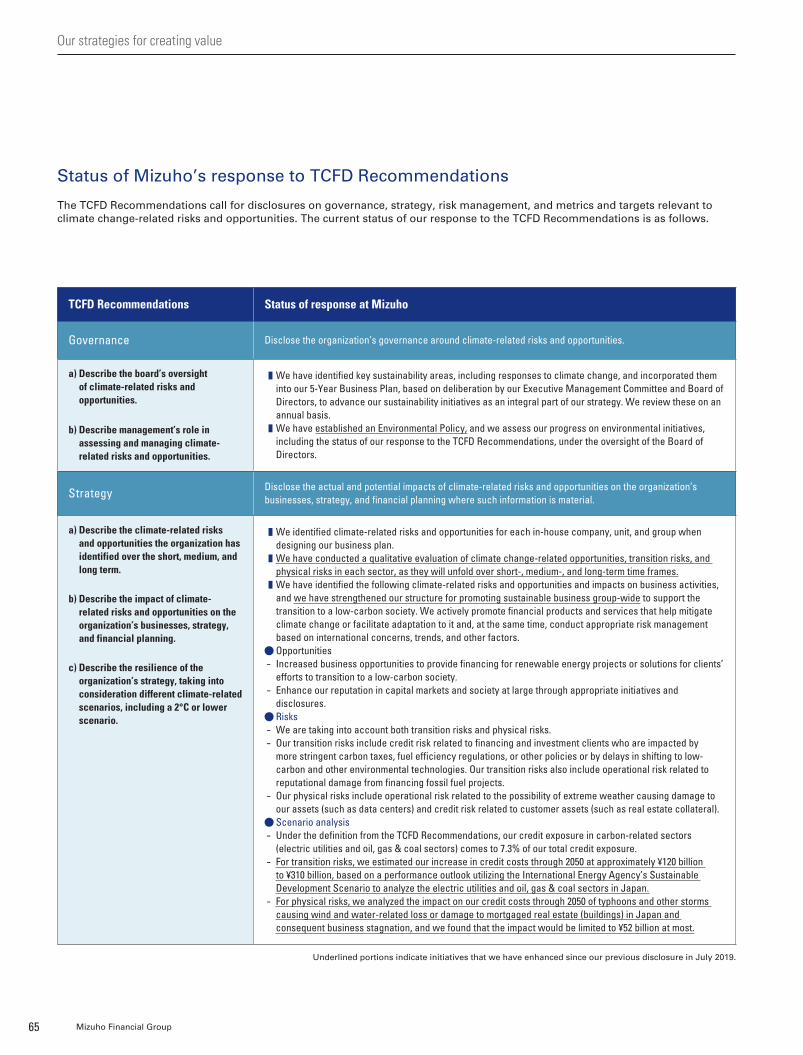
Status of Mizuho’s response to TCFD Recommendations
The TCFD Recommendations call for disclosures on governance, strategy, risk management, and metrics and targets relevant to climate change-related risks and opportunities. The current status of our response to the TCFD Recommendations is as follows.
TCFD Recommendations Status of response at Mizuho
Governance Disclose the organization’s governance around climate-related risks and opportunities.
a) Describe the board’s oversight of climate-related risks and opportunities.
We have identified key sustainability areas, including responses to climate change, and incorporated them into our 5-Year Business Plan, based on deliberation by our Executive Management Committee and Board of Directors, to advance our sustainability initiatives as an integral part of our strategy. We review these on an annual basis.
We have established an Environmental Policy, and we assess our progress on environmental initiatives, including the status of our response to the TCFD Recommendations, under the oversight of the Board of Directors.
b) Describe management’s role in assessing and managing climate-related risks and opportunities.
Strategy Disclose the actual and potential impacts of climate-related risks and opportunities on the organization’s businesses, strategy, and financial planning where such information is material.
a) Describe the climate-related risks and opportunities the organization has identified over the short, medium, and long term.
We identified climate-related risks and opportunities for each in-house company, unit, and group when designing our business plan.
We have conducted a qualitative evaluation of climate change-related opportunities, transition risks, and physical risks in each sector, as they will unfold over short-, medium-, and long-term time frames.
We have identified the following climate-related risks and opportunities and impacts on business activities, and we have strengthened our structure for promoting sustainable business group-wide to support the transition to a low-carbon society. We actively promote financial products and services that help mitigate climate change or facilitate adaptation to it and, at the same time, conduct appropriate risk management based on international concerns, trends, and other factors.
Opportunities- Increased business opportunities to provide financing for renewable energy projects or solutions for clients’
efforts to transition to a low-carbon society.- Enhance our reputation in capital markets and society at large through appropriate initiatives and
disclosures. Risks
- We are taking into account both transition risks and physical risks.- Our transition risks include credit risk related to financing and investment clients who are impacted by
more stringent carbon taxes, fuel efficiency regulations, or other policies or by delays in shifting to low-carbon and other environmental technologies. Our transition risks also include operational risk related to reputational damage from financing fossil fuel projects.
- Our physical risks include operational risk related to the possibility of extreme weather causing damage to our assets (such as data centers) and credit risk related to customer assets (such as real estate collateral).
Scenario analysis- Under the definition from the TCFD Recommendations, our credit exposure in carbon-related sectors
(electric utilities and oil, gas & coal sectors) comes to 7.3% of our total credit exposure.- For transition risks, we estimated our increase in credit costs through 2050 at approximately ¥120 billion
to ¥310 billion, based on a performance outlook utilizing the International Energy Agency’s Sustainable Development Scenario to analyze the electric utilities and oil, gas & coal sectors in Japan.
- For physical risks, we analyzed the impact on our credit costs through 2050 of typhoons and other storms causing wind and water-related loss or damage to mortgaged real estate (buildings) in Japan and consequent business stagnation, and we found that the impact would be limited to ¥52 billion at most.
b) Describe the impact of climate-related risks and opportunities on the organization’s businesses, strategy, and financial planning.
c) Describe the resilience of the organization’s strategy, taking into consideration different climate-related scenarios, including a 2°C or lower scenario.
Underlined portions indicate initiatives that we have enhanced since our previous disclosure in July 2019.
65 Mizuho Financial Group
Our strategies for creating value
016_7080585842009.indd 65 2020/09/15 16:42:27

Publication of first TCFD Report
In May 2020, we published our first TCFD Report, compiling more detailed information
in line with the TCFD Recommendations. Going forward, we will work to further
enhance our disclosures while utilizing international disclosure frameworks.
https://www.mizuho-fg.com/csr/mizuhocsr/report/index.html
TCFD Recommendations Status of response at Mizuho
Risk Management Disclose how the organization identifies, assesses, and manages climate-related risks.
a) Describe the organization’s processes for identifying and assessing climate-related risks.
Identification of climate change risks and integration with comprehensive risk management- By identifying physical and transition risks resulting from climate change and integrating them into our
overall risk management framework for credit, operational, and other types of risk, we are ensuring comprehensive risk management.
Management of top risks- Until recently, we have monitored financing and investment from the perspective of environmental and
social responsibility in our management of “top risks”, which are risks recognized by management as having major potential impact on the group. We now position climate change risks as “emerging risks”, which we define as major risks that must be addressed in the next few years despite the fact that materialization of the risks will occur over a medium- to long-term time frame, and we have begun periodic monitoring of related indicators.
Reviewing our policies in light of climate change risks- We managed relevant risks through reviewing our Environmental and Social Management Policy for
Financing and Investment Activity (e.g. tightening our policy on coal-fired power generation), conducting due diligence based on the Equator Principles, and through engagement with clients.
b) Describe the organization’s processes for managing climate-related risks.
c) Describe how processes for identifying, assessing, and managing climate-related risks are integrated into the organization’s overall risk management.
Metrics and Targets Disclose the metrics and targets used to assess and manage relevant climate-related risks and opportunities where such information is material.
a) Disclose the metrics used by the organization to assess climate-related risks and opportunities in line with its strategy and risk management process.
Targets- Sustainable finance & Environmental finance targets - Target to reduce the outstanding credit balance for coal-fired power generation facilities- Target to reduce our own environmental footprint
Monitoring indicators- Scope 1 (direct) and Scope 2 (indirect) CO2 emissions and energy usage; Scope 3 (business travel) CO2
emissions and environmental footprint from new large-scale power generation projects (amount of contribution to CO2 emissions)
- Environmental conservation associated with new large-scale power generation projects (amount of contribution to CO2 emission reductions)
We are also continuing discussions on Science Based Targets (SBTs), including participating in the SBTi road testing for financial institutions where we provided opinions on issues with SBT setting methods.
b) Disclose Scope 1, Scope 2, and, if appropriate, Scope 3 greenhouse gas (GHG) emissions, and the related risks.
c) Describe the targets used by the organization to manage climate-related risks and opportunities and performance against targets.
Underlined portions indicate initiatives that we have enhanced since our previous disclosure in July 2019.
662020 Integrated Report
Our strategies for creating value Sustainability
016_7080585842009.indd 66 2020/09/15 16:42:27

090_7080587452009.indd 全ページ 2020/08/11 11:17:47090_7080587452009.indd 全ページ 2020/08/11 11:17:47
Mizuho Financial Group67
010_7080587452009.indd 67 2020/09/15 16:57:53
090_7080587452009.indd 全ページ 2020/08/11 11:17:47090_7080587452009.indd 全ページ 2020/08/11 11:17:47
Corporate governance �����������P. 69Dialogue between the Group CEO and Chairman of the Board of Directors ���P. 79Risk governance ���������������P. 83Compliance ������������������P. 89Fiduciary duties ����������������P. 92Compliance with international financial regulations �������������P. 93Stakeholder communication �������P. 94
Foundations for our corporate value
2020 Integrated Report 68
010_7080587452009.indd 68 2020/09/15 16:57:53

Basic policy regarding Mizuho Financial Group’s corporate governance system
Compliance with Japan’s Corporate Governance CodeOur Corporate Governance Guidelines set out the fundamental perspectives regarding corporate governance at Mizuho, and the framework of the corporate governance system, including the roles, composition, and governing policies regarding the Board of Directors, executive officers, Nominating Committee, Compensation Committee, and Audit Committee for Mizuho Financial Group as a Company with Three Committees.
In addition, the Corporate Governance Report, which sets out the status of the corporate governance system of the group, is submitted to the TSE and posted on the websites of the TSE and Mizuho Financial Group.
Corporate Governance Report
https://www.mizuho-fg.com/company/structure/governance/pdf/g_report.pdf
Corporate Governance Guidelines
https://www.mizuho-fg.com/company/structure/governance/pdf/g_guideline.pdf
As the group’s holding company, Mizuho Financial Group is conducting management that contributes to the creation of value for our diverse stakeholders, realizing improved corporate value for the group through continuous and stable corporate growth, and as a result, contributing to economic and industrial development and the prosperity of society inside and outside of Japan. With this goal, we have established our corporate governance system with the Board of Directors at its core, and are working to further enhance our corporate governance.
Secure the effectiveness of corporate governance by ensuring the separation of supervision and management and making supervision of the management, such as the execution of duties by executive officers, the primary focus of the Board of Directors
At the holding company level, actively adopting operations and global best practices regarding corporate governance
Ensuring the separation of supervision and management
Make it possible for the management to make swift and flexible decisions and realize expeditious corporate management by enabling the Board of Directors to delegate decisions regarding business execution to the executive officers
Delegating decisions on business execution to the executive officers
Utilize committees and other forms of oversight, comprised mainly of outside directors who are not members of the management of Mizuho, and secure transparency and fairness in decision-making processes regarding the appointment and dismissal of, and compensation for, the management as well as ensure effective supervision of the management
Securing independence of management supervision
Adopting global standards
Principal features of Mizuho Financial Group’s corporate governance system
Adopted a Company with Three Committees model of corporate governanceThis structure consists of a Board of Directors, Nominating Committee, Compensation Committee, and Audit Committee, and enables executive officers to perform their duties most effectively.
The members of the Nominating Committee and the Compensation Committee shall all be outside directors.
Appropriate disclosure in line with Japan’s Corporate Governance Code
The chairman of the Board of Directors shall be an outside director.
The Chairmen of the Nominating, Compensation, and Audit Committees shall be outside directors.Decision-making regarding the appointment and dismissal of, and compensation for, the management is primarily conducted by outside directors.
Organizational structure Fairness and transparency
Mizuho Financial Group69
Corporate governance
Foundations for our corporate value
010_7080587452009.indd 69 2020/09/15 16:57:53
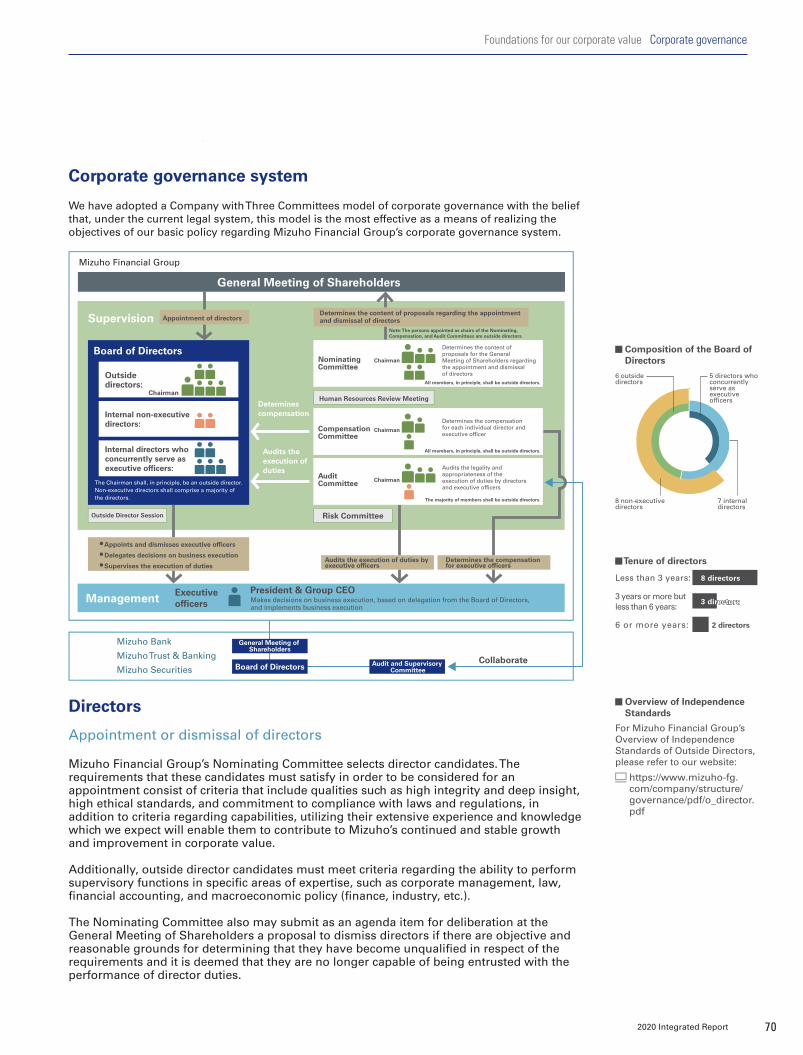
Corporate governance system
We have adopted a Company with Three Committees model of corporate governance with the belief that, under the current legal system, this model is the most effective as a means of realizing the objectives of our basic policy regarding Mizuho Financial Group’s corporate governance system.
Directors
Appointment or dismissal of directors
Mizuho Financial Group’s Nominating Committee selects director candidates. The requirements that these candidates must satisfy in order to be considered for an appointment consist of criteria that include qualities such as high integrity and deep insight, high ethical standards, and commitment to compliance with laws and regulations, in addition to criteria regarding capabilities, utilizing their extensive experience and knowledge which we expect will enable them to contribute to Mizuho’s continued and stable growth and improvement in corporate value.
Additionally, outside director candidates must meet criteria regarding the ability to perform supervisory functions in specific areas of expertise, such as corporate management, law, financial accounting, and macroeconomic policy (finance, industry, etc.).
The Nominating Committee also may submit as an agenda item for deliberation at the General Meeting of Shareholders a proposal to dismiss directors if there are objective and reasonable grounds for determining that they have become unqualified in respect of the requirements and it is deemed that they are no longer capable of being entrusted with the performance of director duties.
Overview of Independence Standards
For Mizuho Financial Group’s Overview of Independence Standards of Outside Directors, please refer to our website:
https://www.mizuho-fg.com/company/structure/governance/pdf/o_director.pdf
Management
Supervision Appointment of directors
Chairman
Chairman
Chairman
Chairman
Board of Directors
General Meeting of Shareholders
General Meeting of Shareholders
Nominating Committee
Board of Directors
Executive officers
Determines the content of proposals for the General Meeting of Shareholders regarding the appointment and dismissal of directors
All members, in principle, shall be outside directors.
Note: The persons appointed as chairs of the Nominating, Compensation, and Audit Committees are outside directors.
All members, in principle, shall be outside directors.
The Chairman shall, in principle, be an outside director.Non-executive directors shall comprise a majority of the directors.
Outside directors:
Internal non-executive directors:
Internal directors who concurrently serve as executive officers:
Outside Director Session
Makes decisions on business execution, based on delegation from the Board of Directors, and implements business execution
President & Group CEO
Audits the execution of duties
Audit Committee
Audits the legality and appropriateness of the execution of duties by directors and executive officers
The majority of members shall be outside directors.
Compensation Committee
Determines the compensation for each individual director and executive officer
Human Resources Review Meeting
Audits the execution of duties by executive officers
Determines the compensation for executive officers
Risk Committee
Determines compensation
● Appoints and dismisses executive officers● Delegates decisions on business execution● Supervises the execution of duties
Determines the content of proposals regarding the appointment and dismissal of directors
Mizuho Bank
Mizuho Trust & Banking
Mizuho SecuritiesAudit and Supervisory
CommitteeCollaborate
Mizuho Financial Group
8 directors
3 years or more but less than 6 years:
Less than 3 years:
6 or more years:
3 directors
2 directors
Tenure of directors
Composition of the Board of Directors
6 outside directors
5 directors who concurrently serve as executive officers
7 internal directors
8 non-executive directors
2020 Integrated Report 70
Foundations for our corporate value Corporate governance
010_7080587452009.indd 70 2020/09/15 16:57:53

Director training
We provide our directors with opportunities to acquire and improve knowledge that is necessary to fulfill their expected roles and duties, at the time of appointment and continuously thereafter.
Improving understanding of the group’s financial and other businesses
• Intensive explanation at the time of appointment will be conducted individually for newly appointed outside directors.
– Explanations from executive officers in charge of different business areas and the General Manager of the Corporate Secretariat regarding Mizuho’s Corporate Identity, business domain, business strategy, business plan, finances, corporate governance system, etc.
Deepening understanding concerning Board of Directors’ proposals
• Providing for thorough explanations of Board of Directors’ proposals in advance and follow-up (after each Board meeting)
Improving communication at times other than the Board of Directors’ meetings
• Outside Director Session
– At which outside directors mutually exchange information and share their understanding while exchanging opinions on the progress of our 5-Year Business Plan and current management issues (held twice).
• Off-site meetings on management issues (held 14 times between April 2019 and March 2020)
• Lunches following the Board of Directors meetings and receptions and dinners for outside directors and executive officers
– Meetings to acquire necessary knowledge though the exchange of information with the internal directors
Other opportunities to acquire/enhance knowledge
• Watching the Group-wide General Managers’ Meeting
• On-site observations
– Interviews with branch managers and exchanges of opinions with employees conducted to deepen outside directors’ understanding of on-site circumstances
For more details please refer to P74.
Offering all directors opportunities for acquiring knowledge and self-improvement1
• Training is provided for newly appointed directors, mainly regarding the duties and responsibilities of directors, and is conducted by an outside instructor (lawyer).
• Directors gain an overall perspective of the management of the group by discussing various proposals, reports, and other activities in the Board of Directors’ meetings.
• Training is also held and conducted by an outside instructor regarding compliance and customer protection and awareness of human rights related issues.
• When necessary for the performance of duties, directors in charge of various areas make individual presentations; advice and instruction is provided by external specialists, and training is provided (at the company’s expense).
At the time of appointment Post-appointment (the examples below were conducted for fiscal 2019)
Opportunities to acquire and improve knowledge for outside directors2
Name Reason for appointment as an outside director
Three statutory committees
Fields where directors are especially expected to contribute*
Nominating Compensation Audit Corporate Management Law Financial
Accounting Finance Technology
Tetsuo Seki
Expected to contribute to (i) strengthening the effectiveness of both the decision-making and supervisory functions of Mizuho Financial Group’s Board of Directors and (ii) Mizuho Financial Group’s effort to further enhance internal control systems and group governance, leveraging his extensive experience and deep insight as a top executive.
Tatsuo Kainaka
Expected to contribute to (i) strengthening the effectiveness of both the decision-making and supervisory functions of Mizuho Financial Group’s Board of Directors and (ii) the further enhancement of the corporate governance, compliance, and risk management system of Mizuho Financial Group, leveraging his extensive experience, deep insight, and high level of expertise as a prosecutor, judge, and attorney-at-law.
Yoshimitsu
Kobayashi
Expected to contribute to strengthening the effectiveness of both the decision-making and supervisory functions of Mizuho Financial Group’s Board of Directors, leveraging his extensive experience as the CEO of a global company and his deep insight into corporate governance.
Ryoji Sato
Expected to contribute to strengthening the effectiveness of both the decision-making and supervisory functions of Mizuho Financial Group’s Board of Directors, leveraging his extensive experience, deep insight, and high level of expertise as a certified public accountant.
Masami
Yamamoto
Expected to contribute to strengthening the effectiveness of both the decision-making and supervisory functions of Mizuho Financial Group’s Board of Directors, leveraging his extensive experience as the CEO of a global company and his deep insight and expertise in technology fields.
Izumi Kobayashi
Expected to contribute to strengthening the effectiveness of both the decision-making and supervisory functions of Mizuho Financial Group’s Board of Directors, leveraging her extensive experience and deep insight as a representative director of both a Japan-based global financial institution and an international institution.
*The fields in the chart above are not representative of all of the areas of expertise the directors possess. Chairman
Outside directors
Outside directors and reason for their appointment
Mizuho Financial Group71
Foundations for our corporate value
010_7080587452009.indd 71 2020/09/15 16:57:53
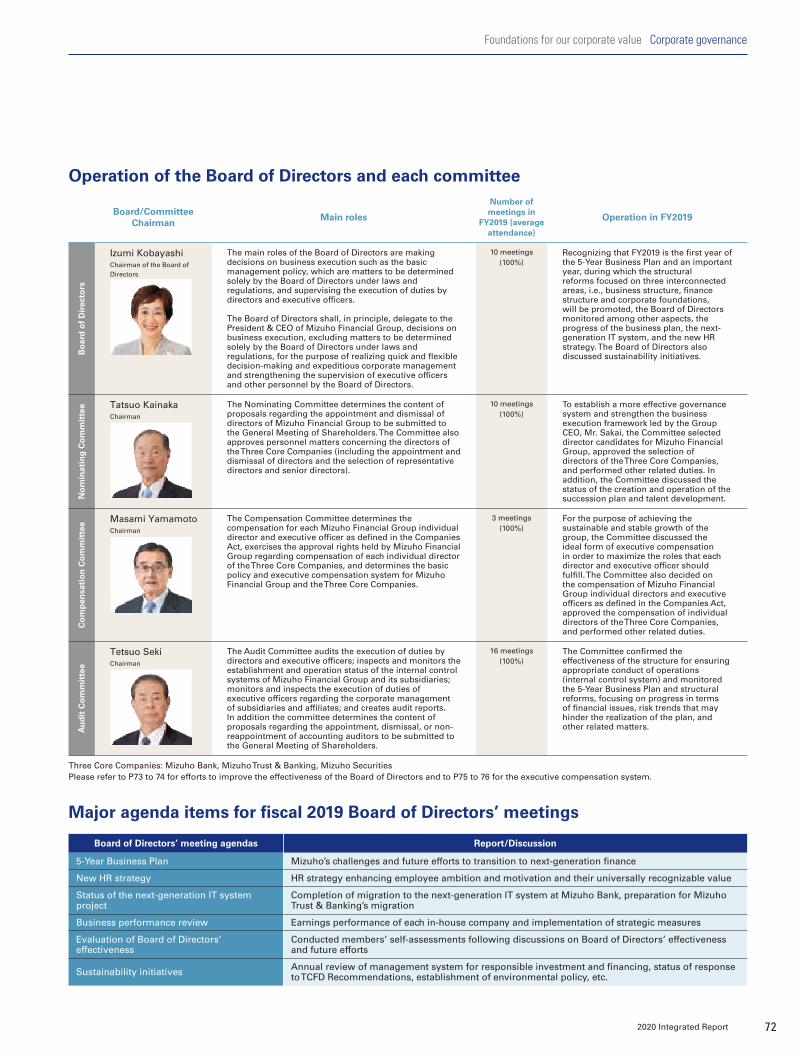
Board/Committee Chairman
Main roles
Number of meetings in
FY2019 (average attendance)
Operation in FY2019
Bo
ard
of
Dir
ecto
rs
Izumi KobayashiChairman of the Board of Directors
The main roles of the Board of Directors are making decisions on business execution such as the basic management policy, which are matters to be determined solely by the Board of Directors under laws and regulations, and supervising the execution of duties by directors and executive officers.
The Board of Directors shall, in principle, delegate to the President & CEO of Mizuho Financial Group, decisions on business execution, excluding matters to be determined solely by the Board of Directors under laws and regulations, for the purpose of realizing quick and flexible decision-making and expeditious corporate management and strengthening the supervision of executive officers and other personnel by the Board of Directors.
10 meetings (100%)
Recognizing that FY2019 is the first year of the 5-Year Business Plan and an important year, during which the structural reforms focused on three interconnected areas, i.e., business structure, finance structure and corporate foundations, will be promoted, the Board of Directors monitored among other aspects, the progress of the business plan, the next-generation IT system, and the new HR strategy. The Board of Directors also discussed sustainability initiatives.
No
min
atin
g C
om
mit
tee Tatsuo Kainaka
Chairman
The Nominating Committee determines the content of proposals regarding the appointment and dismissal of directors of Mizuho Financial Group to be submitted to the General Meeting of Shareholders. The Committee also approves personnel matters concerning the directors of the Three Core Companies (including the appointment and dismissal of directors and the selection of representative directors and senior directors).
10 meetings (100%)
To establish a more effective governance system and strengthen the business execution framework led by the Group CEO, Mr. Sakai, the Committee selected director candidates for Mizuho Financial Group, approved the selection of directors of the Three Core Companies, and performed other related duties. In addition, the Committee discussed the status of the creation and operation of the succession plan and talent development.
Co
mp
ensa
tio
n C
om
mit
tee Masami Yamamoto
Chairman
The Compensation Committee determines the compensation for each Mizuho Financial Group individual director and executive officer as defined in the Companies Act, exercises the approval rights held by Mizuho Financial Group regarding compensation of each individual director of the Three Core Companies, and determines the basic policy and executive compensation system for Mizuho Financial Group and the Three Core Companies.
3 meetings (100%)
For the purpose of achieving the sustainable and stable growth of the group, the Committee discussed the ideal form of executive compensation in order to maximize the roles that each director and executive officer should fulfill. The Committee also decided on the compensation of Mizuho Financial Group individual directors and executive officers as defined in the Companies Act, approved the compensation of individual directors of the Three Core Companies, and performed other related duties.
Au
dit
Co
mm
itte
e
Tetsuo SekiChairman
The Audit Committee audits the execution of duties by directors and executive officers; inspects and monitors the establishment and operation status of the internal control systems of Mizuho Financial Group and its subsidiaries; monitors and inspects the execution of duties of executive officers regarding the corporate management of subsidiaries and affiliates; and creates audit reports. In addition the committee determines the content of proposals regarding the appointment, dismissal, or non-reappointment of accounting auditors to be submitted to the General Meeting of Shareholders.
16 meetings (100%)
The Committee confirmed the effectiveness of the structure for ensuring appropriate conduct of operations (internal control system) and monitored the 5-Year Business Plan and structural reforms, focusing on progress in terms of financial issues, risk trends that may hinder the realization of the plan, and other related matters.
Three Core Companies: Mizuho Bank, Mizuho Trust & Banking, Mizuho SecuritiesPlease refer to P73 to 74 for efforts to improve the effectiveness of the Board of Directors and to P75 to 76 for the executive compensation system.
Operation of the Board of Directors and each committee
Board of Directors’ meeting agendas Report/Discussion
5-Year Business Plan Mizuho’s challenges and future efforts to transition to next-generation finance
New HR strategy HR strategy enhancing employee ambition and motivation and their universally recognizable value
Status of the next-generation IT system project
Completion of migration to the next-generation IT system at Mizuho Bank, preparation for Mizuho Trust & Banking’s migration
Business performance review Earnings performance of each in-house company and implementation of strategic measures
Evaluation of Board of Directors’ effectiveness
Conducted members’ self-assessments following discussions on Board of Directors’ effectiveness and future efforts
Sustainability initiatives Annual review of management system for responsible investment and financing, status of response to TCFD Recommendations, establishment of environmental policy, etc.
Major agenda items for fiscal 2019 Board of Directors’ meetings
2020 Integrated Report 72
Foundations for our corporate value Corporate governance
010_7080587452009.indd 72 2020/09/15 16:57:54
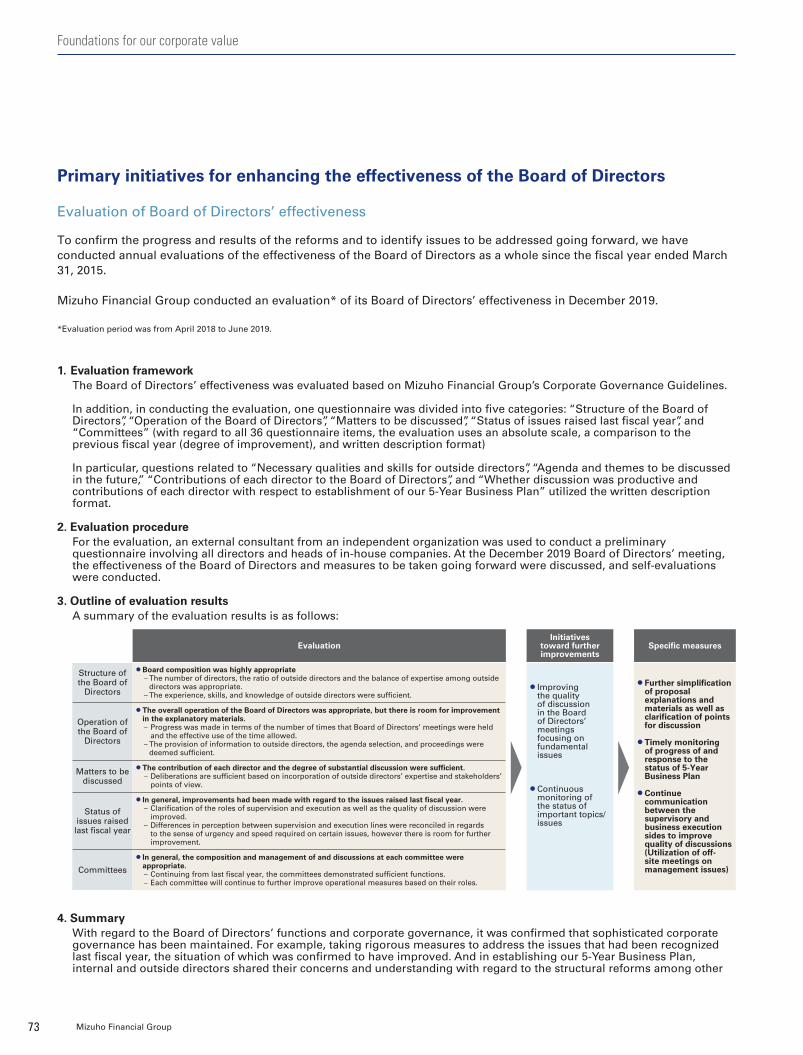
Primary initiatives for enhancing the effectiveness of the Board of Directors
Evaluation of Board of Directors’ effectiveness
To confirm the progress and results of the reforms and to identify issues to be addressed going forward, we have conducted annual evaluations of the effectiveness of the Board of Directors as a whole since the fiscal year ended March 31, 2015.
Mizuho Financial Group conducted an evaluation* of its Board of Directors’ effectiveness in December 2019.
*Evaluation period was from April 2018 to June 2019.
1. Evaluation framework The Board of Directors’ effectiveness was evaluated based on Mizuho Financial Group’s Corporate Governance Guidelines.
In addition, in conducting the evaluation, one questionnaire was divided into five categories: “Structure of the Board of Directors”, “Operation of the Board of Directors”, “Matters to be discussed”, “Status of issues raised last fiscal year”, and “Committees” (with regard to all 36 questionnaire items, the evaluation uses an absolute scale, a comparison to the previous fiscal year (degree of improvement), and written description format)
In particular, questions related to “Necessary qualities and skills for outside directors”, “Agenda and themes to be discussed in the future,” “Contributions of each director to the Board of Directors”, and “Whether discussion was productive and contributions of each director with respect to establishment of our 5-Year Business Plan” utilized the written description format.
2. Evaluation procedure For the evaluation, an external consultant from an independent organization was used to conduct a preliminary questionnaire involving all directors and heads of in-house companies. At the December 2019 Board of Directors’ meeting, the effectiveness of the Board of Directors and measures to be taken going forward were discussed, and self-evaluations were conducted.
3. Outline of evaluation resultsA summary of the evaluation results is as follows:
4. SummaryWith regard to the Board of Directors’ functions and corporate governance, it was confirmed that sophisticated corporate governance has been maintained. For example, taking rigorous measures to address the issues that had been recognized last fiscal year, the situation of which was confirmed to have improved. And in establishing our 5-Year Business Plan, internal and outside directors shared their concerns and understanding with regard to the structural reforms among other
EvaluationInitiatives
toward further improvements
Specific measures
Structure of the Board of
Directors
• Board composition was highly appropriate– The number of directors, the ratio of outside directors and the balance of expertise among outside
directors was appropriate. – The experience, skills, and knowledge of outside directors were sufficient.
• Improving the quality of discussion in the Board of Directors’ meetings focusing on fundamental issues
• Continuous monitoring of the status of important topics/issues
• Further simplification of proposal explanations and materials as well as clarification of points for discussion
• Timely monitoring of progress of and response to the status of 5-Year Business Plan
• Continue communication between the supervisory and business execution sides to improve quality of discussions (Utilization of off-site meetings on management issues)
Operation of the Board of
Directors
• The overall operation of the Board of Directors was appropriate, but there is room for improvement in the explanatory materials. – Progress was made in terms of the number of times that Board of Directors’ meetings were held
and the effective use of the time allowed.– The provision of information to outside directors, the agenda selection, and proceedings were
deemed sufficient.
Matters to be discussed
• The contribution of each director and the degree of substantial discussion were sufficient.– Deliberations are sufficient based on incorporation of outside directors’ expertise and stakeholders’
points of view.
Status of issues raised last fiscal year
• In general, improvements had been made with regard to the issues raised last fiscal year.– Clarification of the roles of supervision and execution as well as the quality of discussion were
improved. – Differences in perception between supervision and execution lines were reconciled in regards
to the sense of urgency and speed required on certain issues, however there is room for further improvement.
Committees • In general, the composition and management of and discussions at each committee were
appropriate.– Continuing from last fiscal year, the committees demonstrated sufficient functions. – Each committee will continue to further improve operational measures based on their roles.
Mizuho Financial Group73
Foundations for our corporate value
010_7080587452009.indd 73 2020/09/15 16:57:54
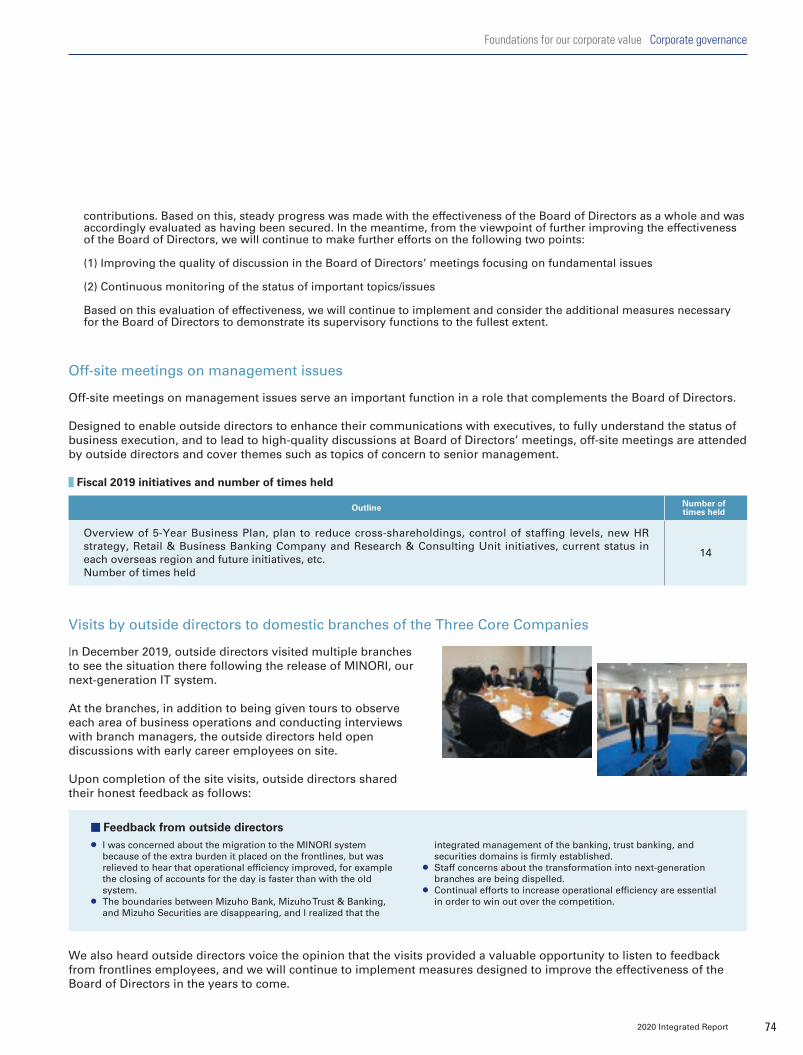
Off-site meetings on management issues
Off-site meetings on management issues serve an important function in a role that complements the Board of Directors.
Designed to enable outside directors to enhance their communications with executives, to fully understand the status of business execution, and to lead to high-quality discussions at Board of Directors’ meetings, off-site meetings are attended by outside directors and cover themes such as topics of concern to senior management.
Fiscal 2019 initiatives and number of times held
Outline Number of times held
Overview of 5-Year Business Plan, plan to reduce cross-shareholdings, control of staffing levels, new HR strategy, Retail & Business Banking Company and Research & Consulting Unit initiatives, current status in each overseas region and future initiatives, etc.Number of times held
14
Visits by outside directors to domestic branches of the Three Core Companies
In December 2019, outside directors visited multiple branches to see the situation there following the release of MINORI, our next-generation IT system.
At the branches, in addition to being given tours to observe each area of business operations and conducting interviews with branch managers, the outside directors held open discussions with early career employees on site.
Upon completion of the site visits, outside directors shared their honest feedback as follows:
integrated management of the banking, trust banking, and securities domains is firmly established.
• Staff concerns about the transformation into next-generation branches are being dispelled.
• Continual efforts to increase operational efficiency are essential in order to win out over the competition.
Feedback from outside directors
• I was concerned about the migration to the MINORI system because of the extra burden it placed on the frontlines, but was relieved to hear that operational efficiency improved, for example the closing of accounts for the day is faster than with the old system.
• The boundaries between Mizuho Bank, Mizuho Trust & Banking, and Mizuho Securities are disappearing, and I realized that the
We also heard outside directors voice the opinion that the visits provided a valuable opportunity to listen to feedback from frontlines employees, and we will continue to implement measures designed to improve the effectiveness of the Board of Directors in the years to come.
contributions. Based on this, steady progress was made with the effectiveness of the Board of Directors as a whole and was accordingly evaluated as having been secured. In the meantime, from the viewpoint of further improving the effectiveness of the Board of Directors, we will continue to make further efforts on the following two points:
(1) Improving the quality of discussion in the Board of Directors’ meetings focusing on fundamental issues
(2) Continuous monitoring of the status of important topics/issues
Based on this evaluation of effectiveness, we will continue to implement and consider the additional measures necessary for the Board of Directors to demonstrate its supervisory functions to the fullest extent.
2020 Integrated Report 74
Foundations for our corporate value Corporate governance
010_7080587452009.indd 74 2020/09/15 16:57:55
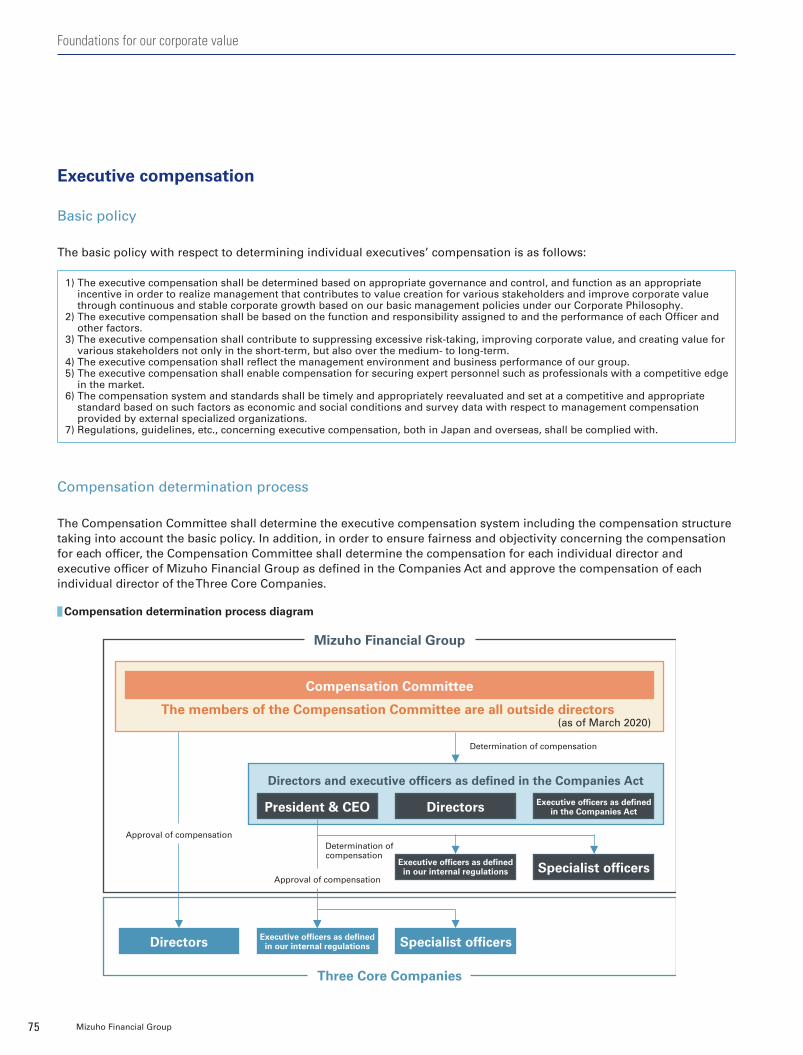
Executive compensation
Basic policy
The basic policy with respect to determining individual executives’ compensation is as follows:
1) The executive compensation shall be determined based on appropriate governance and control, and function as an appropriate incentive in order to realize management that contributes to value creation for various stakeholders and improve corporate value through continuous and stable corporate growth based on our basic management policies under our Corporate Philosophy.
2) The executive compensation shall be based on the function and responsibility assigned to and the performance of each Officer and other factors.
3) The executive compensation shall contribute to suppressing excessive risk-taking, improving corporate value, and creating value for various stakeholders not only in the short-term, but also over the medium- to long-term.
4) The executive compensation shall reflect the management environment and business performance of our group. 5) The executive compensation shall enable compensation for securing expert personnel such as professionals with a competitive edge
in the market. 6) The compensation system and standards shall be timely and appropriately reevaluated and set at a competitive and appropriate
standard based on such factors as economic and social conditions and survey data with respect to management compensation provided by external specialized organizations.
7) Regulations, guidelines, etc., concerning executive compensation, both in Japan and overseas, shall be complied with.
Compensation determination process
The Compensation Committee shall determine the executive compensation system including the compensation structure taking into account the basic policy. In addition, in order to ensure fairness and objectivity concerning the compensation for each officer, the Compensation Committee shall determine the compensation for each individual director and executive officer of Mizuho Financial Group as defined in the Companies Act and approve the compensation of each individual director of the Three Core Companies.
Compensation determination process diagram
Mizuho Financial Group
Three Core Companies
Determination of compensation
Directors and executive officers as defined in the Companies Act
President & CEO
Directors
Directors
Executive officers as defined in our internal regulations
Executive officers as defined in our internal regulations Specialist officers
Specialist officers
Compensation Committee
The members of the Compensation Committee are all outside directors (as of March 2020)
Approval of compensation
Approval of compensation
Determination of compensation
Executive officers as defined in the Companies Act
Mizuho Financial Group75
Foundations for our corporate value
010_7080587452009.indd 75 2020/09/15 16:57:55

Compensation system
Compensation for officers shall, in principle, consist of Base Salary, Performance Payments and Stock Compensation.
Compensation system for officers responsible for business execution1
In principle, compensation for officers responsible for business execution is composed of fixed compensation, consisting of a Base Salary and Stock Compensation I, and variable compensation, consisting of Performance Payments and Stock Compensation II.
Compensation system for non-executive officers responsible for management supervision
From the perspective of ensuring the effectiveness of the supervisory function, compensation for non-executive officers responsible for management supervision shall, in principle, be in the form of fixed compensation, consisting of Base Salary and Stock Compensation I. Such composition shall, in principle, be 85% and 15% for Base Salary and Stock Compensation I, respectively.
Fixe
d c
om
pen
sati
on
Var
iab
le C
om
pen
sati
on
Base Salary
Stock Compensation I
Stock Compensation II
PerformancePayments
Paid on a monthly basis
Payment at time of retirement
50.0%
15.0%
17.5%
Stock32.5%
Cash 67.5%
17.5%
Linked to status of achievement of 5-Year
Business Plan and other factors(e.g., Consolidated Net
Business Profits)0% to 130% of standard amount
for each position
Linked to performance of managed organization and
other factors0% to 170% of standard amount
for each position
Deferred payments over three
years
Eligible for certain
amount of deferred payment
Can be reduced or forfeited
depending on business performance
1. Directors, executive officers as defined in the Companies Act, executive officers as defined in our internal regulations, and specialist officers of Mizuho Financial Group, Mizuho Bank, Mizuho Trust & Banking, and Mizuho Securities
2. Payment of compensation may be designed individually, taking into consideration local compensation practices and the responsibilities, business characteristics, and market value, etc., of each respective officer.
2020 Integrated Report 76
Foundations for our corporate value Corporate governance
010_7080587452009.indd 76 2020/09/15 16:57:55

Hisaaki HiramaMember of the Board of DirectorsMember of the Audit Committee / Member of the Risk Committee
(Chairman)
Career highlights (entity)
General Manager of Accounting
Department (FG, BK, CB)
General Manager of Nagoya Corporate
Banking Department (BK)
Head of Internal Audit Group (BK)
g Izumi KobayashiOutside director
Chairman of the Board of DirectorsMember of the Nominating Committee / Member of the Risk Committee
Career highlights
President and Representative Director,
Merrill Lynch Japan Securities
Executive Vice President, the
Multilateral Investment Guarantee
Agency, the World Bank Group
h Satoshi IshiiMember of the Board of Directors Senior Managing Executive Officer(Representative Executive Officer) /Executive Officer in charge of Digital Innovation (CDIO), Head of IT Systems Group (Group CIO), and Head of Operations Group (Group COO)
Career highlights (entity)
Head of Human Resources Group
(FG, BK)
Head of Business Promotion (BK)
i
Internal director Outside director Director who concurrently serves as an executive officer
Non-executive director
For further details on the backgrounds of directors, please refer to our website:
https://www.mizuho-fg.com/company/info/executives/index.html
Tetsuo SekiOutside directorMember of the Nominating Committee / Member of the Compensation Committee /Member of the Audit Committee
(Chairman)
Career highlights
Representative Director and Executive
Vice President, Nippon Steel
President (Representative Director),
Shoko Chukin Bank
a Yoshimitsu KobayashiOutside directorMember of the Nominating Committee
Career highlights
President, Mitsubishi Chemical
Holdings
Chairperson, Mitsubishi Chemical
Holdings (current)
cYasuhiro SatoMember of the Board of DirectorsChairman (Kaicho)** Chairman (Kaicho) Sato engages in the company’s external activities, but does not chair the Board meetings. The Board meetings are chaired by the independent director chair, Ms. Kobayashi.
Career highlights (entity)
President & CEO (BK, CB)
President & Group CEO (FG)
b
a
bBoard of Directors
g
c
i
Newly appointed
h
Mizuho Financial Group77
Foundations for our corporate value
010_7080587452009.indd 77 2020/09/15 16:57:58
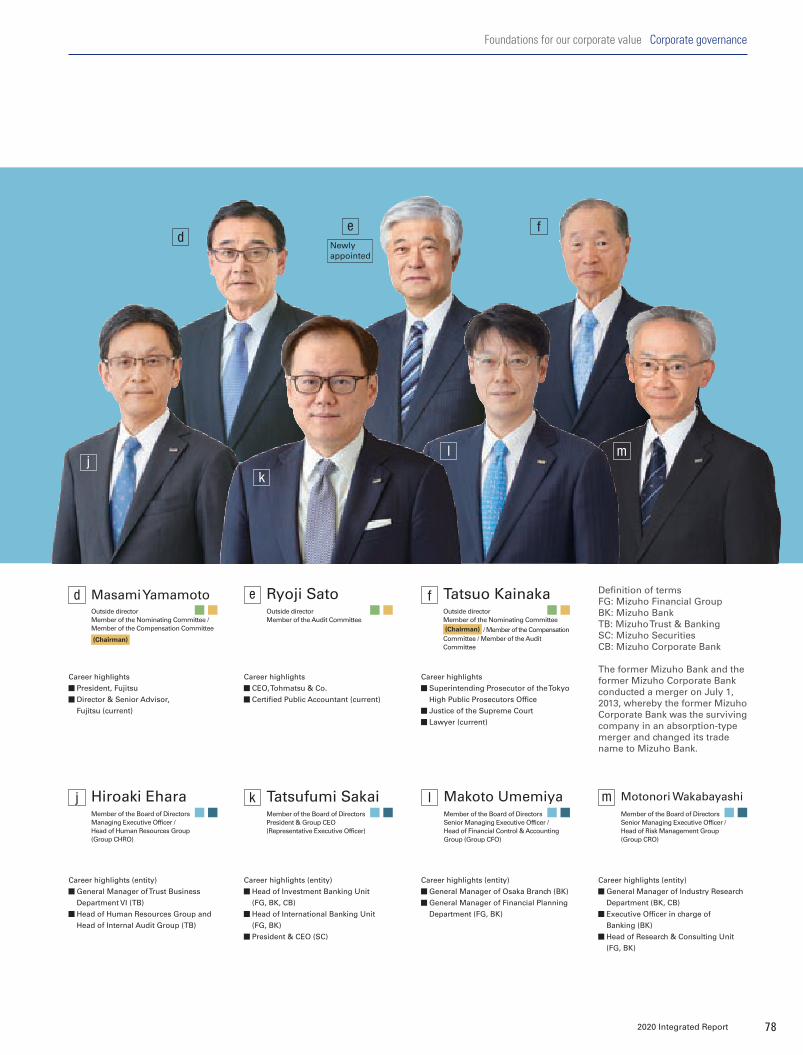
Career highlights (entity)
General Manager of Trust Business
Department VI (TB)
Head of Human Resources Group and
Head of Internal Audit Group (TB)
Hiroaki EharaMember of the Board of Directors Managing Executive Officer /Head of Human Resources Group (Group CHRO)
j Tatsufumi SakaiMember of the Board of DirectorsPresident & Group CEO(Representative Executive Officer)
Career highlights (entity)
Head of Investment Banking Unit
(FG, BK, CB)
Head of International Banking Unit
(FG, BK)
President & CEO (SC)
k Makoto UmemiyaMember of the Board of DirectorsSenior Managing Executive Officer / Head of Financial Control & Accounting Group (Group CFO)
Career highlights (entity)
General Manager of Osaka Branch (BK)
General Manager of Financial Planning
Department (FG, BK)
l
Career highlights (entity)
General Manager of Industry Research
Department (BK, CB)
Executive Officer in charge of
Banking (BK)
Head of Research & Consulting Unit
(FG, BK)
Motonori WakabayashiMember of the Board of Directors Senior Managing Executive Officer / Head of Risk Management Group (Group CRO)
m
Definition of termsFG: Mizuho Financial GroupBK: Mizuho BankTB: Mizuho Trust & BankingSC: Mizuho SecuritiesCB: Mizuho Corporate Bank
The former Mizuho Bank and the former Mizuho Corporate Bank conducted a merger on July 1, 2013, whereby the former Mizuho Corporate Bank was the surviving company in an absorption-type merger and changed its trade name to Mizuho Bank.
Masami YamamotoOutside directorMember of the Nominating Committee / Member of the Compensation Committee
(Chairman)
Career highlights
President, Fujitsu
Director & Senior Advisor,
Fujitsu (current)
d
d
m
fe
jl
Newly appointed
Ryoji SatoOutside directorMember of the Audit Committee
Career highlights
CEO, Tohmatsu & Co.
Certified Public Accountant (current)
e Tatsuo KainakaOutside directorMember of the Nominating Committee (Chairman) / Member of the Compensation
Committee / Member of the Audit Committee
Career highlights
Superintending Prosecutor of the Tokyo
High Public Prosecutors Office
Justice of the Supreme Court
Lawyer (current)
f
k
2020 Integrated Report 78
Foundations for our corporate value Corporate governance
010_7080587452009.indd 78 2020/09/15 16:58:02
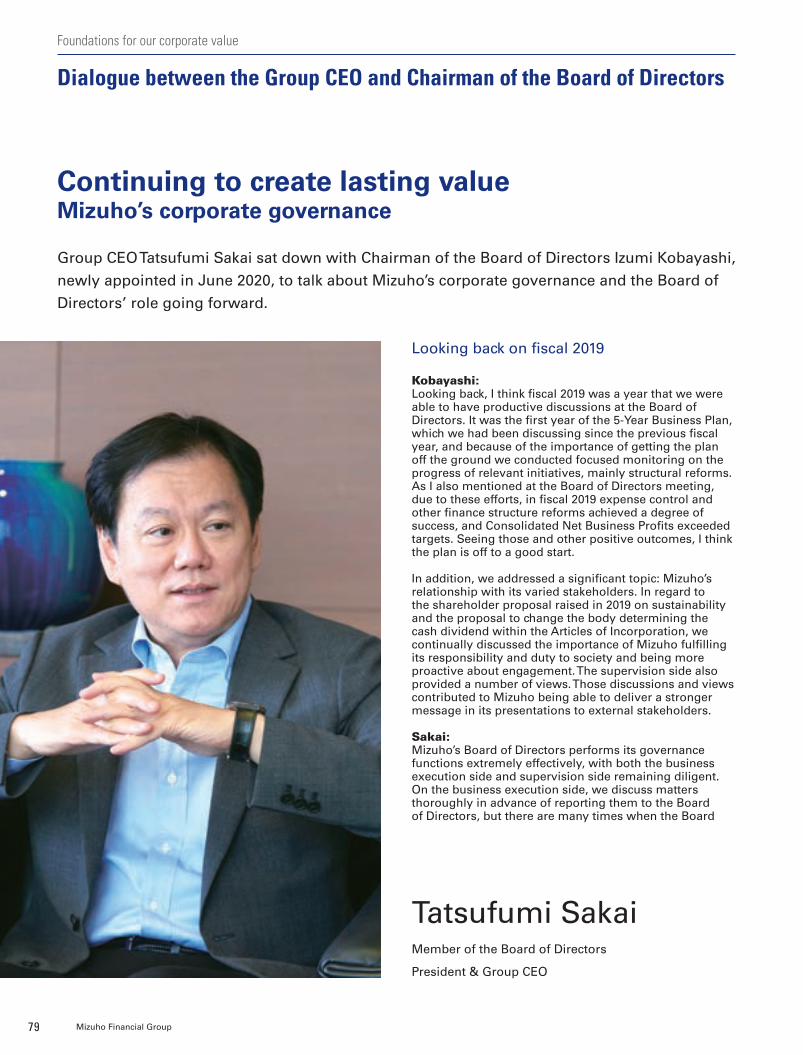
Group CEO Tatsufumi Sakai sat down with Chairman of the Board of Directors Izumi Kobayashi,
newly appointed in June 2020, to talk about Mizuho’s corporate governance and the Board of
Directors’ role going forward.
Continuing to create lasting valueMizuho’s corporate governance
Tatsufumi SakaiMember of the Board of Directors
President & Group CEO
Looking back on fiscal 2019
Kobayashi:Looking back, I think fiscal 2019 was a year that we were able to have productive discussions at the Board of Directors. It was the first year of the 5-Year Business Plan, which we had been discussing since the previous fiscal year, and because of the importance of getting the plan off the ground we conducted focused monitoring on the progress of relevant initiatives, mainly structural reforms. As I also mentioned at the Board of Directors meeting, due to these efforts, in fiscal 2019 expense control and other finance structure reforms achieved a degree of success, and Consolidated Net Business Profits exceeded targets. Seeing those and other positive outcomes, I think the plan is off to a good start.
In addition, we addressed a significant topic: Mizuho’s relationship with its varied stakeholders. In regard to the shareholder proposal raised in 2019 on sustainability and the proposal to change the body determining the cash dividend within the Articles of Incorporation, we continually discussed the importance of Mizuho fulfilling its responsibility and duty to society and being more proactive about engagement. The supervision side also provided a number of views. Those discussions and views contributed to Mizuho being able to deliver a stronger message in its presentations to external stakeholders.
Sakai:Mizuho’s Board of Directors performs its governance functions extremely effectively, with both the business execution side and supervision side remaining diligent. On the business execution side, we discuss matters thoroughly in advance of reporting them to the Board of Directors, but there are many times when the Board
Mizuho Financial Group79
Dialogue between the Group CEO and Chairman of the Board of Directors
Foundations for our corporate value
010_7080587452009.indd 79 2020/09/15 16:58:03
Izumi KobayashiChairman of the Board of Directors
of Directors then gives us valuable comments and suggestions on points that would not have occurred to us otherwise. This helps us see things in a different way.
Kobayashi:I think the outside directors on the board, with their wide-ranging experience and insights, are quite enthusiastic about offering their views. The internal directors then take those views seriously and apply them to business execution. The outside directors and internal directors have developed that sort of trust in each other, so, even while being diligent, we are still able to have a good relationship, which enables governance improvements.
One of the unique features of Mizuho’s corporate governance is that, in addition to the Board of Directors meetings, there are also many off-site meetings on management issues. In these meetings, we outside directors have a chance to hear directly from you about the business situation and your thoughts, to listen to in-house company heads’ presentations on in-house company management and perspectives, and to receive additional, separate explanations as needed. The meetings promote meaningful communication and strengthen our relationship of trust with the business execution side.
Sakai:Mizuho’s corporate governance structure strictly separates business execution and supervision, making executive officers responsible for a large share of the performance of duties. Nevertheless, we proactively share information with outside directors on any matters requiring their consideration. Just as you said, I think that through this we have been able to develop a good relationship, one which allows for encouraging comments on business execution from outside directors and for candid, constructive dialogue at the Board of Directors.
2020 Integrated Report 80
Foundations for our corporate value Dialogue between the Group CEO and Chairman of the Board of Directors
010_7080587452009.indd 80 2020/09/15 16:58:04

The power behind Mizuho’s corporate value
Kobayashi:Last December, in my capacity as outside director, I visited branches in Japan and talked with early career employees. In these and other conversations I had with early career employees and female employees, I could see that they have high expectations for the new HR strategy and are determined to move forward despite the challenges they face. I also met with employees working together as teams across banking, trust banking, and securities and employees striving to develop their individual expertise, all of whom impressed me with their potential as part of the Mizuho group.
Making good use of employees with such potential is critical. The key is the communication between managers and their employees, as well as the HR system. When managers can ease employees’ concerns about the future and support them in taking on new challenges, based on an understanding of the new HR strategy framework, employees are better able to develop professionally. Each employee finding satisfaction in their new roles and pursuing their own development furthers Mizuho’s growth. That is the core of the 5-Year Business Plan.
Sakai:I can feel that the transition to our new HR strategy is really changing employees’ mindsets. To give an example, in order to create opportunities for employees to take on challenges and exercise their skills outside Mizuho, we began allowing external concurrent assignments, and many employees have been applying for them. Finance is an extremely traditional and orthodox field with a conservative-leaning culture. Allowing employees
to venture outside Mizuho and take in some different scenery will produce flexible new ideas and approaches for use in Mizuho’s business. In the 5-Year Business Plan, we put forth “Open & Connected” as one of our action principles and called for creating new value incorporating both financial and non-financial products and services. External concurrent assignments are an initiative well suited to this.
We will endeavor to develop our talent as a unified group and make those efforts a driver of our 5-Year Business Plan.
The Board of Directors’ role going forward
Kobayashi:Under the 5-Year Business Plan, transformation towards a new approach to business operations has been moving forward, and the shift to next-generation branches has also begun. While the plan has been progressing, the global outbreak of COVID-19 has been having unpredictable and sizeable impacts on people’s ways of living and working. The situation is very serious worldwide, but the changes taking place in the configuration of the economy and society also bring with them substantial opportunities.
There is no question that we are beginning to get a sense of what Mizuho must consider and do in order to create sustainable value in the post-COVID-19 “new normal”.
Mizuho Financial Group81
Foundations for our corporate value
010_7080587452009.indd 81 2020/09/15 16:58:06

Changes in the business environment may lead to changes in various stakeholders’ perspectives, which will have implications for Mizuho’s approach to engagement. This new era is again calling into question the conditions for Mizuho to continue creating lasting value, is it not?
Sakai:For Mizuho to continue creating lasting value for our stakeholders in these times of change, we must be willing to confront a variety of changes and undertake our structural reforms with a strong commitment.
I hope you will continue giving us your invaluable advice so that we may transition to the next generation of financial services and build a stronger and more resilient financial group that our customers can depend on in the coming era.
Kobayashi:In June, we welcomed new directors and began a new structure for the Board of Directors. To facilitate
the response to the post-COVID-19 world, we have outside directors with progressive outlooks on business management. I think the membership is very appropriate for the situation. Considering COVID-19 as a starting point, I would like business execution and supervision to be attentive to a wider range of risks, opportunities, and time spans; to discuss Mizuho’s unchanging responsibility and duty to society, its steady implementation of the 5-Year Business Plan, and its pursuit of new challenges; and to work in unison towards Mizuho creating even greater value.
Since Mizuho transitioned to a “company with three committees” model of corporate governance in 2014, an outside director has served as the Chairman of the Board of Directors, and Mizuho’s corporate governance has steadily evolved. With the robust governance that has been developed to this point as a foundation, I will do my utmost as Chairman to chart a path to the future for Mizuho while advancing further corporate governance improvements.
2020 Integrated Report 82
Foundations for our corporate value Dialogue between the Group CEO and Chairman of the Board of Directors
010_7080587452009.indd 82 2020/09/15 16:58:07
Risk culture
We foster a sound risk culture in which all executive officers and employees maintain a high level of awareness regarding risk, and endeavor to make proper judgments and take appropriate actions rooted in good sense and ethical standards. Such judgments and actions allow us to achieve our risk appetite and enhance our corporate value.
We have also established Behavioral Guidelines for a Sound Risk Culture, and work to ensure that executive officers and employees understand these principles through messages from senior management, training sessions and other measures. For Mizuho to put the “customer first principle” into practice and enhance our corporate value, it is essential that all members maintain an attitude of not simply avoiding risk, but rather taking
appropriate risk. These guidelines provide a foundation for the appropriate values and courses of action for Mizuho’s executive officers and employees to take when approaching risks. The guidelines are aligned with the five Mizuho Values that form a part of Mizuho’s Corporate Philosophy, and executive officers and employees can refer to them when they are unsure of a risk-related judgment that needs to be made in their daily work. Putting these guidelines into practice improves our ability to address and counter risks, and fosters a sound risk culture.
These initiatives are also important from the standpoint of internal control, ultimately helping to prevent inappropriate behavior by executive officers and employees.
Risk appetite framework (RAF)
The purpose of our RAF is to maximize our corporate value by securing sustainable and stable profits, and to fulfill our social responsibilities. Based on such purpose, our core risk appetite is to take appropriate risk and provide solutions based on our customers’ actual needs, establishing our competitive advantage against our peers.
We have positioned the RAF as the corporate management framework to support taking the types and levels of risk that we will accept in order to implement our
business and financial strategies. We will further concretely define our risk appetite in our medium-term and fiscal year business plans. The risk appetite forms the basis for establishing our business strategy, resource allocation, and earnings plans as well as monitoring the operating status, thus integrating risk management, business strategy, and profits in order to achieve disciplined risk-taking that achieves an optimal balance of risk and return.
Risk governance overview
Risk governance is a part of Mizuho’s corporate governance framework, centered on our risk appetite framework (RAF). The Board of Directors determines fundamental matters regarding the RAF, along with its management systems and specific risk appetites, and incorporates these in document form as the risk appetite statement (RAS).
At Mizuho, we also work to foster and promote a sound risk culture to support this risk governance framework. The effective administration of the RAF leads to the creation of a sound risk culture, and at the same time, cultivating a sound risk culture creates a foundation for the disciplined risk-taking and risk communication which are promoted as part of the administration of the RAF.
To ensure strong risk governance, we maintain a risk management and compliance structure that operates in accordance with the principles of the “three lines of defense.”
Mizuho Financial Group83
Risk governance
Foundations for our corporate value
011_7080587452009.indd 83 2020/09/10 14:29:16

Formulation and monitoring of risk appetite
Risk appetite is determined through management discussions on the outlook for external factors such as the macroeconomic, regulatory, and competitive environment, along with potential risk events such as economic slowdown and turbulence in financial markets. These are then incorporated into main and risk scenarios that are shared internally.
We then formulate a group-wide risk appetite policy based on our awareness of these external environments, create specific strategies and measures according to this policy, and determine corporate resource allocation and earnings plans. Our risk appetite metrics are expressed in terms of capital strength, profitability, and liquidity, utilizing measures such as CET1 Capital Ratio, ROE, and LCR.
Further, the risk appetite for the entire group is shared with the in-house companies that implement strategies, to ensure the effectiveness of the RAF. The in-house companies in turn formulate individual risk appetite policies to implement the group’s overall policy, and set risk appetite metrics and levels to meet group metrics and levels.
Monitoring of the operational status for the established risk appetite is conducted by the Risk Management Committee (Chairman: Group CRO) on a quarterly basis and as necessary. As part of this process, the Group CRO and each in-house company work to identify issues related to risk and share information on these issues. This monitoring enables timely and appropriate actions, including flexible revisions to our risk appetite and strategies, to be discussed and carried out in the event of changes in the external environment that increase risk or impede our risk appetite and strategies.
Systems for operating the risk appetite framework
Our risk appetite consists of a risk appetite policy that serves as the fundamental policy regarding our risk-taking activities, and risk appetite metrics that serve as a means of quantifying the level of risk-taking based on the risk appetite policy.
In implementing the RAF, the Board of Directors decides on basic matters, including the risk appetite policy, metrics, and levels of risk, and operations are supervised based on the Board’s decisions. In addition, the Risk Committee, which advises the Board of Directors, provides advice regarding risk governance and offers suggestions to management.
On the other hand, to implement the RAF in the course of business operations, the Group CRO, Group CFO, and Group CSO provide assistance overseen by the Group CEO, and implement business strategy, financial strategy, and risk management from an overall perspective. Also, heads of in-house companies, units, and groups are responsible for planning and implementing strategies based on risk appetite, and as the individuals in charge of risk-taking, conduct operations. Note that the Internal Audit Group provides objective and comprehensive assessments of the effectiveness of the RAF from an independent perspective and offers advice and recommendations for addressing any issues that arise.
• Determines basic matters regarding RAF and RAS
• Supervises business execution by the management based on the above determinations
• Advises the Board of Directors and makes proposals to the management regarding risk governance
Supervision
Board of Directors
Risk Committee
• Audits the execution of duties by the executive officers and the management regarding RAF
Audit Committee
Management
President & Group CEO
• Formulates risk appetite policy
• Establishes risk appetite metrics/level
• Formulates RAS
• Conducts business operations consistent with the risk appetite
• Embeds a sound risk culture in each line of business
Executive Management Committee
• Monitors the operation of RAF
Risk Management Committee (Chairman: Group CRO1)
• Formulates and promotes balance sheet management-centered strategies related to risk control and risk-taking
Balance Sheet Management Committee (Chairman: Group CFO2)
Mizuho’s RAF Control Structure
1. Group Chief Risk Officer 2. Group Chief Financial Officer
2020 Integrated Report 84
Foundations for our corporate value Risk governance
011_7080587452009.indd 84 2020/09/10 14:29:16

Comprehensive risk management systems
We recognize that conducting operations tailored to the risks and managing such risks is a key issue relating to overall management. In order to implement our business strategies while maintaining our financial stability, we maintain comprehensive risk management and control measures.
Mizuho Financial Group maintains basic policies for risk management established by the Board of Directors that are applicable to the entire group. These policies clearly define the kinds of risks to be managed, set forth the organizational structure, and provide for the employee training necessary to ensure appropriate levels of risk management. The policies also provide for audits to measure the effectiveness and suitability of the management structure. In line with these basic policies,
Comprehensive risk management
Basic approach
For the group as a whole, in order to ensure sound and stable corporate management and enhance our corporate value, appropriately managing risk and controlling risk are key issues relating to overall management, and therefore we are working to put in place risk management systems.
Mizuho Financial Group has established basic policies for risk management that are applicable to the group as a whole. In line with these basic policies, as a group we
analyze risk comprehensively from multiple perspectives and adopt a variety of measures to strengthen and enhance the sophistication of our risk management system.
We have positioned our RAF as the corporate management framework for realizing our risk appetite as well as comprehensive risk management as a framework for managing risk from every angle.
Three lines of defense
In accordance with the “three lines of defense” approach in the Corporate Governance Principles for Banksreleased by the Basel Committee on Banking Supervision and the definitions and roles outlined below, we ensure appropriate and effective risk governance through autonomous controls (first line) and a check-and-balance
system (second line), along with an independent third line of internal auditing. In addition, Mizuho Financial Group sets group strategies and allocates resources, monitoring the autonomous controls in the first line at core group companies in order to strengthen the system providing appropriate responses.
Our definition of the three lines of defense and their roles
Firs
t lin
e
Autonomous control functionThe first line-of-defense involves daily operations based on the rules, procedures, and risk appetite, and has a primary responsibility for risks and compliance matters accompanying the conduct of business as a risk owner, and for performing autonomous control activities (to identify, assess, and manage/control risks and compliance matters).
Sec
on
d li
ne Risk management and compliance function
The second line-of-defense oversees (monitors), measures, and assesses the first line’s autonomous control activities, and is responsible for establishing and implementing basic policies for risk management and compliance.
Th
ird
lin
e Internal audit functionThe third line-of-defense is independent of the first and second lines and involves assessment and examination of the operations of the first and second lines, and is responsible for providing advice and guidance to settle issues.
Our risk management and compliance framework
Mizuho Financial Group Core group companies*
Internal Audit Group Internal Audit Group
* Of the core group companies, Mizuho Bank, Mizuho Trust & Banking, Mizuho Securities, and Mizuho Americas conduct risk management and compliance based on the “three lines of defense” concept.
3rd
lin
e
Department(s) in charge of risk management/compliance2n
d li
ne Department(s)
in charge of risk management/compliance2n
d li
ne
In-house companies/unitsFirst line-of-defense autonomous control1s
t lin
e Divisions/unitsFirst line-of-defense autonomous control1s
t lin
e
Internal audit
Internal audit
Formulate strategies,
allocate business resources, etc.
Report regarding the first
line-of-defense autonomous
control
Submit/report
Basic policies
Submit/report
Basic policies
Internal audit Internal audit
Monitoring Monitoring
3rd
lin
e
Mizuho Financial Group85
Foundations for our corporate value
011_7080587452009.indd 85 2020/09/10 14:29:16

For more information on our risk management, please visit our website.
https://www.mizuho-fg.com/company/internal/r_management/index.html
we maintain various measures to strengthen and enhance the sophistication of our risk management system.
The Risk Management Committee chaired by the Group CRO provides integrated monitoring and management of the overall risk for the group. The Group CRO reports the risk management situation to the Board of Directors, the Risk Committee, and the Executive Management Committee regularly and as necessary. In addition, Mizuho Financial Group receives reports and applications for approval concerning the risk management situation from our core group companies and gives them appropriate instructions concerning risk management as necessary.
We classify and manage the risks that arise in our businesses according to the various kinds of risk, including credit risk, market risk, liquidity risk, and operational risk. Moreover, in each of our group companies we adopt the same approach of managing risks, such as settlement risk, trust banking operations risk, and other risks appropriately given their nature.
In addition to managing each type of risk individually, we have established a risk management structure to identify and evaluate overall risk and to keep risk within limits that are acceptable.
In line with the basic policies relating to overall risk management established by Mizuho Financial Group, we are working to take even more proactive and sophisticated approaches to risk management.
Departments responsible for risk management
Mizuho Financial Group
Supervision/Audit Management
Board of Directors
Risk Committee
Executive Management Committee
Business policy committees
(e.g. Risk Management Committee)
Mizuho Bank Mizuho Trust & Banking Mizuho Securities Mizuho Americas Other core group companies
Risk Management Department
Credit Risk Management Department
IT & Systems Planning Department
Operations Planning Department
Legal Department
Global Talent Planning and Management Department
Facility Management Department
Strategic Planning Department
Corporate Communications Department
Credit risk
Market risk Liquidity risk
Operational risk
Credit risk
Op
erat
ion
al r
isk
Information technology risk
Operations risk
Legal risk
Human capital risk
Tangible asset risk
Regulatory risk
Reputational risk
Set risk management policiesGive instructions and approval concerning risk management
Report the risk management situationSubmit applications concerning risk management
Officers responsible for risk
management (e.g. Group CRO)
Pres
iden
t &
G
rou
p C
EO
Co
mp
reh
ensi
ve r
isks
2020 Integrated Report 86
Foundations for our corporate value Risk governance
011_7080587452009.indd 86 2020/09/10 14:29:16

financial strength. To ensure the ongoing financial soundness of Mizuho Financial Group and our core group companies we regularly monitor the manner in which risk capital is being used in order to obtain an accurate grasp of the risk profile within this framework. Reports are also submitted to the Board of Directors and other committees of each company. Risk capital is allocated to Mizuho Bank, Mizuho Trust & Banking, Mizuho Securities, and Mizuho Americas by risk category, and is further allocated within their respective business units.
approach, we endeavor to deepen communication regarding risks, seek to create common perspectives regarding risks, and work to secure consistency in awareness of various types of risks.
For the top risks and emerging risks that are identified, the status of controls is confirmed, and, when deemed necessary, consideration is given to additional risk controls.
As of March 2020, the items in the following table have been designated as top risks and emerging risks. Of note, COVID-19 is considered to be a risk event that laterally impacts various risks.
Risk capital allocation
We endeavor to obtain a clear grasp of the group’s overall risk exposure and implement measures to make sure this exposure is within limits that are acceptable and are in accordance with the risk capital allocation framework.
More specifically, we allocate risk capital to our core group companies (including their subsidiaries) to control risk within the limits set for each company. We also control risk within acceptable limits by working to ensure that the overall risk on a consolidated basis does not exceed our
Top risk management
We specify risks that are recognized to have a major potential impact on the group as “top risks” and “emerging risks”, and have introduced top risk management methods. As part of our top risk management, emerging risks are those viewed as major risks that must be addressed in the next few years despite the fact that materialization of the risks will occur over a medium- to long-term time frame, or risks that must be recognized even though they may manifest over the long term.
Based on assessments of the likelihood, impact, and other characteristics of monitored risks, and after careful deliberation by management, top risks and emerging risks are designated and managed accordingly. Through this
Mizuho Financial Group (holding company)
Mizuho Bank
Mizuho Trust & Banking
Mizuho Securities
Mizuho Americas
Setting of upper limits based on risk capital and exercise of control over various risks
Credit risk
Market risk
Stock price risk
Operational risk
Group companies
Examples
Mizuho Bank
Mizuho Trust & Banking
Mizuho Securities
Mizuho Americas
Financial strength of the group
Capital
Other risks
Risk exposure of the group
Ris
k ex
po
sure
of
core
gro
up
co
mp
anie
s*
Allo
cate
d r
isk
cap
ital
Allocated to
business units
*Includes the risk exposure of group companies that are managed by core group companies
Framework for allocating risk capital
Mizuho Financial Group87
Foundations for our corporate value
011_7080587452009.indd 87 2020/09/10 14:29:16

Top risks Potential risks Examples of initiatives
Worsening credit risks arising mainly from global economic stagnation
• Slowdown of the global economy, regional economic deterioration, and turbulence in financial markets due to factors such as COVID-19 and US-China trade friction
• Sudden deterioration in the credit standing of obligors where we are heavily exposed and in credit standing of major clients
• Specify areas of our portfolio which should be subject to stronger management in light of the impacts on our clients’ business environment and other factors, then record additional reserves or take other steps as needed based on a stress analysis and future outlook
Sudden drop in the value of assets arising mainly from financial market turbulence
• Decline in stock prices, sudden fluctuations in currency values, drying up of liquidity due to turmoil in financial markets from the impact of COVID-19
• Worsening valuation of securities due to higher interest rates
• Set discussion points based on the market environment and establish a framework to enable a response at the earliest possible stage
• Implement a hedging strategy for held assets based on the financial impact
Destabilization of foreign currency procurement
• Greater-than-expected outflows of funds, deterioration in liquidity conditions due to turmoil in financial markets, and accompanying rise in funding costs
• Expand stable foreign currency funding methods• Strengthen balance sheet control by utilizing risk indicators for
foreign currency liquidity
Major system failure • Emergence of costs due to IT system failures, government fines, and damage to reputation
• Build a framework for appropriate reporting as well as cause analysis and the establishment of measures to prevent reoccurrence following system recovery based on the rank of the system failure
• Ensure the effectiveness of responses in the event of a system failure via regular drills
Cyber attacks• Emergence of additional costs and damage to reputation due to
suspension of services as a result of cyberattacks, data falsification, information leakage, improper funds transfer, etc.
• Prepare our defenses by continually strengthening countermeasures such as system monitoring and defence in depth
Money laundering/Financing of terrorism
• Government fines/penalties and damage to reputation because of flaws in policies to prevent money laundering and financing of terrorism
• Continue to enhance anti-money laundering measures and other efforts in line with laws/regulations and guidelines from Japan’s Financial Services Agency
Emerging risks Potential risks Examples of initiatives
Climate change risks • Financial loss accompanying the stranding of our invested assets and reputational damage
• Strengthen our response to the TCFD Recommendations such as establishing an Environmental Policy, tightening our policy on financing and investment for coal-fired power generation, and conducting scenario analyses
Strategic risks• Lower profitability mainly due to intensifying competition in the
financial industry, weak earnings for interest business from the prolonging of negative interest rate policies
• Promote new initiatives for the next generation of financial services through strategic alliances and other forms of collaboration
• Accelerate revisions to our channels via operational optimization, strengthening consulting, etc. through use of our new core banking system, MINORI
Note: The risks described here are only some of the possible risks we are aware of. For more comprehensive information on the group’s risks, please refer to our Securities Report, Form 20-F, and other related documents.
Stress testing
We assess the suitability of our risk appetite and the validity of our business plans through stress testing, calculating and assessing the financial effect on our capital adequacy ratio and on our business.
We carry out stress testing based on scenarios formulated taking into account current economic conditions and future outlooks, vulnerabilities in the Mizuho group’s business and finance structures, and other factors. We can confirm whether our capital adequacy ratio, performance, and other indicators are sufficient in the case that stress events actually materialize. If such indicators fall below the necessary level, we reconsider and revise our risk appetite and business plans. In addition, we confirm the
balance between owned capital and risk capital, including interest rate risk in the banking book, at the post-stress stage to assess the adequacy of the capital level.
Furthermore, to structure robust risk management systems, stress testing is also used to manage risk in various risk categories, such as market risk.
This process also serves as a foundation for understanding the characteristics of our business portfolio and enables planning in advance regarding the course of action which should be taken if a stress event occurs, and is conducted regularly to enhance our risk management capabilities.
Mizuho’s stress testing
• Current economic conditions and future outlook• Vulnerabilities of the group’s business and
financial structure
Preparation of scenarios common across the group
1. Preparing scenarios
• Calculation of the impact on the group when the risk scenario materializes
• Main items to calculate: Capital adequacy ratio, losses, VAR, etc.
2. Calculation of risk impact
• Appropriateness of risk-taking and verification of suitability of the business plans
• Assessment of capital adequacy
3. Analysis and use of results
2020 Integrated Report 88
Foundations for our corporate value Risk governance
011_7080587452009.indd 88 2020/09/10 14:29:16
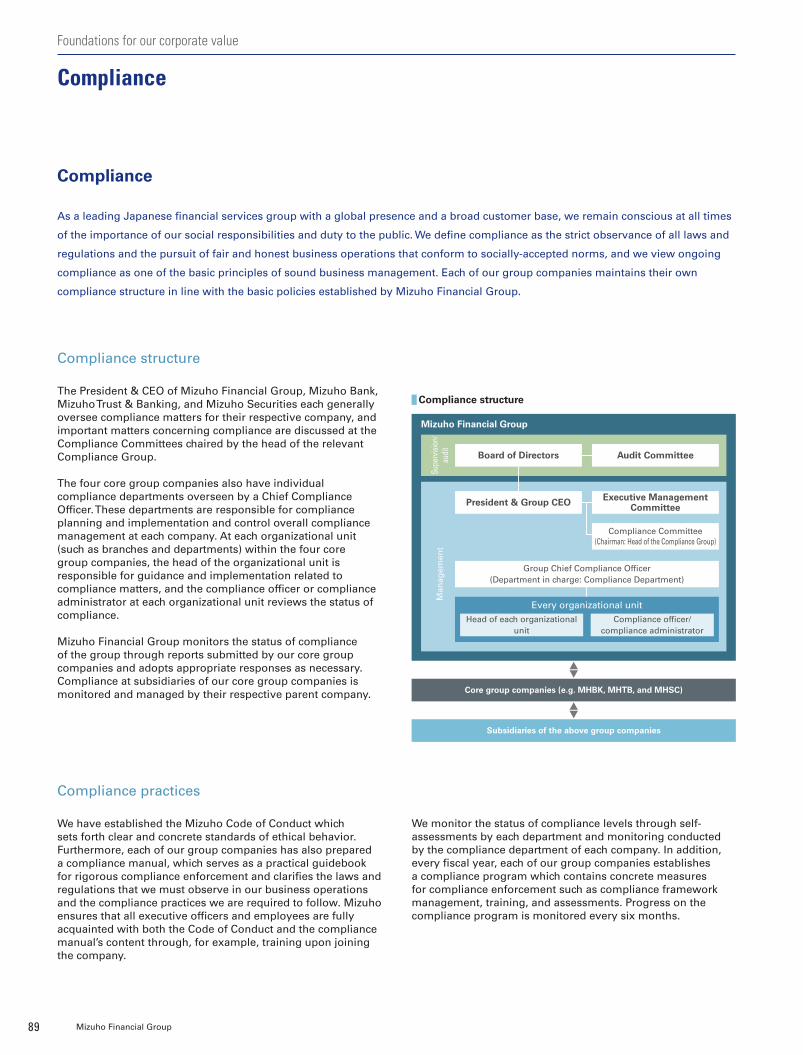
Compliance structure
The President & CEO of Mizuho Financial Group, Mizuho Bank, Mizuho Trust & Banking, and Mizuho Securities each generally oversee compliance matters for their respective company, and important matters concerning compliance are discussed at the Compliance Committees chaired by the head of the relevant Compliance Group.
The four core group companies also have individual compliance departments overseen by a Chief Compliance Officer. These departments are responsible for compliance planning and implementation and control overall compliance management at each company. At each organizational unit (such as branches and departments) within the four core group companies, the head of the organizational unit is responsible for guidance and implementation related to compliance matters, and the compliance officer or compliance administrator at each organizational unit reviews the status of compliance.
Mizuho Financial Group monitors the status of compliance of the group through reports submitted by our core group companies and adopts appropriate responses as necessary. Compliance at subsidiaries of our core group companies is monitored and managed by their respective parent company.
Compliance
As a leading Japanese financial services group with a global presence and a broad customer base, we remain conscious at all times
of the importance of our social responsibilities and duty to the public. We define compliance as the strict observance of all laws and
regulations and the pursuit of fair and honest business operations that conform to socially-accepted norms, and we view ongoing
compliance as one of the basic principles of sound business management. Each of our group companies maintains their own
compliance structure in line with the basic policies established by Mizuho Financial Group.
Compliance practices
We have established the Mizuho Code of Conduct which sets forth clear and concrete standards of ethical behavior. Furthermore, each of our group companies has also prepared a compliance manual, which serves as a practical guidebook for rigorous compliance enforcement and clarifies the laws and regulations that we must observe in our business operations and the compliance practices we are required to follow. Mizuho ensures that all executive officers and employees are fully acquainted with both the Code of Conduct and the compliance manual’s content through, for example, training upon joining the company.
We monitor the status of compliance levels through self-assessments by each department and monitoring conducted by the compliance department of each company. In addition, every fiscal year, each of our group companies establishes a compliance program which contains concrete measures for compliance enforcement such as compliance framework management, training, and assessments. Progress on the compliance program is monitored every six months.
Compliance structure
Mizuho Financial Group
Board of Directors
President & Group CEO Executive Management Committee
Audit Committee
Compliance Committee(Chairman: Head of the Compliance Group)
Every organizational unit
Subsidiaries of the above group companies
Core group companies (e.g. MHBK, MHTB, and MHSC)
Group Chief Compliance Officer(Department in charge: Compliance Department)
Head of each organizational unit
Compliance officer/compliance administrator
Supe
rvisi
on/
audi
tM
anag
emen
t
Mizuho Financial Group89
Compliance
Foundations for our corporate value
011_7080587452009.indd 89 2020/09/10 14:29:16
and taking appropriate action. When we become aware of potential compliance issues, such matters must be reported immediately to department and branch managers in accordance with our compliance manual. Furthermore, each group company has established a hotline which employees can call in order to speak with someone within the Compliance Division or an external law office or compliance professional.
For matters related to inappropriate accounting, internal control on financial reporting, and auditing, an internal control and auditing hotline, which connects to an external law office, is available to receive reports from both in and outside the company.
of the compliance committees of Mizuho Financial Group, Mizuho Bank, Mizuho Trust & Banking, and Mizuho Securities, which are chaired by the President & CEOs or other senior management members of these group companies.
Furthermore, core group companies maintain centralized departments or appoint an officer to manage anti-organized crime efforts and to maintain effective frameworks, for example, by establishing a manual on how to manage such issues and conducting training sessions. If required, we consult with third-party experts and authorities on the handling of specific cases.
Our stance towards organized crime
In order to prevent organized crime from influencing the management of our clients and to avoid any association with the harm caused by organized crime, the Mizuho Code of Conduct includes a policy covering our zero-tolerance stance on business relationships with individuals or organizations that are in any way associated with organized crime and therefore threaten the rule of law, public order, and safety.
We have also formed an Anti-Organized Crime Committee which includes external experts in industry-specific, in-depth discussions on this subject, in addition to other initiatives we are implementing on a group-wide basis to ensure that we have no direct or indirect associations with organized crime. Moreover, drawing on the discussions in this committee, these matters are also discussed and reported on at meetings
Measures for ensuring complianceAt Mizuho, compliance-related education and training are key measures for ensuring appropriate compliance.
During fiscal 2019, Mizuho provided effective training tailored to a broad range of roles within the organization, from employees to senior management. We conducted 12 training sessions in total, including mandatory compliance training sessions for all employees; role-specific training for executive officers, general managers, deputy general managers, compliance officers, and other senior management members; and e-learning training sessions on specific compliance topics.
In addition to training sessions and other programs designed to promote compliance, we are also dedicated to detecting potential compliance issues at the earliest stage possible
Our audit hotline, which connects to an external law office, is available to receive reports from both in and outside the company in connection with concerns regarding accounting and financial reports.
Internal control and audit hotline
We have a robust internal reporting system in place, and are working to further increase its effectiveness by establishing group-wide reporting channels outside the workplace that are available in the evenings, on Saturdays and Sundays, and also by making such services available in foreign languages. To ensure that employees at each group company are fully acquainted with these systems, hotline numbers and other relevant information is included on posters within each workplace and distributed to all employees on wallet-sized cards. In fiscal 2019, Mizuho Financial Group and our core group companies received a total of 141 reports through our hotlines from both inside and outside the group, with the response status reported to our Audit Committee. Following inspection by an authorized registration institute under the Consumer Affairs Agency, our internal reporting system was recognized as operating properly and in accordance with the guidelines set by the Agency, and registered to the Whistleblowing Compliance Management System (a Self-declaration System).
Internal reporting systems (Compliance hotline)
Preventing money laundering and financing of terrorism
Financial crime is becoming more diverse and sophisticated, and acts of terrorism continue to occur around the world. In light of this, anti-money laundering (AML) and combating the financing of terrorism (CFT) are becoming increasingly important. Against this backdrop, the key challenge for financial institutions is the strengthening of their AML countermeasures and CFT initiatives. As a financial services provider operating
globally, Mizuho Financial Group is subject to the laws and regulations of both Japan and the other jurisdictions where it operates, as well as to supervision from financial regulators based on those laws and regulations. Accordingly, we have devised AML and CFT policies and procedures that conform to the laws and regulations in each jurisdiction and we are also continually enhancing our AML and CFT measures.
2020 Integrated Report 90
Foundations for our corporate value Compliance
011_7080587452009.indd 90 2020/09/10 14:29:16

Customer protection management
We give first priority to our customers, and we believe that earning their trust is the basis for ensuring sound management and therefore earning the trust of other stakeholders as well. With this in mind, a core part of our compliance is to continuously seek to monitor and improve the operations of the group from the perspective of what is in the best interests of our customers in order to ensure that our operations are appropriate and to improve customer convenience. We manage customer protection uniformly throughout the group in order to achieve this objective.
Customer service management
At Mizuho, we engage in business with a wide range of customers, and we put a strong emphasis on responding appropriately to feedback, complaints, or other communication from customers in addition to our efforts to offer customers stronger protections and higher convenience.
In the case of receiving a complaint or other critical feedback, we not only emphasize the importance of responding quickly and politely, but also require reports to be drawn up in order to monitor these situations.
Furthermore, we regard all customer feedback as an important asset and work continuously to improve our operations and prevent the recurrence of issues with the aim of increasing customer satisfaction.
For more information on Mizuho’s customer protection measures, please see our website:
https://www.mizuho-fg.com/company/internal/customer/
Customer protection management structure
At Mizuho, customer protection management refers to the efforts we make to improve the protection of our customers and improve customer convenience from the following perspectives:1. Ensuring the appropriateness and sufficiency of explanations
provided to customers prior to conducting transactions, purchasing products, etc. as well as the provision of information (e.g. product explanations) to customers.
2. Ensuring the appropriateness and sufficiency of the handling of customer inquiries, complaints, and other communications (customer service).
3. Ensuring the appropriateness of the management of customer information (customer information management).
4. Ensuring the appropriateness of customer interaction and the handling of customer information in cases where group operations are outsourced (outsourcing management).
5. Ensuring the appropriateness of the management of measures to be taken in order to address conflicts of interest arising from transactions with customers (conflict of interest management).
Our President & Group CEO generally oversees the management of customer protection, and important matters are discussed at Compliance Committee meetings (chaired by the Head of the Compliance Group). At our core group companies, the division responsible for each area of management described above also provides centralized monitoring and implementation of customer protection management. Core group companies oversee customer protection management at their own subsidiaries.
Information management
Advances in information technology have enabled greater utilization of data. At the same time, many countries have tightened legislation protecting personal information. There has also been closer public scrutiny of the methods companies use to protect personal information. Mizuho is aware of the vital importance of managing information in a way that ensures appropriate protection and use of information assets. We are constantly working to strengthen our information management practices. For example, we aim to ensure that our security management measures and information administration methods for information assets are clear and straightforward. Also, we implement training and awareness-building exercises to ensure that all members of our organization have a firm understanding regarding the proper protection of information assets.
Core group companies (e.g. MHBK, MHTB, and MHSC)
Board of Directors Audit Committee
Executive Management Committee
Compliance Committee (Chairman: Head of the Compliance Group)
Officers responsible for the general management of customer protection(Department in charge: Compliance Department)
President & Group CEO
Customer protection management
Outsourcing management
Conflict of interest management
Explanation of products
Customer service management
Divisions in charge
Subsidiaries of the above group companies
Mizuho Financial Group
Supe
rvisi
on/
audi
tM
anag
emen
t
Mizuho Financial Group91
Foundations for our corporate value
011_7080587452009.indd 91 2020/09/10 14:29:16
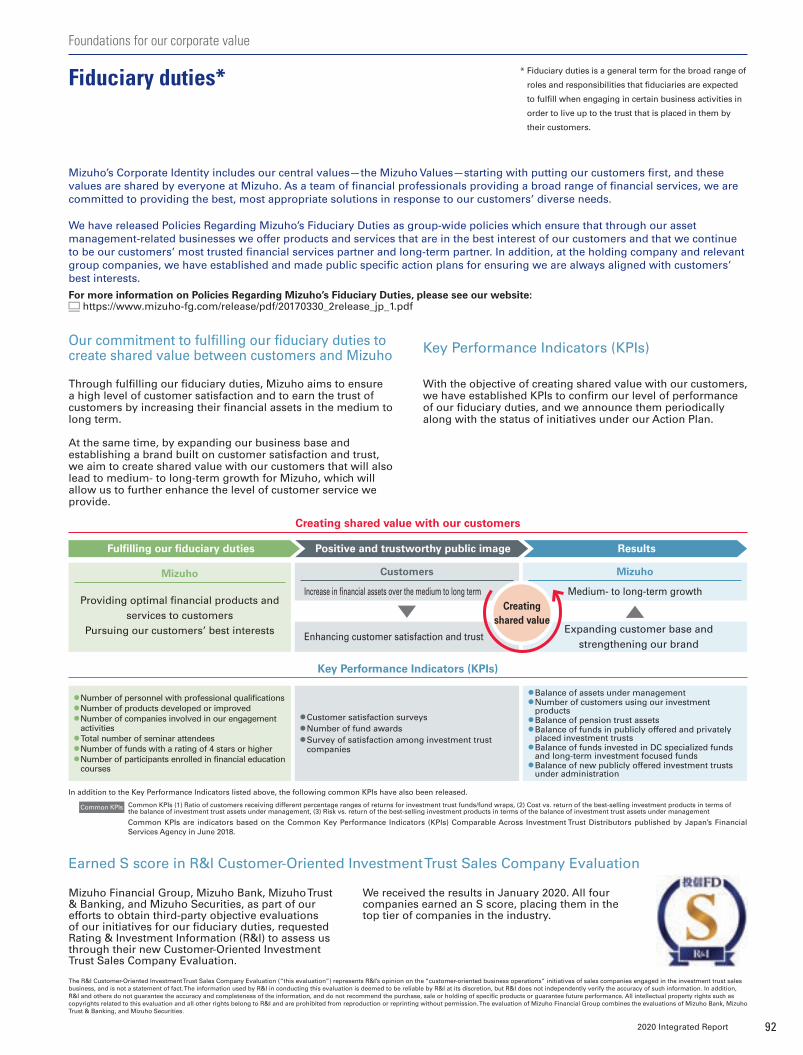
* Fiduciary duties is a general term for the broad range of
roles and responsibilities that fiduciaries are expected
to fulfill when engaging in certain business activities in
order to live up to the trust that is placed in them by
their customers.
Mizuho’s Corporate Identity includes our central values—the Mizuho Values—starting with putting our customers first, and these values are shared by everyone at Mizuho. As a team of financial professionals providing a broad range of financial services, we are committed to providing the best, most appropriate solutions in response to our customers’ diverse needs.
We have released Policies Regarding Mizuho’s Fiduciary Duties as group-wide policies which ensure that through our asset management-related businesses we offer products and services that are in the best interest of our customers and that we continue to be our customers’ most trusted financial services partner and long-term partner. In addition, at the holding company and relevant group companies, we have established and made public specific action plans for ensuring we are always aligned with customers’ best interests.
For more information on Policies Regarding Mizuho’s Fiduciary Duties, please see our website: https://www.mizuho-fg.com/release/pdf/20170330_2release_jp_1.pdf
Earned S score in R&I Customer-Oriented Investment Trust Sales Company Evaluation
Mizuho Financial Group, Mizuho Bank, Mizuho Trust & Banking, and Mizuho Securities, as part of our efforts to obtain third-party objective evaluations of our initiatives for our fiduciary duties, requested Rating & Investment Information (R&I) to assess us through their new Customer-Oriented Investment Trust Sales Company Evaluation.
We received the results in January 2020. All four companies earned an S score, placing them in the top tier of companies in the industry.
The R&I Customer-Oriented Investment Trust Sales Company Evaluation (“this evaluation”) represents R&I’s opinion on the “customer-oriented business operations” initiatives of sales companies engaged in the investment trust sales business, and is not a statement of fact. The information used by R&I in conducting this evaluation is deemed to be reliable by R&I at its discretion, but R&I does not independently verify the accuracy of such information. In addition, R&I and others do not guarantee the accuracy and completeness of the information, and do not recommend the purchase, sale or holding of specific products or guarantee future performance. All intellectual property rights such as copyrights related to this evaluation and all other rights belong to R&I and are prohibited from reproduction or reprinting without permission. The evaluation of Mizuho Financial Group combines the evaluations of Mizuho Bank, Mizuho Trust & Banking, and Mizuho Securities.
Creating shared value with our customers
Mizuho Customers
Increase in financial assets over the medium to long term
Mizuho
Medium- to long-term growth
Enhancing customer satisfaction and trustExpanding customer base and
strengthening our brand
Fulfilling our fiduciary duties Positive and trustworthy public image Results
Creating shared value
Providing optimal financial products and services to customers
Pursuing our customers’ best interests
Key Performance Indicators (KPIs)
Number of personnel with professional qualifications Number of products developed or improved Number of companies involved in our engagement activities Total number of seminar attendees Number of funds with a rating of 4 stars or higher Number of participants enrolled in financial education courses
Customer satisfaction surveys Number of fund awards Survey of satisfaction among investment trust companies
Balance of assets under management Number of customers using our investment products
Balance of pension trust assets Balance of funds in publicly offered and privately placed investment trusts
Balance of funds invested in DC specialized funds and long-term investment focused funds
Balance of new publicly offered investment trusts under administration
In addition to the Key Performance Indicators listed above, the following common KPIs have also been released.
Common KPIs Common KPIs (1) Ratio of customers receiving different percentage ranges of returns for investment trust funds/fund wraps, (2) Cost vs. return of the best-selling investment products in terms of the balance of investment trust assets under management, (3) Risk vs. return of the best-selling investment products in terms of the balance of investment trust assets under management
Common KPIs are indicators based on the Common Key Performance Indicators (KPIs) Comparable Across Investment Trust Distributors published by Japan’s Financial Services Agency in June 2018.
Our commitment to fulfilling our fiduciary duties to create shared value between customers and Mizuho
Through fulfilling our fiduciary duties, Mizuho aims to ensure a high level of customer satisfaction and to earn the trust of customers by increasing their financial assets in the medium to long term.
At the same time, by expanding our business base and establishing a brand built on customer satisfaction and trust, we aim to create shared value with our customers that will also lead to medium- to long-term growth for Mizuho, which will allow us to further enhance the level of customer service we provide.
Key Performance Indicators (KPIs)
With the objective of creating shared value with our customers, we have established KPIs to confirm our level of performance of our fiduciary duties, and we announce them periodically along with the status of initiatives under our Action Plan.
2020 Integrated Report 92
Fiduciary duties*
Foundations for our corporate value
011_7080587452009.indd 92 2020/09/10 14:29:16

The Basel standards, a unified international regulatory framework for ensuring the soundness of banking institutions, were first created in 1988 (now referred to as Basel I). As the financial services industry and world affairs have developed, steps have been taken to steadily enhance this framework. Formulated in 2010, Basel III is a framework that tightened capital requirements along with introducing liquidity requirements to address issues that came to light in the 2008 global financial crisis. Regulatory reforms following the financial crisis were largely completed in 2017 (Basel III finalization) with reforms aimed at reducing discrepancies among banks regarding the calculation of risk-weighted assets (RWA, which is the denominator of the capital ratio). The Group of Central Bank Governors and Heads of Supervision (GHOS) agreed to postpone the initial schedule for implementing Basel III finalization by one year due to the COVID-19 outbreak, with this being phased in between 2023 and 2028.
International financial regulations going forward
With the completion of the post-global financial crisis regulatory reforms, the Financial Stability Board and the Basel Committee on Banking Supervision, which are responsible for developing international financial regulatory standards, are turning their attention to new areas. Specifically, they have shifted their focus from developing new regulatory standards to consistent implementation of regulations in individual countries and evaluating the impact of regulatory reforms (e.g., are they having the intended effect without compromising regulatory resilience).
In addition, the environment that financial institutions operate in has reached a critical turning point, including rapidly accelerating digitalization and increasing societal
interest in sustainability. There is growing attention to the opportunities and risks that new trends such as fintech and stricter approaches to responsible financing that take into account climate change present to banks and financial systems. This has led to an uptick in international discussions about these issues. For example, the Financial Stability Board has prioritized looking at “new risks” such as concerns over cyberattacks due to the spread of fintech and how to coexist with BigTech companies.
To address these various risks, we will work closely with government, academia, and industry, while also holding proactive internal discussions.
Principal requirements under Basel III and state of compliance
As a Global Systemically Important Bank (G-SIB), Mizuho Financial Group must meet some regulatory standards at a higher level. We maintain full compliance with all the requirements in the standards and, going forward, we will steadily accumulate capital and control our balance sheet to ensure that we can satisfy any new requirements that are introduced.
Capital ratioCapital
RWA (which are calculated by taking account of the risk of assets held)
Leverage ratioCapital
Exposure (calculated without taking account of the risk of assets held)
Liquidity coverage ratio
Stock of high-quality liquid assets
Total net cash outflows under severe stress conditions over a specified short-term period (30 days)
Net stable funding ratio
Available amount of stable funding (capital, deposits, market funding, etc.)
Required amount of stable funding (loans, securities, etc.)
1988 1996 2010
Basel I Basel I Basel III finalization
Completion of remaining Basel III tasks
2017 2019
• Introduction of the capital ratio
1982 Latin American debt crisis Increase in trading activity 2008 Global Financial CrisisIncreasing diversity and complexity of financial systemsMore sophisticated risk management systems
• Market risk incorporated into RWA calculation
Basel III
• Strengthening qualitative and quantitative requirements for capital (numerator of the capital ratio)
• Introduction of leverage ratio and liquidity requirements
• Review and revision of RWA calculation methods
• Introduction of output floor (establishment of a floor for RWA calculated using internal models)
• Finalization of minimum capital requirements for market risk
Glo
bal
d
evel
op
men
tsB
asel
sta
nd
ard
s
• Allowing the use of banks’ internal credit ratings in RWA calculation
• Operational risk incorporated into RWA calculation
2004 2009
• Tightening of requirements regarding capital charges for securitized products and market risk
Basel 2.5Basel II
Mizuho Financial Group93
Compliance with international financial regulations
Foundations for our corporate value
011_7080587452009.indd 93 2020/09/10 14:29:16
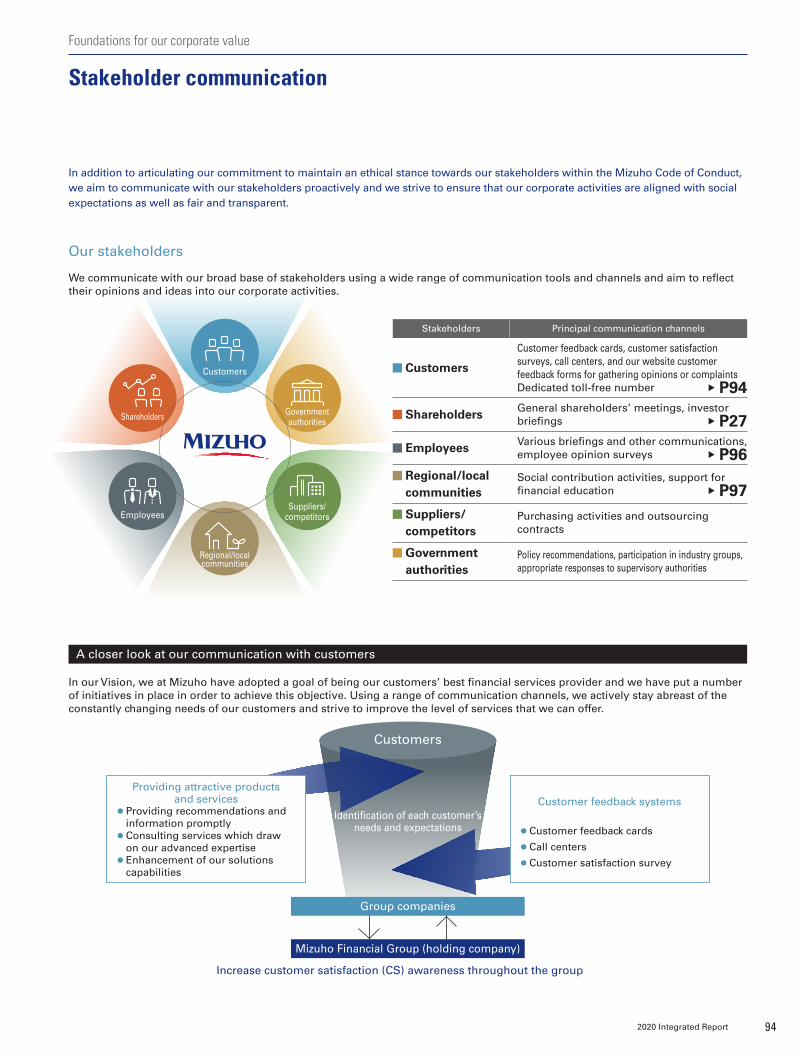
Identification of each customer’s needs and expectations
Customers
Our stakeholders
We communicate with our broad base of stakeholders using a wide range of communication tools and channels and aim to reflect their opinions and ideas into our corporate activities.
In addition to articulating our commitment to maintain an ethical stance towards our stakeholders within the Mizuho Code of Conduct, we aim to communicate with our stakeholders proactively and we strive to ensure that our corporate activities are aligned with social expectations as well as fair and transparent.
Stakeholders Principal communication channels
Customers
Customer feedback cards, customer satisfaction surveys, call centers, and our website customer feedback forms for gathering opinions or complaints Dedicated toll-free number P94
Shareholders General shareholders’ meetings, investor briefings P27
Employees Various briefings and other communications, employee opinion surveys P96
Regional/local communities
Social contribution activities, support for financial education P97
Suppliers/competitors
Purchasing activities and outsourcing contracts
Government authorities
Policy recommendations, participation in industry groups, appropriate responses to supervisory authorities
In our Vision, we at Mizuho have adopted a goal of being our customers’ best financial services provider and we have put a number of initiatives in place in order to achieve this objective. Using a range of communication channels, we actively stay abreast of the constantly changing needs of our customers and strive to improve the level of services that we can offer.
A closer look at our communication with customers
Mizuho Financial Group (holding company)
Increase customer satisfaction (CS) awareness throughout the group
Group companies
Customer feedback systems
Customer feedback cards
Call centers
Customer satisfaction survey
Providing attractive products and services
Providing recommendations and information promptly
Consulting services which draw on our advanced expertise
Enhancement of our solutions capabilities
Government authoritiesShareholders
EmployeesSuppliers/
competitors
Customers
Regional/local communities
2020 Integrated Report 94
Stakeholder communication
Foundations for our corporate value
011_7080587452009.indd 94 2020/09/10 14:29:17
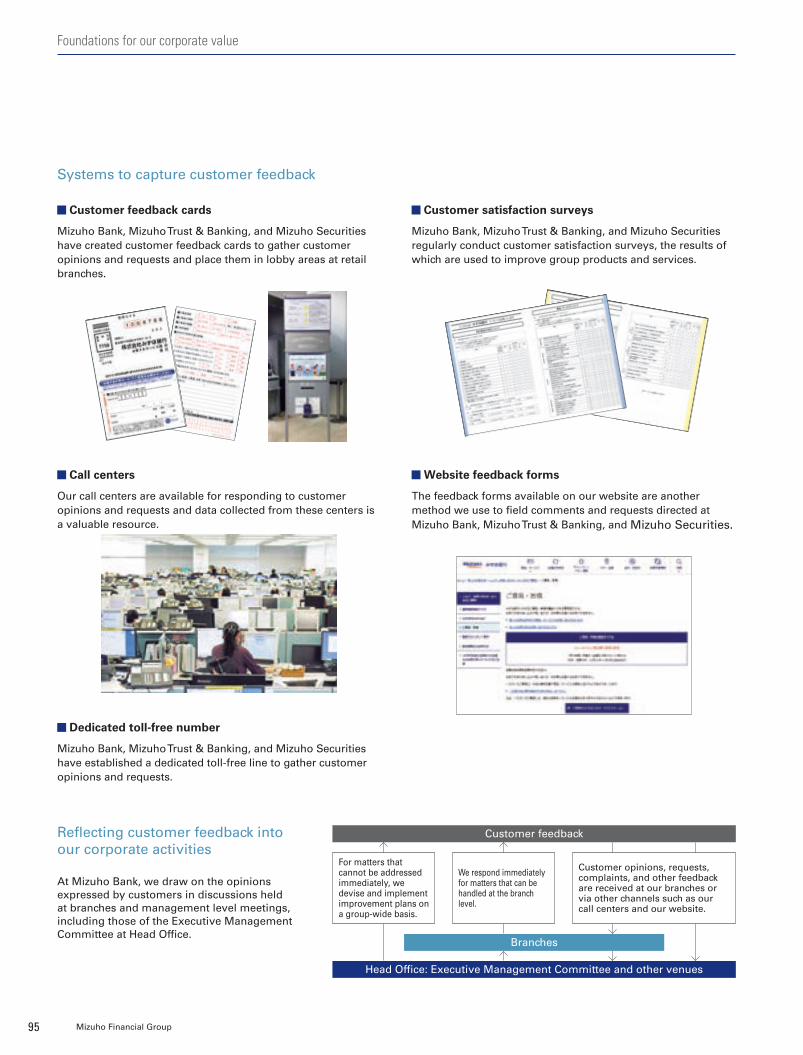
Reflecting customer feedback into our corporate activities
At Mizuho Bank, we draw on the opinions expressed by customers in discussions held at branches and management level meetings, including those of the Executive Management Committee at Head Office.
Systems to capture customer feedback
Customer feedback cards
Mizuho Bank, Mizuho Trust & Banking, and Mizuho Securities have created customer feedback cards to gather customer opinions and requests and place them in lobby areas at retail branches.
Call centers
Our call centers are available for responding to customer opinions and requests and data collected from these centers is a valuable resource.
Dedicated toll-free number
Mizuho Bank, Mizuho Trust & Banking, and Mizuho Securities have established a dedicated toll-free line to gather customer opinions and requests.
Customer satisfaction surveys
Mizuho Bank, Mizuho Trust & Banking, and Mizuho Securities regularly conduct customer satisfaction surveys, the results of which are used to improve group products and services.
Website feedback forms
The feedback forms available on our website are another method we use to field comments and requests directed at Mizuho Bank, Mizuho Trust & Banking, and Mizuho Securities.
Customer feedback
Head Office: Executive Management Committee and other venues
Branches
For matters that cannot be addressed immediately, we devise and implement improvement plans on a group-wide basis.
We respond immediately for matters that can be handled at the branch level.
Customer opinions, requests, complaints, and other feedback are received at our branches or via other channels such as our call centers and our website.
Mizuho Financial Group95
Foundations for our corporate value
011_7080587452009.indd 95 2020/09/10 14:29:18
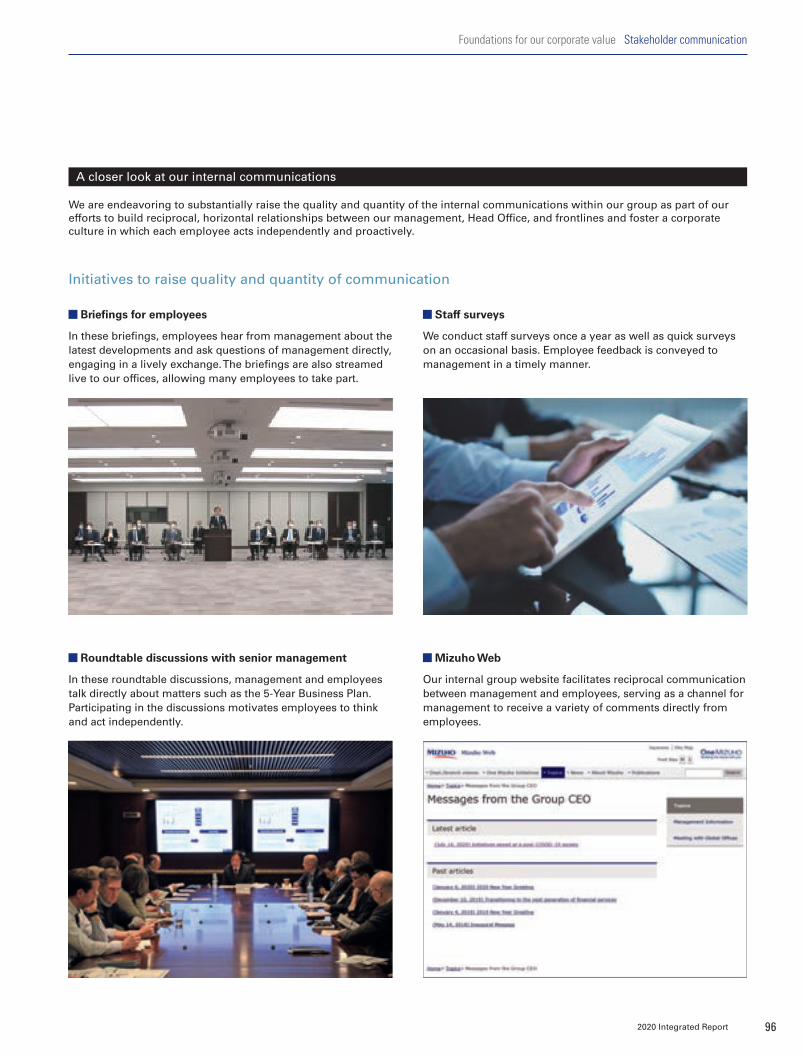
Initiatives to raise quality and quantity of communication
Briefings for employees
In these briefings, employees hear from management about the latest developments and ask questions of management directly, engaging in a lively exchange. The briefings are also streamed live to our offices, allowing many employees to take part.
Roundtable discussions with senior management
In these roundtable discussions, management and employees talk directly about matters such as the 5-Year Business Plan. Participating in the discussions motivates employees to think and act independently.
Staff surveys
We conduct staff surveys once a year as well as quick surveys on an occasional basis. Employee feedback is conveyed to management in a timely manner.
Mizuho Web
Our internal group website facilitates reciprocal communication between management and employees, serving as a channel for management to receive a variety of comments directly from employees.
A closer look at our internal communications
We are endeavoring to substantially raise the quality and quantity of the internal communications within our group as part of our efforts to build reciprocal, horizontal relationships between our management, Head Office, and frontlines and foster a corporate culture in which each employee acts independently and proactively.
2020 Integrated Report 96
Foundations for our corporate value Stakeholder communication
011_7080587452009.indd 96 2020/09/10 14:29:20
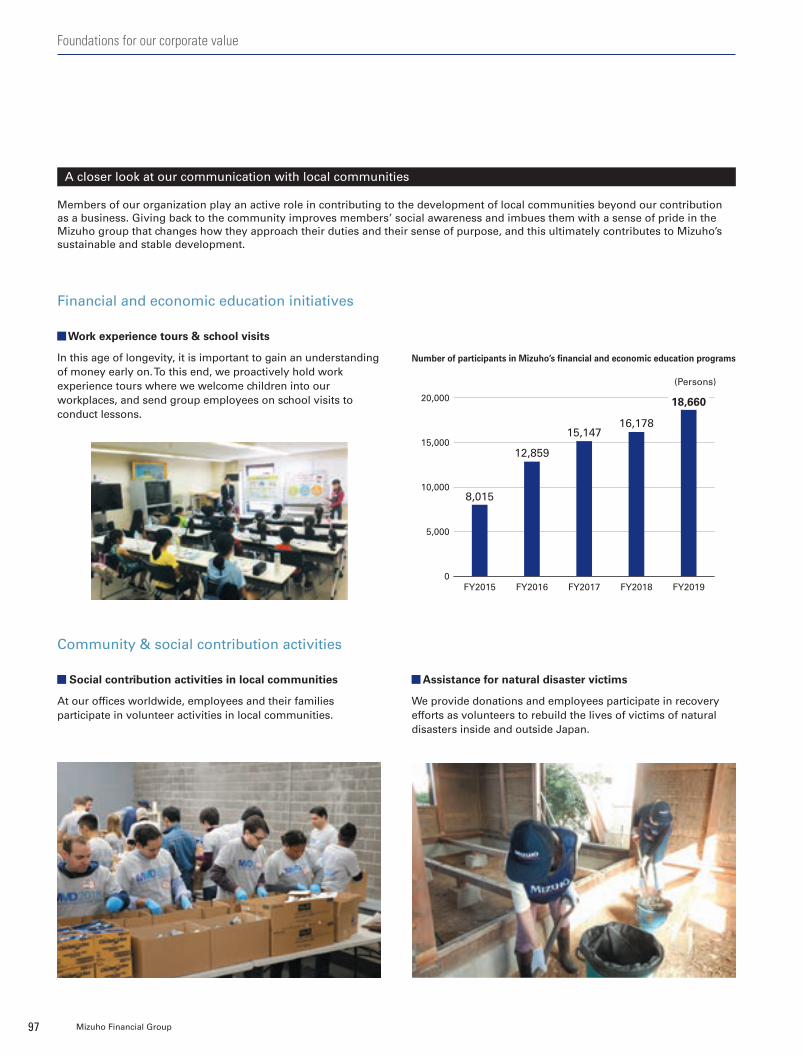
Financial and economic education initiatives
Work experience tours & school visits
In this age of longevity, it is important to gain an understanding of money early on. To this end, we proactively hold work experience tours where we welcome children into our workplaces, and send group employees on school visits to conduct lessons.
Social contribution activities in local communities
At our offices worldwide, employees and their families participate in volunteer activities in local communities.
Assistance for natural disaster victims
We provide donations and employees participate in recovery efforts as volunteers to rebuild the lives of victims of natural disasters inside and outside Japan.
A closer look at our communication with local communities
Members of our organization play an active role in contributing to the development of local communities beyond our contribution as a business. Giving back to the community improves members’ social awareness and imbues them with a sense of pride in the Mizuho group that changes how they approach their duties and their sense of purpose, and this ultimately contributes to Mizuho’s sustainable and stable development.
Community & social contribution activities
Number of participants in Mizuho’s financial and economic education programs
(Persons)
FY2019FY2018FY2017FY2016FY2015
16,17815,147
12,859
8,015
18,660
0
5,000
10,000
15,000
20,000
Mizuho Financial Group97
Foundations for our corporate value
011_7080587452009.indd 97 2020/09/10 14:29:22
Eleven-year major financial data (FY2009-2019) �������������� P. 99Review and analysis for fiscal 2019 �������������� P. 101
Five-year non-financial data ���� P. 105Participation in international initiatives ���������������� P. 106
Mizuho’s global network ������ P. 107
Corporate profile ����������� P. 108
Group companies ���������� P. 109
Data section
2020 Integrated Report 98
011_7080587452009.indd 98 2020/09/10 14:29:22

FY2009 FY2010 FY2011 FY2012 FY2013 FY2014 FY2015 FY2016 FY2017 FY2018 FY2019
Consolidated gross profits 1,996.6 2,025.3 2,003.0 2,171.7 2,035.2 2,247.7 2,221.6 2,092.7 1,915.3 1,812.7 2,062.2
Net interest income 1,151.7 1,109.4 1,088.3 1,075.8 1,108.3 1,129.4 1,003.6 867.8 807.3 762.4 733.5
Fiduciary income 49.1 49.3 49.0 48.5 52.0 52.6 53.4 50.6 55.4 55.1 58.5
Credit costs for trust accounts — — — — — — — — — — —
Net fee and commission income 466.0 458.8 458.9 507.3 560.7 593.3 607.5 603.5 614.3 610.4 619.2
Net trading income 312.3 243.9 150.3 215.0 187.4 262.9 310.5 325.3 275.7 297.3 391.2
Net other operating income 17.4 163.6 256.4 324.8 126.7 209.3 246.4 245.4 162.4 87.3 259.5
General and administrative expenses (1,317.2) (1,277.8) (1,283.8) (1,244.6) (1,258.2) (1,351.6) (1,349.5) (1,467.2) (1,488.9) (1,430.8) (1,378.3)
Consolidated net business profits* 702.6 741.7 719.1 912.1 744.2 876.9 852.8 663.4 457.8 393.3 661.9
Credit-related costs (219.3) (16.6) 27.7 (111.8) 112.8 (4.6) (30.4) (47.5) 156.3 (19.5) (171.7)
Aggregate figures for the 2 banks (157.1) 16.0 24.7 (114.1) 116.6 (7.8) (26.7) (49.3) 153.2 (22.7) (173.7)
Net gains (losses) related to stocks 4.2 (70.5) (38.1) (82.9) 77.0 131.9 205.6 242.1 272.0 274.8 137.1
Net gains (losses) on sales of stocks 88.8 25.7 15.6 46.6 81.5 143.7 225.3 261.1 288.3 305.2 153.7
Losses on impairment (devaluation) of stocks (53.5) (94.4) (49.3) (125.8) (5.3) (5.3) (10.3) (4.8) (5.1) (5.7) (41.6)
Equity in income from investment in affiliates 2.8 (6.1) 2.6 (11.1) 15.4 15.0 24.2 18.8 21.4 51.2 30.3
Other (96.9) (6.1) (62.9) 29.2 5.1 (27.5) (74.0) (101.5) (93.7) (74.2) (41.7)
Ordinary profits 327.1 588.4 648.5 750.3 987.5 1,010.8 997.5 737.5 782.4 614.1 637.8
Net extraordinary gains (losses) 50.6 46.9 67.8 (32.5) (2.2) (20.2) 10.7 46.6 17.5 (497.8) (19.1)
Income taxes – current (18.0) (18.3) (55.3) (50.4) (137.0) (260.2) (213.2) (196.5) (190.1) (161.3) (150.0)
– deferred (25.1) (120.1) (97.4) (7.4) (77.9) (44.7) (69.2) 58.8 (1.4) 163.8 (11.4)
Profit 334.6 496.9 563.6 659.9 770.3 685.6 725.7 646.4 608.3 118.7 457.2
Profit attributable to non-controlling interests (95.2) (83.7) (79.1) (99.4) (81.9) (73.7) (54.7) (42.9) (31.7) (22.1) (8.6)
Profit attributable to owners of parent 239.4 413.2 484.5 560.5 688.4 611.9 670.9 603.5 576.5 96.5 448.5
FY2009 FY2010 FY2011 FY2012 FY2013 FY2014 FY2015 FY2016 FY2017 FY2018 FY2019
Assets 156,253.5 160,812.0 165,360.5 177,411.0 175,822.8 189,684.7 193,458.5 200,508.6 205,028.3 200,792.2 214,659.0
Loans and bills discounted 62,164.5 62,777.7 63,800.5 67,536.8 69,301.4 73,415.1 73,708.8 78,337.7 79,421.4 78,456.9 83,468.1
Securities 43,096.4 44,782.0 51,392.8 53,472.3 43,997.5 43,278.7 39,505.9 32,353.1 34,183.0 29,774.4 34,907.2
Liabilities 150,416.5 154,188.0 158,491.2 169,674.8 167,518.3 179,884.2 184,105.3 191,235.2 195,207.0 191,598.1 205,995.2
Deposits 76,339.7 79,233.9 78,811.9 84,241.9 89,055.5 97,757.5 105,629.0 120,045.2 125,081.2 124,311.0 131,189.6
Negotiable certificates of deposit 10,287.8 9,650.2 11,824.7 15,326.7 12,755.7 15,694.9 11,827.5 10,631.2 11,382.5 13,338.5 13,282.5
Net assets 5,837.0 6,623.9 6,869.2 7,736.2 8,304.5 9,800.5 9,353.2 9,273.3 9,821.2 9,194.0 8,663.8
Total shareholders’ equity 3,207.2 4,248.2 4,762.7 5,174.6 5,676.2 6,131.1 6,559.9 7,001.2 7,388.3 7,303.0 7,561.0
Retained earnings 854.7 1,132.3 1,405.0 1,814.7 2,315.6 2,769.3 3,197.6 3,615.4 4,002.8 3,915.5 4,174.1
Total accumulated other comprehensive income 305.8 80.9 146.6 752.5 781.0 2,029.9 1,607.8 1,520.9 1,677.5 1,445.7 992.9
Non-controlling interests 2,321.7 2,292.1 1,957.6 1,806.4 1,844.0 1,635.5 1,182.6 749.3 754.2 444.5 109.6
FY2009 FY2010 FY2011 FY2012 FY2013 FY2014 FY2015 FY2016 FY2017 FY2018 FY2019
Common Equity Tier 1 capital ratio (consolidated) / / / 8.16 8.80 9.43 10.50 11.34 12.49 12.76 11.65
Tier 1 capital ratio (consolidated) / / / 11.03 11.35 11.50 12.64 13.30 15.44 15.94 14.52
Capital adequacy ratio (BIS standard) (consolidated) 13.46 15.30 15.50 / / / / / / / /Total capital ratio (consolidated) / / / 14.19 14.36 14.58 15.41 16.28 18.24 18.85 17.25
Net assets per share (Yen) 191.53 177.53 187.19 229.70 253.25 322.86 322.46 335.96 357.41 345.00 337.29
Profit attributable to owners of parent per share (Yen) 16.29 20.47 20.62 22.96 28.18 24.91 26.94 23.86 22.72 3.80 17.68
Net return on equity (consolidated) 10.97 11.78 11.36 10.99 11.65 8.60 8.37 7.27 6.55 1.08 5.18
Summary of consolidated performance
Summary of consolidated balance sheet
Financial indicators
* Consolidated gross profits – G&A expenses (excluding non-recurring losses) + Equity in income from investments in affiliates and certain other consolidation adjustments
99 Mizuho Financial Group
Data section
Eleven-year major financial data (FY2009-2019)
010_7080585852009.indd 99 2020/09/15 16:08:15

FY2009 FY2010 FY2011 FY2012 FY2013 FY2014 FY2015 FY2016 FY2017 FY2018 FY2019
Consolidated gross profits 1,996.6 2,025.3 2,003.0 2,171.7 2,035.2 2,247.7 2,221.6 2,092.7 1,915.3 1,812.7 2,062.2
Net interest income 1,151.7 1,109.4 1,088.3 1,075.8 1,108.3 1,129.4 1,003.6 867.8 807.3 762.4 733.5
Fiduciary income 49.1 49.3 49.0 48.5 52.0 52.6 53.4 50.6 55.4 55.1 58.5
Credit costs for trust accounts — — — — — — — — — — —
Net fee and commission income 466.0 458.8 458.9 507.3 560.7 593.3 607.5 603.5 614.3 610.4 619.2
Net trading income 312.3 243.9 150.3 215.0 187.4 262.9 310.5 325.3 275.7 297.3 391.2
Net other operating income 17.4 163.6 256.4 324.8 126.7 209.3 246.4 245.4 162.4 87.3 259.5
General and administrative expenses (1,317.2) (1,277.8) (1,283.8) (1,244.6) (1,258.2) (1,351.6) (1,349.5) (1,467.2) (1,488.9) (1,430.8) (1,378.3)
Consolidated net business profits* 702.6 741.7 719.1 912.1 744.2 876.9 852.8 663.4 457.8 393.3 661.9
Credit-related costs (219.3) (16.6) 27.7 (111.8) 112.8 (4.6) (30.4) (47.5) 156.3 (19.5) (171.7)
Aggregate figures for the 2 banks (157.1) 16.0 24.7 (114.1) 116.6 (7.8) (26.7) (49.3) 153.2 (22.7) (173.7)
Net gains (losses) related to stocks 4.2 (70.5) (38.1) (82.9) 77.0 131.9 205.6 242.1 272.0 274.8 137.1
Net gains (losses) on sales of stocks 88.8 25.7 15.6 46.6 81.5 143.7 225.3 261.1 288.3 305.2 153.7
Losses on impairment (devaluation) of stocks (53.5) (94.4) (49.3) (125.8) (5.3) (5.3) (10.3) (4.8) (5.1) (5.7) (41.6)
Equity in income from investment in affiliates 2.8 (6.1) 2.6 (11.1) 15.4 15.0 24.2 18.8 21.4 51.2 30.3
Other (96.9) (6.1) (62.9) 29.2 5.1 (27.5) (74.0) (101.5) (93.7) (74.2) (41.7)
Ordinary profits 327.1 588.4 648.5 750.3 987.5 1,010.8 997.5 737.5 782.4 614.1 637.8
Net extraordinary gains (losses) 50.6 46.9 67.8 (32.5) (2.2) (20.2) 10.7 46.6 17.5 (497.8) (19.1)
Income taxes – current (18.0) (18.3) (55.3) (50.4) (137.0) (260.2) (213.2) (196.5) (190.1) (161.3) (150.0)
– deferred (25.1) (120.1) (97.4) (7.4) (77.9) (44.7) (69.2) 58.8 (1.4) 163.8 (11.4)
Profit 334.6 496.9 563.6 659.9 770.3 685.6 725.7 646.4 608.3 118.7 457.2
Profit attributable to non-controlling interests (95.2) (83.7) (79.1) (99.4) (81.9) (73.7) (54.7) (42.9) (31.7) (22.1) (8.6)
Profit attributable to owners of parent 239.4 413.2 484.5 560.5 688.4 611.9 670.9 603.5 576.5 96.5 448.5
FY2009 FY2010 FY2011 FY2012 FY2013 FY2014 FY2015 FY2016 FY2017 FY2018 FY2019
Assets 156,253.5 160,812.0 165,360.5 177,411.0 175,822.8 189,684.7 193,458.5 200,508.6 205,028.3 200,792.2 214,659.0
Loans and bills discounted 62,164.5 62,777.7 63,800.5 67,536.8 69,301.4 73,415.1 73,708.8 78,337.7 79,421.4 78,456.9 83,468.1
Securities 43,096.4 44,782.0 51,392.8 53,472.3 43,997.5 43,278.7 39,505.9 32,353.1 34,183.0 29,774.4 34,907.2
Liabilities 150,416.5 154,188.0 158,491.2 169,674.8 167,518.3 179,884.2 184,105.3 191,235.2 195,207.0 191,598.1 205,995.2
Deposits 76,339.7 79,233.9 78,811.9 84,241.9 89,055.5 97,757.5 105,629.0 120,045.2 125,081.2 124,311.0 131,189.6
Negotiable certificates of deposit 10,287.8 9,650.2 11,824.7 15,326.7 12,755.7 15,694.9 11,827.5 10,631.2 11,382.5 13,338.5 13,282.5
Net assets 5,837.0 6,623.9 6,869.2 7,736.2 8,304.5 9,800.5 9,353.2 9,273.3 9,821.2 9,194.0 8,663.8
Total shareholders’ equity 3,207.2 4,248.2 4,762.7 5,174.6 5,676.2 6,131.1 6,559.9 7,001.2 7,388.3 7,303.0 7,561.0
Retained earnings 854.7 1,132.3 1,405.0 1,814.7 2,315.6 2,769.3 3,197.6 3,615.4 4,002.8 3,915.5 4,174.1
Total accumulated other comprehensive income 305.8 80.9 146.6 752.5 781.0 2,029.9 1,607.8 1,520.9 1,677.5 1,445.7 992.9
Non-controlling interests 2,321.7 2,292.1 1,957.6 1,806.4 1,844.0 1,635.5 1,182.6 749.3 754.2 444.5 109.6
FY2009 FY2010 FY2011 FY2012 FY2013 FY2014 FY2015 FY2016 FY2017 FY2018 FY2019
Common Equity Tier 1 capital ratio (consolidated) / / / 8.16 8.80 9.43 10.50 11.34 12.49 12.76 11.65
Tier 1 capital ratio (consolidated) / / / 11.03 11.35 11.50 12.64 13.30 15.44 15.94 14.52
Capital adequacy ratio (BIS standard) (consolidated) 13.46 15.30 15.50 / / / / / / / /Total capital ratio (consolidated) / / / 14.19 14.36 14.58 15.41 16.28 18.24 18.85 17.25
Net assets per share (Yen) 191.53 177.53 187.19 229.70 253.25 322.86 322.46 335.96 357.41 345.00 337.29
Profit attributable to owners of parent per share (Yen) 16.29 20.47 20.62 22.96 28.18 24.91 26.94 23.86 22.72 3.80 17.68
Net return on equity (consolidated) 10.97 11.78 11.36 10.99 11.65 8.60 8.37 7.27 6.55 1.08 5.18
(¥ billion)
(¥ billion)
(%)
1002020 Integrated Report
Data section Eleven-year major financial data
010_7080585852009.indd 100 2020/09/15 16:08:15
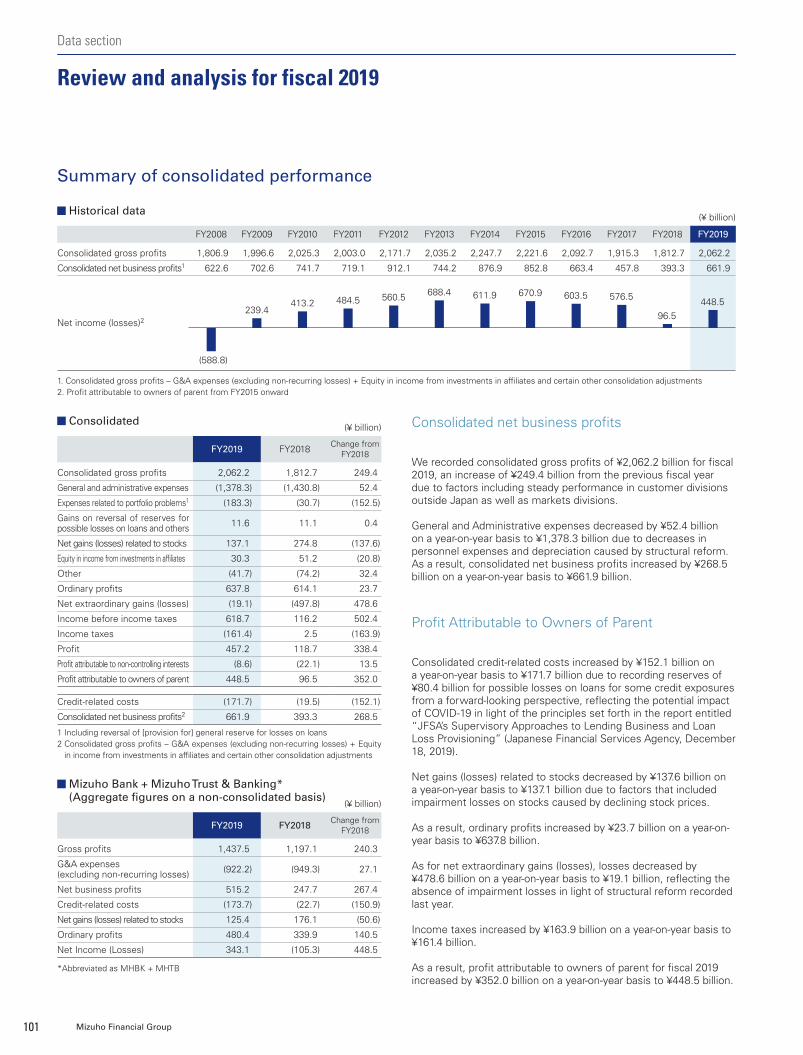
FY2008 FY2009 FY2010 FY2011 FY2012 FY2013 FY2014 FY2015 FY2016 FY2017 FY2018 FY2019
Consolidated gross profits 1,806.9 1,996.6 2,025.3 2,003.0 2,171.7 2,035.2 2,247.7 2,221.6 2,092.7 1,915.3 1,812.7 2,062.2
Consolidated net business profits1 622.6 702.6 741.7 719.1 912.1 744.2 876.9 852.8 663.4 457.8 393.3 661.9
Net income (losses)2
Historical data(¥ billion)
Mizuho Bank + Mizuho Trust & Banking* (Aggregate figures on a non-consolidated basis)
(¥ billion)
Summary of consolidated performance
1. Consolidated gross profits – G&A expenses (excluding non-recurring losses) + Equity in income from investments in affiliates and certain other consolidation adjustments2. Profit attributable to owners of parent from FY2015 onward
Consolidated(¥ billion)
1 Including reversal of [provision for] general reserve for losses on loans2 Consolidated gross profits – G&A expenses (excluding non-recurring losses) + Equity
in income from investments in affiliates and certain other consolidation adjustments
*Abbreviated as MHBK + MHTB
413.2688.4 611.9
(588.8)
239.4560.5484.5
670.9 603.5 576.5 448.596.5
FY2019 FY2018 Change fromFY2018
Consolidated gross profits 2,062.2 1,812.7 249.4
General and administrative expenses (1,378.3) (1,430.8) 52.4
Expenses related to portfolio problems1 (183.3) (30.7) (152.5)
Gains on reversal of reserves for possible losses on loans and others 11.6 11.1 0.4
Net gains (losses) related to stocks 137.1 274.8 (137.6)
Equity in income from investments in affiliates 30.3 51.2 (20.8)
Other (41.7) (74.2) 32.4
Ordinary profits 637.8 614.1 23.7
Net extraordinary gains (losses) (19.1) (497.8) 478.6
Income before income taxes 618.7 116.2 502.4
Income taxes (161.4) 2.5 (163.9)
Profit 457.2 118.7 338.4
Profit attributable to non-controlling interests (8.6) (22.1) 13.5
Profit attributable to owners of parent 448.5 96.5 352.0
Credit-related costs (171.7) (19.5) (152.1)
Consolidated net business profits2 661.9 393.3 268.5
FY2019 FY2018 Change fromFY2018
Gross profits 1,437.5 1,197.1 240.3
G&A expenses (excluding non-recurring losses) (922.2) (949.3) 27.1
Net business profits 515.2 247.7 267.4
Credit-related costs (173.7) (22.7) (150.9)
Net gains (losses) related to stocks 125.4 176.1 (50.6)
Ordinary profits 480.4 339.9 140.5
Net Income (Losses) 343.1 (105.3) 448.5
Consolidated net business profits
We recorded consolidated gross profits of ¥2,062.2 billion for fiscal 2019, an increase of ¥249.4 billion from the previous fiscal year due to factors including steady performance in customer divisions outside Japan as well as markets divisions.
General and Administrative expenses decreased by ¥52.4 billion on a year-on-year basis to ¥1,378.3 billion due to decreases in personnel expenses and depreciation caused by structural reform. As a result, consolidated net business profits increased by ¥268.5 billion on a year-on-year basis to ¥661.9 billion.
Profit Attributable to Owners of Parent
Consolidated credit-related costs increased by ¥152.1 billion on a year-on-year basis to ¥171.7 billion due to recording reserves of ¥80.4 billion for possible losses on loans for some credit exposures from a forward-looking perspective, reflecting the potential impact of COVID-19 in light of the principles set forth in the report entitled “JFSA’s Supervisory Approaches to Lending Business and Loan Loss Provisioning” (Japanese Financial Services Agency, December 18, 2019).
Net gains (losses) related to stocks decreased by ¥137.6 billion on a year-on-year basis to ¥137.1 billion due to factors that included impairment losses on stocks caused by declining stock prices.
As a result, ordinary profits increased by ¥23.7 billion on a year-on-year basis to ¥637.8 billion.
As for net extraordinary gains (losses), losses decreased by ¥478.6 billion on a year-on-year basis to ¥19.1 billion, reflecting the absence of impairment losses in light of structural reform recorded last year.
Income taxes increased by ¥163.9 billion on a year-on-year basis to ¥161.4 billion.
As a result, profit attributable to owners of parent for fiscal 2019 increased by ¥352.0 billion on a year-on-year basis to ¥448.5 billion.
101 Mizuho Financial Group
Review and analysis for fiscal 2019
Data section
010_7080585852009.indd 101 2020/09/15 16:08:15
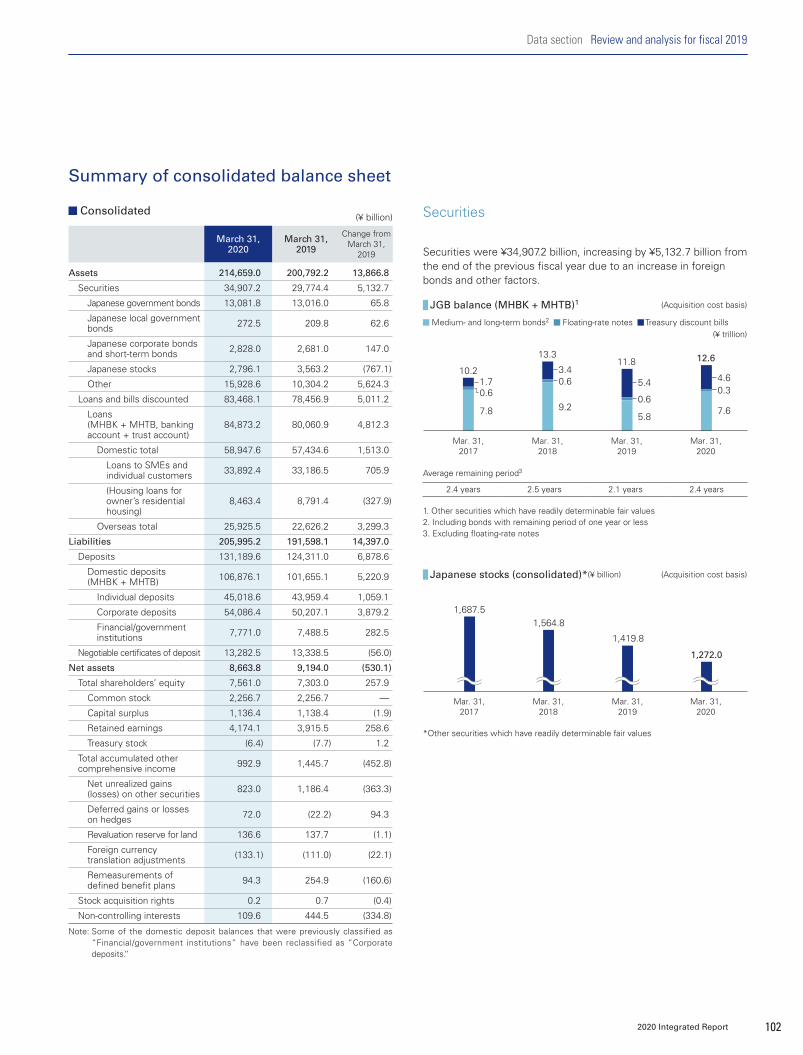
Mar. 31,2017
Mar. 31,2018
1,687.51,564.8
Mar. 31,2019
1,419.8
Mar. 31,2020
1,272.0
Consolidated(¥ billion) Securities
Securities were ¥34,907.2 billion, increasing by ¥5,132.7 billion from the end of the previous fiscal year due to an increase in foreign bonds and other factors.
Summary of consolidated balance sheet
JGB balance (MHBK + MHTB)1 (Acquisition cost basis)
Japanese stocks (consolidated)*(¥ billion) (Acquisition cost basis)
1. Other securities which have readily determinable fair values2. Including bonds with remaining period of one year or less3. Excluding floating-rate notes
*Other securities which have readily determinable fair values
Medium- and long-term bonds2 Floating-rate notes Treasury discount bills (¥ trillion)
2.4 years 2.5 years 2.1 years 2.4 years
Average remaining period3
Mar. 31,2020
5.4
0.6
5.8
11.8
4.60.3
7.6
12.6
Mar. 31,2017
Mar. 31,2019
Mar. 31,2018
1.7
7.8
0.6
10.2 3.40.6
9.2
13.3
Note: Some of the domestic deposit balances that were previously classified as “Financial/government institutions” have been reclassified as “Corporate deposits.”
March 31, 2020
March 31, 2019
Change from March 31,
2019
Assets 214,659.0 200,792.2 13,866.8
Securities 34,907.2 29,774.4 5,132.7
Japanese government bonds 13,081.8 13,016.0 65.8
Japanese local government bonds 272.5 209.8 62.6
Japanese corporate bonds and short-term bonds 2,828.0 2,681.0 147.0
Japanese stocks 2,796.1 3,563.2 (767.1)
Other 15,928.6 10,304.2 5,624.3
Loans and bills discounted 83,468.1 78,456.9 5,011.2
Loans (MHBK + MHTB, banking account + trust account)
84,873.2 80,060.9 4,812.3
Domestic total 58,947.6 57,434.6 1,513.0
Loans to SMEs and individual customers 33,892.4 33,186.5 705.9
(Housing loans for owner’s residential housing)
8,463.4 8,791.4 (327.9)
Overseas total 25,925.5 22,626.2 3,299.3
Liabilities 205,995.2 191,598.1 14,397.0
Deposits 131,189.6 124,311.0 6,878.6
Domestic deposits (MHBK + MHTB) 106,876.1 101,655.1 5,220.9
Individual deposits 45,018.6 43,959.4 1,059.1
Corporate deposits 54,086.4 50,207.1 3,879.2
Financial/government institutions 7,771.0 7,488.5 282.5
Negotiable certificates of deposit 13,282.5 13,338.5 (56.0)
Net assets 8,663.8 9,194.0 (530.1)
Total shareholders’ equity 7,561.0 7,303.0 257.9
Common stock 2,256.7 2,256.7 —
Capital surplus 1,136.4 1,138.4 (1.9)
Retained earnings 4,174.1 3,915.5 258.6
Treasury stock (6.4) (7.7) 1.2
Total accumulated other comprehensive income 992.9 1,445.7 (452.8)
Net unrealized gains (losses) on other securities 823.0 1,186.4 (363.3)
Deferred gains or losses on hedges 72.0 (22.2) 94.3
Revaluation reserve for land 136.6 137.7 (1.1)
Foreign currency translation adjustments (133.1) (111.0) (22.1)
Remeasurements of defined benefit plans 94.3 254.9 (160.6)
Stock acquisition rights 0.2 0.7 (0.4)
Non-controlling interests 109.6 444.5 (334.8)
1022020 Integrated Report
Data section Review and analysis for fiscal 2019
010_7080585852009.indd 102 2020/09/15 16:08:16

March 31, 2020
March 31, 2019
Change from March 31,
2019
Claims against bankrupt and substantially bankrupt obligors 51.0 52.9 (1.9)
Claims with collection risk 386.5 347.6 38.8
Claims for special attention 223.4 159.7 63.6
Subtotal 661.0 560.4 100.5
Normal claims 93,890.9 89,236.8 4,654.1
Total 94,551.9 89,797.2 4,754.7
NPL ratio 0.69% 0.62% 0.07%
Non-performing loans based on the Financial Reconstruction Act (MHBK + MHTB, banking book + trust banking book)
(¥ billion)
Non-performing loans based on the Financial Reconstruction Act (MHBK + MHTB, banking book + trust banking book)
Claims for special attention (¥ trillion) Claims with collection risk (¥ trillion) Claims against bankrupt and substantially bankrupt obligors (¥ trillion) NPL ratio (%)
0.80.5
Mar. 31,2017
Mar. 31,2019
Mar. 31,2018
Mar. 31,2020
0.5 0.6
1.00
0.66 0.62 0.69
Non-performing loans (NPLs)
The combined NPL balance of MHBK and MHTB was ¥661.0 billion, an increase of ¥100.5 billion from fiscal 2018, and the NPL ratio was 0.69%. Both the NPL balance and ratio remain stable in a low position.
Total net assets
Net assets amounted to ¥8,663.8 billion, decreasing by ¥530.1 billion from fiscal 2018 due to a decrease in net unrealized gains (losses) on other securities, and other factors.
Loans
The total of loans was ¥83,468.1 billion, an increase of ¥5,011.2 billion from fiscal 2018, caused primarily by the increases in loans at overseas offices, mainly in the Americas and Europe.
The combined total of loans for MHBK and MHTB was ¥84,873.2 billion, an increase of ¥4,812.3 billion. For our loan balance in Japan, while the balance of personal loans and Japanese government loans decreased, that of large, medium, and small businesses increased, resulting in an overall increase of ¥1,513.0 billion (including a decrease of ¥120.8 billion in loans to the Japanese government and other such obligors). Our loan balance outside Japan (including loans booked offshore) increased by ¥3,299.3 billion, mainly due to an increase in loans especially in the Americas and Europe.
Loan balance (MHBK + MHTB, banking book + trust banking book)
Loan balance in Japan Loan balance outside Japan (¥ trillion)
Mar. 31,2017
Mar. 31,2019
Mar. 31,2018
19.1
56.2
75.4
19.4
55.7
75.2
Mar. 31,2020
22.6
57.4
80.0
25.9
58.9
84.8
Deposits
The total deposits was ¥131,189.6 billion, an increase of ¥6,878.6 billion from fiscal 2018.
The combined deposits in Japan of MHBK and MHTB increased by ¥5,220.9 billion from fiscal 2018 due to factors such as an increase in corporate deposits.
Mar. 31,2017
Mar. 31,2018
92.77.4
41.3
43.9
Mar. 31,2019
6.7
42.8
47.1
96.7 7.7
45.0
54.0
106.8
Mar. 31,2020
7.4
43.9
50.2
101.6
Deposits in Japan (MHBK + MHTB)
Individuals Corporations Financial/government institutions (¥ trillion)
Note: Some of the domestic deposit balances that were previously classified as “Financial/government institutions” have been reclassified as “Corporate deposits.”
103 Mizuho Financial Group
Data section
010_7080585852009.indd 103 2020/09/15 16:08:16
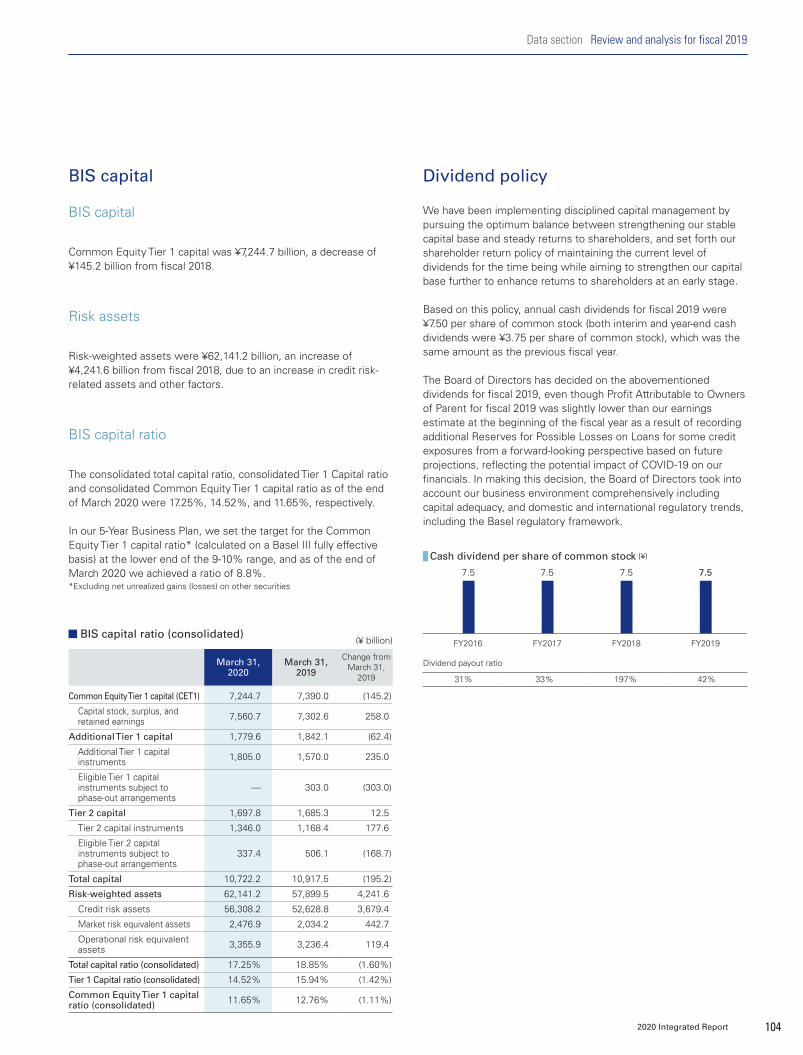
We have been implementing disciplined capital management by pursuing the optimum balance between strengthening our stable capital base and steady returns to shareholders, and set forth our shareholder return policy of maintaining the current level of dividends for the time being while aiming to strengthen our capital base further to enhance returns to shareholders at an early stage.
Based on this policy, annual cash dividends for fiscal 2019 were ¥7.50 per share of common stock (both interim and year-end cash dividends were ¥3.75 per share of common stock), which was the same amount as the previous fiscal year.
The Board of Directors has decided on the abovementioned dividends for fiscal 2019, even though Profit Attributable to Owners of Parent for fiscal 2019 was slightly lower than our earnings estimate at the beginning of the fiscal year as a result of recording additional Reserves for Possible Losses on Loans for some credit exposures from a forward-looking perspective based on future projections, reflecting the potential impact of COVID-19 on our financials. In making this decision, the Board of Directors took into account our business environment comprehensively including capital adequacy, and domestic and international regulatory trends, including the Basel regulatory framework.
Cash dividend per share of common stock (¥)
31% 33% 197% 42%
Dividend payout ratio
FY2016
7.5
FY2017
7.5 7.5
FY2018
7.5
FY2019
BIS capital
Common Equity Tier 1 capital was ¥7,244.7 billion, a decrease of ¥145.2 billion from fiscal 2018.
BIS capital Dividend policy
Risk assets
Risk-weighted assets were ¥62,141.2 billion, an increase of ¥4,241.6 billion from fiscal 2018, due to an increase in credit risk-related assets and other factors.
BIS capital ratio
The consolidated total capital ratio, consolidated Tier 1 Capital ratio and consolidated Common Equity Tier 1 capital ratio as of the end of March 2020 were 17.25%, 14.52%, and 11.65%, respectively.
In our 5-Year Business Plan, we set the target for the Common Equity Tier 1 capital ratio* (calculated on a Basel III fully effective basis) at the lower end of the 9-10% range, and as of the end of March 2020 we achieved a ratio of 8.8%.*Excluding net unrealized gains (losses) on other securities
BIS capital ratio (consolidated)
March 31,2020
March 31,2019
Change from March 31,
2019
Common Equity Tier 1 capital (CET1) 7,244.7 7,390.0 (145.2)
Capital stock, surplus, and retained earnings 7,560.7 7,302.6 258.0
Additional Tier 1 capital 1,779.6 1,842.1 (62.4)
Additional Tier 1 capital instruments 1,805.0 1,570.0 235.0
Eligible Tier 1 capital instruments subject to phase-out arrangements
— 303.0 (303.0)
Tier 2 capital 1,697.8 1,685.3 12.5
Tier 2 capital instruments 1,346.0 1,168.4 177.6
Eligible Tier 2 capital instruments subject to phase-out arrangements
337.4 506.1 (168.7)
Total capital 10,722.2 10,917.5 (195.2)
Risk-weighted assets 62,141.2 57,899.5 4,241.6
Credit risk assets 56,308.2 52,628.8 3,679.4
Market risk equivalent assets 2,476.9 2,034.2 442.7
Operational risk equivalent assets 3,355.9 3,236.4 119.4
Total capital ratio (consolidated) 17.25% 18.85% (1.60%)
Tier 1 Capital ratio (consolidated) 14.52% 15.94% (1.42%)
Common Equity Tier 1 capital ratio (consolidated) 11.65% 12.76% (1.11%)
(¥ billion)
1042020 Integrated Report
Data section Review and analysis for fiscal 2019
010_7080585852009.indd 104 2020/09/15 16:08:16
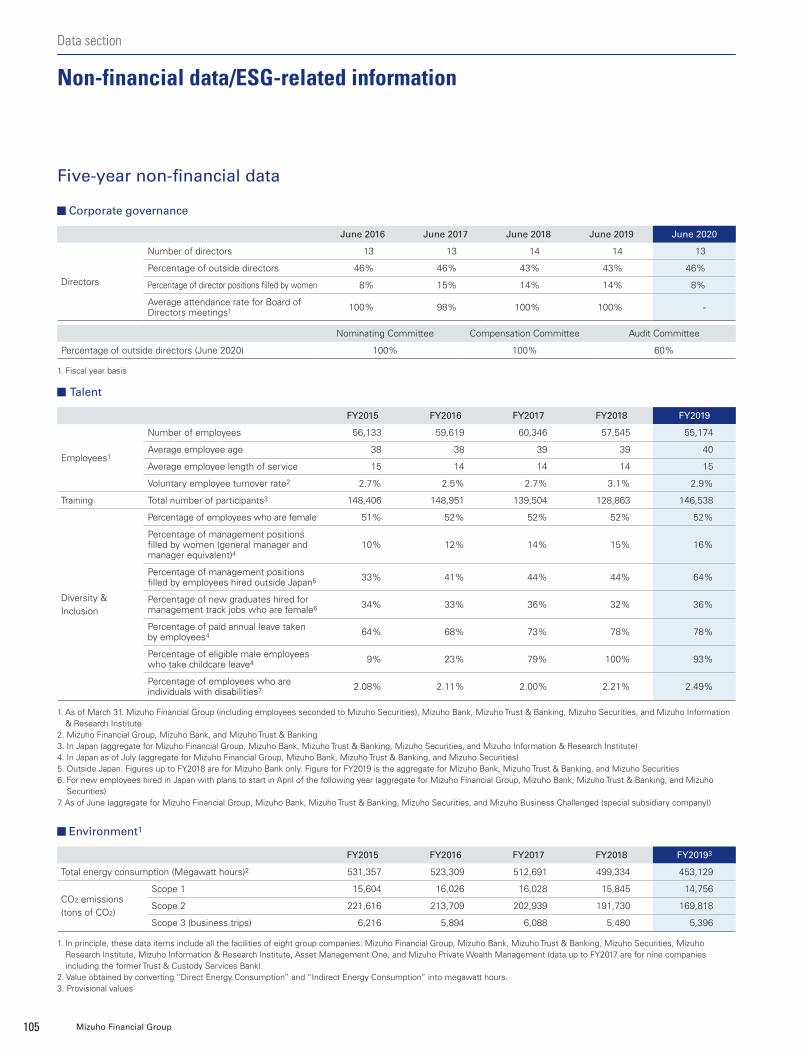
Five-year non-financial data
Talent
Environment1
Corporate governance
Nominating Committee Compensation Committee Audit Committee
Percentage of outside directors (June 2020) 100% 100% 60%
1. Fiscal year basis
FY2015 FY2016 FY2017 FY2018 FY20193
Total energy consumption (Megawatt hours)2 531,357 523,309 512,691 499,334 453,129
CO2 emissions (tons of CO2)
Scope 1 15,604 16,026 16,028 15,845 14,756
Scope 2 221,616 213,709 202,939 191,730 169,818
Scope 3 (business trips) 6,216 5,894 6,088 5,480 5,396
1. In principle, these data items include all the facilities of eight group companies: Mizuho Financial Group, Mizuho Bank, Mizuho Trust & Banking, Mizuho Securities, Mizuho Research Institute, Mizuho Information & Research Institute, Asset Management One, and Mizuho Private Wealth Management (data up to FY2017 are for nine companies including the former Trust & Custody Services Bank).
2. Value obtained by converting “Direct Energy Consumption” and “Indirect Energy Consumption” into megawatt hours.3. Provisional values
FY2015 FY2016 FY2017 FY2018 FY2019
Employees1
Number of employees 56,133 59,619 60,346 57,545 55,174
Average employee age 38 38 39 39 40
Average employee length of service 15 14 14 14 15
Voluntary employee turnover rate2 2.7% 2.5% 2.7% 3.1% 2.9%
Training Total number of participants3 148,406 148,951 139,504 128,863 146,538
Diversity & Inclusion
Percentage of employees who are female 51% 52% 52% 52% 52%
Percentage of management positions filled by women (general manager and manager equivalent)4
10% 12% 14% 15% 16%
Percentage of management positions filled by employees hired outside Japan5 33% 41% 44% 44% 64%
Percentage of new graduates hired for management track jobs who are female6 34% 33% 36% 32% 36%
Percentage of paid annual leave taken by employees4 64% 68% 73% 78% 78%
Percentage of eligible male employees who take childcare leave4 9% 23% 79% 100% 93%
Percentage of employees who are individuals with disabilities7 2.08% 2.11% 2.00% 2.21% 2.49%
1. As of March 31. Mizuho Financial Group (including employees seconded to Mizuho Securities), Mizuho Bank, Mizuho Trust & Banking, Mizuho Securities, and Mizuho Information & Research Institute
2. Mizuho Financial Group, Mizuho Bank, and Mizuho Trust & Banking3. In Japan (aggregate for Mizuho Financial Group, Mizuho Bank, Mizuho Trust & Banking, Mizuho Securities, and Mizuho Information & Research Institute)4. In Japan as of July (aggregate for Mizuho Financial Group, Mizuho Bank, Mizuho Trust & Banking, and Mizuho Securities)5. Outside Japan. Figures up to FY2018 are for Mizuho Bank only. Figure for FY2019 is the aggregate for Mizuho Bank, Mizuho Trust & Banking, and Mizuho Securities6. For new employees hired in Japan with plans to start in April of the following year (aggregate for Mizuho Financial Group, Mizuho Bank, Mizuho Trust & Banking, and Mizuho
Securities)7. As of June (aggregate for Mizuho Financial Group, Mizuho Bank, Mizuho Trust & Banking, Mizuho Securities, and Mizuho Business Challenged (special subsidiary company))
June 2016 June 2017 June 2018 June 2019 June 2020
Directors
Number of directors 13 13 14 14 13
Percentage of outside directors 46% 46% 43% 43% 46%
Percentage of director positions filled by women 8% 15% 14% 14% 8%
Average attendance rate for Board of Directors meetings1 100% 98% 100% 100% -
105 Mizuho Financial Group
Non-financial data/ESG-related information
Data section
010_7080585852009.indd 105 2020/09/15 16:08:16
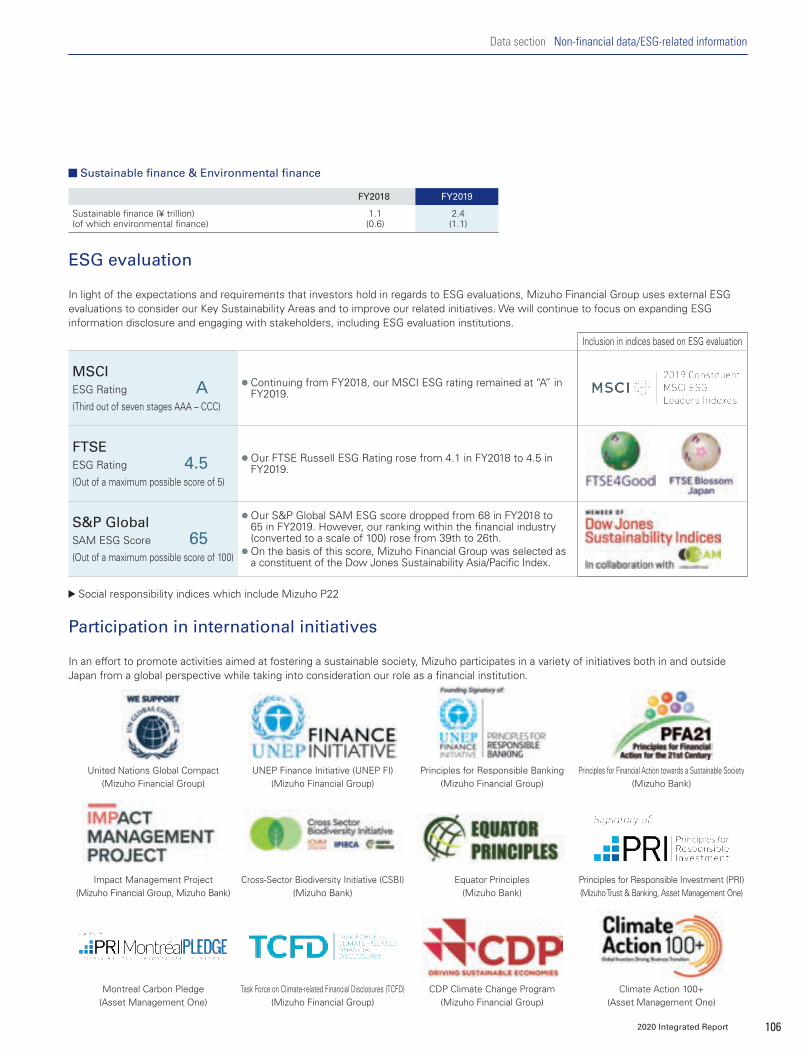
In an effort to promote activities aimed at fostering a sustainable society, Mizuho participates in a variety of initiatives both in and outside Japan from a global perspective while taking into consideration our role as a financial institution.
United Nations Global Compact(Mizuho Financial Group)
UNEP Finance Initiative (UNEP FI)(Mizuho Financial Group)
Principles for Responsible Banking(Mizuho Financial Group)
Principles for Financial Action towards a Sustainable Society(Mizuho Bank)
Impact Management Project(Mizuho Financial Group, Mizuho Bank)
Cross-Sector Biodiversity Initiative (CSBI)(Mizuho Bank)
Equator Principles(Mizuho Bank)
Principles for Responsible Investment (PRI)(Mizuho Trust & Banking, Asset Management One)
Montreal Carbon Pledge(Asset Management One)
Task Force on Climate-related Financial Disclosures (TCFD)(Mizuho Financial Group)
CDP Climate Change Program(Mizuho Financial Group)
Climate Action 100+(Asset Management One)
ESG evaluation
Participation in international initiatives
Sustainable finance & Environmental finance
FY2018 FY2019
Sustainable finance (¥ trillion) (of which environmental finance)
1.1(0.6)
2.4(1.1)
In light of the expectations and requirements that investors hold in regards to ESG evaluations, Mizuho Financial Group uses external ESG evaluations to consider our Key Sustainability Areas and to improve our related initiatives. We will continue to focus on expanding ESG information disclosure and engaging with stakeholders, including ESG evaluation institutions.
Inclusion in indices based on ESG evaluation
MSCIESG Rating A(Third out of seven stages AAA – CCC)
Continuing from FY2018, our MSCI ESG rating remained at “A” in FY2019.
FTSEESG Rating 4.5(Out of a maximum possible score of 5)
Our FTSE Russell ESG Rating rose from 4.1 in FY2018 to 4.5 in FY2019.
S&P GlobalSAM ESG Score 65(Out of a maximum possible score of 100)
Our S&P Global SAM ESG score dropped from 68 in FY2018 to 65 in FY2019. However, our ranking within the financial industry (converted to a scale of 100) rose from 39th to 26th.
On the basis of this score, Mizuho Financial Group was selected as a constituent of the Dow Jones Sustainability Asia/Pacific Index.
Social responsibility indices which include Mizuho P22
1062020 Integrated Report
Data section Non-financial data/ESG-related information
010_7080585852009.indd 106 2020/09/15 16:08:18

Europe, the Middle East, and Africa
Mizuho Bank 17 offices
Mizuho Trust & Banking 1 office
Mizuho Securities 6 offices
Asset Management One 1 office
Mizuho Research Institute 1 office
Mizuho Information & Research Institute 1 office
Americas
Mizuho Bank 26 offices
Mizuho Securities 7 offices
Asset Management One 1 office
Mizuho Research Institute 1 office
Asia and Oceania
Mizuho Bank 43 offices
Mizuho Securities 7 offices
Asset Management One 2 offices
Mizuho Information & Research Institute 2 offices
Total
Mizuho Bank 86 offices
Mizuho Trust & Banking 1 office
Mizuho Securities 20 offices
Asset Management One 4 offices
Mizuho Research Institute 2 offices
Mizuho Information & Research Institute 3 offices
Mizuho’s global network consists of branches, representative offices and overseas subsidiaries.
Beijing
Tianjin
Seoul
Suzhou, Kunshan, Changshu
WuxiShanghai
Toronto
Boston
Manila
TaipeiTaichung
New York
Nassau
Cayman Islands
Mexico City
Houston
Dallas
Leon
Los Angeles
SantiagoSydney
JohannesburgSao Paulo
San Francisco
ChicagoCalgary
Washington, DCAtlanta
Jakarta
Singapore
Phnom Penh
RayongBangkok
Yangon
Thilawa
Kuala Lumpur
Labuan
Ho Chi Minh City
KaohsiungHong Kong
DalianQingdao
Nanjing
London
Hefei
Wuhan
Xiamen
Shenzhen
Guangzhou
Hanoi
Moscow
Vienna
Istanbul
Tehran
New Delhi
Frankfurt
Duesseldorf
Amsterdam
Brussels
LuxembourgMadrid
Paris
Zurich
Milan
BahrainRiyadh
DubaiAhmedabad
Mumbai
Bangalore
Chennai
Abu Dhabi
107 Mizuho Financial Group
Data section
Mizuho’s global network (As of June 30, 2020)
010_7080585852009.indd 107 2020/09/15 16:08:18

Company name: Mizuho Financial Group, Inc
Stock listing (code): Tokyo Stock Exchange (8411)New York Stock Exchange (MFG)
Location of head office: 1-5-5, Otemachi, Chiyoda-ku, Tokyo100-8176, Japan
Representative: Tatsufumi Sakai, President & Group CEO
Capital: ¥2,256.7 billion
Issued shares: 25,392,498,945 shares
Number of employees: 1,677(Total number of employees on a consolidated basis: 57,264)
Date of establishment: January 8, 2003
R&I JCR Moody’s S&P Fitch
Mizuho Financial Group A+ AA- A1 A- A-
Mizuho Bank AA- AA A1 A A-
Mizuho Trust & Banking AA- AA A1 A A-
Mizuho Securities AA- AA A1 A —
(Reference) Japanese Government AA+ AAA A1 A+ A
(As of June 30, 2020) Rating information
Shareholders (common stock) Historical stock price data Tokyo Stock Exchange
Mizuho Financial Group Nikkei Index
Our website provides additional information regarding the business operations of Mizuho Financial Group and our group companies. Sections covering IR, financial information, and our products and services are available in addition to in-depth industry and economic reports.
Additionally, you can sign up for our News Release E-mail Distribution Service to receive updates by email.
www.mizuho-fg.com/
The graph showing Mizuho Financial Group’s stock price and the Nikkei stock price average has been prepared as an index with the closing prices on March 31, 2018 as 100.
Individuals and others
31.94%
Financial institutions
30.02%
Securities companies
4.93%
Other domestic companies
11.72%
National & municipal government
0.03%
Foreign investors
21.36% 140
120
100
60
80
40
March 2020September 2019March 2019September 2018March 2018
Sustibnability
Gain insights into our approach to sustainability.
Financials and Presentations
Access reports, presentations, news, and other investor resources and get details on upcoming events.
https://www.mizuho-fg.com/csr/index.html https://www.mizuho-fg.com/investors/materials/index.html
1082020 Integrated Report
Corporate profile (As of March 31, 2020)
Data section
010_7080585852009.indd 108 2020/09/15 16:08:19
Date of establishment July 1, 2013
Capital ¥1,404.0 billion
Location of head office 1-5-5, Otemachi, Chiyoda-ku, Tokyo 100-8176, Japan
Representative Koji Fujiwara, President & CEO
Number of employees 28,909
Network in Japan 464
Network outside Japan 86
Website www.mizuhobank.com/
Mizuho BankDate of establishment March 12, 2003
Capital ¥247.3 billion
Location of head office 1-2-1, Yaesu, Chuo-ku, Tokyo 103-8670, Japan
Representative Kei Umeda, President & CEO (Appointed on April 1, 2020)
Number of employees 3,424
Network in Japan 60
Network outside Japan 1
Website www.mizuho-tb.co.jp/english/
Mizuho Trust & Banking
Date of establishment January 4, 2013
Capital ¥125.1 billion
Location of head office Otemachi First Square, 1-5-1, Otemachi, Chiyoda-ku, Tokyo 100-0004, Japan
Representative Koichi Iida, President & CEO
Number of employees 7,397
Network in Japan 254
Network outside Japan 20
Website www.mizuho-sc.com/english/
Mizuho Securities
Data section
109 Mizuho Financial Group
Group companies (As of March 31, 2020, except for each company’s network, which is as of June 30, 2020)
010_7080587462009.indd 109 2020/09/02 9:18:25
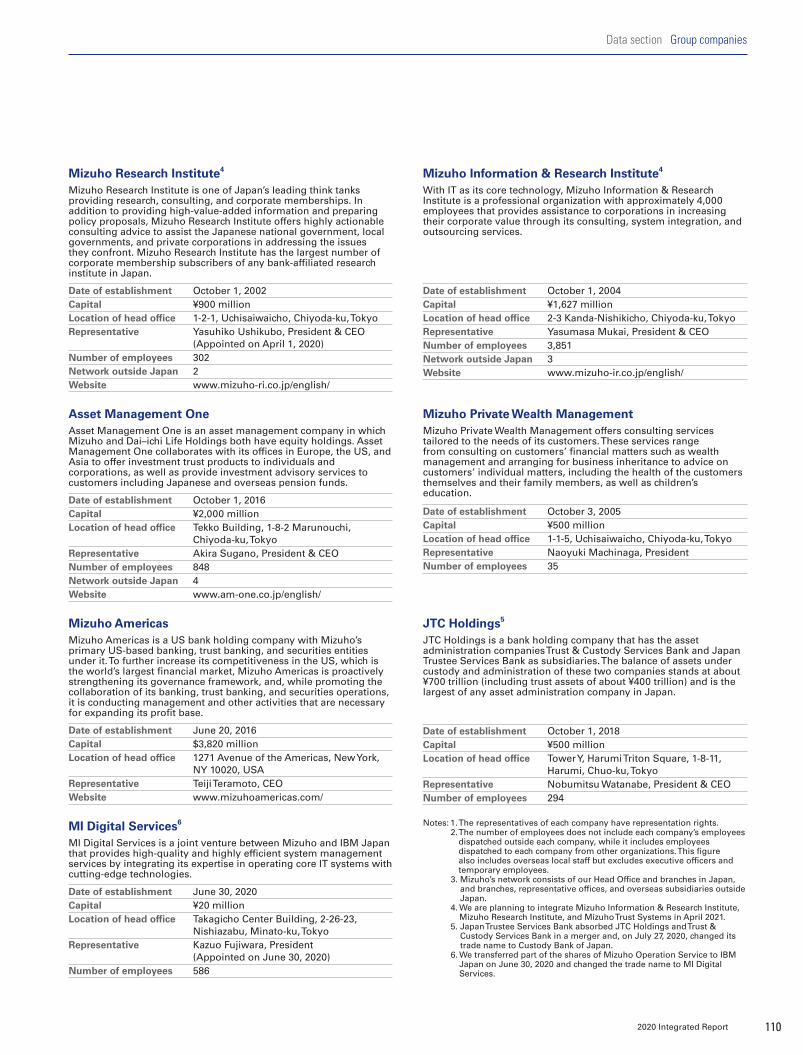
Mizuho Research Institute4
Mizuho Research Institute is one of Japan’s leading think tanks providing research, consulting, and corporate memberships. In addition to providing high-value-added information and preparing policy proposals, Mizuho Research Institute offers highly actionable consulting advice to assist the Japanese national government, local governments, and private corporations in addressing the issues they confront. Mizuho Research Institute has the largest number of corporate membership subscribers of any bank-affiliated research institute in Japan.
Date of establishment October 1, 2002Capital ¥900 millionLocation of head office 1-2-1, Uchisaiwaicho, Chiyoda-ku, TokyoRepresentative Yasuhiko Ushikubo, President & CEO
(Appointed on April 1, 2020)Number of employees 302Network outside Japan 2Website www.mizuho-ri.co.jp/english/
Mizuho Information & Research Institute4
With IT as its core technology, Mizuho Information & Research Institute is a professional organization with approximately 4,000 employees that provides assistance to corporations in increasing their corporate value through its consulting, system integration, and outsourcing services.
Date of establishment October 1, 2004Capital ¥1,627 millionLocation of head office 2-3 Kanda-Nishikicho, Chiyoda-ku, TokyoRepresentative Yasumasa Mukai, President & CEONumber of employees 3,851Network outside Japan 3Website www.mizuho-ir.co.jp/english/
Asset Management OneAsset Management One is an asset management company in which Mizuho and Dai–ichi Life Holdings both have equity holdings. Asset Management One collaborates with its offices in Europe, the US, and Asia to offer investment trust products to individuals and corporations, as well as provide investment advisory services to customers including Japanese and overseas pension funds.
Date of establishment October 1, 2016Capital ¥2,000 millionLocation of head office Tekko Building, 1-8-2 Marunouchi,
Chiyoda-ku, TokyoRepresentative Akira Sugano, President & CEO Number of employees 848Network outside Japan 4Website www.am-one.co.jp/english/
Mizuho Private Wealth ManagementMizuho Private Wealth Management offers consulting services tailored to the needs of its customers. These services range from consulting on customers’ financial matters such as wealth management and arranging for business inheritance to advice on customers’ individual matters, including the health of the customers themselves and their family members, as well as children’s education.
Date of establishment October 3, 2005Capital ¥500 millionLocation of head office 1-1-5, Uchisaiwaicho, Chiyoda-ku, TokyoRepresentative Naoyuki Machinaga, PresidentNumber of employees 35
Mizuho AmericasMizuho Americas is a US bank holding company with Mizuho’s primary US-based banking, trust banking, and securities entities under it. To further increase its competitiveness in the US, which is the world’s largest financial market, Mizuho Americas is proactively strengthening its governance framework, and, while promoting the collaboration of its banking, trust banking, and securities operations, it is conducting management and other activities that are necessary for expanding its profit base.
Date of establishment June 20, 2016Capital $3,820 millionLocation of head office 1271 Avenue of the Americas, New York,
NY 10020, USARepresentative Teiji Teramoto, CEOWebsite www.mizuhoamericas.com/
MI Digital Services6
MI Digital Services is a joint venture between Mizuho and IBM Japan that provides high-quality and highly efficient system management services by integrating its expertise in operating core IT systems with cutting-edge technologies.
Date of establishment June 30, 2020Capital ¥20 millionLocation of head office Takagicho Center Building, 2-26-23,
Nishiazabu, Minato-ku, TokyoRepresentative Kazuo Fujiwara, President
(Appointed on June 30, 2020)Number of employees 586
Notes: 1 . The representatives of each company have representation rights. 2. The number of employees does not include each company’s employees
dispatched outside each company, while it includes employees dispatched to each company from other organizations. This figure also includes overseas local staff but excludes executive officers and temporary employees.
3. Mizuho’s network consists of our Head Office and branches in Japan, and branches, representative offices, and overseas subsidiaries outside Japan.
4. We are planning to integrate Mizuho Information & Research Institute, Mizuho Research Institute, and Mizuho Trust Systems in April 2021.
5. Japan Trustee Services Bank absorbed JTC Holdings and Trust & Custody Services Bank in a merger and, on July 27, 2020, changed its trade name to Custody Bank of Japan.
6. We transferred part of the shares of Mizuho Operation Service to IBM Japan on June 30, 2020 and changed the trade name to MI Digital Services.
JTC Holdings5
JTC Holdings is a bank holding company that has the asset administration companies Trust & Custody Services Bank and Japan Trustee Services Bank as subsidiaries. The balance of assets under custody and administration of these two companies stands at about ¥700 trillion (including trust assets of about ¥400 trillion) and is the largest of any asset administration company in Japan.
Date of establishment October 1, 2018Capital ¥500 millionLocation of head office Tower Y, Harumi Triton Square, 1-8-11,
Harumi, Chuo-ku, TokyoRepresentative Nobumitsu Watanabe, President & CEONumber of employees 294
1102020 Integrated Report
Data section Group companies
010_7080587462009.indd 110 2020/09/02 9:18:25
Reporting items: Mizuho Financial Group has established a hotline
to receive reports from in and outside the company
in connection with problems concerning internal
control and audits of accounts and financial reports.
Contact point: This hotline has been established within an external
law office. Reports can be made via postal mail or
email.
Postal mail: 12th Floor, Kasumigaseki Bldg.,
Kasumigaseki 3-2-5, Chiyoda-ku, Tokyo
100-6012
Mizuho Accounting Hotline, c/o Daiichi
Fuyo Law Office
Email: [email protected]
Approaches to financial alternative dispute resolution (ADR)
• When a report is received concerning the reporting items stipulated
on the left, Mizuho Financial Group will make a reasonable effort
to investigate the facts behind the information received and report
back on the results.
• Anonymous tips are also acceptable, but there are cases where it
will not be possible to fully satisfy the intentions behind such tips
owing to constraints on investigations and the inability to report
back.
• Information on persons making such reports is not disclosed to
third parties other than the group companies except in cases where
the assent of the person in question has been obtained or such
disclosure is required under laws and ordinances.
The designated dispute resolution institution as defined in Japan’s
Banking Act which Mizuho Bank and Mizuho Trust & Banking have
contracted
The Designated Dispute Resolution Institution:
Japanese Bankers Association
Contact: Advisory Center of Japanese Bankers Association
Tel: +81-(0)3-5252-3772
The designated dispute resolution institution as defined in Japan’s
Trust Business Act and Act on Concurrent Operation of Trust
Business by Financial Institutions which Mizuho Trust & Banking has
contracted
The Designated Dispute Resolution Institution:
Trust Companies Association of Japan
Contact: Trust Consultation Center of the Trust Companies
Association of Japan
Tel: +81-(0)3-6206-3988
Internal control and audit hotline
In order to deal expeditiously, fairly, and appropriately with
complaints and other feedback from customers, Mizuho Bank
and Mizuho Trust & Banking have concluded a contract for the
implementation of dispute resolution procedures with the Japanese
Bankers Association, which is a designated dispute resolution
institution as defined in Japan’s Banking Act. Mizuho Trust & Banking
has also concluded a contract for the implementation of dispute
resolution procedures with the Trust Companies Association of
Japan, which is a designated dispute resolution institution as defined
in Japan’s Trust Business Act and Act on Concurrent Operation of
Trust Business by Financial Institutions.
The designated dispute resolution institution takes the steps toward
resolution from a fair and neutral perspective in cases where the
solutions to customers’ complaints adopted by the two banks are not
accepted.
—A system designed for reporting questionable accounting or auditing matters—
111 Mizuho Financial Group
Appendix
Compliance contacts
011_7080587462009.indd 111 2020/09/10 15:23:32
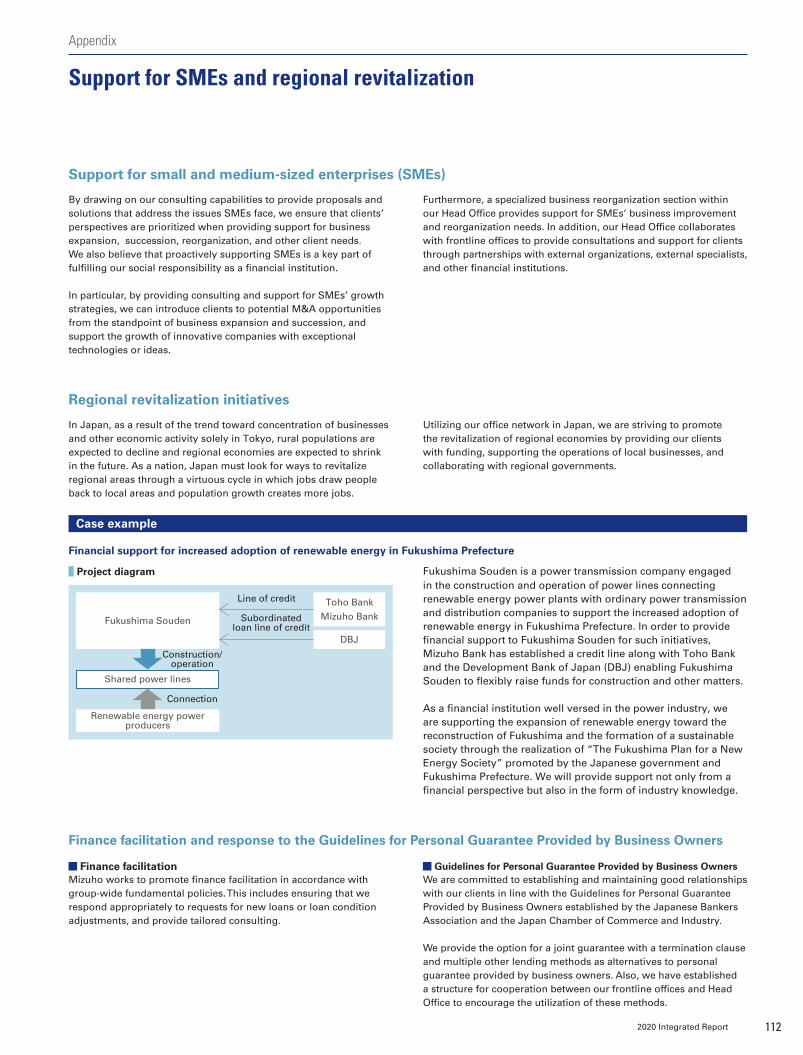
By drawing on our consulting capabilities to provide proposals and solutions that address the issues SMEs face, we ensure that clients’ perspectives are prioritized when providing support for business expansion, succession, reorganization, and other client needs. We also believe that proactively supporting SMEs is a key part of fulfilling our social responsibility as a financial institution.
In particular, by providing consulting and support for SMEs’ growth strategies, we can introduce clients to potential M&A opportunities from the standpoint of business expansion and succession, and support the growth of innovative companies with exceptional technologies or ideas.
Furthermore, a specialized business reorganization section within our Head Office provides support for SMEs’ business improvement and reorganization needs. In addition, our Head Office collaborates with frontline offices to provide consultations and support for clients through partnerships with external organizations, external specialists, and other financial institutions.
Finance facilitation and response to the Guidelines for Personal Guarantee Provided by Business Owners
Finance facilitation Mizuho works to promote finance facilitation in accordance with group-wide fundamental policies. This includes ensuring that we respond appropriately to requests for new loans or loan condition adjustments, and provide tailored consulting.
Guidelines for Personal Guarantee Provided by Business OwnersWe are committed to establishing and maintaining good relationships with our clients in line with the Guidelines for Personal Guarantee Provided by Business Owners established by the Japanese Bankers Association and the Japan Chamber of Commerce and Industry.
We provide the option for a joint guarantee with a termination clause and multiple other lending methods as alternatives to personal guarantee provided by business owners. Also, we have established a structure for cooperation between our frontline offices and Head Office to encourage the utilization of these methods.
Financial support for increased adoption of renewable energy in Fukushima Prefecture
Fukushima Souden is a power transmission company engaged in the construction and operation of power lines connecting renewable energy power plants with ordinary power transmission and distribution companies to support the increased adoption of renewable energy in Fukushima Prefecture. In order to provide financial support to Fukushima Souden for such initiatives, Mizuho Bank has established a credit line along with Toho Bank and the Development Bank of Japan (DBJ) enabling Fukushima Souden to flexibly raise funds for construction and other matters.
As a financial institution well versed in the power industry, we are supporting the expansion of renewable energy toward the reconstruction of Fukushima and the formation of a sustainable society through the realization of “The Fukushima Plan for a New Energy Society” promoted by the Japanese government and Fukushima Prefecture. We will provide support not only from a financial perspective but also in the form of industry knowledge.
Case example
Project diagram
Fukushima Souden
Shared power lines
DBJ
Subordinated loan line of credit
Construction/operation
Connection
Line of credit
Renewable energy power producers
Toho Bank
Mizuho Bank
Support for small and medium-sized enterprises (SMEs)
Regional revitalization initiatives
In Japan, as a result of the trend toward concentration of businesses and other economic activity solely in Tokyo, rural populations are expected to decline and regional economies are expected to shrink in the future. As a nation, Japan must look for ways to revitalize regional areas through a virtuous cycle in which jobs draw people back to local areas and population growth creates more jobs.
Utilizing our office network in Japan, we are striving to promote the revitalization of regional economies by providing our clients with funding, supporting the operations of local businesses, and collaborating with regional governments.
1122020 Integrated Report
Support for SMEs and regional revitalization
Appendix
011_7080587462009.indd 112 2020/09/10 15:23:32
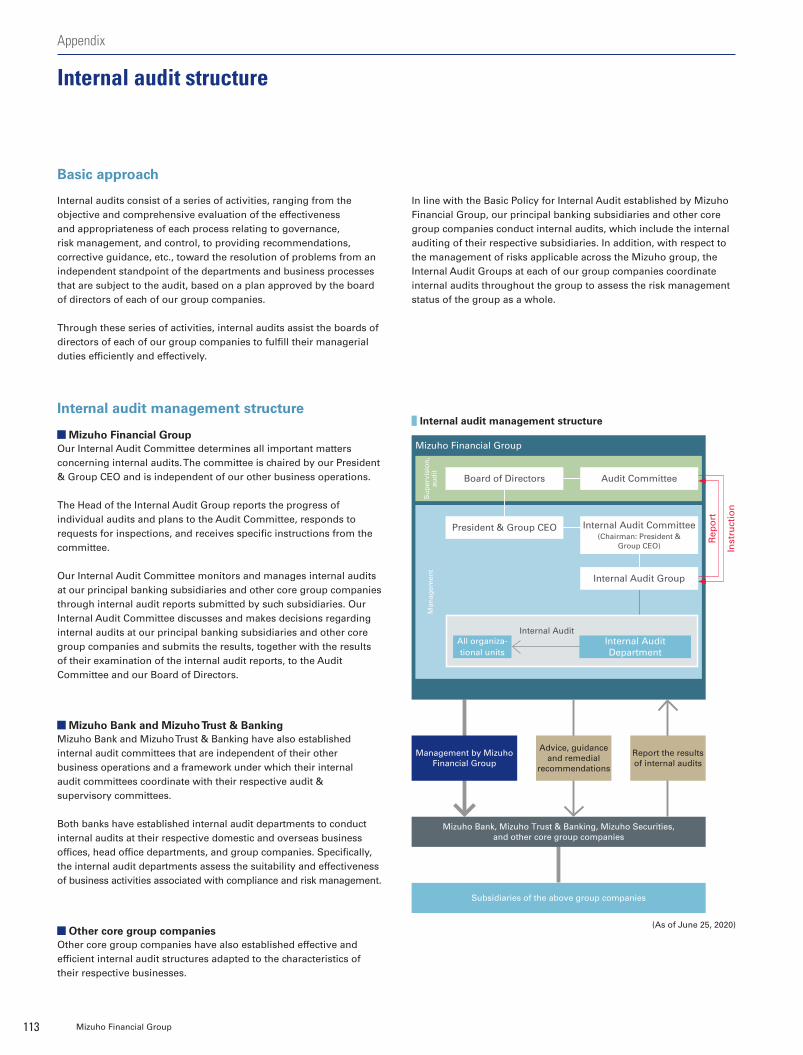
(As of June 25, 2020)
Internal audits consist of a series of activities, ranging from the objective and comprehensive evaluation of the effectiveness and appropriateness of each process relating to governance, risk management, and control, to providing recommendations, corrective guidance, etc., toward the resolution of problems from an independent standpoint of the departments and business processes that are subject to the audit, based on a plan approved by the board of directors of each of our group companies.
Through these series of activities, internal audits assist the boards of directors of each of our group companies to fulfill their managerial duties efficiently and effectively.
Internal audit management structure
Mizuho Financial GroupOur Internal Audit Committee determines all important matters concerning internal audits. The committee is chaired by our President & Group CEO and is independent of our other business operations.
The Head of the Internal Audit Group reports the progress of individual audits and plans to the Audit Committee, responds to requests for inspections, and receives specific instructions from the committee.
Our Internal Audit Committee monitors and manages internal audits at our principal banking subsidiaries and other core group companies through internal audit reports submitted by such subsidiaries. Our Internal Audit Committee discusses and makes decisions regarding internal audits at our principal banking subsidiaries and other core group companies and submits the results, together with the results of their examination of the internal audit reports, to the Audit Committee and our Board of Directors.
Mizuho Bank and Mizuho Trust & BankingMizuho Bank and Mizuho Trust & Banking have also established internal audit committees that are independent of their other business operations and a framework under which their internal audit committees coordinate with their respective audit & supervisory committees.
Both banks have established internal audit departments to conduct internal audits at their respective domestic and overseas business offices, head office departments, and group companies. Specifically, the internal audit departments assess the suitability and effectiveness of business activities associated with compliance and risk management.
Other core group companiesOther core group companies have also established effective and efficient internal audit structures adapted to the characteristics of their respective businesses.
In line with the Basic Policy for Internal Audit established by Mizuho Financial Group, our principal banking subsidiaries and other core group companies conduct internal audits, which include the internal auditing of their respective subsidiaries. In addition, with respect to the management of risks applicable across the Mizuho group, the Internal Audit Groups at each of our group companies coordinate internal audits throughout the group to assess the risk management status of the group as a whole.
Internal audit management structure
Mizuho Financial Group
Board of Directors
President & Group CEO
Audit Committee
Internal Audit Committee(Chairman: President &
Group CEO)
Internal AuditAll organiza-tional units
Internal Audit Department
Internal Audit Group
Management by Mizuho Financial Group
Advice, guidance and remedial
recommendations
Report the results of internal audits
Subsidiaries of the above group companies
Mizuho Bank, Mizuho Trust & Banking, Mizuho Securities, and other core group companies
Su
per
visi
on
, au
dit
Man
agem
ent
Rep
ort
Inst
ruct
ion
Basic approach
113 Mizuho Financial Group
Internal audit structure
Appendix
011_7080587462009.indd 113 2020/09/10 15:23:32
Appendix
Credit risk management
Basic approachWe define credit risk as the Mizuho group’s exposure to the risk of
losses that may be incurred due to a decline in, or total loss of, the
value of assets (including off-balance-sheet instruments), as a result
of deterioration in obligors’ financial position.
Mizuho Financial Group manages credit risk for the group as a
whole. Specifically, Mizuho Financial Group establishes the group’s
fundamental credit risk policy to manage major group companies,
and monitors and manages the credit risks of the group as a whole.
Credit risk management structureOur Board of Directors determines the Mizuho group’s basic
matters pertaining to credit risk management. In addition, the Risk
Management Committee broadly discusses and coordinates matters
relating to basic policies and operations in connection with credit
risk management and matters relating to credit risk monitoring for
the Mizuho group. Under the control of the Group Chief Risk Officer
of Mizuho Financial Group, the Credit Risk Management Department
and the Risk Management Department jointly monitor, analyze, and
submit suggestions concerning credit risk and formulate and execute
plans in connection with basic matters pertaining to credit risk
management.
Our principal banking subsidiaries and other core group companies
manage their credit risk according to the scale and nature of their
exposures in line with basic policies set forth by Mizuho Financial
Group. The Board of Directors of each company determines key
matters pertaining to credit risk management.
The Balance Sheet & Risk Management Committee and the Credit
Committee, each of which is a business policy committee of our
principal banking subsidiaries, are responsible for discussing
and coordinating overall management of their individual credit
portfolios and transaction policies towards obligors. The respective
Chief Risk Officers of our principal banking subsidiaries are
responsible for matters relating to planning and implementing
credit risk management. The credit risk management departments
of our principal banking subsidiaries are in charge of planning and
administering credit risk management and conducting credit risk
measuring and monitoring. The departments regularly present
reports regarding their risk management situation to Mizuho
Financial Group. The credit departments of our principal banking
subsidiaries determine policies and approve/disapprove individual
transactions in terms of credit review, credit management and
collection from obligors in accordance with the lines of authority set
forth respectively by our principal banking subsidiaries. In addition,
our principal banking subsidiaries have established internal audit
groups that are independent of the business departments in order to
ensure appropriate credit risk management.
Method of credit risk managementWe have adopted two different but mutually complementary
approaches to credit risk management. The first approach is
“individual credit management,” in which we manage the process
for each individual transaction and individual obligor from execution
until collection, based on our assessment of the credit quality of the
obligor. Through this process, we curb losses in the case of a credit
event. The second is “credit portfolio management,” in which we
utilize statistical methods to assess the potential for losses related to
credit risk. Through this process, we identify credit risks and respond
appropriately.
Individual credit management
1. Credit code
The basic code of conduct for all of our executive officers and
employees engaged in the credit business is set forth in our credit
code. Seeking to fulfill our mission and social responsibilities, our
basic policy for credit business is determined in light of fundamental
principles focusing on public welfare, safety, growth, and profitability.
2. Internal rating system
One of the most important elements of the risk management
infrastructure of our principal banking subsidiaries is the use of
an internal rating system that consists of credit ratings and pool
allocations. Credit ratings consist of obligor ratings which represent
the level of credit risk of the obligor, and transaction ratings which
represent the possibility of ultimately incurring losses related to
each individual claim by taking into consideration the nature of any
collateral or guarantee and the seniority of the claim.
In principle, obligor ratings apply to all obligors and are subject to
regular reviews at least once a year to reflect promptly the fiscal
period end financial results of the obligors, as well as special reviews
as required whenever an obligor’s credit standing changes. This
enables our principal banking subsidiaries to monitor both individual
1142020 Integrated Report
Risk Management Structure
011_7080587462009.indd 114 2020/09/10 15:23:33
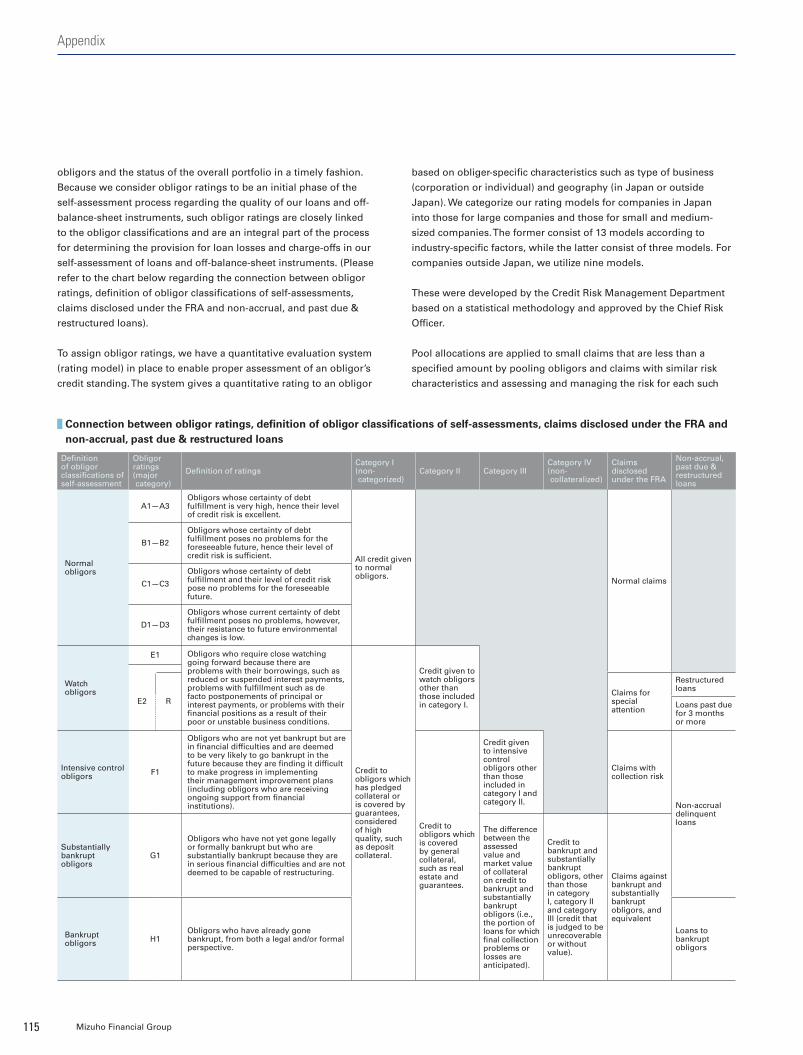
Connection between obligor ratings, definition of obligor classifications of self-assessments, claims disclosed under the FRA and non-accrual, past due & restructured loans
obligors and the status of the overall portfolio in a timely fashion.
Because we consider obligor ratings to be an initial phase of the
self-assessment process regarding the quality of our loans and off-
balance-sheet instruments, such obligor ratings are closely linked
to the obligor classifications and are an integral part of the process
for determining the provision for loan losses and charge-offs in our
self-assessment of loans and off-balance-sheet instruments. (Please
refer to the chart below regarding the connection between obligor
ratings, definition of obligor classifications of self-assessments,
claims disclosed under the FRA and non-accrual, and past due &
restructured loans).
To assign obligor ratings, we have a quantitative evaluation system
(rating model) in place to enable proper assessment of an obligor’s
credit standing. The system gives a quantitative rating to an obligor
based on obliger-specific characteristics such as type of business
(corporation or individual) and geography (in Japan or outside
Japan). We categorize our rating models for companies in Japan
into those for large companies and those for small and medium-
sized companies. The former consist of 13 models according to
industry-specific factors, while the latter consist of three models. For
companies outside Japan, we utilize nine models.
These were developed by the Credit Risk Management Department
based on a statistical methodology and approved by the Chief Risk
Officer.
Pool allocations are applied to small claims that are less than a
specified amount by pooling obligors and claims with similar risk
characteristics and assessing and managing the risk for each such
Definition of obligor classifications of self-assessment
Obligor ratings( major category)
Definition of ratingsCategory I( non-categorized)
Category II Category IIICategory IV( non-collateralized)
Claims disclosed under the FRA
Non-accrual, past due & restructured loans
Normalobligors
A1—A3Obligors whose certainty of debt fulfillment is very high, hence their level of credit risk is excellent.
All credit given to normal obligors.
Normal claims
B1—B2
Obligors whose certainty of debt fulfillment poses no problems for the foreseeable future, hence their level of credit risk is sufficient.
C1—C3
Obligors whose certainty of debt fulfillment and their level of credit risk pose no problems for the foreseeable future.
D1—D3
Obligors whose current certainty of debt fulfillment poses no problems, however, their resistance to future environmental changes is low.
Watchobligors
E1 Obligors who require close watching going forward because there are problems with their borrowings, such as reduced or suspended interest payments, problems with fulfillment such as de facto postponements of principal or interest payments, or problems with their financial positions as a result of their poor or unstable business conditions.
Credit to obligors which has pledged collateral or is covered by guarantees, considered of high quality, such as deposit collateral.
Credit given to watch obligors other than those included in category I. E2 R
Claims for special attention
Restructured loans
Loans past due for 3 months or more
Intensive controlobligors F1
Obligors who are not yet bankrupt but are in financial difficulties and are deemed to be very likely to go bankrupt in the future because they are finding it difficult to make progress in implementing their management improvement plans (including obligors who are receiving ongoing support from financial institutions).
Credit to obligors which is covered by general collateral, such as real estate and guarantees.
Credit given to intensive control obligors other than those included in category I and category II.
Claims with collection risk
Non-accrual delinquent loans
Substantiallybankruptobligors
G1
Obligors who have not yet gone legally or formally bankrupt but who are substantially bankrupt because they are in serious financial difficulties and are not deemed to be capable of restructuring.
The difference between the assessed value and market value of collateral on credit to bankrupt and substantially bankrupt obligors (i.e., the portion of loans for which final collection problems or losses are anticipated).
Credit to bankrupt and substantially bankrupt obligors, other than those in category I, category II and category III (credit that is judged to be unrecoverable or without value).
Claims against bankrupt and substantially bankrupt obligors, and equivalent
Bankrupt obligors H1
Obligors who have already gone bankrupt, from both a legal and/or formal perspective.
Loans to bankrupt obligors
Appendix
115 Mizuho Financial Group
011_7080587462009.indd 115 2020/09/10 15:23:33

Appendix Risk Management Structure
pool. Our principal banking subsidiaries efficiently manage credit
risk and credit screening by dispersing a sufficient number of small
claims within each pool.
Our principal banking subsidiaries generally review the
appropriateness and effectiveness of our approach to obligor ratings
and pool allocations once a year in accordance with predetermined
procedures, which is audited by the Internal Audit Group.
Mizuho Financial Group defines a Restructured Loan as a loan
extended to watch obligors when the following conditions are met:
we are aiming for business reconstruction or financial support;
and lending conditions were amended favorably to the obligor
such as allowing interest rate reduction, postponement of principal
repayment/interest payment, debt forgiveness, etc.
An overdue loan is defined as a loan for watch obligors of which
the loan principal or interest is overdue for three months or more
following the contractual payment date.
Normal obligors
Calculate the value of estimated loss based on the probability of failure over the coming year for loans by obligor rating and appropriate it for the General reserve for possible losses on loans.
Watch obligors
Calculate the estimated loss on loans based on the probability of failure over the next three years and appropriate it for the general reserve for possible losses on loans. Further, in regard to special attention obligors, for obligors with large claims more than a certain amount, if the cash flow from the return of principal and interest payments can reasonably be estimated, set up a reserve under the DCF method.
Intensive control obligors
Provide an amount for specific reserve for possible losses on loans as calculated by one of the following methods after deducting amounts anticipated to be recoverable from the sale of collateral held against the claims and from guarantors of the claims: a) an amount calculated based on the overall ability of the obligor to pay, or b) the estimated loss calculated on the basis of the balance and the probability of failure over the next three years.
Further, for obligors with large claims more than a certain amount, if the cash flow from the return of principal and interest payments can reasonably be estimated, set up a reserve under the DCF method.
Substantially bankrupt obligors Provide the entire balance after deducting amounts anticipated to be recoverable from the sale of collateral held against the claims and from
guarantors of the claims for specific reserve for possible losses on loans, or write-off the entire balance.
Bankrupt obligors
Methods for reserves and write-offs
3. Self-assessment, provision for loan losses and off-balance-sheet
instruments, and write-offs
We conduct self-assessment of assets to ascertain the status of assets
both as an integral part of credit risk management and in preparation
for appropriate accounting treatment, including provision for loan
losses and off-balance-sheet instruments and write-offs. During the
process of self-assessment, obligors are categorized into certain
groups taking into consideration their financial condition and their
ability to make payments, and credit ratings are assigned to all
obligors, in principle, to reflect the extent of their credit risks. The
related assets are then categorized into certain classes based on the
risk of impairment. This process allows us to identify and control the
actual quality of assets and determine the appropriate accounting
treatment, including provision for loan losses and off-balance-sheet
instruments and write-offs. Specifically, the credit risk management
department of each of our principal subsidiaries is responsible
for the overall control of the self-assessment of assets of the
respective banking subsidiaries, cooperating with the administrative
departments specified for each type of asset, including loan portfolios
and securities, in executing and managing self-assessments.
In our assessment of the probability of obligor bankruptcy, we deem
an obligor that is rated as being insolvent or lower as being bankrupt.
4. Credit review
Prevention of new impaired loans through routine credit
management is important in maintaining the quality of our overall
loan assets.
Credit review involves analysis and screening of each potential
transaction within the relevant business department. In
case the screening exceeds the authority of the department, the
credit department in charge at Head Office carries out the review.
The credit group has specialist departments for different industries,
business sizes, and regions, carries out timely and specialized
examinations based on the characteristics of the client and its
market, and provides appropriate advice to the business department.
In addition, in the case of obligors with low credit ratings and high
downside risks, the business department and credit department
jointly clarify their credit policy and in appropriate cases assist the
obligors at an early stage in working towards credit soundness.
1162020 Integrated Report
011_7080587462009.indd 116 2020/09/10 15:23:33

Loss distribution
Frequency
Credit VAR
Unexpected Loss
Loss amount
Expected Loss
Average
This amount depends on the confidence interval. For example, if the confidence interval is set at 99%, it is the 9,900th smallest loss figure out of 10,000 trials.
liabilities for acceptances and guarantees; deposits and foreign
exchange; derivatives including swaps and options; off-balance sheet
items including commitments; and other assets involving credit risk.
In establishing transaction spread guidelines for credit transactions,
we aim to ensure an appropriate return from the transaction in light
of the level of risk by utilizing credit cost data as a reference.
Also, we monitor our credit portfolio from various perspectives
and set guidelines noted below so that losses incurred through a
hypothetical realization of the full Credit VAR would be within the
amount of risk capital and loan loss reserves.
2. Risk control methods
Our principal banking subsidiaries have established guidelines to
manage “credit concentration risk,” which stems from granting
excessive credit to certain corporate groups. Our principal banking
subsidiaries also set the credit limit based on a verification of the
status of capital adequacy. In cases where the limit is exceeded, our
principal banking subsidiaries will formulate a handling policy and/or
action plan.
In addition to the above, our principal banking subsidiaries monitor
total credit exposure, credit exposure per rating, credit concentration
per corporate group, geographic area, and business sector to
make a periodical report to the Balance Sheet & Risk Management
Committee and the Credit Committee.
Credit portfolio management
1. Risk measurement
We use statistical methodologies that involve a risk measurement
system (enterprise value corporate valuation model, holding period
of one year) to manage the possibility of losses by measuring the
expected average loss for a one-year risk horizon (“Expected Loss”)
and the maximum loss within a certain confidence interval (“Credit
VAR”). The difference between Expected Loss and Credit VAR is
measured as the credit risk amount (“Unexpected Loss”).
The risk measurement system covers the following account
items reported by each Mizuho Financial Group company: credit
transactions including loans and discounts; securities; clients’
Appendix
117 Mizuho Financial Group
011_7080587462009.indd 117 2020/09/10 15:23:33
Appendix Risk Management Structure
Market risk management
Basic approachWe define market risk as the risk of losses incurred by the group due
to fluctuations in interest rates, stock prices, and foreign exchange
rates. Our definition includes the risk of losses incurred when it
becomes impossible to execute transactions in the market because
of market confusion or losses arising from transactions at prices that
are significantly less favorable than usual.
Mizuho Financial Group manages market risk for the Mizuho group
as a whole. Specifically, Mizuho Financial Group establishes the
fundamental risk management policy for the entire group, manages
the market risk of our principal banking subsidiaries and other core
group companies, and monitors how the group’s market risk is being
managed as a whole.
Market risk management structureOur Board of Directors determines basic matters pertaining to market
risk management policies. The Risk Management Committee of
Mizuho Financial Group broadly discusses and coordinates matters
relating to basic policies in connection with market risk management,
market risk operations, and market risk monitoring. The Group CRO
of Mizuho Financial Group is responsible for matters relating to
market risk management planning and operations.
The Risk Management Department of Mizuho Financial Group is
responsible for monitoring market risk, reporting and analysing,
making proposals, setting limits and guidelines, and formulating and
implementing plans relating to market risk management.
As for the situation of market risk, the Risk Management Department
submits reports to the President and Group CEO on a daily basis
and to the Board of Directors on a regular basis. For the purpose
of managing the market risk of our principal banking subsidiaries
and other core group companies, the Department regularly receives
reports from each of them to properly identify and manage their
market risk. These subsidiaries and core group companies, which
account for most of the Mizuho group’s exposure to market risk,
establish their basic policies based on ours, and their Boards of
Directors determine important matters relating to market risk
management.
Market risk management methodTo manage market risk, we set limits that correspond to risk capital
allocations according to the risk profile of each of our principal
banking subsidiaries and other core group companies and thereby
prevent the overall market risk we hold from exceeding our financial
strength represented by capital and other indicators. The amount of
risk capital allocated to market risk corresponds to value-at-risk (the
“VAR”) and additional costs that may arise in order to close relevant
positions.
Setting limits
When the above mentioned limits are set, various factors are
taken into account, including business strategies, historical limit
usage ratios, risk-bearing capacity (profits, equity capital, and risk
management framework), profit targets and the market liquidity of
the products involved. The limits are discussed and coordinated by
the Risk Management Committee, discussed further by the Executive
Management Committee and then determined by the President &
Group CEO. For trading and banking activities, we set limits for VAR
and for losses. For banking activities, we set position limits based
on interest rate sensitivity (10 BPV) as needed. An excess over any
of these limits is immediately reported and addressed according to a
pre-determined procedure.
Monitoring
To provide a system of mutual checks and balances in market
operations, we have established middle offices specializing in risk
management that are independent of front offices which engage in
market transactions and of back offices which are responsible for
book entries and settlements. When VAR is not adequate to control
risk, the middle offices manage risk using additional risk indices,
carry out stress testing, and set stop loss limits as needed. We
monitor market liquidity risk for individual financial products in the
market while taking turnover and other factors into consideration.
1182020 Integrated Report
011_7080587462009.indd 118 2020/09/10 15:23:33
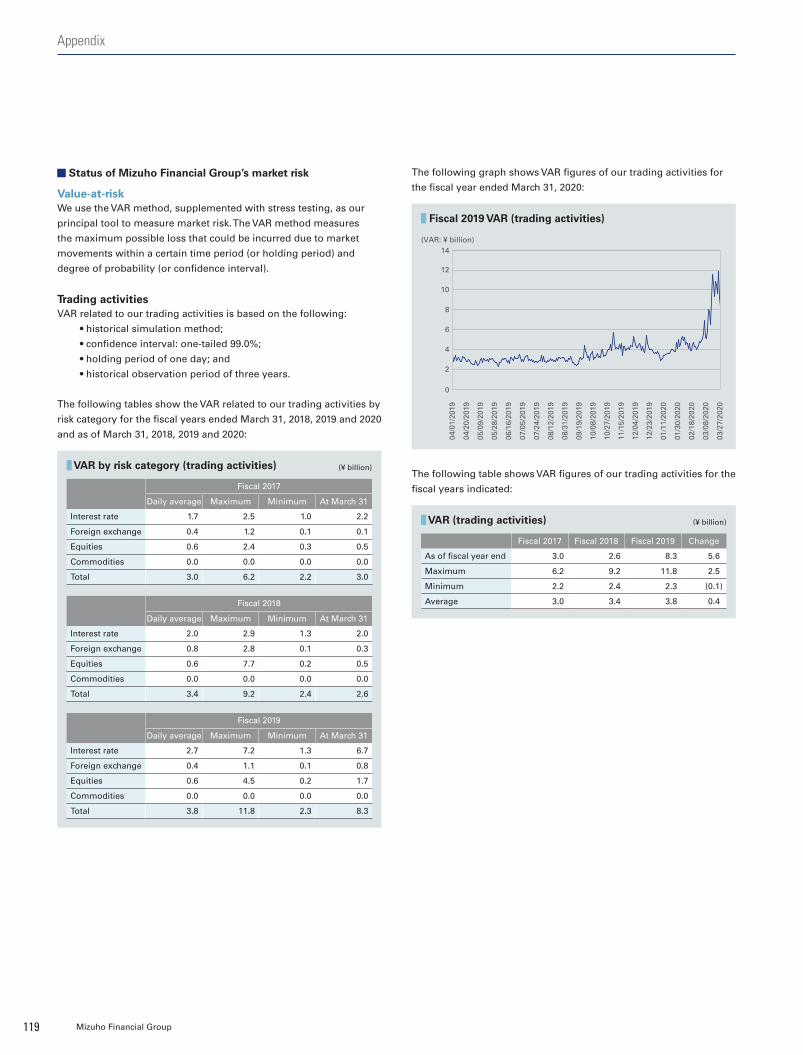
Fiscal 2019
Daily average Maximum Minimum At March 31
Interest rate 2.7 7.2 1.3 6.7
Foreign exchange 0.4 1.1 0.1 0.8
Equities 0.6 4.5 0.2 1.7
Commodities 0.0 0.0 0.0 0.0
Total 3.8 11.8 2.3 8.3
Fiscal 2017
Daily average Maximum Minimum At March 31
Interest rate 1.7 2.5 1.0 2.2
Foreign exchange 0.4 1.2 0.1 0.1
Equities 0.6 2.4 0.3 0.5
Commodities 0.0 0.0 0.0 0.0
Total 3.0 6.2 2.2 3.0
Fiscal 2018
Daily average Maximum Minimum At March 31
Interest rate 2.0 2.9 1.3 2.0
Foreign exchange 0.8 2.8 0.1 0.3
Equities 0.6 7.7 0.2 0.5
Commodities 0.0 0.0 0.0 0.0
Total 3.4 9.2 2.4 2.6
The following graph shows VAR figures of our trading activities for
the fiscal year ended March 31, 2020:
(¥ billion)
Fiscal 2017 Fiscal 2018 Fiscal 2019 Change
As of fiscal year end 3.0 2.6 8.3 5.6
Maximum 6.2 9.2 11.8 2.5
Minimum 2.2 2.4 2.3 (0.1)
Average 3.0 3.4 3.8 0.4
VAR (trading activities)
The following table shows VAR figures of our trading activities for the
fiscal years indicated:
(¥ billion) VAR by risk category (trading activities)
Status of Mizuho Financial Group’s market risk
Value-at-riskWe use the VAR method, supplemented with stress testing, as our
principal tool to measure market risk. The VAR method measures
the maximum possible loss that could be incurred due to market
movements within a certain time period (or holding period) and
degree of probability (or confidence interval).
Trading activitiesVAR related to our trading activities is based on the following:
• historical simulation method;
• confidence interval: one-tailed 99.0%;
• holding period of one day; and
• historical observation period of three years.
The following tables show the VAR related to our trading activities by
risk category for the fiscal years ended March 31, 2018, 2019 and 2020
and as of March 31, 2018, 2019 and 2020:
Appendix
119 Mizuho Financial Group
(VAR: ¥ billion)
0
4
2
6
8
10
12
14
04/0
1/20
19
04/2
0/20
19
05/0
9/20
19
05/2
8/20
19
06/1
6/20
19
07/0
5/20
19
07/2
4/20
19
08/1
2/20
19
08/3
1/20
19
09/1
9/20
19
10/0
8/20
19
10/2
7/20
19
11/1
5/20
19
12/0
4/20
19
12/2
3/20
19
01/1
1/20
20
01/3
0/20
20
02/1
8/20
20
03/0
8/20
20
03/2
7/20
20
Fiscal 2019 VAR (trading activities)
011_7080587462009.indd 119 2020/09/10 15:23:33
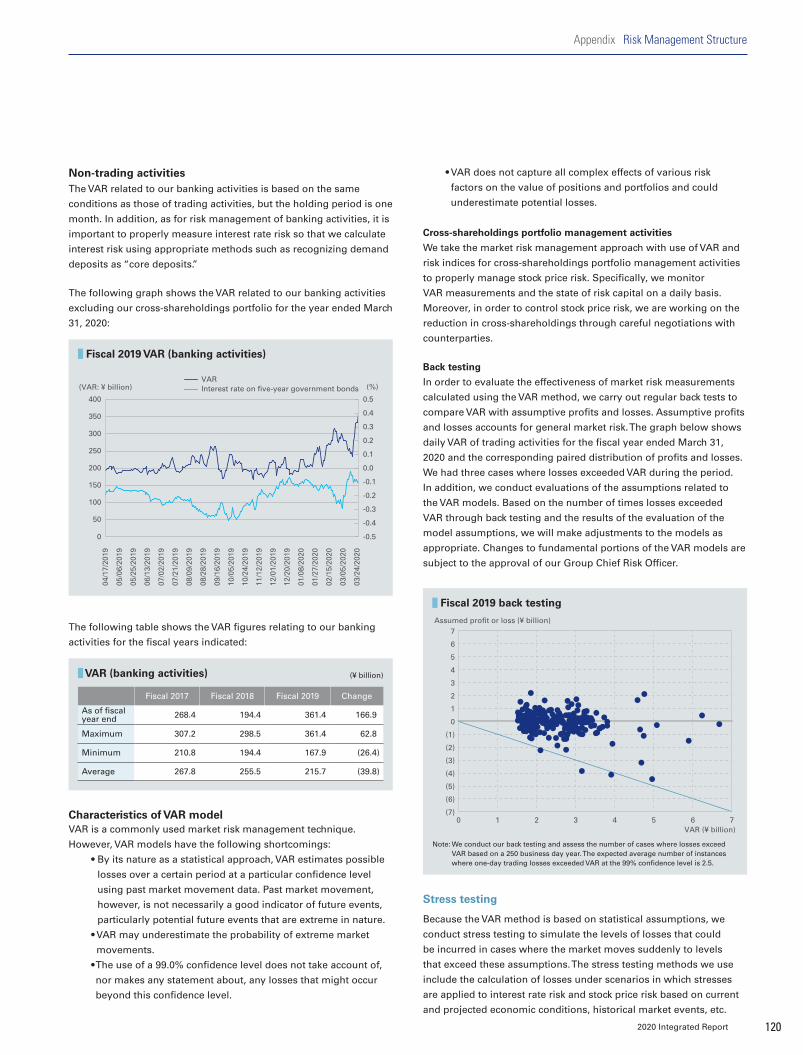
Appendix Risk Management Structure
The following table shows the VAR figures relating to our banking
activities for the fiscal years indicated:
(¥ billion)
Fiscal 2017 Fiscal 2018 Fiscal 2019 Change
As of fiscal year end 268.4 194.4 361.4 166.9
Maximum 307.2 298.5 361.4 62.8
Minimum 210.8 194.4 167.9 (26.4)
Average 267.8 255.5 215.7 (39.8)
VAR (banking activities)
Fiscal 2019 back testing
Note: We conduct our back testing and assess the number of cases where losses exceed VAR based on a 250 business day year. The expected average number of instances where one-day trading losses exceeded VAR at the 99% confidence level is 2.5.
Assumed profit or loss (¥ billion)
VAR (¥ billion)
(7)
7
(4)
(3)
(5)
(6)
(2)
(1)
1
2
4
5
6
3
0
0 1 2 3 4 5 6 7
Non-trading activitiesThe VAR related to our banking activities is based on the same
conditions as those of trading activities, but the holding period is one
month. In addition, as for risk management of banking activities, it is
important to properly measure interest rate risk so that we calculate
interest risk using appropriate methods such as recognizing demand
deposits as “core deposits.”
The following graph shows the VAR related to our banking activities
excluding our cross-shareholdings portfolio for the year ended March
31, 2020:
Characteristics of VAR modelVAR is a commonly used market risk management technique.
However, VAR models have the following shortcomings:
• By its nature as a statistical approach, VAR estimates possible
losses over a certain period at a particular confidence level
using past market movement data. Past market movement,
however, is not necessarily a good indicator of future events,
particularly potential future events that are extreme in nature.
• VAR may underestimate the probability of extreme market
movements.
• The use of a 99.0% confidence level does not take account of,
nor makes any statement about, any losses that might occur
beyond this confidence level.
• VAR does not capture all complex effects of various risk
factors on the value of positions and portfolios and could
underestimate potential losses.
Cross-shareholdings portfolio management activities
We take the market risk management approach with use of VAR and
risk indices for cross-shareholdings portfolio management activities
to properly manage stock price risk. Specifically, we monitor
VAR measurements and the state of risk capital on a daily basis.
Moreover, in order to control stock price risk, we are working on the
reduction in cross-shareholdings through careful negotiations with
counterparties.
Back testing
In order to evaluate the effectiveness of market risk measurements
calculated using the VAR method, we carry out regular back tests to
compare VAR with assumptive profits and losses. Assumptive profits
and losses accounts for general market risk. The graph below shows
daily VAR of trading activities for the fiscal year ended March 31,
2020 and the corresponding paired distribution of profits and losses.
We had three cases where losses exceeded VAR during the period.
In addition, we conduct evaluations of the assumptions related to
the VAR models. Based on the number of times losses exceeded
VAR through back testing and the results of the evaluation of the
model assumptions, we will make adjustments to the models as
appropriate. Changes to fundamental portions of the VAR models are
subject to the approval of our Group Chief Risk Officer.
Stress testing
Because the VAR method is based on statistical assumptions, we
conduct stress testing to simulate the levels of losses that could
be incurred in cases where the market moves suddenly to levels
that exceed these assumptions. The stress testing methods we use
include the calculation of losses under scenarios in which stresses
are applied to interest rate risk and stock price risk based on current
and projected economic conditions, historical market events, etc.
(VAR: ¥ billion) (%)VARInterest rate on five-year government bonds
04/1
7/20
19
05/0
6/20
19
05/2
5/20
19
06/1
3/20
19
07/0
2/20
19
07/2
1/20
19
08/0
9/20
19
08/2
8/20
19
09/1
6/20
19
10/0
5/20
19
10/2
4/20
19
11/1
2/20
19
12/0
1/20
19
12/2
0/20
19
01/0
8/20
20
01/2
7/20
20
02/1
5/20
20
03/0
5/20
20
03/2
4/20
20
0
50
100
150
200
250
300
400
350
-0.5
-0.3
-0.2
-0.4
-0.1
0.0
0.1
0.2
0.3
0.4
0.5
Fiscal 2019 VAR (banking activities)
1202020 Integrated Report
011_7080587462009.indd 120 2020/09/10 15:23:33

Liquidity categorization
We have established a group-wide framework of liquidity risk stages
such as “normal,” “anxious” and “crisis,” which reflects funding
conditions. In addition, we set early warning indicators (“EWIs”)
and monitor on a daily basis to manage funding conditions. The
EWIs we use include stock prices, credit ratings, amount of liquidity
reserve assets such as Japanese government bonds, and our funding
situation.
Liquidity risk management indicators
Limits on funds raised in the market are set based on a number of
time horizons taking into account characteristics and strategies of
each of our principal banking subsidiaries and other core group
companies. Such limits are discussed and coordinated by the
Risk Management Committee, discussed further by the Executive
Management Committee, and determined by the President & Group
CEO. An excess over any of these limits is immediately reported and
addressed according to a pre-determined procedure.
Liquidity stress testing
We carry out stress testing regularly based on market-wide factors,
idiosyncratic factors of the group, and a combination of both types
of factors to verify the sufficiency of liquidity reserve assets and the
effectiveness of our liquidity contingency funding plans. Furthermore,
we utilize stress testing for evaluating the appropriateness of our
annual funding plan.
Liquidity risk management
Basic approachWe define liquidity risk as the risk of losses arising from funding
difficulties due to a deterioration in our financial position that
makes it difficult for us to raise necessary funds or that forces
us to raise funds at significantly higher interest rates than usual.
Mizuho Financial Group manages liquidity risk for the Mizuho group
as a whole. Specifically, Mizuho Financial Group establishes the
fundamental liquidity risk management policy for the entire group,
manages the liquidity risk of our principal banking subsidiaries and
other core group companies, and monitors how the group’s liquidity
risk is being managed as a whole.
Liquidity risk management structureOur Board of Directors determines basic matters pertaining to
liquidity risk management policies. The Risk Management Committee
of Mizuho Financial Group broadly discusses and coordinates
matters relating to basic policies in connection with liquidity risk
management, operations, and monitoring, and proposes responses
to emergencies such as sudden market changes. The Group Chief
Risk Officer of Mizuho Financial Group is responsible for matters
relating to liquidity risk management planning and operations.
The Risk Management Department of Mizuho Financial Group is
responsible for monitoring liquidity risk, reporting and analysing,
making proposals, and formulating and implementing plans relating
to liquidity risk management. In addition, the Group Chief Financial
Officer of Mizuho Financial Group is additionally responsible for
matters relating to planning and running cash flow management
operations, and the Financial Planning Department is responsible
for monitoring and adjusting the cash flow management situation
and for planning and implementing cash flow management to
maintain appropriate funding liquidity. Reports on liquidity risk
management are submitted to the Risk Management Committee
and the Balance Sheet Management Committee (each of which is a
business policy committee), the Executive Management Committee
and the President & Group CEO on a regular basis.
Our principal banking subsidiaries and other core group companies
also establish their basic policies on liquidity risk management to
properly identify and manage liquidity risk.
Liquidity risk management methodWe manage liquidity risk with the use of “liquidity risk management
indicators” and “liquidity categorization.” The former is determined
for the purpose of managing limits on funds raised in the market
considering our fund raising capabilities, and the latter is determined
based on our funding conditions. We also carry out liquidity stress
testing to verify the sufficiency of liquidity reserve assets and the
effectiveness of countermeasures against a possible outflow of funds
during a stress event. The results of stress testing are used for cash
flow management operations.
Appendix
121 Mizuho Financial Group
011_7080587462009.indd 121 2020/09/10 15:23:33

Appendix Risk Management Structure
Operational risk management
Basic approachWe define operational risk as the risk of losses that may be incurred
resulting from inadequate or failed internal processes or systems,
human error, or external events. We control operational risk
management for the Mizuho group as a whole. Considering that
operational risk includes information technology risk, operations risk,
legal risk, human capital risk, tangible asset risk, regulatory risk, and
reputational risk, we have separately determined the fundamental
risk management policies for these different types of risk. We
manage the operational risk associated with our principal banking
subsidiaries and other core group companies while monitoring the
state of group-wide operational risk.
Definition Principal risk management methods
Information technology risk
Information technology risk (“IT risk”) shall refer to the risk that problems (e.g. malfunctions, disruptions, etc.) with the computer systems or improper use of the computers in these systems, which cause disruptions of the services provided to customers, or have significant impact on settlement systems, etc., will result in losses for customers, and the incurrence of losses (tangible or intangible) by our group companies.
• Identify and evaluate the risk by setting specific standards that need to be complied with and implementing measures tailored based on evaluation results to reduce the risk.
• Ensure ongoing project management in systems development and quality control.
• Strengthen security to prevent information leaks.• Strengthen capabilities for rapidly and effectively dealing with
cyberattacks.• Improve effectiveness of emergency responses by improving
backup systems and holding drills.
Operations risk
The risk of customers incurring a loss or the risk of the group incurring tangible and/or intangible losses due to the disruption of services to customers or major incidents affecting settlement systems, etc., as a result of inadequate operations caused by fraudulent acts, errors or negligence, etc., of senior executives or employees, or inadequacies in the operational structure itself.
• Establish clearly defined procedures for handling operations.• Periodically check the status of operational processes.• Conduct training and development programs led by Head Office.• Introduce information technology, office automation, and
centralization for operations.• Improve the effectiveness of emergency responses by holding drills.
Legal riskRisk that the group may incur losses due to violation of laws and regulations, breach of contract, entering into improper contracts or, other legal factors.
• Review and confirm legal issues, including the legality of material decisions, agreements and external documents, etc.
• Collect and distribute legal information and conduct internal training programs.
• Analyze and manage issues related to lawsuits.
Human capital risk
Risk that the group may incur losses due to turnover or loss of personnel, deterioration of morale, inadequate development of personnel, inappropriate working schedules, inappropriate working and safety environment, inequality or inequity in human resource management, or discriminatory conduct.
• Conduct employee satisfaction surveys.• Understand the status of working hours.• Understand the status of vacation days taken by personnel.• Understand the status of voluntary resignations.• Understand the status of the stress check system.
Tangible asset risk
Risk that the group may incur losses from damage to tangible assets or a decline in the quality of the working environment as a result of disasters, criminal actions, or defects in asset maintenance.
• Manage the planning and implementation of construction projects related to the repair and replacement of facilities.
• Identify and evaluate the status of damage to tangible assets caused by natural disasters or other causes, and respond appropriately to such damage.
Regulatory riskRisk that the group may incur losses due to changes in various regulations or systems, such as those related to law, taxation, and accounting.
• Understand important changes in regulations or systems that have significant influence on our business operations or financial condition in a timely and accurate manner.
• Analyze degree of influence of regulatory changes and establish countermeasures.
• Continuously monitor our regulatory risk management mentioned above.
Reputational risk
Risk that the group may incur losses due to damage to our credibility or the value of the “Mizuho” brand when market participants or others learn about, or the media reports on, various adverse events, including actual materialization of risks or false rumors.
• Establish framework to identify and manage, on an integrated basis, information that may have a serious impact on group management and respond to such risk in a manner appropriate to its scale and nature.
• Swiftly identify rumors and devise appropriate responses depending on the urgency and possible impact of the situation to minimize possible losses.
We also recognize and manage information security risk and compliance risk, which constitute a combination of more than one of the above components, as operational risk.
1222020 Integrated Report
011_7080587462009.indd 122 2020/09/10 15:23:33

Operational risk management structureOur Board of Directors determines basic matters pertaining to
operational risk management policies. The Risk Management
Committee of Mizuho Financial Group broadly discusses and
coordinates matters relating to basic policies in connection with
operational risk management, operational risk operations, and
operational risk monitoring. The Group Chief Risk Officer of Mizuho
Financial Group is responsible for matters relating to operational
risk management planning and operations. The Risk Management
Department of Mizuho Financial Group is responsible for monitoring
market risk, reporting and analysing, making proposals, setting limits
and guidelines, and formulating and implementing plans relating to
operational risk management.
Our principal banking subsidiaries and core group companies
establish their basic policies on operational risk management, and
their Boards of Directors determine important matters relating to
operational risk management.
Definition of risks and risk management methodsAs shown in the table on the previous page, we have defined
each component of operational risk, and we apply appropriate risk
management methods in accordance with the scale and nature of
each risk.
Measurement of operational risk equivalent1. Implementation of the Advanced Measurement Approach
(AMA)We have adopted the AMA for the calculation of operational risk
equivalent in association with capital adequacy ratios based on the
Basel Accords. However, we use the Basic Indicator Approach for
entities that are deemed to be less important in the measurement of
operational risk equivalent.
The measurement results under the AMA are used not only as the
operational risk equivalent in the calculation of capital adequacy
ratios but also as Operational VAR for internal risk management
purposes for implementing action plans to reduce operational risk,
and other countermeasures.
2. Outline of the AMAOutline of the measurement system
We have established our model by taking account of four elements:
internal loss data; external loss data; scenario analysis and business
environment; and internal control factors (BEICFs). We calculate
the operational risk amount by estimating the maximum loss,
using a 99.9th percentile one-tailed confidence interval and a one-
year holding period as operational risk equivalent, employing both
internal loss data (i.e., actually experienced operational loss events),
and scenario data to reflect unexperienced potential future loss
events in the measurement.
In the measurement of operational risk equivalent as of March 31,
2020, we did not exclude expected losses and also did not recognize
the risk mitigating impact of insurance. In addition, we did not take
into account the events related to credit risk in measuring operational
risk equivalent.
Operational risk management methodTo manage operational risk, we set common rules for data gathering
to develop various databases shared by the group and measure
operational risk as operational VAR on a regular basis, taking into
account possible future loss events and changes in the business
environment and internal management.
We have established and are strengthening management methods
and systems to appropriately identify, assess, measure, monitor,
and control the operational risks that arise from the growing
sophistication and diversification of financial operations and
developments relating to information technology by utilizing control
self-assessments and improving measurement methods.
Control self-assessmentsAn autonomous method of risk management in which risk inherent
in operations is identified and, after evaluating and monitoring
risks that remain despite implementing risk control, the necessary
measures are implemented to reduce risk.
Appendix
123 Mizuho Financial Group
011_7080587462009.indd 123 2020/09/10 15:23:33
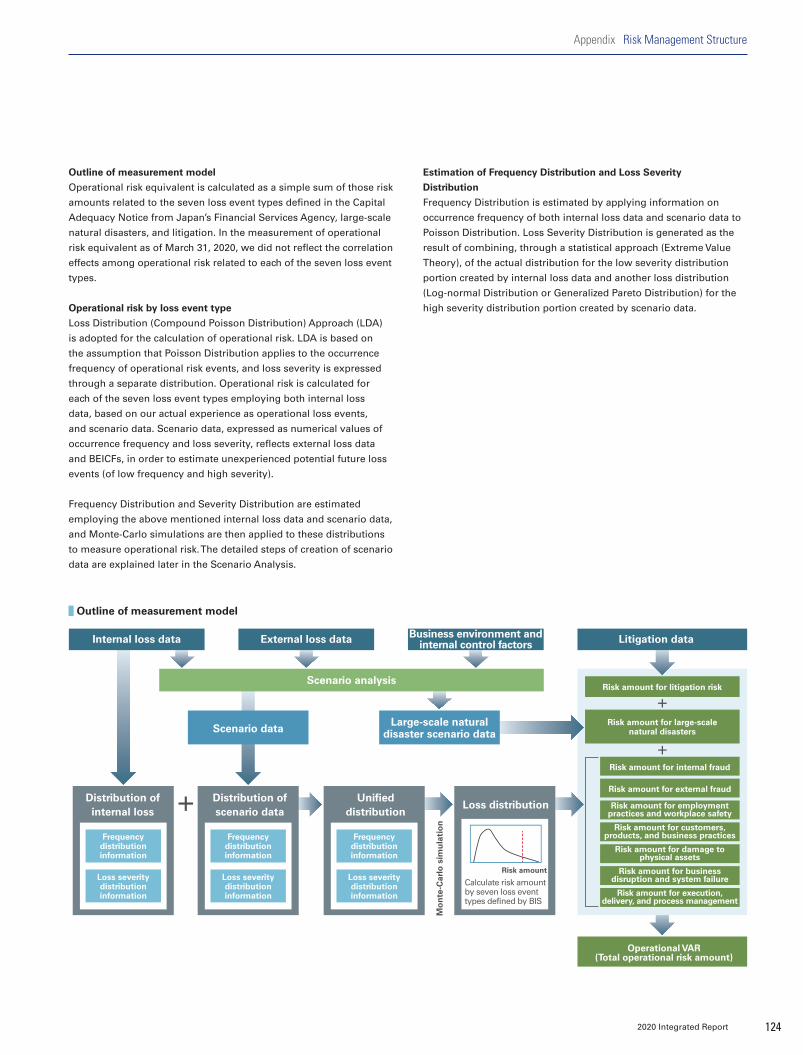
Appendix Risk Management Structure
Outline of measurement model
Operational risk equivalent is calculated as a simple sum of those risk
amounts related to the seven loss event types defined in the Capital
Adequacy Notice from Japan’s Financial Services Agency, large-scale
natural disasters, and litigation. In the measurement of operational
risk equivalent as of March 31, 2020, we did not reflect the correlation
effects among operational risk related to each of the seven loss event
types.
Operational risk by loss event type
Loss Distribution (Compound Poisson Distribution) Approach (LDA)
is adopted for the calculation of operational risk. LDA is based on
the assumption that Poisson Distribution applies to the occurrence
frequency of operational risk events, and loss severity is expressed
through a separate distribution. Operational risk is calculated for
each of the seven loss event types employing both internal loss
data, based on our actual experience as operational loss events,
and scenario data. Scenario data, expressed as numerical values of
occurrence frequency and loss severity, reflects external loss data
and BEICFs, in order to estimate unexperienced potential future loss
events (of low frequency and high severity).
Frequency Distribution and Severity Distribution are estimated
employing the above mentioned internal loss data and scenario data,
and Monte-Carlo simulations are then applied to these distributions
to measure operational risk. The detailed steps of creation of scenario
data are explained later in the Scenario Analysis.
Estimation of Frequency Distribution and Loss Severity
Distribution
Frequency Distribution is estimated by applying information on
occurrence frequency of both internal loss data and scenario data to
Poisson Distribution. Loss Severity Distribution is generated as the
result of combining, through a statistical approach (Extreme Value
Theory), of the actual distribution for the low severity distribution
portion created by internal loss data and another loss distribution
(Log-normal Distribution or Generalized Pareto Distribution) for the
high severity distribution portion created by scenario data.
Frequencydistributioninformation
Loss severitydistributioninformation
Frequencydistributioninformation
Loss severitydistributioninformation
Frequencydistributioninformation
Loss severitydistributioninformation
Scenario analysis
Scenario data
Distribution ofinternal loss
Distribution ofscenario data
Unifieddistribution
Operational VAR(Total operational risk amount)
Risk amount for litigation risk
Risk amount for large-scalenatural disasters
Risk amount for internal fraud
Risk amount for external fraud
Risk amount for employmentpractices and workplace safety
Risk amount for customers,products, and business practices
Risk amount for damage tophysical assets
Risk amount for businessdisruption and system failure
Risk amount for execution,delivery, and process management
Mo
nte
-Car
lo s
imu
lati
on
Internal loss data External loss data Business environment andinternal control factors Litigation data
Large-scale naturaldisaster scenario data
Risk amount
Loss distribution
Calculate risk amountby seven loss eventtypes defined by BIS
Outline of measurement model
1242020 Integrated Report
011_7080587462009.indd 124 2020/09/10 15:23:33

Setting units for scenario analysis
In order to ensure completeness and sufficiency, we set units that
are commonly applied across group entities that adopt AMA (the
“Group Entities”) by referencing and categorizing risk scenarios
recognized through control self-assessment, internal loss data of
the Group Entities, external loss data, etc. Then each of the Group
Entities selects the unit on which scenario analysis is conducted from
the units established on a group-wide basis in accordance with its
business activities and operational risk profile.
Estimation of occurrence frequency
Basic occurrence frequency (once a year) is calculated for each
scenario analysis unit. If a certain scenario analysis unit has relevant
internal loss data of a pre-determined threshold amount or above,
its basic occurrence frequency is calculated based on such data, and
if not, the basic occurrence frequency (the occurrence frequency per
year of losses at or above a pre-determined threshold) is calculated
with reference to the situation of occurrence of internal loss data of
less than the threshold amount and/or external loss data. The basic
occurrence frequency is then adjusted within a pre-determined range
for the purpose of reflecting the most recent BEICFs to determine the
final occurrence frequency.
Estimation of Loss Severity Distribution
In order to estimate Loss Severity Distribution, we use a pre-
determined series of severity ranges. Basic Loss Severity Distribution
is calculated for each scenario analysis unit as an occurrence ratio
(in percentile figures) of loss at each severity range when losses
at or above a pre-determined threshold occurred, with reference
to transaction amount data, external loss data, etc. Then the basic
severity distribution is adjusted, if necessary, from the viewpoint
of statistical data processing to determine the final Loss Severity
Distribution.
Creation of scenario data
For each scenario analysis unit, scenario data is generated as a series
of combinations of occurrence frequency per year at each severity
range, based on the final occurrence frequency and the final Loss
Severity Distribution.
Example of scenario data
Severity range (¥ billion)Total
0.1 0.5 1 5 10
Occurrence ratio (%) 40 30 15 10 5 100
Occurrence frequency(times) 0.4 0.3 0.15 0.1 0.05 1
Final loss severity distribution
Final occurrence frequency
Operational risk of large-scale natural disasters
Monte-Carlo simulation is applied to the datasets expressed as a
combination of the probability of occurrence of large-scale natural
disasters and the probable loss amount in case of such occurrence,
as opposed to estimating Frequency Distribution and Loss Severity
Distribution.
Operational risk of litigation
Each litigation is converted into data according to the profile of the
individual litigation to which Monte-Carlo simulation is applied, as
opposed to estimating Frequency Distribution and Loss Severity
Distribution.
Verification
We confirm the appropriateness of the measurement model by
verifying it, in principle, semi-annually.
3. Scenario analysisOutline of scenario analysis
In the process of scenario analysis, scenario data is created as
numerical values of occurrence frequency and loss severity reflecting
external loss data and BEICFs, in order to estimate unexperienced
potential future operational risk events (of low frequency and high
severity).
As for external loss data, we refer to data publicly reported by
domestic and overseas media, and such data are reflected in the
estimation of occurrence frequency and Loss Severity Distribution in
the process of scenario analysis. In addition, BEICFs are utilized as
indices to adjust occurrence frequency and Loss Severity Distribution
in the process of scenario analysis.
We categorize scenario analysis into four approaches in accordance
with the characteristics of each loss event type and risk management
structures.
At Mizuho Financial Group, loss event types to which Approach A is
applied account for a considerable amount of operational risk. The
detailed process of Approach A is explained here as a typical example
of scenario analysis.
Approach Loss event type(s) to be applied
A Internal fraud / external fraud / clients, products, and business practices / execution, delivery, and process management
B Employment practices and workplace safety
C Damage to physical assets
D Business disruption and system failure
Appendix
125 Mizuho Financial Group
011_7080587462009.indd 125 2020/09/10 15:23:34

In light of our social responsibility and the important role Mizuho
plays within the social infrastructure as a financial institution,
ensuring the continuity of financial settlement functions and the swift
and efficient recovery of operations in the event of an emergency is
one of our top priorities within the group.
To improve business continuity management practices across the
group, we assess the potential impact of emergencies beforehand
and formulate necessary countermeasures in order to minimize such
impact, and to ensure the swift and efficient recovery of operations.
One of the ways in which we are working to achieve this is by
establishing Crisis Management Offices within Mizuho Financial
Group, Mizuho Bank, Mizuho Trust & Banking, and Mizuho Securities
that are responsible for business continuity management and our
responses in the event of emergency.
These offices function as a controller in the event of an emergency
that may materially impact business management, by collecting and
analyzing information, formulating countermeasures, and taking
other necessary action. In addition, their role includes collecting and
analyzing signs and indicators of a potential crisis, and reporting
their findings promptly to management.
Particular focus is placed on strengthening our response to natural
disasters, covering not only earthquakes and tsunamis but also
volcanic eruptions, large-scale wind or water damage, and facilitating
initial responses to acts of terrorism and riots. We also focus on
responses to cyberattacks that have been occurring with increasing
frequency around the world.
Also, to secure the effectiveness of our measures to deal with
emergencies, group-wide practice drills and training sessions are
conducted on an annual basis.
Response to COVID-19
In response to the COVID-19 outbreak that began in January 2020,
we established Emergency Response Headquarters at Mizuho
Financial Group, Mizuho Bank, Mizuho Trust & Banking, and
Mizuho Securities to address the situation as it developed. Since
then, coordinating our efforts through these headquarters, we
have been taking measures to prevent further spread of the virus,
with our customers’ health and safety as our highest priority.
Because we provide financial infrastructure that is indispensable
for the functioning of society, we have been working as a unified
group to maintain our provision of business funding to clients,
our settlement services, and our other financial functions.
A primary example of our infection prevention and business
continuity measures is that we have been asking visitors to our
branches for their cooperation in avoiding congestion in lobbies
and other places in order to prevent potential transmission
among customers. We have also implemented thorough
measures to prevent droplet transmission, installing acrylic
partitions at our counters and having our staff wear face guards.
For our employees, we have endeavored to prevent infection and
to ensure business continuity by implementing such measures as
shift work, reducing crowding at peak business hours. In addition
to shift work and remote working, our Head Office has promoted
methods to minimize contact between employees through, for
example, use of telephone and video conferencing.
Going forward, Mizuho will quickly respond to the structural shifts
COVID-19 is causing in the economy, industry, and society and
continue working as a unified group to support our customers
and society in facing these new challenges. Through this support,
we will build new forms of partnerships with our customers and
aim to transition to the next generation of financial services.
1262020 Integrated Report
Business continuity management
Appendix
011_7080587462009.indd 126 2020/09/10 15:23:34

Mizuho Financial GroupMembers of the Board of DirectorsExecutive Officers as Defined in the Companies Act
Tatsufumi SakaiMember of the Board of DirectorsPresident & CEO(Representative Executive Officer)Group CEO
Satoshi IshiiMember of the Board of DirectorsSenior Managing Executive Officer(Representative Executive Officer)Chief Digital Innovation Officer (CDIO) / Head of IT & Systems Group (Group CIO) / Head of Operations Group (Group COO)
Motonori WakabayashiMember of the Board of DirectorsSenior Managing Executive OfficerHead of Risk Management Group (Group CRO)
Makoto Umemiya Member of the Board of DirectorsSenior Managing Executive OfficerHead of Financial Control & Accounting Group (Group CFO)
Hiroaki EharaMember of the Board of DirectorsManaging Executive OfficerHead of Human Resources Group (Group CHRO)
Yasuhiro SatoMember of the Board of DirectorsChairman (Kaicho)*
Hisaaki HiramaMember of the Board of Directors
Tetsuo SekiMember of the Board of Directors (Outside Director)
Tatsuo KainakaMember of the Board of Directors (Outside Director)
Yoshimitsu KobayashiMember of the Board of Directors (Outside Director)
Ryoji SatoMember of the Board of Directors (Outside Director)
Masami YamamotoMember of the Board of Directors (Outside Director)
Izumi KobayashiChairman, member of the Board of Directors (Outside Director)
Seiji ImaiSenior Managing Executive Officer(Representative Executive Officer)Head of Corporate & Institutional Company / Head of Global Products Unit
Masahiro OtsukaSenior Managing Executive OfficerHead of Retail & Business Banking Company
Naofumi FukeSenior Managing Executive OfficerCo–Head of Retail & Business Banking Company
Hiroshi NagamineSenior Managing Executive OfficerHead of Global Corporate Company / Deputy Head of Global Products Unit
Hisashi KikuchiManaging Executive OfficerHead of Internal Audit Group (Group CA)
Masatoshi YoshiharaManaging Executive OfficerCo–Head of Global Markets Company
Yasuhiro ShibataManaging Executive OfficerCo–Head of Global Markets Company
Toshitsugu OkabeMember of the Board of Directors
Masato MonguchiMember of the Board of Directors (Audit & Supervisory Committee Member)
Hisashi KikuchiMember of the Board of Directors (Audit & Supervisory Committee Member)
Mikinao KitadaMember of the Board of Directors (Outside Director, Audit & Supervisory Committee Member)
Tsutomu TakahashiMember of the Board of Directors (Outside Director, Audit & Supervisory Committee Member)
Yoshikazu NishiwakiMember of the Board of Directors (Outside Director, Audit & Supervisory Committee Member)
Mizuho SecuritiesMembers of the Board of Directors
Koichi Iida**President & CEO (Representative Director)
Kiyoshi Miyake**Chairman
Atsushi Takahashi**Deputy President (Representative Director)Head of IT & Systems Group / Head of Operations Group / Head of Global IT / Head of Global Operations
Masaya Oishi**Executive Managing DirectorHead of Fund Business Division / In charge of JA Sales Department of Global Markets Division
Tatsufumi SakaiMember of the Board of Directors
Toshitsugu OkabeMember of the Board of Directors
Hideyuki KawashimaMember of the Board of Directors (Audit & Supervisory Committee Member)
Hisashi KikuchiMember of the Board of Directors (Audit & Supervisory Committee Member)
Yasuhisa HashimotoMember of the Board of Directors (Outside Director, Audit & Supervisory Committee Member)
Hiroyuki SuzukiMember of the Board of Directors (Outside Director, Audit & Supervisory Committee Member)
Seiji KogaMember of the Board of Directors (Outside Director, Audit & Supervisory Committee Member)
Notes:
1. * indicates that Chairman (Kaicho) Sato engages in our external activities, but does not chair the Board meetings.
2. ** indicates directors concurrently serving as executive officers.
3. Mizuho Financial Group executive officers as defined in our internal regulations have not been listed.
4. Executive officers, excluding the directors concurrently serving as executive officers and executive officers responsible for global regional operations of Mizuho Bank, have not been listed.
5. Executive officers, excluding the directors concurrently serving as executive officers of Mizuho Trust & Banking and Mizuho Securities, have not been listed.
(As of June 25, 2020)
Masamichi IshikawaManaging Executive OfficerHead of Asset Management Company / In charge of Specific Business of Strategic Planning Group
Yasuhiko UshikuboManaging Executive OfficerHead of Research & Consulting Unit, President & CEO of Mizuho Research Institute
Naoshi InomataManaging Executive OfficerHead of Strategic Planning Group (Group CSO) / In charge of Specially Assigned Matters
Masaomi TakadaManaging Executive OfficerHead of Compliance Group (Group CCO)
Mizuho BankMembers of the Board of Directors
Koji Fujiwara **President & CEO (Representative Director)
Satoshi Miyazaki **Deputy President (Representative Director)
Takahiko Yasuhara **Deputy President (Representative Director)
Tatsufumi SakaiMember of the Board of Directors
Toshitsugu OkabeMember of the Board of Directors(Audit & Supervisory Committee Member)
Hisashi KikuchiMember of the Board of Directors(Audit & Supervisory Committee Member)
Shigeo OharaMember of the Board of Directors(Outside Director, Audit & Supervisory Committee Member)
Shotaro TochigiMember of the Board of Directors(Outside Director, Audit & Supervisory Committee Member)
Naoko NemotoMember of the Board of Directors(Outside Director, Audit & Supervisory Committee Member)
Executive Officers(Head of Each Region Outside Japan)
Teiji TeramotoSenior Managing Executive OfficerHead of the Americas
Masayuki SugawaraManaging Executive OfficerHead of East Asia
Hidekatsu TakeManaging Executive OfficerHead of Asia & Oceania excl. East Asia
Shinsuke TodaManaging Executive OfficerHead of Europe, Middle East, and Africa
Mizuho Trust & BankingMembers of the Board of Directors
Kei Umeda**President & CEO (Representative Director)
Shinya Matake**Senior Executive Managing Director (Representative Director)Head of Retail & Business Banking Division / In charge of Specific Business of Strategic Planning Group / In charge of Specific Business of Financial Control & Accounting Group
Tatsufumi SakaiMember of the Board of Directors
127 Mizuho Financial Group
Senior executives
012_7080587462009.indd 127 2020/09/07 13:18:50
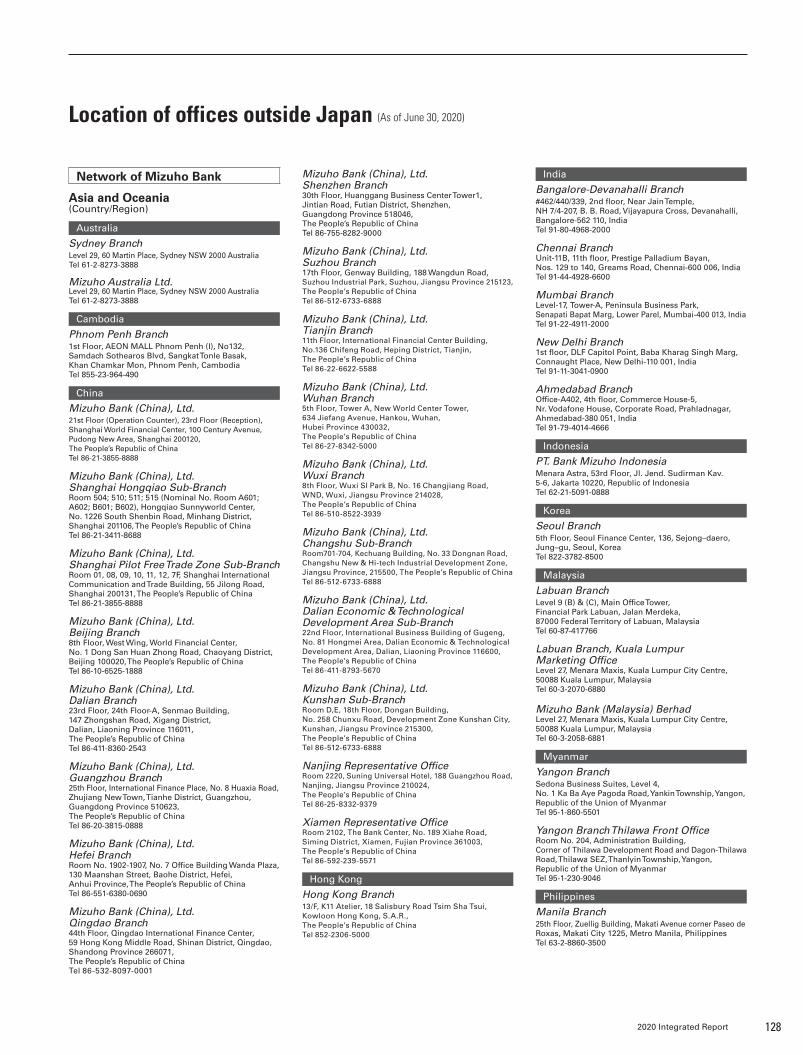
Network of Mizuho Bank
Asia and Oceania(Country/Region)
Australia
Sydney BranchLevel 29, 60 Martin Place, Sydney NSW 2000 AustraliaTel 61-2-8273-3888
Mizuho Australia Ltd.Level 29, 60 Martin Place, Sydney NSW 2000 AustraliaTel 61-2-8273-3888
Cambodia
Phnom Penh Branch1st Floor, AEON MALL Phnom Penh (I), No132,Samdach Sothearos Blvd, Sangkat Tonle Basak,Khan Chamkar Mon, Phnom Penh, CambodiaTel 855-23-964-490
China
Mizuho Bank (China), Ltd.21st Floor (Operation Counter), 23rd Floor (Reception), Shanghai World Financial Center, 100 Century Avenue, Pudong New Area, Shanghai 200120, The People’s Republic of ChinaTel 86-21-3855-8888
Mizuho Bank (China), Ltd.Shanghai Hongqiao Sub-BranchRoom 504; 510; 511; 515 (Nominal No. Room A601;A602; B601; B602), Hongqiao Sunnyworld Center,No. 1226 South Shenbin Road, Minhang District,Shanghai 201106, The People’s Republic of ChinaTel 86-21-3411-8688
Mizuho Bank (China), Ltd.Shanghai Pilot Free Trade Zone Sub-BranchRoom 01, 08, 09, 10, 11, 12, 7F, Shanghai InternationalCommunication and Trade Building, 55 Jilong Road,Shanghai 200131, The People’s Republic of ChinaTel 86-21-3855-8888
Mizuho Bank (China), Ltd.Beijing Branch8th Floor, West Wing, World Financial Center,No. 1 Dong San Huan Zhong Road, Chaoyang District,Beijing 100020, The People’s Republic of ChinaTel 86-10-6525-1888
Mizuho Bank (China), Ltd.Dalian Branch23rd Floor, 24th Floor-A, Senmao Building,147 Zhongshan Road, Xigang District,Dalian, Liaoning Province 116011,The People’s Republic of ChinaTel 86-411-8360-2543
Mizuho Bank (China), Ltd.Guangzhou Branch25th Floor, International Finance Place, No. 8 Huaxia Road,Zhujiang New Town, Tianhe District, Guangzhou,Guangdong Province 510623,The People’s Republic of ChinaTel 86-20-3815-0888
Mizuho Bank (China), Ltd.Hefei BranchRoom No. 1902-1907, No. 7 Office Building Wanda Plaza,130 Maanshan Street, Baohe District, Hefei,Anhui Province, The People’s Republic of ChinaTel 86-551-6380-0690
Mizuho Bank (China), Ltd.Qingdao Branch44th Floor, Qingdao International Finance Center,59 Hong Kong Middle Road, Shinan District, Qingdao,Shandong Province 266071,The People’s Republic of ChinaTel 86-532-8097-0001
India
Bangalore-Devanahalli Branch#462/440/339, 2nd floor, Near Jain Temple, NH 7/4-207, B. B. Road, Vijayapura Cross, Devanahalli,Bangalore-562 110, IndiaTel 91-80-4968-2000
Chennai BranchUnit-11B, 11th floor, Prestige Palladium Bayan,Nos. 129 to 140, Greams Road, Chennai-600 006, IndiaTel 91-44-4928-6600
Mumbai BranchLevel-17, Tower-A, Peninsula Business Park, Senapati Bapat Marg, Lower Parel, Mumbai-400 013, IndiaTel 91-22-4911-2000
New Delhi Branch1st floor, DLF Capitol Point, Baba Kharag Singh Marg, Connaught Place, New Delhi-110 001, IndiaTel 91-11-3041-0900
Ahmedabad BranchOffice-A402, 4th floor, Commerce House-5, Nr. Vodafone House, Corporate Road, Prahladnagar,Ahmedabad-380 051, IndiaTel 91-79-4014-4666
Indonesia
PT. Bank Mizuho IndonesiaMenara Astra, 53rd Floor, Jl. Jend. Sudirman Kav.5-6, Jakarta 10220, Republic of IndonesiaTel 62-21-5091-0888
Korea
Seoul Branch5th Floor, Seoul Finance Center, 136, Sejong–daero,Jung–gu, Seoul, KoreaTel 822-3782-8500
Malaysia
Labuan BranchLevel 9 (B) & (C), Main Office Tower,Financial Park Labuan, Jalan Merdeka,87000 Federal Territory of Labuan, MalaysiaTel 60-87-417766
Labuan Branch, Kuala LumpurMarketing OfficeLevel 27, Menara Maxis, Kuala Lumpur City Centre,50088 Kuala Lumpur, MalaysiaTel 60-3-2070-6880
Mizuho Bank (Malaysia) BerhadLevel 27, Menara Maxis, Kuala Lumpur City Centre,50088 Kuala Lumpur, MalaysiaTel 60-3-2058-6881
Myanmar
Yangon BranchSedona Business Suites, Level 4,No. 1 Ka Ba Aye Pagoda Road, Yankin Township, Yangon,Republic of the Union of MyanmarTel 95-1-860-5501
Yangon Branch Thilawa Front OfficeRoom No. 204, Administration Building,Corner of Thilawa Development Road and Dagon-ThilawaRoad, Thilawa SEZ, Thanlyin Township, Yangon,Republic of the Union of MyanmarTel 95-1-230-9046
Philippines
Manila Branch25th Floor, Zuellig Building, Makati Avenue corner Paseo deRoxas, Makati City 1225, Metro Manila, PhilippinesTel 63-2-8860-3500
India
Mizuho Bank (China), Ltd.Shenzhen Branch30th Floor, Huanggang Business Center Tower1,Jintian Road, Futian District, Shenzhen,Guangdong Province 518046,The People’s Republic of ChinaTel 86-755-8282-9000
Mizuho Bank (China), Ltd.Suzhou Branch17th Floor, Genway Building, 188 Wangdun Road,Suzhou Industrial Park, Suzhou, Jiangsu Province 215123,The People’s Republic of ChinaTel 86-512-6733-6888
Mizuho Bank (China), Ltd.Tianjin Branch11th Floor, International Financial Center Building,No.136 Chifeng Road, Heping District, Tianjin,The People’s Republic of ChinaTel 86-22-6622-5588
Mizuho Bank (China), Ltd.Wuhan Branch5th Floor, Tower A, New World Center Tower,634 Jiefang Avenue, Hankou, Wuhan,Hubei Province 430032,The People’s Republic of ChinaTel 86-27-8342-5000
Mizuho Bank (China), Ltd.Wuxi Branch8th Floor, Wuxi SI Park B, No. 16 Changjiang Road,WND, Wuxi, Jiangsu Province 214028,The People’s Republic of ChinaTel 86-510-8522-3939
Mizuho Bank (China), Ltd.Changshu Sub-BranchRoom701-704, Kechuang Building, No. 33 Dongnan Road,Changshu New & Hi-tech Industrial Development Zone,Jiangsu Province, 215500, The People’s Republic of ChinaTel 86-512-6733-6888
Mizuho Bank (China), Ltd.Dalian Economic & TechnologicalDevelopment Area Sub-Branch22nd Floor, International Business Building of Gugeng,No. 81 Hongmei Area, Dalian Economic & TechnologicalDevelopment Area, Dalian, Liaoning Province 116600,The People’s Republic of ChinaTel 86-411-8793-5670
Mizuho Bank (China), Ltd.Kunshan Sub-BranchRoom D,E, 18th Floor, Dongan Building,No. 258 Chunxu Road, Development Zone Kunshan City,Kunshan, Jiangsu Province 215300,The People’s Republic of ChinaTel 86-512-6733-6888
Nanjing Representative OfficeRoom 2220, Suning Universal Hotel, 188 Guangzhou Road,Nanjing, Jiangsu Province 210024,The People’s Republic of ChinaTel 86-25-8332-9379
Xiamen Representative OfficeRoom 2102, The Bank Center, No. 189 Xiahe Road,Siming District, Xiamen, Fujian Province 361003,The People’s Republic of ChinaTel 86-592-239-5571
Hong Kong
Hong Kong Branch13/F, K11 Atelier, 18 Salisbury Road Tsim Sha Tsui, Kowloon Hong Kong, S.A.R.,The People’s Republic of ChinaTel 852-2306-5000
1282020 Integrated Report
Location of offices outside Japan (As of June 30, 2020)
012_7080587462009.indd 128 2021/01/06 14:04:09
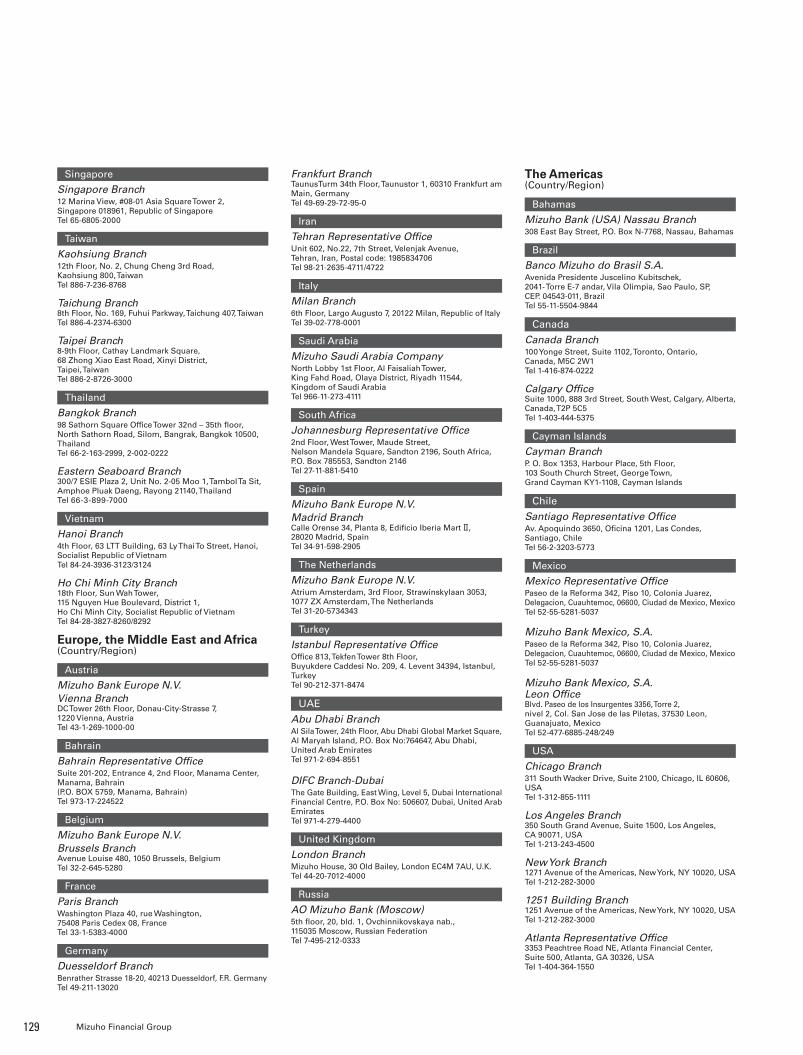
Singapore
Singapore Branch12 Marina View, #08-01 Asia Square Tower 2,Singapore 018961, Republic of SingaporeTel 65-6805-2000
Taiwan
Kaohsiung Branch12th Floor, No. 2, Chung Cheng 3rd Road,Kaohsiung 800, TaiwanTel 886-7-236-8768
Taichung Branch8th Floor, No. 169, Fuhui Parkway, Taichung 407, TaiwanTel 886-4-2374-6300
Taipei Branch8-9th Floor, Cathay Landmark Square, 68 Zhong Xiao East Road, Xinyi District, Taipei, TaiwanTel 886-2-8726-3000
Thailand
Bangkok Branch98 Sathorn Square Office Tower 32nd – 35th floor,North Sathorn Road, Silom, Bangrak, Bangkok 10500,ThailandTel 66-2-163-2999, 2-002-0222
Eastern Seaboard Branch300/7 ESIE Plaza 2, Unit No. 2-05 Moo 1, Tambol Ta Sit,Amphoe Pluak Daeng, Rayong 21140, ThailandTel 66-3-899-7000
Vietnam
Hanoi Branch4th Floor, 63 LTT Building, 63 Ly Thai To Street, Hanoi,Socialist Republic of VietnamTel 84-24-3936-3123/3124
Ho Chi Minh City Branch18th Floor, Sun Wah Tower,115 Nguyen Hue Boulevard, District 1,Ho Chi Minh City, Socialist Republic of VietnamTel 84-28-3827-8260/8292
Europe, the Middle East and Africa(Country/Region)
Austria
Mizuho Bank Europe N.V.Vienna BranchDC Tower 26th Floor, Donau-City-Strasse 7,1220 Vienna, AustriaTel 43-1-269-1000-00
Bahrain
Bahrain Representative OfficeSuite 201-202, Entrance 4, 2nd Floor, Manama Center,Manama, Bahrain(P.O. BOX 5759, Manama, Bahrain)Tel 973-17-224522
Belgium
Mizuho Bank Europe N.V.Brussels BranchAvenue Louise 480, 1050 Brussels, BelgiumTel 32-2-645-5280
France
Paris BranchWashington Plaza 40, rue Washington,75408 Paris Cedex 08, FranceTel 33-1-5383-4000
Germany
Duesseldorf BranchBenrather Strasse 18-20, 40213 Duesseldorf, F.R. GermanyTel 49-211-13020
Frankfurt BranchTaunusTurm 34th Floor, Taunustor 1, 60310 Frankfurt am Main, GermanyTel 49-69-29-72-95-0
Iran
Tehran Representative OfficeUnit 602, No.22, 7th Street, Velenjak Avenue, Tehran, Iran, Postal code: 1985834706Tel 98-21-2635-4711/4722
Italy
Milan Branch6th Floor, Largo Augusto 7, 20122 Milan, Republic of ItalyTel 39-02-778-0001
Saudi Arabia
Mizuho Saudi Arabia CompanyNorth Lobby 1st Floor, Al Faisaliah Tower,King Fahd Road, Olaya District, Riyadh 11544,Kingdom of Saudi ArabiaTel 966-11-273-4111
South Africa
Johannesburg Representative Office2nd Floor, West Tower, Maude Street,Nelson Mandela Square, Sandton 2196, South Africa,P.O. Box 785553, Sandton 2146Tel 27-11-881-5410
Spain
Mizuho Bank Europe N.V.Madrid BranchCalle Orense 34, Planta 8, Edificio Iberia Mart Ⅱ,28020 Madrid, SpainTel 34-91-598-2905
The Netherlands
Mizuho Bank Europe N.V.Atrium Amsterdam, 3rd Floor, Strawinskylaan 3053,1077 ZX Amsterdam, The NetherlandsTel 31-20-5734343
Turkey
Istanbul Representative OfficeOffice 813, Tekfen Tower 8th Floor,Buyukdere Caddesi No. 209, 4. Levent 34394, Istanbul,TurkeyTel 90-212-371-8474
UAEAbu Dhabi BranchAl Sila Tower, 24th Floor, Abu Dhabi Global Market Square, Al Maryah Island, P.O. Box No:764647, Abu Dhabi, United Arab EmiratesTel 971-2-694-8551
DIFC Branch-DubaiThe Gate Building, East Wing, Level 5, Dubai International Financial Centre, P.O. Box No: 506607, Dubai, United Arab EmiratesTel 971-4-279-4400
United Kingdom
London BranchMizuho House, 30 Old Bailey, London EC4M 7AU, U.K.Tel 44-20-7012-4000
Russia
AO Mizuho Bank (Moscow)5th floor, 20, bld. 1, Ovchinnikovskaya nab.,115035 Moscow, Russian FederationTel 7-495-212-0333
The Americas(Country/Region)
Bahamas
Mizuho Bank (USA) Nassau Branch308 East Bay Street, P.O. Box N-7768, Nassau, Bahamas
Brazil
Banco Mizuho do Brasil S.A.Avenida Presidente Juscelino Kubitschek, 2041- Torre E-7 andar, Vila Olimpia, Sao Paulo, SP, CEP. 04543-011, BrazilTel 55-11-5504-9844
CanadaCanada Branch100 Yonge Street, Suite 1102, Toronto, Ontario,Canada, M5C 2W1Tel 1-416-874-0222
Calgary OfficeSuite 1000, 888 3rd Street, South West, Calgary, Alberta,Canada, T2P 5C5Tel 1-403-444-5375
Cayman Islands
Cayman BranchP. O. Box 1353, Harbour Place, 5th Floor,103 South Church Street, George Town,Grand Cayman KY1-1108, Cayman Islands
ChileSantiago Representative OfficeAv. Apoquindo 3650, Oficina 1201, Las Condes, Santiago, ChileTel 56-2-3203-5773
Mexico
Mexico Representative OfficePaseo de la Reforma 342, Piso 10, Colonia Juarez, Delegacion, Cuauhtemoc, 06600, Ciudad de Mexico, MexicoTel 52-55-5281-5037
Mizuho Bank Mexico, S.A.Paseo de la Reforma 342, Piso 10, Colonia Juarez, Delegacion, Cuauhtemoc, 06600, Ciudad de Mexico, MexicoTel 52-55-5281-5037
Mizuho Bank Mexico, S.A. Leon OfficeBlvd. Paseo de los Insurgentes 3356, Torre 2,nivel 2, Col. San Jose de las Piletas, 37530 Leon, Guanajuato, MexicoTel 52-477-6885-248/249
USA
Chicago Branch311 South Wacker Drive, Suite 2100, Chicago, IL 60606, USATel 1-312-855-1111
Los Angeles Branch350 South Grand Avenue, Suite 1500, Los Angeles,CA 90071, USATel 1-213-243-4500
New York Branch1271 Avenue of the Americas, New York, NY 10020, USATel 1-212-282-3000
1251 Building Branch1251 Avenue of the Americas, New York, NY 10020, USATel 1-212-282-3000
Atlanta Representative Office3353 Peachtree Road NE, Atlanta Financial Center,Suite 500, Atlanta, GA 30326, USATel 1-404-364-1550
129 Mizuho Financial Group
012_7080587462009.indd 129 2020/09/07 13:18:50

Mizuho Securities USA LLC1271 Avenue of the Americas, New York, NY 10020, USATel 1-212-209-9300
Mizuho Securities USA LLCBoston Office125 High Street, 21st Floor, Boston, MA 02110, USATel 1-617-235-1722
Mizuho Securities USA LLCChicago Office311 South Wacker Drive, Suite 700, Chicago,IL 60606, USATel 1-312-294-8800
Mizuho Securities USA LLCHouston Office 2700 Post Oak Blvd., Suite 1270, Houston,TX 77056, USATel 1-713-499-4800
Mizuho Securities USA LLCLos Angeles Office 350 South Grand Avenue, Suite 1500, Los Angeles,CA 90071, USATel 1-213-243-4500
Mizuho Securities USA LLCSan Francisco Office235 Pine Street, 19th Floor, San Francisco, CA 94104, USATel 1-415-268-5500
Mizuho Securities Canada Inc.1271 Avenue of the Americas, New York, NY 10020, USATel 1-212-209-9300
Network of Mizuho Trust & Banking
Mizuho Trust & Banking(Luxembourg) S.A.1B, rue Gabriel Lippmann, L-5365 Munsbach,Grand Duchy of LuxembourgTel 352-42-16-17-1
Network of Mizuho Securities
Beijing Representative Office8011, Chang-Fu-Gong Office Building, Jia 26,Jianguomenwai Street, Chaoyang District,Beijing 100022, The People’s Republic of ChinaTel 86-10-6523-4779
Shanghai Representative OfficeT60 17th floor, Shanghai World Financial Center,100 Century Avenue, Pudong New Area, Shanghai200120, The People’s Republic of ChinaTel 86-21-6877-8000
Mizuho Securities Asia Limited14-15/F, K11 Atelier, 18 Salisbury Road,Tsim Sha Tsui, Kowloon, Hong Kong, S.A.R.,The People’s Republic of ChinaTel 852-2685-2000
Mizuho Securities Asia LimitedSeoul Branch5th Floor, Seoul Finance Center, 136,Sejongdaero, Jung-gu, Seoul, 04520, KoreaTel 822-2206-1800
Mizuho Securities Asia Limited (Sydney Office)Level 29, 60 Martin Place, Sydney NSW 2000 AustraliaTel 612-7904-3555
Mizuho Securities India Private LimitedLevel-18, Tower-A, Peninsula Business Park, Senapati Bapat Marg, Lower Parel, Mumbai-400 013, IndiaTel 91-22-4353-7600
Mizuho Securities (Singapore) Pte. Ltd.12 Marina View #10-01A, Asia Square Tower 2,Singapore 018961Tel 65-6603-5688
Mizuho (Switzerland) LtdLoewenstrasse 32, 8021 Zurich, SwitzerlandTel 41-44-216-9111
Mizuho International plcMizuho House, 30 Old Bailey, London EC4M 7AU, U.K.Tel 44-20-7236-1090
Mizuho International plc (DIFC Branch)The Gate Building, East Wing, Level 5,Dubai International Financial Centre,PO Box 507206, Dubai, U.A.E.Tel 971-4-427-5312
Mizuho Securities Europe GmbHTaunusTurm 34th Floor, Taunustor 1,60310 Frankfurt am Main, GermanyTel 49-69-42729-3000
Mizuho Securities Europe GmbHMadrid BranchCalle Orense, 34, Edifico Iberia Mart II, 8th floor,28020, Madrid, SpainTel 34-917-90-7551
Mizuho Securities Europe GmbHParis BranchWashington Plaza, 40, rue Washington, 75008 Paris, France
Dallas Representative Office5345 Towne Square Drive, Suite 285, Plano, TX 75024, USATel 1-972-324-3350
Houston Representative Office2700 Post Oak Blvd., Suite 1270, Houston, TX 77056, USATel 1-713-499-4800
San Francisco Representative Office235 Pine Street, 19th Floor, San Francisco, CA 94104, USATel 1-415-365-1750
Washington, D.C. Representative Office1275 Pennsylvania Avenue, NW, Suite 310, Washington, DC 20004, USATel 1-202-292-5080
Mizuho Bank (USA)1271 Avenue of the Americas, New York, NY 10020, USATel 1-212-282-3000
Mizuho Bank (USA)Atlanta Representative Office3353 Peachtree Road NE, Atlanta Financial Center,Suite 500, Atlanta, GA 30326, USATel 1-404-364-1550
Mizuho Bank (USA)Chicago Representative Office311 South Wacker Drive, Suite 2100, Chicago, IL 60606, USATel 1-312-855-1111
Mizuho Bank (USA)Dallas Representative Office5345 Towne Square Drive, Suite 285, Plano, TX 75024, USATel 1-972-324-3350
Mizuho Bank (USA)Houston Representative Office2700 Post Oak Blvd., Suite 1270, Houston, TX 77056, USATel 1-713-499-4800
Mizuho Bank (USA)Los Angeles Representative Office350 South Grand Avenue, Suite 1500, Los Angeles,CA 90071, USATel 1-213-243-4500
Mizuho Bank (USA)1251 Building Branch1251 Avenue of the Americas, New York, NY 10020, USATel 1-212-282-3000
Mizuho Bank (USA)San Francisco Representative Office235 Pine Street, 19th Floor, San Francisco, CA 94104, USATel 1-415-365-1750
Mizuho Desk(Country/Region)
UAEMashreqbank pscJapan Desk, Mashreqbank Building 3F, Dubai Internet City,Mashreqbank, P.O. Box 1250, Dubai, United Arab EmiratesTel 971-4-363-2053
“Mizuho Desk”By forming tie-ups with major financial institutions in regions where Mizuho does not possess offices, we offer our clients financial services through various institutions. (Transactions are conducted directly between the client and the local financial institution.)
1302020 Integrated Report
012_7080587462009.indd 130 2020/09/07 13:18:50

Date of establishmentJanuary 8, 2003
Paid-in capital¥2,256.7 billion
Issued shares25,392,498,945 shares
Number of shareholdersCommon stock: 991,573
Major shareholders (common stock)
Shares held
Percentageof shares
outstanding(%)
1 The Master Trust Bank of Japan, Ltd. (Trustee account) 1,642,845,500 6.47
2 Japan Trustee Services Bank, Ltd. (Trustee account) 1,109,233,400 4.36
3 Japan Trustee Services Bank, Ltd. (Trustee account 5) 545,964,100 2.15
4 Japan Trustee Services Bank, Ltd. (Trustee account 9) 522,476,800 2.05
5 JPMorgan Chase Bank 385151 443,776,306 1.74
6 State Street Bank West Client – Treaty 505234 423,565,756 1.66
7 Japan Trustee Services Bank, Ltd. (Trustee account 7) 384,499,000 1.51
8 State Street Bank And Trust Company 505103 293,537,902 1.15
9 Japan Trustee Services Bank, Ltd. (Trustee account 1) 280,082,100 1.10
10 Japan Trustee Services Bank, Ltd. (Trustee account 4) 263,338,400 1.03
Notes: 1. Figures for the Percentage of Shares Outstanding are rounded down to the nearest second decimal place.
2. The Percentages of Shares Outstanding are calculated by excluding the treasury stock (3,622,415 shares).
(As of March 31, 2020)
Convocation of general meetings of shareholdersAn ordinary general meeting of shareholders of the Company shall be convened no later than 3 months from the last day of each business year and an extraordinary general meeting of shareholders shall be convened whenever necessary.
Record date1. The Company shall deem shareholders having voting rights
appearing in writing or electronically in the register of shareholders as of the end of March 31 of each year as the shareholders who are entitled to exercise their rights at the ordinary general meeting of shareholders for the relevant business year.
2. The provision of the preceding paragraph shall apply mutatis mutandis to the record date for voting rights at the general meetings of holders of classes of stock, where there is a matter to be resolved at an ordinary general meeting of shareholders that requires, in addition to such resolution, a resolution by the relevant general meeting of holders of class of stock.
3. In addition to the preceding two paragraphs, the Company may set an extraordinary record date, when necessary, by a determination by Executive Officer(s) under the authority delegated by the Board of Directors and upon giving a prior public notice thereof.
Organizations that decide dividends from surplusThe Company may decide distribution of dividends from surplus and other matters provided for in each item of Article 459, Paragraph 1 of the Act, but by a resolution of the Board of Directors, unless otherwise provided for in laws or regulations.
Record date for distribution of dividends from surplusThe record dates for distribution of dividends from surplus of the Company shall be March 31 and September 30 of each year.
ADR* informationOutline of Mizuho Financial Group’s ADR1. Exchange : New York Stock Exchange2. Ticker symbol : MFG3. CUSIP : 60687Y1094. Conversion ratio : 1 ADR = 2 common shares5. Depositary bank : The Bank of New York Mellon6. Local custodian bank : Mizuho Bank, Ltd.* ADRs are securities issued for the purpose of trading in the US in place of
the underlying stock of foreign companies. As ADRs are registered with the SEC as US securities, they are traded, settled and held in custody in substantively the same manner as the stocks of US companies. ADR is an acronym for American Depositary Receipts.
Stock listing(common stock)Tokyo Stock Exchange
Accounting auditorsErnst & Young ShinNihon LLC
Shareholder register managerMizuho Trust & Banking Co., Ltd.
Share unit100 shares
Fiscal yearApril 1 to March 31
131 Mizuho Financial Group
Investor information
012_7080587462009.indd 131 2020/09/07 13:18:50
2020/09/07 16:49:02 / 20635244_株式会社みずほフィナンシャルグループ_総会その他(C)
Financial Analysis[Under Japanese GAAP]
133 Key Indicators of Mizuho Financial Group, Inc.
135 Status of Asset Quality
132
Financial Analysis-Index
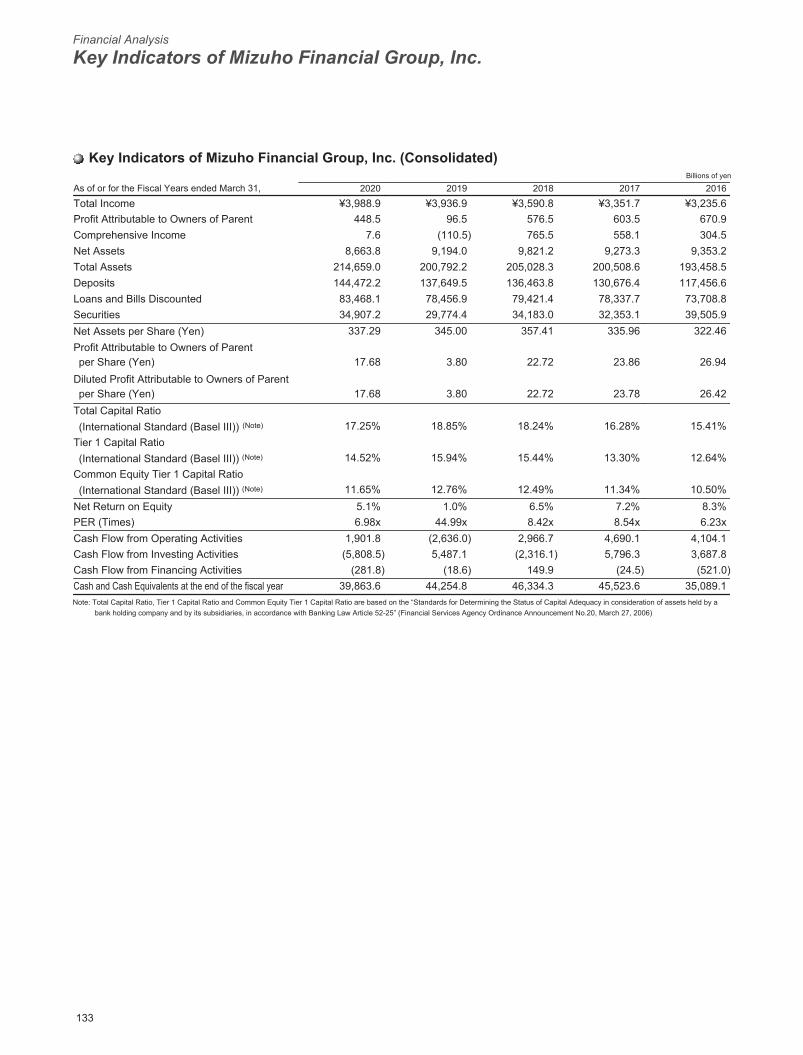
Financial Analysis
Key Indicators of Mizuho Financial Group, Inc.
2020/09/07 16:49:02 / 20635244_株式会社みずほフィナンシャルグループ_総会その他(C)
Key Indicators of Mizuho Financial Group, Inc. (Consolidated)Billions of yen
As of or for the Fiscal Years ended March 31, 2020 2019 2018 2017 2016
Total Income ¥3,988.9 ¥3,936.9 ¥3,590.8 ¥3,351.7 ¥3,235.6Profit Attributable to Owners of Parent 448.5 96.5 576.5 603.5 670.9Comprehensive Income 7.6 (110.5) 765.5 558.1 304.5Net Assets 8,663.8 9,194.0 9,821.2 9,273.3 9,353.2Total Assets 214,659.0 200,792.2 205,028.3 200,508.6 193,458.5Deposits 144,472.2 137,649.5 136,463.8 130,676.4 117,456.6Loans and Bills Discounted 83,468.1 78,456.9 79,421.4 78,337.7 73,708.8Securities 34,907.2 29,774.4 34,183.0 32,353.1 39,505.9Net Assets per Share (Yen) 337.29 345.00 357.41 335.96 322.46Profit Attributable to Owners of Parent per Share (Yen) 17.68 3.80 22.72 23.86 26.94
Diluted Profit Attributable to Owners of Parent per Share (Yen) 17.68 3.80 22.72 23.78 26.42
Total Capital Ratio(International Standard (Basel III)) (Note) 17.25% 18.85% 18.24% 16.28% 15.41%
Tier 1 Capital Ratio(International Standard (Basel III)) (Note) 14.52% 15.94% 15.44% 13.30% 12.64%
Common Equity Tier 1 Capital Ratio (International Standard (Basel III)) (Note) 11.65% 12.76% 12.49% 11.34% 10.50%
Net Return on Equity 5.1% 1.0% 6.5% 7.2% 8.3%PER (Times) 6.98x 44.99x 8.42x 8.54x 6.23xCash Flow from Operating Activities 1,901.8 (2,636.0) 2,966.7 4,690.1 4,104.1Cash Flow from Investing Activities (5,808.5) 5,487.1 (2,316.1) 5,796.3 3,687.8Cash Flow from Financing Activities (281.8) (18.6) 149.9 (24.5) (521.0)Cash and Cash Equivalents at the end of the fiscal year 39,863.6 44,254.8 46,334.3 45,523.6 35,089.1Note: Total Capital Ratio, Tier 1 Capital Ratio and Common Equity Tier 1 Capital Ratio are based on the “Standards for Determining the Status of Capital Adequacy in consideration of assets held by a
bank holding company and by its subsidiaries, in accordance with Banking Law Article 52-25” (Financial Services Agency Ordinance Announcement No.20, March 27, 2006)
133
Key Indicators of Mizuho Financial Group, Inc. (Consolidated)

2020/09/07 16:49:02 / 20635244_株式会社みずほフィナンシャルグループ_総会その他(C)
Key Indicators of Mizuho Financial Group, Inc. (Non-Consolidated)Billions of yen
As of or for the Fiscal Years ended March 31, 2020 2019 2018 2017 2016
Operating Income ¥75.4 ¥331.3 ¥305.0 ¥378.0 ¥333.5Net Income 34.0 354.5 257.1 326.6 304.3Common Stock and Preferred Stock 2,256.7 2,256.7 2,256.5 2,256.2 2,255.7Number of Shares Issued and Outstanding
( Common Stock )Eleventh Series Class XI Preferred Stock ( 25,392,498,945hares)—shares (25,392,498,945shares)—shares (25,389,644,945shares)—shares (25,386,307,945shares)—shares (25,030,525,657shares)914,752,000shares
Net Assets 5,362.4 5,518.7 5,441.3 5,342.5 5,197.2Total Assets 12,823.7 11,637.1 10,587.7 9,269.3 7,064.2Net Assets per Share (Yen) 211.36 217.52 214.43 210.51 203.58Dividends per Share (Yen) (Interim Dividends per Share) (Yen)
Common Stock 7.5 7.5 7.5 7.5 7.5Eleventh Series Class XI Preferred Stock (Note) — — — — 20
( Common Stock )Eleventh Series Class XI Preferred Stock (Note) ( 3.75)— ( 3.75)— ( 3.75)— ( 3.75)— ( 3.75)10Net Income per Share (Yen) 1.34 13.97 10.13 12.91 12.17Diluted Net Income per Share (Yen) 1.34 13.97 10.13 12.86 11.98PER (Times) 92.07x 12.25x 18.88x 15.79x 13.81xDividend Propensity 558.69% 53.65% 73.98% 58.06% 61.62%Note: Mizuho Financial Group Inc. ("MHFG") acquired all of the Eleventh Series Class XI Preferred Stock as of July 1, 2016 that had not been requested for acquisition by June 30, 2016 and calcelled all
of the Eleventh Series Class XI Preferred Stock held by MHFG on July 13, 2016. Accordingly, the cash dividends per share of the Eleventh Series Class XI Preferred Stock for the fiscal year ended March 31, 2017 and after have not been recorded.
134
Key Indicators of Mizuho Financial Group, Inc. (Consolidated)
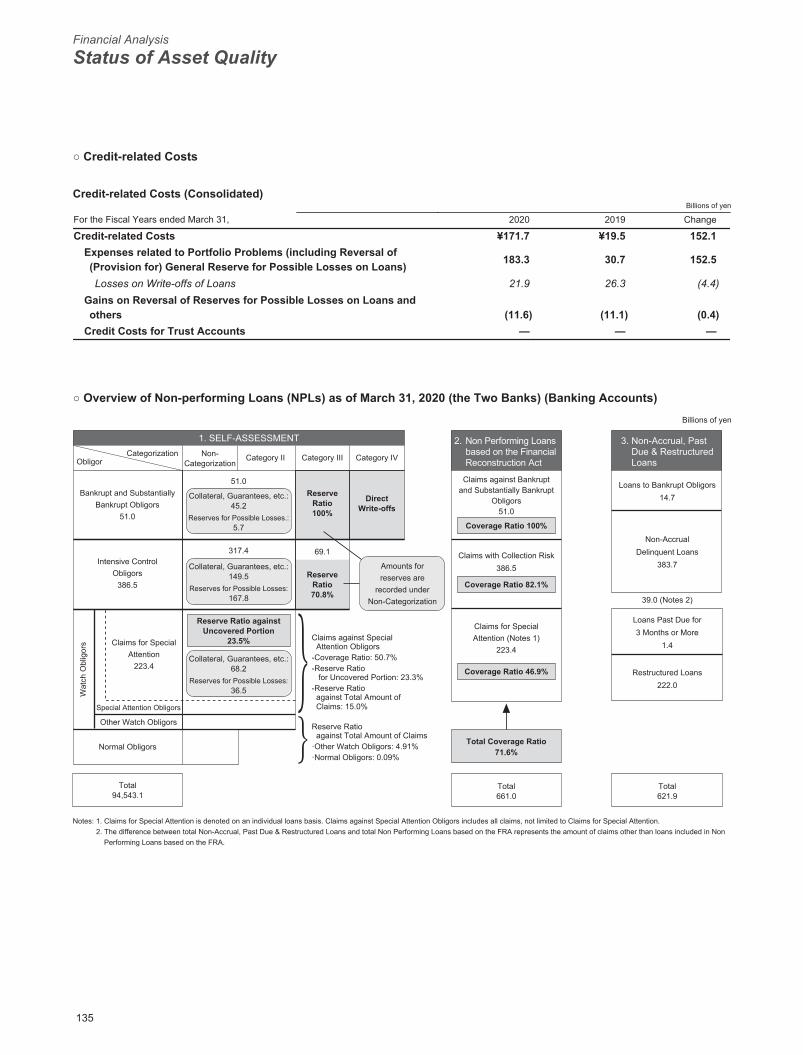
Financial Analysis
Status of Asset Quality
2020/09/07 16:49:02 / 20635244_株式会社みずほフィナンシャルグループ_総会その他(C)
○ Credit-related Costs
Credit-related Costs (Consolidated)Billions of yen
For the Fiscal Years ended March 31, 2020 2019 Change
Credit-related Costs ¥171.7 ¥19.5 152.1Expenses related to Portfolio Problems (including Reversal of (Provision for) General Reserve for Possible Losses on Loans) 183.3 30.7 152.5
Losses on Write-offs of Loans 21.9 26.3 (4.4)Gains on Reversal of Reserves for Possible Losses on Loans and others (11.6) (11.1) (0.4)
Credit Costs for Trust Accounts — — —
○ Overview of Non-performing Loans (NPLs) as of March 31, 2020 (the Two Banks) (Banking Accounts)
1. SELF-ASSESSMENT 3. Non-Accrual, Past Due & Restructured Loans
2.
Loans to Bankrupt Obligors14.7
Claims with Collection Risk386.5
69.1
51.0
ObligorCategorization Category IVCategory IIICategory IINon-
Categorization
Wat
ch O
blig
ors
317.4
Claims against Bankruptand Substantially Bankrupt
Obligors51.0
Claims for SpecialAttention (Notes 1)
223.4
Loans Past Due for3 Months or More
1.4
Restructured Loans222.0
Total621.9
Total661.0
Total Coverage Ratio71.6%
Coverage Ratio 46.9%
Coverage Ratio 82.1%
Coverage Ratio 100%
DirectWrite-offs
ReserveRatio100%
ReserveRatio70.8%
Reserve Ratio againstUncovered Portion
23.5%
Total94,543.1
39.0 (Notes 2)
Non-AccrualDelinquent Loans
383.7
Claims for SpecialAttention
223.4
Intensive ControlObligors
386.5
Bankrupt and SubstantiallyBankrupt Obligors
51.0
Special Attention Obligors
Other Watch Obligors
Normal Obligors
Reserve Ratio against Total Amount of Claims·Other Watch Obligors: 4.91%·Normal Obligors: 0.09%
Claims against Special Attention Obligors-Coverage Ratio: 50.7%-Reserve Ratio for Uncovered Portion: 23.3%-Reserve Ratio against Total Amount of Claims: 15.0%
Collateral, Guarantees, etc.:45.2
Reserves for Possible Losses.:5.7
Collateral, Guarantees, etc.:149.5
Reserves for Possible Losses:167.8
Amounts forreserves are
recorded underNon-Categorization
Collateral, Guarantees, etc.:68.2
Reserves for Possible Losses:36.5
Billions of yen
Non Performing Loansbased on the FinancialReconstruction Act
Notes: 1. Claims for Special Attention is denoted on an individual loans basis. Claims against Special Attention Obligors includes all claims, not limited to Claims for Special Attention.2. The difference between total Non-Accrual, Past Due & Restructured Loans and total Non Performing Loans based on the FRA represents the amount of claims other than loans included in Non
Performing Loans based on the FRA.
135
Credit-related Costs、Overview of Non-performing Loans (NPLs)
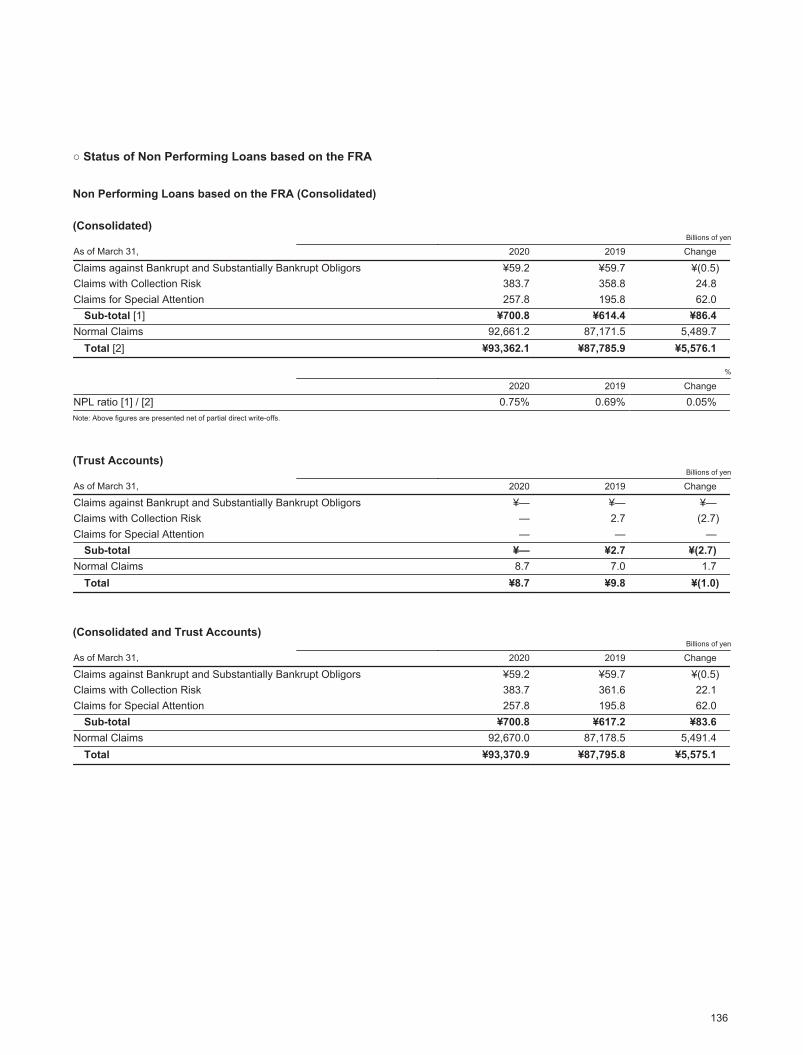
2020/09/07 16:49:02 / 20635244_株式会社みずほフィナンシャルグループ_総会その他(C)
○ Status of Non Performing Loans based on the FRA
Non Performing Loans based on the FRA (Consolidated)
(Consolidated)Billions of yen
As of March 31, 2020 2019 Change
Claims against Bankrupt and Substantially Bankrupt Obligors ¥59.2 ¥59.7 ¥(0.5)Claims with Collection Risk 383.7 358.8 24.8Claims for Special Attention 257.8 195.8 62.0
Sub-total [1] ¥700.8 ¥614.4 ¥86.4Normal Claims 92,661.2 87,171.5 5,489.7
Total [2] ¥93,362.1 ¥87,785.9 ¥5,576.1
%
2020 2019 Change
NPL ratio [1] / [2] 0.75% 0.69% 0.05%Note: Above figures are presented net of partial direct write-offs.
(Trust Accounts)Billions of yen
As of March 31, 2020 2019 Change
Claims against Bankrupt and Substantially Bankrupt Obligors ¥— ¥— ¥—Claims with Collection Risk — 2.7 (2.7)Claims for Special Attention — — —
Sub-total ¥— ¥2.7 ¥(2.7)Normal Claims 8.7 7.0 1.7
Total ¥8.7 ¥9.8 ¥(1.0)
(Consolidated and Trust Accounts)Billions of yen
As of March 31, 2020 2019 Change
Claims against Bankrupt and Substantially Bankrupt Obligors ¥59.2 ¥59.7 ¥(0.5)Claims with Collection Risk 383.7 361.6 22.1Claims for Special Attention 257.8 195.8 62.0
Sub-total ¥700.8 ¥617.2 ¥83.6Normal Claims 92,670.0 87,178.5 5,491.4
Total ¥93,370.9 ¥87,795.8 ¥5,575.1
136
Status of Disclosed Claims under the FRA
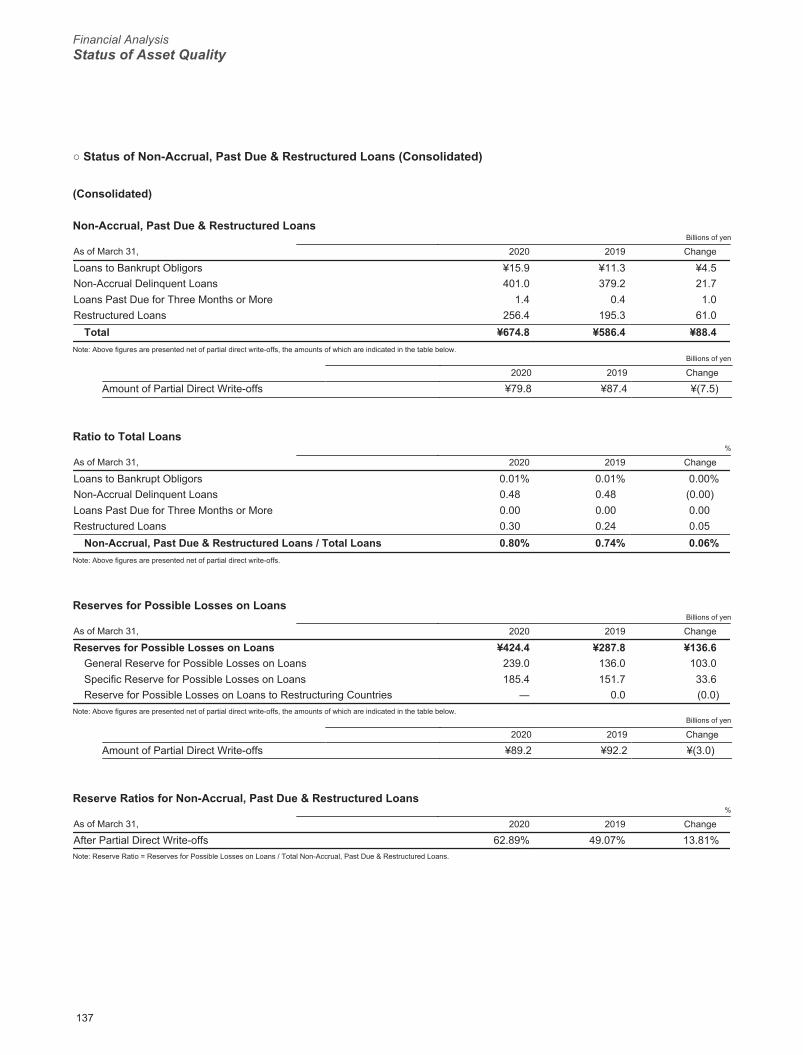
Financial AnalysisStatus of Asset Quality
2020/09/07 16:49:02 / 20635244_株式会社みずほフィナンシャルグループ_総会その他(C)
○ Status of Non-Accrual, Past Due & Restructured Loans (Consolidated)
(Consolidated)
Non-Accrual, Past Due & Restructured LoansBillions of yen
As of March 31, 2020 2019 Change
Loans to Bankrupt Obligors ¥15.9 ¥11.3 ¥4.5Non-Accrual Delinquent Loans 401.0 379.2 21.7Loans Past Due for Three Months or More 1.4 0.4 1.0Restructured Loans 256.4 195.3 61.0
Total ¥674.8 ¥586.4 ¥88.4Note: Above figures are presented net of partial direct write-offs, the amounts of which are indicated in the table below.
Billions of yen
2020 2019 Change
Amount of Partial Direct Write-offs ¥79.8 ¥87.4 ¥(7.5)
Ratio to Total Loans%
As of March 31, 2020 2019 Change
Loans to Bankrupt Obligors 0.01% 0.01% 0.00%Non-Accrual Delinquent Loans 0.48 0.48 (0.00)Loans Past Due for Three Months or More 0.00 0.00 0.00Restructured Loans 0.30 0.24 0.05
Non-Accrual, Past Due & Restructured Loans / Total Loans 0.80% 0.74% 0.06%Note: Above figures are presented net of partial direct write-offs.
Reserves for Possible Losses on LoansBillions of yen
As of March 31, 2020 2019 Change
Reserves for Possible Losses on Loans ¥424.4 ¥287.8 ¥136.6General Reserve for Possible Losses on Loans 239.0 136.0 103.0Specific Reserve for Possible Losses on Loans 185.4 151.7 33.6Reserve for Possible Losses on Loans to Restructuring Countries ― 0.0 (0.0)
Note: Above figures are presented net of partial direct write-offs, the amounts of which are indicated in the table below.Billions of yen
2020 2019 Change
Amount of Partial Direct Write-offs ¥89.2 ¥92.2 ¥(3.0)
Reserve Ratios for Non-Accrual, Past Due & Restructured Loans%
As of March 31, 2020 2019 Change
After Partial Direct Write-offs 62.89% 49.07% 13.81%Note: Reserve Ratio = Reserves for Possible Losses on Loans / Total Non-Accrual, Past Due & Restructured Loans.
137
Status of Non-Accrual, Past Due & Restructured Loans (Consolidated)

2020/09/07 16:49:02 / 20635244_株式会社みずほフィナンシャルグループ_総会その他(C)
(Trust Accounts)
Non-Accrual, Past Due & Restructured LoansBillions of yen
As of March 31, 2020 2019 Change
Loans to Bankrupt Obligors ¥— ¥— ¥—Non-Accrual Delinquent Loans — 2.7 (2.7)Loans Past Due for Three Months or More — — —Restructured Loans — — —
Total ¥— ¥2.7 ¥(2.7)
Ratio to Total Loans%
As of March 31, 2020 2019 Change
Loans to Bankrupt Obligors —% —% —%Non-Accrual Delinquent Loans — 28.15 (28.15)Loans Past Due for Three Months or More — — —Restructured Loans — — —
Non-Accrual, Past Due & Restructured Loans / Total Loans —% 28.15% (28.15)%
(Consolidated and Trust Accounts)
Non-Accrual, Past Due & Restructured LoansBillions of yen
As of March 31, 2020 2019 Change
Loans to Bankrupt Obligors ¥15.9 ¥11.3 ¥4.5Non-Accrual Delinquent Loans 401.0 381.9 19.0Loans Past Due for Three Months or More 1.4 0.4 1.0Restructured Loans 256.4 195.3 61.0
Total ¥674.8 ¥589.1 ¥85.6Note: Above figures are presented net of partial direct write-offs.
Ratio to Total Loans%
As of March 31, 2020 2019 Change
Loans to Bankrupt Obligors 0.01% 0.01% 0.00%Non-Accrual Delinquent Loans 0.48 0.48 (0.00)Loans Past Due for Three Months or More 0.00 0.00 0.00Restructured Loans 0.30 0.24 0.05
Non-Accrual, Past Due & Restructured Loans / Total Loans 0.80% 0.75% 0.05%Note: Above figures are presented net of partial direct write-offs.
138
Status of Non-Accrual, Past Due & Restructured Loans (Consolidated)

Financial AnalysisStatus of Asset Quality
2020/09/07 16:49:02 / 20635244_株式会社みずほフィナンシャルグループ_総会その他(C)
○ Status of Loans by Industry
Outstanding Balances by Industry (Consolidated)Billions of yen, %
2020 2019 Change
As of March 31,Outstanding
Balance CompositionOutstanding
Balance CompositionOutstanding
Balance CompositionDomestic Total (excluding Loans Booked Offshore) ¥55,147.0 100.00% ¥53,453.4 100.00% ¥1,693.5 /
Manufacturing 9,642.2 17.48 9,440.0 17.66 202.2 (0.18)%Agriculture & Forestry 54.7 0.10 47.4 0.09 7.2 0.01Fishery 3.3 0.01 2.1 0.00 1.1 0.01Mining, Quarrying Industry & Gravel Extraction Industry 226.9 0.41 247.1 0.46 (20.1) (0.05)Construction 725.7 1.32 667.2 1.25 58.4 0.07Utilities 2,834.9 5.14 2,800.5 5.24 34.3 (0.10)Communication 1,436.6 2.60 1,283.5 2.40 153.1 0.20Transportation & Postal Industry 2,360.1 4.28 2,370.8 4.44 (10.6) (0.16)Wholesale & Retail 4,930.1 8.94 4,872.3 9.12 57.8 (0.18)Finance & Insurance 4,795.2 8.69 4,468.9 8.36 326.2 0.33Real Estate 8,713.2 15.80 8,141.4 15.23 571.8 0.57Commodity Lease 2,884.9 5.23 2,172.5 4.06 712.4 1.17Service Industries 3,108.7 5.64 2,873.0 5.37 235.7 0.27Local Governments 754.7 1.37 794.3 1.49 (39.5) (0.12)Governments 1,443.5 2.62 1,564.4 2.93 (120.8) (0.31)Other 11,231.5 20.37 11,707.4 21.90 (475.9) (1.53)
Overseas Total (including Loans Booked Offshore) 28,321.1 100.00 25,003.4 100.00 3,317.7 /Governments 355.3 1.26 346.0 1.38 9.2 (0.12)Financial Institutions 9,106.0 32.15 7,817.9 31.27 1,288.1 0.88Other 18,859.7 66.59 16,839.4 67.35 2,020.3 (0.76)Total ¥83,468.1 / ¥78,456.9 / ¥5,011.2 /
Notes :1. Domestic Total = MHFG and its domestic consolidated subsidiaries (excluding their overseas offices).Overseas Total = Overseas offices of MHFG's domestic consolidated subsidiaries and MHFG's overseas consolidated subsidiaries
2. A reclassification of Industry type has been made on the above table as of March 31, 2019 for consistency with current figures.
○ Status of Loans by Nationality of Borrowers
Balance of Loans to Restructuring Countries (Consolidated)As of March 31, 2020 Billions of yen, % As of March 31, 2019 Billions of yen, %
― ¥― Zambia ¥0.0― ― Argentina 0.0
Total ¥― Total ¥0.0Ratio to Total Assets ―% Ratio to Total Assets 0.00%Note: Listed are loans to the government and related agents in restructuring countries for which Reserves for Possible Losses on Loans to Restructuring Countries are accounted as stipulated under the
Japanese Institute of Certified Public Accountants (JICPA) Banking Audit Committee Report No.4.
139
Status of Loans by Industry、Status of Loans by Nationality of Borrowers

2020/09/07 16:49:02 / 20635244_株式会社みずほフィナンシャルグループ_総会その他(C)
Financial Data of Mizuho Financial Group, Inc.[Under Japanese GAAP]
141 Independent Auditor’s Report
145 Consolidated Financial Statements
157 Notes to Consolidated Financial Statements
140
Financial Data of Mizuho Financial Group, Inc.-Index
Financial Data of Mizuho Financial Group, Inc.
Independent Auditor’s Report
2020/09/07 16:49:02 / 20635244_株式会社みずほフィナンシャルグループ_総会その他(C)
Independent Auditor’s Report
The Board of DirectorsMizuho Financial Group, Inc.
Opinion
We have audited the accompanying consolidated financial statements of Mizuho Financial Group, Inc. and its consolidated subsidiaries (the Group), which comprise the consolidated balance sheet as at March 31, 2020, and the consolidated statements of income, comprehensive income, changes in net assets, and cash flows for the year then ended, and notes to the consolidated financial statements.In our opinion, the accompanying consolidated financial statements present fairly, in all material respects, the consolidated financial position of the Group as at March 31, 2020, and its consolidated financial performance and its consolidated cash flows for the year then ended in accordance with accounting principles generally accepted in Japan.
Basis for Opinion
We conducted our audit in accordance with auditing standards generally accepted in Japan. Our responsibilities under those standards are further described in the Auditor’s Responsibilities for the Audit of the Consolidated Financial Statements section of our report. We are independent of the Group in accordance with the ethical requirements that are relevant to our audit of the consolidated financial statements in Japan, and we have fulfilled our other ethical responsibilities in accordance with these requirements. We believe that the audit evidence we have obtained is sufficient and appropriate to provide a basis for our opinion.
Key Audit Matters
Key audit matters are those matters that, in our professional judgment, were of most significance in our audit of the consolidated financial statements of the current period. These matters were addressed in the context of the audit of the consolidated financial statements as a whole, and in forming the auditor’s opinion thereon, and we do not provide a separate opinion on these matters.
(1) Reasonableness of self-assessment of loans, write-offs and reserve provisions
Description of Key Audit Matter Auditor’s Response
As described in (10) “Reserves for Possible Losses on Loans” in Note 5, “Standards of Accounting Method,” the Company recognizes the Reserves for Possible Losses on Loans based on the internally established standards for self-assessment of loans and for write-offs and reserve provisions, considering the borrower’s financial condition, the value of collateral pledged and the economic environment. As the Company has extended credit to borrowers in a wide range of industry sectors both in Japan and overseas, the Company may incur additional reserves for possible losses on loans due to the increase of non-performing loans, deterioration in the credit worthiness of the borrowers and devaluation of collateral and/or guarantees, depending on economic environment in Japan and overseas, changes in the business environment in certain industry sectors and declines in the prices of real estate and other assets.The process of recognizing Reserves for Possible Losses on Loans involves significant judgment by management.
We obtained an understanding, evaluated the design and tested the operating effectiveness of the controls over the Company’s allowance for loan losses process. The controls tested included, but were not limited to, controls over the validation and monitoring process that covers models used to determine the obligor ratings, controls that management periodically reviews and challenges the obligor ratings, controls that evaluates the expected future cash flows used to determine loan impairment amounts and controls that evaluates the reasonableness of significant assumptions and judgments used in adjusting the allowance.Also, we performed the following substantive procedures:・ We selected a sample of obligors both from a
quantitative and qualitative perspective and evaluated the obligor ratings. Our sample considered various risks, such as the type of industry, sector and financial condition of the borrower. We inspected the evidence supporting these ratings and compared the ratings and
141
Independent Auditor’s Report
2020/09/07 16:49:02 / 20635244_株式会社みずほフィナンシャルグループ_総会その他(C)
Description of Key Audit Matter Auditor’s Response
The assignment of obligor ratings to borrowers and estimating the expected future cash flows of impaired loans require significant judgment. Additionally, significant uncertain economic and business conditions affect key lending areas of the Company and the amount of Reserves for Possible Losses on Loans. Specifically, as of March 31, 2020, the Company identified certain industries and obligors which are most likely to be affected by the COVID-19 pandemic and adjusted its Reserve for Possible Losses on Loans for these loan groups, using assumptions such as anticipated business recovery period and current forecast for the growth rate of gross domestic product (“macroeconomic data”).As stated in the consolidated balance sheet, the Company recorded loans of 83,468,185 million yen and Reserves for Possible Losses on Loans of 424,446 million yen as of March 31, 2020, which have a significant effect on the financial position and operating results of the Company. We have identified the Reserves for Possible Losses on Loans, specifically determining obligor ratings, macroeconomic data used in determining the adjustment and estimates related to the expected future cash flows that are developed when measuring impaired loans, as a key audit matter.
the related supporting evidence to management’s obligor rating definitions and made inquiries to the credit risk management division.For the key judgments used in the models to determine the obligor ratings and the expected future cash flows related to self-assessment of loans, write-offs and reserve provisions, we considered and evaluated relevant market and industry information, when available, and identified key data inputs and assessed those through inspection and recalculation, and compared the actual results with the estimates made in prior years. We involved our specialists in testing the areas requiring complex judgement and calculation.
・ We evaluated the reasonableness of methodology and macroeconomic data used by management in estimating the adjustment of the allowance for loan losses. We also involved our specialist in testing the assumption and calculations in the areas requiring complex assumptions and calculations.
(2) Appropriateness of fair value measurement of illiquid financial instruments with no quoted market prices
Description of Key Audit Matter Auditor’s Response
As described in Note “Financial Instruments,” the Company carries various types of financial instruments for treasury and certain trading activities the majority of which are reported at fair value on the consolidated balance sheet. Financial instruments measured at fair value include but not limited to marketable securities such as equities and fixed income securities, and derivative instruments involving interest rates, currencies, equities and debts. Some illiquid financial instruments with no quoted market prices are reported at fair value which is determined based on the management’s estimates and assumptions.In a calculation of fair value, a mark-to-market valuation model is developed, and certain input parameters are used, including probabilities of default, recovery rates and volatilities. Therefore, the fair values outcome may vary depending on different assumptions.The fair value measurement of illiquid financial instruments with no quoted market prices involves significant management judgments including the development of a mark-to-market valuation models and the determination of input parameters.Also, as discussed in Note “Financial Instruments”, the Company carries illiquid financial instruments with no
We obtained an understanding, evaluated the design and tested the operating effectiveness of the controls over the Company’s derivatives and debt fair valuation processes. The controls tested included, but were not limited to, controls over significant inputs included in the fair value measurements and controls over the appropriateness of the valuation techniques utilized within the internally developed valuation models.Also, we involved our specialists to assist us in performing the following substantive procedures:・ We inspected the outcome of the Company’s
independent price verification process and assessed any issues in the fair value measurement identified through our procedures and evaluated the reasonableness of the judgment.
・ We tested certain input parameters used in scope of our verification considering the risks in terms of the degree of subjectivity involved in determining those parameters as well as the quantitative impact on the fair value measurement and compared them with the third-party market information we obtained independently.
・ We evaluated the valuation techniques used in the context of the suitability with market practices.
142
Independent Auditor’s Report
Financial Data of Mizuho Financial Group, Inc.Independent Auditor’s Report
2020/09/07 16:49:02 / 20635244_株式会社みずほフィナンシャルグループ_総会その他(C)
Description of Key Audit Matter Auditor’s Response
quoted market price as of March 31, 2020. These financial instruments are significant to the Company’s financial position and operating results. Accordingly, we have identified the fair value measurement of illiquid financial instruments with no quoted market price as a key audit matter.
・ We tested the mathematical accuracy of the Company’s valuation calculation. To determine the extent, we considered risks associated with the complexity of the valuation techniques used in addition to the quantitative impact on the fair value measurements.
Responsibilities of Management, the Audit Committee for the Consolidated Financial Statements
Management is responsible for the preparation and fair presentation of these consolidated financial statements in accordance with accounting principles generally accepted in Japan, and for such internal control as management determines is necessary to enable the preparation of consolidated financial statements that are free from material misstatement, whether due to fraud or error.In preparing the consolidated financial statements, management is responsible for assessing the Group’s ability to continue as a going concern and disclosing, as required by accounting principles generally accepted in Japan, matters related to going concern.The Audit Committee is responsible for overseeing the Group’s financial reporting process.
Auditor’s Responsibilities for the Audit of the Consolidated Financial Statements
Our objectives are to obtain reasonable assurance about whether the consolidated financial statements as a whole are free from material misstatement, whether due to fraud or error, and to issue an auditor’s report that includes our opinion. Misstatements can arise from fraud or error and are considered material if, individually or in the aggregate, they could reasonably be expected to influence the economic decisions of users taken on the basis of these consolidated financial statements.As part of an audit in accordance with auditing standards generally accepted in Japan, we exercise professional judgment and maintain professional skepticism throughout the audit. We also:・ Identify and assess the risks of material misstatement of the consolidated financial statements, whether due to fraud or
error, design and perform audit procedures responsive to those risks, and obtain audit evidence that is sufficient and appropriate to provide a basis for our opinion.
・ Consider internal control relevant to the audit in order to design audit procedures that are appropriate in the circumstances for our risk assessments, while the purpose of the audit of the consolidated financial statements is not expressing an opinion on the effectiveness of the Group’s internal control.
・ Evaluate the appropriateness of accounting policies used and the reasonableness of accounting estimates and related disclosures made by management.
・ Conclude on the appropriateness of management’s use of the going concern basis of accounting and, based on the audit evidence obtained, whether a material uncertainty exists related to events or conditions that may cast significant doubt on the Group’s ability to continue as a going concern. If we conclude that a material uncertainty exists, we are required to draw attention in our auditor’s report to the related disclosures in the consolidated financial statements or, if such disclosures are inadequate, to modify our opinion. Our conclusions are based on the audit evidence obtained up to the date of our auditor’s report. However, future events or conditions may cause the Group to cease to continue as a going concern.
・ Evaluate the overall presentation, structure and content of the consolidated financial statements, including the disclosures, and whether the consolidated financial statements represent the underlying transactions and events in a manner that achieves fair presentation in accordance with accounting principles generally accepted in Japan.
・ Obtain sufficient appropriate audit evidence regarding the financial information of the entities or business activities within the Group to express an opinion on the consolidated financial statements. We are responsible for the direction, supervision and performance of the group audit. We remain solely responsible for our audit opinion.
We communicate with the Audit Committee regarding, among other matters, the planned scope and timing of the audit and significant audit findings, including any significant deficiencies in internal control that we identify during our audit.We also provide the Audit Committee with a statement that we have complied with the ethical requirements regarding independence that are relevant to our audit of the financial statements in Japan, and to communicate with them all relationships and other matters that may reasonably be thought to bear on our independence, and where applicable, related safeguards.
143
Independent Auditor’s Report
2020/09/07 16:49:02 / 20635244_株式会社みずほフィナンシャルグループ_総会その他(C)
From the matters communicated with the Audit Committee, we determine those matters that were of most significance in the audit of the consolidated financial statements of the current period and are therefore the key audit matters. We describe these matters in our auditor’s report unless law or regulation precludes public disclosure about the matter or when, in extremely rare circumstances, we determine that a matter should not be communicated in our report because the adverse consequences of doing so would reasonably be expected to outweigh the public interest benefits of such communication.
Interest Required to Be Disclosed by the Certified Public Accountants Act of Japan
Our firm and its designated engagement partners do not have any interest in the Group which is required to be disclosed pursuant to the provisions of the Certified Public Accountants Act of Japan.
Convenience Translation
The U.S. dollar amounts in the accompanying consolidated financial statements with respect to the year ended March 31, 2020 are presented solely for convenience. Our audit also included the translation of Japanese yen amounts into U.S. dollar amounts and, in our opinion, such translation has been made on the basis described in Note 1 to the consolidated financial statements.
Ernst & Young ShinNihon LLCTokyo, Japan
June 23, 2020
Ryuji TakagiDesignated Engagement PartnerCertified Public Accountant
Hiroshi NishidaDesignated Engagement PartnerCertified Public Accountant
Shinichi HayashiDesignated Engagement PartnerCertified Public Accountant
Mitsuhiro NagaoDesignated Engagement PartnerCertified Public Accountant
144
Independent Auditor’s Report
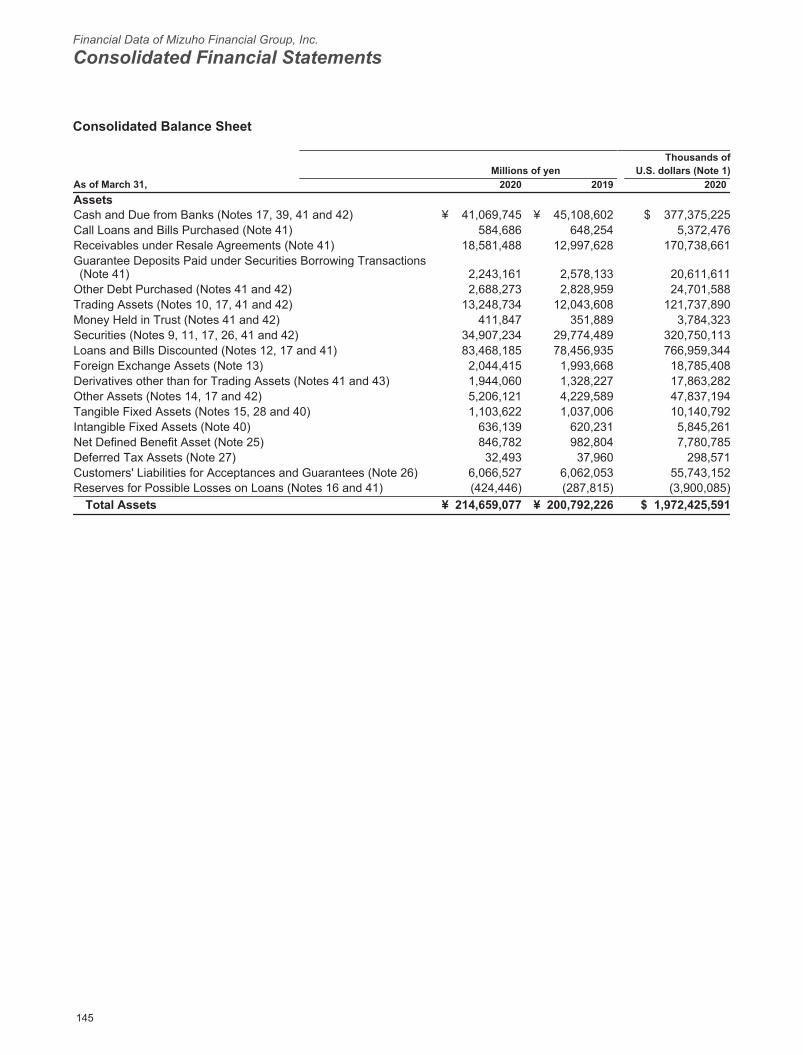
Financial Data of Mizuho Financial Group, Inc.
Consolidated Financial Statements
2020/09/07 16:49:02 / 20635244_株式会社みずほフィナンシャルグループ_総会その他(C)
Consolidated Balance Sheet
Millions of yenThousands of
U.S. dollars (Note 1)As of March 31, 2020 2019 2020AssetsCash and Due from Banks (Notes 17, 39, 41 and 42) ¥ 41,069,745 ¥ 45,108,602 $ 377,375,225Call Loans and Bills Purchased (Note 41) 584,686 648,254 5,372,476Receivables under Resale Agreements (Note 41) 18,581,488 12,997,628 170,738,661Guarantee Deposits Paid under Securities Borrowing Transactions (Note 41) 2,243,161 2,578,133 20,611,611
Other Debt Purchased (Notes 41 and 42) 2,688,273 2,828,959 24,701,588Trading Assets (Notes 10, 17, 41 and 42) 13,248,734 12,043,608 121,737,890Money Held in Trust (Notes 41 and 42) 411,847 351,889 3,784,323Securities (Notes 9, 11, 17, 26, 41 and 42) 34,907,234 29,774,489 320,750,113Loans and Bills Discounted (Notes 12, 17 and 41) 83,468,185 78,456,935 766,959,344Foreign Exchange Assets (Note 13) 2,044,415 1,993,668 18,785,408Derivatives other than for Trading Assets (Notes 41 and 43) 1,944,060 1,328,227 17,863,282Other Assets (Notes 14, 17 and 42) 5,206,121 4,229,589 47,837,194Tangible Fixed Assets (Notes 15, 28 and 40) 1,103,622 1,037,006 10,140,792Intangible Fixed Assets (Note 40) 636,139 620,231 5,845,261Net Defined Benefit Asset (Note 25) 846,782 982,804 7,780,785Deferred Tax Assets (Note 27) 32,493 37,960 298,571Customers' Liabilities for Acceptances and Guarantees (Note 26) 6,066,527 6,062,053 55,743,152Reserves for Possible Losses on Loans (Notes 16 and 41) (424,446) (287,815) (3,900,085)
Total Assets ¥ 214,659,077 ¥ 200,792,226 $ 1,972,425,591
145
Consolidated Balance Sheet
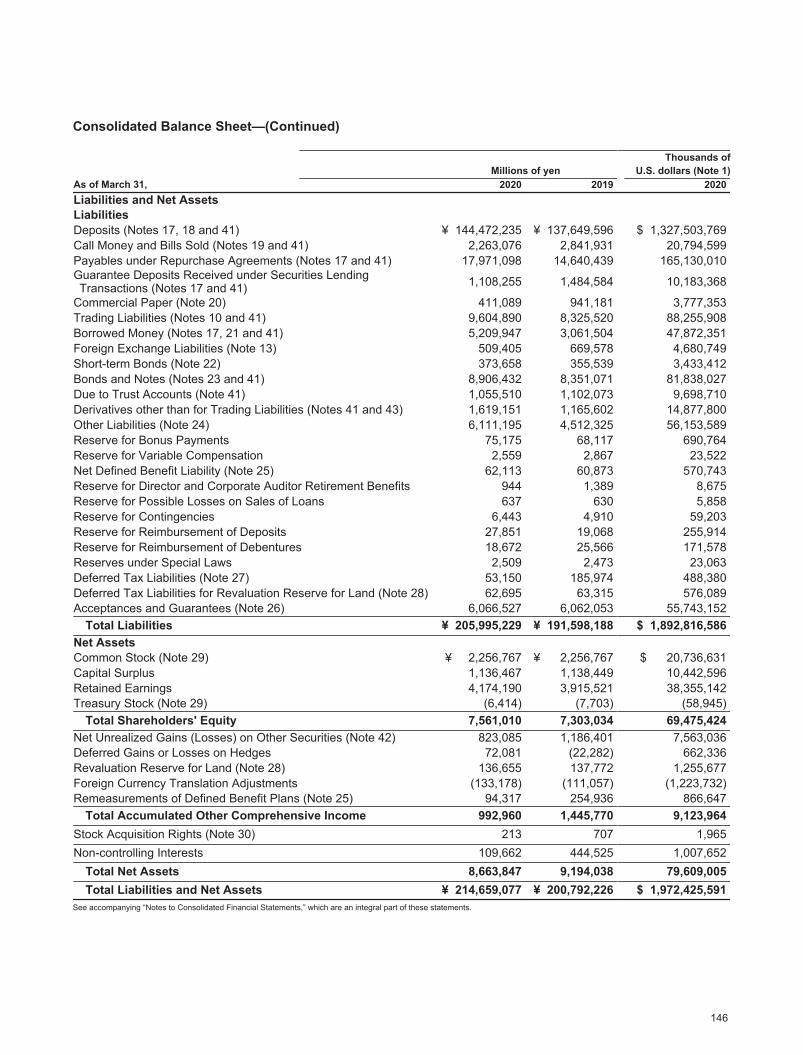
2020/09/07 16:49:02 / 20635244_株式会社みずほフィナンシャルグループ_総会その他(C)
Consolidated Balance Sheet—(Continued)
Millions of yenThousands of
U.S. dollars (Note 1)As of March 31, 2020 2019 2020Liabilities and Net AssetsLiabilitiesDeposits (Notes 17, 18 and 41) ¥ 144,472,235 ¥ 137,649,596 $ 1,327,503,769Call Money and Bills Sold (Notes 19 and 41) 2,263,076 2,841,931 20,794,599Payables under Repurchase Agreements (Notes 17 and 41) 17,971,098 14,640,439 165,130,010Guarantee Deposits Received under Securities Lending Transactions (Notes 17 and 41) 1,108,255 1,484,584 10,183,368
Commercial Paper (Note 20) 411,089 941,181 3,777,353Trading Liabilities (Notes 10 and 41) 9,604,890 8,325,520 88,255,908Borrowed Money (Notes 17, 21 and 41) 5,209,947 3,061,504 47,872,351Foreign Exchange Liabilities (Note 13) 509,405 669,578 4,680,749Short-term Bonds (Note 22) 373,658 355,539 3,433,412Bonds and Notes (Notes 23 and 41) 8,906,432 8,351,071 81,838,027Due to Trust Accounts (Note 41) 1,055,510 1,102,073 9,698,710Derivatives other than for Trading Liabilities (Notes 41 and 43) 1,619,151 1,165,602 14,877,800Other Liabilities (Note 24) 6,111,195 4,512,325 56,153,589Reserve for Bonus Payments 75,175 68,117 690,764Reserve for Variable Compensation 2,559 2,867 23,522Net Defined Benefit Liability (Note 25) 62,113 60,873 570,743Reserve for Director and Corporate Auditor Retirement Benefits 944 1,389 8,675Reserve for Possible Losses on Sales of Loans 637 630 5,858Reserve for Contingencies 6,443 4,910 59,203Reserve for Reimbursement of Deposits 27,851 19,068 255,914Reserve for Reimbursement of Debentures 18,672 25,566 171,578Reserves under Special Laws 2,509 2,473 23,063Deferred Tax Liabilities (Note 27) 53,150 185,974 488,380Deferred Tax Liabilities for Revaluation Reserve for Land (Note 28) 62,695 63,315 576,089Acceptances and Guarantees (Note 26) 6,066,527 6,062,053 55,743,152
Total Liabilities ¥ 205,995,229 ¥ 191,598,188 $ 1,892,816,586Net AssetsCommon Stock (Note 29) ¥ 2,256,767 ¥ 2,256,767 $ 20,736,631Capital Surplus 1,136,467 1,138,449 10,442,596Retained Earnings 4,174,190 3,915,521 38,355,142Treasury Stock (Note 29) (6,414) (7,703) (58,945)
Total Shareholders' Equity 7,561,010 7,303,034 69,475,424Net Unrealized Gains (Losses) on Other Securities (Note 42) 823,085 1,186,401 7,563,036Deferred Gains or Losses on Hedges 72,081 (22,282) 662,336Revaluation Reserve for Land (Note 28) 136,655 137,772 1,255,677Foreign Currency Translation Adjustments (133,178) (111,057) (1,223,732)Remeasurements of Defined Benefit Plans (Note 25) 94,317 254,936 866,647
Total Accumulated Other Comprehensive Income 992,960 1,445,770 9,123,964Stock Acquisition Rights (Note 30) 213 707 1,965Non-controlling Interests 109,662 444,525 1,007,652
Total Net Assets 8,663,847 9,194,038 79,609,005Total Liabilities and Net Assets ¥ 214,659,077 ¥ 200,792,226 $ 1,972,425,591
See accompanying “Notes to Consolidated Financial Statements,” which are an integral part of these statements.
146
Consolidated Balance Sheet
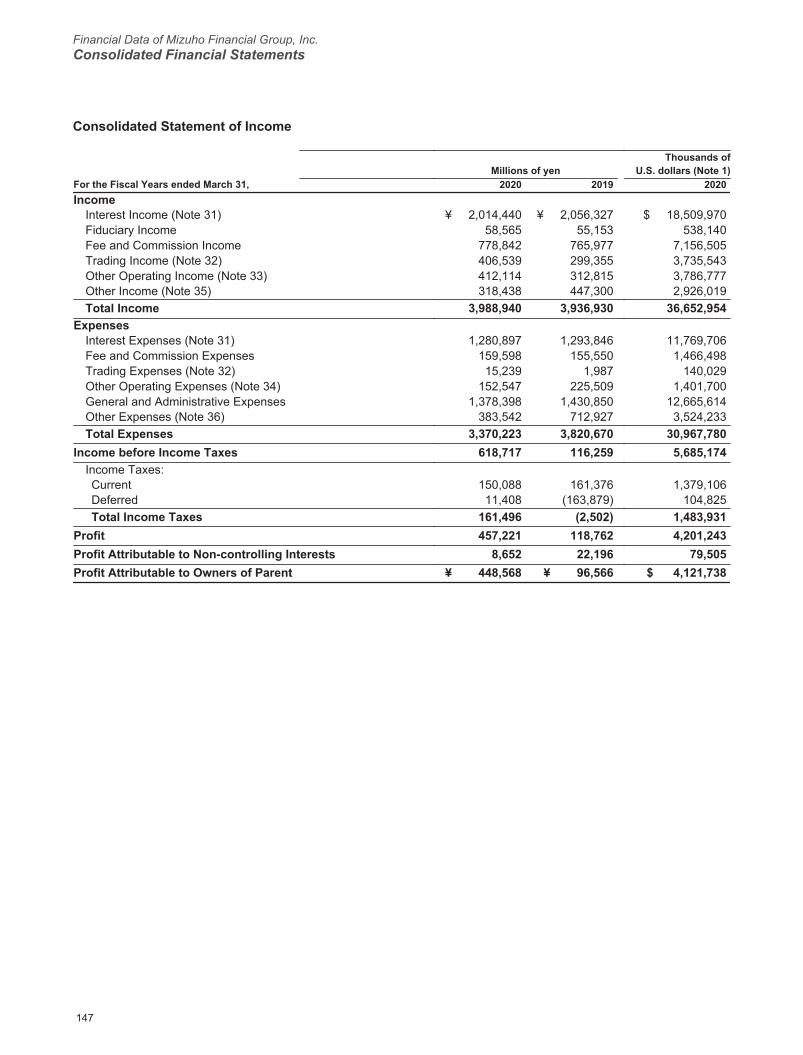
Financial Data of Mizuho Financial Group, Inc.Consolidated Financial Statements
2020/09/07 16:49:02 / 20635244_株式会社みずほフィナンシャルグループ_総会その他(C)
Consolidated Statement of Income
Millions of yenThousands of
U.S. dollars (Note 1)For the Fiscal Years ended March 31, 2020 2019 2020Income
Interest Income (Note 31) ¥ 2,014,440 ¥ 2,056,327 $ 18,509,970Fiduciary Income 58,565 55,153 538,140Fee and Commission Income 778,842 765,977 7,156,505Trading Income (Note 32) 406,539 299,355 3,735,543Other Operating Income (Note 33) 412,114 312,815 3,786,777Other Income (Note 35) 318,438 447,300 2,926,019Total Income 3,988,940 3,936,930 36,652,954
ExpensesInterest Expenses (Note 31) 1,280,897 1,293,846 11,769,706Fee and Commission Expenses 159,598 155,550 1,466,498Trading Expenses (Note 32) 15,239 1,987 140,029Other Operating Expenses (Note 34) 152,547 225,509 1,401,700General and Administrative Expenses 1,378,398 1,430,850 12,665,614Other Expenses (Note 36) 383,542 712,927 3,524,233Total Expenses 3,370,223 3,820,670 30,967,780
Income before Income Taxes 618,717 116,259 5,685,174Income Taxes:Current 150,088 161,376 1,379,106Deferred 11,408 (163,879) 104,825Total Income Taxes 161,496 (2,502) 1,483,931
Profit 457,221 118,762 4,201,243Profit Attributable to Non-controlling Interests 8,652 22,196 79,505Profit Attributable to Owners of Parent ¥ 448,568 ¥ 96,566 $ 4,121,738
147
Consolidated Statement of Income

2020/09/07 16:49:02 / 20635244_株式会社みずほフィナンシャルグループ_総会その他(C)
Per Share of Common Stock
Yen U.S. dollars (Note 1)As of March 31, 2020 2019 2020
Net Income:Basic ¥ 17.68 ¥ 3.80 $ 0.16Diluted 17.68 3.80 0.16
Cash Dividends 7.50 7.50 0.07See accompanying “Notes to Consolidated Financial Statements,” which are an integral part of these statements.
Consolidated Statement of Comprehensive Income
Millions of yenThousands of
U.S. dollars (Note 1)For the Fiscal Years ended March 31, 2020 2019 2020Profit ¥ 457,221 ¥ 118,762 $ 4,201,243Other Comprehensive Income (Note 37): (449,547) (229,304) (4,130,735)
Net Unrealized Gains (Losses) on Other Securities (359,779) (207,505) (3,305,887)Deferred Gains or Losses on Hedges 94,536 45,391 868,664Foreign Currency Translation Adjustments (20,650) (23,882) (189,746)Remeasurements of Defined Benefit Plans (157,693) (35,577) (1,448,992)Share of Other Comprehensive Income of Associates Accounted for Using Equity Method (5,961) (7,730) (54,774)
Comprehensive Income ¥ 7,673 ¥ (110,542) $ 70,508Comprehensive Income Attributable to Owners of Parent: ¥ (3,123) ¥ (128,692) $ (28,702)Comprehensive Income Attributable to Non-controlling Interests: 10,797 18,150 99,210
See accompanying “Notes to Consolidated Financial Statements,” which are an integral part of these statements.
148
Per Share of Common Stock、Consolidated Statement of Comprehensive Income

Financial Data of Mizuho Financial Group, Inc.Consolidated Financial Statements
2020/09/07 16:49:02 / 20635244_株式会社みずほフィナンシャルグループ_総会その他(C)
Consolidated Statement of Changes in Net AssetsMillions of yen
Shareholders' Equity
For the Fiscal Year endedMarch 31, 2020
CommonStock
CapitalSurplus
RetainedEarnings
TreasuryStock
TotalShareholders'
Equity
Balance as of the beginning of the period ¥ 2,256,767 ¥ 1,138,449 ¥ 3,915,521 ¥ (7,703) ¥ 7,303,034
Changes during the period
Cash Dividends (190,405) (190,405)
Profit Attributable to Owners of Parent 448,568 448,568
Repurchase of Treasury Stock (1,908) (1,908)
Disposition of Treasury Stock (625) 3,197 2,571
Transfer from Revaluation Reserve for Land 1,117 1,117
Change in Treasury Shares of Parent Arising from Transactions with Non- controlling Shareholders
(1,968) (1,968)
Transfer from Retained Earnings to Capital Surplus 611 (611) ―
Net Changes in Items other than Shareholders' Equity
Total Changes during the period ― (1,981) 258,668 1,288 257,975
Balance as of the end of the period ¥ 2,256,767 ¥ 1,136,467 ¥ 4,174,190 ¥ (6,414) ¥ 7,561,010
See accompanying “Notes to Consolidated Financial Statements,” which are an integral part of these statements.
149
Consolidated Statement of Changes in Net Assets
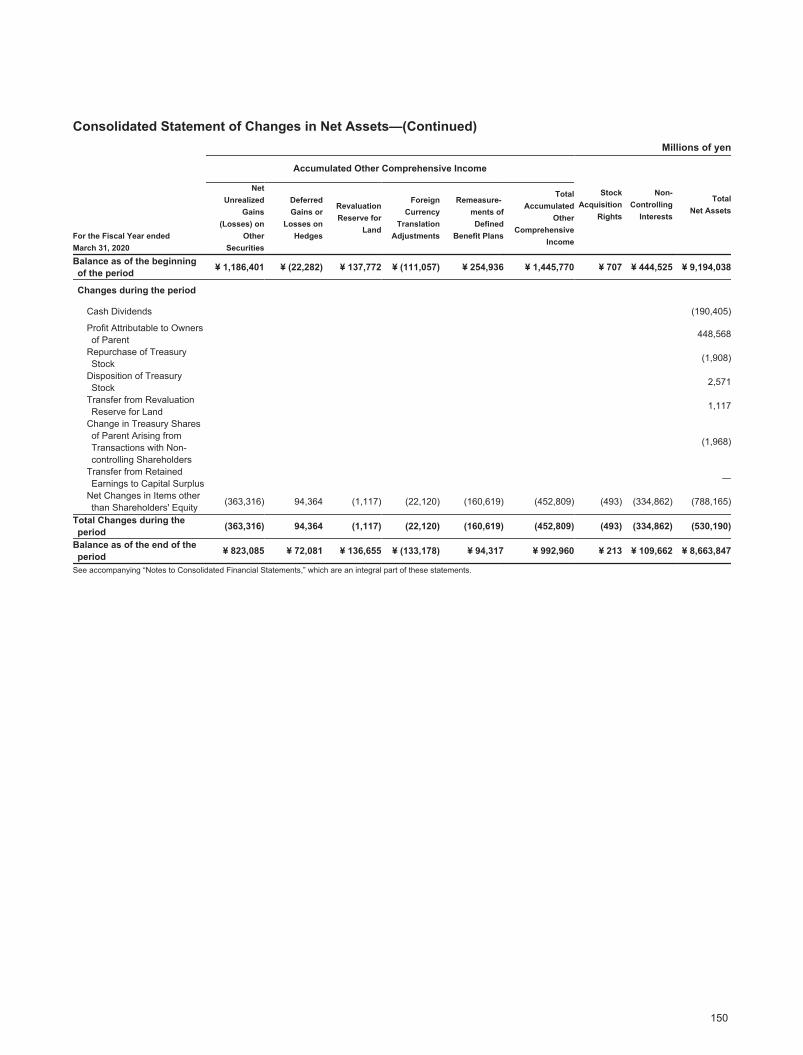
2020/09/07 16:49:02 / 20635244_株式会社みずほフィナンシャルグループ_総会その他(C)
Consolidated Statement of Changes in Net Assets—(Continued)Millions of yen
For the Fiscal Year endedMarch 31, 2020
Accumulated Other Comprehensive Income
StockAcquisition
Rights
Non-Controlling
Interests
TotalNet Assets
NetUnrealized
Gains(Losses) on
OtherSecurities
DeferredGains or
Losses onHedges
RevaluationReserve for
Land
ForeignCurrency
TranslationAdjustments
Remeasure- ments ofDefined
Benefit Plans
TotalAccumulated
OtherComprehensive
Income
Balance as of the beginning of the period ¥ 1,186,401 ¥ (22,282) ¥ 137,772 ¥ (111,057) ¥ 254,936 ¥ 1,445,770 ¥ 707 ¥ 444,525 ¥ 9,194,038
Changes during the period
Cash Dividends (190,405)
Profit Attributable to Owners of Parent 448,568
Repurchase of Treasury Stock (1,908)
Disposition of Treasury Stock 2,571
Transfer from Revaluation Reserve for Land 1,117
Change in Treasury Shares of Parent Arising from Transactions with Non- controlling Shareholders
(1,968)
Transfer from Retained Earnings to Capital Surplus ―
Net Changes in Items other than Shareholders' Equity (363,316) 94,364 (1,117) (22,120) (160,619) (452,809) (493) (334,862) (788,165)
Total Changes during the period (363,316) 94,364 (1,117) (22,120) (160,619) (452,809) (493) (334,862) (530,190)
Balance as of the end of the period ¥ 823,085 ¥ 72,081 ¥ 136,655 ¥ (133,178) ¥ 94,317 ¥ 992,960 ¥ 213 ¥ 109,662 ¥ 8,663,847
See accompanying “Notes to Consolidated Financial Statements,” which are an integral part of these statements.
150
Consolidated Statement of Changes in Net Assets

Financial Data of Mizuho Financial Group, Inc.Consolidated Financial Statements
2020/09/07 16:49:02 / 20635244_株式会社みずほフィナンシャルグループ_総会その他(C)
Consolidated Statement of Changes in Net Assets—(Continued)Millions of yen
Shareholders' Equity
For the Fiscal Year endedMarch 31, 2019
CommonStock
CapitalSurplus
RetainedEarnings
TreasuryStock
TotalShareholders'
Equity
Balance as of the beginning of the period ¥ 2,256,548 ¥ 1,134,922 ¥ 4,002,835 ¥ (5,997) ¥ 7,388,309
Changes during the period
Issuance of New Shares 218 218 437
Cash Dividends (190,384) (190,384)
Profit Attributable to Owners of Parent 96,566 96,566
Repurchase of Treasury Stock (3,001) (3,001)
Disposition of Treasury Stock (23) 1,295 1,271
Transfer from Revaluation Reserve for Land 6,504 6,504
Change in Treasury Shares of Parent Arising from Transactions with Non- controlling Shareholders
3,331 3,331
Net Changes in Items other than Shareholders' Equity
Total Changes during the period 218 3,526 (87,313) (1,706) (85,274)
Balance as of the end of the period ¥ 2,256,767 ¥ 1,138,449 ¥ 3,915,521 ¥ (7,703) ¥ 7,303,034
See accompanying “Notes to Consolidated Financial Statements,” which are an integral part of these statements.
151
Consolidated Statement of Changes in Net Assets

2020/09/07 16:49:02 / 20635244_株式会社みずほフィナンシャルグループ_総会その他(C)
Consolidated Statement of Changes in Net Assets—(Continued)Millions of yen
For the Fiscal Year endedMarch 31, 2019
Accumulated Other Comprehensive Income
StockAcquisition
Rights
Non-Controlling
Interests
TotalNet Assets
NetUnrealized
Gains(Losses) on
OtherSecurities
DeferredGains or
Losses onHedges
RevaluationReserve for
Land
ForeignCurrency
TranslationAdjustments
Remeasure- ments ofDefined
Benefit Plans
TotalAccumulated
OtherComprehensive
Income
Balance as of the beginning of the period ¥ 1,392,392 ¥ (67,578) ¥ 144,277 ¥ (85,094) ¥ 293,536 ¥ 1,677,534 ¥ 1,163 ¥ 754,239 ¥ 9,821,246
Changes during the period
Issuance of New Shares 437
Cash Dividends (190,384)
Profit Attributable to Owners of Parent 96,566
Repurchase of Treasury Stock (3,001)
Disposition of Treasury Stock 1,271
Transfer from Revaluation Reserve for Land 6,504
Change in Treasury Shares of Parent Arising from Transactions with Non- controlling Shareholders
3,331
Net Changes in Items other than Shareholders' Equity (205,990) 45,295 (6,504) (25,963) (38,600) (231,763) (456) (309,713) (541,934)
Total Changes during the period (205,990) 45,295 (6,504) (25,963) (38,600) (231,763) (456) (309,713) (627,208)
Balance as of the end of the period ¥ 1,186,401 ¥ (22,282) ¥ 137,772 ¥ (111,057) ¥ 254,936 ¥ 1,445,770 ¥ 707 ¥ 444,525 ¥ 9,194,038
See accompanying “Notes to Consolidated Financial Statements,” which are an integral part of these statements.
152
Consolidated Statement of Changes in Net Assets
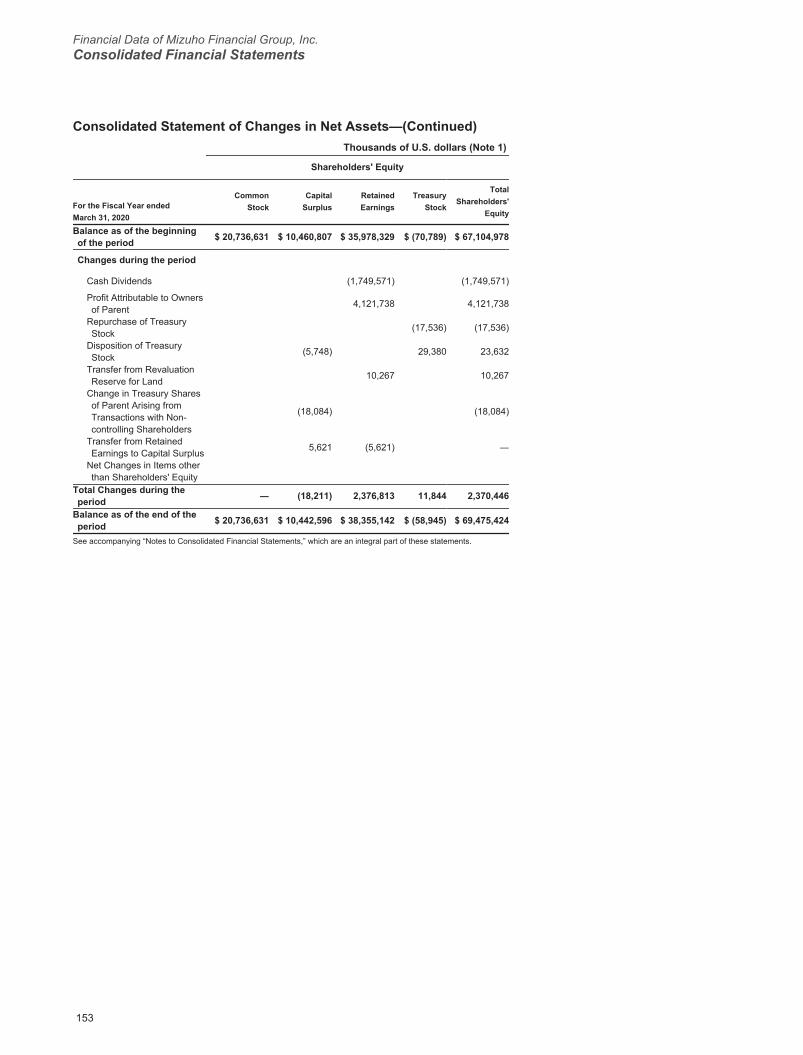
Financial Data of Mizuho Financial Group, Inc.Consolidated Financial Statements
2020/09/07 16:49:02 / 20635244_株式会社みずほフィナンシャルグループ_総会その他(C)
Consolidated Statement of Changes in Net Assets—(Continued)Thousands of U.S. dollars (Note 1)
Shareholders' Equity
For the Fiscal Year endedMarch 31, 2020
Common Stock
CapitalSurplus
RetainedEarnings
TreasuryStock
TotalShareholders'
Equity
Balance as of the beginning of the period $ 20,736,631 $ 10,460,807 $ 35,978,329 $ (70,789) $ 67,104,978
Changes during the period
Cash Dividends (1,749,571) (1,749,571)
Profit Attributable to Owners of Parent 4,121,738 4,121,738
Repurchase of Treasury Stock (17,536) (17,536)
Disposition of Treasury Stock (5,748) 29,380 23,632
Transfer from Revaluation Reserve for Land 10,267 10,267
Change in Treasury Shares of Parent Arising from Transactions with Non- controlling Shareholders
(18,084) (18,084)
Transfer from Retained Earnings to Capital Surplus 5,621 (5,621) ―
Net Changes in Items other than Shareholders' Equity
Total Changes during the period ― (18,211) 2,376,813 11,844 2,370,446
Balance as of the end of the period $ 20,736,631 $ 10,442,596 $ 38,355,142 $ (58,945) $ 69,475,424
See accompanying “Notes to Consolidated Financial Statements,” which are an integral part of these statements.
153
Consolidated Statement of Changes in Net Assets

2020/09/07 16:49:02 / 20635244_株式会社みずほフィナンシャルグループ_総会その他(C)
Consolidated Statement of Changes in Net Assets—(Continued)Thousands of U.S. dollars (Note 1)
For the Fiscal Year endedMarch 31, 2020
Accumulated Other Comprehensive Income
StockAcquisition
Rights
Non-Controlling
Interests
TotalNet Assets
NetUnrealized
Gains(Losses) on
OtherSecurities
DeferredGains or
Losses onHedges
RevaluationReserve for
Land
ForeignCurrency
TranslationAdjustments
Remeasure- ments ofDefinedBenefit
Plans
TotalAccumulated
OtherComprehensive
Income
Balance as of the beginning of the period $ 10,901,424 $ (204,747) $ 1,265,944 $ (1,020,471) $ 2,342,521 $ 13,284,671 $ 6,497 $ 4,084,586 $ 84,480,732
Changes during the period
Cash Dividends (1,749,571)
Profit Attributable to Owners of Parent 4,121,738
Repurchase of Treasury Stock (17,536)
Disposition of Treasury Stock 23,632
Transfer from Revaluation Reserve for Land 10,267
Change in Treasury Shares of Parent Arising from Transactions with Non- controlling Shareholders
(18,084)
Transfer from Retained Earnings to Capital Surplus ―
Net Changes in Items other than Shareholders' Equity (3,338,388) 867,083 (10,267) (203,261) (1,475,874) (4,160,707) (4,532) (3,076,934) (7,242,173)
Total Changes during the period (3,338,388) 867,083 (10,267) (203,261) (1,475,874) (4,160,707) (4,532) (3,076,934) (4,871,727)
Balance as of the end of the period $ 7,563,036 $ 662,336 $ 1,255,677 $ (1,223,732) $ 866,647 $ 9,123,964 $ 1,965 $ 1,007,652 $ 79,609,005
See accompanying “Notes to Consolidated Financial Statements,” which are an integral part of these statements.
154
Consolidated Statement of Changes in Net Assets

Financial Data of Mizuho Financial Group, Inc.Consolidated Financial Statements
2020/09/07 16:49:02 / 20635244_株式会社みずほフィナンシャルグループ_総会その他(C)
Consolidated Statement of Cash Flows
Millions of yenThousands of
U.S. dollars (Note 1)For the Fiscal Years ended March 31, 2020 2019 2020Cash Flow from Operating Activities
Income before Income Taxes ¥ 618,717 ¥ 116,259 $ 5,685,173Depreciation 152,666 168,200 1,402,798Losses on Impairment of Fixed Assets 15,224 503,612 139,892Amortization of Goodwill 4,062 4,080 37,324Equity in Loss (Gain) from Investments in Affiliates (30,382) (51,215) (279,173)Increase (Decrease) in Reserves for Possible Losses on Loans 139,940 (26,910) 1,285,861Increase (Decrease) in Reserve for Possible Losses on Sales of Loans 6 (444) 60
Increase (Decrease) in Reserve for Contingencies 1,793 183 16,475Increase (Decrease) in Reserve for Bonus Payments 8,611 591 79,127Increase (Decrease) in Reserve for Variable Compensation (307) (375) (2,825)Decrease (Increase) in Net Defined Benefit Asset (91,950) (57,863) (844,902)Increase (Decrease) in Net Defined Benefit Liability 2,590 2,497 23,804Increase (Decrease) in Reserve for Director and Corporate Auditor Retirement Benefits (439) (41) (4,034)
Increase (Decrease) in Reserve for Reimbursement of Deposits 8,782 (942) 80,698Increase (Decrease) in Reserve for Reimbursement of Debentures (6,893) (5,194) (63,339)
Interest Income—accrual basis (2,014,440) (2,056,327) (18,509,970)Interest Expenses—accrual basis 1,280,897 1,293,846 11,769,706Losses (Gains) on Securities (231,382) (195,755) (2,126,093)Losses (Gains) on Money Held in Trust (121) (40) (1,120)Foreign Exchange Losses (Gains)—net 103,125 (170,422) 947,585Losses (Gains) on Disposition of Fixed Assets 3,898 1,976 35,824Losses (Gains) on Cancellation of Employee Retirement Benefit Trust ― (7,841) ―
Decrease (Increase) in Trading Assets (1,435,994) (1,536,520) (13,194,837)Increase (Decrease) in Trading Liabilities 1,488,005 227,455 13,672,752Decrease (Increase) in Derivatives other than for Trading Assets (638,977) 485,333 (5,871,334)Increase (Decrease) in Derivatives other than for Trading Liabilities 475,833 (355,068) 4,372,263
Decrease (Increase) in Loans and Bills Discounted (5,967,287) (2,407,594) (54,831,272)Increase (Decrease) in Deposits 8,099,383 2,806,760 74,422,347Increase (Decrease) in Borrowed Money (excluding Subordinated Borrowed Money) 2,165,756 (1,800,307) 19,900,367
Decrease (Increase) in Due from Banks (excluding Due from Central Banks) (365,564) 611,070 (3,359,037)
Decrease (Increase) in Call Loans, etc. (5,758,002) (4,807,554) (52,908,229)Decrease (Increase) in Guarantee Deposits Paid under Securities Borrowing Transactions 334,971 1,772,393 3,077,938
Increase (Decrease) in Call Money, etc. 3,128,355 1,748,141 28,745,339Increase (Decrease) in Commercial Paper (511,609) 199,104 (4,700,996)Increase (Decrease) in Guarantee Deposits Received under Securities Lending Transactions (376,328) (82,249) (3,457,948)
Decrease (Increase) in Foreign Exchange Assets (106,795) (34,376) (981,302)Increase (Decrease) in Foreign Exchange Liabilities (159,598) 223,848 (1,466,497)Increase (Decrease) in Short-term Bonds (Liabilities) 18,119 (6,646) 166,490Increase (Decrease) in Bonds and Notes ¥ 308,937 ¥ 286,158 $ 2,838,716
155
Consolidated Statement of Cash Flows
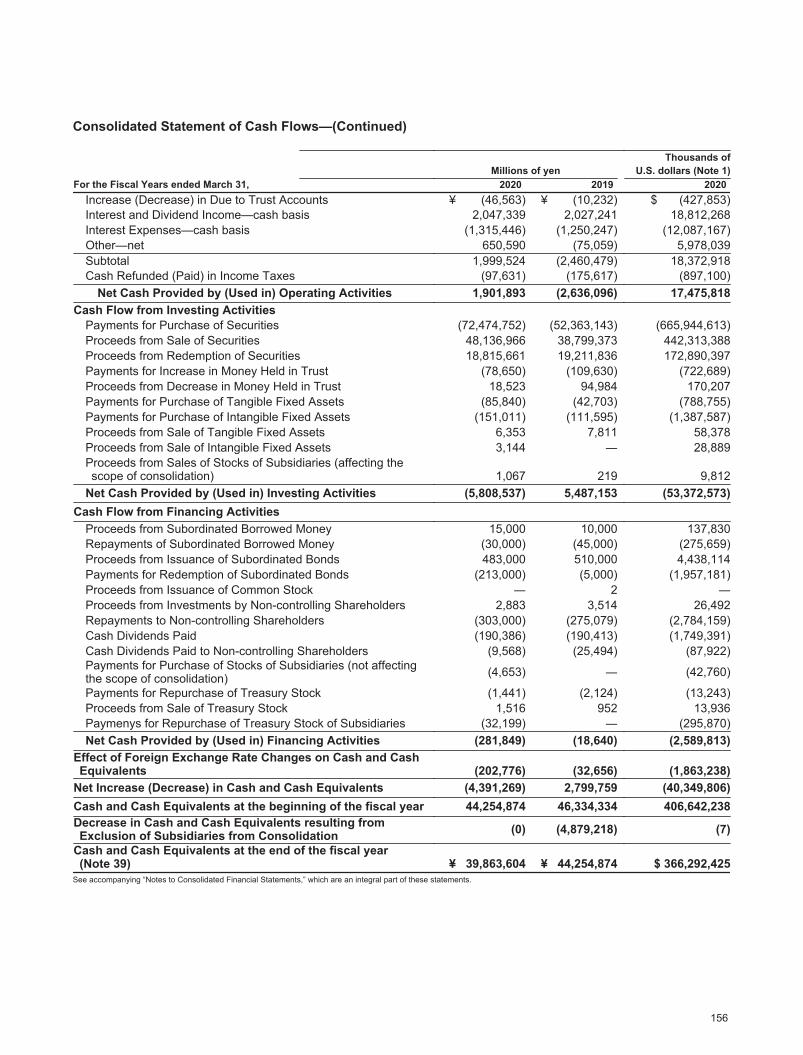
2020/09/07 16:49:02 / 20635244_株式会社みずほフィナンシャルグループ_総会その他(C)
Consolidated Statement of Cash Flows—(Continued)
Millions of yenThousands of
U.S. dollars (Note 1)For the Fiscal Years ended March 31, 2020 2019 2020
Increase (Decrease) in Due to Trust Accounts ¥ (46,563) ¥ (10,232) $ (427,853)Interest and Dividend Income—cash basis 2,047,339 2,027,241 18,812,268Interest Expenses—cash basis (1,315,446) (1,250,247) (12,087,167)Other—net 650,590 (75,059) 5,978,039Subtotal 1,999,524 (2,460,479) 18,372,918Cash Refunded (Paid) in Income Taxes (97,631) (175,617) (897,100)
Net Cash Provided by (Used in) Operating Activities 1,901,893 (2,636,096) 17,475,818Cash Flow from Investing Activities
Payments for Purchase of Securities (72,474,752) (52,363,143) (665,944,613)Proceeds from Sale of Securities 48,136,966 38,799,373 442,313,388Proceeds from Redemption of Securities 18,815,661 19,211,836 172,890,397Payments for Increase in Money Held in Trust (78,650) (109,630) (722,689)Proceeds from Decrease in Money Held in Trust 18,523 94,984 170,207Payments for Purchase of Tangible Fixed Assets (85,840) (42,703) (788,755)Payments for Purchase of Intangible Fixed Assets (151,011) (111,595) (1,387,587)Proceeds from Sale of Tangible Fixed Assets 6,353 7,811 58,378Proceeds from Sale of Intangible Fixed Assets 3,144 ― 28,889Proceeds from Sales of Stocks of Subsidiaries (affecting the scope of consolidation) 1,067 219 9,812
Net Cash Provided by (Used in) Investing Activities (5,808,537) 5,487,153 (53,372,573)Cash Flow from Financing Activities
Proceeds from Subordinated Borrowed Money 15,000 10,000 137,830Repayments of Subordinated Borrowed Money (30,000) (45,000) (275,659)Proceeds from Issuance of Subordinated Bonds 483,000 510,000 4,438,114Payments for Redemption of Subordinated Bonds (213,000) (5,000) (1,957,181)Proceeds from Issuance of Common Stock ― 2 ―Proceeds from Investments by Non-controlling Shareholders 2,883 3,514 26,492Repayments to Non-controlling Shareholders (303,000) (275,079) (2,784,159)Cash Dividends Paid (190,386) (190,413) (1,749,391)Cash Dividends Paid to Non-controlling Shareholders (9,568) (25,494) (87,922)Payments for Purchase of Stocks of Subsidiaries (not affecting the scope of consolidation) (4,653) ― (42,760)
Payments for Repurchase of Treasury Stock (1,441) (2,124) (13,243)Proceeds from Sale of Treasury Stock 1,516 952 13,936Paymenys for Repurchase of Treasury Stock of Subsidiaries (32,199) ― (295,870)Net Cash Provided by (Used in) Financing Activities (281,849) (18,640) (2,589,813)
Effect of Foreign Exchange Rate Changes on Cash and Cash Equivalents (202,776) (32,656) (1,863,238)
Net Increase (Decrease) in Cash and Cash Equivalents (4,391,269) 2,799,759 (40,349,806)Cash and Cash Equivalents at the beginning of the fiscal year 44,254,874 46,334,334 406,642,238Decrease in Cash and Cash Equivalents resulting from Exclusion of Subsidiaries from Consolidation (0) (4,879,218) (7)
Cash and Cash Equivalents at the end of the fiscal year (Note 39) ¥ 39,863,604 ¥ 44,254,874 $ 366,292,425
See accompanying “Notes to Consolidated Financial Statements,” which are an integral part of these statements.
156
Consolidated Statement of Cash Flows

Financial Data of Mizuho Financial Group, Inc.
Notes to Consolidated Financial Statements
2020/09/07 16:49:02 / 20635244_株式会社みずほフィナンシャルグループ_総会その他(C)
1. Basis for Presentation
The accompanying consolidated financial statements have been prepared from the accounts maintained by Mizuho Financial Group, Inc. (“MHFG”) and its consolidated subsidiaries in accordance with the provisions set forth in the Company Law of Japan and the Financial Instruments and Exchange Law, and in conformity with accounting principles generally accepted in Japan (“Japanese GAAP”) which are different in certain respects from the application and disclosure requirements of International Financial Reporting Standards.
Certain items presented in the consolidated financial statements which were previously filed with the Director General of the Kanto Local Finance Bureau are reclassified for the convenience of readers outside Japan. The notes to the consolidated financial statements include information which is not required under Japanese GAAP but is presented herein as additional information.
The amounts indicated in millions of yen are rounded down by truncating the figures below one million. Totals may not add up exactly because of such truncation. Amounts in U.S. dollars are included solely for the convenience of readers outside Japan. The rate of ¥108.83=US$1.00, the foreign exchange rate on March 31, 2020 has been used for translation. The inclusion of such amounts is not intended to imply that Japanese yen has been or could be readily converted, realized or settled into U.S. dollars at that rate or any other rate.
2. Scope of Consolidation
(a) The consolidated financial statements include the accounts of MHFG and its consolidated subsidiaries (collectively, “the Group”), including Mizuho Bank, Ltd. (“MHBK”), Mizuho Trust & Banking Co., Ltd. (“MHTB”), Mizuho Securities Co., Ltd. (“MHSC”) and certain other subsidiaries. The numbers of consolidated subsidiaries as of March 31, 2020 and 2019 were 126 and 117, respectively.
During the period, Mizuho Markets Americas LLC and 19 other companies were newly included in the scope of consolidation as a result of establishment.
During the period, Mizuho Delivery Service Co., Ltd. and 10 other companies were excluded from the scope of consolidation as a result of merger and other factors.
(b) There were no non-consolidated subsidiaries as of March 31, 2020 and 2019.
3. Application of the Equity Method
(a) There were no non-consolidated subsidiaries under the equity method as of March 31, 2020 and 2019.(b) The numbers of affiliates under the equity method as of March 31, 2020 and 2019 were 26 and 22, respectively.
Investments in affiliates include JTC Holdings, Ltd., Orient Corporation, Mizuho Leasing Company, Limited and certain other affiliates.
During the period, LINE Credit Corporation and 4 other companies were newly included in the scope of the equity method as a result of increasing the shares and other factors.
During the period, Qubitous Co., Ltd. was excluded from the scope of the equity method as a result of decreasing the shares.
(c) There were no non-consolidated subsidiaries not under the equity method as of March 31, 2020 and 2019.(d) Pec International Leasing Co., Ltd. ,an affiliate not under the equity method, is not accounted for under the equity
method, as it is not significant to the consolidated financial statements of MHFG.
157
Basis for Presentation、Scope of Consolidation、Application of the Equity Method
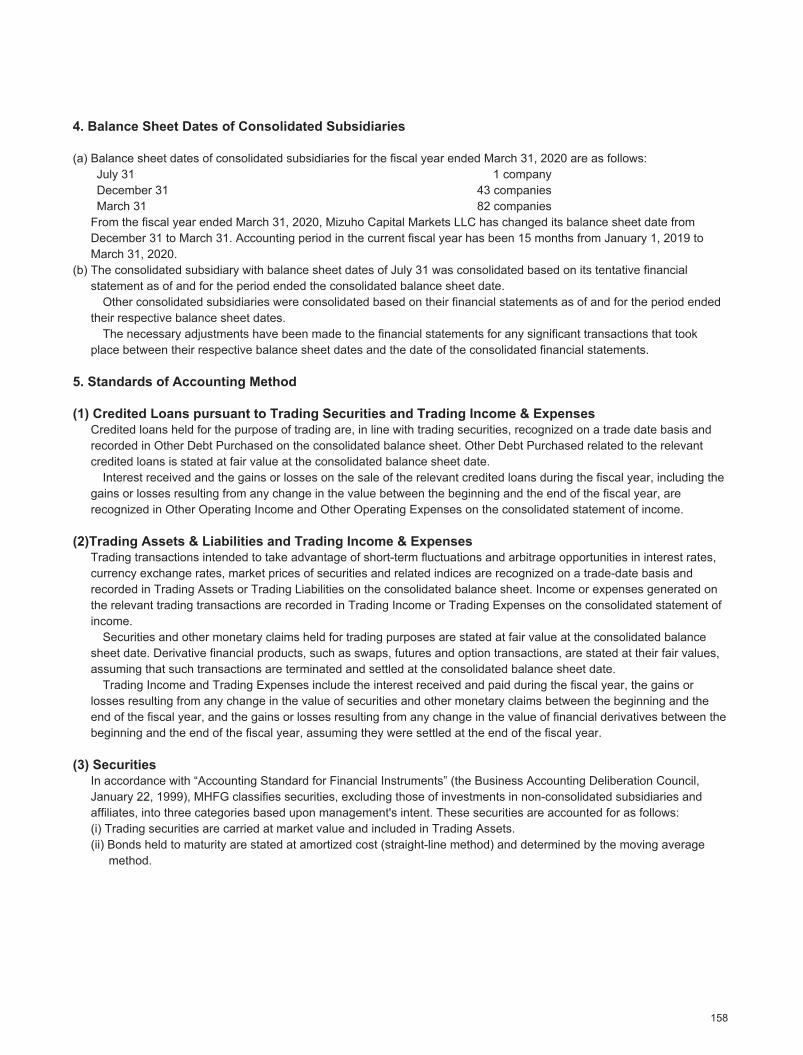
2020/09/07 16:49:02 / 20635244_株式会社みずほフィナンシャルグループ_総会その他(C)
4. Balance Sheet Dates of Consolidated Subsidiaries
(a) Balance sheet dates of consolidated subsidiaries for the fiscal year ended March 31, 2020 are as follows:July 31 1 companyDecember 31 43 companiesMarch 31 82 companies
From the fiscal year ended March 31, 2020, Mizuho Capital Markets LLC has changed its balance sheet date from December 31 to March 31. Accounting period in the current fiscal year has been 15 months from January 1, 2019 to March 31, 2020.
(b) The consolidated subsidiary with balance sheet dates of July 31 was consolidated based on its tentative financial statement as of and for the period ended the consolidated balance sheet date.
Other consolidated subsidiaries were consolidated based on their financial statements as of and for the period ended their respective balance sheet dates.
The necessary adjustments have been made to the financial statements for any significant transactions that took place between their respective balance sheet dates and the date of the consolidated financial statements.
5. Standards of Accounting Method
(1) Credited Loans pursuant to Trading Securities and Trading Income & ExpensesCredited loans held for the purpose of trading are, in line with trading securities, recognized on a trade date basis and recorded in Other Debt Purchased on the consolidated balance sheet. Other Debt Purchased related to the relevant credited loans is stated at fair value at the consolidated balance sheet date.
Interest received and the gains or losses on the sale of the relevant credited loans during the fiscal year, including the gains or losses resulting from any change in the value between the beginning and the end of the fiscal year, are recognized in Other Operating Income and Other Operating Expenses on the consolidated statement of income.
(2)Trading Assets & Liabilities and Trading Income & ExpensesTrading transactions intended to take advantage of short-term fluctuations and arbitrage opportunities in interest rates, currency exchange rates, market prices of securities and related indices are recognized on a trade-date basis and recorded in Trading Assets or Trading Liabilities on the consolidated balance sheet. Income or expenses generated on the relevant trading transactions are recorded in Trading Income or Trading Expenses on the consolidated statement of income.
Securities and other monetary claims held for trading purposes are stated at fair value at the consolidated balance sheet date. Derivative financial products, such as swaps, futures and option transactions, are stated at their fair values, assuming that such transactions are terminated and settled at the consolidated balance sheet date.
Trading Income and Trading Expenses include the interest received and paid during the fiscal year, the gains or losses resulting from any change in the value of securities and other monetary claims between the beginning and the end of the fiscal year, and the gains or losses resulting from any change in the value of financial derivatives between the beginning and the end of the fiscal year, assuming they were settled at the end of the fiscal year.
(3) SecuritiesIn accordance with “Accounting Standard for Financial Instruments” (the Business Accounting Deliberation Council, January 22, 1999), MHFG classifies securities, excluding those of investments in non-consolidated subsidiaries and affiliates, into three categories based upon management's intent. These securities are accounted for as follows:(i) Trading securities are carried at market value and included in Trading Assets.(ii) Bonds held to maturity are stated at amortized cost (straight-line method) and determined by the moving average
method.
158
Balance Sheet Dates of Consolidated Subsidiaries、Standards of Accounting Method

Financial Data of Mizuho Financial Group, Inc.Notes to Consolidated Financial Statements
2020/09/07 16:49:02 / 20635244_株式会社みずほフィナンシャルグループ_総会その他(C)
(iii) Other securities are securities which are not classified as either trading securities or bonds held to maturity. Other securities which have readily determinable fair value are stated at fair value with changes in net unrealized gains or losses, net of applicable income taxes after excluding gains and losses as a result of the fair-value hedge method, included directly in Net Assets. The fair value of Japanese stocks is determined based on the average quoted market price over the month preceding the consolidated balance sheet date. The fair value of securities other than Japanese stocks is determined at the quoted market price if available, or other reasonable value at the consolidated balance sheet date (cost of securities sold is calculated primarily by the moving average method). Other securities, the fair values of which are extremely difficult to determine, are stated at acquisition cost or amortized cost which is determined by the moving average method.
In addition, investments in affiliates not under the equity method are stated at acquisition cost as determined by the moving average method.
Securities which are held as trust assets in Money Held in Trust accounts are valued in the same way as Securities above.Certain Securities other than Trading Securities (excluding Securities for which it is deemed to be extremely difficult to determine the fair value) are devalued to the fair value, and the difference between the acquisition cost and the fair value is treated as a loss for the fiscal year (“impairment (devaluation)”), if the fair value (primarily the closing market price at the consolidated balance sheet date) has significantly deteriorated compared with the acquisition cost (including amortized cost), and unless it is deemed that there is a possibility of a recovery in the fair value. The amounts of impairment (devaluation) were ¥41,655 million ($382,759 thousand) and ¥4,736 million for the fiscal years ended March 31, 2020 and 2019, respectively.
The criteria for determining whether a security's fair value has “significantly deteriorated” are outlined as follows:• Security whose fair value is 50% or less of the acquisition cost• Security whose fair value exceeds 50% but is 70% or less of the acquisition cost and the quoted market price
maintains a certain level or lower
(4) Bills DiscountedIn accordance with “Accounting and Auditing Treatment relating to Adoption of Accounting Standards for Financial Instruments for Banks” (The Japanese Institute of Certified Public Accountants (“JICPA”) Industry Audit Committee Report No. 24), bills discounted are accounted for as financing transactions. The banking subsidiaries have rights to sell or pledge these commercial bills, foreign exchange bills purchased and others. The face value of these bills amounted to ¥1,341,367 million ($12,325,349 thousand) and ¥1,487,045 million as of March 31, 2020 and 2019, respectively.
(5) Derivative TransactionsDerivative transactions are valued at fair value with changes in fair value included in current income. Derivatives qualifying as hedges are mainly accounted for using either the fair-value hedge method or the deferred method of hedge accounting (see (22) Hedge Accounting).
(6) Tangible Fixed Assets (Except for Lease Assets)Depreciation of buildings is computed mainly by the straight-line method, and that of others is computed mainly by the declining-balance method. The range of useful lives is as follows:
Buildings 3 years to 50 yearsOthers 2 years to 20 years
(7) Intangible Fixed Assets (Except for Lease Assets)Amortization of Intangible Fixed Assets is computed by the straight-line method. Development costs for internally-used software are capitalized and amortized over their estimated useful lives of mainly from five to ten years as determined by MHFG and its consolidated subsidiaries.
(8) Lease AssetsDepreciation of lease assets booked in Tangible Fixed Assets and Intangible Fixed Assets which are concerned with finance lease transactions that do not transfer ownership is mainly computed by the same method as the one applied to fixed assets owned by us.
159
Standards of Accounting Method

2020/09/07 16:49:02 / 20635244_株式会社みずほフィナンシャルグループ_総会その他(C)
(9) Deferred AssetsBond issuance costs are expensed as incurred.
(10) Reserves for Possible Losses on LoansReserves for Possible Losses on Loans of major domestic consolidated subsidiaries are maintained in accordance with internally established standards for write-offs and reserve provisions:• For claims extended to obligors that are legally bankrupt under the Bankruptcy Law, Special Liquidation under the
Company Law or other similar laws (“Bankrupt Obligors”), and to obligors that are effectively in similar conditions (“Substantially Bankrupt Obligors”), reserves are maintained at the amounts of claims net of direct write-offs described below and the expected amounts recoverable from the disposition of collateral and the amounts recoverable under guarantees.
• For claims extended to obligors that are not yet legally or formally bankrupt but are likely to be bankrupt (“Intensive Control Obligors”), reserves are maintained at the amounts deemed necessary based on overall solvency analyses of the amounts of claims net of expected amounts recoverable from the disposition of collateral and the amounts recoverable under guarantees.
• For claims extended to Intensive Control Obligors and Obligors with Restructured Loans (defined in Note 12 below) and others, if the exposure to an obligor exceeds a certain specific amount, reserves are provided as follows:(i) if future cash flows of the principal and interest can be reasonably estimated, the discounted cash flow method is
applied, under which the reserve is determined as the difference between the book value of the loan and its present value of future cash flows discounted using the contractual interest rate before the loan was classified as a Restructured Loan, and
(ii) if future cash flows of the principal and interest cannot be reasonably estimated, reserves are provided for the losses estimated for each individual loan.
• For claims extended to other obligors, reserves for the next one year or three years are maintained at rates derived from historical credit loss experience or historical bankruptcy experience for one or three years and making necessary adjustments such as future prospects and others.
• Reserve for Possible Losses on Loans to Restructuring Countries is maintained in order to cover possible losses based on analyses of the political and economic climates of the countries. All claims are assessed by each claim origination department in accordance with the internally established “Self-assessment Standard,” and the results of the assessments are verified and examined by the independent examination departments.In the case of claims to Bankrupt Obligors and Substantially Bankrupt Obligors, which are collateralized or guaranteed
by a third party, the amounts deemed uncollectible (calculated by deducting the anticipated proceeds from the sale of collateral pledged against the claims and amounts that are expected to be recovered from guarantors of the claims) are written off against the respective claim balances. The total directly written-off amounts were ¥89,216 million ($819,782 thousand) and ¥92,269 million as of March 31, 2020 and 2019, respectively.
Other consolidated subsidiaries provide the amount necessary to cover the loan losses based upon past experience and other factors for general claims and the assessment for each individual loan for other claims.(Additional Information)In light of the principles set forth in the report entitled “Japanese Financial Services Agency (“JFSA”)’s supervisory approaches to lending business and loan loss provisioning” published by JFSA in December 18, 2019, we have reflected the potential impact of the COVID-19 on Reserves for Possible Losses on Loans for some credit. More specifically, we have identified certain industries and certain obligors that are expected to be significantly impacted by the COVID-19. For these identified industries and obligors we have updated the estimated expected loss amount by incorporating certain assumptions such as the future recovery periods and the forecasted GDP growth rate in Japan.
(11) Reserve for Possible Losses on InvestmentsReserve for Possible Losses on Investments is maintained to provide against possible losses on investments in securities, after taking into consideration the financial condition and other factors concerning the investee company.
(12) Reserve for Bonus PaymentsReserve for Bonus Payments, which is provided for future bonus payments to employees, is maintained at the amount accrued at the end of the fiscal year, based on the estimated future payments.
160
Standards of Accounting Method
Financial Data of Mizuho Financial Group, Inc.Notes to Consolidated Financial Statements
2020/09/07 16:49:02 / 20635244_株式会社みずほフィナンシャルグループ_総会その他(C)
(13) Reserve for Variable CompensationTo prepare for the payments of performance payments and stock compensation to be paid as variable compensation within compensation for directors, and executive officers of Mizuho Financial Group, Inc., Mizuho Bank, Ltd., Mizuho Trust & Banking Co., Ltd., and Mizuho Securities Co., Ltd., the estimated payment based on the standard amount regarding variable compensation of the fiscal year is provided.
(14) Reserve for Director and Corporate Auditor Retirement BenefitsReserve for Director and Corporate Auditor Retirement Benefits, which is provided for future retirement benefit payments to directors, corporate auditors, and executive officers, is recognized at the amount accrued by the end of the fiscal year, based on the internally established standards.
(15) Reserve for Possible Losses on Sales of LoansReserve for Possible Losses on Sales of Loans is provided for possible future losses on sales of loans at the amount deemed necessary based on a reasonable estimate of possible future losses.
(16) Reserve for ContingenciesReserve for Contingencies is maintained to provide against possible losses from contingencies which are not covered by other specific reserves. The balance is an estimate of possible future losses considered to require a reserve.
(17) Reserve for Reimbursement of DepositsReserve for Reimbursement of Deposits is provided against the losses for the deposits derecognized from liabilities at the estimated amount of future claims for withdrawal by depositors.
(18) Reserve for Reimbursement of DebenturesReserve for Reimbursement of Debentures is provided for the debentures derecognized from liabilities at the estimated amount for future claims.
(19) Reserve under Special LawsReserve under Special Laws is Reserve for Contingent Liabilities from Financial Instruments and Exchange of ¥2,509 million ($23,063 thousand) and ¥2,473 million as of March 31, 2020 and 2019, respectively. This is the reserve pursuant to Article 46-5 of the Financial Instruments and Exchange Law and Article 175 of the Cabinet Office Ordinance regarding Financial Instruments Business, etc. to indemnify the losses incurred from accidents in the purchase and sale of securities, other transactions or derivative transactions.
(20) Accounting Method for Retirement BenefitsIn calculating retirement benefit obligations, a benefit formula basis is used as a method of attributing expected retirement benefits to the period up to the end of this fiscal year. Unrecognized prior service cost and unrecognized actuarial differences are recognized as follows:
Unrecognized prior service cost: Recognized mainly as income or expenses in the period of occurrence.Unrecognized actuarial difference: Recognized as income or expenses from the following fiscal year under the
straight-line method over a certain term within the average remaining service period of the employees (mainly 10 years) of the respective fiscal years.
Certain consolidated subsidiaries apply the simplified method that assumes the amount required for voluntary resignation at the end of the term to be retirement benefit obligations in computing net defined benefit liability and retirement benefit expenses.
161
Standards of Accounting Method
2020/09/07 16:49:02 / 20635244_株式会社みずほフィナンシャルグループ_総会その他(C)
(21) Assets and Liabilities Denominated in Foreign CurrenciesAssets and liabilities denominated in foreign currencies and accounts of overseas branches of domestic consolidated banking subsidiaries and a domestic consolidated trust banking subsidiary are translated into Japanese yen primarily at the exchange rates in effect at the consolidated balance sheet date, with the exception of the investments in affiliates not under the equity method, which are translated at historical exchange rates.
Assets and liabilities denominated in foreign currencies of the consolidated subsidiaries, except for the transactions mentioned above, are translated into Japanese yen primarily at the exchange rates in effect at the respective balance sheet dates.
(22) Hedge Accounting(a) Interest Rate Risk
The deferred method, the fair-value hedge method or the exceptional accrual method for interest rate swaps are applied as hedge accounting methods.
The portfolio hedge transaction for a large volume of small-value monetary claims and liabilities of domestic consolidated banking subsidiaries and domestic consolidated trust banking subsidiaries is accounted for by the method stipulated in the JICPA Industry Audit Committee Report No.24, February 13, 2002.
The effectiveness of hedging activities for the portfolio hedge transaction for a large volume of small-value monetary claims and liabilities is assessed as follows:(i) as for hedging activities to offset market fluctuation risks, the effectiveness is assessed by bracketing both the
hedged instruments, such as deposits and loans, and the hedging instruments, such as interest-rate swaps, in the same maturity bucket.
(ii) as for hedging activities to fix the cash flows, the effectiveness is assessed based on the correlation between the base interest rate index of the hedged instrument and that of the hedging instrument.
The effectiveness of the individual hedge is assessed based on the comparison of the fluctuation in the market or of cash flows of the hedged instruments with that of the hedging instruments.
(b) Foreign Exchange RiskDomestic consolidated banking subsidiaries and domestic consolidated trust banking subsidiaries apply the deferred method of hedge accounting to hedge foreign exchange risks associated with various financial assets and liabilities denominated in foreign currencies as stipulated in the “Accounting and Auditing Treatment relating to Adoption of Accounting Standards for Foreign Currency Transactions for Banks” (JICPA Industry Audit Committee Report No.25, July 29, 2002). The effectiveness of the hedge is assessed by confirming that the amount of the foreign currency position of the hedged monetary claims and liabilities is equal to or larger than that of currency swap transactions, exchange swap transactions, and similar transactions designated as the hedging instruments of the foreign exchange risk.
In addition to the above methods, these subsidiaries apply the deferred method or the fair-value hedge method to portfolio hedges of the foreign exchange risks associated with investments in subsidiaries and affiliates denominated in foreign currency and Other securities denominated in foreign currency (except for bonds) identified as hedged items in advance, as long as the amount of foreign currency payables of spot and forward foreign exchange contracts exceeds the amount of acquisition cost of the hedged foreign securities denominated in foreign currency.
(c) Inter-company TransactionsInter-company interest rate swaps, currency swaps and similar derivatives among consolidated companies or between trading accounts and other accounts, which are designated as hedges, are not eliminated and related gains and losses are recognized in the statement of income or deferred under hedge accounting, because these inter-company derivatives are executed according to the criteria for appropriate outside third-party cover operations which are treated as hedge transactions objectively in accordance with JICPA Industry Audit Committee Reports No.24 and 25.
As for certain assets and liabilities of MHFG and its consolidated subsidiaries, the deferred method, the fair-value hedge method or the exceptional accrual method for interest rate swaps are applied.
(23) Consumption Taxes and OtherWith respect to MHFG and its domestic consolidated subsidiaries, Japanese consumption taxes and local consumption taxes are excluded from transaction amounts.
162
Standards of Accounting Method
Financial Data of Mizuho Financial Group, Inc.Notes to Consolidated Financial Statements
2020/09/07 16:49:02 / 20635244_株式会社みずほフィナンシャルグループ_総会その他(C)
(24) Amortization Method of Goodwill and Amortization PeriodGoodwill is amortized over an appropriate period not to exceed 20 years under the straight-line method. The full amount of Goodwill that has no material impact is expensed as incurred.
(25) Scope of Cash and Cash Equivalents on Consolidated Statement of Cash FlowsIn the consolidated statement of cash flows, Cash and Cash Equivalents consist of cash and due from central banks included in “Cash and Due from Banks” on the consolidated balance sheet.
6. Changes in Accounting Policies
(Application of “Leases” (IFRS 16 and ASU 2016-02))MHFG has applied “Leases” (IFRS 16 and ASU 2016-02) at some consolidated subsidiaries from the consolidated fiscal year ended March 31, 2020. Accordingly, lessees recognize assets and liabilities for all leases as a general rule.In accordance with transitional treatment, MHFG has recognized the impact of adoption of this accounting standard cumulatively as of the date of adoption for balances at the beginning of the consolidated fiscal year ended March 31, 2020.The impact on the consolidated financial statements for the consolidated fiscal year ended March 31, 2020 is immaterial.
(Changes in Hedge Accounting)Previously, deferred method or the fair-value hedge method have been applied as hedge accounting methods.From the consolidated fiscal year ended March 31, 2020, hedge accounting methods of some items were changed from fair-value method to deferred method.Based on current market trends, MHFG reconsidered its risk management activities from the consolidated fiscal year ended March 31, 2020, in order to provide more transparent disclosure in the financial statements.This change has no impact on the gains and losses.
7. Issued but not yet Adopted Accounting Standard and Others
1. Accounting Standard for Revenue Recognition and Others・Accounting Standard for Revenue Recognition (Accounting Standards Board of Japan ("ASBJ") Statement No.29, March 31,
2020)・Implementation Guidance on Accounting Standard for Revenue Recognition (ASBJ Guidance No.30, March 31, 2020)・Implementation Guidance on Disclosures about Fair Value of Financial Instruments (ASBJ Guidance No.19, March 31, 2020)(1) Overview
International Accounting Standards Board ("IASB") and Financial Accounting Standards Board ("FASB") jointly established the comprehensive accounting standard for revenue recognition and issued "Revenue from contracts with customers" (International Financial Reporting Standards ("IFRS") 15 / FASB Topic 606). Considering the application of IFRS 15 from the fiscal year beginning on and after January 1, 2018 and Topic 606 from the fiscal year beginning after December 15, 2017, ASBJ has established the comprehensive accounting standard for revenue recognition and issued the accounting standard together with the implementation guidance.As a basic policy in establishing the accounting standard for revenue recognition, ASBJ has initiated deliberation on the accounting standard, incorporating the basic principles of IFRS 15 from the standpoint of maintaining comparability between financial statements that is one of benefits of ensuring consistency with IFRS 15. If there were items that should give consideration to practical businesses conducted in Japan, the alternative treatment shall be provided as long as comparability is not harmed.
(2) Scheduled Date of ApplicationMHFG is scheduled to apply this accounting standard from the beginning of the consolidated fiscal year starting on April 1, 2021.
(3) Effect of Application of this accounting standardThe effect of the application of this accounting standard is under assessment.
163
Standards of Accounting Method、Changes in Accounting Policies、Issued but not yet Adopted Accounting Standard and Others
2020/09/07 16:49:02 / 20635244_株式会社みずほフィナンシャルグループ_総会その他(C)
2. Accounting Standard for Fair Value Measurement and Others・Accounting Standard for Fair Value Measurement (ASBJ Statement No.30 July 4, 2019)・Implementation Guidance on Accounting Standard for Fair Value Measurement (ASBJ Guidance No.31, July 4, 2019)・Accounting Standard for Financial Instruments (ASBJ Statement No.10, July 4, 2019)・Implementation Guidance on Disclosures about Fair Value of Financial Instruments (ASBJ Guidance No.19, March 31, 2020)(1) Overview
Considering the situation where IASB and FASB have provided almost the same detailed guidance on fair value measurement (IFRS 13 "Fair Value Measurement" / US Accounting Standards Codification Topic 820 "Fair Value Measurement"), ASBJ has implemented initiatives to ensure consistency between Japanese and international accounting standards, mainly with regard to guidance and disclosure about fair value of financial instruments, and has issued "Accounting Standard for Fair Value Measurement" and others.As a basic policy of ASBJ in establishing accounting standard for fair value measurement, it has been decided to basically adopt all of the provisions of IFRS 13 from the perspective of improving comparability between financial statements of domestic and foreign companies using a unified measurement method. If there were items that should give consideration to practical businesses conducted in Japan, the alternative treatment shall be provided as long as comparability is not harmed.
(2) Scheduled Date of ApplicationMHFG is scheduled to apply this accounting standard from the beginning of the consolidated fiscal year starting on April 1, 2020.
(3) Effect of Application of this accounting standardThe effect of the application of this accounting standard is under assessment.
3. Accounting Standard for Disclosure of Accounting Estimates・Accounting Standard for Disclosure of Accounting Estimates (ASBJ Statement No.31, March 31, 2020)(1) Overview
In response to requests to consider requiring disclosure as footnote information under Japanese GAAP of "Sources of Estimation Uncertainty" that is required to be disclosed by Paragraph 125 of International Accounting Standards 1 "Presentation of Financial Statements" ("IAS 1") issued by IASB in 2003 as such information is considered highly useful to financial statements users, ASBJ has established and issued accounting standards for disclosure of accounting estimates.As a basic policy of ASBJ in establishing this accounting standard, it has been decided not to expand requirements for individual notes but to provide principles (disclosure purposes), and a company determines the contents of disclosure in light of the disclosure purposes. In establishing this accounting standard, it has been decided that the provisions of IAS 1, Paragraph 125 are referred to.
(2) Scheduled Date of ApplicationMHFG is scheduled to apply this accounting standard from the end of the consolidated fiscal year starting on April 1, 2020.
8. Additional Information
(The Board Benefit Trust (“BBT”) Program)Since MHFG operates its business to contribute to the creation of value for diverse stakeholders and realize improved corporate value through the continuous and stable growth of MHFG group pursuant to MHFG’s basic management policy defined under the Mizuho Financial Group’s Corporate Identity, MHFG has introduced a stock compensation program using a trust (the “Program”) that functions as an incentive for each Director, Executive Officer, and Specialist Officer to exert maximum effort in performing his or her duties, and also as consideration for such exertion of effort.(1) Outline of the Program
The Program has adopted the Board Benefit Trust (“BBT”) framework. MHFG’s shares on the stock market will be acquired through a trust established based on the underlying funds contributed by MHFG, and MHFG’s shares will be distributed to Directors, Executive Officers, and Specialist Officers of MHFG, Mizuho Bank, Ltd., Mizuho Trust & Banking Co., Ltd., and Mizuho Securities Co., Ltd. (the “Company Group”) in accordance with the Rules on Distribution of Shares to be prescribed in advance. The framework consists of the stock compensation program based on the Company Group Officer’s position in their respective company (“Stock Compensation I”) and the stock compensation program based on the performance evaluation of the Company Group (“Stock Compensation II”).Stock Compensation I will be paid at the time of retirement in the form of shares of MHFG calculated based on their position. A system is adopted which enables a decrease or forfeiture of the amount depending on the performance of the company or the individual.
164
Issued but not yet Adopted Accounting Standard and Others、Additional Information

Financial Data of Mizuho Financial Group, Inc.Notes to Consolidated Financial Statements
2020/09/07 16:49:02 / 20635244_株式会社みずほフィナンシャルグループ_総会その他(C)
Stock Compensation II will be paid in the form of shares of MHFG and will be deferred over three years, which is calculated based on the status of achieving our Five-Year Business Plan. A system is adopted which enables a decrease or forfeiture of the amount depending on the performance of the company or the individual.Upon the payment of stock compensation under the Program, MHFG may, for a certain portion, pay a monetary amount equivalent to the market value of its stock in lieu of stock compensation in accordance with the Rules on Distribution of Shares.Voting rights related to MHFG’s shares belonging to the trust assets under the trust shall not be exercised.
(2) MHFG’s Shares Outstanding in the TrustMHFG’s shares outstanding in the trust are recognized as Treasury Stock under Net Assets at the carrying amount (excluding the amount of incidental expenses) in the trust. The carrying amount of such Treasury Stock as of March 31, 2020 was ¥3,485 million ($32,026 thousand) for 19,636 thousand shares. (The carrying amount of such Treasury Stock as of March 31, 2019 was ¥3,569 million for 18,917 thousand shares.)
(Application of tax-effect accounting to the Transition from the Consolidated Taxation System to the Group Aggregation System)Some domestic consolidated subsidiaries of the Group record amounts of deferred tax assets and deferred tax liabilities based on the provisions of tax laws prior to amendment under the treatment in Paragraph 3 of "Treatment of the application of the tax-effect accounting in relation to the transition from the consolidated tax system to the aggregate group system" (Practical Solutions No.39 March 31, 2020), without applying the provisions of Paragraph 44 of "Guidance on Accounting Standard for tax-effect accounting" (Implementation Guidance No.28 February 16, 2018), regarding the tax items for which review of the non-consolidated Tax Payment System was implemented in accordance with the transition to the aggregated group system established under the "Act for Partial Revision of the Income Tax Act, etc." (Act No. 8 of 2020) and the transition to the aggregated group system.
9. Securities Lending and Borrowing TransactionsUnsecured loaned securities which the borrowers have the right to sell or repledge amounted to ¥80,056 million ($735,606 thousand) and ¥ - million as of March 31, 2020 and 2019, respectively, and are included in Japanese Government Bonds under Securities. MHFG has the right to sell or repledge some of unsecured borrowed securities, securities purchased under resale agreements and securities borrowed with cash collateral. Among them, the totals of securities repledged were ¥19,960,803 million ($183,412,696 thousand) and ¥12,595,142 million as of March 31, 2020 and 2019, respectively, and securities neither repledged nor re-loaned were ¥1,998,251 million ($18,361,221 thousand) and ¥3,952,221 million as of March 31, 2020 and 2019, respectively.
10. Trading Assets and Liabilities
Millions of yen Thousands of U.S. dollarsAs of March 31, 2020 2019 2020Trading Assets:Trading Securities ¥ 5,377,182 ¥ 5,968,848 $ 49,409,014Derivatives for Trading Transactions 7,404,811 5,907,081 68,040,164
Derivatives for Trading Securities 466,740 167,677 4,288,712Total ¥ 13,248,734 ¥ 12,043,608 $ 121,737,890
Trading Liabilities:Trading Securities Sold Short ¥ 2,213,074 ¥ 2,579,940 $ 20,335,147Derivatives for Trading Transactions 7,034,850 5,587,502 64,640,727
Derivatives for Trading Securities 356,966 158,078 3,280,034Total ¥ 9,604,890 ¥ 8,325,520 $ 88,255,908
165
Additional Information、Securities Lending and Borrowing Transactions、Trading Assets and Liabilities

2020/09/07 16:49:02 / 20635244_株式会社みずほフィナンシャルグループ_総会その他(C)
11. Securities
Millions of yen Thousands of U.S. dollarsAs of March 31, 2020 2019 2020Japanese Government Bonds ¥13,081,871 ¥ 13,016,033 $120,204,641Japanese Local Government Bonds 272,567 209,891 2,504,524Japanese Corporate Bonds 2,828,044 2,681,005 25,985,890Japanese Stocks*1 2,796,100 3,563,271 25,692,372Other*2 15,928,651 10,304,286 146,362,686
Total ¥34,907,234 ¥ 29,774,489 $320,750,113
*1 Japanese Stocks included investments in non-consolidated subsidiaries and affiliates of ¥245,025 million ($2,251,449 thousand) and ¥252,044 million as of March 31, 2020 and 2019, respectively.
*2 Other included investments in non-consolidated subsidiaries and affiliates of ¥87,364 million ($802,763 thousand) and ¥82,120 million as of March 31, 2020 and 2019, respectively.
12. Loans and Bills Discounted
Millions of yen Thousands of U.S. dollarsAs of March 31, 2020 2019 2020Loans on Deeds ¥ 70,211,197 ¥ 66,030,880 $ 645,145,617Overdrafts 9,182,140 8,533,976 84,371,411Loans on Notes 3,548,262 3,378,943 32,603,716Bills Discounted 325,228 369,288 2,988,412Financing Receivables, including Factoring, Leasing and Property Financing 201,355 143,846 1,850,188Total ¥ 83,468,185 ¥ 78,456,935 $ 766,959,344
Loans and Bills Discounted as of March 31, 2020 and 2019 include the following:
Millions of yen Thousands of U.S. dollarsAs of March 31, 2020 2019 2020Loans to Bankrupt Obligors*1 ¥ 15,938 ¥ 11,393 $ 146,457Non-Accrual Delinquent Loans*2 401,016 379,225 3,684,797Loans Past Due for Three Months or More*3 1,468 436 13,497Restructured Loans*4 256,429 195,366 2,356,239
Total ¥ 674,853 ¥ 586,422 $ 6,200,990
*1 Loans to Bankrupt Obligors represent non-accrual loans to obligors who are legally bankrupt as defined in Article 96, Paragraph 1, Items 3 and 4 of the Corporate Tax Law Enforcement Ordinance (Government Ordinance No.97, 1965).
*2 Non-Accrual Delinquent Loans represent non-accrual loans other than (i) Loans to Bankrupt Obligors and (ii) loans of which payments of interest are deferred in order to assist or facilitate the restructuring of obligors in financial difficulties.
*3 Loans to Bankrupt Obligors or Non-Accrual Delinquent Loans, both of which are classified as non-accrual, are not included in this category.*4 Restructured Loans represent loans on which contracts were amended in favor of obligors (e.g., the reduction of or exemption from stated interest, the
deferral of interest payments, the extension of maturity dates, or renunciation of claims) in order to assist or facilitate the restructuring of obligors in financial difficulties.
Note: The amounts given in the above table are gross amounts before deduction of amounts for the Reserves for Possible Losses on Loans.
166
Securities、Loans and Bills Discounted
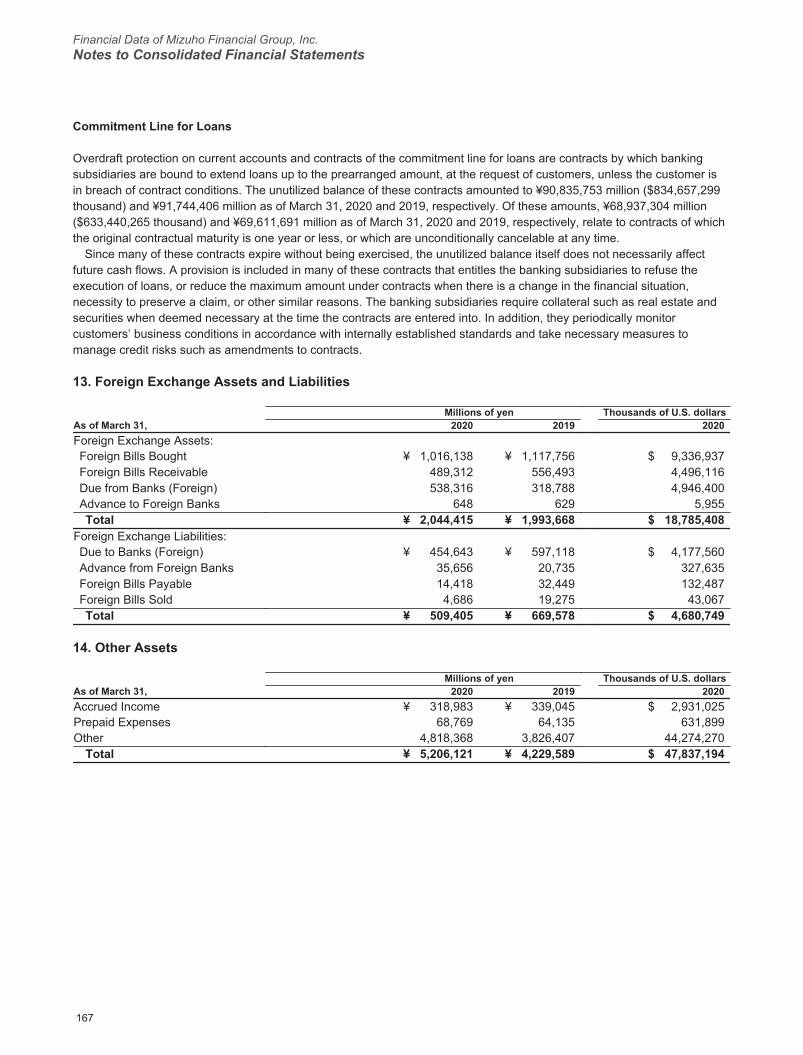
Financial Data of Mizuho Financial Group, Inc.Notes to Consolidated Financial Statements
2020/09/07 16:49:02 / 20635244_株式会社みずほフィナンシャルグループ_総会その他(C)
Commitment Line for Loans
Overdraft protection on current accounts and contracts of the commitment line for loans are contracts by which banking subsidiaries are bound to extend loans up to the prearranged amount, at the request of customers, unless the customer is in breach of contract conditions. The unutilized balance of these contracts amounted to ¥90,835,753 million ($834,657,299 thousand) and ¥91,744,406 million as of March 31, 2020 and 2019, respectively. Of these amounts, ¥68,937,304 million ($633,440,265 thousand) and ¥69,611,691 million as of March 31, 2020 and 2019, respectively, relate to contracts of which the original contractual maturity is one year or less, or which are unconditionally cancelable at any time.
Since many of these contracts expire without being exercised, the unutilized balance itself does not necessarily affect future cash flows. A provision is included in many of these contracts that entitles the banking subsidiaries to refuse the execution of loans, or reduce the maximum amount under contracts when there is a change in the financial situation, necessity to preserve a claim, or other similar reasons. The banking subsidiaries require collateral such as real estate and securities when deemed necessary at the time the contracts are entered into. In addition, they periodically monitor customers’ business conditions in accordance with internally established standards and take necessary measures to manage credit risks such as amendments to contracts.
13. Foreign Exchange Assets and Liabilities
Millions of yen Thousands of U.S. dollarsAs of March 31, 2020 2019 2020Foreign Exchange Assets:Foreign Bills Bought ¥ 1,016,138 ¥ 1,117,756 $ 9,336,937Foreign Bills Receivable 489,312 556,493 4,496,116Due from Banks (Foreign) 538,316 318,788 4,946,400Advance to Foreign Banks 648 629 5,955Total ¥ 2,044,415 ¥ 1,993,668 $ 18,785,408
Foreign Exchange Liabilities:Due to Banks (Foreign) ¥ 454,643 ¥ 597,118 $ 4,177,560Advance from Foreign Banks 35,656 20,735 327,635Foreign Bills Payable 14,418 32,449 132,487Foreign Bills Sold 4,686 19,275 43,067Total ¥ 509,405 ¥ 669,578 $ 4,680,749
14. Other Assets
Millions of yen Thousands of U.S. dollarsAs of March 31, 2020 2019 2020Accrued Income ¥ 318,983 ¥ 339,045 $ 2,931,025Prepaid Expenses 68,769 64,135 631,899Other 4,818,368 3,826,407 44,274,270
Total ¥ 5,206,121 ¥ 4,229,589 $ 47,837,194
167
Loans and Bills Discounted、Foreign Exchange Assets and Liabilities、Other Assets
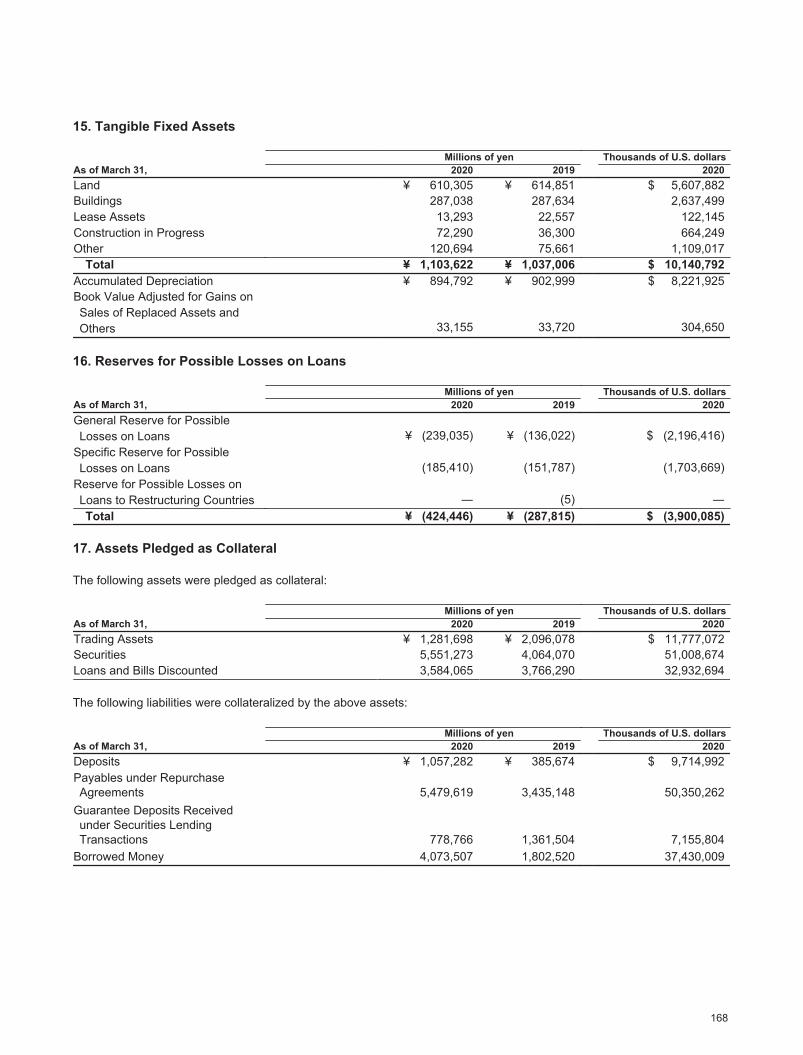
2020/09/07 16:49:02 / 20635244_株式会社みずほフィナンシャルグループ_総会その他(C)
15. Tangible Fixed Assets
Millions of yen Thousands of U.S. dollarsAs of March 31, 2020 2019 2020Land ¥ 610,305 ¥ 614,851 $ 5,607,882Buildings 287,038 287,634 2,637,499Lease Assets 13,293 22,557 122,145Construction in Progress 72,290 36,300 664,249Other 120,694 75,661 1,109,017
Total ¥ 1,103,622 ¥ 1,037,006 $ 10,140,792Accumulated Depreciation ¥ 894,792 ¥ 902,999 $ 8,221,925Book Value Adjusted for Gains on Sales of Replaced Assets and Others 33,155 33,720 304,650
16. Reserves for Possible Losses on Loans
Millions of yen Thousands of U.S. dollarsAs of March 31, 2020 2019 2020General Reserve for Possible Losses on Loans ¥ (239,035) ¥ (136,022) $ (2,196,416)
Specific Reserve for Possible Losses on Loans (185,410) (151,787) (1,703,669)
Reserve for Possible Losses on Loans to Restructuring Countries ― (5) ―Total ¥ (424,446) ¥ (287,815) $ (3,900,085)
17. Assets Pledged as Collateral
The following assets were pledged as collateral:
Millions of yen Thousands of U.S. dollarsAs of March 31, 2020 2019 2020Trading Assets ¥ 1,281,698 ¥ 2,096,078 $ 11,777,072Securities 5,551,273 4,064,070 51,008,674Loans and Bills Discounted 3,584,065 3,766,290 32,932,694
The following liabilities were collateralized by the above assets:
Millions of yen Thousands of U.S. dollarsAs of March 31, 2020 2019 2020Deposits ¥ 1,057,282 ¥ 385,674 $ 9,714,992Payables under Repurchase Agreements 5,479,619 3,435,148 50,350,262
Guarantee Deposits Received under Securities Lending Transactions 778,766 1,361,504 7,155,804
Borrowed Money 4,073,507 1,802,520 37,430,009
168
Tangible Fixed Assets、Reserves for Possible Losses on Loans、Assets Pledged as Collateral
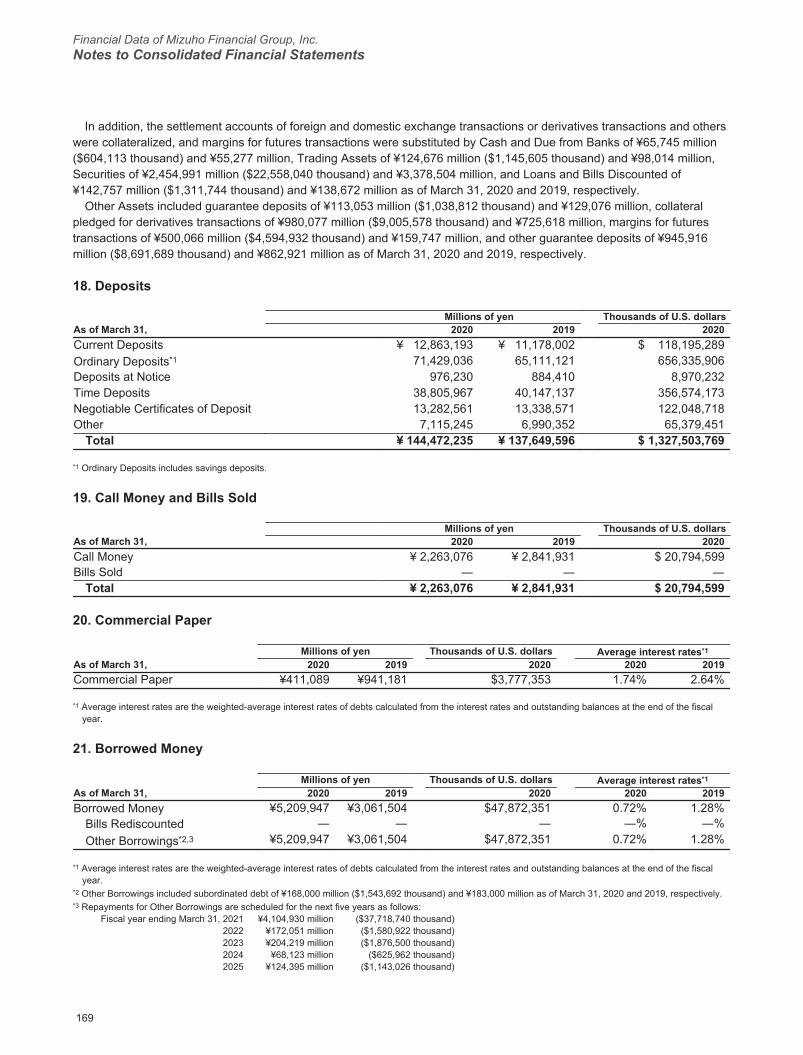
Financial Data of Mizuho Financial Group, Inc.Notes to Consolidated Financial Statements
2020/09/07 16:49:02 / 20635244_株式会社みずほフィナンシャルグループ_総会その他(C)
In addition, the settlement accounts of foreign and domestic exchange transactions or derivatives transactions and others were collateralized, and margins for futures transactions were substituted by Cash and Due from Banks of ¥65,745 million ($604,113 thousand) and ¥55,277 million, Trading Assets of ¥124,676 million ($1,145,605 thousand) and ¥98,014 million, Securities of ¥2,454,991 million ($22,558,040 thousand) and ¥3,378,504 million, and Loans and Bills Discounted of ¥142,757 million ($1,311,744 thousand) and ¥138,672 million as of March 31, 2020 and 2019, respectively.
Other Assets included guarantee deposits of ¥113,053 million ($1,038,812 thousand) and ¥129,076 million, collateral pledged for derivatives transactions of ¥980,077 million ($9,005,578 thousand) and ¥725,618 million, margins for futures transactions of ¥500,066 million ($4,594,932 thousand) and ¥159,747 million, and other guarantee deposits of ¥945,916 million ($8,691,689 thousand) and ¥862,921 million as of March 31, 2020 and 2019, respectively.
18. Deposits
Millions of yen Thousands of U.S. dollarsAs of March 31, 2020 2019 2020Current Deposits ¥ 12,863,193 ¥ 11,178,002 $ 118,195,289Ordinary Deposits*1 71,429,036 65,111,121 656,335,906Deposits at Notice 976,230 884,410 8,970,232Time Deposits 38,805,967 40,147,137 356,574,173Negotiable Certificates of Deposit 13,282,561 13,338,571 122,048,718Other 7,115,245 6,990,352 65,379,451
Total ¥ 144,472,235 ¥ 137,649,596 $ 1,327,503,769
*1 Ordinary Deposits includes savings deposits.
19. Call Money and Bills Sold
Millions of yen Thousands of U.S. dollarsAs of March 31, 2020 2019 2020Call Money ¥ 2,263,076 ¥ 2,841,931 $ 20,794,599Bills Sold ― ― ―
Total ¥ 2,263,076 ¥ 2,841,931 $ 20,794,599
20. Commercial Paper
Millions of yen Thousands of U.S. dollars Average interest rates*1
As of March 31, 2020 2019 2020 2020 2019Commercial Paper ¥411,089 ¥941,181 $3,777,353 1.74% 2.64%
*1 Average interest rates are the weighted-average interest rates of debts calculated from the interest rates and outstanding balances at the end of the fiscal year.
21. Borrowed Money
Millions of yen Thousands of U.S. dollars Average interest rates*1
As of March 31, 2020 2019 2020 2020 2019Borrowed Money ¥5,209,947 ¥3,061,504 $47,872,351 0.72% 1.28%
Bills Rediscounted ― ― ― ―% ―%Other Borrowings*2,3 ¥5,209,947 ¥3,061,504 $47,872,351 0.72% 1.28%
*1 Average interest rates are the weighted-average interest rates of debts calculated from the interest rates and outstanding balances at the end of the fiscal year.
*2 Other Borrowings included subordinated debt of ¥168,000 million ($1,543,692 thousand) and ¥183,000 million as of March 31, 2020 and 2019, respectively.*3 Repayments for Other Borrowings are scheduled for the next five years as follows:
Fiscal year ending March 31, 2021 ¥4,104,930 million ($37,718,740 thousand)2022 ¥172,051 million ($1,580,922 thousand)2023 ¥204,219 million ($1,876,500 thousand)2024 ¥68,123 million ($625,962 thousand)2025 ¥124,395 million ($1,143,026 thousand)
169
Assets Pledged as Collateral、Deposits、Call Money and Bills Sold、Commercial Paper、Borrowed Money

2020/09/07 16:49:02 / 20635244_株式会社みずほフィナンシャルグループ_総会その他(C)
22. Short-term Bonds
Major components of Short-term Bonds at March 31, 2020 were as follows:
Issuer Issue Millions of yen Thousands of U.S. dollars Interest rates DueMHSC Sep. 2019–Mar. 2020 ¥319,000 $2,931,177 0.00%–0.00% Apr. 2020–
[319,000] [2,931,177] Sep. 2020*1 Oct. 2019–Mar. 2020 54,658 502,235 0.06%–0.12% Apr. 2020–
[54,658] [502,235] Jun. 2020Total ¥373,658 $3,433,412
*1 indicates the total amount of Short-term Bonds issued by the domestic consolidated subsidiary, Allstar Funding Co., Ltd, and the overseas consolidated subsidiary, JAPAN SECURITIZATION CORPORATION.
Notes: 1. Figures indicated in brackets [ ] represent the amounts to be redeemed within one year.2. No collateral was provided for the above Short-term Bonds.
Major components of Short-term Bonds at March 31, 2019 were as follows:
Issuer Issue Millions of yen Interest rates DueMHSC Sep. 2018–Mar. 2019 ¥333,200 0.00% Apr. 2019–
[333,200] Oct. 2019*1 Oct. 2018–Mar. 2019 22,339 0.04%–0.12% Apr. 2019–
[22,339] May 2019Total ¥355,539
*1 indicates the total amount of Short-term Bonds issued by the domestic consolidated subsidiary, Allstar Funding Co., Ltd, and the overseas consolidated subsidiary, JAPAN SECURITIZATION CORPORATION.
Notes: 1. Figures indicated in brackets [ ] represent the amounts to be redeemed within one year.2. No collateral was provided for the above Short-term Bonds.
170
Short-term Bonds

Financial Data of Mizuho Financial Group, Inc.Notes to Consolidated Financial Statements
2020/09/07 16:49:02 / 20635244_株式会社みずほフィナンシャルグループ_総会その他(C)
23. Bonds and Notes
Major components of Bonds and Notes as of March 31, 2020 were as follows:
Issuer Description Issue Millions of yenThousands of U.S.
dollarsInterestrates Due
MHFG Straight Bonds Jul. 2014– ¥6,414,818 $58,943,476 0.10%– Apr. 2021–Feb.2020 [—] [—] 4.35%
(US$ 26,950,000 thousand)(EUR 4,500,000 thousand)
(AUD 625,000 thousand)MHTB Straight Bonds Dec. 2005 10,000 91,887 2.24% Dec. 2020
[10,000] [91,887]MHBK Straight Bonds Aug. 2005– 1,100,670 10,113,672 0.22%– Apr. 2020–
Mar. 2020 [196,393] [1,804,587] 5.30%(US$ 5,849,635 thousand)
(AUD 905,000 thousand)(SGD 50,000 thousand)
(HKD 1,540,000 thousand)(CNY 500,000 thousand)
*1 Straight Bonds Jul. 2012– 326,182 2,997,174 4.20%– Jul. 2022–Mar. 2014 [—] [—] 4.60% Mar. 2024
(US$ 2,997,174 thousand)*2 Straight Bonds Sep. 2005 30,000 275,659 2.21% Sep. 2025
[—] [—]*3 Straight Bonds Jan. 2003– 1,024,760 9,416,159 0.00%– Apr. 2020–
Mar. 2020 [249,616] [2,293,633] 51.60% Dec. 2059(US$ 2,360,301 thousand)
(AUD 72,340 thousand)(EUR 889,300 thousand)
(BRL 1,007 thousand)(GBP 20,000 thousand)(MXN 9,000 thousand)
(TRY 58,276 thousand)Total ¥8,906,432 $81,838,027
*1 indicates the total amount of straight bonds issued by the overseas consolidated subsidiaries, Mizuho Financial Group (Cayman) 2 Limited and Mizuho Financial Group (Cayman) 3 Limited.
*2 indicates the total amount of straight bonds issued by the overseas consolidated subsidiaries, Mizuho Finance (Cayman) Limited and Mizuho Finance (Curaçao) N.V.
*3 indicates the total amount of straight bonds issued by the domestic consolidated subsidiary, MHSC, and the overseas consolidated subsidiaries, Mizuho International plc, Mizuho Securities USA LLC, Mizuho Capital Markets LLC and Banco Mizuho do Brasil S.A.
Notes: 1. Figures indicated in brackets [ ] represent the amounts to be redeemed within one year.2. The amounts of foreign currency-denominated bonds are shown in original currencies in parentheses ( ).3. Repayments for Bonds and Notes are scheduled for the next five years as follows:
Fiscal year ending March 31, 2021 ¥456,009 million ($4,190,106 thousand)2022 ¥1,217,464 million ($11,186,849 thousand)2023 ¥936,038 million ($8,600,919 thousand)2024 ¥461,467 million ($4,240,264 thousand)2025 ¥1,041,730 million ($9,572,086 thousand)
4. Bonds and Notes as of March 31, 2020 included subordinated bonds and notes of ¥3,594,804 million ($33,031,379 thousand).
5. No collateral was provided for the above Bonds and Notes.
171
Bonds and Notes

2020/09/07 16:49:02 / 20635244_株式会社みずほフィナンシャルグループ_総会その他(C)
Major components of Bonds and Notes as of March 31, 2019 were as follows:
Issuer Description Issue Millions of yenInterestrates Due
MHFG Straight Bonds Jul. 2014– ¥5,000,247 0.10%– Apr. 2021–Oct.2018 [—] 4.35%
(US$ 20,250,000 thousand)(EUR 2,000,000 thousand)
(AUD 625,000 thousand)MHTB Straight Bonds Dec. 2005 10,000 2.24% Dec. 2020
[—]MHBK Straight Bonds Aug. 2005– 1,968,205 0.22%– Apr. 2019–
Sep. 2018 [790,842] 5.30%(US$ 9,581,244 thousand)
(AUD 745,000 thousand)(SGD 190,000 thousand)
(HKD 1,540,000 thousand)(CNY 500,000 thousand)
*1 Straight Bonds Jul. 2012– 332,620 4.20%– Jul. 2022–Mar. 2014 [—] 4.60% Mar. 2024
(US$ 2,996,308 thousand)*2 Straight Bonds Sep. 2005– 41,000 1.30%– May 2024–
May 2012 [—] 2.21% Sep. 2025*3 Straight Bonds Jan. 2003– 998,998 0.00%– Apr. 2019–
Mar. 2019 [219,536] 25.00% Mar. 2049(US$ 2,694,224 thousand)
(AUD 31,360 thousand)(EUR 725,400 thousand)
(BRL 14,500 thousand)(GBP 20,000 thousand)(MXN 9,000 thousand)
(TRY 59,076 thousand)Total ¥8,351,071
*1 indicates the total amount of straight bonds issued by the overseas consolidated subsidiaries, Mizuho Financial Group (Cayman) 2 Limited and Mizuho Financial Group (Cayman) 3 Limited.
*2 indicates the total amount of straight bonds issued by the overseas consolidated subsidiaries, Mizuho Finance (Cayman) Limited and Mizuho Finance (Curaçao) N.V.
*3 indicates the total amount of straight bonds issued by the domestic consolidated subsidiary, MHSC, and the overseas consolidated subsidiaries, Mizuho International plc and Mizuho Securities USA LLC.
Notes: 1. Figures indicated in brackets [ ] represent the amounts to be redeemed within one year.2. The amounts of foreign currency-denominated bonds are shown in original currencies in parentheses ( ).3. Repayments for Bonds and Notes are scheduled for the next five years as follows:
Fiscal year ending March 31, 2020 ¥1,010,378 million2021 ¥354,732 million2022 ¥1,139,615 million2023 ¥896,522 million2024 ¥261,906 million
4. Bonds and Notes as of March 31, 2019 included subordinated bonds and notes of ¥3,332,877 million.5. No collateral was provided for the above Bonds and Notes.
172
Bonds and Notes
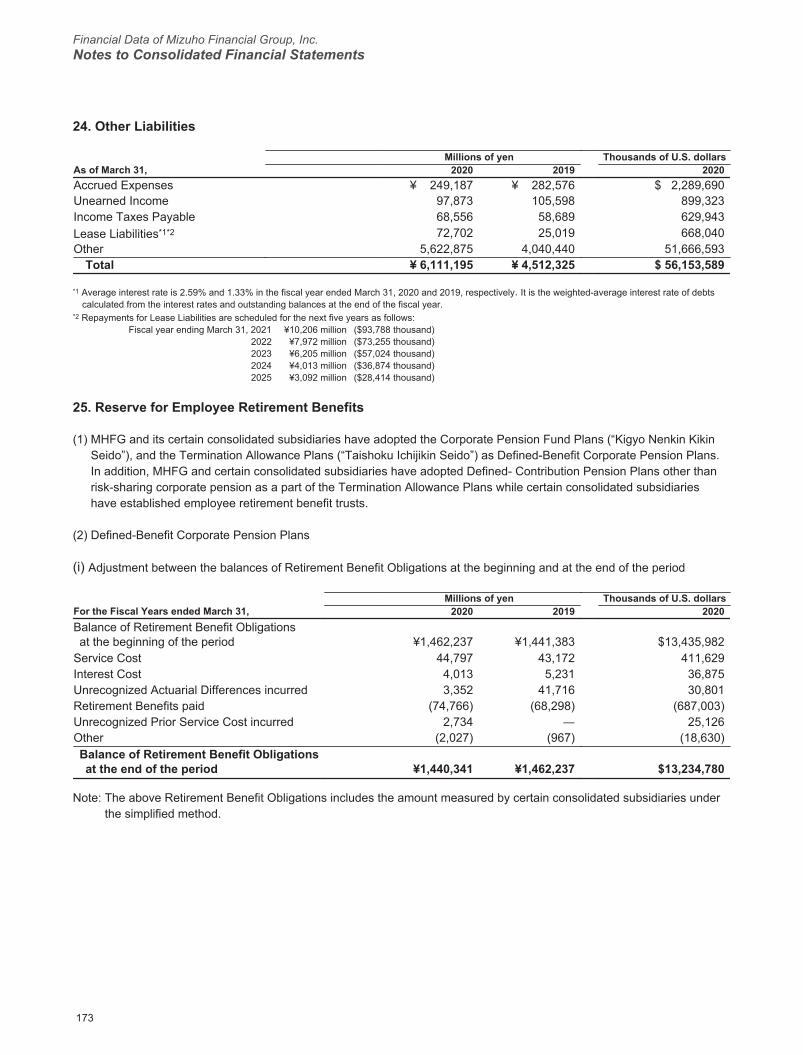
Financial Data of Mizuho Financial Group, Inc.Notes to Consolidated Financial Statements
2020/09/07 16:49:02 / 20635244_株式会社みずほフィナンシャルグループ_総会その他(C)
24. Other Liabilities
Millions of yen Thousands of U.S. dollarsAs of March 31, 2020 2019 2020Accrued Expenses ¥ 249,187 ¥ 282,576 $ 2,289,690Unearned Income 97,873 105,598 899,323Income Taxes Payable 68,556 58,689 629,943Lease Liabilities*1*2 72,702 25,019 668,040Other 5,622,875 4,040,440 51,666,593
Total ¥ 6,111,195 ¥ 4,512,325 $ 56,153,589
*1 Average interest rate is 2.59% and 1.33% in the fiscal year ended March 31, 2020 and 2019, respectively. It is the weighted-average interest rate of debts calculated from the interest rates and outstanding balances at the end of the fiscal year.
*2 Repayments for Lease Liabilities are scheduled for the next five years as follows:Fiscal year ending March 31, 2021 ¥10,206 million ($93,788 thousand)
2022 ¥7,972 million ($73,255 thousand)2023 ¥6,205 million ($57,024 thousand)2024 ¥4,013 million ($36,874 thousand)2025 ¥3,092 million ($28,414 thousand)
25. Reserve for Employee Retirement Benefits
(1) MHFG and its certain consolidated subsidiaries have adopted the Corporate Pension Fund Plans (“Kigyo Nenkin Kikin Seido”), and the Termination Allowance Plans (“Taishoku Ichijikin Seido”) as Defined-Benefit Corporate Pension Plans. In addition, MHFG and certain consolidated subsidiaries have adopted Defined- Contribution Pension Plans other than risk-sharing corporate pension as a part of the Termination Allowance Plans while certain consolidated subsidiaries have established employee retirement benefit trusts.
(2) Defined-Benefit Corporate Pension Plans
(i) Adjustment between the balances of Retirement Benefit Obligations at the beginning and at the end of the period
Millions of yen Thousands of U.S. dollarsFor the Fiscal Years ended March 31, 2020 2019 2020Balance of Retirement Benefit Obligationsat the beginning of the period ¥1,462,237 ¥1,441,383 $13,435,982
Service Cost 44,797 43,172 411,629Interest Cost 4,013 5,231 36,875Unrecognized Actuarial Differences incurred 3,352 41,716 30,801Retirement Benefits paid (74,766) (68,298) (687,003)Unrecognized Prior Service Cost incurred 2,734 ― 25,126Other (2,027) (967) (18,630)Balance of Retirement Benefit Obligations at the end of the period ¥1,440,341 ¥1,462,237 $13,234,780
Note: The above Retirement Benefit Obligations includes the amount measured by certain consolidated subsidiaries under the simplified method.
173
Other Liabilities、Reserve for Employee Retirement Benefits
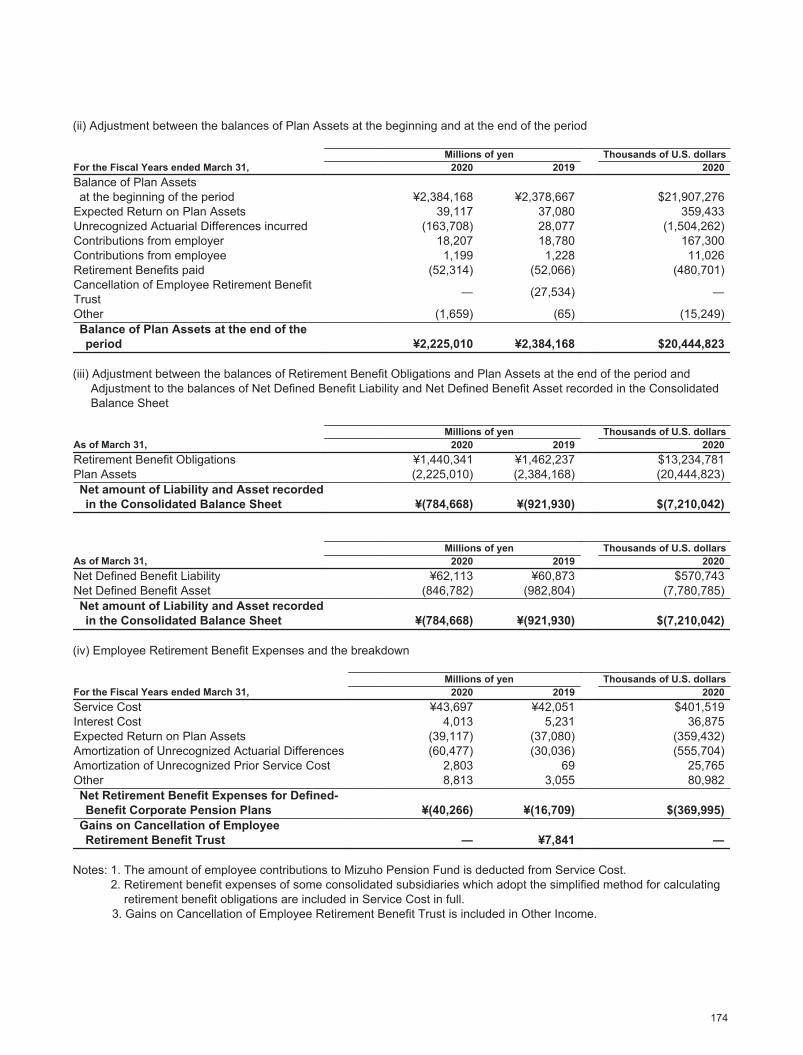
2020/09/07 16:49:02 / 20635244_株式会社みずほフィナンシャルグループ_総会その他(C)
(ii) Adjustment between the balances of Plan Assets at the beginning and at the end of the period
Millions of yen Thousands of U.S. dollarsFor the Fiscal Years ended March 31, 2020 2019 2020Balance of Plan Assetsat the beginning of the period ¥2,384,168 ¥2,378,667 $21,907,276
Expected Return on Plan Assets 39,117 37,080 359,433Unrecognized Actuarial Differences incurred (163,708) 28,077 (1,504,262)Contributions from employer 18,207 18,780 167,300Contributions from employee 1,199 1,228 11,026Retirement Benefits paid (52,314) (52,066) (480,701)Cancellation of Employee Retirement Benefit Trust ― (27,534) ―
Other (1,659) (65) (15,249)Balance of Plan Assets at the end of the period ¥2,225,010 ¥2,384,168 $20,444,823
(iii) Adjustment between the balances of Retirement Benefit Obligations and Plan Assets at the end of the period and Adjustment to the balances of Net Defined Benefit Liability and Net Defined Benefit Asset recorded in the Consolidated Balance Sheet
Millions of yen Thousands of U.S. dollarsAs of March 31, 2020 2019 2020Retirement Benefit Obligations ¥1,440,341 ¥1,462,237 $13,234,781Plan Assets (2,225,010) (2,384,168) (20,444,823)Net amount of Liability and Asset recordedin the Consolidated Balance Sheet ¥(784,668) ¥(921,930) $(7,210,042)
Millions of yen Thousands of U.S. dollarsAs of March 31, 2020 2019 2020Net Defined Benefit Liability ¥62,113 ¥60,873 $570,743Net Defined Benefit Asset (846,782) (982,804) (7,780,785)Net amount of Liability and Asset recordedin the Consolidated Balance Sheet ¥(784,668) ¥(921,930) $(7,210,042)
(iv) Employee Retirement Benefit Expenses and the breakdown
Millions of yen Thousands of U.S. dollarsFor the Fiscal Years ended March 31, 2020 2019 2020Service Cost ¥43,697 ¥42,051 $401,519Interest Cost 4,013 5,231 36,875Expected Return on Plan Assets (39,117) (37,080) (359,432)Amortization of Unrecognized Actuarial Differences (60,477) (30,036) (555,704)Amortization of Unrecognized Prior Service Cost 2,803 69 25,765Other 8,813 3,055 80,982Net Retirement Benefit Expenses for Defined- Benefit Corporate Pension Plans ¥(40,266) ¥(16,709) $(369,995)
Gains on Cancellation of Employee Retirement Benefit Trust ― ¥7,841 ―
Notes: 1. The amount of employee contributions to Mizuho Pension Fund is deducted from Service Cost.2. Retirement benefit expenses of some consolidated subsidiaries which adopt the simplified method for calculating
retirement benefit obligations are included in Service Cost in full. 3. Gains on Cancellation of Employee Retirement Benefit Trust is included in Other Income.
174
Reserve for Employee Retirement Benefits
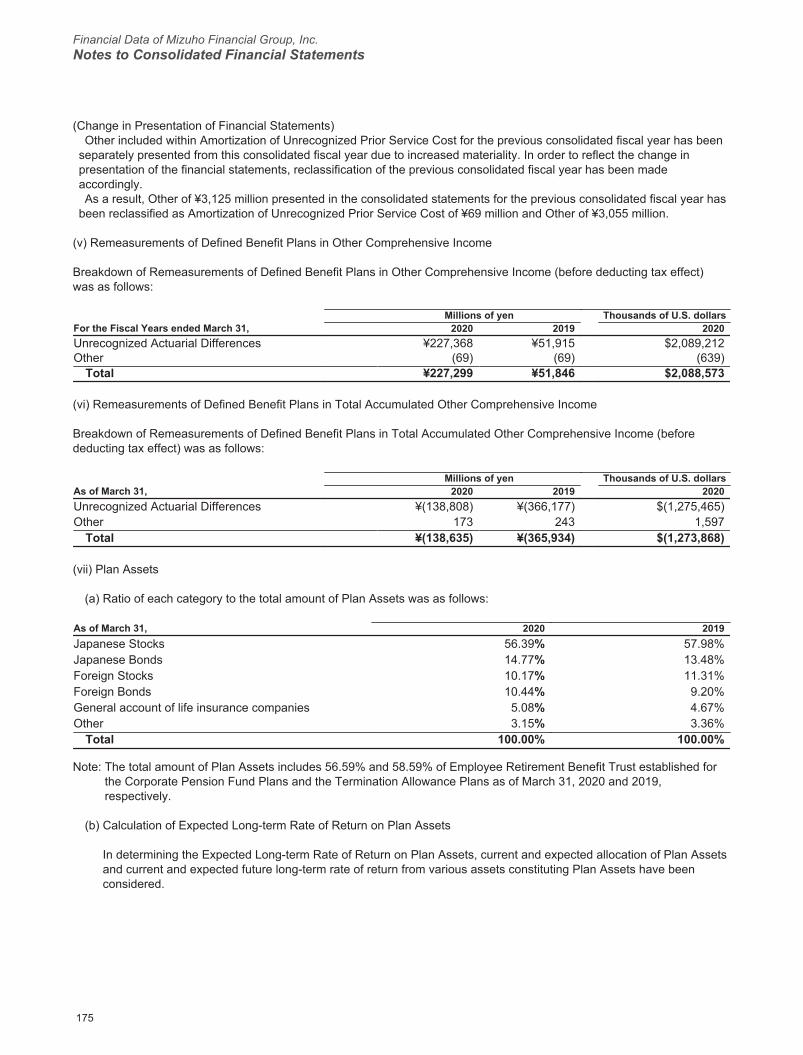
Financial Data of Mizuho Financial Group, Inc.Notes to Consolidated Financial Statements
2020/09/07 16:49:02 / 20635244_株式会社みずほフィナンシャルグループ_総会その他(C)
(Change in Presentation of Financial Statements)Other included within Amortization of Unrecognized Prior Service Cost for the previous consolidated fiscal year has been
separately presented from this consolidated fiscal year due to increased materiality. In order to reflect the change in presentation of the financial statements, reclassification of the previous consolidated fiscal year has been made accordingly.As a result, Other of ¥3,125 million presented in the consolidated statements for the previous consolidated fiscal year has
been reclassified as Amortization of Unrecognized Prior Service Cost of ¥69 million and Other of ¥3,055 million.
(v) Remeasurements of Defined Benefit Plans in Other Comprehensive Income
Breakdown of Remeasurements of Defined Benefit Plans in Other Comprehensive Income (before deducting tax effect) was as follows:
Millions of yen Thousands of U.S. dollarsFor the Fiscal Years ended March 31, 2020 2019 2020Unrecognized Actuarial Differences ¥227,368 ¥51,915 $2,089,212Other (69) (69) (639)
Total ¥227,299 ¥51,846 $2,088,573
(vi) Remeasurements of Defined Benefit Plans in Total Accumulated Other Comprehensive Income
Breakdown of Remeasurements of Defined Benefit Plans in Total Accumulated Other Comprehensive Income (before deducting tax effect) was as follows:
Millions of yen Thousands of U.S. dollarsAs of March 31, 2020 2019 2020Unrecognized Actuarial Differences ¥(138,808) ¥(366,177) $(1,275,465)Other 173 243 1,597
Total ¥(138,635) ¥(365,934) $(1,273,868)
(vii) Plan Assets
(a) Ratio of each category to the total amount of Plan Assets was as follows:
As of March 31, 2020 2019Japanese Stocks 56.39% 57.98%Japanese Bonds 14.77% 13.48%Foreign Stocks 10.17% 11.31%Foreign Bonds 10.44% 9.20%General account of life insurance companies 5.08% 4.67%Other 3.15% 3.36%
Total 100.00% 100.00%
Note: The total amount of Plan Assets includes 56.59% and 58.59% of Employee Retirement Benefit Trust established for the Corporate Pension Fund Plans and the Termination Allowance Plans as of March 31, 2020 and 2019, respectively.
(b) Calculation of Expected Long-term Rate of Return on Plan Assets
In determining the Expected Long-term Rate of Return on Plan Assets, current and expected allocation of Plan Assets and current and expected future long-term rate of return from various assets constituting Plan Assets have been considered.
175
Reserve for Employee Retirement Benefits
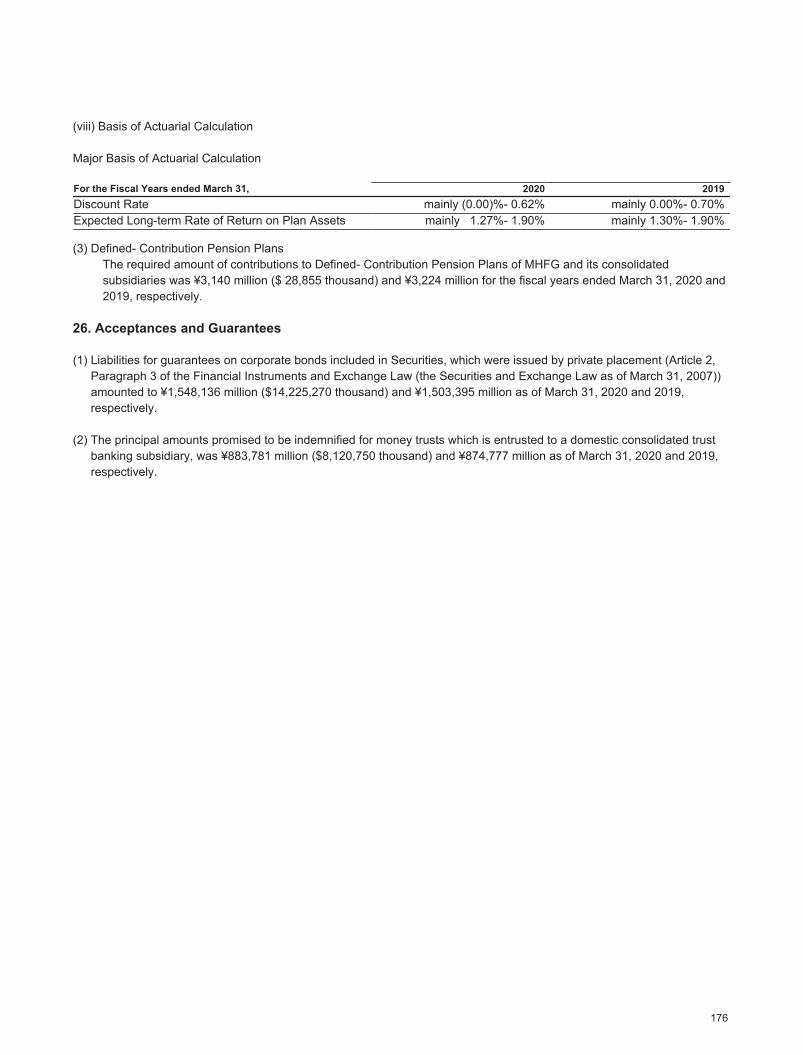
2020/09/07 16:49:02 / 20635244_株式会社みずほフィナンシャルグループ_総会その他(C)
(viii) Basis of Actuarial Calculation
Major Basis of Actuarial Calculation
For the Fiscal Years ended March 31, 2020 2019Discount Rate mainly (0.00)%- 0.62% mainly 0.00%- 0.70%Expected Long-term Rate of Return on Plan Assets mainly 1.27%- 1.90% mainly 1.30%- 1.90%
(3) Defined- Contribution Pension PlansThe required amount of contributions to Defined- Contribution Pension Plans of MHFG and its consolidated subsidiaries was ¥3,140 million ($ 28,855 thousand) and ¥3,224 million for the fiscal years ended March 31, 2020 and 2019, respectively.
26. Acceptances and Guarantees
(1) Liabilities for guarantees on corporate bonds included in Securities, which were issued by private placement (Article 2, Paragraph 3 of the Financial Instruments and Exchange Law (the Securities and Exchange Law as of March 31, 2007)) amounted to ¥1,548,136 million ($14,225,270 thousand) and ¥1,503,395 million as of March 31, 2020 and 2019, respectively.
(2) The principal amounts promised to be indemnified for money trusts which is entrusted to a domestic consolidated trust banking subsidiary, was ¥883,781 million ($8,120,750 thousand) and ¥874,777 million as of March 31, 2020 and 2019, respectively.
176
Reserve for Employee Retirement Benefits、Acceptances and Guarantees
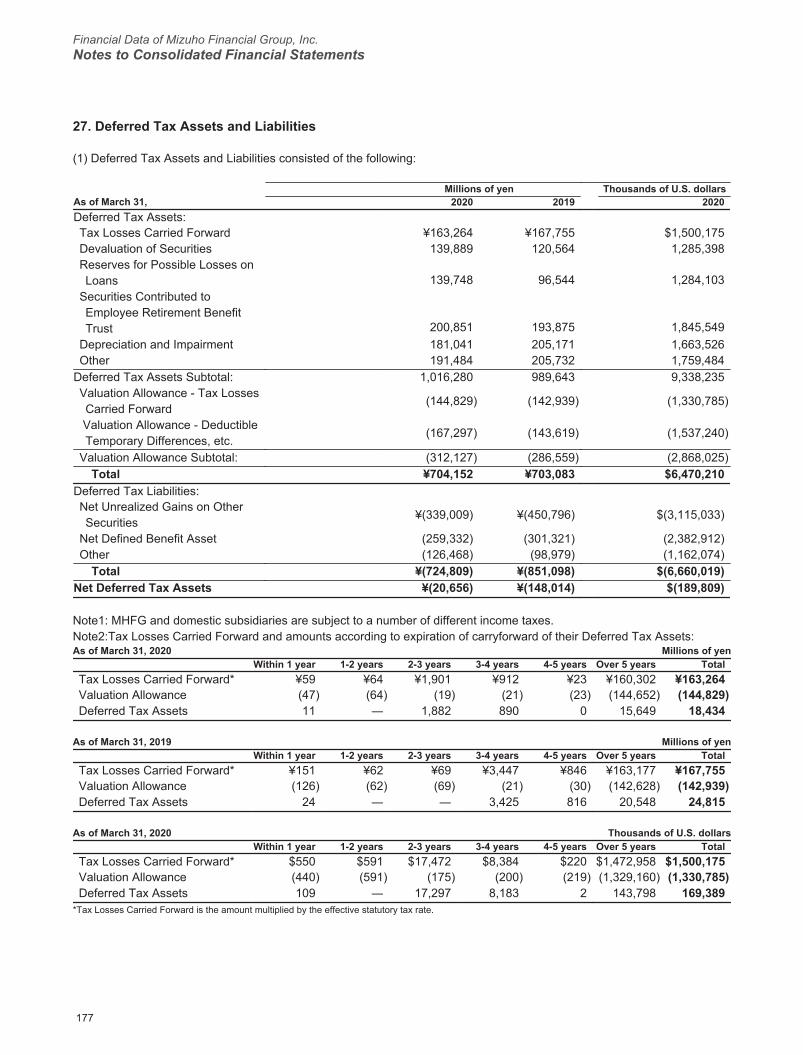
Financial Data of Mizuho Financial Group, Inc.Notes to Consolidated Financial Statements
2020/09/07 16:49:02 / 20635244_株式会社みずほフィナンシャルグループ_総会その他(C)
27. Deferred Tax Assets and Liabilities
(1) Deferred Tax Assets and Liabilities consisted of the following:
Millions of yen Thousands of U.S. dollarsAs of March 31, 2020 2019 2020Deferred Tax Assets:Tax Losses Carried Forward ¥163,264 ¥167,755 $1,500,175Devaluation of Securities 139,889 120,564 1,285,398Reserves for Possible Losses on Loans 139,748 96,544 1,284,103
Securities Contributed to Employee Retirement Benefit Trust 200,851 193,875 1,845,549
Depreciation and Impairment 181,041 205,171 1,663,526Other 191,484 205,732 1,759,484
Deferred Tax Assets Subtotal: 1,016,280 989,643 9,338,235Valuation Allowance - Tax Losses Carried Forward
(144,829) (142,939) (1,330,785)
Valuation Allowance - Deductible Temporary Differences, etc.
(167,297) (143,619) (1,537,240)
Valuation Allowance Subtotal: (312,127) (286,559) (2,868,025)Total ¥704,152 ¥703,083 $6,470,210
Deferred Tax Liabilities:Net Unrealized Gains on Other Securities
¥(339,009) ¥(450,796) $(3,115,033)
Net Defined Benefit Asset (259,332) (301,321) (2,382,912)Other (126,468) (98,979) (1,162,074)
Total ¥(724,809) ¥(851,098) $(6,660,019)Net Deferred Tax Assets ¥(20,656) ¥(148,014) $(189,809)
Note1: MHFG and domestic subsidiaries are subject to a number of different income taxes.Note2:Tax Losses Carried Forward and amounts according to expiration of carryforward of their Deferred Tax Assets:As of March 31, 2020 Millions of yen
Within 1 year 1-2 years 2-3 years 3-4 years 4-5 years Over 5 years TotalTax Losses Carried Forward* ¥59 ¥64 ¥1,901 ¥912 ¥23 ¥160,302 ¥163,264Valuation Allowance (47) (64) (19) (21) (23) (144,652) (144,829)Deferred Tax Assets 11 ― 1,882 890 0 15,649 18,434
As of March 31, 2019 Millions of yenWithin 1 year 1-2 years 2-3 years 3-4 years 4-5 years Over 5 years Total
Tax Losses Carried Forward* ¥151 ¥62 ¥69 ¥3,447 ¥846 ¥163,177 ¥167,755Valuation Allowance (126) (62) (69) (21) (30) (142,628) (142,939)Deferred Tax Assets 24 ― ― 3,425 816 20,548 24,815
As of March 31, 2020 Thousands of U.S. dollarsWithin 1 year 1-2 years 2-3 years 3-4 years 4-5 years Over 5 years Total
Tax Losses Carried Forward* $550 $591 $17,472 $8,384 $220 $1,472,958 $1,500,175Valuation Allowance (440) (591) (175) (200) (219) (1,329,160) (1,330,785)Deferred Tax Assets 109 ― 17,297 8,183 2 143,798 169,389
*Tax Losses Carried Forward is the amount multiplied by the effective statutory tax rate.
177
Deferred Tax Assets and Liabilities
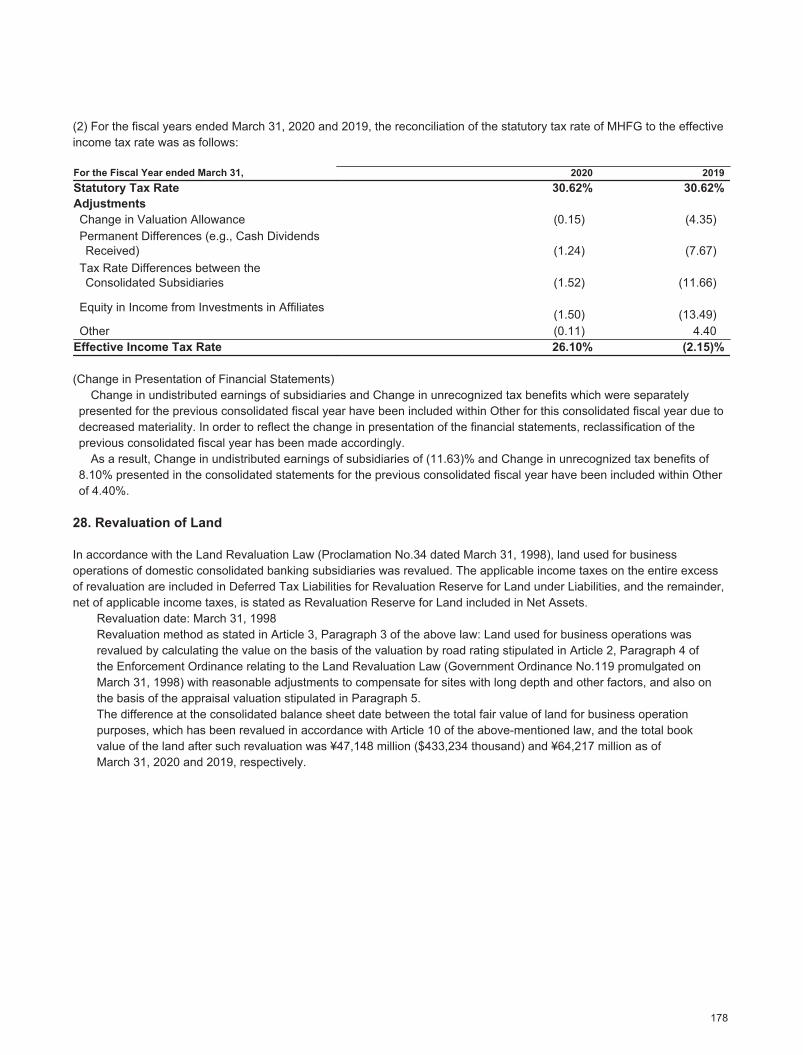
2020/09/07 16:49:02 / 20635244_株式会社みずほフィナンシャルグループ_総会その他(C)
(2) For the fiscal years ended March 31, 2020 and 2019, the reconciliation of the statutory tax rate of MHFG to the effective income tax rate was as follows:
For the Fiscal Year ended March 31, 2020 2019Statutory Tax Rate 30.62% 30.62%AdjustmentsChange in Valuation Allowance (0.15) (4.35)Permanent Differences (e.g., Cash Dividends Received) (1.24) (7.67)
Tax Rate Differences between the Consolidated Subsidiaries (1.52) (11.66)
Equity in Income from Investments in Affiliates (1.50) (13.49)Other (0.11) 4.40
Effective Income Tax Rate 26.10% (2.15)%
(Change in Presentation of Financial Statements)Change in undistributed earnings of subsidiaries and Change in unrecognized tax benefits which were separately
presented for the previous consolidated fiscal year have been included within Other for this consolidated fiscal year due to decreased materiality. In order to reflect the change in presentation of the financial statements, reclassification of the previous consolidated fiscal year has been made accordingly.
As a result, Change in undistributed earnings of subsidiaries of (11.63)% and Change in unrecognized tax benefits of 8.10% presented in the consolidated statements for the previous consolidated fiscal year have been included within Other of 4.40%.
28. Revaluation of Land
In accordance with the Land Revaluation Law (Proclamation No.34 dated March 31, 1998), land used for business operations of domestic consolidated banking subsidiaries was revalued. The applicable income taxes on the entire excess of revaluation are included in Deferred Tax Liabilities for Revaluation Reserve for Land under Liabilities, and the remainder, net of applicable income taxes, is stated as Revaluation Reserve for Land included in Net Assets.
Revaluation date: March 31, 1998Revaluation method as stated in Article 3, Paragraph 3 of the above law: Land used for business operations wasrevalued by calculating the value on the basis of the valuation by road rating stipulated in Article 2, Paragraph 4 ofthe Enforcement Ordinance relating to the Land Revaluation Law (Government Ordinance No.119 promulgated onMarch 31, 1998) with reasonable adjustments to compensate for sites with long depth and other factors, and also onthe basis of the appraisal valuation stipulated in Paragraph 5.The difference at the consolidated balance sheet date between the total fair value of land for business operationpurposes, which has been revalued in accordance with Article 10 of the above-mentioned law, and the total bookvalue of the land after such revaluation was ¥47,148 million ($433,234 thousand) and ¥64,217 million as ofMarch 31, 2020 and 2019, respectively.
178
Deferred Tax Assets and Liabilities、Revaluation of Land

Financial Data of Mizuho Financial Group, Inc.Notes to Consolidated Financial Statements
2020/09/07 16:49:02 / 20635244_株式会社みずほフィナンシャルグループ_総会その他(C)
29. Common Stock and Preferred Stock
Common Stock and Preferred Stock at March 31, 2020 and 2019 were as follows:
Number of shares Per share (Yen)
As of March 31, 2020Class of stock Authorized*2
Issued andoutstanding*1
Interimcash
dividend
Year-endcash
dividendLiquidation
valueConvertible
or not
WithRedemption
or notCommon Stock 48,000,000,000 25,392,498,945 ¥3.75 ¥3.75 ¥― No No
Notes: 1. Treasury Stock is included. The number is as follows:Common Stock 3,622 thousand shares
2. Each total number of other shares which are authorized to be issued is as follows:First Series Class XIV Preferred Stock 900,000 thousand sharesSecond Series Class XIV Preferred Stock 900,000 thousand sharesThird Series Class XIV Preferred Stock 900,000 thousand sharesFourth Series Class XIV Preferred Stock 900,000 thousand sharesFirst Series Class XV Preferred Stock 900,000 thousand sharesSecond Series Class XV Preferred Stock 900,000 thousand sharesThird Series Class XV Preferred Stock 900,000 thousand sharesFourth Series Class XV Preferred Stock 900,000 thousand sharesFirst Series Class XVI Preferred Stock 1,500,000 thousand sharesSecond Series Class XVI Preferred Stock 1,500,000 thousand sharesThird Series Class XVI Preferred Stock 1,500,000 thousand sharesFourth Series Class XVI Preferred Stock 1,500,000 thousand sharesThe total number of shares of the First to Fourth Series Class XIV Preferred Stock, which are authorized to be issued, shall not exceed 900,000,000 in total.The total number of shares of the First to Fourth Series Class XV Preferred Stock, which are authorized to be issued, shall not exceed 900,000,000 in total.The total number of shares of the First to Fourth Series Class XVI Preferred Stock, which are authorized to be issued, shall not exceed 1,500,000,000 in total.
179
Common Stock and Preferred Stock

2020/09/07 16:49:02 / 20635244_株式会社みずほフィナンシャルグループ_総会その他(C)
Number of shares Per share (Yen)
As of March 31, 2019Class of stock Authorized*2
Issued andoutstanding*1
Interimcash
dividend
Year-endcash
dividendLiquidation
valueConvertible
or not
WithRedemption
or notCommon Stock 48,000,000,000 25,392,498,945 ¥3.75 ¥3.75 ¥― No No
Notes: 1. Treasury Stock is included. The number is as follows:Common Stock 6,520 thousand shares
2. Each total number of other shares which are authorized to be issued is as follows:First Series Class XIV Preferred Stock 900,000 thousand sharesSecond Series Class XIV Preferred Stock 900,000 thousand sharesThird Series Class XIV Preferred Stock 900,000 thousand sharesFourth Series Class XIV Preferred Stock 900,000 thousand sharesFirst Series Class XV Preferred Stock 900,000 thousand sharesSecond Series Class XV Preferred Stock 900,000 thousand sharesThird Series Class XV Preferred Stock 900,000 thousand sharesFourth Series Class XV Preferred Stock 900,000 thousand sharesFirst Series Class XVI Preferred Stock 1,500,000 thousand sharesSecond Series Class XVI Preferred Stock 1,500,000 thousand sharesThird Series Class XVI Preferred Stock 1,500,000 thousand sharesFourth Series Class XVI Preferred Stock 1,500,000 thousand sharesThe total number of shares of the First to Fourth Series Class XIV Preferred Stock, which are authorized to be issued, shall not exceed 900,000,000 in total.The total number of shares of the First to Fourth Series Class XV Preferred Stock, which are authorized to be issued, shall not exceed 900,000,000 in total.The total number of shares of the First to Fourth Series Class XVI Preferred Stock, which are authorized to be issued, shall not exceed 1,500,000,000 in total.
180
Common Stock and Preferred Stock

Financial Data of Mizuho Financial Group, Inc.Notes to Consolidated Financial Statements
2020/09/07 16:49:02 / 20635244_株式会社みずほフィナンシャルグループ_総会その他(C)
30. Stock Options
Outline of stock options and changes
For the fiscal year ended March 31, 2020
(1) Outline of stock options
As of March 31, 2020Third Series of Stock
Acquisition Rights of MHFGFourth Series of Stock
Acquisition Rights of MHFGFifth Series of Stock
Acquisition Rights of MHFGNumber of grantees Directors 4 Directors 6 Directors 6
ExecutiveOfficers 4 Executive
Officers 6 ExecutiveOfficers 11
Directors ofsubsidiaries ofMHFG
12Directors ofsubsidiaries ofMHFG
26Directors ofsubsidiaries ofMHFG
23
ExecutiveOfficers ofsubsidiaries ofMHFG
71
ExecutiveOfficers ofsubsidiaries ofMHFG
130
ExecutiveOfficers ofsubsidiaries ofMHFG
150
Number of stockoptions*1 Common stock 6,808,000 Common stock 12,452,000 Common stock 11,776,000
Grant date August 26, 2010 December 8, 2011 August 31, 2012Condition for vesting The grantee may exercise the
Stock Acquisition Rights which have been allotted based on his or her capacity as a Director or an Executive Officer of MHFG, MHBK or MHCB immediately following the date on which such grantee loses the status as a Director or an Executive Officer of MHFG, MHBK or MHCB.
The grantee may exercise the Stock Acquisition Rights which have been allotted based on his or her capacity as a Director or an Executive Officer of MHFG, MHBK, MHCB, MHTB or MHSC immediately following the date on which such grantee loses the status as a Director or an Executive Officer of MHFG, MHBK, MHCB, MHTB or MHSC.
Required serviceperiod
April 1, 2010to March 31, 2011
April 1, 2011to March 31, 2012
April 1, 2012to March 31, 2013
Exercise period August 27, 2010to August 26, 2030
December 9, 2011to December 8, 2031
September 3, 2012to August 31, 2032
181
Stock Options
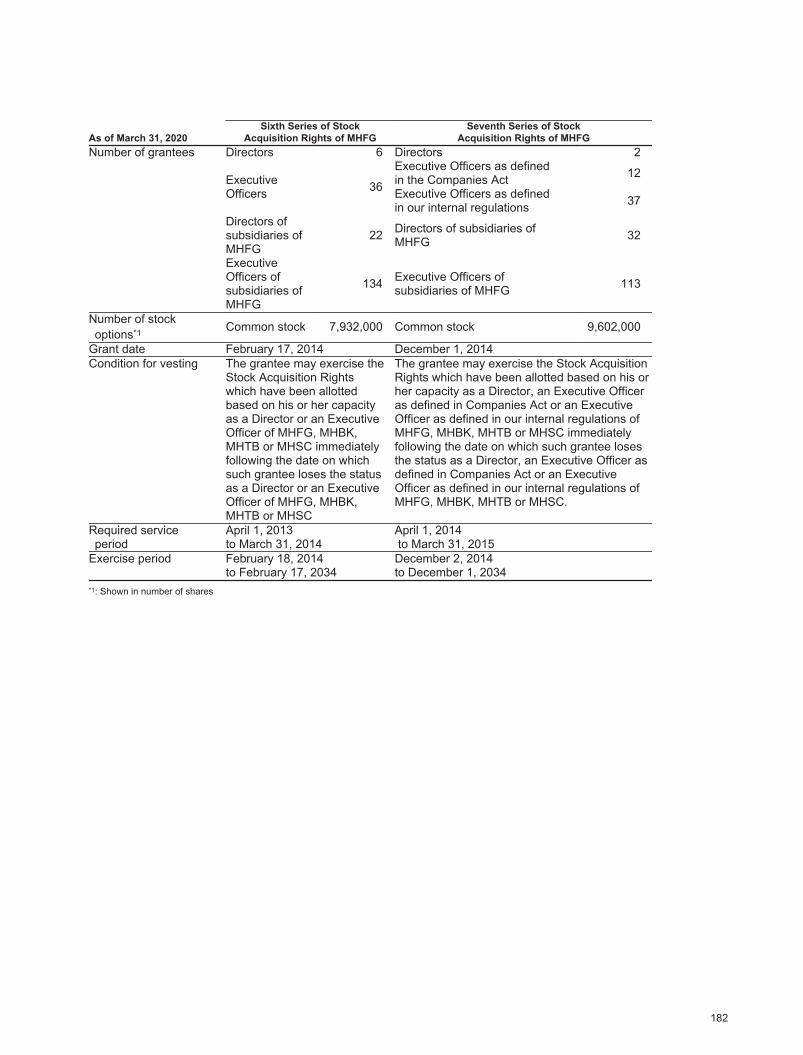
2020/09/07 16:49:02 / 20635244_株式会社みずほフィナンシャルグループ_総会その他(C)
As of March 31, 2020Sixth Series of Stock
Acquisition Rights of MHFGSeventh Series of Stock
Acquisition Rights of MHFGNumber of grantees Directors 6 Directors 2
ExecutiveOfficers 36
Executive Officers as definedin the Companies Act 12
Executive Officers as definedin our internal regulations 37
Directors ofsubsidiaries ofMHFG
22 Directors of subsidiaries ofMHFG 32
ExecutiveOfficers ofsubsidiaries ofMHFG
134 Executive Officers ofsubsidiaries of MHFG 113
Number of stockoptions*1 Common stock 7,932,000 Common stock 9,602,000
Grant date February 17, 2014 December 1, 2014Condition for vesting The grantee may exercise the
Stock Acquisition Rights which have been allotted based on his or her capacity as a Director or an Executive Officer of MHFG, MHBK, MHTB or MHSC immediately following the date on which such grantee loses the status as a Director or an Executive Officer of MHFG, MHBK, MHTB or MHSC
The grantee may exercise the Stock Acquisition Rights which have been allotted based on his or her capacity as a Director, an Executive Officer as defined in Companies Act or an Executive Officer as defined in our internal regulations of MHFG, MHBK, MHTB or MHSC immediately following the date on which such grantee loses the status as a Director, an Executive Officer as defined in Companies Act or an Executive Officer as defined in our internal regulations of MHFG, MHBK, MHTB or MHSC.
Required serviceperiod
April 1, 2013to March 31, 2014
April 1, 2014 to March 31, 2015
Exercise period February 18, 2014to February 17, 2034
December 2, 2014to December 1, 2034
*1: Shown in number of shares
182
Stock Options
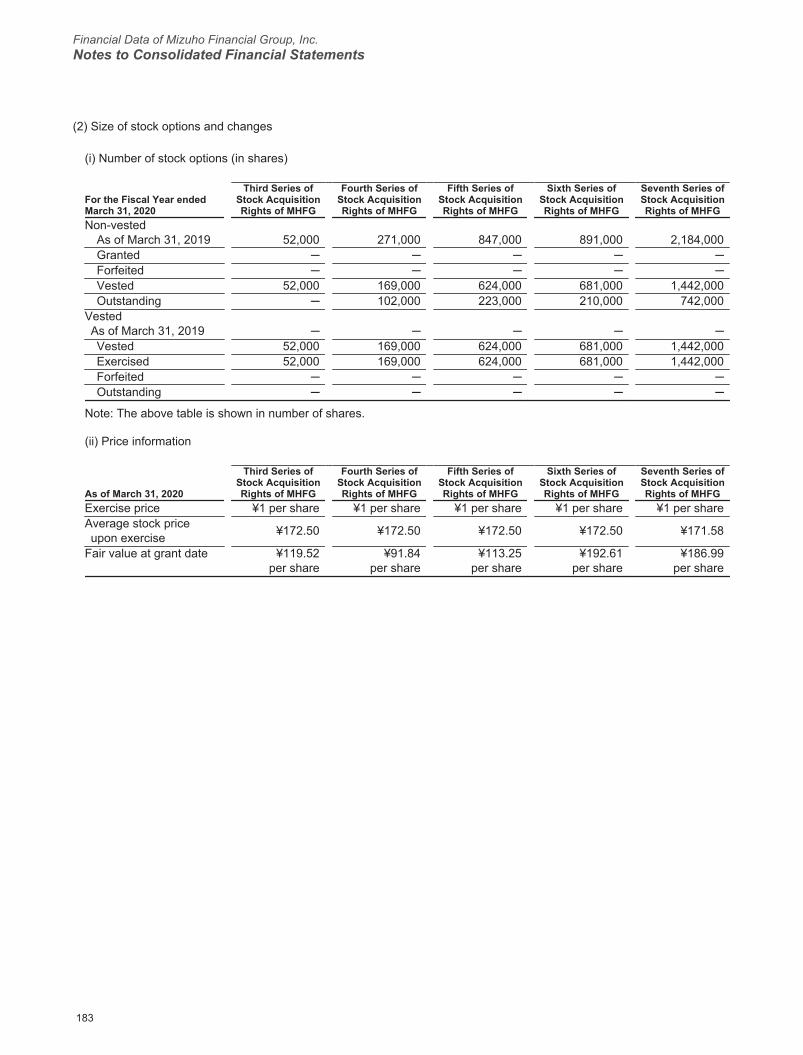
Financial Data of Mizuho Financial Group, Inc.Notes to Consolidated Financial Statements
2020/09/07 16:49:02 / 20635244_株式会社みずほフィナンシャルグループ_総会その他(C)
(2) Size of stock options and changes
(i) Number of stock options (in shares)
For the Fiscal Year endedMarch 31, 2020
Third Series ofStock AcquisitionRights of MHFG
Fourth Series ofStock AcquisitionRights of MHFG
Fifth Series ofStock AcquisitionRights of MHFG
Sixth Series ofStock AcquisitionRights of MHFG
Seventh Series ofStock AcquisitionRights of MHFG
Non-vestedAs of March 31, 2019 52,000 271,000 847,000 891,000 2,184,000Granted ─ ─ ─ ─ ─Forfeited ─ ─ ─ ─ ─Vested 52,000 169,000 624,000 681,000 1,442,000Outstanding ─ 102,000 223,000 210,000 742,000
VestedAs of March 31, 2019 ─ ─ ─ ─ ─Vested 52,000 169,000 624,000 681,000 1,442,000Exercised 52,000 169,000 624,000 681,000 1,442,000Forfeited ─ ─ ─ ─ ─Outstanding ─ ─ ─ ─ ─
Note: The above table is shown in number of shares.
(ii) Price information
As of March 31, 2020
Third Series ofStock AcquisitionRights of MHFG
Fourth Series ofStock AcquisitionRights of MHFG
Fifth Series ofStock AcquisitionRights of MHFG
Sixth Series ofStock AcquisitionRights of MHFG
Seventh Series ofStock AcquisitionRights of MHFG
Exercise price ¥1 per share ¥1 per share ¥1 per share ¥1 per share ¥1 per shareAverage stock priceupon exercise ¥172.50 ¥172.50 ¥172.50 ¥172.50 ¥171.58
Fair value at grant date ¥119.52 ¥91.84 ¥113.25 ¥192.61 ¥186.99per share per share per share per share per share
183
Stock Options
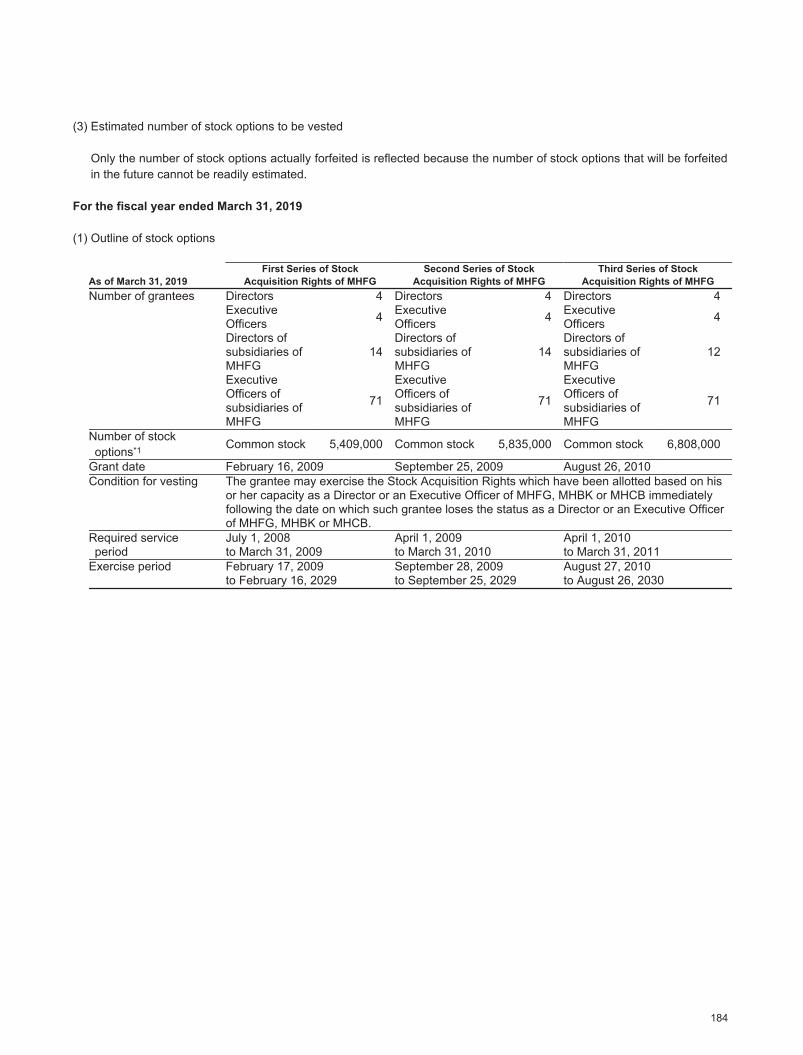
2020/09/07 16:49:02 / 20635244_株式会社みずほフィナンシャルグループ_総会その他(C)
(3) Estimated number of stock options to be vested
Only the number of stock options actually forfeited is reflected because the number of stock options that will be forfeited in the future cannot be readily estimated.
For the fiscal year ended March 31, 2019
(1) Outline of stock options
As of March 31, 2019First Series of Stock
Acquisition Rights of MHFGSecond Series of Stock
Acquisition Rights of MHFGThird Series of Stock
Acquisition Rights of MHFGNumber of grantees Directors 4 Directors 4 Directors 4
ExecutiveOfficers 4 Executive
Officers 4 ExecutiveOfficers 4
Directors ofsubsidiaries ofMHFG
14Directors ofsubsidiaries ofMHFG
14Directors ofsubsidiaries ofMHFG
12
ExecutiveOfficers ofsubsidiaries ofMHFG
71
ExecutiveOfficers ofsubsidiaries ofMHFG
71
ExecutiveOfficers ofsubsidiaries ofMHFG
71
Number of stockoptions*1 Common stock 5,409,000 Common stock 5,835,000 Common stock 6,808,000
Grant date February 16, 2009 September 25, 2009 August 26, 2010Condition for vesting The grantee may exercise the Stock Acquisition Rights which have been allotted based on his
or her capacity as a Director or an Executive Officer of MHFG, MHBK or MHCB immediately following the date on which such grantee loses the status as a Director or an Executive Officer of MHFG, MHBK or MHCB.
Required serviceperiod
July 1, 2008to March 31, 2009
April 1, 2009to March 31, 2010
April 1, 2010to March 31, 2011
Exercise period February 17, 2009to February 16, 2029
September 28, 2009to September 25, 2029
August 27, 2010to August 26, 2030
184
Stock Options
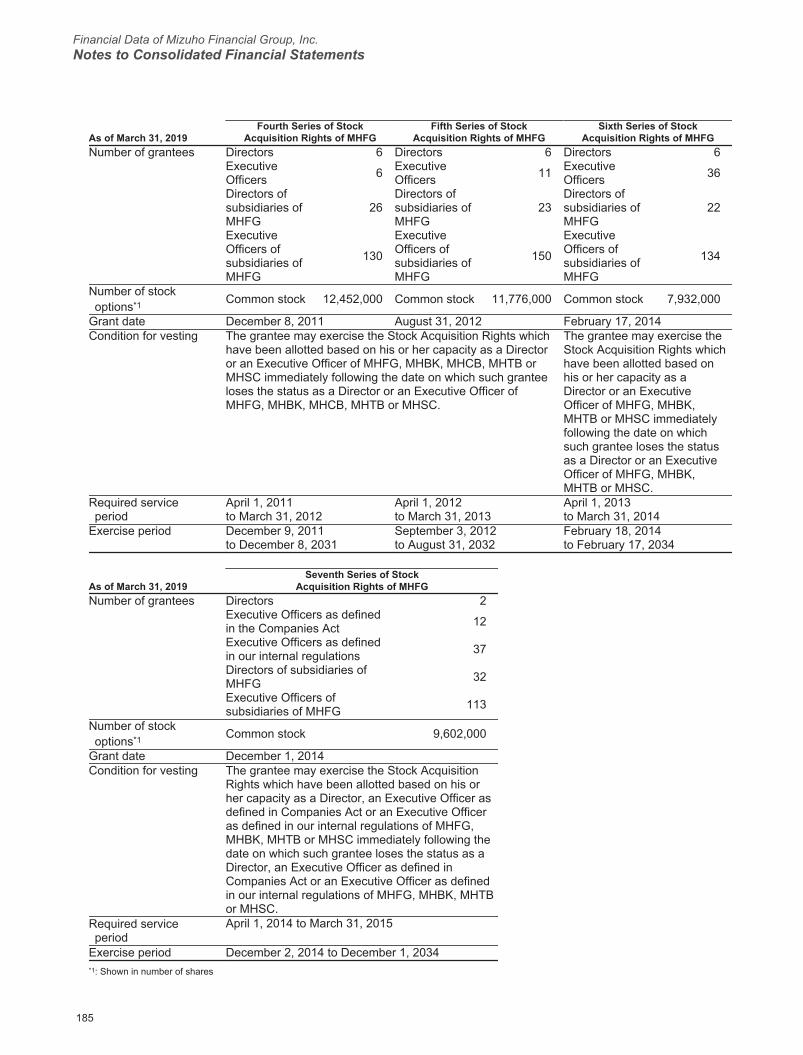
Financial Data of Mizuho Financial Group, Inc.Notes to Consolidated Financial Statements
2020/09/07 16:49:02 / 20635244_株式会社みずほフィナンシャルグループ_総会その他(C)
As of March 31, 2019Fourth Series of Stock
Acquisition Rights of MHFGFifth Series of Stock
Acquisition Rights of MHFGSixth Series of Stock
Acquisition Rights of MHFGNumber of grantees Directors 6 Directors 6 Directors 6
ExecutiveOfficers 6 Executive
Officers 11 ExecutiveOfficers 36
Directors ofsubsidiaries ofMHFG
26Directors ofsubsidiaries ofMHFG
23Directors ofsubsidiaries ofMHFG
22
ExecutiveOfficers ofsubsidiaries ofMHFG
130
ExecutiveOfficers ofsubsidiaries ofMHFG
150
ExecutiveOfficers ofsubsidiaries ofMHFG
134
Number of stockoptions*1 Common stock 12,452,000 Common stock 11,776,000 Common stock 7,932,000
Grant date December 8, 2011 August 31, 2012 February 17, 2014Condition for vesting The grantee may exercise the Stock Acquisition Rights which
have been allotted based on his or her capacity as a Director or an Executive Officer of MHFG, MHBK, MHCB, MHTB or MHSC immediately following the date on which such grantee loses the status as a Director or an Executive Officer of MHFG, MHBK, MHCB, MHTB or MHSC.
The grantee may exercise the Stock Acquisition Rights which have been allotted based on his or her capacity as a Director or an Executive Officer of MHFG, MHBK, MHTB or MHSC immediately following the date on which such grantee loses the status as a Director or an Executive Officer of MHFG, MHBK, MHTB or MHSC.
Required serviceperiod
April 1, 2011to March 31, 2012
April 1, 2012to March 31, 2013
April 1, 2013to March 31, 2014
Exercise period December 9, 2011to December 8, 2031
September 3, 2012to August 31, 2032
February 18, 2014to February 17, 2034
As of March 31, 2019Seventh Series of Stock
Acquisition Rights of MHFGNumber of grantees Directors 2
Executive Officers as definedin the Companies Act 12
Executive Officers as definedin our internal regulations 37
Directors of subsidiaries ofMHFG 32
Executive Officers ofsubsidiaries of MHFG 113
Number of stockoptions*1 Common stock 9,602,000
Grant date December 1, 2014Condition for vesting The grantee may exercise the Stock Acquisition
Rights which have been allotted based on his or her capacity as a Director, an Executive Officer as defined in Companies Act or an Executive Officer as defined in our internal regulations of MHFG, MHBK, MHTB or MHSC immediately following the date on which such grantee loses the status as a Director, an Executive Officer as defined in Companies Act or an Executive Officer as defined in our internal regulations of MHFG, MHBK, MHTB or MHSC.
Required serviceperiod
April 1, 2014 to March 31, 2015
Exercise period December 2, 2014 to December 1, 2034*1: Shown in number of shares
185
Stock Options

2020/09/07 16:49:02 / 20635244_株式会社みずほフィナンシャルグループ_総会その他(C)
(2) Size of stock options and changes
(i) Number of stock options (in shares)
For the Fiscal Year endedMarch 31, 2019
First Series ofStock AcquisitionRights of MHFG
Second Series ofStock AcquisitionRights of MHFG
Third Series ofStock AcquisitionRights of MHFG
Fourth Series ofStock AcquisitionRights of MHFG
Fifth Series ofStock AcquisitionRights of MHFG
Non-vestedAs of March 31, 2018 124,000 220,000 331,000 612,000 1,474,000Granted ─ ─ ─ ─ ─Forfeited ─ ─ ─ ─ ─Vested 124,000 220,000 279,000 341,000 627,000Outstanding ─ ─ 52,000 271,000 847,000
VestedAs of March 31, 2018 ─ ─ ─ ─ ─Vested 124,000 220,000 279,000 341,000 627,000Exercised 124,000 220,000 279,000 341,000 627,000Forfeited ─ ─ ─ ─ ─Outstanding ─ ─ ─ ─ ─
For the Fiscal Year endedMarch 31, 2019
Sixth Series ofStock AcquisitionRights of MHFG
Seventh Series ofStock AcquisitionRights of MHFG
Non-vestedAs of March 31, 2018 1,305,000 3,150,000Granted ─ ─Forfeited ─ ─Vested 414,000 966,000Outstanding 891,000 2,184,000
VestedAs of March 31, 2018 ─ ─Vested 414,000 966,000Exercised 414,000 966,000Forfeited ─ ─Outstanding ─ ─
Note: The above table is shown in number of shares.
(ii) Price information
As of March 31, 2019
First Series ofStock AcquisitionRights of MHFG
Second Series ofStock AcquisitionRights of MHFG
Third Series ofStock AcquisitionRights of MHFG
Fourth Series ofStock AcquisitionRights of MHFG
Fifth Series ofStock AcquisitionRights of MHFG
Exercise price ¥1 per share ¥1 per share ¥1 per share ¥1 per share ¥1 per shareAverage stock priceupon exercise ¥196.20 ¥196.20 ¥196.20 ¥196.20 ¥196.20
Fair value at grant date ¥190.91 ¥168.69 ¥119.52 ¥91.84 ¥113.25per share per share per share per share per share
As of March 31, 2019
Sixth Series ofStock AcquisitionRights of MHFG
Seventh Series ofStock AcquisitionRights of MHFG
Exercise price ¥1 per share ¥1 per shareAverage stock priceupon exercise ¥196.20 ¥195.21
Fair value at grant date ¥192.61 ¥186.99per share per share
186
Stock Options
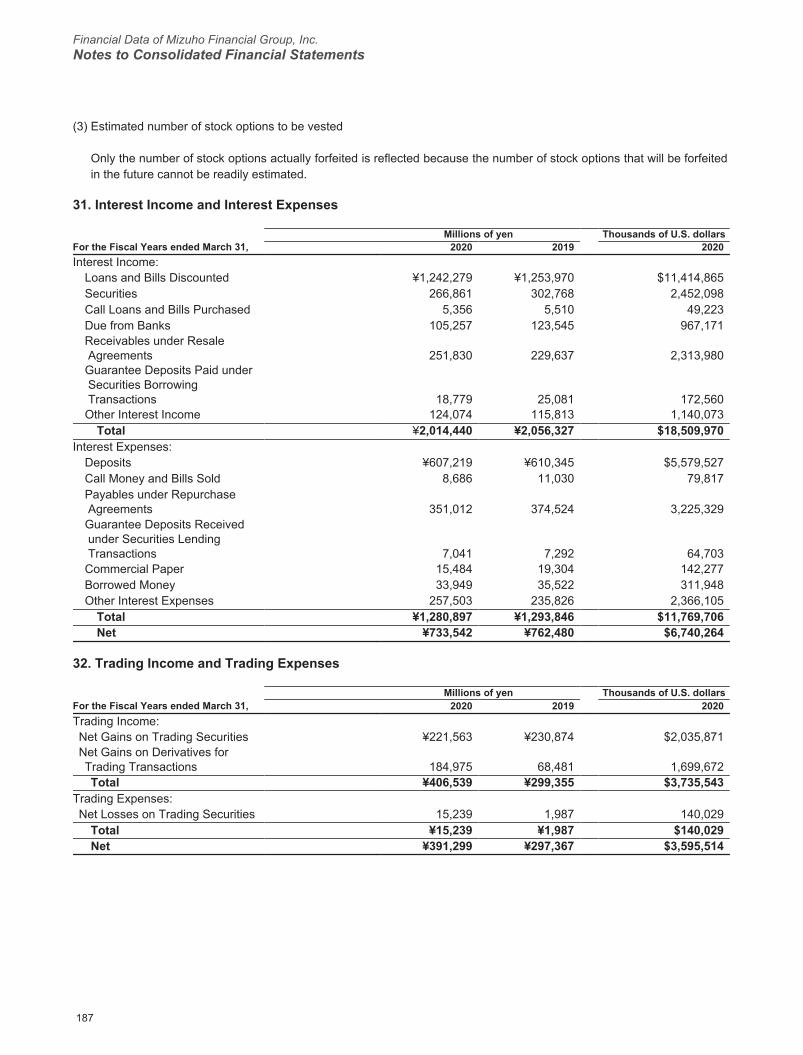
Financial Data of Mizuho Financial Group, Inc.Notes to Consolidated Financial Statements
2020/09/07 16:49:02 / 20635244_株式会社みずほフィナンシャルグループ_総会その他(C)
(3) Estimated number of stock options to be vested
Only the number of stock options actually forfeited is reflected because the number of stock options that will be forfeited in the future cannot be readily estimated.
31. Interest Income and Interest Expenses
Millions of yen Thousands of U.S. dollarsFor the Fiscal Years ended March 31, 2020 2019 2020Interest Income:
Loans and Bills Discounted ¥1,242,279 ¥1,253,970 $11,414,865Securities 266,861 302,768 2,452,098Call Loans and Bills Purchased 5,356 5,510 49,223Due from Banks 105,257 123,545 967,171Receivables under Resale Agreements 251,830 229,637 2,313,980Guarantee Deposits Paid under Securities Borrowing Transactions 18,779 25,081 172,560Other Interest Income 124,074 115,813 1,140,073
Total ¥2,014,440 ¥2,056,327 $18,509,970Interest Expenses:
Deposits ¥607,219 ¥610,345 $5,579,527Call Money and Bills Sold 8,686 11,030 79,817Payables under Repurchase Agreements 351,012 374,524 3,225,329Guarantee Deposits Received under Securities Lending Transactions 7,041 7,292 64,703Commercial Paper 15,484 19,304 142,277Borrowed Money 33,949 35,522 311,948Other Interest Expenses 257,503 235,826 2,366,105
Total ¥1,280,897 ¥1,293,846 $11,769,706Net ¥733,542 ¥762,480 $6,740,264
32. Trading Income and Trading Expenses
Millions of yen Thousands of U.S. dollarsFor the Fiscal Years ended March 31, 2020 2019 2020Trading Income:Net Gains on Trading Securities ¥221,563 ¥230,874 $2,035,871Net Gains on Derivatives forTrading Transactions 184,975 68,481 1,699,672Total ¥406,539 ¥299,355 $3,735,543
Trading Expenses:Net Losses on Trading Securities 15,239 1,987 140,029
Total ¥15,239 ¥1,987 $140,029Net ¥391,299 ¥297,367 $3,595,514
187
Stock Options、Interest Income and Interest Expenses、Trading Income and Trading Expenses

2020/09/07 16:49:02 / 20635244_株式会社みずほフィナンシャルグループ_総会その他(C)
33. Other Operating Income
Millions of yen Thousands of U.S. dollarsFor the Fiscal Years ended March 31, 2020 2019 2020Gains on Foreign ExchangeTransactions ¥29,538 ¥94,921 $271,421
Gains on Sales of Bonds 224,830 72,682 2,065,885Gains on Derivatives other thanfor Trading or Hedging 23,969 11,214 220,244
Other 133,776 133,996 1,229,227Total ¥412,114 ¥312,815 $3,786,777
34. Other Operating Expenses
Millions of yen Thousands of U.S. dollarsFor the Fiscal Years ended March 31, 2020 2019 2020Losses on Sales of Bonds ¥103,320 ¥175,074 $949,377Losses on Devaluation of Bonds 2,185 1,259 20,086Other 47,040 49,175 432,237
Total ¥152,547 ¥225,509 $1,401,700
35. Other Income
Millions of yen Thousands of U.S. dollarsFor the Fiscal Years ended March 31, 2020 2019 2020Gains on Sales of Stock ¥226,005 ¥351,049 $2,076,682Recovery on Written-off Loans 11,901 10,395 109,363Gains on Disposition of FixedAssets 2,239 3,438 20,582
Gains on Cancellation ofEmployee RetirementBenefit Trust
― 7,841 ―
Reversal of Reserves forPossible Losses on Loans ― 4,357 ―
Other 78,291 70,216 719,392Total ¥318,438 ¥447,300 $2,926,019
36. Other Expenses
Millions of yen Thousands of U.S. dollarsFor the Fiscal Years ended March 31, 2020 2019 2020Provision for Reserves for PossibleLosses on Loans ¥161,005 ¥― $1,479,422
Losses on Sales of Stocks 72,258 45,847 663,954Impairment Losses of Stocks 41,691 5,795 383,090Losses on Impairment of FixedAssets 15,224 503,612 139,892
Losses on Disposition of FixedAssets 6,138 5,414 56,406
Stock-related derivatives expenses ― 24,542 ―Other 87,223 127,714 801,469
Total ¥383,542 ¥712,927 $3,524,233
188
Other Operating Income、Other Operating Expenses、Other Income、Other Expenses
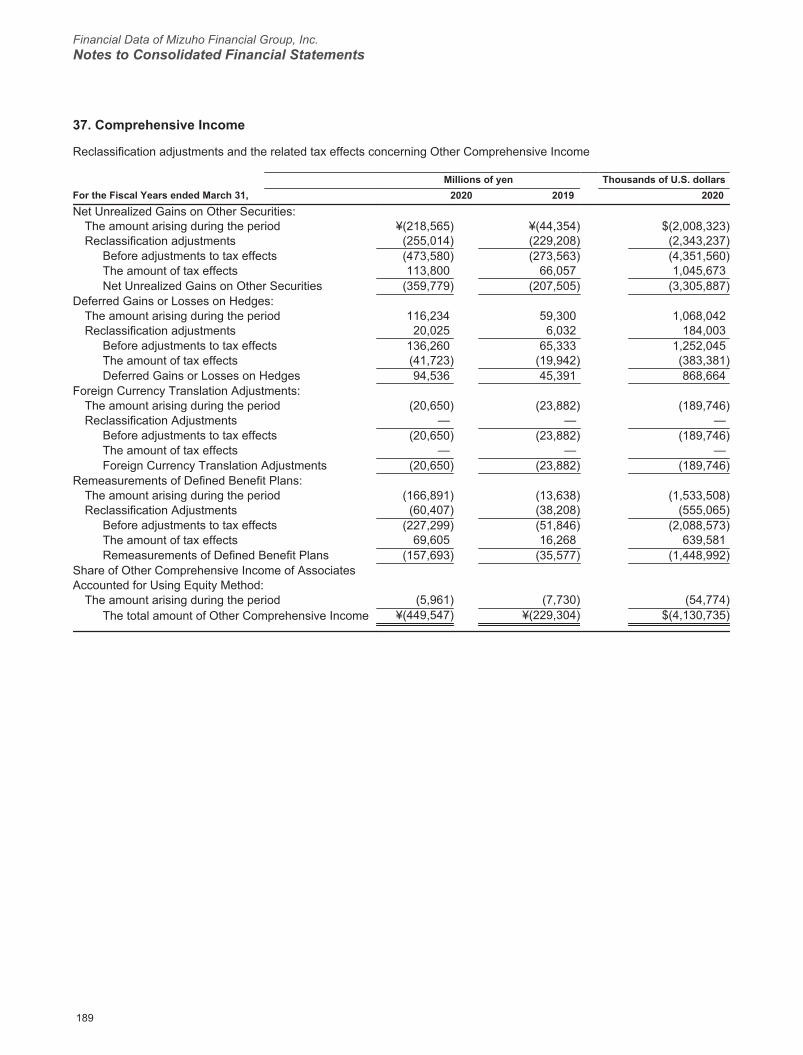
Financial Data of Mizuho Financial Group, Inc.Notes to Consolidated Financial Statements
2020/09/07 16:49:02 / 20635244_株式会社みずほフィナンシャルグループ_総会その他(C)
37. Comprehensive Income
Reclassification adjustments and the related tax effects concerning Other Comprehensive Income
Millions of yen Thousands of U.S. dollarsFor the Fiscal Years ended March 31, 2020 2019 2020Net Unrealized Gains on Other Securities:
The amount arising during the period ¥(218,565) ¥(44,354) $(2,008,323)Reclassification adjustments (255,014) (229,208) (2,343,237)
Before adjustments to tax effects (473,580) (273,563) (4,351,560)The amount of tax effects 113,800 66,057 1,045,673Net Unrealized Gains on Other Securities (359,779) (207,505) (3,305,887)
Deferred Gains or Losses on Hedges:The amount arising during the period 116,234 59,300 1,068,042Reclassification adjustments 20,025 6,032 184,003
Before adjustments to tax effects 136,260 65,333 1,252,045The amount of tax effects (41,723) (19,942) (383,381)Deferred Gains or Losses on Hedges 94,536 45,391 868,664
Foreign Currency Translation Adjustments:The amount arising during the period (20,650) (23,882) (189,746)Reclassification Adjustments — — —
Before adjustments to tax effects (20,650) (23,882) (189,746)The amount of tax effects — — —Foreign Currency Translation Adjustments (20,650) (23,882) (189,746)
Remeasurements of Defined Benefit Plans:The amount arising during the period (166,891) (13,638) (1,533,508)Reclassification Adjustments (60,407) (38,208) (555,065)
Before adjustments to tax effects (227,299) (51,846) (2,088,573)The amount of tax effects 69,605 16,268 639,581Remeasurements of Defined Benefit Plans (157,693) (35,577) (1,448,992)
Share of Other Comprehensive Income of AssociatesAccounted for Using Equity Method:
The amount arising during the period (5,961) (7,730) (54,774)The total amount of Other Comprehensive Income ¥(449,547) ¥(229,304) $(4,130,735)
189
Comprehensive Income

2020/09/07 16:49:02 / 20635244_株式会社みずほフィナンシャルグループ_総会その他(C)
38. Changes in Net Assets
For the fiscal year ended March 31, 2020
(i) Types and number of issued shares and of treasury stock are as follows:
Thousands of SharesAs of
April 1, 2019Increase during
the fiscal yearDecrease during
the fiscal yearAs of
March 31, 2020 RemarksIssued sharesCommon stock 25,392,498 — — 25,392,498
Total 25,392,498 — — 25,392,498Treasury stockCommon stock 33,962 12,149 14,004 32,106 *1
Total 33,962 12,149 14,004 32,106
*1 Increases are due to acquisition of treasury stock by BBT trust account (9,030 thousand shares) and repurchase of shares constituting less than one unit and
other factors (3,119 thousand shares). Decreases are due to distribution and sale of treasury stock through BBT trust account (8,311 thousand shares), exercise of stock acquisition rights (stock options) (2,968 thousand shares), and repurchase of shares constituting less than one unit and other factors (2,725 thousand shares). The number of shares as of March 31, 2020 includes the number of treasury stock held by BBT trust account (19,636 thousand shares).
(ii) Stock acquisition rights and treasury stock acquisition rights are as follows:
Class ofshares tobe issued
ortransferred
uponexercise of
stockacquisition
rights
Number of shares to be issued or transferredupon exercise of stock acquisition rights
(Shares)
Category
Breakdown ofstockacquisitionrights
As ofApril 1,
2019
Increaseduring
the fiscalyear
Decreaseduring
the fiscalyear
As ofMarch
31, 2020
Balance as ofMarch 31,
2020(Millions of
yen)
Balance asof March31, 2020
(Thousandsof
U.S.dollars) RemarksMHFG Stock
acquisitionrights(Treasurystockacquisitionrights)
— —(—)
—(—)
—(—)
—(—)
¥—(—)
$—(—)
Stockacquisitionrights asstock option
— 213 1,965
Consolidatedsubsidiaries (Treasurystock acquisition rights)
— —(—)
—(—)
Total — ¥213(—)
$1,965(—)
190
Changes in Net Assets
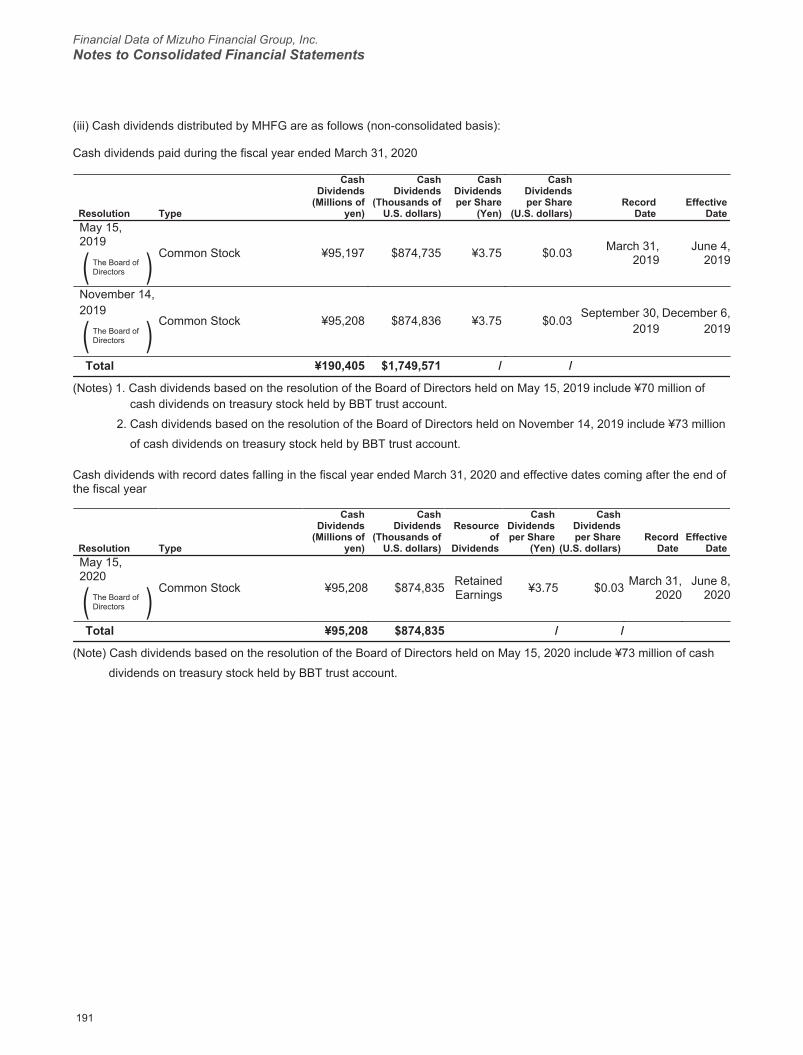
Financial Data of Mizuho Financial Group, Inc.Notes to Consolidated Financial Statements
2020/09/07 16:49:02 / 20635244_株式会社みずほフィナンシャルグループ_総会その他(C)
(iii) Cash dividends distributed by MHFG are as follows (non-consolidated basis):
Cash dividends paid during the fiscal year ended March 31, 2020
Resolution Type
CashDividends
(Millions ofyen)
CashDividends
(Thousands ofU.S. dollars)
CashDividendsper Share
(Yen)
CashDividendsper Share
(U.S. dollars)Record
DateEffective
DateMay 15,2019
Common Stock ¥95,197 $874,735 ¥3.75 $0.03 March 31,2019
June 4,2019( The Board of
Directors )November 14,2019
( The Board ofDirectors ) Common Stock ¥95,208 $874,836 ¥3.75 $0.03
September 30,2019
December 6,2019
Total ¥190,405 $1,749,571 / /
(Notes) 1. Cash dividends based on the resolution of the Board of Directors held on May 15, 2019 include ¥70 million ofcash dividends on treasury stock held by BBT trust account.
2. Cash dividends based on the resolution of the Board of Directors held on November 14, 2019 include ¥73 million
of cash dividends on treasury stock held by BBT trust account.
Cash dividends with record dates falling in the fiscal year ended March 31, 2020 and effective dates coming after the end of the fiscal year
Resolution Type
CashDividends
(Millions ofyen)
CashDividends
(Thousands ofU.S. dollars)
Resourceof
Dividends
CashDividendsper Share
(Yen)
CashDividendsper Share
(U.S. dollars)Record
DateEffective
DateMay 15,2020
Common Stock ¥95,208 $874,835 RetainedEarnings ¥3.75 $0.03 March 31,
2020June 8,
2020( The Board ofDirectors )
Total ¥95,208 $874,835 / /
(Note) Cash dividends based on the resolution of the Board of Directors held on May 15, 2020 include ¥73 million of cash
dividends on treasury stock held by BBT trust account.
191
Changes in Net Assets

2020/09/07 16:49:02 / 20635244_株式会社みずほフィナンシャルグループ_総会その他(C)
For the fiscal year ended March 31, 2019
(i) Types and number of issued shares and of treasury stock are as follows:
Thousands of SharesAs of
April 1, 2018Increase during
the fiscal yearDecrease during
the fiscal yearAs of
March 31, 2019 RemarksIssued sharesCommon stock 25,389,644 2,854 — 25,392,498 *1
Total 25,389,644 2,854 — 25,392,498Treasury stockCommon stock 24,829 15,788 6,656 33,962 *2
Total 24,829 15,788 6,656 33,962
*1 Increases are due to exercise of stock acquisition rights (stock options) (2,854 thousand shares).*2 Increases are due to acquisition of treasury stock by BBT trust account (10,676 thousand shares) and repurchase of shares constituting less than one unit
and other factors (5,112 thousand shares). Decreases are due to distribution and sale of treasury stock through BBT trust account (5,078 thousand shares), exercise of stock acquisition rights (stock options) (117 thousand shares), and repurchase of shares constituting less than one unit and other factors (1,460 thousand shares). The number of shares as of March 31, 2019 includes the number of treasury stock held by BBT trust account (18,917 thousand shares).
(ii) Stock acquisition rights and treasury stock acquisition rights are as follows:
Class ofshares tobe issued
ortransferred
uponexercise of
stockacquisition
rights
Number of shares to be issued or transferredupon exercise of stock acquisition rights
(Shares)
Category
Breakdown ofstockacquisitionrights
As ofApril 1,
2018
Increaseduring
the fiscalyear
Decreaseduring
the fiscalyear
As ofMarch
31, 2019
Balance as ofMarch 31,
2019(Millions of
yen) RemarksMHFG Stock
acquisitionrights(Treasurystockacquisitionrights)
— —(—)
—(—)
—(—)
—(—)
¥—(—)
Stockacquisitionrights asstock option
— 707
Consolidatedsubsidiaries (Treasurystock acquisition rights)
— —(—)
Total — ¥707(—)
192
Changes in Net Assets
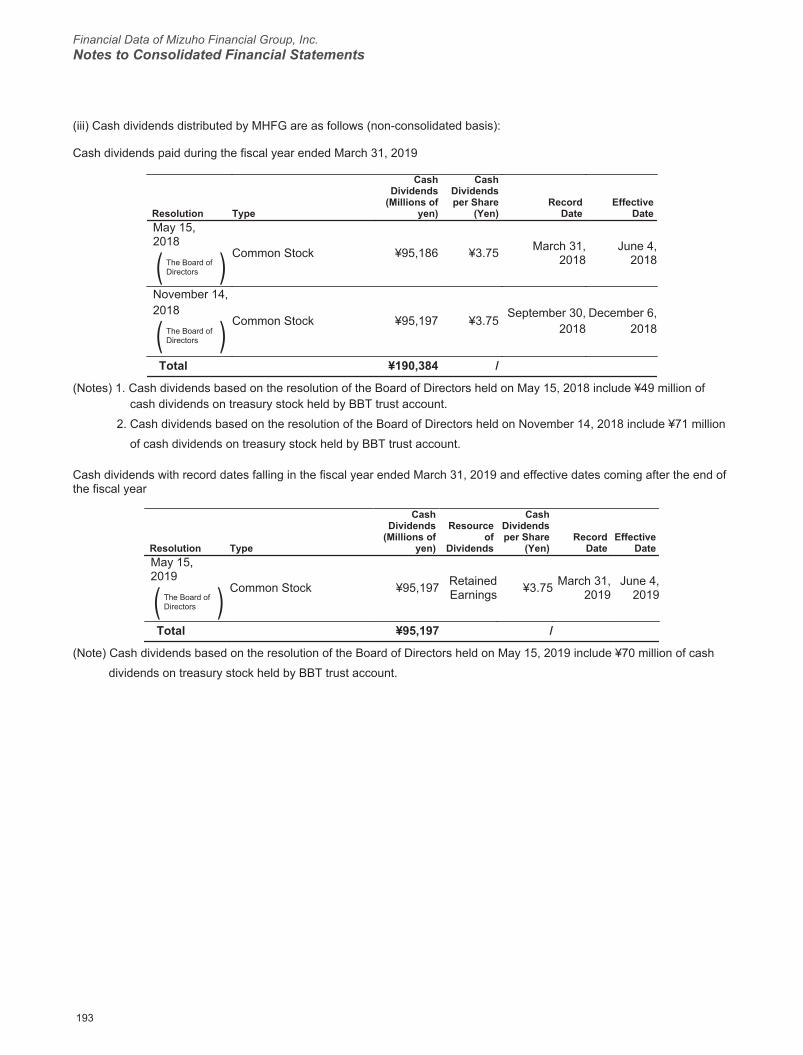
Financial Data of Mizuho Financial Group, Inc.Notes to Consolidated Financial Statements
2020/09/07 16:49:02 / 20635244_株式会社みずほフィナンシャルグループ_総会その他(C)
(iii) Cash dividends distributed by MHFG are as follows (non-consolidated basis):
Cash dividends paid during the fiscal year ended March 31, 2019
Resolution Type
CashDividends
(Millions ofyen)
CashDividendsper Share
(Yen)Record
DateEffective
DateMay 15,2018
Common Stock ¥95,186 ¥3.75 March 31,2018
June 4,2018( The Board of
Directors )November 14,2018
( The Board ofDirectors ) Common Stock ¥95,197 ¥3.75
September 30,2018
December 6,2018
Total ¥190,384 /
(Notes) 1. Cash dividends based on the resolution of the Board of Directors held on May 15, 2018 include ¥49 million ofcash dividends on treasury stock held by BBT trust account.
2. Cash dividends based on the resolution of the Board of Directors held on November 14, 2018 include ¥71 million
of cash dividends on treasury stock held by BBT trust account.
Cash dividends with record dates falling in the fiscal year ended March 31, 2019 and effective dates coming after the end of the fiscal year
Resolution Type
CashDividends
(Millions ofyen)
Resourceof
Dividends
CashDividendsper Share
(Yen)Record
DateEffective
DateMay 15,2019
Common Stock ¥95,197 RetainedEarnings ¥3.75 March 31,
2019June 4,
2019( The Board ofDirectors )
Total ¥95,197 /
(Note) Cash dividends based on the resolution of the Board of Directors held on May 15, 2019 include ¥70 million of cash
dividends on treasury stock held by BBT trust account.
193
Changes in Net Assets
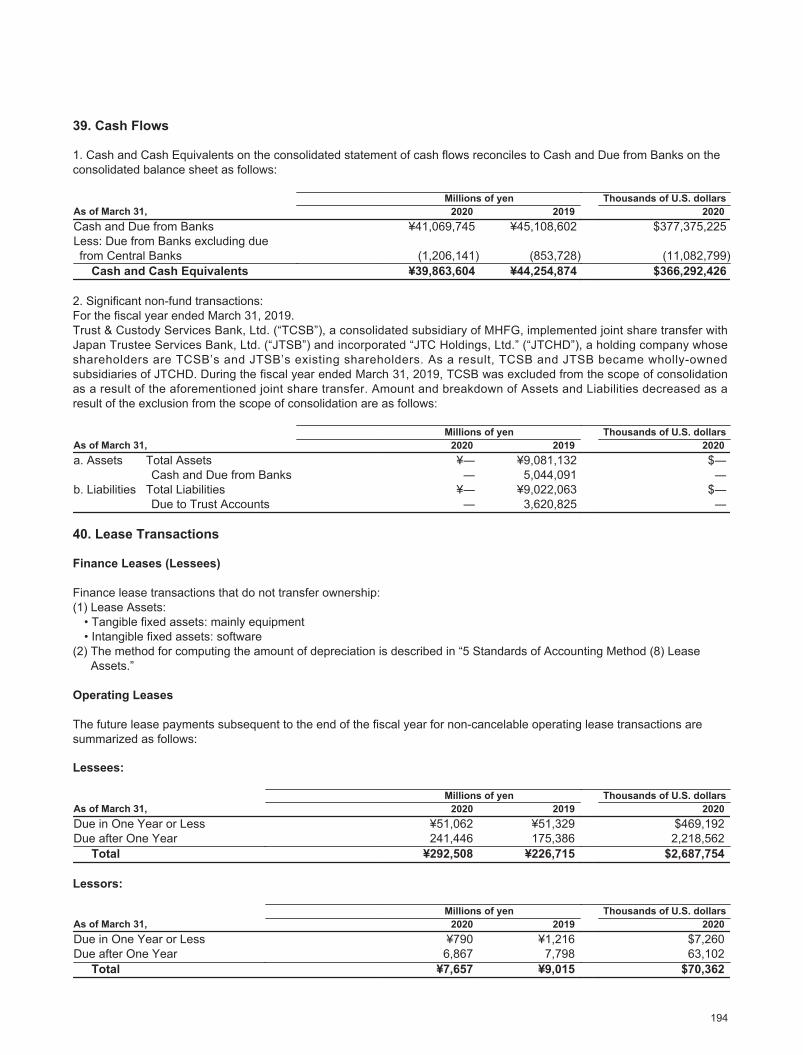
2020/09/07 16:49:02 / 20635244_株式会社みずほフィナンシャルグループ_総会その他(C)
39. Cash Flows
1. Cash and Cash Equivalents on the consolidated statement of cash flows reconciles to Cash and Due from Banks on the consolidated balance sheet as follows:
Millions of yen Thousands of U.S. dollarsAs of March 31, 2020 2019 2020Cash and Due from Banks ¥41,069,745 ¥45,108,602 $377,375,225Less: Due from Banks excluding due from Central Banks (1,206,141) (853,728) (11,082,799)
Cash and Cash Equivalents ¥39,863,604 ¥44,254,874 $366,292,426
2. Significant non-fund transactions:For the fiscal year ended March 31, 2019.Trust & Custody Services Bank, Ltd. (“TCSB”), a consolidated subsidiary of MHFG, implemented joint share transfer with Japan Trustee Services Bank, Ltd. (“JTSB”) and incorporated “JTC Holdings, Ltd.” (“JTCHD”), a holding company whose shareholders are TCSB’s and JTSB’s existing shareholders. As a result, TCSB and JTSB became wholly-owned subsidiaries of JTCHD. During the fiscal year ended March 31, 2019, TCSB was excluded from the scope of consolidation as a result of the aforementioned joint share transfer. Amount and breakdown of Assets and Liabilities decreased as a result of the exclusion from the scope of consolidation are as follows:
Millions of yen Thousands of U.S. dollarsAs of March 31, 2020 2019 2020a. Assets Total Assets
Cash and Due from Banks¥――
¥9,081,1325,044,091
$――
b. Liabilities Total LiabilitiesDue to Trust Accounts
¥――
¥9,022,0633,620,825
$――
40. Lease Transactions
Finance Leases (Lessees)
Finance lease transactions that do not transfer ownership:(1) Lease Assets:
• Tangible fixed assets: mainly equipment• Intangible fixed assets: software
(2) The method for computing the amount of depreciation is described in “5 Standards of Accounting Method (8) Lease Assets.”
Operating Leases
The future lease payments subsequent to the end of the fiscal year for non-cancelable operating lease transactions are summarized as follows:
Lessees:
Millions of yen Thousands of U.S. dollarsAs of March 31, 2020 2019 2020Due in One Year or Less ¥51,062 ¥51,329 $469,192Due after One Year 241,446 175,386 2,218,562
Total ¥292,508 ¥226,715 $2,687,754
Lessors:
Millions of yen Thousands of U.S. dollarsAs of March 31, 2020 2019 2020Due in One Year or Less ¥790 ¥1,216 $7,260Due after One Year 6,867 7,798 63,102
Total ¥7,657 ¥9,015 $70,362
194
Cash Flows、Lease Transactions
Financial Data of Mizuho Financial Group, Inc.Notes to Consolidated Financial Statements
2020/09/07 16:49:02 / 20635244_株式会社みずほフィナンシャルグループ_総会その他(C)
41. Financial Instruments
1. Matters Relating to the Conditions of Financial Instruments
(1) Policy on Financial InstrumentsMizuho Financial Group (MHFG), which primarily engages in banking business, incurs financial liabilities such as customer deposits and market deposits on the funding side while holding financial assets such as customer loans, stocks and bonds on the investment side, and also engages in trading business for certain financial products. Some majority-owned consolidated subsidiaries and other subsidiaries conduct securities business and other financial business.
For above funding and investment business, MHFG appropriately manages risks of each financial instrument and carefully watches term-gaps and other risk factors.
(2) Contents and Risk of Financial ProductsThe main financial assets of the Mizuho group consist of loans to customers, government bonds and stocks. These financial assets are subject to various types of risk that may cause the Group to incur losses due to a decline in, or total loss of, the value of assets, as a result of deterioration in a counterparty’s and/or an issuer’s financial position (“credit risk”), or due to a decline in the value of assets caused by fluctuations in interest rates, stock prices and foreign exchange rates and so on (“market risk”). The Group may also be exposed to the risk of incurring losses when it becomes impossible to execute transactions in the market because of market confusion or losses arising from transactions at prices that are significantly less favorable than usual (“market liquidity risk “).
The main financing source of the Mizuho group is a stable source of deposits from its customers in addition to direct funding from the financial market. These financing sources are subject to the risk of losses (“liquidity risk”) arising from funding difficulties due to market disruption or a deterioration in our financial position that makes it difficult for us to raise the necessary funds or that forces us to raise funds at significantly higher interest rates than usual.
In addition, the Mizuho group uses derivative financial products to control the interest rate risk related to the assets and liabilities of the Group, as part of our asset and liability management (“ALM”). The Group primarily utilizes the portfolio hedge by grouping numerous financial assets and liabilities such as loans and deposits into similar interest risk units in accordance with risk management policies. Some derivative products like interest rate swaps are used as hedging methods for cash-flow hedges or fair value hedges. The Group applies hedge accounting to the majority of these products, treating them as deferred hedges. The effectiveness of the hedges is assessed periodically by regression analysis and other methods to ensure whether the derivative financial products effectively work in order to offset the exposure to changes in fair value and variable cash flows from hedged items. It should be noted that the Mizuho Group uses derivative financial products for trading purposes and so on as well.
(3) Risk Management for Financial Products(a) Commitment to Risk Management
We recognize the conducting of operations tailored to the risks and managing such risks as a key issue relating to overall management. In order to implement our business strategy while maintaining our financial stability, we maintain comprehensive risk management and control measures.
We maintain basic policies for risk management established by our Board of Directors that are applicable to the entire Mizuho group. These policies clearly define the kinds of risks to be managed, set forth the organizational structure and provide for the human resources training necessary for appropriate levels of risk management. The policies also provide for audits to measure the effectiveness and suitability of the risk management structure. In line with these basic policies, we maintain various measures to strengthen and enhance the sophistication of our risk management system.
(b) General Concept of Risk ManagementWe classify our risk exposures according to the various kinds of risk, including credit risk, market risk, liquidity risk and operational risk, and manage each type of risk according to its characteristics.
In addition to managing each type of risk individually, we have established a risk management structure to identify and evaluate overall risk and, where necessary, to devise appropriate responses to keep risk within limits that are managerially acceptable in both qualitative and quantitative terms.
More specifically, we allocate risk capital to core group companies, including their respective subsidiaries, to control risk within the limits set for each company. We also control risk within managerially acceptable limits by
195
Financial Instruments
2020/09/07 16:49:02 / 20635244_株式会社みずほフィナンシャルグループ_総会その他(C)
working to ensure that the overall risk we hold on a consolidated basis does not exceed the Group’s financial strength. To ensure the ongoing financial health of Mizuho Financial Group, we regularly monitor the manner in which risk capital is being used in order to obtain a proper grasp of the risk profile within this framework. Reports are also submitted to the Board of Directors and other committees of each company.
(c) Credit Risk ManagementThe Board of Directors of Mizuho Financial Group determines basic matters pertaining to credit risk management. In addition, we have established the Risk Management Committee, as one of its Business Policy Committees. This committee broadly discusses and coordinates basic policy in connection with credit risk management matters in connection with overall credit portfolio management and credit risk monitoring for the Mizuho group. Under the control of the Chief Risk Officer of Mizuho Financial Group, the Credit Risk Management Department and the Risk Management Department jointly monitor, analyze and submit suggestions concerning credit risk and formulate and execute plans in connection with basic matters pertaining to credit risk management.
We have adopted two different but mutually complementary approaches in credit risk management. The first approach is “credit management,” in which we manage the process for each individual transaction and individual obligor from execution until collection, based on our assessment of the credit quality of the customer. Through this process, we curb losses in the case of a credit event. The second is “credit portfolio management,” in which we utilize statistical methods to assess the potential for losses related to credit risk. Through this process, we identify credit risk and respond appropriately.
We use statistical methods to manage the possibility of losses by measuring the expected average loss for a one-year risk horizon (“expected loss”) and the maximum loss within a certain confidence interval (“credit VAR”). The difference between expected loss and credit VAR is measured as the credit risk amount (“unexpected loss”).Our principal banking subsidiaries have established guidelines to manage “credit concentration risk,” which stems from granting excessive credit to certain corporate groups.
The Board of Directors of each of our principal banking subsidiaries and other core group companies determines key matters pertaining to credit risk management by establishing their respective basic policies in line with the basic policies for credit risk management set forth by Mizuho Financial Group. Their respective Business Policy Committees are responsible for discussing and coordinating overall management of their individual credit portfolios and transaction policies towards obligors.
The Chief Risk Officer of each principal banking subsidiary and core group company is responsible for matters relating to planning and implementing credit risk management. Departments in charge of credit risk management are responsible for planning and administering credit risk management and conducting credit risk measuring and monitoring. Credit Departments determine policies and approves/disapproves individual transactions regarding review and management of and collection from customers in accordance with the lines of authority set forth by each principal banking subsidiary. In addition, each of our principal banking subsidiaries has also established internal audit groups that are independent of the business departments in order to ensure appropriate credit risk management.
(d) Market Risk ManagementThe Board of Directors of Mizuho Financial Group determines basic matters pertaining to market risk management policies. In addition, we have established the Risk Management Committee, as one of its Business Policy Committees. The committee broadly discusses and coordinates matters concerning basic policy and operations in connection with market risk management and market risk monitoring, and proposes measures to be taken in emergencies such as sudden market changes.
The Chief Risk Officer of Mizuho Financial Group is responsible for matters relating to market risk management planning and operations. The Risk Management Department of Mizuho Financial Group is responsible for monitoring market risk, reports and analyses, proposals, setting limits and guidelines, and formulating and implementing plans relating to market risk management. In addition, the department assesses and manages the overall market risk of the Mizuho group as a whole and keeps track of the market risk situation of our principal banking subsidiaries and other core group companies. The department also submits reports to the President & CEO on a daily basis and to our Board of Directors and the executive management committee of Mizuho Financial Group on a regular basis.
To manage market risk, we set limits that correspond to risk capital allocations. The amount of risk capital allocated to market risk corresponds to VAR and additional costs that may arise in order to close relevant positions.
196
Financial Instruments

Financial Data of Mizuho Financial Group, Inc.Notes to Consolidated Financial Statements
2020/09/07 16:49:02 / 20635244_株式会社みずほフィナンシャルグループ_総会その他(C)
For trading and banking activities, we set limits for VAR and for losses. For banking activities, we set position limits based on interest rate sensitivity as needed.
The Board of Directors of each of our principal banking subsidiaries and other core group companies determine key matters pertaining to market risk by establishing their respective basic policies in line with the basic policies for market risk management set forth by Mizuho Financial Group. Based on a common Mizuho Group risk capital allocation framework, the above-mentioned companies manage market risk by setting limits according to the risk capital allocated to market risk by Mizuho Financial Group. They have the same market risk management structure as the Mizuho Financial Group, such as their Business Policy Committees being responsible for overall discussion and coordination of the market risk management.
In addition, they have established middle offices specializing in risk management that are independent of their front offices, which engage in market transactions, and their back offices, which are responsible for book entries and settlements. This system enables them to achieve mutual checks and control over market operations.
When VAR is not adequate to control risk, the middle offices manage risk using additional risk indices such as 10 BPV (Basis Point Value), carry out stress tests and set stop loss limits as needed.
(e) Situation of Market Riski. Banking Business
The following table shows the VAR figures relating to our banking activities for the fiscal years indicated:
Billions of yen Thousands of U.S. dollarsFor the Fiscal Years ended March 31, 2020 2019 2020As of fiscal year end ¥361.4 ¥194.4 $3,320,879Maximum 361.4 298.5 3,320,879Minimum 167.9 194.4 1,543,480Average 215.7 255.5 1,982,448
[Definition of Banking Business]The following transactions are categorized as banking business, with trading business and cross-shareholdingsbeing categorized separately.
(1) Deposits and loans as well as related funding activities, and hedge against interest rate risk.(2) Equity (excluding cross-shareholdings), bonds, investment trusts, etc. and hedges against related market
risk.The core deposit of liquid deposits is to be specified and incorporated into the measurement of market risk.
Banking business VAR used to calculate Market Risk Equivalent is based on the following:• VAR : historical simulation method;• confidence interval: one-tailed 99%;• holding period of one month ; and• historical observation period of three years.
197
Financial Instruments

2020/09/07 16:49:02 / 20635244_株式会社みずほフィナンシャルグループ_総会その他(C)
ii. Trading BusinessThe following table shows VAR figures of our trading activities for the fiscal years indicated :
Billions of yen Thousands of U.S. dollarsFor the Fiscal Years ended March 31, 2020 2019 2020As of fiscal year end ¥8.3 ¥2.6 $76,349Maximum 11.8 9.2 108,900Minimum 2.3 2.4 21,682Average 3.8 3.4 35,103
[Definition of Trading Business](1) Transactions held for the purpose of short-term resale.(2) Transactions held for the purpose of making a profit from price fluctuations over a short period as well as
fixing a profit from arbitrage activities.(3) Deals that have both aspects of (1) and (2) above.(4) Deals held for broking business or market making business.
Trading business VAR used to calculate Market Risk Equivalent is based on the following:• VAR: historical simulation method;• confidence interval: one-tailed 99%;• holding period of one trading day; and• historical observation period of three years.
iii. Cross-shareholdingsFor cross-shareholdings, we take the same market risk management approach as that for Banking and Trading businesses with the use of VAR and risk indices.
The risk index for the cross-shareholdings (sensitivity of the portfolio to a 1% change in the equity index of TOPIX) is ¥13.9 billion ($127,360 thousand) and ¥28.0 billion for the fiscal years ended March 31, 2020 and 2019, respectively.
iv. Risk management using VARVAR is a commonly used market risk management technique with statistical assumptions to measure maximum possible loss in the market, which will be incurred to the holding portfolio in a certain period with some probability.It should be noted that in general VAR model has the following shortcomings:
• VAR estimates could differ by assumptions of holding period, confidence interval level and approaches for the measurement.
• VAR which is calculated based on historical data does not necessarily indicate an accurate future possible maximum loss.
• VAR might underestimate the probability of extreme market movements when the market gets inactive as VAR assumes sales of holding portfolio and hedges in the market during the holding period for the calculation.
• The use of a 99% confidence level neither takes account of, nor makes any statement about, any losses that might occur beyond this confidence level.
The historical simulation method used as the measurement technique of VAR assumes that change in a market movement follows an empirical distribution. Therefore, the model might underestimate the risk under the circumstance that the market is likely to move extremely beyond the assumption. We check the validity of the market risk measurement made by VAR approach periodically by the back-test which compares VAR with actual profit and loss. In addition to VAR, we make a wide variety of management and controls such as risk indices monitoring, implementation of stress tests, loss limit monitoring in order to make strict risk management by capturing carefully all risks, including what VAR approach is not able to cover.
(f) Liquidity Risk ManagementOur liquidity risk management structure is generally the same as the market risk management structure described above (“Item (d) Market Risk Management”). However, the head of the Financial Control & Accounting Group of Mizuho Financial Group is additionally responsible for matters relating to planning and running cash flow management operations, while the Financial Planning Department is responsible for monitoring and adjusting
198
Financial Instruments

Financial Data of Mizuho Financial Group, Inc.Notes to Consolidated Financial Statements
2020/09/07 16:49:02 / 20635244_株式会社みずほフィナンシャルグループ_総会その他(C)
the cash flow management situation and for planning and implementing cash flow management. Reports on the cash flow situation are submitted to the Risk Management Committee, the Balance Sheet Management Committee, the executive management committee and the President & CEO.
We measure liquidity risk using indices pertaining to cash flow, such as limits on funds raised in the market. Limits on liquidity risk are discussed and coordinated by the Risk Management Committee, discussed further by the executive management committee and determined by the President & CEO. We have established classifications for the cash flow conditions affecting the Group, ranging from “normal” to “anxious” and “crisis,” and have established procedures for dealing with cases which are deemed to fall into the “anxious” or “crisis” categories. In addition, we have constructed a system under which we will be able to respond smoothly in the event of emergency situations that affect our funding by establishing action plans.
(4) Supplementary Explanation of Matters Relating to Fair Value of Financial Instruments and OthersFair values of financial instruments include the values based on market prices, and the values deemed as market prices obtained by the reasonable estimate when the financial instruments do not have market prices. Since certain assumptions and others are adopted for calculating such values, they may differ when adopting different assumptions and others.
199
Financial Instruments
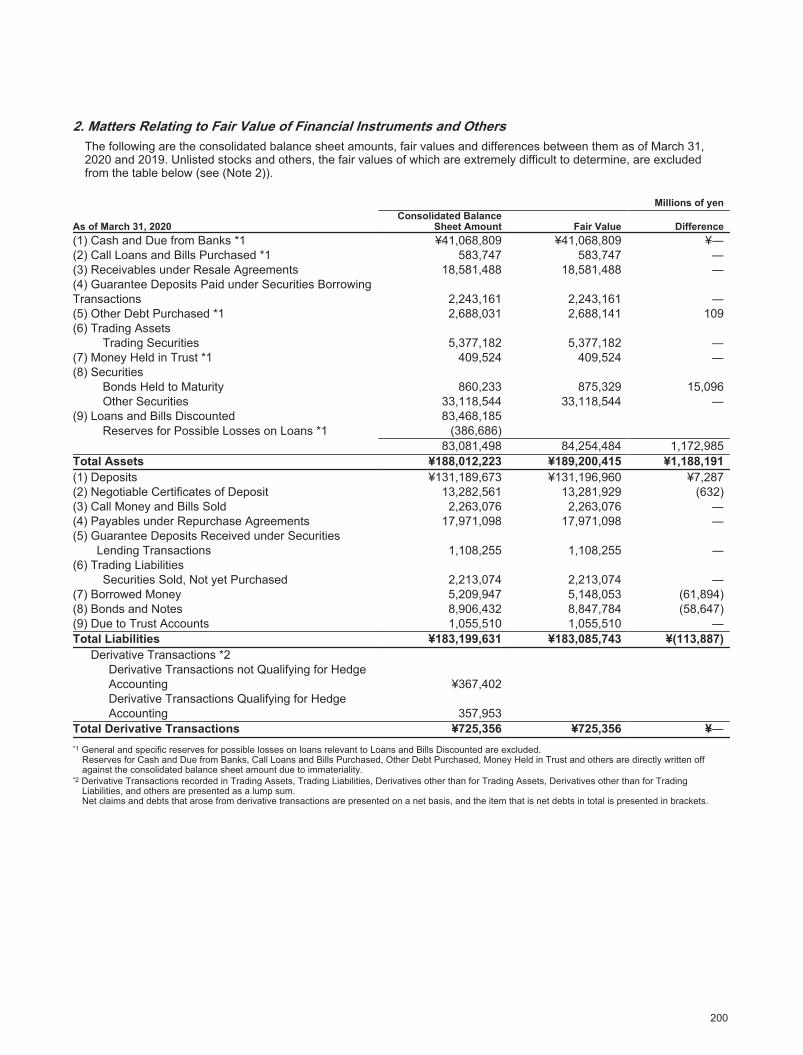
2020/09/07 16:49:02 / 20635244_株式会社みずほフィナンシャルグループ_総会その他(C)
2. Matters Relating to Fair Value of Financial Instruments and OthersThe following are the consolidated balance sheet amounts, fair values and differences between them as of March 31, 2020 and 2019. Unlisted stocks and others, the fair values of which are extremely difficult to determine, are excluded from the table below (see (Note 2)).
Millions of yen
As of March 31, 2020Consolidated Balance
Sheet Amount Fair Value Difference(1) Cash and Due from Banks *1 ¥41,068,809 ¥41,068,809 ¥―(2) Call Loans and Bills Purchased *1 583,747 583,747 ―(3) Receivables under Resale Agreements 18,581,488 18,581,488 ―(4) Guarantee Deposits Paid under Securities BorrowingTransactions 2,243,161 2,243,161 ―(5) Other Debt Purchased *1 2,688,031 2,688,141 109(6) Trading Assets
Trading Securities 5,377,182 5,377,182 ―(7) Money Held in Trust *1 409,524 409,524 ―(8) Securities
Bonds Held to Maturity 860,233 875,329 15,096Other Securities 33,118,544 33,118,544 ―
(9) Loans and Bills Discounted 83,468,185Reserves for Possible Losses on Loans *1 (386,686)
83,081,498 84,254,484 1,172,985Total Assets ¥188,012,223 ¥189,200,415 ¥1,188,191(1) Deposits ¥131,189,673 ¥131,196,960 ¥7,287(2) Negotiable Certificates of Deposit 13,282,561 13,281,929 (632)(3) Call Money and Bills Sold 2,263,076 2,263,076 ―(4) Payables under Repurchase Agreements 17,971,098 17,971,098 ―(5) Guarantee Deposits Received under Securities
Lending Transactions 1,108,255 1,108,255 ―(6) Trading Liabilities
Securities Sold, Not yet Purchased 2,213,074 2,213,074 ―(7) Borrowed Money 5,209,947 5,148,053 (61,894)(8) Bonds and Notes 8,906,432 8,847,784 (58,647)(9) Due to Trust Accounts 1,055,510 1,055,510 ―Total Liabilities ¥183,199,631 ¥183,085,743 ¥(113,887)
Derivative Transactions *2Derivative Transactions not Qualifying for HedgeAccounting ¥367,402Derivative Transactions Qualifying for HedgeAccounting 357,953
Total Derivative Transactions ¥725,356 ¥725,356 ¥―*1 General and specific reserves for possible losses on loans relevant to Loans and Bills Discounted are excluded.
Reserves for Cash and Due from Banks, Call Loans and Bills Purchased, Other Debt Purchased, Money Held in Trust and others are directly written off against the consolidated balance sheet amount due to immateriality.
*2 Derivative Transactions recorded in Trading Assets, Trading Liabilities, Derivatives other than for Trading Assets, Derivatives other than for Trading Liabilities, and others are presented as a lump sum.Net claims and debts that arose from derivative transactions are presented on a net basis, and the item that is net debts in total is presented in brackets.
200
Financial Instruments

Financial Data of Mizuho Financial Group, Inc.Notes to Consolidated Financial Statements
2020/09/07 16:49:02 / 20635244_株式会社みずほフィナンシャルグループ_総会その他(C)
Millions of yen
As of March 31, 2019Consolidated Balance
Sheet Amount Fair Value Difference(1) Cash and Due from Banks *1 ¥45,106,880 ¥45,106,880 ¥―(2) Call Loans and Bills Purchased *1 647,711 647,711 ―(3) Receivables under Resale Agreements 12,997,628 12,997,628 ―(4) Guarantee Deposits Paid under Securities BorrowingTransactions 2,578,133 2,578,133 ―(5) Other Debt Purchased *1 2,828,702 2,828,704 1(6) Trading Assets
Trading Securities 5,968,848 5,968,848 ―(7) Money Held in Trust *1 349,897 349,897 ―(8) Securities
Bonds Held to Maturity 1,602,209 1,609,588 7,378Other Securities 27,532,818 27,532,818 ―
(9) Loans and Bills Discounted 78,456,935Reserves for Possible Losses on Loans *1 (249,276)
78,207,658 79,261,612 1,053,954Total Assets ¥177,820,489 ¥178,881,824 ¥1,061,334(1) Deposits ¥124,311,025 ¥124,307,964 ¥(3,060)(2) Negotiable Certificates of Deposit 13,338,571 13,338,148 (423)(3) Call Money and Bills Sold 2,841,931 2,841,931 ―(4) Payables under Repurchase Agreements 14,640,439 14,640,439 ―(5) Guarantee Deposits Received under Securities
Lending Transactions 1,484,584 1,484,584 ―(6) Trading Liabilities
Securities Sold, Not yet Purchased 2,579,940 2,579,940 ―(7) Borrowed Money 3,061,504 3,054,910 (6,594)(8) Bonds and Notes 8,351,071 8,459,713 108,642(9) Due to Trust Accounts 1,102,073 1,102,073 ―Total Liabilities ¥171,711,141 ¥171,809,706 ¥98,565
Derivative Transactions *2
Derivative Transactions not Qualifying for HedgeAccounting ¥216,790Derivative Transactions Qualifying for HedgeAccounting 224,803
Total Derivative Transactions ¥441,593 ¥441,593 ¥―*1 General and specific reserves for possible losses on loans relevant to Loans and Bills Discounted are excluded.
Reserves for Cash and Due from Banks, Call Loans and Bills Purchased, Other Debt Purchased, Money Held in Trust and others are directly written off against the consolidated balance sheet amount due to immateriality.
*2 Derivative Transactions recorded in Trading Assets, Trading Liabilities, Derivatives other than for Trading Assets, Derivatives other than for Trading Liabilities, and others are presented as a lump sum.Net claims and debts that arose from derivative transactions are presented on a net basis, and the item that is net debts in total is presented in brackets.
201
Financial Instruments
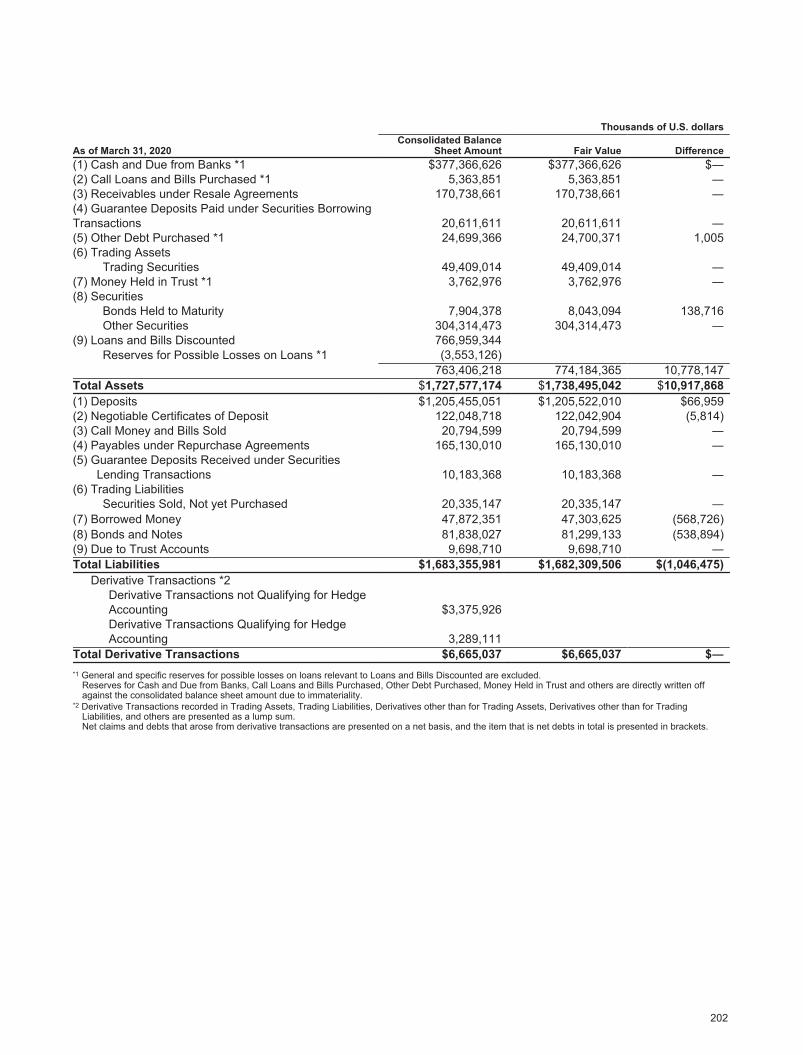
2020/09/07 16:49:02 / 20635244_株式会社みずほフィナンシャルグループ_総会その他(C)
Thousands of U.S. dollars
As of March 31, 2020Consolidated Balance
Sheet Amount Fair Value Difference(1) Cash and Due from Banks *1 $377,366,626 $377,366,626 $―(2) Call Loans and Bills Purchased *1 5,363,851 5,363,851 ―(3) Receivables under Resale Agreements 170,738,661 170,738,661 ―(4) Guarantee Deposits Paid under Securities BorrowingTransactions 20,611,611 20,611,611 ―(5) Other Debt Purchased *1 24,699,366 24,700,371 1,005(6) Trading Assets
Trading Securities 49,409,014 49,409,014 ―(7) Money Held in Trust *1 3,762,976 3,762,976 ―(8) Securities
Bonds Held to Maturity 7,904,378 8,043,094 138,716Other Securities 304,314,473 304,314,473 ―
(9) Loans and Bills Discounted 766,959,344Reserves for Possible Losses on Loans *1 (3,553,126)
763,406,218 774,184,365 10,778,147Total Assets $1,727,577,174 $1,738,495,042 $10,917,868(1) Deposits $1,205,455,051 $1,205,522,010 $66,959(2) Negotiable Certificates of Deposit 122,048,718 122,042,904 (5,814)(3) Call Money and Bills Sold 20,794,599 20,794,599 ―(4) Payables under Repurchase Agreements 165,130,010 165,130,010 ―(5) Guarantee Deposits Received under Securities
Lending Transactions 10,183,368 10,183,368 ―(6) Trading Liabilities
Securities Sold, Not yet Purchased 20,335,147 20,335,147 ―(7) Borrowed Money 47,872,351 47,303,625 (568,726)(8) Bonds and Notes 81,838,027 81,299,133 (538,894)(9) Due to Trust Accounts 9,698,710 9,698,710 ―Total Liabilities $1,683,355,981 $1,682,309,506 $(1,046,475)
Derivative Transactions *2Derivative Transactions not Qualifying for HedgeAccounting $3,375,926Derivative Transactions Qualifying for HedgeAccounting 3,289,111
Total Derivative Transactions $6,665,037 $6,665,037 $―*1 General and specific reserves for possible losses on loans relevant to Loans and Bills Discounted are excluded.
Reserves for Cash and Due from Banks, Call Loans and Bills Purchased, Other Debt Purchased, Money Held in Trust and others are directly written off against the consolidated balance sheet amount due to immateriality.
*2 Derivative Transactions recorded in Trading Assets, Trading Liabilities, Derivatives other than for Trading Assets, Derivatives other than for Trading Liabilities, and others are presented as a lump sum.Net claims and debts that arose from derivative transactions are presented on a net basis, and the item that is net debts in total is presented in brackets.
202
Financial Instruments

Financial Data of Mizuho Financial Group, Inc.Notes to Consolidated Financial Statements
2020/09/07 16:49:02 / 20635244_株式会社みずほフィナンシャルグループ_総会その他(C)
(Note 1) Calculation method of fair value of financial instruments
Assets
(1) Cash and Due from BanksFor Due from Banks which have no maturity, since fair values of these items approximate book values, we deem the book values to be fair values. For Due from Banks which have maturity, since contractual terms of these items are mainly short (i.e., within six months) and fair values of these items approximate book values, we deem the book values to be fair values.
(2) Call Loans and Bills Purchased, (3) Receivables under Resale Agreements and (4) Guarantee Deposits Paid under Securities Borrowing TransactionsSince contractual terms of these items are mainly short (i.e., within six months) and fair values of these items approximate book values, we deem the book values to be fair values.
(5) Other Debt PurchasedFair values of Other Debt Purchased are based on the values deemed as market prices obtained by the reasonable estimate such as those obtained from brokers and financial information vendors.
(6) Trading AssetsFair values of securities held for trading, such as bonds held for trading, are based on the market prices and others.
(7) Money Held in TrustAs to securities managed as trust assets in a directed money trust for separate investment with the management of securities as its primary purpose, fair values of these items are calculated using the method stated in (8). For other Money Held in Trust, since fair values of these items approximate book values, we deem the book values to be fair values.
The notes to Money Held in Trust based on holding purpose are stated in “42.Fair Value of Securities and Money Held in Trust.”
(8) SecuritiesFair values of stocks are based on the prices on securities exchanges, and those of bonds and others are based on the market prices, valuations obtained from brokers and information vendors and others. Fair values of investment trusts are based on the disclosed net asset value and others. Fair values of private placement bonds are calculated by discounting the total amount of principal and interest and others at interest rates based on the discount rate reflecting expected loss and various risk factors by categories according to the internal ratings and terms.
Fair values of securitized products are based on valuations obtained from brokers and others, and reasonably calculated prices based on the reasonable estimates of our management. In deriving reasonably calculated prices based on the reasonable estimates of our management mentioned above, we used the discounted cash flow method.The price decision variables include default rates, recovery rates, pre-payment rates, and discount rates.
Fair values of Floating-rate Japanese Government Bonds, according to our determination that current market prices may not reflect the fair value, are based on the reasonably calculated prices as book value. In deriving the reasonably calculated prices, we used the discount cash flow method as well as other methods. The price decision variables include the yield of 10-year Japanese Government Bonds and the volatilities of interest rate swap options for 10-year Japanese Government Bonds as underlying assets.
The notes to Securities based on holding purpose are stated in “42.Fair Value of Securities and Money Held in Trust.”
(9) Loans and Bills DiscountedFair values of Loans and Bills Discounted are calculated by the total amount of principal and interest and others at interest rates based on the discount rate reflecting expected loss and various risk factors by categories according to the types, internal ratings and terms of the Loans and Bills Discounted. In addition, as to claims against bankrupt obligors, substantially bankrupt obligors and intensive control obligors, since the estimated amount of bad debts is calculated based on the present value of the expected future cash flows or the estimated amounts that we would be able to collect from collateral and guarantees, fair values approximate the amount of Debentures and others minus the amount of
203
Financial Instruments
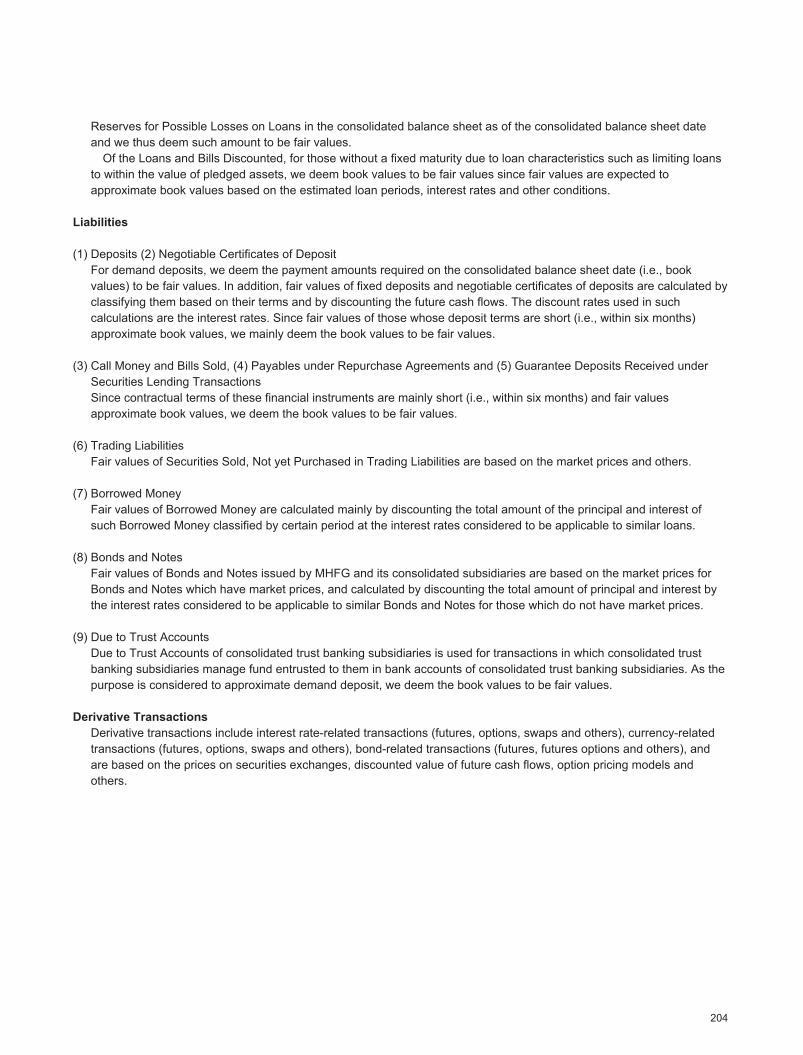
2020/09/07 16:49:02 / 20635244_株式会社みずほフィナンシャルグループ_総会その他(C)
Reserves for Possible Losses on Loans in the consolidated balance sheet as of the consolidated balance sheet date and we thus deem such amount to be fair values.
Of the Loans and Bills Discounted, for those without a fixed maturity due to loan characteristics such as limiting loans to within the value of pledged assets, we deem book values to be fair values since fair values are expected to approximate book values based on the estimated loan periods, interest rates and other conditions.
Liabilities
(1) Deposits (2) Negotiable Certificates of DepositFor demand deposits, we deem the payment amounts required on the consolidated balance sheet date (i.e., book values) to be fair values. In addition, fair values of fixed deposits and negotiable certificates of deposits are calculated by classifying them based on their terms and by discounting the future cash flows. The discount rates used in such calculations are the interest rates. Since fair values of those whose deposit terms are short (i.e., within six months) approximate book values, we mainly deem the book values to be fair values.
(3) Call Money and Bills Sold, (4) Payables under Repurchase Agreements and (5) Guarantee Deposits Received under Securities Lending TransactionsSince contractual terms of these financial instruments are mainly short (i.e., within six months) and fair values approximate book values, we deem the book values to be fair values.
(6) Trading LiabilitiesFair values of Securities Sold, Not yet Purchased in Trading Liabilities are based on the market prices and others.
(7) Borrowed MoneyFair values of Borrowed Money are calculated mainly by discounting the total amount of the principal and interest of such Borrowed Money classified by certain period at the interest rates considered to be applicable to similar loans.
(8) Bonds and NotesFair values of Bonds and Notes issued by MHFG and its consolidated subsidiaries are based on the market prices for Bonds and Notes which have market prices, and calculated by discounting the total amount of principal and interest by the interest rates considered to be applicable to similar Bonds and Notes for those which do not have market prices.
(9) Due to Trust AccountsDue to Trust Accounts of consolidated trust banking subsidiaries is used for transactions in which consolidated trust banking subsidiaries manage fund entrusted to them in bank accounts of consolidated trust banking subsidiaries. As the purpose is considered to approximate demand deposit, we deem the book values to be fair values.
Derivative TransactionsDerivative transactions include interest rate-related transactions (futures, options, swaps and others), currency-related transactions (futures, options, swaps and others), bond-related transactions (futures, futures options and others), and are based on the prices on securities exchanges, discounted value of future cash flows, option pricing models and others.
204
Financial Instruments
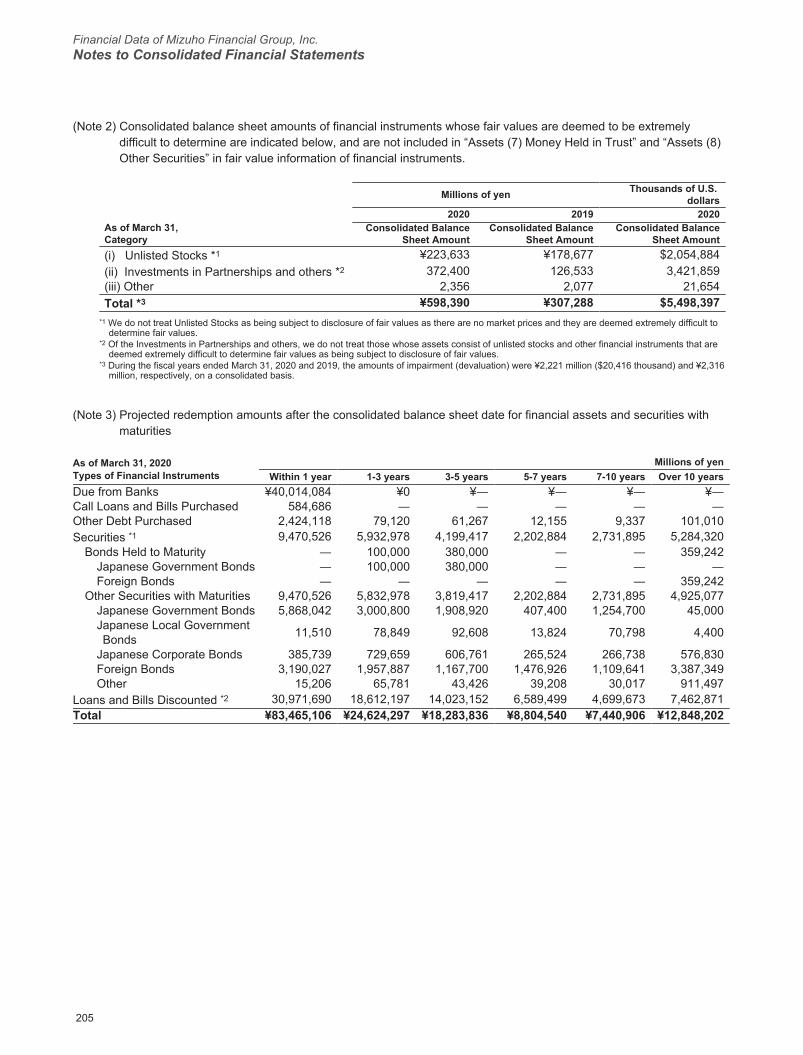
Financial Data of Mizuho Financial Group, Inc.Notes to Consolidated Financial Statements
2020/09/07 16:49:02 / 20635244_株式会社みずほフィナンシャルグループ_総会その他(C)
(Note 2) Consolidated balance sheet amounts of financial instruments whose fair values are deemed to be extremely difficult to determine are indicated below, and are not included in “Assets (7) Money Held in Trust” and “Assets (8) Other Securities” in fair value information of financial instruments.
Millions of yen Thousands of U.S. dollars
2020 2019 2020As of March 31,Category
Consolidated BalanceSheet Amount
Consolidated BalanceSheet Amount
Consolidated BalanceSheet Amount
(i) Unlisted Stocks *1 ¥223,633 ¥178,677 $2,054,884(ii) Investments in Partnerships and others *2 372,400 126,533 3,421,859(iii) Other 2,356 2,077 21,654Total *3 ¥598,390 ¥307,288 $5,498,397
*1 We do not treat Unlisted Stocks as being subject to disclosure of fair values as there are no market prices and they are deemed extremely difficult to determine fair values.
*2 Of the Investments in Partnerships and others, we do not treat those whose assets consist of unlisted stocks and other financial instruments that are deemed extremely difficult to determine fair values as being subject to disclosure of fair values.
*3 During the fiscal years ended March 31, 2020 and 2019, the amounts of impairment (devaluation) were ¥2,221 million ($20,416 thousand) and ¥2,316 million, respectively, on a consolidated basis.
(Note 3) Projected redemption amounts after the consolidated balance sheet date for financial assets and securities with maturities
As of March 31, 2020Types of Financial Instruments
Millions of yenWithin 1 year 1-3 years 3-5 years 5-7 years 7-10 years Over 10 years
Due from Banks ¥40,014,084 ¥0 ¥― ¥― ¥― ¥―Call Loans and Bills Purchased 584,686 ― ― ― ― ―Other Debt Purchased 2,424,118 79,120 61,267 12,155 9,337 101,010Securities *1 9,470,526 5,932,978 4,199,417 2,202,884 2,731,895 5,284,320
Bonds Held to Maturity ― 100,000 380,000 ― ― 359,242Japanese Government Bonds ― 100,000 380,000 ― ― ―Foreign Bonds ― ― ― ― ― 359,242
Other Securities with Maturities 9,470,526 5,832,978 3,819,417 2,202,884 2,731,895 4,925,077Japanese Government Bonds 5,868,042 3,000,800 1,908,920 407,400 1,254,700 45,000Japanese Local Government Bonds 11,510 78,849 92,608 13,824 70,798 4,400
Japanese Corporate Bonds 385,739 729,659 606,761 265,524 266,738 576,830Foreign Bonds 3,190,027 1,957,887 1,167,700 1,476,926 1,109,641 3,387,349Other 15,206 65,781 43,426 39,208 30,017 911,497
Loans and Bills Discounted *2 30,971,690 18,612,197 14,023,152 6,589,499 4,699,673 7,462,871Total ¥83,465,106 ¥24,624,297 ¥18,283,836 ¥8,804,540 ¥7,440,906 ¥12,848,202
205
Financial Instruments
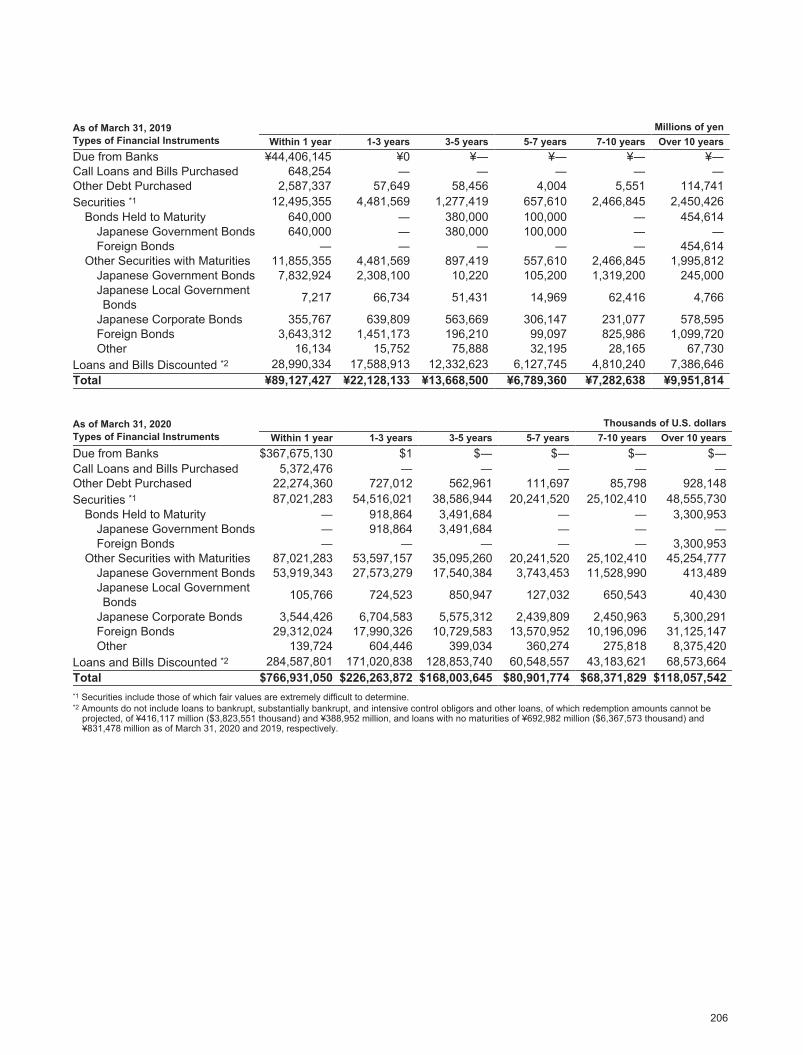
2020/09/07 16:49:02 / 20635244_株式会社みずほフィナンシャルグループ_総会その他(C)
As of March 31, 2019Types of Financial Instruments
Millions of yenWithin 1 year 1-3 years 3-5 years 5-7 years 7-10 years Over 10 years
Due from Banks ¥44,406,145 ¥0 ¥― ¥― ¥― ¥―Call Loans and Bills Purchased 648,254 ― ― ― ― ―Other Debt Purchased 2,587,337 57,649 58,456 4,004 5,551 114,741Securities *1 12,495,355 4,481,569 1,277,419 657,610 2,466,845 2,450,426
Bonds Held to Maturity 640,000 ― 380,000 100,000 ― 454,614Japanese Government Bonds 640,000 ― 380,000 100,000 ― ―Foreign Bonds ― ― ― ― ― 454,614
Other Securities with Maturities 11,855,355 4,481,569 897,419 557,610 2,466,845 1,995,812Japanese Government Bonds 7,832,924 2,308,100 10,220 105,200 1,319,200 245,000Japanese Local Government Bonds 7,217 66,734 51,431 14,969 62,416 4,766
Japanese Corporate Bonds 355,767 639,809 563,669 306,147 231,077 578,595Foreign Bonds 3,643,312 1,451,173 196,210 99,097 825,986 1,099,720Other 16,134 15,752 75,888 32,195 28,165 67,730
Loans and Bills Discounted *2 28,990,334 17,588,913 12,332,623 6,127,745 4,810,240 7,386,646Total ¥89,127,427 ¥22,128,133 ¥13,668,500 ¥6,789,360 ¥7,282,638 ¥9,951,814
As of March 31, 2020Types of Financial Instruments
Thousands of U.S. dollarsWithin 1 year 1-3 years 3-5 years 5-7 years 7-10 years Over 10 years
Due from Banks $367,675,130 $1 $― $― $― $―Call Loans and Bills Purchased 5,372,476 ― ― ― ― ―Other Debt Purchased 22,274,360 727,012 562,961 111,697 85,798 928,148Securities *1 87,021,283 54,516,021 38,586,944 20,241,520 25,102,410 48,555,730
Bonds Held to Maturity ― 918,864 3,491,684 ― ― 3,300,953Japanese Government Bonds ― 918,864 3,491,684 ― ― ―Foreign Bonds ― ― ― ― ― 3,300,953
Other Securities with Maturities 87,021,283 53,597,157 35,095,260 20,241,520 25,102,410 45,254,777Japanese Government Bonds 53,919,343 27,573,279 17,540,384 3,743,453 11,528,990 413,489Japanese Local Government Bonds 105,766 724,523 850,947 127,032 650,543 40,430
Japanese Corporate Bonds 3,544,426 6,704,583 5,575,312 2,439,809 2,450,963 5,300,291Foreign Bonds 29,312,024 17,990,326 10,729,583 13,570,952 10,196,096 31,125,147Other 139,724 604,446 399,034 360,274 275,818 8,375,420
Loans and Bills Discounted *2 284,587,801 171,020,838 128,853,740 60,548,557 43,183,621 68,573,664Total $766,931,050 $226,263,872 $168,003,645 $80,901,774 $68,371,829 $118,057,542*1 Securities include those of which fair values are extremely difficult to determine.*2 Amounts do not include loans to bankrupt, substantially bankrupt, and intensive control obligors and other loans, of which redemption amounts cannot be
projected, of ¥416,117 million ($3,823,551 thousand) and ¥388,952 million, and loans with no maturities of ¥692,982 million ($6,367,573 thousand) and ¥831,478 million as of March 31, 2020 and 2019, respectively.
206
Financial Instruments
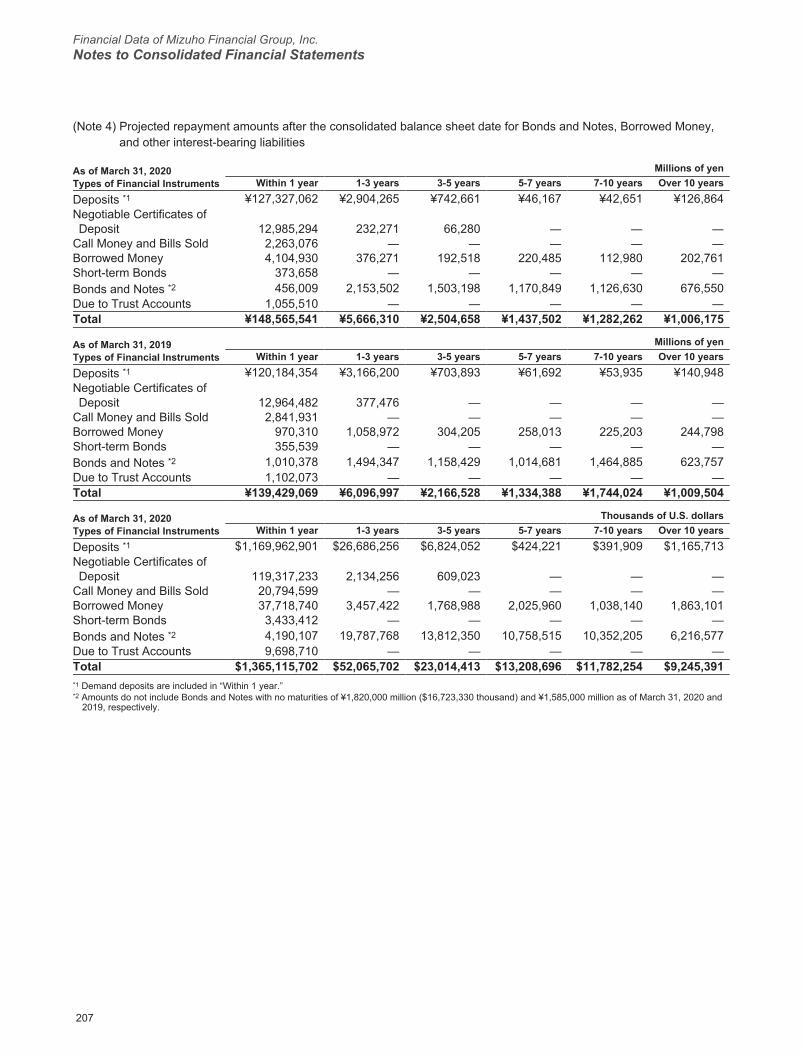
Financial Data of Mizuho Financial Group, Inc.Notes to Consolidated Financial Statements
2020/09/07 16:49:02 / 20635244_株式会社みずほフィナンシャルグループ_総会その他(C)
(Note 4) Projected repayment amounts after the consolidated balance sheet date for Bonds and Notes, Borrowed Money, and other interest-bearing liabilities
As of March 31, 2020Types of Financial Instruments
Millions of yenWithin 1 year 1-3 years 3-5 years 5-7 years 7-10 years Over 10 years
Deposits *1 ¥127,327,062 ¥2,904,265 ¥742,661 ¥46,167 ¥42,651 ¥126,864Negotiable Certificates of Deposit 12,985,294 232,271 66,280 ― ― ―
Call Money and Bills Sold 2,263,076 ― ― ― ― ―Borrowed Money 4,104,930 376,271 192,518 220,485 112,980 202,761Short-term Bonds 373,658 ― ― ― ― ―Bonds and Notes *2 456,009 2,153,502 1,503,198 1,170,849 1,126,630 676,550Due to Trust Accounts 1,055,510 ― ― ― ― ―Total ¥148,565,541 ¥5,666,310 ¥2,504,658 ¥1,437,502 ¥1,282,262 ¥1,006,175
As of March 31, 2019Types of Financial Instruments
Millions of yenWithin 1 year 1-3 years 3-5 years 5-7 years 7-10 years Over 10 years
Deposits *1 ¥120,184,354 ¥3,166,200 ¥703,893 ¥61,692 ¥53,935 ¥140,948Negotiable Certificates of Deposit 12,964,482 377,476 — — — —
Call Money and Bills Sold 2,841,931 — — — — —Borrowed Money 970,310 1,058,972 304,205 258,013 225,203 244,798Short-term Bonds 355,539 — — — — —Bonds and Notes *2 1,010,378 1,494,347 1,158,429 1,014,681 1,464,885 623,757Due to Trust Accounts 1,102,073 — — — — —Total ¥139,429,069 ¥6,096,997 ¥2,166,528 ¥1,334,388 ¥1,744,024 ¥1,009,504
As of March 31, 2020Types of Financial Instruments
Thousands of U.S. dollarsWithin 1 year 1-3 years 3-5 years 5-7 years 7-10 years Over 10 years
Deposits *1 $1,169,962,901 $26,686,256 $6,824,052 $424,221 $391,909 $1,165,713Negotiable Certificates of Deposit 119,317,233 2,134,256 609,023 — — —
Call Money and Bills Sold 20,794,599 — — — — —Borrowed Money 37,718,740 3,457,422 1,768,988 2,025,960 1,038,140 1,863,101Short-term Bonds 3,433,412 — — — — —Bonds and Notes *2 4,190,107 19,787,768 13,812,350 10,758,515 10,352,205 6,216,577Due to Trust Accounts 9,698,710 — — — — —Total $1,365,115,702 $52,065,702 $23,014,413 $13,208,696 $11,782,254 $9,245,391*1 Demand deposits are included in “Within 1 year.”*2 Amounts do not include Bonds and Notes with no maturities of ¥1,820,000 million ($16,723,330 thousand) and ¥1,585,000 million as of March 31, 2020 and
2019, respectively.
207
Financial Instruments
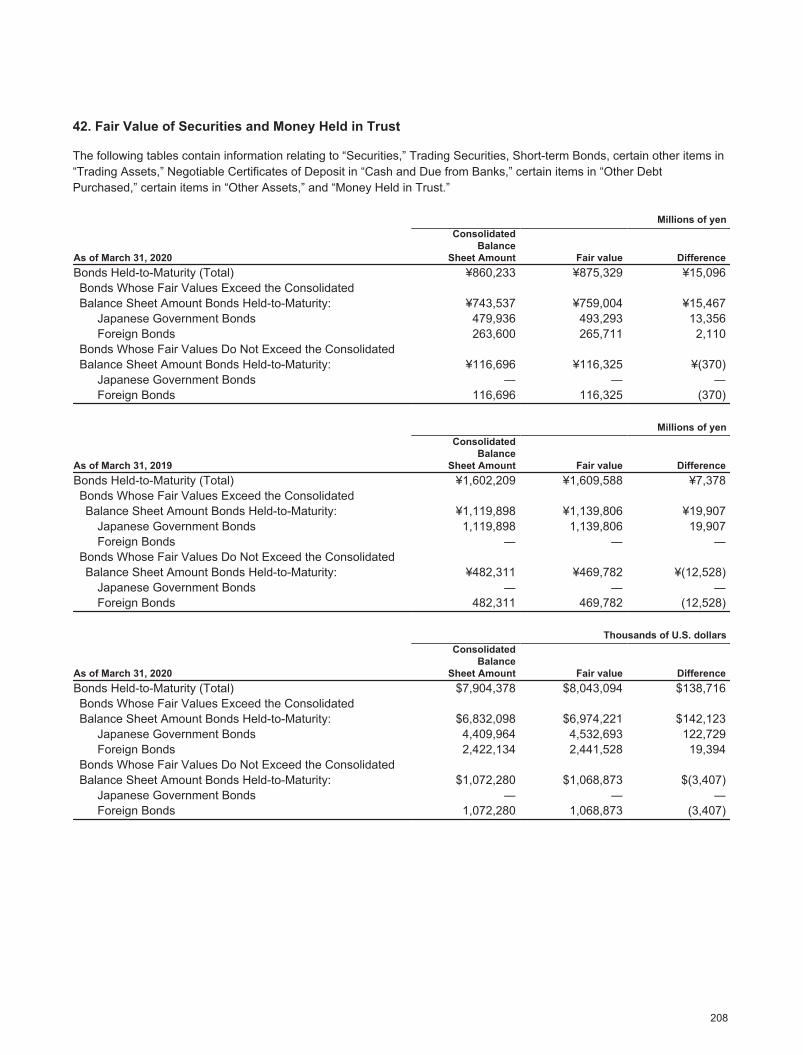
2020/09/07 16:49:02 / 20635244_株式会社みずほフィナンシャルグループ_総会その他(C)
42. Fair Value of Securities and Money Held in Trust
The following tables contain information relating to “Securities,” Trading Securities, Short-term Bonds, certain other items in “Trading Assets,” Negotiable Certificates of Deposit in “Cash and Due from Banks,” certain items in “Other DebtPurchased,” certain items in “Other Assets,” and “Money Held in Trust.”
Millions of yen
As of March 31, 2020
ConsolidatedBalance
Sheet Amount Fair value DifferenceBonds Held-to-Maturity (Total) ¥860,233 ¥875,329 ¥15,096Bonds Whose Fair Values Exceed the ConsolidatedBalance Sheet Amount Bonds Held-to-Maturity: ¥743,537 ¥759,004 ¥15,467
Japanese Government Bonds 479,936 493,293 13,356Foreign Bonds 263,600 265,711 2,110
Bonds Whose Fair Values Do Not Exceed the ConsolidatedBalance Sheet Amount Bonds Held-to-Maturity: ¥116,696 ¥116,325 ¥(370)
Japanese Government Bonds ― ― ―Foreign Bonds 116,696 116,325 (370)
Millions of yen
As of March 31, 2019
ConsolidatedBalance
Sheet Amount Fair value DifferenceBonds Held-to-Maturity (Total) ¥1,602,209 ¥1,609,588 ¥7,378Bonds Whose Fair Values Exceed the ConsolidatedBalance Sheet Amount Bonds Held-to-Maturity: ¥1,119,898 ¥1,139,806 ¥19,907
Japanese Government Bonds 1,119,898 1,139,806 19,907Foreign Bonds ― ― ―
Bonds Whose Fair Values Do Not Exceed the ConsolidatedBalance Sheet Amount Bonds Held-to-Maturity: ¥482,311 ¥469,782 ¥(12,528)
Japanese Government Bonds ― ― ―Foreign Bonds 482,311 469,782 (12,528)
Thousands of U.S. dollars
As of March 31, 2020
ConsolidatedBalance
Sheet Amount Fair value DifferenceBonds Held-to-Maturity (Total) $7,904,378 $8,043,094 $138,716Bonds Whose Fair Values Exceed the ConsolidatedBalance Sheet Amount Bonds Held-to-Maturity: $6,832,098 $6,974,221 $142,123
Japanese Government Bonds 4,409,964 4,532,693 122,729Foreign Bonds 2,422,134 2,441,528 19,394
Bonds Whose Fair Values Do Not Exceed the ConsolidatedBalance Sheet Amount Bonds Held-to-Maturity: $1,072,280 $1,068,873 $(3,407)
Japanese Government Bonds ― ― ―Foreign Bonds 1,072,280 1,068,873 (3,407)
208
Fair Value of Securities and Money Held in Trust
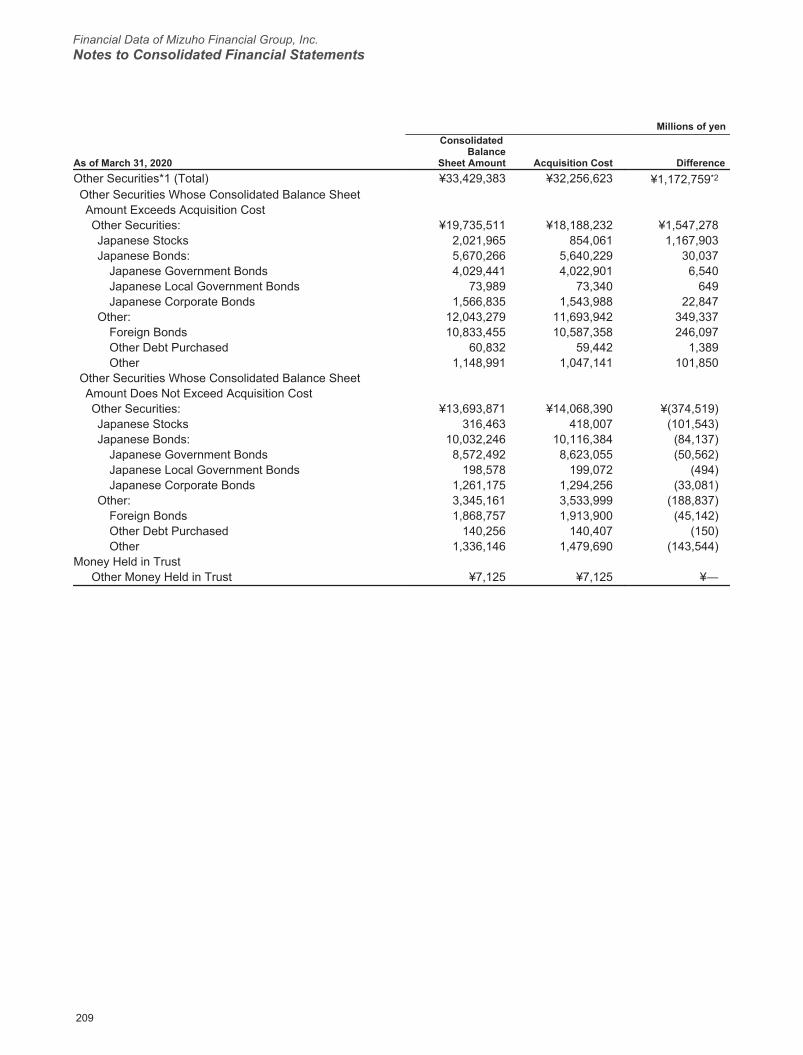
Financial Data of Mizuho Financial Group, Inc.Notes to Consolidated Financial Statements
2020/09/07 16:49:02 / 20635244_株式会社みずほフィナンシャルグループ_総会その他(C)
Millions of yen
As of March 31, 2020
Consolidated Balance
Sheet Amount Acquisition Cost DifferenceOther Securities*1 (Total) ¥33,429,383 ¥32,256,623 ¥1,172,759*2
Other Securities Whose Consolidated Balance SheetAmount Exceeds Acquisition CostOther Securities: ¥19,735,511 ¥18,188,232 ¥1,547,278Japanese Stocks 2,021,965 854,061 1,167,903Japanese Bonds: 5,670,266 5,640,229 30,037
Japanese Government Bonds 4,029,441 4,022,901 6,540Japanese Local Government Bonds 73,989 73,340 649Japanese Corporate Bonds 1,566,835 1,543,988 22,847
Other: 12,043,279 11,693,942 349,337Foreign Bonds 10,833,455 10,587,358 246,097Other Debt Purchased 60,832 59,442 1,389Other 1,148,991 1,047,141 101,850
Other Securities Whose Consolidated Balance SheetAmount Does Not Exceed Acquisition CostOther Securities: ¥13,693,871 ¥14,068,390 ¥(374,519)Japanese Stocks 316,463 418,007 (101,543)Japanese Bonds: 10,032,246 10,116,384 (84,137)
Japanese Government Bonds 8,572,492 8,623,055 (50,562)Japanese Local Government Bonds 198,578 199,072 (494)Japanese Corporate Bonds 1,261,175 1,294,256 (33,081)
Other: 3,345,161 3,533,999 (188,837)Foreign Bonds 1,868,757 1,913,900 (45,142)Other Debt Purchased 140,256 140,407 (150)Other 1,336,146 1,479,690 (143,544)
Money Held in TrustOther Money Held in Trust ¥7,125 ¥7,125 ¥―
209
Fair Value of Securities and Money Held in Trust
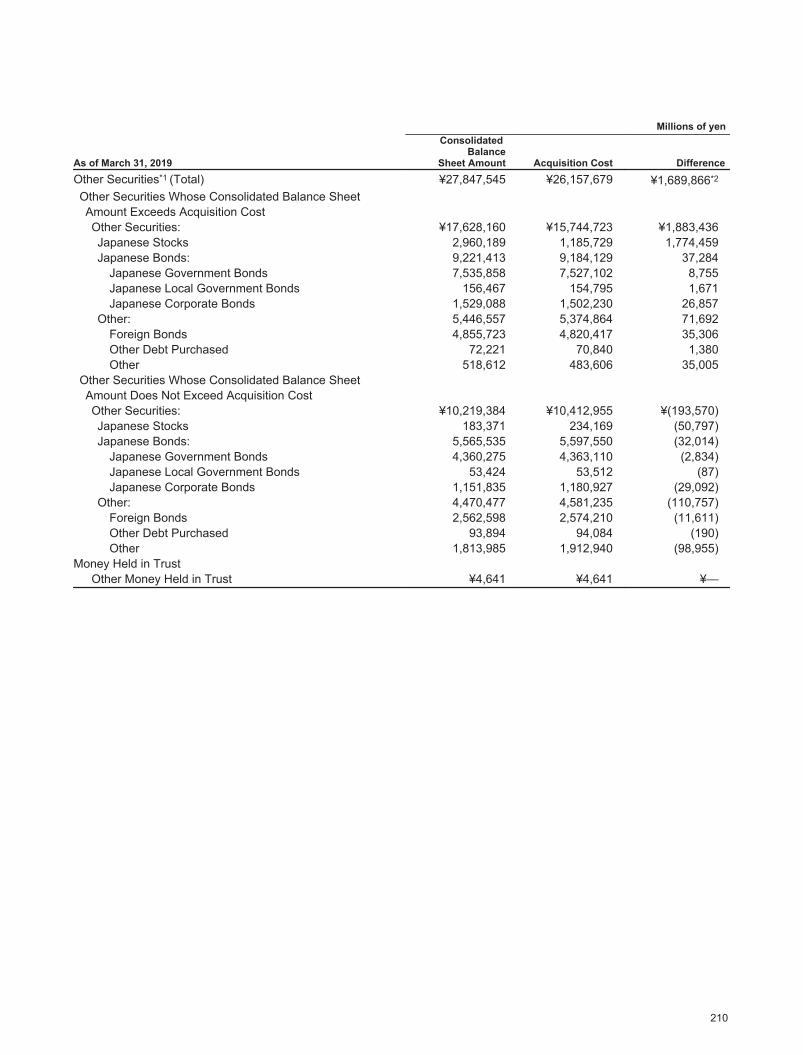
2020/09/07 16:49:02 / 20635244_株式会社みずほフィナンシャルグループ_総会その他(C)
Millions of yen
As of March 31, 2019
Consolidated Balance
Sheet Amount Acquisition Cost DifferenceOther Securities*1 (Total) ¥27,847,545 ¥26,157,679 ¥1,689,866*2
Other Securities Whose Consolidated Balance SheetAmount Exceeds Acquisition CostOther Securities: ¥17,628,160 ¥15,744,723 ¥1,883,436Japanese Stocks 2,960,189 1,185,729 1,774,459Japanese Bonds: 9,221,413 9,184,129 37,284
Japanese Government Bonds 7,535,858 7,527,102 8,755Japanese Local Government Bonds 156,467 154,795 1,671Japanese Corporate Bonds 1,529,088 1,502,230 26,857
Other: 5,446,557 5,374,864 71,692Foreign Bonds 4,855,723 4,820,417 35,306Other Debt Purchased 72,221 70,840 1,380Other 518,612 483,606 35,005
Other Securities Whose Consolidated Balance SheetAmount Does Not Exceed Acquisition CostOther Securities: ¥10,219,384 ¥10,412,955 ¥(193,570)Japanese Stocks 183,371 234,169 (50,797)Japanese Bonds: 5,565,535 5,597,550 (32,014)
Japanese Government Bonds 4,360,275 4,363,110 (2,834)Japanese Local Government Bonds 53,424 53,512 (87)Japanese Corporate Bonds 1,151,835 1,180,927 (29,092)
Other: 4,470,477 4,581,235 (110,757)Foreign Bonds 2,562,598 2,574,210 (11,611)Other Debt Purchased 93,894 94,084 (190)Other 1,813,985 1,912,940 (98,955)
Money Held in TrustOther Money Held in Trust ¥4,641 ¥4,641 ¥—
210
Fair Value of Securities and Money Held in Trust

Financial Data of Mizuho Financial Group, Inc.Notes to Consolidated Financial Statements
2020/09/07 16:49:02 / 20635244_株式会社みずほフィナンシャルグループ_総会その他(C)
Thousands of U.S. dollars
As of March 31, 2020
Consolidated Balance
Sheet Amount Acquisition Cost DifferenceOther Securities*1 (Total) $307,170,663 $296,394,596 $10,776,067*2
Other Securities Whose Consolidated Balance SheetAmount Exceeds Acquisition CostOther Securities: $181,342,566 $167,125,176 $14,217,390Japanese Stocks 18,579,117 7,847,667 10,731,450Japanese Bonds: 52,102,054 51,826,051 276,003
Japanese Government Bonds 37,025,103 36,965,001 60,102Japanese Local Government Bonds 679,859 673,895 5,964Japanese Corporate Bonds 14,397,092 14,187,155 209,937
Other: 110,661,395 107,451,458 3,209,937Foreign Bonds 99,544,754 97,283,454 2,261,300Other Debt Purchased 558,970 546,198 12,772Other 10,557,671 9,621,806 935,865
Other Securities Whose Consolidated Balance SheetAmount Does Not Exceed Acquisition CostOther Securities: $125,828,097 $129,269,420 $(3,441,323)Japanese Stocks 2,907,873 3,840,921 (933,048)Japanese Bonds: 92,182,729 92,955,842 (773,113)
Japanese Government Bonds 78,769,574 79,234,175 (464,601)Japanese Local Government Bonds 1,824,665 1,829,205 (4,540)Japanese Corporate Bonds 11,588,490 11,892,462 (303,972)
Other: 30,737,495 32,472,657 (1,735,162)Foreign Bonds 17,171,349 17,586,151 (414,802)Other Debt Purchased 1,288,771 1,290,154 (1,383)Other 12,277,375 13,596,352 (1,318,977)
Money Held in TrustOther Money Held in Trust $65,478 $65,478 $―
*1 The fair value of Japanese stocks is determined based on the average quoted market price over the month preceding the consolidated balance sheet date.The fair value of securities other than Japanese stocks is determined at the quoted market price if available, or other reasonable value at the consolidated balance sheet date.
*2 Unrealized Gains (Losses) or Difference include gains (losses) of ¥(5,191) million ($(47,699) thousand) and ¥38,000 million which were recognized in the statements of income for the fiscal years ended March 31, 2020 and 2019, respectively, by applying the fair-value hedge method.
Note: A summary of Trading Securities and Money Held in Trust for investment purposes and related unrealized gains and losses recognized in the statement of income are as follows: *
Millions of yen Thousands of U.S. dollars2020 2019 2020
As of March 31,Unrealized
gains (losses)Unrealized
gains (losses)Unrealized
gains (losses)Trading Securities ¥(16,818) ¥15,812 $(154,543)
Millions of yen Thousands of U.S. dollars2020 2019 2020
As of March 31, Fair valueUnrealized
gains (losses) Fair valueUnrealized
gains (losses) Fair valueUnrealized
gains (losses)Money Held in Trust forInvestment ¥404,721 ¥(2,031) ¥347,247 ¥(175) $3,718,845 $(18,671)
* Fair values of trading securities as of March 31, 2020 and 2019 are described in “41. Financial Instruments.”
211
Fair Value of Securities and Money Held in Trust

2020/09/07 16:49:02 / 20635244_株式会社みずほフィナンシャルグループ_総会その他(C)
Other Securities Sold during the Fiscal Year
Millions of yen Thousands of U.S. dollars
For the Fiscal Year ended March 31,2020
Proceedsfrom sales
Total amountof gainson sales
Total amountof losseson sales
Proceedsfrom sales
Total amountof gainson sales
Total amountof losseson sales
Stocks ¥306,902 ¥189,638 ¥47,389 $2,820,013 $1,742,522 $435,442Bonds 21,039,917 40,971 11,757 193,328,287 376,469 108,036Japanese Government Bonds 20,354,622 38,972 11,754 187,031,361 358,104 108,012Japanese LocalGovernment Bonds 51,191 747 - 470,377 6,872 -
Japanese Corporate Bonds 634,103 1,250 2 5,826,549 11,493 24Other 27,028,303 237,333 112,126 248,353,431 2,180,776 1,030,293Total ¥48,375,123 ¥467,943 ¥171,273 $444,501,731 $4,299,767 $1,573,771
Millions of yen
For the Fiscal Year ended March 31,2019
Proceedsfrom sales
Total amountof gainson sales
Total amountof losseson sales
Stocks ¥398,587 ¥217,587 ¥25,532Bonds 19,662,280 24,420 14,558Japanese Government Bonds 18,749,068 20,981 14,287Japanese LocalGovernment Bonds 108,741 1,747 7
Japanese Corporate Bonds 804,470 1,691 264Other 18,208,373 208,878 176,851Total ¥38,269,240 ¥450,886 ¥216,942
Note: The above table contains Other Securities that are deemed extremely difficult to determine fair values.
Unrealized Gains/Losses on Other Securities
Unrealized Gains/Losses on Other Securities as of March 31, 2020 and 2019 are as follows:
Millions of yenThousands of
U.S. dollarsAs of March 31, 2020 2019 2020Difference between Acquisition Cost and Fair Value*1 ¥1,177,927 ¥1,651,704 $10,823,556Other Securities*2 1,177,927 1,651,704 10,823,556
Deferred Tax Liabilities (338,232) (452,032) (3,107,893)Difference between Acquisition Cost and Fair Value, net of Taxes 839,695 1,199,672 7,715,663Amount Corresponding to Non-controlling Interests 18,922 16,592 173,868Amount Corresponding to Net Unrealized Gains (Losses) on Other Securities Owned by Affiliated Companies, which is 2,311 3,322 21,241 attributable to MHFGNet Unrealized Gains (Losses) on Other Securities ¥823,085 ¥1,186,401 $7,563,036*1 The difference between acquisition cost and fair value excludes ¥5,191 million ($47,699 thousand) and ¥(38,000) million which were recognized in the
statements of income for the fiscal years ended March 31, 2020 and 2019, respectively, by applying the fair-value hedge method.*2 Other Securities includes translation differences regarding securities which do not have readily determinable fair value.
212
Fair Value of Securities and Money Held in Trust

Financial Data of Mizuho Financial Group, Inc.Notes to Consolidated Financial Statements
2020/09/07 16:49:02 / 20635244_株式会社みずほフィナンシャルグループ_総会その他(C)
43. Derivatives Information
The fair value of derivatives not qualifying for hedge accounting and derivatives qualifying for hedge accounting as of March 31, 2020 and 2019 is shown in the tables below. In the following tables:
(i) Contract value represents notional amounts for swap transactions and contract amounts for other transactions.Contract value amounts do not indicate the market risk related to derivative transactions.
(ii) Fair values of listed contracts are based on the closing prices of the Osaka Exchange, the Tokyo Financial Exchange, the New York Mercantile Exchange and others. Fair values of over-the-counter contracts and inter-company or internal transactions are based on the discounted value of future cash flows, option pricing models and others.
(1) Derivative Transactions not Qualifying for Hedge AccountingTransactions are marked to market, and changes in unrealized gains (losses) are included in the consolidated statement of income.
(a) Interest Rate-Related Transactions
Millions of yen
As of March 31, 2020Contract value
Fair valueUnrealized
gains (losses)Total Over one yearListed:
Futures:Sold ¥5,529,634 ¥1,591,823 ¥(31,113) ¥(31,113)Bought 5,887,309 2,471,820 35,315 35,315
Options:Sold 419,803 40,353 (1,901) (767)Bought 757,178 29,771 2,961 1,352
Over-the-Counter:FRAs:
Sold 43,095,911 108,830 (27,342) (27,342)Bought 39,476,804 108,830 29,903 29,903
Swaps:Receive Fixed / Pay Float 444,709,861 336,523,057 (9,755,139) (9,755,139)Receive Float / Pay Fixed 431,142,776 326,305,878 10,260,575 10,260,575Receive Float / Pay Float 121,038,451 95,223,531 46,160 46,160Receive Fixed / Pay Fixed 329,536 313,093 (1,072) (1,072)
Options:Sold 13,056,382 7,542,710 (255,511) (255,511)Bought 12,156,026 7,821,714 192,734 192,734
Inter-company or Internal Transactions:Swaps:
Receive Fixed / Pay Float 4,718,469 4,347,933 131,693 131,693Receive Float / Pay Fixed 13,413,792 12,916,374 (273,174) (273,174)Total / / ¥354,090 ¥353,615
213
Derivatives Information
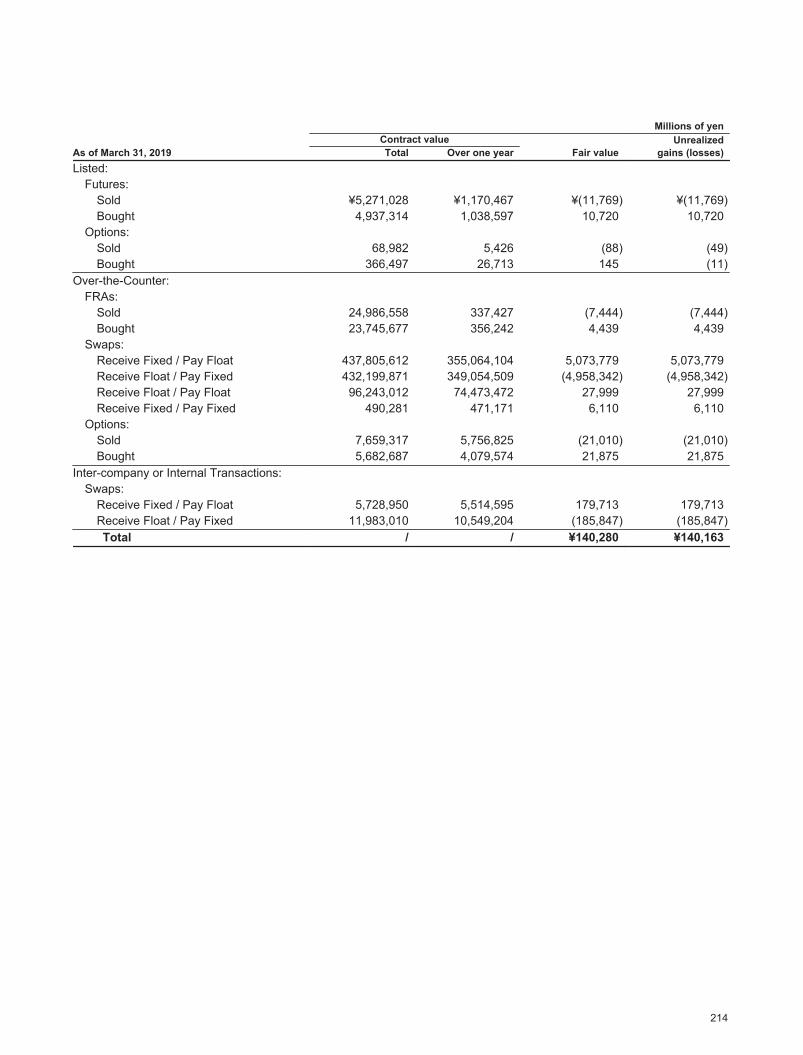
2020/09/07 16:49:02 / 20635244_株式会社みずほフィナンシャルグループ_総会その他(C)
Millions of yen
As of March 31, 2019Contract value
Fair valueUnrealized
gains (losses)Total Over one yearListed:
Futures:Sold ¥5,271,028 ¥1,170,467 ¥(11,769) ¥(11,769)Bought 4,937,314 1,038,597 10,720 10,720
Options:Sold 68,982 5,426 (88) (49)Bought 366,497 26,713 145 (11)
Over-the-Counter:FRAs:
Sold 24,986,558 337,427 (7,444) (7,444)Bought 23,745,677 356,242 4,439 4,439
Swaps:Receive Fixed / Pay Float 437,805,612 355,064,104 5,073,779 5,073,779Receive Float / Pay Fixed 432,199,871 349,054,509 (4,958,342) (4,958,342)Receive Float / Pay Float 96,243,012 74,473,472 27,999 27,999Receive Fixed / Pay Fixed 490,281 471,171 6,110 6,110
Options:Sold 7,659,317 5,756,825 (21,010) (21,010)Bought 5,682,687 4,079,574 21,875 21,875
Inter-company or Internal Transactions:Swaps:
Receive Fixed / Pay Float 5,728,950 5,514,595 179,713 179,713Receive Float / Pay Fixed 11,983,010 10,549,204 (185,847) (185,847)Total / / ¥140,280 ¥140,163
214
Derivatives Information

Financial Data of Mizuho Financial Group, Inc.Notes to Consolidated Financial Statements
2020/09/07 16:49:02 / 20635244_株式会社みずほフィナンシャルグループ_総会その他(C)
Thousands of U.S. dollars
As of March 31, 2020Contract value
Fair valueUnrealized
gains (losses)Total Over one yearListed:
Futures:Sold $50,809,834 $14,626,699 $(285,888) $(285,888)Bought 54,096,384 22,712,672 324,499 324,499
Options:Sold 3,857,421 370,799 (17,470) (7,048)Bought 6,957,445 273,559 27,214 12,424
Over-the-Counter:FRAs:
Sold 395,992,941 1,000,000 (251,244) (251,244)Bought 362,738,257 1,000,000 274,776 274,776
Swaps:Receive Fixed / Pay Float 4,086,280,083 3,092,190,185 (89,636,489) (89,636,489)Receive Float / Pay Fixed 3,961,616,988 2,998,308,169 94,280,764 94,280,764Receive Float / Pay Float 1,112,179,097 874,975,020 424,153 424,153Receive Fixed / Pay Fixed 3,027,996 2,876,909 (9,851) (9,851)
Options:Sold 119,970,434 69,307,269 (2,347,799) (2,347,799)Bought 111,697,389 71,870,943 1,770,972 1,770,972
Inter-company or Internal Transactions:Swaps:
Receive Fixed / Pay Float 43,356,334 39,951,609 1,210,086 1,210,086Receive Float / Pay Fixed 123,254,552 118,683,956 (2,510,107) (2,510,107)Total / / $3,253,616 $3,249,248
215
Derivatives Information
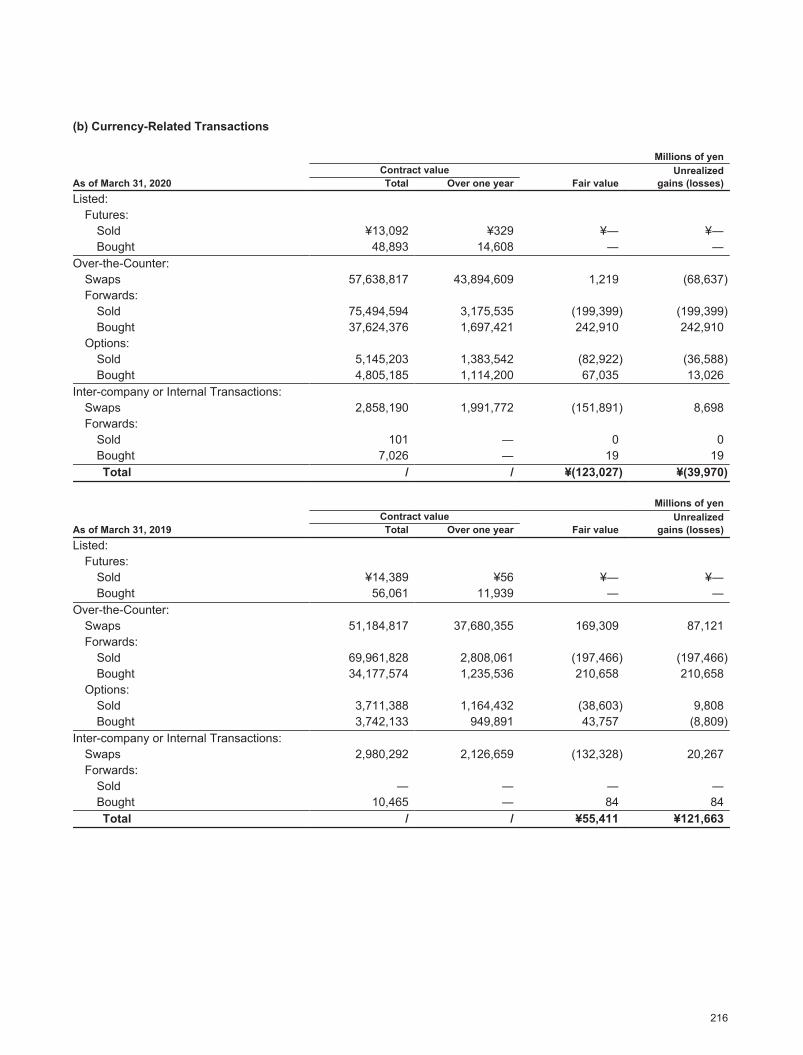
2020/09/07 16:49:02 / 20635244_株式会社みずほフィナンシャルグループ_総会その他(C)
(b) Currency-Related Transactions
Millions of yen
As of March 31, 2020Contract value
Fair valueUnrealized
gains (losses)Total Over one yearListed:
Futures:Sold ¥13,092 ¥329 ¥― ¥―Bought 48,893 14,608 ― ―
Over-the-Counter:Swaps 57,638,817 43,894,609 1,219 (68,637)Forwards:
Sold 75,494,594 3,175,535 (199,399) (199,399)Bought 37,624,376 1,697,421 242,910 242,910
Options:Sold 5,145,203 1,383,542 (82,922) (36,588)Bought 4,805,185 1,114,200 67,035 13,026
Inter-company or Internal Transactions:Swaps 2,858,190 1,991,772 (151,891) 8,698Forwards:
Sold 101 ― 0 0Bought 7,026 ― 19 19Total / / ¥(123,027) ¥(39,970)
Millions of yen
As of March 31, 2019Contract value
Fair valueUnrealized
gains (losses)Total Over one yearListed:
Futures:Sold ¥14,389 ¥56 ¥― ¥―Bought 56,061 11,939 ― ―
Over-the-Counter:Swaps 51,184,817 37,680,355 169,309 87,121Forwards:
Sold 69,961,828 2,808,061 (197,466) (197,466)Bought 34,177,574 1,235,536 210,658 210,658
Options:Sold 3,711,388 1,164,432 (38,603) 9,808Bought 3,742,133 949,891 43,757 (8,809)
Inter-company or Internal Transactions:Swaps 2,980,292 2,126,659 (132,328) 20,267Forwards:
Sold ― ― ― ―Bought 10,465 ― 84 84Total / / ¥55,411 ¥121,663
216
Derivatives Information
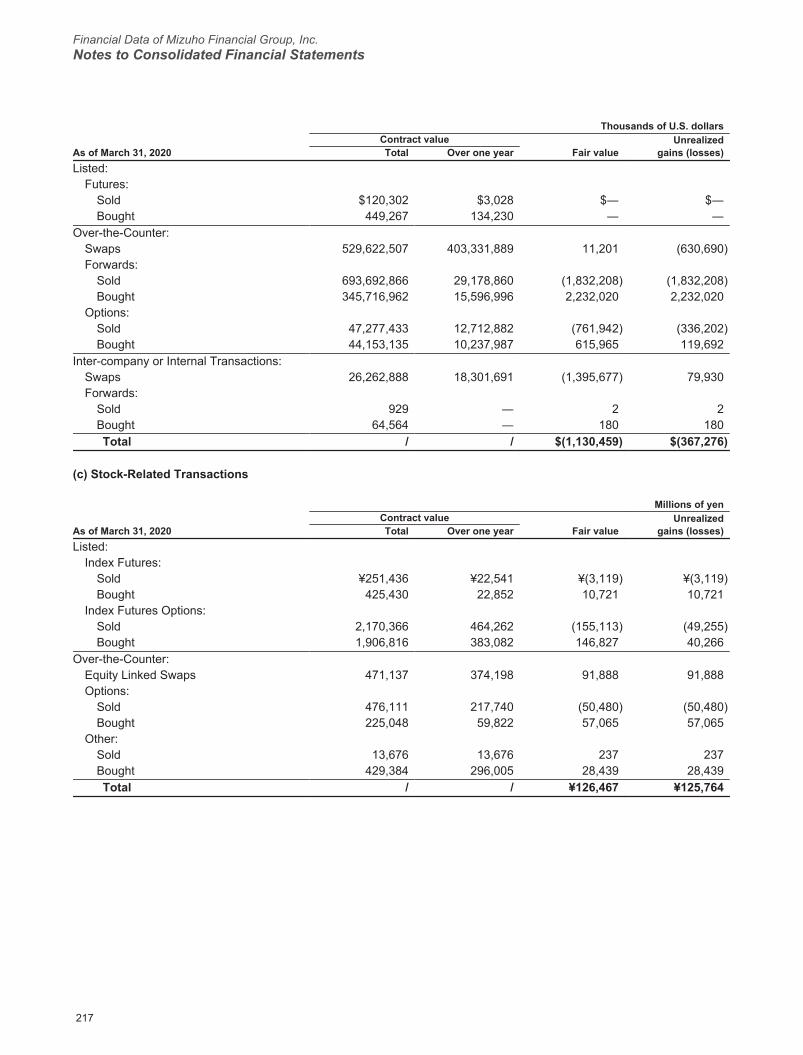
Financial Data of Mizuho Financial Group, Inc.Notes to Consolidated Financial Statements
2020/09/07 16:49:02 / 20635244_株式会社みずほフィナンシャルグループ_総会その他(C)
Thousands of U.S. dollars
As of March 31, 2020Contract value
Fair valueUnrealized
gains (losses)Total Over one yearListed:
Futures:Sold $120,302 $3,028 $― $―Bought 449,267 134,230 ― ―
Over-the-Counter:Swaps 529,622,507 403,331,889 11,201 (630,690)Forwards:
Sold 693,692,866 29,178,860 (1,832,208) (1,832,208)Bought 345,716,962 15,596,996 2,232,020 2,232,020
Options:Sold 47,277,433 12,712,882 (761,942) (336,202)Bought 44,153,135 10,237,987 615,965 119,692
Inter-company or Internal Transactions:Swaps 26,262,888 18,301,691 (1,395,677) 79,930Forwards:
Sold 929 ― 2 2Bought 64,564 ― 180 180Total / / $(1,130,459) $(367,276)
(c) Stock-Related Transactions
Millions of yen
As of March 31, 2020Contract value
Fair valueUnrealized
gains (losses)Total Over one yearListed:
Index Futures:Sold ¥251,436 ¥22,541 ¥(3,119) ¥(3,119)Bought 425,430 22,852 10,721 10,721
Index Futures Options:Sold 2,170,366 464,262 (155,113) (49,255)Bought 1,906,816 383,082 146,827 40,266
Over-the-Counter:Equity Linked Swaps 471,137 374,198 91,888 91,888Options:
Sold 476,111 217,740 (50,480) (50,480)Bought 225,048 59,822 57,065 57,065
Other:Sold 13,676 13,676 237 237Bought 429,384 296,005 28,439 28,439Total / / ¥126,467 ¥125,764
217
Derivatives Information
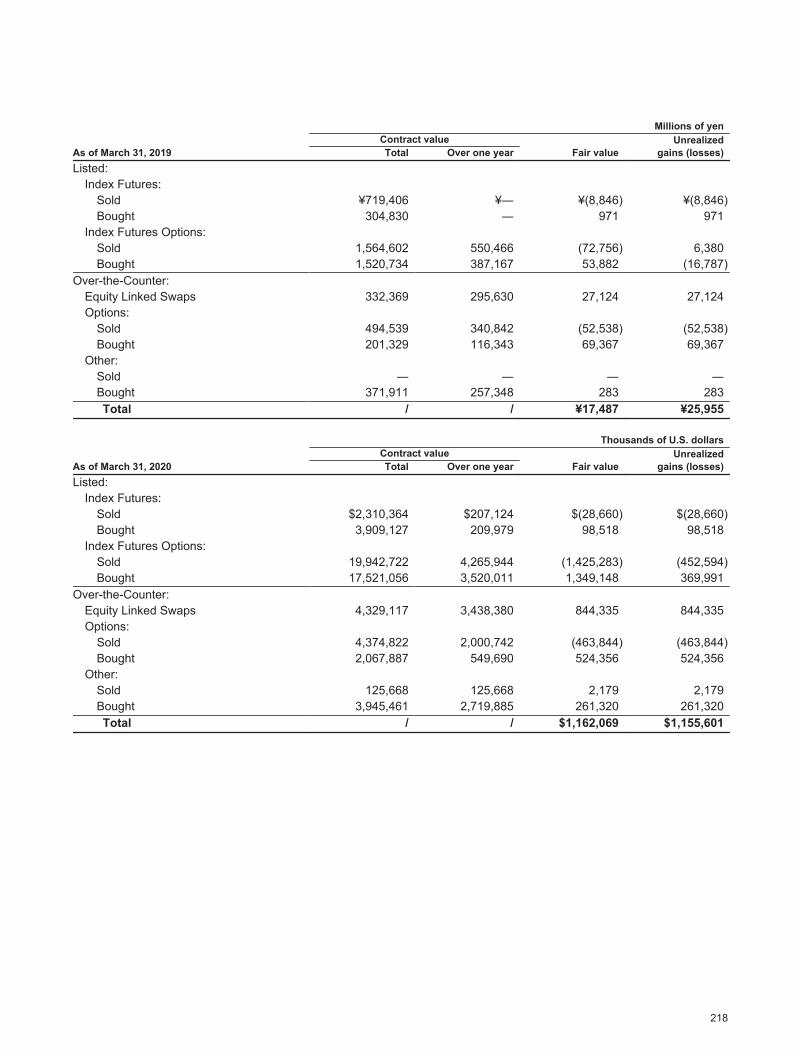
2020/09/07 16:49:02 / 20635244_株式会社みずほフィナンシャルグループ_総会その他(C)
Millions of yen
As of March 31, 2019Contract value
Fair valueUnrealized
gains (losses)Total Over one yearListed:
Index Futures:Sold ¥719,406 ¥― ¥(8,846) ¥(8,846)Bought 304,830 ― 971 971
Index Futures Options:Sold 1,564,602 550,466 (72,756) 6,380Bought 1,520,734 387,167 53,882 (16,787)
Over-the-Counter:Equity Linked Swaps 332,369 295,630 27,124 27,124Options:
Sold 494,539 340,842 (52,538) (52,538)Bought 201,329 116,343 69,367 69,367
Other:Sold ― ― ― ―Bought 371,911 257,348 283 283Total / / ¥17,487 ¥25,955
Thousands of U.S. dollars
As of March 31, 2020Contract value
Fair valueUnrealized
gains (losses)Total Over one yearListed:
Index Futures:Sold $2,310,364 $207,124 $(28,660) $(28,660)Bought 3,909,127 209,979 98,518 98,518
Index Futures Options:Sold 19,942,722 4,265,944 (1,425,283) (452,594)Bought 17,521,056 3,520,011 1,349,148 369,991
Over-the-Counter:Equity Linked Swaps 4,329,117 3,438,380 844,335 844,335Options:
Sold 4,374,822 2,000,742 (463,844) (463,844)Bought 2,067,887 549,690 524,356 524,356
Other:Sold 125,668 125,668 2,179 2,179Bought 3,945,461 2,719,885 261,320 261,320Total / / $1,162,069 $1,155,601
218
Derivatives Information

Financial Data of Mizuho Financial Group, Inc.Notes to Consolidated Financial Statements
2020/09/07 16:49:02 / 20635244_株式会社みずほフィナンシャルグループ_総会その他(C)
(d) Bond-Related Transactions
Millions of yen2020 2019
As of March 31,
Contract valueFair
valueUnrealized
gains (losses)
Contract valueFair
valueUnrealized
gains (losses)TotalOver
one year TotalOver
one yearListed:
Futures:Sold ¥624,565 ¥― ¥(11,223) ¥(11,223) ¥792,227 ¥― ¥(6,496) ¥(6,496)Bought 625,248 ― 6,551 6,551 674,829 ― 7,354 7,354
Futures Options:Sold ― ― ― ― 129,948 ― (124) (37)Bought ― ― ― ― 252,433 ― 189 (26)
Over-the-Counter:Options:
Sold 579,001 145,808 (2,593) (851) 632,942 207,161 (8,098) (7,291)Bought 577,602 145,808 4,993 3,096 633,054 207,161 7,455 6,632
Other:Sold ― ― ― ― 139,680 ― (1,313) (1,313)Bought 15,585 ― 422 422 129,465 ― 696 696Total / / ¥(1,848) ¥(2,003) / / ¥(336) ¥(482)
Thousands of U.S. dollars2020
As of March 31,
Contract valueFair
valueUnrealized
gains (losses)TotalOver
One yearListed:
Futures:Sold $5,738,908 $― $(103,131) $(103,131)Bought 5,745,182 ― 60,204 60,204
Futures Options:Sold ― ― ― ―Bought ― ― ― ―
Over-the-Counter:Options:
Sold 5,320,239 1,339,784 (23,827) (7,820)Bought 5,307,386 1,339,784 45,881 28,451
Other:Sold ― ― ― ―Bought 143,214 ― 3,883 3,883Total / / $(16,990) $(18,413)
219
Derivatives Information

2020/09/07 16:49:02 / 20635244_株式会社みずほフィナンシャルグループ_総会その他(C)
(e) Commodity-Related Transactions
Millions of yen2020 2019
As of March 31,
Contract valueFair
valueUnrealized
gains (losses)
Contract valueFair
valueUnrealized
gains (losses)TotalOver
one year TotalOver
one yearListed:
Futures:Sold ¥13,086 ¥6,097 ¥3,098 ¥3,098 ¥9,482 ¥557 ¥(707) ¥(707)Bought 24,556 13,371 (5,794) (5,794) 15,634 2,425 1,996 1,996
Futures Options:Sold ― ― ― ― 233 ― (11) 3
Over-the-Counter:Options:
Sold 172,561 73,050 30,337 30,337 205,339 50,214 (2,572) (2,572)Bought 161,781 65,707 (25,017) (25,017) 206,872 48,150 3,898 3,898Total / / ¥2,623 ¥2,623 / / ¥2,603 ¥2,618
Thousands of U.S. dollars2020
As of March 31,
Contract valueFair
valueUnrealized
gains (losses)TotalOver
one yearListed:
Futures:Sold $120,248 $56,031 $28,469 $28,469Bought 225,642 122,866 (53,245) (53,245)
Futures Options:Sold ― ― ― ―
Over-the-Counter:Options:
Sold 1,585,601 671,233 278,757 278,757Bought 1,486,548 603,763 (229,873) (229,873)Total / / $24,108 $24,108
Note: Commodities include oil, copper, aluminum and others.
220
Derivatives Information

Financial Data of Mizuho Financial Group, Inc.Notes to Consolidated Financial Statements
2020/09/07 16:49:02 / 20635244_株式会社みずほフィナンシャルグループ_総会その他(C)
(f) Credit Derivative Transactions
Millions of yen
As of March 31, 2020Contract value
Fair valueUnrealized
gains (losses)Total Over one yearOver-the-Counter:
Credit Derivatives:Sold ¥1,815,742 ¥1,545,558 ¥(4,725) ¥(4,725)Bought 3,022,474 2,712,677 13,821 13,821Total / / ¥9,096 ¥9,096
Millions of yen
As of March 31, 2019Contract value
Fair valueUnrealized
gains (losses)Total Over one yearOver-the-Counter:
Credit Derivatives:Sold ¥1,465,454 ¥1,139,869 ¥15,200 ¥15,200Bought 1,628,301 1,260,718 (13,856) (13,856)Total / / ¥1,343 ¥1,343
Thousands of U.S. dollars
As of March 31, 2020Contract value
Fair valueUnrealized
gains (losses)Total Over one yearOver-the-Counter:
Credit Derivatives:Sold $16,684,210 $14,201,582 $(43,420) $(43,420)Bought 27,772,434 24,925,825 127,002 127,002Total / / $83,582 $83,582
Note: “Sold” and “Bought” indicate assumption and cession of credit risk, respectively.
221
Derivatives Information
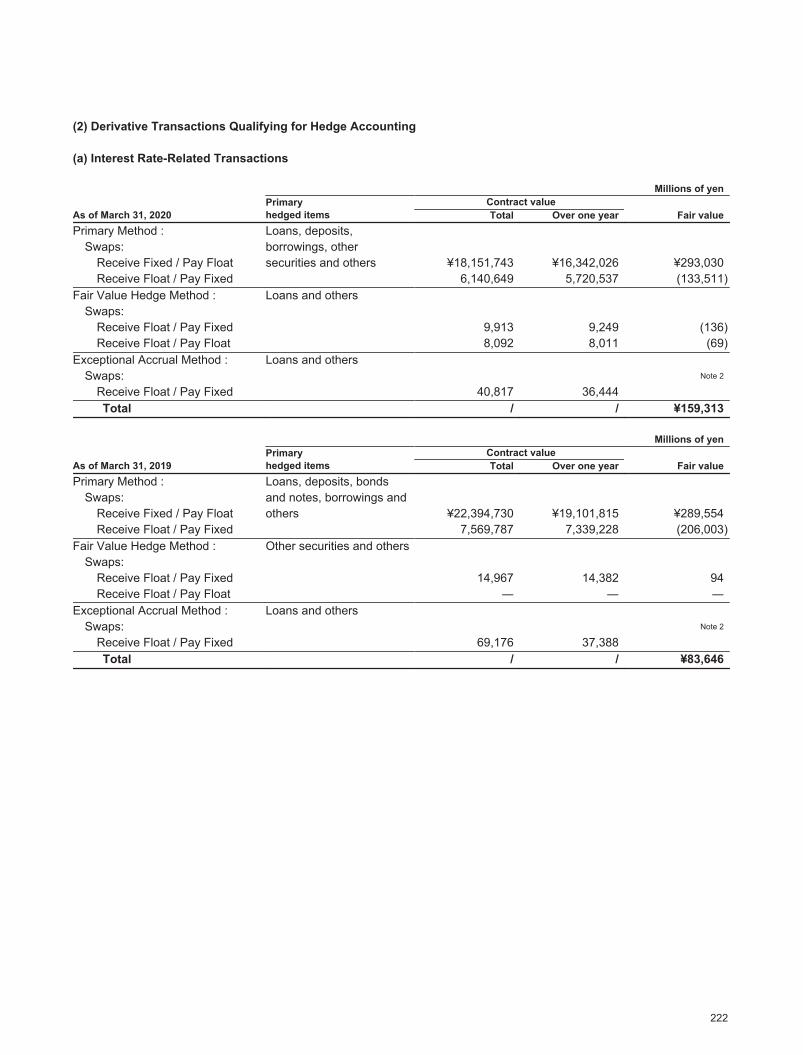
2020/09/07 16:49:02 / 20635244_株式会社みずほフィナンシャルグループ_総会その他(C)
(2) Derivative Transactions Qualifying for Hedge Accounting
(a) Interest Rate-Related Transactions
Millions of yenPrimaryhedged items
Contract valueFair valueAs of March 31, 2020 Total Over one year
Primary Method : Loans, deposits, borrowings, other securities and others
Swaps:Receive Fixed / Pay Float ¥18,151,743 ¥16,342,026 ¥293,030Receive Float / Pay Fixed 6,140,649 5,720,537 (133,511)
Fair Value Hedge Method : Loans and othersSwaps:
Receive Float / Pay Fixed 9,913 9,249 (136)Receive Float / Pay Float 8,092 8,011 (69)
Exceptional Accrual Method : Loans and othersSwaps: Note 2
Receive Float / Pay Fixed 40,817 36,444Total / / ¥159,313
Millions of yenPrimaryhedged items
Contract valueFair valueAs of March 31, 2019 Total Over one year
Primary Method : Loans, deposits, bonds and notes, borrowings and others
Swaps:Receive Fixed / Pay Float ¥22,394,730 ¥19,101,815 ¥289,554Receive Float / Pay Fixed 7,569,787 7,339,228 (206,003)
Fair Value Hedge Method : Other securities and othersSwaps:
Receive Float / Pay Fixed 14,967 14,382 94Receive Float / Pay Float ― ― ―
Exceptional Accrual Method : Loans and othersSwaps: Note 2
Receive Float / Pay Fixed 69,176 37,388Total / / ¥83,646
222
Derivatives Information
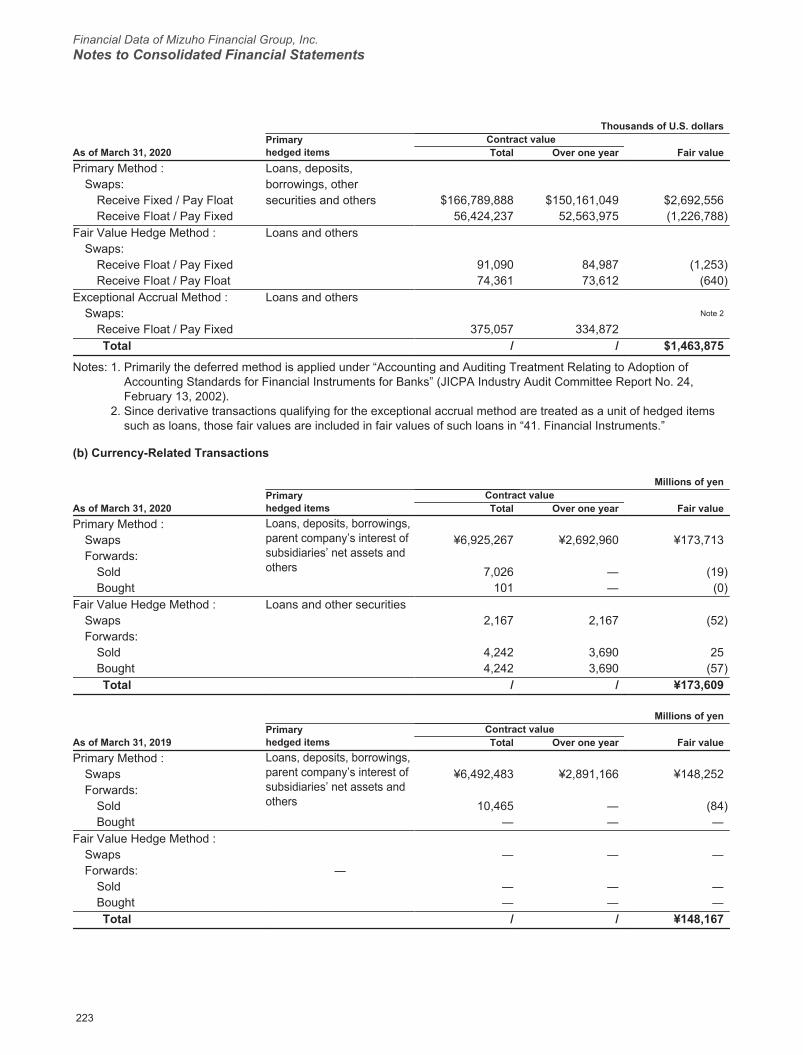
Financial Data of Mizuho Financial Group, Inc.Notes to Consolidated Financial Statements
2020/09/07 16:49:02 / 20635244_株式会社みずほフィナンシャルグループ_総会その他(C)
Thousands of U.S. dollarsPrimaryhedged items
Contract valueFair valueAs of March 31, 2020 Total Over one year
Primary Method : Loans, deposits, borrowings, other securities and others
Swaps:Receive Fixed / Pay Float $166,789,888 $150,161,049 $2,692,556Receive Float / Pay Fixed 56,424,237 52,563,975 (1,226,788)
Fair Value Hedge Method : Loans and othersSwaps:
Receive Float / Pay Fixed 91,090 84,987 (1,253)Receive Float / Pay Float 74,361 73,612 (640)
Exceptional Accrual Method : Loans and othersSwaps: Note 2
Receive Float / Pay Fixed 375,057 334,872Total / / $1,463,875
Notes: 1. Primarily the deferred method is applied under “Accounting and Auditing Treatment Relating to Adoption of Accounting Standards for Financial Instruments for Banks” (JICPA Industry Audit Committee Report No. 24, February 13, 2002).
2. Since derivative transactions qualifying for the exceptional accrual method are treated as a unit of hedged items such as loans, those fair values are included in fair values of such loans in “41. Financial Instruments.”
(b) Currency-Related Transactions
Millions of yenPrimaryhedged items
Contract valueFair valueAs of March 31, 2020 Total Over one year
Primary Method : Loans, deposits, borrowings, parent company’s interest of subsidiaries’ net assets and others
Swaps ¥6,925,267 ¥2,692,960 ¥173,713Forwards:
Sold 7,026 ― (19)Bought 101 ― (0)
Fair Value Hedge Method : Loans and other securitiesSwaps 2,167 2,167 (52)Forwards:
Sold 4,242 3,690 25Bought 4,242 3,690 (57)Total / / ¥173,609
Millions of yenPrimaryhedged items
Contract valueFair valueAs of March 31, 2019 Total Over one year
Primary Method : Loans, deposits, borrowings, parent company’s interest of subsidiaries’ net assets and others
Swaps ¥6,492,483 ¥2,891,166 ¥148,252Forwards:
Sold 10,465 ― (84)Bought ― ― ―
Fair Value Hedge Method :
―Swaps ― ― ―Forwards:
Sold ― ― ―Bought ― ― ―Total / / ¥148,167
223
Derivatives Information

2020/09/07 16:49:02 / 20635244_株式会社みずほフィナンシャルグループ_総会その他(C)
Thousands of U.S. dollarsPrimaryhedged items
Contract valueFair valueAs of March 31, 2020 Total Over one year
Primary Method : Loans, deposits, borrowings, parent company’s interest of subsidiaries’ net assets and others
Swaps $63,633,814 $24,744,650 $1,596,193Forwards:
Sold 64,564 ― (180)Bought 929 ― (2)
Fair Value Hedge Method : Loans and other securitiesSwaps 19,914 19,914 (479)Forwards:
Sold 38,987 33,911 231Bought 38,987 33,911 (528)Total / / $1,595,235
Note: Primarily the deferred method is applied under “Accounting and Auditing Treatment Relating to Adoption of Accounting Standards for Foreign Currency Transactions for Banks” (JICPA Industry Audit Committee Report No. 25, July 29, 2002).
(c) Stock-Related Transactions
Millions of yenPrimaryhedged items
Contract valueFair valueAs of March 31, 2020 Total Over one year
Fair Value Hedge Method : Other securitiesForward Stock Agreements:
Sold ¥148,913 ¥148,913 ¥25,031Total / / ¥25,031
Millions of yenPrimaryhedged items
Contract valueFair valueAs of March 31, 2019 Total Over one year
Fair Value Hedge Method : Other securitiesForward Stock Agreements:
Sold ¥153,791 ¥143,123 ¥(7,010)Total / / ¥(7,010)
Thousands of U.S. dollarsPrimaryhedged items
Contract valueFair valueAs of March 31, 2020 Total Over one year
Fair Value Hedge Method : Other securitiesForward Stock Agreements:
Sold $1,368,312 $1,368,312 $230,001Total / / $230,001
224
Derivatives Information
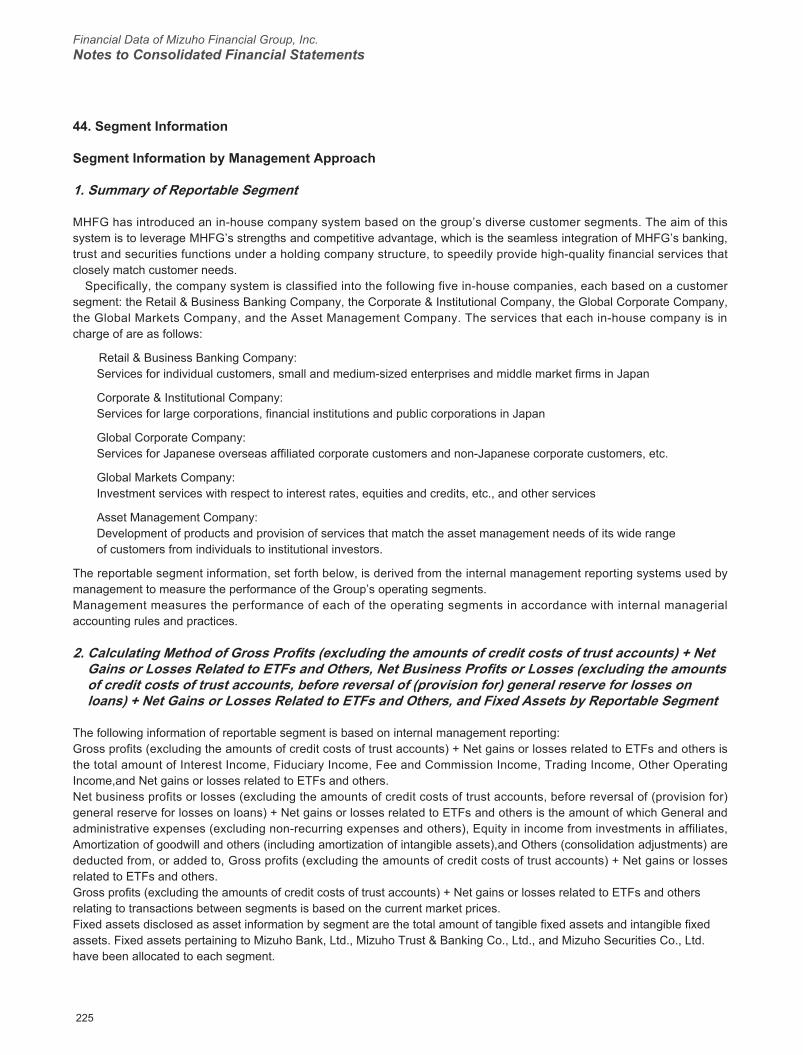
Financial Data of Mizuho Financial Group, Inc.Notes to Consolidated Financial Statements
2020/09/07 16:49:02 / 20635244_株式会社みずほフィナンシャルグループ_総会その他(C)
44. Segment Information
Segment Information by Management Approach
1. Summary of Reportable Segment
MHFG has introduced an in-house company system based on the group’s diverse customer segments. The aim of this system is to leverage MHFG’s strengths and competitive advantage, which is the seamless integration of MHFG’s banking, trust and securities functions under a holding company structure, to speedily provide high-quality financial services that closely match customer needs. Specifically, the company system is classified into the following five in-house companies, each based on a customer segment: the Retail & Business Banking Company, the Corporate & Institutional Company, the Global Corporate Company, the Global Markets Company, and the Asset Management Company. The services that each in-house company is in charge of are as follows:
Retail & Business Banking Company: Services for individual customers, small and medium-sized enterprises and middle market firms in Japan
Corporate & Institutional Company: Services for large corporations, financial institutions and public corporations in Japan
Global Corporate Company: Services for Japanese overseas affiliated corporate customers and non-Japanese corporate customers, etc.
Global Markets Company: Investment services with respect to interest rates, equities and credits, etc., and other services
Asset Management Company: Development of products and provision of services that match the asset management needs of its wide range of customers from individuals to institutional investors.
The reportable segment information, set forth below, is derived from the internal management reporting systems used by management to measure the performance of the Group’s operating segments.Management measures the performance of each of the operating segments in accordance with internal managerial accounting rules and practices.
2. Calculating Method of Gross Profits (excluding the amounts of credit costs of trust accounts) + Net Gains or Losses Related to ETFs and Others, Net Business Profits or Losses (excluding the amounts of credit costs of trust accounts, before reversal of (provision for) general reserve for losses on loans) + Net Gains or Losses Related to ETFs and Others, and Fixed Assets by Reportable Segment
The following information of reportable segment is based on internal management reporting:Gross profits (excluding the amounts of credit costs of trust accounts) + Net gains or losses related to ETFs and others is the total amount of Interest Income, Fiduciary Income, Fee and Commission Income, Trading Income, Other Operating Income,and Net gains or losses related to ETFs and others.Net business profits or losses (excluding the amounts of credit costs of trust accounts, before reversal of (provision for) general reserve for losses on loans) + Net gains or losses related to ETFs and others is the amount of which General and administrative expenses (excluding non-recurring expenses and others), Equity in income from investments in affiliates, Amortization of goodwill and others (including amortization of intangible assets),and Others (consolidation adjustments) are deducted from, or added to, Gross profits (excluding the amounts of credit costs of trust accounts) + Net gains or losses related to ETFs and others.Gross profits (excluding the amounts of credit costs of trust accounts) + Net gains or losses related to ETFs and others relating to transactions between segments is based on the current market prices.Fixed assets disclosed as asset information by segment are the total amount of tangible fixed assets and intangible fixed assets. Fixed assets pertaining to Mizuho Bank, Ltd., Mizuho Trust & Banking Co., Ltd., and Mizuho Securities Co., Ltd. have been allocated to each segment.
225
Segment Information
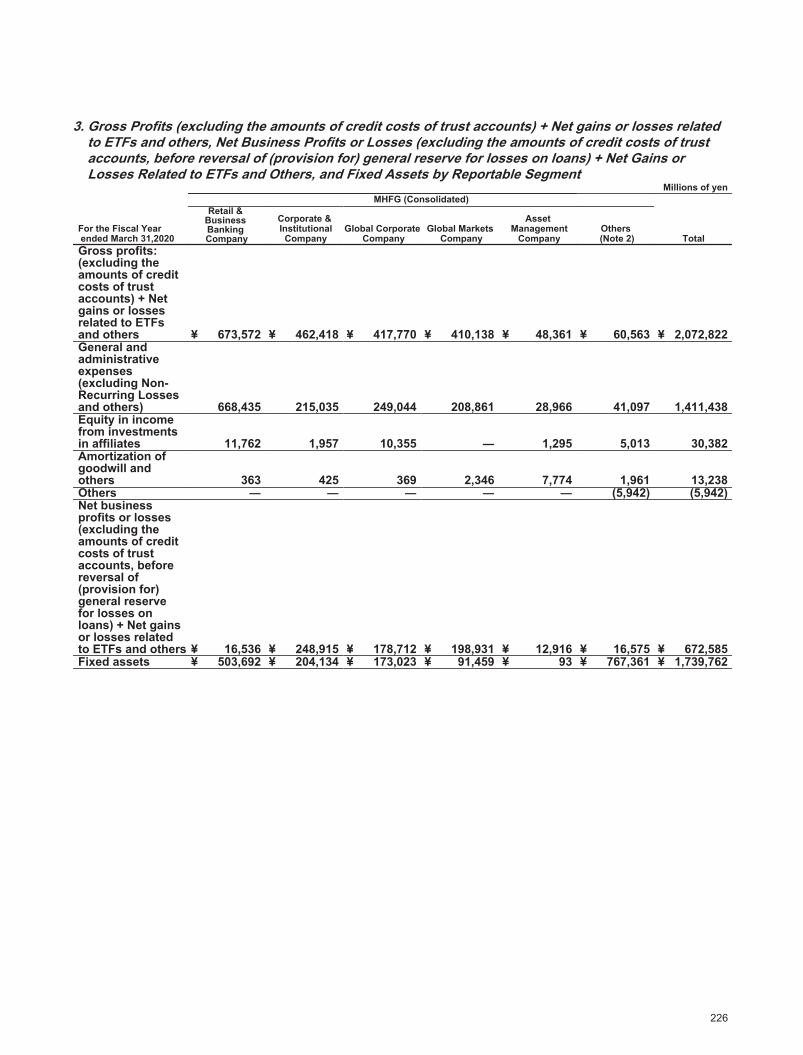
2020/09/07 16:49:02 / 20635244_株式会社みずほフィナンシャルグループ_総会その他(C)
3. Gross Profits (excluding the amounts of credit costs of trust accounts) + Net gains or losses related to ETFs and others, Net Business Profits or Losses (excluding the amounts of credit costs of trust accounts, before reversal of (provision for) general reserve for losses on loans) + Net Gains or Losses Related to ETFs and Others, and Fixed Assets by Reportable Segment
Millions of yenMHFG (Consolidated)
For the Fiscal Year ended March 31,2020
Retail & Business Banking Company
Corporate & Institutional Company
Global Corporate Company
Global Markets Company
Asset Management
CompanyOthers
(Note 2) TotalGross profits: (excluding the amounts of credit costs of trust accounts) + Net gains or losses related to ETFs and others ¥ 673,572 ¥ 462,418 ¥ 417,770 ¥ 410,138 ¥ 48,361 ¥ 60,563 ¥ 2,072,822General and administrative expenses (excluding Non-Recurring Losses and others) 668,435 215,035 249,044 208,861 28,966 41,097 1,411,438Equity in income from investments in affiliates 11,762 1,957 10,355 ― 1,295 5,013 30,382Amortization of goodwill and others 363 425 369 2,346 7,774 1,961 13,238Others ― ― ― ― ― (5,942) (5,942)Net business profits or losses (excluding the amounts of credit costs of trust accounts, before reversal of (provision for) general reserve for losses on loans) + Net gains or losses related to ETFs and others ¥ 16,536 ¥ 248,915 ¥ 178,712 ¥ 198,931 ¥ 12,916 ¥ 16,575 ¥ 672,585Fixed assets ¥ 503,692 ¥ 204,134 ¥ 173,023 ¥ 91,459 ¥ 93 ¥ 767,361 ¥ 1,739,762
226
Segment Information
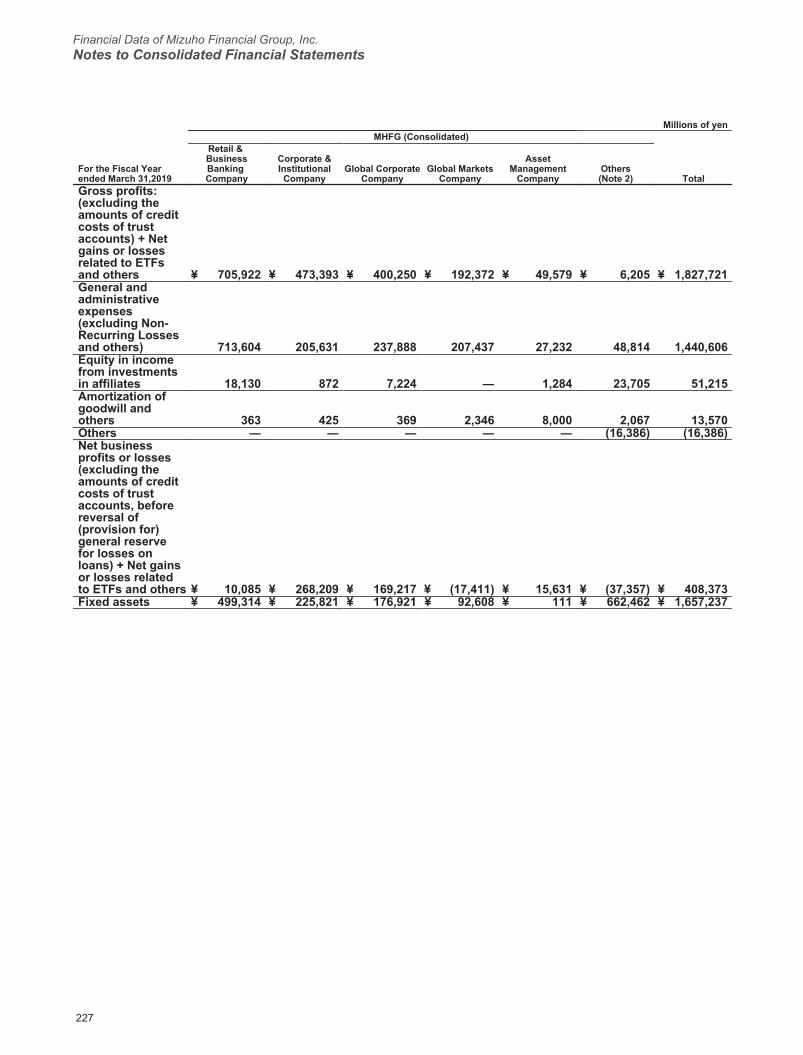
Financial Data of Mizuho Financial Group, Inc.Notes to Consolidated Financial Statements
2020/09/07 16:49:02 / 20635244_株式会社みずほフィナンシャルグループ_総会その他(C)
Millions of yenMHFG (Consolidated)
For the Fiscal Yearended March 31,2019
Retail & BusinessBanking Company
Corporate &InstitutionalCompany
Global CorporateCompany
Global MarketsCompany
AssetManagement
CompanyOthers(Note 2) Total
Gross profits: (excluding the amounts of credit costs of trust accounts) + Net gains or losses related to ETFs and others ¥ 705,922 ¥ 473,393 ¥ 400,250 ¥ 192,372 ¥ 49,579 ¥ 6,205 ¥ 1,827,721General and administrative expenses (excluding Non-Recurring Losses and others) 713,604 205,631 237,888 207,437 27,232 48,814 1,440,606Equity in income from investments in affiliates 18,130 872 7,224 ― 1,284 23,705 51,215Amortization of goodwill and others 363 425 369 2,346 8,000 2,067 13,570Others ― ― ― ― ― (16,386) (16,386)Net business profits or losses (excluding the amounts of credit costs of trust accounts, before reversal of (provision for) general reserve for losses on loans) + Net gains or losses related to ETFs and others ¥ 10,085 ¥ 268,209 ¥ 169,217 ¥ (17,411) ¥ 15,631 ¥ (37,357) ¥ 408,373Fixed assets ¥ 499,314 ¥ 225,821 ¥ 176,921 ¥ 92,608 ¥ 111 ¥ 662,462 ¥ 1,657,237
227
Segment Information

2020/09/07 16:49:02 / 20635244_株式会社みずほフィナンシャルグループ_総会その他(C)
Thousands of U.S. dollarsMHFG (Consolidated)
For the Fiscal Yearended March 31,2020
Retail & BusinessBanking Company
Corporate &InstitutionalCompany
Global CorporateCompany
Global MarketsCompany
AssetManagement
CompanyOthers(Note 2) Total
Gross profits: (excluding the amounts of credit costs of trust accounts) + Net gains or losses related to ETFs and others $ 6,189,212 $ 4,248,994 $ 3,838,739 $ 3,768,612 $ 444,372 $ 556,499 $ 19,046,428General and administrative expenses (excluding Non-Recurring Losses and others) 6,142,011 1,975,880 2,288,376 1,919,149 266,158 377,630 12,969,204Equity in income from investments in affiliates 108,077 17,982 95,148 ― 11,899 46,067 279,173Amortization of goodwill and others 3,335 3,905 3,390 21,557 71,433 18,024 121,644Others ― ― ― ― ― (54,603) (54,603)Net business profits or losses (excluding the amounts of credit costs of trust accounts, before reversal of (provision for) general reserve for losses on loans) + Net gains or losses related to ETFs and others $ 151,943 $ 2,287,191 $ 1,642,121 $ 1,827,906 $ 118,680 $ 152,309 $ 6,180,150Fixed assets $ 4,628,246 $ 1,875,714 $ 1,589,847 $ 840,384 $ 854 $ 7,051,008 $ 15,986,053
Notes: 1.Gross profits (excluding the amounts of credit costs of trust accounts) + Net gains or losses related to ETFs and others is reported instead of sales reported by general corporations.Net gains or losses related to ETFs and others amounted to ¥ 10,602 million and ¥14,984 million, of which ¥ 7,334 million and ¥ 7,280 million are included in the Global Markets Company for the fiscal year ended March 31 2020 and 2019, respectively.
2.“Others” includes items which should be eliminated as internal transactions between each segment on a consolidated basis.3.“Others” in Fixed assets includes assets of headquarters that have not been allocated to each segment, Fixed assets pertaining to
consolidated subsidiaries that are not subject to allocation, consolidated adjustments, and others. Among Fixed assets that have not been allocated to each segment, some related expenses are allocated to each segment using the reasonable criteria of allocation.
4.Following the change in allocation method for transactions between each segment and “Others” made in April, 2019, reclassification was made on the above table for the fiscal year ended March 31 2019, to reflect the relevant change.
228
Segment Information

Financial Data of Mizuho Financial Group, Inc.Notes to Consolidated Financial Statements
2020/09/07 16:49:02 / 20635244_株式会社みずほフィナンシャルグループ_総会その他(C)
4. The Difference between the Total Amounts of Reportable Segments and the Recorded Amounts in Consolidated Statement of Income, and the Contents of the Difference (Matters relating to adjustment to difference)
The above amount of Gross profits (excluding the amounts of credit costs of trust accounts) + Net gains or losses related to ETFs and others and that of Net business profits (excluding the amounts of credit costs of trust accounts, before reversal of (provision for) general reserve for losses on loans) + Net gains or losses related to ETFs and others derived from internal management reporting by reportable segment are different from the amounts recorded in Consolidated Statement of Income. The contents of the difference for the period are as follows:
(a) The Total of Gross Profits (excluding the amounts of credit costs of trust accounts) + Net gains or losses related to ETFs and others of Segment Information and Ordinary Profits recorded in the Consolidated Statement of Income
Millions of yenThousands of
U.S. dollars2020 2019 2020
Gross Profits (excluding the amounts of credit costs of trust accounts) + Net
gains or losses related to ETFs and others ¥ 2,072,822 ¥ 1,827,721 $ 19,046,428Net gains or losses related to ETFs and others (10,602) (14,984) (97,426)Other Ordinary Income 316,198 436,019 2,905,437General and Administrative Expenses (1,378,398) (1,430,850) (12,665,614)Other Ordinary Expenses (362,142) (203,788) (3,327,599)Ordinary Profits recorded in Consolidated Statement of Income¥ 637,877 ¥ 614,118 $ 5,861,226
(b) The Total of Net Business Profits (excluding the amounts of credit costs of trust accounts, before reversal of (provision for) general reserve for losses on loans) + Net gains or losses related to ETFs and others of Segment Information and Income before Income Taxes Recorded in Consolidated Statement of Income
Millions of yenThousands of
U.S. dollars2020 2019 2020
Net Business Profits (excluding the amounts of credit costs of trust accounts, before reversal of (provision for) general reserve for losses on loans) + Net Gains (Losses) related to ETFs and others ¥ 672,585 ¥ 408,373 $ 6,180,150Credit Costs for Trust Accounts — — —General and Administrative Expenses (non-recurring losses) 46,278 23,326 425,234Expenses Related to Portfolio Problems (including reversal of(provision for) general reserve for losses on loans) (183,308) (30,710) (1,684,360)Gains on Reversal of Reserves for Possible Losses on Loansand others 11,605 11,156 106,642Net Gains (Losses) Related to Stocks- Net Gains (Losses) related to ETFs and others 126,571 259,879 1,163,018Net Extraordinary Gains (Losses) (19,159) (497,858) (176,052)Others (35,854) (57,907) (329,458)Income before Income Taxes Recorded in ConsolidatedStatement of Income ¥ 618,717 ¥ 116,259 $ 5,685,174
229
Segment Information

2020/09/07 16:49:02 / 20635244_株式会社みずほフィナンシャルグループ_総会その他(C)
5. Related Information
(a) Information about Geographic Areas
(i) Ordinary income
Millions of yen
2020 Japan Americas EuropeAsia/Oceania
excluding Japan TotalOrdinary Income ¥ 2,362,597 ¥ 809,986 ¥ 256,126 ¥ 557,990 ¥ 3,986,701
Millions of yen
2019 Japan Americas EuropeAsia/Oceania
excluding Japan TotalOrdinary Income ¥ 2,292,945 ¥ 766,900 ¥ 276,061 ¥ 589,742 ¥ 3,925,649
Thousands of U.S. dollars
2020 Japan Americas EuropeAsia/Oceania
excluding Japan TotalOrdinary Income $ 21,709,061 $ 7,442,680 $ 2,353,458 $ 5,127,173 $ 36,632,372
Notes: 1.The above table shows Ordinary Income instead of sales of non-financial companies.2.Ordinary income is segmented by country and region based on the location of our group office in
consideration of geographical proximity, similarity of economic activities, and interrelationship of business activities.
(ii) Tangible fixed assetsInformation on tangible fixed assets by geographical areas as of March 31, 2020 and 2019 is not disclosed since tangible fixed assets in Japan accounted for more than 90% of tangible fixed assets.
(b) Information about Major CustomersInformation about major customers is not disclosed since there are no outside customers accounted for more than 10% of Ordinary Income of the Company.
230
Segment Information
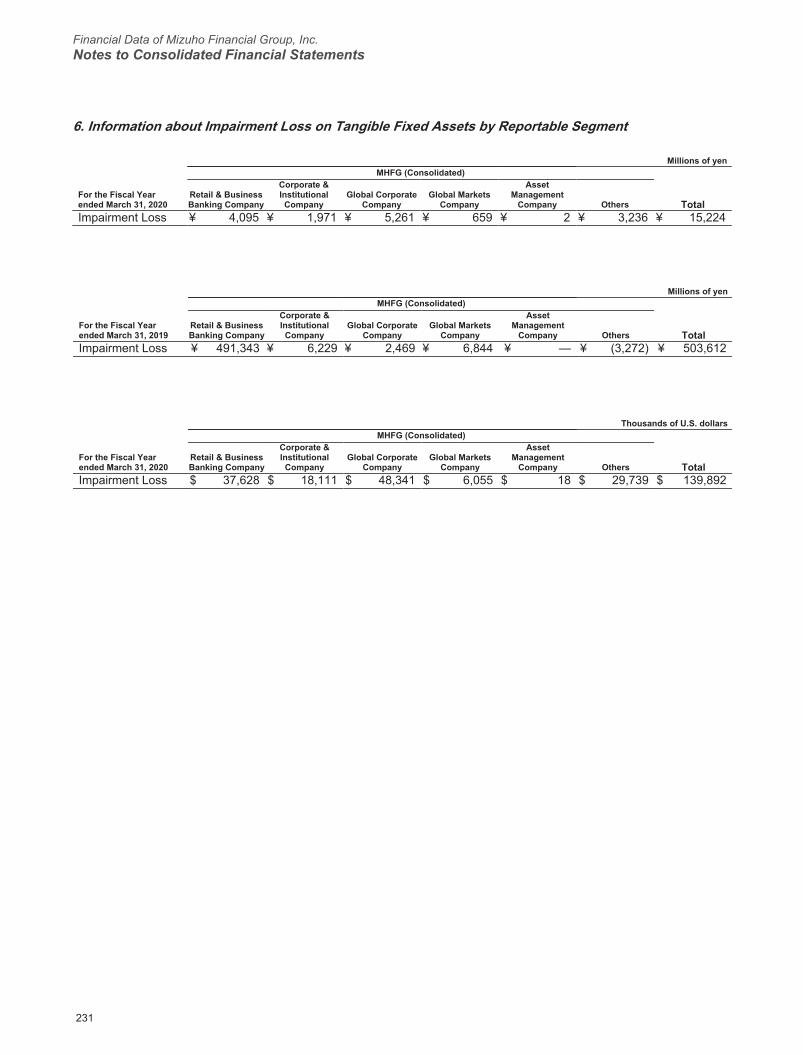
Financial Data of Mizuho Financial Group, Inc.Notes to Consolidated Financial Statements
2020/09/07 16:49:02 / 20635244_株式会社みずほフィナンシャルグループ_総会その他(C)
6. Information about Impairment Loss on Tangible Fixed Assets by Reportable Segment
Millions of yenMHFG (Consolidated)
For the Fiscal Yearended March 31, 2020
Retail & BusinessBanking Company
Corporate &InstitutionalCompany
Global CorporateCompany
Global MarketsCompany
AssetManagement
Company Others TotalImpairment Loss ¥ 4,095 ¥ 1,971 ¥ 5,261 ¥ 659 ¥ 2 ¥ 3,236 ¥ 15,224
Millions of yenMHFG (Consolidated)
For the Fiscal Yearended March 31, 2019
Retail & BusinessBanking Company
Corporate &InstitutionalCompany
Global CorporateCompany
Global MarketsCompany
AssetManagement
Company Others TotalImpairment Loss ¥ 491,343 ¥ 6,229 ¥ 2,469 ¥ 6,844 ¥ — ¥ (3,272) ¥ 503,612
Thousands of U.S. dollarsMHFG (Consolidated)
For the Fiscal Yearended March 31, 2020
Retail & BusinessBanking Company
Corporate &InstitutionalCompany
Global CorporateCompany
Global MarketsCompany
AssetManagement
Company Others TotalImpairment Loss $ 37,628 $ 18,111 $ 48,341 $ 6,055 $ 18 $ 29,739 $ 139,892
231
Segment Information
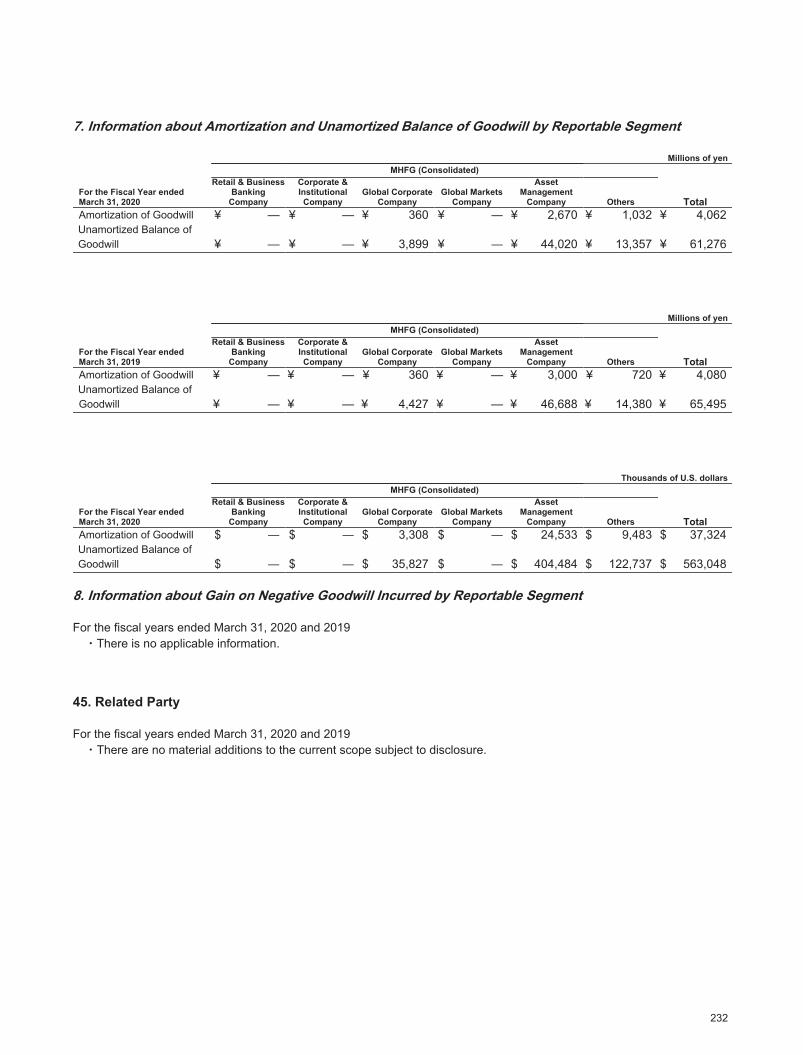
2020/09/07 16:49:02 / 20635244_株式会社みずほフィナンシャルグループ_総会その他(C)
7. Information about Amortization and Unamortized Balance of Goodwill by Reportable Segment
Millions of yenMHFG (Consolidated)
For the Fiscal Year endedMarch 31, 2020
Retail & BusinessBanking
Company
Corporate &InstitutionalCompany
Global CorporateCompany
Global MarketsCompany
AssetManagement
Company Others TotalAmortization of Goodwill ¥ — ¥ — ¥ 360 ¥ ― ¥ 2,670 ¥ 1,032 ¥ 4,062Unamortized Balance ofGoodwill ¥ — ¥ — ¥ 3,899 ¥ ― ¥ 44,020 ¥ 13,357 ¥ 61,276
Millions of yenMHFG (Consolidated)
For the Fiscal Year endedMarch 31, 2019
Retail & BusinessBanking
Company
Corporate &InstitutionalCompany
Global CorporateCompany
Global MarketsCompany
AssetManagement
Company Others TotalAmortization of Goodwill ¥ — ¥ — ¥ 360 ¥ — ¥ 3,000 ¥ 720 ¥ 4,080Unamortized Balance ofGoodwill ¥ — ¥ — ¥ 4,427 ¥ — ¥ 46,688 ¥ 14,380 ¥ 65,495
Thousands of U.S. dollarsMHFG (Consolidated)
For the Fiscal Year endedMarch 31, 2020
Retail & BusinessBanking
Company
Corporate &InstitutionalCompany
Global CorporateCompany
Global MarketsCompany
AssetManagement
Company Others TotalAmortization of Goodwill $ ― $ ― $ 3,308 $ ― $ 24,533 $ 9,483 $ 37,324Unamortized Balance ofGoodwill $ ― $ ― $ 35,827 $ ― $ 404,484 $ 122,737 $ 563,048
8. Information about Gain on Negative Goodwill Incurred by Reportable Segment
For the fiscal years ended March 31, 2020 and 2019・There is no applicable information.
45. Related Party
For the fiscal years ended March 31, 2020 and 2019・There are no material additions to the current scope subject to disclosure.
232
Segment Information、Related Party
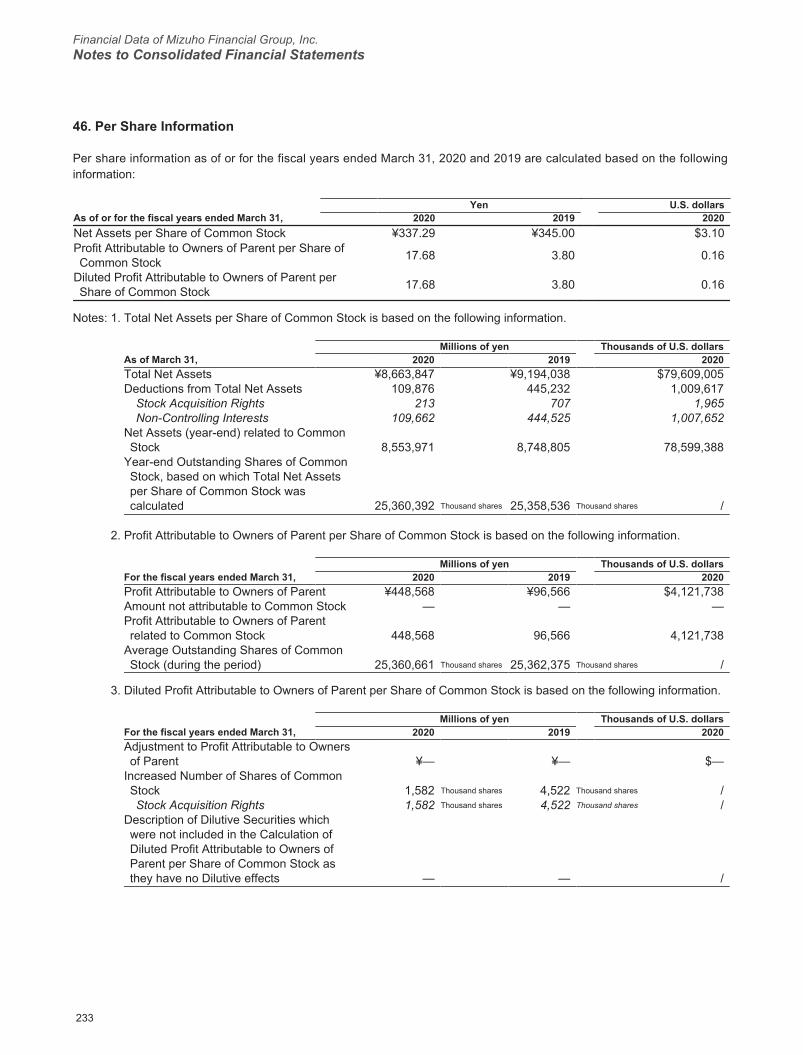
Financial Data of Mizuho Financial Group, Inc.Notes to Consolidated Financial Statements
2020/09/07 16:49:02 / 20635244_株式会社みずほフィナンシャルグループ_総会その他(C)
46. Per Share Information
Per share information as of or for the fiscal years ended March 31, 2020 and 2019 are calculated based on the following information:
Yen U.S. dollarsAs of or for the fiscal years ended March 31, 2020 2019 2020Net Assets per Share of Common Stock ¥337.29 ¥345.00 $3.10Profit Attributable to Owners of Parent per Share ofCommon Stock 17.68 3.80 0.16
Diluted Profit Attributable to Owners of Parent perShare of Common Stock 17.68 3.80 0.16
Notes: 1. Total Net Assets per Share of Common Stock is based on the following information.
Millions of yen Thousands of U.S. dollarsAs of March 31, 2020 2019 2020Total Net Assets ¥8,663,847 ¥9,194,038 $79,609,005Deductions from Total Net Assets 109,876 445,232 1,009,617
Stock Acquisition Rights 213 707 1,965Non-Controlling Interests 109,662 444,525 1,007,652
Net Assets (year-end) related to CommonStock 8,553,971 8,748,805 78,599,388
Year-end Outstanding Shares of CommonStock, based on which Total Net Assetsper Share of Common Stock wascalculated 25,360,392 Thousand shares 25,358,536 Thousand shares /
2. Profit Attributable to Owners of Parent per Share of Common Stock is based on the following information.
Millions of yen Thousands of U.S. dollarsFor the fiscal years ended March 31, 2020 2019 2020Profit Attributable to Owners of Parent ¥448,568 ¥96,566 $4,121,738Amount not attributable to Common Stock — — —Profit Attributable to Owners of Parentrelated to Common Stock 448,568 96,566 4,121,738
Average Outstanding Shares of CommonStock (during the period) 25,360,661 Thousand shares 25,362,375 Thousand shares /
3. Diluted Profit Attributable to Owners of Parent per Share of Common Stock is based on the following information.
Millions of yen Thousands of U.S. dollarsFor the fiscal years ended March 31, 2020 2019 2020Adjustment to Profit Attributable to Ownersof Parent ¥— ¥— $—
Increased Number of Shares of CommonStock 1,582 Thousand shares 4,522 Thousand shares /Stock Acquisition Rights 1,582 Thousand shares 4,522 Thousand shares /
Description of Dilutive Securities whichwere not included in the Calculation ofDiluted Profit Attributable to Owners ofParent per Share of Common Stock asthey have no Dilutive effects — — /
233
Per Share Information
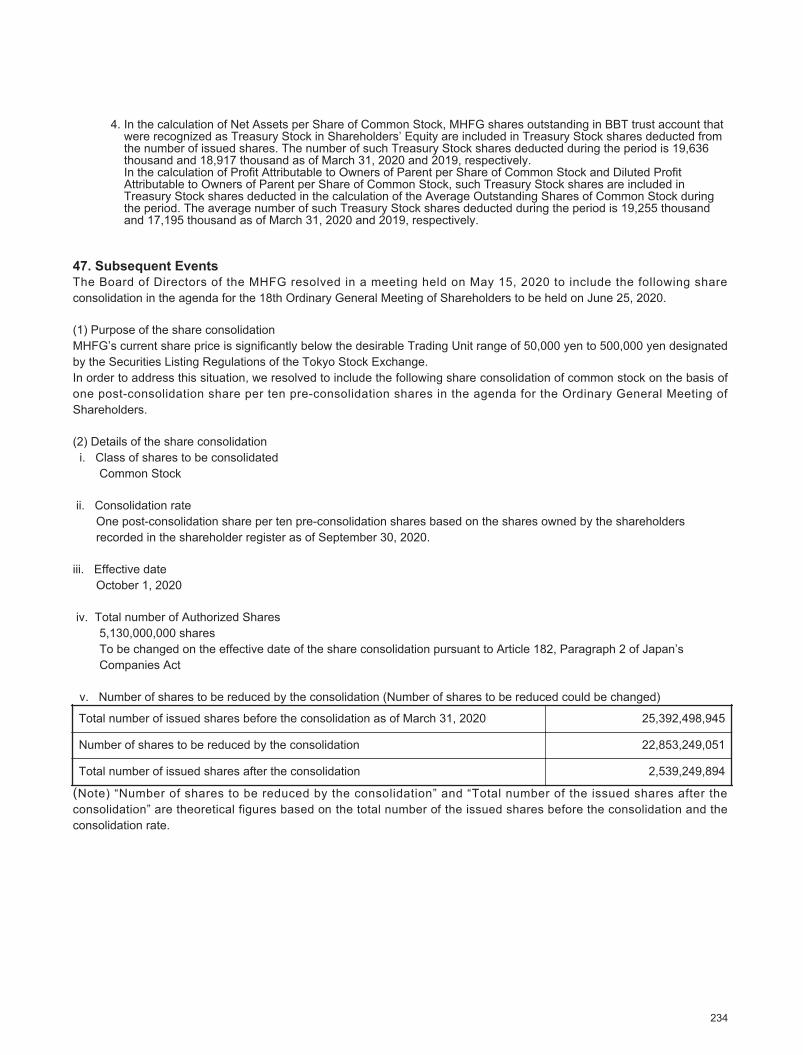
2020/09/07 16:49:02 / 20635244_株式会社みずほフィナンシャルグループ_総会その他(C)
4. In the calculation of Net Assets per Share of Common Stock, MHFG shares outstanding in BBT trust account that were recognized as Treasury Stock in Shareholders’ Equity are included in Treasury Stock shares deducted from the number of issued shares. The number of such Treasury Stock shares deducted during the period is 19,636 thousand and 18,917 thousand as of March 31, 2020 and 2019, respectively.In the calculation of Profit Attributable to Owners of Parent per Share of Common Stock and Diluted Profit Attributable to Owners of Parent per Share of Common Stock, such Treasury Stock shares are included in Treasury Stock shares deducted in the calculation of the Average Outstanding Shares of Common Stock during the period. The average number of such Treasury Stock shares deducted during the period is 19,255 thousand and 17,195 thousand as of March 31, 2020 and 2019, respectively.
47. Subsequent EventsThe Board of Directors of the MHFG resolved in a meeting held on May 15, 2020 to include the following share consolidation in the agenda for the 18th Ordinary General Meeting of Shareholders to be held on June 25, 2020.
(1) Purpose of the share consolidationMHFG’s current share price is significantly below the desirable Trading Unit range of 50,000 yen to 500,000 yen designated by the Securities Listing Regulations of the Tokyo Stock Exchange.In order to address this situation, we resolved to include the following share consolidation of common stock on the basis of one post-consolidation share per ten pre-consolidation shares in the agenda for the Ordinary General Meeting of Shareholders.
(2) Details of the share consolidation i. Class of shares to be consolidated Common Stock
ii. Consolidation rate One post-consolidation share per ten pre-consolidation shares based on the shares owned by the shareholders recorded in the shareholder register as of September 30, 2020.
iii. Effective date October 1, 2020
iv. Total number of Authorized Shares 5,130,000,000 shares To be changed on the effective date of the share consolidation pursuant to Article 182, Paragraph 2 of Japan’s Companies Act
v. Number of shares to be reduced by the consolidation (Number of shares to be reduced could be changed)
Total number of issued shares before the consolidation as of March 31, 2020 25,392,498,945
Number of shares to be reduced by the consolidation 22,853,249,051
Total number of issued shares after the consolidation 2,539,249,894
(Note) “Number of shares to be reduced by the consolidation” and “Total number of the issued shares after the consolidation” are theoretical figures based on the total number of the issued shares before the consolidation and the consolidation rate.
234
Per Share Information、Subsequent Events
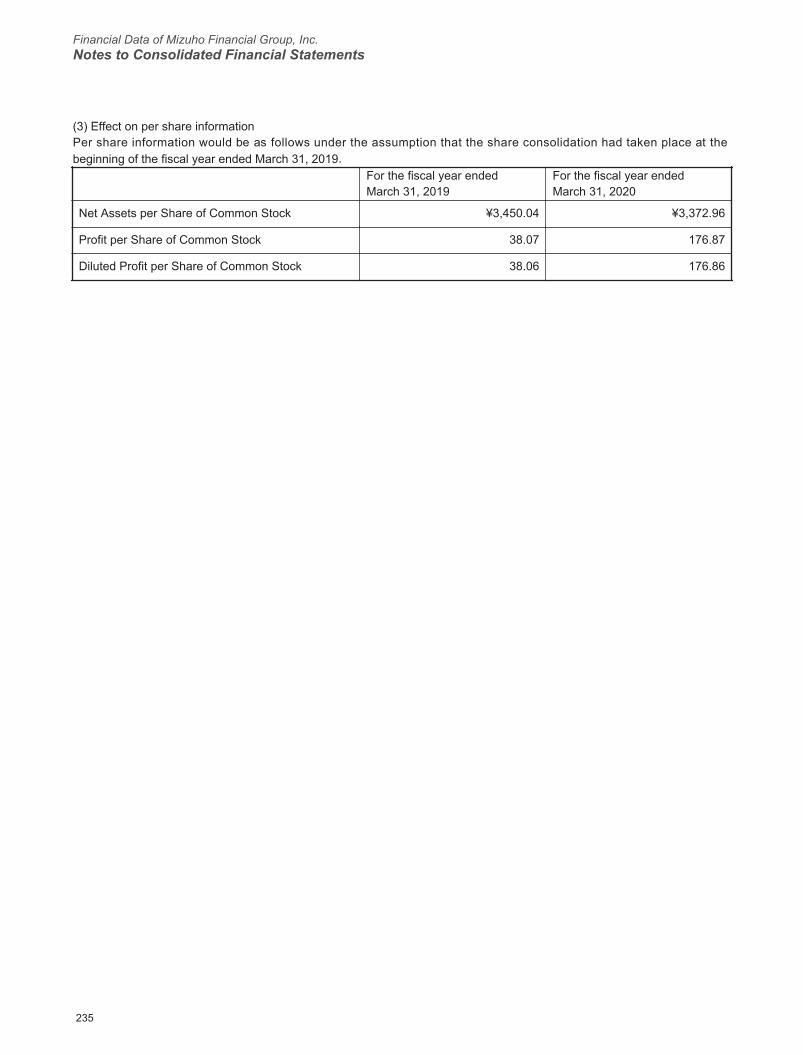
Financial Data of Mizuho Financial Group, Inc.Notes to Consolidated Financial Statements
2020/09/07 16:49:02 / 20635244_株式会社みずほフィナンシャルグループ_総会その他(C)
(3) Effect on per share informationPer share information would be as follows under the assumption that the share consolidation had taken place at the beginning of the fiscal year ended March 31, 2019.
For the fiscal year ended March 31, 2019
For the fiscal year ended March 31, 2020
Net Assets per Share of Common Stock ¥3,450.04 ¥3,372.96
Profit per Share of Common Stock 38.07 176.87
Diluted Profit per Share of Common Stock 38.06 176.86
235
Subsequent Events
2020/09/07 16:49:02 / 20635244_株式会社みずほフィナンシャルグループ_総会その他(C)
Non-Consolidated Financial Statements ofMizuho Financial Group, Inc. and Three Subsidiaries[Under Japanese GAAP]
Mizuho Financial Group, Inc.
237 Non-Consolidated Balance Sheet
238 Non-Consolidated Statement of Income
Mizuho Bank, Ltd.
239 Non-Consolidated Balance Sheet
241 Non-Consolidated Statement of Income
Mizuho Trust & Banking Co., Ltd.
242 Non-Consolidated Balance Sheet
244 Non-Consolidated Statement of Income
Mizuho Securities Co., Ltd.
245 Non-Consolidated Balance Sheet
248 Non-Consolidated Statement of Income
236
Non-Consolidated Financial Statements of Mizuho Financial Group, Inc. and Three Subsidiaries-Index

Non-Consolidated Financial Statements of Mizuho Financial Group, Inc. and Three Subsidiaries
Mizuho Financial Group, Inc.
2020/09/07 16:49:02 / 20635244_株式会社みずほフィナンシャルグループ_総会その他(C)
Non-Consolidated Balance Sheet
Millions of yenThousands of
U.S. dollarsAs of March 31, 2020 2019 2020AssetsCurrent Assets ¥ 90,273 ¥ 176,648 $ 829,487
Cash and Due from Banks 43,233 100,367 397,260Other Current Assets 47,039 76,281 432,227
Fixed Assets 12,733,504 11,460,467 117,003,623Tangible Fixed Assets 67,318 222,738 618,569Intangible Fixed Assets 8,117 11,072 74,590Investments in Subsidiaries and Affiliates 6,079,198 6,074,549 55,859,584Other Investments 6,578,869 5,152,106 60,450,880Total Assets ¥ 12,823,777 ¥ 11,637,116 $ 117,833,110
Liabilities and Net AssetsLiabilitiesCurrent Liabilities ¥ 893,384 ¥ 982,626 $ 8,208,992
Short-term Borrowings 860,000 945,505 7,902,233Other Current Liabilities 33,384 37,121 306,759
Non-Current Liabilities 6,567,949 5,135,769 60,350,546Total Liabilities 7,461,334 6,118,395 68,559,538
Net AssetsShareholders' Equity 5,362,232 5,518,013 49,271,643
Common Stock 2,256,767 2,256,767 20,736,631Capital Surplus 1,196,659 1,196,673 10,995,677
Capital Reserve 1,196,659 1,196,659 10,995,677Other Capital Surplus ― 13 ―
Retained Earnings 1,913,787 2,070,749 17,585,114Appropriated Reserve 4,350 4,350 39,970Other Retained Earnings 1,909,437 2,066,399 17,545,144
Retained Earnings Brought Forward 1,909,437 2,066,399 17,545,144Treasury Stock (4,982) (6,176) (45,779)
Valuation and Translation Adjustments (3) (0) (36)Net Unrealized Gains ( Losses) on Other Securities, net of Taxes (3) (0) (36)
Stock Acquisition Rights 213 707 1,965Total Net Assets 5,362,442 5,518,720 49,273,572Total Liabilities and Net Assets ¥ 12,823,777 ¥ 11,637,116 $ 117,833,110
Notes: 1. The amounts indicated in millions of yen are rounded down by truncating the figures below one million.2. The rate of ¥108.83=US$1.00, the foreign exchange rate on March 31, 2020, has been used for translation.
237
Non-Consolidated Balance Sheet

2020/09/07 16:49:02 / 20635244_株式会社みずほフィナンシャルグループ_総会その他(C)
Non-Consolidated Statement of Income
Millions of yenThousands of
U.S. dollarsFor the Fiscal Years ended March 31, 2020 2019 2020Operating Income ¥ 75,424 ¥ 331,315 $ 693,046
Cash Dividends Received from Subsidiaries and Affiliates 36,673 291,116 336,981Fee and Commission Income Received from Subsidiaries and Affiliates 38,750 40,198 356,065
Operating Expenses 38,951 40,679 357,909General and Administrative Expenses 38,951 40,679 357,909
Operating Profits 36,472 290,635 335,137Non-Operating Income 135,156 196,744 1,241,904Non-Operating Expenses 131,631 116,300 1,209,516Income before Income Taxes 39,997 371,078 367,525
Income Taxes:Current 29 22,606 267Deferred 5,912 (6,104) 54,326
Net Income ¥ 34,056 ¥ 354,576 $ 312,932Notes: 1. The amounts indicated in millions of yen are rounded down by truncating the figures below one million.
2. The rate of ¥108.83=US$1.00, the foreign exchange rate on March 31, 2020, has been used for translation.
238
Non-Consolidated Statement of Income

Non-Consolidated Financial Statements of Mizuho Financial Group, Inc. and Three Subsidiaries
Mizuho Bank, Ltd.
2020/09/07 16:49:02 / 20635244_株式会社みずほフィナンシャルグループ_総会その他(C)
Non-Consolidated Balance Sheet
Millions of yenThousands of
U.S. dollarsAs of March 31, 2020 2019 2020AssetsCash and Due from Banks ¥38,833,234 ¥42,044,263 $356,824,719Call Loans 958,359 516,085 8,806,024Receivables under Resale AgreementsGuarantee Deposits Paid under Securities Borrowing Transactions
8,599,865122,001
4,226,040100,501
79,021,0921,121,028
Other Debt Purchased 430,330 491,276 3,954,149Trading Assets 5,013,413 3,708,952 46,066,466Money Held in Trust 503 503 4,629Securities 34,372,765 29,475,876 315,839,061Loans and Bills Discounted 80,871,269 76,047,363 743,097,207Foreign Exchange Assets 1,966,593 2,043,874 18,070,328Other Assets 8,103,925 5,897,245 74,464,076Tangible Fixed Assets 843,058 729,129 7,746,567
Buildings 244,714 252,623 2,248,597Land 515,264 396,379 4,734,579Lease Assets 12,559 21,680 115,407Construction in Progress 29,830 14,287 274,101Other Tangible Fixed Assets 40,689 44,159 373,883
Intangible Fixed Assets 357,432 354,116 3,284,318Software 301,586 84,065 2,771,169Lease Assets 4,061 5,337 37,317Other Intangible Fixed Assets 51,784 264,713 475,832
Prepaid Pension Cost 556,273 481,875 5,111,399Deferred Tax Assets 36,950 ― 339,521Customers' Liabilities for Acceptances and Guarantees 6,535,786 6,492,905 60,055,005Reserves for Possible Losses on Loans (385,129) (242,076) (3,538,817)Reserve for Possible Losses on Investments (2,458) (370) (22,592)
Total Assets ¥187,214,174 ¥172,367,564 $1,720,244,180
239
Non-Consolidated Balance Sheet
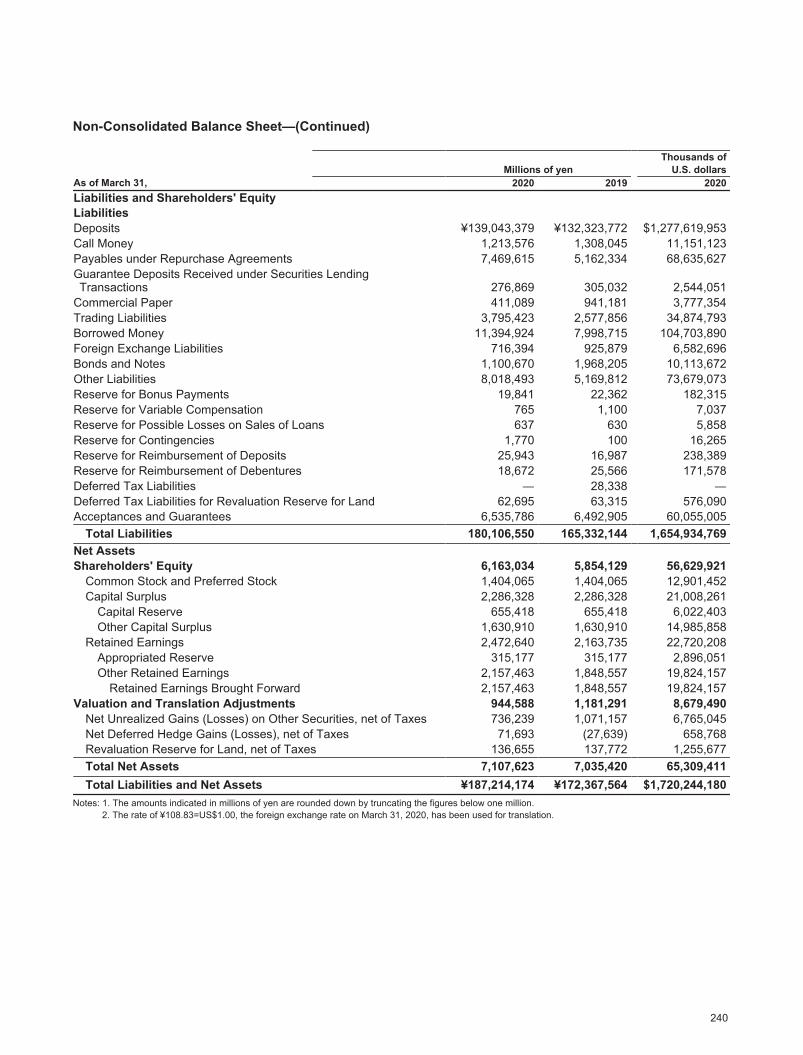
2020/09/07 16:49:02 / 20635244_株式会社みずほフィナンシャルグループ_総会その他(C)
Non-Consolidated Balance Sheet—(Continued)
Millions of yenThousands of
U.S. dollarsAs of March 31, 2020 2019 2020Liabilities and Shareholders' EquityLiabilitiesDeposits ¥139,043,379 ¥132,323,772 $1,277,619,953Call Money 1,213,576 1,308,045 11,151,123Payables under Repurchase Agreements 7,469,615 5,162,334 68,635,627Guarantee Deposits Received under Securities LendingTransactions 276,869 305,032 2,544,051
Commercial Paper 411,089 941,181 3,777,354Trading Liabilities 3,795,423 2,577,856 34,874,793Borrowed Money 11,394,924 7,998,715 104,703,890Foreign Exchange Liabilities 716,394 925,879 6,582,696Bonds and Notes 1,100,670 1,968,205 10,113,672Other Liabilities 8,018,493 5,169,812 73,679,073Reserve for Bonus Payments 19,841 22,362 182,315Reserve for Variable Compensation 765 1,100 7,037Reserve for Possible Losses on Sales of Loans 637 630 5,858Reserve for Contingencies 1,770 100 16,265Reserve for Reimbursement of Deposits 25,943 16,987 238,389Reserve for Reimbursement of Debentures 18,672 25,566 171,578Deferred Tax Liabilities ― 28,338 ―Deferred Tax Liabilities for Revaluation Reserve for Land 62,695 63,315 576,090Acceptances and Guarantees 6,535,786 6,492,905 60,055,005
Total Liabilities 180,106,550 165,332,144 1,654,934,769Net AssetsShareholders' Equity 6,163,034 5,854,129 56,629,921
Common Stock and Preferred Stock 1,404,065 1,404,065 12,901,452Capital Surplus 2,286,328 2,286,328 21,008,261
Capital Reserve 655,418 655,418 6,022,403Other Capital Surplus 1,630,910 1,630,910 14,985,858
Retained Earnings 2,472,640 2,163,735 22,720,208Appropriated Reserve 315,177 315,177 2,896,051Other Retained Earnings 2,157,463 1,848,557 19,824,157
Retained Earnings Brought Forward 2,157,463 1,848,557 19,824,157Valuation and Translation Adjustments 944,588 1,181,291 8,679,490
Net Unrealized Gains (Losses) on Other Securities, net of Taxes 736,239 1,071,157 6,765,045Net Deferred Hedge Gains (Losses), net of Taxes 71,693 (27,639) 658,768Revaluation Reserve for Land, net of Taxes 136,655 137,772 1,255,677Total Net Assets 7,107,623 7,035,420 65,309,411Total Liabilities and Net Assets ¥187,214,174 ¥172,367,564 $1,720,244,180
Notes: 1. The amounts indicated in millions of yen are rounded down by truncating the figures below one million.2. The rate of ¥108.83=US$1.00, the foreign exchange rate on March 31, 2020, has been used for translation.
240
Non-Consolidated Balance Sheet

Non-Consolidated Financial Statements of Mizuho Financial Group, Inc. and Three SubsidiariesMizuho Bank, Ltd.
2020/09/07 16:49:02 / 20635244_株式会社みずほフィナンシャルグループ_総会その他(C)
Non-Consolidated Statement of Income
Millions of yenThousands of
U.S. dollarsFor the Fiscal Years ended March 31, 2020 2019 2020Income
Interest Income ¥1,642,866 ¥1,678,702 $15,095,716Loans and Bills Discounted 1,113,358 1,126,596 10,232,094Securities 258,265 281,807 2,373,114
Fee and Commission Income 476,787 471,196 4,381,030Trading Income 150,596 61,855 1,383,780Other Operating Income 238,043 158,466 2,187,293Other Income 255,203 257,901 2,344,970Total Income 2,763,497 2,628,122 25,392,789
ExpensesInterest Expenses 1,013,852 1,028,946 9,315,929
Deposits 570,830 577,801 5,245,162Fee and Commission Expenses 91,650 90,934 842,146Trading Expenses 809 377 7,439Other Operating Expenses 97,383 174,935 894,819General and Administrative Expenses 789,552 840,607 7,254,920Other Expenses 356,673 699,784 3,277,348Total Expenses 2,349,922 2,835,586 21,592,601
Income (Loss) before Income Taxes 413,574 (207,463) 3,800,188Income Taxes:
Current 109,151 94,923 1,002,951Deferred (3,364) (157,943) (30,917)
Net Income (Loss) ¥307,788 ¥(144,444) $2,828,154
Notes: 1. The amounts indicated in millions of yen are rounded down by truncating the figures below one million.2. The rate of ¥108.83=US$1.00, the foreign exchange rate on March 31, 2020, has been used for translation.
241
Non-Consolidated Statement of Income
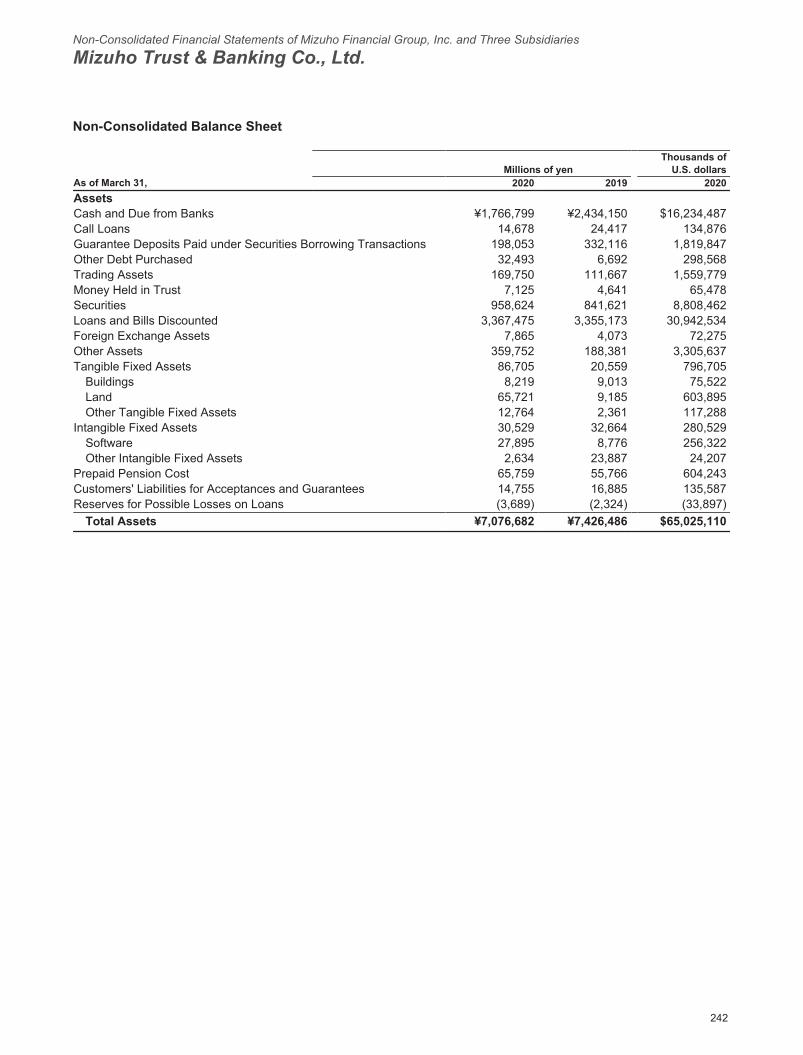
Non-Consolidated Financial Statements of Mizuho Financial Group, Inc. and Three Subsidiaries
Mizuho Trust & Banking Co., Ltd.
2020/09/07 16:49:02 / 20635244_株式会社みずほフィナンシャルグループ_総会その他(C)
Non-Consolidated Balance Sheet
Millions of yenThousands of
U.S. dollarsAs of March 31, 2020 2019 2020AssetsCash and Due from Banks ¥1,766,799 ¥2,434,150 $16,234,487Call Loans 14,678 24,417 134,876Guarantee Deposits Paid under Securities Borrowing Transactions 198,053 332,116 1,819,847Other Debt Purchased 32,493 6,692 298,568Trading Assets 169,750 111,667 1,559,779Money Held in Trust 7,125 4,641 65,478Securities 958,624 841,621 8,808,462Loans and Bills Discounted 3,367,475 3,355,173 30,942,534Foreign Exchange Assets 7,865 4,073 72,275Other Assets 359,752 188,381 3,305,637Tangible Fixed Assets 86,705 20,559 796,705
Buildings 8,219 9,013 75,522Land 65,721 9,185 603,895Other Tangible Fixed Assets 12,764 2,361 117,288
Intangible Fixed Assets 30,529 32,664 280,529Software 27,895 8,776 256,322Other Intangible Fixed Assets 2,634 23,887 24,207
Prepaid Pension Cost 65,759 55,766 604,243Customers' Liabilities for Acceptances and Guarantees 14,755 16,885 135,587Reserves for Possible Losses on Loans (3,689) (2,324) (33,897)
Total Assets ¥7,076,682 ¥7,426,486 $65,025,110
242
Non-Consolidated Balance Sheet

Non-Consolidated Financial Statements of Mizuho Financial Group, Inc. and Three SubsidiariesMizuho Trust & Banking Co., Ltd.
2020/09/07 16:49:02 / 20635244_株式会社みずほフィナンシャルグループ_総会その他(C)
Non-Consolidated Balance Sheet―(Continued)
Millions of yenThousands of
U.S. dollarsAs of March 31, 2020 2019 2020Liabilities and Shareholders' EquityLiabilitiesDeposits ¥3,761,075 ¥3,819,608 $34,559,182Call Money 807,706 947,104 7,421,727Payables under Repurchase Agreements ― 22,198 ―Guarantee Deposits Received under Securities LendingTransactions 289,789 362,246 2,662,777
Trading Liabilities 170,146 107,096 1,563,412Borrowed Money 255,860 379,706 2,351,014Foreign Exchange Liabilities 23 ― 214Bonds and Notes 10,000 10,000 91,886Due to Trust Accounts 1,055,510 1,102,073 9,698,710Other Liabilities 142,457 68,806 1,308,996Reserve for Bonus Payments 2,153 2,125 19,792Reserve for Variable Compensation 368 467 3,383Reserve for Reimbursement of Deposits 1,907 2,081 17,525Deferred Tax Liabilities 3,220 6,631 29,594Acceptances and Guarantees 14,755 16,885 135,587
Total Liabilities 6,514,977 6,847,033 59,863,799Net AssetsShareholders' Equity 516,339 504,764 4,744,463
Common Stock and Preferred Stock 247,369 247,369 2,272,992Capital Surplus 15,505 15,505 142,472
Capital Reserve 15,505 15,505 142,472Retained Earnings 253,465 241,889 2,328,999
Appropriated Reserve 41,484 36,719 381,186Other Retained Earnings 211,980 205,170 1,947,813
Retained Earnings Brought Forward 211,980 205,170 1,947,813Valuation and Translation Adjustments 45,365 74,687 416,848
Net Unrealized Gains (Losses) on Other Securities, net of Taxes 49,981 76,295 459,262Net Deferred Hedge Gains (Losses), net of Taxes (4,615) (1,608) (42,414)Total Net Assets 561,705 579,452 5,161,311Total Liabilities and Net Assets ¥7,076,682 ¥7,426,486 $65,025,110
Notes: 1. The amounts indicated in millions of yen are rounded down by truncating the figures below one million.2. The rate of ¥108.83=US$1.00, the foreign exchange rate on March 31, 2020, has been used for translation.
243
Non-Consolidated Balance Sheet
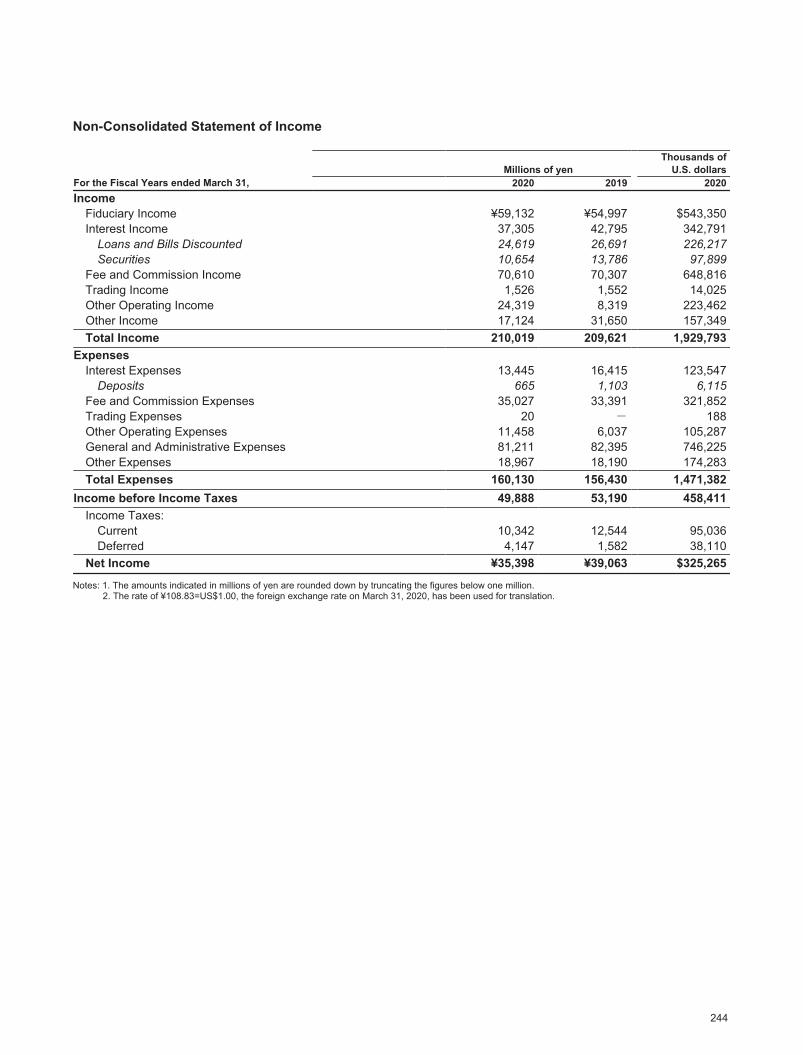
2020/09/07 16:49:02 / 20635244_株式会社みずほフィナンシャルグループ_総会その他(C)
Non-Consolidated Statement of Income
Millions of yenThousands of
U.S. dollarsFor the Fiscal Years ended March 31, 2020 2019 2020Income
Fiduciary Income ¥59,132 ¥54,997 $543,350Interest Income 37,305 42,795 342,791
Loans and Bills Discounted 24,619 26,691 226,217Securities 10,654 13,786 97,899
Fee and Commission Income 70,610 70,307 648,816Trading Income 1,526 1,552 14,025Other Operating Income 24,319 8,319 223,462Other Income 17,124 31,650 157,349Total Income 210,019 209,621 1,929,793
ExpensesInterest Expenses 13,445 16,415 123,547
Deposits 665 1,103 6,115Fee and Commission Expenses 35,027 33,391 321,852Trading Expenses 20 - 188Other Operating Expenses 11,458 6,037 105,287General and Administrative Expenses 81,211 82,395 746,225Other Expenses 18,967 18,190 174,283Total Expenses 160,130 156,430 1,471,382
Income before Income Taxes 49,888 53,190 458,411Income Taxes:
Current 10,342 12,544 95,036Deferred 4,147 1,582 38,110
Net Income ¥35,398 ¥39,063 $325,265
Notes: 1. The amounts indicated in millions of yen are rounded down by truncating the figures below one million.2. The rate of ¥108.83=US$1.00, the foreign exchange rate on March 31, 2020, has been used for translation.
244
Non-Consolidated Statement of Income

Non-Consolidated Financial Statements of Mizuho Financial Group, Inc. and Three Subsidiaries
Mizuho Securities Co., Ltd.
2020/09/07 16:49:02 / 20635244_株式会社みずほフィナンシャルグループ_総会その他(C)
Non-Consolidated Balance Sheet
Millions of yenThousands of
U.S. dollarsAs of March 31, 2020 2019 2020AssetsCurrent Assets
Cash and Due from Banks ¥533,288 ¥388,516 $4,900,202Cash Segregated as Deposits for Customers and Others 387,043 335,712 3,556,403Trading Assets 6,461,814 6,061,110 59,375,308
Trading Securities and Others 2,366,879 3,064,131 21,748,414Derivatives 4,094,934 2,996,979 37,626,894
Operating Investment Securities 33,430 28,640 307,178Receivables Related to Margin Transactions 22,055 34,162 202,663
Loans Receivable under Margin Transactions 20,172 23,975 185,355Cash Collateral for Borrowed Securities under Margin Transactions 1,883 10,187 17,308
Collateralized Short-term Financing Agreements-receivable 4,296,231 3,871,953 39,476,539Deposits Paid for Securities Borrowed 2,131,439 2,353,557 19,585,034Securities Purchased under Agreements to Resell 2,164,792 1,518,395 19,891,505
Advances Paid 579 488 5,322Short-term Guarantee Deposits 544,402 387,042 5,002,320Securities: Fail to Deliver 12,971 9,613 119,192Short-term Loans Receivable 37,298 52,652 342,721Advance Payments 275 733 2,529Prepaid Expenses 3,080 3,208 28,309Accounts Receivable-other 10,756 7,082 98,838Accrued income 34,274 35,006 314,933Other Current Assets 3,040 1,410 27,942Less: Allowance for Doubtful Accounts (7) (3) (67)Total Current Assets 12,380,536 11,217,332 113,760,332
Noncurrent AssetsTangible Fixed Assets 11,196 12,527 102,885Intangible Fixed Assets 61,637 50,829 566,365Investments and Other Assets 302,584 315,137 2,780,343
Investment Securities 237,673 244,677 2,183,897Long-term Guarantee Deposits 10,572 10,966 97,144Prepaid Pension Cost 21,275 18,616 195,491Deferred Tax Assets 18,739 19,790 172,189Other 18,308 26,637 168,232Less: Allowance for Doubtful Accounts (3,435) (3,488) (31,571)Less: Allowance for Possible Losses on Securities (548) (2,062) (5,039)
Total Noncurrent Assets 375,419 378,493 3,449,593Total Assets ¥12,755,956 ¥11,595,825 $117,209,925
245
Non-Consolidated Balance Sheet
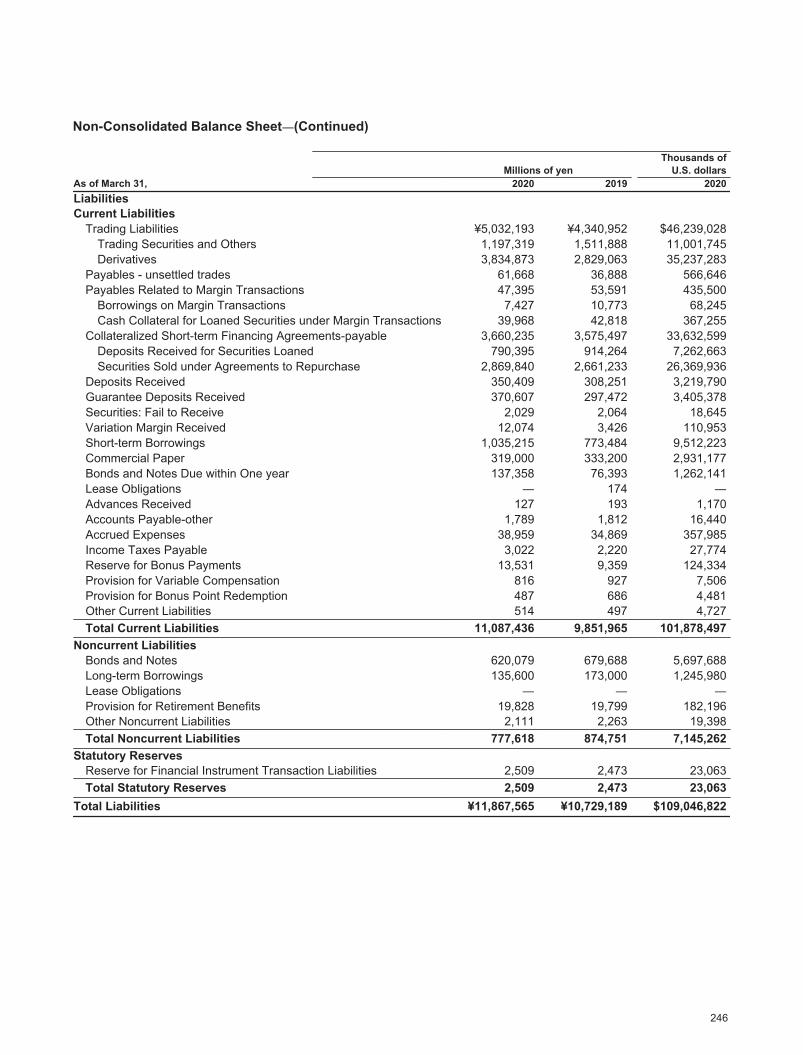
2020/09/07 16:49:02 / 20635244_株式会社みずほフィナンシャルグループ_総会その他(C)
Non-Consolidated Balance Sheet―(Continued)
Millions of yenThousands of
U.S. dollarsAs of March 31, 2020 2019 2020LiabilitiesCurrent Liabilities
Trading Liabilities ¥5,032,193 ¥4,340,952 $46,239,028Trading Securities and Others 1,197,319 1,511,888 11,001,745Derivatives 3,834,873 2,829,063 35,237,283
Payables - unsettled trades 61,668 36,888 566,646Payables Related to Margin Transactions 47,395 53,591 435,500
Borrowings on Margin Transactions 7,427 10,773 68,245Cash Collateral for Loaned Securities under Margin Transactions 39,968 42,818 367,255
Collateralized Short-term Financing Agreements-payable 3,660,235 3,575,497 33,632,599Deposits Received for Securities Loaned 790,395 914,264 7,262,663Securities Sold under Agreements to Repurchase 2,869,840 2,661,233 26,369,936
Deposits Received 350,409 308,251 3,219,790Guarantee Deposits Received 370,607 297,472 3,405,378Securities: Fail to Receive 2,029 2,064 18,645Variation Margin Received 12,074 3,426 110,953Short-term Borrowings 1,035,215 773,484 9,512,223Commercial Paper 319,000 333,200 2,931,177Bonds and Notes Due within One year 137,358 76,393 1,262,141Lease Obligations ― 174 ―Advances Received 127 193 1,170Accounts Payable-other 1,789 1,812 16,440Accrued Expenses 38,959 34,869 357,985Income Taxes Payable 3,022 2,220 27,774Reserve for Bonus Payments 13,531 9,359 124,334Provision for Variable Compensation 816 927 7,506Provision for Bonus Point Redemption 487 686 4,481Other Current Liabilities 514 497 4,727Total Current Liabilities 11,087,436 9,851,965 101,878,497
Noncurrent LiabilitiesBonds and Notes 620,079 679,688 5,697,688Long-term Borrowings 135,600 173,000 1,245,980Lease Obligations ― ― ―Provision for Retirement Benefits 19,828 19,799 182,196Other Noncurrent Liabilities 2,111 2,263 19,398Total Noncurrent Liabilities 777,618 874,751 7,145,262
Statutory ReservesReserve for Financial Instrument Transaction Liabilities 2,509 2,473 23,063Total Statutory Reserves 2,509 2,473 23,063
Total Liabilities ¥11,867,565 ¥10,729,189 $109,046,822
246
Non-Consolidated Balance Sheet

Non-Consolidated Financial Statements of Mizuho Financial Group, Inc. and Three SubsidiariesMizuho Securities Co., Ltd.
2020/09/07 16:49:02 / 20635244_株式会社みずほフィナンシャルグループ_総会その他(C)
Non-Consolidated Balance Sheet―(Continued)
Millions of yenThousands of
U.S. dollarsAs of March 31, 2020 2019 2020Net AssetsShareholders' Equity
Common Stock ¥125,167 ¥125,167 $1,150,118Capital Surplus
Additional Paid in Capital 285,831 285,831 2,626,403Other Capital Surplus 95,817 95,817 880,437
Total Capital Surpluses 381,649 381,649 3,506,840Retained Earnings
Other Retained EarningsRetained Earnings Brought Forward 371,261 346,585 3,411,390
Total Retained Earnings 371,261 346,585 3,411,390Total Shareholders’ Equity 878,078 853,401 8,068,348
Valuation and Translation AdjustmentsNet Unrealized Gains on (Operating) Investment Securities, net of Tax 20,066 23,023 184,384
Net Deferred Gains or Losses on Hedges, net of Tax (9,754) (9,789) (89,629)Total Valuation and Translation Adjustments 10,312 13,233 94,755
Total Net Assets 888,390 866,635 8,163,103Total Liabilities and Net Assets ¥12,755,956 ¥11,595,825 $117,209,925Notes: 1. The amounts indicated in millions of yen are rounded down by truncating the figures below one million.
2. The rate of ¥108.83=US$1.00, the foreign exchange rate on March 31, 2020, has been used for translation.
247
Non-Consolidated Balance Sheet
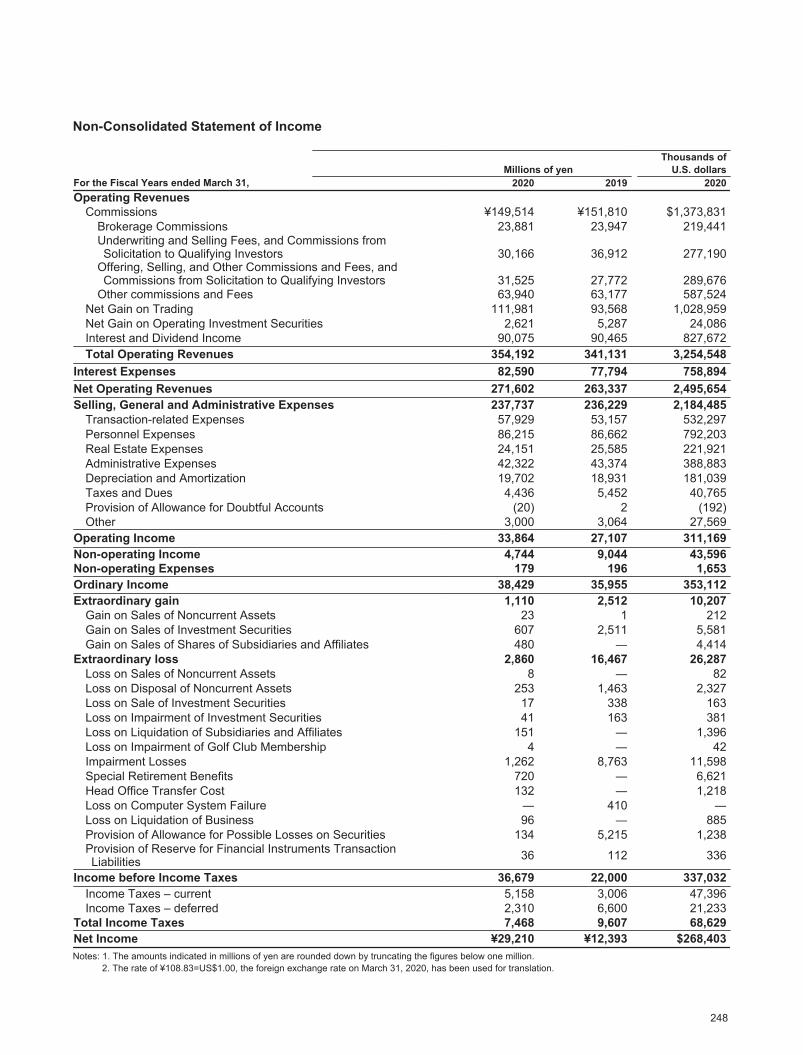
2020/09/07 16:49:02 / 20635244_株式会社みずほフィナンシャルグループ_総会その他(C)
Non-Consolidated Statement of Income
Millions of yenThousands of
U.S. dollarsFor the Fiscal Years ended March 31, 2020 2019 2020Operating Revenues
Commissions ¥149,514 ¥151,810 $1,373,831Brokerage Commissions 23,881 23,947 219,441Underwriting and Selling Fees, and Commissions from Solicitation to Qualifying Investors 30,166 36,912 277,190
Offering, Selling, and Other Commissions and Fees, and Commissions from Solicitation to Qualifying Investors 31,525 27,772 289,676
Other commissions and Fees 63,940 63,177 587,524Net Gain on Trading 111,981 93,568 1,028,959Net Gain on Operating Investment Securities 2,621 5,287 24,086Interest and Dividend Income 90,075 90,465 827,672Total Operating Revenues 354,192 341,131 3,254,548
Interest Expenses 82,590 77,794 758,894Net Operating Revenues 271,602 263,337 2,495,654Selling, General and Administrative Expenses 237,737 236,229 2,184,485
Transaction-related Expenses 57,929 53,157 532,297Personnel Expenses 86,215 86,662 792,203Real Estate Expenses 24,151 25,585 221,921Administrative Expenses 42,322 43,374 388,883Depreciation and Amortization 19,702 18,931 181,039Taxes and Dues 4,436 5,452 40,765Provision of Allowance for Doubtful Accounts (20) 2 (192)Other 3,000 3,064 27,569
Operating Income 33,864 27,107 311,169Non-operating Income 4,744 9,044 43,596Non-operating Expenses 179 196 1,653Ordinary Income 38,429 35,955 353,112Extraordinary gain 1,110 2,512 10,207
Gain on Sales of Noncurrent Assets 23 1 212Gain on Sales of Investment Securities 607 2,511 5,581Gain on Sales of Shares of Subsidiaries and Affiliates 480 ― 4,414
Extraordinary loss 2,860 16,467 26,287Loss on Sales of Noncurrent Assets 8 ― 82Loss on Disposal of Noncurrent Assets 253 1,463 2,327Loss on Sale of Investment Securities 17 338 163Loss on Impairment of Investment Securities 41 163 381Loss on Liquidation of Subsidiaries and Affiliates 151 ― 1,396Loss on Impairment of Golf Club Membership 4 ― 42Impairment Losses 1,262 8,763 11,598Special Retirement Benefits 720 ― 6,621Head Office Transfer Cost 132 ― 1,218Loss on Computer System Failure ― 410 ―Loss on Liquidation of Business 96 ― 885Provision of Allowance for Possible Losses on Securities 134 5,215 1,238Provision of Reserve for Financial Instruments Transaction Liabilities 36 112 336
Income before Income Taxes 36,679 22,000 337,032Income Taxes – current 5,158 3,006 47,396Income Taxes – deferred 2,310 6,600 21,233
Total Income Taxes 7,468 9,607 68,629Net Income ¥29,210 ¥12,393 $268,403Notes: 1. The amounts indicated in millions of yen are rounded down by truncating the figures below one million.
2. The rate of ¥108.83=US$1.00, the foreign exchange rate on March 31, 2020, has been used for translation.
248
Non-Consolidated Statement of Income

2020/09/07 16:50:34 / 20635245_株式会社みずほフィナンシャルグループ_総会その他(C)
249
白頁
2020/09/07 16:50:34 / 20635245_株式会社みずほフィナンシャルグループ_総会その他(C)
Basel Regulatory Disclosures
251 Key Metrics252 Status of Mizuho Financial Group's
Consolidated Capital Adequacy252 Scope of Consolidation
253 Risk-based Capital
270 Summary of Risk Management and Risk-weightedAssets (RWA)
272 Linkages between Financial Statementsand Regulatory Exposures
277 Credit Risk
297 Counterparty Credit Risk
306 Securitization Exposures
313 Market Risk
316 Investment or Equity Exposure
316 Operational Risk
317 Composition of Leverage Ratio
318 TLAC Regulations
323 Geographical distribution of credit exposures usedin the countercyclical capital buffer
323 Indicators for Assessing Global SystemicallyImportant Banks (G-SIBs)
324 Status of Sound Management of Liquidity Risk324 Liquidity Coverage Ratio
326 Status of Major Liquid Assets
326 Status of Major Funding
327 Compensation of Directors and Employees
250
Basel Regulatory Disclosures
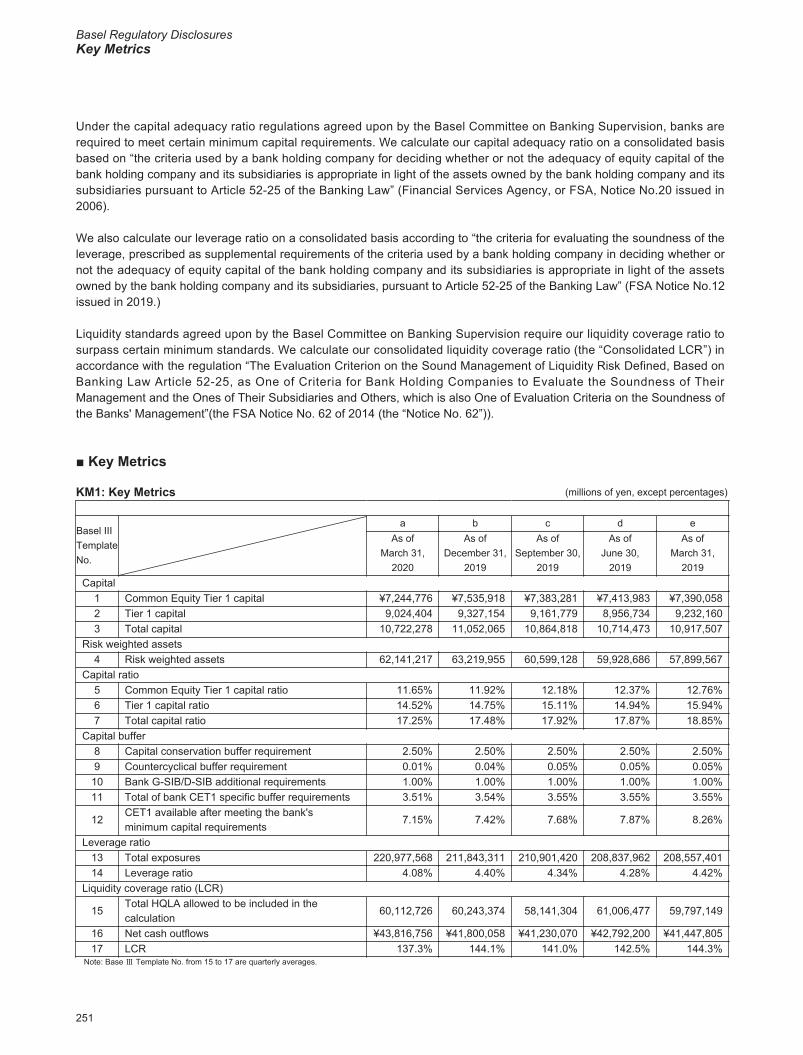
Basel Regulatory DisclosuresKey Metrics
2020/09/07 16:50:34 / 20635245_株式会社みずほフィナンシャルグループ_総会その他(C)
Under the capital adequacy ratio regulations agreed upon by the Basel Committee on Banking Supervision, banks are required to meet certain minimum capital requirements. We calculate our capital adequacy ratio on a consolidated basis based on “the criteria used by a bank holding company for deciding whether or not the adequacy of equity capital of the bank holding company and its subsidiaries is appropriate in light of the assets owned by the bank holding company and its subsidiaries pursuant to Article 52-25 of the Banking Law” (Financial Services Agency, or FSA, Notice No.20 issued in 2006).
We also calculate our leverage ratio on a consolidated basis according to “the criteria for evaluating the soundness of the leverage, prescribed as supplemental requirements of the criteria used by a bank holding company in deciding whether or not the adequacy of equity capital of the bank holding company and its subsidiaries is appropriate in light of the assets owned by the bank holding company and its subsidiaries, pursuant to Article 52-25 of the Banking Law” (FSA Notice No.12 issued in 2019.)
Liquidity standards agreed upon by the Basel Committee on Banking Supervision require our liquidity coverage ratio to surpass certain minimum standards. We calculate our consolidated liquidity coverage ratio (the “Consolidated LCR”) in accordance with the regulation “The Evaluation Criterion on the Sound Management of Liquidity Risk Defined, Based on Banking Law Article 52-25, as One of Criteria for Bank Holding Companies to Evaluate the Soundness of Their Management and the Ones of Their Subsidiaries and Others, which is also One of Evaluation Criteria on the Soundness of the Banks' Management”(the FSA Notice No. 62 of 2014 (the “Notice No. 62”)).
■ Key Metrics
KM1: Key Metrics (millions of yen, except percentages)
Basel IIITemplateNo.
a b c d eAs of
March 31,2020
As ofDecember 31,
2019
As ofSeptember 30,
2019
As ofJune 30,
2019
As ofMarch 31,
2019Capital
1 Common Equity Tier 1 capital ¥7,244,776 ¥7,535,918 ¥7,383,281 ¥7,413,983 ¥7,390,0582 Tier 1 capital 9,024,404 9,327,154 9,161,779 8,956,734 9,232,1603 Total capital 10,722,278 11,052,065 10,864,818 10,714,473 10,917,507
Risk weighted assets4 Risk weighted assets 62,141,217 63,219,955 60,599,128 59,928,686 57,899,567
Capital ratio5 Common Equity Tier 1 capital ratio 11.65% 11.92% 12.18% 12.37% 12.76%6 Tier 1 capital ratio 14.52% 14.75% 15.11% 14.94% 15.94%7 Total capital ratio 17.25% 17.48% 17.92% 17.87% 18.85%
Capital buffer8 Capital conservation buffer requirement 2.50% 2.50% 2.50% 2.50% 2.50%9 Countercyclical buffer requirement 0.01% 0.04% 0.05% 0.05% 0.05%
10 Bank G-SIB/D-SIB additional requirements 1.00% 1.00% 1.00% 1.00% 1.00%11 Total of bank CET1 specific buffer requirements 3.51% 3.54% 3.55% 3.55% 3.55%
12CET1 available after meeting the bank's minimum capital requirements
7.15% 7.42% 7.68% 7.87% 8.26%
Leverage ratio13 Total exposures 220,977,568 211,843,311 210,901,420 208,837,962 208,557,40114 Leverage ratio 4.08% 4.40% 4.34% 4.28% 4.42%
Liquidity coverage ratio (LCR)
15Total HQLA allowed to be included in the calculation
60,112,726 60,243,374 58,141,304 61,006,477 59,797,149
16 Net cash outflows ¥43,816,756 ¥41,800,058 ¥41,230,070 ¥42,792,200 ¥41,447,80517 LCR 137.3% 144.1% 141.0% 142.5% 144.3%
Note: Base Ⅲ Template No. from 15 to 17 are quarterly averages.
251
Key Metrics
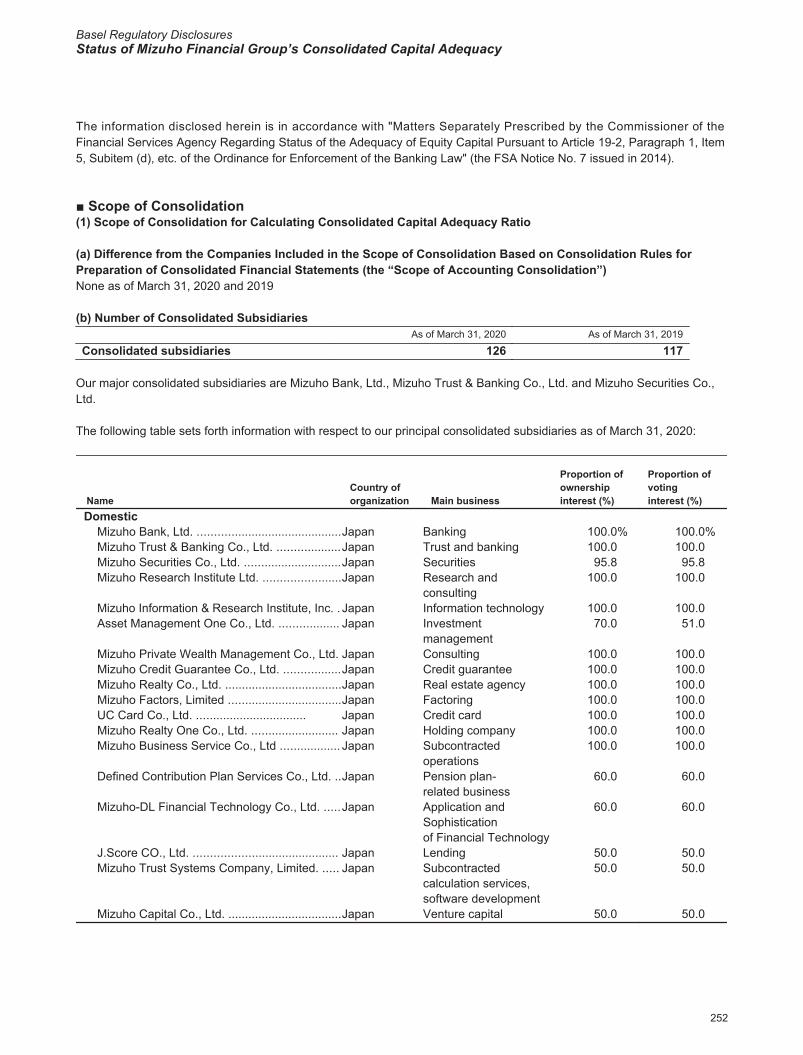
Basel Regulatory DisclosuresStatus of Mizuho Financial Group’s Consolidated Capital Adequacy
2020/09/07 16:50:34 / 20635245_株式会社みずほフィナンシャルグループ_総会その他(C)
The information disclosed herein is in accordance with "Matters Separately Prescribed by the Commissioner of the Financial Services Agency Regarding Status of the Adequacy of Equity Capital Pursuant to Article 19-2, Paragraph 1, Item 5, Subitem (d), etc. of the Ordinance for Enforcement of the Banking Law" (the FSA Notice No. 7 issued in 2014).
■ Scope of Consolidation(1) Scope of Consolidation for Calculating Consolidated Capital Adequacy Ratio
(a) Difference from the Companies Included in the Scope of Consolidation Based on Consolidation Rules for Preparation of Consolidated Financial Statements (the “Scope of Accounting Consolidation”)None as of March 31, 2020 and 2019
(b) Number of Consolidated SubsidiariesAs of March 31, 2020 As of March 31, 2019
Consolidated subsidiaries 126 117
Our major consolidated subsidiaries are Mizuho Bank, Ltd., Mizuho Trust & Banking Co., Ltd. and Mizuho Securities Co., Ltd.
The following table sets forth information with respect to our principal consolidated subsidiaries as of March 31, 2020:
NameCountry oforganization Main business
Proportion ofownershipinterest (%)
Proportion ofvotinginterest (%)
DomesticMizuho Bank, Ltd. ...........................................Japan Banking 100.0% 100.0%Mizuho Trust & Banking Co., Ltd. ...................Japan Trust and banking 100.0 100.0Mizuho Securities Co., Ltd. .............................Japan Securities 95.8 95.8Mizuho Research Institute Ltd. .......................Japan Research and
consulting100.0 100.0
Mizuho Information & Research Institute, Inc. . Japan Information technology 100.0 100.0Asset Management One Co., Ltd. .................. Japan Investment
management70.0 51.0
Mizuho Private Wealth Management Co., Ltd. Japan Consulting 100.0 100.0Mizuho Credit Guarantee Co., Ltd. .................Japan Credit guarantee 100.0 100.0Mizuho Realty Co., Ltd. ...................................Japan Real estate agency 100.0 100.0Mizuho Factors, Limited ..................................Japan Factoring 100.0 100.0UC Card Co., Ltd. ................................. Japan Credit card 100.0 100.0Mizuho Realty One Co., Ltd. ..........................Mizuho Business Service Co., Ltd ..................
JapanJapan
Holding companySubcontracted operations
100.0100.0
100.0100.0
Defined Contribution Plan Services Co., Ltd. ..Japan Pension plan-related business
60.0 60.0
Mizuho-DL Financial Technology Co., Ltd. .....Japan Application and Sophisticationof Financial Technology
60.0 60.0
J.Score CO., Ltd. ........................................... Japan Lending 50.0 50.0Mizuho Trust Systems Company, Limited. ..... Japan Subcontracted
calculation services, software development
50.0 50.0
Mizuho Capital Co., Ltd. ..................................Japan Venture capital 50.0 50.0
252
Scope of Consolidation

Basel Regulatory DisclosuresStatus of Mizuho Financial Group’s Consolidated Capital Adequacy
2020/09/07 16:50:34 / 20635245_株式会社みずほフィナンシャルグループ_総会その他(C)
NameCountry oforganization Main business
Proportion ofownershipinterest (%)
Proportion ofvotinginterest (%)
OverseasMizuho Americas LLC .....................................U.S.A. Holding company 100.0 100.0Mizuho Bank (China), Ltd. ..............................China Banking 100.0 100.0Mizuho International plc ..................................U.K. Securities and banking 100.0 100.0Mizuho Securities Asia Limited .......................China Securities 100.0 100.0Mizuho Securities USA LLC ............................U.S.A. Securities 100.0 100.0Mizuho Capital Markets LLCMizuho Bank Europe N.V. ...............................
U.S.A.Netherlands
DerivativesBanking and securities
100.0100.0
100.0100.0
Banco Mizuho do Brasil S.A. ..........................Brazil Banking 100.0 100.0Mizuho Trust & Banking (Luxembourg) S.A. ...Luxembourg Trust and banking 100.0 100.0Mizuho Bank (USA) ........................................U.S.A. Banking and trust 100.0 100.0Mizuho Securities Europe GmbH ....................Germany Securities 100.0 100.0PT. Bank Mizuho Indonesia ............................Indonesia Banking 99.0 99.0
(c) Corporations Providing Financial Services for Which Article 9 of the FSA Notice No. 20 is ApplicableNone as of March 31, 2020 and 2019.
(d) Companies that are in the Bank Holding Company’s Corporate Group but not Included in the Scope of Accounting Consolidation and Companies that are not in the Bank Holding Company’s Corporate Group but Included in the Scope of Accounting ConsolidationNone as of March 31, 2020 and 2019.
(e) Restrictions on Transfer of Funds or Capital within the Bank Holding Company’s Corporate GroupNone as of March 31, 2020 and 2019.
(f) Names of Any Other Financial Institutions, etc., Classified as Subsidiaries or Other Members of the Bank Holding Company that are Deficient in Regulatory CapitalNone as of March 31, 2020 and 2019.
■ Risk-based Capital
(1) Summary of Approach to Assessing Capital Adequacy
In order to ensure that risk-based capital is sufficiently maintained in light of the risk held by us, we regularly conduct the following assessment of capital adequacy in addition to adopting a suitable and effective capital adequacy monitoring structure.
Maintaining a sufficient BIS capital ratioWe confirm our maintenance of a high level of financial soundness by conducting regular evaluations to examine whether our risk-based capital is adequate in qualitative as well as quantitative terms, in light of our business plans and strategic targets to match the increase in risk-weighted assets acquired for growth, in addition to maintaining our capital above the minimum requirements of common equity Tier 1 capital ratio, Tier 1 capital ratio, total capital ratio, capital buffer ratio, adequate leverage ratio and TLAC ratio.
Balancing risk and capitalOn the basis of the framework for allocating risk capital, after obtaining the clearest possible grasp of the group’s overall risk exposure, we endeavor to control risk so as to keep it within the range of our business capacity by means of allocating capital that corresponds to the amount of risk to the principal banking subsidiaries, etc., within the bounds of our capital, and we conduct regular assessments to ensure that a sufficient level of capital is maintained for our risk profile. When making these assessments, we calculate the potential losses arising from assumed stress events and risk volumes, which we assess whether they balance with the group’s capital. Stress events are based on risk scenarios that are formulated based on the current economic condition and the economic outlook, etc. In addition, we examine whether an appropriate return on risk is maintained in the assessments.
253
Scope of Consolidation、Risk-based Capital
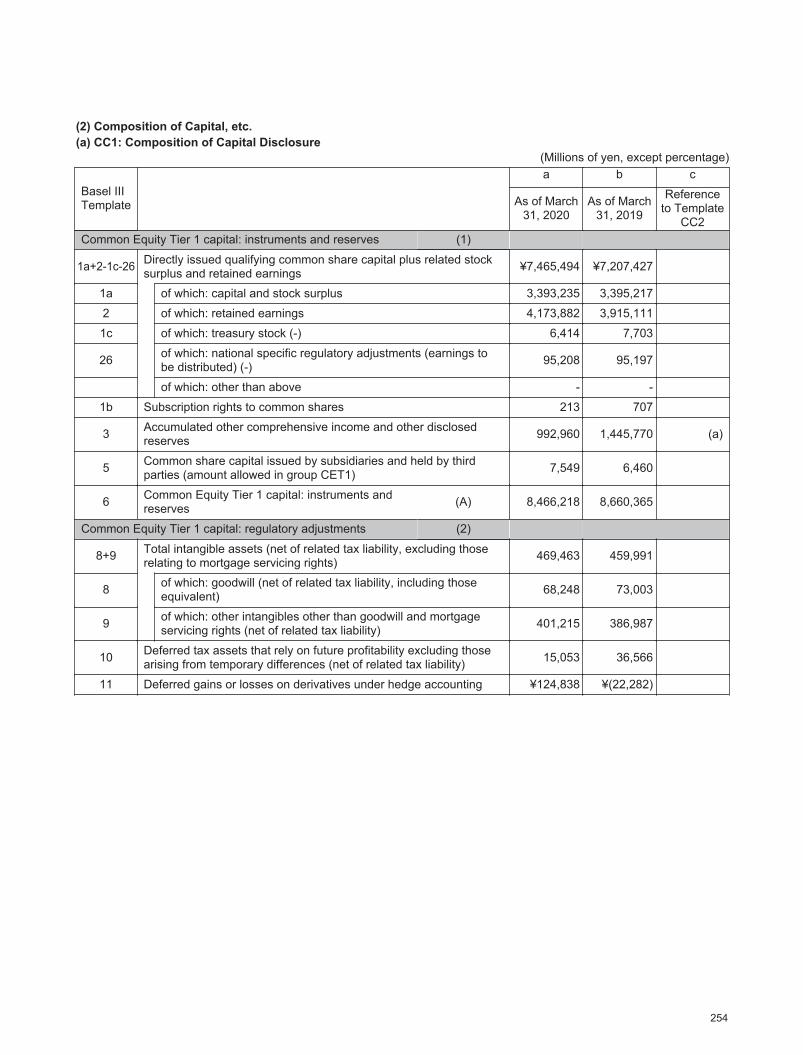
2020/09/07 16:50:34 / 20635245_株式会社みずほフィナンシャルグループ_総会その他(C)
(2) Composition of Capital, etc.(a) CC1: Composition of Capital Disclosure
(Millions of yen, except percentage)
Basel IIITemplate
a b c
As of March31, 2020
As of March31, 2019
Referenceto Template
CC2Common Equity Tier 1 capital: instruments and reserves (1)
1a+2-1c-26 Directly issued qualifying common share capital plus related stock surplus and retained earnings ¥7,465,494 ¥7,207,427
1a of which: capital and stock surplus 3,393,235 3,395,217
2 of which: retained earnings 4,173,882 3,915,111
1c of which: treasury stock (-) 6,414 7,703
26 of which: national specific regulatory adjustments (earnings to be distributed) (-) 95,208 95,197
of which: other than above - -
1b Subscription rights to common shares 213 707
3 Accumulated other comprehensive income and other disclosed reserves 992,960 1,445,770 (a)
5 Common share capital issued by subsidiaries and held by third parties (amount allowed in group CET1) 7,549 6,460
6 Common Equity Tier 1 capital: instruments and reserves (A) 8,466,218 8,660,365
Common Equity Tier 1 capital: regulatory adjustments (2)
8+9 Total intangible assets (net of related tax liability, excluding those relating to mortgage servicing rights) 469,463 459,991
8 of which: goodwill (net of related tax liability, including those equivalent) 68,248 73,003
9 of which: other intangibles other than goodwill and mortgage servicing rights (net of related tax liability) 401,215 386,987
10 Deferred tax assets that rely on future profitability excluding those arising from temporary differences (net of related tax liability) 15,053 36,566
11 Deferred gains or losses on derivatives under hedge accounting ¥124,838 ¥(22,282)
254
Composition of Capital Disclosure
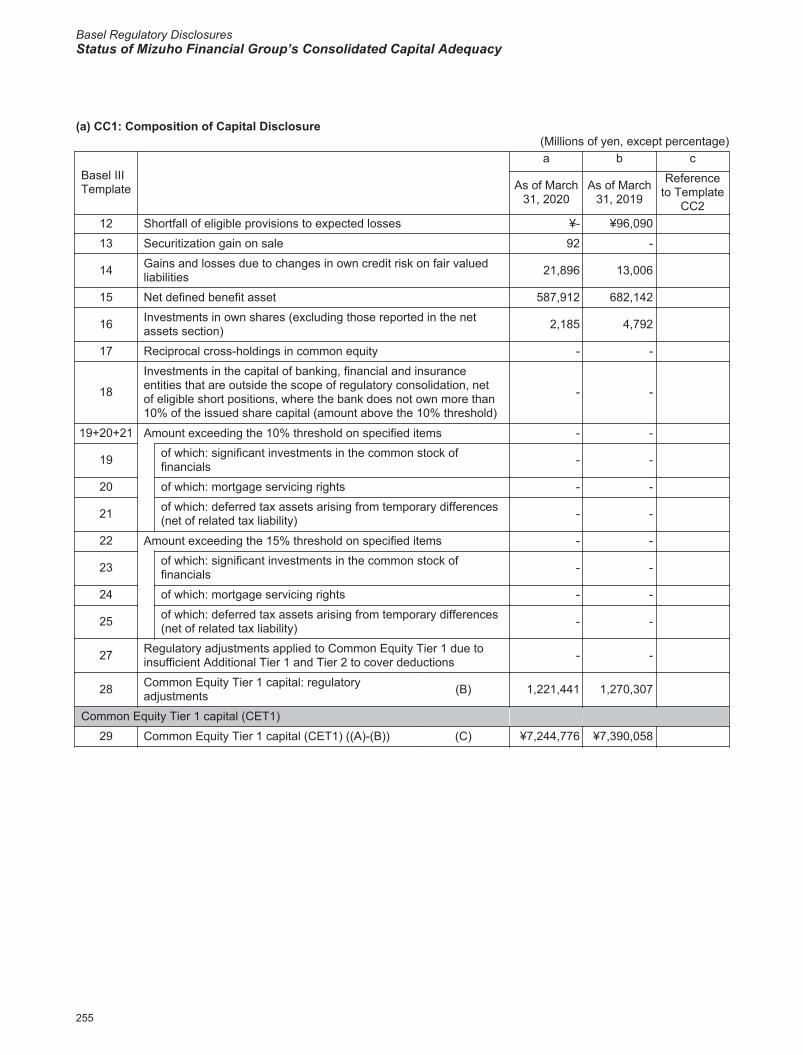
Basel Regulatory DisclosuresStatus of Mizuho Financial Group’s Consolidated Capital Adequacy
2020/09/07 16:50:34 / 20635245_株式会社みずほフィナンシャルグループ_総会その他(C)
(a) CC1: Composition of Capital Disclosure(Millions of yen, except percentage)
Basel IIITemplate
a b c
As of March31, 2020
As of March31, 2019
Referenceto Template
CC212 Shortfall of eligible provisions to expected losses ¥- ¥96,090
13 Securitization gain on sale 92 -
14 Gains and losses due to changes in own credit risk on fair valued liabilities 21,896 13,006
15 Net defined benefit asset 587,912 682,142
16 Investments in own shares (excluding those reported in the net assets section) 2,185 4,792
17 Reciprocal cross-holdings in common equity - -
18
Investments in the capital of banking, financial and insurance entities that are outside the scope of regulatory consolidation, net of eligible short positions, where the bank does not own more than 10% of the issued share capital (amount above the 10% threshold)
- -
19+20+21 Amount exceeding the 10% threshold on specified items - -
19 of which: significant investments in the common stock of financials - -
20 of which: mortgage servicing rights - -
21 of which: deferred tax assets arising from temporary differences (net of related tax liability) - -
22 Amount exceeding the 15% threshold on specified items - -
23 of which: significant investments in the common stock of financials - -
24 of which: mortgage servicing rights - -
25 of which: deferred tax assets arising from temporary differences (net of related tax liability) - -
27 Regulatory adjustments applied to Common Equity Tier 1 due to insufficient Additional Tier 1 and Tier 2 to cover deductions - -
28 Common Equity Tier 1 capital: regulatory adjustments (B) 1,221,441 1,270,307
Common Equity Tier 1 capital (CET1)
29 Common Equity Tier 1 capital (CET1) ((A)-(B)) (C) ¥7,244,776 ¥7,390,058
255
Composition of Capital Disclosure

2020/09/07 16:50:34 / 20635245_株式会社みずほフィナンシャルグループ_総会その他(C)
(a) CC1: Composition of Capital Disclosure(Millions of yen, except percentage)
Basel IIITemplate
a b c
As of March31, 2020
As of March31, 2019
Referenceto Template
CC2Additional Tier 1 capital: instruments (3)
30 31aDirectly issued qualifying Additional Tier 1 instruments plus related stock surplus of which: classified as equity under applicable accounting standards and the breakdown
¥- ¥-
30 31b Subscription rights to Additional Tier 1 instruments - -
30 32Directly issued qualifying Additional Tier 1 instruments plus related stock surplus of which: classified as liabilities under applicable accounting standards
1,805,000 1,570,000
30 Qualifying Additional Tier 1 instruments plus related stock surplus issued by special purpose vehicles and other equivalent entities - -
34-35 Additional Tier 1 instruments issued by subsidiaries and held by third parties (amount allowed in group AT1) 20,277 28,502
33+35 Eligible Tier 1 capital instruments subject to phase-out arrangements included in Additional Tier 1 capital: instruments - 303,000
33 of which: directly issued capital instruments subject to phase out from Additional Tier 1 - 303,000
35 of which: instruments issued by subsidiaries subject to phase out - -
36 Additional Tier 1 capital: instruments (D) 1,825,277 1,901,502
Additional Tier 1 capital: regulatory adjustments
37 Investments in own Additional Tier 1 instruments 1,700 2,900
38 Reciprocal cross-holdings in Additional Tier 1 instruments ¥- ¥-
256
Composition of Capital Disclosure
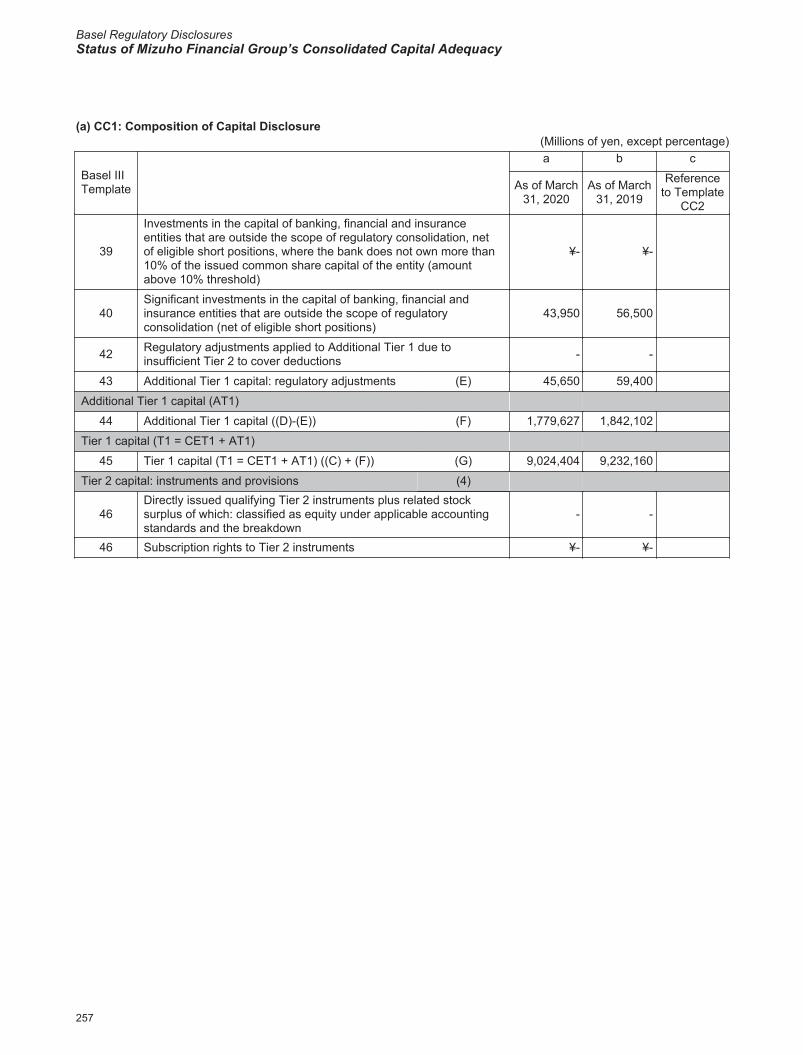
Basel Regulatory DisclosuresStatus of Mizuho Financial Group’s Consolidated Capital Adequacy
2020/09/07 16:50:34 / 20635245_株式会社みずほフィナンシャルグループ_総会その他(C)
(a) CC1: Composition of Capital Disclosure(Millions of yen, except percentage)
Basel IIITemplate
a b c
As of March31, 2020
As of March31, 2019
Referenceto Template
CC2
39
Investments in the capital of banking, financial and insurance entities that are outside the scope of regulatory consolidation, net of eligible short positions, where the bank does not own more than 10% of the issued common share capital of the entity (amount above 10% threshold)
¥- ¥-
40Significant investments in the capital of banking, financial and insurance entities that are outside the scope of regulatory consolidation (net of eligible short positions)
43,950 56,500
42 Regulatory adjustments applied to Additional Tier 1 due to insufficient Tier 2 to cover deductions - -
43 Additional Tier 1 capital: regulatory adjustments (E) 45,650 59,400
Additional Tier 1 capital (AT1)
44 Additional Tier 1 capital ((D)-(E)) (F) 1,779,627 1,842,102
Tier 1 capital (T1 = CET1 + AT1)
45 Tier 1 capital (T1 = CET1 + AT1) ((C) + (F)) (G) 9,024,404 9,232,160
Tier 2 capital: instruments and provisions (4)
46Directly issued qualifying Tier 2 instruments plus related stock surplus of which: classified as equity under applicable accounting standards and the breakdown
- -
46 Subscription rights to Tier 2 instruments ¥- ¥-
257
Composition of Capital Disclosure
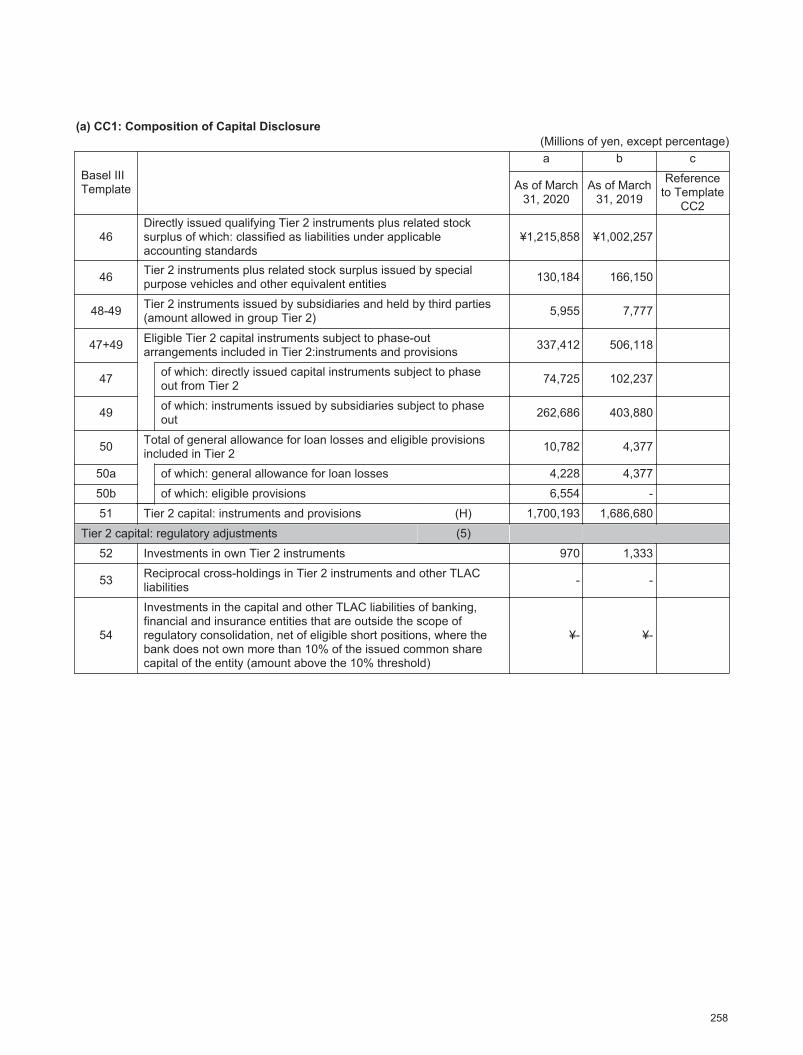
2020/09/07 16:50:34 / 20635245_株式会社みずほフィナンシャルグループ_総会その他(C)
(a) CC1: Composition of Capital Disclosure(Millions of yen, except percentage)
Basel IIITemplate
a b c
As of March31, 2020
As of March31, 2019
Referenceto Template
CC2
46Directly issued qualifying Tier 2 instruments plus related stock surplus of which: classified as liabilities under applicable accounting standards
¥1,215,858 ¥1,002,257
46 Tier 2 instruments plus related stock surplus issued by special purpose vehicles and other equivalent entities 130,184 166,150
48-49 Tier 2 instruments issued by subsidiaries and held by third parties (amount allowed in group Tier 2) 5,955 7,777
47+49 Eligible Tier 2 capital instruments subject to phase-out arrangements included in Tier 2:instruments and provisions 337,412 506,118
47 of which: directly issued capital instruments subject to phase out from Tier 2 74,725 102,237
49 of which: instruments issued by subsidiaries subject to phase out 262,686 403,880
50 Total of general allowance for loan losses and eligible provisions included in Tier 2 10,782 4,377
50a of which: general allowance for loan losses 4,228 4,377
50b of which: eligible provisions 6,554 -
51 Tier 2 capital: instruments and provisions (H) 1,700,193 1,686,680
Tier 2 capital: regulatory adjustments (5)
52 Investments in own Tier 2 instruments 970 1,333
53 Reciprocal cross-holdings in Tier 2 instruments and other TLAC liabilities - -
54
Investments in the capital and other TLAC liabilities of banking, financial and insurance entities that are outside the scope of regulatory consolidation, net of eligible short positions, where the bank does not own more than 10% of the issued common share capital of the entity (amount above the 10% threshold)
¥- ¥-
258
Composition of Capital Disclosure
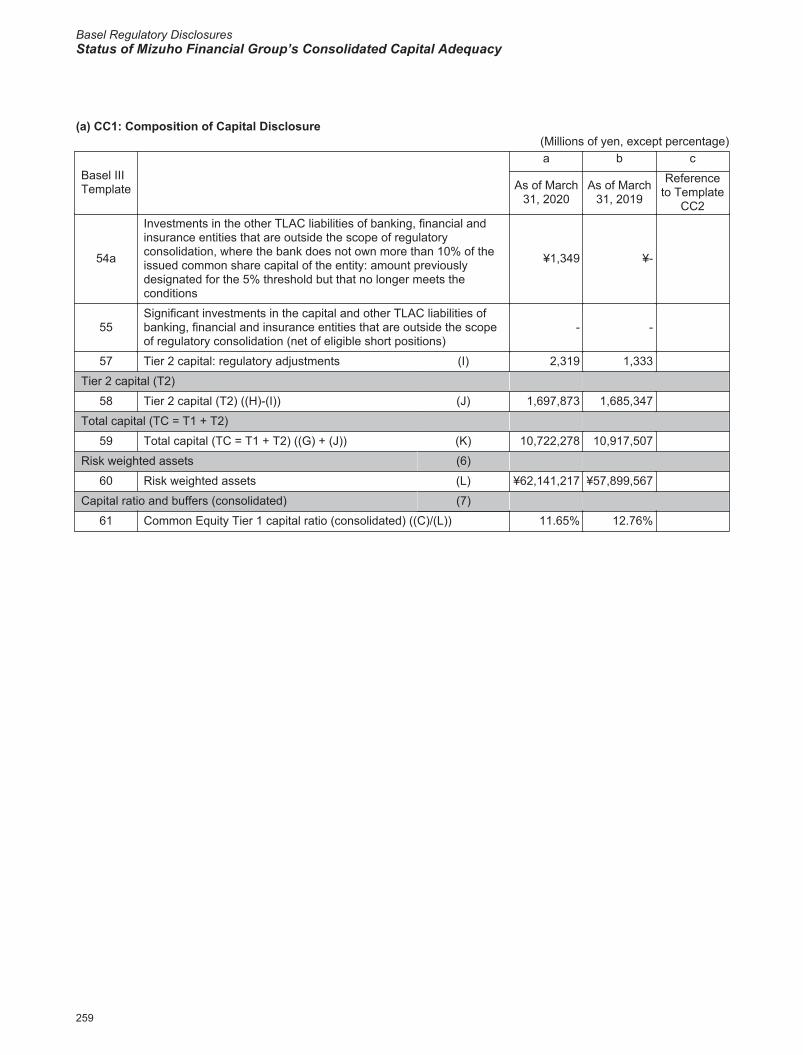
Basel Regulatory DisclosuresStatus of Mizuho Financial Group’s Consolidated Capital Adequacy
2020/09/07 16:50:34 / 20635245_株式会社みずほフィナンシャルグループ_総会その他(C)
(a) CC1: Composition of Capital Disclosure(Millions of yen, except percentage)
Basel IIITemplate
a b c
As of March31, 2020
As of March31, 2019
Referenceto Template
CC2
54a
Investments in the other TLAC liabilities of banking, financial and insurance entities that are outside the scope of regulatory consolidation, where the bank does not own more than 10% of the issued common share capital of the entity: amount previously designated for the 5% threshold but that no longer meets the conditions
¥1,349 ¥-
55Significant investments in the capital and other TLAC liabilities of banking, financial and insurance entities that are outside the scope of regulatory consolidation (net of eligible short positions)
- -
57 Tier 2 capital: regulatory adjustments (I) 2,319 1,333
Tier 2 capital (T2)
58 Tier 2 capital (T2) ((H)-(I)) (J) 1,697,873 1,685,347
Total capital (TC = T1 + T2)
59 Total capital (TC = T1 + T2) ((G) + (J)) (K) 10,722,278 10,917,507
Risk weighted assets (6)
60 Risk weighted assets (L) ¥62,141,217 ¥57,899,567
Capital ratio and buffers (consolidated) (7)
61 Common Equity Tier 1 capital ratio (consolidated) ((C)/(L)) 11.65% 12.76%
259
Composition of Capital Disclosure

2020/09/07 16:50:34 / 20635245_株式会社みずほフィナンシャルグループ_総会その他(C)
(a) CC1: Composition of Capital Disclosure(Millions of yen, except percentage)
Basel IIITemplate
a b c
As of March31, 2020
As of March31, 2019
Referenceto Template
CC262 Tier 1 capital ratio (consolidated) ((G)/(L)) 14.52% 15.94%
63 Total capital ratio (consolidated) ((K)/(L)) 17.25% 18.85%
64 Total of bank CET1 specific buffer requirements 3.51% 3.55%
65 of which: capital conservation buffer requirement 2.50% 2.50%
66 of which: countercyclical buffer requirement 0.01% 0.05%
67 of which: bank G-SIB/D-SIB additional requirements 1.00% 1.00%
68 CET1 available after meeting the bank's minimum capital requirements 7.15% 8.26%
Regulatory adjustments (8)
72Non-significant investments in the capital and other TLAC liabilities of other financials that are below the thresholds for deduction (before risk weighting)
¥455,356 ¥540,695
73 Significant investments in the common stock of financials that are below the thresholds for deduction (before risk weighting) 268,070 250,095
74 Mortgage servicing rights that are below the thresholds for deduction (before risk weighting) - -
75 Deferred tax assets arising from temporary differences that are below the thresholds for deduction (before risk weighting) 351,227 233,628
Provisions included in Tier 2 capital: instruments and provisions (9)
76 Provisions (general allowance for loan losses) 4,228 4,377
77 Cap on inclusion of provisions (general allowance for loan losses) 43,991 43,521
78Provisions eligible for inclusion in Tier 2 in respect of exposures subject to internal ratings-based approach (prior to application of cap) (if the amount is negative, report as "nil")
6,554 -
79 Cap for inclusion of provisions in Tier 2 under internal ratings-based approach 302,928 278,991
Capital instruments subject to phase-out arrangements (10)
82 Current cap on AT1 instruments subject to phase-out arrangements 416,627 624,941
83Amount excluded from AT1 due to cap (excess over cap after redemptions and maturities) (if the amount is negative, report as "nil")
- -
84 Current cap on T2 instruments subject to phase-out arrangements 337,412 506,118
85Amount excluded from T2 due to cap (excess over cap after redemptions and maturities) (if the amount is negative, report as "nil")
¥1,270 ¥37,812
Notes: 1. The above figures are calculated based on the international standard applied on a consolidated basis under the FSA Notice No. 20.2. As an external audit of calculating the consolidated capital adequacy ratio, we underwent an examination under the procedures agreed with by Ernst & Young ShinNihon
LLC, on the basis of "Practical guidance on agreed-upon procedures for the calculation of capital adequacy ratio and leverage ratio" (Practical Guideline for specialized fields No. 4465 of the Japanese Institute of Certified Public Accountants). Note that this examination is not a part of the audit performed on our consolidated financial statements or internal controls over financial reporting. Ernst & Young ShinNihon LLC does not give its opinion or conclusion concerning the capital adequacy ratio or our internal control structure regarding the calculation of the capital adequacy ratio. Instead, it performs an examination to the extent both of us agreed to and reports the results to us.
260
Composition of Capital Disclosure

Basel Regulatory DisclosuresStatus of Mizuho Financial Group’s Consolidated Capital Adequacy
2020/09/07 16:50:34 / 20635245_株式会社みずほフィナンシャルグループ_総会その他(C)
(b) CC2:Reconciliation of regulatory capital to consolidated balance sheet
(Millions of yen)
Items
a b c d
Consolidated balancesheet as in publishedfinancial statements
Consolidated balancesheet as in publishedfinancial statements
Reference toTemplate CC1
Cross-reference toAppended template
As of March 31, 2020 As of March 31, 2019(Assets)Cash and Due from Banks ¥41,069,745 ¥45,108,602Call Loans and Bills Purchased 584,686 648,254Receivables under Resale Agreements 18,581,488 12,997,628Guarantee Deposits Paid under Securities Borrowing Transactions 2,243,161 2,578,133
Other Debt Purchased 2,688,273 2,828,959Trading Assets 13,248,734 12,043,608 6-aMoney Held in Trust 411,847 351,889Securities 34,907,234 29,774,489 2-b, 6-bLoans and Bills Discounted 83,468,185 78,456,935 6-cForeign Exchange Assets 2,044,415 1,993,668Derivatives other than for Trading Assets 1,944,060 1,328,227 6-dOther Assets 5,206,121 4,229,589 6-eTangible Fixed Assets 1,103,622 1,037,006Intangible Fixed Assets 636,139 620,231 2-aNet Defined Benefit Asset 846,782 982,804 3Deferred Tax Assets 32,493 37,960 4-aCustomers' Liabilities for Acceptances and Guarantees 6,066,527 6,062,053
Reserves for Possible Losses on Loans (424,446) (287,815)Total Assets ¥214,659,077 ¥200,792,226(Liabilities)Deposits ¥131,189,673 ¥124,311,025Negotiable Certificates of Deposit 13,282,561 13,338,571Call Money and Bills Sold 2,263,076 2,841,931Payables under Repurchase Agreements 17,971,098 14,640,439Guarantee Deposits Received under Securities Lending Transactions 1,108,255 1,484,584
Commercial Paper 411,089 941,181Trading Liabilities 9,604,890 8,325,520 6-fBorrowed Money 5,209,947 3,061,504 8-aForeign Exchange Liabilities 509,405 669,578Short-term Bonds 373,658 355,539Bonds and Notes 8,906,432 8,351,071 8-bDue to Trust Accounts 1,055,510 1,102,073Derivatives other than for Trading Liabilities 1,619,151 1,165,602 6-gOther Liabilities 6,111,195 4,512,325Reserve for Bonus Payments 75,175 68,117Reserve for Variable Compensation 2,559 2,867Net Defined Benefit Liability 62,113 60,873Reserve for Director and Corporate Auditor Retirement Benefits 944 1,389
Reserve for Possible Losses on Sales of Loans 637 630
Reserve for Contingencies 6,443 4,910Reserve for Reimbursement of Deposits 27,851 19,068Reserve for Reimbursement of Debentures 18,672 25,566Reserves under Special Laws 2,509 2,473Deferred Tax Liabilities ¥53,150 ¥185,974 4-b
261
Reconciliation of regulatory capital to consolidated balance sheet

2020/09/07 16:50:34 / 20635245_株式会社みずほフィナンシャルグループ_総会その他(C)
(b) CC2:Reconciliation of regulatory capital to consolidated balance sheet
(Millions of yen)
Items
a b c d
Consolidated balancesheet as in publishedfinancial statements
Consolidated balancesheet as in publishedfinancial statements
Reference toTemplate CC1
Cross-reference toAppended template
As of March 31, 2020 As of March 31, 2019Deferred Tax Liabilities for Revaluation Reserve for Land ¥62,695 ¥63,315 4-cAcceptances and Guarantees 6,066,527 6,062,053Total Liabilities ¥205,995,229 ¥191,598,188(Net Assets)Common Stock 2,256,767 2,256,767 1-aCapital Surplus 1,136,467 1,138,449 1-bRetained Earnings 4,174,190 3,915,521 1-cTreasury Stock (6,414) (7,703) 1-dTotal Shareholders' Equity ¥7,561,010 ¥7,303,034Net Unrealized Gains (Losses) on Other Securities 823,085 1,186,401
Deferred Gains or Losses on Hedges 72,081 (22,282) 5Revaluation Reserve for Land 136,655 137,772Foreign Currency Translation Adjustments (133,178) (111,057)Remeasurements of Defined Benefit Plans 94,317 254,936Total Accumulated Other Comprehensive Income ¥992,960 ¥1,445,770 (a)
Stock Acquisition Rights 213 707Non-Controlling Interests 109,662 444,525 7Total Net Assets ¥8,663,847 ¥9,194,038Total Liabilities and Net Assets ¥214,659,077 ¥200,792,226
Note: The regulatory scope of consolidation is the same as the accounting scope of consolidation.
262
Reconciliation of regulatory capital to consolidated balance sheet
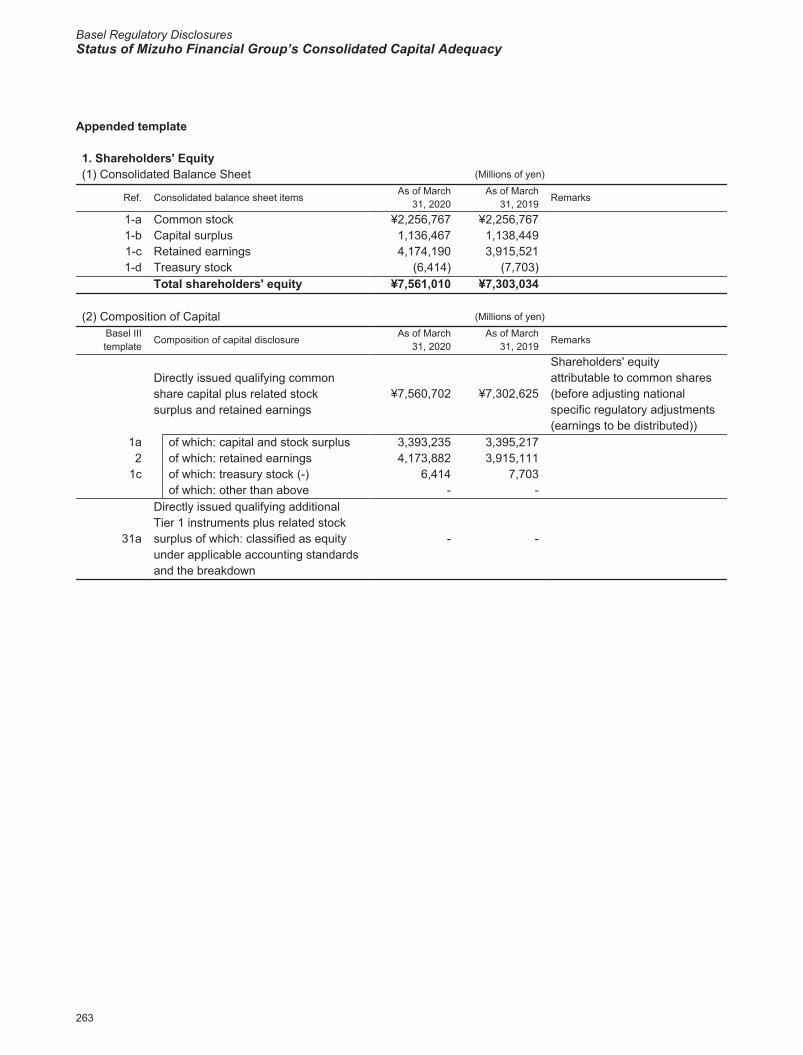
Basel Regulatory DisclosuresStatus of Mizuho Financial Group’s Consolidated Capital Adequacy
2020/09/07 16:50:34 / 20635245_株式会社みずほフィナンシャルグループ_総会その他(C)
Appended template
1. Shareholders' Equity(1) Consolidated Balance Sheet (Millions of yen)
Ref. Consolidated balance sheet itemsAs of March
31, 2020As of March
31, 2019Remarks
1-a Common stock ¥2,256,767 ¥2,256,7671-b Capital surplus 1,136,467 1,138,4491-c Retained earnings 4,174,190 3,915,5211-d Treasury stock (6,414) (7,703)
Total shareholders' equity ¥7,561,010 ¥7,303,034
(2) Composition of Capital (Millions of yen)
Basel IIItemplate
Composition of capital disclosureAs of March
31, 2020As of March
31, 2019Remarks
Directly issued qualifying common share capital plus related stock surplus and retained earnings
¥7,560,702 ¥7,302,625
Shareholders' equity attributable to common shares (before adjusting national specific regulatory adjustments (earnings to be distributed))
1a of which: capital and stock surplus 3,393,235 3,395,2172 of which: retained earnings 4,173,882 3,915,111
1c of which: treasury stock (-) 6,414 7,703of which: other than above - -
31a
Directly issued qualifying additional Tier 1 instruments plus related stock surplus of which: classified as equity under applicable accounting standards and the breakdown
- -
263
Reconciliation of regulatory capital to consolidated balance sheet

2020/09/07 16:50:34 / 20635245_株式会社みずほフィナンシャルグループ_総会その他(C)
2. Intangible Fixed Assets(1) Consolidated Balance Sheet (Millions of yen)
Ref. Consolidated balance sheet itemsAs of March
31, 2020As of March
31, 2019Remarks
2-a Intangible fixed assets ¥636,139 ¥620,2312-b Securities 34,907,234 29,774,489
of which: share of goodwill of companies accounted for using the equity method
6,971 7,508Share of goodwill of companies accounted for using the equity method
Income taxes related to above ¥(173,648) ¥(167,749)
(2) Composition of Capital (Millions of yen)
Basel IIItemplate
Composition of capital disclosureAs of March
31, 2020As of March
31, 2019Remarks
8Goodwill (net of related tax liability, including those equivalent)
¥68,248 ¥73,003
9Other intangibles other than goodwill and mortgage servicing rights (net of related tax liability)
401,215 386,987 Software and other
Mortgage servicing rights (net of related tax liability)
- -
20 Amount exceeding the 10% threshold on specified items
- -
24Amount exceeding the 15% threshold on specified items
- -
74Mortgage servicing rights that are below the thresholds for deduction (before risk weighting)
- -
3. Net defined Benefit Asset(1) Consolidated Balance Sheet (Millions of yen)
Ref. Consolidated balance sheet itemsAs of March
31, 2020As of March
31, 2019Remarks
3 Net defined benefit asset ¥846,782 ¥982,804
Income taxes related to above ¥(258,870) ¥(300,661)
(2) Composition of Capital (Millions of yen)
Basel IIItemplate
Composition of capital disclosureAs of March
31, 2020As of March
31, 2019Remarks
15 Net defined benefit asset ¥587,912 ¥682,142
264
Reconciliation of regulatory capital to consolidated balance sheet
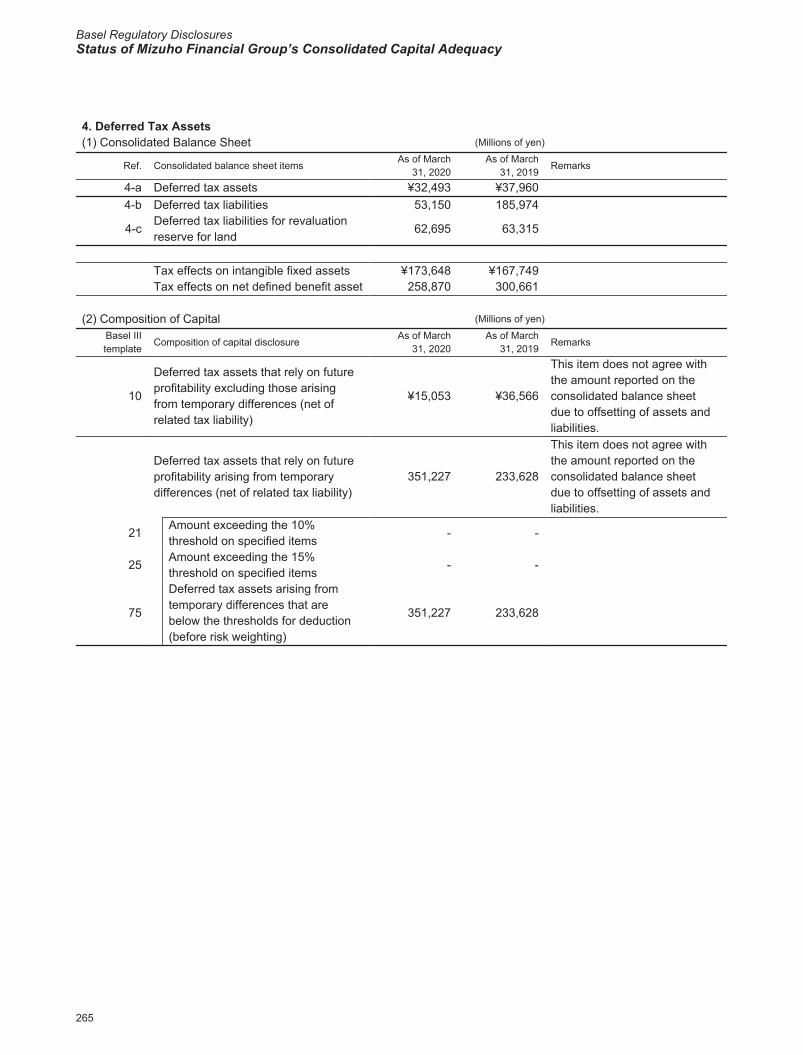
Basel Regulatory DisclosuresStatus of Mizuho Financial Group’s Consolidated Capital Adequacy
2020/09/07 16:50:34 / 20635245_株式会社みずほフィナンシャルグループ_総会その他(C)
4. Deferred Tax Assets(1) Consolidated Balance Sheet (Millions of yen)
Ref. Consolidated balance sheet itemsAs of March
31, 2020As of March
31, 2019Remarks
4-a Deferred tax assets ¥32,493 ¥37,9604-b Deferred tax liabilities 53,150 185,974
4-cDeferred tax liabilities for revaluation reserve for land
62,695 63,315
Tax effects on intangible fixed assets ¥173,648 ¥167,749Tax effects on net defined benefit asset 258,870 300,661
(2) Composition of Capital (Millions of yen)
Basel IIItemplate
Composition of capital disclosureAs of March
31, 2020As of March
31, 2019Remarks
10
Deferred tax assets that rely on future profitability excluding those arising from temporary differences (net of related tax liability)
¥15,053 ¥36,566
This item does not agree with the amount reported on the consolidated balance sheet due to offsetting of assets and liabilities.
Deferred tax assets that rely on future profitability arising from temporary differences (net of related tax liability)
351,227 233,628
This item does not agree with the amount reported on the consolidated balance sheet due to offsetting of assets and liabilities.
21 Amount exceeding the 10% threshold on specified items
- -
25Amount exceeding the 15% threshold on specified items
- -
75
Deferred tax assets arising from temporary differences that are below the thresholds for deduction (before risk weighting)
351,227 233,628
265
Reconciliation of regulatory capital to consolidated balance sheet
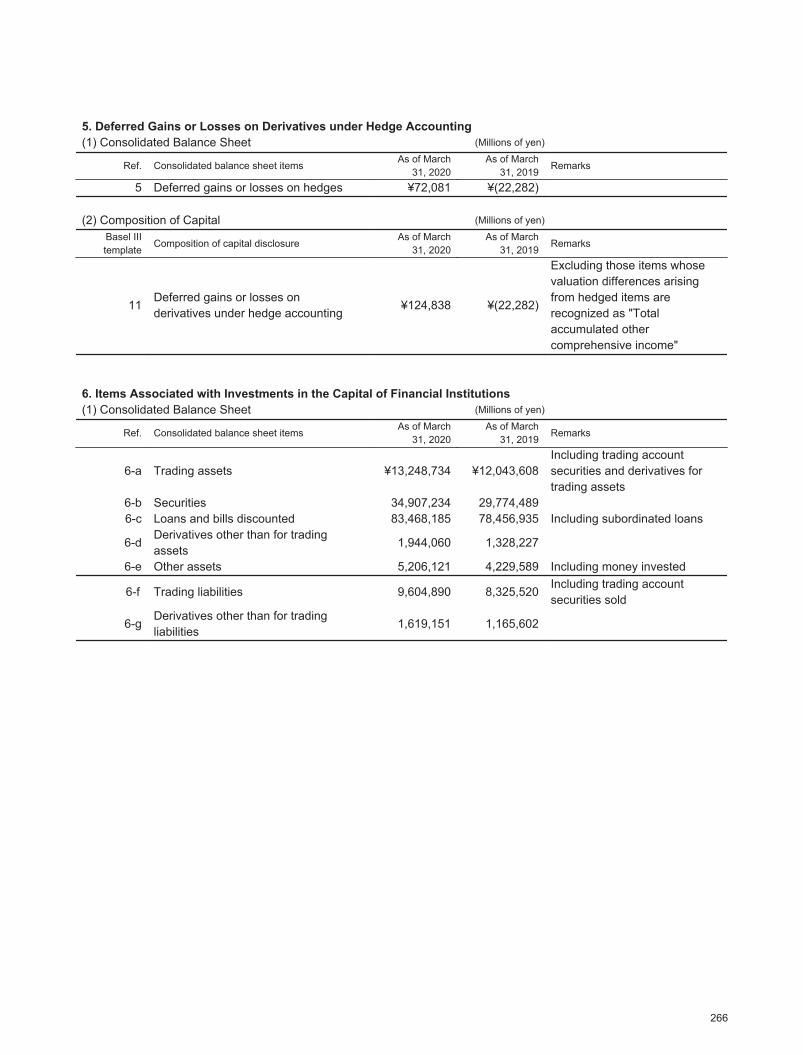
2020/09/07 16:50:34 / 20635245_株式会社みずほフィナンシャルグループ_総会その他(C)
5. Deferred Gains or Losses on Derivatives under Hedge Accounting(1) Consolidated Balance Sheet (Millions of yen)
Ref. Consolidated balance sheet itemsAs of March
31, 2020As of March
31, 2019Remarks
5 Deferred gains or losses on hedges ¥72,081 ¥(22,282)
(2) Composition of Capital (Millions of yen)
Basel IIItemplate
Composition of capital disclosureAs of March
31, 2020As of March
31, 2019Remarks
11Deferred gains or losses on derivatives under hedge accounting
¥124,838 ¥(22,282)
Excluding those items whose valuation differences arising from hedged items are recognized as "Total accumulated other comprehensive income"
6. Items Associated with Investments in the Capital of Financial Institutions(1) Consolidated Balance Sheet (Millions of yen)
Ref. Consolidated balance sheet itemsAs of March
31, 2020As of March
31, 2019Remarks
6-a Trading assets ¥13,248,734 ¥12,043,608Including trading account securities and derivatives for trading assets
6-b Securities 34,907,234 29,774,4896-c Loans and bills discounted 83,468,185 78,456,935 Including subordinated loans
6-dDerivatives other than for trading assets
1,944,060 1,328,227
6-e Other assets 5,206,121 4,229,589 Including money invested
6-f Trading liabilities 9,604,890 8,325,520Including trading account securities sold
6-gDerivatives other than for trading liabilities
1,619,151 1,165,602
266
Reconciliation of regulatory capital to consolidated balance sheet
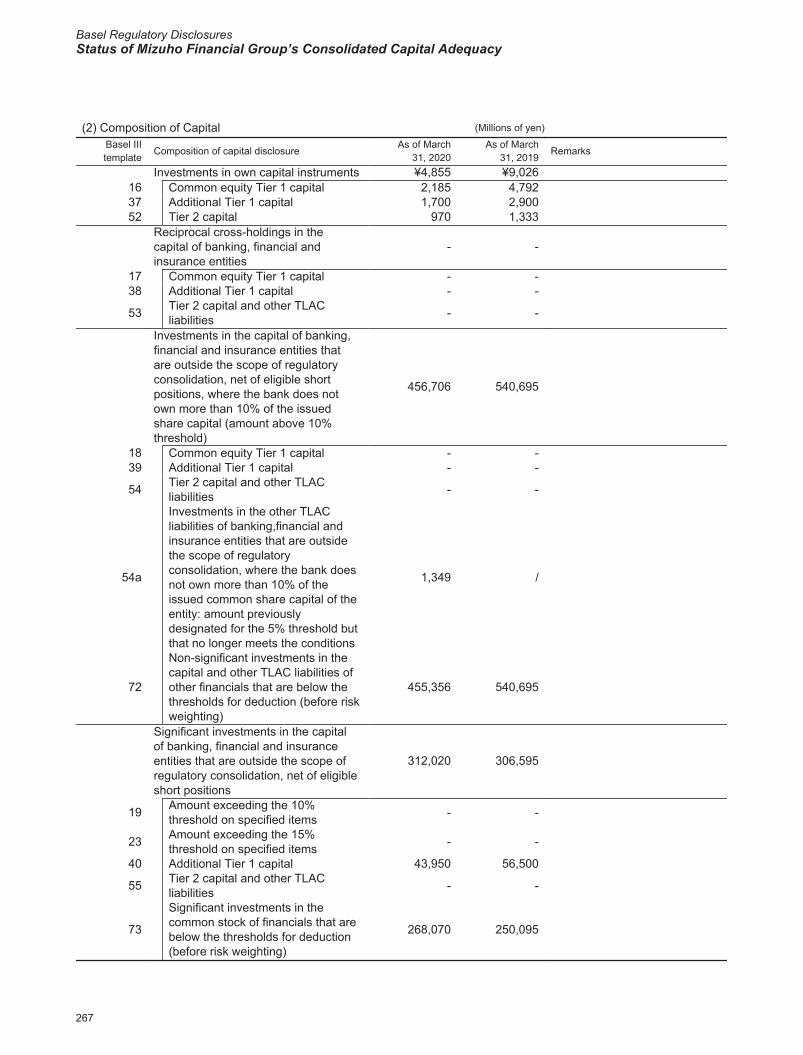
Basel Regulatory DisclosuresStatus of Mizuho Financial Group’s Consolidated Capital Adequacy
2020/09/07 16:50:34 / 20635245_株式会社みずほフィナンシャルグループ_総会その他(C)
(2) Composition of Capital (Millions of yen)
Basel IIItemplate
Composition of capital disclosureAs of March
31, 2020As of March
31, 2019Remarks
Investments in own capital instruments ¥4,855 ¥9,02616 Common equity Tier 1 capital 2,185 4,79237 Additional Tier 1 capital 1,700 2,90052 Tier 2 capital 970 1,333
Reciprocal cross-holdings in the capital of banking, financial and insurance entities
- -
17 Common equity Tier 1 capital - -38 Additional Tier 1 capital - -
53 Tier 2 capital and other TLAC liabilities - -
Investments in the capital of banking, financial and insurance entities that are outside the scope of regulatory consolidation, net of eligible short positions, where the bank does not own more than 10% of the issued share capital (amount above 10% threshold)
456,706 540,695
18 Common equity Tier 1 capital - -39 Additional Tier 1 capital - -
54 Tier 2 capital and other TLAC liabilities - -
54a
Investments in the other TLAC liabilities of banking,financial and insurance entities that are outside the scope of regulatory consolidation, where the bank does not own more than 10% of the issued common share capital of the entity: amount previously designated for the 5% threshold but that no longer meets the conditions
1,349 /
72
Non-significant investments in the capital and other TLAC liabilities of other financials that are below the thresholds for deduction (before risk weighting)
455,356 540,695
Significant investments in the capital of banking, financial and insurance entities that are outside the scope of regulatory consolidation, net of eligible short positions
312,020 306,595
19 Amount exceeding the 10% threshold on specified items - -
23 Amount exceeding the 15% threshold on specified items - -
40 Additional Tier 1 capital 43,950 56,500
55 Tier 2 capital and other TLAC liabilities - -
73
Significant investments in the common stock of financials that are below the thresholds for deduction (before risk weighting)
268,070 250,095
267
Reconciliation of regulatory capital to consolidated balance sheet
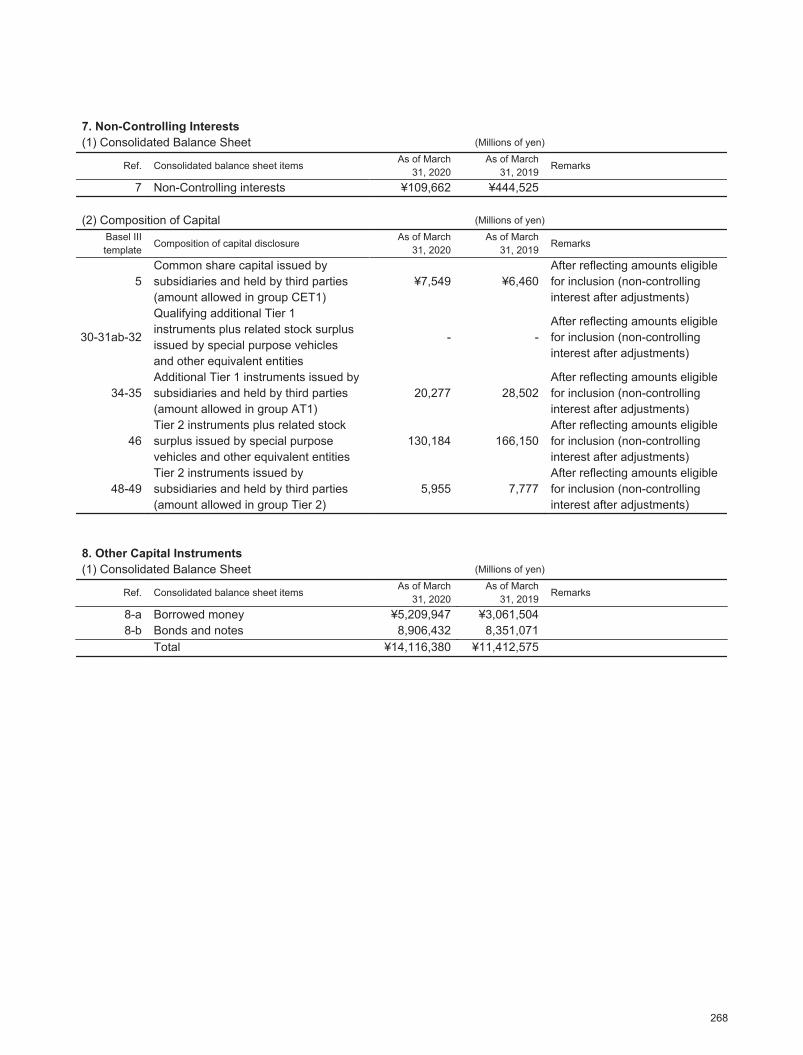
2020/09/07 16:50:34 / 20635245_株式会社みずほフィナンシャルグループ_総会その他(C)
7. Non-Controlling Interests(1) Consolidated Balance Sheet (Millions of yen)
Ref. Consolidated balance sheet itemsAs of March
31, 2020As of March
31, 2019Remarks
7 Non-Controlling interests ¥109,662 ¥444,525
(2) Composition of Capital (Millions of yen)
Basel IIItemplate
Composition of capital disclosureAs of March
31, 2020As of March
31, 2019Remarks
5Common share capital issued by subsidiaries and held by third parties (amount allowed in group CET1)
¥7,549 ¥6,460After reflecting amounts eligible for inclusion (non-controlling interest after adjustments)
30-31ab-32
Qualifying additional Tier 1 instruments plus related stock surplus issued by special purpose vehicles and other equivalent entities
- -After reflecting amounts eligible for inclusion (non-controlling interest after adjustments)
34-35Additional Tier 1 instruments issued by subsidiaries and held by third parties (amount allowed in group AT1)
20,277 28,502After reflecting amounts eligible for inclusion (non-controlling interest after adjustments)
46Tier 2 instruments plus related stock surplus issued by special purpose vehicles and other equivalent entities
130,184 166,150After reflecting amounts eligible for inclusion (non-controlling interest after adjustments)
48-49Tier 2 instruments issued by subsidiaries and held by third parties (amount allowed in group Tier 2)
5,955 7,777After reflecting amounts eligible for inclusion (non-controlling interest after adjustments)
8. Other Capital Instruments(1) Consolidated Balance Sheet (Millions of yen)
Ref. Consolidated balance sheet itemsAs of March
31, 2020As of March
31, 2019Remarks
8-a Borrowed money ¥5,209,947 ¥3,061,5048-b Bonds and notes 8,906,432 8,351,071
Total ¥14,116,380 ¥11,412,575
268
Reconciliation of regulatory capital to consolidated balance sheet

Basel Regulatory DisclosuresStatus of Mizuho Financial Group’s Consolidated Capital Adequacy
2020/09/07 16:50:34 / 20635245_株式会社みずほフィナンシャルグループ_総会その他(C)
(2) Composition of Capital (Millions of yen)
Basel IIItemplate
Composition of capital disclosureAs of March
31, 2020As of March
31, 2019Remarks
32
Directly issued qualifying additional Tier 1 instruments plus related stock surplus of which: classified as liabilities under applicable accounting standards
¥1,805,000 ¥1,570,000
46
Directly issued qualifying Tier 2 instruments plus related stock surplus of which: classified as liabilities under applicable accounting standards
1,215,858 1,002,257
269
Reconciliation of regulatory capital to consolidated balance sheet
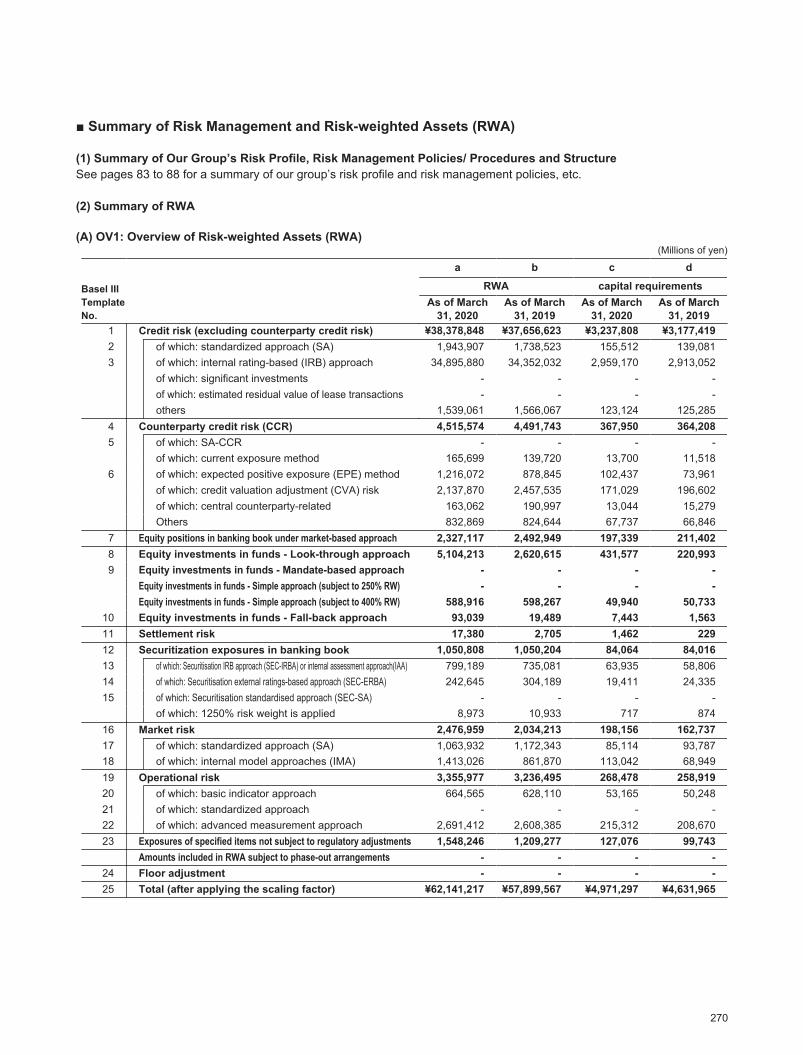
2020/09/07 16:50:34 / 20635245_株式会社みずほフィナンシャルグループ_総会その他(C)
■ Summary of Risk Management and Risk-weighted Assets (RWA)
(1) Summary of Our Group’s Risk Profile, Risk Management Policies/ Procedures and StructureSee pages 83 to 88 for a summary of our group’s risk profile and risk management policies, etc.
(2) Summary of RWA
(A) OV1: Overview of Risk-weighted Assets (RWA)(Millions of yen)
Basel IIITemplateNo.
a b c d
RWA capital requirementsAs of March
31, 2020As of March
31, 2019As of March
31, 2020As of March
31, 20191 Credit risk (excluding counterparty credit risk) ¥38,378,848 ¥37,656,623 ¥3,237,808 ¥3,177,4192 of which: standardized approach (SA) 1,943,907 1,738,523 155,512 139,0813 of which: internal rating-based (IRB) approach 34,895,880 34,352,032 2,959,170 2,913,052
of which: significant investments - - - -of which: estimated residual value of lease transactions - - - -others 1,539,061 1,566,067 123,124 125,285
4 Counterparty credit risk (CCR) 4,515,574 4,491,743 367,950 364,2085 of which: SA-CCR - - - -
of which: current exposure method 165,699 139,720 13,700 11,5186 of which: expected positive exposure (EPE) method 1,216,072 878,845 102,437 73,961
of which: credit valuation adjustment (CVA) risk 2,137,870 2,457,535 171,029 196,602of which: central counterparty-related 163,062 190,997 13,044 15,279Others 832,869 824,644 67,737 66,846
7 Equity positions in banking book under market-based approach 2,327,117 2,492,949 197,339 211,4028 Equity investments in funds - Look-through approach 5,104,213 2,620,615 431,577 220,9939 Equity investments in funds - Mandate-based approach - - - -
Equity investments in funds - Simple approach (subject to 250% RW) - - - -Equity investments in funds - Simple approach (subject to 400% RW) 588,916 598,267 49,940 50,733
10 Equity investments in funds - Fall-back approach 93,039 19,489 7,443 1,56311 Settlement risk 17,380 2,705 1,462 22912 Securitization exposures in banking book 1,050,808 1,050,204 84,064 84,01613 of which: Securitisation IRB approach (SEC-IRBA) or internal assessment approach(IAA) 799,189 735,081 63,935 58,80614 of which: Securitisation external ratings-based approach (SEC-ERBA) 242,645 304,189 19,411 24,33515 of which: Securitisation standardised approach (SEC-SA) - - - -
of which: 1250% risk weight is applied 8,973 10,933 717 87416 Market risk 2,476,959 2,034,213 198,156 162,73717 of which: standardized approach (SA) 1,063,932 1,172,343 85,114 93,78718 of which: internal model approaches (IMA) 1,413,026 861,870 113,042 68,94919 Operational risk 3,355,977 3,236,495 268,478 258,91920 of which: basic indicator approach 664,565 628,110 53,165 50,24821 of which: standardized approach - - - -22 of which: advanced measurement approach 2,691,412 2,608,385 215,312 208,67023 Exposures of specified items not subject to regulatory adjustments 1,548,246 1,209,277 127,076 99,743
Amounts included in RWA subject to phase-out arrangements - - - -24 Floor adjustment - - - -25 Total (after applying the scaling factor) ¥62,141,217 ¥57,899,567 ¥4,971,297 ¥4,631,965
270
Overview of RWA
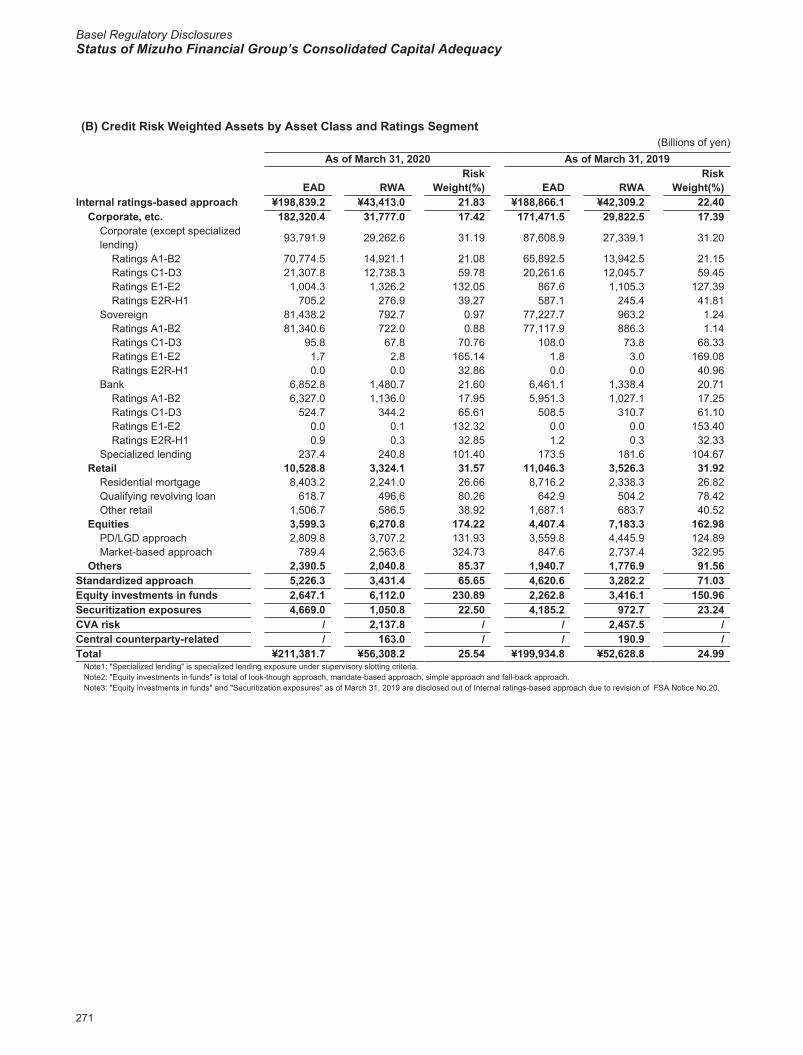
Basel Regulatory DisclosuresStatus of Mizuho Financial Group’s Consolidated Capital Adequacy
2020/09/07 16:50:34 / 20635245_株式会社みずほフィナンシャルグループ_総会その他(C)
(B) Credit Risk Weighted Assets by Asset Class and Ratings Segment(Billions of yen)
As of March 31, 2020 As of March 31, 2019
EAD RWARisk
Weight(%) EAD RWARisk
Weight(%)Internal ratings-based approach ¥198,839.2 ¥43,413.0 21.83 ¥188,866.1 ¥42,309.2 22.40
Corporate, etc. 182,320.4 31,777.0 17.42 171,471.5 29,822.5 17.39Corporate (except specialized lending) 93,791.9 29,262.6 31.19 87,608.9 27,339.1 31.20
Ratings A1-B2 70,774.5 14,921.1 21.08 65,892.5 13,942.5 21.15Ratings C1-D3 21,307.8 12,738.3 59.78 20,261.6 12,045.7 59.45Ratings E1-E2 1,004.3 1,326.2 132.05 867.6 1,105.3 127.39Ratings E2R-H1 705.2 276.9 39.27 587.1 245.4 41.81
Sovereign 81,438.2 792.7 0.97 77,227.7 963.2 1.24Ratings A1-B2 81,340.6 722.0 0.88 77,117.9 886.3 1.14Ratings C1-D3 95.8 67.8 70.76 108.0 73.8 68.33Ratings E1-E2 1.7 2.8 165.14 1.8 3.0 169.08Ratings E2R-H1 0.0 0.0 32.86 0.0 0.0 40.96
Bank 6,852.8 1,480.7 21.60 6,461.1 1,338.4 20.71Ratings A1-B2 6,327.0 1,136.0 17.95 5,951.3 1,027.1 17.25Ratings C1-D3 524.7 344.2 65.61 508.5 310.7 61.10Ratings E1-E2 0.0 0.1 132.32 0.0 0.0 153.40Ratings E2R-H1 0.9 0.3 32.85 1.2 0.3 32.33
Specialized lending 237.4 240.8 101.40 173.5 181.6 104.67Retail 10,528.8 3,324.1 31.57 11,046.3 3,526.3 31.92
Residential mortgage 8,403.2 2,241.0 26.66 8,716.2 2,338.3 26.82Qualifying revolving loan 618.7 496.6 80.26 642.9 504.2 78.42Other retail 1,506.7 586.5 38.92 1,687.1 683.7 40.52
Equities 3,599.3 6,270.8 174.22 4,407.4 7,183.3 162.98PD/LGD approach 2,809.8 3,707.2 131.93 3,559.8 4,445.9 124.89Market-based approach 789.4 2,563.6 324.73 847.6 2,737.4 322.95
Others 2,390.5 2,040.8 85.37 1,940.7 1,776.9 91.56Standardized approach 5,226.3 3,431.4 65.65 4,620.6 3,282.2 71.03Equity investments in funds 2,647.1 6,112.0 230.89 2,262.8 3,416.1 150.96Securitization exposures 4,669.0 1,050.8 22.50 4,185.2 972.7 23.24CVA risk / 2,137.8 / / 2,457.5 /Central counterparty-related / 163.0 / / 190.9 /Total ¥211,381.7 ¥56,308.2 25.54 ¥199,934.8 ¥52,628.8 24.99
Note1: "Specialized lending" is specialized lending exposure under supervisory slotting criteria.Note2: "Equity investments in funds" is total of look-though approach, mandate-based approach, simple approach and fall-back approach.Note3: "Equity investments in funds" and "Securitization exposures" as of March 31, 2019 are disclosed out of Internal ratings-based approach due to revision of FSA Notice No.20.
271
RWA by asset class and ratings segment
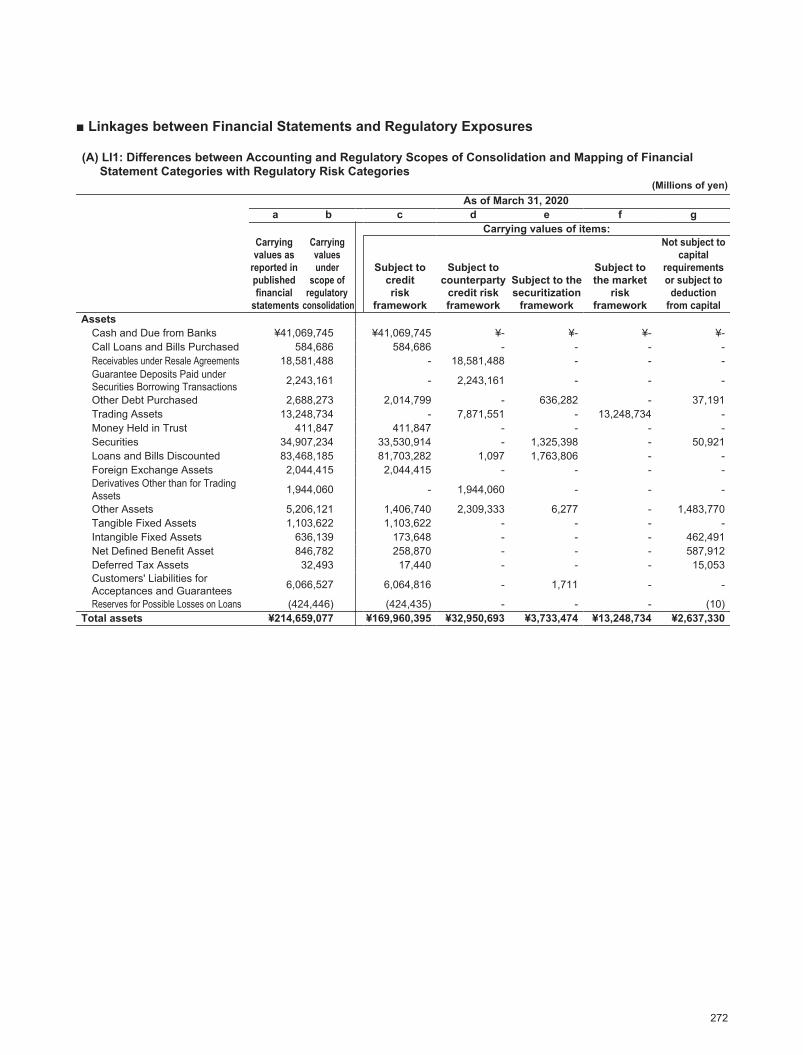
2020/09/07 16:50:34 / 20635245_株式会社みずほフィナンシャルグループ_総会その他(C)
■ Linkages between Financial Statements and Regulatory Exposures
(A) LI1: Differences between Accounting and Regulatory Scopes of Consolidation and Mapping of Financial Statement Categories with Regulatory Risk Categories
(Millions of yen)As of March 31, 2020
a b c d e f g
Carrying values as
reported in published financial
statements
Carrying values under
scope of regulatory
consolidation
Carrying values of items:
Subject tocreditrisk
framework
Subject tocounterparty
credit riskframework
Subject to thesecuritization
framework
Subject tothe market
riskframework
Not subject tocapital
requirementsor subject to
deductionfrom capital
AssetsCash and Due from Banks ¥41,069,745 ¥41,069,745 ¥- ¥- ¥- ¥-Call Loans and Bills Purchased 584,686 584,686 - - - -Receivables under Resale Agreements 18,581,488 - 18,581,488 - - -Guarantee Deposits Paid under Securities Borrowing Transactions 2,243,161 - 2,243,161 - - -
Other Debt Purchased 2,688,273 2,014,799 - 636,282 - 37,191Trading Assets 13,248,734 - 7,871,551 - 13,248,734 -Money Held in Trust 411,847 411,847 - - - -Securities 34,907,234 33,530,914 - 1,325,398 - 50,921Loans and Bills Discounted 83,468,185 81,703,282 1,097 1,763,806 - -Foreign Exchange Assets 2,044,415 2,044,415 - - - -Derivatives Other than for Trading Assets 1,944,060 - 1,944,060 - - -
Other Assets 5,206,121 1,406,740 2,309,333 6,277 - 1,483,770Tangible Fixed Assets 1,103,622 1,103,622 - - - -Intangible Fixed Assets 636,139 173,648 - - - 462,491Net Defined Benefit Asset 846,782 258,870 - - - 587,912Deferred Tax Assets 32,493 17,440 - - - 15,053Customers' Liabilities for Acceptances and Guarantees 6,066,527 6,064,816 - 1,711 - -
Reserves for Possible Losses on Loans (424,446) (424,435) - - - (10)Total assets ¥214,659,077 ¥169,960,395 ¥32,950,693 ¥3,733,474 ¥13,248,734 ¥2,637,330
272
Linkages between Financial Statements and Regulatory Exposures
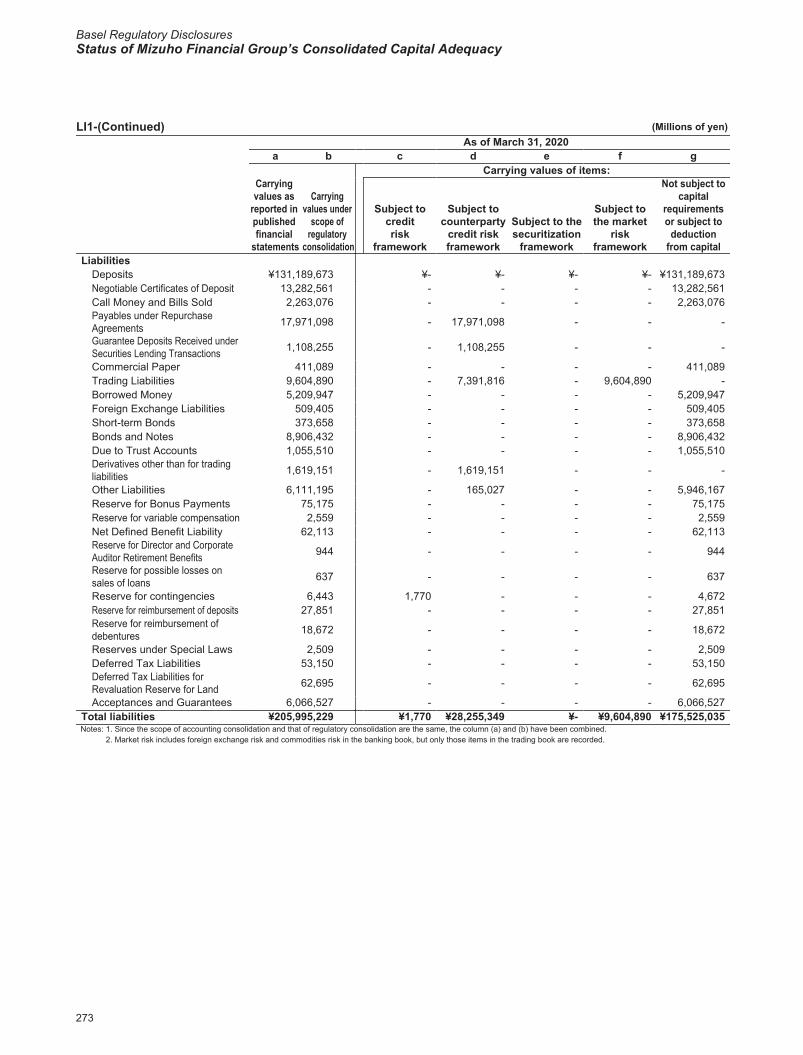
Basel Regulatory DisclosuresStatus of Mizuho Financial Group’s Consolidated Capital Adequacy
2020/09/07 16:50:34 / 20635245_株式会社みずほフィナンシャルグループ_総会その他(C)
LI1-(Continued) (Millions of yen)As of March 31, 2020
a b c d e f g
Carrying values as
reported in published financial
statements
Carrying values under
scope of regulatory
consolidation
Carrying values of items:
Subject tocreditrisk
framework
Subject tocounterparty
credit riskframework
Subject to thesecuritization
framework
Subject tothe market
riskframework
Not subject tocapital
requirementsor subject to
deductionfrom capital
LiabilitiesDeposits ¥131,189,673 ¥- ¥- ¥- ¥- ¥131,189,673Negotiable Certificates of Deposit 13,282,561 - - - - 13,282,561Call Money and Bills Sold 2,263,076 - - - - 2,263,076Payables under Repurchase Agreements 17,971,098 - 17,971,098 - - -
Guarantee Deposits Received under Securities Lending Transactions 1,108,255 - 1,108,255 - - -
Commercial Paper 411,089 - - - - 411,089Trading Liabilities 9,604,890 - 7,391,816 - 9,604,890 -Borrowed Money 5,209,947 - - - - 5,209,947Foreign Exchange Liabilities 509,405 - - - - 509,405Short-term Bonds 373,658 - - - - 373,658Bonds and Notes 8,906,432 - - - - 8,906,432Due to Trust Accounts 1,055,510 - - - - 1,055,510Derivatives other than for trading liabilities 1,619,151 - 1,619,151 - - -
Other Liabilities 6,111,195 - 165,027 - - 5,946,167Reserve for Bonus Payments 75,175 - - - - 75,175Reserve for variable compensation 2,559 - - - - 2,559Net Defined Benefit Liability 62,113 - - - - 62,113Reserve for Director and Corporate Auditor Retirement Benefits 944 - - - - 944
Reserve for possible losses on sales of loans 637 - - - - 637
Reserve for contingencies 6,443 1,770 - - - 4,672Reserve for reimbursement of deposits 27,851 - - - - 27,851Reserve for reimbursement of debentures 18,672 - - - - 18,672
Reserves under Special Laws 2,509 - - - - 2,509Deferred Tax Liabilities 53,150 - - - - 53,150Deferred Tax Liabilities for Revaluation Reserve for Land 62,695 - - - - 62,695
Acceptances and Guarantees 6,066,527 - - - - 6,066,527Total liabilities ¥205,995,229 ¥1,770 ¥28,255,349 ¥- ¥9,604,890 ¥175,525,035Notes: 1. Since the scope of accounting consolidation and that of regulatory consolidation are the same, the column (a) and (b) have been combined.
2. Market risk includes foreign exchange risk and commodities risk in the banking book, but only those items in the trading book are recorded.
273
Linkages between Financial Statements and Regulatory Exposures
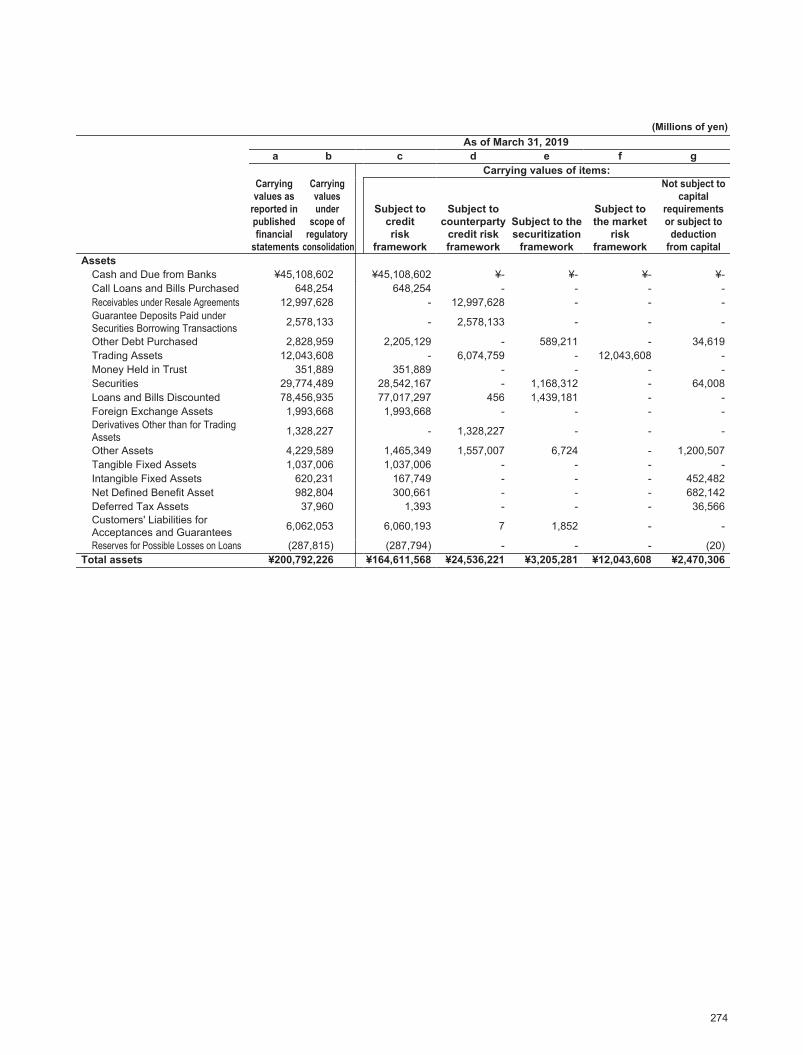
2020/09/07 16:50:34 / 20635245_株式会社みずほフィナンシャルグループ_総会その他(C)
(Millions of yen)As of March 31, 2019
a b c d e f g
Carrying values as
reported in published financial
statements
Carrying values under
scope of regulatory
consolidation
Carrying values of items:
Subject tocreditrisk
framework
Subject tocounterparty
credit riskframework
Subject to thesecuritization
framework
Subject tothe market
riskframework
Not subject tocapital
requirementsor subject to
deductionfrom capital
AssetsCash and Due from Banks ¥45,108,602 ¥45,108,602 ¥- ¥- ¥- ¥-Call Loans and Bills Purchased 648,254 648,254 - - - -Receivables under Resale Agreements 12,997,628 - 12,997,628 - - -Guarantee Deposits Paid under Securities Borrowing Transactions 2,578,133 - 2,578,133 - - -
Other Debt Purchased 2,828,959 2,205,129 - 589,211 - 34,619Trading Assets 12,043,608 - 6,074,759 - 12,043,608 -Money Held in Trust 351,889 351,889 - - - -Securities 29,774,489 28,542,167 - 1,168,312 - 64,008Loans and Bills Discounted 78,456,935 77,017,297 456 1,439,181 - -Foreign Exchange Assets 1,993,668 1,993,668 - - - -Derivatives Other than for Trading Assets 1,328,227 - 1,328,227 - - -
Other Assets 4,229,589 1,465,349 1,557,007 6,724 - 1,200,507Tangible Fixed Assets 1,037,006 1,037,006 - - - -Intangible Fixed Assets 620,231 167,749 - - - 452,482Net Defined Benefit Asset 982,804 300,661 - - - 682,142Deferred Tax Assets 37,960 1,393 - - - 36,566Customers' Liabilities for Acceptances and Guarantees 6,062,053 6,060,193 7 1,852 - -
Reserves for Possible Losses on Loans (287,815) (287,794) - - - (20)Total assets ¥200,792,226 ¥164,611,568 ¥24,536,221 ¥3,205,281 ¥12,043,608 ¥2,470,306
274
Linkages between Financial Statements and Regulatory Exposures
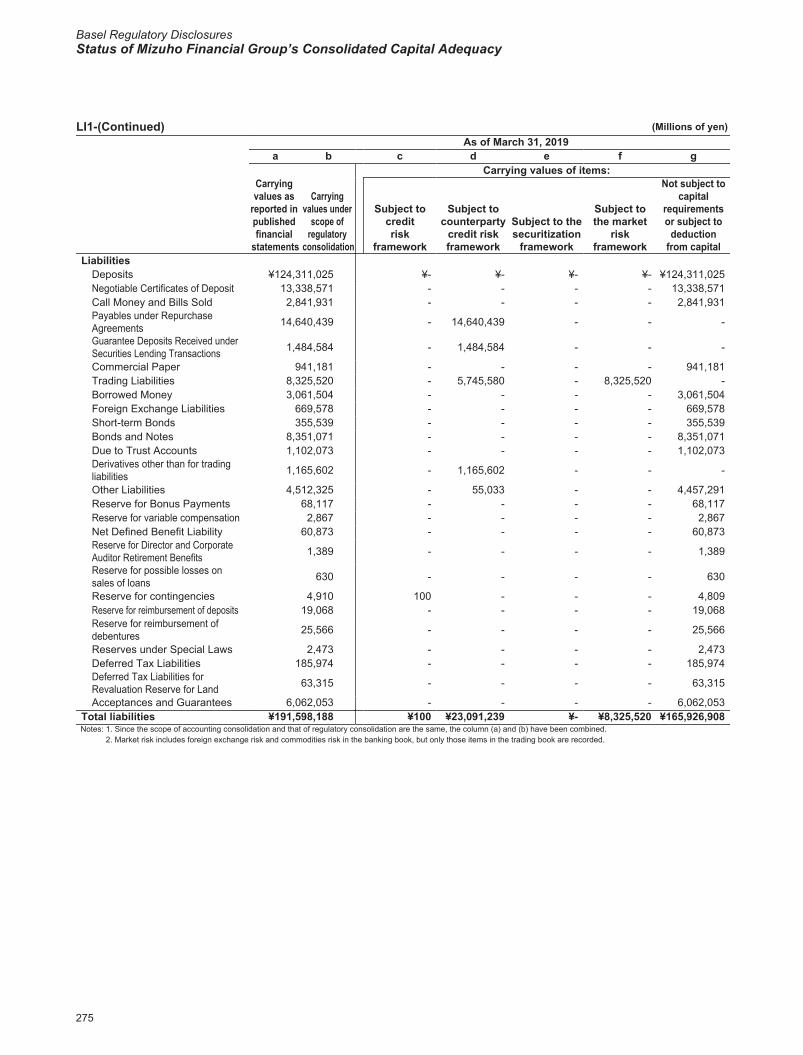
Basel Regulatory DisclosuresStatus of Mizuho Financial Group’s Consolidated Capital Adequacy
2020/09/07 16:50:34 / 20635245_株式会社みずほフィナンシャルグループ_総会その他(C)
LI1-(Continued) (Millions of yen)As of March 31, 2019
a b c d e f g
Carrying values as
reported in published financial
statements
Carrying values under
scope of regulatory
consolidation
Carrying values of items:
Subject tocreditrisk
framework
Subject tocounterparty
credit riskframework
Subject to thesecuritization
framework
Subject tothe market
riskframework
Not subject tocapital
requirementsor subject to
deductionfrom capital
LiabilitiesDeposits ¥124,311,025 ¥- ¥- ¥- ¥- ¥124,311,025Negotiable Certificates of Deposit 13,338,571 - - - - 13,338,571Call Money and Bills Sold 2,841,931 - - - - 2,841,931Payables under Repurchase Agreements 14,640,439 - 14,640,439 - - -
Guarantee Deposits Received under Securities Lending Transactions 1,484,584 - 1,484,584 - - -
Commercial Paper 941,181 - - - - 941,181Trading Liabilities 8,325,520 - 5,745,580 - 8,325,520 -Borrowed Money 3,061,504 - - - - 3,061,504Foreign Exchange Liabilities 669,578 - - - - 669,578Short-term Bonds 355,539 - - - - 355,539Bonds and Notes 8,351,071 - - - - 8,351,071Due to Trust Accounts 1,102,073 - - - - 1,102,073Derivatives other than for trading liabilities 1,165,602 - 1,165,602 - - -
Other Liabilities 4,512,325 - 55,033 - - 4,457,291Reserve for Bonus Payments 68,117 - - - - 68,117Reserve for variable compensation 2,867 - - - - 2,867Net Defined Benefit Liability 60,873 - - - - 60,873Reserve for Director and Corporate Auditor Retirement Benefits 1,389 - - - - 1,389
Reserve for possible losses on sales of loans 630 - - - - 630
Reserve for contingencies 4,910 100 - - - 4,809Reserve for reimbursement of deposits 19,068 - - - - 19,068Reserve for reimbursement of debentures 25,566 - - - - 25,566
Reserves under Special Laws 2,473 - - - - 2,473Deferred Tax Liabilities 185,974 - - - - 185,974Deferred Tax Liabilities for Revaluation Reserve for Land 63,315 - - - - 63,315
Acceptances and Guarantees 6,062,053 - - - - 6,062,053Total liabilities ¥191,598,188 ¥100 ¥23,091,239 ¥- ¥8,325,520 ¥165,926,908Notes: 1. Since the scope of accounting consolidation and that of regulatory consolidation are the same, the column (a) and (b) have been combined.
2. Market risk includes foreign exchange risk and commodities risk in the banking book, but only those items in the trading book are recorded.
275
Linkages between Financial Statements and Regulatory Exposures

2020/09/07 16:50:34 / 20635245_株式会社みずほフィナンシャルグループ_総会その他(C)
(B) LI2: Main Sources of Differences between Regulatory Exposure Amounts and Carrying Values in Financial Statements
(Millions of yen)As of March 31, 2020
a b c d e
Total
Items subject to:
Credit riskframework
Counterpartycredit riskframework
Securitizationframework
Market riskframework
1 Asset carrying value amount under scope of regulatory consolidation (as per template LI1) ¥212,021,746 ¥169,960,395 ¥32,950,693 ¥3,733,474 ¥13,248,734
2 Liabilities carrying value amount under regulatory scope of consolidation (as per template LI1) 30,470,193 1,770 28,255,349 - 9,604,890
3 Total net amount under regulatory scope of consolidation 181,551,552 169,958,625 4,695,343 3,733,474 3,643,8444 Off-balance sheet amounts 18,475,125 17,539,554 - 935,570 -
5 Differences due to consideration of provision for loan losses and write-offs 509,631 509,631 - - -
6 Differences due to derivative transactions, etc. 2,193,674 - 2,193,674 - -7 Differences due to repurchase transactions 14,196,805 - 14,196,805 - -8 Other differences 37,306 (442,430) - - -9 Exposure amounts considered for regulatory purposes ¥216,964,093 ¥187,565,380 ¥21,085,824 ¥4,669,045 ¥3,643,844
Notes: 1. Column (a) is not necessarily equal to the sum of columns (b) to (e) due to assets being riskweighted more than once.2. Differences between regulatory exposure amounts and carrying values in consolidated financial statements and the main sources of the differences are as follows.
・ Off-balance sheet amounts correspond to the differences produced mainly by adding exposures to undrawn commitments and by multiplying customer liabilities for acceptances and guarantees by the credit conversion factor (CCF) assigned to off-balance sheet items under the regulatory capital requirements.
・ Differences due to consideration of provision for loan losses, and write-offs are produced mainly by adding general provisions for loan losses, specific provisions for loan losses and partial direct bad debt write-offs to those assets subject to the advanced internal ratings-based approach.
・ Differences due to derivative transactions, etc. are produced mainly by incorporating future market value fluctuations and the effect of netting into regulatory exposure amounts. Derivative transactions, etc. include long-settlement transactions.
・ Differences due to repurchase transactions are mainly produced by adding the exposure amounts related to assets pledged as collateral and considering the effect of netting and collateral.
・ Other differences are produced mainly by considering the offsetting of deferred tax assets against deferred tax liabilities and the regulatory recognized effectiveness of hedging and making regulatory prudential adjustments.
(Millions of yen)As of March 31, 2019
a b c d e
Total
Items subject to:
Credit riskframework
Counterpartycredit riskframework
Securitizationframework
Market riskframework
1 Asset carrying value amount under scope of regulatory consolidation (as per template LI1) ¥198,321,920 ¥164,611,568 ¥24,536,221 ¥3,205,281 ¥12,043,608
2 Liabilities carrying value amount under regulatory scope of consolidation (as per template LI1) 25,671,280 100 23,091,239 - 8,325,520
3 Total net amount under regulatory scope of consolidation 172,650,640 164,611,467 1,444,982 3,205,281 3,718,0884 Off-balance sheet amounts 18,704,303 17,707,842 - 996,461 -
5 Differences due to consideration of provision for loan losses and write-offs 372,837 372,837 - - -
6 Differences due to derivative transactions, etc. 1,818,614 - 1,818,614 - -7 Differences due to repurchase transactions 11,473,212 - 11,473,212 - -8 Other differences (21,575) (350,755) - - -9 Exposure amounts considered for regulatory purposes ¥204,998,031 ¥182,341,391 ¥14,736,809 ¥4,201,743 ¥3,718,088
Notes: 1. Column (a) is not necessarily equal to the sum of columns (b) to (e) due to assets being riskweighted more than once.2. Differences between regulatory exposure amounts and carrying values in consolidated financial statements and the main sources of the differences are as follows.
・ Off-balance sheet amounts correspond to the differences produced mainly by adding exposures to undrawn commitments and by multiplying customer liabilities for acceptances and guarantees by the credit conversion factor (CCF) assigned to off-balance sheet items under the regulatory capital requirements.
・ Differences due to consideration of provision for loan losses, and write-offs are produced mainly by adding general provisions for loan losses, specific provisions for loan losses and partial direct bad debt write-offs to those assets subject to the advanced internal ratings-based approach.
・ Differences due to derivative transactions, etc. are produced mainly by incorporating future market value fluctuations and the effect of netting into regulatory exposure amounts. Derivative transactions, etc. include long-settlement transactions.
・ Differences due to repurchase transactions are mainly produced by adding the exposure amounts related to assets pledged as collateral and considering the effect of netting and collateral.
・ Other differences are produced mainly by considering the offsetting of deferred tax assets against deferred tax liabilities and the regulatory recognized effectiveness of hedging and making regulatory prudential adjustments.
276
Linkages between Financial Statements and Regulatory Exposures
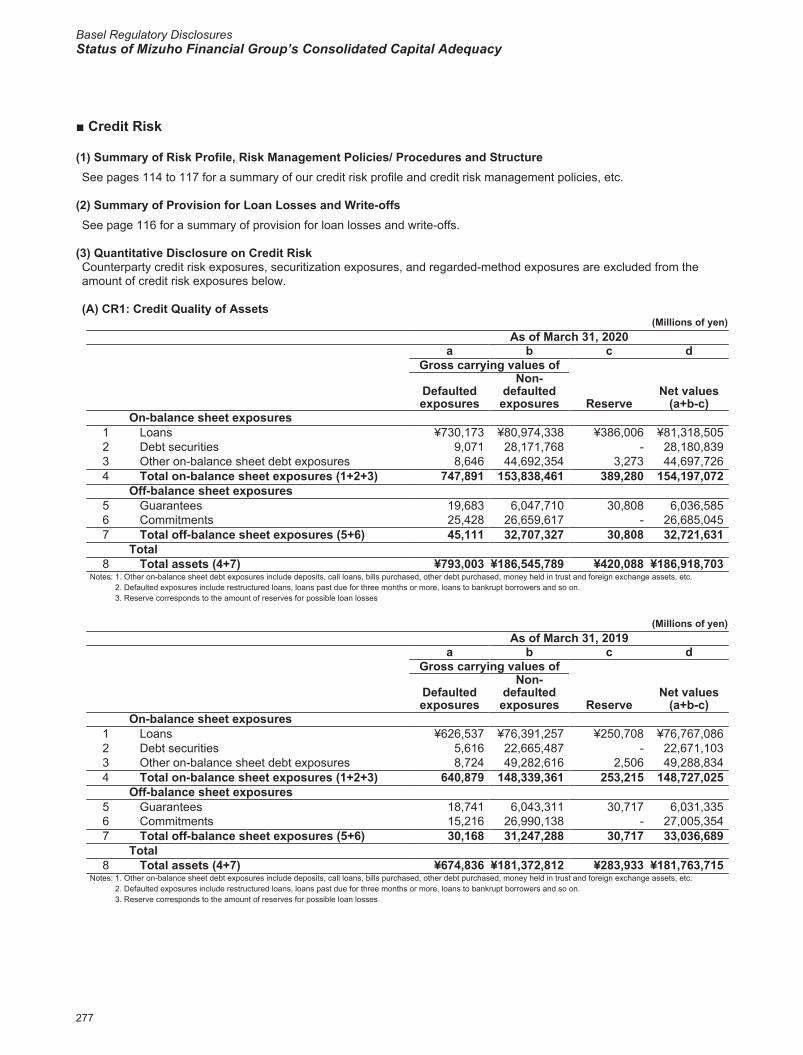
Basel Regulatory DisclosuresStatus of Mizuho Financial Group’s Consolidated Capital Adequacy
2020/09/07 16:50:34 / 20635245_株式会社みずほフィナンシャルグループ_総会その他(C)
■ Credit Risk
(1) Summary of Risk Profile, Risk Management Policies/ Procedures and StructureSee pages 114 to 117 for a summary of our credit risk profile and credit risk management policies, etc.
(2) Summary of Provision for Loan Losses and Write-offsSee page 116 for a summary of provision for loan losses and write-offs.
(3) Quantitative Disclosure on Credit RiskCounterparty credit risk exposures, securitization exposures, and regarded-method exposures are excluded from the amount of credit risk exposures below.
(A) CR1: Credit Quality of Assets(Millions of yen)
As of March 31, 2020a b c d
Gross carrying values of
Defaultedexposures
Non-defaulted
exposures ReserveNet values
(a+b-c)On-balance sheet exposures
1 Loans ¥730,173 ¥80,974,338 ¥386,006 ¥81,318,5052 Debt securities 9,071 28,171,768 - 28,180,8393 Other on-balance sheet debt exposures 8,646 44,692,354 3,273 44,697,7264 Total on-balance sheet exposures (1+2+3) 747,891 153,838,461 389,280 154,197,072
Off-balance sheet exposures5 Guarantees 19,683 6,047,710 30,808 6,036,5856 Commitments 25,428 26,659,617 - 26,685,0457 Total off-balance sheet exposures (5+6) 45,111 32,707,327 30,808 32,721,631
Total8 Total assets (4+7) ¥793,003 ¥186,545,789 ¥420,088 ¥186,918,703
Notes: 1. Other on-balance sheet debt exposures include deposits, call loans, bills purchased, other debt purchased, money held in trust and foreign exchange assets, etc.2. Defaulted exposures include restructured loans, loans past due for three months or more, loans to bankrupt borrowers and so on.3. Reserve corresponds to the amount of reserves for possible loan losses
(Millions of yen)As of March 31, 2019
a b c dGross carrying values of
Defaultedexposures
Non-defaulted
exposures ReserveNet values
(a+b-c)On-balance sheet exposures
1 Loans ¥626,537 ¥76,391,257 ¥250,708 ¥76,767,0862 Debt securities 5,616 22,665,487 - 22,671,1033 Other on-balance sheet debt exposures 8,724 49,282,616 2,506 49,288,8344 Total on-balance sheet exposures (1+2+3) 640,879 148,339,361 253,215 148,727,025
Off-balance sheet exposures5 Guarantees 18,741 6,043,311 30,717 6,031,3356 Commitments 15,216 26,990,138 - 27,005,3547 Total off-balance sheet exposures (5+6) 30,168 31,247,288 30,717 33,036,689
Total8 Total assets (4+7) ¥674,836 ¥181,372,812 ¥283,933 ¥181,763,715
Notes: 1. Other on-balance sheet debt exposures include deposits, call loans, bills purchased, other debt purchased, money held in trust and foreign exchange assets, etc.2. Defaulted exposures include restructured loans, loans past due for three months or more, loans to bankrupt borrowers and so on.3. Reserve corresponds to the amount of reserves for possible loan losses
277
Credit Risk、Quantitative Disclosure on Credit Risk
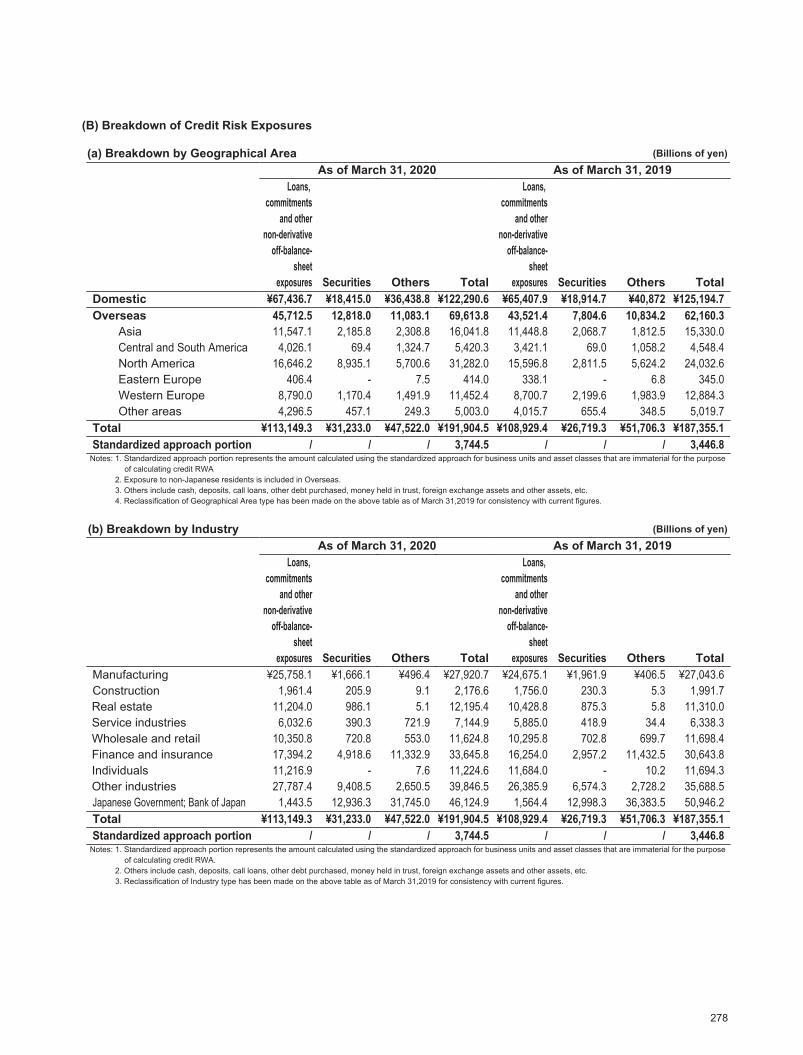
2020/09/07 16:50:34 / 20635245_株式会社みずほフィナンシャルグループ_総会その他(C)
(B) Breakdown of Credit Risk Exposures
(a) Breakdown by Geographical Area (Billions of yen)As of March 31, 2020 As of March 31, 2019
Loans, commitments
and othernon-derivative
off-balance-sheet
exposures Securities Others Total
Loans, commitments
and othernon-derivative
off-balance-sheet
exposures Securities Others TotalDomestic ¥67,436.7 ¥18,415.0 ¥36,438.8 ¥122,290.6 ¥65,407.9 ¥18,914.7 ¥40,872 ¥125,194.7Overseas 45,712.5 12,818.0 11,083.1 69,613.8 43,521.4 7,804.6 10,834.2 62,160.3
Asia 11,547.1 2,185.8 2,308.8 16,041.8 11,448.8 2,068.7 1,812.5 15,330.0Central and South America 4,026.1 69.4 1,324.7 5,420.3 3,421.1 69.0 1,058.2 4,548.4North America 16,646.2 8,935.1 5,700.6 31,282.0 15,596.8 2,811.5 5,624.2 24,032.6Eastern Europe 406.4 - 7.5 414.0 338.1 - 6.8 345.0Western Europe 8,790.0 1,170.4 1,491.9 11,452.4 8,700.7 2,199.6 1,983.9 12,884.3Other areas 4,296.5 457.1 249.3 5,003.0 4,015.7 655.4 348.5 5,019.7
Total ¥113,149.3 ¥31,233.0 ¥47,522.0 ¥191,904.5 ¥108,929.4 ¥26,719.3 ¥51,706.3 ¥187,355.1Standardized approach portion / / / 3,744.5 / / / 3,446.8
Notes: 1. Standardized approach portion represents the amount calculated using the standardized approach for business units and asset classes that are immaterial for the purpose of calculating credit RWA
2. Exposure to non-Japanese residents is included in Overseas.3. Others include cash, deposits, call loans, other debt purchased, money held in trust, foreign exchange assets and other assets, etc.4. Reclassification of Geographical Area type has been made on the above table as of March 31,2019 for consistency with current figures.
(b) Breakdown by Industry (Billions of yen)As of March 31, 2020 As of March 31, 2019
Loans, commitments
and othernon-derivative
off-balance-sheet
exposures Securities Others Total
Loans, commitments
and othernon-derivative
off-balance-sheet
exposures Securities Others TotalManufacturing ¥25,758.1 ¥1,666.1 ¥496.4 ¥27,920.7 ¥24,675.1 ¥1,961.9 ¥406.5 ¥27,043.6Construction 1,961.4 205.9 9.1 2,176.6 1,756.0 230.3 5.3 1,991.7Real estate 11,204.0 986.1 5.1 12,195.4 10,428.8 875.3 5.8 11,310.0Service industries 6,032.6 390.3 721.9 7,144.9 5,885.0 418.9 34.4 6,338.3Wholesale and retail 10,350.8 720.8 553.0 11,624.8 10,295.8 702.8 699.7 11,698.4Finance and insurance 17,394.2 4,918.6 11,332.9 33,645.8 16,254.0 2,957.2 11,432.5 30,643.8Individuals 11,216.9 - 7.6 11,224.6 11,684.0 - 10.2 11,694.3Other industries 27,787.4 9,408.5 2,650.5 39,846.5 26,385.9 6,574.3 2,728.2 35,688.5Japanese Government; Bank of Japan 1,443.5 12,936.3 31,745.0 46,124.9 1,564.4 12,998.3 36,383.5 50,946.2Total ¥113,149.3 ¥31,233.0 ¥47,522.0 ¥191,904.5 ¥108,929.4 ¥26,719.3 ¥51,706.3 ¥187,355.1Standardized approach portion / / / 3,744.5 / / / 3,446.8
Notes: 1. Standardized approach portion represents the amount calculated using the standardized approach for business units and asset classes that are immaterial for the purpose of calculating credit RWA.
2. Others include cash, deposits, call loans, other debt purchased, money held in trust, foreign exchange assets and other assets, etc.3. Reclassification of Industry type has been made on the above table as of March 31,2019 for consistency with current figures.
278
Quantitative Disclosure on Credit Risk
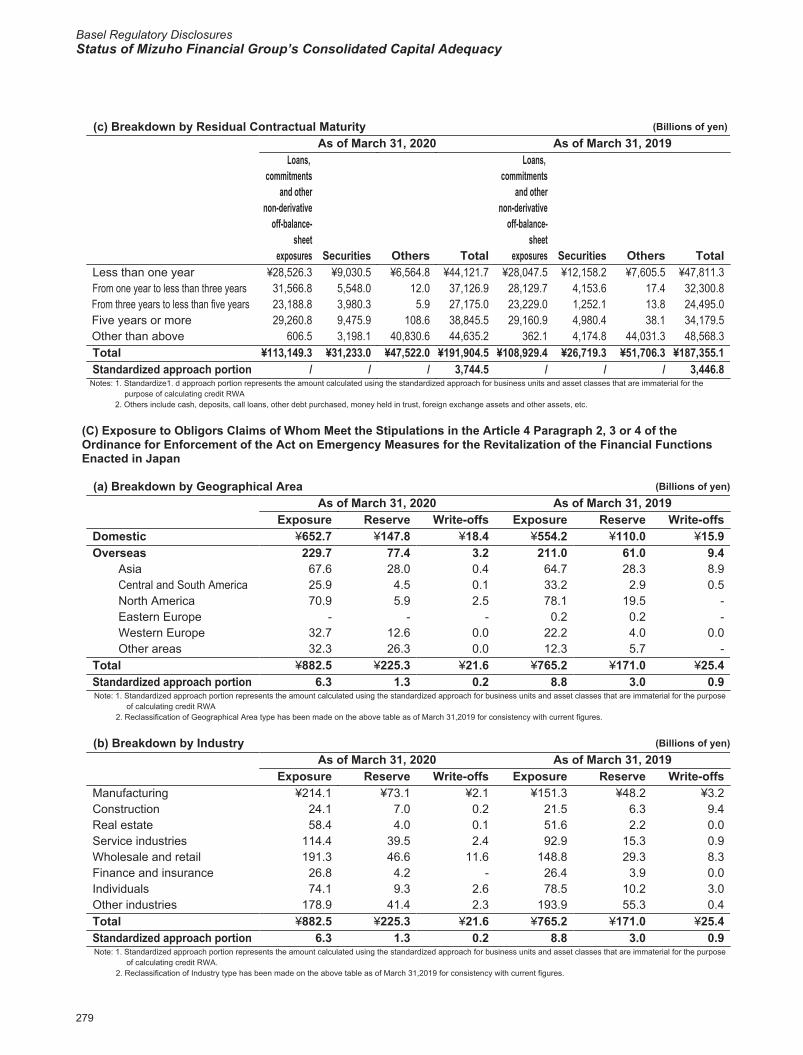
Basel Regulatory DisclosuresStatus of Mizuho Financial Group’s Consolidated Capital Adequacy
2020/09/07 16:50:34 / 20635245_株式会社みずほフィナンシャルグループ_総会その他(C)
(c) Breakdown by Residual Contractual Maturity (Billions of yen)As of March 31, 2020 As of March 31, 2019
Loans, commitments
and othernon-derivative
off-balance-sheet
exposures Securities Others Total
Loans, commitments
and othernon-derivative
off-balance-sheet
exposures Securities Others TotalLess than one year ¥28,526.3 ¥9,030.5 ¥6,564.8 ¥44,121.7 ¥28,047.5 ¥12,158.2 ¥7,605.5 ¥47,811.3From one year to less than three years 31,566.8 5,548.0 12.0 37,126.9 28,129.7 4,153.6 17.4 32,300.8From three years to less than five years 23,188.8 3,980.3 5.9 27,175.0 23,229.0 1,252.1 13.8 24,495.0Five years or more 29,260.8 9,475.9 108.6 38,845.5 29,160.9 4,980.4 38.1 34,179.5Other than above 606.5 3,198.1 40,830.6 44,635.2 362.1 4,174.8 44,031.3 48,568.3Total ¥113,149.3 ¥31,233.0 ¥47,522.0 ¥191,904.5 ¥108,929.4 ¥26,719.3 ¥51,706.3 ¥187,355.1Standardized approach portion / / / 3,744.5 / / / 3,446.8
Notes: 1. Standardize1. d approach portion represents the amount calculated using the standardized approach for business units and asset classes that are immaterial for the purpose of calculating credit RWA
2. Others include cash, deposits, call loans, other debt purchased, money held in trust, foreign exchange assets and other assets, etc.
(C) Exposure to Obligors Claims of Whom Meet the Stipulations in the Article 4 Paragraph 2, 3 or 4 of the Ordinance for Enforcement of the Act on Emergency Measures for the Revitalization of the Financial Functions Enacted in Japan
(a) Breakdown by Geographical Area (Billions of yen)As of March 31, 2020 As of March 31, 2019
Exposure Reserve Write-offs Exposure Reserve Write-offsDomestic ¥652.7 ¥147.8 ¥18.4 ¥554.2 ¥110.0 ¥15.9Overseas 229.7 77.4 3.2 211.0 61.0 9.4
Asia 67.6 28.0 0.4 64.7 28.3 8.9Central and South America 25.9 4.5 0.1 33.2 2.9 0.5North America 70.9 5.9 2.5 78.1 19.5 -Eastern Europe - - - 0.2 0.2 -Western Europe 32.7 12.6 0.0 22.2 4.0 0.0Other areas 32.3 26.3 0.0 12.3 5.7 -
Total ¥882.5 ¥225.3 ¥21.6 ¥765.2 ¥171.0 ¥25.4Standardized approach portion 6.3 1.3 0.2 8.8 3.0 0.9 Note: 1. Standardized approach portion represents the amount calculated using the standardized approach for business units and asset classes that are immaterial for the purpose
of calculating credit RWA2. Reclassification of Geographical Area type has been made on the above table as of March 31,2019 for consistency with current figures.
(b) Breakdown by Industry (Billions of yen)As of March 31, 2020 As of March 31, 2019
Exposure Reserve Write-offs Exposure Reserve Write-offsManufacturing ¥214.1 ¥73.1 ¥2.1 ¥151.3 ¥48.2 ¥3.2Construction 24.1 7.0 0.2 21.5 6.3 9.4Real estate 58.4 4.0 0.1 51.6 2.2 0.0Service industries 114.4 39.5 2.4 92.9 15.3 0.9Wholesale and retail 191.3 46.6 11.6 148.8 29.3 8.3Finance and insurance 26.8 4.2 - 26.4 3.9 0.0Individuals 74.1 9.3 2.6 78.5 10.2 3.0Other industries 178.9 41.4 2.3 193.9 55.3 0.4Total ¥882.5 ¥225.3 ¥21.6 ¥765.2 ¥171.0 ¥25.4Standardized approach portion 6.3 1.3 0.2 8.8 3.0 0.9 Note: 1. Standardized approach portion represents the amount calculated using the standardized approach for business units and asset classes that are immaterial for the purpose
of calculating credit RWA.2. Reclassification of Industry type has been made on the above table as of March 31,2019 for consistency with current figures.
279
Quantitative Disclosure on Credit Risk
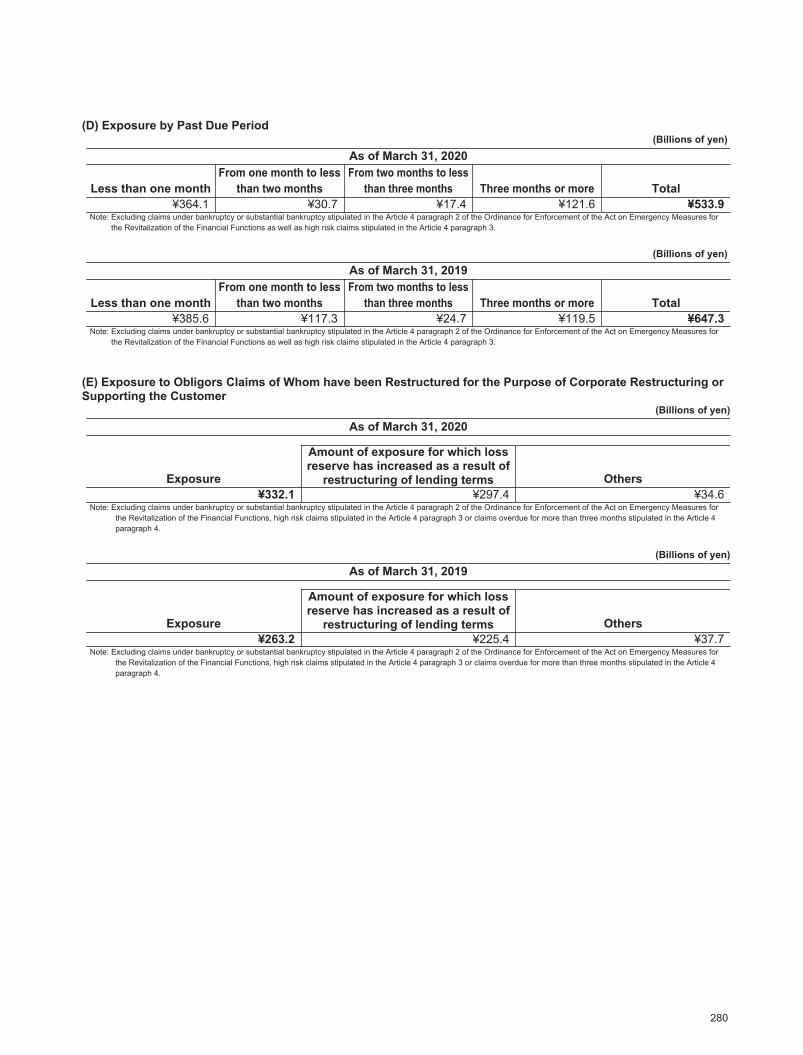
2020/09/07 16:50:34 / 20635245_株式会社みずほフィナンシャルグループ_総会その他(C)
(D) Exposure by Past Due Period(Billions of yen)
As of March 31, 2020
Less than one monthFrom one month to less
than two monthsFrom two months to less
than three months Three months or more Total¥364.1 ¥30.7 ¥17.4 ¥121.6 ¥533.9
Note: Excluding claims under bankruptcy or substantial bankruptcy stipulated in the Article 4 paragraph 2 of the Ordinance for Enforcement of the Act on Emergency Measures for the Revitalization of the Financial Functions as well as high risk claims stipulated in the Article 4 paragraph 3.
(Billions of yen)As of March 31, 2019
Less than one monthFrom one month to less
than two monthsFrom two months to less
than three months Three months or more Total¥385.6 ¥117.3 ¥24.7 ¥119.5 ¥647.3
Note: Excluding claims under bankruptcy or substantial bankruptcy stipulated in the Article 4 paragraph 2 of the Ordinance for Enforcement of the Act on Emergency Measures for the Revitalization of the Financial Functions as well as high risk claims stipulated in the Article 4 paragraph 3.
(E) Exposure to Obligors Claims of Whom have been Restructured for the Purpose of Corporate Restructuring or Supporting the Customer
(Billions of yen)As of March 31, 2020
Exposure
Amount of exposure for which lossreserve has increased as a result of
restructuring of lending terms Others¥332.1 ¥297.4 ¥34.6
Note: Excluding claims under bankruptcy or substantial bankruptcy stipulated in the Article 4 paragraph 2 of the Ordinance for Enforcement of the Act on Emergency Measures for the Revitalization of the Financial Functions, high risk claims stipulated in the Article 4 paragraph 3 or claims overdue for more than three months stipulated in the Article 4 paragraph 4.
(Billions of yen)As of March 31, 2019
Exposure
Amount of exposure for which lossreserve has increased as a result of
restructuring of lending terms Others¥263.2 ¥225.4 ¥37.7
Note: Excluding claims under bankruptcy or substantial bankruptcy stipulated in the Article 4 paragraph 2 of the Ordinance for Enforcement of the Act on Emergency Measures for the Revitalization of the Financial Functions, high risk claims stipulated in the Article 4 paragraph 3 or claims overdue for more than three months stipulated in the Article 4 paragraph 4.
280
Quantitative Disclosure on Credit Risk
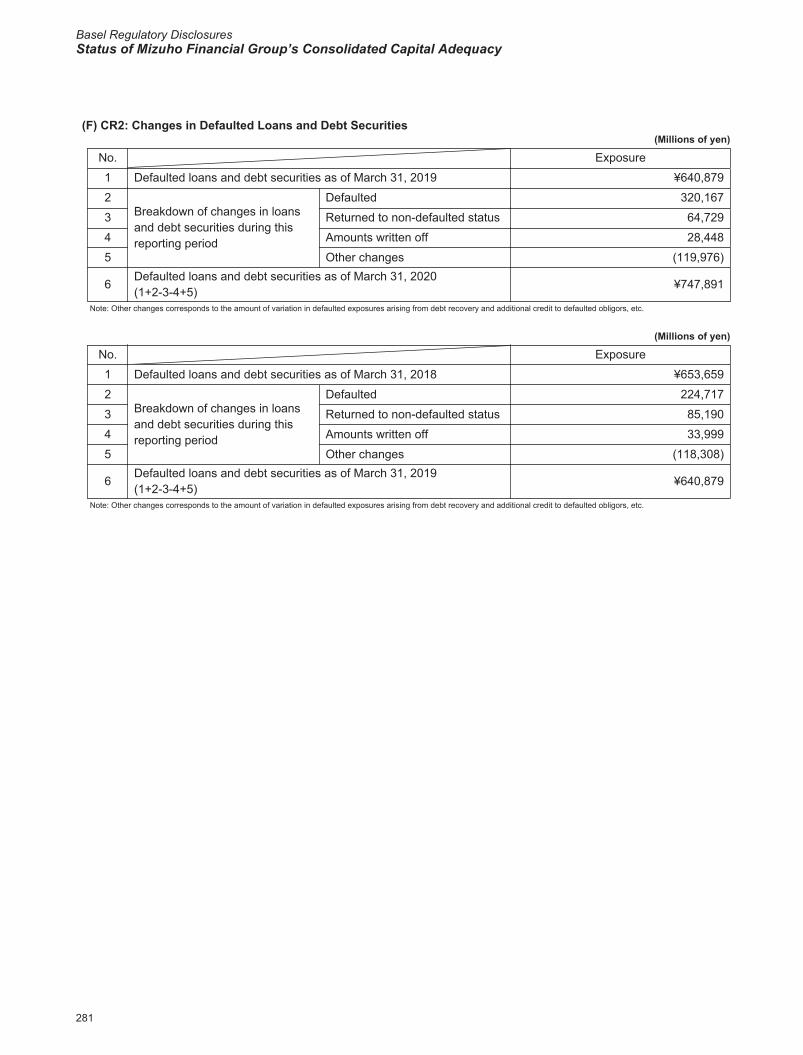
Basel Regulatory DisclosuresStatus of Mizuho Financial Group’s Consolidated Capital Adequacy
2020/09/07 16:50:34 / 20635245_株式会社みずほフィナンシャルグループ_総会その他(C)
(F) CR2: Changes in Defaulted Loans and Debt Securities(Millions of yen)
No. Exposure
1 Defaulted loans and debt securities as of March 31, 2019 ¥640,879
2Breakdown of changes in loans and debt securities during this reporting period
Defaulted 320,167
3 Returned to non-defaulted status 64,729
4 Amounts written off 28,448
5 Other changes (119,976)
6Defaulted loans and debt securities as of March 31, 2020(1+2-3-4+5)
¥747,891
Note: Other changes corresponds to the amount of variation in defaulted exposures arising from debt recovery and additional credit to defaulted obligors, etc.
(Millions of yen)
No. Exposure
1 Defaulted loans and debt securities as of March 31, 2018 ¥653,659
2Breakdown of changes in loans and debt securities during this reporting period
Defaulted 224,717
3 Returned to non-defaulted status 85,190
4 Amounts written off 33,999
5 Other changes (118,308)
6Defaulted loans and debt securities as of March 31, 2019(1+2-3-4+5)
¥640,879
Note: Other changes corresponds to the amount of variation in defaulted exposures arising from debt recovery and additional credit to defaulted obligors, etc.
281
Quantitative Disclosure on Credit Risk

2020/09/07 16:50:34 / 20635245_株式会社みずほフィナンシャルグループ_総会その他(C)
(4) Credit Risk under Internal Ratings-Based (IRB) Approach
(i) Summary of Internal Ratings-Based (IRB) ApproachWe have adopted Advanced Internal Ratings-Based (AIRB) Approach as a method to calculate credit risk weighted assets (RWA) since March 31, 2009. The following business units have adopted AIRB approach:
Mizuho Financial Group, Inc., Mizuho Bank, Ltd., Mizuho Trust & Banking Co., Ltd., Mizuho Credit Guarantee Co., Ltd., Mizuho Trust Realty Company Limited, Mizuho Bank (China), Mizuho Bank (USA), Ltd., Mizuho Bank Europe N.V., and Mizuho Capital Markets LLC., Mizuho Markets Cayman LP., and Mizuho Markets Americas LLC.Note: Special purpose companies (SPCs) controlled by the above companies have also adopted the AIRB approach due to their business operations integrated with their parent companies.
The application scope of AIRB is determined through taking into account the importance for each business unit, such as the ratio of its credit RWA to that of the entire group. AIRB is generally applied to those assets held by the business units that have adopted AIRB except for some asset classes considered immaterial for the purpose of calculating credit RWA .In addition, AIRB is used for all equity exposures regardless of what approach the business unit has adopted. With respect to credit RWA exposures under Regarded-Method, AIRB is used for those of which the look-through approach is applied except for cases where it is difficult to accurately calculate credit RWA regarding their underlying assets based on the IRB Approach and therefore reliability of credit RWA cannot be secured. The standardized approach will be applied to any of those business units and asset classes that do not meet the above conditions.
(ii) Summary of Our Internal Rating SystemSee pages 114 to 116 for a summary of our internal rating system and rating assignment procedures.
Estimation of parameters and validationWe use our own estimates for the parameters indicated below in the calculation of credit RWA under the Basel Framework. We generally validate the parameters by backtesting or other methods on an annual basis. Methods of estimation and validation as well as results are approved by the Chief Risk Officer.
PD Probability of default (likelihood of default of an obligor over a period of one year)LGD Loss given defaultEAD Exposure at default
The definition of default conforms to the Notice issued by Japan’s Financial Services Agency.
Details of Estimates:We estimate PD of corporate, sovereign and bank exposures per obligor rating, and that of retail exposures per pool allocations. In making estimations, we make conservative adjustments such as accounting for estimation error on the long-term average of internal default records. We supplement estimations for low default portfolios with external data. We apply the regulatory floor PD (0.03%) to A1-rated obligors in the measurement of credit RWA, except for sovereign exposures. The estimated parameters in almost all the PD categories such as obligor rating or pool allocations exceeded actual defaults in the last three years. The differences stemmed from such reasons as: actual defaults in the last few years were lower than the long-term average of the defaults over the entire period, which was the basis for our estimation; conservative adjustments have been made to estimated parameters.We estimate LGD based on obligor classifications in our self-assessments or pool allocations, and protection coverage. For LGD per obligor classifications, we estimate LGD under normal economic circumstances based on prior defaulted obligor data, making adjustments in consideration of periods of economic downturn using stochastic methods. Our estimation is based on validation of the time between the default event and the closure of the exposure as well as LGD for low default portfolios etc. With regard to protection, we estimate LGD per type of collateral using some external data.We estimate EAD based on prior defaulted obligor data.
(iii) Asset Class-based EAD Ratios to the Total EAD by Credit RWA Calculation Approach
As of March 31, 2020 As of March 31, 2019Internal Ratings-based Approach 98.18% 98.08%
Corporate 87.78% 86.81%Retail 5.70% 6.12%Equities 1.95% 2.44%Purchase Receivables 1.45% 1.62%Others 1.29% 1.07%
Standardized Approach 1.81% 1.91%Total 100.00% 100.00%Notes: 1. Counterparty credit risk exposures, securitization exposures, and regarded-method exposures are excluded from the amount of credit risk exposures above.
2. As for any portfolio to which the standardized approach is applied, exposure instead of EAD is used for calculation.
282
Qualitative Disclosure on Credit Risk under IRB approach
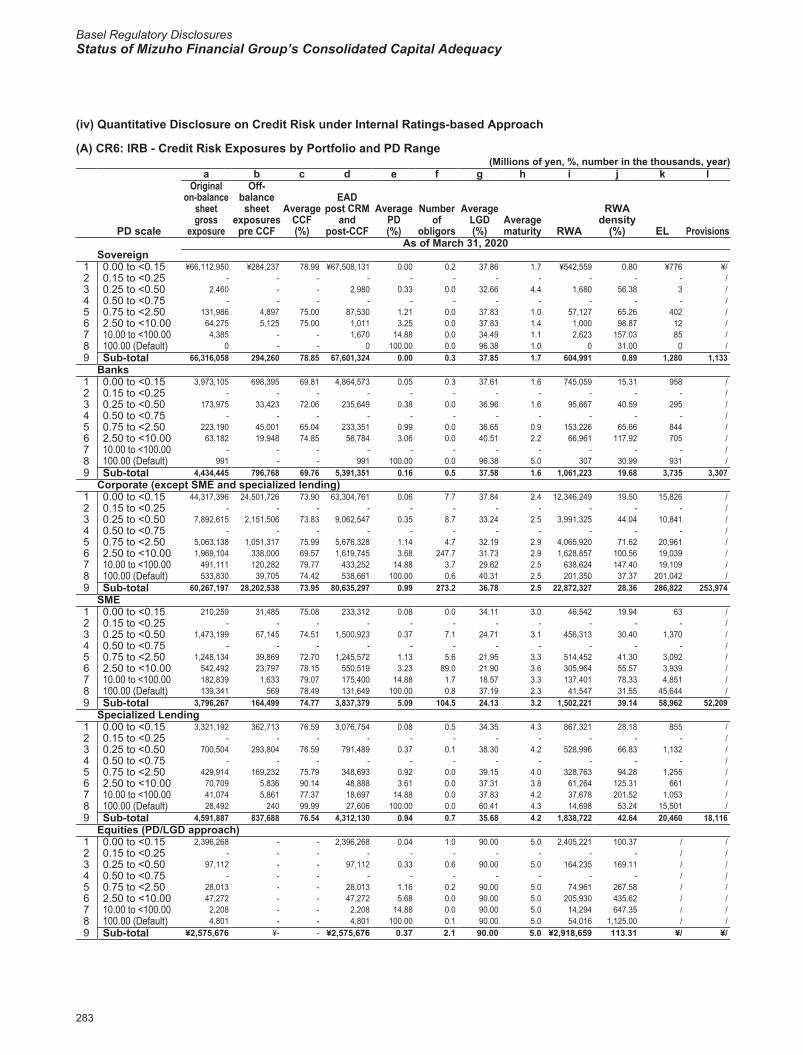
Basel Regulatory DisclosuresStatus of Mizuho Financial Group’s Consolidated Capital Adequacy
2020/09/07 16:50:34 / 20635245_株式会社みずほフィナンシャルグループ_総会その他(C)
(iv) Quantitative Disclosure on Credit Risk under Internal Ratings-based Approach
(A) CR6: IRB - Credit Risk Exposures by Portfolio and PD Range(Millions of yen, %, number in the thousands, year)
a b c d e f g h i j k l
PD scale
Originalon-balance
sheetgross
exposure
Off-balancesheet
exposurespre CCF
AverageCCF(%)
EADpost CRM
andpost-CCF
AveragePD(%)
Numberof
obligors
AverageLGD(%)
Averagematurity RWA
RWAdensity
(%) EL ProvisionsAs of March 31, 2020
Sovereign1 0.00 to <0.15 ¥66,112,950 ¥284,237 78.99 ¥67,508,131 0.00 0.2 37.86 1.7 ¥542,559 0.80 ¥776 ¥/2 0.15 to <0.25 - - - - - - - - - - - /3 0.25 to <0.50 2,460 - - 2,980 0.33 0.0 32.66 4.4 1,680 56.38 3 /4 0.50 to <0.75 - - - - - - - - - - - /5 0.75 to <2.50 131,986 4,897 75.00 87,530 1.21 0.0 37.83 1.0 57,127 65.26 402 /6 2.50 to <10.00 64,275 5,125 75.00 1,011 3.25 0.0 37.83 1.4 1,000 98.87 12 /7 10.00 to <100.00 4,385 - - 1,670 14.88 0.0 34.49 1.1 2,623 157.03 85 /8 100.00 (Default) 0 - - 0 100.00 0.0 96.38 1.0 0 31.00 0 /9 Sub-total 66,316,058 294,260 78.85 67,601,324 0.00 0.3 37.85 1.7 604,991 0.89 1,280 1,133
Banks1 0.00 to <0.15 3,973,105 698,395 69.81 4,864,573 0.05 0.3 37.61 1.6 745,059 15.31 958 /2 0.15 to <0.25 - - - - - - - - - - - /3 0.25 to <0.50 173,975 33,423 72.06 235,649 0.38 0.0 36.96 1.6 95,667 40.59 295 /4 0.50 to <0.75 - - - - - - - - - - - /5 0.75 to <2.50 223,190 45,001 65.04 233,351 0.99 0.0 36.65 0.9 153,226 65.66 844 /6 2.50 to <10.00 63,182 19,948 74.85 56,784 3.06 0.0 40.51 2.2 66,961 117.92 705 /7 10.00 to <100.00 - - - - - - - - - - - /8 100.00 (Default) 991 - - 991 100.00 0.0 96.38 5.0 307 30.99 931 /9 Sub-total 4,434,445 796,768 69.76 5,391,351 0.16 0.5 37.58 1.6 1,061,223 19.68 3,735 3,307
Corporate (except SME and specialized lending)1 0.00 to <0.15 44,317,396 24,501,726 73.90 63,304,761 0.06 7.7 37.84 2.4 12,346,249 19.50 15,826 /2 0.15 to <0.25 - - - - - - - - - - - /3 0.25 to <0.50 7,892,615 2,151,506 73.83 9,062,547 0.35 8.7 33.24 2.5 3,991,325 44.04 10,841 /4 0.50 to <0.75 - - - - - - - - - - - /5 0.75 to <2.50 5,063,138 1,051,317 75.99 5,676,328 1.14 4.7 32.19 2.9 4,065,920 71.62 20,961 /6 2.50 to <10.00 1,969,104 338,000 69.57 1,619,745 3.68 247.7 31.73 2.9 1,628,857 100.56 19,039 /7 10.00 to <100.00 491,111 120,282 79.77 433,252 14.88 3.7 29.62 2.5 638,624 147.40 19,109 /8 100.00 (Default) 533,830 39,705 74.42 538,661 100.00 0.6 40.31 2.5 201,350 37.37 201,042 /9 Sub-total 60,267,197 28,202,538 73.95 80,635,297 0.99 273.2 36.78 2.5 22,872,327 28.36 286,822 253,974
SME1 0.00 to <0.15 210,259 31,485 75.08 233,312 0.08 0.0 34.11 3.0 46,542 19.94 63 /2 0.15 to <0.25 - - - - - - - - - - - /3 0.25 to <0.50 1,473,199 67,145 74.51 1,500,923 0.37 7.1 24.71 3.1 456,313 30.40 1,370 /4 0.50 to <0.75 - - - - - - - - - - - /5 0.75 to <2.50 1,248,134 39,869 72.70 1,245,572 1.13 5.6 21.95 3.3 514,452 41.30 3,092 /6 2.50 to <10.00 542,492 23,797 78.15 550,519 3.23 89.0 21.90 3.6 305,964 55.57 3,939 /7 10.00 to <100.00 182,839 1,633 79.07 175,400 14.88 1.7 18.57 3.3 137,401 78.33 4,851 /8 100.00 (Default) 139,341 569 78.49 131,649 100.00 0.8 37.19 2.3 41,547 31.55 45,644 /9 Sub-total 3,796,267 164,499 74.77 3,837,379 5.09 104.5 24.13 3.2 1,502,221 39.14 58,962 52,209
Specialized Lending1 0.00 to <0.15 3,321,192 362,713 76.59 3,076,754 0.08 0.5 34.35 4.3 867,321 28.18 855 /2 0.15 to <0.25 - - - - - - - - - - - /3 0.25 to <0.50 700,504 293,804 76.59 791,489 0.37 0.1 38.30 4.2 528,996 66.83 1,132 /4 0.50 to <0.75 - - - - - - - - - - - /5 0.75 to <2.50 429,914 169,232 75.79 348,693 0.92 0.0 39.15 4.0 328,763 94.28 1,255 /6 2.50 to <10.00 70,709 5,836 90.14 48,888 3.61 0.0 37.31 3.8 61,264 125.31 661 /7 10.00 to <100.00 41,074 5,861 77.37 18,697 14.88 0.0 37.83 4.2 37,678 201.52 1,053 /8 100.00 (Default) 28,492 240 99.99 27,606 100.00 0.0 60.41 4.3 14,698 53.24 15,501 /9 Sub-total 4,591,887 837,688 76.54 4,312,130 0.94 0.7 35.68 4.2 1,838,722 42.64 20,460 18,116
Equities (PD/LGD approach)1 0.00 to <0.15 2,396,268 - - 2,396,268 0.04 1.0 90.00 5.0 2,405,221 100.37 / /2 0.15 to <0.25 - - - - - - - - - - / /3 0.25 to <0.50 97,112 - - 97,112 0.33 0.6 90.00 5.0 164,235 169.11 / /4 0.50 to <0.75 - - - - - - - - - - / /5 0.75 to <2.50 28,013 - - 28,013 1.16 0.2 90.00 5.0 74,961 267.58 / /6 2.50 to <10.00 47,272 - - 47,272 5.68 0.0 90.00 5.0 205,930 435.62 / /7 10.00 to <100.00 2,208 - - 2,208 14.88 0.0 90.00 5.0 14,294 647.35 / /8 100.00 (Default) 4,801 - - 4,801 100.00 0.1 90.00 5.0 54,016 1,125.00 / /9 Sub-total ¥2,575,676 ¥- - ¥2,575,676 0.37 2.1 90.00 5.0 ¥2,918,659 113.31 ¥/ ¥/
283
Quantitative Disclosure on Credit Risk under IRB approach

2020/09/07 16:50:34 / 20635245_株式会社みずほフィナンシャルグループ_総会その他(C)
CR6-(Continued)(Millions of yen, %, number in the thousands, year)
a b c d e f g h i j k l
PD scale
Originalon-balance
sheetgross
exposure
Off-balancesheet
exposurespre CCF
AverageCCF(%)
EADpost CRM
andpost-CCF
AveragePD(%)
Numberof
obligors
AverageLGD(%)
Averagematurity RWA
RWAdensity
(%) EL ProvisionsAs of March 31, 2020
Purchased receivables (Corporate, etc.) - Default Risk Equivalent1 0.00 to <0.15 ¥2,180,942 ¥243,041 77.54 ¥2,369,298 0.06 0.7 38.12 1.4 ¥299,332 12.63 ¥581 ¥/2 0.15 to <0.25 - - - - - - - - - - - /3 0.25 to <0.50 187,781 25,223 80.65 208,126 0.32 0.2 37.83 1.9 87,923 42.24 258 /4 0.50 to <0.75 - - - - - - - - - - - /5 0.75 to <2.50 61,612 3,297 85.45 64,430 1.20 0.0 37.83 2.6 52,917 82.13 294 /6 2.50 to <10.00 23,611 10,838 86.30 32,966 3.23 0.0 37.83 1.8 33,954 102.99 403 /7 10.00 to <100.00 753 - - 753 14.88 0.0 37.83 0.1 1,237 164.30 42 /8 100.00 (Default) 917 - - 917 100.00 0.0 45.30 0.9 474 51.66 377 /9 Sub-total 2,455,620 282,399 78.25 2,676,492 0.19 1.0 38.09 1.5 475,839 17.77 1,959 1,734
Purchased receivables (Retail) - Default Risk Equivalent1 0.00 to <0.15 - - - - - - - - - - - /2 0.15 to <0.25 - - - - - - - - - - - /3 0.25 to <0.50 - - - - - - - - - - - /4 0.50 to <0.75 - - - - - - - - - - - /5 0.75 to <2.50 - - - - - - - - - - - /6 2.50 to <10.00 - - - - - - - - - - - /7 10.00 to <100.00 - - - - - - - - - - - /8 100.00 (Default) - - - - - - - - - - - /9 Sub-total - - - - - - - - - - - -
Purchased receivables (Dilution Risk Equivalent)1 0.00 to <0.15 1,100,298 36,485 100.00 1,136,783 0.06 0.1 37.83 - 136,422 12.00 295 /2 0.15 to <0.25 - - - - - - - - - - - /3 0.25 to <0.50 89,397 11,380 100.00 100,777 0.32 0.0 37.67 - 34,199 33.93 124 /4 0.50 to <0.75 - - - - - - - - - - - /5 0.75 to <2.50 42,229 - - 42,229 1.52 0.0 37.83 - 32,242 76.35 243 /6 2.50 to <10.00 42,264 - - 42,264 3.24 0.0 37.83 - 39,998 94.63 519 /7 10.00 to <100.00 843 - - 843 14.88 0.0 37.83 - 1,451 171.98 47 /8 100.00 (Default) 26,636 - - 26,636 100.00 0.0 51.23 - 15,218 57.13 12,429 /9 Sub-total 1,301,669 47,865 100.00 1,349,534 2.21 0.1 38.08 - 259,532 19.23 13,659 /
Retail – qualifying revolving retail exposures (QRRE)1 0.00 to <0.15 - - - - - - - / - - - /2 0.15 to <0.25 - - - 2 0.15 0.0 72.62 / 0 6.42 0 /3 0.25 to <0.50 - - - 30 0.33 0.7 79.32 / 3 12.90 0 /4 0.50 to <0.75 - - - 27 0.73 1.6 79.32 / 6 23.94 0 /5 0.75 to <2.50 227,008 842,372 13.74 342,771 2.38 571.9 79.31 / 198,228 57.83 6,472 /6 2.50 to <10.00 167,858 875,085 7.89 236,844 4.24 2,044.5 79.32 / 201,203 84.95 7,976 /7 10.00 to <100.00 33,264 17,653 29.19 38,417 18.69 207.4 79.32 / 68,507 178.32 5,696 /8 100.00 (Default) 507 1,239 10.86 639 100.00 1.9 72.11 / 572 89.50 415 /9 Sub-total 428,639 1,736,351 10.94 618,733 4.20 2,828.2 79.31 / 468,522 75.72 20,561 18,206
Retail – Residential mortgage1 0.00 to <0.15 1,802,107 - - 1,837,359 0.08 217.3 28.77 / 107,528 5.85 443 /2 0.15 to <0.25 1,069,410 - - 1,071,224 0.20 100.6 31.92 / 138,852 12.96 696 /3 0.25 to <0.50 1,843,518 - - 1,900,321 0.34 217.0 32.11 / 360,340 18.96 2,077 /4 0.50 to <0.75 1,968,725 76,439 96.76 1,947,361 0.63 278.1 34.38 / 611,736 31.41 4,210 /5 0.75 to <2.50 1,458,221 415 100.00 1,459,858 1.07 183.3 34.82 / 657,889 45.06 5,371 /6 2.50 to <10.00 100,861 2,131 100.00 103,246 9.29 14.3 36.29 / 165,152 159.95 3,483 /7 10.00 to <100.00 20,248 1,560 100.00 21,814 50.21 3.3 39.32 / 39,824 182.55 4,305 /8 100.00 (Default) 60,942 1,178 100.00 62,104 100.00 5.0 44.12 / 32,829 52.86 24,779 /9 Sub-total 8,324,037 81,724 96.97 8,403,291 1.43 1,019.2 32.51 / 2,114,155 25.15 45,368 40,173
Other retail1 0.00 to <0.15 19 - - 231,398 0.06 32.9 47.27 / 17,718 7.65 69 /2 0.15 to <0.25 13 - - 63,248 0.17 3.5 46.22 / 10,945 17.30 52 /3 0.25 to <0.50 114,025 104 90.38 114,254 0.34 3.2 48.19 / 31,634 27.68 188 /4 0.50 to <0.75 19,389 84 75.00 19,518 0.65 0.9 18.72 / 3,047 15.61 24 /5 0.75 to <2.50 890,961 3,053 77.88 838,185 1.34 102.7 44.61 / 396,337 47.28 4,595 /6 2.50 to <10.00 329,655 1,551 64.73 147,700 6.50 16.0 18.32 / 39,839 26.97 1,331 /7 10.00 to <100.00 77,356 7,855 53.54 40,363 17.97 14.0 34.30 / 28,552 70.73 2,696 /8 100.00 (Default) 64,190 2,178 96.24 50,786 100.00 2.6 47.82 / 24,692 48.61 22,313 /9 Sub-total 1,495,612 14,828 66.38 1,505,455 5.29 176.0 42.27 / 552,767 36.71 31,271 27,690Total (all portfolios) ¥155,987,112 ¥32,458,925 70.72 ¥178,906,668 0.73 4,406.4 37.7 2.2 ¥34,668,964 19.37 ¥484,080 ¥416,548
Notes: 1. Counterparty credit risk exposures, securitization exposures, and regarded-method exposures are excluded from the amount of credit risk exposures above.2. On-balance sheet exposures, pre-CCF and pre- CRM off-balance sheet exposures, and the average CCF are allocated to the PD ranges based on pre- CRM PD
estimates.3. The number of credits is disclosed as the number of data of obligors for QRRE, residential mortgage and other retail excluding credit for business purpose.
284
Quantitative Disclosure on Credit Risk under IRB approach
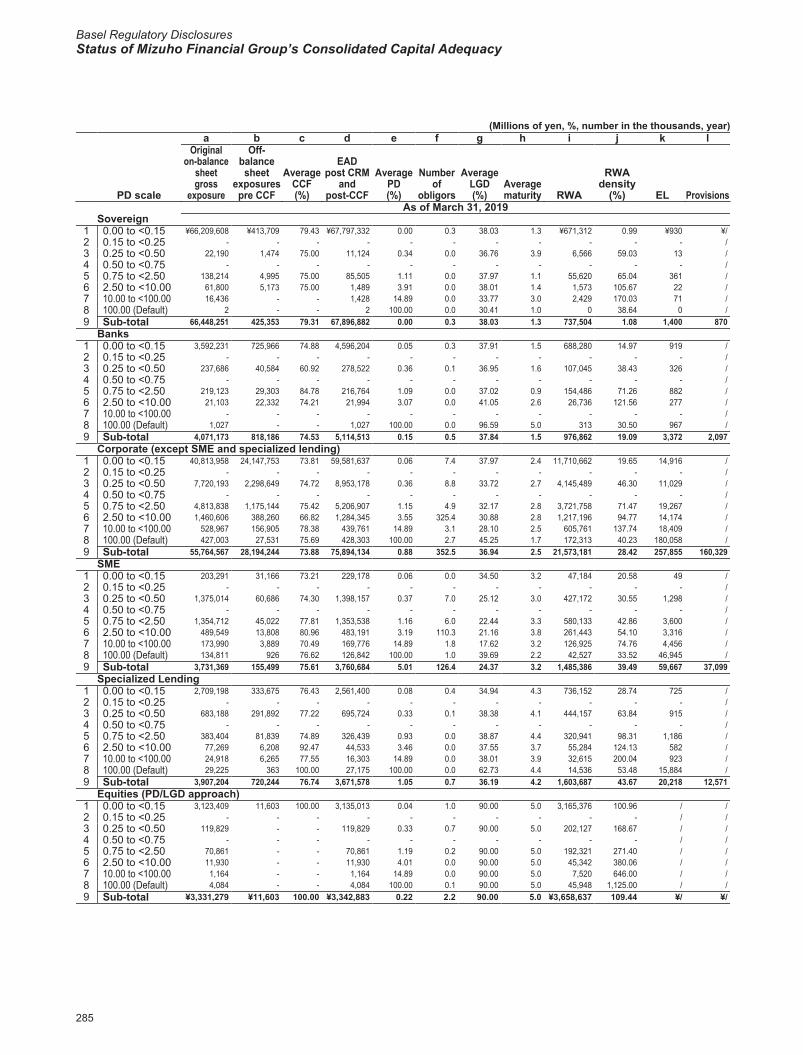
Basel Regulatory DisclosuresStatus of Mizuho Financial Group’s Consolidated Capital Adequacy
2020/09/07 16:50:34 / 20635245_株式会社みずほフィナンシャルグループ_総会その他(C)
(Millions of yen, %, number in the thousands, year)a b c d e f g h i j k l
PD scale
Originalon-balance
sheetgross
exposure
Off-balancesheet
exposurespre CCF
AverageCCF(%)
EADpost CRM
andpost-CCF
AveragePD(%)
Numberof
obligors
AverageLGD(%)
Averagematurity RWA
RWAdensity
(%) EL ProvisionsAs of March 31, 2019
Sovereign1 0.00 to <0.15 ¥66,209,608 ¥413,709 79.43 ¥67,797,332 0.00 0.3 38.03 1.3 ¥671,312 0.99 ¥930 ¥/2 0.15 to <0.25 - - - - - - - - - - - /3 0.25 to <0.50 22,190 1,474 75.00 11,124 0.34 0.0 36.76 3.9 6,566 59.03 13 /4 0.50 to <0.75 - - - - - - - - - - - /5 0.75 to <2.50 138,214 4,995 75.00 85,505 1.11 0.0 37.97 1.1 55,620 65.04 361 /6 2.50 to <10.00 61,800 5,173 75.00 1,489 3.91 0.0 38.01 1.4 1,573 105.67 22 /7 10.00 to <100.00 16,436 - - 1,428 14.89 0.0 33.77 3.0 2,429 170.03 71 /8 100.00 (Default) 2 - - 2 100.00 0.0 30.41 1.0 0 38.64 0 /9 Sub-total 66,448,251 425,353 79.31 67,896,882 0.00 0.3 38.03 1.3 737,504 1.08 1,400 870
Banks1 0.00 to <0.15 3,592,231 725,966 74.88 4,596,204 0.05 0.3 37.91 1.5 688,280 14.97 919 /2 0.15 to <0.25 - - - - - - - - - - - /3 0.25 to <0.50 237,686 40,584 60.92 278,522 0.36 0.1 36.95 1.6 107,045 38.43 326 /4 0.50 to <0.75 - - - - - - - - - - - /5 0.75 to <2.50 219,123 29,303 84.78 216,764 1.09 0.0 37.02 0.9 154,486 71.26 882 /6 2.50 to <10.00 21,103 22,332 74.21 21,994 3.07 0.0 41.05 2.6 26,736 121.56 277 /7 10.00 to <100.00 - - - - - - - - - - - /8 100.00 (Default) 1,027 - - 1,027 100.00 0.0 96.59 5.0 313 30.50 967 /9 Sub-total 4,071,173 818,186 74.53 5,114,513 0.15 0.5 37.84 1.5 976,862 19.09 3,372 2,097
Corporate (except SME and specialized lending)1 0.00 to <0.15 40,813,958 24,147,753 73.81 59,581,637 0.06 7.4 37.97 2.4 11,710,662 19.65 14,916 /2 0.15 to <0.25 - - - - - - - - - - - /3 0.25 to <0.50 7,720,193 2,298,649 74.72 8,953,178 0.36 8.8 33.72 2.7 4,145,489 46.30 11,029 /4 0.50 to <0.75 - - - - - - - - - - - /5 0.75 to <2.50 4,813,838 1,175,144 75.42 5,206,907 1.15 4.9 32.17 2.8 3,721,758 71.47 19,267 /6 2.50 to <10.00 1,460,606 388,260 66.82 1,284,345 3.55 325.4 30.88 2.8 1,217,196 94.77 14,174 /7 10.00 to <100.00 528,967 156,905 78.38 439,761 14.89 3.1 28.10 2.5 605,761 137.74 18,409 /8 100.00 (Default) 427,003 27,531 75.69 428,303 100.00 2.7 45.25 1.7 172,313 40.23 180,058 /9 Sub-total 55,764,567 28,194,244 73.88 75,894,134 0.88 352.5 36.94 2.5 21,573,181 28.42 257,855 160,329
SME1 0.00 to <0.15 203,291 31,166 73.21 229,178 0.06 0.0 34.50 3.2 47,184 20.58 49 /2 0.15 to <0.25 - - - - - - - - - - - /3 0.25 to <0.50 1,375,014 60,686 74.30 1,398,157 0.37 7.0 25.12 3.0 427,172 30.55 1,298 /4 0.50 to <0.75 - - - - - - - - - - - /5 0.75 to <2.50 1,354,712 45,022 77.81 1,353,538 1.16 6.0 22.44 3.3 580,133 42.86 3,600 /6 2.50 to <10.00 489,549 13,808 80.96 483,191 3.19 110.3 21.16 3.8 261,443 54.10 3,316 /7 10.00 to <100.00 173,990 3,889 70.49 169,776 14.89 1.8 17.62 3.2 126,925 74.76 4,456 /8 100.00 (Default) 134,811 926 76.62 126,842 100.00 1.0 39.69 2.2 42,527 33.52 46,945 /9 Sub-total 3,731,369 155,499 75.61 3,760,684 5.01 126.4 24.37 3.2 1,485,386 39.49 59,667 37,099
Specialized Lending1 0.00 to <0.15 2,709,198 333,675 76.43 2,561,400 0.08 0.4 34.94 4.3 736,152 28.74 725 /2 0.15 to <0.25 - - - - - - - - - - - /3 0.25 to <0.50 683,188 291,892 77.22 695,724 0.33 0.1 38.38 4.1 444,157 63.84 915 /4 0.50 to <0.75 - - - - - - - - - - - /5 0.75 to <2.50 383,404 81,839 74.89 326,439 0.93 0.0 38.87 4.4 320,941 98.31 1,186 /6 2.50 to <10.00 77,269 6,208 92.47 44,533 3.46 0.0 37.55 3.7 55,284 124.13 582 /7 10.00 to <100.00 24,918 6,265 77.55 16,303 14.89 0.0 38.01 3.9 32,615 200.04 923 /8 100.00 (Default) 29,225 363 100.00 27,175 100.00 0.0 62.73 4.4 14,536 53.48 15,884 /9 Sub-total 3,907,204 720,244 76.74 3,671,578 1.05 0.7 36.19 4.2 1,603,687 43.67 20,218 12,571
Equities (PD/LGD approach)1 0.00 to <0.15 3,123,409 11,603 100.00 3,135,013 0.04 1.0 90.00 5.0 3,165,376 100.96 / /2 0.15 to <0.25 - - - - - - - - - - / /3 0.25 to <0.50 119,829 - - 119,829 0.33 0.7 90.00 5.0 202,127 168.67 / /4 0.50 to <0.75 - - - - - - - - - - / /5 0.75 to <2.50 70,861 - - 70,861 1.19 0.2 90.00 5.0 192,321 271.40 / /6 2.50 to <10.00 11,930 - - 11,930 4.01 0.0 90.00 5.0 45,342 380.06 / /7 10.00 to <100.00 1,164 - - 1,164 14.89 0.0 90.00 5.0 7,520 646.00 / /8 100.00 (Default) 4,084 - - 4,084 100.00 0.1 90.00 5.0 45,948 1,125.00 / /9 Sub-total ¥3,331,279 ¥11,603 100.00 ¥3,342,883 0.22 2.2 90.00 5.0 ¥3,658,637 109.44 ¥/ ¥/
285
Quantitative Disclosure on Credit Risk under IRB approach
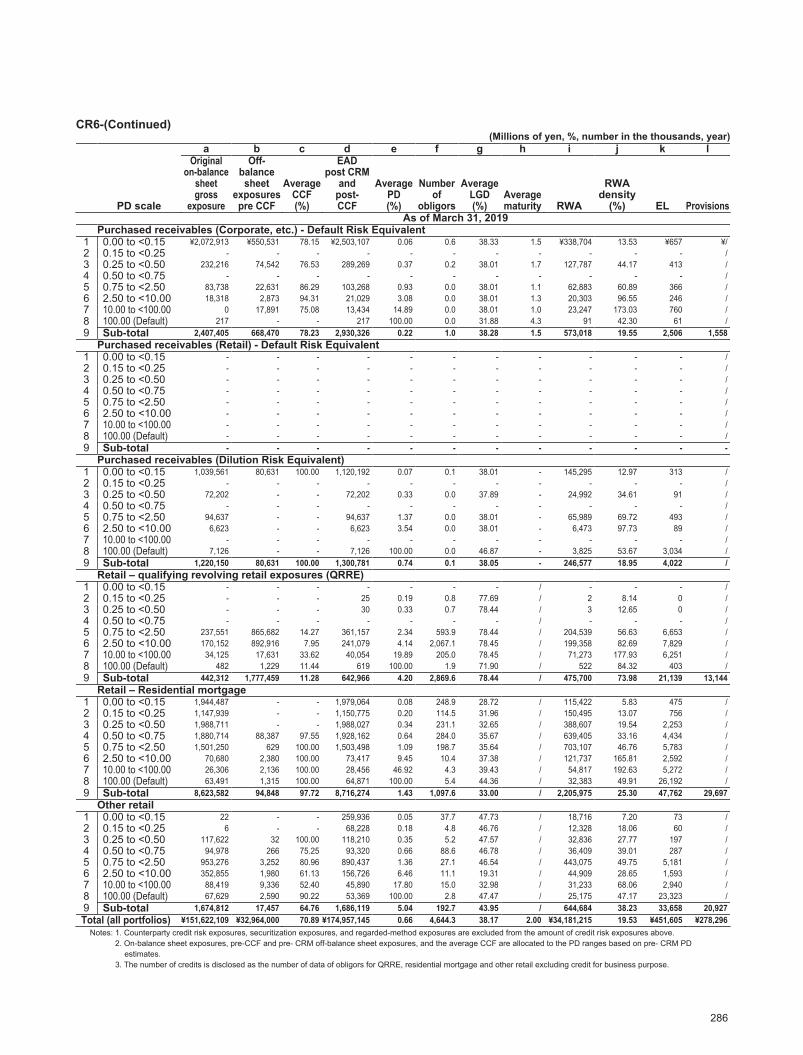
2020/09/07 16:50:34 / 20635245_株式会社みずほフィナンシャルグループ_総会その他(C)
CR6-(Continued)(Millions of yen, %, number in the thousands, year)
a b c d e f g h i j k l
PD scale
Originalon-balance
sheetgross
exposure
Off-balancesheet
exposurespre CCF
AverageCCF(%)
EADpost CRM
andpost-CCF
AveragePD(%)
Numberof
obligors
AverageLGD(%)
Averagematurity RWA
RWAdensity
(%) EL ProvisionsAs of March 31, 2019
Purchased receivables (Corporate, etc.) - Default Risk Equivalent1 0.00 to <0.15 ¥2,072,913 ¥550,531 78.15 ¥2,503,107 0.06 0.6 38.33 1.5 ¥338,704 13.53 ¥657 ¥/2 0.15 to <0.25 - - - - - - - - - - - /3 0.25 to <0.50 232,216 74,542 76.53 289,269 0.37 0.2 38.01 1.7 127,787 44.17 413 /4 0.50 to <0.75 - - - - - - - - - - - /5 0.75 to <2.50 83,738 22,631 86.29 103,268 0.93 0.0 38.01 1.1 62,883 60.89 366 /6 2.50 to <10.00 18,318 2,873 94.31 21,029 3.08 0.0 38.01 1.3 20,303 96.55 246 /7 10.00 to <100.00 0 17,891 75.08 13,434 14.89 0.0 38.01 1.0 23,247 173.03 760 /8 100.00 (Default) 217 - - 217 100.00 0.0 31.88 4.3 91 42.30 61 /9 Sub-total 2,407,405 668,470 78.23 2,930,326 0.22 1.0 38.28 1.5 573,018 19.55 2,506 1,558
Purchased receivables (Retail) - Default Risk Equivalent1 0.00 to <0.15 - - - - - - - - - - - /2 0.15 to <0.25 - - - - - - - - - - - /3 0.25 to <0.50 - - - - - - - - - - - /4 0.50 to <0.75 - - - - - - - - - - - /5 0.75 to <2.50 - - - - - - - - - - - /6 2.50 to <10.00 - - - - - - - - - - - /7 10.00 to <100.00 - - - - - - - - - - - /8 100.00 (Default) - - - - - - - - - - - /9 Sub-total - - - - - - - - - - - -
Purchased receivables (Dilution Risk Equivalent)1 0.00 to <0.15 1,039,561 80,631 100.00 1,120,192 0.07 0.1 38.01 - 145,295 12.97 313 /2 0.15 to <0.25 - - - - - - - - - - - /3 0.25 to <0.50 72,202 - - 72,202 0.33 0.0 37.89 - 24,992 34.61 91 /4 0.50 to <0.75 - - - - - - - - - - - /5 0.75 to <2.50 94,637 - - 94,637 1.37 0.0 38.01 - 65,989 69.72 493 /6 2.50 to <10.00 6,623 - - 6,623 3.54 0.0 38.01 - 6,473 97.73 89 /7 10.00 to <100.00 - - - - - - - - - - - /8 100.00 (Default) 7,126 - - 7,126 100.00 0.0 46.87 - 3,825 53.67 3,034 /9 Sub-total 1,220,150 80,631 100.00 1,300,781 0.74 0.1 38.05 - 246,577 18.95 4,022 /
Retail – qualifying revolving retail exposures (QRRE)1 0.00 to <0.15 - - - - - - - / - - - /2 0.15 to <0.25 - - - 25 0.19 0.8 77.69 / 2 8.14 0 /3 0.25 to <0.50 - - - 30 0.33 0.7 78.44 / 3 12.65 0 /4 0.50 to <0.75 - - - - - - - / - - - /5 0.75 to <2.50 237,551 865,682 14.27 361,157 2.34 593.9 78.44 / 204,539 56.63 6,653 /6 2.50 to <10.00 170,152 892,916 7.95 241,079 4.14 2,067.1 78.45 / 199,358 82.69 7,829 /7 10.00 to <100.00 34,125 17,631 33.62 40,054 19.89 205.0 78.45 / 71,273 177.93 6,251 /8 100.00 (Default) 482 1,229 11.44 619 100.00 1.9 71.90 / 522 84.32 403 /9 Sub-total 442,312 1,777,459 11.28 642,966 4.20 2,869.6 78.44 / 475,700 73.98 21,139 13,144
Retail – Residential mortgage1 0.00 to <0.15 1,944,487 - - 1,979,064 0.08 248.9 28.72 / 115,422 5.83 475 /2 0.15 to <0.25 1,147,939 - - 1,150,775 0.20 114.5 31.96 / 150,495 13.07 756 /3 0.25 to <0.50 1,988,711 - - 1,988,027 0.34 231.1 32.65 / 388,607 19.54 2,253 /4 0.50 to <0.75 1,880,714 88,387 97.55 1,928,162 0.64 284.0 35.67 / 639,405 33.16 4,434 /5 0.75 to <2.50 1,501,250 629 100.00 1,503,498 1.09 198.7 35.64 / 703,107 46.76 5,783 /6 2.50 to <10.00 70,680 2,380 100.00 73,417 9.45 10.4 37.38 / 121,737 165.81 2,592 /7 10.00 to <100.00 26,306 2,136 100.00 28,456 46.92 4.3 39.43 / 54,817 192.63 5,272 /8 100.00 (Default) 63,491 1,315 100.00 64,871 100.00 5.4 44.36 / 32,383 49.91 26,192 /9 Sub-total 8,623,582 94,848 97.72 8,716,274 1.43 1,097.6 33.00 / 2,205,975 25.30 47,762 29,697
Other retail1 0.00 to <0.15 22 - - 259,936 0.05 37.7 47.73 / 18,716 7.20 73 /2 0.15 to <0.25 6 - - 68,228 0.18 4.8 46.76 / 12,328 18.06 60 /3 0.25 to <0.50 117,622 32 100.00 118,210 0.35 5.2 47.57 / 32,836 27.77 197 /4 0.50 to <0.75 94,978 266 75.25 93,320 0.66 88.6 46.78 / 36,409 39.01 287 /5 0.75 to <2.50 953,276 3,252 80.96 890,437 1.36 27.1 46.54 / 443,075 49.75 5,181 /6 2.50 to <10.00 352,855 1,980 61.13 156,726 6.46 11.1 19.31 / 44,909 28.65 1,593 /7 10.00 to <100.00 88,419 9,336 52.40 45,890 17.80 15.0 32.98 / 31,233 68.06 2,940 /8 100.00 (Default) 67,629 2,590 90.22 53,369 100.00 2.8 47.47 / 25,175 47.17 23,323 /9 Sub-total 1,674,812 17,457 64.76 1,686,119 5.04 192.7 43.95 / 644,684 38.23 33,658 20,927Total (all portfolios) ¥151,622,109 ¥32,964,000 70.89 ¥174,957,145 0.66 4,644.3 38.17 2.00 ¥34,181,215 19.53 ¥451,605 ¥278,296
Notes: 1. Counterparty credit risk exposures, securitization exposures, and regarded-method exposures are excluded from the amount of credit risk exposures above.2. On-balance sheet exposures, pre-CCF and pre- CRM off-balance sheet exposures, and the average CCF are allocated to the PD ranges based on pre- CRM PD
estimates.3. The number of credits is disclosed as the number of data of obligors for QRRE, residential mortgage and other retail excluding credit for business purpose.
286
Quantitative Disclosure on Credit Risk under IRB approach
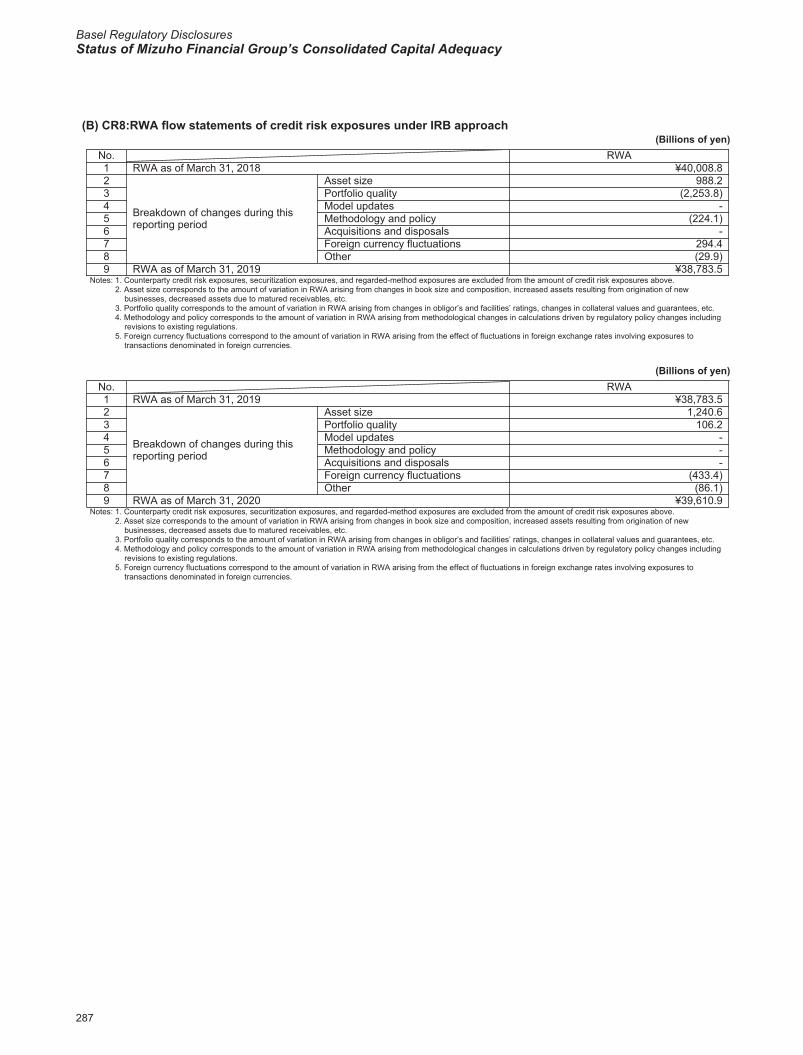
Basel Regulatory DisclosuresStatus of Mizuho Financial Group’s Consolidated Capital Adequacy
2020/09/07 16:50:34 / 20635245_株式会社みずほフィナンシャルグループ_総会その他(C)
(B) CR8:RWA flow statements of credit risk exposures under IRB approach(Billions of yen)
No. RWA1 RWA as of March 31, 2018 ¥40,008.82
Breakdown of changes during this reporting period
Asset size 988.23 Portfolio quality (2,253.8)4 Model updates -5 Methodology and policy (224.1)6 Acquisitions and disposals -7 Foreign currency fluctuations 294.48 Other (29.9)9 RWA as of March 31, 2019 ¥38,783.5
Notes: 1. Counterparty credit risk exposures, securitization exposures, and regarded-method exposures are excluded from the amount of credit risk exposures above.2. Asset size corresponds to the amount of variation in RWA arising from changes in book size and composition, increased assets resulting from origination of new
businesses, decreased assets due to matured receivables, etc.3. Portfolio quality corresponds to the amount of variation in RWA arising from changes in obligor’s and facilities’ ratings, changes in collateral values and guarantees, etc.4. Methodology and policy corresponds to the amount of variation in RWA arising from methodological changes in calculations driven by regulatory policy changes including
revisions to existing regulations.5. Foreign currency fluctuations correspond to the amount of variation in RWA arising from the effect of fluctuations in foreign exchange rates involving exposures to
transactions denominated in foreign currencies.
(Billions of yen)No. RWA1 RWA as of March 31, 2019 ¥38,783.52
Breakdown of changes during this reporting period
Asset size 1,240.63 Portfolio quality 106.24 Model updates -5 Methodology and policy -6 Acquisitions and disposals -7 Foreign currency fluctuations (433.4)8 Other (86.1)9 RWA as of March 31, 2020 ¥39,610.9
Notes: 1. Counterparty credit risk exposures, securitization exposures, and regarded-method exposures are excluded from the amount of credit risk exposures above.2. Asset size corresponds to the amount of variation in RWA arising from changes in book size and composition, increased assets resulting from origination of new
businesses, decreased assets due to matured receivables, etc.3. Portfolio quality corresponds to the amount of variation in RWA arising from changes in obligor’s and facilities’ ratings, changes in collateral values and guarantees, etc.4. Methodology and policy corresponds to the amount of variation in RWA arising from methodological changes in calculations driven by regulatory policy changes including
revisions to existing regulations.5. Foreign currency fluctuations correspond to the amount of variation in RWA arising from the effect of fluctuations in foreign exchange rates involving exposures to
transactions denominated in foreign currencies.
287
Quantitative Disclosure on Credit Risk under IRB approach

2020/09/07 16:50:34 / 20635245_株式会社みずほフィナンシャルグループ_総会その他(C)
(C) CR9: IRB - Backtesting of Probability of Default (PD) per Portfolio(%, the number of data)
As of March 31, 2020a b c d e f g h i
PortfolioPD
Range(%)
External rating equivalent Weightedaverage
PD(%)
ArithmeticaveragePD by
obligors(%)
Number ofobligors Defaulted
obligorsin the year
of which:new
defaultedobligors
in the year
Averagehistorical
annualdefault
rate(%)
S&P Moody’s Fitch R&I JCR
As ofMarch
31, 2018
As ofMarch
31, 2019
Corporate,etc.
0.00 to <0.10 AAA~A- Aaa~A3 AAA~A- AAA~A- AAA~A- 0.04 0.05 2,428 2,448 1 - 0.000.10 to <0.20 BBB+~BBB- Baa1~Baa3 BBB+~BBB- BBB+~BBB- BBB+~BBB- 0.12 0.12 5,415 5,793 4 - 0.050.20 to <1.00 BB+~BB- Ba1~Ba3 BB+~BB- BB+~BB- BB+~BB- 0.48 0.50 21,637 21,594 48 1 0.241.00 to <5.00 B+~B- B1~B3 B+~B- B+~B- B+~B- 2.04 2.53 8,470 8,398 146 2 1.425.00 to <100.00 CCC+~CCC- Caa1~Caa3 CCC+~CCC- CCC+~CCC- CCC~C 12.53 13.08 1,949 1,949 139 3 7.47
Retail – qualifying revolving retail exposures (QRRE)
0.00 to <0.10 - - - - - - -0.10 to <0.20 - - - - - - -0.20 to <1.00 - - - - - - -1.00 to <5.00 2.75 2.94 331,852 310,140 6,405 475 1.895.00 to <100.00 13.19 9.12 146,854 149,075 11,657 743 9.13
Retail – Residentialmortgage
0.00 to <0.10 0.06 0.06 87,230 77,325 33 - 0.020.10 to <0.20 0.14 0.14 78,900 78,259 46 1 0.060.20 to <1.00 0.50 0.51 385,619 382,771 872 2 0.241.00 to <5.00 1.25 1.22 82,718 82,274 338 - 0.475.00 to <100.00 20.37 21.31 9,024 10,757 1,050 - 10.70
Other retail
0.00 to <0.10 - - - - - - -0.10 to <0.20 - - - - - - -0.20 to <1.00 0.79 0.67 400,105 306,402 1,268 24 0.311.00 to <5.00 2.72 3.14 80,665 50,604 855 10 0.535.00 to <100.00 13.04 22.53 34,136 24,918 1,850 2 4.34
Notes: 1. Counterparty credit risk exposures, securitization exposures, and regarded-method exposures are excluded from the amount of credit risk exposures above.2. Exposures to sovereign and bank is included in the category of corporate, etc. because their obligors can be presumably specified. Likewise, exposures to corporate
(except specialized lending), specialized lending, equity and purchased receivables (corporate) is included in the category of corporate, etc. because the data of the respective portfolios is not separately used for PD estimation. Since purchased receivables (retail) account for a small portion of the entire exposure, they are incorporated with any one of QRRE, residential mortgage or other retail depending on the portfolio classification of the purchased receivables.
3. PD Range indicates the ranges of PD estimates for multiple consolidated internal ratings groups.4. The following shows the percentages accounted for by the respective portfolios among the credit RWA calculated by the AIRB: Corporate, etc. : 80%, QRRE: 1%,
Residential mortgage : 6%, Other retail : 2%5. The number of credits is disclosed as the number of data of obligors for QRRE, residential mortgage and other retail excluding credit for business purpose.6. The back testing covers the period from September 30, 2018 to September 30, 2019.
288
Quantitative Disclosure on Credit Risk under IRB approach

Basel Regulatory DisclosuresStatus of Mizuho Financial Group’s Consolidated Capital Adequacy
2020/09/07 16:50:34 / 20635245_株式会社みずほフィナンシャルグループ_総会その他(C)
(%, the number of data)As of March 31, 2019
a b c d e f g h i
PortfolioPD
Range(%)
External rating equivalent Weightedaverage
PD(%)
ArithmeticaveragePD by
obligors(%)
Number ofobligors Defaulted
obligorsin the year
of which:new
defaultedobligors
in the year
Averagehistorical
annualdefault
rate(%)
S&P Moody’s Fitch R&I JCR
As ofMarch
31, 2018
As ofMarch
31, 2019
Corporate,etc.
0.00 to <0.10 AAA~A- Aaa~A3 AAA~A- AAA~A- AAA~A- 0.05 0.05 2,404 2,381 - - -0.10 to <0.20 BBB+~BBB- Baa1~Baa3 BBB+~BBB- BBB+~BBB- BBB+~BBB- 0.13 0.14 5,295 5,295 2 - 0.030.20 to <1.00 BB+~BB- Ba1~Ba3 BB+~BB- BB+~BB- BB+~BB- 0.48 0.51 21,259 21,605 44 1 0.221.00 to <5.00 B+~B- B1~B3 B+~B- B+~B- B+~B- 2.24 2.15 9,037 8,453 115 2 1.295.00 to <100.00 CCC+~CCC- Caa1~Caa3 CCC+~CCC- CCC+~CCC- CCC~C 10.79 13.08 2,144 1,882 140 2 7.77
Retail – qualifying revolving retail exposures (QRRE)
0.00 to <0.10 / / / / / - - - - - - -0.10 to <0.20 / / / / / - - - - - - -0.20 to <1.00 / / / / / - - - - - - -1.00 to <5.00 / / / / / 2.40 2.81 376,296 363,146 7,834 913 1.885.00 to <100.00 / / / / / 10.75 6.73 109,372 115,560 11,704 709 8.95
Retail – Residentialmortgage
0.00 to <0.10 / / / / / 0.06 0.06 96,887 87,230 38 - 0.020.10 to <0.20 / / / / / 0.15 0.15 78,362 78,900 39 1 0.060.20 to <1.00 / / / / / 0.53 0.53 396,443 385,619 871 5 0.241.00 to <5.00 / / / / / 1.30 1.26 75,664 82,718 363 - 0.515.00 to <100.00 / / / / / 21.24 22.41 8,551 9,024 961 - 10.77
Other retail
0.00 to <0.10 / / / / / - - - - - - -0.10 to <0.20 / / / / / - - - - - - -0.20 to <1.00 / / / / / 0.77 0.67 389,084 273,543 1,343 25 0.321.00 to <5.00 / / / / / 2.38 3.20 273,668 207,228 1,508 12 0.485.00 to <100.00 / / / / / 18.47 22.85 47,239 34,136 2,579 5 4.46
Notes: 1. Counterparty credit risk exposures, securitization exposures, and regarded-method exposures are excluded from the amount of credit risk exposures above.2. Exposures to sovereign and bank is included in the category of corporate, etc. because their obligors can be presumably specified. Likewise, exposures to corporate
(except specialized lending), specialized lending, equity and purchased receivables (corporate) is included in the category of corporate, etc. because the data of the respective portfolios is not separately used for PD estimation. Since purchased receivables (retail) account for a small portion of the entire exposure, they are incorporated with any one of QRRE, residential mortgage or other retail depending on the portfolio classification of the purchased receivables.
3. PD Range indicates the ranges of PD estimates for multiple consolidated internal ratings groups.4. The following shows the percentages accounted for by the respective portfolios among the credit RWA calculated by the AIRB: Corporate, etc. : 75%, QRRE: 1%,
Residential mortgage : 7%, Other retail : 2%5. The number of credits is disclosed as the number of data of obligors for QRRE, residential mortgage and other retail excluding credit for business purpose.6. The back testing covers the period from September 30, 2017 to September 30, 2018.
289
Quantitative Disclosure on Credit Risk under IRB approach
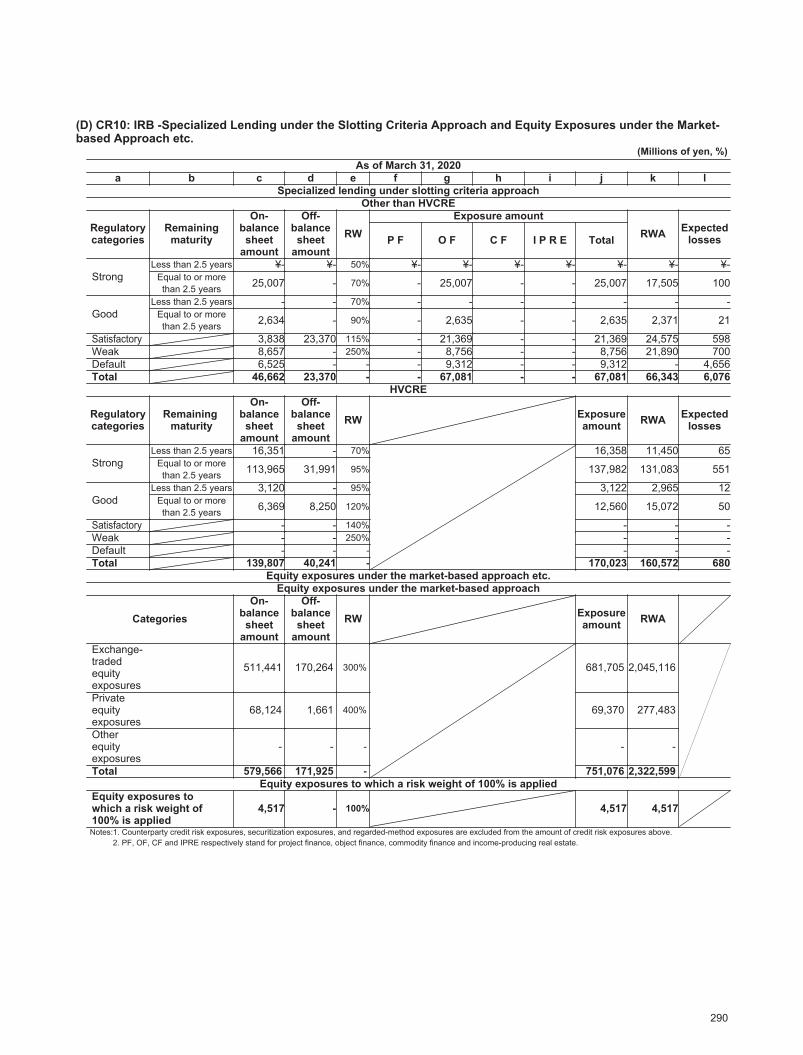
2020/09/07 16:50:34 / 20635245_株式会社みずほフィナンシャルグループ_総会その他(C)
(D) CR10: IRB -Specialized Lending under the Slotting Criteria Approach and Equity Exposures under the Market-based Approach etc.
(Millions of yen, %)As of March 31, 2020
a b c d e f g h i j k lSpecialized lending under slotting criteria approach
Other than HVCRE
Regulatorycategories
Remainingmaturity
On-balancesheet
amount
Off-balancesheet
amountRW
Exposure amountRWA Expected
lossesP F O F C F I P R E Total
StrongLess than 2.5 years ¥- ¥- 50% ¥- ¥- ¥- ¥- ¥- ¥- ¥-
Equal to or morethan 2.5 years 25,007 - 70% - 25,007 - - 25,007 17,505 100
GoodLess than 2.5 years - - 70% - - - - - - -
Equal to or morethan 2.5 years 2,634 - 90% - 2,635 - - 2,635 2,371 21
Satisfactory 3,838 23,370 115% - 21,369 - - 21,369 24,575 598Weak 8,657 - 250% - 8,756 - - 8,756 21,890 700Default 6,525 - - - 9,312 - - 9,312 - 4,656Total 46,662 23,370 - - 67,081 - - 67,081 66,343 6,076
HVCRE
Regulatorycategories
Remaining maturity
On-balancesheet
amount
Off-balancesheet
amountRW Exposure
amount RWA Expectedlosses
StrongLess than 2.5 years 16,351 - 70% 16,358 11,450 65
Equal to or morethan 2.5 years 113,965 31,991 95% 137,982 131,083 551
GoodLess than 2.5 years 3,120 - 95% 3,122 2,965 12
Equal to or morethan 2.5 years 6,369 8,250 120% 12,560 15,072 50
Satisfactory - - 140% - - -Weak - - 250% - - -Default - - - - - -Total 139,807 40,241 - 170,023 160,572 680
Equity exposures under the market-based approach etc.Equity exposures under the market-based approach
CategoriesOn-
balancesheet
amount
Off-balancesheet
amountRW Exposure
amount RWA
Exchange-traded equity exposures
511,441 170,264 300% 681,705 2,045,116
Private equity exposures
68,124 1,661 400% 69,370 277,483
Other equity exposures
- - - - -
Total 579,566 171,925 - 751,076 2,322,599Equity exposures to which a risk weight of 100% is applied
Equity exposures to which a risk weight of 100% is applied
4,517 - 100% 4,517 4,517
Notes:1. Counterparty credit risk exposures, securitization exposures, and regarded-method exposures are excluded from the amount of credit risk exposures above.2. PF, OF, CF and IPRE respectively stand for project finance, object finance, commodity finance and income-producing real estate.
290
Quantitative Disclosure on Credit Risk under IRB approach
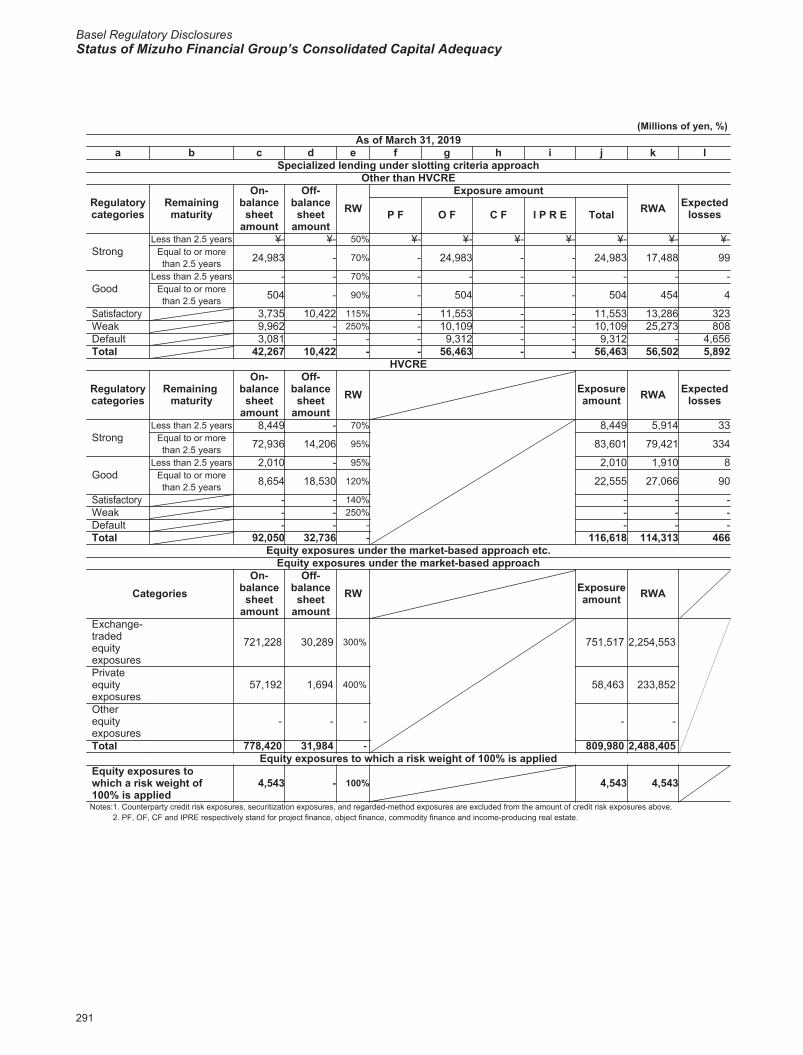
Basel Regulatory DisclosuresStatus of Mizuho Financial Group’s Consolidated Capital Adequacy
2020/09/07 16:50:34 / 20635245_株式会社みずほフィナンシャルグループ_総会その他(C)
(Millions of yen, %)As of March 31, 2019
a b c d e f g h i j k lSpecialized lending under slotting criteria approach
Other than HVCRE
Regulatorycategories
Remainingmaturity
On-balancesheet
amount
Off-balancesheet
amountRW
Exposure amountRWA Expected
lossesP F O F C F I P R E Total
StrongLess than 2.5 years ¥- ¥- 50% ¥- ¥- ¥- ¥- ¥- ¥- ¥-
Equal to or morethan 2.5 years 24,983 - 70% - 24,983 - - 24,983 17,488 99
GoodLess than 2.5 years - - 70% - - - - - - -
Equal to or morethan 2.5 years 504 - 90% - 504 - - 504 454 4
Satisfactory 3,735 10,422 115% - 11,553 - - 11,553 13,286 323Weak 9,962 - 250% - 10,109 - - 10,109 25,273 808Default 3,081 - - - 9,312 - - 9,312 - 4,656Total 42,267 10,422 - - 56,463 - - 56,463 56,502 5,892
HVCRE
Regulatorycategories
Remaining maturity
On-balancesheet
amount
Off-balancesheet
amountRW Exposure
amount RWA Expectedlosses
StrongLess than 2.5 years 8,449 - 70% 8,449 5,914 33
Equal to or morethan 2.5 years 72,936 14,206 95% 83,601 79,421 334
GoodLess than 2.5 years 2,010 - 95% 2,010 1,910 8
Equal to or morethan 2.5 years 8,654 18,530 120% 22,555 27,066 90
Satisfactory - - 140% - - -Weak - - 250% - - -Default - - - - - -Total 92,050 32,736 - 116,618 114,313 466
Equity exposures under the market-based approach etc.Equity exposures under the market-based approach
CategoriesOn-
balancesheet
amount
Off-balancesheet
amountRW Exposure
amount RWA
Exchange-traded equity exposures
721,228 30,289 300% 751,517 2,254,553
Private equity exposures
57,192 1,694 400% 58,463 233,852
Other equity exposures
- - - - -
Total 778,420 31,984 - 809,980 2,488,405Equity exposures to which a risk weight of 100% is applied
Equity exposures to which a risk weight of 100% is applied
4,543 - 100% 4,543 4,543
Notes:1. Counterparty credit risk exposures, securitization exposures, and regarded-method exposures are excluded from the amount of credit risk exposures above.2. PF, OF, CF and IPRE respectively stand for project finance, object finance, commodity finance and income-producing real estate.
291
Quantitative Disclosure on Credit Risk under IRB approach
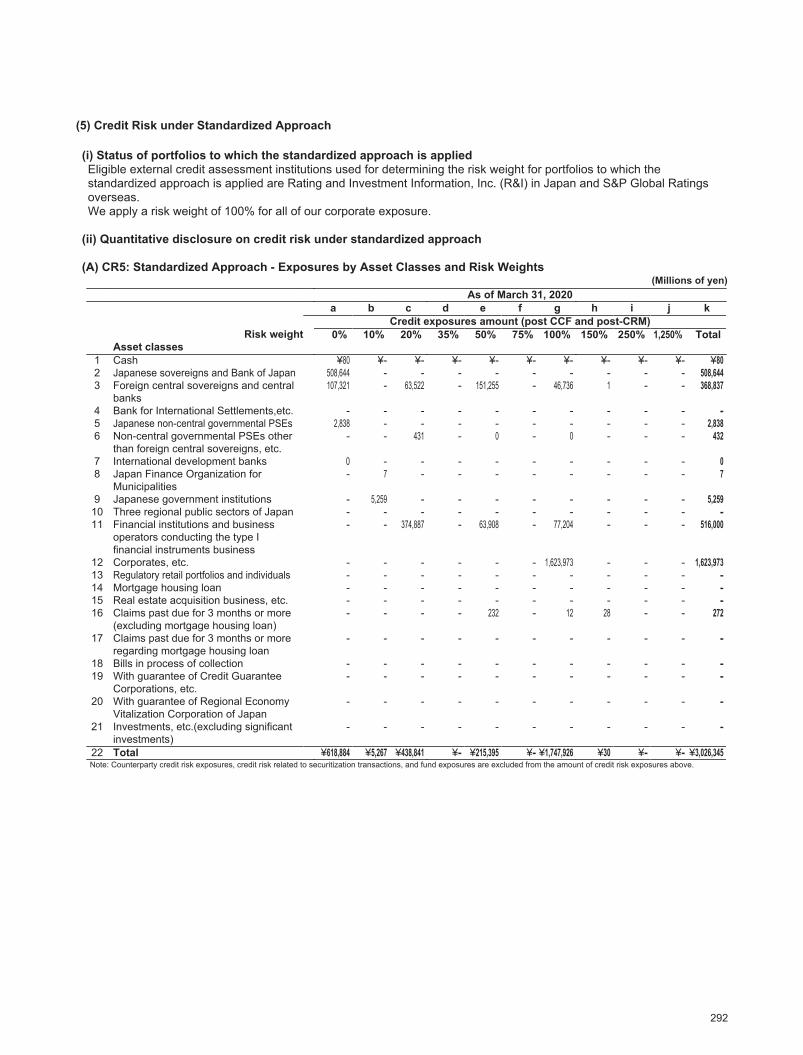
2020/09/07 16:50:34 / 20635245_株式会社みずほフィナンシャルグループ_総会その他(C)
(5) Credit Risk under Standardized Approach
(i) Status of portfolios to which the standardized approach is appliedEligible external credit assessment institutions used for determining the risk weight for portfolios to which the standardized approach is applied are Rating and Investment Information, Inc. (R&I) in Japan and S&P Global Ratings overseas.We apply a risk weight of 100% for all of our corporate exposure.
(ii) Quantitative disclosure on credit risk under standardized approach
(A) CR5: Standardized Approach - Exposures by Asset Classes and Risk Weights(Millions of yen)
As of March 31, 2020a b c d e f g h i j k
Credit exposures amount (post CCF and post-CRM)Risk weight
Asset classes0% 10% 20% 35% 50% 75% 100% 150% 250% 1,250% Total
1 Cash ¥80 ¥- ¥- ¥- ¥- ¥- ¥- ¥- ¥- ¥- ¥802 Japanese sovereigns and Bank of Japan 508,644 - - - - - - - - - 508,6443 Foreign central sovereigns and central
banks107,321 - 63,522 - 151,255 - 46,736 1 - - 368,837
4 Bank for International Settlements,etc. - - - - - - - - - - -5 Japanese non-central governmental PSEs 2,838 - - - - - - - - - 2,8386 Non-central governmental PSEs other
than foreign central sovereigns, etc.- - 431 - 0 - 0 - - - 432
7 International development banks 0 - - - - - - - - - 08 Japan Finance Organization for
Municipalities- 7 - - - - - - - - 7
9 Japanese government institutions - 5,259 - - - - - - - - 5,25910 Three regional public sectors of Japan - - - - - - - - - - -11 Financial institutions and business
operators conducting the type I financial instruments business
- - 374,887 - 63,908 - 77,204 - - - 516,000
12 Corporates, etc. - - - - - - 1,623,973 - - - 1,623,97313 Regulatory retail portfolios and individuals - - - - - - - - - - -14 Mortgage housing loan - - - - - - - - - - -15 Real estate acquisition business, etc. - - - - - - - - - - -16 Claims past due for 3 months or more
(excluding mortgage housing loan)- - - - 232 - 12 28 - - 272
17 Claims past due for 3 months or more regarding mortgage housing loan
- - - - - - - - - - -
18 Bills in process of collection - - - - - - - - - - -19 With guarantee of Credit Guarantee
Corporations, etc.- - - - - - - - - - -
20 With guarantee of Regional Economy Vitalization Corporation of Japan
- - - - - - - - - - -
21 Investments, etc.(excluding significant investments)
- - - - - - - - - - -
22 Total ¥618,884 ¥5,267 ¥438,841 ¥- ¥215,395 ¥- ¥1,747,926 ¥30 ¥- ¥- ¥3,026,345Note: Counterparty credit risk exposures, credit risk related to securitization transactions, and fund exposures are excluded from the amount of credit risk exposures above.
292
Credit Risk under Standardized Approach

Basel Regulatory DisclosuresStatus of Mizuho Financial Group’s Consolidated Capital Adequacy
2020/09/07 16:50:34 / 20635245_株式会社みずほフィナンシャルグループ_総会その他(C)
(Millions of yen)As of March 31, 2019
a b c d e f g h i j kCredit exposures amount (post CCF and post-CRM)
Risk weightAsset classes
0% 10% 20% 35% 50% 75% 100% 150% 250% 1,250% Total
1 Cash ¥116 ¥- ¥- ¥- ¥- ¥- ¥- ¥- ¥- ¥- ¥1162 Japanese sovereigns and Bank of Japan 465,728 - - - - - - - - - 465,7283 Foreign central sovereigns and central
banks46,903 - 39,562 - 123,316 - 55,915 - - - 265,699
4 Bank for International Settlements,etc. - - - - - - - - - - -5 Japanese non-central governmental PSEs 1,043 - - - - - - - - - 1,0436 Non-central governmental PSEs other
than foreign central sovereigns, etc.- - 1,103 - 61 - 28 - - - 1,194
7 International development banks 6 - - - - - - - - - 68 Japan Finance Organization for
Municipalities- 1 - - - - - - - - 1
9 Japanese government institutions - 2,328 - - - - - - - - 2,32810 Three regional public sectors of Japan - - - - - - - - - - -11 Financial institutions and business
operators conducting the type I financial instruments business
- - 238,960 - 45,431 - 62,702 - - - 347,093
12 Corporates, etc. - - - - - - 1,479,276 - - - 1,479,27613 Regulatory retail portfolios and individuals - - - - - - - - - - -14 Mortgage housing loan - - - - - - - - - - -15 Real estate acquisition business, etc. - - - - - - - - - - -16 Claims past due for 3 months or more
(excluding mortgage housing loan)- - - - 87 - 17 21 - - 126
17 Claims past due for 3 months or more regarding mortgage housing loan
- - - - - - - - - - -
18 Bills in process of collection - - - - - - - - - - -19 With guarantee of Credit Guarantee
Corporations, etc.- - - - - - - - - - -
20 With guarantee of Regional Economy Vitalization Corporation of Japan
- - - - - - - - - - -
21 Investments, etc.(excluding significant investments)
- - - - - - - - - - -
22 Total ¥513,798 ¥2,330 ¥279,627 ¥- ¥168,897 ¥- ¥1,597,940 ¥21 ¥- ¥- ¥2,562,615Note: Counterparty credit risk exposures, credit risk related to securitization transactions, and fund exposures are excluded from the amount of credit risk exposures above.
293
Credit Risk under Standardized Approach

2020/09/07 16:50:34 / 20635245_株式会社みずほフィナンシャルグループ_総会その他(C)
(6) Credit Risk Mitigation Techniques
(i) Summary of Risk Profile, Risk Management Policies/ Procedures and StructureWe obtain collateral and guarantees as a means of securing credit. In obtaining the collateral and guarantees, we evaluate the value of the collateral, guarantee performance capability of guarantor and legal enforceability, and we also conduct periodical subsequent re-evaluations. Furthermore, we monitor any concentration of risks in particular corporate groups including indirect credit exposure such as collateral issuers and guarantees. When calculating the credit risk weighted assets for capital adequacy ratio regulations, the effect of credit risk mitigation through financial collateral (mainly deposits and securities), other collateral (mainly real estate) and guarantees by "sovereign, banks or corporations above a certain credit rating" is reflected.
(ii) Quantitative Disclosure on Credit Risk Mitigation TechniquesCounterparty risk exposures, securitization exposures, and regarded-method exposures are excluded from the amount of credit risk exposures below.
(A) CR3: Credit Risk Mitigation Techniques - Overview(Millions of yen)
As of March 31, 2020a b c d e
Exposuresunsecured Exposures secured
Exposures securedby collateral
Exposures securedby financialguarantees
Exposures securedby credit
derivatives1 Loans ¥65,503,018 ¥15,815,487 ¥6,493,163 ¥7,043,960 ¥3,0192 Debt securities 27,701,052 479,786 303,452 81,134 -3 Other on balance debt assets 44,625,456 72,270 2,198 56,783 -4 Total (1+2+3) ¥137,829,527 ¥16,367,544 ¥6,798,814 ¥7,181,879 ¥3,0195 Of which defaulted 279,426 254,343 135,921 43,523 -
Notes: 1. Other on-balance debt assets include deposits, call loans, bills purchased, monetary claims bought, money held in trust, and foreign exchange assets, etc.2. Defaulted exposures include restructured loans, loans past due for three months or more, loans to bankrupt borrowers and so on.
(Millions of yen)As of March 31, 2019
a b c d e
Exposuresunsecured Exposures secured
Exposures securedby collateral
Exposures securedby financialguarantees
Exposures securedby credit
derivatives1 Loans ¥60,910,902 ¥15,856,184 ¥6,365,790 ¥7,169,389 ¥3,1372 Debt securities 22,289,542 381,561 212,479 95,790 -3 Other on balance debt assets 49,191,702 97,131 3,037 78,503 -4 Total (1+2+3) ¥132,392,148 ¥16,334,877 ¥6,581,306 ¥7,343,683 ¥3,1375 Of which defaulted 261,864 220,226 101,305 47,220 -
Notes: 1. Other on-balance debt assets include deposits, call loans, bills purchased, monetary claims bought, money held in trust, and foreign exchange assets, etc.2. Defaulted exposures include restructured loans, loans past due for three months or more, loans to bankrupt borrowers and so on.
294
Credit Risk Mitigation Techniques
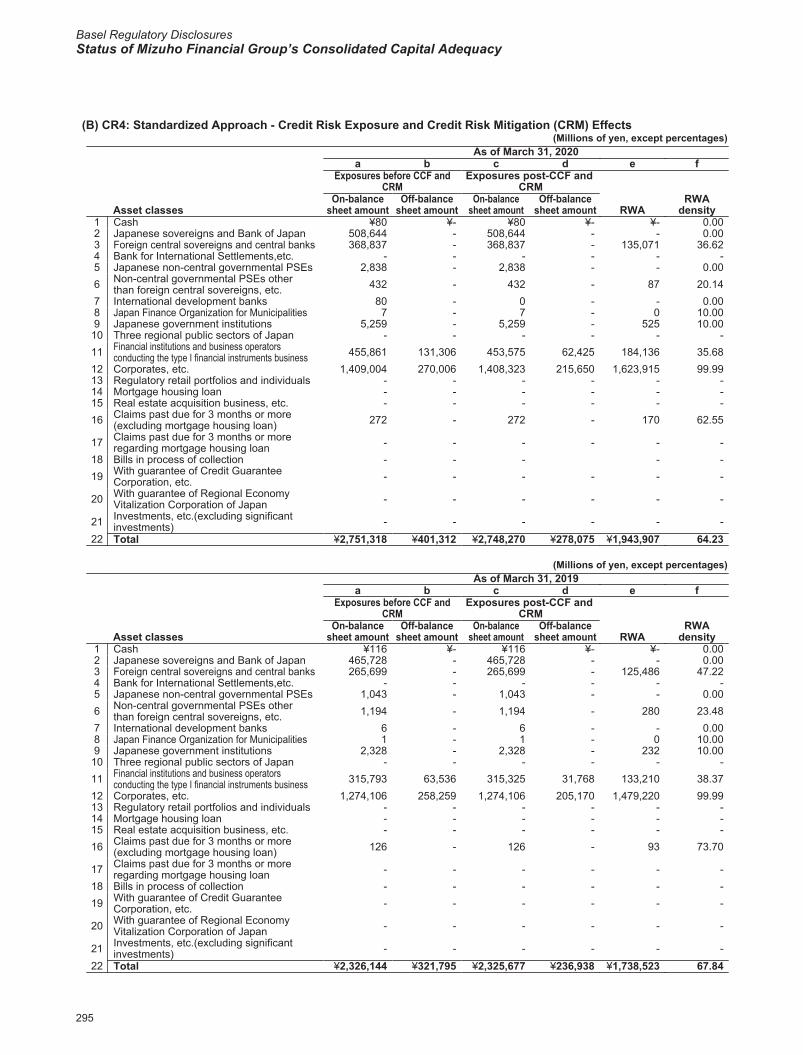
Basel Regulatory DisclosuresStatus of Mizuho Financial Group’s Consolidated Capital Adequacy
2020/09/07 16:50:34 / 20635245_株式会社みずほフィナンシャルグループ_総会その他(C)
(B) CR4: Standardized Approach - Credit Risk Exposure and Credit Risk Mitigation (CRM) Effects(Millions of yen, except percentages)
As of March 31, 2020a b c d e f
Exposures before CCF andCRM
Exposures post-CCF and CRM
Asset classesOn-balance
sheet amountOff-balance
sheet amountOn-balance
sheet amountOff-balance
sheet amount RWARWA
density1 Cash ¥80 ¥- ¥80 ¥- ¥- 0.002 Japanese sovereigns and Bank of Japan 508,644 - 508,644 - - 0.003 Foreign central sovereigns and central banks 368,837 - 368,837 - 135,071 36.624 Bank for International Settlements,etc. - - - - - -5 Japanese non-central governmental PSEs 2,838 - 2,838 - - 0.006 Non-central governmental PSEs other
than foreign central sovereigns, etc. 432 - 432 - 87 20.147 International development banks 80 - 0 - - 0.008 Japan Finance Organization for Municipalities 7 - 7 - 0 10.009 Japanese government institutions 5,259 - 5,259 - 525 10.0010 Three regional public sectors of Japan - - - - - -11 Financial institutions and business operators
conducting the type I financial instruments business 455,861 131,306 453,575 62,425 184,136 35.6812 Corporates, etc. 1,409,004 270,006 1,408,323 215,650 1,623,915 99.9913 Regulatory retail portfolios and individuals - - - - - -14 Mortgage housing loan - - - - - -15 Real estate acquisition business, etc. - - - - - -16 Claims past due for 3 months or more
(excluding mortgage housing loan) 272 - 272 - 170 62.55
17 Claims past due for 3 months or more regarding mortgage housing loan - - - - - -
18 Bills in process of collection - - - - -19 With guarantee of Credit Guarantee
Corporation, etc. - - - - - -
20 With guarantee of Regional Economy Vitalization Corporation of Japan - - - - - -
21 Investments, etc.(excluding significant investments) - - - - - -
22 Total ¥2,751,318 ¥401,312 ¥2,748,270 ¥278,075 ¥1,943,907 64.23
(Millions of yen, except percentages)As of March 31, 2019
a b c d e fExposures before CCF and
CRMExposures post-CCF and
CRM
Asset classesOn-balance
sheet amountOff-balance
sheet amountOn-balance
sheet amountOff-balance
sheet amount RWARWA
density1 Cash ¥116 ¥- ¥116 ¥- ¥- 0.002 Japanese sovereigns and Bank of Japan 465,728 - 465,728 - - 0.003 Foreign central sovereigns and central banks 265,699 - 265,699 - 125,486 47.224 Bank for International Settlements,etc. - - - - - -5 Japanese non-central governmental PSEs 1,043 - 1,043 - - 0.006 Non-central governmental PSEs other
than foreign central sovereigns, etc. 1,194 - 1,194 - 280 23.487 International development banks 6 - 6 - - 0.008 Japan Finance Organization for Municipalities 1 - 1 - 0 10.009 Japanese government institutions 2,328 - 2,328 - 232 10.0010 Three regional public sectors of Japan - - - - - -11 Financial institutions and business operators
conducting the type I financial instruments business 315,793 63,536 315,325 31,768 133,210 38.3712 Corporates, etc. 1,274,106 258,259 1,274,106 205,170 1,479,220 99.9913 Regulatory retail portfolios and individuals - - - - - -14 Mortgage housing loan - - - - - -15 Real estate acquisition business, etc. - - - - - -16 Claims past due for 3 months or more
(excluding mortgage housing loan) 126 - 126 - 93 73.70
17 Claims past due for 3 months or more regarding mortgage housing loan - - - - - -
18 Bills in process of collection - - - - - -19 With guarantee of Credit Guarantee
Corporation, etc. - - - - - -
20 With guarantee of Regional Economy Vitalization Corporation of Japan - - - - - -
21 Investments, etc.(excluding significant investments) - - - - - -
22 Total ¥2,326,144 ¥321,795 ¥2,325,677 ¥236,938 ¥1,738,523 67.84
295
Credit Risk Mitigation Techniques
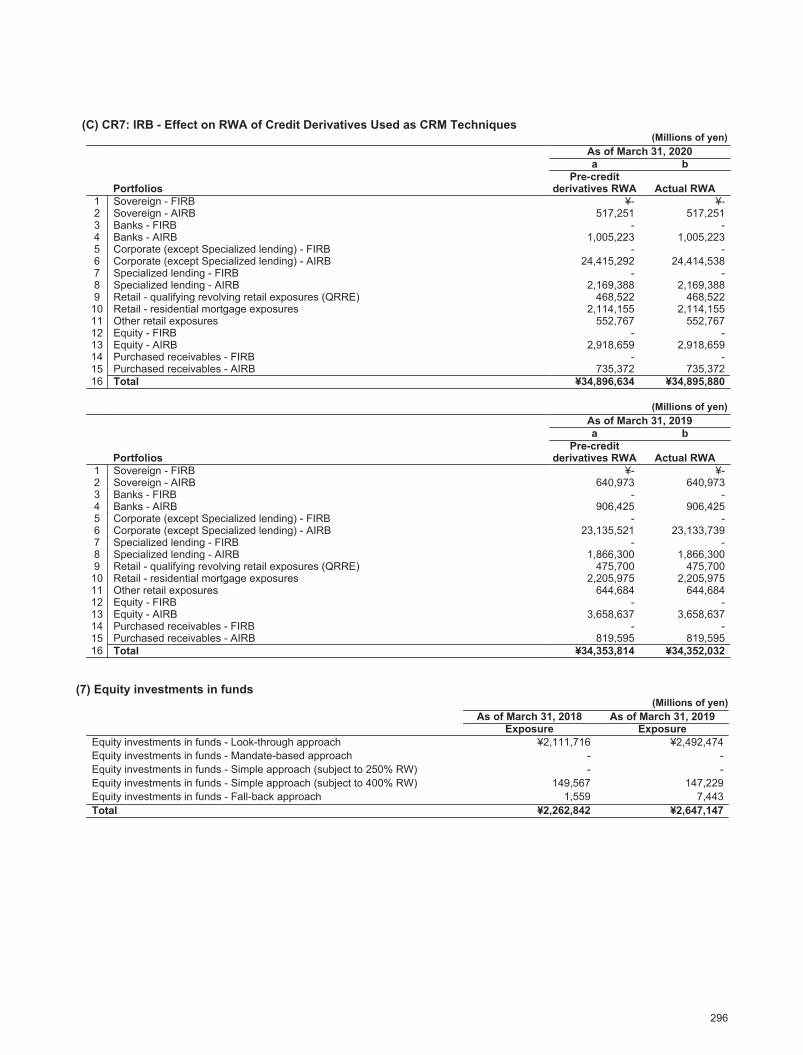
2020/09/07 16:50:34 / 20635245_株式会社みずほフィナンシャルグループ_総会その他(C)
(C) CR7: IRB - Effect on RWA of Credit Derivatives Used as CRM Techniques(Millions of yen)
As of March 31, 2020a b
PortfoliosPre-credit
derivatives RWA Actual RWA1 Sovereign - FIRB ¥- ¥-2 Sovereign - AIRB 517,251 517,2513 Banks - FIRB - -4 Banks - AIRB 1,005,223 1,005,2235 Corporate (except Specialized lending) - FIRB - -6 Corporate (except Specialized lending) - AIRB 24,415,292 24,414,5387 Specialized lending - FIRB - -8 Specialized lending - AIRB 2,169,388 2,169,3889 Retail - qualifying revolving retail exposures (QRRE) 468,522 468,52210 Retail - residential mortgage exposures 2,114,155 2,114,15511 Other retail exposures 552,767 552,76712 Equity - FIRB - -13 Equity - AIRB 2,918,659 2,918,65914 Purchased receivables - FIRB - -15 Purchased receivables - AIRB 735,372 735,37216 Total ¥34,896,634 ¥34,895,880
(Millions of yen)As of March 31, 2019a b
PortfoliosPre-credit
derivatives RWA Actual RWA1 Sovereign - FIRB ¥- ¥-2 Sovereign - AIRB 640,973 640,9733 Banks - FIRB - -4 Banks - AIRB 906,425 906,4255 Corporate (except Specialized lending) - FIRB - -6 Corporate (except Specialized lending) - AIRB 23,135,521 23,133,7397 Specialized lending - FIRB - -8 Specialized lending - AIRB 1,866,300 1,866,3009 Retail - qualifying revolving retail exposures (QRRE) 475,700 475,70010 Retail - residential mortgage exposures 2,205,975 2,205,97511 Other retail exposures 644,684 644,68412 Equity - FIRB - -13 Equity - AIRB 3,658,637 3,658,63714 Purchased receivables - FIRB - -15 Purchased receivables - AIRB 819,595 819,59516 Total ¥34,353,814 ¥34,352,032
(7) Equity investments in funds(Millions of yen)
As of March 31, 2018 As of March 31, 2019Exposure Exposure
Equity investments in funds - Look-through approach ¥2,111,716 ¥2,492,474Equity investments in funds - Mandate-based approach - -Equity investments in funds - Simple approach (subject to 250% RW) - -Equity investments in funds - Simple approach (subject to 400% RW) 149,567 147,229Equity investments in funds - Fall-back approach 1,559 7,443Total ¥2,262,842 ¥2,647,147
296
Credit Risk Mitigation Techniques、Equity investments in funds
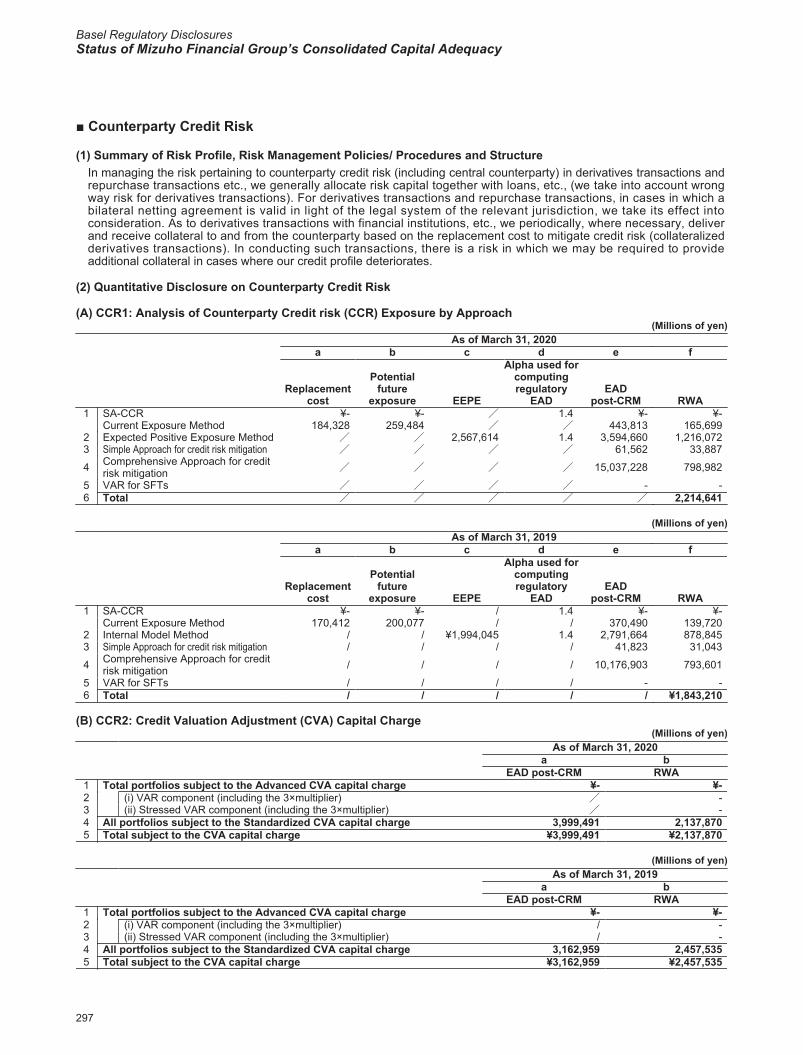
Basel Regulatory DisclosuresStatus of Mizuho Financial Group’s Consolidated Capital Adequacy
2020/09/07 16:50:34 / 20635245_株式会社みずほフィナンシャルグループ_総会その他(C)
■ Counterparty Credit Risk
(1) Summary of Risk Profile, Risk Management Policies/ Procedures and StructureIn managing the risk pertaining to counterparty credit risk (including central counterparty) in derivatives transactions and repurchase transactions etc., we generally allocate risk capital together with loans, etc., (we take into account wrong way risk for derivatives transactions). For derivatives transactions and repurchase transactions, in cases in which a bilateral netting agreement is valid in light of the legal system of the relevant jurisdiction, we take its effect into consideration. As to derivatives transactions with financial institutions, etc., we periodically, where necessary, deliver and receive collateral to and from the counterparty based on the replacement cost to mitigate credit risk (collateralized derivatives transactions). In conducting such transactions, there is a risk in which we may be required to provide additional collateral in cases where our credit profile deteriorates.
(2) Quantitative Disclosure on Counterparty Credit Risk
(A) CCR1: Analysis of Counterparty Credit risk (CCR) Exposure by Approach(Millions of yen)
As of March 31, 2020a b c d e f
Replacementcost
Potentialfuture
exposure EEPE
Alpha used forcomputingregulatory
EADEAD
post-CRM RWA1 SA-CCR ¥- ¥- / 1.4 ¥- ¥-
Current Exposure Method 184,328 259,484 / / 443,813 165,6992 Expected Positive Exposure Method / / 2,567,614 1.4 3,594,660 1,216,0723 Simple Approach for credit risk mitigation / / / / 61,562 33,887
4 Comprehensive Approach for credit risk mitigation / / / / 15,037,228 798,982
5 VAR for SFTs / / / / - -6 Total / / / / / 2,214,641
(Millions of yen)As of March 31, 2019
a b c d e f
Replacementcost
Potentialfuture
exposure EEPE
Alpha used forcomputingregulatory
EADEAD
post-CRM RWA1 SA-CCR ¥- ¥- / 1.4 ¥- ¥-
Current Exposure Method 170,412 200,077 / / 370,490 139,7202 Internal Model Method / / ¥1,994,045 1.4 2,791,664 878,8453 Simple Approach for credit risk mitigation / / / / 41,823 31,043
4 Comprehensive Approach for credit risk mitigation / / / / 10,176,903 793,601
5 VAR for SFTs / / / / - -6 Total / / / / / ¥1,843,210
(B) CCR2: Credit Valuation Adjustment (CVA) Capital Charge(Millions of yen)
As of March 31, 2020a b
EAD post-CRM RWA1 Total portfolios subject to the Advanced CVA capital charge ¥- ¥-2 (i) VAR component (including the 3×multiplier) / -3 (ii) Stressed VAR component (including the 3×multiplier) / -4 All portfolios subject to the Standardized CVA capital charge 3,999,491 2,137,8705 Total subject to the CVA capital charge ¥3,999,491 ¥2,137,870
(Millions of yen)As of March 31, 2019
a bEAD post-CRM RWA
1 Total portfolios subject to the Advanced CVA capital charge ¥- ¥-2 (i) VAR component (including the 3×multiplier) / -3 (ii) Stressed VAR component (including the 3×multiplier) / -4 All portfolios subject to the Standardized CVA capital charge 3,162,959 2,457,5355 Total subject to the CVA capital charge ¥3,162,959 ¥2,457,535
297
Risk Management of Counterparty Credit Risk、Quantitative Disclosure on Counterparty Credit Risk
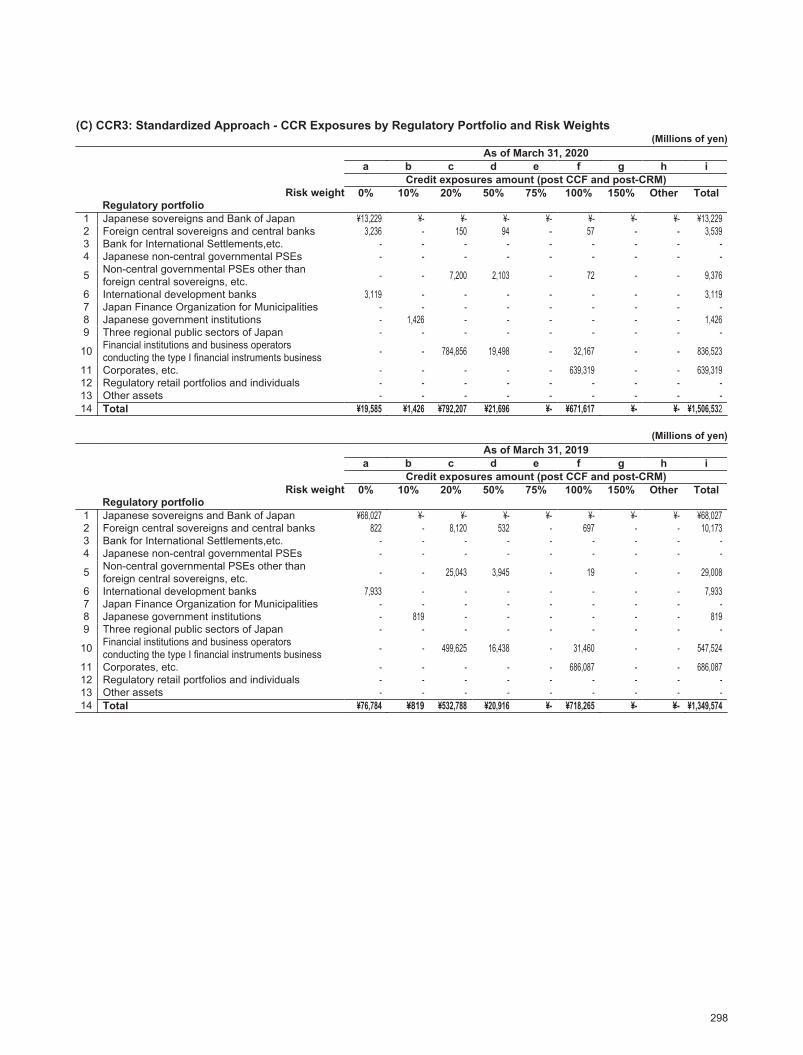
2020/09/07 16:50:34 / 20635245_株式会社みずほフィナンシャルグループ_総会その他(C)
(C) CCR3: Standardized Approach - CCR Exposures by Regulatory Portfolio and Risk Weights(Millions of yen)
As of March 31, 2020a b c d e f g h i
Credit exposures amount (post CCF and post-CRM)Risk weight
Regulatory portfolio0% 10% 20% 50% 75% 100% 150% Other Total
1 Japanese sovereigns and Bank of Japan ¥13,229 ¥- ¥- ¥- ¥- ¥- ¥- ¥- ¥13,2292 Foreign central sovereigns and central banks 3,236 - 150 94 - 57 - - 3,5393 Bank for International Settlements,etc. - - - - - - - - -4 Japanese non-central governmental PSEs - - - - - - - - -
5 Non-central governmental PSEs other than foreign central sovereigns, etc. - - 7,200 2,103 - 72 - - 9,376
6 International development banks 3,119 - - - - - - - 3,1197 Japan Finance Organization for Municipalities - - - - - - - - -8 Japanese government institutions - 1,426 - - - - - - 1,4269 Three regional public sectors of Japan - - - - - - - - -
10 Financial institutions and business operators conducting the type I financial instruments business - - 784,856 19,498 - 32,167 - - 836,523
11 Corporates, etc. - - - - - 639,319 - - 639,31912 Regulatory retail portfolios and individuals - - - - - - - - -13 Other assets - - - - - - - - -14 Total ¥19,585 ¥1,426 ¥792,207 ¥21,696 ¥- ¥671,617 ¥- ¥- ¥1,506,532
(Millions of yen)As of March 31, 2019
a b c d e f g h iCredit exposures amount (post CCF and post-CRM)
Risk weightRegulatory portfolio
0% 10% 20% 50% 75% 100% 150% Other Total
1 Japanese sovereigns and Bank of Japan ¥68,027 ¥- ¥- ¥- ¥- ¥- ¥- ¥- ¥68,0272 Foreign central sovereigns and central banks 822 - 8,120 532 - 697 - - 10,1733 Bank for International Settlements,etc. - - - - - - - - -4 Japanese non-central governmental PSEs - - - - - - - - -
5 Non-central governmental PSEs other than foreign central sovereigns, etc. - - 25,043 3,945 - 19 - - 29,008
6 International development banks 7,933 - - - - - - - 7,9337 Japan Finance Organization for Municipalities - - - - - - - - -8 Japanese government institutions - 819 - - - - - - 8199 Three regional public sectors of Japan - - - - - - - - -
10 Financial institutions and business operators conducting the type I financial instruments business - - 499,625 16,438 - 31,460 - - 547,524
11 Corporates, etc. - - - - - 686,087 - - 686,08712 Regulatory retail portfolios and individuals - - - - - - - - -13 Other assets - - - - - - - - -14 Total ¥76,784 ¥819 ¥532,788 ¥20,916 ¥- ¥718,265 ¥- ¥- ¥1,349,574
298
Quantitative Disclosure on Counterparty Credit Risk
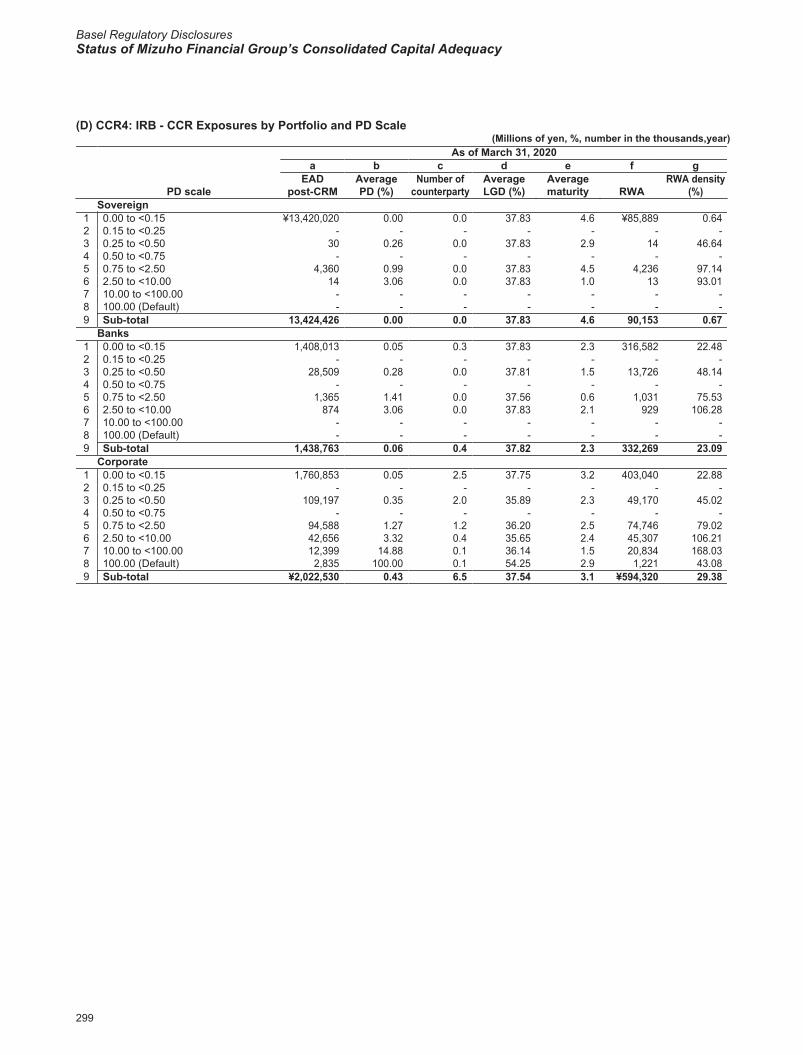
Basel Regulatory DisclosuresStatus of Mizuho Financial Group’s Consolidated Capital Adequacy
2020/09/07 16:50:34 / 20635245_株式会社みずほフィナンシャルグループ_総会その他(C)
(D) CCR4: IRB - CCR Exposures by Portfolio and PD Scale(Millions of yen, %, number in the thousands,year)
As of March 31, 2020a b c d e f g
PD scaleEAD
post-CRMAveragePD (%)
Number ofcounterparty
AverageLGD (%)
Averagematurity RWA
RWA density(%)
Sovereign1 0.00 to <0.15 ¥13,420,020 0.00 0.0 37.83 4.6 ¥85,889 0.642 0.15 to <0.25 - - - - - - -3 0.25 to <0.50 30 0.26 0.0 37.83 2.9 14 46.644 0.50 to <0.75 - - - - - - -5 0.75 to <2.50 4,360 0.99 0.0 37.83 4.5 4,236 97.146 2.50 to <10.00 14 3.06 0.0 37.83 1.0 13 93.017 10.00 to <100.00 - - - - - - -8 100.00 (Default) - - - - - - -9 Sub-total 13,424,426 0.00 0.0 37.83 4.6 90,153 0.67
Banks1 0.00 to <0.15 1,408,013 0.05 0.3 37.83 2.3 316,582 22.482 0.15 to <0.25 - - - - - - -3 0.25 to <0.50 28,509 0.28 0.0 37.81 1.5 13,726 48.144 0.50 to <0.75 - - - - - - -5 0.75 to <2.50 1,365 1.41 0.0 37.56 0.6 1,031 75.536 2.50 to <10.00 874 3.06 0.0 37.83 2.1 929 106.287 10.00 to <100.00 - - - - - - -8 100.00 (Default) - - - - - - -9 Sub-total 1,438,763 0.06 0.4 37.82 2.3 332,269 23.09
Corporate1 0.00 to <0.15 1,760,853 0.05 2.5 37.75 3.2 403,040 22.882 0.15 to <0.25 - - - - - - -3 0.25 to <0.50 109,197 0.35 2.0 35.89 2.3 49,170 45.024 0.50 to <0.75 - - - - - - -5 0.75 to <2.50 94,588 1.27 1.2 36.20 2.5 74,746 79.026 2.50 to <10.00 42,656 3.32 0.4 35.65 2.4 45,307 106.217 10.00 to <100.00 12,399 14.88 0.1 36.14 1.5 20,834 168.038 100.00 (Default) 2,835 100.00 0.1 54.25 2.9 1,221 43.089 Sub-total ¥2,022,530 0.43 6.5 37.54 3.1 ¥594,320 29.38
299
Quantitative Disclosure on Counterparty Credit Risk
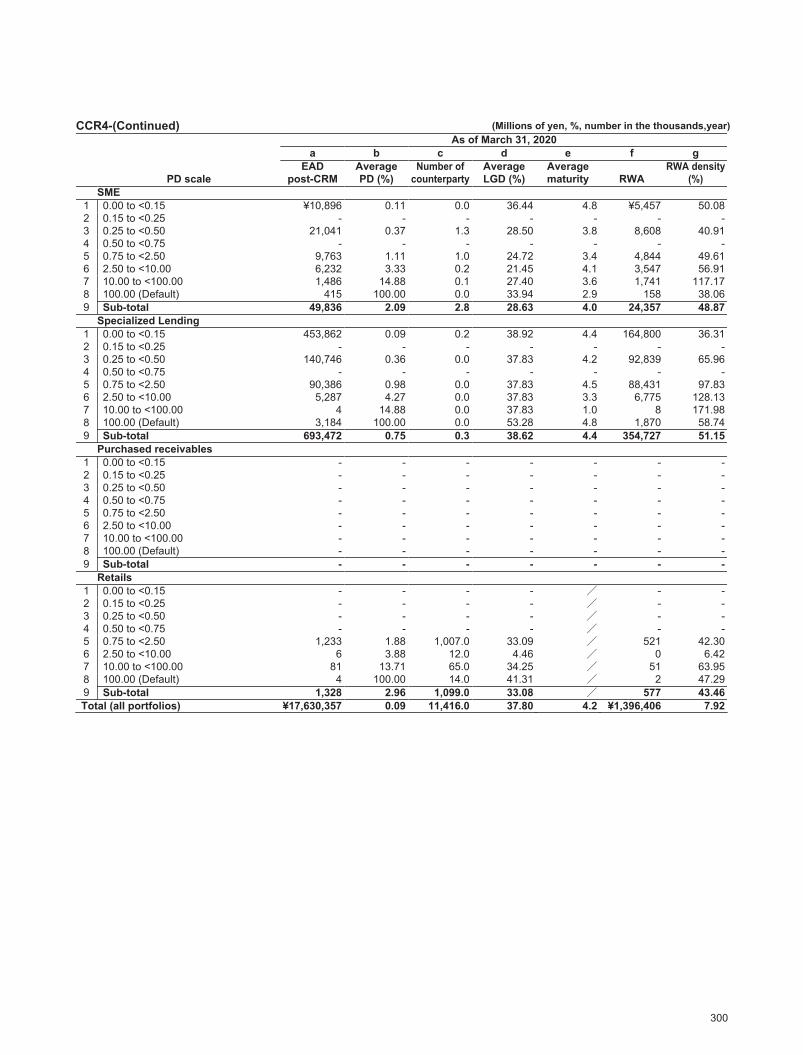
2020/09/07 16:50:34 / 20635245_株式会社みずほフィナンシャルグループ_総会その他(C)
CCR4-(Continued) (Millions of yen, %, number in the thousands,year)As of March 31, 2020
a b c d e f g
PD scaleEAD
post-CRMAveragePD (%)
Number ofcounterparty
AverageLGD (%)
Averagematurity RWA
RWA density(%)
SME1 0.00 to <0.15 ¥10,896 0.11 0.0 36.44 4.8 ¥5,457 50.082 0.15 to <0.25 - - - - - - -3 0.25 to <0.50 21,041 0.37 1.3 28.50 3.8 8,608 40.914 0.50 to <0.75 - - - - - - -5 0.75 to <2.50 9,763 1.11 1.0 24.72 3.4 4,844 49.616 2.50 to <10.00 6,232 3.33 0.2 21.45 4.1 3,547 56.917 10.00 to <100.00 1,486 14.88 0.1 27.40 3.6 1,741 117.178 100.00 (Default) 415 100.00 0.0 33.94 2.9 158 38.069 Sub-total 49,836 2.09 2.8 28.63 4.0 24,357 48.87
Specialized Lending1 0.00 to <0.15 453,862 0.09 0.2 38.92 4.4 164,800 36.312 0.15 to <0.25 - - - - - - -3 0.25 to <0.50 140,746 0.36 0.0 37.83 4.2 92,839 65.964 0.50 to <0.75 - - - - - - -5 0.75 to <2.50 90,386 0.98 0.0 37.83 4.5 88,431 97.836 2.50 to <10.00 5,287 4.27 0.0 37.83 3.3 6,775 128.137 10.00 to <100.00 4 14.88 0.0 37.83 1.0 8 171.988 100.00 (Default) 3,184 100.00 0.0 53.28 4.8 1,870 58.749 Sub-total 693,472 0.75 0.3 38.62 4.4 354,727 51.15
Purchased receivables1 0.00 to <0.15 - - - - - - -2 0.15 to <0.25 - - - - - - -3 0.25 to <0.50 - - - - - - -4 0.50 to <0.75 - - - - - - -5 0.75 to <2.50 - - - - - - -6 2.50 to <10.00 - - - - - - -7 10.00 to <100.00 - - - - - - -8 100.00 (Default) - - - - - - -9 Sub-total - - - - - - -
Retails1 0.00 to <0.15 - - - - / - -2 0.15 to <0.25 - - - - / - -3 0.25 to <0.50 - - - - / - -4 0.50 to <0.75 - - - - / - -5 0.75 to <2.50 1,233 1.88 1,007.0 33.09 / 521 42.306 2.50 to <10.00 6 3.88 12.0 4.46 / 0 6.427 10.00 to <100.00 81 13.71 65.0 34.25 / 51 63.958 100.00 (Default) 4 100.00 14.0 41.31 / 2 47.299 Sub-total 1,328 2.96 1,099.0 33.08 / 577 43.46Total (all portfolios) ¥17,630,357 0.09 11,416.0 37.80 4.2 ¥1,396,406 7.92
300
Quantitative Disclosure on Counterparty Credit Risk
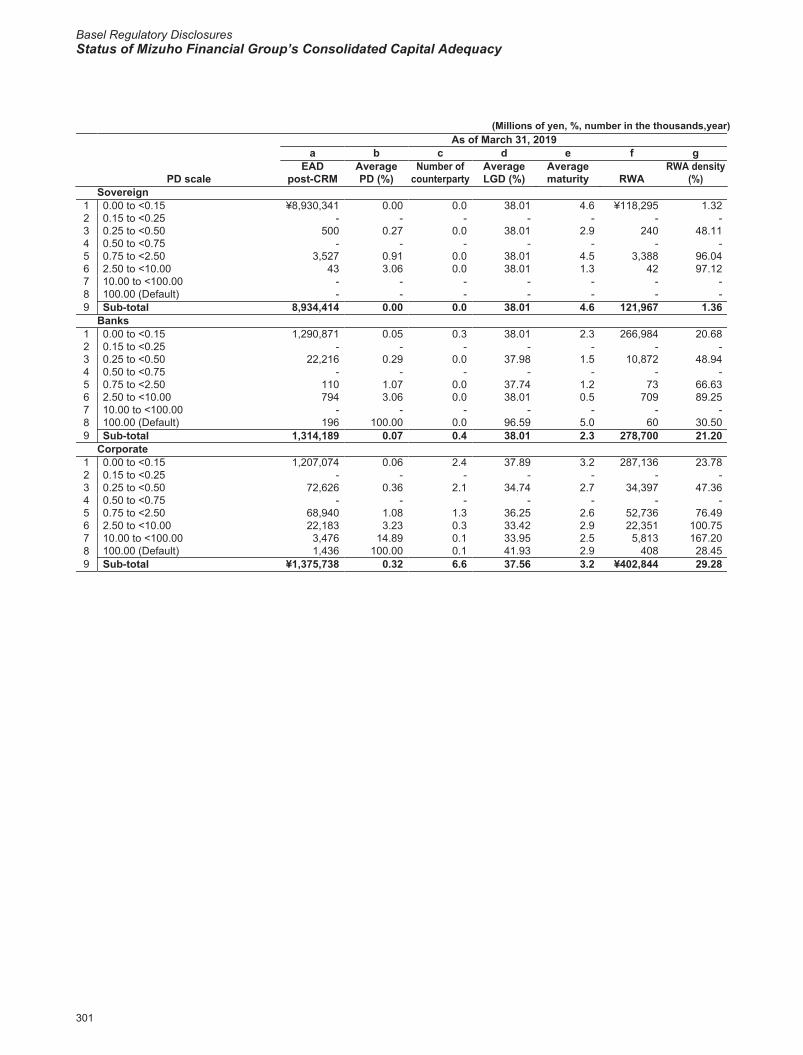
Basel Regulatory DisclosuresStatus of Mizuho Financial Group’s Consolidated Capital Adequacy
2020/09/07 16:50:34 / 20635245_株式会社みずほフィナンシャルグループ_総会その他(C)
(Millions of yen, %, number in the thousands,year)As of March 31, 2019
a b c d e f g
PD scaleEAD
post-CRMAveragePD (%)
Number ofcounterparty
AverageLGD (%)
Averagematurity RWA
RWA density(%)
Sovereign1 0.00 to <0.15 ¥8,930,341 0.00 0.0 38.01 4.6 ¥118,295 1.322 0.15 to <0.25 - - - - - - -3 0.25 to <0.50 500 0.27 0.0 38.01 2.9 240 48.114 0.50 to <0.75 - - - - - - -5 0.75 to <2.50 3,527 0.91 0.0 38.01 4.5 3,388 96.046 2.50 to <10.00 43 3.06 0.0 38.01 1.3 42 97.127 10.00 to <100.00 - - - - - - -8 100.00 (Default) - - - - - - -9 Sub-total 8,934,414 0.00 0.0 38.01 4.6 121,967 1.36
Banks1 0.00 to <0.15 1,290,871 0.05 0.3 38.01 2.3 266,984 20.682 0.15 to <0.25 - - - - - - -3 0.25 to <0.50 22,216 0.29 0.0 37.98 1.5 10,872 48.944 0.50 to <0.75 - - - - - - -5 0.75 to <2.50 110 1.07 0.0 37.74 1.2 73 66.636 2.50 to <10.00 794 3.06 0.0 38.01 0.5 709 89.257 10.00 to <100.00 - - - - - - -8 100.00 (Default) 196 100.00 0.0 96.59 5.0 60 30.509 Sub-total 1,314,189 0.07 0.4 38.01 2.3 278,700 21.20
Corporate1 0.00 to <0.15 1,207,074 0.06 2.4 37.89 3.2 287,136 23.782 0.15 to <0.25 - - - - - - -3 0.25 to <0.50 72,626 0.36 2.1 34.74 2.7 34,397 47.364 0.50 to <0.75 - - - - - - -5 0.75 to <2.50 68,940 1.08 1.3 36.25 2.6 52,736 76.496 2.50 to <10.00 22,183 3.23 0.3 33.42 2.9 22,351 100.757 10.00 to <100.00 3,476 14.89 0.1 33.95 2.5 5,813 167.208 100.00 (Default) 1,436 100.00 0.1 41.93 2.9 408 28.459 Sub-total ¥1,375,738 0.32 6.6 37.56 3.2 ¥402,844 29.28
301
Quantitative Disclosure on Counterparty Credit Risk
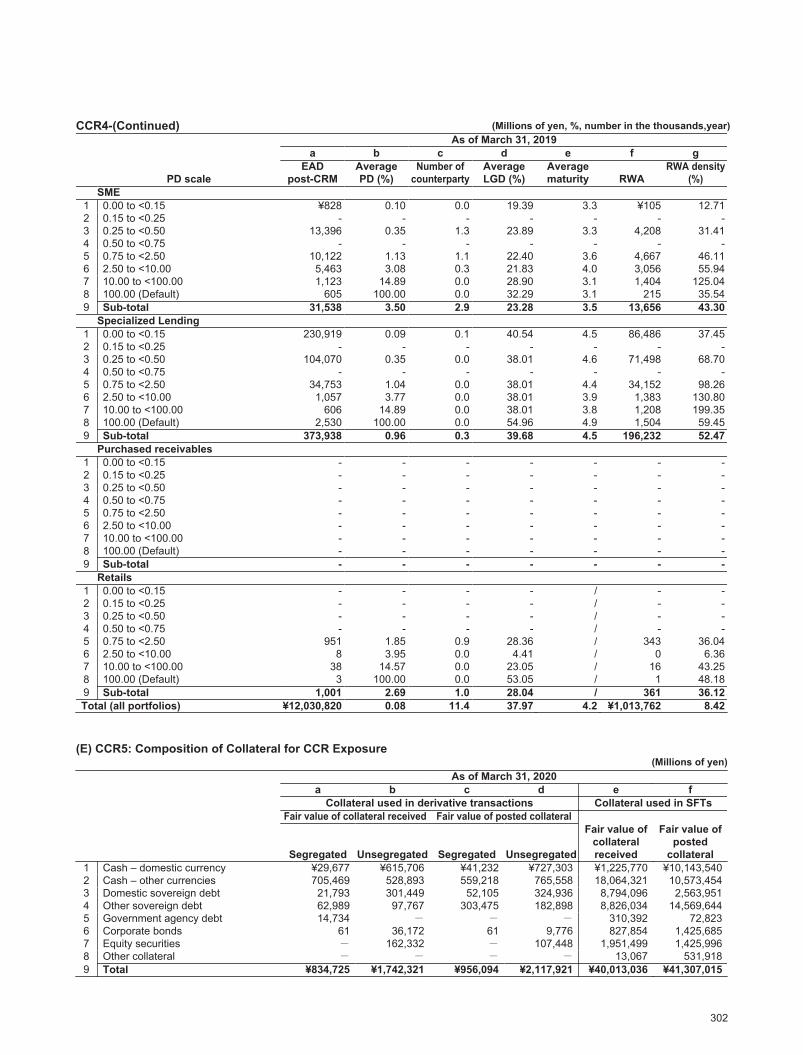
2020/09/07 16:50:34 / 20635245_株式会社みずほフィナンシャルグループ_総会その他(C)
CCR4-(Continued) (Millions of yen, %, number in the thousands,year)As of March 31, 2019
a b c d e f g
PD scaleEAD
post-CRMAveragePD (%)
Number ofcounterparty
AverageLGD (%)
Averagematurity RWA
RWA density(%)
SME1 0.00 to <0.15 ¥828 0.10 0.0 19.39 3.3 ¥105 12.712 0.15 to <0.25 - - - - - - -3 0.25 to <0.50 13,396 0.35 1.3 23.89 3.3 4,208 31.414 0.50 to <0.75 - - - - - - -5 0.75 to <2.50 10,122 1.13 1.1 22.40 3.6 4,667 46.116 2.50 to <10.00 5,463 3.08 0.3 21.83 4.0 3,056 55.947 10.00 to <100.00 1,123 14.89 0.0 28.90 3.1 1,404 125.048 100.00 (Default) 605 100.00 0.0 32.29 3.1 215 35.549 Sub-total 31,538 3.50 2.9 23.28 3.5 13,656 43.30
Specialized Lending1 0.00 to <0.15 230,919 0.09 0.1 40.54 4.5 86,486 37.452 0.15 to <0.25 - - - - - - -3 0.25 to <0.50 104,070 0.35 0.0 38.01 4.6 71,498 68.704 0.50 to <0.75 - - - - - - -5 0.75 to <2.50 34,753 1.04 0.0 38.01 4.4 34,152 98.266 2.50 to <10.00 1,057 3.77 0.0 38.01 3.9 1,383 130.807 10.00 to <100.00 606 14.89 0.0 38.01 3.8 1,208 199.358 100.00 (Default) 2,530 100.00 0.0 54.96 4.9 1,504 59.459 Sub-total 373,938 0.96 0.3 39.68 4.5 196,232 52.47
Purchased receivables1 0.00 to <0.15 - - - - - - -2 0.15 to <0.25 - - - - - - -3 0.25 to <0.50 - - - - - - -4 0.50 to <0.75 - - - - - - -5 0.75 to <2.50 - - - - - - -6 2.50 to <10.00 - - - - - - -7 10.00 to <100.00 - - - - - - -8 100.00 (Default) - - - - - - -9 Sub-total - - - - - - -
Retails1 0.00 to <0.15 - - - - / - -2 0.15 to <0.25 - - - - / - -3 0.25 to <0.50 - - - - / - -4 0.50 to <0.75 - - - - / - -5 0.75 to <2.50 951 1.85 0.9 28.36 / 343 36.046 2.50 to <10.00 8 3.95 0.0 4.41 / 0 6.367 10.00 to <100.00 38 14.57 0.0 23.05 / 16 43.258 100.00 (Default) 3 100.00 0.0 53.05 / 1 48.189 Sub-total 1,001 2.69 1.0 28.04 / 361 36.12Total (all portfolios) ¥12,030,820 0.08 11.4 37.97 4.2 ¥1,013,762 8.42
(E) CCR5: Composition of Collateral for CCR Exposure(Millions of yen)
As of March 31, 2020a b c d e f
Collateral used in derivative transactions Collateral used in SFTsFair value of collateral received Fair value of posted collateral
Segregated Unsegregated Segregated Unsegregated
Fair value ofcollateralreceived
Fair value ofposted
collateral1 Cash – domestic currency ¥29,677 ¥615,706 ¥41,232 ¥727,303 ¥1,225,770 ¥10,143,5402 Cash – other currencies 705,469 528,893 559,218 765,558 18,064,321 10,573,4543 Domestic sovereign debt 21,793 301,449 52,105 324,936 8,794,096 2,563,9514 Other sovereign debt 62,989 97,767 303,475 182,898 8,826,034 14,569,6445 Government agency debt 14,734 - - - 310,392 72,8236 Corporate bonds 61 36,172 61 9,776 827,854 1,425,6857 Equity securities - 162,332 - 107,448 1,951,499 1,425,9968 Other collateral - - - - 13,067 531,9189 Total ¥834,725 ¥1,742,321 ¥956,094 ¥2,117,921 ¥40,013,036 ¥41,307,015
302
Quantitative Disclosure on Counterparty Credit Risk

Basel Regulatory DisclosuresStatus of Mizuho Financial Group’s Consolidated Capital Adequacy
2020/09/07 16:50:34 / 20635245_株式会社みずほフィナンシャルグループ_総会その他(C)
(Millions of yen)As of March 31, 2019
a b c d e fCollateral used in derivative transactions Collateral used in SFTs
Fair value of collateral received Fair value of posted collateral
Segregated Unsegregated Segregated Unsegregated
Fair value ofcollateralreceived
Fair value ofposted
collateral1 Cash – domestic currency ¥11,079 ¥570,998 ¥4,056 ¥883,792 ¥1,704,049 ¥3,730,4042 Cash – other currencies 336,654 336,381 260,207 374,001 14,465,337 11,540,2223 Domestic sovereign debt 19,336 324,357 106,721 377,249 3,183,024 2,674,0234 Other sovereign debt 105,414 91,743 306,088 118,358 9,482,818 11,223,5575 Government agency debt 226 - - - 206,703 61,1306 Corporate bonds 20 24,331 20 5,077 1,102,381 1,777,9257 Equity securities - 93,877 - 86,874 1,645,752 1,311,0298 Other collateral - - - - 13,411 433,3529 Total ¥472,731 ¥1,441,690 ¥677,094 ¥1,845,353 ¥31,803,478 ¥32,751,646
(F) CCR6: Credit Derivatives Exposures(Millions of yen)
As of March 31, 2020a b
Protection bought Protection soldNotionals
1 Single-name credit default swaps ¥1,561,051 ¥1,273,3292 Index credit default swaps 1,084,242 750,6763 Total return swaps 243,973 33,3144 Credit options - -5 Other credit derivatives 1,100 -6 Total notionals ¥2,890,367 ¥2,057,320
Fair values7 Positive fair value (asset) 26,832 12,9338 Negative fair value (liability) (16,830) (16,264)
(Millions of yen)As of March 31, 2019
a bProtection bought Protection sold
Notionals1 Single-name credit default swaps ¥1,108,432 ¥1,109,0822 Index credit default swaps 350,692 330,9133 Total return swaps 14,431 23,4714 Credit options - -5 Other credit derivatives 1,100 -6 Total notionals ¥1,474,656 ¥1,463,467
Fair values7 Positive fair value (asset) 2,653 16,8148 Negative fair value (liability) (14,162) (1,969)
303
Quantitative Disclosure on Counterparty Credit Risk

2020/09/07 16:50:34 / 20635245_株式会社みずほフィナンシャルグループ_総会その他(C)
(G) CCR7: RWA flow statements of CCR exposures under EPE method(Billions of yen)
No. RWA1 RWA as of March 31, 2018 ¥887.82
Breakdown of changes during this reporting period
Asset size 34.73 Credit quality of counterparties (56.1)4 Model updates (EPE only) -5 Methodology and policy (EPE only) -6 Acquisitions and disposals -7 Foreign currency fluctuations 12.18 Other 0.29 RWA as of March 31, 2019 ¥878.8
(Billions of yen)No. RWA1 RWA as of March 31, 2019 ¥878.82
Breakdown of changes during this reporting period
Asset size 376.83 Credit quality of counterparties (7.5)4 Model updates (EPE only) -5 Methodology and policy (EPE only) -6 Acquisitions and disposals -7 Foreign currency fluctuations (30.3)8 Other (1.7)9 RWA as of March 31, 2020 ¥1,216.0
(H) CCR8: Exposures to Central Counterparties(Millions of yen)
As of March 31, 2020a b
EAD (post-CRM) RWA1 Exposures to QCCPs (total) / ¥163,062
2 Exposures for trades at QCCPs (excluding initial margin and default fund contributions); of which ¥996,454 ¥15,025
3 (i) OTC derivatives 328,996 2,2624 (ii) Exchange-traded derivatives 294,314 7,8185 (iii) Securities financing transactions 373,143 4,9446 (iv) Netting sets where cross-product netting has been approved - -7 Segregated initial margin 541,202 /8 Non-segregated initial margin 658,624 13,5819 Pre-funded default fund contributions 289,075 134,45410 Unfunded default fund contributions - -11 Exposures to non-QCCPs (total) / -
12 Exposures for trades at non-QCCPs (excluding initial margin and default fund contributions); of which - -
13 (i) OTC derivatives - -14 (ii) Exchange-traded derivatives - -15 (iii) Securities financing transactions - -16 (iv) Netting sets where cross-product netting has been approved - -17 Segregated initial margin - /18 Non-segregated initial margin - -19 Pre-funded default fund contributions - -20 Unfunded default fund contributions - -
304
Quantitative Disclosure on Counterparty Credit Risk

Basel Regulatory DisclosuresStatus of Mizuho Financial Group’s Consolidated Capital Adequacy
2020/09/07 16:50:34 / 20635245_株式会社みずほフィナンシャルグループ_総会その他(C)
(Millions of yen)As of March 31, 2019
a bEAD (post-CRM) RWA
1 Exposures to QCCPs (total) / ¥190,997
2 Exposures for trades at QCCPs (excluding initial margin and default fund contributions); of which ¥654,350 ¥4,670
3 (i) OTC derivatives 145,239 5014 (ii) Exchange-traded derivatives 83,138 1,9315 (iii) Securities financing transactions 425,973 2,2376 (iv) Netting sets where cross-product netting has been approved - -7 Segregated initial margin 167,185 /8 Non-segregated initial margin 478,110 9,3179 Pre-funded default fund contributions 219,871 177,00910 Unfunded default fund contributions - -11 Exposures to non-QCCPs (total) / -
12 Exposures for trades at non-QCCPs (excluding initial margin and default fund contributions); of which - -
13 (i) OTC derivatives - -14 (ii) Exchange-traded derivatives - -15 (iii) Securities financing transactions - -16 (iv) Netting sets where cross-product netting has been approved - -17 Segregated initial margin - /18 Non-segregated initial margin - -19 Pre-funded default fund contributions - -20 Unfunded default fund contributions - -
305
Quantitative Disclosure on Counterparty Credit Risk

2020/09/07 16:50:34 / 20635245_株式会社みずほフィナンシャルグループ_総会その他(C)
■ Securitization Exposures
We classify transactions as securit ization exposures based on two characterist ics, “non-recourse” and “senior/subordinated structure,” pursuant to the definitions set forth in the FSA Notice No.20, etc.; provided that the transactions do not include those which fall within specialized lending exposure.
(1) Summary of Risk Management Regarding Securitization ExposuresOur role in securitization transactionsWe are associated with securitization transactions from various purposes and positions through our banking book and trading book.
(a) Securitization of our assets (“Securitization as originator”)For the purposes of mitigating credit risk and credit concentration risk, controlling economic capital and responding to the needs of our investors, etc., we engage in securitization transactions, the underlying assets of which include mortgage loans and loans to our corporate customers. When conducting a securitization as an originator, we consider such transactions from various aspects, including the effects of reduction of economic capital and improvement of return on risk as well as the practical effects of risk transfers, and make a comprehensive judgment on the structure and appropriateness of such transactions.
(b) Securitization program (ABCP/ABL) sponsorAs a means of supporting our customers in the securitization of their account receivables and notes receivables, etc., we retain securitization exposure by providing asset-backed loans (ABLs, which are on-balance-sheet transactions), and providing asset-backed commercial paper (ABCP) backup lines (off-balance-sheet transactions), as sponsor to special purpose companies (in the form of Cayman Islands Corporations, etc.). In such cases, in addition to gaining firm understanding of the actual risk profile through due diligence from the viewpoint of investors, we assign internal ratings and make evaluations by assessing such transactions and carefully managing the exposure together with other direct loan assets.
(c) Investment in alternative credit risk assets (“Securitization Transactions as an Investor”)We hold securitization products, such as ABS, CMBS, RMBS, and CDO, and resecuritization products, the underlying assets of which are mainly RMBS and CDO, etc., for the purpose of investing in alternative credit risk assets that are different from conventional credit risk assets in order to diversify our investment portfolio. The Risk Management Committee, etc. set limits on the amount of investment for Securitization Transactions as an Investor, and we maintain a stringent structure for management of such transactions. In addition, we implement stress tests based on scenarios under the market liquidity depletion and sharp price declines.
In addition, we undertake various securitization program arrangements such as ABL, ABCP and trust schemes, etc., as a means of financing for our customers. We endeavor to understand the actual risk profile, including the underlying assets, and to appropriately disclose the risks and terms of the program to the customers who invest in the product.Furthermore, we actively act as servicer for securitization transactions, offer settlement account facilities (servicer cash advance) and provide interest rate swaps to securitization conduits.One of our affiliated entities ,Mizuho Leasing Company, Ltd, holds securitization products in which we are involved as originators or sponsors.The securitization conduits included within the scope of consolidation are as follows:ROCK FIELD CORPORATION, FANTASTIC FUNDING CORPORATION, ARTEMIS FUNDING CORPORATION,N&M FUNDING CORPORATION, Denshi Saiken Kaitori Godo Kaisha, JAPAN SECURITIZATION CORPORATION,Allstar Funding Co., Ltd, SPARCS FUNDING CORPORATION, PERPETUAL FUNDING CORPORATION,Working Capital Management Co. L.P., ALWAYS CAPITAL CORPORATION, HORIZON CAPITAL CORPORATIONThere are no securitization conduits that provide credit enhancement beyond what is provided in agreements.
Overview of risk profile of securitization transactions and monitoring systemIn addition to price fluctuation and market liquidity risks, securitization and resecuritization products are exposed to risks related to default, recovery and granularity of underlying asset portfolio. The structure of these products also contains risks related to the originators, the administrators, trustees and managers of the underlying assets.To address these risks, we also analyze the structure in terms of the underlying assets and credit events. We monitor the ability, quality and operating performance of originators and managers in charge of controlling the underlying assets as well as covenant information and credit status of the parties related to the program. In addition, for resecuritization products, we pay attention to the underlying assets of the underlying securitization products. We also assign internal ratings to all products and review the rating at least once a year. If there is a change in the credit situations, we will review the internal rating as appropriate. As mentioned above, we have established a system to comprehensively understand the risk characteristics of securitization exposures and manage these exposures.We conduct credit risk measurements on all credit transactions, including securitization transactions. Furthermore, we carry out periodic monitoring on investment amount and performance on securitization transactions and report the situations to our Risk Management Committee, etc.
306
Summary of Securitization Exposure and Its Risk Management
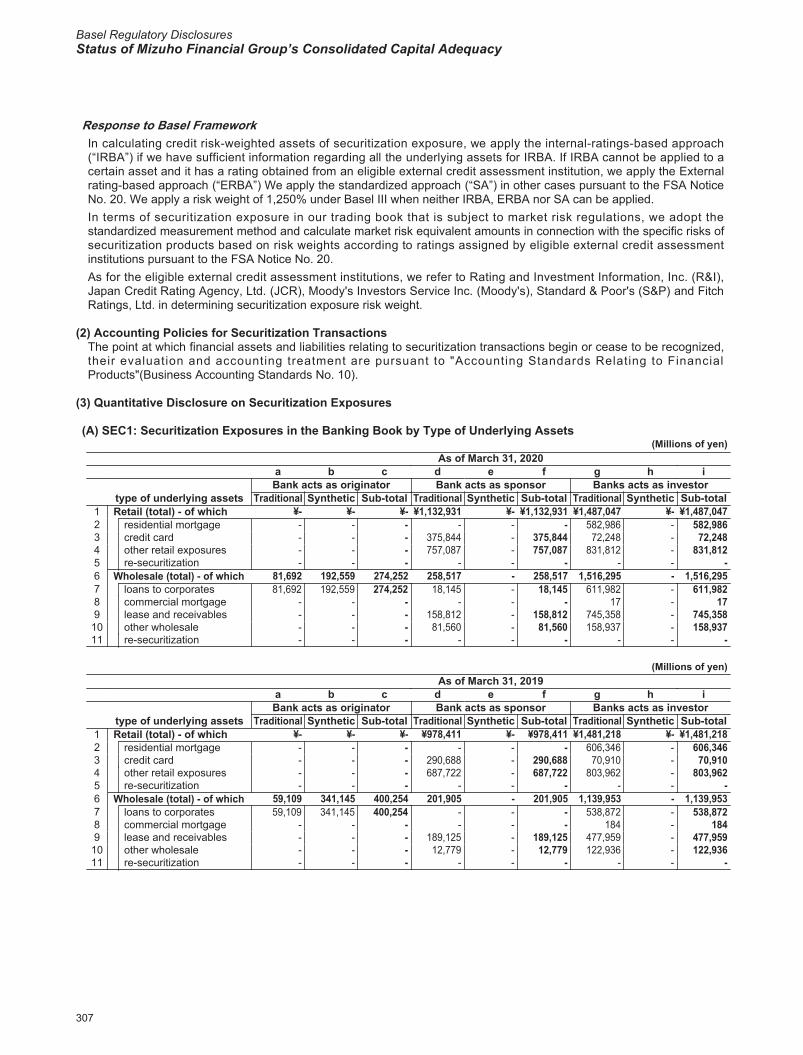
Basel Regulatory DisclosuresStatus of Mizuho Financial Group’s Consolidated Capital Adequacy
2020/09/07 16:50:34 / 20635245_株式会社みずほフィナンシャルグループ_総会その他(C)
Response to Basel FrameworkIn calculating credit risk-weighted assets of securitization exposure, we apply the internal-ratings-based approach (“IRBA”) if we have sufficient information regarding all the underlying assets for IRBA. If IRBA cannot be applied to a certain asset and it has a rating obtained from an eligible external credit assessment institution, we apply the External rating-based approach (“ERBA”) We apply the standardized approach (“SA”) in other cases pursuant to the FSA Notice No. 20. We apply a risk weight of 1,250% under Basel III when neither IRBA, ERBA nor SA can be applied.In terms of securitization exposure in our trading book that is subject to market risk regulations, we adopt the standardized measurement method and calculate market risk equivalent amounts in connection with the specific risks of securitization products based on risk weights according to ratings assigned by eligible external credit assessment institutions pursuant to the FSA Notice No. 20.As for the eligible external credit assessment institutions, we refer to Rating and Investment Information, Inc. (R&I), Japan Credit Rating Agency, Ltd. (JCR), Moody's Investors Service Inc. (Moody's), Standard & Poor's (S&P) and Fitch Ratings, Ltd. in determining securitization exposure risk weight.
(2) Accounting Policies for Securitization TransactionsThe point at which financial assets and liabilities relating to securitization transactions begin or cease to be recognized, their evaluation and accounting treatment are pursuant to "Accounting Standards Relating to Financial Products"(Business Accounting Standards No. 10).
(3) Quantitative Disclosure on Securitization Exposures
(A) SEC1: Securitization Exposures in the Banking Book by Type of Underlying Assets(Millions of yen)
As of March 31, 2020a b c d e f g h iBank acts as originator Bank acts as sponsor Banks acts as investor
type of underlying assets Traditional Synthetic Sub-total Traditional Synthetic Sub-total Traditional Synthetic Sub-total1 Retail (total) - of which ¥- ¥- ¥- ¥1,132,931 ¥- ¥1,132,931 ¥1,487,047 ¥- ¥1,487,0472 residential mortgage - - - - - - 582,986 - 582,9863 credit card - - - 375,844 - 375,844 72,248 - 72,2484 other retail exposures - - - 757,087 - 757,087 831,812 - 831,8125 re-securitization - - - - - - - - -6 Wholesale (total) - of which 81,692 192,559 274,252 258,517 - 258,517 1,516,295 - 1,516,2957 loans to corporates 81,692 192,559 274,252 18,145 - 18,145 611,982 - 611,9828 commercial mortgage - - - - - - 17 - 179 lease and receivables - - - 158,812 - 158,812 745,358 - 745,35810 other wholesale - - - 81,560 - 81,560 158,937 - 158,93711 re-securitization - - - - - - - - -
(Millions of yen)As of March 31, 2019
a b c d e f g h iBank acts as originator Bank acts as sponsor Banks acts as investor
type of underlying assets Traditional Synthetic Sub-total Traditional Synthetic Sub-total Traditional Synthetic Sub-total1 Retail (total) - of which ¥- ¥- ¥- ¥978,411 ¥- ¥978,411 ¥1,481,218 ¥- ¥1,481,2182 residential mortgage - - - - - - 606,346 - 606,3463 credit card - - - 290,688 - 290,688 70,910 - 70,9104 other retail exposures - - - 687,722 - 687,722 803,962 - 803,9625 re-securitization - - - - - - - - -6 Wholesale (total) - of which 59,109 341,145 400,254 201,905 - 201,905 1,139,953 - 1,139,9537 loans to corporates 59,109 341,145 400,254 - - - 538,872 - 538,8728 commercial mortgage - - - - - - 184 - 1849 lease and receivables - - - 189,125 - 189,125 477,959 - 477,95910 other wholesale - - - 12,779 - 12,779 122,936 - 122,93611 re-securitization - - - - - - - - -
307
Summary of Securitization Exposure and Its Risk Management、Accounting Policies for Securitization Transactions、Quantitative Disclosure Items for Securitization Exposure

2020/09/07 16:50:34 / 20635245_株式会社みずほフィナンシャルグループ_総会その他(C)
(B) SEC2: Securitization Exposures in the Trading Book by Type of Underlying Assets(Millions of yen)
As of March 31, 2020a b c d e f g h iBank acts as originator Bank acts as sponsor Banks acts as investor
type of underlying assets Traditional Synthetic Sub-total Traditional Synthetic Sub-total Traditional Synthetic Sub-total1 Retail (total) - of which ¥- ¥- ¥- ¥- ¥- ¥- ¥30,122 ¥- ¥30,1222 residential mortgage - - - - - - 7,414 - 7,4143 credit card - - - - - - - - -4 other retail exposures - - - - - - 21,957 - 21,9575 re-securitization - - - - - - 750 - 7506 Wholesale (total) - of which - - - - - - 9,703 - 9,7037 loans to corporates - - - - - - 9,589 - 9,5898 commercial mortgage - - - - - - - - -9 lease and receivables - - - - - - 113 - 11310 other wholesale - - - - - - - - -11 re-securitization - - - - - - - - -
(Millions of yen)As of March 31, 2019
a b c d e f g h iBank acts as originator Bank acts as sponsor Banks acts as investor
type of underlying assets Traditional Synthetic Sub-total Traditional Synthetic Sub-total Traditional Synthetic Sub-total1 Retail (total) - of which ¥- ¥- ¥- ¥- ¥- ¥- ¥20,847 ¥- ¥20,8472 residential mortgage - - - - - - 13,727 - 13,7273 credit card - - - - - - 6,243 - 6,2434 other retail exposures - - - - - - 875 - 8755 re-securitization - - - - - - 0 - 06 Wholesale (total) - of which - - - - - - 7,091 - 7,0917 loans to corporates - - - - - - 7,091 - 7,0918 commercial mortgage - - - - - - - - -9 lease and receivables - - - - - - - - -10 other wholesale - - - - - - - - -11 re-securitization - - - - - - - - -
308
Quantitative Disclosure Items for Securitization Exposure
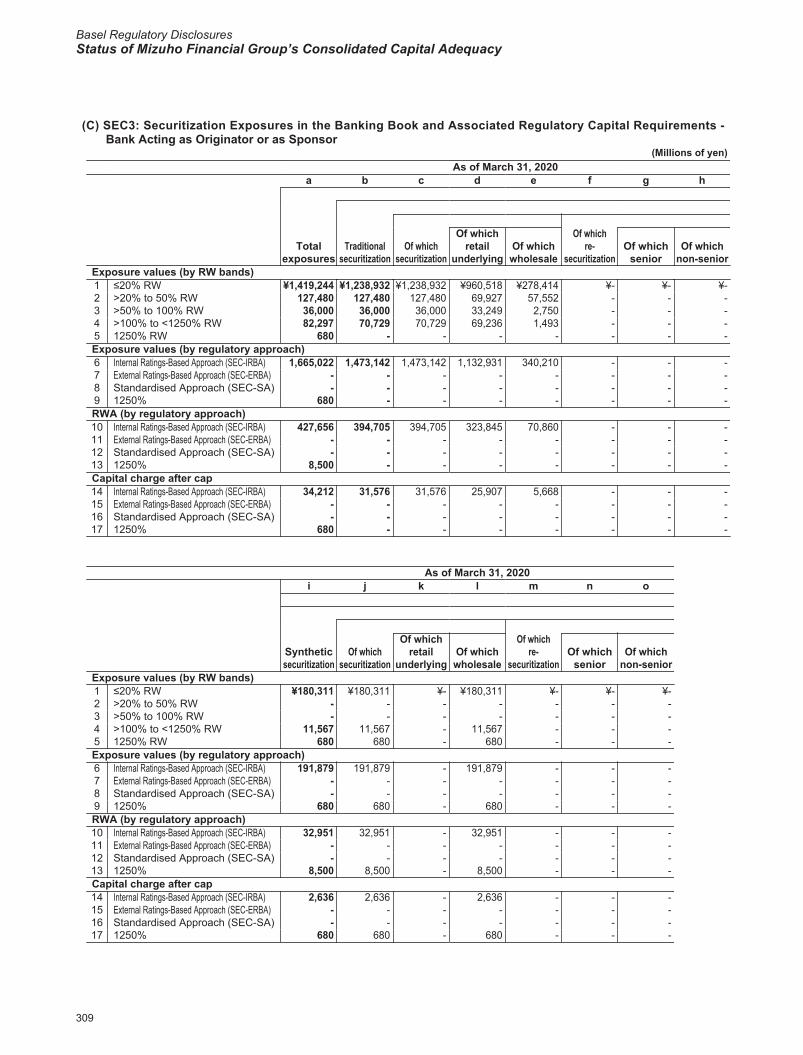
Basel Regulatory DisclosuresStatus of Mizuho Financial Group’s Consolidated Capital Adequacy
2020/09/07 16:50:34 / 20635245_株式会社みずほフィナンシャルグループ_総会その他(C)
(C) SEC3: Securitization Exposures in the Banking Book and Associated Regulatory Capital Requirements - Bank Acting as Originator or as Sponsor
(Millions of yen)As of March 31, 2020
a b c d e f g h
Totalexposures
Traditionalsecuritization
Of whichsecuritization
Of whichretail
underlyingOf which
wholesale
Of whichre-
securitizationOf which
seniorOf which
non-seniorExposure values (by RW bands)1 ≤20% RW ¥1,419,244 ¥1,238,932 ¥1,238,932 ¥960,518 ¥278,414 ¥- ¥- ¥-2 >20% to 50% RW 127,480 127,480 127,480 69,927 57,552 - - -3 >50% to 100% RW 36,000 36,000 36,000 33,249 2,750 - - -4 >100% to <1250% RW 82,297 70,729 70,729 69,236 1,493 - - -5 1250% RW 680 - - - - - - -Exposure values (by regulatory approach)6 Internal Ratings-Based Approach (SEC-IRBA) 1,665,022 1,473,142 1,473,142 1,132,931 340,210 - - -7 External Ratings-Based Approach (SEC-ERBA) - - - - - - - -8 Standardised Approach (SEC-SA) - - - - - - - -9 1250% 680 - - - - - - -RWA (by regulatory approach)10 Internal Ratings-Based Approach (SEC-IRBA) 427,656 394,705 394,705 323,845 70,860 - - -11 External Ratings-Based Approach (SEC-ERBA) - - - - - - - -12 Standardised Approach (SEC-SA) - - - - - - - -13 1250% 8,500 - - - - - - -Capital charge after cap14 Internal Ratings-Based Approach (SEC-IRBA) 34,212 31,576 31,576 25,907 5,668 - - -15 External Ratings-Based Approach (SEC-ERBA) - - - - - - - -16 Standardised Approach (SEC-SA) - - - - - - - -17 1250% 680 - - - - - - -
As of March 31, 2020i j k l m n o
Syntheticsecuritization
Of whichsecuritization
Of whichretail
underlyingOf which
wholesale
Of whichre-
securitizationOf which
seniorOf which
non-seniorExposure values (by RW bands)1 ≤20% RW ¥180,311 ¥180,311 ¥- ¥180,311 ¥- ¥- ¥-2 >20% to 50% RW - - - - - - -3 >50% to 100% RW - - - - - - -4 >100% to <1250% RW 11,567 11,567 - 11,567 - - -5 1250% RW 680 680 - 680 - - -Exposure values (by regulatory approach)6 Internal Ratings-Based Approach (SEC-IRBA) 191,879 191,879 - 191,879 - - -7 External Ratings-Based Approach (SEC-ERBA) - - - - - - -8 Standardised Approach (SEC-SA) - - - - - - -9 1250% 680 680 - 680 - - -RWA (by regulatory approach)10 Internal Ratings-Based Approach (SEC-IRBA) 32,951 32,951 - 32,951 - - -11 External Ratings-Based Approach (SEC-ERBA) - - - - - - -12 Standardised Approach (SEC-SA) - - - - - - -13 1250% 8,500 8,500 - 8,500 - - -Capital charge after cap14 Internal Ratings-Based Approach (SEC-IRBA) 2,636 2,636 - 2,636 - - -15 External Ratings-Based Approach (SEC-ERBA) - - - - - - -16 Standardised Approach (SEC-SA) - - - - - - -17 1250% 680 680 - 680 - - -
309
Quantitative Disclosure Items for Securitization Exposure
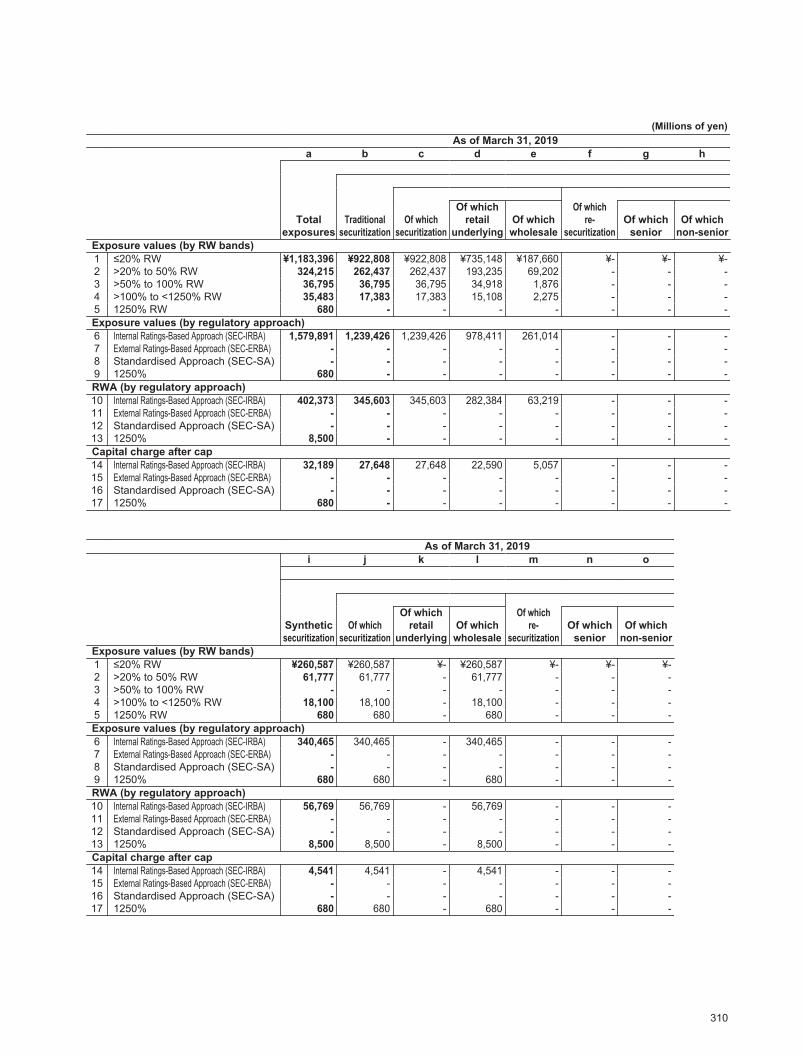
2020/09/07 16:50:34 / 20635245_株式会社みずほフィナンシャルグループ_総会その他(C)
(Millions of yen)As of March 31, 2019
a b c d e f g h
Totalexposures
Traditionalsecuritization
Of whichsecuritization
Of whichretail
underlyingOf which
wholesale
Of whichre-
securitizationOf which
seniorOf which
non-seniorExposure values (by RW bands)1 ≤20% RW ¥1,183,396 ¥922,808 ¥922,808 ¥735,148 ¥187,660 ¥- ¥- ¥-2 >20% to 50% RW 324,215 262,437 262,437 193,235 69,202 - - -3 >50% to 100% RW 36,795 36,795 36,795 34,918 1,876 - - -4 >100% to <1250% RW 35,483 17,383 17,383 15,108 2,275 - - -5 1250% RW 680 - - - - - - -Exposure values (by regulatory approach)6 Internal Ratings-Based Approach (SEC-IRBA) 1,579,891 1,239,426 1,239,426 978,411 261,014 - - -7 External Ratings-Based Approach (SEC-ERBA) - - - - - - - -8 Standardised Approach (SEC-SA) - - - - - - - -9 1250% 680 - - - - - - -RWA (by regulatory approach)10 Internal Ratings-Based Approach (SEC-IRBA) 402,373 345,603 345,603 282,384 63,219 - - -11 External Ratings-Based Approach (SEC-ERBA) - - - - - - - -12 Standardised Approach (SEC-SA) - - - - - - - -13 1250% 8,500 - - - - - - -Capital charge after cap14 Internal Ratings-Based Approach (SEC-IRBA) 32,189 27,648 27,648 22,590 5,057 - - -15 External Ratings-Based Approach (SEC-ERBA) - - - - - - - -16 Standardised Approach (SEC-SA) - - - - - - - -17 1250% 680 - - - - - - -
As of March 31, 2019i j k l m n o
Syntheticsecuritization
Of whichsecuritization
Of whichretail
underlyingOf which
wholesale
Of whichre-
securitizationOf which
seniorOf which
non-seniorExposure values (by RW bands)1 ≤20% RW ¥260,587 ¥260,587 ¥- ¥260,587 ¥- ¥- ¥-2 >20% to 50% RW 61,777 61,777 - 61,777 - - -3 >50% to 100% RW - - - - - - -4 >100% to <1250% RW 18,100 18,100 - 18,100 - - -5 1250% RW 680 680 - 680 - - -Exposure values (by regulatory approach)6 Internal Ratings-Based Approach (SEC-IRBA) 340,465 340,465 - 340,465 - - -7 External Ratings-Based Approach (SEC-ERBA) - - - - - - -8 Standardised Approach (SEC-SA) - - - - - - -9 1250% 680 680 - 680 - - -RWA (by regulatory approach)10 Internal Ratings-Based Approach (SEC-IRBA) 56,769 56,769 - 56,769 - - -11 External Ratings-Based Approach (SEC-ERBA) - - - - - - -12 Standardised Approach (SEC-SA) - - - - - - -13 1250% 8,500 8,500 - 8,500 - - -Capital charge after cap14 Internal Ratings-Based Approach (SEC-IRBA) 4,541 4,541 - 4,541 - - -15 External Ratings-Based Approach (SEC-ERBA) - - - - - - -16 Standardised Approach (SEC-SA) - - - - - - -17 1250% 680 680 - 680 - - -
310
Quantitative Disclosure Items for Securitization Exposure
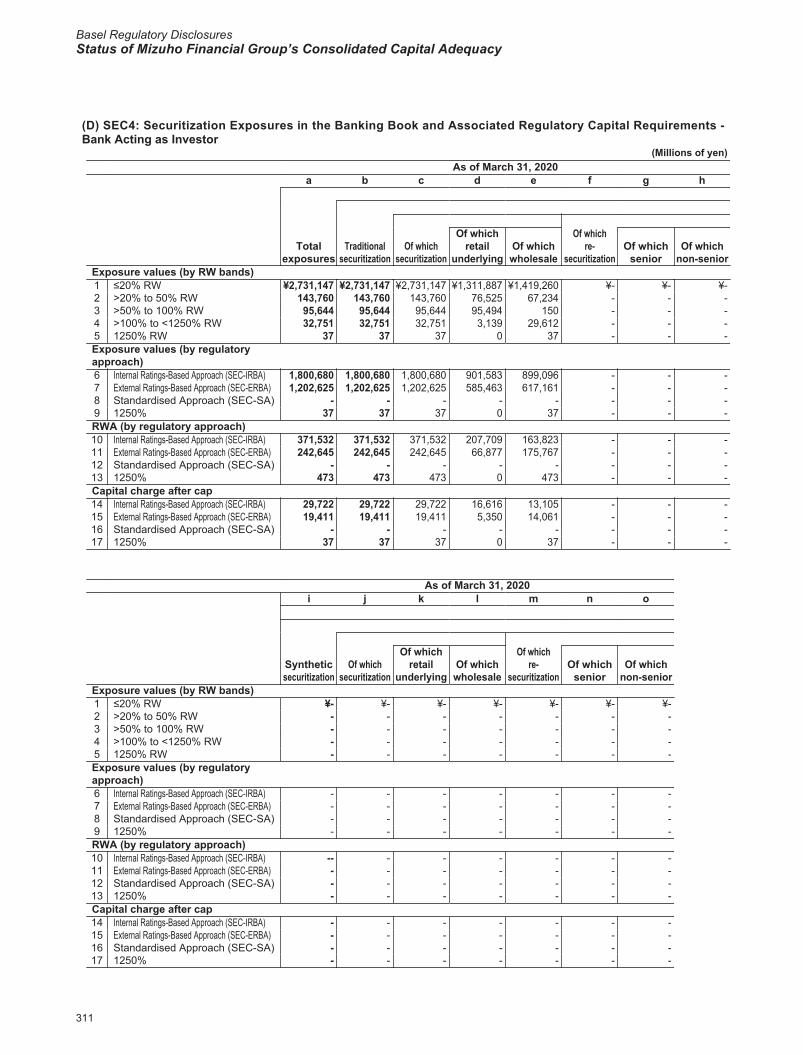
Basel Regulatory DisclosuresStatus of Mizuho Financial Group’s Consolidated Capital Adequacy
2020/09/07 16:50:34 / 20635245_株式会社みずほフィナンシャルグループ_総会その他(C)
(D) SEC4: Securitization Exposures in the Banking Book and Associated Regulatory Capital Requirements - Bank Acting as Investor
(Millions of yen)As of March 31, 2020
a b c d e f g h
Totalexposures
Traditionalsecuritization
Of whichsecuritization
Of whichretail
underlyingOf which
wholesale
Of whichre-
securitizationOf which
seniorOf which
non-seniorExposure values (by RW bands)1 ≤20% RW ¥2,731,147 ¥2,731,147 ¥2,731,147 ¥1,311,887 ¥1,419,260 ¥- ¥- ¥-2 >20% to 50% RW 143,760 143,760 143,760 76,525 67,234 - - -3 >50% to 100% RW 95,644 95,644 95,644 95,494 150 - - -4 >100% to <1250% RW 32,751 32,751 32,751 3,139 29,612 - - -5 1250% RW 37 37 37 0 37 - - -Exposure values (by regulatory approach)6 Internal Ratings-Based Approach (SEC-IRBA) 1,800,680 1,800,680 1,800,680 901,583 899,096 - - -7 External Ratings-Based Approach (SEC-ERBA) 1,202,625 1,202,625 1,202,625 585,463 617,161 - - -8 Standardised Approach (SEC-SA) - - - - - - - -9 1250% 37 37 37 0 37 - - -RWA (by regulatory approach)10 Internal Ratings-Based Approach (SEC-IRBA) 371,532 371,532 371,532 207,709 163,823 - - -11 External Ratings-Based Approach (SEC-ERBA) 242,645 242,645 242,645 66,877 175,767 - - -12 Standardised Approach (SEC-SA) - - - - - - - -13 1250% 473 473 473 0 473 - - -Capital charge after cap14 Internal Ratings-Based Approach (SEC-IRBA) 29,722 29,722 29,722 16,616 13,105 - - -15 External Ratings-Based Approach (SEC-ERBA) 19,411 19,411 19,411 5,350 14,061 - - -16 Standardised Approach (SEC-SA) - - - - - - - -17 1250% 37 37 37 0 37 - - -
As of March 31, 2020i j k l m n o
Syntheticsecuritization
Of whichsecuritization
Of whichretail
underlyingOf which
wholesale
Of whichre-
securitizationOf which
seniorOf which
non-seniorExposure values (by RW bands)1 ≤20% RW ¥- ¥- ¥- ¥- ¥- ¥- ¥-2 >20% to 50% RW - - - - - - -3 >50% to 100% RW - - - - - - -4 >100% to <1250% RW - - - - - - -5 1250% RW - - - - - - -Exposure values (by regulatory approach)6 Internal Ratings-Based Approach (SEC-IRBA) - - - - - - -7 External Ratings-Based Approach (SEC-ERBA) - - - - - - -8 Standardised Approach (SEC-SA) - - - - - - -9 1250% - - - - - - -RWA (by regulatory approach)10 Internal Ratings-Based Approach (SEC-IRBA) -- - - - - - -11 External Ratings-Based Approach (SEC-ERBA) - - - - - - -12 Standardised Approach (SEC-SA) - - - - - - -13 1250% - - - - - - -Capital charge after cap14 Internal Ratings-Based Approach (SEC-IRBA) - - - - - - -15 External Ratings-Based Approach (SEC-ERBA) - - - - - - -16 Standardised Approach (SEC-SA) - - - - - - -17 1250% - - - - - - -
311
Quantitative Disclosure Items for Securitization Exposure

2020/09/07 16:50:34 / 20635245_株式会社みずほフィナンシャルグループ_総会その他(C)
(Millions of yen)As of March 31, 2019
a b c d e f g h
Totalexposures
Traditionalsecuritization
Of whichsecuritization
Of whichretail
underlyingOf which
wholesale
Of whichre-
securitizationOf which
seniorOf which
non-seniorExposure values (by RW bands)1 ≤20% RW ¥2,407,832 ¥2,407,832 ¥2,407,832 ¥1,318,476 ¥1,089,355 ¥- ¥- ¥-2 >20% to 50% RW 20,044 20,044 20,044 20,044 - - - -3 >50% to 100% RW 162,557 162,557 162,557 137,995 24,561 - - -4 >100% to <1250% RW 30,542 30,542 30,542 4,701 25,840 - - -5 1250% RW 194 194 194 0 194 - - -Exposure values (by regulatory approach)6 Internal Ratings-Based Approach (SEC-IRBA) 1,462,952 1,462,952 1,462,952 867,244 595,708 - - -7 External Ratings-Based Approach (SEC-ERBA) 1,158,024 1,158,024 1,158,024 613,974 544,050 - - -8 Standardised Approach (SEC-SA) - - - - - - - -9 1250% 194 194 194 0 194 - - -RWA (by regulatory approach)10 Internal Ratings-Based Approach (SEC-IRBA) 332,708 332,708 332,708 216,665 116,042 - - -11 External Ratings-Based Approach (SEC-ERBA) 304,189 304,189 304,189 123,610 180,579 - - -12 Standardised Approach (SEC-SA) - - - - - - - -13 1250% 2,433 2,433 2,433 0 2,433 - - -Capital charge after cap14 Internal Ratings-Based Approach (SEC-IRBA) 26,616 26,616 26,616 17,333 9,283 - - -15 External Ratings-Based Approach (SEC-ERBA) 24,335 24,335 24,335 9,888 14,446 - - -16 Standardised Approach (SEC-SA) - - - - - - - -17 1250% 194 194 194 0 194 - - -
As of March 31, 2019i j k l m n o
Syntheticsecuritization
Of whichsecuritization
Of whichretail
underlyingOf which
wholesale
Of whichre-
securitizationOf which
seniorOf which
non-seniorExposure values (by RW bands)1 ≤20% RW ¥- ¥- ¥- ¥- ¥- ¥- ¥-2 >20% to 50% RW - - - - - - -3 >50% to 100% RW - - - - - - -4 >100% to <1250% RW - - - - - - -5 1250% RW - - - - - - -Exposure values (by regulatory approach)6 Internal Ratings-Based Approach (SEC-IRBA) - - - - - - -7 External Ratings-Based Approach (SEC-ERBA) - - - - - - -8 Standardised Approach (SEC-SA) - - - - - - -9 1250% - - - - - - -RWA (by regulatory approach)10 Internal Ratings-Based Approach (SEC-IRBA) - - - - - - -11 External Ratings-Based Approach (SEC-ERBA) - - - - - - -12 Standardised Approach (SEC-SA) - - - - - - -13 1250% - - - - - - -Capital charge after cap14 Internal Ratings-Based Approach (SEC-IRBA) - - - - - - -15 External Ratings-Based Approach (SEC-ERBA) - - - - - - -16 Standardised Approach (SEC-SA) - - - - - - -17 1250% - - - - - - -
312
Quantitative Disclosure Items for Securitization Exposure

Basel Regulatory DisclosuresStatus of Mizuho Financial Group’s Consolidated Capital Adequacy
2020/09/07 16:50:34 / 20635245_株式会社みずほフィナンシャルグループ_総会その他(C)
■ Market Risk
See pages 118 to 120 for information regarding our market risk management structure, etc.
(1) Trading Activities
In the calculation of the market risk equivalent amounts under the regulatory capital requirements, the risk arising from fluctuations in common factors across the market as a whole (e.g. foreign exchange and interest rates, etc.) is referred to as general market risk, and the risk arising from a deterioration in creditworthiness or market liquidity inherent in bonds and stocks is referred to as specific risk. In principle, we calculate market risk equivalent amounts by determining both general market risk and specific risk by applying the Internal Models Approach (IMA) to the former and the standardized approach to the latter, and by simply adding up both amounts. The Internal Models Approach is applied to trading transactions and calculated by adding up VAR and stressed VAR.
(A) MR1:Market risk under standardized approach (Millions of yen)As of March 31, 2020 As of March 31, 2019
No.RWA
(Risk equivalent / 8%)RWA
(Risk equivalent / 8%)1 Interest rate risk (general and specific) ¥428,815 ¥536,2322 Equity risk (general and specific) 312,525 288,6043 Foreign exchange risk 47,344 53,4714 Commodity risk 182,860 187,430
Options5 Simplified approach - -6 Delta-plus method 7,609 37,3077 Scenario approach - -8 Securitization 84,777 69,2979 Total ¥1,063,932 ¥1,172,343
(B) MR2:RWA flow statements of market risk exposures under IMA(Billions of yen)
No.A B C D E F
VAR StressedVAR IRC CRM Other Total
1a RWA as of March 31, 2019 ¥259.0 ¥602.8 ¥- ¥- / ¥861.81b Adjustment to RWA as of March 31, 2019 3.92 2.76 - - / 3.031c IMA values as of March 31, 2019 66.0 217.9 - - / 283.92
Breakdown of changes during this reporting period
Change in risk levels 57.1 68.3 - - / 125.43 Model updates/changes - - - - / -4 Methodology and policy - - - - / -5 Acquisitions and disposals - - - - / -6 Foreign currency fluctuations (4.9) (100.6) - - / (105.5)7 Other 72.1 94.5 - - / 166.6
8a IMA values as of March 31, 2020 190.2 280.1 - - / 470.48b Adjustment to RWA as of March 31, 2020 2.11 3.60 - - / 3.008c RWA as of March 31, 2020 402.3 1,010.6 - - / 1,413.0
313
Trading Activities

2020/09/07 16:50:34 / 20635245_株式会社みずほフィナンシャルグループ_総会その他(C)
(Billions of yen)
No.A B C D E F
VAR StressedVAR IRC CRM Other Total
1a RWA as of March 31, 2018 ¥269.0 ¥794.8 ¥- ¥- / ¥1,063.91b Adjustment to RWA as of March 31, 2018 3.02 3.72 - - / 3.511c IMA values as of March 31, 2018 89.0 213.6 - - / 302.62
Breakdown of changes during this reporting period
Change in risk levels 27.6 29.3 - - / 57.03 Model updates/changes 2.8 5.7 - - / 8.54 Methodology and policy - - - - / -5 Acquisitions and disposals - - - - / -6 Foreign currency fluctuations 30.3 23.2 - - / 53.67 Other (83.9) (54.1) - - / (138.0)
8a IMA values as of March 31, 2019 66.0 217.9 - - / 283.98b Adjustment to RWA as of March 31, 2019 3.92 2.76 - - / 3.038c RWA as of March 31, 2019 259.0 602.8 - - / 861.8
(C) MR3:IMA values for trading portfolios (Millions of yen)
No. As of March 31, 2020 As of March 31, 2019VAR (10 day 99%)
1 Maximum value ¥21,317 ¥27,1142 Average value 8,038 7,9393 Minimum value 5,022 4,8004 Period end 15,218 5,280
Stressed VAR (10 day 99%)5 Maximum value 39,947 61,3026 Average value 21,633 21,5447 Minimum value 13,614 12,6238 Period end 22,415 17,434
Incremental Risk Charge (99.9%)9 Maximum value - -
10 Average value - -11 Minimum value - -12 Period end - -
Comprehensive Risk Capital Charge (99.9%)13 Maximum value - -14 Average value - -15 Minimum value - -16 Period end - -17 Floor (standardized measurement method) - -Notes: 1. The historical simulation method is used for the calculation of VAR and stressed VAR under the Internal Models Approach.
2. VAR is measured based on the observation period of 3 years (801 business days), a 99% confidence interval and a 1-day holding period. This 1-day VAR is scaled up to 10-business day VAR using the square-root-of-time (√T) rule. We update historical data on a daily basis, in principle, and do not weight such data. When re-pricing instruments, we use the full revaluation method, a sensitivity-based approach and the like. We consider change width or rate as market volatility of risk factors according to product attributes.
3. When measuring stressed VAR, the same measurement approach as VAR is used except for the observation period of 1 year (265 business days). As a stressed period, we select a period which has an adequate length of time and is considered the most stressful under a certain set of criteria established based on the most recent portfolio.
4. When applying the internal model, we regularly verify the preconditions used for VAR measurement.
314
Trading Activities
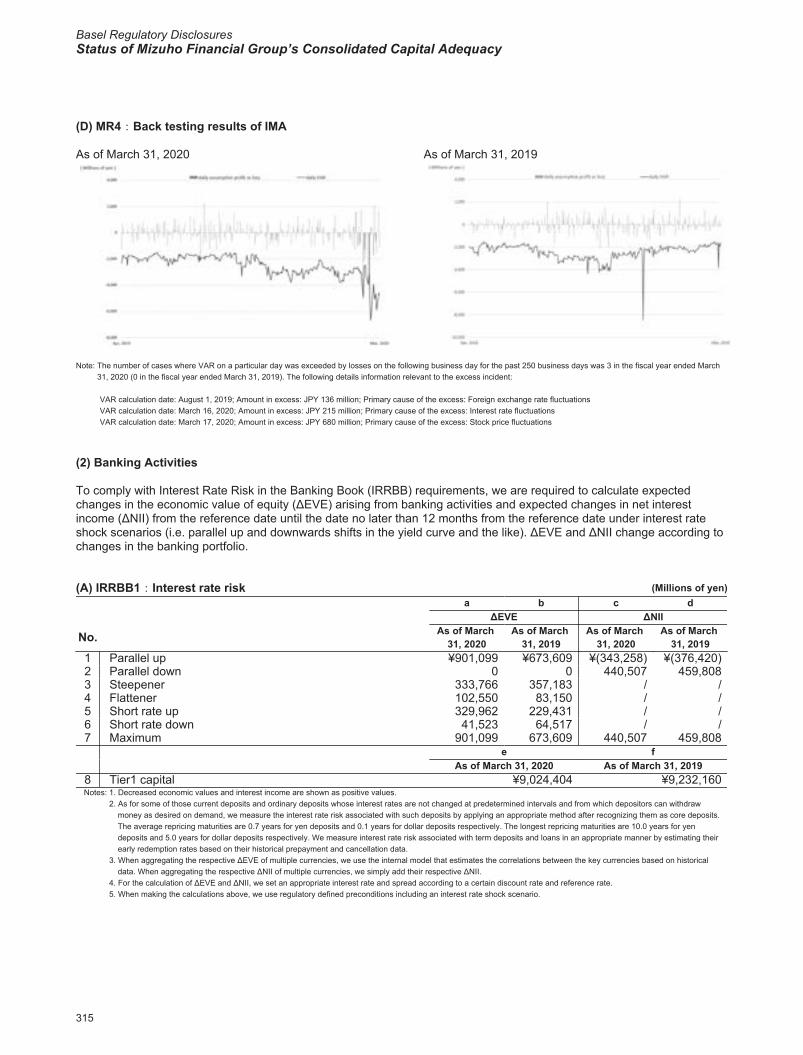
Basel Regulatory DisclosuresStatus of Mizuho Financial Group’s Consolidated Capital Adequacy
2020/09/07 16:50:34 / 20635245_株式会社みずほフィナンシャルグループ_総会その他(C)
(D) MR4:Back testing results of IMA
As of March 31, 2020 As of March 31, 2019
Note: The number of cases where VAR on a particular day was exceeded by losses on the following business day for the past 250 business days was 3 in the fiscal year ended March 31, 2020 (0 in the fiscal year ended March 31, 2019). The following details information relevant to the excess incident:
VAR calculation date: August 1, 2019; Amount in excess: JPY 136 million; Primary cause of the excess: Foreign exchange rate fluctuations VAR calculation date: March 16, 2020; Amount in excess: JPY 215 million; Primary cause of the excess: Interest rate fluctuations VAR calculation date: March 17, 2020; Amount in excess: JPY 680 million; Primary cause of the excess: Stock price fluctuations
(2) Banking Activities
To comply with Interest Rate Risk in the Banking Book (IRRBB) requirements, we are required to calculate expected changes in the economic value of equity (ΔEVE) arising from banking activities and expected changes in net interest income (ΔNII) from the reference date until the date no later than 12 months from the reference date under interest rate shock scenarios (i.e. parallel up and downwards shifts in the yield curve and the like). ΔEVE and ΔNII change according to changes in the banking portfolio.
(A) IRRBB1:Interest rate risk (Millions of yen)a b c d
ΔEVE ΔNII
No. As of March 31, 2020
As of March 31, 2019
As of March 31, 2020
As of March 31, 2019
1 Parallel up ¥901,099 ¥673,609 ¥(343,258) ¥(376,420)2 Parallel down 0 0 440,507 459,8083 Steepener 333,766 357,183 / /4 Flattener 102,550 83,150 / /5 Short rate up 329,962 229,431 / /6 Short rate down 41,523 64,517 / /7 Maximum 901,099 673,609 440,507 459,808
e fAs of March 31, 2020 As of March 31, 2019
8 Tier1 capital ¥9,024,404 ¥9,232,160Notes: 1. Decreased economic values and interest income are shown as positive values.
2. As for some of those current deposits and ordinary deposits whose interest rates are not changed at predetermined intervals and from which depositors can withdraw money as desired on demand, we measure the interest rate risk associated with such deposits by applying an appropriate method after recognizing them as core deposits. The average repricing maturities are 0.7 years for yen deposits and 0.1 years for dollar deposits respectively. The longest repricing maturities are 10.0 years for yen deposits and 5.0 years for dollar deposits respectively. We measure interest rate risk associated with term deposits and loans in an appropriate manner by estimating their early redemption rates based on their historical prepayment and cancellation data.
3. When aggregating the respective ΔEVE of multiple currencies, we use the internal model that estimates the correlations between the key currencies based on historical data. When aggregating the respective ΔNII of multiple currencies, we simply add their respective ΔNII.
4. For the calculation of ΔEVE and ΔNII, we set an appropriate interest rate and spread according to a certain discount rate and reference rate.5. When making the calculations above, we use regulatory defined preconditions including an interest rate shock scenario.
315
Trading Activities、Banking Activities

2020/09/07 16:50:34 / 20635245_株式会社みずほフィナンシャルグループ_総会その他(C)
■ Investment or Equity Exposure
(1) Summary of Risk Profile, Risk Management Policies/ Procedures and StructureWith regard to equities, we manage default risk through our credit risk management structure and price fluctuation risk through our market risk management structure. With regard to subsidiaries and related companies in which we invest, we manage their risks on a consolidated basis, and manage them appropriately in accordance with their management classification. In addition, securities, a part of equity exposure, are valued as follows: Japanese stocks with quoted market prices are valued based on the average quoted market price over the month preceding the consolidated balance sheet date; other securities which have readily determinable fair values are valued at the quoted market price if available, or otherwise based on their reasonable value at the consolidated balance sheet date (cost of securities sold is calculated primarily by the moving average method); and other securities the fair values of which are extremely difficult to determine are stated at acquisition cost or amortized cost and determined by the moving average method.
■ Operational risk
(1) Summary of Operational Risk Management and ProceduresSee pages 122 to 125 for a summary of our operational risk management policies, etc.
(2) Approach Used for the Measurement of Operational Risk EquivalentWe use the Advanced Measurement Approach for the calculation of operational risk equivalent. See pages ●●● to ●●● a for the outline of the Advanced Measurement Approach. In the measurement of operational risk equivalent, we do not recognize the risk mitigating impact of insurance. The following entities have adopted the Advanced Measurement Approach:
Mizuho Financial Group, Inc.; Mizuho Bank., Ltd., Mizuho Trust & Banking Co., Ltd.; Mizuho Securities Co., Ltd.; Mizuho Information & Research Institute, Inc.; Mizuho Operation Service, Ltd.; Mizuho Credit Guarantee Co., Ltd.; Mizuho Business Service Co., Ltd.; Mizuho Trust Operations Co., Ltd.; Mizuho Trust Systems Co., Ltd.; Mizuho Trust Business Operations Co., Ltd.; Mizuho Trust Retail Support Co., Ltd.; Mizuho Bank Europe N.V.; and Mizuho International plc.
316
Summary of Risk Profile, Risk Management Policies/ Procedures and Structure、Summary of Operational Risk Management and Procedures、Approach Used for the Measurement of Operational Risk Equivalent
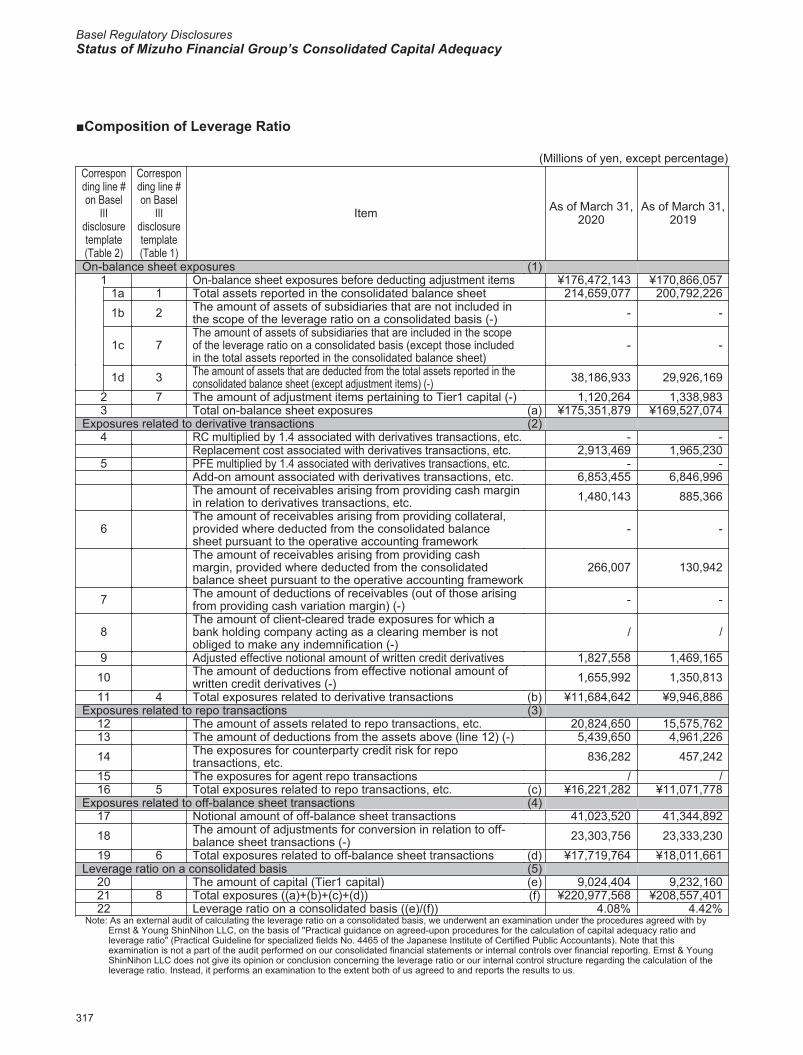
Basel Regulatory DisclosuresStatus of Mizuho Financial Group’s Consolidated Capital Adequacy
2020/09/07 16:50:34 / 20635245_株式会社みずほフィナンシャルグループ_総会その他(C)
■Composition of Leverage Ratio
(Millions of yen, except percentage)Corresponding line #on Basel
IIIdisclosuretemplate(Table 2)
Corresponding line #on Basel
IIIdisclosuretemplate(Table 1)
Item As of March 31,2020
As of March 31,2019
On-balance sheet exposures (1)1 On-balance sheet exposures before deducting adjustment items ¥176,472,143 ¥170,866,057
1a 1 Total assets reported in the consolidated balance sheet 214,659,077 200,792,2261b 2 The amount of assets of subsidiaries that are not included in
the scope of the leverage ratio on a consolidated basis (-) - -
1c 7The amount of assets of subsidiaries that are included in the scope of the leverage ratio on a consolidated basis (except those included in the total assets reported in the consolidated balance sheet)
- -
1d 3 The amount of assets that are deducted from the total assets reported in the consolidated balance sheet (except adjustment items) (-) 38,186,933 29,926,169
2 7 The amount of adjustment items pertaining to Tier1 capital (-) 1,120,264 1,338,9833 Total on-balance sheet exposures (a) ¥175,351,879 ¥169,527,074
Exposures related to derivative transactions (2)4 RC multiplied by 1.4 associated with derivatives transactions, etc. - -
Replacement cost associated with derivatives transactions, etc. 2,913,469 1,965,2305 PFE multiplied by 1.4 associated with derivatives transactions, etc. - -
Add-on amount associated with derivatives transactions, etc. 6,853,455 6,846,996The amount of receivables arising from providing cash margin in relation to derivatives transactions, etc. 1,480,143 885,366
6The amount of receivables arising from providing collateral, provided where deducted from the consolidated balance sheet pursuant to the operative accounting framework
- -
The amount of receivables arising from providing cash margin, provided where deducted from the consolidated balance sheet pursuant to the operative accounting framework
266,007 130,942
7 The amount of deductions of receivables (out of those arising from providing cash variation margin) (-) - -
8The amount of client-cleared trade exposures for which a bank holding company acting as a clearing member is not obliged to make any indemnification (-)
/ /
9 Adjusted effective notional amount of written credit derivatives 1,827,558 1,469,16510 The amount of deductions from effective notional amount of
written credit derivatives (-) 1,655,992 1,350,81311 4 Total exposures related to derivative transactions (b) ¥11,684,642 ¥9,946,886
Exposures related to repo transactions (3)12 The amount of assets related to repo transactions, etc. 20,824,650 15,575,76213 The amount of deductions from the assets above (line 12) (-) 5,439,650 4,961,22614 The exposures for counterparty credit risk for repo
transactions, etc. 836,282 457,24215 The exposures for agent repo transactions / /16 5 Total exposures related to repo transactions, etc. (c) ¥16,221,282 ¥11,071,778
Exposures related to off-balance sheet transactions (4)17 Notional amount of off-balance sheet transactions 41,023,520 41,344,89218 The amount of adjustments for conversion in relation to off-
balance sheet transactions (-) 23,303,756 23,333,23019 6 Total exposures related to off-balance sheet transactions (d) ¥17,719,764 ¥18,011,661
Leverage ratio on a consolidated basis (5)20 The amount of capital (Tier1 capital) (e) 9,024,404 9,232,16021 8 Total exposures ((a)+(b)+(c)+(d)) (f) ¥220,977,568 ¥208,557,40122 Leverage ratio on a consolidated basis ((e)/(f)) 4.08% 4.42%
Note: As an external audit of calculating the leverage ratio on a consolidated basis, we underwent an examination under the procedures agreed with by Ernst & Young ShinNihon LLC, on the basis of "Practical guidance on agreed-upon procedures for the calculation of capital adequacy ratio and leverage ratio" (Practical Guideline for specialized fields No. 4465 of the Japanese Institute of Certified Public Accountants). Note that this examination is not a part of the audit performed on our consolidated financial statements or internal controls over financial reporting. Ernst & Young ShinNihon LLC does not give its opinion or conclusion concerning the leverage ratio or our internal control structure regarding the calculation of the leverage ratio. Instead, it performs an examination to the extent both of us agreed to and reports the results to us.
317
Composition of Leverage Ratio

2020/09/07 16:50:34 / 20635245_株式会社みずほフィナンシャルグループ_総会その他(C)
■ TLAC Regulations
(1) TLAC1: TLAC composition for G-SIBs (at resolution group level)(Millions of yen, except percentage)
Basel III Template No.
Itemsa b
As of March 31,2020
As of March 31,2019
Preferred resolution strategy (1)The SPE (Single Point of Entry) resolution strategy is considered to be the preferred resolution strategy for Mizuho Financial Group, Inc. (MHFG) and its subsidiaries.More concretely, at the time of a stress, following the relevant authority's determination that one or more of the material sub-groups, i.e. Mizuho Bank, Ltd., Mizuho Trust & Banking Co., Ltd. and Mizuho Securities Co., Ltd. have reached the point of non-viability, losses incurred to them would be passed to MHFG, the ultimate holding company. While this could lead to a resolution of MHFG, the material sub-groups are expected to continue their business as usual under the Specified Bridge Financial Institution, etc. incorporated by the Deposit Insurance Corporation of Japan (DICJ) to which MHFG transfers its business.Regulatory capital elements of TLAC and adjustments (2)
1 Common Equity Tier 1 capital (CET1) (A) ¥7,244,776 ¥7,390,0582 Additional Tier 1 capital (AT1) before TLAC adjustments (B) 1,779,627 1,842,1023 AT1 ineligible as TLAC as issued out of subsidiaries to third parties (C) - -4 Other adjustments (D) - -5 AT1 instruments eligible under the TLAC framework ((B)-(C)-(D)) (E) 1,779,627 1,842,1026 Tier 2 capital (T2) before TLAC adjustments (F) 1,697,873 1,685,3477 Amortised portion of T2 instruments where remaining maturity > 1 year (G) (256,731) (189,764)8 T2 capital ineligible as TLAC as issued out of subsidiaries to third parties (H) - -9 Other adjustments (I) 210,907 189,401
10 T2 instruments eligible under the TLAC framework ((F)-(G)-(H)-(I)) (J) 1,743,698 1,685,71111 TLAC arising from regulatory capital ((A) + (E) + (J)) (K) 10,768,102 10,917,871
Non-regulatory capital elements of TLAC (3)
12 External TLAC instruments issued directly by the bank and subordinated to excluded liabilities
(L) 3,506,196 2,537,990
13 External TLAC instruments issued directly by the bank which are not subordinated to excluded liabilities but meet all other TLAC term sheet requirements / /
14 of which: amount eligible as TLAC after application of the caps / /15 External TLAC instruments issued by funding vehicles prior to 1 January 2022 / /16 Eligible ex ante commitments to recapitalise a G-SIB in resolution (M) 1,553,530 1,447,489
17 TLAC arising from non-regulatory capital instruments before adjustments ((L) + (M))
(N) 5,059,726 3,985,479
Non-regulatory capital elements of TLAC: adjustments (4)18 TLAC before deductions ((K) + (N)) (O) 15,827,828 14,903,350
19 Deductions of exposures between MPE resolution groups that correspond to items eligible for TLAC (not applicable to SPE G-SIBs)
(P) - -
20 Deduction of investments in own other TLAC liabilities (Q) 3,441 2,58721 Other adjustments to TLAC (R) - -22 TLAC after deductions ((O)-(P)-(Q)-(R)) (S) 15,824,386 14,900,763
Risk-weighted assets and leverage exposure measure for TLAC purposes (5)23 Total RWA (T) 62,141,217 57,899,56724 Leverage ratio exposure measure (U) 220,977,568 208,557,401
TLAC ratios and buffers (6)
25 TLAC before deduction of CET1 specific buffer requirement (as a percentage of RWA) ((S)/(T)) 25.46% 25.73%
25a TLAC as a percentage of RWA 21.95% 22.18%26 TLAC as a percentage of leverage ratio exposure measure ((S)/(U)) 7.16% 7.14%27 CET1 available after meeting the bank's minimum capital requirements 7.15% 8.26%28 Total of bank CET1 specific buffer requirements 3.51% 3.55%29 of which: capital conservation buffer requirement 2.50% 2.50%30 of which: countercyclical buffer requirement 0.01% 0.05%31 of which: bank G-SIB/D-SIB additional requirements 1.00% 1.00%
318
TLAC Regulations

Basel Regulatory DisclosuresStatus of Mizuho Financial Group’s Consolidated Capital Adequacy
2020/09/07 16:50:34 / 20635245_株式会社みずほフィナンシャルグループ_総会その他(C)
(2) TLAC2:Material subgroup entity – creditor ranking at legal entity level(Millions of yen)
Mizuho Bank (Non-consolidated)As of March 31, 2019
Sum of1 to 5
Creditor rankingBasel IIITemplate Items
12 3 4
5most junior most senior
1 Is the resolution entity the creditor/investor? ✓ - ✓ - ✓ - ✓ - ✓ -
2 Description of creditor ranking Commonequity
Additional Tier 1capital instruments
Tier 2 capitalinstruments
Eligible Tier 2 capitalinstruments subject
to phase-outarrangements
Other internalTLAC eligibleinstruments
3 Total capital and liabilities net of credit risk mitigation (A) 3,690,389 - 1,873,004 - 1,168,772 - 166,515 601,000 2,537,990 - 10,037,6714 Subset of row 3 that are excluded liabilities (B) - - - - - - - - - - -5 Total capital and liabilities less excluded liabilities ((A) -(B) ) 3,690,389 - 1,873,004 - 1,168,772 - 166,515 601,000 2,537,990 - 10,037,6716 Subset of row 5 that are eligible as TLAC 3,690,389 - 1,570,000 - 1,002,257 - - - 2,537,990 - 8,800,6377 Subset of row 6 with 1 year ≤ residual maturity < 2 years - - - - - - - - - - -8 Subset of row 6 with 2 years ≤ residual maturity < 5 years - - - - - - - - 1,480,946 - 1,480,9469 Subset of row 6 with 5 years ≤ residual maturity < 10 years - - - - 907,257 - - - 946,034 - 1,853,291
10 Subset of row 6 with 10 years ≤ residual maturity,but excluding perpetual securities - - - - 95,000 - - - 111,010 - 206.010
11 Subset of row 6 that is perpetual securities 3,690,389 - 1,570,000 - - - - - - - 5,260,389*1 : Additional Tier1 capital instruments include eligible Tier 1 capital instruments subject to phase-out arrangements issued by SPC (303,000 million yen)
(Millions of yen)Mizuho Bank (Non-consolidated)
As of March 31, 2020Sum of1 to 5
Creditor rankingBasel IIITemplate Items
12 3 4
5most junior most senior
1 Is the resolution entity the creditor/investor? ✓ - ✓ - ✓ - ✓ - ✓ -
2 Description of creditor ranking Commonequity
Additional Tier 1capital instruments
Tier 2 capitalinstruments
Eligible Tier 2 capitalinstruments subject
to phase-outarrangements
Other internalTLAC eligibleinstruments
3 Total capital and liabilities net of credit risk mitigation (A) 3,690,389 - 1,805,004 - 1,391,867 - 163,245 393,000 3,506,196 - 10,949,7024 Subset of row 3 that are excluded liabilities (B) - - - - - - - - - - -5 Total capital and liabilities less excluded liabilities ((A) -(B) ) 3,690,389 - 1,805,004 - 1,391,867 - 163,245 393,000 3,506,196 - 10,949,7026 Subset of row 5 that are eligible as TLAC 3,690,389 - 1,805,000 - 1,228,622 - - - 3,506,196 - 10,230,2087 Subset of row 6 with 1 year ≤ residual maturity < 2 years - - - - - - - - 864,017 - 864,0178 Subset of row 6 with 2 years ≤ residual maturity < 5 years - - - - 105,000 - - - 1,317,283 - 1,422,2839 Subset of row 6 with 5 years ≤ residual maturity < 10 years - - - - 1,023,622 - - - 1,044,705 - 2,068,327
10 Subset of row 6 with 10 years ≤ residual maturity,but excluding perpetual securities - - - - 100,000 - - - 280,190 - 380,190
11 Subset of row 6 that is perpetual securities 3,690,389 - 1,805,000 - - - - - - - 5,495,389
319
TLAC Regulations

2020/09/07 16:50:34 / 20635245_株式会社みずほフィナンシャルグループ_総会その他(C)
(Millions of yen)Mizuho Trust & Banking (Non-consolidated)
As of March 31, 2019Sum of 1
to 3Creditor ranking
Basel IIITemplate Items
12
3most junior most senior
1 Is the resolution entity the creditor/investor? ✓ - ✓ - ✓ -
2 Description of creditor ranking Common equity Eligible Tier 2 capital instrumentssubject to phase-out arrangements
Other internal TLAC eligibleinstruments
3 Total capital and liabilities net of credit risk mitigation (A) 262,874 - - 10,000 - - 272,8744 Subset of row 3 that are excluded liabilities (B) - - - - - - -5 Total capital and liabilities less excluded liabilities ((A) -(B) ) 262,874 - - 10,000 - - 272,8746 Subset of row 5 that are eligible as TLAC 262,874 - - - - - 262,8747 Subset of row 6 with 1 year ≤ residual maturity < 2 years - - - - - - -8 Subset of row 6 with 2 years ≤ residual maturity < 5 years - - - - - - -9 Subset of row 6 with 5 years ≤ residual maturity < 10 years - - - - - - -
10 Subset of row 6 with 10 years ≤ residual maturity , but excluding perpetual securities - - - - - - -
11 Subset of row 6 that is perpetual securities 262,874 - - - - - 262,874
(Millions of yen)Mizuho Trust & Banking (Non-consolidated)
As of March 31, 2020Sum of 1
to 3Creditor ranking
Basel IIITemplate Items
12
3most junior most senior
1 Is the resolution entity the creditor/investor? ✓ - ✓ - ✓ -
2 Description of creditor ranking Common equity Eligible Tier 2 capital instrumentssubject to phase-out arrangements
Other internal TLAC eligibleinstruments
3 Total capital and liabilities net of credit risk mitigation (A) 262,874 - - 10,000 - - 272,8744 Subset of row 3 that are excluded liabilities (B) - - - - - - -5 Total capital and liabilities less excluded liabilities ((A) -(B) ) 262,874 - - 10,000 - - 272,8746 Subset of row 5 that are eligible as TLAC 262,874 - - - - - 262,8747 Subset of row 6 with 1 year ≤ residual maturity < 2 years - - - - - - -8 Subset of row 6 with 2 years ≤ residual maturity < 5 years - - - - - - -9 Subset of row 6 with 5 years ≤ residual maturity < 10 years - - - - - - -
10 Subset of row 6 with 10 years ≤ residual maturity , but excluding perpetual securities - - - - - - -
11 Subset of row 6 that is perpetual securities 262,874 - - - - - 262,874
320
TLAC Regulations
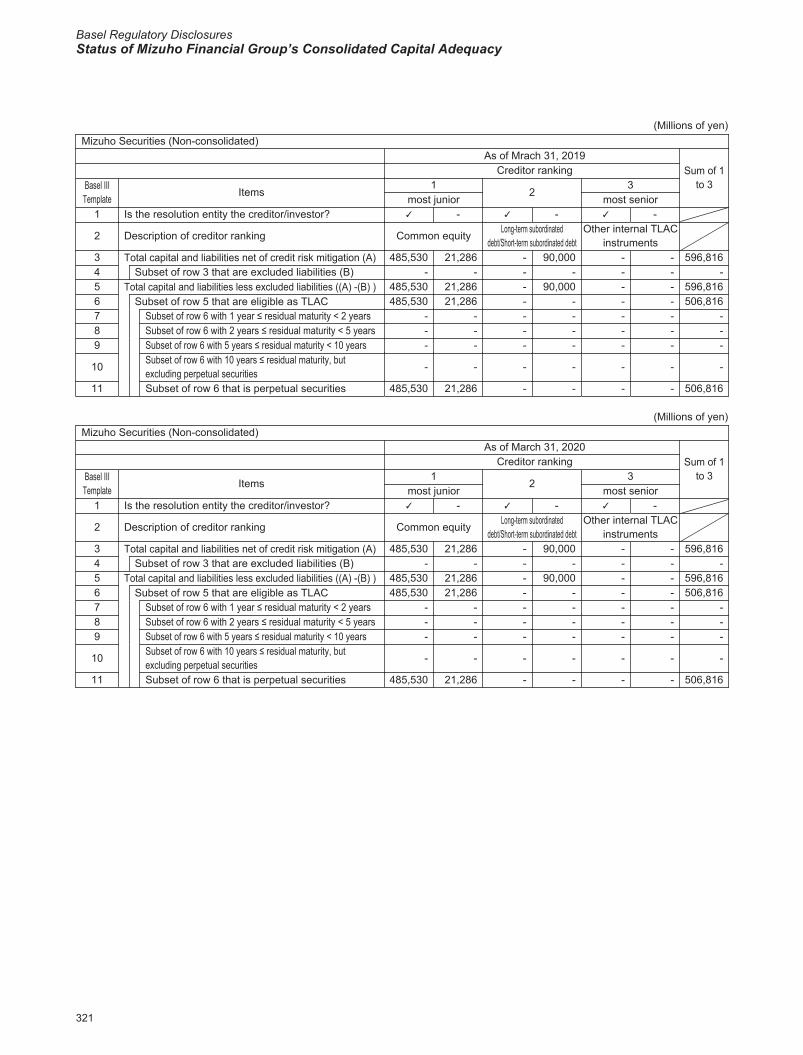
Basel Regulatory DisclosuresStatus of Mizuho Financial Group’s Consolidated Capital Adequacy
2020/09/07 16:50:34 / 20635245_株式会社みずほフィナンシャルグループ_総会その他(C)
(Millions of yen)Mizuho Securities (Non-consolidated)
As of Mrach 31, 2019Sum of 1
to 3Creditor ranking
Basel IIITemplate Items
12
3most junior most senior
1 Is the resolution entity the creditor/investor? ✓ - ✓ - ✓ -
2 Description of creditor ranking Common equity Long-term subordinateddebt/Short-term subordinated debt
Other internal TLACinstruments
3 Total capital and liabilities net of credit risk mitigation (A) 485,530 21,286 - 90,000 - - 596,8164 Subset of row 3 that are excluded liabilities (B) - - - - - - -5 Total capital and liabilities less excluded liabilities ((A) -(B) ) 485,530 21,286 - 90,000 - - 596,8166 Subset of row 5 that are eligible as TLAC 485,530 21,286 - - - - 506,8167 Subset of row 6 with 1 year ≤ residual maturity < 2 years - - - - - - -8 Subset of row 6 with 2 years ≤ residual maturity < 5 years - - - - - - -9 Subset of row 6 with 5 years ≤ residual maturity < 10 years - - - - - - -
10 Subset of row 6 with 10 years ≤ residual maturity, but excluding perpetual securities - - - - - - -
11 Subset of row 6 that is perpetual securities 485,530 21,286 - - - - 506,816
(Millions of yen)Mizuho Securities (Non-consolidated)
As of March 31, 2020Sum of 1
to 3Creditor ranking
Basel IIITemplate Items
12
3most junior most senior
1 Is the resolution entity the creditor/investor? ✓ - ✓ - ✓ -
2 Description of creditor ranking Common equity Long-term subordinateddebt/Short-term subordinated debt
Other internal TLACinstruments
3 Total capital and liabilities net of credit risk mitigation (A) 485,530 21,286 - 90,000 - - 596,8164 Subset of row 3 that are excluded liabilities (B) - - - - - - -5 Total capital and liabilities less excluded liabilities ((A) -(B) ) 485,530 21,286 - 90,000 - - 596,8166 Subset of row 5 that are eligible as TLAC 485,530 21,286 - - - - 506,8167 Subset of row 6 with 1 year ≤ residual maturity < 2 years - - - - - - -8 Subset of row 6 with 2 years ≤ residual maturity < 5 years - - - - - - -9 Subset of row 6 with 5 years ≤ residual maturity < 10 years - - - - - - -
10 Subset of row 6 with 10 years ≤ residual maturity, but excluding perpetual securities - - - - - - -
11 Subset of row 6 that is perpetual securities 485,530 21,286 - - - - 506,816
321
TLAC Regulations
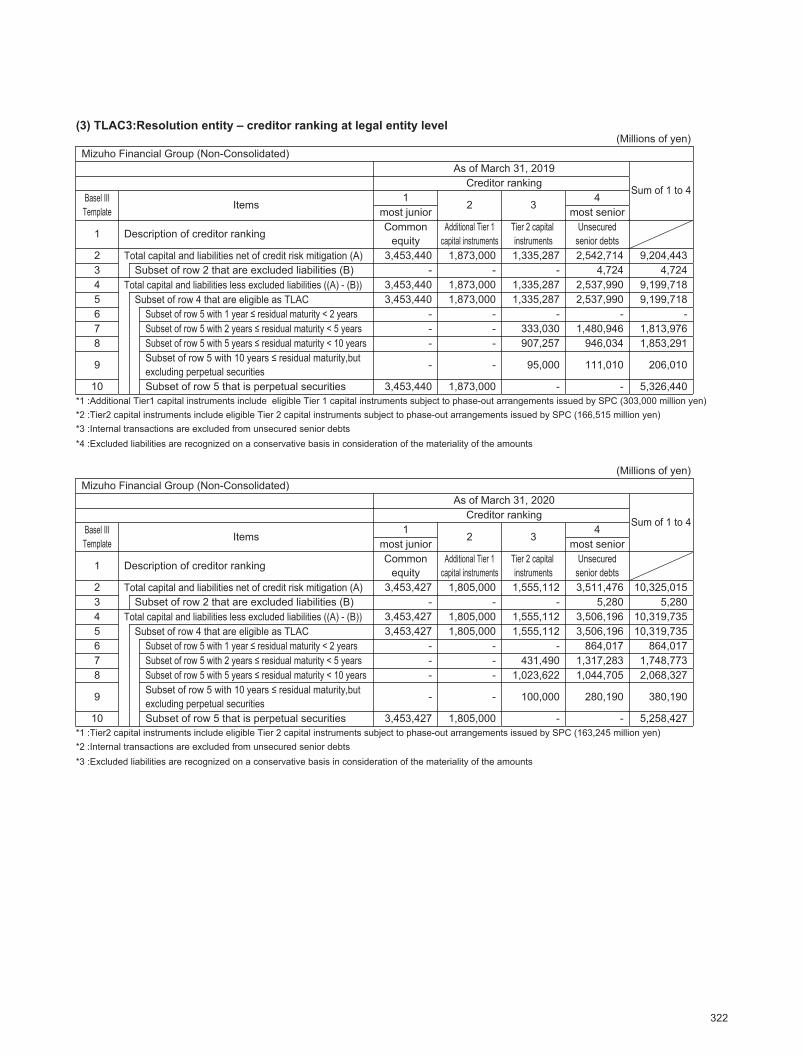
2020/09/07 16:50:34 / 20635245_株式会社みずほフィナンシャルグループ_総会その他(C)
(3) TLAC3:Resolution entity – creditor ranking at legal entity level(Millions of yen)
Mizuho Financial Group (Non-Consolidated)As of March 31, 2019
Sum of 1 to 4Creditor ranking
Basel IIITemplate Items
12 3
4most junior most senior
1 Description of creditor ranking Commonequity
Additional Tier 1capital instruments
Tier 2 capital instruments
Unsecuredsenior debts
2 Total capital and liabilities net of credit risk mitigation (A) 3,453,440 1,873,000 1,335,287 2,542,714 9,204,4433 Subset of row 2 that are excluded liabilities (B) - - - 4,724 4,7244 Total capital and liabilities less excluded liabilities ((A) - (B)) 3,453,440 1,873,000 1,335,287 2,537,990 9,199,7185 Subset of row 4 that are eligible as TLAC 3,453,440 1,873,000 1,335,287 2,537,990 9,199,7186 Subset of row 5 with 1 year ≤ residual maturity < 2 years - - - - -7 Subset of row 5 with 2 years ≤ residual maturity < 5 years - - 333,030 1,480,946 1,813,9768 Subset of row 5 with 5 years ≤ residual maturity < 10 years - - 907,257 946,034 1,853,291
9 Subset of row 5 with 10 years ≤ residual maturity,but excluding perpetual securities - - 95,000 111,010 206,010
10 Subset of row 5 that is perpetual securities 3,453,440 1,873,000 - - 5,326,440*1 :Additional Tier1 capital instruments include eligible Tier 1 capital instruments subject to phase-out arrangements issued by SPC (303,000 million yen)*2 :Tier2 capital instruments include eligible Tier 2 capital instruments subject to phase-out arrangements issued by SPC (166,515 million yen)*3 :Internal transactions are excluded from unsecured senior debts*4 :Excluded liabilities are recognized on a conservative basis in consideration of the materiality of the amounts
(Millions of yen)Mizuho Financial Group (Non-Consolidated)
As of March 31, 2020
Sum of 1 to 4Creditor ranking
Basel IIITemplate Items
12 3
4most junior most senior
1 Description of creditor ranking Commonequity
Additional Tier 1capital instruments
Tier 2 capital instruments
Unsecuredsenior debts
2 Total capital and liabilities net of credit risk mitigation (A) 3,453,427 1,805,000 1,555,112 3,511,476 10,325,0153 Subset of row 2 that are excluded liabilities (B) - - - 5,280 5,2804 Total capital and liabilities less excluded liabilities ((A) - (B)) 3,453,427 1,805,000 1,555,112 3,506,196 10,319,7355 Subset of row 4 that are eligible as TLAC 3,453,427 1,805,000 1,555,112 3,506,196 10,319,7356 Subset of row 5 with 1 year ≤ residual maturity < 2 years - - - 864,017 864,0177 Subset of row 5 with 2 years ≤ residual maturity < 5 years - - 431,490 1,317,283 1,748,7738 Subset of row 5 with 5 years ≤ residual maturity < 10 years - - 1,023,622 1,044,705 2,068,327
9 Subset of row 5 with 10 years ≤ residual maturity,but excluding perpetual securities - - 100,000 280,190 380,190
10 Subset of row 5 that is perpetual securities 3,453,427 1,805,000 - - 5,258,427*1 :Tier2 capital instruments include eligible Tier 2 capital instruments subject to phase-out arrangements issued by SPC (163,245 million yen)*2 :Internal transactions are excluded from unsecured senior debts*3 :Excluded liabilities are recognized on a conservative basis in consideration of the materiality of the amounts
322
TLAC Regulations
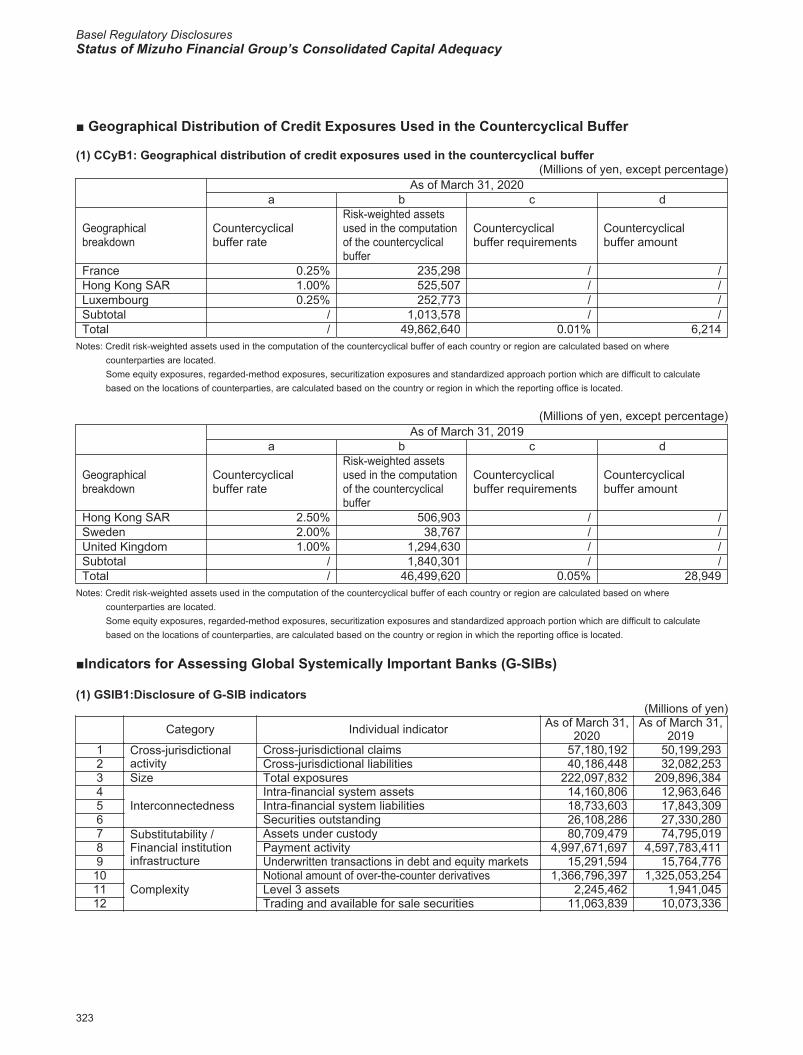
Basel Regulatory DisclosuresStatus of Mizuho Financial Group’s Consolidated Capital Adequacy
2020/09/07 16:50:34 / 20635245_株式会社みずほフィナンシャルグループ_総会その他(C)
■ Geographical Distribution of Credit Exposures Used in the Countercyclical Buffer
(1) CCyB1: Geographical distribution of credit exposures used in the countercyclical buffer(Millions of yen, except percentage)
As of March 31, 2020a b c d
Geographical breakdown
Countercyclical buffer rate
Risk-weighted assets used in the computation of the countercyclical buffer
Countercyclical buffer requirements
Countercyclical buffer amount
France 0.25% 235,298 / /Hong Kong SAR 1.00% 525,507 / /Luxembourg 0.25% 252,773 / /Subtotal / 1,013,578 / /Total / 49,862,640 0.01% 6,214
Notes: Credit risk-weighted assets used in the computation of the countercyclical buffer of each country or region are calculated based on where
counterparties are located.Some equity exposures, regarded-method exposures, securitization exposures and standardized approach portion which are difficult to calculate based on the locations of counterparties, are calculated based on the country or region in which the reporting office is located.
(Millions of yen, except percentage)As of March 31, 2019
a b c d
Geographical breakdown
Countercyclical buffer rate
Risk-weighted assets used in the computation of the countercyclical buffer
Countercyclical buffer requirements
Countercyclical buffer amount
Hong Kong SAR 2.50% 506,903 / /Sweden 2.00% 38,767 / /United Kingdom 1.00% 1,294,630 / /Subtotal / 1,840,301 / /Total / 46,499,620 0.05% 28,949
Notes: Credit risk-weighted assets used in the computation of the countercyclical buffer of each country or region are calculated based on where
counterparties are located.Some equity exposures, regarded-method exposures, securitization exposures and standardized approach portion which are difficult to calculate based on the locations of counterparties, are calculated based on the country or region in which the reporting office is located.
■Indicators for Assessing Global Systemically Important Banks (G-SIBs)
(1) GSIB1:Disclosure of G-SIB indicators(Millions of yen)
Category Individual indicator As of March 31,2020
As of March 31,2019
1 Cross-jurisdictional activity
Cross-jurisdictional claims 57,180,192 50,199,2932 Cross-jurisdictional liabilities 40,186,448 32,082,2533 Size Total exposures 222,097,832 209,896,3844
InterconnectednessIntra-financial system assets 14,160,806 12,963,646
5 Intra-financial system liabilities 18,733,603 17,843,3096 Securities outstanding 26,108,286 27,330,2807 Substitutability /
Financial institution infrastructure
Assets under custody 80,709,479 74,795,0198 Payment activity 4,997,671,697 4,597,783,4119 Underwritten transactions in debt and equity markets 15,291,594 15,764,77610
ComplexityNotional amount of over-the-counter derivatives 1,366,796,397 1,325,053,254
11 Level 3 assets 2,245,462 1,941,04512 Trading and available for sale securities 11,063,839 10,073,336
323
Geographical Distribution of Credit Exposures Used in the Countercyclical Buffer、Indicators for assessing Global Systemically Important Banks (G-SIBs)
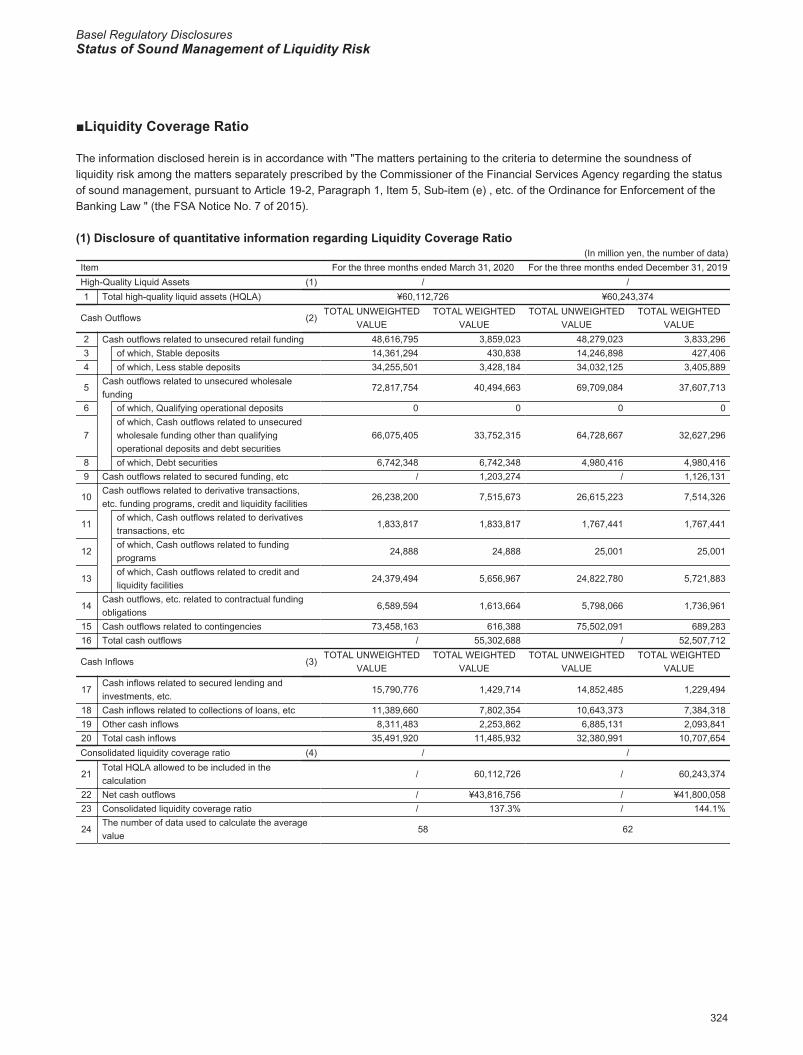
Basel Regulatory DisclosuresStatus of Sound Management of Liquidity Risk
2020/09/07 16:50:34 / 20635245_株式会社みずほフィナンシャルグループ_総会その他(C)
■Liquidity Coverage Ratio
The information disclosed herein is in accordance with "The matters pertaining to the criteria to determine the soundness of liquidity risk among the matters separately prescribed by the Commissioner of the Financial Services Agency regarding the status of sound management, pursuant to Article 19-2, Paragraph 1, Item 5, Sub-item (e) , etc. of the Ordinance for Enforcement of the Banking Law " (the FSA Notice No. 7 of 2015).
(1) Disclosure of quantitative information regarding Liquidity Coverage Ratio (In million yen, the number of data)
Item For the three months ended March 31, 2020 For the three months ended December 31, 2019High-Quality Liquid Assets (1) / /1 Total high-quality liquid assets (HQLA) ¥60,112,726 ¥60,243,374
Cash Outflows (2)TOTAL UNWEIGHTED
VALUETOTAL WEIGHTED
VALUETOTAL UNWEIGHTED
VALUETOTAL WEIGHTED
VALUE2 Cash outflows related to unsecured retail funding 48,616,795 3,859,023 48,279,023 3,833,2963 of which, Stable deposits 14,361,294 430,838 14,246,898 427,4064 of which, Less stable deposits 34,255,501 3,428,184 34,032,125 3,405,889
5Cash outflows related to unsecured wholesale funding
72,817,754 40,494,663 69,709,084 37,607,713
6 of which, Qualifying operational deposits 0 0 0 0
7of which, Cash outflows related to unsecured wholesale funding other than qualifying operational deposits and debt securities
66,075,405 33,752,315 64,728,667 32,627,296
8 of which, Debt securities 6,742,348 6,742,348 4,980,416 4,980,4169 Cash outflows related to secured funding, etc / 1,203,274 / 1,126,131
10Cash outflows related to derivative transactions, etc. funding programs, credit and liquidity facilities
26,238,200 7,515,673 26,615,223 7,514,326
11of which, Cash outflows related to derivatives transactions, etc
1,833,817 1,833,817 1,767,441 1,767,441
12of which, Cash outflows related to funding programs
24,888 24,888 25,001 25,001
13of which, Cash outflows related to credit and liquidity facilities
24,379,494 5,656,967 24,822,780 5,721,883
14Cash outflows, etc. related to contractual funding obligations
6,589,594 1,613,664 5,798,066 1,736,961
15 Cash outflows related to contingencies 73,458,163 616,388 75,502,091 689,28316 Total cash outflows / 55,302,688 / 52,507,712
Cash Inflows (3)TOTAL UNWEIGHTED
VALUETOTAL WEIGHTED
VALUETOTAL UNWEIGHTED
VALUETOTAL WEIGHTED
VALUE
17Cash inflows related to secured lending and investments, etc.
15,790,776 1,429,714 14,852,485 1,229,494
18 Cash inflows related to collections of loans, etc 11,389,660 7,802,354 10,643,373 7,384,31819 Other cash inflows 8,311,483 2,253,862 6,885,131 2,093,84120 Total cash inflows 35,491,920 11,485,932 32,380,991 10,707,654Consolidated liquidity coverage ratio (4) / /
21Total HQLA allowed to be included in the calculation
/ 60,112,726 / 60,243,374
22 Net cash outflows / ¥43,816,756 / ¥41,800,05823 Consolidated liquidity coverage ratio / 137.3% / 144.1%
24The number of data used to calculate the average value
58 62
324
Liquidity Coverage Ratio
Basel Regulatory DisclosuresStatus of Sound Management of Liquidity Risk
2020/09/07 16:50:34 / 20635245_株式会社みずほフィナンシャルグループ_総会その他(C)
(2) Disclosure of qualitative information regarding Liquidity Coverage Ratio
(A) Chronological changes in Liquidity Coverage RatioOur Consolidated LCR has remained stable over the past two years.
(B) Evaluation of the consolidated Liquidity Coverage Ratio LevelOur Consolidated LCR surpasses the final regulatory standard (100%), with no issues. Our Consolidated LCR disclosed herein does not differ significantly from our original expectations, and we do not expect our Consolidated LCR to deviate significantly from the current level in the future.
(C) Composition of the total HQLA allowed to be included in the calculationThere are no significant changes in the composition, such as by currency or type, and geographic distribution of the HQLA allowed to be included in the calculation. In addition, there is no significant currency mismatch between total amount of the HQLA allowed to be included in the calculation and net cash outflow regarding main currencies (those currencies of which the aggregate liabilities denominated amount to 5% or more of our total liabilities).
(D) Other matters regarding the Liquidity Coverage RatioWe do not apply the "exception regarding qualifying operational deposits" in Article 28 of the Notice No. 62 and "the amount of additional collateral required due to market valuation changes to derivatives transactions estimated by the scenario approach" in Article 37 of the Notice No. 62. "Cash outflows from other contracts" in Article 59 of the Notice No. 62 incluedes "cash outflows related to small consolidated subsidiaries." There are no material items that require detailed explanation of "cash outflows from other contingent events" in Article 52 of the Notice No. 62 and "cash inflows from other contracts" in Article 72 of the Notice No. 62. Monthly or quarterly data is used for our consolidated subsidiaries.
325
Liquidity Coverage Ratio
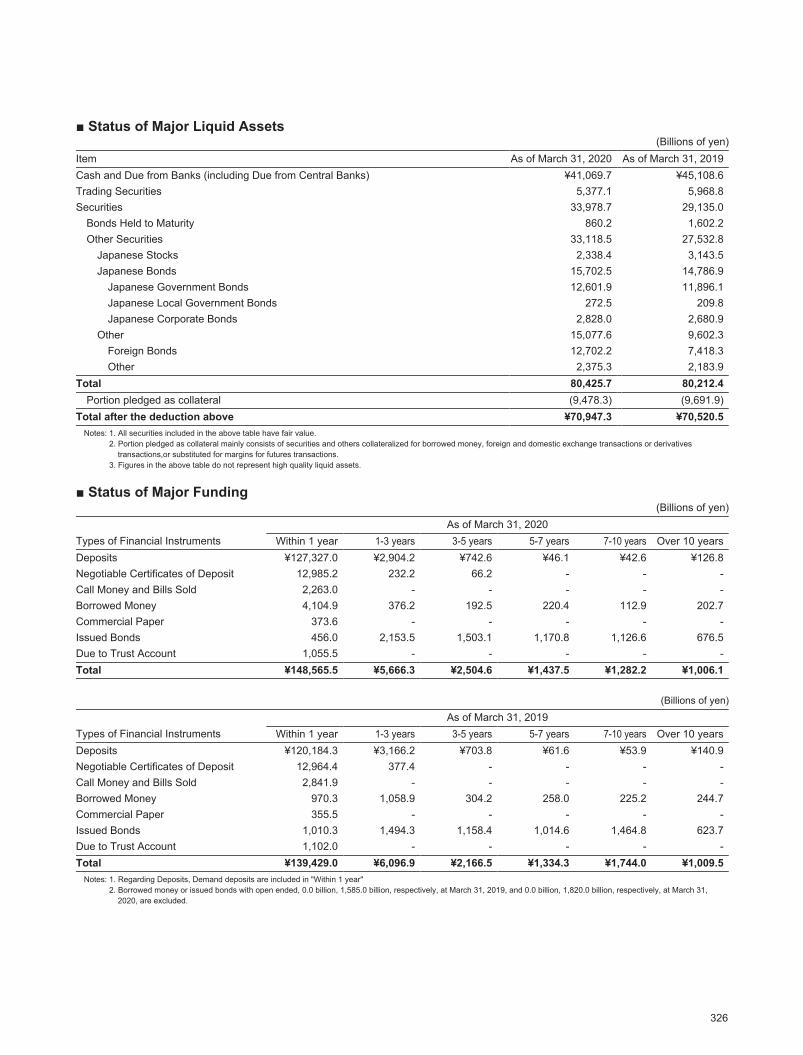
2020/09/07 16:50:34 / 20635245_株式会社みずほフィナンシャルグループ_総会その他(C)
■ Status of Major Liquid Assets(Billions of yen)
Item As of March 31, 2020 As of March 31, 2019Cash and Due from Banks (including Due from Central Banks) ¥41,069.7 ¥45,108.6Trading Securities 5,377.1 5,968.8Securities 33,978.7 29,135.0
Bonds Held to Maturity 860.2 1,602.2Other Securities 33,118.5 27,532.8
Japanese Stocks 2,338.4 3,143.5Japanese Bonds 15,702.5 14,786.9
Japanese Government Bonds 12,601.9 11,896.1Japanese Local Government Bonds 272.5 209.8Japanese Corporate Bonds 2,828.0 2,680.9
Other 15,077.6 9,602.3Foreign Bonds 12,702.2 7,418.3Other 2,375.3 2,183.9
Total 80,425.7 80,212.4Portion pledged as collateral (9,478.3) (9,691.9)
Total after the deduction above ¥70,947.3 ¥70,520.5Notes: 1. All securities included in the above table have fair value.
2. Portion pledged as collateral mainly consists of securities and others collateralized for borrowed money, foreign and domestic exchange transactions or derivatives transactions,or substituted for margins for futures transactions.
3. Figures in the above table do not represent high quality liquid assets.
■ Status of Major Funding(Billions of yen)
As of March 31, 2020Types of Financial Instruments Within 1 year 1-3 years 3-5 years 5-7 years 7-10 years Over 10 yearsDeposits ¥127,327.0 ¥2,904.2 ¥742.6 ¥46.1 ¥42.6 ¥126.8Negotiable Certificates of Deposit 12,985.2 232.2 66.2 - - -Call Money and Bills Sold 2,263.0 - - - - -Borrowed Money 4,104.9 376.2 192.5 220.4 112.9 202.7Commercial Paper 373.6 - - - - -Issued Bonds 456.0 2,153.5 1,503.1 1,170.8 1,126.6 676.5Due to Trust Account 1,055.5 - - - - -Total ¥148,565.5 ¥5,666.3 ¥2,504.6 ¥1,437.5 ¥1,282.2 ¥1,006.1
(Billions of yen)
As of March 31, 2019Types of Financial Instruments Within 1 year 1-3 years 3-5 years 5-7 years 7-10 years Over 10 yearsDeposits ¥120,184.3 ¥3,166.2 ¥703.8 ¥61.6 ¥53.9 ¥140.9Negotiable Certificates of Deposit 12,964.4 377.4 - - - -Call Money and Bills Sold 2,841.9 - - - - -Borrowed Money 970.3 1,058.9 304.2 258.0 225.2 244.7Commercial Paper 355.5 - - - - -Issued Bonds 1,010.3 1,494.3 1,158.4 1,014.6 1,464.8 623.7Due to Trust Account 1,102.0 - - - - -Total ¥139,429.0 ¥6,096.9 ¥2,166.5 ¥1,334.3 ¥1,744.0 ¥1,009.5
Notes: 1. Regarding Deposits, Demand deposits are included in "Within 1 year"2. Borrowed money or issued bonds with open ended, 0.0 billion, 1,585.0 billion, respectively, at March 31, 2019, and 0.0 billion, 1,820.0 billion, respectively, at March 31,
2020, are excluded.
326
Liquidity Coverage Ratio
Basel Regulatory DisclosuresCompensation of Directors and Employees
2020/09/07 16:50:34 / 20635245_株式会社みずほフィナンシャルグループ_総会その他(C)
■ Compensation of Directors and Employees
(1) Qualitative Disclosure
(A) State of the Organizational System Relating to Compensation of "Subject Directors and Employees" of Mizuho Group
1. Scope of "Subject directors and employees""Subject directors, etc." and "Subject employees, etc." subject to disclosure as provided for in the FSA Notice (collectively, "Subject directors and employees") are as follows:(1) Scope of "Subject directors, etc."
"Subject directors, etc." are directors and executive officers as defined in the Companies Act of Mizuho Financial Group, Inc. ("MHFG"). Outside directors are excluded.
(2) Scope of "Subject employees, etc.""Subject employees, etc." who are subject to disclosure are executive officers (as defined in our internal regulations), specialist officers and employees of MHFG and directors and employees of its "Major consolidated subsidiaries", who are "persons who receive large amounts of compensation" and "materially affect the operation of business or the state of assets of Mizuho group or its major consolidated subsidiaries."(a) Scope of "Major consolidated subsidiaries"
A "Major consolidated subsidiary" is a consolidated subsidiary, etc., (i) whose total assets as a percentage of consolidated total assets exceeds 2% of a bank holding company or bank and (ii) who materially affects the management of our group. Specifically, those are Mizuho Bank, Ltd. ("MHBK"), Mizuho Bank (USA) and other subsidiaries who conduct banking business similar to a branch of MHBK, Mizuho Trust & Banking Co., Ltd. ("MHTB"), Mizuho Securities Co., Ltd. ("MHSC"), Mizuho Securities USA Inc. and Mizuho International Plc.
(b) Scope of "Persons who receive large amounts of compensation"A "Person who receives large amounts of compensation" refers to a person who receives compensation that exceeds the base amount from MHFG or its "Major consolidated subsidiaries." The base amount at MHFG has been set at ¥60 million. Such base amount has been set based on the average amounts of the compensation of directors and executive officers (as defined in the Companies Act) of MHFG, MHBK and MHTB for the last three fiscal years (excluding persons who resigned or retired during each of such fiscal years), taking into account fluctuations in amounts of compensation over past fiscal years. The preceding base amount has been adopted as the common base in order to unify the selection criteria of persons who receive large amounts of compensation at each of the companies in this paragraph.
(c) Scope of "Persons who materially affect the operation of business or the state of assets of Mizuho group"A "Person who materially affects the operation of business or the state of assets of Mizuho group" means a person who exerts significant influence on the operation of the business of MHFG or a "Major consolidated subsidiary" through his or her work in conducting transactions or management, or who materially affects the state of assets by incurring losses on transactions. Specifically, it includes executive officers (as defined in our internal regulations) and specialist officers of MHFG and directors, executive officers (as defined in our internal regulations), specialist officers and market department employees of "Major consolidated subsidiaries."
2. Decisions on compensation of "Subject directors and employees" and the name, composition and duties of the committee to supervise business execution and other major organizations relating to payment of compensation and other compensation, etc.(1) State of maintaining and ensuring the Compensation Committee, etc.
MHFG is a Company with Three Committees, and has established the Compensation Committee as a statutory committee.The chairman of the statutory Compensation Committee shall be an outside director, and in principle its members shall be appointed from among the outside directors (or at least non-executive directors) in order to ensure objectivity and transparency in director and executive officer compensation. As of March 2020, all four members of the Compensation Committee, including the chairman, were outside directors. The Compensation Committee shall determine the basic policy and compensation system for directors and executive officers of MHFG, MHBK, MHTB and MHSC, determine the compensation for each individual director and executive officer (as defined in the Companies Act) of MHFG, and exercise approval rights in MHFG for compensation for each individual director of MHBK, MHTB and MHSC.In addition, the president of each of MHBK, MHTB and MHSC determines the amount of compensation for each of its executive officers and specialist officers.
327
Qualitative disclosure
2020/09/07 16:50:34 / 20635245_株式会社みずほフィナンシャルグループ_総会その他(C)
(2) Decisions on compensation of "Subject employees, etc."Matters relating to executive officers (as defined in our internal regulations) and specialist officers of MHFG and directors, executive officers (as defined in our internal regulations) and specialist officers of MHBK, MHTB and MHSC are as set out in (1) State of maintaining and ensuring the Compensation Committee, etc.. With regard to the compensation of directors of MHBK, MHTB and MHSC, it is determined through approval by the Compensation Committee, pursuant to each statutory procedure for directors who are Audit & Supervisory Committee Members and for directors who are not Audit & Supervisory Committee Members, and set within the scope of the total amount of compensation of directors resolved at the ordinary general meeting of shareholders.The compensation of subject employees, etc., is decided and paid in accordance with the salary and bonus system established by MHFG and the "Major consolidated subsidiaries." Such system is designed and put into writing by the human resources departments of MHFG and the "Major consolidated subsidiaries" which are independent of departments furthering business. In terms of the compensation of overseas employees, each overseas office or operation determines its own compensation policy based on local laws and regulations as well as employment relationships.
3. Total amount of compensation paid to members of the compensation committee and number of meetings held by the Compensation Committee
Number of meetings held(April 2019 – March 2020)
Compensation Committee (MHFG) 3
Note: The total amount of compensation is not set out above as it is not possible to separately calculate the amounts that are paid as consideration for the execution of duties by the compensation committee.
(B) Evaluating the Appropriateness of the Design and Operation of the System Relating to Compensation of "Subject Directors and Employees" of Mizuho Group
1. Policies relating to compensation(1) Policies relating to compensation of "Subject directors, etc. "
MHFG set out the “Mizuho Financial Group Compensation Policy” concerning the determination of compensation for each individual director, executive officer and specialist officer (“Officers, etc.”) of MHFG as well as MHBK, MHTB and MHSC (the “Three Core Companies”).
a. Philosophy and objectivesExecutive compensation for MHFG and the Three Core Companies pursuant to such policy is determined based on appropriate governance and control, and aims to function as incentive and compensation for each Officer, etc., to exercise their designated function to the fullest in our efforts to realize management that contributes to value creation for various stakeholders and improve corporate value through continuous and stable corporate growth based on our basic management policies under our Corporate Identity.
b. Basic PolicyThe basic policy with respect to the determination concerning the individual compensation of Officers, etc., of MHFG and the Three Core Companies is set forth below:
(i) The executive compensation shall be determined based on appropriate governance and control, and function as an appropriate incentive in order to realize management that contributes to value creation for various stakeholders and improve corporate value through continuous and stable corporate growth based on our basic management policies under our Corporate Philosophy.
(ii) The executive compensation shall be based on the function and responsibility assigned to and the performance of each Officer, etc.
(iii) The executive compensation shall contribute to suppressing excessive risk-taking, improving corporate value and creating value for various stakeholders not only in the short-term, but also over the medium- to long-term.
(iv) The executive compensation shall reflect the management environment and business performance of our group.(v) The executive compensation shall enable compensation for securing expert personnel such as professionals with
a competitive edge in the market.
328
Qualitative disclosure
Basel Regulatory DisclosuresCompensation of Directors and Employees
2020/09/07 16:50:34 / 20635245_株式会社みずほフィナンシャルグループ_総会その他(C)
(vi) The compensation system and standards shall be timely and appropriately reevaluated and set at a competitive and appropriate standard based on such factors as the economic and social conditions and survey data with respect to management compensation provided by external specialized organizations.
(vii) Regulations and guidelines, etc., concerning executive compensation, both in Japan and overseas, shall be complied with.
c. Compensation SystemI. Compensation for Officers, etc., shall, in principle, consist of a “Basic Salary,” “Performance Payment” and “Stock
Compensation.”(i) “Basic Salaries” shall factor in the function and responsibility of each Officer, etc., in addition to the standard
amount for each position and payment will be made monthly in cash.(ii) “Performance Payments” shall be made as a monetary incentive for Officers, etc., to achieve the annual budget
and as compensation for their achievement. The payment thereof shall reflect the results of organizations (our in-house companies and units, etc.) that each Officer, etc., is in charge of and the performance of each Officer, etc., in addition to the standard amount for each position. A system shall be adopted which, based on resolution by the Compensation Committee, etc., enables certain amount of deferred payments of the performance payments over three years, as well as a decrease or forfeiture of the deferred amount depending on performance, etc., of the company or the individual.
(iii) “Stock Compensation” shall be paid in the form of shares of common stock of MHFG consisting of “Stock Compensation I” and “Stock Compensation II,” (together “Stock Compensation I and II”) acquired from the stock market through a trust with an aim to align the interests of Officers, etc., with those of the shareholders and increase the incentive to enhance corporate value.
(a) “Stock Compensation I” shall be paid at the time of retirement of each Officer, etc., in the form of shares of common stock of MHFG calculated based on each position. A system shall be adopted which enables a decrease or forfeiture of the amount by resolution of the Compensation Committee, etc., depending on performance of the company or the individual.
(b) “Stock Compensation II” shall be paid in accordance with the status of achieving our 5-Year Business Plan in addition to the standard amount for each position. A system shall be adopted which enables the entire amount of deferred payments over three years, as well as a decrease or forfeiture of the deferred amount by resolution of the Compensation Committee, etc., depending on performance of the company or the individual.
II. Within the Officers, etc., the compensation system for the executive officers as defined in the Companies Act, the directors, the executive officers as defined in our internal regulations and the specialist officers responsible for business execution (the "Officers Responsible for Business Execution") shall be separate from the compensation system for the directors responsible for management supervision ("Non-Executive Officers Responsible for Management Supervision").
(i) The basic compensation system for "Officers Responsible for Business Execution" shall be a “Basic Salary,” “Performance Payment” and “Stock Compensation I and II.”
(a)The composition of the compensation shall, in principle, be 50%, 17.5% and 32.5% for “Basic Salary,” “Performance Payment” and “Stock Compensation I and II” respectively.
(b) “Performance Payment” shall be paid, in principle, within the range of 0% to 170% of the standard amount for each position.
(c) “Stock Compensation II” shall be paid, in principle, within the range of 0% to 130% of the standard amount for each position.
(ii) The compensation for Non-Executive Officers Responsible for Management Supervision, in principle, shall be in the form of fixed compensation from the perspective of ensuring the effectiveness of the supervisory function. The compensation system shall consist of “Basic Salaries” and “Stock Compensation” and the composition shall, in principle, be 85% and 15% for “Basic Salaries” and “Stock Compensation,” respectively.
329
Qualitative disclosure

2020/09/07 16:50:34 / 20635245_株式会社みずほフィナンシャルグループ_総会その他(C)
III. There are cases where compensation for some personnel, including those officers recruited locally in countries other than Japan, may be designed individually in compliance with local compensation regulations while taking into consideration local compensation practices and the responsibilities, business characteristics and market value, etc., of each respective officer.For cases where compensation is designed individually, payment of compensation is also made in accordance with the performance of the company or the individual. Payment of compensation is designed to avoid excessive risk-taking through a system which enables certain amount or a portion of deferred payments and non-monetary payments such as stock, as well as a decrease or forfeiture of the deferred amount depending on the performance, etc., of the company or the individual.
d. Compensation Determination ProcessI. The Compensation Committee shall determine the determination policy of executive compensation for MHFG and
the Three Core Companies and the executive compensation system including the compensation system set out in “Compensation System” in order to effectively secure the transparency and objectivity of compensation, etc., for individual Officers, etc. In addition, the Compensation Committee shall determine the compensation for each individual director and executive officer, as defined in the Companies Act, of MHFG and approve at MHFG the compensation of each individual director of the Three Core Companies.
II. The President & CEO, pursuant to this policy and regulations and detailed rules, etc., shall determine the compensation for each executive officer, as defined in our internal regulations, and specialist officer of MHFG and approve at the MHFG the compensation of each individual executive officer and specialist officer of the Three Core Companies.
III. The Compensation Committee will verify the validity of the compensation system and standards based on economic and social conditions and survey data with respect to management compensation provided by external specialized organizations.
IV. All members of the Compensation Committee shall be appointed from among outside directors (or at least non-executive directors) and the Chairman thereof shall be an outside director.
V. The Compensation Committee may have officers who are not members of the committee (including officers of the Three Core Companies) such as the President & CEO and external experts, etc., attend its meetings and provide their opinion in order to facilitate adequate and appropriate discussions and determinations.
(2) Policies relating to compensation of "Subject employees, etc."The policies relating to compensation for executive officers (as defined in our internal regulations) and specialist officers of MHFG and directors, executive officers (as defined in our internal regulations) and specialist officers of MHBK, MHTB and MHSC are also the same as the policies described in (1) Policies relating to compensation of "Subject directors, etc." above. Compensation for other employees, etc., is determined in accordance with their duties and responsibilities. Some bonuses that are linked to performance are determined after comprehensively evaluating the employee’s contribution to business, including any qualitative contributions to the organization, in a manner that does not place an excessive emphasis on results.
2. The effect of the overall level of compensation, etc., on equity capitalThe Compensation Committee of MHFG receives reports on the amount of compensation paid to directors, executive officers (as defined in the Companies Act), executive officers (as defined in our internal regulations) and specialist officers of MHFG, MHBK, MHTB and MHSC in the previous fiscal year and confirms that there is no material effect on the Mizuho group’s performance or the adequacy of equity capital.
330
Qualitative disclosure
Basel Regulatory DisclosuresCompensation of Directors and Employees
2020/09/07 16:50:34 / 20635245_株式会社みずほフィナンシャルグループ_総会その他(C)
(C) Compatibility between System for Compensation of "Subject Directors and Employees" of Mizuho Group and Risk Management and Matters Relating to Linking Compensation with Performance
1. Compatibility between system for compensation of "Subject directors and employees" and risk managementThe compensation of employees in risk management department, compliance department and internal audit department is decided in accordance with the salary and bonus system, and specific payment amounts are conclusively determined in accordance with employee performance evaluations made by the relevant department and the human resources department, independent from departments furthering business.Each employee of the risk management department, the compliance department and the internal audit department sets their own objectives in the employee performance evaluations, subject to the approval of their superiors. The degree to which the objectives are achieved is evaluated by taking into account the degree of the employee's contribution to the establishment of a system for risk management, compliance and internal audit.
2.Linking compensation of "Subject directors and employees" with performanceThe performance payments and performance-based stock compensation for "Officers Responsible for Business Execution" shall be made or paid in accordance with each officer’s performance, the result of organizations (our in-house companies and units, etc.) that each Officer, etc., in charge of, and the status of achieving our 5-Year Business Plan etc., against the annual business plan in addition to the standard amount of each positon. A certain amount of the performance payments and the entire amount of the performance-based stock compensation shall be made or paid in deferred payments over three years, and a decrease or forfeiture of the deferred amount may be made depending on the performance, etc., of the company and such officer. It should be noted that certain "Subject directors and employees" have entered into compensation-related contracts. Stock compensation for "Non-Executive Officers Responsible for Management Supervision" shall be made in accordance with the standard amount set for each position, and the payment level shall not change based on the performance of each officer. With regard to compensation for other employees, salary is determined according to their job duties and responsibilities. In addition, the proportion linked to the performance bonus is determined through appropriately and comprehensively evaluating the contribution to performance, including the degree of contribution to the organization, etc., so as not to become excessively performance based.
331
Qualitative disclosure
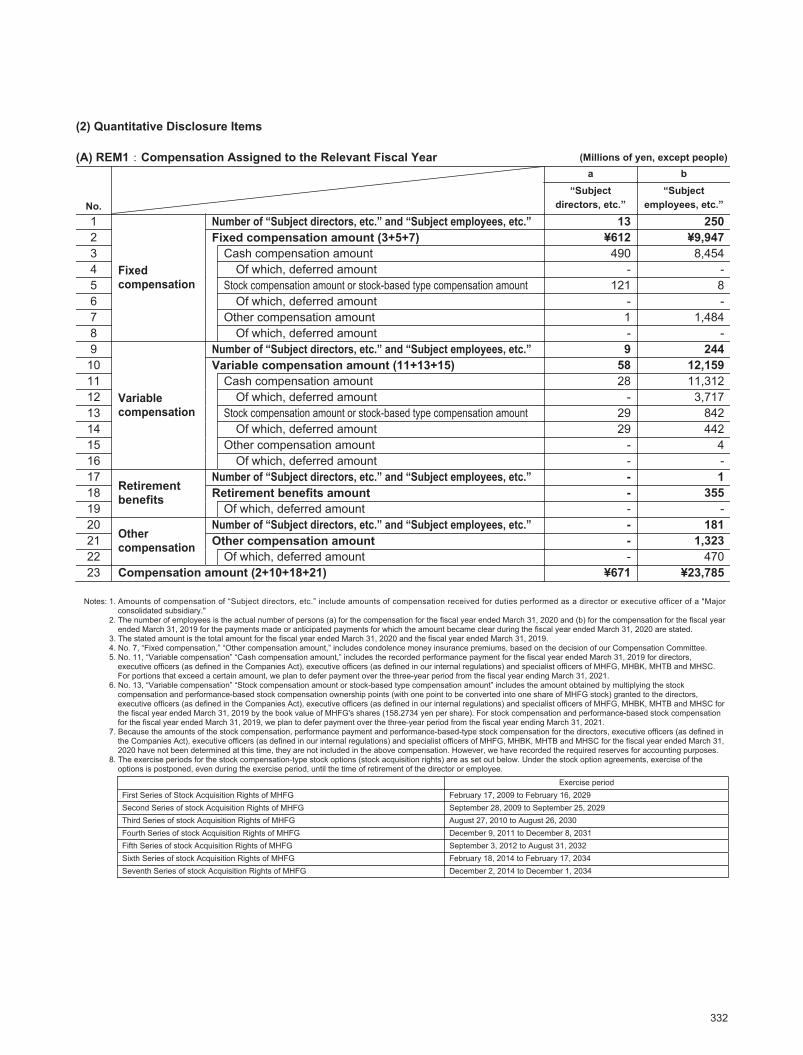
2020/09/07 16:50:34 / 20635245_株式会社みずほフィナンシャルグループ_総会その他(C)
(2) Quantitative Disclosure Items
(A) REM1:Compensation Assigned to the Relevant Fiscal Year (Millions of yen, except people)
No.
a b“Subject
directors, etc.”“Subject
employees, etc.”
1
Fixed compensation
Number of “Subject directors, etc.” and “Subject employees, etc.” 13 2502 Fixed compensation amount (3+5+7) ¥612 ¥9,9473 Cash compensation amount 490 8,4544 Of which, deferred amount - -5 Stock compensation amount or stock-based type compensation amount 121 86 Of which, deferred amount - -7 Other compensation amount 1 1,4848 Of which, deferred amount - -9
Variable compensation
Number of “Subject directors, etc.” and “Subject employees, etc.” 9 24410 Variable compensation amount (11+13+15) 58 12,15911 Cash compensation amount 28 11,31212 Of which, deferred amount - 3,71713 Stock compensation amount or stock-based type compensation amount 29 84214 Of which, deferred amount 29 44215 Other compensation amount - 416 Of which, deferred amount - -17
Retirementbenefits
Number of “Subject directors, etc.” and “Subject employees, etc.” - 118 Retirement benefits amount - 35519 Of which, deferred amount - -20
Other compensation
Number of “Subject directors, etc.” and “Subject employees, etc.” - 18121 Other compensation amount - 1,32322 Of which, deferred amount - 47023 Compensation amount (2+10+18+21) ¥671 ¥23,785
Notes: 1. Amounts of compensation of “Subject directors, etc.” include amounts of compensation received for duties performed as a director or executive officer of a "Major consolidated subsidiary."
2. The number of employees is the actual number of persons (a) for the compensation for the fiscal year ended March 31, 2020 and (b) for the compensation for the fiscal year ended March 31, 2019 for the payments made or anticipated payments for which the amount became clear during the fiscal year ended March 31, 2020 are stated.
3. The stated amount is the total amount for the fiscal year ended March 31, 2020 and the fiscal year ended March 31, 2019.4. No. 7, “Fixed compensation,” “Other compensation amount,” includes condolence money insurance premiums, based on the decision of our Compensation Committee.5. No. 11, “Variable compensation” “Cash compensation amount,” includes the recorded performance payment for the fiscal year ended March 31, 2019 for directors,
executive officers (as defined in the Companies Act), executive officers (as defined in our internal regulations) and specialist officers of MHFG, MHBK, MHTB and MHSC. For portions that exceed a certain amount, we plan to defer payment over the three-year period from the fiscal year ending March 31, 2021.
6. No. 13, “Variable compensation” “Stock compensation amount or stock-based type compensation amount” includes the amount obtained by multiplying the stock compensation and performance-based stock compensation ownership points (with one point to be converted into one share of MHFG stock) granted to the directors, executive officers (as defined in the Companies Act), executive officers (as defined in our internal regulations) and specialist officers of MHFG, MHBK, MHTB and MHSC for the fiscal year ended March 31, 2019 by the book value of MHFG's shares (158.2734 yen per share). For stock compensation and performance-based stock compensation for the fiscal year ended March 31, 2019, we plan to defer payment over the three-year period from the fiscal year ending March 31, 2021.
7. Because the amounts of the stock compensation, performance payment and performance-based-type stock compensation for the directors, executive officers (as defined in the Companies Act), executive officers (as defined in our internal regulations) and specialist officers of MHFG, MHBK, MHTB and MHSC for the fiscal year ended March 31, 2020 have not been determined at this time, they are not included in the above compensation. However, we have recorded the required reserves for accounting purposes.
8. The exercise periods for the stock compensation-type stock options (stock acquisition rights) are as set out below. Under the stock option agreements, exercise of the options is postponed, even during the exercise period, until the time of retirement of the director or employee.
Exercise periodFirst Series of Stock Acquisition Rights of MHFG February 17, 2009 to February 16, 2029Second Series of stock Acquisition Rights of MHFG September 28, 2009 to September 25, 2029Third Series of stock Acquisition Rights of MHFG August 27, 2010 to August 26, 2030Fourth Series of stock Acquisition Rights of MHFG December 9, 2011 to December 8, 2031Fifth Series of stock Acquisition Rights of MHFG September 3, 2012 to August 31, 2032Sixth Series of stock Acquisition Rights of MHFG February 18, 2014 to February 17, 2034Seventh Series of stock Acquisition Rights of MHFG December 2, 2014 to December 1, 2034
332
Quantitative Disclosure Items

Basel Regulatory DisclosuresCompensation of Directors and Employees
2020/09/07 16:50:34 / 20635245_株式会社みずほフィナンシャルグループ_総会その他(C)
(B) REM2:Special Compensation (Millions of yen, except people)a b c d e f
Bonus guaranteesLump sum payments
at the time of recruitmentAdditional retirement benefits
People JPY People JPY People JPY“Subject directors, etc.” - - - - - -“Subject employees, etc.” - ¥- 1 ¥470 24 ¥1,388
(C) REM3:Deferred Compensation (Millions of yen)a b c d e
Deferred compensation
amount
Of which, the deferred
compensation amount subject to adjustment or
variation
Regarding compensation
after allocation, variable amounts adjusted but not
linked to variations for the
relevant fiscal year
Regarding compensation
after allocation, variable amounts
adjusted and linked to
variations for the relevant fiscal
year
Amount of deferred
compensation paid in the
relavent fiscal year
“Subject directors,
etc.”
Cash compensation amount
¥1 ¥1 ¥- ¥- ¥1
Stock compensation amount or stock-based type compensation amount
212 135 - (59) 76
Other compensation amount
- - - - -
“Subject employees,
etc.”
Cash compensation amount
6,015 187 50 - 2,506
Stock compensation amount or stock-based type compensation amount
888 175 50 (0) 233
Other compensation amount
- - - - -
Total amount ¥7,118 ¥501 ¥100 ¥(60) ¥2,818
(D) Other Relevant Matters Relating to Our System of Compensation for "Subject Directors and Employees" of Mizuho Group
Not applicable, other than those covered in the above.
333
Quantitative Disclosure Items
1. Basic principlesWe are committed to growing together with our customers in a stable and sustainable manner and bringing together our group-wide expertise to contribute to the prosperity of economies and societies throughout the world as the leading Japanese financial services group with a global presence and a broad customer base. For this reason, we place one of the highest management priorities on continuing to disclose information to our customers, shareholders, and investors both in and outside Japan in a fair, timely and appropriate manner, in order that they may form proper judgments and appraisals of the group. To achieve this aim, we observe applicable domestic and international laws and regulations as well as stock exchange rules relating to corporate disclosure, and we establish and implement appropriate Disclosure Controls and Procedures.
2. Disclosure Controls and Procedures(1) Establishment and implementation of Disclosure Controls
and ProceduresOur Disclosure Controls and Procedures are established to observe applicable domestic and international laws and regulations as well as stock exchange rules and to implement fair, timely and appropriate corporate disclosure. The Disclosure Controls and Procedures are the process carried out by directors, officers and employees of Mizuho Financial Group and include Internal Controls over Financial Reporting designed to provide reasonable assurance regarding the reliability of Financial Reporting and the Preparation of Financial Statements. We have established the basic principles underlying our Disclosure Controls and Procedures as well as our internal rules related to Disclosure Controls and Procedures that govern the management framework for the entire Mizuho Financial Group including group companies, and we endeavor to establish, implement and continuously improve our Disclosure Controls and Procedures. Our Disclosure Committee is the Business Policy Committee that is responsible for discussing and coordinating matters relating to Disclosure Controls and Procedures.
(2) Evaluation of effectiveness of Disclosure Controls and ProceduresOur Disclosure Controls and Procedures are documented, and evaluation of the overall effectiveness of our Disclosure Controls and Procedures is conducted regularly by reviewing the contents of such documentation and their implementation. In addition, evaluation of the effectiveness and appropriateness of Disclosure Controls and Procedures is conducted through internal audits.
(3) OthersWe established a “Code of Ethics for Financial Professionals” to be observed by all directors and executive officers, as well as all managers and other employees within Mizuho Financial Group who engage in financial reporting, accounting or disclosure. We have also developed the “internal control and audit hotline”, a system designed for reporting questionable accounting, internal control, or auditing matters from both inside and outside Mizuho Financial Group.
3. Disclosure methods, other(1) Disclosure methods
With respect to the information which is required to be disclosed pursuant to applicable domestic and international
laws and regulations as well as stock exchange rules, we follow the defined disclosure procedures such as publishing such information in business reports (Jigyo–Hokoku), annual securities reports (Yukashoken–Hokokusho), Integrated Report (Annual Review) and other disclosure publications, as well as providing such information through the information distribution systems of domestic and international stock exchanges and through press releases. We also endeavor to disclose other information in a fair, timely and appropriate manner. When we disclose such information, we basically publish on our website the information we disclose. In addition, we endeavor to utilize the latest disclosure methods and tools to provide more fair and widespread disclosure.
(2) Investor relations activitiesInvestor relations activities to market participants both in and outside Japan such as shareholders, investors and securities analysts are conducted by the President & Group CEO, Group CFO, Chief IR Officer, and executives and employees designated by them. In accordance with our basic principles described in section 1 above, and with due attention to two–way communication, we endeavor sincerely to facilitate a proper understanding of our management strategies, financial condition and other matters. In this way, we aim to earn the trust of the market and obtain an appropriate market reputation.
Beginning with the disclosure required by applicable domestic and international laws and regulations as well as stock exchange rules, we endeavor to grasp properly the types of information desired by the market and to disclose useful and appropriate information voluntarily and proactively, in accordance with the so-called Fair Disclosure Rule (“FDR”). Regarding disclosure of information we consider particularly important, we communicate such information on an ad hoc basis as and when necessary, even if a press release has already been issued, through such means as special briefing sessions.
In addition, we respect various disclosure principles including fair disclosure. Accordingly, at individual calls, private meetings or conferences hosted or attended by representatives of Mizuho Financial Group we endeavor to limit carefully our explanations to matters already disclosed and facts commonly known.
Should we happen to disclose important information such as information subject to insider trading regulations and/or undisclosed financial results that might have a significant influence on stock prices, we endeavor to take necessary action such as officially announcing the information as soon as possible, in accordance with FDR.
(3) Correction of misconceptions in the marketsIf we identify significant misconceptions regarding Mizuho Financial Group in the market due to the spread of rumors or otherwise, we endeavor to investigate their causes and correct such misconceptions promptly.
Disclosure Policy
3342020 Integrated Report

Mizu
ho
Finan
cial Gro
up
| Integ
rated R
epo
rt 2020
Mizuho Financial Group, Inc.1-5-5, Otemachi, Chiyoda-ku, Tokyo 100-8176, Japan
www.mizuho-fg.com
This PDF version of the Integrated Report is a digital version of the Forest Stewardship Council (FSC)-certified published version, which is printed on FSC-certified paper.