

Integrated PET/MRI - AMOS Onlineamos3.aapm.org/abstracts/pdf/77-22654-312436-101917.pdf · scanner...
71
Transcript of Integrated PET/MRI - AMOS Onlineamos3.aapm.org/abstracts/pdf/77-22654-312436-101917.pdf · scanner...

Outline
PET/MRI:
Brief history and current state-of-the-art
Methodological advances enabling new
science:
What MR can do for PET
What PET can do for MR
Potential research and clinical
applications

Representative paths in tissue of a 2 MeV electron
(Raylman et al. Int J Rad Onc Biol Phys, 1997; 37(5))
“Physics” motivation for simultaneous PET/MRI -
positron range error reduction in magnetic fields
e+
e+ e–
511 KEV
PHOTON
511 KEV
PHOTON
ANNIHILATION
ERROR
DUE TO
POSITRON
RANGE
q – particle charge; V – positron velocity; B –
magnetic field; Et – component of the positron
kinetic energy (MeV) perpendicular to the
magnetic field;
mp – rest mass of the positron
2 ) 2 (
334 . 0 t t p E E m
B R + =
= B x V q F Lor
*In-plane PET scanner spatial
resolution might improve at high
magnetic fields (i.e. B>7T), for high
energy positron emitters (i.e. 82Rb,
Et=3.15 MeV) if it is not dominated by
other factors (i.e. crystal size, non-
colinearity, etc.)

PET effects on the MR:
No ferromagnetic components allowed;
Disturb homogeneity of the B0 field;
RF interference with the MR Tx/Rx coils;
Susceptibility artifacts and eddy currents. …
MR effects on the PET:
PMTs very sensitive to magnetic fields;
RFI, heating, vibrations, etc. …
General considerations:
Space constraints inside the MR;
Cost !
Integrating PET and MRI does not mean placing
an existing PET scanner inside an MR scanner.

Integrated PET/MR scanners have been
developed for small animal and human imaging.
(Wehrl HF, Judenhofer MS, Wiehr S, Pichler BJ,
Eur J Nucl Med Mol Imaging 36 (Suppl 1): S56-58; 2009, updated)
2011

PET-MR(-CT) Scanners Available for Human Use
GE PET/CT Patient Transport GE MR
Philips Ingenuity TF PET/MR Siemens Biograph mMR
Outline
Integrated PET/MRI:
Brief history and current state-of-the-art
Methodological advances enabling new
science:
What MR can do for PET
What PET can do for MR
Potential research and clinical
applications

What MR can do for PET
0.E+00
1.E-03
2.E-03
3.E-03
4.E-03
5.E-03
6.E-03
0 200 400 600Time (sec)
Counts (a.u.)
3. Partial volume effects corr.
2. Motion correction
4. Arterial input function estimation
1. Attenuation correction

Annihilation photons can interact with the
subject before reaching the detectors.
2 1
x
μ )(
2
xDep = xep =1
DxDx
coinc eeeppp === )(
21.
DeCorrAtten =..
xeIxI = )0()(
Uniform cylinder before and after AC (Ø=20 cm, µ=0.096 cm-1)
x D

10
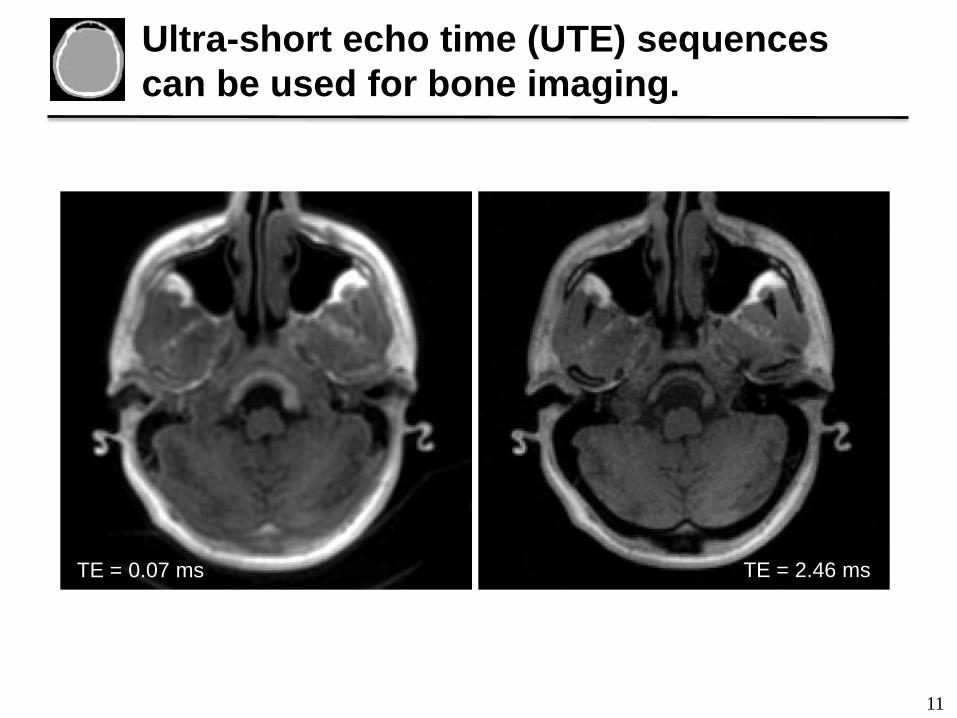
Estimating the tissue linear attenuation
correction factors from MR is difficult.
A number of factors have to be considered for implementing an accurate
MR-based attenuation correction method.
Separating the bone from air-filled cavities is the most challenging task using
conventional MR sequences.
MR Scaled CT Segmented CT
11
TE = 2.46 ms TE = 0.07 ms
Ultra-short echo time (UTE) sequences
can be used for bone imaging.

12
MR-based PET attenuation correction
using DUTE data
ATTENUATION MAPS
CTsegmented (top) and DUTEsegmented
(bottom)
RECONSTRUCTED PET IMAGES
Attenuation correction factors derived from the
CTsegmented (top) and DUTEsegmented (bottom).
(C. Catana et al, J Nucl Med, 2010)
13
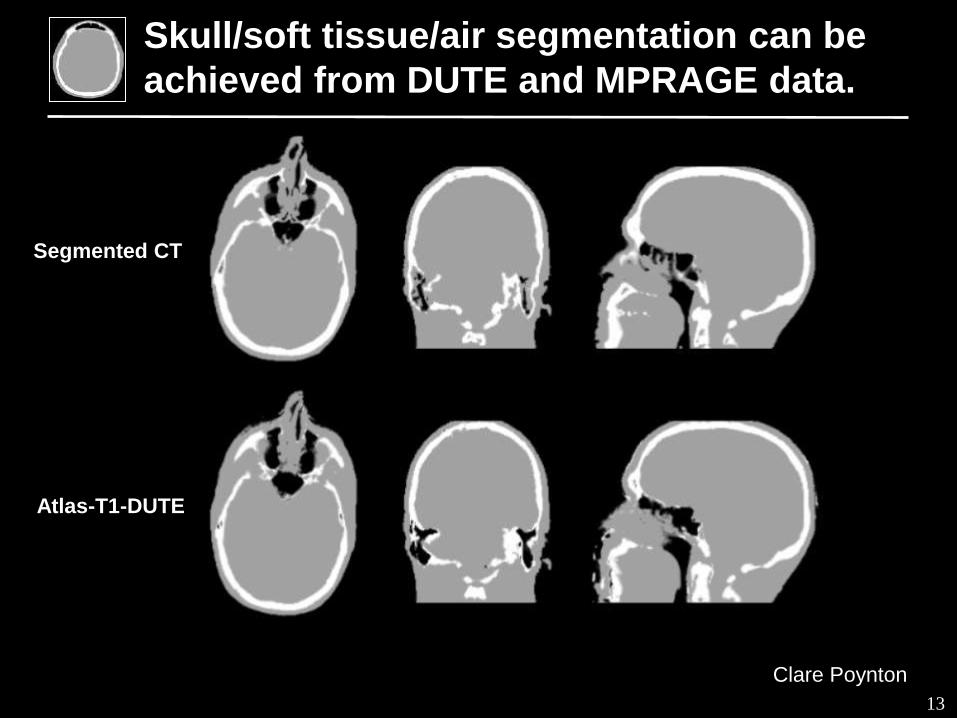
Skull/soft tissue/air segmentation can be
achieved from DUTE and MPRAGE data.
Segmented CT
Atlas-T1-DUTE
Clare Poynton

14
Atlas-based methods allow generation of
continuous-valued attenuation maps.
MPRAGE
David Izquierdo

15
The attenuation caused by the RF coils has to
be accounted for in an integrated scanner.
1.E+01
1.E+02
1.E+03
1.E+04
1.E+05
1.E+06
-60 -50 -40 -30 -20 -10 0 10 20Relative change (%)
no coil 3 mm X3 mm Y 3 deg Z
-5
5
-50
50
3 mm trans.
along Y axis
3°rot.
about Z axis
3 mm trans.
along X axis
Coil attenuation
ignored
Relative change images and histograms
BrainPET
gantry
Patient
table
RF coil
BrainPET prototype inside the 3T MR
scanner (MGH installation)

16
Motion is difficult to avoid in long PET
studies.
Spatial resolution “loss”
image blurring/artifacts;
attenuation/emission data mismatch;
inaccurate quantification.

17
Various motion correction approaches have
been investigated for neuroPET studies.
1. Eliminate head motion
2. Inter-frame correction
3. Event-by-event correction

18 MR before and after MC
( Andre J.W. van der Kouwe et al, Magnetic
Resonance in Medicine 2006; 56: 1019-1032 )
Navigators introduced in standard MR sequences
provide high temporal resolution motion estimates.

19
Motion correction algorithm for dynamic studies
on the BrainPET prototype.
(C. Catana et al, JNM, 2011)

20
MR-derived motion estimates can be used
to retrospectively correct the PET data.
• Healthy volunteer;
• ~5 mCi 18FDG;
• Simultaneous MR-PET study;
• PET MC applied in LOR space.
PET data before (left) and after (right) MR-assisted motion correction
(C. Catana et al, JNM, 2011)
Motion estimates derived from EPI
MR series every 3 seconds

In and out pressure
from ventilator
Gel with
background activity
Inflatable balloon
Hot spheres attached to balloon (10mm diameter)
Vent
Methods: Phantom Study in PET-MR
PET External
trigger
MR
“Beating Phantom”
Phantom
Guerin and El Fakhri, Med Phys 2011

Methods: Tagged MR
GRE sequence GRE sequence with tagging
Tagging patterns provide additional motion information.
Courtesy G. El Fakhri, MIPI, MGH

Phantom Results: Reconstruction
Sphere 2:
Diameter 10mm
Resolution 2mm each
Max motion ~3.0mm
(small motion) MR motion corrected
Uncorrected Gated 90
0
C=1.2
σ=19%
C=1.7
σ=48%
C=2.0
σ=20%
Chun, El Fakhri, JNM 2011

• Motion Correction with Primate in simultaneous PET-MR
Gated tagged MR Gated PET
Primate Results
Chun, El Fakhri, JNM 2011
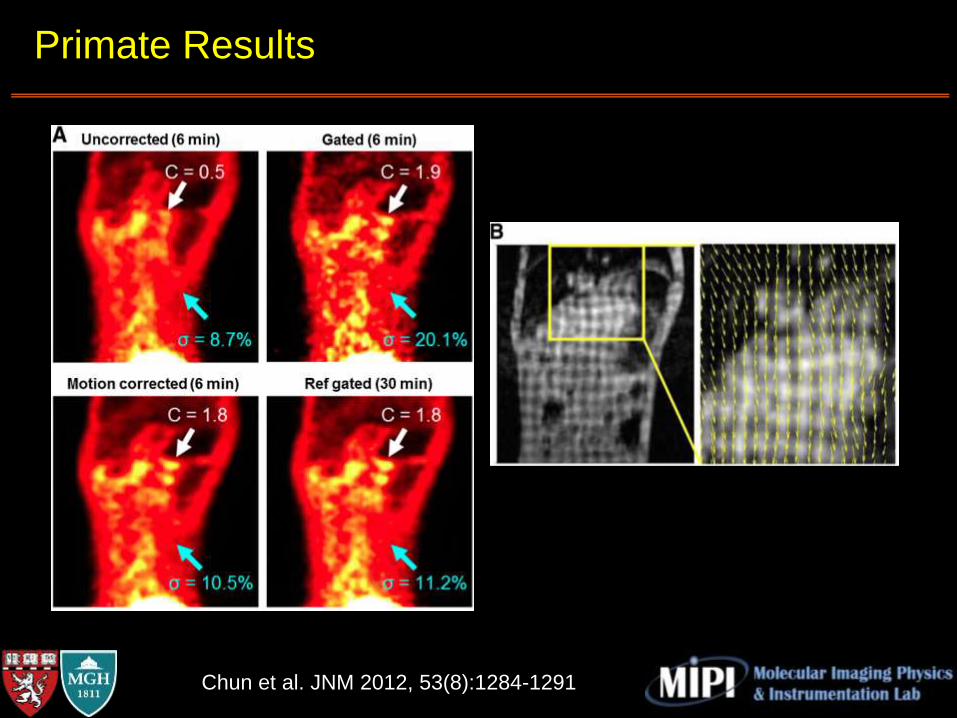
Primate Results
Chun et al. JNM 2012, 53(8):1284-1291

26
Partial volume effects (PVE) affect PET
data quantification.
0
10
20
30
40
50
60
70
80
90
100
original 3 mm 5 mm 7 mm
To account for PVEs, information about the size of the structures of interest and
the spatially variant point spread function of the PET scanner is needed.

27
The high resolution morphological MRI
data can be used for PET PVE correction.
Automated brain structures segmentation from the MPRAGE data.

28
The high resolution morphological MRI
data can be used for PET PVE correction.
Morphological MR (ME-MPRAGE)
Original PET
Recovery coefficients
PET after regional PVE correction
Spencer Bowen, MGH

29
Dynamic PET frames
FDG AIF
The non-invasive estimation of the radiotracer
input function can be improved using MR data. 0.E+00
1.E-03
2.E-03
3.E-03
4.E-03
5.E-03
6.E-03
0 200 400 600Time (sec)
Counts (a.u.)
50 100 150 200 250
50
100
150
200
250
50 100 150 200 250
20
40
60
80
100
120
140
TOF MR
ME-MPRAGE
Daniel Chonde, MGH
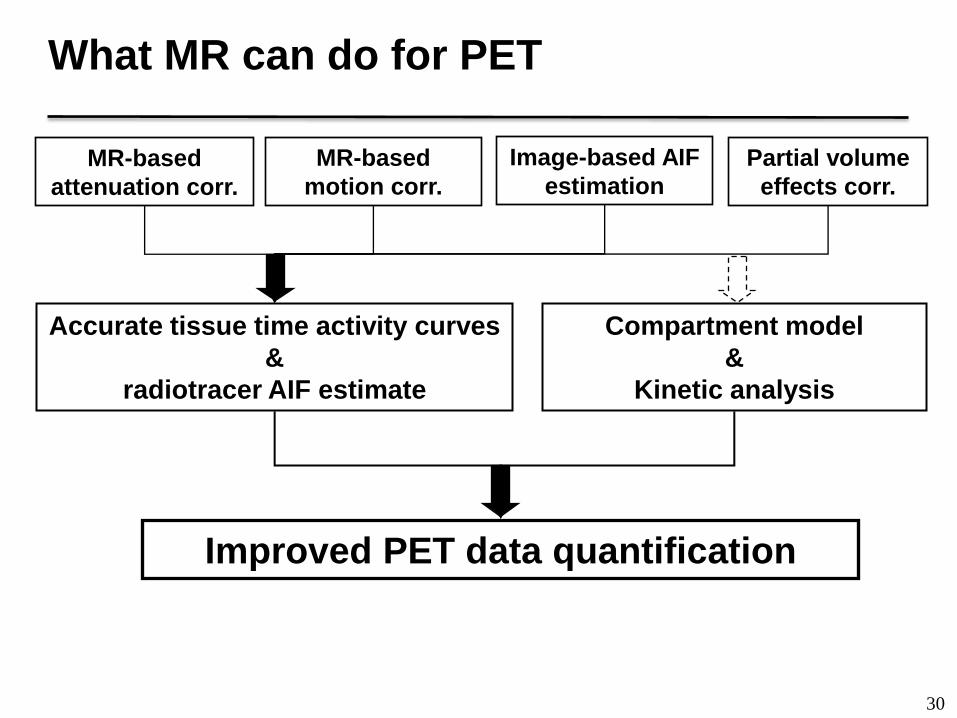
30
MR-based
attenuation corr.
Compartment model
&
Kinetic analysis
Accurate tissue time activity curves
&
radiotracer AIF estimate
Improved PET data quantification
Partial volume
effects corr.
MR-based
motion corr.
Image-based AIF
estimation
What MR can do for PET
31
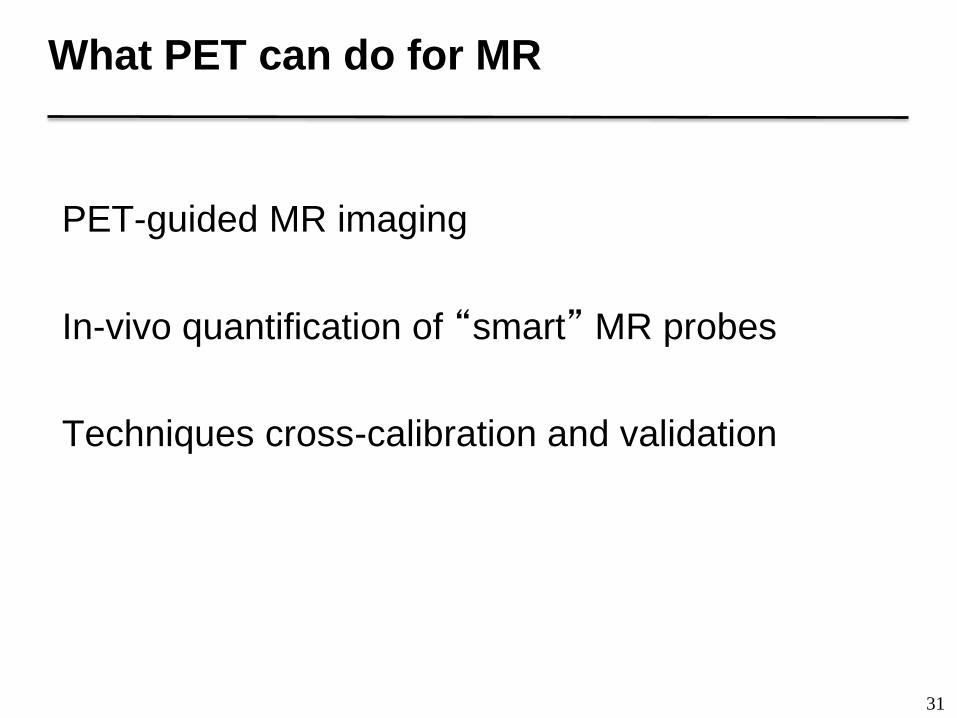
What PET can do for MR
PET-guided MR imaging
In-vivo quantification of “smart” MR probes
Techniques cross-calibration and validation

32
Fibrin Targeted Gd-based Contrast Agent
Fibrin-
specific
Peptide
Bis Gd
chelate
Bis Gd
chelate Linker
Improved fibrin affinity. High relaxivity: 4 Gd + protein binding.
No metabolism issues. Minimal Gd retention.
N H
H N
N H
H N
N H
H N
N H
O
O
O
O
O
O
O H N
O
N
O
N H
O
O N H
S
O H
S
O O N H 2 O
C l
O H
H N
O H
O H
O H N
H N N H
O
H N
N H
N N
N N
O
O
O
O
O
O
O
O G d
O H 2
N N
N N
O
O
O
O
O O
O
O
G d O H 2
O
O
N N
N N
O
O
O
O
O O
O
O
G d O H 2
O
N N
N N
O
O
O
O
O
O
O
O G d
O H 2
O
E P - 2 1 0 4 R
N a 5
Overoye-Chan et al., J Am Chem Soc 2008, 130:6025-39

33
A B C
Image pre contrast
agent
Image post contrast
agent Arterial anatomy
(Ritika Uppal, Ilknur Ay, Peter Caravan)
Embolic Stroke Model

34
Fibrin-targeted MR-PET Probe
Focused MR study
Whole-body PET “screening”
High sensitivity PET can guide the high
resolution MR study.
Uppal, Caravan, Radiology, 2011;258(3):812-20
Cu
Gd Gd
Gd
Peptide

35
Relaxivity is sensitive to many molecular factors
that can be modulated to induce an MR signal.
Enzyme activation change property of contrast agent
(Louie, Meade et al, Nature Biotech, 2000)
A) GFP mRNA injection in R; B) EgadMe, β-gal injection in
R; C) β-gal staining

36
pH-responsive “smart” MR probe
(Kalman, Sherry, Caravan et al, Inorg Chem 2007, 46,5260;
Ali, Sherry, Caravan et al, Chem Eur J 2008, 14:7250-8)
Low pH: more exchangeable protons (blue)
proton exchange rate ideal
High pH: fewer exchangeable protons (blue)
proton exchange too fast

37
The MR signal depends on both relaxivity and
contrast agent concentration.
0
1
1
1
1][
1
TGdr
T+=
contrast agent
concentration
relaxivity
Two unknowns, one measurement

38
Responsiv
e P
robe
Quantification
MR
PET
Dual
probe
(L. Frullano, C. Catana, T. Benner, A. Sherry, P.
Caravan. Angew. Chem. Int. Ed. 2010; 49:2382-4)
pH (electrode)
pH
(M
R-P
ET
) y = 1.01x
R2 = 0.95
6
6.5
7
7.5
8
6 6.5 7 7.5 8
A “smart” dual-modal MR-PET agent can
quantitatively and non-invasively measure pH.

39
Cross-validate PET and MRI cerebral perfusion
measurements.
[O15]H2O PET and steady-state ASL MR
(F.Q.Ye et al. MRM 2000; 44:450-456)
(Y Ozsunar and AG Sorensen et al;
Topics in MRI 2000; 11(5): 259-272)
Bolus tracking technique
(L Ostergaard. JMRI 2005, 22:710-7)
Arterial spin labeling technique
40
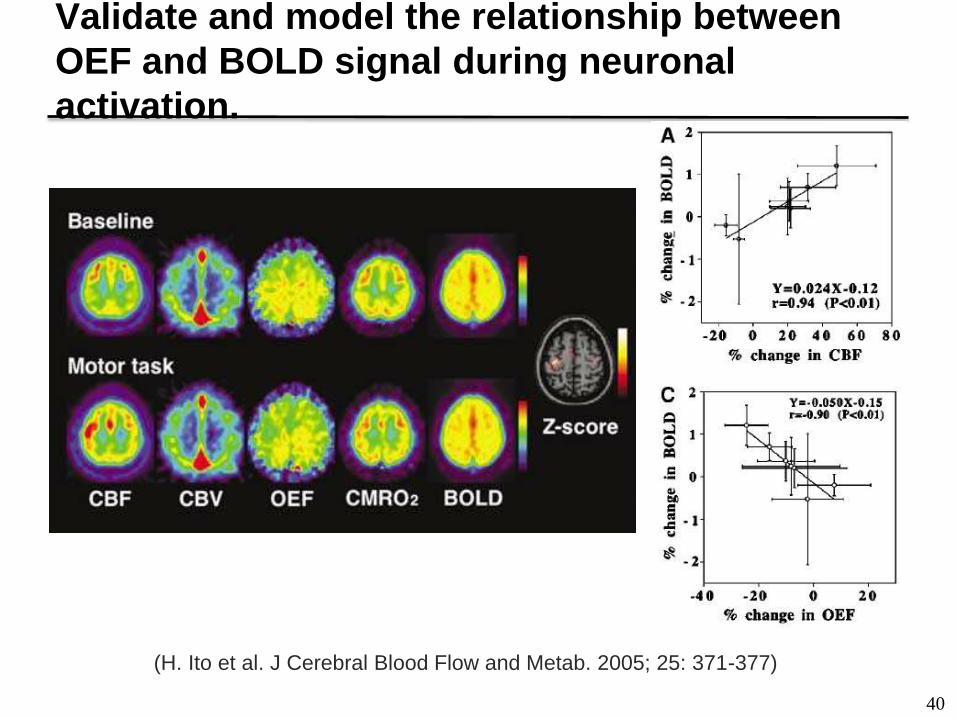
Validate and model the relationship between
OEF and BOLD signal during neuronal
activation.
(H. Ito et al. J Cerebral Blood Flow and Metab. 2005; 25: 371-377)
41
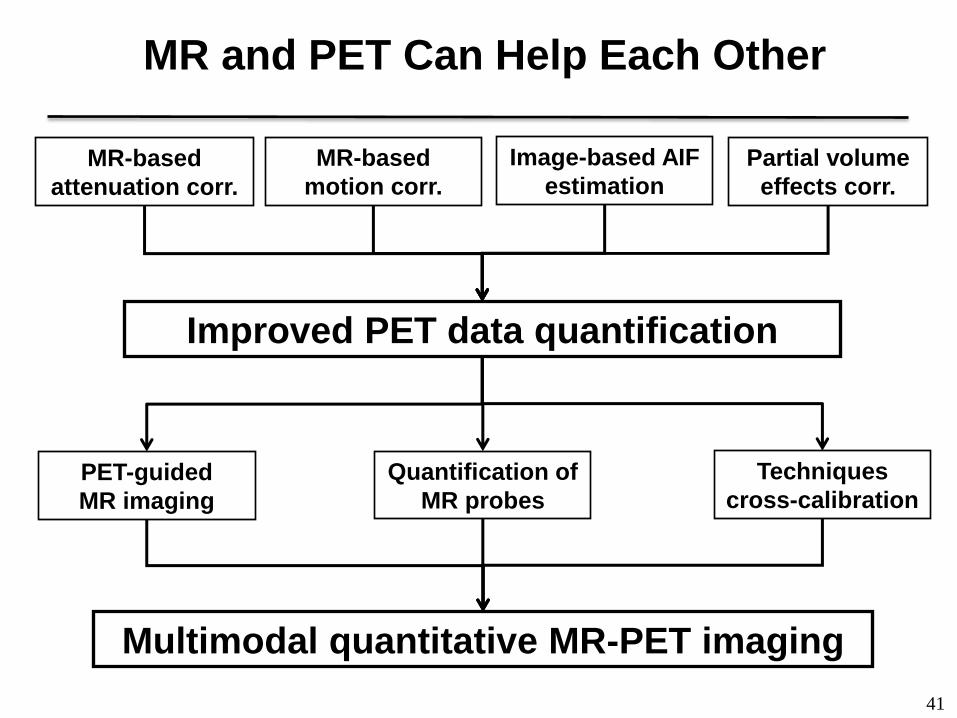
MR-based
attenuation corr.
Improved PET data quantification
Partial volume
effects corr.
MR-based
motion corr.
Image-based AIF
estimation
MR and PET Can Help Each Other
PET-guided
MR imaging
Quantification of
MR probes
Techniques
cross-calibration
Multimodal quantitative MR-PET imaging

42
Automated Data Processing and Analysis
Dan Chonde, MGH
43
Outline
Integrated PET/MRI:
Brief history and current state-of-the-art
Methodological advances enabling new
science:
What MR can do for PET
What PET can do for MR
Potential research and clinical
applications

Potential Applications
How can MR-PET …
1) increase diagnostic accuracy?
2) improve patient experience?
3) advance scientific discovery?
How can MR-PET …
1) increase diagnostic accuracy?
oncology, cardiology, neurology
2) improve patient experience?
3) advance scientific discovery?

Most frequent site of
metastases*
PET/MRI is relevant for (favorable to PET/CT) …
Tumor entity Brain Lung Liver Bone Staging
category
Special objective/prognostic factor
Head and neck SCC − + − + T Extracapsular spread; bone infiltration
Non-small cell lung
cancer
+ + + + M Distant metastases
Breast cancer + + + + T/M Primary diagnosis and T-stage (benefit compared with
PET/CT; potential benefit over MRI mammography alone
is questionable); distant metastases
HCC − + + + T Pretransplantation evaluation
Colorectal
carcinoma
− + + − T/M Circumferential resection margin; liver metastases; tumor
regression rate to neoadjuvant therapy
Soft-tissue sarcoma − + + − T/M Tumor size and depth of infiltration defines T category;
muscular, neurovascular, and bone invasion
Primary bone
tumors
− + −
− T Presurgical evaluation (e.g., neurovascular invasion);
exact tumor size and response to neoadjuvant treatment
Melanoma + + + + M Exact number and location of metastases for presurgical
evaluation
Lymphoma M Extranodal dissemination; early therapy response
assessment
“Indications in which PET/MRI may be favorable
over PET/CT, depending on tumor entity”
*Frequency of metastatic spread (frequently [+], rare [−]) is according to AJCC Cancer Staging Manual, seventh edition; PET/CT and
PET/MRI are considered equally accurate for N-staging, and thus importance of N-staging is not discussed.
C. Buchbender et al. Oncologic PET/MRI, Part 1 & 2. JNM 2012; 53: 928-938 &1244-1252

Head & Neck MR-PET
More precise metabolic-anatomic allocation of the FDG-avid lesion
FDG-PET/CT
FDG-PET/MR
C. Buchbender et al.
J Nucl Med 2012; 53:928-
938
54-y-old man with
gingival SCC arising
from maxilla

Spencer Bowen, MGH
Accurate spatial registration
MRscan 1 PETscan 1 Fused MRscan 1-PETscan 1
MRscan 2 Fused MRscan 2-PETscan 1
Breast MR-PET

Liver PET/CT + MRI
P. Veit-Haibach, F.P. Kuhn, F. Wiesinger, G. Dalso and G. van Schulthess.
Magn Reson Mater Phy (2013) 26: 25-35
Increased lesion conspicuity

Pelvis MR-PET
DWI MRI
T1-weighted post-contrast MRI FDG PET PET/MRI fusion
ADC map
Collaboration with A. Guimaraes, MGH
Improved soft tissue discrimination and functional information
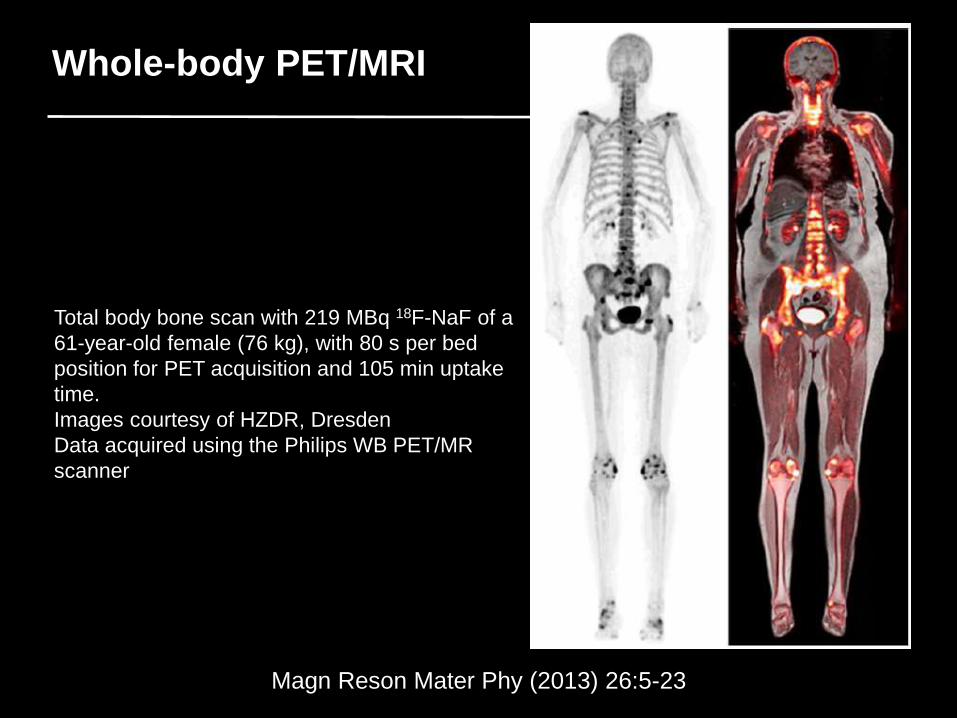
Whole-body PET/MRI
Total body bone scan with 219 MBq 18F-NaF of a
61-year-old female (76 kg), with 80 s per bed
position for PET acquisition and 105 min uptake
time.
Images courtesy of HZDR, Dresden
Data acquired using the Philips WB PET/MR
scanner
Magn Reson Mater Phy (2013) 26:5-23

“Advantageous Features of Combined PET/MR
with Focus on Cardiac Applications”
C. Rischpler, S.G. Nekolla, I. Dregely and M. Schwaiger. Hybrid PET/MR Imaging of the
Heart: Potential, Initial Experiences, and Future Prospects. JNM 2013; 54:402-415

52
Myocardial Perfusion MR-PET Study
13NH3
PET
Gd-DTPA
MR
Fused
MR-PET
C. Rischpler, S.G. Nekolla, I. Dregely and M. Schwaiger. Hybrid PET/MR Imaging of the
Heart: Potential, Initial Experiences, and Future Prospects. JNM 2013; 54:402-415
53
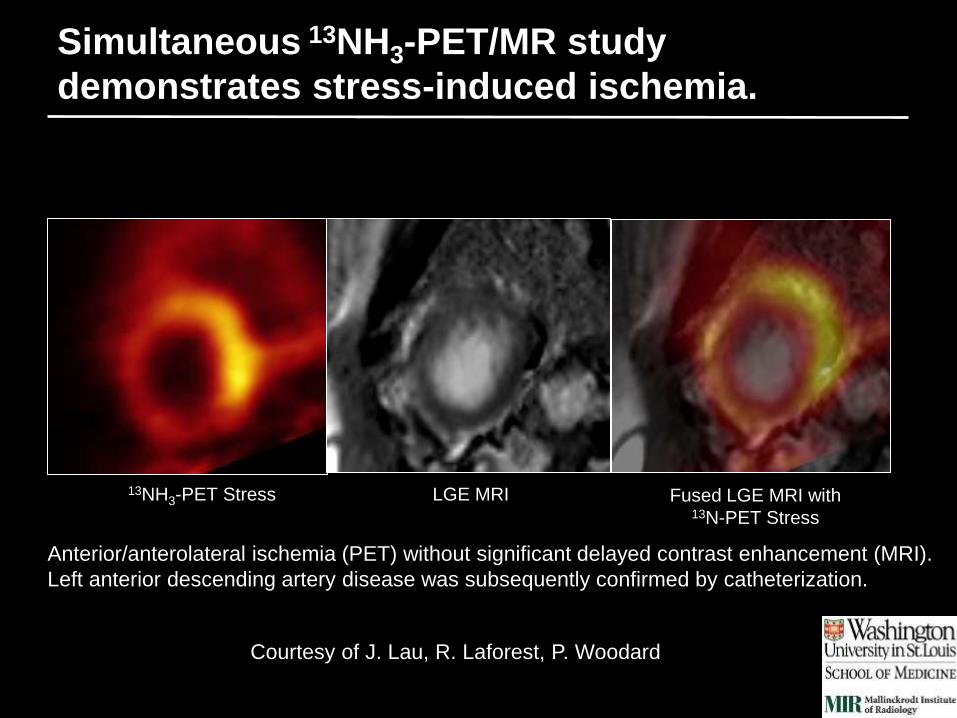
Simultaneous 13NH3-PET/MR study
demonstrates stress-induced ischemia.
13NH3-PET Stress LGE MRI Fused LGE MRI with 13N-PET Stress
Anterior/anterolateral ischemia (PET) without significant delayed contrast enhancement (MRI).
Left anterior descending artery disease was subsequently confirmed by catheterization.
Courtesy of J. Lau, R. Laforest, P. Woodard

54
Simultaneous FDG-PET and DCE MR study
allows myocardial viability assessment.
MR FDG-PET Fused PET/MR Cine
Delayed contrast enhancement MR and FDG-PET images acquired in diastole.
Fused cine created from the PET list mode data binned into 8 phases fused with
simultaneously acquired free-breathing real time SSFP cardiac cine.
[J. Lau, R. Laforest, S. Sharma, J. McConathy, A. Priatna,
L. Amado, R. Gropler, P. Woodard. ISMRM 2013, Oral: #0573]

Potential Benefits
How can MR-PET …
1) increase diagnostic accuracy?
2) improve patient experience?
3) advance scientific discovery?

MR-PET can improve patient experience
• Two exams in one session:
– Increased patient compliance
– Reduced need for sedation/anesthesia in pediatric
patients
– One pharmacological challenge for two exams
• Reduced radiation exposure:
– Pediatric patients, women of childbearing age,
chronic patients
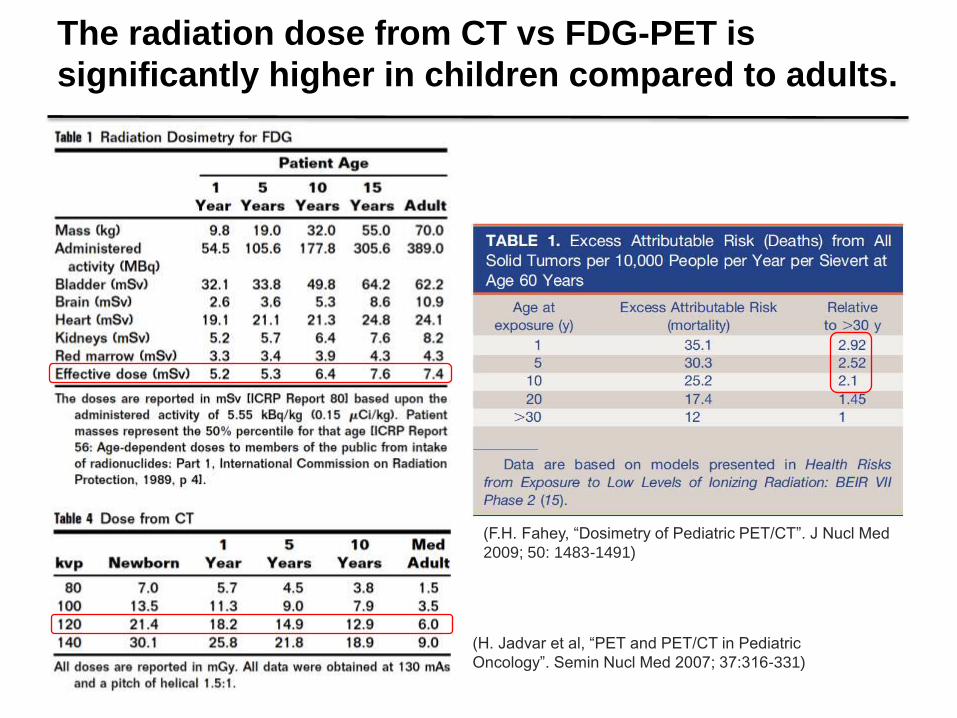
The radiation dose from CT vs FDG-PET is
significantly higher in children compared to adults.
(F.H. Fahey, “Dosimetry of Pediatric PET/CT”. J Nucl Med
2009; 50: 1483-1491)
(H. Jadvar et al, “PET and PET/CT in Pediatric
Oncology”. Semin Nucl Med 2007; 37:316-331)


F.W. Hirsch, B. Sattler et al. University of Leipzig
15-yo boy with left testicular tumor with retroperitoneal,
supraclavicular, hepatic and lung metastases

Potential Benefits
How can MR-PET …
1) increase diagnostic accuracy?
2) improve patient experience?
3) advance scientific discovery?

61
Simultaneous MR-PET opens new opportunities
for studying the brain.
(Figure from “Imaging of the Human Brain in Health and Disease”, J.E. Johnson ed.)

Neuropsychiatric conditions contribute the most to the overall
burden of non-communicable disease, more than either
cardiovascular disease or cancer.
Prince M et al. No health without mental health. Lancet 2007; 370(9590): 859-77
Contribution by different non-communicable diseases to DALYs worldwide in 2005
DALY – disability-adjusted life-year (sum of the years lived with disability and years of life lost)

PET and MRI provide complementary information about
the brain.
Hemodynamic parameters:
cerebral blood flow (H215O, 15O-
butanol, 13NH3,…), cerebral blood volume (11CO)
Substrate metabolism:
glucose (18F-FDG), oxygen (15O2)
Protein synthesis: 11C-methionine, 11C-leucine, 11C-
tyrosine
Amino acid transport: 18F-fluoroethyltyrosine, 18F-
fluorophenylalanine,…
Nucleosides and DNA synthesis: 18F-fluorothymidine,…
Neurotransmitter biochemistry:
precursors (18F-FDOPA, 11C-AMT,…), transporters (11C-methylphenidate, 11C-cocaine,…), receptors (11C-raclopride, 11C-nicotine, 18F-altanserin,…), enzyme activity (11C-deprenyl, 11C-donepezil,…)
…
Anatomy:
high resolution morphology,
angiography
Perfusion:
cerebral blood flow and blood volume,
mean transit time, time to peak,
relative vessel size and permeability,…
Water diffusion:
mean diffusivity, fractional anisotropy,
apparent diffusion coefficient, fiber
orientation
Brain function:
BOLD contrast, PWI
Chemical composition:
1H-MRS (NAA, Cr, Cho, Lac, mI) , 31P-
MRS
…
PET RADIOTRACERS MR TECHNIQUES


65
Surface projections
show areas with
reduced metabolism
Collaboration with
Brad Dickerson,
Alexander Drzezga
MR-PET allows the assessment of
anatomical/functional/molecular changes in
dementia.
FDG
PET
MPRAGE
Fused
MR-PET
DTI
C. Catana et al. “PET and MR Imaging: The odd couple or a match
made in heaven?” JNM 2013; 54:1-10

66
MR-PET could help us understand the mechanism
of action of therapeutic agents in GBM patients.
[18F]FDG [18F]FMISO [18F]FLT [18F]FET
PET
MRI
Fused
MRI-PET
(C. Catana et al. “PET/MRI for Neurological Applications”. JNM 2012; 53:1916-1925 )

67 Sobesky et al Stroke 2005; 36: 980-985
Cross-calibration measures could elucidate the
mismatch-penumbra debate in ischemic stroke patients.
68
0.0 0.1 0.2 0.3 0.4-0.1
0.0
0.1
0.2
0.3
ΔBPND
ΔB
OLD
(%
Sig
nal C
hanges)
r = 0.96
p = 0.001
Thalamus (L)
-0.4 -0.2 0.0 0.2 0.4 0.6-0.1
0.0
0.1
0.2
0.3
ΔBPND
ΔB
OLD
(%
Sig
nal C
hanges)
r = -0.28
p = 0.5
Putamen/NAc (R) (b)
(a)
2.3
3
Z
fMR
I
PE
T
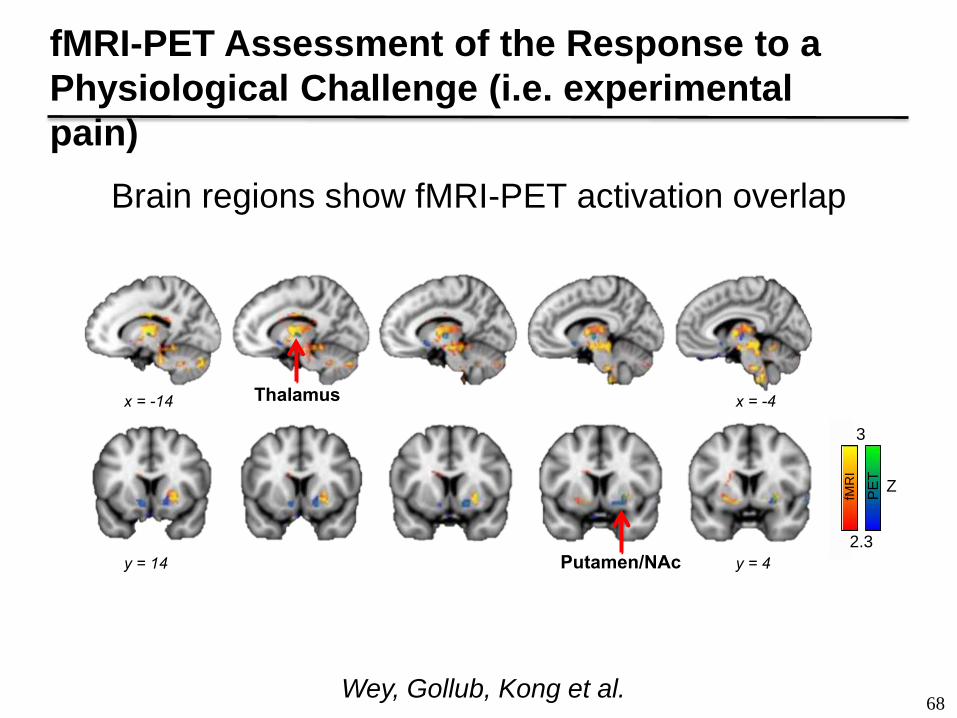
Thalamus
Putamen/NAc
x = -14 x = -4
y = 14 y = 4 0.0 0.1 0.2 0.3 0.4
-0.1
0.0
0.1
0.2
0.3
ΔBPND
ΔB
OLD
(%
Sig
nal C
hanges)
r = 0.96
p = 0.001
Thalamus (L)
-0.4 -0.2 0.0 0.2 0.4 0.6-0.1
0.0
0.1
0.2
0.3
ΔBPND
ΔB
OLD
(%
Sig
nal C
hanges)
r = -0.28
p = 0.5
Putamen/NAc (R) (b)
(a)
2.3
3
Z
fMR
I
PE
T
Thalamus
Putamen/NAc
x = -14 x = -4
y = 14 y = 4
Wey, Gollub, Kong et al.
fMRI-PET Assessment of the Response to a
Physiological Challenge (i.e. experimental
pain)
Brain regions show fMRI-PET activation overlap

FDG-PET/MRI Study of Dexmedetomidine
Sedation
pASL-MRI
Seun Akeju, MGH
FDG-PET
Baseline
After sedation
Baseline
After sedation

70
71
Acknowledgements
Massachusetts General Hospital
Bruce Rosen
Daniel Chonde, Spencer Bowen, Kevin Chen, David Izquierdo
Jacob Hooker, Grae Arabasz, Shirley Hsu, Steve Carlin, Chris
Moseley
Alexander Guimaraes, Andre van der Kouwe, Elizabeth
Gerstner, Tracy Batchelor, Peter Caravan, Larry Wald, Brad
Dickerson, Alexander Drzezga, Jian Kong, Randy Gollub,
Darin Dougherty, Monica Wey, Joe Mandeville, Christin
Sander, …
Siemens Healthcare
Greg Sorensen
Larry Byars, Christian Michel, Matthias Schmand, …
Keith Heberlein, Michael Hamm, Thomas Benner, Matthias
Fenchel, …
University of California Davis
Simon Cherry (PhD advisor)


![Multimodal analysis using [11C]PiB-PET/MRI for functional ...](https://static.fdocuments.in/doc/165x107/61ff326588a357094244a349/multimodal-analysis-using-11cpib-petmri-for-functional-.jpg)


