Integrated Multimodal Transportation Dashboard · Integrated Multimodal Transportation Dashboard 2...
125
FACULDADE DE E NGENHARIA DA UNIVERSIDADE DO P ORTO Integrated Multimodal Transportation Dashboard Ana Zaiat Mestrado Integrado em Engenharia Informática e Computação Supervisor: Rosaldo J. F. Rossetti (PhD) July 28, 2014
Transcript of Integrated Multimodal Transportation Dashboard · Integrated Multimodal Transportation Dashboard 2...
FACULDADE DE ENGENHARIA DA UNIVERSIDADE DO PORTO
Integrated Multimodal TransportationDashboard
Ana Zaiat
Mestrado Integrado em Engenharia Informática e Computação
Supervisor: Rosaldo J. F. Rossetti (PhD)
July 28, 2014


Integrated Multimodal Transportation Dashboard
Ana Zaiat2
Mestrado Integrado em Engenharia Informática e Computação
Approved in oral examination by the committee:4
Chair: Doctor Carlos Manuel Milheiro de Oliveira Pinto Soares (Prof. Associado)
External Examiner: Doctor Artur José Carneiro Pereira (Prof. Auxiliar, Universidade deAveiro)
Supervisor: Doctor Rosaldo José Fernandes Rossetti (Prof. Auxiliar)
July 28, 20146

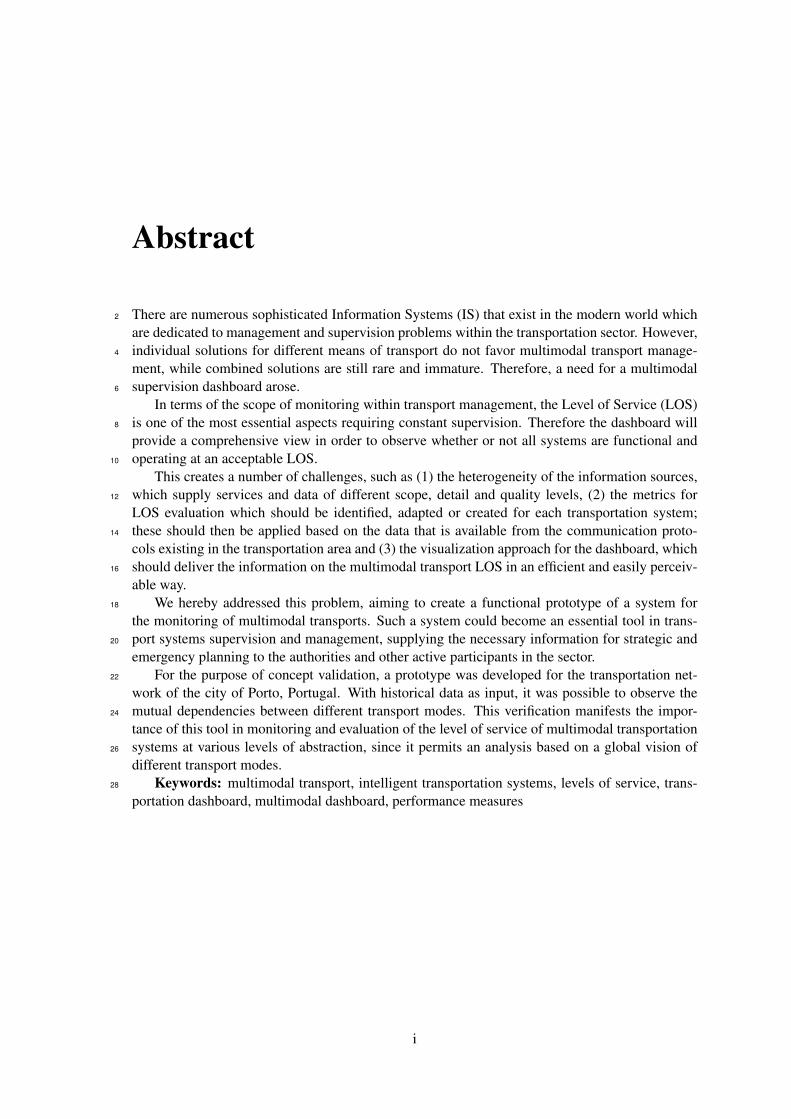
Abstract
There are numerous sophisticated Information Systems (IS) that exist in the modern world which2
are dedicated to management and supervision problems within the transportation sector. However,individual solutions for different means of transport do not favor multimodal transport manage-4
ment, while combined solutions are still rare and immature. Therefore, a need for a multimodalsupervision dashboard arose.6
In terms of the scope of monitoring within transport management, the Level of Service (LOS)is one of the most essential aspects requiring constant supervision. Therefore the dashboard will8
provide a comprehensive view in order to observe whether or not all systems are functional andoperating at an acceptable LOS.10
This creates a number of challenges, such as (1) the heterogeneity of the information sources,which supply services and data of different scope, detail and quality levels, (2) the metrics for12
LOS evaluation which should be identified, adapted or created for each transportation system;these should then be applied based on the data that is available from the communication proto-14
cols existing in the transportation area and (3) the visualization approach for the dashboard, whichshould deliver the information on the multimodal transport LOS in an efficient and easily perceiv-16
able way.We hereby addressed this problem, aiming to create a functional prototype of a system for18
the monitoring of multimodal transports. Such a system could become an essential tool in trans-port systems supervision and management, supplying the necessary information for strategic and20
emergency planning to the authorities and other active participants in the sector.For the purpose of concept validation, a prototype was developed for the transportation net-22
work of the city of Porto, Portugal. With historical data as input, it was possible to observe themutual dependencies between different transport modes. This verification manifests the impor-24
tance of this tool in monitoring and evaluation of the level of service of multimodal transportationsystems at various levels of abstraction, since it permits an analysis based on a global vision of26
different transport modes.Keywords: multimodal transport, intelligent transportation systems, levels of service, trans-28
portation dashboard, multimodal dashboard, performance measures
i

ii

Resumo
Titulo: Painel Integrado de Monitorização de Transportes Multimodais2
Atualmente, existem vários sistemas de informação sofisticados focados na resolução de prob-lemas de gestão e supervisão na área de sistemas de transportes. No entanto, a maioria destas4
soluções aborda individualmente cada um dos diferentes meios de transporte, o que não favorecea geração de políticas e mecanismos integrados de gestão de transporte multimodal. Para além6
disto, apesar de existirem algumas soluções combinadas, estas são raras e ainda bastante imaturas.Surge, assim, a necessidade de um painel de monitorização multimodal.8
Em relação aos parâmetros de monitorização no âmbito de gestão de transportes, o nível deserviço é um dos aspectos essenciais, que necessita de supervisão permanente. Portanto, o painel10
de monitorização deve fornecer uma visão geral de modo a se poder observar se todos os sistemasestão funcionais e a operar a um nível de serviço aceitável.12
Isso inclui uma série de desafios, tais como (1) a heterogeneidade das fontes de informação,que fornecem serviços e dados de alcance diferente e com níveis de qualidade e detalhes variáveis,14
(2) as métricas para a avaliação do nível de serviço, que devem ser identificadas, adaptadas oucriadas para cada sistema de transportes, devendo ser aplicadas com base nos dados que estão16
disponíveis a partir dos protocolos de comunicação existentes na area de transportes. Por último,(3) a abordagem a utilizar para o painel de visualização, que deve fornecer a informação sobre os18
niveis de serviço de transportes multimodais de forma eficiente e facilmente compreensível.Deste modo, o problema foi abordado tendo como objetivo a elaboração dum protótipo fun-20
cional de um sistema para monitorização de transportes multimodais. Tal sistema pode servircomo uma ferramenta essencial na supervisão e gestão de sistemas de transportes, fornecendo as22
informações necessárias para o planeamento estratégico e de emergência para as autoridades eoutros participantes ativos no setor.24
Para a validação de conceito, um protótipo foi desenvolvido para a rede de transportes dacidade do Porto, Portugal. Com os dados históricos como dados de entrada, foi possível observar26
as dependências mútuas entre os diferentes modos de transporte. Esta verificação demonstrou aimportância desta ferramenta na monitorização e avaliação do nível de serviço dos sistemas de28
transportes multimodais em vários níveis de abstração, visto que permite uma análise a partir deuma visão global dos diferentes modos de transporte.30
Palavras-chave: transportes multimodais, sistemas inteligentes de transportes, níveis de serviço,painel de monitorização de transportes, painel de monitorização multimodal, medidas de desem-32
penho
iii

iv
Acknowledgements
In the first place, I would like to express my deepest gratitude to my supervisor, Professor Rosaldo2
Rossetti, for his support, ideas and inspiring guidance throughout the project.I’m very thankful to Ricardo Coelho, my supervisor at Armis company, whose support and4
experience contributed significantly to the success of the project.Guilherme Soares and José Macedo, Armis, deserve special thanks for the help that they pro-6
vided. Guilherme is the author of the graphical interface framework that was integrated in thesolution.8
I would also like to thank Manuel João and Carlos Costa, Armis, for supporting the idea ofthis project and agreeing to its realization in a collaboration with Armis.10
I express my sincere gratitude to Daniel Moura, a research assistant on the Future Citiesproject, who has provided the information collected for the Future Cities project on urban bas12
service availability for the result analysis included in the paper.And, of course, deepest thanks to my family for their support during the project.14
Ana Zaiat
v

vi

“The limits of the possiblecan only be defined2
by going beyond them into the impossible.”
Arthur C. Clarke4
vii

viii
Contents
1 Introduction 11.1 Context . . . . . . . . . . . . . . . . . . . . . . . . . . . . . . . . . . . . . . . 11.2 Motivation and Goals . . . . . . . . . . . . . . . . . . . . . . . . . . . . . . . . 21.3 Thesis Structure . . . . . . . . . . . . . . . . . . . . . . . . . . . . . . . . . . . 4
2 Literature Review 52.1 Introduction . . . . . . . . . . . . . . . . . . . . . . . . . . . . . . . . . . . . . 52
2.2 Levels of Service . . . . . . . . . . . . . . . . . . . . . . . . . . . . . . . . . . 62.2.1 Road Transport . . . . . . . . . . . . . . . . . . . . . . . . . . . . . . . 64
2.2.2 Rail Transport . . . . . . . . . . . . . . . . . . . . . . . . . . . . . . . 92.2.3 Aviation . . . . . . . . . . . . . . . . . . . . . . . . . . . . . . . . . . . 106
2.2.4 Maritime and Inland Transport . . . . . . . . . . . . . . . . . . . . . . . 112.3 Information Systems in Transportation . . . . . . . . . . . . . . . . . . . . . . . 118
2.4 Studies Overview . . . . . . . . . . . . . . . . . . . . . . . . . . . . . . . . . . 142.4.1 Current Trends of Real-Time Multimodal Urban Mobility Information10
Services ( RTMMIS ) . . . . . . . . . . . . . . . . . . . . . . . . . . . . 142.4.2 ITS Action Plan. Study "Towards a European Multi-Modal Journey Planner" 1512
2.4.3 Designing A Multi-Modal Traveler Information Platform For Urban Trans-portation . . . . . . . . . . . . . . . . . . . . . . . . . . . . . . . . . . 1614
2.4.4 Measuring Multimodal Transport Level of Service . . . . . . . . . . . . 172.4.5 Multimodal Level of Service Analysis for Urban Streets . . . . . . . . . 1916
2.4.6 Standards in Related Works . . . . . . . . . . . . . . . . . . . . . . . . 192.5 Dashboard and Traveler Information System Examples . . . . . . . . . . . . . . 2018
2.5.1 CityDashboard . . . . . . . . . . . . . . . . . . . . . . . . . . . . . . . 202.5.2 The FAST Dashboard . . . . . . . . . . . . . . . . . . . . . . . . . . . 2120
2.5.3 RCMP Roadway Performance Dashboard . . . . . . . . . . . . . . . . . 212.5.4 Maryland Department of Transportation . . . . . . . . . . . . . . . . . . 2222
2.5.5 VDOT Dashboard . . . . . . . . . . . . . . . . . . . . . . . . . . . . . 222.5.6 Trafiken.Nu Journey Planner . . . . . . . . . . . . . . . . . . . . . . . . 2224
2.5.7 TRAVIC . . . . . . . . . . . . . . . . . . . . . . . . . . . . . . . . . . 232.6 Data Communication Protocols . . . . . . . . . . . . . . . . . . . . . . . . . . . 2426
2.7 Conclusions . . . . . . . . . . . . . . . . . . . . . . . . . . . . . . . . . . . . . 24
3 Problem and Methodology 27 2
3.1 Problem Definition . . . . . . . . . . . . . . . . . . . . . . . . . . . . . . . . . 273.2 Requirements Analysis . . . . . . . . . . . . . . . . . . . . . . . . . . . . . . . 28 4
3.2.1 Software Quality Requirements . . . . . . . . . . . . . . . . . . . . . . 283.2.2 Stakeholders . . . . . . . . . . . . . . . . . . . . . . . . . . . . . . . . 29 6
ix

CONTENTS
3.3 Methodological Approach . . . . . . . . . . . . . . . . . . . . . . . . . . . . . 323.3.1 LOS Metrics . . . . . . . . . . . . . . . . . . . . . . . . . . . . . . . . 32 8
3.3.2 Sources and Information . . . . . . . . . . . . . . . . . . . . . . . . . . 333.3.3 Primary Data Model . . . . . . . . . . . . . . . . . . . . . . . . . . . . 34 10
3.3.4 Metamodel . . . . . . . . . . . . . . . . . . . . . . . . . . . . . . . . . 353.3.5 Values Classification And Presentation Rules . . . . . . . . . . . . . . . 36 12
3.3.6 Hierarchical LOS Evaluation . . . . . . . . . . . . . . . . . . . . . . . . 373.3.7 Prototype . . . . . . . . . . . . . . . . . . . . . . . . . . . . . . . . . . 39 14
3.3.8 Logical Architecture . . . . . . . . . . . . . . . . . . . . . . . . . . . . 413.4 Summary . . . . . . . . . . . . . . . . . . . . . . . . . . . . . . . . . . . . . . 42 16
4 Implementation 434.1 Technology . . . . . . . . . . . . . . . . . . . . . . . . . . . . . . . . . . . . . 43 18
4.1.1 Service Oriented Architecture . . . . . . . . . . . . . . . . . . . . . . . 434.1.2 Server Side Technologies . . . . . . . . . . . . . . . . . . . . . . . . . . 43 20
4.1.3 User Interface Technologies . . . . . . . . . . . . . . . . . . . . . . . . 444.1.4 Communication . . . . . . . . . . . . . . . . . . . . . . . . . . . . . . . 44 22
4.1.5 Database And Object-Relational Mapping . . . . . . . . . . . . . . . . . 454.1.6 Graph Library . . . . . . . . . . . . . . . . . . . . . . . . . . . . . . . . 45 24
4.2 Data Structure . . . . . . . . . . . . . . . . . . . . . . . . . . . . . . . . . . . . 454.3 Application Architecture . . . . . . . . . . . . . . . . . . . . . . . . . . . . . . 48 26
4.4 Server Side Classes and Implementation Nuances . . . . . . . . . . . . . . . . . 494.4.1 Agent Package . . . . . . . . . . . . . . . . . . . . . . . . . . . . . . . 49 28
4.4.2 Appconfig Package . . . . . . . . . . . . . . . . . . . . . . . . . . . . . 494.4.3 Broker Package . . . . . . . . . . . . . . . . . . . . . . . . . . . . . . . 50 30
4.4.4 Dao Package . . . . . . . . . . . . . . . . . . . . . . . . . . . . . . . . 504.4.5 Engine Package . . . . . . . . . . . . . . . . . . . . . . . . . . . . . . . 50 32
4.4.6 Guiobjects Package . . . . . . . . . . . . . . . . . . . . . . . . . . . . . 534.4.7 Pojo Package . . . . . . . . . . . . . . . . . . . . . . . . . . . . . . . . 54 34
4.4.8 Service Package . . . . . . . . . . . . . . . . . . . . . . . . . . . . . . 544.5 GUI Classes and Implementation Nuances . . . . . . . . . . . . . . . . . . . . . 55 36
4.6 Summary . . . . . . . . . . . . . . . . . . . . . . . . . . . . . . . . . . . . . . 56
5 Preliminary Results 59 38
5.1 Experimental Setup . . . . . . . . . . . . . . . . . . . . . . . . . . . . . . . . . 595.2 Results Analysis . . . . . . . . . . . . . . . . . . . . . . . . . . . . . . . . . . . 612
5.3 Summary . . . . . . . . . . . . . . . . . . . . . . . . . . . . . . . . . . . . . . 63
6 Conclusions and Future Work 654
6.1 SWOT Analysis . . . . . . . . . . . . . . . . . . . . . . . . . . . . . . . . . . . 676.1.1 Strengths . . . . . . . . . . . . . . . . . . . . . . . . . . . . . . . . . . 676
6.1.2 Weaknesses . . . . . . . . . . . . . . . . . . . . . . . . . . . . . . . . . 676.1.3 Opportunities . . . . . . . . . . . . . . . . . . . . . . . . . . . . . . . . 678
6.1.4 Threats . . . . . . . . . . . . . . . . . . . . . . . . . . . . . . . . . . . 686.2 Future Work . . . . . . . . . . . . . . . . . . . . . . . . . . . . . . . . . . . . . 6810
References 71
A LOS Evaluation Model Diagrams 7912
x

CONTENTS
B Data Model Detailed View 87
C Dashboard Screen-shots 8914
D Output Values 93
E Software Engineering 9716
E.1 Use Cases . . . . . . . . . . . . . . . . . . . . . . . . . . . . . . . . . . . . . . 97E.2 User Stories . . . . . . . . . . . . . . . . . . . . . . . . . . . . . . . . . . . . . 9818
E.3 Work Plan . . . . . . . . . . . . . . . . . . . . . . . . . . . . . . . . . . . . . . 102
xi

CONTENTS
xii
List of Figures20
2.1 Transport Canada LOS standards for Airport Terminals. [MBBI10, p. 148] . . . 142.2 Traveller information platform architecture. [Dos10, p. 59] . . . . . . . . . . . . 1822
2.3 LOS Model Interactions [DRF+08, p. 95] . . . . . . . . . . . . . . . . . . . . . 192.4 The FAST Dashboard [(RT] . . . . . . . . . . . . . . . . . . . . . . . . . . . . 2124
2.5 Public Transport Service Status, Maryland Department of Transportation. [oTa] . 222.6 VDOT Dashboard [oTb] . . . . . . . . . . . . . . . . . . . . . . . . . . . . . . 2326
3.1 Benefits Net. . . . . . . . . . . . . . . . . . . . . . . . . . . . . . . . . . . . . 303.2 Workflow. . . . . . . . . . . . . . . . . . . . . . . . . . . . . . . . . . . . . . . 3228
3.3 Primary Data Model. . . . . . . . . . . . . . . . . . . . . . . . . . . . . . . . . 343.4 Metamodel Diagram. . . . . . . . . . . . . . . . . . . . . . . . . . . . . . . . . 3630
3.5 Meta Model Vertical Structure. . . . . . . . . . . . . . . . . . . . . . . . . . . . 393.6 Dashboard Prototype. Filled Work Area. . . . . . . . . . . . . . . . . . . . . . . 4032
3.7 Dashboard Prototype. Weights Customization. . . . . . . . . . . . . . . . . . . . 413.8 Logical Architecture. . . . . . . . . . . . . . . . . . . . . . . . . . . . . . . . . 4234
4.1 Data Model. . . . . . . . . . . . . . . . . . . . . . . . . . . . . . . . . . . . . . 464.2 Component Model. . . . . . . . . . . . . . . . . . . . . . . . . . . . . . . . . . 4836
4.3 Legend For LOS Indicators. . . . . . . . . . . . . . . . . . . . . . . . . . . . . 564.4 LOS Tree View with Filters. . . . . . . . . . . . . . . . . . . . . . . . . . . . . 5638
5.1 Road Congestion LOS, Tuesday. . . . . . . . . . . . . . . . . . . . . . . . . . . 615.2 Road Congestion LOS. All observed days. . . . . . . . . . . . . . . . . . . . . . 62 2
5.3 Number Of Buses On The Route. . . . . . . . . . . . . . . . . . . . . . . . . . . 63
A.1 High level LOS structure. . . . . . . . . . . . . . . . . . . . . . . . . . . . . . . 80 4
A.2 Road Traffic LOS Diagram. . . . . . . . . . . . . . . . . . . . . . . . . . . . . . 81A.3 Urban and Interurban Public Transport LOS Diagram. . . . . . . . . . . . . . . . 81 6
A.4 Bicycle LOS and Taxi LOS Mode Diagrams. . . . . . . . . . . . . . . . . . . . 82A.5 Urban Rail LOS Diagram. . . . . . . . . . . . . . . . . . . . . . . . . . . . . . 83 8
A.6 Interurban Rail LOS Diagram. . . . . . . . . . . . . . . . . . . . . . . . . . . . 84A.7 Airports LOS Diagram. . . . . . . . . . . . . . . . . . . . . . . . . . . . . . . . 85 10
A.8 Helicopter LOS Diagram. . . . . . . . . . . . . . . . . . . . . . . . . . . . . . . 86A.9 Inland and Maritime LOS Diagram. . . . . . . . . . . . . . . . . . . . . . . . . 86 12
B.1 Data Model Detailed View. . . . . . . . . . . . . . . . . . . . . . . . . . . . . . 88
C.1 Dashboard Default View. Domain level LOS indicators at City abstraction with 14
all domains selected. . . . . . . . . . . . . . . . . . . . . . . . . . . . . . . . . 90
xiii

LIST OF FIGURES
C.2 Dashboard View with Legend and Atomic LOS Indicators at City Abstraction. . . 90 16
C.3 Line Chart View with Historical Values For Metro LOS. Indicators on the mapcorrespond to Component level at Area abstraction. . . . . . . . . . . . . . . . . 91 18
C.4 Stack Bar Chart View with Historical Values for Operational Statuses For UrbanBus Stops. Indicators on the map correspond to Aggregation level at City abstraction. 91 20
C.5 Information Pane For a LOS Indicator. Indicators on the map correspond to Ag-gregation level at Area abstraction. . . . . . . . . . . . . . . . . . . . . . . . . . 92 22
E.1 Use Case Model Diagram. . . . . . . . . . . . . . . . . . . . . . . . . . . . . . 98
xiv

List of Tables 24
2.1 Average Generalized Passenger Car Equivalents On Motorways. . . . . . . . . . 72.2 Levels Of Service Criteria For Basic Motorway Sections. [TEM02, p. 9] . . . . . 8 26
2.3 Levels of Service for Queuing Areas [Kit99a, Ch. 2, p. 4-4] . . . . . . . . . . . 92.4 Service Frequency LOS: Urban Scheduled Transit Service. [Kit99b, p. 5-16] . . . 10 28
2.5 LOS Criteria For Uninterrupted Bicycle Facilities [BOA00, p. 11-15] . . . . . . 112.6 Bicycle and Pedestrian LOS Categories. [oT09, p. 27] . . . . . . . . . . . . . . . 12 30
2.7 Quality of Service of bicycle facilities. [Nat11, p. 211] . . . . . . . . . . . . . . 132.8 IATA LOS standards for Airport Terminals (figures in square meters). [MBBI10,
p. 149] . . . . . . . . . . . . . . . . . . . . . . . . . . . . . . . . . . . . . . . . 152
2.9 Definition of Levels of Service for Inland Locks. [Mck13, p. 6] . . . . . . . . . 162.10 Operating Regimes for Commercial Navigation, The Netherlands [aN11, p. 144] 174
2.11 Standards, frameworks and specifications analysis in related works. (Tempier andRapp 2011; Doshi 2010) . . . . . . . . . . . . . . . . . . . . . . . . . . . . . . 206
2.12 Data Communication Protocols Comparison (Y = Yes, N = No). . . . . . . . . . 242.13 Dashboard and Traveller Information System Examples Comparison. . . . . . . . 258
3.1 Stakeholders . . . . . . . . . . . . . . . . . . . . . . . . . . . . . . . . . . . . . 313.2 TPEG-PTI Tables Applicable to Air Transport [BBC]. . . . . . . . . . . . . . . 3510
3.3 Output Values Classification. . . . . . . . . . . . . . . . . . . . . . . . . . . . . 373.4 Presentation Rules. . . . . . . . . . . . . . . . . . . . . . . . . . . . . . . . . . 3812
D.1 Output Values. . . . . . . . . . . . . . . . . . . . . . . . . . . . . . . . . . . . . 93D.1 Output Values. . . . . . . . . . . . . . . . . . . . . . . . . . . . . . . . . . . . . 9614
E.1 User Stories . . . . . . . . . . . . . . . . . . . . . . . . . . . . . . . . . . . . . 99E.1 User Stories . . . . . . . . . . . . . . . . . . . . . . . . . . . . . . . . . . . . . 10216
xv

LIST OF TABLES
xvi
Abbreviations
API Application programming interfaceATIS Alliance for Telecommunications Industry SolutionsATS Artificial Transportation SystemsBFS Breadth-first searchCEN European Committee for Standardization (Comité Européen de Normalisation)DAO Data Access ObjectDB Data BaseDFS Depth-first searchEC European CommissionEJB Enterprise JavaBeansEMS Event Management SystemETC Electronic toll collectionEVP Emergency Vehicle PreemptionEU European UnionFDOT Florida Department of TransportationFIPA Foundation for Intelligent Physical AgentsGIS Geographic Information SystemsGTFS General Transit Feed SpecificationGUI Graphical User InterfaceHCM Highway Capacity ManualHDC Highway Data CollectionHGV Heavy goods vehicleIATA International Air Transport AssociationICT Information and communications technologyIFOPT Identification of Fixed Objects in Public TransportIDE Integrated development environmentIS Information SystemISO International Organization for StandardizationIT Information TechnologyITS Intelligent Transportation SystemJP Journey PlannerLOS Level Of ServiceMDOT Maryland Department of TransportationMIELE Multimodal Interoperability E-services for Logistics and Environment sustain-
abilityMM MultimodalMVC Model–view–controllerNMEA National Marine Electronics Association
xvii

ABBREVIATIONS
ORM Object-Relational MappingPOJO Plain Old Java ObjectPPM Public Performance MeasurePT Public TransportRCMP Regional Congestion Management ProgramREST Representational state transferRSQI Rail Service Quality IndexRTMMIS real-time multimodal information systemsSIRI Service Interface for Real Time InformationSOA Service-oriented ArchitectureSOAP Simple Object Access ProtocolSTCP Sociedade de Transportes Colectivos do PortoSWOT Strengths, Weaknesses, Opportunities, and Threats analysisTC Transport CanadaTCS Traffic Control SystemTIS Traveler Information SystemTEM Trans-European North-South MotorwayTMS Traffic Management SystemsTPEG Transport Protocol Experts GroupTRB Transportation Research BoardTS Transport systemTSP Transit Signal PriorityUK United KingdomURI Uniform resource identifierUS United StatesUS User StoriesV2I Vehicle-to-infrastructureV2V Vehicle-to-vehicleVCS Video Control SystemVDC Vehicle Data CollectionVDOT Virginia Department of TransportationWCF Windows Communication FoundationXML Extensible Markup LanguageWWW World Wide Web
18
xviii
Chapter 1
Introduction20
With the growth of Information Systems (IS) and their expansion in various fields of our life, they22
have occupied an important place in the Transportation area. The term ITS (Intelligent Transporta-
tion System) has been spread during recent decades and is defined as follows:24
“Intelligent Transport Systems (ITS) are advanced applications which without em-
bodying intelligence as such aim to provide innovative services relating to different26
modes of transport and traffic management and enable various users to be better in-
formed and make safer, more coordinated and ’smarter’ use of transport networks.” 2
[PotE10, p. 1]
At the present time, various intelligent systems exist in the Transportation area, which permit 4
monitoring, control and other relevant functionalities for a given transport mode. However, the
individual solutions for different transport modes don’t favor multimodal transport management; 6
there are a very few solutions that combine different transport types in one application. Therefore,
a need for a multimodal supervision dashboard arouse – a dashboard that would permit to combine 8
transportation systems of different types and that would provide a comprehensive view in order
to observe whether all the systems are functional and operating at an acceptable Level of Service 10
(LOS). This work will address the above issue specifically for the Transportation Network of the
city of Porto, Portugal, as a case study. 12
1.1 Context
This project is carried out under the supervision and with the help of Armis, an IT company 14
based in Porto, Portugal, with a considerable experience in development of IT solutions for the
transportation area and other fields. 16
The paper refers to the area of Transport and IS existing within this area, mainly Intelligent
Transportation Systems (ITS) and Information and communications technology (ICT) Systems. It 18
1
Introduction
provides a review of some studies and existing dashboards that address the issue of multimodal
transport systems and their performance monitoring. 20
Another domain, which is in fact the central subject of this paper, is Level of Service (LOS)
which measures the level of performance of a transportation system and its operational state. The 22
methods and approaches to the measurement of LOS are considered and analyzed for different
transport modes including road transport, railway, aviation and waterborne transport. The paper 24
proposes an extensive hierarchy-based model that integrates all modes and sub-modes of trans-
portation network for the evaluation of LOS of each component at all levels of abstraction. 26
Since no measurements may be made without information, it is necessary to analyze the pos-
sible sources of the input data for the dashboard, as well as the types of data supplied by these 28
sources, its formats and channels. In the world of transport, thanks to the advanced state-of-the-art
of ITS and ICT systems and the existing trends towards information sharing and standardization 30
of communication between distributed applications, be it within one organization or between dif-
ferent entities, a certain number of recognized standards already exist in the transport area. The2
paper suggests an overview of the most important data communication protocols relevant to the
study and their brief comparison.4
The work was conducted to construct a prototype of a multimodal transportation supervision
dashboard, in order to analyze the viability of the idea suggested by this paper and the possibility6
of providing a comprehensive view on the functioning of the whole transport network in a certain
geographic area. For an application of this type it is crucial to possess such features as ease of use8
and understanding, configurability and quick alerting, in order to enhance the efficient use of the
dashboard in real life as a tool for the decision making process. From a technical perspective, the10
proposed prototype consists of several major components or layers, such as the Communication
Layer (retrieval of raw data from multiple sources available online), Data Layer (translation of12
raw data into useful information, its validation and further storage in a database), Control Layer
(Business logic responsible for the calculation of LOS values and providing information to ex-14
terior applications through web-services) and Visualization Layer (user interface and graphical
representation of transport systems operational state).16
1.2 Motivation and Goals
It is a matter of common knowledge that multimodality in transport area has become one of the ob-18
jectives in modern society. Multiple transport choices and their efficient cooperation are in the first
place intended to reduce air pollution and other negative ecological impacts caused by transport.20
Another benefit brought by multimodality is optimized logistics. The efficient use of multimodal
transport however, as well as the growth of urban transport networks in size and complexity, in-22
troduces certain challenges. It requires sophisticated management at different scales including a
city-scale, which of course cannot be performed without timely and extensive information, in-24
cluding performance measures. The information in turn, especially that referring to performance,
needs monitoring.26
2
Introduction
As it was said in the Performance Measures for Multimodal Transportation Systems study:
“Information on transportation performance may be used in a variety of policy, plan-28
ning, and operational situations. It may be used by public agencies in assessing fa-
cility or system adequacy, identifying problems, calibrating models, developing and30
assessing improvements, formulating programs and priorities, and setting policies. It
may be used by the private sector in making locational or investment decisions. It may
be used by the general public and media in assessing travelers’ satisfaction.” [PL96, 2
p. 86]
The institutions and organizations that may need to monitor LOS-related information on trans- 4
port include public authorities, city planning and transportation management entities, in order to
monitor operational state, analyze time behavior, perform a well informed government action, in- 6
vestment, etc. The possible users of the transport LOS information include private sector as well,
namely private transport operators and organizations that use transport service intensively, which 8
benefit from monitoring transport systems to evaluate the impact on their own operations, compar-
ing to competitors within the same sector and alternative modes, planning investment and making
optimization decisions. General public is another consumer of multimodal transport performance2
information, which plays role in mode selection decisions.
The monitoring and control problems in transport area are often solved with the help of In-4
formational Systems (IS) that now occupy an important place in transport management. In fact,
there exists a great variety of such IS: Intelligent Transportation Systems (ITS), Information and6
Communications Technology (ICT) systems. However, the majority of such systems address a
single transport mode, and very few solutions combine different modes at the same time. Nev-8
ertheless, demand exists for multimodal transport solutions that would provide a comprehensive
view of local Transportation Network [SAT+13, pp. 1-2]. Such systems could offer a number10
of benefits to the public and authorities. One of the important features would be the possibility
of monitoring the levels of service (LOS) and performance of local transport networks, thereby12
providing support in the decision making process in case of emergency events, etc.
The aim of this work consists in studying a possibility of providing a tool for integrated anal-14
ysis of LOS of different transport modes existing in a city or another geographical unit. The
LOS measures should be combined in a single dashboard in an effective way, in order to permit16
monitoring of functioning level of the whole local transportation system. The specific goals to be
achieved are as follows:18
• Identify the protocols that supply data related to LOS for different transport means (air, land,
water, rail);20
• Identify or define, when necessary, the metrics and scale for the evaluation of LOS of each
transport system and its relevant components, based on literature review;22
• Formulate or adapt the methods of LOS degradation detection and localization for the inte-
grated transportation systems;24
3
Introduction
• Implement and test a prototype of a dashboard for an integrated LOS monitoring for multi-
modal transport services.26
The innovation introduced by this work includes the following aspects:
• Scientific Contribution: Synthesis of LOS evaluation methods existing in the World for28
all urban transport modes; implementation of algorithms that permit automatic inference of
LOS of various transport modes, based on the information provided by protocols used for
each mode, to be then monitored by means of an integrated dashboard. 2
• Technological Contribution: Proposed architecture of a multimodal dashboard, which
would permit an integrated monitoring of the information about perturbations in each trans- 4
port system operation related to its level of service (accidents, congestion, delays, etc.) by
means of integrating varied data sources provided by transport services. 6
• Practical Contribution: Implementation of a functional prototype for an integrated multi-
modal monitoring of various transport systems and decision support, to be used by Armis. 8
Such an application would be useful to public authorities providing a comprehensive view
on local transport systems operation, their real-time monitoring and decision support in 10
cases of emergency or other situations, when transport is essential. Long-term monitoring
with an access to historic data can unveil the weak points of the city transportation network 12
and thus help in strategic transport management. Another advantage would be having such
a monitoring facility for all transport modes in one single dashboard instead of the need to 14
use several sources of information.
1.3 Thesis Structure 16
The Introduction chapter is followed by five other chapters that explicitly describe the problem
addressed in this work and its proposed solution. Chapter 2 provides a review of the State-of-the- 18
art in multimodal transportation IS, the studies performed in this field and existing solutions, data
communication standards as well as an overview of the existing approaches and methods for trans- 20
port systems LOS evaluation. Chapter 3 describes the problem in more detail and the proposed
approach for its solution. It is followed by the Implementation chapter 4, which explains technical 22
aspects of the dashboard prototype that was built for this project, its architecture and implemented
functionalities. The Preliminary Results Chapter, 5, is dedicated to the tests performed on the pro- 24
totype and tests results discussion. The final Chapter 6 analyzes the results achieved, the strong
and weak sides of the project, its perspectives and future work. 26
4
Chapter 2
Literature Review 28
In case of a multimodal transportation dashboard, two domains are involved in the study: Trans-2
portation and IS for transport needs. Specifically, due to the nature of the dashboard and its
objectives, the study is to be focused on the measurement of transport service levels. In the further4
sections, starting with a brief analysis of transport modes, a review of the existing LOS metrics is
provided, followed by a review of IS existing in transport sector, studies performed on the topic,6
as well as the existing multimodal dashboards and the analysis of existing protocols for data ex-
change in the area of ITS. The final part includes conclusions derived from the State-of-the-art in8
multimodal transport IS and identifies the existing gaps in the area which result in opportunities
for this project.10
2.1 Introduction
The importance of LOS-related information was well explained in an article "Performance Mea-12
sures for Multimodal Transportation Systems" published by Richard H. Pratt and Timothy J. Lo-
max in TRANSPORTATION RESEARCH RECORD Journal in 1996:14
"Information on transportation performance may be used in a variety of policy, planning, and
operational situations. It may be used by public agencies in assessing facility or system adequacy,16
identifying problems, calibrating models, developing and assessing improvements, formulating
programs and priorities, and setting policies. It may be used by the private sector in making18
locational or investment decisions. It may be used by the general public and media in assessing
travelers’ satisfaction" [PL96, p. 86].20
In order to cover the entire transportation network in a geographic location, it is first necessary
to identify and categorize all transport modes existing in an urban area. The main categories are22
presented below, including the elements that require an evaluation of their operational state:
• Road transport24
5

Literature Review
– Road traffic
– Buses 2
– Bicycles
• Rail transport 4
– Interurban Rail
– Urban Rail (Metro and Light Rail) 6
• Aviation
– Airports 8
– Helicopters
• Waterborne (Maritime and Inland) transport 10
– Ports
– Locks and Docks 12
It is also important to understand such concepts as Intermodal and Multimodal transport and
the difference between them. Intermodal transport system involves "the movements of passengers 14
or freight from one mode of transport to another, commonly taking place at a terminal specifically
designed for such a purpose." [RCS13, ch. 3] While the term multimodal transport system is 16
defined as conjunction of more than one mode of transport (cycling, automobile, public transit,
rail, etc.) and connections among modes [Lit14, EfAtP, p. 1]. 18
2.2 Levels of Service
The concept of Level of Service, or LOS, is widely used for measuring traffic flow on roads, 20
however, in recent decades it was also introduced for some other modes of transport, such as
pedestrian, bus, public transport terminals [Kit99a]. In this project the same term will be used 22
to measure the operational state for all transport modes, terminal types, as well as for the entire
transportation systems. The metrics that exist for each transport mode are described further in 24
detail.
2.2.1 Road Transport2
Road transport includes a good variety of transport types and sub-modes, like private cars, coaches,
buses, car-sharing, bike-sharing, pedestrian walking, taxi, rental cars and some other. The most4
studied and standardized aspect in terms of LOS evaluation is road traffic. Metrics exist as well
for public transport, pedestrian walkways and bicycles.6
6
Literature Review
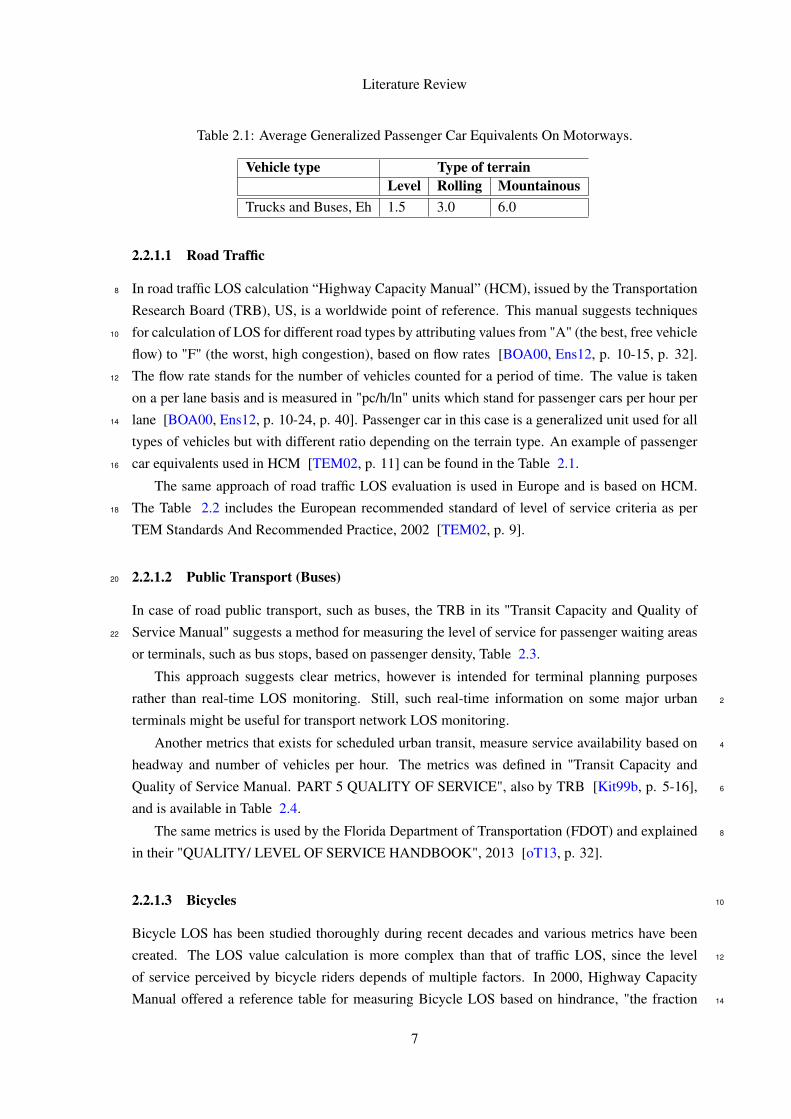
Table 2.1: Average Generalized Passenger Car Equivalents On Motorways.
Vehicle type Type of terrainLevel Rolling Mountainous
Trucks and Buses, Eh 1.5 3.0 6.0
2.2.1.1 Road Traffic
In road traffic LOS calculation “Highway Capacity Manual” (HCM), issued by the Transportation8
Research Board (TRB), US, is a worldwide point of reference. This manual suggests techniques
for calculation of LOS for different road types by attributing values from "A" (the best, free vehicle10
flow) to "F" (the worst, high congestion), based on flow rates [BOA00, Ens12, p. 10-15, p. 32].
The flow rate stands for the number of vehicles counted for a period of time. The value is taken12
on a per lane basis and is measured in "pc/h/ln" units which stand for passenger cars per hour per
lane [BOA00, Ens12, p. 10-24, p. 40]. Passenger car in this case is a generalized unit used for all14
types of vehicles but with different ratio depending on the terrain type. An example of passenger
car equivalents used in HCM [TEM02, p. 11] can be found in the Table 2.1.16
The same approach of road traffic LOS evaluation is used in Europe and is based on HCM.
The Table 2.2 includes the European recommended standard of level of service criteria as per18
TEM Standards And Recommended Practice, 2002 [TEM02, p. 9].
2.2.1.2 Public Transport (Buses)20
In case of road public transport, such as buses, the TRB in its "Transit Capacity and Quality of
Service Manual" suggests a method for measuring the level of service for passenger waiting areas22
or terminals, such as bus stops, based on passenger density, Table 2.3.
This approach suggests clear metrics, however is intended for terminal planning purposes
rather than real-time LOS monitoring. Still, such real-time information on some major urban 2
terminals might be useful for transport network LOS monitoring.
Another metrics that exists for scheduled urban transit, measure service availability based on 4
headway and number of vehicles per hour. The metrics was defined in "Transit Capacity and
Quality of Service Manual. PART 5 QUALITY OF SERVICE", also by TRB [Kit99b, p. 5-16], 6
and is available in Table 2.4.
The same metrics is used by the Florida Department of Transportation (FDOT) and explained 8
in their "QUALITY/ LEVEL OF SERVICE HANDBOOK", 2013 [oT13, p. 32].
2.2.1.3 Bicycles 10
Bicycle LOS has been studied thoroughly during recent decades and various metrics have been
created. The LOS value calculation is more complex than that of traffic LOS, since the level 12
of service perceived by bicycle riders depends of multiple factors. In 2000, Highway Capacity
Manual offered a reference table for measuring Bicycle LOS based on hindrance, "the fraction 14
7

Literature Review
Table 2.2: Levels Of Service Criteria For Basic Motorway Sections. [TEM02, p. 9]
LEVELS OF SERVICE CRITERIA FOR BASIC MOTORWAY SECTIONSLOS MAXIMUM
DENSITY(pc/km/In)
MINIMUMSPEED(km/h)
MAXIMUMSERVICEFLOW RATE(pc/h/In)
MAXIMUMv/c RATIO
FREE-FLOW SPEED = 120 km/hA 6 120 720 0.29B 10 120 1,200 0.47C 15 115 1,725 0.68D 20 104 2,080 0.85E 28 85.7 2,400 1.00F >28 <85.7 >2,400 >1.00
FREE-FLOW SPEED = 110 km/hA 6 110 660 0.28B 10 110 1,100 0.44C 15 109 1,635 0.66D 20 101 2,020 0.84E 28 84.0 2,350 1.00F >28 <84.0 >2,350 >1.00
FREE-FLOW SPEED = 100 km/hA 6 100 600 0.26B 10 100 1,000 0.42C 15 100 1,500 0.63D 20 96 1,920 0.81E 28 82.0 2,300 1.00F >28 <82.0 >2,300 >1.00
FREE-FLOW SPEED = 90 km/hA 6 90 540 0.24B 10 90 900 0.39C 15 90 1,350 0.59D 20 90 1,800 0.78E 28 80.4 2,250 1.00F >28 <80.4 >2,250 >1.00
of users over 1.0 km of a path experiencing hindrance from passing and meeting maneuvers"
[BOA00, p. 11-15], as shown in the Table 2.5. 16
Later, in 2009, the FDOT suggested a more sophisticated method for Bicycle LOS calculation,
which considers such factors as average effective width of the outside through lane, motorized ve- 18
hicle volumes, motorized vehicle speeds, heavy vehicle (truck) volumes and pavement condition
[oT09, p. 26]. A relative importance is then attributed to each of these variables. After the appli- 20
cation of an equation explained in the FDOT QUALITY/LEVEL OF SERVICE HANDBOOK, a
numerical LOS score is calculated. The final value usually ranges from 0.5 to 6.5 and is stratified 22
to a LOS letter grade, based on a reference table, Table 2.6.
8
Literature Review
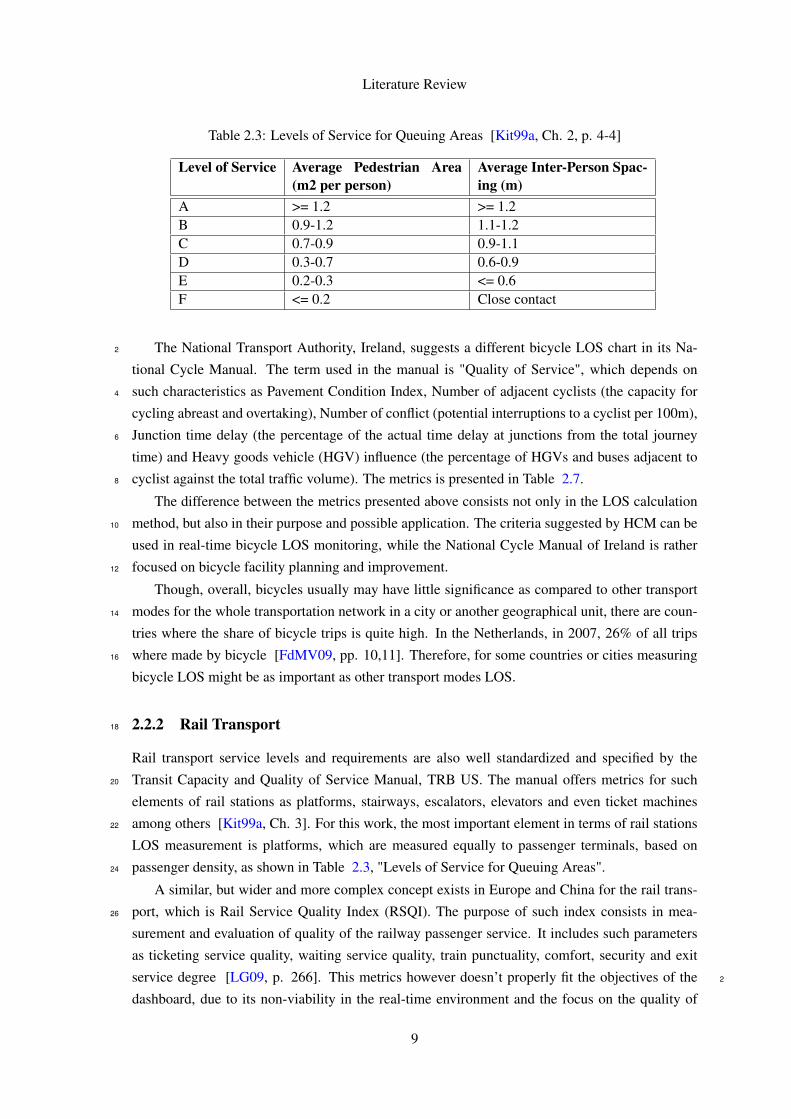
Table 2.3: Levels of Service for Queuing Areas [Kit99a, Ch. 2, p. 4-4]
Level of Service Average Pedestrian Area(m2 per person)
Average Inter-Person Spac-ing (m)
A >= 1.2 >= 1.2B 0.9-1.2 1.1-1.2C 0.7-0.9 0.9-1.1D 0.3-0.7 0.6-0.9E 0.2-0.3 <= 0.6F <= 0.2 Close contact
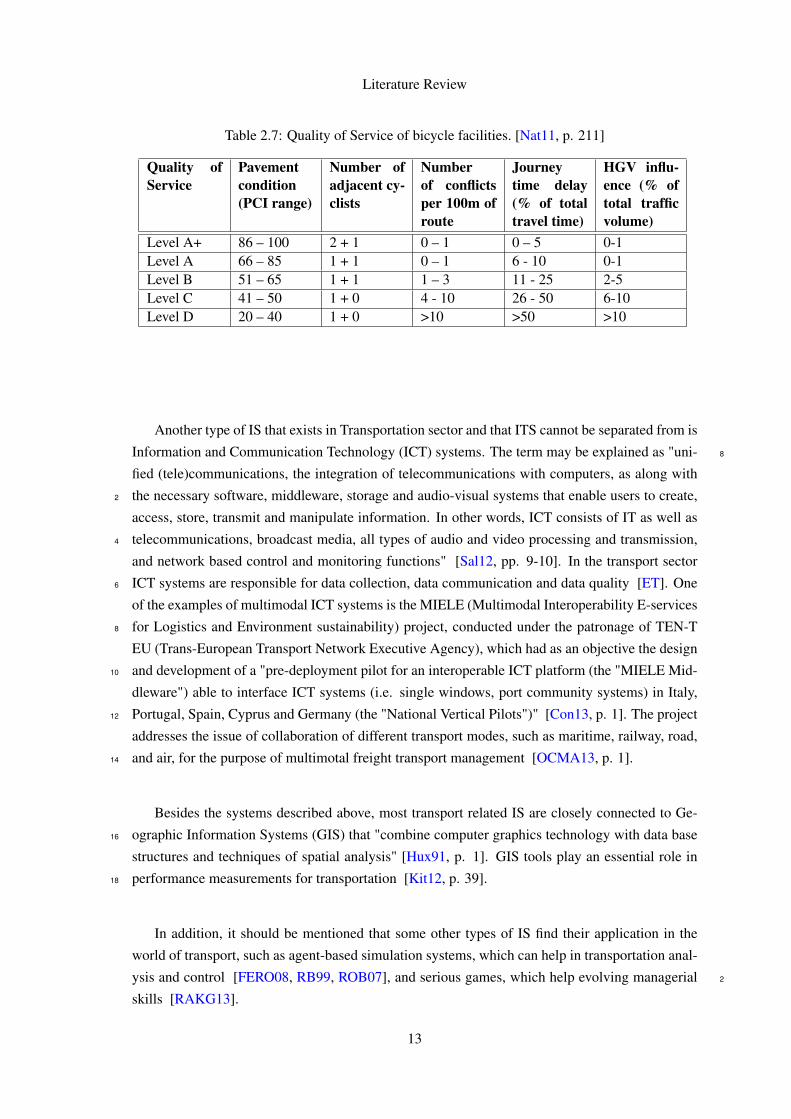
The National Transport Authority, Ireland, suggests a different bicycle LOS chart in its Na-2
tional Cycle Manual. The term used in the manual is "Quality of Service", which depends on
such characteristics as Pavement Condition Index, Number of adjacent cyclists (the capacity for4
cycling abreast and overtaking), Number of conflict (potential interruptions to a cyclist per 100m),
Junction time delay (the percentage of the actual time delay at junctions from the total journey6
time) and Heavy goods vehicle (HGV) influence (the percentage of HGVs and buses adjacent to
cyclist against the total traffic volume). The metrics is presented in Table 2.7.8
The difference between the metrics presented above consists not only in the LOS calculation
method, but also in their purpose and possible application. The criteria suggested by HCM can be10
used in real-time bicycle LOS monitoring, while the National Cycle Manual of Ireland is rather
focused on bicycle facility planning and improvement.12
Though, overall, bicycles usually may have little significance as compared to other transport
modes for the whole transportation network in a city or another geographical unit, there are coun-14
tries where the share of bicycle trips is quite high. In the Netherlands, in 2007, 26% of all trips
where made by bicycle [FdMV09, pp. 10,11]. Therefore, for some countries or cities measuring16
bicycle LOS might be as important as other transport modes LOS.
2.2.2 Rail Transport18
Rail transport service levels and requirements are also well standardized and specified by the
Transit Capacity and Quality of Service Manual, TRB US. The manual offers metrics for such20
elements of rail stations as platforms, stairways, escalators, elevators and even ticket machines
among others [Kit99a, Ch. 3]. For this work, the most important element in terms of rail stations22
LOS measurement is platforms, which are measured equally to passenger terminals, based on
passenger density, as shown in Table 2.3, "Levels of Service for Queuing Areas".24
A similar, but wider and more complex concept exists in Europe and China for the rail trans-
port, which is Rail Service Quality Index (RSQI). The purpose of such index consists in mea-26
surement and evaluation of quality of the railway passenger service. It includes such parameters
as ticketing service quality, waiting service quality, train punctuality, comfort, security and exit
service degree [LG09, p. 266]. This metrics however doesn’t properly fit the objectives of the 2
dashboard, due to its non-viability in the real-time environment and the focus on the quality of
9

Literature Review
Table 2.4: Service Frequency LOS: Urban Scheduled Transit Service. [Kit99b, p. 5-16]
LOS Headway (min) Veh/h CommentsA <10 >6 Passengers don’t need schedulesB 10-14 5-6 Frequent service, passengers consult schedulesC 15-20 3-4 Maximum desirable time to wait if bus/train missedD 21-30 2 Service unattractive to choice ridersE 31-60 1 Service available during hourF >60 <1 Service unattractive to all riders
service perceived by the passengers. Most of the parameters are hard to acquire citywide. Some 4
of them don’t change frequently and may be considered as static rather than dynamic, such as for
instance "connections with other forms of public transport" [Ltd10, p. 13]. 6
As for the rail lines on-time performance, a term Public Performance Measure (PPM) is used
in United Kingdom. This indicator measures percentage of trains that arrive at destination on time 8
[Rai, Kee13, p. 2].
2.2.3 Aviation 10
In aviation, airports are the core component for the evaluation of the operational state of the whole
infrastructure. Although there exists a good variety of parameters that affect the airports function- 12
ing level, such as weather conditions, flight delays and others, it is a common worldwide practice
to measure airport terminal LOS based on passenger density, similarly to public transport terminals 14
LOS.
Airport terminal LOS, as a concept, appeared in 1970s and was developed by Transport Canada
(TC). [MBBI10, p. 146]. The metrics used by TC to measure it are illustrated in Figure 2.1.2
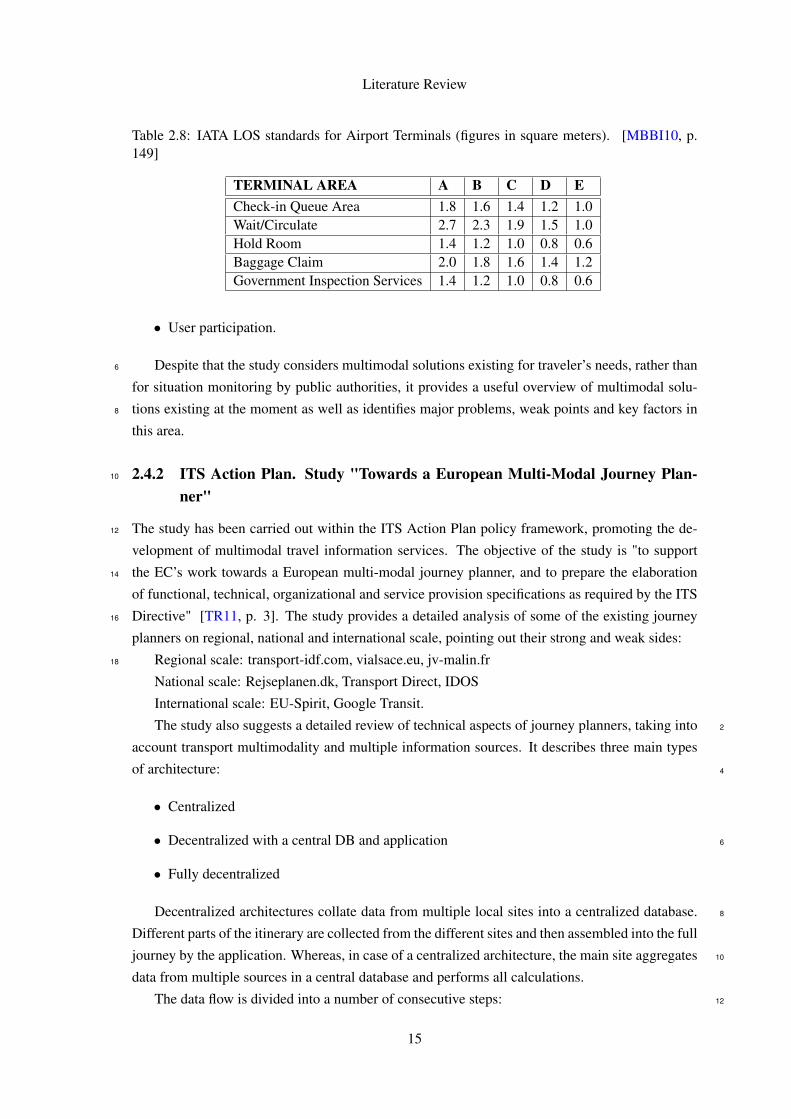
These metrics have been adopted by The International Air Transport Association (IATA), the
trade association for the world’s airlines, and have become an internationally recognized standard.4
The IATA terminal LOS standards are shown in the Table 2.8.
Criticism exists on these criteria suggesting that terminal LOS is a more complex concept that6
may depend on other factors, such as passenger perception, amount of time spent in a facility and
some others [JP07, p. 525]. But despite that, IATA LOS standard is still used in airport planning8
and management.
Another important aspect in airports functioning is flights on-time performance. In this re-10
spect, Eurocontrol in its monthly reports [Dir13, p. 5] presents detailed analysis of such figures
as:12
• Average daily airport and en-route delays (minutes)
• Monthly airport and en-route delay trends (percentage)14
• Proportion of airport and en-route delay by reason (percentage)
• Delays per location (minutes and percentage)16
10

Literature Review
Table 2.5: LOS Criteria For Uninterrupted Bicycle Facilities [BOA00, p. 11-15]
LOS Hindrance %A <=10B 10-20C 20-40D 40-70E 70-100F >100
• Average daily flights with >= 15 min en-route delay (minutes)
• En-route delays per flight (minutes)18
• Reasons for Airport delays (minutes)
• Average Airport delays per flight (minutes)20
• Average departure delay per flight (minutes)
• Monthly departure delays (percentage)22
As for the threshold values for distinguishing normal operation from severe delays, the same
report suggests analysis of delays within the following categories: over 15 minutes and over 3024
minutes. [Dir13, p. 12]
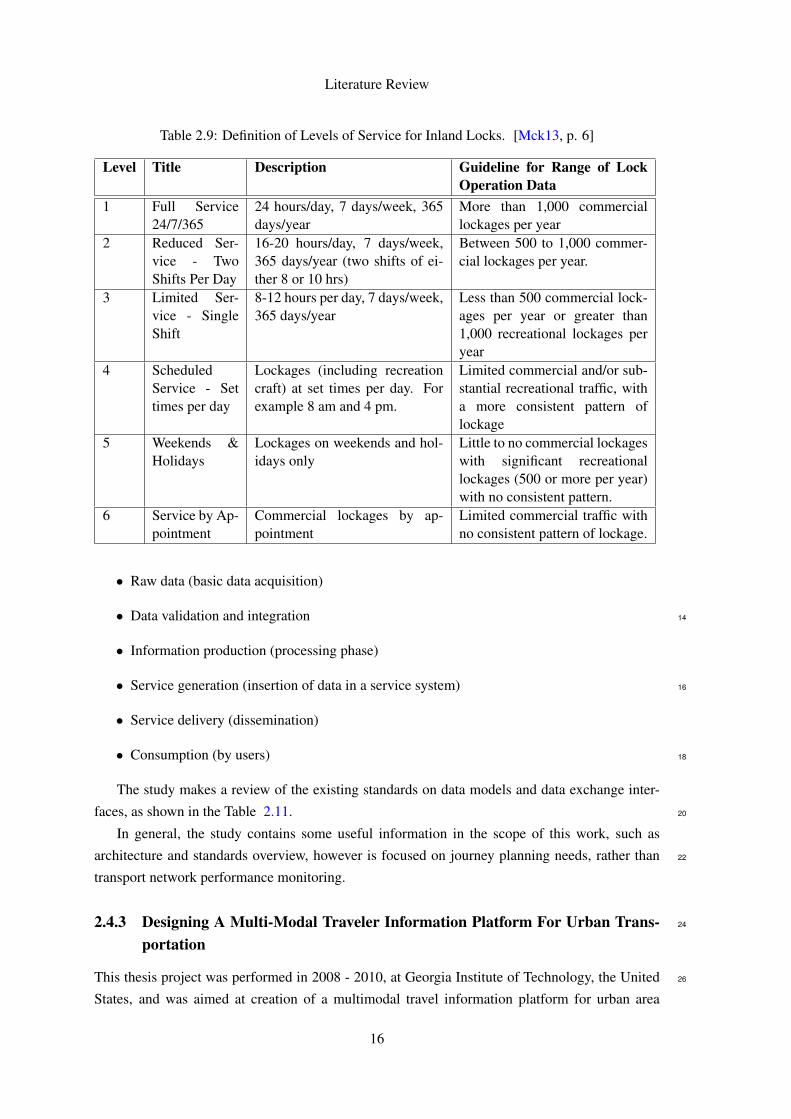
2.2.4 Maritime and Inland Transport
In the area of Sea and Inland transportation, the LOS isn’t a widely used concept. The only 2
standard for LOS measurement that was found during the research is applied to river systems in
the United States, specifically to locks and is presented in the Table 2.9. 4
The "Waterway Guidelines 2011", Netherlands, defines operating regimes for commercial nav-
igation based on the type of schedule, listed in the Table 2.10. 6
The metrics presented above may be applied for identifying the type of facility or schedule in
use. However, in the scope of this work, they are of a little help, since they don’t permit measuring 8
current state of an infrastructure or a facility that varies in time in terms or normal/abnormal
behavior. 10
2.3 Information Systems in Transportation
ITS systems are being widely introduced in our everyday life due to the benefits that they bring, 12
such as safety, comfort of use, wide range of services, higher efficiency on all levels from private
car driving to road network management and reduction of pollution. 14
Based on their scope and functions, ITS systems may be classified into the following categories
[Eze10, p. 8]: 16
11

Literature Review
Table 2.6: Bicycle and Pedestrian LOS Categories. [oT09, p. 27]
LOS ScoreA <= 1.5B > 1.5 and <= 2.5C > 2.5 and <= 3.5D > 3.5 and <= 4.5E > 4.5 and <= 5.5F > 5.5
• Advanced Traveler Information Systems – are systems that provide useful real-time infor-
mation to drivers. 18
• Advanced Transportation Management Systems include traffic control devices, such as traf-
fic signals, ramp meters, variable message signs, and traffic operations centers.2
• ITS-Enabled Transportation Pricing Systems, including electronic toll collection (ETC) sys-
tems.4
• Advanced Public Transportation Systems that permit public transport coordination and in-
formation delivery to passengers among their other possible uses.6
• Fully integrated intelligent transportation systems, that include vehicle-to-infrastructure (V2I)
and vehicle-to-vehicle (V2V) cooperative ITS systems, and are based on communication be-8
tween various types of elements from road sensors to vehicles.
Another classification of ITS systems exists based on their application, according to a survey10
published in 2013 [QA13, p. 635]:
• Electronic Toll Collection (ETC)12
• Highway Data Collection (HDC)
• Traffic Management Systems (TMS), which is quite a broad area that includes system sub-14
types, such as the following:
– Event Management System (EMS)16
– Traffic Control System (TCS)
– Traveler Information System (TIS) 2
– Video Control System (VCS)
• Vehicle Data Collection (VDC) 4
• Transit Signal Priority (TSP)
• Emergency Vehicle Preemption (EVP) 6
12
Literature Review
Table 2.7: Quality of Service of bicycle facilities. [Nat11, p. 211]
Quality ofService
Pavementcondition(PCI range)
Number ofadjacent cy-clists
Numberof conflictsper 100m ofroute
Journeytime delay(% of totaltravel time)
HGV influ-ence (% oftotal trafficvolume)
Level A+ 86 – 100 2 + 1 0 – 1 0 – 5 0-1Level A 66 – 85 1 + 1 0 – 1 6 - 10 0-1Level B 51 – 65 1 + 1 1 – 3 11 - 25 2-5Level C 41 – 50 1 + 0 4 - 10 26 - 50 6-10Level D 20 – 40 1 + 0 >10 >50 >10
Another type of IS that exists in Transportation sector and that ITS cannot be separated from is
Information and Communication Technology (ICT) systems. The term may be explained as "uni- 8
fied (tele)communications, the integration of telecommunications with computers, as along with
the necessary software, middleware, storage and audio-visual systems that enable users to create,2
access, store, transmit and manipulate information. In other words, ICT consists of IT as well as
telecommunications, broadcast media, all types of audio and video processing and transmission,4
and network based control and monitoring functions" [Sal12, pp. 9-10]. In the transport sector
ICT systems are responsible for data collection, data communication and data quality [ET]. One6
of the examples of multimodal ICT systems is the MIELE (Multimodal Interoperability E-services
for Logistics and Environment sustainability) project, conducted under the patronage of TEN-T8
EU (Trans-European Transport Network Executive Agency), which had as an objective the design
and development of a "pre-deployment pilot for an interoperable ICT platform (the "MIELE Mid-10
dleware") able to interface ICT systems (i.e. single windows, port community systems) in Italy,
Portugal, Spain, Cyprus and Germany (the "National Vertical Pilots")" [Con13, p. 1]. The project12
addresses the issue of collaboration of different transport modes, such as maritime, railway, road,
and air, for the purpose of multimotal freight transport management [OCMA13, p. 1].14
Besides the systems described above, most transport related IS are closely connected to Ge-
ographic Information Systems (GIS) that "combine computer graphics technology with data base16
structures and techniques of spatial analysis" [Hux91, p. 1]. GIS tools play an essential role in
performance measurements for transportation [Kit12, p. 39].18
In addition, it should be mentioned that some other types of IS find their application in the
world of transport, such as agent-based simulation systems, which can help in transportation anal-
ysis and control [FERO08, RB99, ROB07], and serious games, which help evolving managerial 2
skills [RAKG13].
13

Literature Review
Figure 2.1: Transport Canada LOS standards for Airport Terminals. [MBBI10, p. 148]
2.4 Studies Overview 4
2.4.1 Current Trends of Real-Time Multimodal Urban Mobility Information Ser-vices ( RTMMIS ) 6
The work describes a study performed in 2011, that identifies the trends in real-time multimodal
information systems (RTMMIS), within a research project aimed at "improving real-time public 8
transport information of commuters of the Sophia- Antipolis agglomeration in France" [GST11,
p. 1]. Analyzing the existing multimodal traveler information systems in and outside Europe, the 10
study comes to the following conclusion on the availability of a multimodal view on five major
types of information: 12
• Advice / tips (’User Manual’ of the transport network, practical advising) – variable;
• Reference (available reference information sources) – Public Transport plus car; 14
• Recurring or planned events – rare;
• Delays, including car park availability, road travel times – no; 16
• Perturbations – partial.
The results of the analysis clearly show current weak points in traveler information systems 18
that need attention. Two important issues that the study describes are local coordination and
open data which are crucial for multimodal IS of any kind, due to the involvement of numerous 20
infrastructures and organizations usually with a high share of private sector. The key success
factors identified by the study are [GST11, p. 9]:
• Sharing data2
• Common tools for coordinated mobility management and user information (data provision
platform, off-line observatory, traffic management tools, web portals)4
14
Literature Review
Table 2.8: IATA LOS standards for Airport Terminals (figures in square meters). [MBBI10, p.149]
TERMINAL AREA A B C D ECheck-in Queue Area 1.8 1.6 1.4 1.2 1.0Wait/Circulate 2.7 2.3 1.9 1.5 1.0Hold Room 1.4 1.2 1.0 0.8 0.6Baggage Claim 2.0 1.8 1.6 1.4 1.2Government Inspection Services 1.4 1.2 1.0 0.8 0.6
• User participation.
Despite that the study considers multimodal solutions existing for traveler’s needs, rather than6
for situation monitoring by public authorities, it provides a useful overview of multimodal solu-
tions existing at the moment as well as identifies major problems, weak points and key factors in8
this area.
2.4.2 ITS Action Plan. Study "Towards a European Multi-Modal Journey Plan-10
ner"
The study has been carried out within the ITS Action Plan policy framework, promoting the de-12
velopment of multimodal travel information services. The objective of the study is "to support
the EC’s work towards a European multi-modal journey planner, and to prepare the elaboration14
of functional, technical, organizational and service provision specifications as required by the ITS
Directive" [TR11, p. 3]. The study provides a detailed analysis of some of the existing journey16
planners on regional, national and international scale, pointing out their strong and weak sides:
Regional scale: transport-idf.com, vialsace.eu, jv-malin.fr18
National scale: Rejseplanen.dk, Transport Direct, IDOS
International scale: EU-Spirit, Google Transit.
The study also suggests a detailed review of technical aspects of journey planners, taking into 2
account transport multimodality and multiple information sources. It describes three main types
of architecture: 4
• Centralized
• Decentralized with a central DB and application 6
• Fully decentralized
Decentralized architectures collate data from multiple local sites into a centralized database. 8
Different parts of the itinerary are collected from the different sites and then assembled into the full
journey by the application. Whereas, in case of a centralized architecture, the main site aggregates 10
data from multiple sources in a central database and performs all calculations.
The data flow is divided into a number of consecutive steps: 12
15
Literature Review
Table 2.9: Definition of Levels of Service for Inland Locks. [Mck13, p. 6]
Level Title Description Guideline for Range of LockOperation Data
1 Full Service24/7/365
24 hours/day, 7 days/week, 365days/year
More than 1,000 commerciallockages per year
2 Reduced Ser-vice - TwoShifts Per Day
16-20 hours/day, 7 days/week,365 days/year (two shifts of ei-ther 8 or 10 hrs)
Between 500 to 1,000 commer-cial lockages per year.
3 Limited Ser-vice - SingleShift
8-12 hours per day, 7 days/week,365 days/year
Less than 500 commercial lock-ages per year or greater than1,000 recreational lockages peryear
4 ScheduledService - Settimes per day
Lockages (including recreationcraft) at set times per day. Forexample 8 am and 4 pm.
Limited commercial and/or sub-stantial recreational traffic, witha more consistent pattern oflockage
5 Weekends &Holidays
Lockages on weekends and hol-idays only
Little to no commercial lockageswith significant recreationallockages (500 or more per year)with no consistent pattern.
6 Service by Ap-pointment
Commercial lockages by ap-pointment
Limited commercial traffic withno consistent pattern of lockage.
• Raw data (basic data acquisition)
• Data validation and integration 14
• Information production (processing phase)
• Service generation (insertion of data in a service system) 16
• Service delivery (dissemination)
• Consumption (by users) 18
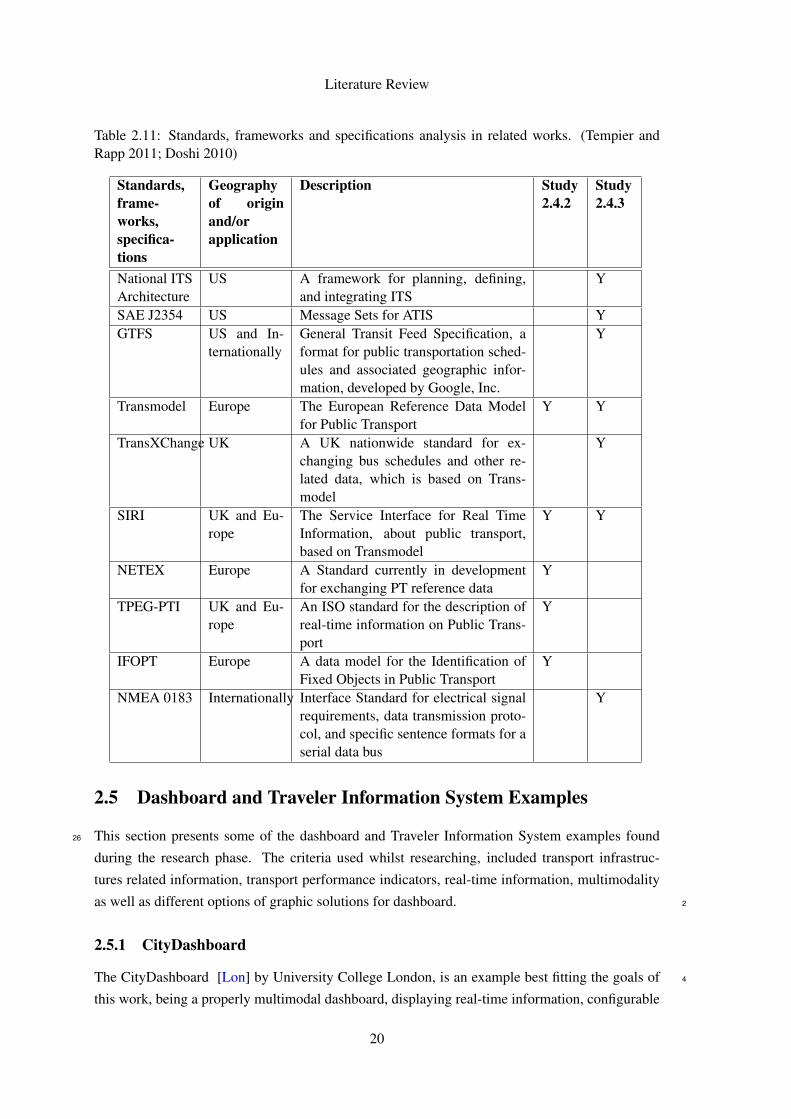
The study makes a review of the existing standards on data models and data exchange inter-
faces, as shown in the Table 2.11. 20
In general, the study contains some useful information in the scope of this work, such as
architecture and standards overview, however is focused on journey planning needs, rather than 22
transport network performance monitoring.
2.4.3 Designing A Multi-Modal Traveler Information Platform For Urban Trans- 24
portation
This thesis project was performed in 2008 - 2010, at Georgia Institute of Technology, the United 26
States, and was aimed at creation of a multimodal travel information platform for urban area
16

Literature Review
Table 2.10: Operating Regimes for Commercial Navigation, The Netherlands [aN11, p. 144]
regime Monday Tuesday – Friday Saturday Sunday total weekly hours1 0 - 24 0 - 24 0 - 24 0 - 24 1682 6 - 24 0 - 24 0 - 20 8 – 20 1463 6 - 22 6 - 22 8 - 20 9 – 17 1004 6 - 22 6 - 22 8 - 18 – 905 7 - 19 7 - 19 – – 60
transport [Dos10, p. xii]. The work reviews the standards, frameworks and specifications, existing
in the United States and worldwide, which are listed in the Table 2.11, as well as some examples2
of journey planning solutions existing in the world.
The set of requirements defined for the platform’s final version, RideVia:4
• Store real-time transit data
• Store data for multiple modes6
• Display real-time and static data
• Drive multiple applications8
• Multi-modal trip Planning
• Store real-time data history10
• Use of uniform data formats
• Scalability and extensibility12
• Maintainability
• Loose coupling between layers14
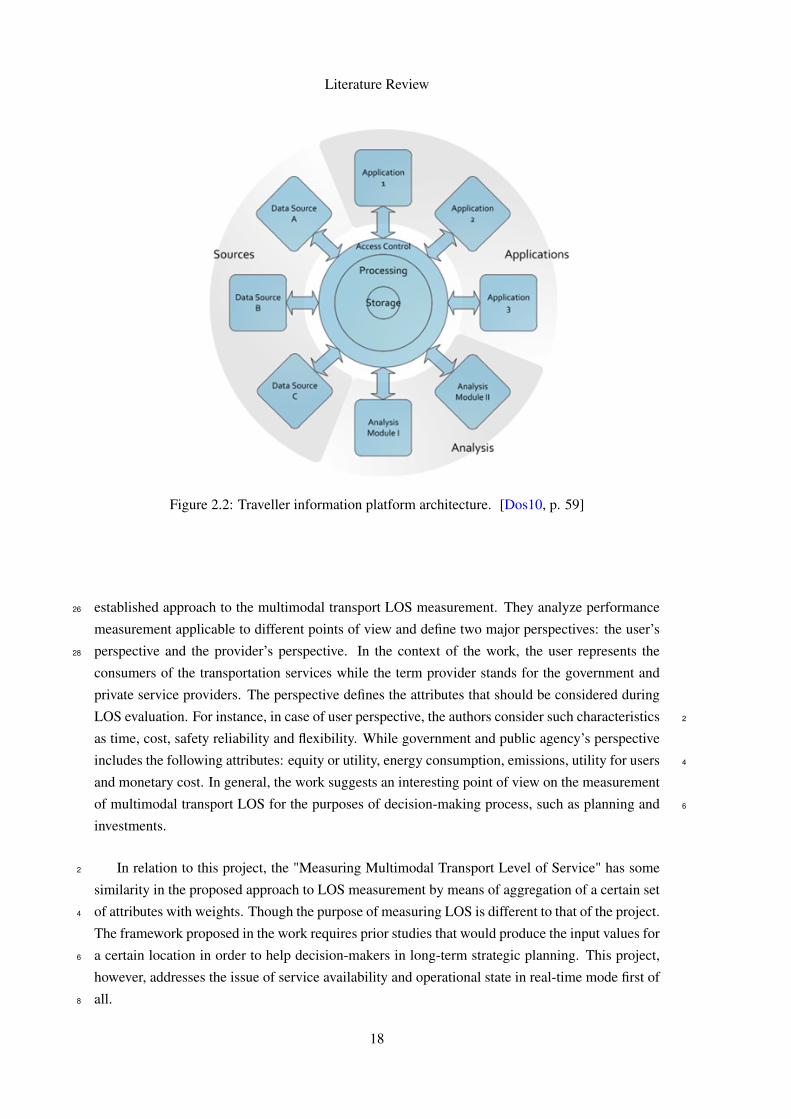
The Figure 2.2 shows a general view of a traveler information platform architecture that in-
cludes multiple data sources, as suggested by the study.16
The work addresses some of the challenges of this project that are introduced by the multi-
modality, such as multiple sources of information, information exchange standards, transforming18
raw data into useful information. The objectives of the work however are different, in the way that
it is intended for journey planning purposes, where the final user would be a traveler, and doesn’t20
address such issues as transport modes performance monitoring.
2.4.4 Measuring Multimodal Transport Level of Service22
In the report conducted by Adib Kanafani and Rui Wang, University of California, Berkeley,
in 2010, the authors focus on the elaboration of a framework for the evaluation of the level of24
service of multimodal transport [KW10, p. 1]. The authors speak in their work of the lack of an
17
Literature Review
Figure 2.2: Traveller information platform architecture. [Dos10, p. 59]
established approach to the multimodal transport LOS measurement. They analyze performance26
measurement applicable to different points of view and define two major perspectives: the user’s
perspective and the provider’s perspective. In the context of the work, the user represents the28
consumers of the transportation services while the term provider stands for the government and
private service providers. The perspective defines the attributes that should be considered during
LOS evaluation. For instance, in case of user perspective, the authors consider such characteristics 2
as time, cost, safety reliability and flexibility. While government and public agency’s perspective
includes the following attributes: equity or utility, energy consumption, emissions, utility for users 4
and monetary cost. In general, the work suggests an interesting point of view on the measurement
of multimodal transport LOS for the purposes of decision-making process, such as planning and 6
investments.
In relation to this project, the "Measuring Multimodal Transport Level of Service" has some2
similarity in the proposed approach to LOS measurement by means of aggregation of a certain set
of attributes with weights. Though the purpose of measuring LOS is different to that of the project.4
The framework proposed in the work requires prior studies that would produce the input values for
a certain location in order to help decision-makers in long-term strategic planning. This project,6
however, addresses the issue of service availability and operational state in real-time mode first of
all.8
18

Literature Review
Figure 2.3: LOS Model Interactions [DRF+08, p. 95]
2.4.5 Multimodal Level of Service Analysis for Urban Streets
The report issued by TRB within a NATIONAL COOPERATIVE HIGHWAY RESEARCH PRO-10
GRAM is another example of a framework for measuring multimodal transport LOS. It describes
an extensive study that had been carried out, including a comprehensive analysis of existing LOS12
evaluation metrics and frameworks and a survey of LOS perceived by different participants of road
flow (car drivers, transit passengers, bicycle riders, and pedestrians). The objective of the work14
was to "develop and test a framework and enhanced methods for determining levels of service for
automobile, transit, bicycle, and pedestrian modes on urban streets, paying particular respect to the16
interaction among the modes" [DRF+08, p. 3]. Though the report does not aggregate LOS values
of different modes in one single value, it provides a profound analysis of modes interactions, as it18
is seen in Figure 2.3.
The report is dedicated solely to road transport and is intended to help in urban street planning20
and decision making.
2.4.6 Standards in Related Works22
The Table "Standards, frameworks and specifications analysis in related works", 2.11, lists com-
munication standards and frameworks that were reviewed by the related works described above.24
19
Literature Review
Table 2.11: Standards, frameworks and specifications analysis in related works. (Tempier andRapp 2011; Doshi 2010)
Standards,frame-works,specifica-tions
Geographyof originand/orapplication
Description Study2.4.2
Study2.4.3
National ITSArchitecture
US A framework for planning, defining,and integrating ITS
Y
SAE J2354 US Message Sets for ATIS YGTFS US and In-
ternationallyGeneral Transit Feed Specification, aformat for public transportation sched-ules and associated geographic infor-mation, developed by Google, Inc.
Y
Transmodel Europe The European Reference Data Modelfor Public Transport
Y Y
TransXChange UK A UK nationwide standard for ex-changing bus schedules and other re-lated data, which is based on Trans-model
Y
SIRI UK and Eu-rope
The Service Interface for Real TimeInformation, about public transport,based on Transmodel
Y Y
NETEX Europe A Standard currently in developmentfor exchanging PT reference data
Y
TPEG-PTI UK and Eu-rope
An ISO standard for the description ofreal-time information on Public Trans-port
Y
IFOPT Europe A data model for the Identification ofFixed Objects in Public Transport
Y
NMEA 0183 Internationally Interface Standard for electrical signalrequirements, data transmission proto-col, and specific sentence formats for aserial data bus
Y
2.5 Dashboard and Traveler Information System Examples
This section presents some of the dashboard and Traveler Information System examples found26
during the research phase. The criteria used whilst researching, included transport infrastruc-
tures related information, transport performance indicators, real-time information, multimodality
as well as different options of graphic solutions for dashboard. 2
2.5.1 CityDashboard
The CityDashboard [Lon] by University College London, is an example best fitting the goals of 4
this work, being a properly multimodal dashboard, displaying real-time information, configurable
20

Literature Review
Figure 2.4: The FAST Dashboard [(RT]
to a certain extent, allowing layout changes by moving information blocks. It isn’t focused on 6
transport, but it does offer some transport related information, such as:
• Tube line status 8
• Bike sharing (bikes available, stations empty, etc.)
• Buses and underground trains in service 10
• Street cameras snapshots
This dashboard however is missing information on other modes of transport, such as airport 12
functioning, waterborne transport (only river level is available) and doesn’t suggest proper trans-
port networks LOS related data, that might include road congestion levels, buses on-time perfor- 14
mance, etc.
2.5.2 The FAST Dashboard 16
This dashboard [(RT] is not multimodal, it is focused solely on road traffic information in Las
Vegas, Nevada, US. But it offers an interesting combination of charts, map and camera views 18
that allow monitoring current situation with roads LOS, daily and weekly historical data, monthly
average speeds and some other useful information, Figure 2.4. 20
2.5.3 RCMP Roadway Performance Dashboard
Regional Congestion Management Program (RCMP) Performance Dashboard [oG] displays charts 22
with historical data on roads performance indicators such as lane miles by LOS, Centerline Miles
by Pedestrian, Bicycle and Transit LOS. It is LOS-oriented and multimodal in the sense that it 24
21
Literature Review
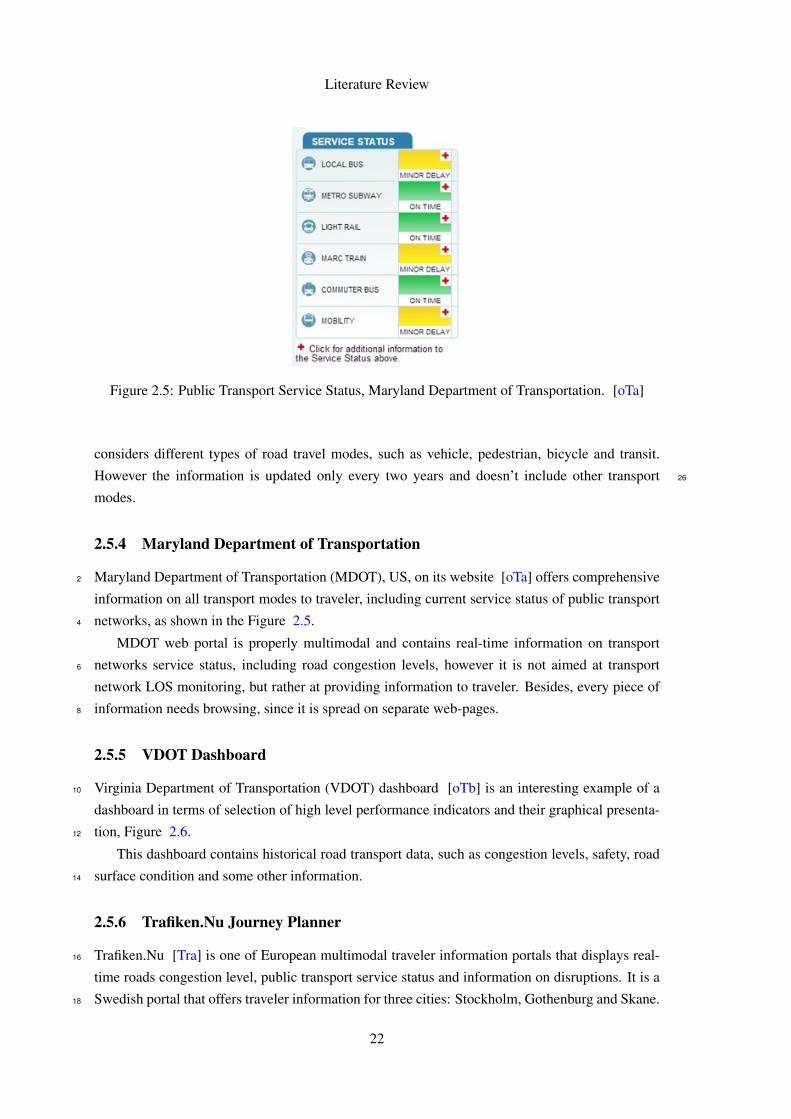
Figure 2.5: Public Transport Service Status, Maryland Department of Transportation. [oTa]
considers different types of road travel modes, such as vehicle, pedestrian, bicycle and transit.
However the information is updated only every two years and doesn’t include other transport 26
modes.
2.5.4 Maryland Department of Transportation
Maryland Department of Transportation (MDOT), US, on its website [oTa] offers comprehensive2
information on all transport modes to traveler, including current service status of public transport
networks, as shown in the Figure 2.5.4
MDOT web portal is properly multimodal and contains real-time information on transport
networks service status, including road congestion levels, however it is not aimed at transport6
network LOS monitoring, but rather at providing information to traveler. Besides, every piece of
information needs browsing, since it is spread on separate web-pages.8
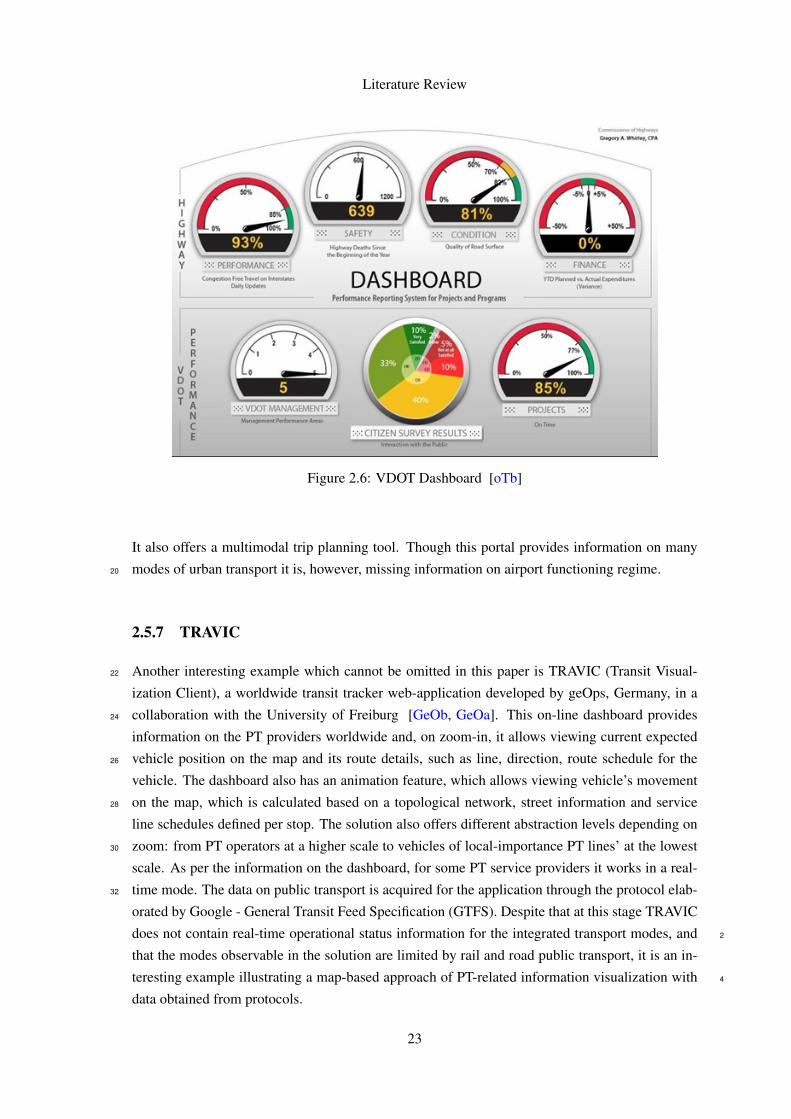
2.5.5 VDOT Dashboard
Virginia Department of Transportation (VDOT) dashboard [oTb] is an interesting example of a10
dashboard in terms of selection of high level performance indicators and their graphical presenta-
tion, Figure 2.6.12
This dashboard contains historical road transport data, such as congestion levels, safety, road
surface condition and some other information.14
2.5.6 Trafiken.Nu Journey Planner
Trafiken.Nu [Tra] is one of European multimodal traveler information portals that displays real-16
time roads congestion level, public transport service status and information on disruptions. It is a
Swedish portal that offers traveler information for three cities: Stockholm, Gothenburg and Skane.18
22
Literature Review
Figure 2.6: VDOT Dashboard [oTb]
It also offers a multimodal trip planning tool. Though this portal provides information on many
modes of urban transport it is, however, missing information on airport functioning regime.20
2.5.7 TRAVIC
Another interesting example which cannot be omitted in this paper is TRAVIC (Transit Visual-22
ization Client), a worldwide transit tracker web-application developed by geOps, Germany, in a
collaboration with the University of Freiburg [GeOb, GeOa]. This on-line dashboard provides24
information on the PT providers worldwide and, on zoom-in, it allows viewing current expected
vehicle position on the map and its route details, such as line, direction, route schedule for the26
vehicle. The dashboard also has an animation feature, which allows viewing vehicle’s movement
on the map, which is calculated based on a topological network, street information and service28
line schedules defined per stop. The solution also offers different abstraction levels depending on
zoom: from PT operators at a higher scale to vehicles of local-importance PT lines’ at the lowest30
scale. As per the information on the dashboard, for some PT service providers it works in a real-
time mode. The data on public transport is acquired for the application through the protocol elab-32
orated by Google - General Transit Feed Specification (GTFS). Despite that at this stage TRAVIC
does not contain real-time operational status information for the integrated transport modes, and 2
that the modes observable in the solution are limited by rail and road public transport, it is an in-
teresting example illustrating a map-based approach of PT-related information visualization with 4
data obtained from protocols.
23

Literature Review
Table 2.12: Data Communication Protocols Comparison (Y = Yes, N = No).
Protocol Geography Used in Portugal RoadTraffic
PT LocationReferencing
XML sup-ported
TPEG EU, Worldwide Not confirmed Y Y Y YDATEX I, II EU Y Y N Y YSIRI UK, EU N Y Y YNeTEx EU N Y Y YTransXChange UK N Y YGTFS Worldwide Y [ptpL] N Y Y N
2.6 Data Communication Protocols 6
Data communication protocols are essential for applications comprising multiple exterior data
sources, like this project. Many protocols exist today in the world for transport related data ex- 8
change. Efforts have been and are being performed for their standardization and increased com-
patibility. The Table 2.12 suggests a brief comparison based on some most important features for 10
the major protocols used in Europe. The features taken into account are: geography of application,
whether a protocol is used in Portugal, supply of information on road traffic and/or public transport
(PT), location referencing and support of XML files for data transmission over the Internet. 2
To date, TPEG is the only protocol family covering data exchange both on road traffic (TPEG-
RTM) and public transport (TPEG-PTI) [TIS12, pp. 7-9]. 4
DATEX is Europe-wide standard for road traffic information exchange. In Portugal it is used
by INIR, Brisa and Estradas Portugal [BLA12, pp. 26-28] [vdVLW13, Annex]. 6
SIRI is a European protocol for real-time public transport information exchange, which is
widely used in Europe, especially UK. It also served as a base for the development of NeTEx 8
standard [CEN13, CEN09, Mob12, p. 7].
NeTEx is a new protocol, which is expected to become a new Europe-wide standard for com- 10
munication and data exchange on all mass public transport modes, including rail, bus, ferry and
airports [CEN09, p. 8]. Some of its parts are still on the development phase. It is based on other 12
protocols and standards, such as SIRI, Transmodel and IFOPT [CEN09, p. 7]. The standard is
compatible with TPEG and some country-specific standards, such as VDV 452 and Neptune. 14
GTFS, defined as The General Transit Feed Specification, is a standard developed by Google
for sharing public transport schedules and geographic information [Goob]. The protocol isn’t 16
widely used in Portugal yet, but it is gradually gaining popularity.
2.7 Conclusions 18
LOS concepts and their measurement methods are well defined and standardized for some trans-
port modes and infrastructure elements, such as road traffic, airport and public transport terminals, 20
waiting areas, flight delays. However, the existing metrics unfortunately do not fully cover all
24

Literature Review
Table 2.13: Dashboard and Traveller Information System Examples Comparison.
Source Name Scope LOS Indi-cators
RT MM Dashboard
CityDashboard Transport and more Y Y Y YFAST Dashboard Road transport Y Y YRCMP Dashboard Road transport Y Within road
modeY
MDOT Transport, TIS Y Y YVDOT Dashboard Road transport Y YTrafiken.Nu Transport, TIS, JP Y Y YTRAVIC PT N Y/N Within PT Y
modes and components of urban transport networks. Namely, the question of measuring water- 22
borne transport facilities, like ports, docks and locks, remains open and requires consultations with
professionals working in the area. When metrics are available, they are usually applied to small 24
facilities or components of a transport system, e.g. a transit terminal or a road segment. However
the goals of this project include providing a judgment on the operational status of entire transport
modes and the whole transportation network in a monitored region. In these cases, a strategy for2
evaluating the LOS at different levels of abstraction and granularity needed to be defined for the
dashboard.4
Besides the absence of information on certain LOS metrics, there exists a significant diver-
sity of approaches to transport systems performance evaluation which vary between departments,6
towns, regions and countries. That presented another challenge and required a thorough planning
of the application and LOS evaluation model to ensure their flexibility and extensibility.8
Many US governmental dashboards were found offering transport LOS related information
within a scope of a city, state or countrywide. Most of these examples however contain historical10
rather than real-time data and few of them are multimodal. The majority of multimodal transport
portals and applications that exist today are Traveler Information Systems (TIS) and/or Journey12
Planners (JP) and are not focused on observing transport systems status. A brief comparison of the
examples described in this chapter is presented in the Table 2.13. Comparison criteria were chosen14
based on their relevance to this work and include the scope, presence of LOS related information,
real-time information, multimodality and the form of presentation.16
As it was mentioned before, the CityDashboard, UK, corresponds to the goals of this work to
the highest degree, though it doesn’t cover all transport modes.18
The gaps that were detected in the literature review exhibit the lack of integrated multimodal
transport monitoring solutions and create an opportunity for innovation. As it was stated in one of20
the reviewed studies, the data access is one of the key issues in building applications that provide
information on multimodal transport [GST11, p.10]. This may be an obstacle in cases, when22
there are numerous stakeholders both from private and public sector, due to restricting data access
policies of the data owners. In this respect, a governmental will and mutual benefits may play24
an essential role, which requires a detailed analysis of possible purposes of use of the dashboard
25

Literature Review
or information provided by the system through web-services for the key participants in order to26
deliver the vision of possible opportunities for the stakeholders. Another challenge consists in the
diversity of data communication channels and formats. However, as the study of the existing pro-28
tocols shows, there already exist some common standards as well as Europe-wide trends towards
further standardization of data communication for transport area. This will facilitate considerably30
the elaboration of the application and its further introduction to the market.
26

Chapter 332
Problem and Methodology
This chapter provides a closer look at the problem and the necessary steps towards its solution. 2
The methodological approach section includes a description of major phases of the project before
the implementation, its proposed architecture and an approach to dashboard presentation. 4
3.1 Problem Definition
The objective of the work consists in studying the possibility of creating a tool for monitoring 6
multimodal transport network performance level in an integrated form in real-time mode. Such a
tool should provide support in transport management and decision-making process. 8
This task imposes a certain number of challenges to overcome. First of all it is necessary to
build a set of LOS measurement metrics to cover all transport modalities integrated in the solu- 10
tion. These metrics usually measure performance level of small components of a transport system,
such as a road segment or a public transport service line, etc. Thus, the next step would be un- 12
derstanding how to evaluate LOS of entire transport systems (rail transport, maritime transport,
etc.) and the transport network as a whole, based on the measures obtained for the smaller compo- 14
nents. The diversity of transport modes, infrastructures and performance measure policies presents
another challenge, implying heterogeneous data structures and entity relationships, diverse LOS2
scales and calculation methods. It is critical in these conditions to identify similar patterns and
define ontology that could be applied to all modes and their components. Also, the high number4
of stakeholders brought by multimodality results in multiple data sources and thus diverse data
formats. Therefore the system’s architecture should be tailored to integrate multiple data sources.6
The presentation metaphors for the dashboard require a separate analysis. It is necessary to
understand how to deliver the information to the user in an efficient and understandable form8
and how to integrate different transport domains and levels of abstraction in a single dashboard.
Understanding what output information is available for the user is crucial for the accomplishment10
of this task.
27

Problem and Methodology
The overview and analysis of the proposed solution and approaches to addressing the chal-12
lenges derived from the problem are presented in Section 3.3.
3.2 Requirements Analysis14
The main requirements to the integrated multimodal transportation dashboard consist in the fol-
lowing:
• Real-time monitoring of urban transport systems LOS; 2
• Comprehensive view of the information related to different transport modes;
• Ease of use and understanding; 4
• Quick alerting;
• Configurability and customization. 6
This brings up certain problems that need to be solved, such as:
• LOS measuring methods for different transport modes (when measured, it is usually only 8
done for a single mode);
• LOS evaluation based on data supplied by protocols and other available sources; 10
• The design of an integrated view on various transport systems;
• Combination of different modes LOS in one dashboard. 12
The next subsections explain the software quality requirements that were identified for the
proposed solution and the involved stakeholders. 14
3.2.1 Software Quality Requirements
The system’s quality requirements were defined based on ISO 9126 standard that defines Software 16
Quality Requirements model [PPM10, Fle] and consist in the following:
• Functionality 18
– Suitability - the conformity of the system to its specification;
– Accuracy - correctness of functions results;2
– Interoperability - this is an essential characteristic of the system, taking into account
its dependence on diverse information sources (communication protocols, etc.);4
• Reliability
28

Problem and Methodology
– Fault tolerance - since the concept of a dashboard implies continuous usage of an6
application, the system should be capable of error handling;
– Recoverability - the ability of the system to resume working after a failure without8
data loss;
• Usability10
– Understandability - the system’s interface should be intuitive to users of different level
of computer literacy12
– Learnability - the system shouldn’t present any challenges to its users in learning pro-
cess, which should take little time;14
– Operability - users should be able to comprehend the current status of transport sys-
tems "at a glance" and reach the necessary information easily;16
• Efficiency
– Time behavior - for an application working in a real-time mode, response time should18
be reduced to useful time;
– Resource utilization - taking into account the volume of information implied by mul-20
timodality, optimal resource use should be one of the major concerns;
• Maintainbility22
– Changeability - an important feature due to the high number and diversity of stake-
holders and possible users of the system, as well as use purposes;24
– Stability - since the probability of further modifications is expected to be high, the
system should be able to continue functioning in an expected way;26
• Security - the system is projected to provide public and authorization-based access to its
users, therefore, it should be ensured that the protected functionalities and information
should be prevented from unauthorized access. 2
3.2.2 Stakeholders
The audience of the information on multimodal transport is very wide and diverse. It includes 4
local authorities, public and private organizations and general public - all providers and users
of the transport service. Literally every person and organization is related to or dependent on 6
the transportation to some extent. However it is necessary to identify user groups in order to
understand the purposes of their use of the information on transport LOS and use patterns. The 8
typical classification in such case is subdivision into service providers and consumers [KW10, p.
4]. However, within the context of this work a more detailed analysis of stakeholders is essential. 10
29
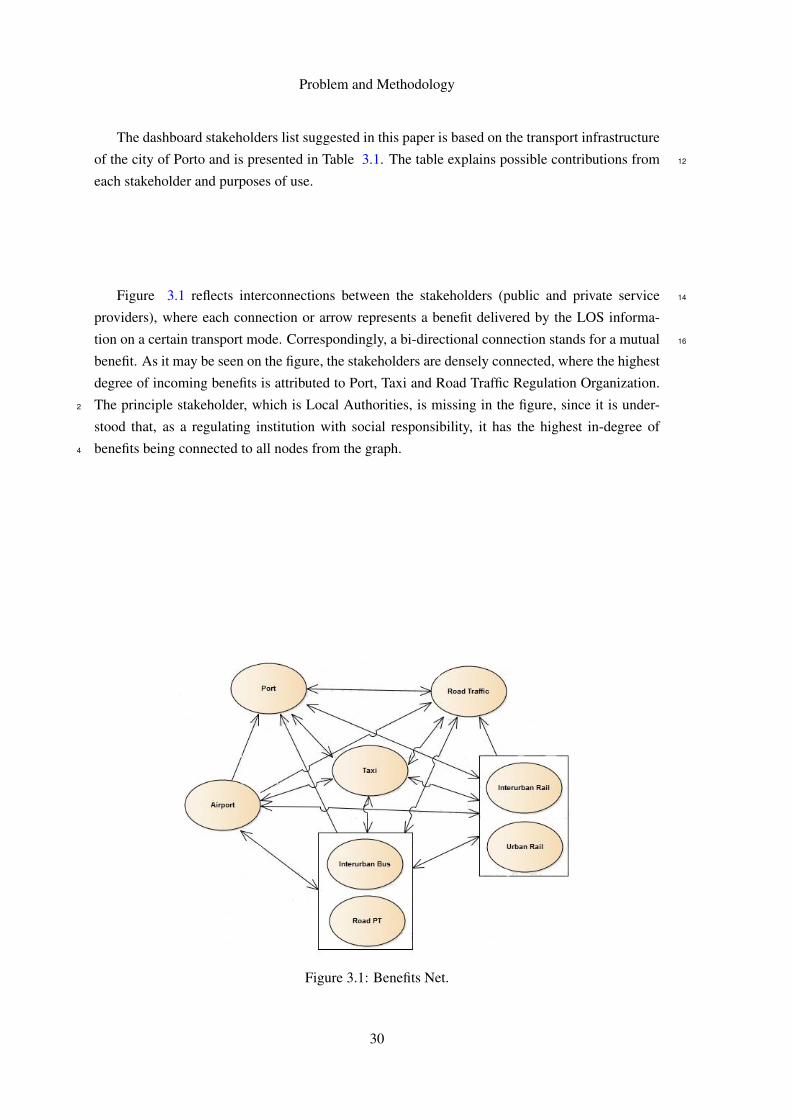
Problem and Methodology
The dashboard stakeholders list suggested in this paper is based on the transport infrastructure
of the city of Porto and is presented in Table 3.1. The table explains possible contributions from 12
each stakeholder and purposes of use.
Figure 3.1 reflects interconnections between the stakeholders (public and private service 14
providers), where each connection or arrow represents a benefit delivered by the LOS informa-
tion on a certain transport mode. Correspondingly, a bi-directional connection stands for a mutual 16
benefit. As it may be seen on the figure, the stakeholders are densely connected, where the highest
degree of incoming benefits is attributed to Port, Taxi and Road Traffic Regulation Organization.
The principle stakeholder, which is Local Authorities, is missing in the figure, since it is under-2
stood that, as a regulating institution with social responsibility, it has the highest in-degree of
benefits being connected to all nodes from the graph.4
Figure 3.1: Benefits Net.
30
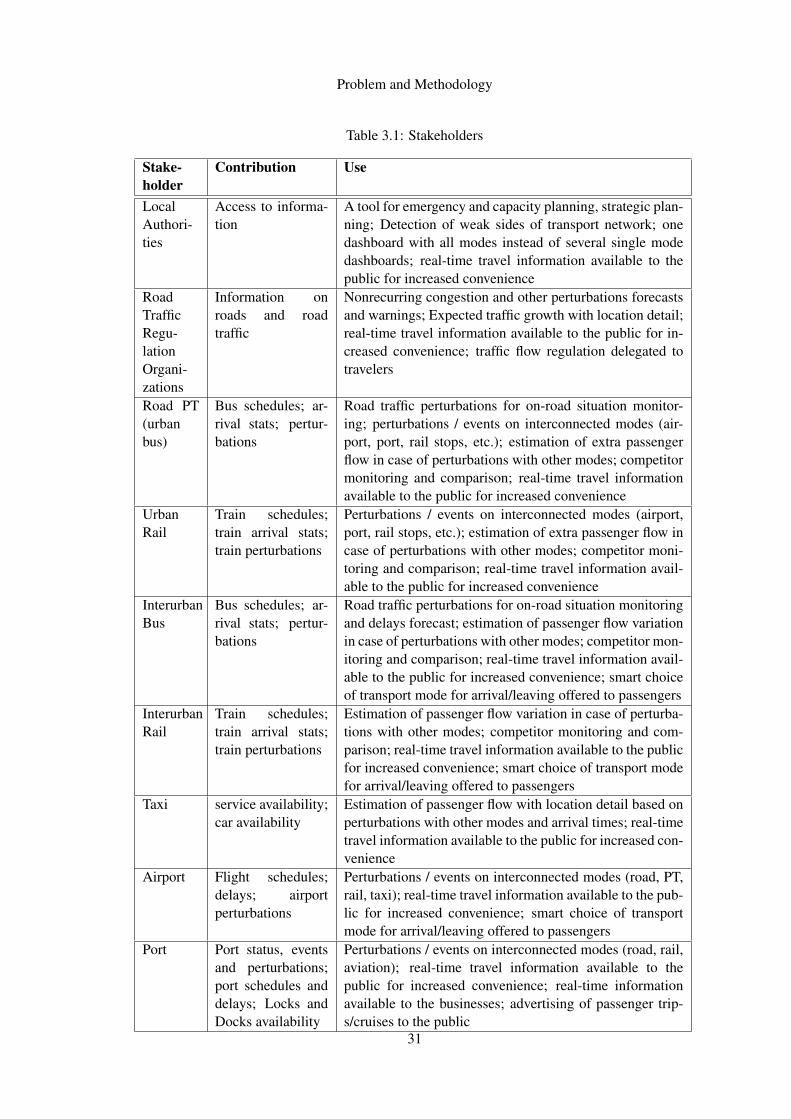
Problem and Methodology
Table 3.1: Stakeholders
Stake-holder
Contribution Use
LocalAuthori-ties
Access to informa-tion
A tool for emergency and capacity planning, strategic plan-ning; Detection of weak sides of transport network; onedashboard with all modes instead of several single modedashboards; real-time travel information available to thepublic for increased convenience
RoadTrafficRegu-lationOrgani-zations
Information onroads and roadtraffic
Nonrecurring congestion and other perturbations forecastsand warnings; Expected traffic growth with location detail;real-time travel information available to the public for in-creased convenience; traffic flow regulation delegated totravelers
Road PT(urbanbus)
Bus schedules; ar-rival stats; pertur-bations
Road traffic perturbations for on-road situation monitor-ing; perturbations / events on interconnected modes (air-port, port, rail stops, etc.); estimation of extra passengerflow in case of perturbations with other modes; competitormonitoring and comparison; real-time travel informationavailable to the public for increased convenience
UrbanRail
Train schedules;train arrival stats;train perturbations
Perturbations / events on interconnected modes (airport,port, rail stops, etc.); estimation of extra passenger flow incase of perturbations with other modes; competitor moni-toring and comparison; real-time travel information avail-able to the public for increased convenience
InterurbanBus
Bus schedules; ar-rival stats; pertur-bations
Road traffic perturbations for on-road situation monitoringand delays forecast; estimation of passenger flow variationin case of perturbations with other modes; competitor mon-itoring and comparison; real-time travel information avail-able to the public for increased convenience; smart choiceof transport mode for arrival/leaving offered to passengers
InterurbanRail
Train schedules;train arrival stats;train perturbations
Estimation of passenger flow variation in case of perturba-tions with other modes; competitor monitoring and com-parison; real-time travel information available to the publicfor increased convenience; smart choice of transport modefor arrival/leaving offered to passengers
Taxi service availability;car availability
Estimation of passenger flow with location detail based onperturbations with other modes and arrival times; real-timetravel information available to the public for increased con-venience
Airport Flight schedules;delays; airportperturbations
Perturbations / events on interconnected modes (road, PT,rail, taxi); real-time travel information available to the pub-lic for increased convenience; smart choice of transportmode for arrival/leaving offered to passengers
Port Port status, eventsand perturbations;port schedules anddelays; Locks andDocks availability
Perturbations / events on interconnected modes (road, rail,aviation); real-time travel information available to thepublic for increased convenience; real-time informationavailable to the businesses; advertising of passenger trip-s/cruises to the public
31

Problem and Methodology
Figure 3.2: Workflow.
3.3 Methodological Approach
This section is dedicated to the methodology used in the project, which was defined based on the6
software requirements engineering process partially described in the previous section and comple-
mented by the Appendix E. The work-flow may be divided into six phases, as shown in the Figure8
3.2.
3.3.1 LOS Metrics10
The study of the relevant literature and state-of-the-art on LOS metrics and scales applied to dif-
ferent transport modes served as a background for defining LOS calculation model for the project.12
However, the existing metrics unfortunately do not fully cover all modes and components of
urban transport networks. For instance, the method for measuring ports operational state was14
specially defined for this project, as well as some other indicators.
The existing metrics that have been included in the project based on their applicability to the16
case study are as follows:
• Road Traffic LOS, defined by "Highway Capacity Manual" (HCM), issued by the Trans-18
portation Research Board (TRB), US, which is a worldwide point of reference. This manual
suggests techniques for calculation of LOS for different road types by attributing values20
from A (the best, free vehicle flow) to F (the worst, high congestion), based on flow rates
[BOA00, p. 10-15] [Ens12, p. 32].22
• Terminal LOS for Road and Railway Public Transport, such as bus terminals, subway ter-
minals, etc. The Transportation Research Board (TRB), US, in its "Transit Capacity and
Quality of Service Manual" suggests a method for measuring the level of service for pas- 2
senger waiting areas or terminals based on passenger density [Kit99a, Part 4].
• Public Performance Measure (PPM), which is used in United Kingdom to measure rail lines 4
on-time performance. This indicator measures percentage of trains that arrive at destination
on time [Rai, Kee13, p. 2]. 6
32

Problem and Methodology
• Airport terminal LOS, that is based on passenger density, similarly to public transport termi-
nals LOS. These metrics have been adopted by The International Air Transport Association 8
(IATA) [MBBI10, p. 149] [JP07, p. 525] and have become an internationally recognized
standard. 10
• Average Airport delays per flight (minutes) [Dir13, p. 5] [Net13, p. 1];
• Total Airport delays (minutes) [(EU14]; 12
• Flights with 15 or more minutes delay (the threshold is set to 30 minutes in some sources)
[Com05, (EU14, p. III]. 14
It is understood that new LOS metrics may be introduced in future, therefore it is important
that the LOS calculation model is flexible enough to integrate new measures. 16
3.3.2 Sources and Information
This phase included the study of information sources that exist for different transport modes and2
their data sets. In general, due to the multimodality of the dashboard, there will exist various
sources of information, but what truly presents an interest in this case, is how the information is to4
be communicated. In transportation area, there exists a number of standards and protocols. Since
this case study is performed for Porto, it considers the standards spread in Europe, especially those6
used in Portugal.
The following protocols and standards have been selected:8
• DATEX II. This is a Europe-wide standard for road traffic information exchange with a high
coverage in European countries [vdVLW13, p. 28]. In Portugal this standard is used by10
Brisa and Estradas Portugal [BLA12, pp. 26-28]. It communicates information that may be
divided into the following categories [BLA12, p. 11]:
– Road and traffic related events (named "Traffic elements") 2
– Operator actions
– Impacts 4
– Non-road event information
– Elaborated data (derived/computed data, e.g. travel times, traffic status) 6
– Measured data (direct measurement data from equipment or outstations, e.g. traffic
and weather measurements) 8
– Messages displayed on Variable Message Signs (VMS).
• TPEG – a standard with a good coverage in European countries [vdVLW13, p. 96, Annex] 10
[Kop03, pp. 3-4,14]. It has several versions including:
– TPEG-PTI – multimodal public transport information 12
33

Problem and Methodology
Figure 3.3: Primary Data Model.
– TPEG-RTM – road traffic messages
This protocol supports transmission of data in a form of data stream messages or XML
through various channels: RDS-TMC, teletext and Internet. The messages are language2
independent and constructed based on TPEG tables. Each TPEG table has its own Id and
contains a set of attributes, their codes and translations to several languages [BBC, TIS12,4
p.8].
3.3.3 Primary Data Model6
This phase includes the analysis of relevant raw data, its categorization and structuring, data sets
provided by the sources identified on the previous phase and elaboration of a primitive data struc-8
ture diagram.
The general view of the diagram is presented in the Figure 3.3, where there are listed the main10
travel mode categories, such as Rail, Water, Air, Road Traffic, Public Transport and Self-Drive,
and their subcategories.12
Each data category includes one or more subcategories representing the protocols applicable to
the corresponding categories. Each such subcategory includes data sets delivered by the protocol.14
34
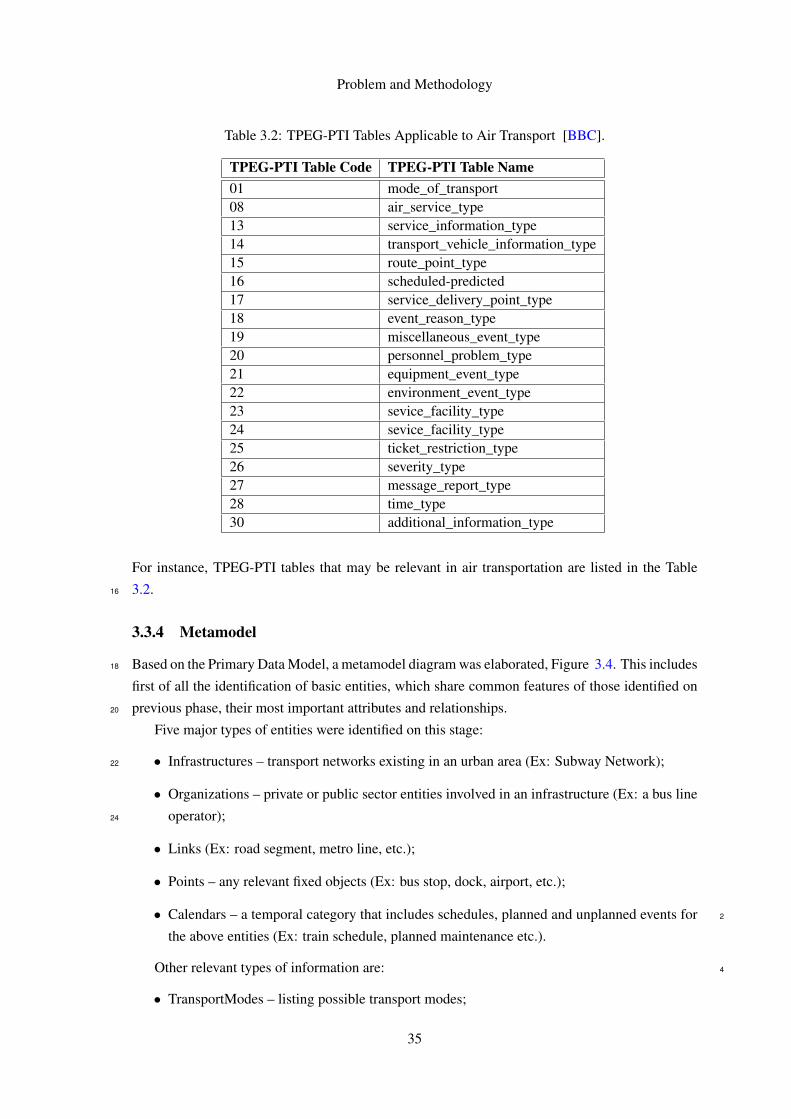
Problem and Methodology
Table 3.2: TPEG-PTI Tables Applicable to Air Transport [BBC].
TPEG-PTI Table Code TPEG-PTI Table Name01 mode_of_transport08 air_service_type13 service_information_type14 transport_vehicle_information_type15 route_point_type16 scheduled-predicted17 service_delivery_point_type18 event_reason_type19 miscellaneous_event_type20 personnel_problem_type21 equipment_event_type22 environment_event_type23 sevice_facility_type24 sevice_facility_type25 ticket_restriction_type26 severity_type27 message_report_type28 time_type30 additional_information_type
For instance, TPEG-PTI tables that may be relevant in air transportation are listed in the Table
3.2.16
3.3.4 Metamodel
Based on the Primary Data Model, a metamodel diagram was elaborated, Figure 3.4. This includes18
first of all the identification of basic entities, which share common features of those identified on
previous phase, their most important attributes and relationships.20
Five major types of entities were identified on this stage:
• Infrastructures – transport networks existing in an urban area (Ex: Subway Network);22
• Organizations – private or public sector entities involved in an infrastructure (Ex: a bus line
operator);24
• Links (Ex: road segment, metro line, etc.);
• Points – any relevant fixed objects (Ex: bus stop, dock, airport, etc.);
• Calendars – a temporal category that includes schedules, planned and unplanned events for 2
the above entities (Ex: train schedule, planned maintenance etc.).
Other relevant types of information are: 4
• TransportModes – listing possible transport modes;
35

Problem and Methodology
Figure 3.4: Metamodel Diagram.
• VehicleTypes – types of vehicles applicable to each transport mode; 6
• Equipment – equipment on links and points;
• Status – service status which represents the output value for the dashboard and may be 8
applied to links, points, their equipment and infrastructures in general;
• ViewType – presentation modes applicable to each type of status. 10
3.3.5 Values Classification And Presentation Rules
This section identifies the LOS parameters that should be measured or calculated in order to deliver 12
the information on transport systems performance levels.
The suggested LOS values, that differ both in nature and detail level, are listed in the Table 14
D.1, Appendix D, per each transport mode, along with important characteristics such as data type,
boundaries and whether it is a single value or an array. 16
Based on the output values and their characteristics identified on the previous stage, it was
possible to define rules for the graphic presentation of each piece of information. The result of this 18
phase is a set of chart types that are applicable to each type of output value.
The first step consists in the identification of output values classes based on common patterns 20
between some values. The identified classes are listed in the Table 3.3.
The second step is to define presentation rules for each output value class. The rules are 22
defined for three scenarios:
36

Problem and Methodology
Table 3.3: Output Values Classification.
Nr Array or single value Type Boundaries1 Single Enum x values2 Array Enum x values3 Array Float [0,100], %4 Single Float [0,100], %5 Array Int/Float [0, 1440], mins6 Single Int [0, MaxValue]7 Single Int [0, Infinity]8 Array Text
• current data, to show real-time information; 24
• Historical data – discrete time, to provide historical information per day, per week, per
month, etc.; 26
• Historical data – continuous time, to show historical information in a continuous time for a
certain period. 28
The Table 3.4 includes suggested charts for each class and scenario.
3.3.6 Hierarchical LOS Evaluation 30
Taking into consideration the heterogeneity and hierarchical structure of such complex and large-
scale system as the Transportation Network, where LOS values differ in detail level and may 32
depend on each other, this paper suggests using ontology for the evaluation of the operational
status of the network’s components, as well as that of the entire network. 34
This approach includes several phases described below.
First step is the identification of abstraction levels which represent vertical structure of the 36
model. The levels identified for the Transportation Network are shown in Figure 3.5.
Next important phase is horizontal decomposition - identification of the elements each abstrac-
tion level consists of. In case of transport area, the domain level consists of Aviation, Railway,2
Waterborne and Road transport. Each domain is further decomposed into modes (e.g. Road do-
main includes such modes as Road Traffic, Urban Public Transport, Interurban Public Transport,4
Bicycle, Taxi), etc. The nodes from the Atomic level represent operational status indicators for
the smallest units in the system, which in case of Transportation can be a Bus Stop Terminal LOS,6
Road Segment Congestion status, Subway Line Operational Status, etc. The types of atomic val-
ues have been identified for each transport mode based on a literature review. Aggregation level8
node in this model does not represent any network element’s LOS, but rather aggregates the val-
ues from the level below (Atomic), which then contributes to the calculation of the LOS of a level10
above (Mode or Component).
Thirdly, dependencies analysis and attribution of influences should be performed - each con-12
nection between the nodes represents dependency of the target node on the source node. In case
37
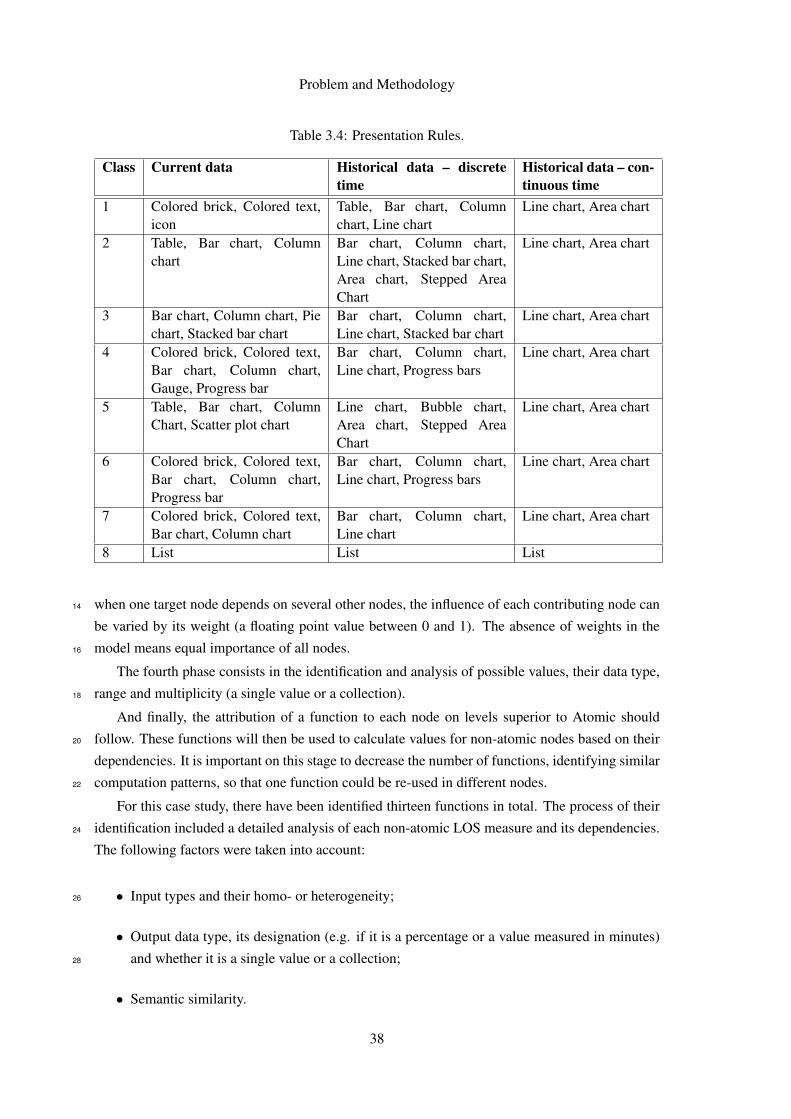
Problem and Methodology
Table 3.4: Presentation Rules.
Class Current data Historical data – discretetime
Historical data – con-tinuous time
1 Colored brick, Colored text,icon
Table, Bar chart, Columnchart, Line chart
Line chart, Area chart
2 Table, Bar chart, Columnchart
Bar chart, Column chart,Line chart, Stacked bar chart,Area chart, Stepped AreaChart
Line chart, Area chart
3 Bar chart, Column chart, Piechart, Stacked bar chart
Bar chart, Column chart,Line chart, Stacked bar chart
Line chart, Area chart
4 Colored brick, Colored text,Bar chart, Column chart,Gauge, Progress bar
Bar chart, Column chart,Line chart, Progress bars
Line chart, Area chart
5 Table, Bar chart, ColumnChart, Scatter plot chart
Line chart, Bubble chart,Area chart, Stepped AreaChart
Line chart, Area chart
6 Colored brick, Colored text,Bar chart, Column chart,Progress bar
Bar chart, Column chart,Line chart, Progress bars
Line chart, Area chart
7 Colored brick, Colored text,Bar chart, Column chart
Bar chart, Column chart,Line chart
Line chart, Area chart
8 List List List
when one target node depends on several other nodes, the influence of each contributing node can14
be varied by its weight (a floating point value between 0 and 1). The absence of weights in the
model means equal importance of all nodes.16
The fourth phase consists in the identification and analysis of possible values, their data type,
range and multiplicity (a single value or a collection).18
And finally, the attribution of a function to each node on levels superior to Atomic should
follow. These functions will then be used to calculate values for non-atomic nodes based on their20
dependencies. It is important on this stage to decrease the number of functions, identifying similar
computation patterns, so that one function could be re-used in different nodes.22
For this case study, there have been identified thirteen functions in total. The process of their
identification included a detailed analysis of each non-atomic LOS measure and its dependencies.24
The following factors were taken into account:
• Input types and their homo- or heterogeneity;26
• Output data type, its designation (e.g. if it is a percentage or a value measured in minutes)
and whether it is a single value or a collection;28
• Semantic similarity.
38
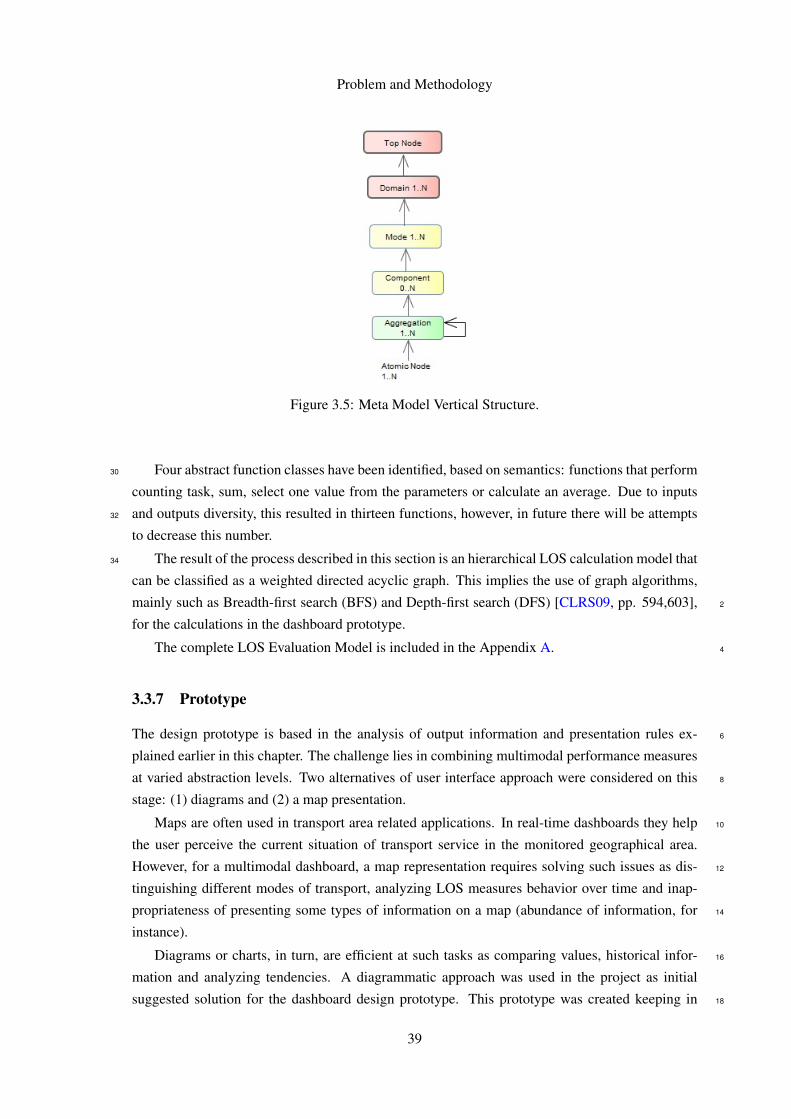
Problem and Methodology
Figure 3.5: Meta Model Vertical Structure.
Four abstract function classes have been identified, based on semantics: functions that perform30
counting task, sum, select one value from the parameters or calculate an average. Due to inputs
and outputs diversity, this resulted in thirteen functions, however, in future there will be attempts32
to decrease this number.
The result of the process described in this section is an hierarchical LOS calculation model that34
can be classified as a weighted directed acyclic graph. This implies the use of graph algorithms,
mainly such as Breadth-first search (BFS) and Depth-first search (DFS) [CLRS09, pp. 594,603], 2
for the calculations in the dashboard prototype.
The complete LOS Evaluation Model is included in the Appendix A. 4
3.3.7 Prototype
The design prototype is based in the analysis of output information and presentation rules ex- 6
plained earlier in this chapter. The challenge lies in combining multimodal performance measures
at varied abstraction levels. Two alternatives of user interface approach were considered on this 8
stage: (1) diagrams and (2) a map presentation.
Maps are often used in transport area related applications. In real-time dashboards they help 10
the user perceive the current situation of transport service in the monitored geographical area.
However, for a multimodal dashboard, a map representation requires solving such issues as dis- 12
tinguishing different modes of transport, analyzing LOS measures behavior over time and inap-
propriateness of presenting some types of information on a map (abundance of information, for 14
instance).
Diagrams or charts, in turn, are efficient at such tasks as comparing values, historical infor- 16
mation and analyzing tendencies. A diagrammatic approach was used in the project as initial
suggested solution for the dashboard design prototype. This prototype was created keeping in 18
39

Problem and Methodology
Figure 3.6: Dashboard Prototype. Filled Work Area.
mind the idea of configurability. It consisted of two major elements: a menu with LOS values by
infrastructure or domain and a work area. The values listed in the menu can be dragged into the
main work area, where they will appear in a chart form, and then placed as preferred, depending2
on the purpose and objectives of monitoring.
Figure 3.6 demonstrates schematic view of the dashboard after filling the main area with LOS4
charts and selecting preferred chart types, when there is a choice. The menu on top left includes a
hierarchical structure of LOS measures, where they may be dragged from. After a value is dragged6
to the work area, it appears there with a default view. The user is given an option then to select
a different chart view, depending on those available for the selected value. Within the same view,8
the user is offered a choice to see the history of a value or select a more detailed view with a higher
information granularity. User may also choose to view meta data on the observed value with the10
information on responsible organization.
An authenticated user may save the work area layout in order to avoid its repeat configuration.12
The customization feature example is shown in Figure 3.7, where the user is offered a possibility
to set priorities and importance to values, when more than one value contribute to a higher level14
measure, by means of weights customization.
40

Problem and Methodology
Figure 3.7: Dashboard Prototype. Weights Customization.
During the implementation phase, however, it was decided to focus on a map view with the16
use of some features of the diagrammatic presentation described above. A map provides a better
understanding of location-specific information, however, charts are preferable in some situations18
when information cannot be shown on a map in an efficient way. Besides, taking into account the
variety of stakeholders and possible uses of the dashboard, the user should be offered a choice of20
selecting different views for efficient monitoring. That’s why a combination of both approaches
was chosen for the implementation.22
3.3.8 Logical Architecture
Conceptually, the system’s architecture behind the front-end consists of four layers:24
• Connection layer – connects with protocols and other external sources supplying raw data
and delivers it to the next layer;26
• Data layer – the layer, where raw data is verified, mapped to system’s data fields and then
stored in database to be delivered to the layer above;28
41
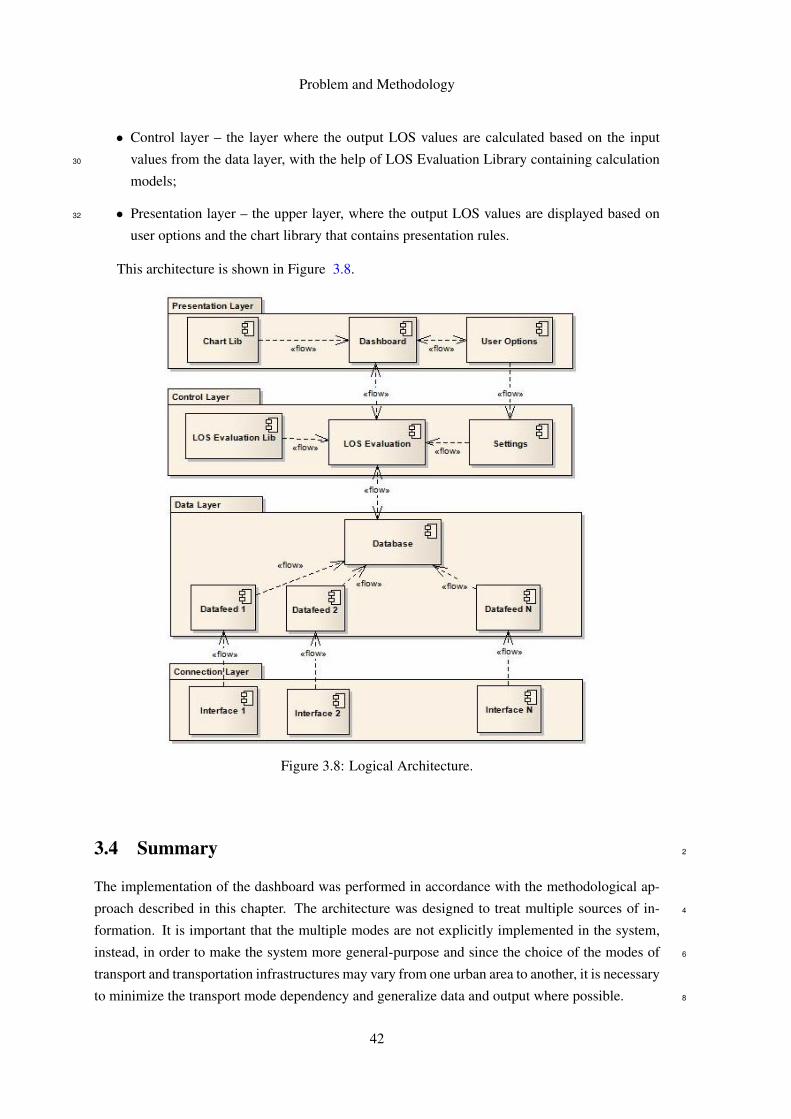
Problem and Methodology
• Control layer – the layer where the output LOS values are calculated based on the input
values from the data layer, with the help of LOS Evaluation Library containing calculation30
models;
• Presentation layer – the upper layer, where the output LOS values are displayed based on32
user options and the chart library that contains presentation rules.
This architecture is shown in Figure 3.8.
Figure 3.8: Logical Architecture.
3.4 Summary 2
The implementation of the dashboard was performed in accordance with the methodological ap-
proach described in this chapter. The architecture was designed to treat multiple sources of in- 4
formation. It is important that the multiple modes are not explicitly implemented in the system,
instead, in order to make the system more general-purpose and since the choice of the modes of 6
transport and transportation infrastructures may vary from one urban area to another, it is necessary
to minimize the transport mode dependency and generalize data and output where possible. 8
42

Chapter 4
Implementation 10
This chapter includes the overview of technology used in the project, systems architecture and
explains the system’s implementation nuances and major classes that were used in the solution in 12
order to achieve the goals set for the project.
4.1 Technology 14
The choice of technology to use for the project implementation is crucial for its success. The
following sections provide an overview of technologies used or considered for use for the devel-2
opment of the system.
4.1.1 Service Oriented Architecture4
In terms of architecture, several factors influenced the choice of technology. The dashboard should
provide a real-time, quickly updated information to the user. It is also convenient to use a client-6
server architecture principles, where server would be responsible for data storage and processing
and a client would remotely request the necessary information. Due to the multimodal nature of8
the application and the variety of results that may or may not be available and necessary to the
user, Service Oriented Architecture (SOA) with web services as its core feature appears to be10
the best choice. It brings such important advantages as platform and technology independence,
module-based architecture (independent services) [HCT04, p. 17], which is extremely important12
for the dashboard, enabling customization and independence on a certain urban transportation
infrastructure.14
4.1.2 Server Side Technologies
In the world of SOA, there is a wide choice of frameworks, where the main competitors are .NET16
and Java EE/EJBs for Java development. .NET in turn offers .NET Remoting and a newer frame-
work that combines functionalities of .NET Remoting and offers a number of other useful fea-18
tures, which is Windows Communication Foundation (WCF) [Cha10, p. 6]. Both technologies
43
Implementation
are based on ASP.NET and C#/Visual Basic. Many disputes exist on the advantages of Java versus20
Microsoft solutions and vice versa in terms of performance, choice of functionalities and ease of
development [COG13, Bie09] [ST, p. 5]. This paper however isn’t aimed at comparing these22
technologies. Java EE was selected for the implementation of the server, since it provides all the
necessary tools to achieve the goals set for the project.24
It was also decided to use such technology as intelligent agents on server side. The advantages
of agents-based systems consist in multi-threading and parallel computation, behavior paradigm,26
trigger handling, facilitated scheduling and communication between agents [NJ02, p. 3] [She02,
p. 89]. The use of agents introduces a higher abstraction in process control which is beneficial for28
the application. For this purpose Jade (Java Agent DEvelopment Framework) was selected, as a
free Java-based, FIPA (Foundation for Intelligent Physical Agents) compliant middleware [Cai04,30
p. 29] that has already proved to be a powerful tool for multi-agent based systems development.
4.1.3 User Interface Technologies32
Two alternatives were considered for the dashboard’s Graphical User Interface (GUI): a desktop
application or a web-application. A web-application has such advantages as access to the dash-34
board from different locations/devices and facilitated deployment of the application, which should
only be installed on a dedicated server and requires no installation on a client side. However, 2
the Armis company had a ready framework developed using JavaFX for a desktop application
that suited the needs and requirements of this project. That’s why on this stage the decision was 4
made in favor of a desktop GUI application, in order to speedup the development phase. In future,
however, it is planned to provide a web-access to the dashboard as well. 6
The JavaFX is a Java-based platform developed by Oracle for rich enterprise client applica-
tions. It is a powerful tool for building rich high-performance graphical interfaces and possesses 8
such beneficial features as separation of application UI and logic, possibility of creating scalable,
graphics-rich applications without performance penalties, and extending existing Swing applica- 10
tions [Ora11, p. 1].
4.1.4 Communication 12
As for the communication protocols, the main alternatives are SOAP and REST. Both have their
drawbacks and advantages. REST-based web-services have such important benefit for real-time 14
applications with an intensive communication of large amounts of data as "less overall latency and
requires less bandwidth than the SOAP-based counterpart" [MG09, 1428]. Other advantages of 16
REST web-services are loose coupling of components and the fact that client needs no routing
information other than the initial process factory URI [zMNS05, p. 24]. Besides, RESTful 18
messages support both XML and JSON data formats, while SOAP is a XML-based technology.
These advantages of REST resulted in the choice of this communication method. 20
The data format implemented in the solution is JSON, which was selected due to its light
weight and speed of processing and data transfer [NPRI09, p. 6]. The translation of Java objects 22
44
Implementation
to JSON and vice-versa is performed with the help of Gson, an open source library developed and
distributed by Google [Gooa]. 24
4.1.5 Database And Object-Relational Mapping
MySQL database was preferred to Oracle and MS SQL Server, due to such factors as low cost 26
(it is an open source software), scalability, high performance, platform portability and ease of use
[Sch09, Ehi14, Tru08]. 28
To facilitate the support of the MVC architecture, an Object-Relational Mapping (ORM), such
as Hibernate, was integrated in the project. ORM technology brings in such inarguable advantages 30
as database independence, abstraction of data access, efficient use of table dependencies, speeding
development and object persistence [Fin, Kar09, Hib]. Among the existing ORM tools, Hibernate 32
is a preferred one, since it is an open source technology widely spread on the market that proved
to be efficient and its community has grown considerably during recent years. 34
4.1.6 Graph Library
On the early stages of the implementation, due to the need of manipulations with LOS graphs,
representing the Hierarchical LOS Model, a use of a graph library was considered, namely the2
JGraphT library. This free Java graph library has such features that might be beneficial for the
project, as the support of various types of graphs, as well as vertices which can be any object,4
visualization tool with GUI-based editing and extensibility [Nav11]. Though, after the initial
tests of the system with the use of JGraphT structures, it was decided to postpone its further6
integration into the solution due to certain performance issues. However, its visualization feature
might be useful for the analysis and editing of the instantiated LOS model, which is planned to be8
implemented in the future.
4.2 Data Structure10
The application’s data structure was built based on both the Hierarchical LOS Evaluation ontology
described in Section 3.3.6 and meta model suggested in Section 3.3.4.12
Figure 4.1 serves as a schematic view of entities and their relationship. It only includes the
table names, while the detailed view is available in the Appendix B.14
The vertical structure of the Hierarchical LOS Model is represented in the following tables:
Domain, Mode, Component, Aggregation. The lower, Atomic, level includes three types of atomic16
entities: Link, Point and Equipment, as suggested in the meta model, Section 3.3.4. The Atomi-
cEntityType table helps in referencing and distinguishing atomic entities, where a certain atomic18
entity can always be identified by two keys: AtomicEntityType Id and entity Id from a corre-
sponding table (Link, Point or Equipment). In a similar way, LevelType table helps referencing20
the entities from different abstraction levels by means of a combination of LevelType Id, which
identifies abstraction level, and entity Id from a corresponding table (Domain, Mode, Component22
45

Implementation
Figure 4.1: Data Model.
or Aggregation). Each entity in Mode, Component and Aggregation tables references the upper
level entity, or entity, it contributes to (in case of Aggregation, an aggregation entity may refer-24
ence another aggregation entity, component entity or mode entity). Together, these tables contain
information on what LOS measures physically describe - a road segment, the aggregated status of26
bus stops or a whole transport domain, such as aviation.
The current LOS values for all entities and abstraction levels are stored in Los table, while28
connections between them - in Dependency table. The records in Los table contain information on
which exact measure is being taken and its current value. Same entity may have several measures,30
for instance, in case of a Public Transport service line, the measures that might be taken are:
frequency or operational status (full service or closure, etc.) and delays. The entity which is being 2
measured is identified by three keys:
1. Level type Id, which identifies the abstraction level; 4
2. Atomic entity type Id, which in case of Atomic level identifies the corresponding table
(Link, Point or Equipment); 6
3. Measured entity Id, which stands for the corresponding entity Id in the table identified by
the two previous keys. 8
Together, the Los and Dependency tables represent an instantiated hierarchical LOS model for
a specific geographical area, monitored by the application. 10
46

Implementation
The system was projected to support three geographical abstraction levels: entire monitored
region, its areas and each area’s subareas. 12
LosArea and LosSubarea entities, which are identified by area and subarea Id correspondingly,
contain current LOS values for a given geographical unit at a corresponding geographical abstrac- 14
tion integrated in the system. Physically they store a replicated LOS model from the Los table for
each area and subarea. 16
Old and expired LOS values from Los, LosArea and LosSubarea tables are stored in Histori-
calLos table. Each record references the corresponding LOS from Los table and, in case of area 18
or subarea specific values, a corresponding geographical subregion.
Other entities are listed below with a brief explanation of their designation: 20
• Affiliation - affiliation of atomic entities (links, points, equipment) to other atomic entities,
since one entity may consist of a few smaller entities (e.g. terminals in an airport, road 22
segments in a road, etc.);
• AtomicEntityArea - links atomic entities to areas; 24
• AtomicEntitySubarea - links atomic entities to subareas;
• ChartType - a list of possible chart types, such as Bar chart, Line chart, Stacked bar chart, 26
Area chart, etc.;
• Configuration - user configurations for the dashboard layout; 28
• Infrastructure - transport infrastructures, e.g. city subway network;
• InfrastructureOrganization - associations between infrastructures and organizations (a many- 30
to-many relationship);
• LosType - class of LOS value, as defined in Table 3.3; 32
• Organization - Organizations involved;
• Owner - organizations responsible for atomic entities (stops, lines, etc.); 34
• PrimitiveDataType - a list of primitive types and units they are measured in, that are used to
calculate Atomic level LOS, such as traffic speed, traffic volume, etc.; 36
• StatusEnum - a list of possible enum values for LOS measures (e.g. literal values from ’A’
to ’F’ for road congestion status);
• Threshold - thresholds used in the solution to define enum value for a given numeric mea-2
sure;
• User - a list of users with a reference to an organization each user belongs to or represents;4
• UserSettings - settings defined for each user;
• ViewType - chart types corresponding to each los type, as defined in Table 3.4;6
47
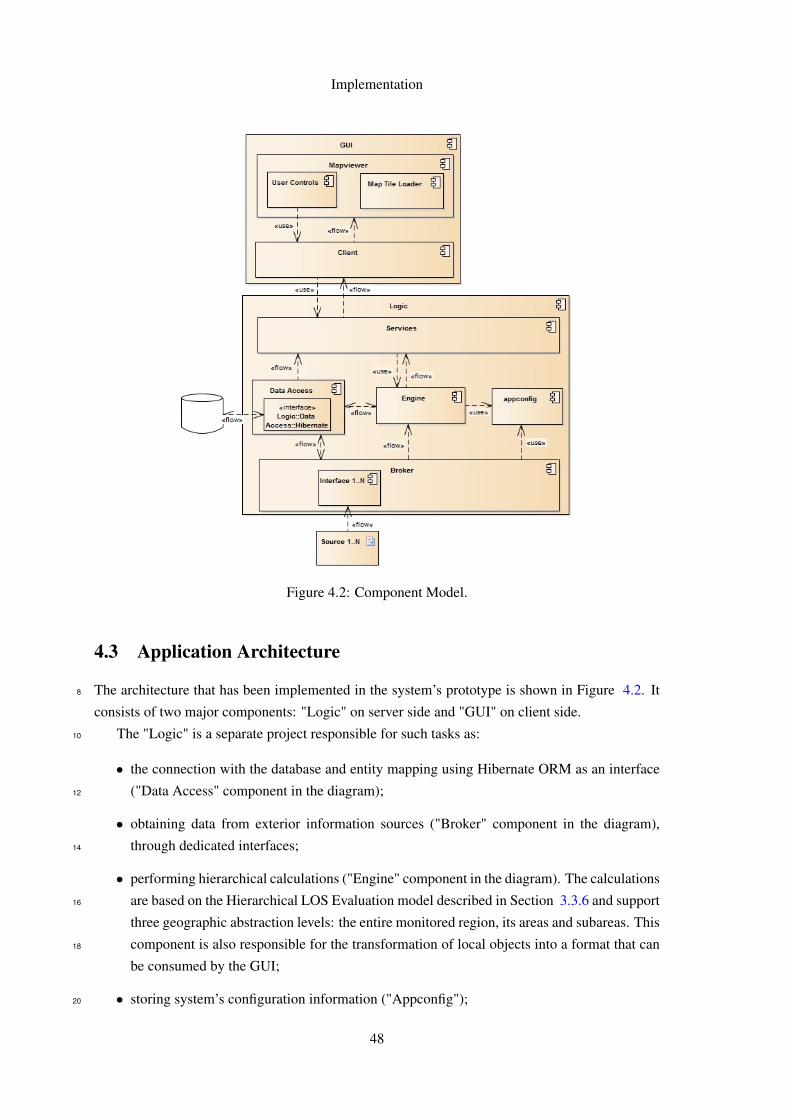
Implementation
Figure 4.2: Component Model.
4.3 Application Architecture
The architecture that has been implemented in the system’s prototype is shown in Figure 4.2. It8
consists of two major components: "Logic" on server side and "GUI" on client side.
The "Logic" is a separate project responsible for such tasks as:10
• the connection with the database and entity mapping using Hibernate ORM as an interface
("Data Access" component in the diagram);12
• obtaining data from exterior information sources ("Broker" component in the diagram),
through dedicated interfaces;14
• performing hierarchical calculations ("Engine" component in the diagram). The calculations
are based on the Hierarchical LOS Evaluation model described in Section 3.3.6 and support16
three geographic abstraction levels: the entire monitored region, its areas and subareas. This
component is also responsible for the transformation of local objects into a format that can18
be consumed by the GUI;
• storing system’s configuration information ("Appconfig");20
48
Implementation
• providing web-services to other applications ("Services"), which use JSON format for data
exchange.22
The Graphical User Interface ("GUI") represents the dashboard itself. This project may be di-
vided in two major parts: the graphics engine ("Mapviewer") responsible for the graphical output24
of the information and the interface ("Client") which communicates with the Logic through REST
Web Services to obtain the information requested by the user. The Client receives object collec-26
tions from the server and, when necessary, transforms them into the objects that can be placed on
the map.28
4.4 Server Side Classes and Implementation Nuances
The server side basically consists of one project called "Logic". In future, this may be divided30
into more granular projects for an easier maintenance. The "Logic" project consists of eight pack-
ages, each of which has its own designation. These packages are described in detail in the next32
subsections.
4.4.1 Agent Package34
It was mentioned in the Section 4.1.2 that the system was implemented with the use of JADE,
a Multi Agent System framework. Two agents exist at this stage of the project: Initializer and36
MainAgent.
The Initializer agent is launched at application startup and its main purpose lies in starting
the necessary agents (MainAgent at the moment). The Initializer has one behavior, of the type 2
OneShotBehaviour. In this behavior it launches the MainAgent and instantiates it with a Data
Access Object (DAO). 4
The MainAgent performs the control of the application execution at startup and is responsible
for scheduling the reception and processing of the new input values. At the moment, it executes 6
two behaviors:
• SimpleBehaviour, which is "made by a single, monolithic task and cannot be interrupted" 8
[JB]. It runs the calculations required at startup.
• TickerBehaviour, "that periodically executes a user-defined piece of code" [JB]. Its task 10
consists in consuming new inputs on every tick, which is defined in the program. This
feature can be extended in the next versions of the project with more complex schedules, in 12
order to connect to the proper information sources at an appropriate time.
4.4.2 Appconfig Package 14
This package includes system’s configuration information such as the constants and thresholds
that are not present in the database and are shared between different components of the system. 16
49

Implementation
At this stage of the project the amount of the information stored in the configurations package is
small, but it is expected to grow with the system’s further growth, improvement and tuning.2
4.4.3 Broker Package
The Broker package is responsible for the acquisition of the inputs from the available data sources4
through the interfaces that are implemented in this package. At present, the interfaces with the
data communication protocols analyzed in Section 2.6 haven’t been implemented, due to a certain6
resistance in information sharing that exists in Portugal, where the relevant information sources
are usually owned by private organizations. However, some information is available through the8
partners of Armis. That allows the Broker to be executed in two modes: random value generation
and from the file. In the random value generation mode, the value generation is performed in10
several steps:
1. A type of LOS value from Atomic level is randomly selected. This could be an "Urban Bus12
Stop Terminal LOS" or "Metro Line Delays", etc.
2. A random LOS value is selected from the collection of the existing LOS values of the14
selected type;
3. A random value is generated for the selected LOS value, depending on its data type and the16
range of possible values.
In the file mode, the application consumes values from a specified file, containing a collection18
of inputs gathered by road sensors, and records the last read entry to avoid consuming the same
input again.20
After a new LOS value is obtained, recalculations are fired over the LOS graph by calling the
Engine package, to ensure that the new value propagates necessary changes to the upper levels.22
4.4.4 Dao Package
The DAO stands for Data Access Objects, which is what the Dao package is responsible for. It24
contains a rich functions library for the interaction with the database, such as queries, inserts and
updates. The access to the database objects is performed by means of Hibernate query language,26
which introduces a higher abstraction from the classic SQL queries. Listing 4.1 contains an
example of a typical data access method which performs a request for a collection of records from28
LosArea table filtered by the area they belong to.
4.4.5 Engine Package30
As it was stated in Section 3.3.6 the Hierarchical LOS Evaluation model can be classified as a
weighted directed acyclic graph, which implies the use of graph algorithms for the calculations in32
the dashboard prototype. The algorithms implemented in the solution are BFS and DFS.
50

Implementation
1 public List<LosArea> getLosAreaByArea(int areaId) {2 Query querySegments = this.sessionFactory.getCurrentSession()3 .createQuery("from LosArea where area.areaId = " + areaId);4
5 List<LosArea> l = (List<LosArea>) querySegments.list();6
7 return l;8 }
Listing 4.1: Example Data Access Method
The principle class of the package that represents the graph and contains the methods imple-34
menting graph algorithms is LOSGraph. It is initialized by accessing database through Dao object.
The resulting graph represents the instantiated version of the Hierarchical LOS Model, where leaf
nodes (nodes without children) are nodes from the Atomic level. 2
The DFS algorithm, graphDFS() method of LOSGraph, is used for running calculations over
the entire LOS model at startup to make sure that all values are up-to-date. The algorithm begins 4
its execution from the top node which corresponds to the LOS of entire transport network, and
analyses each of its child nodes (in this case children are values that contribute to the parent 6
node’s value) in depth. The edges between the nodes are in fact dependencies stored in the data
base (Section 4.2). The calculations are done in a post order [Nel96], since it is first necessary 8
to obtain the updated values of child nodes to be able to calculate the parent node’s LOS value.
Therefore, after all children of a node are explored, and if the node itself is not a leaf (does not 10
belong to the Atomic level), the DFS algorithm calls calculateLos method which is responsible
for the calculation of each non-atomic LOS value. 12
Since the DFS method is time-consuming, it is not used further during the system execution,
apart from the startup. Instead, in real time mode, on the arrival of a new value, usually at Atomic 14
Level (e.g. updated road segment’s congestion status), the BFS based calculations are triggered
(method recalculateParentsLos). The BFS algorithm is responsible for ensuring that all the upper 16
level values, that depend on the updated node, are reviewed and recalculated if necessary. The
model supports updates triggered at any level of abstraction, where the recently updated node 18
serves as a "root" node for the BFS algorithm. In case of BFS, the graph traversal is an opposite
direction to DFS, from lower levels to the Top of the Hierarchical LOS Model. The algorithm 20
continues its execution while there remain non-recalculated upper level LOS values, that had their
inputs changed, or till the Top node is reached. That means that if the algorithm has arrived to a 22
node that was recalculated, but the value hasn’t changed, this branch is not explored further.
The same method is used for different levels of geographic abstraction implemented in the2
prototype: the entire network, Area and Sub-area. In case of Area (class LOSGraphArea) and Sub-
area (class LOSGraphSubarea) abstractions, an instance of the original graph is created, except4
that it includes only the nodes that exist in the specific area/sub-area. In order to ignore the non-
instantiated branches of the graph in areas and sub-areas and improve performance, Area and2
51
Implementation
Sub-area calculations use only the BFS algorithm implemented in the method graphBFS both at
the startup and during execution. The only difference is that at startup, the BFS algorithm for areas4
and sub-areas pushes the entire set of instantiated atomic nodes (leaves) for the corresponding area
or sub-area to the queue instead of a single "root" node, while in all other cases the node with a6
changed LOS value is set as a "root" node for the algorithm.
The calculateLos method obtains the instantiated child nodes and, depending on the type of8
LOS that should be calculated, prepares the parameters and calls the necessary method from a
library containing LOS functions. The names of methods or functions corresponding to each10
LOS measure are stored in database and loaded as an attribute of LOS object. These methods
are implemented in a dedicated library, in the LosFunctions class. As it was mentioned in the12
Section 3.3.6, there have been identified thirteen functions in total, out of which seven have been
implemented for the current version of the application. A brief description of the implemented14
functions follows below:
• average - the function receives a list of strings with numbers in format "[n1, n2, ...]" and16
calculates and returns an average value. This method is usually used to calculate an average
delay for public transport service lines, such as average bus lines delay, etc.18
• enumListToPercentageList - the method consumes a list of enum values representing atomic
LOS values in string format, calculates the total share of each enum value compared to the20
entire collection of values and returns a string with enum-percentage pairs in the following
format: "enum1-percentage1,enum2-percentage2,...". For instance, if the method receives22
as a parameter a collection of road congestion statuses ["A", "A", "C", "F"], the result would
be a string "A-50.0,C-25.0,F-25.0". The enumListToPercentageList is typically used at the24
Aggregation level to understand the share of each status value compared to other values.
• enumPercentageListToPercentage - the method receives a string with enum-percentage pairs
in format "enum1-percentage1,enum2-percentage2,...", built by enumListToPercentageList 2
function, and list of keys or enums to look for. The output of the method is a percentage
share of the searched enums (keys). The purpose of this LOS function consists in determin- 4
ing, what percentage of measured facilities are operating at an acceptable LOS level. For
instance, based on the example above, if the acceptable LOS level includes such LOS sta- 6
tuses as "A", "B" and "C", the total share of road segments with an acceptable LOS would
be 75.0: 50.0 (the share of "A" LOS) plus 25.0 (the share of "C" LOS). 8
• FloatListToPercentage - a function depending on two parameters: a list of strings with num-
bers in format "[n1, n2, ...]" and a threshold (Float data type). This method returns the 10
percentage of numbers that are less or equal to the threshold. The semantics of this method
consists in calculating the share of public transport vehicles arriving on time (for urban and 12
interurban bus and railway service, as well as flights), where the threshold represents maxi-
mum allowed time span for the given transport mode within which the arrival is considered 14
as "on-time". The method is typically applied to Aggregation Level LOS values.
52
Implementation
• MixedValuesToPercentage - the method receives as an input a list of strings with values and 16
their types in format "value1:type1" and a list of weights attributed to the values. The result
of the function is a percentage, which represents an aggregated evaluation of the values 18
received based on their weights. This method may be used on Aggregation, Component and
Mode levels. As reflected in its name, the method is capable of consuming heterogeneous 20
values both in their semantics and data type, such as an average delay measured in minutes,
total accumulated delay in minutes, or a percentage. Later, even more value types should 22
be integrated. In order to generate a single result based on these diverse values, it is first
necessary to normalize them, which implies a transformation to a single type - a percentage 24
in this case. After the normalization is done, it is possible to derive a weighted average
reusing a method already implemented in the library for the calculation of other LOS values 26
and described further: PercentageListToPercentage.
• or - the function receives a list of objects of Float type and a list of weights corresponding2
to the values. Only one of the values is returned, unchanged: the first one if no weights were
specified or the one with highest weight. This function is used in situations when the same4
LOS value may be measured by more than one method. For instance, when evaluating Road
Equipment LOS, two aggregating methods may serve as a metrics: the total share of roads6
with operational equipment or simply the share of operational equipment.
• PercentageListToPercentage - this function has already been mentioned earlier. It receives8
a list of values in percentage format (Float numbers from 0.0 to 100.0) and a list of their
weights. The returned result is an average percentage (if weights were not specified) or10
a Weighted Average otherwise. This method is typically used for higher level LOS: Top,
Domain, Mode and Component levels. Sometimes it is applied however to the Aggregation12
level LOS measures as well. This method is available in the Listing 4.2.
The Engine package also contains methods for translating the collections of objects used in14
graphs as nodes to the objects that are understood by GUI. In these translation methods (LosToGui-
Los method in LOSGraph class and toGuiLos method in LOSGraphArea and LOSGraphSubarea),16
the GUI objects receive all information associated to a LOS value that is required for the user
interface, such as the identification of the LOS measure, its value, geographical position, area or18
sub-area the LOS belongs to, etc.
The translation is made purely for the purpose of embodying the information related to a single20
LOS value that is spread over several entities into one object, avoiding at the same time passing
unnecessary or redundant information which is only used on the server side.22
4.4.6 Guiobjects Package
The package contains classes used to communicate information to the user interfaces. At this stage24
there is only one class in the package, which is GuiLos. In future however the package may grow
depending on the types of uses and diversity of information required by user interfaces. There are
53
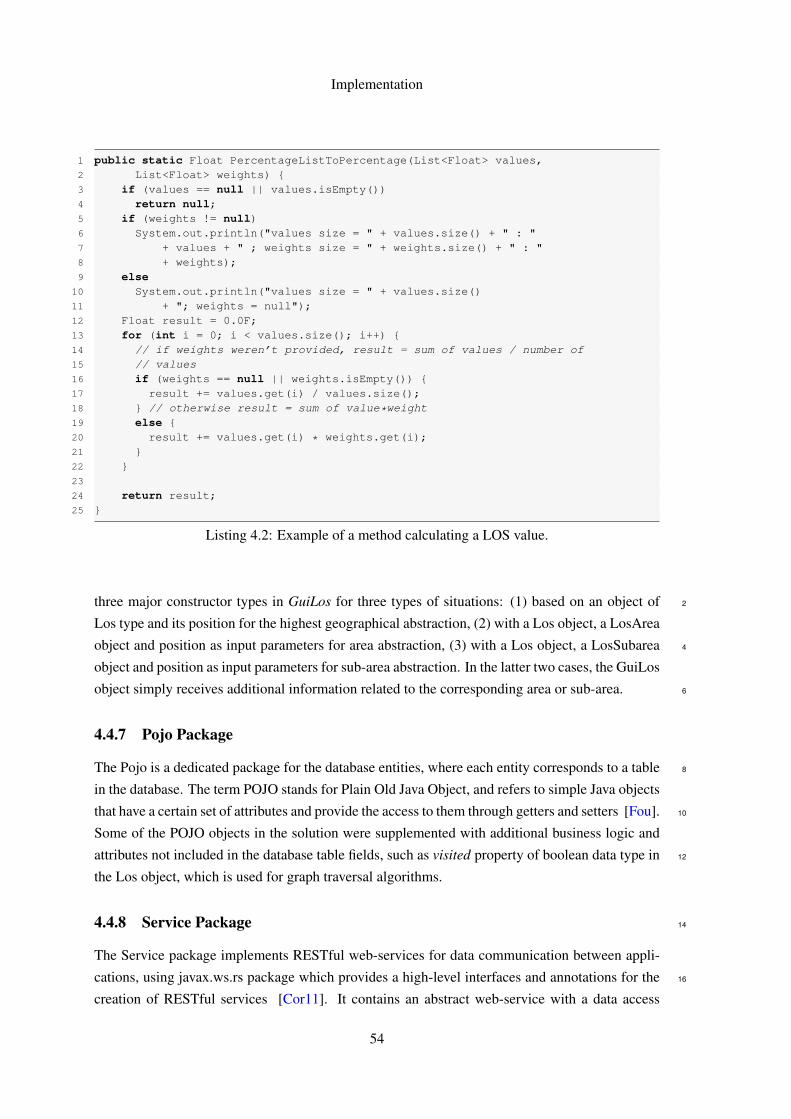
Implementation
1 public static Float PercentageListToPercentage(List<Float> values,2 List<Float> weights) {3 if (values == null || values.isEmpty())4 return null;5 if (weights != null)6 System.out.println("values size = " + values.size() + " : "7 + values + " ; weights size = " + weights.size() + " : "8 + weights);9 else
10 System.out.println("values size = " + values.size()11 + "; weights = null");12 Float result = 0.0F;13 for (int i = 0; i < values.size(); i++) {14 // if weights weren’t provided, result = sum of values / number of15 // values16 if (weights == null || weights.isEmpty()) {17 result += values.get(i) / values.size();18 } // otherwise result = sum of value*weight19 else {20 result += values.get(i) * weights.get(i);21 }22 }23
24 return result;25 }
Listing 4.2: Example of a method calculating a LOS value.
three major constructor types in GuiLos for three types of situations: (1) based on an object of 2
Los type and its position for the highest geographical abstraction, (2) with a Los object, a LosArea
object and position as input parameters for area abstraction, (3) with a Los object, a LosSubarea 4
object and position as input parameters for sub-area abstraction. In the latter two cases, the GuiLos
object simply receives additional information related to the corresponding area or sub-area. 6
4.4.7 Pojo Package
The Pojo is a dedicated package for the database entities, where each entity corresponds to a table 8
in the database. The term POJO stands for Plain Old Java Object, and refers to simple Java objects
that have a certain set of attributes and provide the access to them through getters and setters [Fou]. 10
Some of the POJO objects in the solution were supplemented with additional business logic and
attributes not included in the database table fields, such as visited property of boolean data type in 12
the Los object, which is used for graph traversal algorithms.
4.4.8 Service Package 14
The Service package implements RESTful web-services for data communication between appli-
cations, using javax.ws.rs package which provides a high-level interfaces and annotations for the 16
creation of RESTful services [Cor11]. It contains an abstract web-service with a data access
54
Implementation
object as an attribute and three classes that extend the abstract web-service: LosService, AreaSer-
vice and SubareaService. The web-service methods are grouped in these classes depending on the2
geographic abstraction that they require.
Most of web-service methods implemented in this version of the solution fulfill information4
requests, therefore the results of the requests are typically collections of GuiLos or HistoricalLos
objects. Before the response is sent to the client, these objects are encapsulated into a Parcel object6
which is then transformed to JSON string and returned to the client in this format.
4.5 GUI Classes and Implementation Nuances8
As it was mentioned in the Section 4.1.3, the user interface was built on top of an existing frame-
work, JavaFXMapViewer, that was implemented by Armis. This freeware framework was created
for graphic representation of road traffic information on a map. It provides a view of a certain2
geographic area, specified in the framework, at several zoom levels. For the needs of this project,
some new elements were added to the framework, such as:4
• Interface with the server - a package, containing classes corresponding to the objects trans-
mitted by the server (GuiLos and HistoricalLos), RESTful client responsible for the request-6
response communication with the server and configurations with application-wide con-
stants;8
• New map objects - LOS indicators on the map, MapLos class, which contains the informa-
tion on the LOS value that should appear on the map, attributes referring to how the value10
should be visualized (e.g. its color, graphic elements, such as panes, etc.) and a collection
of necessary methods (building and populating charts, updating indicator’s position on the12
map, etc.);
• Additional graphic elements - a number of panes and other necessary graphic elements,14
that were necessary in the dashboard, in addition to the already existing map view in the
framework.16
• User controls and filters - elements allowing an interaction of the application with its user.
These controls allow user to modify the abstraction level of LOS values that appear on18
the map from Atomic to Domain level and geographical abstraction from the entire region
to sub-areas. The controls also permit filtering the visualized values by Domain, Mode,20
Component or Aggregation. For example, setting filters to "Train Average Delay per Line"
for all modes (Metro, Urban Bus, etc.) and abstraction level to Atomic, will result in viewing22
only atomic LOS indicators for public transport line delays on the map. Another control
allows the user to view or hide legends pane containing information on graphic indicators’24
semantics.
• New behavioral features - the GUI application was also supplied with threads which ensure26
the concurrency of the indicators on the dashboard with the current real state of transport
55
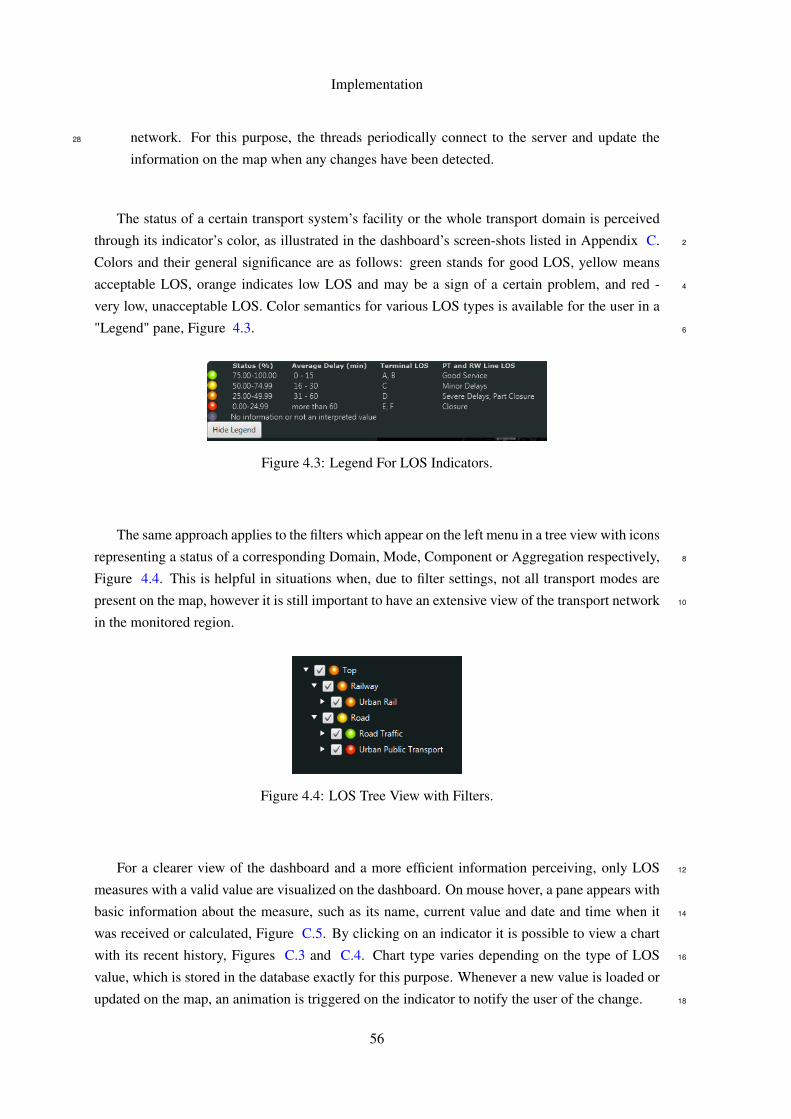
Implementation
network. For this purpose, the threads periodically connect to the server and update the28
information on the map when any changes have been detected.
The status of a certain transport system’s facility or the whole transport domain is perceived
through its indicator’s color, as illustrated in the dashboard’s screen-shots listed in Appendix C. 2
Colors and their general significance are as follows: green stands for good LOS, yellow means
acceptable LOS, orange indicates low LOS and may be a sign of a certain problem, and red - 4
very low, unacceptable LOS. Color semantics for various LOS types is available for the user in a
"Legend" pane, Figure 4.3. 6
Figure 4.3: Legend For LOS Indicators.
The same approach applies to the filters which appear on the left menu in a tree view with icons
representing a status of a corresponding Domain, Mode, Component or Aggregation respectively, 8
Figure 4.4. This is helpful in situations when, due to filter settings, not all transport modes are
present on the map, however it is still important to have an extensive view of the transport network 10
in the monitored region.
Figure 4.4: LOS Tree View with Filters.
For a clearer view of the dashboard and a more efficient information perceiving, only LOS 12
measures with a valid value are visualized on the dashboard. On mouse hover, a pane appears with
basic information about the measure, such as its name, current value and date and time when it 14
was received or calculated, Figure C.5. By clicking on an indicator it is possible to view a chart
with its recent history, Figures C.3 and C.4. Chart type varies depending on the type of LOS 16
value, which is stored in the database exactly for this purpose. Whenever a new value is loaded or
updated on the map, an animation is triggered on the indicator to notify the user of the change. 18
56

Implementation
4.6 Summary
The result of the implementation phase is a ready application that allows monitoring and analysis 20
of transportation network in a real-time mode, applied to the city of Porto. The examples of its
execution are illustrated in the Appendix C. 22
The technologies that were chosen for the implementation of the dashboard prototype helped
to achieve the goals set for this phase. The next steps would consist in further improvement of 24
the application and performance optimization, the dashboard’s design refinement, adding a chart
choice feature and implementation of protocol interfaces. 26
57

Implementation
58

Chapter 5
Preliminary Results 28
This chapter describes the tests that have been performed on the application using historical data. 30
The purpose of the tests was to observe system’s behavior in different scenarios: with and without
perturbations in public transport service. The sections below explain in detail the system’s setup 32
to conduct the experiment, illustrate the results obtained and discuss them, comparing with the
expectations. 34
5.1 Experimental Setup
The tests performed on the system included two transport domains: Road and Railway. The 36
database was populated with the following information available for the transport systems of the
city of Porto: 38
• Metro lines and stops for Urban Rail Mode;
• Funicular lines and stops for Urban Rail Mode;
• Bus stops and bus lines for Urban Public Transport (Urban Bus) Mode;2
• Road segments on major motorways equipped with sensors for Road Traffic Mode;
The LOS related information for Metro, Funicular and Urban Bus was randomly generated,4
while the status of monitored road segments was obtained from the road sensors.
For the Road Traffic test case, the idea of the experiment consisted in the analysis of LOS6
values for road traffic on the day when public transport was at a strike and comparing them to
those recorded during days without strikes. It was expected that during hours with strike there8
should be a certain degradation of road traffic LOS, since more travelers were expected to switch
to other transport means, including personal cars, therefore contributing to the road traffic.10
The strike occurred on 26 of November, 2013, when STCP, one of the principal urban public
transport providers in Porto with a fleet of 481 vehicles and 2,458 stops per information on 201212
59
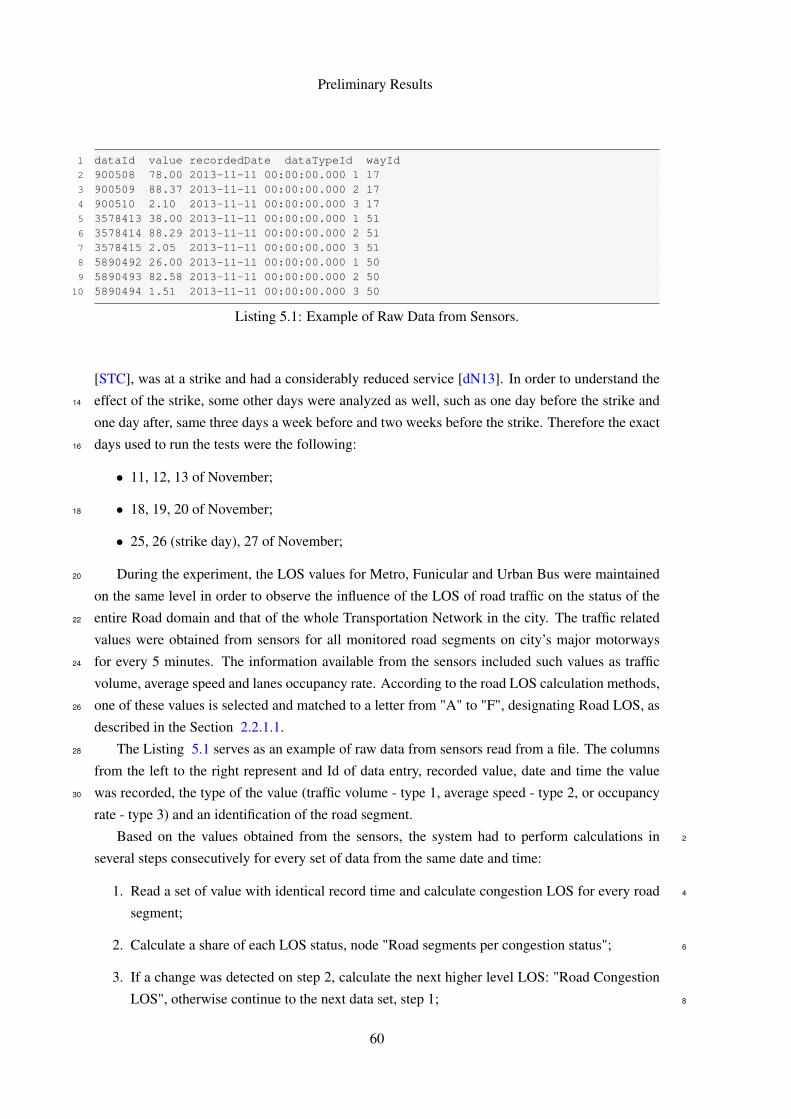
Preliminary Results
1 dataId value recordedDate dataTypeId wayId2 900508 78.00 2013-11-11 00:00:00.000 1 173 900509 88.37 2013-11-11 00:00:00.000 2 174 900510 2.10 2013-11-11 00:00:00.000 3 175 3578413 38.00 2013-11-11 00:00:00.000 1 516 3578414 88.29 2013-11-11 00:00:00.000 2 517 3578415 2.05 2013-11-11 00:00:00.000 3 518 5890492 26.00 2013-11-11 00:00:00.000 1 509 5890493 82.58 2013-11-11 00:00:00.000 2 50
10 5890494 1.51 2013-11-11 00:00:00.000 3 50
Listing 5.1: Example of Raw Data from Sensors.
[STC], was at a strike and had a considerably reduced service [dN13]. In order to understand the
effect of the strike, some other days were analyzed as well, such as one day before the strike and14
one day after, same three days a week before and two weeks before the strike. Therefore the exact
days used to run the tests were the following:16
• 11, 12, 13 of November;
• 18, 19, 20 of November;18
• 25, 26 (strike day), 27 of November;
During the experiment, the LOS values for Metro, Funicular and Urban Bus were maintained20
on the same level in order to observe the influence of the LOS of road traffic on the status of the
entire Road domain and that of the whole Transportation Network in the city. The traffic related22
values were obtained from sensors for all monitored road segments on city’s major motorways
for every 5 minutes. The information available from the sensors included such values as traffic24
volume, average speed and lanes occupancy rate. According to the road LOS calculation methods,
one of these values is selected and matched to a letter from "A" to "F", designating Road LOS, as26
described in the Section 2.2.1.1.
The Listing 5.1 serves as an example of raw data from sensors read from a file. The columns28
from the left to the right represent and Id of data entry, recorded value, date and time the value
was recorded, the type of the value (traffic volume - type 1, average speed - type 2, or occupancy30
rate - type 3) and an identification of the road segment.
Based on the values obtained from the sensors, the system had to perform calculations in 2
several steps consecutively for every set of data from the same date and time:
1. Read a set of value with identical record time and calculate congestion LOS for every road 4
segment;
2. Calculate a share of each LOS status, node "Road segments per congestion status"; 6
3. If a change was detected on step 2, calculate the next higher level LOS: "Road Congestion
LOS", otherwise continue to the next data set, step 1; 8
60
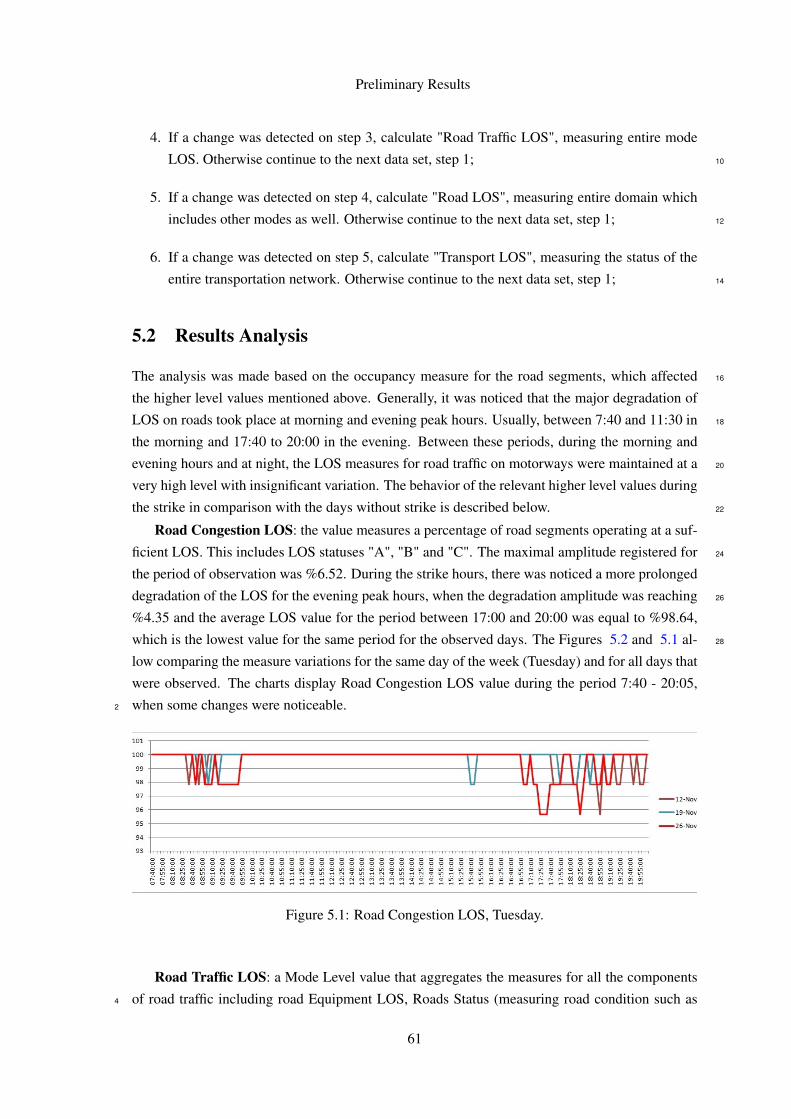
Preliminary Results
4. If a change was detected on step 3, calculate "Road Traffic LOS", measuring entire mode
LOS. Otherwise continue to the next data set, step 1; 10
5. If a change was detected on step 4, calculate "Road LOS", measuring entire domain which
includes other modes as well. Otherwise continue to the next data set, step 1; 12
6. If a change was detected on step 5, calculate "Transport LOS", measuring the status of the
entire transportation network. Otherwise continue to the next data set, step 1; 14
5.2 Results Analysis
The analysis was made based on the occupancy measure for the road segments, which affected 16
the higher level values mentioned above. Generally, it was noticed that the major degradation of
LOS on roads took place at morning and evening peak hours. Usually, between 7:40 and 11:30 in 18
the morning and 17:40 to 20:00 in the evening. Between these periods, during the morning and
evening hours and at night, the LOS measures for road traffic on motorways were maintained at a 20
very high level with insignificant variation. The behavior of the relevant higher level values during
the strike in comparison with the days without strike is described below. 22
Road Congestion LOS: the value measures a percentage of road segments operating at a suf-
ficient LOS. This includes LOS statuses "A", "B" and "C". The maximal amplitude registered for 24
the period of observation was %6.52. During the strike hours, there was noticed a more prolonged
degradation of the LOS for the evening peak hours, when the degradation amplitude was reaching 26
%4.35 and the average LOS value for the period between 17:00 and 20:00 was equal to %98.64,
which is the lowest value for the same period for the observed days. The Figures 5.2 and 5.1 al- 28
low comparing the measure variations for the same day of the week (Tuesday) and for all days that
were observed. The charts display Road Congestion LOS value during the period 7:40 - 20:05,
when some changes were noticeable.2
Figure 5.1: Road Congestion LOS, Tuesday.
Road Traffic LOS: a Mode Level value that aggregates the measures for all the components
of road traffic including road Equipment LOS, Roads Status (measuring road condition such as4
61
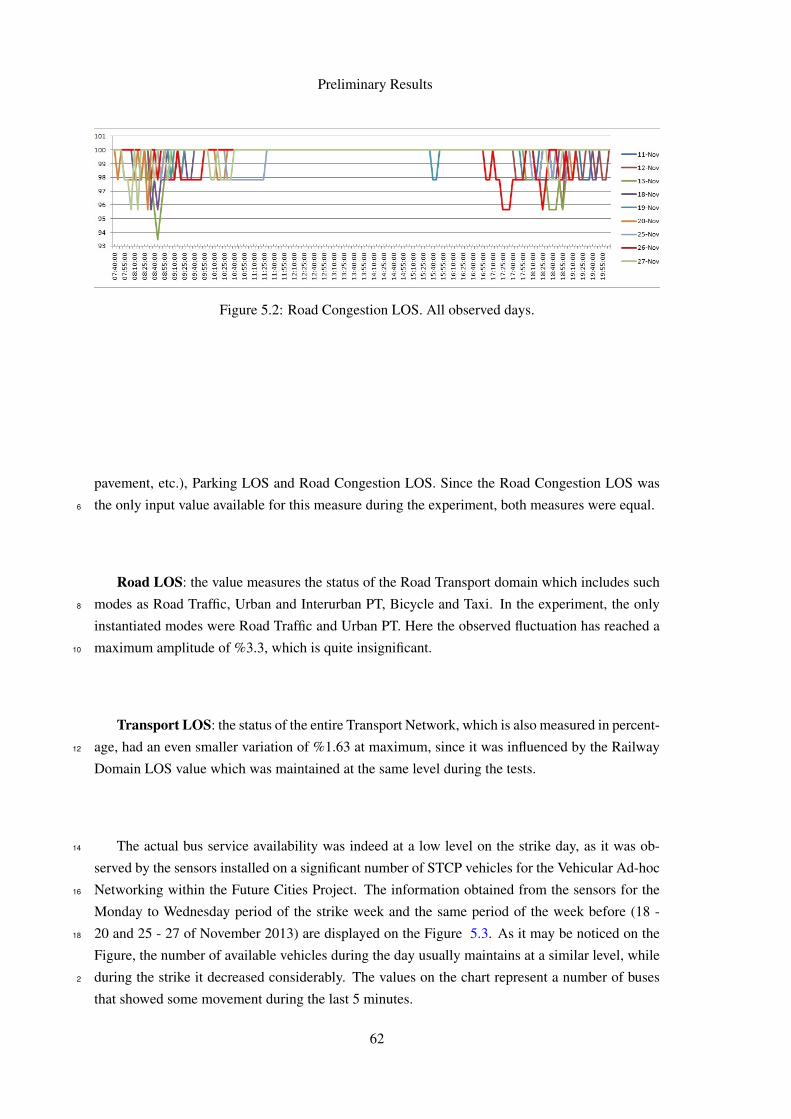
Preliminary Results
Figure 5.2: Road Congestion LOS. All observed days.
pavement, etc.), Parking LOS and Road Congestion LOS. Since the Road Congestion LOS was
the only input value available for this measure during the experiment, both measures were equal.6
Road LOS: the value measures the status of the Road Transport domain which includes such
modes as Road Traffic, Urban and Interurban PT, Bicycle and Taxi. In the experiment, the only8
instantiated modes were Road Traffic and Urban PT. Here the observed fluctuation has reached a
maximum amplitude of %3.3, which is quite insignificant.10
Transport LOS: the status of the entire Transport Network, which is also measured in percent-
age, had an even smaller variation of %1.63 at maximum, since it was influenced by the Railway12
Domain LOS value which was maintained at the same level during the tests.
The actual bus service availability was indeed at a low level on the strike day, as it was ob-14
served by the sensors installed on a significant number of STCP vehicles for the Vehicular Ad-hoc
Networking within the Future Cities Project. The information obtained from the sensors for the16
Monday to Wednesday period of the strike week and the same period of the week before (18 -
20 and 25 - 27 of November 2013) are displayed on the Figure 5.3. As it may be noticed on the18
Figure, the number of available vehicles during the day usually maintains at a similar level, while
during the strike it decreased considerably. The values on the chart represent a number of buses2
that showed some movement during the last 5 minutes.
62
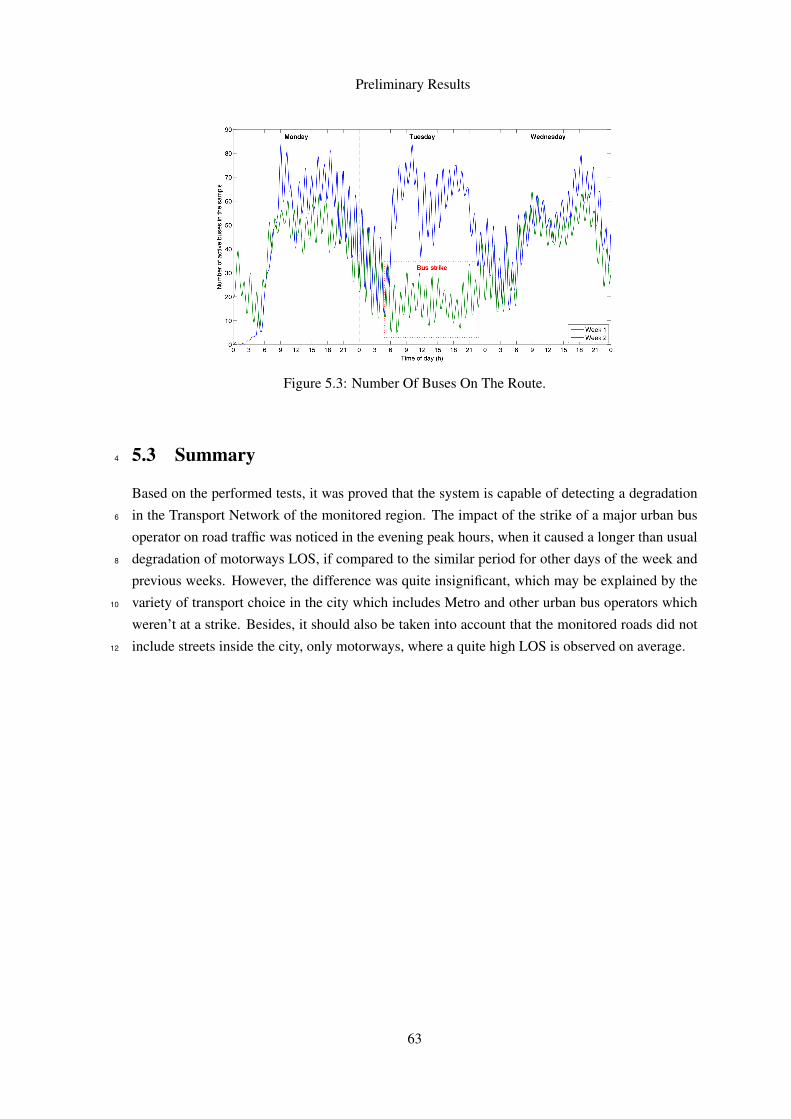
Preliminary Results
Figure 5.3: Number Of Buses On The Route.
5.3 Summary4
Based on the performed tests, it was proved that the system is capable of detecting a degradation
in the Transport Network of the monitored region. The impact of the strike of a major urban bus6
operator on road traffic was noticed in the evening peak hours, when it caused a longer than usual
degradation of motorways LOS, if compared to the similar period for other days of the week and8
previous weeks. However, the difference was quite insignificant, which may be explained by the
variety of transport choice in the city which includes Metro and other urban bus operators which10
weren’t at a strike. Besides, it should also be taken into account that the monitored roads did not
include streets inside the city, only motorways, where a quite high LOS is observed on average.12
63

Preliminary Results
64

Chapter 6
Conclusions and Future Work14
The Transport sector benefits from the growth and development observed in IT solutions existing16
for this sector, which facilitates considerably monitoring and management tasks and contributes
to the service level improvement, as well as has a positive impact on safety, by improved control18
of transport facilities, and ecology, by reducing emissions with a more efficient mode choice and
logistics.20
One of the key issues in the management of transport sector is performance measurement. This
was also the key subject in this project, where different approaches to the measurement of level22
of service were considered. The Literature Review chapter describes the metrics existing in the
world that were discovered during the research. LOS concepts and their measurement methods are24
well defined and standardized for some transport modes and infrastructure elements, such as road
traffic, airport and public transport terminals, waiting areas, flight delays. Where metrics were not26
detected in the literature, they were defined for the project. It was detected that the existing metrics
are usually focused on a single transport mode. Therefore, the innovative approach of this work to28
the LOS measures monitoring consists in the combination of the measures received from different
transport modes. For the purpose of generalization of this project, it considers all possibilities of30
LOS evaluation for each mode. An Hierarchical LOS Evaluation Model was created for this pur-
pose, allowing the evaluation of the operational status of the Transport Network’s components, as32
well as that of the entire network. The model includes several abstraction levels: Top Level mea-
suring the LOS of the entire Transport Network, Domain Level which includes LOS measures for 2
the principle transport domains (Aviation, Railway, Waterborne and Road transport), Mode Level
represents major modalities and their statuses (e.g. Road Traffic, Airports, Urban or Interurban 4
Public Transport, Bicycle, etc.), Component Level (where a further specification of mode is nec-
essary or its components, such as Ports, Docks and Locks for Waterborne transport or Equipment, 6
Road Congestion and Parking for Road Traffic Mode, etc.), Aggregation Level (aggregates the
values received from the level below), Atomic Input Level (operational status indicators for the 8
smallest units in the system, e.g. Bus Stop Terminal LOS, Road Segment Congestion status, Sub-
65

Conclusions and Future Work
way Line Operational Status, etc.). The suggested model incorporates the heterogeneous structure 10
of the Transport sector and offers such important features as an easy extensibility and priorities
customization by means of weights attribution to the incoming values. 12
As for the multimodal IS, the review of the background, related works and studies and existing
dashboards has proved the lack of a dashboard that would provide a comprehensive view on the 14
level of service of all transport networks in an urban area. The majority of IS in transportation area
address a single transport mode, and very few solutions combine different modes at the same time. 16
The existing multimodal systems usually do not address the issue of LOS monitoring. The few
examples of transport dashboards focused on LOS information were either unimodal or contained 18
historical rather than real-time data, or both. A need of such a service exists however. It could be
beneficial to public authorities facilitating transport networks monitoring and providing support in 20
the decision making process in cases of emergency events and other situations.
The problem of data supply for the real-time applications in transport area has various so- 22
lutions. Europe-wide and worldwide standards exist for transport-related data communication,
which were reviewed in the Literature Review chapter as well. However, due to the fact of some 24
technologies and standards being in the state of deployment or development, as well as the varied
sets of protocols used in different countries and/or urban areas, a certain degree of abstraction 26
from the concrete data sources was used in the project. Referring to Portugal, various ITS systems
already exist locally or are being introduced. Though the only real-time transport data exchange 28
protocol, which use in Portugal was confirmed during literature review, is DATEX. Some Pub-
lic Transport information exists in GTFS format as well, which within the context of this project 30
would be helpful at the deployment and setup phase.
Based on the performed research and the analysis of various possibilities of a visualization ap- 32
proach for the dashboard, this paper proposes a solution which was developed during the project.
The solution permits a real-time monitoring of the current status of multimodal transport systems 34
in the monitored region. It consists of two major components. The Dashboard GUI offers a map-
based view on the local transport systems performance state, allowing a choice of LOS abstraction 36
from the Domain Level to the Atomic Input Level and geographic abstraction of three levels, from
entire monitored region to sub-areas. It also permits filtering the information on the dashboard by 38
transport domains, modes, components, and aggregations for any LOS and geographic abstraction.
Another feature of the dashboard relevant for the performance analysis tasks and decision-making 40
process is the charts view of the transport systems behavior over the time. The Logic component
performs all necessary calculations, includes interfaces with varied data sources and provides in-
formation through services to the exterior applications based on RESTful communication. It can2
be executed independently on the GUI and used to feed any other systems with the LOS-related
data in a real-time mode.4
This chapter includes further the Strengths, Weaknesses, Opportunities, and Threats (SWOT)
analysis of the project and the future work and perspectives for the dashboard as seen on the6
current stage.
66
Conclusions and Future Work
6.1 SWOT Analysis8
The SWOT analysis provides a better view on the strong and weak sides of the project as well as
its opportunities and major threats.10
6.1.1 Strengths
• Multimodality and comprehensive view of all transport modes, which may substitute single12
mode tools;
• Multimodal transportation LOS evaluation method;14
• A monitoring tool for the entire transport network and quick detection of degradation of
transport systems;16
• Access to historic data, which allows detection of week points of the transportation network
and thus may help in strategic transport management;18
• Independence of the LOS evaluation model on the location of its application;
• The Service-oriented Architecture which enables flexibility and ease of development and20
deployment of new features and functions [HCG+].
6.1.2 Weaknesses22
• Dependency on exogenous information providers – public and commercial organizations
that own and process the transport related information;24
• Absence of digitalized information and/or access to it for some transport modes;
• Amount of data and processing which has a negative impact on application’s performance.26
• Complexity and heterogeneity brought by the multimodal nature of the project.
6.1.3 Opportunities28
• Popularization of multimodal transport applications and data sharing as well as data com-
munication standardization in EU [SAT+13, p. 2] [TR11, p. 3] [GST11, p. 8], that open30
the doors for this project in terms of access to the information;
• Active cooperation with local public and commercial transport infrastructures and authori-32
ties for further project development and growth;
• Becoming a tool for transport systems monitoring and strategic planning for the authorities34
on city, district, state or country scale;
• Adding decision support elements for various needs, possibly such as emergency planning36
and strategic transport planning;
67

Conclusions and Future Work
• Feeding artificial traffic control systems, such as the one described in [RFBO08];38
• Integration with simulation systems for innovative transport, such as for instance the au-
tonomous vehicles simulation system [PR12], for the evaluation of the perspectives of their
integration into transportation networks; 2
• Further re-usage of the hierarchical calculation model as a background for multimodal su-
pervision solutions in other areas besides transportation. 4
6.1.4 Threats
• Temporal or long-term lack of real-time digital information on some components of the 6
LOS model, which may result in the absence of some output values. Such situation would
have a negative impact on the validity of LOS values at higher abstraction, which may fail 8
to reflect transport system’s actual state;
• Insufficiency of data sources, which presents a threat to the idea of multimodality; 10
• Lack of support from local public and commercial transport infrastructures and authorities
which may reduce the information supply to the dashboard; 12
6.2 Future Work
Due to its size, complexity and interdisciplinary nature, the project hasn’t achieved its final state 14
yet and leaves space for further investigation and design. The future work foreseen at this stage
includes the following major steps: 16
• Further specification of data model depending on practical needs of the stakeholders and its
application; 18
• Specification and implementation of raw data verification and validation policies, to address
issues of information conflicts, duplication, etc.; 20
• Implementation of interfaces with external data sources, such as communication protocols;
• Implementation of model configuration tool; 22
• Specification and implementation of importance (weights) attribution framework;
• Implementation of GUI customization feature; 24
• Performing questionnaires and other forms of validation for the suggested dashboard design
approach and its usability evaluation; 26
• Validation of LOS calculation models with the professionals involved in transportation area;
68
Conclusions and Future Work
• Validation of the correct execution of the proposed solution by means of Artificial Trans- 28
portation Systems (ATS), as proposed in [RLT11, p. 309];
• System’s technical and architectural improvements to increase software quality, in accor- 30
dance to the quality requirements defined in Chapter 3, Section 3.1;
• Implementation of a web-application for GUI to allow the access to the dashboard from a 32
browser, independently on device and location;
• Where little data is available on exact routes of PT lines or roads positioning on a map, 34
this problem could be solved by integrating the system with the tools for correcting routing
information through GPS data, as proposed in articles [FCR09, FCR10]; 36
• Extension of the Hierarchical LOS Model by means of measures for the status of the inter-
modal and multimodal connections; 38
• Introduction of the concepts of infrastructure and organization into the LOS Model and
output filters.2
The project in general is reasonably ambitious and presents a number of challenges, but current
trends towards the multimodality and standardization in data communication field present good4
opportunities for its further introduction into real life. During the further extensive real-data testing
and deployment phases, the support from public authorities and local transport operators may6
contribute significantly to the success of the dashboard.
69

Conclusions and Future Work
70

References8
[aN11] Centre for Transport and Navigation. Waterway Guidelines 2011. 2011.
[BBC] BBC. Public Transport Information Tables Index. http://www.bbc.co.uk/10
travelnews/xml/pti/pti_index.html, accessed on 23 January, 2014.
[Bie09] Adam Bien. Java EE or .NET - An Almost Unbiased Opinion : Adam Bien’s12
Weblog. http://www.adam-bien.com/roller/abien/entry/java_ee_or_net_an, accessed on 16 June, 2014, 2009.14
[BLA12] LOÏC BLAIVE. Data Exchange Interfaces, DATEX II. Deployment Guideline.(January):1–30, 2012.16
[BOA00] TRANSPORTATION RESEARCH BOARD. HIGHWAY CAPACITY MANUAL.2000.18
[Cai04] Giovanni Caire. JADE : the new kernel and last developments Summary. 2004.
[CEN09] CEN/TC 278. NeTEx — Network and Timetable Exchange — Part 1 : Network20
Topology Contents. Technical report, CEN/TC 278, 2009.
[CEN13] CEN/TC 278. Public transport — Service interface for real-time information relating22
to public transport operations — Part 3 : Functional service interfaces. Technicalreport, CEN, 2013.24
[Cha10] David Chappell. Introducing Windows Communication Foundation. (January),2010.26
[CLRS09] Thomas H. Cormen, Charles E. Leiserson, Ronald L. Rivest, and Clifford Stein.Introduction to Algorithms. Third Edition, volume 21. The MIT Press, Cambridge,28
3rd edition, January 2009.
[COG13] JEFF COGSWELL. Java vs. C#: Which Performs Better in the ’Real30
World’? - Dice News. http://news.dice.com/2013/01/17/java-vs-c-which-performs-better-in-the-real-world-2/, ac-32
cessed on 16 June, 2014, 2013.
[Com05] Performance Review Commission. Punctuality drivers at major European airports.34
Technical Report May, European Organisation for the Safety of Air Navigation (EU-ROCONTROL), Brussels, 2005.36
[Con] DSDM Consortium. 10. MoSCoW Prioritisation | DSDM CONSORTiUM. http://dsdm.org/content/10-moscow-prioritisation, accessed on 13 June,38
2014.
71

REFERENCES
[Con13] MIELE Consortium. MIELE. Part of Priority Project 21, 2013.
[Cor11] Oracle Corporation. javax.ws.rs (Java EE 6 ). http://docs.oracle. 2
com/javaee/6/api/javax/ws/rs/package-summary.html, accessed on18 June 2014, 2011. 4
[Dir13] Network Manager Directorate. NM Monthly Network Operations Report - Analysis- October 2013. Technical Report October, The European Organisation for the Safety 6
of Air Navigation (EUROCONTROL), Brussels, 2013.
[dN13] Jornal de Noticias. STCP alerta clientes para "perturbações significativas" na 8
terça-feira devido a greve - JN. http://www.jn.pt/paginainicial/pais/concelho.aspx?Distrito=Porto&Concelho=Porto&Option= 10
Interior&content_id=3549876, accessed on 20 June, 2014, 2013.
[Dos10] Siddharth Doshi. DESIGNING A MULTI-MODAL TRAVELER INFORMATION 12
PLATFORM FOR URBAN TRANSPORTATION. PhD thesis, Georgia Institute ofTechnology, 2010. 14
[DRF+08] Richard Dowling, David Reinke, Aimee Flannery, Paul Ryus, Mark Vandehey, TheoPetritsch, Bruce Landis, Nagui Rouphail, and James Bonneson. Multimodal Level 16
of Service Analysis for Urban Streets. Technical report, TRANSPORTATION RE-SEARCH BOARD, WASHINGTON, 2008. 18
[EfAtP] The United Nations Economic (ESCAP), Social Commission for Asia, and the Pa-cific. Multimodal Transport Operations. 20
[Ehi14] Benjamin Ehinger. MySQL vs Oracle | ITX. http://itxdesign.com/mysql-vs-oracle/, accessed on 16 June, 2014, 2014. 22
[Ens12] James Oliver Ensley. Application of Highway Capacity Manual 2010 Level-of-Service Methodologies for Planning Deficiency Analysis. PhD thesis, 2012. 24
[ET] DIRECTORATE-GENERAL FOR MOBILITY EUROPEAN COMMISSION andTRANSPORT. ICT Infrastructure. http://ec.europa.eu/transport/ 26
themes/its/road/application_areas/ict_infrastructure_en.htm, accessed on 6 June, 2014. 28
[(EU14] The European Organisation for the Safety of Air Navigation (EUROCON-TROL). NOP Network Operations Portal. https://www.public.cfmu. 30
eurocontrol.int/PUBPORTAL/gateway/spec/index.html, accessed on14 June, 2014, 2014. 32
[Eze10] Stephen Ezell. Intelligent Transportation Systems. The Information Technology &Innovation Foundation, 2010. 34
[FCR09] Tiago R. M. Freitas, Antoanio Coelho, and Rosaldo J. F. Rossetti. Improving digitalmaps through GPS data processing. In 2009 12th International IEEE Conference on 36
Intelligent Transportation Systems, pages 1–6, St. Louis, MO, October 2009. IEEE.
[FCR10] Tiago R. M. Freitas, Antonio Coelho, and Rosaldo J. F. Rossetti. Correcting routing 38
information through GPS data processing. In 13th International IEEE Conferenceon Intelligent Transportation Systems, pages 706–711, Funchal, September 2010. 40
IEEE.
72

REFERENCES
[FdMV09] Mario Fruianu, Gordon de Munck, and Hans Voerknecht. Cycling in the Nether-2
lands. Technical report, Ministry of Transport, Public Works and Water ManagementDirectorate-General for Passenger Transport, Hague, 2009.4
[FERO08] Paulo Ferreira, Edgar Esteves, Rosaldo J F Rossetti, and Eugénio C Oliveira. A Co-operative Simulation Framework for Traffic and Transportation Engineering. Lecture6
Notes in Computer Science, 5220:89–97, 2008.
[Fin] Findbestopensource.com. Advantages and Disadvantages of using Hiber-8
nate like ORM libraries. http://www.findbestopensource.com/article-detail/orm-advantage-disadvantage, accessed on 16 June,10
2014.
[Fle] Ian Fleming. ISO9126 - Software Quality Characteristics. An overview of the ISO12
9126-1 software quality model definition, with an explanation of the major charac-teristics. http://www.sqa.net/iso9126.html, accessed on 12 June, 2014.14
[Fou] Eclipse Foundation. Help - Eclipse Platform. Plain old Java objects.http://help.eclipse.org/juno/index.jsp?topic=/org.eclipse.16
jst.ejb.doc.user/topics/cpojosandee5.html, accessed on 18 June,2014.18
[GeOa] GeOps. TRAVIC - Transit Visualization Client. http://tracker.geops.ch/,accessed on 20 June, 2014.20
[GeOb] GeOps. Worldwide Transit Tracker | geOps. http://geops.de/node/117?language=en, accessed on 21 June, 2014.22
[Gooa] Google. google-gson - A Java library to convert JSON to Java objects and vice-versa- Google Project Hosting. https://code.google.com/p/google-gson/,24
accessed on 18 June, 2014.
[Goob] Google. What is GTFS? - Transit — Google Developers. https://developers.26
google.com/transit/gtfs/, accessed on 22 June 2014.
[GST11] Patrick Gendre, Bernard Senach, and Brigitte Trousse. Current Trends of Real-Time28
Multimodal Urban Mobility Information Services ( RTMMIS ). (June):1–10, 2011.
[Hau11] Duncan Haughey. MoSCoW Method. Project Smart, page 2011, 2011.30
[HCG+] Chris Harding, Tony Carrato, Mats Gejnevall, Chris Greenslade, Jorge Diaz, AliArsanjani, Jack Fujieda, Alex Heublien, Harry Hendrickx, Kerrie Holley, Dave Ings,32
and Heather Kreger. The SOA Source Book. chapter Service Or.
[HCT04] Kerrie (IBM Global Services) Holley, Kishore (IBM Global Services)34
Channabasavaiah, and Edward M (IBM Software Group) Tuggle. Migratingto a service-oriented architecture. (April), 2004.36
[Hib] Hibernate.org. What is Object/Relational Mapping? - Hibernate ORM. http://hibernate.org/orm/what-is-an-orm/, accessed on 16 June 2014.38
[Hux91] William E. Huxhold. An Introduction to Urban Geographic Information Systems.Oxford University Press, City of Milwaukee, 1991. 2
73
REFERENCES
[JB] JADE-Board. Jade.core.behaviours (JADE v4.3.2 API). http://jade.tilab.com/doc/api/jade/core/behaviours/package-summary.html, ac-cessed on 17 June, 2014.2
[JP07] D. R. Jones and D. E. Pitfield. The Effectiveness of Conceptual Airport TerminalDesigns. Transportation Planning and Technology, 30(5):521–543, October 2007.4
[Kar09] Bill Karwin. Keeping it Simple: Why Should You Use an ORM? http://karwin.blogspot.pt/2009/01/why-should-you-use-orm.html,6
accessed on 16 June, 2014, 2009.
[Kee13] Matthew Keep. Railway performance and subsidy statistics. Technical Report Octo-8
ber, House Of Commons Library, Social and General Statistics Section, 2013.
[Kit99a] Inc. In Kittelson & Associates. Transit Capacity and Quality of Service Manual.10
PART 4 TERMINAL CAPACITY. 1999.
[Kit99b] Inc. In Kittelson & Associates. Transit Capacity and Quality of Service Manual.12
PART 5 QUALITY OF SERVICE. 1999.
[Kit12] Inc. Kittelson & Associates. Regional Congestion Management Program. Technical14
Report 209, San Joaquin Council of Governments, Stockton, 2012.
[Kop03] Dietmar Kopitz. TPEG Final Project Report (2000 – 2003). Technical report, Euro-16
pean Broadcasting Union, 2003.
[KW10] Adib Kanafani and Rui Wang. Measuring Multimodal Transport Level of Service.18
Technical Report August, University of California Transportation Center, Berkeley,2010.20
[LG09] Peide Liu and Zhongliang Guan. Evaluation Research on the Quality of theRailway Passenger Service Based on the Linguistic Variables and the Improved22
PROMETHEE-II Method. JOURNAL OF COMPUTERS, 4(3):265–270, 2009.
[Lit14] Todd (Victoria Transport Policy Institute) Litman. Introduction to Multi-Modal24
Transportation Planning Principles and Practices. 2014.
[Lon] University College London. CityDashboard: London. http://citydashboard.26
org/london/, accessed on 22 January, 2014.
[Ltd10] Oxera Consulting Ltd. How can a quality of service index be created ? Service28
quality report. 2010.
[MBBI10] C Hair Michael R Morris, Allen D Biehler, Larry L Brown, and Randell H Iwasaki.Airport Passenger Terminal Planning and Design. Guidebook., volume 1. Washing- 2
ton, 2010.
[Mck13] Jeff Mckee. Inland Marine Transportation System Levels of Service Update. 2013. 4
[MG09] Gavin (Virginia Tech) Mulligan and Denis (Virginia Tech) Gracanin. A comparisonof SOAP and REST implementations of a service based interaction independence 6
middleware framework. In Simulation Conference (WSC), Proceedings of the 2009Winter, pages 1423–1432, Austin, TX, 2009. IEEE.2
74
REFERENCES
[Mob12] Intelematics Australia Connected Mobility. European update Traffic & TravellerInformation Standards Focus. Technical report, Intelematics Australia Connected2
Mobility European, 2012.
[Nat11] Ireland National Transport Authority. National Cycle Manual. 2011.2
[Nav11] Barak Naveh. Welcome to JGraphT - a free Java Graph Library. http://jgrapht.org/, accessed on 19 June, 2014, 2011.2
[Nel96] Randal C. (Department of Computer Science University of Rochester) Nelson.Graphs: Search. https://www.cs.rochester.edu/u/nelson/courses/4
csc_173/graphs/search.html, accessed on 18 June, 2014, 1996.
[Net13] Network Manager (Eurocontrol). Monthly Network Operations Report. Technical6
Report October, Eurocontrol, 2013.
[NJ02] Timothy J (University of Aberdeen) Norman and Nicholas R (University of Ab-8
erdeen) Jennings. Constructing a Virtual Training Laboratory using IntelligentAgents. International Journal of Continuing Engineering Education and Life Long10
Learning, 12(Numbers 1-4/2002):201–213, 2002.
[NPRI09] Nurzhan (Department of Computer Science Montana State University – Bozeman)12
Nurseitov, Michael (Department of Computer Science Montana State University– Bozeman) Paulson, Randall (Department of Computer Science Montana State14
University – Bozeman) Reynolds, and Clemente (Department of Computer ScienceMontana State University – Bozeman) Izurieta. Comparison of JSON and XML16
Data Interchange Formats : A Case Study. In ISCA 22nd International Conferenceon Computer Applications in Industry and Engineering, CAINE 2009, San Francisco,18
2009.
[OCMA13] A. Luis Osório, Luis M. Camarinha-Matos, and Hamideh Afsarmanesh. Enterprise20
Collaboration Network for Transport and Logistics Services. Collaborative Systemsfor Reindustrialization, 408(2013):267–278, 2013.22
[oG] San Joaquin Council of Governments. RCMP Roadway Per-formance Dashboard. http://www.sjcog-rcmp.org/rcmp-roadway-performance-dashboard, accessed on 23 January, 2014. 2
[Ora11] Oracle. THE PREMIER PLATFORM FOR RICH ENTERPRISE CLIENT APPLI-CATIONS. 2011. 4
[oTa] Maryland Department of Transportation. New MDOT Site. http://www.mdot.maryland.gov/2012HomeContent.html, accessed on 23 January, 2014. 6
[oTb] Virginia Department of Transportation. VDOT Dashboard v3.0. http://dashboard.virginiadot.org/, accessed on 23 January, 2014. 8
[oT09] Florida Department of Transportation. FDOT QUALITY/LEVEL OF SERVICEHANDBOOK. Tallahassee, 2009 edition, 2009. 10
[oT13] Florida Department of Transportation. 2013 QUALITY/ LEVEL OF SERVICEHANDBOOK. Tallahassee, 2013 edition, 2013. 12
75
REFERENCES
[PL96] Richard H. Pratt and Timothy J. Lomax. Performance Measures for MultimodalTransportation Systems. Transportation Research Record: Journal of the Trans- 14
portation Research Board, 1518(Volume 1518 / 1996 Transportation Planning Ap-plications):86, 1996.2
[PotE10] European Parliament and Council of the EU. DIRECTIVE 2010/40/EU OF THE EU-ROPEAN PARLIAMENT AND OF THE COUNCIL of 7 July 2010 on the frame-4
work for the deployment of Intelligent Transport Systems in the field of road trans-port and for interfaces with other modes of transport. Official Journal of the Euro-6
pean Union, pages 1–13, 2010.
[PPM10] I Padayachee, P. Kotze, and A. van Der Merwe. ISO 9126 external systems quality8
characteristics , sub- characteristics and domain specific criteria for evaluating e-Learning systems. 2010.10
[PR12] José L. F. Pereira and Rosaldo J. F. Rossetti. An integrated architecture for au-tonomous vehicles simulation. In Proceedings of the 27th Annual ACM Symposium 2
on Applied Computing - SAC ’12, pages 286–292, New York, New York, USA, 2012.ACM Press. 4
[ptpL] Mais Perto Soluções para transportes públicos Lda. Transportes Públicos em Por-tugal. http://www.transportespublicos.pt/faq/, accessed on 21 June, 6
2014.
[QA13] Kashif Naseer Qureshi and Abdul Hanan Abdullah. A Survey on Intelligent Trans- 8
portation Systems. Middle-East Journal of Scientific Research, 15(5):629–642,2013. 10
[Rai] Network Rail. Performance and punctuality (PPM) - Network Rail. http://www.networkrail.co.uk/about/performance/, accessed on 25 January, 2014.2
[RAKG13] Rosaldo J.F. Rossetti, Joao Emilio Almeida, Zafeiris Kokkinogenis, and JoelGoncalves. Playing Transportation Seriously: Applications of Serious Games to4
Artificial Transportation Systems. IEEE Intelligent Systems, 28(4):107–112, July2013.6
[RB99] Rosaldo José Fernandes Rossetti and Sergio Bampi. A software environment to inte-grate urban traffic simulation tasks. Journal of Geographic Information and Decision8
Analysis, 3(1):56–63, 1999.
[RCS13] Jean-Paul Rodrigue, Claude Comtois, and Brian Slack. The Geography of Transport10
Systems. New York, 2013.
[RFBO08] Rosaldo J. F. Rossetti, Paulo A. F. Ferreira, Rodrigo A. M. Braga, and Eugenio C.12
Oliveira. Towards an Artificial Traffic Control System. In 2008 11th InternationalIEEE Conference on Intelligent Transportation Systems, pages 14–19, Beijing, Oc-14
tober 2008. IEEE.2052
[RLT11] Rosaldo J. F. Rossetti, Ronghui Liu, and Shuming Tang. Guest Editorial SpecialIssue on Artificial Transportation Systems and Simulation. IEEE Transactions on2054
Intelligent Transportation Systems, 12(2):309–312, June 2011.
76
REFERENCES
[ROB07] Rosaldo J F Rossetti, Eugénio C Oliveira, and Ana L C Bazzan. Towards a speci-2056
fication of a framework for sustainable transportation analysis. In 13th PortugueseConference on Artificial Intelligence, Guimaraes, Portugal, 2007.2058
[(RT] The Regional Transportation Commission of Southern Nevada (RTC). FreewayTravel Times: Interactive Dashboard - Performance Monitoring & Measurement2060
System (PMMS). http://bugatti.nvfast.org/, accessed on 6 June, 2014.
[Sal12] Gyula Sallai. Defining Infocommunications and Related Terms. Acta Polytechnica2062
Hungarica, 9(6):5–15, 2012.
[SAT+13] Beasley Simon, Blaquiere Alexandre, Brown Tony, Franco Gino, and Jensen Helge.2064
URBAN ITS EXPERT GROUP. GUIDELINES FOR ITS DEPLOYMENT IN UR-BAN A REAS. MULTIMODAL INFORMATION. (January), 2013.2066
[Sch09] Robin Schumacher. MySQL :: Why Move to MySQL from Microsoft SQLServer? http://dev.mysql.com/tech-resources/articles/move_2068
from_microsoft_SQL_Server.html, accessed on 16 June, 2014, 2009.
[She02] Weiming Shen. Distributed manufacturing scheduling using intelligent agents. In-2070
telligent Systems, IEEE, 17(1):88 – 94, 2002.
[Sof] SmartBear Software. What is soapUI? | About SoapUI. http://www.soapui.2072
org/About-SoapUI/what-is-soapui.html, accessed on 19 June, 2014.
[ST] Microsoft NET Stocktrader and IBM Websphere Trade. .NET 3.0 vs. IBM Web-2074
Sphere 6.1 Benchmark Results.
[STC] SA STCP. STCP. http://www.stcp.pt/pt/institucional/2076
governo-societario/indicadores-chave/, accessed on 23 June, 2014.
[TEM02] TEM Project Central Office. TEM STANDARDS AND RECOMMENDED PRAC-2078
TICE. Technical Report February, United Nations Economic Commission for Eu-rope, Warsaw, 2002.2080
[TIS12] TISA. TISA Guideline TPEG – What is it all about ? (April):1–14, 2012.
[TR11] Rémi Tempier and Peter Rapp. ITS ACTION PLAN. Study “Towards a European2082
Multi-Modal Journey Planner”. Technical Report September, EUROPEAN COM-MISSION, Directorate-General Mobility and Transport, Brussels, 2011.2084
[Tra] Trafiken.nu. Trafiken.nu. http://www.trafiken.nu/Stockholm/, accessedon 23 January, 2014.2086
[Tru08] George Trujillo. MySQL versus Oracle Features/Functionality (A DBA’s Jour-ney in the Sun). https://blogs.oracle.com/GeorgeTrujillo/entry/2088
mysql_versus_oracle_features_functionality, accessed on 16 June,2014, 2008.2090
[vdVLW13] Tom van de Ven, James Long, and Mark Wedlock. ITS ACTION PLAN. Free RoadSafety Traffic Information. Technical Report January, EUROPEAN COMMISSION,2092
Directorate-General Mobility and Transport, Brussels, 2013.
77

REFERENCES
[zMNS05] Michael zur Muehlen, Jeffrey V. Nickerson, and Keith D. Swenson. Developing web2094
services choreography standards—the case of REST vs. SOAP. Decision SupportSystems, 40(1):9–29, July 2005.2096
78

Appendix A
LOS Evaluation Model Diagrams2098
The diagrams below show the dependencies of higher level values from lower level, where de-
tail degree is higher. The corresponding level of abstraction is indicated on the left, where the2100
"Atomic Entity" row serves for the identification of the measured facility, equipment or service
at the Atomic input level and its corresponding type in the data model (value in brackets). The2102
facility in this case may designate a bus stop, an airport terminal, etc., and is associated to the
"point" type. A Service, on its turn, is an entity of the "link" type and could be a port cruise, a2104
flight, a bus line, etc. The values in the boxes contain the following information: the name of the
LOS measure, the unit it is measured in (optional value in brackets), an indicator of a collection2106
of values "1...n" if the LOS represents a collection and not a single value, then, following a colon
":" a function used for calculating the LOS value (does not apply to the Atomic level), and finally2108
function parameters in brackets. The values in the brackets representing LOS value type may be
set to the percentage symbol, "%", which means that the corresponding LOS value is a percentage,2110
or symbol "#" which designates a numeric data type and, finally, it could be an "enum" data type,
which means that the LOS may take one of the defined values.2112
In some cases, there appears an word "AND" in LOS value names which means that the
corresponding cell represents in fact two or more LOS values, each of which has a its own sub-2114
graph of lower level LOS values. E.g. "Urban Public Transport LOS AND Interurban Public
Transport LOS" in Figure A.3 . In such cases these sub-graphs do not intersect but have identical2116
structure. This was made solely for the purpose of a more compact view of the diagrams.
Weights may be attributed to all connections, where several inputs contribute to the calculation2118
of a LOS value, since the inputs may have different priorities and importance.
Due to the dimensions on the LOS Model diagram, it was was divided into several parts which2120
appear in this appendix in the following order:
1. High level LOS structure, which includes Top, Domain and Mode levels, Figure A.1. Each2122
node from the Mode level on this diagram is illustrated in the figures that follow;
2. Road Traffic LOS Diagram, Figure A.2;2124
3. Urban and Interurban Public Transport LOS, Figure A.3;
79
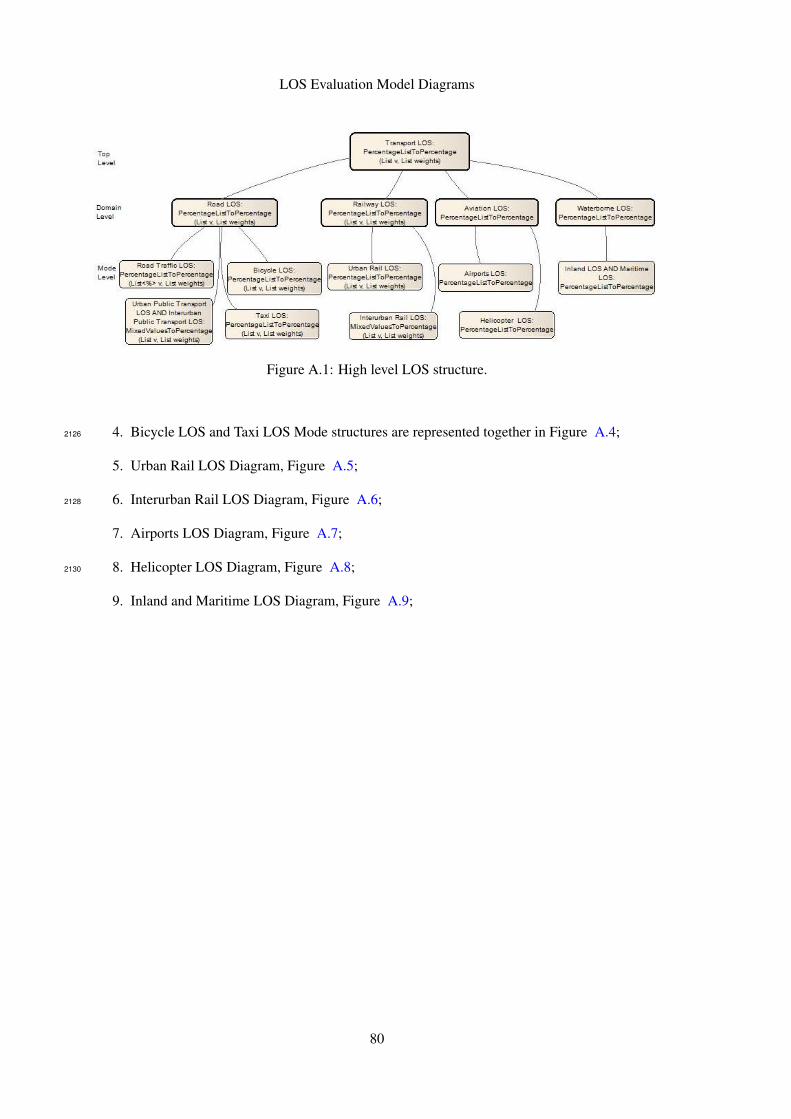
LOS Evaluation Model Diagrams
Figure A.1: High level LOS structure.
4. Bicycle LOS and Taxi LOS Mode structures are represented together in Figure A.4;2126
5. Urban Rail LOS Diagram, Figure A.5;
6. Interurban Rail LOS Diagram, Figure A.6;2128
7. Airports LOS Diagram, Figure A.7;
8. Helicopter LOS Diagram, Figure A.8;2130
9. Inland and Maritime LOS Diagram, Figure A.9;
80

LOS Evaluation Model Diagrams
Figure A.2: Road Traffic LOS Diagram.
Figure A.3: Urban and Interurban Public Transport LOS Diagram.
81

LOS Evaluation Model Diagrams
Figure A.4: Bicycle LOS and Taxi LOS Mode Diagrams.
82
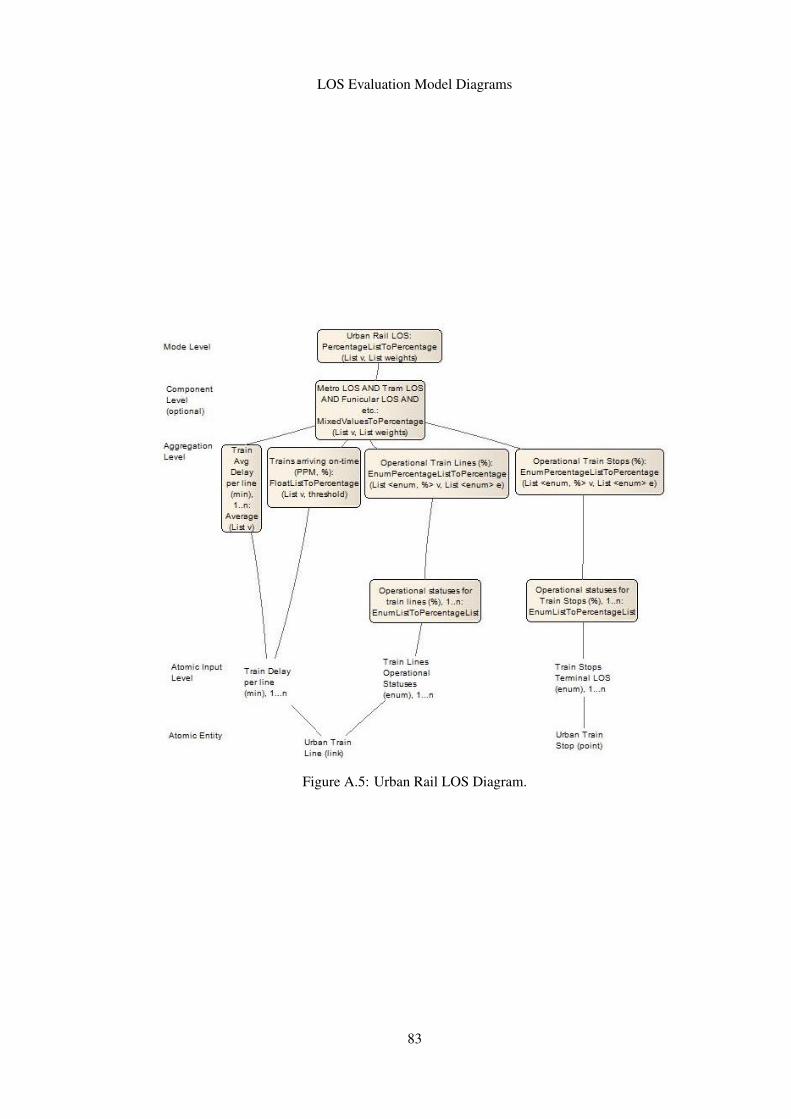
LOS Evaluation Model Diagrams
Figure A.5: Urban Rail LOS Diagram.
83

LOS Evaluation Model Diagrams
Figure A.6: Interurban Rail LOS Diagram.
84
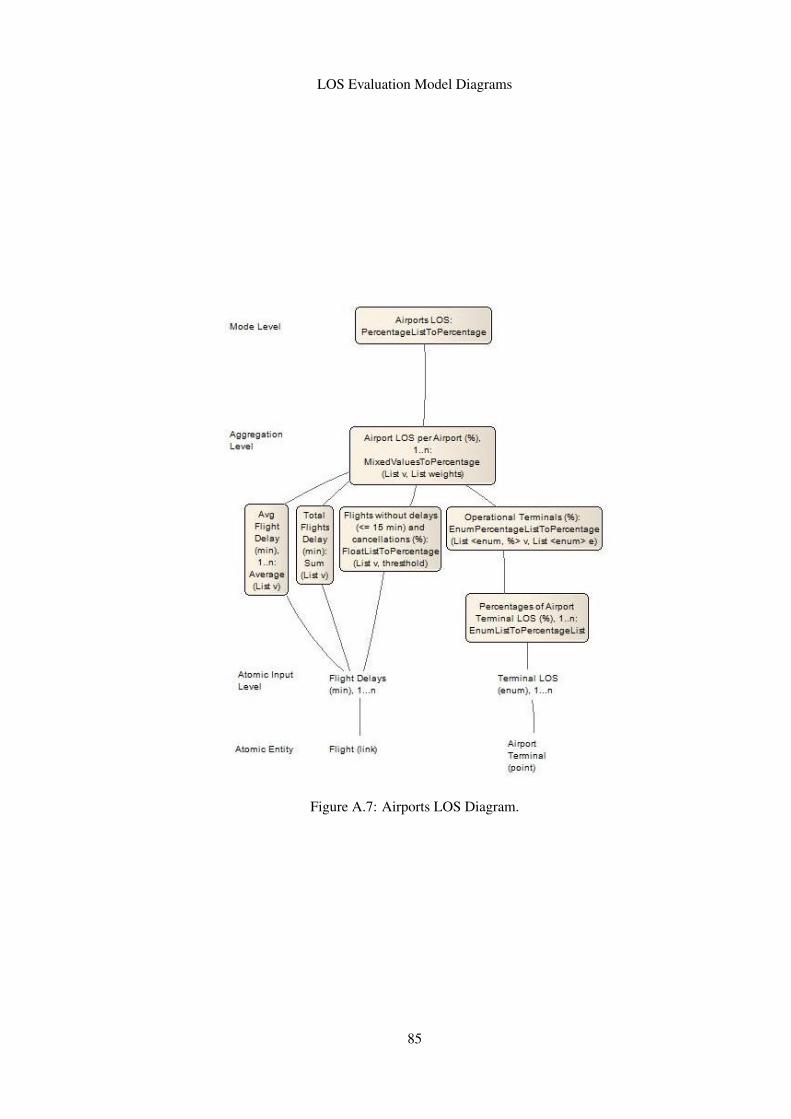
LOS Evaluation Model Diagrams
Figure A.7: Airports LOS Diagram.
85

LOS Evaluation Model Diagrams
Figure A.8: Helicopter LOS Diagram.
Figure A.9: Inland and Maritime LOS Diagram.
86

Appendix B2132
Data Model Detailed View
87

Data Model Detailed View
Figure B.1: Data Model Detailed View.
88

Appendix C2134
Dashboard Screen-shots
89

Dashboard Screen-shots
Figure C.1: Dashboard Default View. Domain level LOS indicators at City abstraction with alldomains selected.
Figure C.2: Dashboard View with Legend and Atomic LOS Indicators at City Abstraction.
90

Dashboard Screen-shots
Figure C.3: Line Chart View with Historical Values For Metro LOS. Indicators on the map corre-spond to Component level at Area abstraction.
Figure C.4: Stack Bar Chart View with Historical Values for Operational Statuses For Urban BusStops. Indicators on the map correspond to Aggregation level at City abstraction.
91
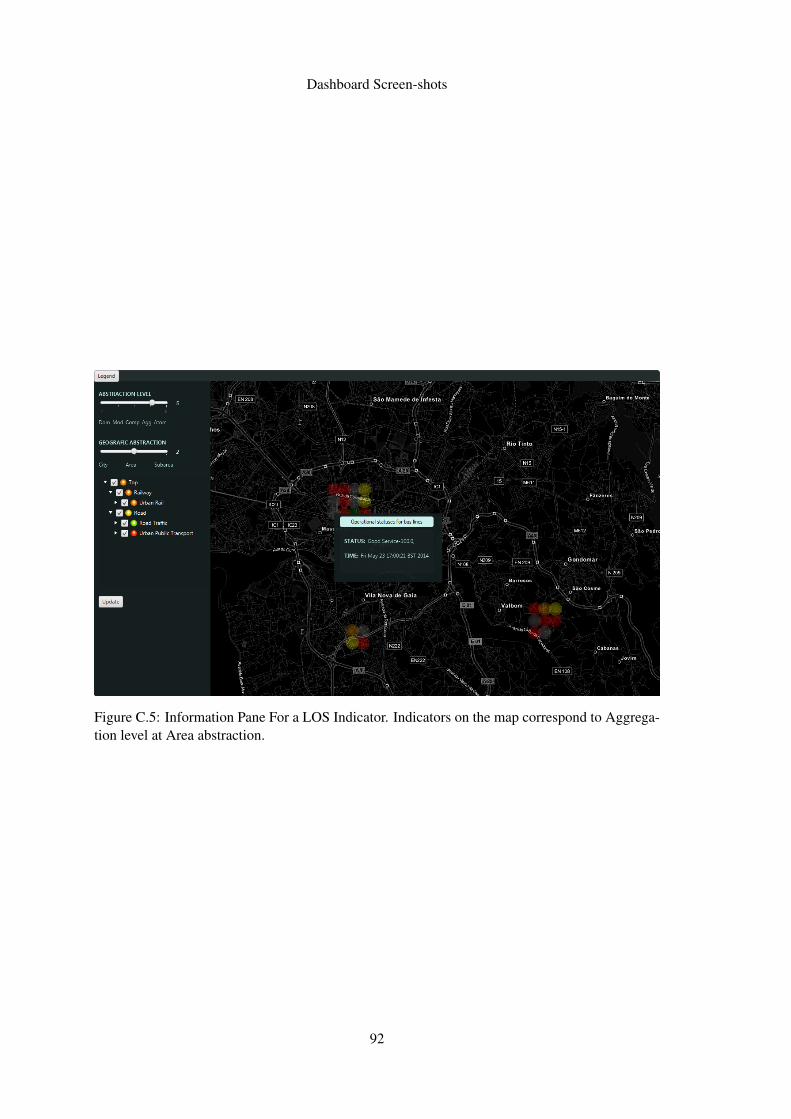
Dashboard Screen-shots
Figure C.5: Information Pane For a LOS Indicator. Indicators on the map correspond to Aggrega-tion level at Area abstraction.
92

Appendix D2136
Output Values
Table D.1: Output Values.
TransportMode
Output Value Array orsingle value
DataType
Boundaries
Maritime Maritime LOS single float [0,100]
Maritime Sea LOS single float [0,100]
Maritime Inland LOS single float [0,100]
Maritime Ports LOS single float [0,100]
Maritime Locks LOS single float [0,100]
Maritime Docks LOS single float [0,100]
Maritime Port Operational Status array enum x values
Maritime Percentage of available locks single float [0,100]
Maritime Percentages of operational
statuses for locks
array float [0,100]
Maritime Lock LOS array enum x values
Maritime Lock Operational Status
(open/closed/full)
array enum x values
Maritime Lockages Operational Status array enum x values
Maritime Percentages of operational
statuses for docks
array float [0,100]
Maritime Percentage of available docks single float [0,100]
Maritime Docks Operational Status array enum x values
Road Road LOS single float [0,100]
Road Road Traffic LOS single float [0,100]
Road Public Transport LOS single float [0,100]
Road Bicycle LOS single float [0,100]
Road Congestion per road segment array enum x values
93

Output Values
Road Percentage of non-congested
roads
single float [0,100]
Road Percentage of road segments
per congestion status
array float [0,100]
Road Equipment Statuses array enum x values
Road Percentage of Operational
Equipment per road segment
array float [0,100]
Road Percentage of Roads with op-
erational equipment
single float [0,100]
Road Percentage of Operational
equipment
single float [0,100]
Road Percentages of operational
statuses for Bus Stops
array float [0,100]
Road Bus Stops Terminal LOS array enum x values
Road Bus Lines Operational Status array enum x values
Road Percentages of operational
statuses for bus lines
array float [0,100]
Road Bus Lines Avg Delay per
line, min
single float [0, 1440]
Road Percentage of buses arriving
on-time
single float [0,100]
Road Delays per Bus line, min array int [0, 1440]
Road Percentage of buses arriving
on-time
single float [0,100]
Road Total Bicycles Available single float [0,100]
Road Bicycles Availability per sta-
tion
array int [0, Max-
Value]
Road Bike station statuses (full /
empty / medium)
array enum x values
Road Percentages of non-empty
bike stations
array float [0,100]
Aviation Aviation LOS single float [0,100]
Aviation Medium Airport LOS single float [0,100]
Aviation Airports LOS single float [0,100]
Aviation Helicopter LOS single float [0,100]
Aviation Avg Delay per Flight per air-
port, min
array float [0, 1440]
94
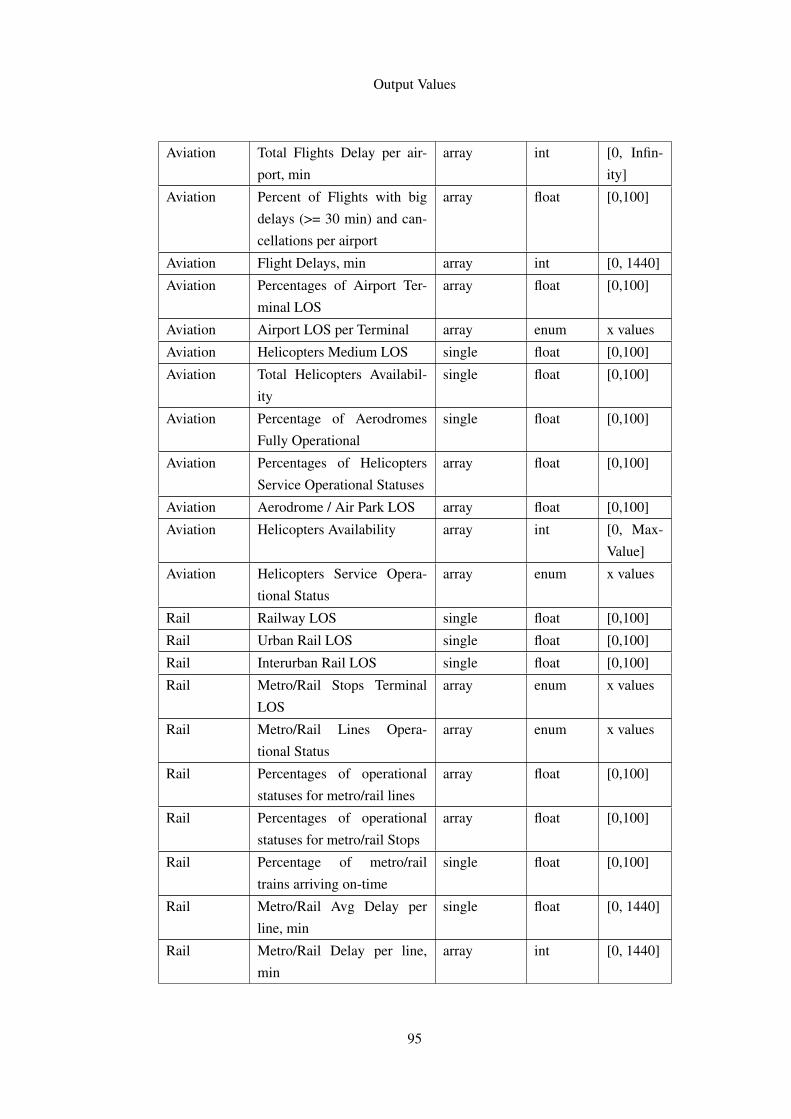
Output Values
Aviation Total Flights Delay per air-
port, min
array int [0, Infin-
ity]
Aviation Percent of Flights with big
delays (>= 30 min) and can-
cellations per airport
array float [0,100]
Aviation Flight Delays, min array int [0, 1440]
Aviation Percentages of Airport Ter-
minal LOS
array float [0,100]
Aviation Airport LOS per Terminal array enum x values
Aviation Helicopters Medium LOS single float [0,100]
Aviation Total Helicopters Availabil-
ity
single float [0,100]
Aviation Percentage of Aerodromes
Fully Operational
single float [0,100]
Aviation Percentages of Helicopters
Service Operational Statuses
array float [0,100]
Aviation Aerodrome / Air Park LOS array float [0,100]
Aviation Helicopters Availability array int [0, Max-
Value]
Aviation Helicopters Service Opera-
tional Status
array enum x values
Rail Railway LOS single float [0,100]
Rail Urban Rail LOS single float [0,100]
Rail Interurban Rail LOS single float [0,100]
Rail Metro/Rail Stops Terminal
LOS
array enum x values
Rail Metro/Rail Lines Opera-
tional Status
array enum x values
Rail Percentages of operational
statuses for metro/rail lines
array float [0,100]
Rail Percentages of operational
statuses for metro/rail Stops
array float [0,100]
Rail Percentage of metro/rail
trains arriving on-time
single float [0,100]
Rail Metro/Rail Avg Delay per
line, min
single float [0, 1440]
Rail Metro/Rail Delay per line,
min
array int [0, 1440]
95

Output Values
News,MM Events array text
Table D.1: Output Values.
96
Appendix E2138
Software Engineering
E.1 Use Cases2140
There are two types of dashboard users: non-authenticated user and authenticated user who has
access to a wider range of functionalities. Another actor represents data sources, the number of2142
which can be more than one.
Non-authenticated user has access to the following uses:2144
• Authenticate
• Observe the system2146
• Select to view certain specific information
Authenticated user’s possible uses consist in the following:2148
• Observe the system
• Select to view certain specific information2150
• Receive alarms and notifications in case when there is a degradation of a certain LOS value
• Customize the dashboard in order to monitor only the most important and critical informa-2152
tion
• Configure the system in accordance to the needs and interests of the organization or institu-2154
tion the user belongs to
• Subscribe to or unsubscribe from notifications, depending on their importance to the user2156
and/or organization
The Data Source actor is responsible for delivering the raw data, which should then be verified,2158
validated, mapped and finally inserted to the database.
The detailed Use Case diagram is presented in Figure E.1.2160
97

Software Engineering
Figure E.1: Use Case Model Diagram.
E.2 User Stories
The User Stories (US) have been defined for the system implementation in two levels of detail:2162
high level US and Detailed US. The high level US are as follows:
1. As a General User, I want to have a clear vision of all transport systems (TSs) that are2164
monitored on the dashboard in real time, so that I could see their current LOS and make
decision based on this information.2166
2. As an Authenticated User, I want to be alarmed or notified by the system in case some TS
suffers LOS degradation, so that I could perform a necessary action with a minimal delay.2168
3. As a General User, I want to see the details on the TS that suffered LOS degradation, such
as TS infrastructure details, problem/event details, time and date problem/event occurred,2170
details of affected area (road segment, etc.), responsible authorities (name, contacts, etc.),
so that I and/or responsible authorities could treat the problem properly.2172
4. As a General User, I want to have access to historical data on TSs LOS, so that I could spot
the weak points and analyze tendencies.2174
98

Software Engineering
5. As an Authenticated User, I want to customize the dashboard, so that the LOS values were
calculated in accordance with the existing priorities and dependencies, as set by my organi-2176
zation.
6. As an Authenticated User, I want to configure dashboard, so that it would display only the2178
necessary information with a required detail level using an optimal layout.
7. As an Authenticated User, I want to subscribe or unsubscribe from notifications about LOS2180
change, so that I would only receive notifications I am interested in.
The detailed user stories are listed in the Table E.1, where a priority value is attributed to each2182
requirement, based on MoSCoW Prioritisation Method, which defines four priority levels, from
the highest to the lowest: Must, Could, Should, Won’t or Would [Con, Hau11].2184
Table E.1: User Stories
USID
As an I want to So that Priority(MoSCoW)
101 General
User
Have access to the top level
LOS that evaluates the sta-
tus of the entire transport net-
work
I could instantly perceive the
general status of local trans-
port
MUST
102 General
User
Have access to the domain
level LOS that evaluates the
status of the entire transport
domain, such as Aviation,
Road, Rail and Maritime
I could instantly perceive the
status of the corresponding
transport domain
MUST
103 General
User
Have access to the mode
level LOS that evaluates the
status of the entire transport
mode, such as Road Traffic,
Urban Bus (PT), Interurban
Bus, Bicycle, Taxi, Urban
Rail, Interurban Rail, Air-
port, Helicopter, Inland Wa-
terborne Transport, Maritime
Transport
I could perceive the status of
the corresponding transport
mode
MUST
99

Software Engineering
104 General
User
Have access to the Aggre-
gation Level LOS values on
various transport modes that
aggregate the atomic inputs
for a conjunction of elements
such as bus stops, lines, road
segments, flights, etc., in per-
centage, numeric format or in
the form of an average status
I could analyze the operation
of a certain transport mode in
more detail
MUST
105 General
User
Have access to the Atomic
and Input level values
I could analyze details of
the operation of a certain
transport mode or its com-
ponent and localize the ele-
ments with LOS degradation
SHOULD
106 General
User
Authenticate in the system I could view the LOS values
in accordance with the cus-
tomization and configuration
performed for my account
SHOULD
201 Authenticated
User
Be alarmed by the system in
case of Top, Domain or Mode
Level LOS degradation
I could immediately in-
form of the problem the
responsible organization/per-
son and/or make informed
decision/planning
SHOULD
202 Authenticated
User
Be notified by the system
about Component or Aggre-
gation Level LOS degrada-
tion
I could immediately in-
form of the problem or
request information from
the responsible organiza-
tion/person and forecast
possible consequences for
other modes/TSs
SHOULD
203 Authenticated
User
View notifications about
Atomic and Input Level LOS
degradation
I could quickly localize the
elements with LOS degra-
dation and/or causing LOS
degradation on a higher level
and forecast possible conse-
quences for other modes/TSs
SHOULD
100

Software Engineering
301 General
User
See the details on the TS
that suffered LOS degrada-
tion, such as TS infrastruc-
ture details, Problem/event
details, time and date prob-
lem/event occurred, details of
affected area (road segment,
etc.), responsible authorities
(name, contacts, etc.)
I and/or responsible authori-
ties could treat the problem
properly
COULD
401 General
User
Be offered a choice to access
historical data on each LOS
value
I could check the tendencies
and evolution of each LOS
value over the time
SHOULD
402 General
User
After selecting a certain LOS
value historical view, to view
a chart with its dynamics for
a certain period of time
I could analyze the tenden-
cies of a certain TS/compo-
nent/element LOS
COULD
403 General
User
After selecting a certain LOS
value historical view, to be
able to choose a period and
time format (daily/ weekly/
monthly/ etc. or continuous
time)
I could analyze the tenden-
cies of a certain TS/ compo-
nent/ element LOS for a cer-
tain period of time
WON’T
501 Authenticated
User
Customize the set of LOS
values to be included in the
system
The dashboard would calcu-
late LOS values that are ap-
plicable to the given geo-
graphic area
COULD
502 Authenticated
User
Customize the set of inputs
for each LOS value from
lower levels
The system would calculate
LOS values in an adequate
and correct way
COULD
503 Authenticated
User
Customize the weights of in-
puts when there are more
than one inputs to the next
level LOS value
The system would calculate
LOS values based on in-
puts priorities and impor-
tance, which may not be uni-
form
SHOULD
504 Authenticated
User
Have my setting saved after
the customization
I wouldn’t need to repeat cus-
tomization every time at au-
thentication
SHOULD
101

Software Engineering
601 Authenticated
User
Select the LOS values to be
displayed on the dashboard
It would display only the
necessary values in order
to avoid information over-
whelming
COULD
602 Authenticated
User
Change layout of LOS values
on the dashboard (their posi-
tion and size)
I had a more convenient pre-
sentation of the information
for its better perception
COULD
603 Authenticated
User
For each displayed LOS
value, to be able to choose a
chart type (or other presenta-
tion mode)
I had a more convenient pre-
sentation of the information
for its better perception
WON’T
604 Authenticated
User
After selecting a certain LOS
value historical view, to be
able to choose a chart type (or
other presentation mode)
I had a more convenient pre-
sentation of the information
for its better perception
WON’T
605 Authenticated
User
Have my setting saved after
the configuration
I wouldn’t need to repeat
configuration every time at
authentication
SHOULD
701 Authenticated
User
Subscribe for notifications
about LOS change that I am
interested in
I would receive information
on the change of LOS values
that are important to me
WON’T
702 Authenticated
User
Unsubscribe from notifica-
tions about LOS change
I would only receive notifica-
tions I am interested in
WON’T
Table E.1: User Stories
E.3 Work Plan
The implementation process was divided into fifteen macro tasks which are described in this sec-2186
tion. The tasks are listed in their chronological order, however it is understood that the implementa-
tion process followed an incremental development model, where software components developed2188
at earlier phases may suffer changes and improvements during following phases.
1. Implementation of database structure;2190
2. Populating database which includes the LOS Model, as well as some transport systems data
necessary for testing purposes;2192
3. Integration of development tools (IDE, Hibernate, libraries, etc.);
4. Creating a prototype representing software architecture (projects, major packages and classes);2194
102
Software Engineering
5. Implementation and tests of LOS functions;
6. Implementation of graph traversal algorithms for two scenarios: the startup calculations2196
over the entire LOS Model and re-calculations on the arrival of a new value;
7. Testing graph algorithms and triggered calculations;2198
8. Implementation of web-services and their testing using the SoapUI tool, an open source
functional testing solution [Sof];2200
9. Implementation of Broker component, responsible for the communication with information
sources and obtaining new values;2202
10. Integration of the GUI framework into the project;
11. Implementation of the interface with the server on client side (GUI);2204
12. Testing the correct execution of GUI in conjunction with the server;
13. Implementation of user controls and filters on GUI;2206
14. Testing the application in real-time mode with random value generation;
15. Testing the application in real-time mode with real values read from a file.2208
103