INTEGRATED MACROECONOMIC ACCOUNTS FOR THE UNITED · PDF file ·...
51
INTEGRATED MACROECONOMIC ACCOUNTS FOR THE UNITED STATES: DRAFT SNA-USA A JOINT PROJECT OF THE BOARD OF GOVERNORS OF THE FEDERAL RESERVE SYSTEM AND THE BUREAU OF ECONOMIC ANALYSIS Current Version: July 2005 Albert M. Teplin, CSE Analysis Rochelle Antoniewicz, Investment Company Institute* Susan Hume McIntosh, Board of Governors of the Federal Reserve System* Michael G. Palumbo, Board of Governors of the Federal Reserve System* Genevieve Solomon, Federal Reserve Bank of Dallas* Charles Ian Mead, Bureau Of Economic Analysis, U.S. Department of Commerce* Karin Moses, Bureau Of Economic Analysis, U.S. Department of Commerce* Brent Moulton, Bureau of Economic Analysis, U.S. Department of Commerce* *The analysis and conclusions set forth are those of the authors and do not indicate concurrence by other members of their respective research staffs, the Board of Governors of the Federal Reserve System, the Bureau of Economic Analysis, or the Department of Commerce. Data in this publication are estimates based on incomplete source material and are not official figures of the U.S. Government or the Federal Reserve System.
Transcript of INTEGRATED MACROECONOMIC ACCOUNTS FOR THE UNITED · PDF file ·...

IINNTTEEGGRRAATTEEDD MMAACCRROOEECCOONNOOMMIICC AACCCCOOUUNNTTSS FFOORR TTHHEE UUNNIITTEEDD SSTTAATTEESS:: DDRRAAFFTT SSNNAA--UUSSAA
A JOINT PROJECT OF THE BOARD OF GOVERNORS OF THE FEDERAL RESERVE SYSTEM AND
THE BUREAU OF ECONOMIC ANALYSIS
Current Version: July 2005 Albert M. Teplin, CSE Analysis Rochelle Antoniewicz, Investment Company Institute* Susan Hume McIntosh, Board of Governors of the Federal Reserve System* Michael G. Palumbo, Board of Governors of the Federal Reserve System* Genevieve Solomon, Federal Reserve Bank of Dallas* Charles Ian Mead, Bureau Of Economic Analysis, U.S. Department of Commerce* Karin Moses, Bureau Of Economic Analysis, U.S. Department of Commerce* Brent Moulton, Bureau of Economic Analysis, U.S. Department of Commerce*
*The analysis and conclusions set forth are those of the authors and do not indicate concurrence by other members of their respective research staffs, the Board of Governors of the Federal Reserve System, the Bureau of Economic Analysis, or the Department of Commerce. Data in this publication are estimates based on incomplete source material and are not official figures of the U.S. Government or the Federal Reserve System.

I. INTRODUCTION
This paper reports on an ongoing effort at the Federal Reserve Board (FRB) and the
Bureau of Economic Analysis (BEA), henceforth the agencies, to integrate the nation’s
macroeconomic accounts. BEA publishes the national income and product accounts (NIPA) and
international transaction accounts (ITA). The NIPA conveys production and income flows in the
United States—the current accounts. The NIPA also includes data on the accumulation and value
of reproducible, tangible assets. The presentation in the NIPA is heaviest on national aggregates,
with a mixture of sector and transaction detail. The ITA records the nation’s transactions and
balances with the rest of the world. It provides detail on the U.S. external position and changes in
that position, in many cases by region and country.
The FRB publishes the flow of funds accounts (FFA). The focus of the presentation is on
sector activity. For each sector, the FFA combines a capital account (showing saving and capital
expenditures) and a financial account (showing net acquisition of financial assets and net
incurrence of liabilities). The FFA includes detail on flows of financial instruments and stocks of
financial assets and liabilities. For certain private sectors, the FFA has balance sheets, which
combine information on tangible assets with stocks of financial assets and liabilities. The FFA
offers considerable detail for specific financial instruments, such as mortgages, corporate bonds,
and deposits.
The three published accounts—NIPA, ITA, and FFA—are major elements of a full set of
integrated national accounts outlined in standards developed by a consortium of international
agencies and published as the System of National Accounts 1993 (SNA93).1 The U.S. accounts
provide a long history of macroeconomic activity, using a consistent methodology, and with a
level of detail and quality rarely matched in accounts of other countries. The publications are
available quarterly and are produced in a timely fashion.
Over the past decade, many changes to the U.S. accounts have moved them closer to
SNA93 standards. For example, in the NIPA comprehensive revision that was released in
December 2003, the tables and definition of transactions were changed to make them much more
1 SYSTEM OF NATIONAL ACCOUNTS 1993, prepared under the auspices of the Inter-Secretariat Working Group on National Accounts, Commission of the European Communities-Eurostat, International Monetary Fund, Organization for Economic Co-operation and Development, United Nations, and World Bank (1993).

1
consistent with SNA93.2 Nonetheless, the agencies and the user public have recognized that the
accounts could be more fully integrated.3 Closer coordination between the agencies would ensure
that certain critical elements—such as sector boundaries, alternative data sources, and treatment
of transactions—are handled in a way that minimizes distortions to important analytical concepts.
Integration likely would align U. S. statistics more closely with those of other nations, and allow
policymakers and researchers to analyze more fully and accurately the interrelationships of the
nation’s financial and nonfinancial activities. Integration of the accounts also would provide a
common terminology and a uniform presentation that highlighted connections between the
activities described in separate accounts.
The U.S. effort toward a better or more fully integrated set of economic accounts has a
history, with a particularly noteworthy undertaking by Richard Ruggles and Nancy Ruggles about
a quarter century ago.4 While retaining much of the existing account structure, they showed a
framework for all economic statistics that embraced both stocks and flows using the then-existing
NIPA, ITA, and FFA. The commentary on their effort highlighted significant conceptual issues
and considerable disagreement on the form of such accounts. Some of those issues and
disagreements remain; but over the years, international consensus, published in SNA93, have
eliminated many.
Given the consensus, our work focuses on the actual production of accounts. With regard
to the Ruggles’s 1982 paper, James Tobin noted that “their experiment … illustrate[d] the well-
known problem. It is difficult to reconcile data from the different sources, and disturbingly large,
unexplained discrepancies remain…Conceptual integration needs to be matched by a concerted
effort to diagnose and remedy these inconsistencies.”5
Diagnosing and remedying inconsistencies has been our goal. Indeed, preparing this
paper, including the attached tables, is perhaps the most significant joint effort on the accounts
since the Tobin comment was made. The agencies have looked closely at sector boundaries and
2 Brent R. Moulton and Eugene P. Seskin, “Preview of the 2003 Comprehensive Revision of the National Income and Product Accounts: Changes in Definitions and Classifications,” SURVEY OF CURRENT BUSINESS, vol. 83 (June 2003), 17-34; and Nicole Mayerhauser, Shelly Smith, and David F. Sullivan, “Preview of the 2003 Comprehensive Revision of the National Income and Product Accounts: New and Redesigned Tables,” vol. 83 (August 2003), 7-31. 3 For example, references to the integration of the NIPA and FFA are contained both in general and specific terms in “BEA’s Strategic Plan for FY 2001-2005,” SURVEY OF CURRENT BUSINESS, vol. 82, (May 2002), 8-32. 4 Richard Ruggles and Nancy D. Ruggles, “Integrated Economic Accounts for the United States, 1947-80,” SURVEY OF CURRENT BUSINESS, vol. 62 (May 1982), 1-53. Discussion by other experts is contained in pages 54-75. 5 Ibid, 74.

2
the nature of discrepancies that arise from using different data sources, judgmental adjustments,
and estimating techniques. We have uncovered many issues and have solved a number of them;
others remain for future work.
We have also considered ways to present the vast amount of data that lie within
integrated accounts. As matters stand, the FFA quarterly release is more than a hundred pages
and the number of tables in the NIPA and ITA could easily fill an equal number of pages. Even if
done parsimoniously and coherently, a combined set of accounts likely will require considerable
navigation by the user.
Other countries and economic areas are in various stages of providing a fully integrated
set of macroeconomic accounts. Canada, for example, has published integrated accounts for
some time. The integration extends to benchmarking to the input-output accounts. Moreover,
within Statistics Canada, there is coordination so that common estimation methods are used
among the accounts; and, where issues arise, implications are considered for the full range of
accounts, rather than a single portion.6
Eurostat provides a coordinating role within Europe. They have published standards in
the European System of Accounts (ESA95) patterned on SNA93. EU member countries are
legally required to meet the standards for national income and product accounts and financial
accounts over a set time schedule. They are requested to transmit regularly annual financial and
nonfinancial accounts to Eurostat. The European Central Bank is coordinating development of
quarterly financial accounts for the euro area, and, thus far, countries have provided quarterly
national data, which are used, together with other euro area financial statistics, to compile a
subset of quarterly Monetary Union financial accounts for nonfinancial sectors, insurance
companies, and pension funds. They are working toward expanding the integrated system to
seven sectors—households, nonfinancial corporations, government, monetary financial
institutions, insurance corporations and pension funds, other financial intermediaries, and the rest
of the world.
International agencies are also providing impetus to the efforts. The IMF guides and
manuals for national statistics are increasingly ensuring that accounting and other elements are
6 A more thorough description of three counties integrated accounts is provided in a paper by Karen Wilson (2004), “The Architecture of the System of National Accounts: A Three-Way International Comparison of Canada, Australia, and the United Kingdom.”

3
consistent with SNA93 standards.7 Moreover, international agencies have sponsored ongoing
committees and conferences during which issues pertaining to SNA93 standards are addressed.
Currently, an effort is underway to update SNA93. The OECD is coordinating dissemination of
integrated accounts among member countries.8
The next section of this paper offers an overview of the contents of an integrated set of
accounts and reviews how those accounts are related to current publications in the U.S. Section
III discusses draft SNA-USA sector tables produced with the recent data in the NIPA, ITA, and
FFA. Section IV highlights several issues that affect the quality of the accounts, mainly those
dealing with the statistical discrepancies between the capital and financial accounts. Section V
has a few concluding remarks.
II. WHAT ARE INTEGRATED ACCOUNTS AND WHERE DO WE STAND WITH CURRENT
PUBLICATIONS?
The SNA93 structure envisions separate statements for sectors of the economy. Each
statement contains accounts for production, income, saving, investment, and financial flows for
that sector. Those sector flow accounts are combined with information on changes in value of
assets and liabilities due to factors not related directly to production and saving. All together, the
integrated accounts offer a means to track the sources of change in sectors’ net worth; the SNA93
structure begins with a balance sheet position and fully explains how that position evolves.
Along the way, it provides detail on transactions, the distribution of income by factors of
production, saving, capital formation, financial intermediation, and other aspects of national and
sector economic activity.
The types of accounts are listed in text table A, along with comments on how each
account relates to what is currently published. The first, the current account, is comprised of
production and income sub accounts that provide the familiar measures for gross domestic
product (GDP), national income, and their components.
Although there are nearly three-hundred NIPA tables that provide extensive detail on the
flows underlying the major aggregates, there are still some gaps relative to what would be needed
for a complete set of integrated accounts. In addition to what is currently in the NIPA, the 7 Examples include QUARTERLY NATIONAL ACCOUNTS MANUAL, CONCEPTS, DATA SOURCES, AND COMPILATION, by Adriann M. Bloem, Robert J.Dipplesman, and Nils Ø. Mæhle, (Washington, D.C., International Monetary Fund, 2001); MONETARY AND FINANCIAL STATISTICS MANUAL, (Washington, D.C., International Monetary Fund, 2000); and BALANCE OF PAYMENTS COMPILATION GUIDE, (Washington, D.C., International Monetary Fund, 1995). 8 BEA prepares estimates for the OECD on an SNA basis; these estimates and their relationship to the NIPA is described in Mead, Moses, and Moulton (2004).

4
integrated accounts envision providing such information by major sectors and subsectors. In the
production account, SNA93 recommends a presentation of gross output, intermediate
consumption, and value added by each sector. BEA provides this type information by industry in
its input-output and GDP-by-industry accounts, and provides value-added information by sector
in tables 1.3.5 and 1.14. However, the NIPA tables do not provide information on gross output or
intermediate consumption for nongovernment sectors. The more familiar presentation of GDP in
NIPA table 1.1.5, though, presents it as the sum of final expenditures (a calculation that SNA93
presents only in the input-output or “supply-use” tables). The SNA93 distribution and use of
income accounts are similar to the NIPA private enterprise income, personal income and outlay,
government receipts and expenditures, and foreign transactions accounts, but would show more
detail on financial and nonfinancial corporations and noncorporate business. Published integrated
accounts may retain the information shown on these or similar tables, but they would also clearly
derive the saving for each sector and for the total economy.
The most important shortcoming of the NIPA relative to the integrated accounts
envisioned by SNA93 is an inconsistency in sector definitions between the production account
and the distribution and use of income account. While SNA93 calls for using consistently
defined sectors throughout, the sectors emphasized in the NIPA production account differ from
those presented in the distribution and use of income accounts. The NIPA production account, as
shown in table 1.3.5, presents three major domestic sectors—business (including private and
government noncorporate business), general government, and households and institutions. In
contrast, the distribution and use of income accounts feature a personal sector (which includes
income derived from private noncorporate business), a government account (which includes
government business enterprises--that is, the full public sector), and, implicitly, a corporate
business sector, which is defined by corporate legal form of organization.9 Some production
information is presented for corporate business, but these estimates are based on the income
approach, and, therefore, differ from the expenditure-approach estimates for the other production
account sectors. Consequently, the statistical discrepancy between these two types of estimates
prevents the derivation of an estimate of value-added for the noncorporate business sector as the
difference between value-added for corporate business and for the full business sector.
Developing estimates for a consistent set of sectors is a major objective of this paper.10
9 The distribution and use of income accounts are presented in table 2.1 for the NIPA personal sector, in table 3.1 for the government (including government enterprises), and in table 1.14 for the corporate business sector. 10 See also Kishori Lal, “Measurement of Output, Value Added, GDP in Canada and the United States: Similarities and Differences,” Research paper 13F0031MIE-No.010, Statistics Canada (June 2003).

5
A second set of accounts is accumulation accounts. Much of the information for the
capital account, the first accumulation account, is provided in the current NIPA. Data for capital
outlays and saving are compiled by major sectors. Although not currently labeled as such, FFA
sector statements—such as table F.100 for the household sector and tables F.101 through F.104
for the major nonfinancial business sectors—typically begin with a capital account. However, the
terminologies in the NIPA and FFA are not similar to each other, among the sectors, or with that
in SNA93.
Financial accounts, the mainstay of the FFA, are available in considerable detail. The
FFA tables offer information for more than thirty sectors, many of which are financial
intermediaries. Data for about fifty instruments are published in the FFA, with a separate set of
tables describing the issuers and purchasers of each instrument. Again, the terminology in the
tables differs from international norms and the organization of the tables varies slightly among
sectors.
SNA93 structure has additional accumulation accounts for revaluations of stocks and
changes in volume of stocks due to neither holding gains and losses nor net purchases. The
information in the U.S for revaluation accounts and other changes in volume accounts is less
developed than that for other types of flows. The FFA reconciliation tables (labeled R.100
through R.103) enumerate factors that lead to changes in net worth. They estimate holding gains
and losses for equity, real estate, and other instruments and other factors that change the level of
assets and liabilities. The ITA also provides figures in some tables on revaluations due to
currency and price changes of assets and liabilities.
The SNA format envisions balance sheet positions for each sector. The FFA publishes
balance sheet tables for three sectors—the household and nonprofit organizations sector (table
B.100 in the FFA), nonfinancial noncorporate business sector (B.103), and nonfinancial corporate
business sector (B.102). For other sectors in the FFA, balance sheet data are limited to financial
assets and liabilities. The necessary information for tangible assets of private subsectors has not
been fully developed; and, of course, there are many issues concerning valuation of tangible
assets of governments other than reproducible assets.
The listing in table A implies most of the elements of integrated accounts are in currently
published material, although the missing pieces are critical in many instances. Moreover, data for
some elements are incomplete or thin. Sophisticated users of the NIPA, ITA, and FFA likely are
aware that this is the case, but because the information is diffused over different publications,
there is a perception by a new or occasional user that the accounts are unrelated. Use of the
combined accounts is cumbersome, at best. For anyone analyzing international transactions for

6
TABLE A: STRUCTURE OF INTEGRATED MACROECONOMIC ACCOUNTS ACCOUNT SUB
ACCOUNTS WHAT IT SHOWS WHAT IS
PUBLISHED NOW SIGNIFICANT
ISSUES
Production
Gross value added and consumption of fixed capital by sector. For the economy as a whole, sum is Gross (Net) Domestic Product
National aggregates in the NIPA with some sector detail.
Gross output and intermediate consumption not available for non-government sectors. No production accounts for subsectors.
Current
Distribution and use of income,
including saving
Generation of income within sectors and payment to factors of production supplied by other sectors. Shows taxes and transfers. Use of income provides a derivation of saving as difference between disposable income and consumption.
National aggregates in NIPA with some sector detail.
Accounts for some financial subsectors not provided.
Capital
Capital outlays for structures, equipment, and software, net lending/or net borrowing of funds.
National aggregates in NIPA with some sector detail. Additional detail provided by BEA for FFA. Truncated account shown for all sectors.
Detail for all sectors is not provided.
Financial
How net lending/net borrowing was satisfied through increase in financial assets and incurrence of liabilities.
Sector and instrument detail in the FFA and ITA.
Sector boundaries in FFA may not match those in NIPA; some differences between rest of world sector in FFA and ITA.
Other changes in volume
Changes in net worth that arise from factors unrelated to revaluation and net saving, such as bad debts, accounting changes, data discontinuities.
Some sector and instrument detail in FFA and ITA.
Not provided for all sectors. More limited than the revaluation account.
Accumulation
Revaluation
Nominal changes in net worth arising from holding gains/losses. Splits gains/losses into real and relative price changes
Some sector and instrument detail in FFA and ITA.
Not provided for all sectors. In FFA, limited to equity shares and real estate.
Opening position
Beginning period value of assets, liabilities, and net worth.
Published for some sectors in the FFA.
Not provided for all sectors.
Changes in stock positions
Summary of changes in net worth due to (a) capital formation, (b) net lending/borrowing, (c) revaluation of assets and liabilities, and (d) other changes in volume.
Published for some sectors in the FFA, but not in the form envisioned in the SNA.
A change in format might be helpful, using international terminology.
Balance sheet
Closing position
Ending period value of assets, liabilities, and net worth.
Published for some sectors in the FFA.
Not provided for all sectors.

7
example, the differences between the FFA rest of world sector and BEA’s international
transactions tables seem enormous. In fact, they are not, as both agencies rely on the same
information, but present it differently. Less well known are the inconsistencies between accounts
that remain in the published data and the dangers of drawing analytical conclusions from a
combination of the accounts.
III. DRAFT SNA-USA TABLES
This section presents draft SNA-USA tables, an integration of the agencies’ accounts.
We were able to construct virtually all the series required from existing data in the NIPA, ITA,
and FFA. In those instances where information was incomplete, we made estimates. We are
reasonably confident that the figures in the tables are near what would be derived from a more
sustained effort, but they remain unofficial estimates from the agencies.
Each sector table is lengthy, and the accounts are quite a bit to absorb in a single sitting,
even though we have limited them to the major sectors. Little attempt was made at this stage to
whittle down the information to ease the presentation, because a goal is to understand and show
the structure of the accounts. We maintained the traditional time series format, with tables that
have annual figures for 1985 to 2002.11 The estimates are based on official data available on June
10, 2004.12
In draft SNA-USA, the economy is divided into five sectors—households and nonprofit
institutions serving households, nonfinancial business, financial business, government, and the
rest of the world (text table B). Draft SNA-USA tables show subsectors for nonfinancial
corporate business, nonfinancial noncorporate business, federal government and state and local
governments.
11 The draft SNA-USA tables 1 through 9 appended to this paper show the year 1995 through 2002. A set of these tables that also include data for 1985-1994 is available at <www.bea.gov> in XLS format. 12 June 10, 2004 marked the release of the FFA for 2004:Q1 and revisions to prior periods. Preliminary estimates of the NIPA for 2004:Q1 were published on May 27, 2004. International transaction accounts for 2003 were made available on March 12, 2004; revisions to the official estimates made after June 10, 2004, are not reflected in draft SNA-USA.

8
TABLE B: SECTORS IN DRAFT SNA-USA
SECTOR SUBSECTORS COMMENTS
1. Households and nonprofit institutions serving households None
Current efforts seek to coordinate the NIPA and FFA information for consistency in sector boundary and data sources.
Nonfinancial corporate business
2. Nonfinancial business Nonfinancial noncorporate business (partnerships and sole proprietorships)
In SNA93, the unincorporated business sector is divided into units that are not separable from households that own them (for example, most sole proprietorships), which is included in the household sector, and units that are distinct and maintain separate accounts (for example, partnerships), which are included in the nonfinancial corporate business sector. At present, available source data do not permit this treatment for the U.S., nor is it clear that the SNA93 treatment is most useful for analysis, although agencies may consider this treatment, if additional source data are developed.
3. Financial business None
Financial businesses in the U.S. represent a diverse set of institutions that carry out intermediation of funds. Additional subsectors and detail on their types of transactions are provided in the FFA. Data for revaluations, other changes in volume (such as for loan write-offs), and value of tangible assets need to be developed.
Federal government, including federal government enterprises
4. General government State and local governments, including regional government enterprises
Developing information for the market value of tangible assets remains problematic, particularly land or the combination of land and structures. Monuments, parks, and other public facilities present difficult valuation issues.
5. Rest of world None
SNA measures an increase in purchases of national securities by foreigners as an increase in rest of world assets. In the balance of payments, such flows are a positive capital inflow to the nation. Draft SNA-USA provides an integration of foreign activity with other sectors.

9
There are several differences between draft SNA-USA sectors and those in SNA93 and
current publications.
The household sector includes nonprofit institutions serving households
(NPISH). Over the past decade, both agencies developed and published separate
sets of estimates for NPISHs, but their definitions of the sector boundary differ
enough at this time that combining separately estimated financial and
nonfinancial flows was not possible. In addition, assets of bank personal trusts
are part of assets of the household sector in draft SNA-USA; in the FFA, such
trusts are a separate financial sector, with the level and change in the total value
of the sector assets a separate instrument held by households.
The division of the nonfinancial business sector in draft SNA-USA into corporate
and noncorporate sectors closely matches current publications.13 The
noncorporate sector includes both partnerships and sole proprietors, the latter of
which would be within the household sector boundary in SNA93, while the
former would be merged with corporations.14
Draft SNA-USA treatment of housing, specifically owner-occupied and tenant-
occupied housing, differs in some respects from SNA93 guidance, but is the
same as in the NIPA and FFA. Owner-occupied housing production and finances
are in the household sector, and the transactions associated with such activity are
treated as business-type transactions within the sector. Rental housing
transactions are also of a business type, but they are part of the nonfinancial
noncorporate business sector in draft SNA-USA. As suggested above, SNA93
would include activities of individuals that provide rental homes in the household
sector.
13 SNA93, and international statistical terminology generally, defines corporation more broadly than in the U.S. In the international terminology, a corporation sector refers to institutional business enterprises grouped together because of the type of function they perform while, in the U.S., a corporation sector refers to a legal form of business. Except in instances where the meaning should be clear or where the statistical consequences are judged insignificant, draft SNA-USA has retained the terminology in the NIPA and FFA, using business to refer to type of sector and corporation to refer to a specific legal form of business. 14 SNA93 defines quasi-corporations as unincorporated enterprises operated as if they were separate corporations whose de facto relationship to their owner is that of a corporation to its shareholders. It specifically notes one form of quasi-corporation is an unincorporated enterprise, including an unincorporated partnership, owned by households, which is operated as if it were a privately owned corporation. Quasi-corporations are not limited to those owned by households, however; they may include government business enterprises and partnerships.

10
Draft SNA-USA, SNA93, and NIPA differ in their placement of government
enterprises, such as the Postal Service and Tennessee Valley Authority. In draft
SNA-USA and the FFA, their activity is within the government sector. In the
NIPA, there is a mixed treatment of government business enterprises; their
activities are presented as part of the business sector in the production account;
but, for calculating net saving, they are consolidated with the government sector
in the government receipts and expenditures account.
In addition, as indicated in the comments in table B, portions of the other changes in
volume, revaluation, and balance sheet accounts are unavailable or underdeveloped for some
sectors. In particular, balance sheet accounts for the government sectors and financial business
sector reflect only the reproducible portion of tangible assets. Thus, buildings are included, but
the full market value of real estate is not.
The following narrative introduces significant elements of draft SNA-USA. It also
highlights differences from currently published series. After some brief comment about the total
economy current account, the discussion turns to the sectors, with more detailed comments for the
household sector to explain the terminology and structure common to all the tables.
TOTAL ECONOMY—CURRENT ACCOUNT (TABLE 1)
Draft SNA-USA table 1 shows the current account for the economy as a whole, and
illustrates that the account reflects an income-side approach. We have used SNA93
terminology—GDP/gross value added in line 1, and net domestic product (line 3), while in the
NIPA we refer to these figures as gross (net) domestic income. That is, in the NIPA, there are
two methods of calculating GDP. The featured measure, known as GDP, is based on the sum of
final expenditures (personal consumption, private investment, net exports, and government
consumption and investment). The other measure, known as gross domestic income, is based on
the sum of incomes generated from production. Because these measures, which are conceptually
identical, are estimated from separate source data, they differ by a statistical discrepancy. For this
paper we avoid dealing with the effects of this discrepancy by focusing on the income-side
measure, or gross domestic income; the more familiar expenditure-side measure is shown in line
44.15
15 Total gross value added NIPA table 1.3.5 (Gross Value Added by Sector) is similar but not identical to the draft SNA-USA gross value added. The NIPA table subsumes the statistical discrepancy and puts value added of government enterprises in the business sector; draft SNA-USA has not allocated the discrepancy, and government enterprises are in the government sector.

11
The specific income factors are shown in lines 4 through 8. One term, operating surplus
(line 8), is a concept that only recently has appeared in U.S. accounts. In SNA93, it is defined as
“the surplus accruing from processes of production before deducting any explicit or implicit
interest charges, rents, or other property incomes payable on the financial assets, land, or other
tangible nonproduced assets required to carry on the production.”16 In other words, it is a broad
income concept that includes interest, rent, and profits.
Lines 9 and 10 of table 1 account for the difference between domestic product and
national income. Specifically, they add to gross product income receipts from the rest of the
world and remove income payments made to the rest of the world.
The middle section of the current account describes the factors of net national income
(line 11). These include the compensation received by employees and operating surplus. Net
saving for the total economy (line 41) is derived by subtracting final consumption expenditures
(line 40) from disposable income (line 39).17
HOUSEHOLDS AND NONPROFIT ORGANIZATIONS SERVING HOUSEHOLDS SECTOR (TABLE 3)
Production in the household sector (table 3, line 1) and net domestic product (line 3) are
measured largely by compensation paid (line 4) and net operating surplus in draft SNA-USA (line
8). In the context of the household sector, the operating surplus is that part of GDP associated
with owner-occupied housing. It also includes net interest on fixed assets used by NPISHs. In
both cases, the operating surplus is net of taxes on production and imports less subsidies (line 7).
While output of the sector is relatively small, it receives the bulk of net national income
(line 9) in the form of employee compensation (line 11) and property income (line 14), including
“withdrawals from income of quasi-corporations (line 18),” which is the sum of proprietors’
income and rental income of tenant-occupied housing in the NIPA.
In draft SNA-USA, household sector disposable income (line 26) is slightly different
from “disposable personal income” in the NIPA. In draft SNA-USA, interest received (line 15)
and interest paid (line 19) are part of the derivation of net national income for the sector. In
addition, current transfers paid (line 25) are subtracted from net national income. In the NIPA,
disposable personal income includes interest paid and other current transfers paid.
16 SNA93 ¶ 7.82 17 Draft SNA-USA Table 2, “Selected Aggregates for Total Economy and Sectors,” is an example of the supplementary information that can be provided in a full set of accounts. It summarizes the contribution of sectors for several important aggregates. Table 2 was produced mainly as a way to check the consistency of our compilations of sectors with published aggregates. However, it appeared to be of interest on its own and is offered, without narrative, in the overall set of draft SNA-USA tables.

12
Net saving (line 28) in draft SNA-USA differs from that in the NIPA by the amount of
wage accruals less disbursements, which are included in compensation received by the household
sector in draft SNA-USA. In addition, in draft SNA-USA, net saving is calculated as disposable
income (line 26) less sector consumption expenditures (line 27), instead of the more
comprehensive personal outlays concept in the NIPA. When calculating the household sector
saving rate, the smaller denominator in draft SNA-USA and difference in the level of net saving
results in a slightly higher level for the rate (chart 1, panel A).
The capital account for the household sector is straightforward. Net saving is reduced by
capital transfers (net) (line 31). For this sector, such transfers are negative, on net, reflecting
estate and gift taxes paid to the government and net migrants’ transfers received by the rest of the
world.
Importantly, net capital formation (line 32) excludes consumer durable goods purchases,
which are a component of consumption expenditures (line 27). The accounting treatment of
consumer durable goods outlays in the current and capital account is consistent with SNA93 (and
NIPA).18 However, because in draft SNA-USA we chose to show the value of the stock of
consumer durable goods as household sector assets (as is done in the FFA), this treatment has
implications for our revaluation and balance sheet accounts (discussed below).
The difference between saving and capital formation is net lending or borrowing (line
37), the amount the sector supplies to financial markets for other sectors or requires from the
financial markets to meet its own needs. The figures in table 3 indicate the household sector has
been a net borrower since 1997.
The details of how the sector meets its borrowing requirement is revealed in the financial
account, which is analogous to table F.100 in the FFA. In the financial account, accounting
identities require net lending/net borrowing to equal the net acquisition of financial assets (line
39) less the net incurrence of liabilities (line 68). The “net” in the financial account refers to
purchases less sales of assets, and the extensions less repayment of liabilities.
Although conceptually the same, the value of household sector net lending/net borrowing
derived in the financial account (line 79) differs substantially from that in the capital account.
Indeed, it is less clear from the figures in line 79 whether the sector has consistently borrowed
over the past six years.
The difference between the net lending/net borrowing derived in the capital account and
that derived in the financial account is defined in draft SNA-USA as the sector’s statistical
18 See also Barbara M. Fraumeni and Sumiye Okubo, “Alternative Treatments of Consumer Durables in the National Accounts,” paper prepared for the BEA Advisory Committee Meeting, May 11, 2001.

13
discrepancy (line 83). The treatment of the statistical discrepancy is problematic and has
implications for the estimates of household sector net worth.
Some nations do not show a discrepancy between the two measures of net lending/net
borrowing. Rather, they force equality in some way, such as splitting the difference between the
financial account and the current and capital accounts. (There is no recognition of such
discrepancies in SNA93.) Our practice is to report the discrepancy as a component of the “other
changes in volume account.” An indication, albeit a crude indication, of the success of our efforts
to bring the accounts into better alignment in the future will be the reduction of the statistical
discrepancies between the financial account and the current and capital accounts for sectors.19
We examine the alternative values of net lending/net borrowing derived in each sector in the next
section.
The remaining accumulation accounts provide additional information on how estimates
of net worth of the sector are affected in the period. The account for “other changes in volume”
allows for recording factors that are not defined as financial transactions or holding gains and
losses in the period, such as the statistical discrepancy noted above. The revaluation account
(analogous to table R.100 in the FFA) lists changes in value of assets due to holding gains and
losses.
We used the other changes in volume account to insert net investment in consumer
durable goods (line 81). Our view, not reflected in SNA93, is that the value of such goods is an
important household sector asset that belongs with other tangible assets on the balance sheet
account. BEA estimates the value of the stock consistent with the expenditures in the current
account, including depreciation and revaluations. The FRB uses the data to complete estimates of
tangible assets in the FFA sector balance sheet statement (table B.100 in the FFA). Draft SNA-
USA retains that balance sheet treatment.
The revaluation account (lines 84 to 94) records nominal holding gains and losses for
nonfinancial assets and financial assets. We have carried over the practice of estimating the gains
for real estate (combined land and structures), because the agencies have found no acceptable
way, on a macro-sector basis, to separate changes in the value of land from changes in the value
of structures on the land.20
19 In the household sector, the sum of net lending/net borrowing in the financial account and net capital formation is an alternative, but conceptually equivalent, measure of saving from the FFA. 20 No attempt was made to separate nominal holding gains into neutral gains (those due to changes in the general price level) and real gains (those due to changes in the relative prices of assets), as SNA93 would dictate.

14
The change in net worth for the household sector is shown in line 95 at the beginning of
the balance sheet account. It is the sum of net capital formation, net lending/net borrowing, other
changes in volume, and nominal holding gains/losses. The change in net worth is the same as
that published in the FFA, but the components differ. The net lending/net borrowing figure used
for calculation of net worth is that from the capital account, rather than the financial account. The
statistical discrepancy between the financial and capital account enters into the other changes in
volume account. The change in net worth as a percent of disposable income differs slightly from
that currently published only because the denominator (disposable income) in draft SNA-USA is
different (chart 1, panel B).]
End of period stocks in the household balance sheet are similar to those published in the
FFA, although the terminology for asset and liability items is consistent with international
terminology, which should allow for easier comparison across countries. Instruments have been
grouped as recommended in SNA93. This was also done in the financial account in draft
SNA-USA.
NONFINANCIAL NONCORPORATE BUSINESS SECTOR (TABLE 4)
As noted above, the nonfinancial noncorporate business sector includes partnerships and
sole proprietorships (including tenant-occupied housing). Draft SNA-USA has a full set of
accounts for this sector.
Income generated in the sector is paid out to the household sector as withdrawals from
income of quasi-corporations (table 4, line 14).21 As a result, the sector has no net saving.
Nonetheless, there is capital formation and financial transactions in the noncorporate business
sector. The financial account in draft SNA-USA—lines 29 through 60 in table 4—is analogous to
table F.103 in the FFA. The additions to net worth (line 71) result mainly from capital gains on
real estate shown in the revaluation account (line 63).22
NONFINANCIAL CORPORATE BUSINESS SECTOR (TABLE 5)
We have been able to provide a full set of accounts for the nonfinancial corporate
business sector. The sector’s value added (table 5, line 1) is more than half of total output of the
economy. Consumption of fixed capital (line 2) in this sector, as with other sectors, is on an
21 Households withdraw income from both financial and nonfinancial quasi-corporations. 22 We considered a number of ways to treat household equity in nonfinancial noncorporate business, and, although the method chosen is consistent within the sequence of accounts in draft SNA-USA, it is not necessarily consistent with SNA93.

15
economic basis, reflecting the capital consumption adjustment to book (tax) depreciation.
Similarly, in the capital account, inventory investment (line 32) reflects the NIPA valuation
adjustment so that inventories are at current prices and on a consistent accounting basis.
The draft SNA-USA current account arguably offers a more comprehensive and intuitive
view of flows through the sector, although the terminology is probably unfamiliar to users of
NIPA tables. Measures of profits and cash flow, which are fairly prominent in the NIPA and
FFA, are noticeably missing from SNA93 and, thus, our presentation of draft SNA-USA.
Providing them likely would be a useful addition to some analysts of the U.S. economy.
The sector has no final consumption expenditures, and the SNA format shows disposable
income (line 23) as net saving (line 24); net saving in this sector and the financial business sector
is the same as undistributed corporate profits in the NIPA. Again, the presentation lacks a
measure of total internal funds that is used to derive the financing gap shown in the FFA (in table
F.102 of the FFA)—a sometimes-cited measure of the impetus for corporate borrowing. Net
lending/net borrowing (line 33) is nearly the same concept, but it includes undistributed profits of
foreign subsidiaries, which are not in the FFA calculation of U.S. internal funds.
The statistical discrepancy resulting from the difference in net lending/net borrowing in
the capital account and in the financial account was handled the same way as for the household
sector. Net saving in the capital account was used to derive changes in net worth (line 93), and
the discrepancy is reported in the other changes in volume account (line 80).
The calculation and interpretation of net worth in the nonfinancial corporate business
sector (line 144) is substantially different from that currently published. In table B.102 of the
FFA, net worth is the market (or replacement) value of assets less liabilities, excluding equity
capital. That measure of net worth is sometimes compared with the market value of shares for
nonfinancial corporate businesses or to net worth derived with tangible assets at historical cost.
Draft SNA-USA follows the format in SNA93, which calculates net worth as the market (or
replacement) value of assets less liabilities, including the market value of shares and other equity
(line 136).
The currently published measure of net worth has been a large positive figure that has
risen from just over $4 trillion in 1985 to about $9-1/2 trillion in 2002 (chart 2, panel A). In
contrast, nonfinancial corporate business sector net worth in draft SNA-USA has both positive
and negative values (panel B). Indeed, as would be expected from the elevated equity valuations
in the late 1990s, the draft SNA-USA measure of net worth moved down sharply over the 1990s
to $-7 trillion, before turning up in 2000 and becoming positive in 2002.

16
The draft SNA-USA measure of net worth may be interpreted as a variant of Tobin’s Q.
As defined by Tobin, Q is the ratio of the market value of the firm (equity plus debt) to the
replacement cost of its tangible assets. For the nonfinancial corporate business sector, debt and
equity are the bulk of liabilities in the SNA format, and they correspond to the numerator of Q.
Tangible assets (the denominator in Q) are about half of total assets on the sector balance sheet.23
Therefore, a negative net worth in draft SNA-USA corresponds to a Q greater than one, while a
positive net worth corresponds to a Q of less than one.
FINANCIAL BUSINESS SECTOR (TABLE 6)
The financial business sector includes the monetary authority, depository institutions,
insurance and pension funds, and all other financial intermediaries, such as finance companies,
mutual funds, and brokers and dealers. Except for a complete accounting for the value of real
estate holdings, we have been able to compile nearly a full set of accounts for the combined
sector.
The current account and capital account are structured the same as the nonfinancial
corporate business sector, with the exception of withdrawals from quasi-corporations, and the
financial account is a summation of lending and borrowing flows of all the financial
intermediaries in the flow of funds accounts. For this sector, we did not net intra-sector assets
and liabilities. For example, issuance of a mortgage-backed security by a government sponsored
enterprise and purchased by a bank is reflected as a net incurrence of a liability (included in line
50 of table 6,) and as an acquisition of a financial asset (included in line 33).
A consequence of showing gross flows of the sector is that there are sizable revaluations
of financial assets (line 74) and liabilities (line 78). As with other sector accounts, shares and
other equity instruments were revalued for capital gains and losses. Other types of liabilities,
such as bonds and mortgages were not revalued. Past efforts by staff at the Federal Reserve
Board found little impact on net worth of sector balance sheets when liabilities other than equities
were revalued. However, that work predated the recent down-shift in interest rates; and it was not
applied to the financial business sector as defined in draft SNA-USA.
While draft SNA-USA shows an account for other changes in volume for financial
corporations, the data are not well developed. In particular, debt write-offs are not included.
Rather they are reflected in changes in the flows in the financial account. A better articulation of
23 The popular press often uses a variant of Q equal to the ratio of the market value of equity of the sector to the published net worth of the sector. The popular version differs from true Q by including financial assets and non-debt liabilities in the denominator.

17
such information would likely make analysis of business and household financing in the economy
clearer, and the draft SNA-USA format provides a focused means for eventually recording the
figures as they are developed.
The change in net worth for the financial business sector (and for the government sectors
that follow) is calculated using the same factors as for the household and nonfinancial business
sectors, with an important exception. Data are available only for reproducible assets, which
include structures; data are not available for the market value of real estate, which combines the
value of structures and land. As a result, the change in net worth (line 85) and the level of net
worth (line 134) are limited. The change excludes revaluations of real estate and the level
excludes the market value of real estate, but includes the current cost value of structures.
GOVERNMENT SECTORS (TABLES 7 AND 8)
In the government sectors, current surpluses (deficits) are measured by net saving (line 24
of both tables 7 and 8). Net lending or borrowing (line 32) in the capital account provides a
broader measure of the surplus/deficit, by taking into account investment in fixed assets; it is the
measure most akin to the budget surplus/deficit reported by U.S. Office of Management and
Budget (OMB).
The capital account also shows the net acquisition of nonproduced nonfinancial assets
(line 31 in both tables). The federal government has been a seller of such assets, which include
the sale of electromagnetic spectrum rights and leasing of offshore drilling rights. For state and
local governments, acquisition of nonproduced assets reflects net purchases of land and access
rights for roads. The counterparty for the government sales, leases, and purchases is the
nonfinancial corporate business sector.
The revaluation and balance sheet account for the government sectors is limited by the
lack of information for real estate values, the same, as is the case for the financial businesses
sector. Estimates for real estate—actually for structures and land—are available in
supplementary information in the federal government budget documents produced each year by
OMB. 24 However, as noted by OMB, the data are somewhat rough and are provided for
illustrative purposes in showing how a national balance sheet could be constructed; they have not
been fully vetted by the agencies for use in national accounts. Moreover, there are no estimates
24 ANALYTICAL PERSPECTIVE, BUDGET OF THE UNITED STATES GOVERNMENT, Fiscal Year 2005, Part II—the Federal Government’s Assets and Liabilities, (Office of Management and Budget, Washington, D.C. 2004), 187-190.

18
for state and local governments. As a result, stocks in the balance sheet in draft SNA-USA are
for reproducible tangible assets, financial assets, and liabilities.
In the past, BEA and the FRB have collaborated to compile a consolidated government
sector. Both the NIPA and FFA have a consolidated sector and doing so in SNA format should
be a relatively straightforward exercise for the agencies in the future.
REST OF WORLD SECTOR (TABLE 9)
The rest of world sector is a mirror image of the international transactions accounts
published by BEA. In the current account, net saving, or the current external balance (table 9,
line 8), is derived as the difference in foreign income received from U.S. residents and foreign
outlays to U.S. residents. The capital account adds net capital transfers and subtracts acquisitions
of nonproduced nonfinancial assets to derive net lending and borrowing to U.S. residents from the
rest of the world. That figure must offset the sum of net lending/net borrowing for domestic
sectors.25
Data for the draft SNA-USA financial, other changes in volume, and revaluation accounts
are taken from BEA’s international transaction accounts and underlying source data. The nature
of the presentation is the same as the domestic sectors. It differs from the ITA, however, because
many financial transactions are netted in draft SNA-USA (and the FFA), while they are shown
gross in the ITA.
The statistical discrepancy in the rest of world sector—the difference between net lending
calculated in the current and capital account and net lending in the financial account reflects the
statistical discrepancy in the recorded balance of payments as well as a combination of other
differences in residency definitions in the NIPA, ITA, and the FFA. The agencies have a project
underway to reconcile differences between the accounts.
IV. ISSUES CONCERNING THE INTEGRATION OF THE ACCOUNTS
As noted above, the agencies are working to minimize sector discrepancies that result
from using alternative data sources and methods. Those discrepancies are summarized by the net
lending/net borrowing measures compared in the panels of chart 3. The charts indicate that the
pattern of net lending/net borrowing is similar in each sector whether measured by the capital
25 Net lending from the rest of the world does in fact equal the net borrowing from the domestic sectors after accounting for the NIPA statistical discrepancy, wage accruals less disbursements, and rounding differences. The statistical discrepancy is a factor because we used data for capital formation from the NIPA product side and net saving from the NIPA income side. The figures for all the sectors are shown in draft SNA-USA table 2.

19
account or the financial account. Even so, there are significant differences for some sectors and
in some years.
For the household sector (chart 3, panel A), the differences in net lending/net borrowing
between draft SNA-USA capital account and financial account are significant, but relatively
stable in sign for the earlier period shown. Until about 1998, net lending derived in the financial
account averaged about two percentage points (of disposable income) more than in the current
account. In recent years, the differences have narrowed on average. Put another way, the
financial account implies that households accumulated more assets than suggested by flows from
the capital account, and household sector net worth is about six percent higher than would be the
case without the discrepancy that is included in the changes in other volume account. (The six
percent represents the value of the discrepancy accumulated over time.)
The household sector discrepancy in the FFA has been the subject of several studies over
the years.26 The residual calculation of some categories in the current account and the residual
calculation of most asset categories and some liability categories in the financial and balance
sheet accounts leave considerable room for speculation on the sources of the difference. A
benefit of integrating the national accounts as we have done for this paper is that the nature of the
problem is more clearly defined in terms of stocks and flows of the sector.
An additional concern to the agencies has been the difference in
net lending/net borrowing for the nonfinancial corporate business sector (panel B of chart 3).
Creating draft SNA-USA pointed to several likely sources for the discrepancy. A particularly
vexing one lies in the agencies separation of nonfinancial and financial businesses, a boundary
that is important for analysis of disintermediation and evaluation of flows, such as interest paid
and interest received. The boundary also has implications for measuring stocks and net worth in
the sectors.
The business boundary problem reflects in part differences in source data for the NIPA
and the FFA. NIPA relies heavily on tax return data, and the FFA supplements tax data with
surveys and regulatory information to compile accounts for financial corporations. In the NIPA,
corporations that file consolidated returns, which combine data for nonfinancial and financial
subsidiaries, are either in the financial or nonfinancial business sectors, depending on the
predominant business. In the financial accounts, adjustments are made with the supplementary
information to split consolidated corporations into financial and nonfinancial enterprises. The 26 See for example, “Measuring Household Saving: Recent Experience from the Flow-of-Funds Perspective,” John F. Wilson, James L. Freund, Frederick O. Yohn, Jr., and Walter Lederer, in THE MEASUREMENT OF SAVING, INVESTMENT, AND WEALTH, Robert E. Lipsey and Helen Stone Tice, editors, (Studies in Income and Wealth, Volume 52, 1989), 101-152.

20
issue is particularly acute in cases for firms with captive finance companies, such as General
Motor’s GMAC and General Electric’s GE Capital.
Some encouragement that solving the boundary problem will reduce the discrepancy is
evident in chart 4. The net lending/net borrowing estimates of the two sectors combined aligns
somewhat better than for the sectors separately.
In addition to the boundary problem, part of the difference between
net lending/net borrowing measures in the nonfinancial corporate business sector likely reflects
the booking of miscellaneous financial assets. In the financial accounts, changes to goodwill and
other intangible assets are included in flows of miscellaneous financial assets. Such flows are
large and positive during periods of heavy merger activity; they are large and negative during
periods of economic weakness. The impact of changes in such assets is not reflected in the
current and capital accounts. SNA93 standards would relegate a portion of the changes in the
value of such assets to the other changes in volume account. An effort to reclassify them into
revaluations and/or other changes in volume is likely to have a sizable impact on the statistical
discrepancy. No changes were made for draft SNA-USA for the business sectors’ boundary or
other accounting issues.
Finally, net lending/net borrowing estimates for the federal government sector (panel C
of chart 3) are close, reflecting a generally high quality of information available and recent efforts
by the agencies to ensure consistent use of that data. In contrast, net lending/net borrowing
estimates for the state and local government sector (panel D) – where the data tend to be of lower
quality – diverge by significant amounts. It would appear that coordination of estimation
methods for missing data would more tightly integrate the accounts of the state and local
government sector.
V. WHERE DO WE GO FROM HERE?
Aside from reformulating the structure of the accounts to international standards, it has
been our intention to use the integration of the accounts to improve the quality and usefulness of
the estimates published. Specific items that require joint work by the agencies have been
identified, including further work on ensuring that sector boundaries are consistent across
accounts, developing additional source material for sectors where information is not available,
and sharing data sources and methods for estimating missing data.
We have shown that SNA-USA tables can be produced for the period 1985-2002.
Considerable work is still required, if the agencies chose to rework the published figures into the
draft SNA-USA structure for the period before 1985. The exercise indicated, moreover, that

21
considerable investment is needed to produce the integrated accounts on a continuing basis, and
even greater investment to carry out the improvements identified.
BEA's Strategic Plan outlines a number of research and development activities related to
the development of integrated accounts. Work is already under way to examine sector
definitions, with particular consideration given to the development of improved source data on
government business enterprises. Other research is being conducted on improving the
consistency of source data between the NIPA and FFA, for example, to improve consistency of
NIPA interest flow estimates with FFA estimates of interest-bearing assets and liabilities. Efforts
are also underway to improve the estimates of fixed assets and to provide more reliable
information on valuation and legal form of ownership of these assets, along with the efforts to
improve integration with other BEA accounts, such as the input-output accounts, and with the
BLS productivity statistics, which are described in many of the other papers in this volume.
Among other prospective projects that should improve integration of the U.S.
macroeconomic accounts, FRB staff are initiating new research into the accounting of
miscellaneous assets and liabilities by nonfinancial businesses. These categories include a wide
range of financial activities and, indeed, are the largest items on the balance sheets of
nonfinancial corporations in the U.S. Once more detailed information about these financial
activities have been analyzed, FRB staff intend to reconsider how changes in miscellaneous assets
and liabilities should be apportioned into flows, revaluations, and other changes in volume.
Although the work involved is expected to be considerable, it offers the potential to improve the
integration of the flow of funds accounts of the U.S. with the NIPAs and to bring them into closer
alignment with the SNA-93 guidelines.
In addition, efforts at the Federal Reserve are directed toward improving integration in
the capital accounts, particularly adapting the draft SNA-USA framework to show estimates for
as many detailed financial sectors as are included in the flow of funds accounts of the U.S. In
conjunction with that work will be a consideration of developing detailed information for the
other changes in volume accounts, particularly estimates of debt write-downs.
BEA and the FRB are jointly advancing other efforts to improve the integration of the
accounts. These efforts include estimating the general degree to which captive finance companies
are included in consolidated tax return data for nonfinancial corporations, so that more is known
about the importance that disparities between the sector boundaries might play in examining the
financing of the corporate sector. BEA and FRB staff are also working together to further
examine the possible use of alternative data sources to improve the NIPA estimates for state and

22
local governments that are made before complete data from the Census of Governments become
available.
An important and useful result of integrated macroeconomic accounts would be an ability
to produce on a regular basis a national balance sheet. Several deficiencies, some already noted,
would need to be resolved before such a balance sheet is completed. Three of the most important
are:
Further development of the other changes in volume and revaluation accounts.
Although the other changes in volume accounts in draft SNA-USA is more
advanced than found in other countries’ publications, they are still limited. The
effort to expand the accounts would require a closer review of the accounting
techniques used in data sources and whether those techniques align with what is
needed for macroeconomic accounts so that differences in flows, revaluations,
and other changes in volume can be separated.
Improved data for real estate values in some sectors, especially for the
government sector and techniques for separating the market value of land and
structures.
Removal or reconciliation of remaining differences between the current and
accumulation accounts and the international transactions accounts.

23
BIBLIOGRAPHY 1. Bloem, Adriann M., Robert J. Dipplesman, and Nils Ø. Mæhle, QUARTERLY NATIONAL ACCOUNTS MANUAL, CONCEPTS, DATA SOURCES, AND COMPILATION, International Monetary Fund, (Washington, D.C., 2001). 2. Bureau of Economic Analysis, “BEA’s Strategic Plan for FY 2001-2005,” SURVEY OF CURRENT BUSINESS, vol. 82 (May 2002), 8-32. 3. Commission of the European Communities-Eurostat, International Monetary Fund, Organization for Economic Co-operation and Development, United Nations, and World Bank, SYSTEM OF NATIONAL ACCOUNTS 1993, prepared under the auspices of the Inter-Secretariat Working Group on National Accounts, 1993. 4. Fraumeni, Barbara M., and Sumiye Okubo, “Alternative Treatments of Consumer Durables in the National Accounts,” paper prepared for the BEA Advisory Committee Meeting, May 11, 2001. 5. International Monetary Fund, BALANCE OF PAYMENTS COMPILATION GUIDE, (Washington, D.C., 1995). 6. International Monetary Fund, MONETARY AND FINANCIAL STATISTICS MANUAL, (Washington, D.C., 2000). 7. Lal, Kishori, “Measurement of Output, Value Added, GDP in Canada and the United States: Similarities and Differences,” Research paper 13F0031MIE-No.010, Statistics Canada (June 2003). 8. Mayerhauser, Nicole, Shelly Smith, and David F. Sullivan, “Preview of the 2003 Comprehensive Revision of the National Income and Product Accounts: New and Redesigned Tables,” SURVEY OF CURRENT BUSINESS, vol. 83 (August 2003), 7-31. 9. Mead, Charles Ian, Karin Moses, and Brent R. Moulton, “The NIPAs and the System of National Accounts,” SURVEY OF CURRENT BUSINESS, vol. 84 (December 2004), 17-32. 10. Moulton, Brent R. and Eugene P. Seskin, “Preview of the 2003 Comprehensive Revision of the National Income and Product Accounts: Changes in Definitions and Classifications,” SURVEY OF CURRENT BUSINESS, vol. 83 (June 2003), 17-34. 11. Ruggles, Richard and Nancy D. Ruggles, “Integrated Economic Accounts for the United States, 1947-80,” SURVEY OF CURRENT BUSINESS, vol. 62 (May 1982), 1-53. 12. Wilson, Karen, “The Architecture of the System of National Accounts: A Three-Way International Comparison of Canada, Australia, and the United Kingdom,” prepared for Conference on Research in Income and Wealth, Architecture of National Accounts (April 16-17, 2004, Washington, D.C.). 13. Wilson, John F., James L. Freund, Frederick O. Yohn, Jr., and Walter Lederer, “Measuring Household Saving: Recent Experience from the Flow-of-Funds Perspective,” in THE MEASUREMENT OF SAVING, INVESTMENT, AND WEALTH, Robert E. Lipsey and Helen Stone Tice, editors, National Bureau of Economic Research, Studies in Income and Wealth, Volume 52, 1989, 101-152. 14. U. S. Office of Management and Budget, ANALYTICAL PERSPECTIVE, BUDGET OF THE UNITED STATES GOVERNMENT, Fiscal Year 2005, Part II—the Federal Government’s Assets and Liabilities, (Washington, D.C., 2004), 187-190.

Draft SNA-USA July 19, 2004
1. Total Economy - Current AccountBillions of dollars
1995 1996 1997 1998 1999 2000 2001 2002
1 Gross domestic product(GDP)/Gross value added 7296.4 7723.1 8233.6 8761.7 9304.2 9944.1 10213.0 10558.0 1 (income approach)
2 Less consumption of fixed capital 878.4 918.0 974.4 1030.1 1101.2 1187.8 1266.9 1288.6 2
3 Equals net domestic product/Net value added 6418.1 6805.0 7259.2 7731.6 8202.9 8756.3 8946.2 9269.3 3 4 Compensation of employees (paid) 4197.3 4394.7 4666.0 5023.9 5362.3 5787.3 5945.4 6024.4 4 5 Wages and salaries 3439.7 3627.3 3879.1 4187.3 4476.6 4833.8 4947.9 4979.8 5 6 Employers’ social contributions 757.6 767.4 787.1 836.7 885.7 953.5 997.7 1044.6 6 7 Taxes on production and imports less subsidies 524.2 546.8 579.1 604.5 629.9 664.5 674.6 721.8 7 8 Operating surplus, net 1696.4 1863.5 2014.1 2103.1 2210.7 2304.5 2326.2 2523.2 8
9 Plus income receipts from the rest of the world 234.0 248.7 286.7 287.1 320.8 382.7 319.0 299.1 9 10 Less income payments from the rest of the world 198.2 213.7 253.7 265.8 287.1 343.7 283.8 277.7 10
11 Equals net national income/Balance of primary incomes, net 6454.0 6840.0 7292.2 7752.9 8236.5 8795.1 8981.1 9290.8 11 12 Operating surplus, net 1696.4 1863.5 2014.1 2103.1 2210.7 2304.5 2326.2 2523.2 12 13 Compensation of employees (received) 4193.3 4390.5 4661.7 5019.4 5357.1 5782.7 5940.4 6019.1 13 14 Wages and salaries 3435.7 3623.2 3874.7 4182.7 4471.4 4829.2 4942.9 4974.6 14 15 Employers’ social contributions 757.7 767.3 787.0 836.7 885.7 953.4 997.6 1044.5 15 16 Taxes on production and imports, receivable 558.3 581.1 612.0 639.9 674.1 708.9 729.8 760.1 16 17 Subsidies, payable -34.0 -34.3 -32.8 -35.4 -44.2 -44.3 -55.3 -38.2 17 18 Property income (received) 2892.8 3107.0 3379.3 3620.3 3787.3 4302.6 4274.8 4146.6 18 19 Interest 1935.0 2030.8 2208.0 2390.2 2491.8 2877.1 2833.0 2643.0 19 20 Distributed income of corporations 882.0 997.4 1086.5 1158.1 1202.8 1297.9 1331.1 1370.5 20 21 Dividends 335.5 396.8 451.7 472.2 465.8 509.9 498.5 509.1 21 22 Withdrawals from income of quasi-corporations 546.5 600.6 634.8 685.9 737.0 788.0 832.6 861.4 22 23 Reinvested earnings on foreign direct investment 68.8 70.3 75.5 63.6 84.1 116.2 97.3 121.0 23 24 Rents 7.0 8.6 9.3 8.4 8.6 11.4 13.5 12.1 24 25 Less uses of property income (paid) 2852.9 3067.8 3342.0 3594.4 3748.4 4259.2 4234.7 4119.9 25 26 Interest 1987.8 2093.5 2281.7 2467.3 2574.3 2979.3 2954.2 2769.6 26 27 Distributed income of corporations 849.4 957.0 1035.9 1115.7 1161.1 1268.5 1295.9 1331.3 27 28 Dividends 302.9 356.4 401.1 429.8 424.1 480.4 463.3 469.8 28 29 Withdrawals from income of quasi-corporations 546.5 600.6 634.8 685.9 737.0 788.1 832.6 861.5 29 30 Reinvested earnings on foreign direct investment 8.7 8.7 15.2 3.0 4.4 0 -28.9 6.9 30 31 Rents 7.0 8.6 9.2 8.4 8.6 11.4 13.5 12.1 31
32 Net national income/Balance of primary incomes, net 6454.0 6840.0 7292.2 7752.9 8236.5 8795.1 8981.1 9290.8 32 33 Plus current taxes on income, wealth, etc. (received) 959.0 1060.9 1168.5 1271.9 1362.2 1498.0 1442.8 1246.1 33 34 Less current taxes on income, wealth, etc. (paid) 962.7 1063.8 1172.4 1275.3 1366.1 1500.8 1444.8 1248.1 34 35 Plus social benefits (received) 1391.2 1457.4 1519.0 1576.8 1649.4 1744.3 1871.2 1999.7 35 36 Less social contributions (paid) 1393.1 1459.5 1521.1 1579.2 1651.8 1746.9 1873.8 2002.6 36 37 Plus other current transfers (received) 262.2 280.1 285.9 314.3 347.6 383.5 428.1 452.6 37 38 Less other current transfers (paid) 292.1 314.1 321.6 357.4 388.4 434.1 470.5 507.2 38
39 Equals disposable income, net 6418.5 6800.9 7250.6 7703.9 8189.2 8739.1 8934.1 9231.5 39 40 Less final consumption expenditures 6112.4 6427.9 6764.0 7135.5 7616.5 8156.5 8543.2 8980.7 40
41 Equals net saving 306.1 373.0 486.6 568.5 572.7 582.7 390.9 250.8 41
Memo: 42 GDP (line 1) 7296.4 7723.1 8233.6 8761.7 9304.2 9944.1 10213.0 10558.0 42 43 Plus statistical discrepancy (NIPA) 101.2 93.7 70.6 -14.7 -35.7 -127.2 -112.3 -77.0 43 44 Equals GDP (NIPA, expenditure approach) 7397.6 7816.8 8304.3 8747.0 9268.5 9817.0 10100.8 10480.9 44

Draft SNA-USA July 19, 2004
2. Selected Aggregates for Total Economy and Sectors Billions of dollars
1995 1996 1997 1998 1999 2000 2001 2002
1 Gross domestic product(GDP)/Gross value added 7296.4 7723.1 8233.6 8761.7 9304.2 9944.1 10213.0 10558.0 1 2 Households and nonprofit institutions serving households 817.7 854.5 898.1 952.1 1014.8 1083.3 1155.8 1229.3 2 3 Nonfinancial noncorporate business 1052.8 1120.5 1184.8 1284.8 1372.4 1475.7 1569.5 1629.3 3 4 Nonfinancial corporate business 3879.5 4109.5 4401.8 4655.0 4950.8 5272.2 5299.3 5410.6 4 5 Financial business 541.0 601.9 679.2 764.3 813.8 899.8 917.7 949.0 5 6 Federal government 338.7 343.7 349.3 352.9 361.9 378.7 386.9 408.9 6 7 State and local government 666.7 693.0 720.4 752.6 790.5 834.4 883.8 930.9 7
8 Net saving 306.1 373.0 486.6 568.5 572.7 582.7 390.9 250.8 8 9 Households and nonprofit institutions serving households 267.2 231.9 215.5 275.9 163.6 168.3 127.1 183.1 9 10 Nonfinancial corporate business 186.5 226.8 248.7 191.3 210.7 155.2 118.9 197.7 10 11 Financial business 37.4 30.3 39.1 10.5 44.4 19.7 77.1 113.2 11 12 Federal government -197.0 -141.8 -55.8 38.8 103.6 189.5 50.5 -240.0 12 13 State and local government 12.0 25.8 39.1 52.0 50.4 50.0 17.3 -3.2 13
Net capital transfers 14 Households and nonprofit institutions serving households -20.7 -23.7 -27.8 -33.1 -37.4 -36.5 -36.7 -34.2 14 15 Federal government -12.8 -10.7 -8.5 -3.6 -7.4 -8.1 -12.9 -18.7 15 16 State and local government 32.4 33.9 35.3 36.0 39.9 43.7 48.5 51.7 16
17 Gross fixed capital formation 1345.6 1454.4 1570.0 1700.7 1845.6 1983.5 1960.3 1921.0 17 18 Households and nonprofit institutions serving households 292.1 320.3 345.0 388.2 418.5 440.4 467.8 495.0 18 19 Nonfinancial noncorporate business 135.0 141.5 122.8 151.6 199.5 225.1 205.7 195.4 19 20 Nonfinancial corporate business 597.5 635.4 684.6 709.7 800.5 882.1 847.0 771.2 20 21 Financial business 88.2 112.2 165.5 188.9 140.2 131.4 122.9 122.2 21 22 Federal government 78.7 81.1 73.2 75.8 80.8 79.5 81.2 88.7 22 23 State and local government 154.0 163.8 178.9 186.5 206.1 225.1 235.8 248.4 23
24 Consumption of fixed capital 878.4 918.0 974.4 1030.1 1101.3 1187.9 1266.9 1288.6 24 25 Households and nonprofit institutions serving households 113.2 118.2 125.1 132.9 144.5 154.8 167.4 175.2 25 26 Nonfinancial noncorporate business 111.2 114.8 119.1 126.5 134.6 142.1 148.0 150.9 26 27 Nonfinancial corporate business 415.0 436.5 467.1 493.3 523.9 567.9 610.5 618.2 27 28 Financial business 74.0 79.3 89.0 98.4 111.4 126.1 135.1 133.5 28 29 Federal government 81.9 82.0 82.5 82.8 84.8 87.2 88.2 89.1 29 30 State and local government 83.1 87.2 91.6 96.2 102.1 109.8 117.7 121.7 30
31 Change in inventories 31.1 30.8 72.0 70.8 66.9 56.5 -36.1 5.4 31 32 Nonfinancial noncorporate business -9.0 9.7 6.7 4.8 0.8 1.6 -1.7 -2.9 32 33 Nonfinancial corporate business 40.1 21.0 65.3 65.9 66.1 54.9 -34.4 8.3 33
34 Net lending/borrowing -193.0 -194.8 -181.9 -173.5 -243.1 -270.2 -267.5 -388.4 34 35 Households and nonprofit institutions serving households 67.7 6.2 -32.3 -12.3 -147.7 -153.6 -209.9 -171.0 35 36 Nonfinancial noncorporate business -14.8 -36.5 -10.3 -29.9 -65.7 -84.6 -56.0 -41.5 36 37 Nonfinancial corporate business -36.7 8.8 -36.0 -89.4 -124.3 -205.5 -75.3 45.2 37 38 Financial business 23.2 -2.6 -37.4 -80.0 15.6 14.4 89.3 124.5 38 39 Federal government -199.3 -147.8 -47.3 47.9 101.3 189.3 45.4 -258.7 39 40 State and local government -33.0 -22.9 -18.8 -9.9 -22.3 -30.3 -61.0 -86.9 40 Memo: 41 Statistical discrepancy (NIPA) 101.2 93.7 70.6 -14.7 -35.7 -127.2 -112.3 -77.0 41 42 Rest of the world 92.1 101.0 111.2 188.1 278.8 397.4 379.6 465.4 42
Total other volume changes 43 Households and nonprofit institutions serving households 113.4 307.1 186.9 301.9 248.1 52.0 381.6 36.0 43 44 Nonfinancial noncorporate business 19.7 -21.1 -64.9 -76.6 -72.5 -26.9 -21.5 -36.0 44 45 Nonfinancial corporate business 177.3 125.5 128.0 438.5 491.4 651.4 26.4 7.3 45 46 Financial business 49.8 -7.3 21.7 -4.3 -48.7 -156.5 -104.3 -205.3 46 47 Federal government 29.8 -48.2 -11.6 -28.7 46.0 36.2 -4.5 -29.2 47 48 State and local government 29.6 15.5 -44.0 45.1 22.6 22.0 33.1 25.2 48 49 Rest of the world -60.0 86.9 -56.8 -202.2 -264.0 238.9 50.9 -39.9 49
Holding gains/losses 50 Households and nonprofit institutions serving households 2501.9 2040.3 3405.7 2961.3 4577.7 -458.7 -1245.5 -1839.7 50 51 Nonfinancial noncorporate business 173.3 196.6 314.2 325.0 280.1 395.7 113.7 226.2 51 52 Nonfinancial corporate business -1547.9 -1164.0 -1846.6 -1674.3 -3513.9 2823.8 1614.3 2879.4 52 53 Financial business -267.3 -239.9 -584.6 -21.4 395.1 -509.6 322.0 464.1 53 54 Federal government 46.0 32.7 39.1 28.3 43.2 40.3 32.4 29.4 54 55 State and local government 101.5 86.5 116.5 100.1 141.6 176.8 79.1 76.9 55 56 Rest of the world 74.7 -111.5 80.7 105.3 -295.1 -54.9 119.4 47.9 56
Change in net worth 57 Households and nonprofit institutions serving households 2861.9 2555.8 3780.2 3506.2 4952.0 -274.7 -773.4 -1654.8 57 58 Nonfinancial noncorporate business 193.0 175.5 249.4 248.4 207.6 368.7 92.2 190.2 58 59 Nonfinancial corporate business -1184.1 -811.7 -1469.9 -1044.5 -2811.7 3630.4 1759.6 3084.4 59 60 Financial business -180.2 -216.9 -523.8 -15.2 390.9 -646.4 294.7 372.0 60 61 Federal government -133.9 -168.0 -36.6 34.9 185.5 257.8 65.6 -258.6 61 62 State and local government 175.5 161.7 146.9 233.2 254.6 292.5 178.0 150.5 62

Draft SNA-USA July 19, 2004
3. Households and Nonprofit Institutions Serving HouseholdsBillions of dollars
1995 1996 1997 1998 1999 2000 2001 2002
CURRENT ACCOUNT:
1 Gross domestic product(GDP)/Gross value added 817.7 854.5 898.1 952.1 1014.8 1083.3 1155.8 1229.3 1
2 Less consumption of fixed capital 113.2 118.2 125.1 132.9 144.5 154.8 167.4 175.2 2
3 Equals net domestic product/Net value added 704.5 736.3 773.0 819.2 870.3 928.5 988.4 1054.1 3 4 Compensation paid by households and NPISHs 320.3 333.7 349.8 374.3 394.2 421.4 443.4 474.6 4 5 Wages and salaries 276.3 289.9 306.1 327.2 344.0 367.4 387.0 412.9 5 6 Employers’ social contributions 44.0 43.8 43.8 47.2 50.2 54.0 56.5 61.7 6 7 Taxes on production and imports less subsidies 83.7 87.8 92.4 95.8 100.6 105.6 112.0 121.2 7 8 Operating surplus, net 300.5 314.8 330.8 349.0 375.5 401.6 433.0 458.3 8
9 Net national income/Balance of primary incomes, net 5692.6 6003.3 6388.7 6894.7 7267.2 7844.1 8037.2 8173.8 9 10 Operating surplus, net 300.5 314.8 330.8 349.0 375.5 401.6 433.0 458.3 10 11 Compensation of employees (received) 4193.3 4390.5 4661.7 5019.4 5357.1 5782.7 5940.4 6019.1 11 12 Wages and salaries 3435.7 3623.2 3874.7 4182.7 4471.4 4829.2 4942.9 4974.6 12 13 Employers’ social contributions 757.7 767.3 787.0 836.7 885.7 953.4 997.6 1044.5 13 14 Property income (received) 1563.9 1690.8 1817.6 1970.1 2002.3 2176.2 2208.7 2241.3 14 15 Interest 764.2 794.0 849.8 934.3 929.7 1012.1 1004.9 983.7 15 16 Distributed income of corporations 799.7 896.8 967.8 1035.8 1072.6 1164.1 1203.8 1257.6 16 17 Dividends 253.2 296.2 333.0 349.9 335.6 376.1 371.2 396.2 17 18 Withdrawals from income of quasi-corporations 546.5 600.6 634.8 685.9 737.0 788.0 832.6 861.4 18 19 Less uses of property income (interest paid) 365.1 392.8 421.4 443.8 467.7 516.4 544.9 544.9 19
20 Net national income/Balance of primary incomes, net 5692.6 6003.3 6388.7 6894.7 7267.2 7844.1 8037.2 8173.8 20 21 Less current taxes on income, wealth, etc. (paid) 744.1 832.1 926.3 1027.0 1107.5 1235.7 1243.7 1053.1 21 22 Plus social benefits (received) 858.4 902.1 931.8 952.6 988.0 1041.6 1142.6 1249.5 22 23 Less social contributions (paid) 532.8 555.2 587.2 624.2 661.4 702.7 728.5 750.3 23 24 Plus other current transfers (received) 19.0 22.9 19.4 26.0 34.1 42.4 49.9 42.6 24 25 Less other current transfers (paid) 50.1 52.3 63.5 66.7 74.3 82.0 85.0 94.1 25
26 Equals disposable income, net 5243.0 5488.7 5762.9 6155.4 6446.1 6907.7 7172.5 7568.4 26 27 Less final consumption expenditures 4975.8 5256.8 5547.4 5879.5 6282.5 6739.4 7045.4 7385.3 27
28 Equals net saving 267.2 231.9 215.5 275.9 163.6 168.3 127.1 183.1 28
CAPITAL ACCOUNT:
29 Net saving and capital transfers 246.6 208.3 187.6 243.0 126.3 132.0 90.5 148.9 29 30 Net saving 267.2 231.9 215.5 275.9 163.6 168.3 127.1 183.1 30 31 Capital transfers received (net) -20.7 -23.7 -27.8 -33.1 -37.4 -36.5 -36.7 -34.2 31
32 Capital formation, net 178.9 202.1 219.9 255.3 274.0 285.6 300.4 319.8 32 33 Gross fixed capital formation, excluding consumer durables 292.1 320.3 345.0 388.2 418.5 440.4 467.8 495.0 33 34 Residential 254.8 280.8 293.2 329.9 359.8 377.3 401.6 429.8 34 35 Nonresidential (nonprofit organizations) 37.3 39.5 51.8 58.3 58.7 63.1 66.2 65.3 35 36 Less consumption of fixed capital 113.2 118.2 125.1 132.9 144.5 154.8 167.4 175.2 36
37 Net lending or borrowing, capital account (lines 29-32) 67.7 6.2 -32.3 -12.3 -147.7 -153.6 -209.9 -171.0 37
FINANCIAL ACCOUNT:
38 Net lending or borrowing, capital account (line 37) 67.7 6.2 -32.3 -12.3 -147.7 -153.6 -209.9 -171.0 38
39 Net acquisition of financial assets 455.9 507.6 383.9 601.2 415.5 305.7 589.4 419.3 39
40 Currency and deposits 90.4 91.2 105.7 144.6 38.9 188.3 342.9 281.1 40 41 Currency and transferable deposits -40.8 -72.9 -33.7 -16.2 -75.4 -120.5 93.7 -18.2 41 42 Other deposits 131.2 164.1 139.4 160.9 114.3 308.7 249.2 299.3 42 43 Foreign deposits 4.6 12.4 6.5 0.1 5.2 20.0 -5.0 10.7 43 44 Time and savings deposits 126.6 151.7 132.9 160.7 109.1 288.8 254.2 288.7 44
45 Securities other than shares 30.3 127.4 -43.3 95.6 138.5 -98.7 -138.3 -71.3 45 46 Open market paper 2.0 4.1 1.3 3.0 4.7 2.4 -33.9 5.6 46 47 U.S. savings bonds 5.1 2.0 -0.5 0.1 -0.2 -1.7 5.6 4.5 47 48 Treasury securities -30.0 -14.2 -150.2 -40.9 29.5 -170.5 -88.9 -71.2 48 49 Agency- and GSE-backed securities 27.3 100.8 52.7 39.8 114.0 79.1 -57.6 -143.9 49 50 Municipal securities -58.9 -35.3 23.5 5.0 34.4 9.2 47.7 108.0 50 51 Corporate and foreign bonds 84.8 70.0 30.0 88.5 -44.0 -17.4 -11.2 25.7 51
52 Loans 11.1 27.9 44.4 58.3 54.8 99.8 50.2 -31.1 52 53 Short-term (security credit) 18.6 35.3 52.6 61.2 47.2 88.6 41.9 -41.6 53 54 Long-term (mortgages) -7.5 -7.4 -8.2 -3.0 7.6 11.3 8.3 10.5 54
55 Shares and other equity 103.7 53.9 4.8 17.3 -4.6 -116.1 47.8 -54.8 55 56 Corporate equities -101.2 -187.1 -240.2 -321.8 -110.7 -476.7 -264.4 -112.4 56 57 Mutual fund shares 87.4 195.2 228.5 278.5 65.8 217.5 186.5 154.8 57 58 Money market mutual fund shares 101.4 58.3 75.9 139.5 119.6 152.7 150.6 -41.6 58 59 Equity in noncorporate business 16.0 -12.5 -59.4 -78.8 -79.3 -9.6 -24.9 -55.6 59
60 Insurance technical reserves 221.2 203.3 273.6 276.9 190.5 231.2 279.0 298.1 60

Draft SNA-USA July 19, 2004
3. Households and Nonprofit Institutions Serving HouseholdsBillions of dollars
1995 1996 1997 1998 1999 2000 2001 2002
61 Net equity in life insurance and pension funds 204.5 192.8 261.0 264.9 178.0 224.7 260.5 269.4 61 62 Net equity in life insurance reserves 45.8 44.5 59.3 48.0 50.8 50.2 77.2 60.1 62 63 Net equity in pension fund reserves 158.7 148.3 201.7 216.9 127.3 174.5 183.4 209.3 63 64 Prepayments of premiums and reserves against claims 16.7 10.6 12.7 12.1 12.4 6.5 18.5 28.7 64 65 Net equity in reserves of other insurance companies 8.7 2.7 2.0 1.8 1.1 -0.3 11.9 18.5 65 66 Net equity in other life insurance company reserves 8.0 7.8 10.7 10.3 11.4 6.9 6.5 10.2 66
67 Other accounts receivable (miscellaneous assets) -0.9 3.9 -1.4 8.4 -2.5 1.2 7.7 -2.6 67
68 Net incurrence of liabilities 337.4 357.1 350.5 465.2 571.3 574.9 599.1 700.0 68
69 Securities other than shares (municipals) 0.7 6.6 10.0 12.0 10.4 5.8 13.8 12.9 69
70 Loans 328.1 341.7 331.3 445.9 554.7 565.2 581.7 679.2 70 71 Short-term 180.0 125.8 108.6 125.8 175.0 181.2 83.0 30.2 71 72 Consumer credit 147.0 103.6 62.1 96.8 112.1 165.2 137.7 81.4 72 73 Bank loans n.e.c. 17.4 0.5 8.0 7.7 -6.9 6.8 -16.5 -3.1 73 74 Other loans and advances 12.0 5.8 1.7 -0.3 -5.4 2.0 0.6 0.1 74 75 Security credit 3.5 15.8 36.8 21.6 75.2 7.2 -38.8 -48.2 75 76 Long-term (mortgages) 148.1 215.8 222.7 320.1 379.7 383.9 498.7 649.0 76
77 Insurance technical reserves (unpaid premiums) 0.7 0.8 0.3 -1.4 2.1 0.1 -0.4 0.9 77
78 Other accounts payable (trade debt) 7.9 8.0 8.9 8.7 4.1 3.8 4.0 7.0 78
Memo: 79 Net lending or borrowing, financial account (lines 39-68) 118.5 150.5 33.4 136.0 -155.8 -269.2 -9.7 -280.6 79
OTHER CHANGES IN VOLUME ACCOUNT:
80 Total other volume changes 113.4 307.1 186.9 301.9 248.1 52.0 381.6 36.0 80 81 Net investment in consumer durable goods 96.0 111.2 129.3 161.0 197.0 205.9 193.5 200.3 81 82 Other volume changes -33.4 51.5 -8.1 -7.3 59.1 -38.3 -12.1 -54.6 82 83 Less statistical discrepancy (lines 37-[39-68])* -50.9 -144.4 -65.6 -148.2 8.1 115.6 -200.2 109.7 83
REVALUATION ACCOUNT:
84 Nonfinancial assets 329.7 159.2 313.1 586.7 600.5 814.6 734.4 903.0 84 85 Real estate 325.8 174.4 350.1 627.6 645.6 841.2 799.2 978.6 85 86 Consumer durable goods 4.3 -14.5 -35.5 -39.2 -44.5 -26.1 -64.1 -74.6 86 87 Equipment and software -0.4 -0.8 -1.5 -1.7 -0.6 -0.5 -0.8 -0.9 87
88 Financial assets 2172.2 1881.2 3092.6 2374.6 3977.2 -1273.4 -1979.9 -2742.7 88 89 Shares and other equity 1695.0 1507.1 2547.8 1876.5 3319.6 -1045.4 -1503.6 -2081.8 89 90 Corporate equities 1356.4 1080.2 1960.6 1327.9 2438.3 -1148.1 -1255.8 -1843.9 90 91 Mutual fund shares 136.9 176.5 236.6 217.8 569.2 -295.3 -380.8 -483.9 91 92 Equity in noncorporate business 201.7 250.5 348.9 330.8 312.0 398.0 132.9 246.0 92 93 Insurance technical reserves 477.2 374.0 544.8 498.1 657.6 -228.0 -476.3 -660.9 93
94 Changes in net worth due to nominal holding gains/losses 2501.9 2040.3 3405.7 2961.3 4577.7 -458.7 -1245.5 -1839.7 94
CHANGES IN BALANCE SHEET ACCOUNT:
95 Change in net worth (lines 32+37+80+94) 2861.9 2555.8 3780.2 3506.2 4952.0 -274.7 -773.4 -1654.8 95
BALANCE SHEET ACCOUNT (end of period):
96 Total assets 32618.1 35531.0 39661.9 43633.3 49157.1 49468.3 49293.9 48339.1 96
97 Nonfinancial assets 11048.3 11512.8 12171.1 13173.6 14243.8 15559.3 16789.0 18201.6 97 98 Real estate 8687.8 9053.5 9613.5 10488.6 11399.9 12529.0 13624.4 14907.8 98 99 Consumer durable goods 2296.0 2392.8 2486.6 2608.3 2760.9 2940.7 3070.1 3195.7 99100 Equipment and software 64.6 66.6 71.0 76.7 83.0 89.5 94.5 98.0 100
101 Financial assets 21569.8 24018.1 27490.9 30459.7 34913.3 33909.0 32505.0 30137.5 101
102 Currency and deposits 2859.0 2949.9 3050.8 3196.5 3235.3 3423.6 3766.5 4047.6 102103 Currency and transferable deposits 544.3 471.4 437.7 421.5 346.0 225.5 319.2 301.0 103104 Other deposits 2314.7 2478.5 2613.1 2775.0 2889.3 3198.1 3447.3 3746.6 104105 Foreign deposits 23.4 35.5 37.2 38.3 43.5 63.5 58.5 69.2 105106 Time and savings deposits 2291.3 2443.1 2575.9 2736.7 2845.8 3134.6 3388.8 3677.4 106
107 Securities other than shares 2051.4 2238.7 2196.5 2284.1 2483.5 2348.2 2196.3 2080.9 107108 Open market paper 71.7 75.8 77.1 80.2 84.9 87.3 53.4 59.0 108109 U.S. savings bonds 185.0 187.0 186.5 186.6 186.4 184.8 190.3 194.9 109110 Treasury securities 626.0 673.7 570.0 528.5 629.6 426.1 327.6 221.2 110111 Agency- and GSE-backed securities 116.7 215.3 260.4 292.8 397.5 468.9 407.5 254.6 111112 Municipal securities 539.7 504.5 511.1 516.1 550.5 559.8 607.5 715.5 112113 Corporate and foreign bonds 512.3 582.3 591.4 679.9 634.6 621.3 610.0 635.7 113
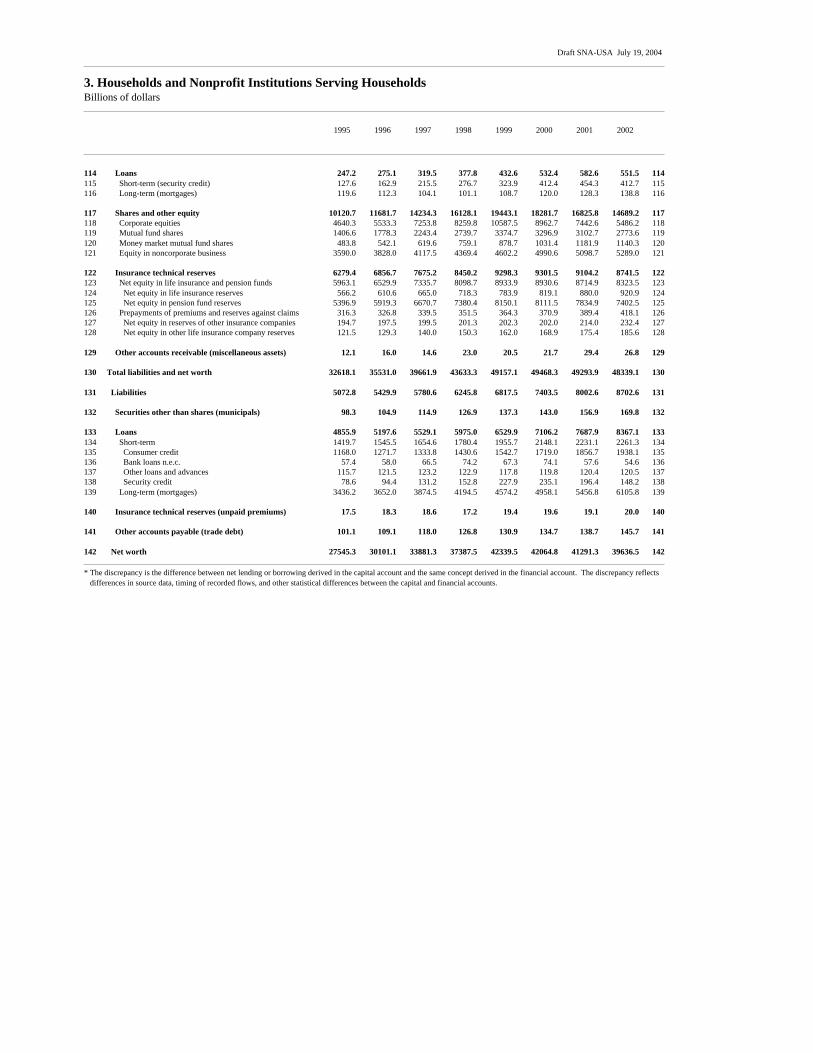
Draft SNA-USA July 19, 2004
3. Households and Nonprofit Institutions Serving HouseholdsBillions of dollars
1995 1996 1997 1998 1999 2000 2001 2002
114 Loans 247.2 275.1 319.5 377.8 432.6 532.4 582.6 551.5 114115 Short-term (security credit) 127.6 162.9 215.5 276.7 323.9 412.4 454.3 412.7 115116 Long-term (mortgages) 119.6 112.3 104.1 101.1 108.7 120.0 128.3 138.8 116
117 Shares and other equity 10120.7 11681.7 14234.3 16128.1 19443.1 18281.7 16825.8 14689.2 117118 Corporate equities 4640.3 5533.3 7253.8 8259.8 10587.5 8962.7 7442.6 5486.2 118119 Mutual fund shares 1406.6 1778.3 2243.4 2739.7 3374.7 3296.9 3102.7 2773.6 119120 Money market mutual fund shares 483.8 542.1 619.6 759.1 878.7 1031.4 1181.9 1140.3 120121 Equity in noncorporate business 3590.0 3828.0 4117.5 4369.4 4602.2 4990.6 5098.7 5289.0 121
122 Insurance technical reserves 6279.4 6856.7 7675.2 8450.2 9298.3 9301.5 9104.2 8741.5 122123 Net equity in life insurance and pension funds 5963.1 6529.9 7335.7 8098.7 8933.9 8930.6 8714.9 8323.5 123124 Net equity in life insurance reserves 566.2 610.6 665.0 718.3 783.9 819.1 880.0 920.9 124125 Net equity in pension fund reserves 5396.9 5919.3 6670.7 7380.4 8150.1 8111.5 7834.9 7402.5 125126 Prepayments of premiums and reserves against claims 316.3 326.8 339.5 351.5 364.3 370.9 389.4 418.1 126127 Net equity in reserves of other insurance companies 194.7 197.5 199.5 201.3 202.3 202.0 214.0 232.4 127128 Net equity in other life insurance company reserves 121.5 129.3 140.0 150.3 162.0 168.9 175.4 185.6 128
129 Other accounts receivable (miscellaneous assets) 12.1 16.0 14.6 23.0 20.5 21.7 29.4 26.8 129
130 Total liabilities and net worth 32618.1 35531.0 39661.9 43633.3 49157.1 49468.3 49293.9 48339.1 130
131 Liabilities 5072.8 5429.9 5780.6 6245.8 6817.5 7403.5 8002.6 8702.6 131
132 Securities other than shares (municipals) 98.3 104.9 114.9 126.9 137.3 143.0 156.9 169.8 132
133 Loans 4855.9 5197.6 5529.1 5975.0 6529.9 7106.2 7687.9 8367.1 133134 Short-term 1419.7 1545.5 1654.6 1780.4 1955.7 2148.1 2231.1 2261.3 134135 Consumer credit 1168.0 1271.7 1333.8 1430.6 1542.7 1719.0 1856.7 1938.1 135136 Bank loans n.e.c. 57.4 58.0 66.5 74.2 67.3 74.1 57.6 54.6 136137 Other loans and advances 115.7 121.5 123.2 122.9 117.8 119.8 120.4 120.5 137138 Security credit 78.6 94.4 131.2 152.8 227.9 235.1 196.4 148.2 138139 Long-term (mortgages) 3436.2 3652.0 3874.5 4194.5 4574.2 4958.1 5456.8 6105.8 139
140 Insurance technical reserves (unpaid premiums) 17.5 18.3 18.6 17.2 19.4 19.6 19.1 20.0 140
141 Other accounts payable (trade debt) 101.1 109.1 118.0 126.8 130.9 134.7 138.7 145.7 141
142 Net worth 27545.3 30101.1 33881.3 37387.5 42339.5 42064.8 41291.3 39636.5 142
* The discrepancy is the difference between net lending or borrowing derived in the capital account and the same concept derived in the financial account. The discrepancy reflects differences in source data, timing of recorded flows, and other statistical differences between the capital and financial accounts.

Draft SNA-USA July 19, 2004
4. Nonfinancial Noncorporate BusinessBillions of dollars
1995 1996 1997 1998 1999 2000 2001 2002
CURRENT ACCOUNT:
1 Gross domestic product(GDP)/Gross value added 1052.8 1120.5 1184.8 1284.8 1372.4 1475.7 1569.5 1629.3 1
2 Less consumption of fixed capital 111.2 114.8 119.1 126.5 134.6 142.1 148.0 150.9 2
3 Equals net domestic product/Net value added 941.6 1005.7 1065.7 1158.3 1237.8 1333.6 1421.5 1478.4 3 4 Compensation of employees (paid) 255.3 269.7 286.2 311.4 341.2 367.6 390.7 405.9 4 5 Wages and salaries 222.3 235.9 251.6 273.7 299.8 322.6 343.8 355.8 5 6 Employers’ social contributions 33.0 33.8 34.6 37.7 41.4 45.0 46.9 50.1 6 7 Taxes on production and imports less subsidies 52.6 56.7 65.0 72.5 72.5 74.1 80.6 91.5 7 8 Operating surplus, net 633.6 679.2 714.5 774.4 824.1 891.8 950.2 980.9 8
9 Net national income/Balance of primary incomes, net 6.2 7.8 8.5 7.4 8.8 9.0 7.8 12.4 9 10 Operating surplus, net 633.6 679.2 714.5 774.4 824.1 891.8 950.2 980.9 10 11 Property income (interest received) 9.1 10.4 11.8 12.6 13.3 13.3 15.8 17.4 11 12 Less uses of property income (paid) 636.6 681.8 717.8 779.6 828.5 896.1 958.2 986.0 12 13 Interest 126.1 128.8 136.1 148.7 159.7 182.7 192.7 194.4 13 14 Withdrawals from income of quasi-corporations 510.4 553.0 581.6 630.9 668.8 713.4 765.6 791.6 14 15 Reinvested earnings on foreign direct investment 0.1 0 0.1 0 0 0 -0.1 0 15 16 Rents 0 0 0 0 0 0 0 0 16
17 Net national income/Balance of primary incomes, net 6.2 7.8 8.5 7.4 8.8 9.0 7.8 12.4 17 18 Less other current transfers (paid) 6.2 7.8 8.5 7.4 8.8 9.0 7.8 12.4 18
19 Equals disposable income, net 0 0 0 0 0 0 0 0 19
20 Equals net saving 0 0 0 0 0 0 0 0 20
CAPITAL ACCOUNT:
21 Net saving 0 0 0 0 0 0 0 0 21
22 Capital formation, net 14.8 36.5 10.3 29.9 65.7 84.6 56.0 41.5 22 23 Gross fixed capital formation 135.0 141.5 122.8 151.6 199.5 225.1 205.7 195.4 23 24 Nonresidential 92.4 95.2 81.0 109.9 139.4 159.0 142.3 127.4 24 25 Residential 42.6 46.3 41.8 41.7 60.1 66.1 63.4 68.0 25 26 Less consumption of fixed capital 111.2 114.8 119.1 126.5 134.6 142.1 148.0 150.9 26 27 Change in inventories -9.0 9.7 6.7 4.8 0.8 1.6 -1.7 -2.9 27
28 Net lending or borrowing, capital account (lines 21-22) -14.8 -36.5 -10.3 -29.9 -65.7 -84.6 -56.0 -41.5 28
FINANCIAL ACCOUNT:
29 Net lending or borrowing (line 28) -14.8 -36.5 -10.3 -29.9 -65.7 -84.6 -56.0 -41.5 29
30 Net acquisition of financial assets 75.6 92.8 127.7 211.4 176.8 237.4 148.2 143.5 30
31 Currency and deposits 18.0 22.8 33.2 47.2 58.4 76.7 8.3 15.4 31 32 Currency and transferable deposits 13.7 19.3 22.5 34.4 39.3 56.6 1.1 13.2 32 33 Time and savings deposits 4.3 3.5 10.7 12.7 19.1 20.1 7.1 2.2 33
34 Securities other than shares 5.9 5.3 4.2 5.4 -0.9 2.7 3.7 2.5 34 35 Treasury securities 5.3 4.9 3.7 5.7 -0.8 3.0 2.7 2.3 35 36 Municipal securities 0.6 0.4 0.5 -0.4 -0.1 -0.3 1.1 0.2 36
37 Loans -2.1 -1.4 -1.6 7.9 -2.0 -1.4 3.3 1.2 37 38 Short-term (consumer credit) 0 0 0 0 0 0 0 0 38 39 Long-term (mortgages) -2.1 -1.4 -1.6 7.9 -2.0 -1.4 3.3 1.2 39
40 Shares and other equity 1.9 2.2 3.7 9.7 8.1 8.7 9.6 2.4 40 41 Money market mutual fund shares 1.9 2.2 3.7 9.7 8.1 8.7 9.6 2.3 41 42 Equity in government-sponsored enterprises -0.1 0.0 0 0.1 -0.0 -0.0 0.0 0.1 42
Insurance technical reserves (net equity in reserves of 43 other insurance companies) 3.9 1.2 0.9 0.8 0.5 -0.2 3.9 8.2 43
44 Other accounts receivable 50.0 64.8 91.0 150.1 120.8 159.6 129.0 116.2 44 45 Trade receivables 15.3 29.5 35.1 28.2 39.4 69.6 1.8 22.8 45 46 Other (miscellaneous assets) 34.7 35.2 55.9 121.9 81.4 90.0 127.3 93.4 46
47 Net incurrence of liabilities 90.4 129.3 138.0 241.4 242.5 321.9 204.2 185.1 47
48 Loans 48.9 72.2 100.9 190.0 194.8 203.7 166.7 156.9 48 49 Short-term 19.7 31.3 50.1 39.3 54.0 59.7 38.0 16.0 49 50 Bank loans n.e.c. 11.8 29.5 47.3 26.0 45.6 47.0 37.8 12.5 50 51 Other loans and advances 7.9 1.8 2.8 13.3 8.4 12.8 0.3 3.5 51 52 Long-term (mortgages) 29.2 40.9 50.8 150.7 140.8 144.0 128.7 140.9 52
53 Shares and other equity 14.0 -6.5 -55.6 -76.4 -70.1 -26.9 -14.2 -22.2 53 54 Equity in noncorporate business 14.1 -6.8 -56.1 -76.6 -70.3 -27.0 -14.3 -22.4 54 55 Foreign direct investment in U.S. -0.1 0.3 0.5 0.2 0.2 0.1 0.1 0.2 55

Draft SNA-USA July 19, 2004
4. Nonfinancial Noncorporate BusinessBillions of dollars
1995 1996 1997 1998 1999 2000 2001 2002
56 Other accounts payable 27.6 63.6 92.7 127.8 117.7 145.1 51.7 50.4 56 57 Trade payables 13.4 31.8 32.4 31.5 35.1 47.5 -7.5 21.9 57 58 Taxes payable 0.6 2.3 4.3 4.1 8.9 11.7 4.0 8.1 58 59 Other (miscellaneous liabilities) 13.6 29.4 56.0 92.1 73.7 85.9 55.2 20.3 59
Memo: 60 Net lending or borrowing, financial account (lines 30-47) -14.8 -36.5 -10.3 -29.9 -65.7 -84.6 -56.0 -41.5 60
OTHER CHANGES IN VOLUME ACCOUNT:
61 Total other volume changes 19.7 -21.1 -64.9 -76.6 -72.5 -26.9 -21.5 -36.0 61
REVALUATION ACCOUNT:
62 Nonfinancial assets 173.3 196.6 314.2 325.0 280.1 395.7 113.7 226.2 62 63 Real estate 142.0 165.7 285.1 281.6 241.1 344.8 68.9 202.6 63 64 Residential 119.7 144.6 190.6 178.7 218.6 268.2 119.9 171.0 64 65 Nonresidential 22.2 21.2 94.5 102.9 22.6 76.6 -51.1 31.6 65 66 Equipment and software 30.1 30.9 30.5 45.0 37.8 49.5 46.7 22.3 66 67 Residential 0.2 0.9 0.2 0.5 0.3 1.1 0.8 0.3 67 68 Nonresidential 30.0 30.0 30.3 44.4 37.5 48.4 45.8 22.0 68 69 Inventories 1.2 -0.0 -1.4 -1.6 1.1 1.4 -1.8 1.3 69
70 Changes in net worth due to nominal holding gains/losses 173.3 196.6 314.2 325.0 280.1 395.7 113.7 226.2 70
CHANGES IN BALANCE SHEET ACCOUNT:
71 Change in net worth (lines 22+28+61+70) 193.0 175.5 249.4 248.4 207.6 368.7 92.2 190.2 71
BALANCE SHEET ACCOUNT (end of period):
72 Total assets 4207.2 4514.8 4950.1 5504.9 6019.9 6725.9 7028.5 7416.7 72
73 Nonfinancial assets 3659.1 3871.7 4176.2 4512.2 4843.1 5303.1 5450.1 5696.9 73 74 Real estate 3215.0 3397.9 3674.5 3949.9 4230.5 4639.1 4751.5 4983.8 74 75 Residential 2361.5 2522.5 2723.5 2912.6 3157.2 3456.3 3604.1 3811.0 75 76 Nonresidential 853.6 875.5 951.0 1037.3 1073.3 1182.8 1147.4 1172.9 76 77 Equipment and software 387.8 416.3 442.3 501.0 546.7 593.8 632.0 644.8 77 78 Residential 37.1 39.0 39.9 41.3 42.8 45.2 47.0 48.1 78 79 Nonresidential 350.7 377.3 402.3 459.7 503.9 548.7 585.0 596.7 79 80 Inventories 56.3 57.4 59.5 61.3 65.9 70.2 66.6 68.3 80
81 Financial assets 548.1 643.2 773.8 992.7 1176.8 1422.7 1578.4 1719.8 81
82 Currency and deposits 176.2 199.0 232.0 277.4 335.1 411.6 419.3 434.2 82 83 Currency and transferable deposits 104.7 124.0 146.2 178.9 217.6 274.1 274.5 287.3 83 84 Time and savings deposits 71.5 75.0 85.7 98.5 117.5 137.6 144.7 146.9 84
85 Securities other than shares 25.8 31.2 35.4 40.8 39.9 42.6 46.3 48.9 85 86 Treasury securities 23.6 28.6 32.2 38.0 37.2 40.2 42.8 45.2 86 87 Municipal securities 2.2 2.6 3.2 2.8 2.7 2.4 3.5 3.7 87
88 Loans 21.7 20.4 18.7 26.7 24.7 23.3 26.6 27.8 88 89 Short-term (consumer credit) 0 0 0 0 0 0 0 0 89 90 Long-term (mortgages) 21.7 20.4 18.7 26.7 24.7 23.3 26.6 27.8 90
91 Shares and other equity 18.0 20.9 24.6 34.2 42.3 51.0 60.5 62.9 91 92 Money market mutual fund shares 17.0 19.2 22.9 32.6 40.7 49.4 59.0 61.3 92 93 Equity in government-sponsored enterprises 1.0 1.7 1.7 1.6 1.6 1.6 1.5 1.5 93
Insurance technical reserves (net equity in reserves of 94 other insurance companies) 44.2 44.8 45.2 45.6 45.9 45.8 48.3 52.5 94
95 Other accounts receivable 262.2 326.9 417.9 568.0 688.8 848.4 977.4 1093.6 95 96 Trade receivables 140.3 169.8 204.9 233.1 272.6 342.1 343.9 366.7 96 97 Other (miscellaneous assets) 121.9 157.1 213.0 334.9 416.3 506.2 633.5 726.9 97
98 Total liabilities and net worth 4207.2 4514.8 4950.1 5504.9 6019.9 6725.9 7028.5 7416.7 98
99 Liabilities 1396.4 1528.6 1714.5 2020.9 2328.3 2665.5 2876.0 3073.9 99
100 Loans 1062.0 1130.7 1225.4 1405.3 1595.5 1788.4 1944.7 2093.0 100101 Short-term 257.0 287.4 334.5 370.2 425.3 480.7 515.9 531.7 101102 Bank loans n.e.c. 164.7 193.6 237.3 262.1 308.6 352.9 390.7 404.1 102103 Other loans and advances 92.3 93.9 97.2 108.1 116.7 127.8 125.3 127.6 103104 Long-term (mortgages) 805.0 843.2 890.9 1035.1 1170.1 1307.6 1428.8 1561.3 104
105 Shares and other equity (direct investment in U.S.) 2.8 4.0 3.9 3.4 3.3 3.4 3.2 3.4 105

Draft SNA-USA July 19, 2004
4. Nonfinancial Noncorporate BusinessBillions of dollars
1995 1996 1997 1998 1999 2000 2001 2002
106 Other accounts payable 331.6 393.9 485.2 612.2 729.5 873.8 928.0 977.5 106107 Trade payables 86.2 116.8 147.8 178.6 213.3 259.9 255.0 276.0 107108 Taxes payable 33.4 35.7 39.9 44.1 53.0 64.6 68.7 76.8 108109 Other (miscellaneous liabilities) 212.0 241.5 297.5 389.6 463.2 549.2 604.3 624.7 109
110 Net worth 2810.8 2986.2 3235.6 3484.0 3691.6 4060.3 4152.5 4342.8 110

Draft SNA-USA July 19, 2004
5. Nonfinancial Corporate BusinessBillions of dollars
1995 1996 1997 1998 1999 2000 2001 2002
CURRENT ACCOUNT:
1 Gross domestic product(GDP)/Gross value added 3879.5 4109.5 4401.8 4655.0 4950.8 5272.2 5299.3 5410.6 1
2 Less consumption of fixed capital 415.0 436.5 467.1 493.3 523.8 567.8 610.5 618.2 2
3 Equals net domestic product/Net value added 3464.5 3673.0 3934.7 4161.7 4427.0 4704.3 4688.9 4792.4 3 4 Compensation of employees (paid) 2509.8 2630.8 2812.9 3045.6 3267.7 3544.4 3597.0 3570.1 4 5 Wages and salaries 2076.7 2197.0 2367.9 2567.2 2758.0 2989.8 3016.7 2971.8 5 6 Employers’ social contributions 433.1 433.8 445.1 478.4 509.7 554.5 580.4 598.3 6 7 Taxes on production and imports less subsidies 356.9 369.1 385.5 398.7 416.6 443.4 440.3 464.5 7 8 Operating surplus, net 597.8 673.1 736.3 717.4 742.7 716.5 651.5 757.7 8
9 Net national income/Balance of primary incomes, net 357.7 417.9 449.6 385.1 426.9 373.8 303.2 388.7 9 10 Operating surplus, net 597.8 673.1 736.3 717.4 742.7 716.5 651.5 757.7 10 11 Property income (received) 295.8 331.0 367.8 349.3 384.0 453.6 413.5 398.0 11 12 Interest 189.9 216.7 239.5 235.9 251.3 291.3 273.0 242.9 12 13 Distributed income of corporations (dividends) 45.4 52.8 62.4 58.2 59.7 62.0 57.1 54.8 13 14 Reinvested earnings on foreign direct investment 60.5 61.5 65.9 55.2 73.0 100.3 83.4 100.3 14 15 Less uses of property income (paid) 535.9 586.2 654.5 681.6 699.8 796.3 761.8 767.0 15 16 Interest 298.0 319.9 354.2 371.3 402.9 471.5 465.3 437.7 16 17 Distributed income of corporations (dividends) 223.4 250.2 278.3 299.2 284.4 313.4 305.3 312.0 17 18 Reinvested earnings on foreign direct investment 7.5 7.5 12.8 2.7 3.9 0 -22.3 5.2 18 19 Rent 7.0 8.6 9.2 8.4 8.6 11.4 13.5 12.1 19
20 Net national income/Balance of primary incomes, net 357.7 417.9 449.6 385.1 426.9 373.8 303.2 388.7 20 21 Less current taxes on income, wealth, etc. (paid) 141.0 153.1 161.9 158.6 171.2 170.2 134.3 131.9 21 22 Less other current transfers (paid) 30.2 38.0 39.0 35.2 45.0 48.4 50.0 59.1 22
23 Equals disposable income, net 186.5 226.8 248.7 191.3 210.7 155.2 118.9 197.7 23
24 Equals net saving 186.5 226.8 248.7 191.3 210.7 155.2 118.9 197.7 24
CAPITAL ACCOUNT:
25 Net saving and capital transfers 186.5 226.6 248.7 191.1 210.8 155.2 118.8 197.7 25 26 Net saving 186.5 226.8 248.7 191.3 210.7 155.2 118.9 197.7 26 27 Capital transfers received (net) 0 0 0 0 0 0 0 0 27
28 Capital formation, net 223.2 217.8 284.7 280.5 335.1 360.7 194.1 152.5 28 29 Gross fixed capital formation (acq. of produced nonfinancial assets) 597.5 635.4 684.6 709.7 800.5 882.1 847.0 771.2 29 30 Less consumption of fixed capital 415.0 436.5 467.1 493.3 523.9 567.9 610.5 618.2 30 31 Acq. of nonproduced nonfinancial assets 0.6 -2.2 1.8 -1.9 -7.7 -8.5 -8.0 -8.8 31 32 Inventory change including inventory valuation adjustment 40.1 21.0 65.3 65.9 66.1 54.9 -34.4 8.3 32
33 Net lending or borrowing, capital account (lines 25-28) -36.7 8.8 -36.0 -89.4 -124.3 -205.5 -75.3 45.2 33
FINANCIAL ACCOUNT:
34 Net lending or borrowing, capital account (line 33) -36.7 8.8 -36.0 -89.4 -124.3 -205.5 -75.3 45.2 34
35 Net acquisition of financial assets 426.4 454.0 272.4 569.9 969.9 1209.2 177.6 121.3 35
36 Currency and deposits 9.5 50.1 22.2 23.6 81.2 43.5 -64.2 10.4 36 37 Currency and transferable deposits 4.5 39.3 7.6 23.0 56.0 50.5 -49.5 9.5 37 38 Time and savings deposits 3.3 -0.0 19.7 -6.8 24.3 0.5 -6.2 -3.6 38 39 Foreign deposits 1.7 10.8 -5.1 7.4 0.9 -7.4 -8.5 4.4 39
40 Securities other than shares -8.8 0.7 -39.8 1.1 5.0 18.8 -0.1 21.4 40 41 Open market paper 1.3 11.4 4.6 3.3 8.2 10.2 2.4 4.5 41 42 Treasury securities 6.3 -10.0 -20.2 -3.2 -4.2 -1.3 -1.6 14.8 42 43 Agency- and GSE-backed securities 3.5 5.1 -20.5 2.6 1.8 3.0 1.7 -1.2 43 44 Municipal securities -19.9 -5.8 -3.6 -1.6 -0.7 6.9 -2.6 3.3 44
45 Loans 0.3 -9.4 27.7 -16.1 -22.0 4.7 2.5 4.1 45 46 Short-term (security RPs and consumer credit) -1.3 -5.9 1.8 -3.1 4.1 2.4 -0.6 2.1 46 47 Long-term (mortgages) 1.6 -3.6 25.9 -13.0 -26.0 2.3 3.1 2.0 47
48 Shares and other equity 122.5 95.0 94.3 168.1 257.0 184.3 207.9 148.9 48 49 Mutual fund shares 4.6 8.7 -6.4 6.7 7.4 12.0 2.0 10.5 49 50 Money market mutual fund shares 22.9 7.7 20.2 38.6 28.4 36.5 110.5 26.9 50 51 U.S. direct investment abroad 90.3 76.8 84.3 129.2 194.4 128.4 97.0 117.0 51 52 Equity in government-sponsored enterprises 0 0 0 0 0 0 0 0 52 53 Investment in finance company subsidiaries 4.6 1.8 -3.7 -6.4 26.8 7.4 -1.7 -5.5 53
Insurance technical reserves (net equity in reserves of 54 other insurance companies) 8.2 2.6 1.9 1.7 1.0 -0.3 10.3 17.4 54
55 Other accounts receivable 294.7 315.2 166.0 391.5 647.6 958.2 21.3 -80.8 55 56 Trade receivables 78.0 88.1 93.5 85.0 203.4 283.0 -129.4 -34.4 56 57 Other (miscellaneous assets) 216.7 227.1 72.5 306.5 444.1 675.2 150.7 -46.4 57

Draft SNA-USA July 19, 2004
5. Nonfinancial Corporate BusinessBillions of dollars
1995 1996 1997 1998 1999 2000 2001 2002
58 Net incurrence of liabilities 390.8 398.5 283.5 616.0 987.6 1237.4 95.2 107.0 58
59 Securities other than shares 112.3 118.4 168.4 265.3 264.1 212.0 263.7 71.2 59 60 Open market paper 18.1 -0.9 13.7 24.4 37.4 48.1 -88.3 -64.2 60 61 Municipal securities 3.1 3.1 4.2 5.8 5.1 1.4 3.5 3.1 61 62 Corporate bonds 91.1 116.3 150.5 235.2 221.7 162.6 348.5 132.3 62
63 Loans 114.8 64.4 123.4 127.1 108.4 145.2 -36.4 -30.2 63 64 Short-term 106.8 54.6 90.9 130.5 67.6 114.0 -95.5 -80.5 64 65 Bank loans n.e.c. 74.5 40.4 51.1 76.2 44.1 48.0 -103.3 -96.5 65 66 Other loans and advances 32.3 14.2 39.8 54.3 23.4 65.9 7.8 16.0 66 67 Long-term (mortgages) 8.0 9.8 32.5 -3.3 40.8 31.2 59.0 50.2 67
68 Shares and other equity -4.8 24.3 22.8 -71.1 136.7 62.9 24.0 -18.9 68 69 Corporate equities -58.3 -47.3 -77.4 -215.5 -110.4 -118.2 -47.4 -41.6 69 70 Direct investment in U.S. 53.6 71.7 100.2 144.4 247.0 181.1 71.4 22.7 70
71 Insurance technical reserves (contributions payable) 4.1 4.1 7.1 21.4 -7.6 1.2 1.3 1.3 71
72 Other accounts payable 164.4 187.3 -38.3 273.3 486.1 816.0 -157.3 83.7 72 73 Trade payables 81.0 49.5 65.1 57.6 178.5 313.3 -103.7 -15.8 73 74 Other 83.5 137.8 -103.3 215.7 307.6 502.8 -53.6 99.5 74 75 Taxes payable -0.0 9.6 9.3 4.8 7.0 7.0 3.1 11.9 75 76 Miscellaneous liabilities 83.5 128.3 -112.7 210.8 300.6 495.8 -56.6 87.6 76
Memo: 77 Net lending or borrowing, financial account (lines 35-58) 35.5 55.5 -11.1 -46.1 -17.7 -28.2 82.4 14.4 77
OTHER CHANGES IN VOLUME ACCOUNT:
78 Total other volume changes 177.3 125.5 128.0 438.5 491.4 651.4 26.4 7.3 78 79 Other volume changes 86.8 81.8 117.2 415.4 385.8 460.0 -122.2 35.9 79 80 Less statistical discrepancy (lines 33-[35-58]) * -72.3 -46.7 -24.9 -43.3 -106.6 -177.3 -157.8 30.8 80 81 Less inventory valuation adjustment -18.3 3.1 14.1 20.2 0.9 -14.1 9.1 -2.2 81
REVALUATION ACCOUNT:
82 Nonfinancial assets 110.2 74.4 308.6 355.9 106.4 315.9 -227.1 136.6 82 83 Real estate 82.4 77.9 348.9 393.2 93.3 306.2 -186.7 134.4 83 84 Equipment and software 23.4 -6.5 -28.0 -27.2 -8.7 -2.8 -14.9 -19.8 84 85 Inventories 4.4 2.9 -12.3 -10.2 21.8 12.5 -25.5 22.0 85
86 Financial assets 12.7 19.6 0.7 -5.0 13.9 -50.8 -62.7 -15.0 86 87 Mutual fund shares 10.0 8.6 18.4 16.3 21.6 -15.0 -15.0 -24.5 87 88 Direct investment abroad 2.8 11.0 -17.6 -21.3 -7.8 -35.7 -47.8 9.5 88
89 Liabilities 1670.9 1258.0 2155.9 2025.2 3634.1 -2558.7 -1904.1 -2757.9 89 90 Corporate equity 1675.6 1272.4 2203.9 2027.7 3688.2 -2358.6 -1835.2 -2847.7 90 91 Direct investment in U.S. -4.7 -14.5 -48.0 -2.4 -54.1 -200.1 -68.9 89.8 91
92 Changes in net worth due to nominal holding gains/losses -1547.9 -1164.0 -1846.6 -1674.3 -3513.9 2823.8 1614.3 2879.4 92
CHANGES IN BALANCE SHEET ACCOUNT:
93 Change in net worth (lines 28+33+78+92) -1184.1 -811.7 -1469.9 -1044.5 -2811.7 3630.4 1759.6 3084.4 93
BALANCE SHEET ACCOUNT (end of period):
94 Total assets 11580.7 12363.1 13269.9 14866.4 16582.1 18939.8 19014.9 19345.5 94
95 Nonfinancial assets 6622.2 6905.4 7461.2 8050.2 8488.3 9167.3 9116.0 9412.4 95 96 Real estate 3125.1 3265.2 3665.8 4108.9 4283.8 4671.2 4573.0 4770.5 96 97 Equipment and software 2376.0 2496.0 2614.1 2722.7 2891.2 3092.8 3200.7 3258.3 97 98 Inventories 1069.8 1090.7 1129.6 1165.2 1252.1 1333.6 1264.5 1297.0 98 99 Nonproduced nonfinancial assets 51.3 53.5 51.6 53.5 61.2 69.7 77.7 86.5 99
100 Financial assets 4958.5 5457.7 5808.7 6816.1 8093.8 9772.5 9898.9 9933.1 100
101 Currency and deposits 322.2 372.2 394.4 418.1 499.3 542.8 478.6 488.9 101102 Currency and transferable deposits 205.1 244.3 251.9 275.0 331.0 381.4 331.9 341.4 102103 Time and savings deposits 99.7 99.7 119.4 112.6 136.9 137.3 131.1 127.5 103104 Foreign deposits 17.4 28.2 23.1 30.5 31.5 24.0 15.5 20.0 104
105 Securities other than shares 137.4 138.1 98.3 99.4 104.4 123.2 123.2 144.5 105106 Open market paper 20.1 31.5 36.1 39.4 47.6 57.8 60.2 64.7 106107 Treasury securities 57.1 47.1 26.8 23.6 19.4 18.1 16.5 31.3 107108 Agency- and GSE-backed securities 23.4 28.5 8.0 10.6 12.4 15.4 17.2 15.9 108109 Municipal securities 36.8 31.0 27.4 25.7 25.0 31.9 29.3 32.6 109

Draft SNA-USA July 19, 2004
5. Nonfinancial Corporate BusinessBillions of dollars
1995 1996 1997 1998 1999 2000 2001 2002
110 Loans 145.4 136.0 163.7 147.7 125.7 130.4 132.9 137.0 110111 Short-term 87.5 81.7 83.5 80.4 84.5 86.9 86.3 88.4 111112 Security RPs 2.4 3.9 4.6 4.2 5.8 4.2 4.0 6.2 112113 Consumer credit 85.1 77.7 78.9 76.2 78.7 82.7 82.3 82.2 113114 Long-term (mortgages) 57.9 54.4 80.2 67.3 41.2 43.5 46.6 48.7 114
115 Shares and other equity 909.8 1024.4 1119.5 1282.6 1553.5 1687.0 1832.1 1966.0 115116 Mutual fund shares 45.7 63.0 75.0 98.0 127.0 124.0 111.0 97.0 116117 Money market mutual fund shares 60.0 67.6 87.8 126.4 154.9 191.4 301.9 328.8 117118 U.S. direct investment abroad 778.7 866.5 933.1 1041.0 1227.7 1320.4 1369.6 1496.1 118119 Equity in government-sponsored enterprises 0 0 0 0 0 0 0 0 119120 Investment in finance company subsidiaries 25.5 27.3 23.5 17.1 43.9 51.3 49.6 44.1 120
Insurance technical reserves (net equity in reserves of121 other insurance companies) 183.6 186.2 188.1 189.8 190.8 190.4 200.8 218.2 121
122 Other accounts receivable 3260.0 3600.8 3844.6 4678.6 5620.1 7098.6 7131.4 6978.4 122123 Trade receivables 1184.9 1273.1 1366.6 1451.6 1655.0 1938.1 1808.7 1774.3 123124 Other (miscellaneous assets) 2075.1 2327.7 2478.0 3227.0 3965.1 5160.5 5322.7 5204.1 124
125 Total liabilities and net worth 11580.7 12363.1 13269.9 14866.4 16582.1 18939.8 19014.9 19345.5 125
126 Liabilities 12423.6 14017.7 16394.4 19035.4 23562.9 22290.2 20605.6 17851.8 126
127 Securities other than shares 1636.2 1754.6 1921.5 2186.8 2450.9 2662.9 2926.6 2997.8 127128 Open market paper 157.4 156.4 168.6 193.0 230.3 278.4 190.1 126.0 128129 Municipal securities 134.8 137.9 142.0 147.8 152.8 154.2 157.7 160.8 129130 Corporate bonds 1344.1 1460.4 1610.9 1846.0 2067.7 2230.3 2578.8 2711.0 130
131 Loans 1273.4 1337.7 1460.9 1588.0 1730.7 1875.9 1840.1 1809.8 131132 Short-term 1055.4 1110.0 1200.4 1330.8 1398.4 1512.3 1417.5 1337.0 132133 Bank loans n.e.c. 601.8 642.1 692.7 768.8 813.0 861.0 758.3 661.9 133134 Other loans and advances 453.7 467.9 507.7 562.0 585.4 651.3 659.1 675.1 134135 Long-term (mortgages) 217.9 227.7 260.5 257.2 332.3 363.5 422.6 472.8 135
136 Shares and other equity 7055.2 8337.5 10516.3 12470.4 16241.2 13745.4 11865.2 9088.4 136137 Corporate equity 6414.1 7639.2 9765.7 11577.8 15155.6 12678.8 10796.2 7906.9 137138 Direct investment in U.S. 641.1 698.4 750.6 892.6 1085.5 1066.6 1069.1 1181.5 138
139 Insurance technical reserves (contributions payable) 82.4 86.4 93.5 114.9 107.3 108.5 109.8 111.1 139
140 Other accounts payable 2376.4 2501.4 2402.3 2675.3 3032.8 3897.4 3864.0 3844.7 140141 Trade payables 877.5 927.0 992.1 1049.7 1228.2 1541.4 1437.7 1421.9 141142 Taxes payable 40.3 49.9 59.2 64.1 71.0 78.0 81.0 93.0 142143 Miscellaneous liabilities 1458.6 1524.5 1351.0 1561.6 1733.6 2278.0 2345.2 2329.9 143
144 Net worth -842.9 -1654.6 -3124.5 -4169.0 -6980.8 -3350.3 -1590.8 1493.6 144
* The discrepancy is the difference between net lending or borrowing derived in the capital account and the same concept derived in the financial account. The discrepancy reflects differences in source data, timing of recorded flows, and other statistical differences between the capital and financial accounts.

Draft SNA-USA July 19, 2004
6. Financial Business (1)Billions of dollars
1995 1996 1997 1998 1999 2000 2001 2002
CURRENT ACCOUNT:
1 Gross domestic product(GDP)/Gross value added 541.0 601.9 679.2 764.3 813.8 899.8 917.7 949.0 1
2 Less consumption of fixed capital 74.0 79.3 89.0 98.4 111.4 126.1 135.1 133.5 2
3 Equals net domestic product/Net value added 467.0 522.6 590.2 665.9 702.4 773.7 782.6 815.5 3 4 Compensation of employees (paid) 282.9 305.7 334.1 376.4 403.9 443.1 450.7 447.6 4 5 Wages and salaries 238.9 260.1 285.4 322.0 345.5 379.3 384.7 379.4 5 6 Employers’ social contributions 44.0 45.6 48.7 54.4 58.4 63.8 66.0 68.2 6 7 Taxes on production and imports less subsidies 31.0 33.2 36.2 37.5 40.2 41.4 41.7 44.6 7 8 Operating surplus, net 153.1 183.7 219.9 252.0 258.3 289.2 290.2 323.5 8
9 Net national income/Balance of primary incomes, net 124.3 116.7 121.4 120.9 144.1 143.7 181.3 194.5 9 10 Operating surplus, net 153.1 183.7 219.9 252.0 258.3 289.2 290.2 323.5 10 11 Property income (received) 931.9 974.6 1078.4 1185.9 1280.9 1542.1 1516.8 1373.8 11 12 Interest 887.7 919.4 1014.0 1115.1 1201.1 1456.3 1434.7 1297.1 12 13 Distributed income of corporations (dividends) 35.9 46.4 54.8 62.4 68.7 69.9 68.2 56.0 13 14 Reinvested earnings on foreign direct investment 8.3 8.8 9.6 8.4 11.1 15.9 13.9 20.7 14 15 Less uses of property income (paid) 960.7 1041.6 1176.9 1317.0 1395.1 1687.6 1625.7 1502.8 15 16 Interest 844.0 886.6 998.6 1131.1 1186.7 1445.9 1407.2 1273.4 16 17 Distributed income of corporations 115.6 153.8 176.0 185.6 207.9 241.7 225.0 227.7 17 18 Dividends 79.5 106.2 122.8 130.6 139.7 167.0 158.0 157.8 18 19 Withdrawals from income of quasi-corporations 36.1 47.6 53.2 55.0 68.2 74.7 67.0 69.9 19 20 Reinvested earnings on foreign direct investment 1.1 1.2 2.3 0.3 0.5 0 -6.5 1.7 20 21 Rents 0 0 0 0 0 0 0 0 21
22 Net national income/Balance of primary incomes, net 124.3 116.7 121.4 120.9 144.1 143.7 181.3 194.5 22 23 Less current taxes on income, wealth, etc. (paid) 77.6 78.6 84.2 89.7 87.4 94.9 66.8 63.1 23 24 Less other current transfers (paid) 9.3 7.8 -1.9 20.7 12.3 29.1 37.4 18.2 24
25 Equals disposable income, net 37.4 30.3 39.1 10.5 44.4 19.7 77.1 113.2 25
26 Equals net saving 37.4 30.3 39.1 10.5 44.4 19.7 77.1 113.2 26
CAPITAL ACCOUNT:
27 Net saving 37.4 30.3 39.1 10.5 44.4 19.7 77.1 113.2 27
28 Capital formation, net 14.2 32.9 76.5 90.5 28.8 5.3 -12.2 -11.3 28 29 Gross fixed capital formation (nonresidential) 88.2 112.2 165.5 188.9 140.2 131.4 122.9 122.2 29 30 Less consumption of fixed capital 74.0 79.3 89.0 98.4 111.4 126.1 135.1 133.5 30
31 Net lending or borrowing, capital account (lines 27-28) 23.2 -2.6 -37.4 -80.0 15.6 14.4 89.3 124.5 31
FINANCIAL ACCOUNT:
32 Net lending or borrowing (line 31) 23.2 -2.6 -37.4 -80.0 15.6 14.4 89.3 124.5 32
33 Net acquisition of financial assets 1511.3 1512.4 1984.0 2568.5 2467.9 2359.4 2771.5 1987.6 33
34 Monetary gold and SDRs 2.1 -0.5 -0.5 -0.0 -3.0 -4.0 -0.0 -0.0 34
35 Currency and deposits 55.8 43.7 57.1 89.4 43.8 25.0 204.7 24.4 35
36 Securities other than shares 543.2 399.7 717.5 876.7 927.3 632.1 1003.4 933.4 36
37 Loans 583.8 554.6 639.6 950.8 1093.6 947.6 768.9 837.6 37 38 Short-term 375.1 264.5 333.9 453.8 511.0 398.1 99.5 10.7 38 39 Long-term (mortgages) 208.8 290.1 305.7 497.0 582.5 549.6 669.4 826.8 39
40 Shares and other equity 222.1 392.3 362.7 441.4 334.8 535.0 502.5 214.1 40 41 Corporate equities 74.0 176.3 110.0 157.1 -3.6 289.6 219.1 99.6 41 42 Mutual fund shares 49.4 27.6 50.4 6.7 113.8 9.0 7.6 15.1 42 43 Money market mutual fund shares 15.0 77.2 56.1 99.5 93.0 35.4 157.9 -4.4 43 44 Equity in government-sponsored enterprises 2.0 1.4 1.8 4.0 6.1 2.2 2.8 1.9 44 45 U.S. direct investment abroad 8.4 15.1 20.5 13.5 30.5 30.8 22.9 20.8 45 46 Stock in Federal Reserve Banks 0.3 0.6 0.8 0.5 0.5 0.6 0.4 1.0 46 47 Investment in subsidiaries 72.9 94.1 123.0 160.1 94.6 167.4 91.9 80.0 47
48 Insurance technical reserves 22.5 19.3 6.4 5.1 -15.4 -10.4 3.3 15.2 48
49 Other accounts receivable 81.8 103.2 201.3 205.1 86.8 234.1 288.6 -37.1 49
50 Net incurrence of liabilities 1442.6 1494.0 2002.0 2632.3 2415.7 2496.2 2790.5 1997.7 50
51 Currency and deposits 162.7 174.1 239.2 268.5 334.4 248.7 520.9 384.2 51
52 Securities other than shares 435.4 484.2 527.8 919.6 954.9 754.5 846.4 823.6 52
53 Loans 144.9 126.4 260.9 314.4 297.1 300.4 113.4 89.8 53 54 Short-term 139.5 118.6 246.0 289.6 292.0 294.1 112.1 83.9 54

Draft SNA-USA July 19, 2004
6. Financial Business (1)Billions of dollars
1995 1996 1997 1998 1999 2000 2001 2002
55 Long-term (mortgages) 5.3 7.9 14.9 24.8 5.1 6.2 1.3 5.9 55
56 Shares and other equity 381.4 484.5 535.1 770.2 618.2 846.1 851.6 326.8 56 57 Corporate equity issues -5.6 -20.8 -26.6 0.9 -2.4 16.8 37.3 71.0 57 58 Mutual fund shares 147.4 237.6 265.1 279.5 191.2 239.4 201.2 182.4 58 59 Money market mutual fund shares 141.2 145.4 155.9 287.2 249.1 233.3 428.6 -16.8 59 60 Equity in government-sponsored enterprises 2.0 1.5 1.8 4.1 6.1 2.2 2.8 2.0 60 61 Foreign direct investment in U.S. 4.3 14.5 4.9 34.4 42.2 140.1 80.0 16.7 61 62 Equity in noncorporate business 14.4 9.9 13.9 9.9 10.2 39.0 11.2 -4.1 62 63 Investment by parent 77.5 95.9 119.3 153.7 121.4 174.8 90.2 74.5 63 64 Stock in Federal Reserve Banks 0.3 0.6 0.8 0.5 0.5 0.6 0.4 1.0 64
65 Insurance technical reserves 250.0 220.9 273.6 263.3 180.6 217.6 294.2 335.2 65
66 Other accounts payable 68.3 3.8 165.3 96.2 30.5 128.9 164.0 38.1 66
Memo: 67 Net lending or borrowing, financial account (lines 33-50) 68.7 18.3 -18.0 -63.7 52.2 -136.7 -19.1 -10.1 67
OTHER CHANGES IN VOLUME ACCOUNT:
68 Total other volume changes 49.8 -7.3 21.7 -4.3 -48.7 -156.5 -104.3 -205.3 68 69 Other volume changes 4.2 -28.2 2.3 -20.5 -85.2 -5.4 4.1 -70.7 69 70 Less statistical discrepancy (lines 31-[33-50]) * -45.5 -20.9 -19.4 -16.2 -36.5 151.1 108.4 134.6 70
REVALUATION ACCOUNT:
71 Nonfinancial assets 90.0 84.4 81.3 91.0 182.5 187.8 137.8 203.2 71 72 Structures 79.5 80.3 83.8 94.7 177.2 177.4 131.2 213.2 72 73 Equipment and software 10.5 4.1 -2.5 -3.7 5.3 10.4 6.6 -10.0 73
74 Financial assets 738.5 657.1 989.7 887.4 1421.7 -615.0 -1043.9 -1423.1 74 75 Corporate equities 660.0 588.7 873.4 770.7 1277.3 -574.8 -934.8 -1258.5 75 76 Mutual fund shares 81.1 67.0 126.9 110.1 143.3 -32.2 -105.3 -171.1 76 77 U.S. direct investment abroad -2.6 1.4 -8.9 6.6 1.2 -8.1 -3.8 6.5 77
78 Liabilities 1095.9 981.3 1655.5 999.8 1209.2 82.3 -1228.1 -1684.0 78 79 Corporate equity issues 395.6 371.2 711.6 174.3 -128.6 715.1 -230.8 -354.0 79 80 Mutual fund shares 228.0 252.0 381.9 344.2 734.1 -342.5 -501.0 -679.6 80 81 Foreign direct investment in U.S. 10.9 -7.4 21.6 0.6 -19.7 -21.1 -15.3 8.4 81 82 Equity in noncorporate business -15.9 -8.5 -9.3 -12.1 -19.0 -56.1 -21.0 -17.2 82 83 Pension fund reserves 477.2 374.0 549.8 492.8 642.4 -213.1 -460.0 -641.7 83
84 Changes in net worth due to nominal holding gains/losses -267.3 -239.9 -584.6 -21.4 395.1 -509.6 322.0 464.1 84
CHANGES IN BALANCE SHEET ACCOUNT:
85 Change in net worth (lines 28+31+68+84)** -180.2 -216.9 -523.8 -15.2 390.9 -646.4 294.7 372.0 85
BALANCE SHEET ACCOUNT (end of period):
86 Total assets 23097.8 25366.6 28490.4 32128.5 36225.4 38162.8 40012.1 40706.1 86
87 Nonfinancial assets 1883.5 1983.3 2111.0 2262.6 2450.4 2624.0 2730.9 2836.5 87 88 Structures 1402.9 1467.7 1562.9 1663.5 1781.1 1899.2 1985.4 2081.0 88 89 Equipment and software 480.5 515.5 548.2 599.1 669.4 724.8 745.6 755.6 89
90 Financial assets 21214.3 23383.4 26379.4 29865.9 33775.0 35538.9 37281.1 37869.6 90
91 Monetary gold and SDRs 21.2 20.8 20.2 20.2 17.2 13.2 13.2 13.2 91
92 Currency and deposits 498.9 544.5 600.8 692.2 734.0 757.6 960.8 985.7 92
93 Securities other than shares 7279.8 7653.2 8354.2 9230.9 10160.6 10792.8 11794.4 12727.9 93 94 Open market paper 525.7 578.1 714.4 835.6 1058.7 1225.6 1129.5 1014.4 94 95 Treasury securities 1606.8 1514.5 1557.7 1492.7 1432.8 1424.8 1447.9 1593.0 95 96 Agency- and GSE-backed securities 1967.3 2099.7 2254.5 2610.3 3012.1 3243.2 3800.6 4391.4 96 97 Municipal securities 684.5 719.0 773.1 855.7 878.0 885.1 961.5 1010.8 97 98 Corporate and foreign bonds 1989.2 2180.6 2452.9 2793.7 3094.9 3309.2 3689.2 3928.0 98 99 Nonmarketable government securities 506.3 561.4 601.7 642.9 684.0 704.9 765.8 790.3 99
100 Loans 7301.7 7856.3 8495.9 9446.7 10542.0 11500.7 12269.3 13106.9 100101 Short-term 3104.9 3369.4 3703.3 4157.1 4668.4 5077.6 5176.8 5187.5 101102 Long-term (mortgages) 4196.8 4486.9 4792.6 5289.6 5873.6 6423.1 7092.5 7919.4 102
103 Shares and other equity 4505.2 5554.6 6906.9 8235.7 9992.3 9912.2 9370.8 8161.8 103104 Corporate equities 3258.8 4023.8 5007.2 5935.0 7208.8 6923.6 6207.9 5049.1 104105 Mutual fund shares 365.5 460.0 637.4 754.2 1011.2 988.0 890.3 734.3 105106 Money market mutual fund shares 180.5 257.7 312.2 411.6 504.6 540.0 697.9 693.5 106

Draft SNA-USA July 19, 2004
6. Financial Business (1)Billions of dollars
1995 1996 1997 1998 1999 2000 2001 2002
107 Equity in government-sponsored enterprises 15.1 16.5 18.3 22.3 28.4 30.5 33.3 35.2 107108 U.S. direct investment abroad 106.8 123.3 134.9 155.0 186.6 209.4 228.5 255.8 108109 Stock in Federal Reserve Banks 4.0 4.6 5.4 6.0 6.4 7.0 7.4 8.4 109110 Investment in subsidiaries 574.4 668.5 791.5 951.7 1046.3 1213.7 1305.6 1385.6 110
111 Insurance technical reserves 432.1 465.8 494.1 516.7 523.1 509.4 501.1 497.6 111
112 Other accounts receivable 1175.4 1288.2 1507.2 1723.4 1805.8 2052.9 2371.4 2376.5 112
113 Total liabilities and net worth 23097.8 25366.6 28490.4 32128.5 36225.4 38162.8 40012.1 40706.1 113
114 Liabilities 21864.6 24350.3 27997.9 31651.1 35357.2 37941.0 39495.5 39817.6 114
115 Currency and deposits 4295.6 4471.5 4709.0 4979.4 5311.7 5564.2 6069.0 6450.3 115
116 Securities other than shares 4122.2 4606.4 5125.1 6044.7 6999.6 7758.1 8601.9 9425.5 116117 Agency- and GSE-backed securities 2376.8 2608.2 2821.1 3292.0 3884.0 4317.4 4944.1 5498.1 117118 Corporate bonds 1258.5 1419.1 1558.3 1846.0 2032.7 2226.0 2488.4 2821.5 118119 Commercial paper 486.9 579.1 745.7 906.7 1082.9 1214.7 1169.4 1105.9 119
120 Loans 1097.7 1224.1 1485.0 1799.4 2096.5 2396.8 2522.9 2612.7 120121 Short-term 1073.6 1192.2 1438.2 1727.8 2019.8 2313.9 2438.7 2522.6 121122 Long-term (mortgages) 24.1 31.9 46.8 71.6 76.7 82.9 84.2 90.1 122
123 Shares and other equity 4537.7 5629.5 7270.3 8547.6 9732.5 10874.0 10957.6 10242.0 123124 Corporate equity issues 1284.0 1634.3 2319.3 2494.5 2363.4 3095.3 2901.8 2618.8 124125 Mutual fund shares 1852.8 2342.4 2989.4 3613.1 4538.5 4435.3 4135.5 3638.4 125126 Money market mutual fund shares 741.3 886.7 1042.5 1329.7 1578.8 1812.1 2240.7 2223.9 126127 Equity in government-sponsored enterprises 18.3 19.7 21.5 25.5 31.6 33.8 36.5 38.5 127128 Foreign direct investment in U.S. 36.1 43.2 69.7 104.7 127.2 246.2 310.9 336.1 128129 Equity in noncorporate business 1.4 2.8 7.4 5.2 -3.6 -20.7 -30.5 -51.7 129130 Investment by parent 599.9 695.8 815.1 968.8 1090.2 1265.0 1355.2 1429.8 130131 Stock in Federal Reserve Banks 4.0 4.6 5.4 6.0 6.4 7.0 7.4 8.4 131
132 Insurance technical reserves 6851.7 7461.1 8301.5 9080.4 9940.2 9926.6 9733.0 9388.6 132
133 Other accounts payable 959.7 957.7 1107.0 1199.7 1276.6 1421.2 1611.2 1698.4 133
134 Net worth 1233.2 1016.3 492.5 477.4 868.2 221.8 516.6 888.5 134
(1) Includes other financial institutions, depository institutions, insurance companies and pension funds, and monetary authority.* The discrepancy is the difference between net lending or borrowing derived in the capital account and the same concept derived in the financial account. The discrepancy reflects differences in source data, timing of recorded flows, and other statistical differences between the capital and financial accounts.** Partial--Does not include revaluation of tangible assets.

Draft SNA-USA July 19, 2004
7. Federal GovernmentBillions of dollars
1995 1996 1997 1998 1999 2000 2001 2002
CURRENT ACCOUNT:
1 Gross domestic product(GDP)/Gross value added 338.7 343.7 349.3 352.9 361.9 378.7 386.9 408.9 1
2 Less consumption of fixed capital 81.9 82.0 82.5 82.8 84.8 87.2 88.2 89.1 2
3 Equals net domestic product/Net value added 256.9 261.6 266.8 270.1 277.0 291.6 298.7 319.8 3 4 Compensation of employees (paid) 257.5 262.9 266.5 270.0 277.4 293.9 302.8 323.0 4 5 Wages and salaries 174.7 175.7 177.3 179.7 184.3 195.8 200.5 213.3 5 6 Employers’ social contributions 82.8 87.2 89.2 90.3 93.1 98.1 102.3 109.7 6 7 Operating surplus, net -0.6 -1.2 0.3 0.1 -0.3 -2.3 -4.1 -3.1 7
8 Net national income/Balance of primary incomes, net -225.1 -232.3 -228.0 -231.1 -221.4 -216.3 -199.0 -161.5 8 9 Operating surplus, net -0.6 -1.2 0.3 0.1 -0.3 -2.3 -4.1 -3.1 9 10 Taxes on production and imports, receivable 75.9 73.2 78.2 81.1 83.9 87.8 86.0 87.6 10 11 Subsidies (paid) -33.7 -34.0 -32.4 -35.0 -43.8 -43.8 -47.6 -37.2 11 12 Property income (received) 23.7 26.9 25.9 21.5 21.5 25.2 24.4 20.6 12 13 Interest 21.2 23.0 21.4 17.7 18.0 20.1 17.9 15.9 13 14 Rents 2.5 4.0 4.5 3.8 3.5 5.1 6.5 4.7 14 15 Less uses of property income (interest paid) 290.4 297.3 300.0 298.8 282.7 283.3 257.5 229.3 15
16 Net national income/Balance of primary incomes, net -225.1 -232.3 -228.0 -231.1 -221.4 -216.3 -199.0 -161.5 16 17 Plus current taxes on income, wealth, etc. (received) 769.2 859.2 952.4 1035.8 1111.9 1225.8 1168.9 993.1 17 18 Plus social benefits (received) 519.2 542.8 576.4 613.8 651.6 691.7 715.4 736.7 18 19 Less social contributions (paid) 642.7 680.0 706.3 719.2 738.0 772.5 840.2 920.0 19 20 Plus other current transfers (received) 19.1 23.1 19.9 21.5 22.7 25.7 27.4 25.8 20 21 Less other current transfers (paid) 196.3 208.2 212.5 227.4 248.0 265.6 290.3 323.4 21
22 Equals disposable income, net 243.5 304.5 401.9 493.4 578.7 688.8 582.2 350.8 22 23 Less final consumption expenditures 440.5 446.3 457.7 454.6 475.1 499.3 531.7 590.8 23
24 Equals net saving -197.0 -141.8 -55.8 38.8 103.6 189.5 50.5 -240.0 24
CAPITAL ACCOUNT:
25 Net saving and capital transfers -209.8 -152.5 -64.2 35.3 96.3 181.4 37.7 -258.8 25 26 Net saving -197.0 -141.8 -55.8 38.8 103.6 189.5 50.5 -240.0 26 27 Capital transfers received (net) -12.8 -10.7 -8.5 -3.6 -7.4 -8.1 -12.9 -18.7 27
28 Capital formation, net -10.5 -4.7 -17.0 -12.6 -5.0 -8.0 -7.8 -0.2 28 29 Gross fixed capital formation (acq. of produced nonfinancial assets) 78.7 81.1 73.2 75.8 80.8 79.5 81.2 88.7 29 30 Less consumption of fixed capital 81.9 82.0 82.5 82.8 84.8 87.2 88.2 89.1 30 31 Acq. of nonproduced nonfinancial assets -7.4 -3.8 -7.6 -5.7 -1.0 -0.3 -0.7 0.2 31
32 Net lending or borrowing, capital account (lines 25-28) -199.3 -147.8 -47.3 47.9 101.3 189.3 45.4 -258.7 32
FINANCIAL ACCOUNT:
33 Net lending or borrowing (line 32) -199.3 -147.8 -47.3 47.9 101.3 189.3 45.4 -258.7 33
34 Net acquisition of financial assets -11.5 2.5 -12.6 -8.6 71.4 -70.7 51.2 16.6 34
35 Monetary gold and SDRs 0.8 -0.4 0.4 0.1 -0.0 0.7 0.6 0.8 35
36 Currency and deposits 6.1 9.8 2.5 -9.6 60.4 -65.5 49.2 6.4 36 37 Official foreign exchange 3.2 -3.8 -1.5 0.8 -1.6 0.9 0.3 1.9 37 38 Net IMF position 2.5 1.3 3.6 5.1 -5.5 -2.3 3.6 6.1 38 39 Currency and transferable deposits -0.0 11.0 -0.5 -16.7 66.2 -65.1 41.1 -18.7 39 40 Time and savings deposits 0.3 1.4 1.0 1.3 0.7 1.0 4.2 17.1 40 41 Nonofficial foreign currencies 0.3 -0.1 -0.0 -0.1 0.6 0.0 -0.1 0.1 41
42 Loans -7.0 -1.3 3.1 11.6 6.4 11.6 6.0 9.8 42 43 Short-term 6.6 5.9 7.6 12.5 6.4 12.5 7.1 9.2 43 44 Consumer credit 3.2 7.7 10.8 9.0 13.6 16.1 13.1 12.7 44 45 Other loans and advances 3.4 -1.8 -3.1 3.4 -7.1 -3.6 -5.9 -3.4 45 46 Long-term (mortgages) -13.5 -7.2 -4.5 -0.8 -0.1 -0.9 -1.1 0.5 46
47 Shares and other equity 1.5 1.8 1.6 1.6 1.5 1.5 1.7 1.7 47 48 Equity in international organizations 1.5 1.8 1.6 1.6 1.5 1.5 1.7 1.7 48 49 Equity in government-sponsored enterprises 0 0 0 0 0 0 0 0 49
50 Other accounts receivable -13.0 -7.4 -20.1 -12.4 3.2 -19.1 -6.3 -2.0 50 51 Trade receivables -1.6 0.9 -3.2 1.5 4.6 5.3 7.3 -3.3 51 52 Taxes receivable -7.5 0.0 -10.0 -8.9 1.6 -21.5 -13.4 2.8 52 53 Other (miscellaneous assets) -3.8 -8.4 -7.0 -5.0 -3.0 -2.9 -0.3 -1.5 53
54 Net incurrence of liabilities 169.0 198.1 56.5 -24.6 -34.0 -268.7 53.5 285.9 54
55 Monetary gold and SDRs (SDR certificates) 2.2 -0.5 -0.5 0 -3.0 -4.0 0 0 55
56 Currency and deposits (treasury currency) 0.7 0.5 0.5 0.6 1.0 2.4 1.3 1.0 56

Draft SNA-USA July 19, 2004
7. Federal GovernmentBillions of dollars
1995 1996 1997 1998 1999 2000 2001 2002
57 Securities other than shares 144.4 144.9 23.1 -52.6 -71.2 -295.9 -5.6 257.5 57 58 Treasury securities including savings bonds 142.9 146.6 23.2 -54.6 -71.0 -294.9 -5.0 257.0 58 59 Federal agency securities 1.5 -1.6 -0.1 2.0 -0.2 -1.0 -0.5 0.5 59
60 Insurance technical reserves 21.8 55.7 42.0 42.5 42.5 22.3 62.2 26.1 60 61 Insurance reserves 1.0 0.6 1.7 1.3 1.4 1.4 1.4 1.6 61 62 Nonmarketable securities held by pension plans 20.8 55.1 40.3 41.2 41.1 20.9 60.8 24.5 62
63 Other accounts payable -0.1 -2.6 -8.6 -15.1 -3.4 6.4 -4.5 1.3 63 64 Trade payables -4.6 0.7 -8.8 -8.0 -0.4 4.4 3.4 1.8 64 65 Other (miscellaneous liabilities) 4.5 -3.3 0.3 -7.1 -2.9 2.0 -7.8 -0.4 65
Memo: 66 Net lending or borrowing, financial account (lines 34-54) -180.4 -195.6 -69.1 16.0 105.4 198.0 -2.3 -269.3 66
OTHER CHANGES IN VOLUME ACCOUNT:
67 Total other volume changes 29.8 -48.2 -11.6 -28.7 46.0 36.2 -4.5 -29.2 67 68 Other volume changes 11.0 -0.4 10.3 3.2 41.9 27.5 43.2 -18.5 68 69 Less statistical discrepancy (lines 32-[34-54]) * -18.8 47.9 21.8 31.9 -4.1 -8.7 47.7 10.6 69
REVALUATION ACCOUNT:
70 Nonfinancial assets 45.7 33.6 40.7 27.0 44.1 41.6 33.4 30.8 70 71 Structures 38.0 33.7 40.9 30.3 38.4 43.0 32.6 30.0 71 72 Equipment and software 7.6 -0.2 -0.2 -3.3 5.7 -1.4 0.8 0.8 72
73 Financial assets 0.3 -0.8 -1.6 1.3 -0.9 -1.3 -1.0 -1.4 73 74 Currency and checkable deposits -5.6 5.2 3.8 -1.7 -1.4 1.4 1.5 -0.6 74 75 Monetary gold, SDRs, and official foreign exchange 6.0 -6.0 -5.4 3.1 0.5 -2.7 -2.5 -0.8 75
76 Changes in net worth due to nominal holding gains/losses 46.0 32.7 39.1 28.3 43.2 40.3 32.4 29.4 76
CHANGES IN BALANCE SHEET ACCOUNT:
77 Change in net worth (lines 28+32+67+76)** -133.9 -168.0 -36.6 34.9 185.5 257.8 65.6 -258.6 77
BALANCE SHEET ACCOUNT (end of period):
78 Total assets 1756.3 1790.3 1809.3 1826.8 1981.0 1967.9 2094.6 2122.2 78
79 Nonfinancial assets 1314.4 1343.2 1367.0 1381.4 1420.5 1454.1 1479.8 1510.4 79 80 Structures 787.7 819.0 848.5 869.4 901.9 936.5 959.2 987.0 80 81 Equipment and software 526.7 524.3 518.4 511.9 518.6 517.6 520.6 523.4 81
82 Financial assets 441.9 447.1 442.3 445.4 560.5 513.8 614.9 611.8 82
83 Monetary gold and SDRs 11.0 10.3 10.0 10.6 10.3 10.5 10.8 12.2 83
84 Currency and deposits 68.1 77.4 79.0 70.3 130.0 63.7 112.3 116.8 84 85 Official foreign exchange 28.0 19.0 13.8 16.2 16.0 15.6 14.4 16.9 85 86 Net IMF position 14.7 15.5 18.2 24.2 18.0 14.9 17.9 22.1 86 87 Currency and transferable deposits 22.2 38.3 41.6 23.2 87.9 24.3 66.9 47.5 87 88 Time and savings deposits 0.9 2.4 3.4 4.7 5.4 6.3 10.5 27.6 88 89 Nonofficial foreign currencies 2.3 2.2 2.1 2.0 2.6 2.6 2.6 2.7 89
90 Loans 207.8 206.5 209.8 221.6 261.1 272.7 278.7 288.5 90 91 Short-term 150.3 156.3 164.1 176.7 183.3 195.8 203.0 212.2 91 92 Consumer credit 9.9 17.6 28.3 37.4 50.9 67.0 80.1 92.8 92 93 Other loans and advances 140.5 138.7 135.7 139.3 132.4 128.8 122.9 119.4 93 94 Long-term (mortgages) 57.5 50.3 45.7 44.9 77.7 76.9 75.8 76.3 94
95 Shares and other equity 27.4 29.2 30.8 32.4 33.9 35.4 37.1 38.7 95 96 Equity in international organizations 27.4 29.2 30.8 32.4 33.9 35.4 37.1 38.7 96 97 Equity in government-sponsored enterprises 0 0 0 0 0 0 0 0 97
98 Other accounts receivable 127.5 123.6 112.6 110.5 125.3 131.5 176.0 155.7 98 99 Trade receivables 23.1 24.0 20.8 22.3 22.9 28.1 35.5 32.2 99100 Taxes receivable 17.3 20.7 20.0 21.4 38.5 42.4 79.8 64.3 100101 Other (miscellaneous assets) 87.2 78.8 71.9 66.9 63.9 61.0 60.7 59.2 101
102 Total liabilities and net worth 1756.3 1790.3 1809.3 1826.8 1981.0 1967.9 2094.6 2122.2 102
103 Liabilities 4289.2 4491.2 4546.8 4529.4 4498.1 4227.2 4288.3 4574.5 103
104 Monetary gold and SDRs (SDR certificates) 10.2 9.7 9.2 9.2 6.2 2.2 2.2 2.2 104
105 Currency and deposits (treasury currency) 18.3 18.9 19.3 19.9 20.9 23.2 24.5 25.5 105

Draft SNA-USA July 19, 2004
7. Federal GovernmentBillions of dollars
1995 1996 1997 1998 1999 2000 2001 2002
106 Securities other than shares 3636.7 3781.7 3804.8 3752.2 3681.0 3385.1 3379.5 3637.0 106107 Treasury securities including savings bonds 3608.5 3755.1 3778.3 3723.7 3652.7 3357.8 3352.7 3609.8 107108 Federal agency securities 28.2 26.6 26.5 28.5 28.3 27.3 26.8 27.3 108
109 Insurance technical reserves 536.2 591.9 634.0 676.5 719.0 741.3 803.6 829.7 109110 Insurance reserves 29.9 30.5 32.3 33.6 35.0 36.4 37.8 39.4 110111 Nonmarketable securities held by pension plans 506.3 561.4 601.7 642.9 684.0 704.9 765.8 790.3 111
112 Other accounts payable 87.7 89.0 79.6 71.7 71.1 75.4 78.6 80.1 112113 Trade payables 81.1 81.8 72.9 65.0 64.5 69.0 72.3 74.1 113114 Other (miscellaneous liabilities) 6.7 7.3 6.6 6.7 6.6 6.4 6.2 6.0 114
115 Net worth -2532.9 -2700.9 -2737.6 -2702.6 -2517.2 -2259.3 -2193.7 -2452.3 115
* The discrepancy is the difference between net lending or borrowing derived in the capital account and the same concept derived in the financial account. The discrepancy reflects differences in source data, timing of recorded flows, and other statistical differences between the capital and financial accounts.** Partial--Does not include revaluation of tangible assets.

Draft SNA-USA July 19, 2004
8. State and Local Governments (1)Billions of dollars
1995 1996 1997 1998 1999 2000 2001 2002
CURRENT ACCOUNT:
1 Gross domestic product(GDP)/Gross value added 666.7 693.0 720.4 752.6 790.5 834.4 883.8 930.9 1
2 Less consumption of fixed capital 83.1 87.2 91.6 96.2 102.1 109.8 117.7 121.7 2
3 Equals net domestic product/Net value added 583.6 605.8 628.8 656.4 688.4 724.6 766.1 809.1 3 4 Compensation of employees (paid) 571.5 591.9 616.5 646.2 677.9 716.9 760.8 803.2 4 5 Wages and salaries 450.8 468.7 490.8 517.5 545.0 578.9 615.2 646.6 5 6 Employers’ social contributions 120.7 123.2 125.7 128.7 132.9 138.1 145.6 156.6 6 7 Operating surplus, net 12.0 13.9 12.3 10.2 10.4 7.7 5.4 5.9 7
8 Net national income/Balance of primary incomes, net 498.3 526.6 552.0 575.9 610.9 640.8 650.6 682.9 8 9 Operating surplus, net 12.0 13.9 12.3 10.2 10.4 7.7 5.4 5.9 9 10 Taxes on production and imports, receivable 482.4 507.9 533.8 558.8 590.2 621.1 643.8 672.5 10 11 Subsidies (paid) -0.3 -0.3 -0.4 -0.4 -0.4 -0.5 -7.7 -1.0 11 12 Property income (received) 68.4 73.3 77.8 80.9 85.3 92.2 95.6 95.5 12 13 Interest 62.9 67.3 71.5 74.6 78.4 84.0 86.7 86.0 13 14 Distributed income of corporations (dividends) 1.0 1.4 1.5 1.7 1.8 1.9 2.0 2.1 14 15 Rents 4.5 4.6 4.8 4.6 5.1 6.3 7.0 7.4 15 16 Less uses of property income (interest paid) 64.2 68.1 71.4 73.6 74.6 79.5 86.6 89.9 16
17 Net national income/Balance of primary incomes, net 498.3 526.6 552.0 575.9 610.9 640.8 650.6 682.9 17 18 Plus current taxes on income, wealth, etc. (received) 189.8 201.7 216.1 236.1 250.3 272.2 273.9 253.0 18 19 Plus social benefits (received) 13.6 12.5 10.8 10.4 9.8 11.0 13.2 13.5 19 20 Less social contributions (paid) 217.6 224.3 227.6 235.8 252.4 271.7 305.1 332.3 20 21 Plus other current transfers (received) 224.1 234.1 246.6 266.8 290.8 315.4 350.8 384.2 21
22 Equals disposable income, net 708.1 750.6 798.0 853.3 909.3 967.7 983.4 1001.4 22 23 Less final consumption expenditures 696.1 724.8 758.9 801.4 858.9 917.8 966.1 1004.6 23
24 Equals net saving 12.0 25.8 39.1 52.0 50.4 50.0 17.3 -3.2 24
CAPITAL ACCOUNT:
25 Net saving and capital transfers 44.4 59.7 74.4 88.0 90.3 93.8 65.8 48.4 25 26 Net saving 12.0 25.8 39.1 52.0 50.4 50.0 17.3 -3.2 26 27 Capital transfers received (net) 32.4 33.9 35.3 36.0 39.9 43.7 48.5 51.7 27
28 Capital formation, net 77.4 82.6 93.2 97.9 112.6 124.0 126.8 135.3 28 29 Gross fixed capital formation (acq. of produced nonfinancial assets) 154.0 163.8 178.9 186.5 206.1 225.1 235.8 248.4 29 30 Less consumption of fixed capital 83.1 87.2 91.6 96.2 102.1 109.8 117.7 121.7 30 31 Acq. of nonproduced nonfinancial assets 6.6 6.1 5.9 7.6 8.6 8.8 8.6 8.6 31
32 Net lending or borrowing, capital account (lines 25-28) -33.0 -22.9 -18.8 -9.9 -22.3 -30.3 -61.0 -86.9 32
FINANCIAL ACCOUNT:
33 Net lending or borrowing (line 32) -33.0 -22.9 -18.8 -9.9 -22.3 -30.3 -61.0 -86.9 33
34 Net acquisition of financial assets -31.7 13.8 25.4 146.9 77.5 35.8 91.5 86.6 34
35 Currency and deposits 10.0 5.1 10.2 8.9 14.9 10.4 12.7 25.6 35 36 Currency and transferable deposits 3.4 -5.5 4.4 -3.9 3.9 1.0 5.1 8.5 36 37 Time and savings deposits 6.6 10.6 5.8 12.8 11.0 9.4 7.7 17.1 37
38 Securities other than shares -94.7 -37.5 -3.6 130.3 24.1 -22.3 55.9 20.8 38 39 Open market paper 17.1 20.3 14.3 28.0 6.9 22.6 -26.5 -3.8 39 40 Treasury securities -80.2 -32.8 -17.7 30.0 -2.5 -29.1 50.2 22.1 40 41 Agency- and GSE-backed securities -35.1 -35.3 -0.8 63.6 11.0 -18.0 19.9 2.1 41 42 Municipal securities -3.5 -0.5 -0.7 -1.4 -1.5 0.6 0.3 -1.4 42 43 Corporate and foreign bonds 7.1 10.7 1.3 10.2 10.1 1.7 11.9 1.8 43
44 Loans 0.3 35.9 7.2 11.3 9.3 24.2 -8.7 2.8 44 45 Short-term (security RPs) -3.0 32.1 3.6 7.2 5.0 19.7 -13.4 -2.1 45 46 Long-term (mortgages) 3.3 3.8 3.7 4.1 4.3 4.5 4.7 5.0 46
47 Shares and other equity 18.0 20.5 9.4 -2.9 7.8 -0.3 27.9 8.6 47 48 Corporate equities 12.1 14.5 16.8 9.4 3.5 -1.2 22.8 6.7 48 49 Mutual fund shares 5.9 6.0 -7.4 -12.3 4.3 0.8 5.1 2.0 49
50 Other accounts receivable 34.6 -10.1 2.1 -0.6 21.5 23.7 3.6 28.7 50 51 Taxes receivable -9.1 -4.6 0.3 2.8 10.5 14.8 3.6 10.4 51 52 Other (miscellaneous assets) 43.7 -5.5 1.9 -3.5 11.0 8.9 -0.0 18.4 52
53 Net incurrence of liabilities -31.7 15.0 72.9 98.2 67.6 42.8 131.0 168.4 53
54 Securities other than shares (municipals) -61.4 -16.2 42.8 66.5 38.9 16.5 105.5 143.4 54 55 Short-term 1.2 6.3 8.3 -6.3 2.6 1.4 23.8 25.2 55 56 Other -62.6 -22.5 34.4 72.7 36.3 15.1 81.7 118.2 56
57 Loans (short-term) 0.5 0.4 -1.2 1.2 -0.4 -1.0 0.2 0.5 57

Draft SNA-USA July 19, 2004
8. State and Local Governments (1)Billions of dollars
1995 1996 1997 1998 1999 2000 2001 2002
58 Other accounts payable (trade payables) 29.2 30.9 31.4 30.5 29.1 27.4 25.2 24.5 58
Memo: 59 Net lending or borrowing, financial account (lines 34-53) 0.0 -1.2 -47.5 48.8 9.9 -7.1 -39.5 -81.7 59
OTHER CHANGES IN VOLUME ACCOUNT:
60 Total other volume changes 29.6 15.5 -44.0 45.1 22.6 22.0 33.1 25.2 60 61 Other volume changes -3.5 -6.2 -15.3 -13.7 -9.5 -1.2 11.6 20.1 61 62 Less statistical discrepancy (lines 32-[34-53]) * -33.1 -21.7 28.7 -58.7 -32.1 -23.2 -21.5 -5.2 62
REVALUATION ACCOUNT:
63 Nonfinancial assets 98.1 80.3 101.2 86.5 132.1 175.6 90.7 97.0 63 64 Structures 96.2 81.3 104.1 88.6 132.5 175.5 83.8 90.0 64 65 Equipment and software 1.9 -0.9 -2.9 -2.1 -0.4 0.0 6.9 7.0 65
66 Shares and other equity 3.5 6.2 15.3 13.7 9.5 1.2 -11.6 -20.1 66
67 Changes in net worth due to nominal holding gains/losses 101.5 86.5 116.5 100.1 141.6 176.8 79.1 76.9 67
CHANGES IN BALANCE SHEET ACCOUNT:
68 Change in net worth (lines 28+32+60+67)** 175.5 161.7 146.9 233.2 254.6 292.5 178.0 150.5 68
BALANCE SHEET ACCOUNT (end of period):
69 Total assets 4212.7 4389.5 4609.3 4940.6 5262.8 5598.1 5907.1 6226.0 69
70 Nonfinancial assets 3218.6 3381.5 3575.9 3760.3 4005.0 4304.6 4522.1 4754.4 70 71 Structures 3059.7 3213.9 3400.8 3574.6 3805.6 4091.2 4288.7 4501.0 71 72 Equipment and software 158.9 167.7 175.1 185.7 199.4 213.4 233.4 253.4 72
73 Financial assets 994.1 1007.9 1033.3 1180.3 1257.8 1293.5 1385.0 1471.6 73
74 Currency and deposits 95.3 100.3 110.5 119.4 134.3 144.7 157.4 183.0 74 75 Currency and transferable deposits 33.3 27.8 32.2 28.3 32.2 33.2 38.2 46.7 75 76 Time and savings deposits 62.0 72.6 78.4 91.1 102.1 111.5 119.2 136.3 76
77 Securities other than shares 524.8 487.2 483.7 614.0 638.1 615.8 671.6 692.4 77 78 Open market paper 39.4 59.7 74.0 102.0 108.9 131.5 105.0 101.2 78 79 Treasury securities 289.8 257.0 239.3 269.3 266.8 237.7 287.9 310.0 79 80 Agency- and GSE-backed securities 151.5 116.2 115.4 179.0 190.0 172.0 191.9 194.0 80 81 Municipal securities 5.1 4.6 3.9 2.5 1.0 1.6 1.9 0.5 81 82 Corporate and foreign bonds 39.0 49.7 51.0 61.2 71.3 73.0 84.9 86.7 82
83 Loans 229.5 265.4 272.7 284.0 293.3 317.5 308.8 311.7 83 84 Short-term (security RPs) 115.7 147.8 151.4 158.5 163.5 183.3 169.9 167.7 84 85 Long-term (mortgages) 113.8 117.6 121.3 125.4 129.8 134.3 139.0 143.9 85
86 Shares and other equity 61.2 87.9 112.6 123.3 140.6 141.5 157.8 146.4 86 87 Corporate equities 26.2 46.8 79.0 102.0 115.0 115.1 126.3 112.9 87 88 Mutual fund shares 35.0 41.0 33.6 21.3 25.6 26.4 31.5 33.5 88
89 Other accounts receivable 83.4 67.1 53.9 39.6 51.6 74.1 89.3 138.2 89 90 Taxes receivable 27.9 26.1 26.9 28.1 33.5 45.6 50.1 59.5 90 91 Other (miscellaneous assets) 55.4 41.0 27.0 11.5 18.1 28.5 39.2 78.6 91
92 Total liabilities and net worth 4212.7 4389.5 4609.3 4940.6 5262.8 5598.1 5907.1 6226.0 92
93 Liabilities 1531.7 1546.7 1619.7 1717.8 1785.4 1828.3 1959.2 2127.6 93
94 Securities other than shares (municipals) 1035.3 1019.0 1061.8 1128.2 1167.1 1183.6 1289.2 1432.6 94 95 Short-term 32.9 39.1 47.5 41.2 43.7 45.1 69.0 94.2 95 96 Other 1002.4 979.9 1014.3 1087.1 1123.4 1138.5 1220.2 1338.4 96
97 Loans (short-term) 9.8 10.1 8.9 10.1 9.7 8.7 8.9 9.4 97
98 Other accounts payable (trade payables) 486.7 517.6 549.0 579.5 608.6 635.9 661.1 685.6 98
99 Net worth 2681.0 2842.7 2989.6 3222.8 3477.3 3769.8 3947.8 4098.4 99
(1) Does not include employee retirement funds.* The discrepancy is the difference between net lending or borrowing derived in the capital account and the same concept derived in the financial account. The discrepancy reflects differences in source data, timing of recorded flows, and other statistical differences between the capital and financial accounts.** Partial--Does not include revaluation of tangible assets.

Draft SNA-USA July 19, 2004
9. Rest of the World Billions of dollars
1995 1996 1997 1998 1999 2000 2001 2002
CURRENT ACCOUNT:
1 Foreign income from U.S. 1137.2 1217.7 1352.2 1430.4 1586.0 1875.6 1732.5 1770.1 1 2 U.S. imports of goods and services 903.6 964.8 1056.9 1115.9 1251.8 1475.8 1401.7 1433.1 2 3 U.S. income payments to rest of world 198.2 213.7 253.7 265.8 287.1 343.7 283.8 277.7 3 4 Current taxes and trans. payments to rest of world 35.4 39.1 41.6 48.8 47.2 56.1 47.1 59.3 4
5 Foreign outlays to U.S. 1046.2 1117.3 1242.1 1243.1 1312.1 1479.0 1354.1 1306.0 5 6 U.S. exports of goods and services 812.2 868.6 955.4 955.9 991.3 1096.3 1035.1 1006.8 6 7 U.S. income receipts from rest of world 234.0 248.7 286.7 287.1 320.8 382.7 319.0 299.1 7
8 Equals net saving (current external balance) 91.0 100.4 110.2 187.4 273.9 396.6 378.5 464.1 8
CAPITAL ACCOUNT:
9 Net saving 91.0 100.4 110.2 187.4 273.9 396.6 378.5 464.1 9
10 Net capital transfers 1.1 0.6 1.0 0.7 4.9 0.8 1.1 1.3 10
11 Less acq. of nonproduced nonfinancial assets 0.2 -0.1 -0.1 -0.0 0.0 0.0 0.1 0.0 11
12 Net lending or borrowing, capital account (lines 9+10-11) 92.1 101.0 111.2 188.1 278.8 397.4 379.6 465.4 12
FINANCIAL ACCOUNT:
13 Net lending or borrowing (line 12) 92.1 101.0 111.2 188.1 278.8 397.4 379.6 465.4 13
14 Net acquisition of U.S. financial assets 419.2 521.8 597.3 393.4 708.5 942.2 640.3 680.0 14
15 Monetary gold and SDRs -0.8 0.4 -0.4 -0.1 0.0 -0.7 -0.6 -0.8 15
16 Currency and deposits 17.9 -21.1 38.6 0.7 49.2 18.5 -41.6 39.4 16 17 Currency 12.3 17.4 24.8 16.6 26.6 5.3 23.8 21.5 17 18 Transferable deposits 1.1 2.6 5.1 -1.8 13.3 -9.5 0.4 1.7 18 19 Time deposits -6.6 10.9 13.1 13.0 15.0 1.9 -20.1 12.0 19 20 Net interbank items due from U.S. banks 11.1 -52.0 -4.3 -27.1 -5.7 20.8 -45.6 4.2 20
21 Securities other than shares 246.8 375.7 242.3 173.4 162.5 228.1 321.4 428.9 21 22 Open market paper 18.6 14.4 19.9 37.6 -13.0 9.5 6.2 17.3 22 23 Treasury securities 160.5 262.7 123.7 18.7 -32.3 -87.2 3.3 139.4 23 24 Agency- and GSE-backed securities 17.6 26.8 30.3 11.1 63.4 137.3 106.1 106.7 24 25 Corporate bonds 50.1 71.8 68.4 106.2 144.4 168.4 205.8 165.6 25
26 Loans (short-term) 21.0 7.1 37.2 -19.8 -14.8 9.2 57.8 49.5 26 27 Security RPs 21.0 3.2 20.0 -18.8 8.0 11.4 59.4 39.4 27 28 Loans to U.S. corporate business 0.0 3.9 17.3 -1.0 -22.7 -2.2 -1.6 10.1 28
29 Shares and other equity 74.3 97.6 172.6 221.0 401.7 514.9 273.0 92.8 29 30 Corporate equities 16.5 11.1 67.0 42.0 112.3 193.6 121.4 53.2 30 31 Foreign direct investment in U.S. 57.8 86.5 105.6 179.0 289.4 321.3 151.6 39.6 31
32 Other accounts receivable 60.0 62.2 106.9 18.2 109.9 172.3 30.3 70.2 32 33 Trade receivables 0.7 5.5 0.9 -6.5 -5.1 -0.4 -3.1 3.1 33 34 Other (miscellaneous assets) 59.2 56.7 106.0 24.7 115.0 172.6 33.4 67.1 34
35 Net incurrence of liabilities 332.6 383.9 377.8 318.4 476.8 486.7 225.8 153.3 35
36 Currency and deposits 44.4 79.5 108.3 12.9 53.0 133.8 34.9 33.9 36 37 Official foreign exchange 6.3 -7.6 -2.9 1.5 -3.3 1.9 0.7 3.8 37 38 Net IMF position 2.5 1.3 3.6 5.1 -5.5 -2.3 3.6 6.1 38 39 U.S. private deposits 35.3 85.9 107.7 6.5 61.1 134.2 30.7 23.9 39 40 U.S. government deposits 0.3 -0.1 -0.0 -0.1 0.6 0.0 -0.1 0.1 40
41 Securities other than shares 70.6 78.3 65.1 30.6 18.2 46.9 -38.7 2.6 41 42 Commercial paper 13.5 11.3 3.7 7.8 16.3 31.7 -14.2 36.1 42 43 Bonds 57.1 67.0 61.4 22.8 1.9 15.2 -24.5 -33.5 43
44 Loans (short-term) 7.9 10.1 6.7 0.6 -5.3 10.1 -11.0 3.2 44 45 Acceptance liabilities to banks 0.3 1.8 -0.2 -5.0 -0.9 -0.7 -2.6 -0.4 45 46 U.S. government loans -0.8 -0.7 -1.6 -1.0 -4.8 -0.6 -1.1 -1.8 46 47 Bank loans n.e.c. 8.5 9.1 8.5 6.6 0.5 11.4 -7.3 5.3 47
48 Shares and other equity 165.7 176.6 164.0 245.6 340.7 267.4 230.8 157.2 48 49 Corporate equities 65.4 82.8 57.6 101.4 114.3 106.7 109.1 17.7 49 50 U.S. government equity in IBRD, etc. 1.5 1.8 1.6 1.6 1.5 1.5 1.7 1.7 50 51 U.S. direct investment abroad 98.8 91.9 104.8 142.6 224.9 159.2 120.0 137.8 51
52 Other accounts payable 44.1 39.4 33.7 28.7 70.1 28.5 9.8 -43.6 52 53 Trade payables 5.8 -1.7 5.2 -3.9 4.2 0.8 -2.2 -10.1 53 54 Other (miscellaneous liabilities) 38.3 41.1 28.5 32.6 65.9 27.6 12.0 -33.5 54
Memo: 55 Net lending, financial account (lines 14-35) 86.6 137.9 219.6 75.0 231.7 455.5 414.5 526.7 55

Draft SNA-USA July 19, 2004
9. Rest of the World Billions of dollars
1995 1996 1997 1998 1999 2000 2001 2002
OTHER CHANGES IN VOLUME ACCOUNT:
56 Total other volume changes -60.0 86.9 -56.8 -202.2 -264.0 238.9 50.9 -39.9 56 57 Other volume changes -54.5 50.0 -165.2 -89.1 -217.0 180.8 15.9 -101.3 57 58 Less statistical discrepancy (lines 12-[14-35]) * 5.6 -36.9 -108.4 113.1 47.1 -58.1 -35.0 -61.3 58
REVALUATION ACCOUNT:
59 Financial assets 170.2 57.4 185.0 261.0 111.5 -360.0 -285.0 -222.2 59
60 Securities other than shares 30.6 -33.5 -1.4 8.0 -63.3 40.6 12.7 44.1 60 61 Treasury securities 27.1 -35.6 -5.3 0.6 -72.2 32.9 10.3 35.2 61 62 Agency- and GSE-backed securities 3.5 2.1 3.9 7.4 8.9 7.7 2.5 8.9 62
63 Shares and other equity 139.6 90.9 186.4 253.0 174.8 -400.6 -297.7 -266.3 63 64 Corporate equities 135.3 111.8 213.5 255.5 248.9 -179.5 -213.1 -364.4 64 65 Foreign direct investment in U.S. 4.3 -20.9 -27.1 -2.5 -74.1 -221.1 -84.6 98.2 65
66 Liabilities 95.4 168.9 104.3 155.7 406.6 -305.1 -404.4 -270.1 66
67 Currency and deposits 11.3 13.2 -16.4 4.6 -1.2 -3.6 -3.5 -0.9 67 68 Official foreign exchange 1.5 -3.2 -4.6 3.7 -0.6 -2.8 -2.9 1.0 68 69 Net IMF position 0.2 -0.5 -0.9 0.9 -0.7 -0.8 -0.6 -1.9 69
70 Shares and other equity 84.1 155.7 120.7 151.2 407.8 -301.4 -400.9 -269.2 70 71 Corporate equities 83.9 143.3 147.3 165.8 414.4 -257.6 -349.3 -285.2 71 72 U.S. direct investment abroad 0.2 12.4 -26.6 -14.7 -6.6 -43.8 -51.6 15.9 72
73 Changes in net worth due to nominal holding gains/losses 74.7 -111.5 80.7 105.3 -295.1 -54.9 119.4 47.9 73
CHANGES IN BALANCE SHEET ACCOUNT:
74 Change in net worth (lines 12+56+73) 106.8 76.4 135.1 91.2 -280.4 581.4 549.9 473.3 74
FINANCIAL BALANCE SHEET ACCOUNT (end of period):
75 Total financial assets 3434.5 4042.1 4627.3 5199.8 5819.9 6590.6 6979.2 7375.3 75
76 Currency and deposits 472.7 451.6 490.2 490.9 540.1 558.7 517.1 556.5 76 77 Currency 169.2 186.6 211.4 228.0 254.6 259.9 283.7 305.2 77 78 Transferable deposits 24.5 27.1 32.2 30.4 43.7 34.2 34.6 36.3 78 79 Time deposits 49.6 60.6 73.6 86.6 101.6 103.5 83.3 95.3 79 80 Net interbank items due from U.S. banks 229.3 177.3 173.0 145.9 140.3 161.1 115.5 119.7 80
81 Securities other than shares 1371.3 1713.5 1954.4 2135.9 2235.1 2503.8 2837.9 3310.9 81 82 Open market paper 43.4 57.9 77.8 115.3 102.3 111.9 118.1 135.4 82 83 Treasury securities 820.2 1047.3 1165.7 1185.0 1080.4 1026.1 1039.7 1214.2 83 84 Agency- and GSE-backed securities 146.2 175.1 209.4 227.8 300.2 445.2 553.8 669.4 84 85 Corporate bonds 361.5 433.2 501.6 607.8 752.1 920.6 1126.3 1291.9 85
86 Loans (short-term) 189.7 196.9 234.1 214.3 199.5 208.7 266.4 316.0 86 87 Security RPs 67.6 70.9 90.8 72.0 79.9 91.3 150.7 190.1 87 88 Loans to U.S. corporate business 122.1 126.0 143.3 142.3 119.5 117.3 115.7 125.8 88
89 Shares and other equity 1229.6 1418.0 1777.0 2251.0 2827.5 2941.8 2917.1 2743.7 89 90 Corporate equities 549.5 672.4 952.9 1250.3 1611.5 1625.6 1533.9 1222.7 90 91 Foreign direct investment in U.S. 680.1 745.6 824.1 1000.7 1216.0 1316.2 1383.2 1521.0 91
92 Other accounts receivable 171.2 262.2 171.6 107.7 17.6 377.6 440.5 448.2 92 93 Trade receivables 52.6 58.1 59.0 52.5 47.4 47.0 43.9 47.0 93 94 Other (miscellaneous assets) 118.6 204.1 112.6 55.2 -29.7 330.6 396.7 401.2 94
95 Total liabilities and net worth 3434.5 4042.1 4627.3 5199.8 5819.9 6590.6 6979.2 7375.3 95
96 Total liabilities 2788.5 3319.7 3769.8 4251.1 5151.6 5340.9 5179.5 5102.3 96
97 Currency and deposits 484.8 577.6 669.5 687.0 738.8 869.0 900.4 933.4 97 98 Official foreign exchange 49.1 38.3 30.8 36.0 32.2 31.2 29.0 33.8 98 99 Net IMF position 14.6 15.4 18.1 24.1 18.0 14.8 17.9 22.0 99100 U.S. private deposits 418.8 521.7 618.5 624.9 686.1 820.3 851.0 874.9 100101 U.S. government deposits 2.3 2.2 2.1 2.0 2.6 2.6 2.6 2.7 101
102 Securities other than shares 355.5 433.8 492.8 523.5 541.7 588.6 549.9 552.6 102103 Commercial paper 56.2 67.5 65.1 72.9 89.2 120.9 106.7 142.8 103104 Bonds 299.4 366.3 427.7 450.6 452.5 467.7 443.2 409.8 104
105 Loans (short-term) 98.1 108.3 115.1 115.8 110.8 120.9 109.8 113.0 105106 Acceptance liabilities to banks 8.2 9.9 9.7 4.7 3.9 3.1 0.5 0.2 106107 U.S. government loans 55.4 54.7 53.2 52.4 47.8 47.2 46.0 44.3 107

Draft SNA-USA July 19, 2004
9. Rest of the World Billions of dollars
1995 1996 1997 1998 1999 2000 2001 2002
108 Bank loans n.e.c. 34.6 43.7 52.1 58.7 59.2 70.5 63.2 68.6 108
109 Shares and other equity 1689.7 2022.0 2306.7 2703.4 3451.9 3417.9 3247.8 3135.8 109110 U.S. government equity in IBRD, etc. 27.4 29.2 30.8 32.4 33.9 35.4 37.1 38.7 110111 U.S. direct investment abroad 885.5 989.8 1068.1 1196.0 1414.4 1529.7 1598.1 1751.9 111112 Corporate equities 776.8 1002.9 1207.8 1475.0 2003.7 1852.9 1612.7 1345.2 112
113 Other accounts payable 160.3 178.0 185.7 221.4 308.4 344.5 371.6 367.6 113114 Trade payables 45.3 43.6 48.8 44.9 49.1 49.9 47.8 37.6 114115 Other (miscellaneous liabilities) 115.0 134.4 136.9 176.5 259.3 294.6 323.8 330.0 115
116 Net worth (external account) 646.0 722.4 857.5 948.7 668.3 1249.7 1799.6 2273.0 116
* The discrepancy is the difference between net lending or borrowing derived in the capital account and the same concept derived in the financial account. The discrepancy reflects differences in source data, timing of recorded flows, and other statistical differences between the capital and financial accounts.

Chart 1: Measures of Household Sector Saving and Net Worth as a Percent of Disposable Income
1985 1987 1989 1991 1993 1995 1997 1999 2001 0
2
4
6
8
10Percent
Draft SNA-USANIPA
A. Net Saving
1985 1987 1989 1991 1993 1995 1997 1999 2001-30
-10
10
30
50
70
90Percent
Draft SNA-USAFFA
B. Change in net worth

Chart 2: Alternative Concepts of Net Worth for the Nonfinancial Corporate Business Sector
1985 1987 1989 1991 1993 1995 1997 1999 2001 4
5
6
7
8
9
10Trillions of dollarsA. Published in FFA (market value)
1985 1987 1989 1991 1993 1995 1997 1999 2001-7
-5
-3
-1
1
3
5Trillions of dollarsB. From Draft SNA-USA

Chart 3: Net Lending / Net Borrowing in Draft SNA-USA
1985 1988 1991 1994 1997 2000-350
-250
-150
-50
50
150
250
350Billions of dollars
Capital accountFinancial account
A. Households and Nonprofit InstitutionsServing Households
Annual
1985 1988 1991 1994 1997 2000-250
-150
-50
50
150
250Billions of dollars
Capital accountFinancial account
B. Nonfinancial Corporate Business
Annual
1985 1988 1991 1994 1997 2000-400
-300
-200
-100
0
100
200Billions of dollars
Capital accountFinancial account
C. Federal Government
Annual
1985 1988 1991 1994 1997 2000-100
-50
0
50
100Billions of dollars
Capital accountFinancial account
D. State and Local Governments
Annual
1985 1988 1991 1994 1997 2000-250
-150
-50
50
150
250Billions of dollars
Capital accountFinancial account
E. Financial Business
Annual
1985 1988 1991 1994 1997 2000-100
0
100
200
300
400
500
600Billions of dollars
Capital accountFinancial account
F. Rest Of The World
Annual

Chart 4: Net Lending / Net Borrowing for Combined Financial andNonfinancial Corporate Business
1985 1987 1989 1991 1993 1995 1997 1999 2001-250
-150
-50
50
150
250Billions of dollars
Capital accountFinancial account
Annual