INTEGRATED FLOOD DISASTER MANAGEMENT … FLOOD DISASTER MANAGEMENT AND SPATIAL INFORMATION: CASE...
8
INTEGRATED FLOOD DISASTER MANAGEMENT AND SPATIAL INFORMATION: CASE STUDIES OF NETHERLANDS AND INDIA Sisi Zlatanova a , Tarun Ghawana b , Amarjeet Kaur b , Jeroen M.M. Neuvel c a Faculty of Architecture, Jullianalaan, TU Delft, 134, 2628BL Delft, The Netherlands- [email protected] b Centre for Disaster Management Studies, Guru Gobind Singh Indraprastha University, Sector-16C, Dwarka, New Delhi, P.O. Box-110078, India - [email protected]; [email protected] c Saxion University of Applied Sciences, Risk management, Handelskade 75, 7417 DH Deventer, The Netherlands - [email protected] KEY WORDS: Floods, Spatial Information Infrastructure, GIS, Risk Management, Emergency Management ABSTRACT: Spatial Information is an integral part of flood management practices which include risk management & emergency response processes. Although risk & emergency management activities have their own characteristics, for example, related to the time scales, time pressure, activities & actors involved, it is still possible to identify at least one common challenge that constrains the ability of risk & emergency management to plan for & manage emergencies effectively and efficiently i.e. the need for better information. Considering this aspect, this paper explores flood management in Netherlands& India with an emphasis on spatial information requirements of each system. The paper examines the activities, actors & information needs related to flood management. Changing perspectives on flood management in Netherlands are studied where additional attention is being paid to the organization and preparation of flood emergency management. Role of different key actors involved in risk management is explored. Indian Flood management guidelines, by National Disaster Management Authority, are analyzed in context of their history, institutional framework, achievements and gaps. Flood Forecasting System of Central Water Commission of India is also analyzed in context of spatial dimensions. Further, information overlap between risk & emergency management from the perspectives of spatial planners & emergency responders and role of GIS based modelling / simulation is analyzed. Finally, the need for an integrated spatial information structure is explained & discussed in detail. This examination of flood management practices in the Netherlands and India with an emphasis on the required spatial information in these practices has revealed an increased recognition of the strong interdependence between risk management and emergency response processes. Consequently, the importance of an integrated spatial information infrastructure that facilitates the process of both risk and emergency management is addressed. 1. INTRODUCTION Disaster management activities have their own characteristics – e.g., related to the time scales, time pressure, activities and actors involved – and the stakeholders involved in different activities have their own system requirements, it is still possible to identify at least one common challenge that constrains the ability of risk and emergency management to plan for and manage emergencies effectively and efficiently: the need for better information (Cutter et al. 2003; Parker et al. 2007; Zlatanova et al. 2007; Fiedrich, and Zlatanova, 2013; Kaviani et al., 2014). Geospatial Information Systems are increasingly seen as indispensable in supporting disaster management activities (Brazier and Greenwood 1998; Contini et al. 2000; Greene 2002; Craciunescu et al. 2006; Köhler and Wächter 2006; Parker et al. 2007; Pattusamy et al. 2014). The paper explores flood management in Netherlands and India with an emphasis on the role of spatial information. It tries to understand the components of flood management system in the both countries. The paper examines the activities, stakeholders & information needs related to flood management. The case study in the Netherlands is based on previous research, in which the spatial information requirements were explored through a literature study, interviews and workshops (Neuvel 2009, Chapter 7). 2. RISK & EMERGENCY MANAGEMENT AND GIS Normally, risk and emergency management activities are divided into pre-event activities consisting of mitigation and preparation activities and post-event activities including response and recovery activities. However, it has been suggested to merge preparation and response activities since many GIS systems developed in the preparation phase are utilised in the response phase (Cova 2005; Zlatanova, and Fabbri, 2009). In case of preparation phase, modelling and simulation exercises are very important which can help towards prevention, adaptation and mitigation processes. In GIS arena, water resources management applications have most efficiently harnessed its analytical capacities to create bio-physical models and simulation runs, for eg. Hydrological Models and Hydraulic Models (MIKE11 and HEC-RAS). These systems in an integrated form can predict flood behaviour taking inputs of various terrain, landcover / landuse and hydro-meteorological datasets to. In a manner, they work as Spatial Decision Support Systems (SDSS). In response phase, this information along with infrastructural data in spatial and non-spatial form can be used to enhance the efficiency of response. Optimization of routes by response teams based on the real time data of the affected areas could easily save time and resources while responding. Satellite imageries of the disaster event can provide the information about the extent of flooded areas. Using Depth or volume The International Archives of the Photogrammetry, Remote Sensing and Spatial Information Sciences, Volume XL-8, 2014 ISPRS Technical Commission VIII Symposium, 09 – 12 December 2014, Hyderabad, India This contribution has been peer-reviewed. doi:10.5194/isprsarchives-XL-8-147-2014 147
Transcript of INTEGRATED FLOOD DISASTER MANAGEMENT … FLOOD DISASTER MANAGEMENT AND SPATIAL INFORMATION: CASE...
INTEGRATED FLOOD DISASTER MANAGEMENT AND SPATIAL INFORMATION:
CASE STUDIES OF NETHERLANDS AND INDIA
Sisi Zlatanovaa, Tarun Ghawanab, Amarjeet Kaurb, Jeroen M.M. Neuvelc
aFaculty of Architecture, Jullianalaan, TU Delft, 134, 2628BL Delft, The Netherlands- [email protected]
bCentre for Disaster Management Studies, Guru Gobind Singh Indraprastha University, Sector-16C, Dwarka, New Delhi,
P.O. Box-110078, India - [email protected]; [email protected] cSaxion University of Applied Sciences, Risk management, Handelskade 75, 7417 DH Deventer, The Netherlands -
KEY WORDS: Floods, Spatial Information Infrastructure, GIS, Risk Management, Emergency Management
ABSTRACT:
Spatial Information is an integral part of flood management practices which include risk management & emergency response
processes. Although risk & emergency management activities have their own characteristics, for example, related to the time scales,
time pressure, activities & actors involved, it is still possible to identify at least one common challenge that constrains the ability of
risk & emergency management to plan for & manage emergencies effectively and efficiently i.e. the need for better information.
Considering this aspect, this paper explores flood management in Netherlands& India with an emphasis on spatial information
requirements of each system. The paper examines the activities, actors & information needs related to flood management. Changing
perspectives on flood management in Netherlands are studied where additional attention is being paid to the organization and
preparation of flood emergency management. Role of different key actors involved in risk management is explored. Indian Flood
management guidelines, by National Disaster Management Authority, are analyzed in context of their history, institutional
framework, achievements and gaps. Flood Forecasting System of Central Water Commission of India is also analyzed in context of
spatial dimensions. Further, information overlap between risk & emergency management from the perspectives of spatial planners &
emergency responders and role of GIS based modelling / simulation is analyzed. Finally, the need for an integrated spatial
information structure is explained & discussed in detail. This examination of flood management practices in the Netherlands and
India with an emphasis on the required spatial information in these practices has revealed an increased recognition of the strong
interdependence between risk management and emergency response processes. Consequently, the importance of an integrated spatial
information infrastructure that facilitates the process of both risk and emergency management is addressed.
1. INTRODUCTION
Disaster management activities have their own characteristics –
e.g., related to the time scales, time pressure, activities and
actors involved – and the stakeholders involved in different
activities have their own system requirements, it is still possible
to identify at least one common challenge that constrains the
ability of risk and emergency management to plan for and
manage emergencies effectively and efficiently: the need for
better information (Cutter et al. 2003; Parker et al. 2007;
Zlatanova et al. 2007; Fiedrich, and Zlatanova, 2013; Kaviani
et al., 2014). Geospatial Information Systems are increasingly
seen as indispensable in supporting disaster management
activities (Brazier and Greenwood 1998; Contini et al. 2000;
Greene 2002; Craciunescu et al. 2006; Köhler and Wächter
2006; Parker et al. 2007; Pattusamy et al. 2014).
The paper explores flood management in Netherlands and India
with an emphasis on the role of spatial information. It tries to
understand the components of flood management system in the
both countries. The paper examines the activities, stakeholders
& information needs related to flood management. The case
study in the Netherlands is based on previous research, in
which the spatial information requirements were explored
through a literature study, interviews and workshops (Neuvel
2009, Chapter 7).
2. RISK & EMERGENCY MANAGEMENT AND GIS
Normally, risk and emergency management activities are
divided into pre-event activities consisting of mitigation and
preparation activities and post-event activities including
response and recovery activities. However, it has been
suggested to merge preparation and response activities since
many GIS systems developed in the preparation phase are
utilised in the response phase (Cova 2005; Zlatanova, and
Fabbri, 2009).
In case of preparation phase, modelling and simulation
exercises are very important which can help towards
prevention, adaptation and mitigation processes. In GIS arena,
water resources management applications have most efficiently
harnessed its analytical capacities to create bio-physical models
and simulation runs, for eg. Hydrological Models and
Hydraulic Models (MIKE11 and HEC-RAS). These systems in
an integrated form can predict flood behaviour taking inputs of
various terrain, landcover / landuse and hydro-meteorological
datasets to. In a manner, they work as Spatial Decision Support
Systems (SDSS).
In response phase, this information along with infrastructural
data in spatial and non-spatial form can be used to enhance the
efficiency of response. Optimization of routes by response
teams based on the real time data of the affected areas could
easily save time and resources while responding. Satellite
imageries of the disaster event can provide the information
about the extent of flooded areas. Using Depth or volume
The International Archives of the Photogrammetry, Remote Sensing and Spatial Information Sciences, Volume XL-8, 2014ISPRS Technical Commission VIII Symposium, 09 – 12 December 2014, Hyderabad, India
This contribution has been peer-reviewed. doi:10.5194/isprsarchives-XL-8-147-2014
147
information from the previously run simulation exercises,
responsible agencies can find out the possible depth or volume
of water in the flood area. They can also find out the proneness
of further areas to be affected by the flood water reaching in
those areas.
3. FLOOD MANAGEMENT IN THE NETHERLANDS –
CHANGING PERSPECTIVES
Dutch flood management strategies are traditionally aimed at
reducing the probability of flooding through more than 3,600
km of primary dikes that directly protect the hinterland from
flooding by the sea or major rivers (Ministerie van
VerkeerenWaterstaat and InspectieVerkeerenWaterstaat 2006).
Nevertheless, this flood risk management strategy has been
changing since the 1990s. After the flooding of unprotected
areas in the river foreland of the Meuse in 1993 and 1995 and a
near flooding event of the dike ring areas along the Meuse and
Rhine in 1995, flood risk policies were changed and river dikes
were raised at various places. This action was supported by a
plan which allowed for the largest rivers to be given greater
freedom to spill out across some parts of their original
floodplains. The plan, which became known as the ‘Room for
the River’ Policy, entailed the removal of obstacles from the
floodplains, dike relocation, and the creation of retention areas,
bypasses and secondary channels to circumvent urban
bottlenecks.
Dutch government, in particular, Ministry of Transport, Public
Works and Water Management are considering the need for
additional mitigation measures to reduce the consequences of
flooding (Ministerie van VerkeerenWaterstaat 2007). Land use
planning is also being seen an important instrument.
In the last decade, various projects were also funded for
developing early warning systems (estimating also
measurements from water level gauges) and information
systems to support the communication between actors involved
in emergency response. These improvement efforts also
included improving cooperation with neighbouring countries
(STOWA 2008; Minister van Infrastructure en Milieu
Interprovincial Overleg IPO & Unie van Waterschappen 2012).
3.1 Flood Risk Management in the Netherlands
Risk management activities and processes can be grouped into
four clusters: 1) identification, 2) risk assessment or evaluation,
3) choice and implementation of risk reduction measures and
instruments, 4) monitoring and maintenance of the acceptable
risks (Bottelberghs 2000; Schanze 2006). Table 1 gives an
overview of key actors in Dutch flood risk management
practices.
Table 1: Key Stakeholders Involved in Risk Management
Activities Key Staekholders
Identification of flood
risks
Ministry of Infrastructure and the Environment, provinces, water boards
Evaluation and
assessment of flood
risks
Ministry of Infrastructure and the
Environment, provinces, municipalities,
water boards, emergency services, non-governmental stakeholders
Choice and
implementation of risk
reduction measures
and instruments
Ministry of Infrastructure and the
Environment, provinces, municipalities,
water boards, emergency services, non-governmental stakeholders
Monitoring and
maintenance of the
acceptable risks
Ministry of Infrastructure and the
Environment, water boards.
As expected, water authorities play an important role in risk
management. The Dutch Ministry of Infrastructure and the
Environment takes a leading role in the management of flood
risks from the sea and major Dutch rivers and lakes. Both
regional water boards and the provinces play a prominent role
in the flood risk management of other regional rivers, lakes and
canals while the regional board and the Rijkswaterstaat
(Ministry of Infrastructure and the Environment) have an
important function in the monitoring and management of Dutch
dikes. Land use planning authorities and non-governmental
stakeholders such as inhabitants are already involved in the
implementation of ‘room-for–the-river’ measures. These actors,
however, still have a limited role in the evaluation and
implementation of flood mitigation measures. As mentioned
before, perspectives on flood-risk management are changing,
though. Consequently, it is expected that land use authorities,
including the municipality, the province and the spatial
planning ministry will be more instrumental in evaluating and
implementing flood risks and flood risk management strategies.
Since it is strived for that emergency response issues, such as
possibilities for evacuation, will also play a more prominent
role in future flood risk management practices, it is expected
that emergency services will play a more prominent role in risk
management practices as well. Insurance companies hardly
play a role in flood risk management practices since the
Netherlands does not have a system of flood insurance.
3.1.1 Informational Requirements
The investigation of information needs of spatial planners
resulted in a wide variety of information needs related to flood
risks. Based on the literature on risk and emergency
management, these informational needs have been divided into
four categories: hazards, exposure, capacities and processes.
Within these categories, static information and simulated
information could be distinguished as summarised in Table 2.
Static information has its time orientation in the present
whereas the time focus of the simulated information is in the
future. Most of these informational requirements are spatial in
nature (Observed / Simulated). It could be on bio-physical or
socio-economic aspects.
Table 2: Examples of Information Needed for Flood Mitigation
in Landuse Planning
Examples of information needs
Ha
zard
s
Static information: Flood prone areas; Nature of the flood, e.g. flash flood, salt or fresh water.
Simulated information: Estimates of actual flood probabilities and expected effects and consequences such as potential water
inundation extent, depth and velocity.
Ex
po
sure
Static information: Information about citizens in the area
exposed such as total number of inhabitants or people under
restrictions such as prisoners; Information about infrastructure in the way of probable flood path, Vulnerable objects such as
schools, drinking-water supply or installations with hazardous
substances; Buildings characteristics such as high/low-rise
building (shelter), building material (strength).
Simulated information: Damage and number of victims or
buildings for a particular flooding scenario.
Resi
sta
nce
ca
pa
city
Static information: Probability of failure of dikes and other
hydraulic structures such as sluices.
Simulated information: Simulation of dike breaches or failure of hydraulic structures.
The International Archives of the Photogrammetry, Remote Sensing and Spatial Information Sciences, Volume XL-8, 2014ISPRS Technical Commission VIII Symposium, 09 – 12 December 2014, Hyderabad, India
This contribution has been peer-reviewed. doi:10.5194/isprsarchives-XL-8-147-2014
148
Ad
ap
tive
ca
pa
city
Static information: The extent of flood proofing measures or
the flood compatibility of the use of the ground floor of
buildings.
Simulated information: The effect of adaptive measures on
potential flood damage and potential number of victims.
Co
pin
g
ca
pa
city
Static information: Capacity of people such as the ability of people to get to a safe location; Possibilities for shelter;
Infrastructure information such as road capacities.
Simulated information: Possibilities for evacuation, shelter and capacity of emergency services and hospitals.
Recov
ery
ca
pa
city
Static information: The type and extent of insurance, recovery plans
Simulated information: Potential damage and recovery capacity
Process
es
Static information: -
Simulated information: Climate change, urbanization,
economic developments.
3.2 Flood Emergency Management in the Netherlands
In addition to examining flood risk management characteristics
and informational requirements, a case study was carried out to
study the performed activities, actors and information needs in
flood emergency management. The results of this study are
summarized below.
3.2.1 Stakeholders and Activities
Both emergency training and response activities are focussed
on emergency response and its preparation. On the operational
level, the activities carried out in emergency management can
be divided into four clusters: 1) containment and control of the
flood and its effects, 2) medical assistance, 3) public order and
traffic management, 4) taking care of the population (Ministerie
van BinnenlandseZaken 2003; Diehl and Van der Heide 2005).
Table 3 gives an overview of the key stakeholders involved in
these activities.
Table 3: Operational Flood Emergency Activities and Key
Actors Involved (Diehl & Van der Heide 2005)
Activities Key operational stakeholders
Containment and
control of the flood
and its effects
Regional fire department; Rijkswaterstaat; Royal Dutch Water Life Saving Association
(KNBRD), Royal Netherlands Sea Rescue
Institution (KNRM). Military National Reserve.
Medical assistance (Para)medical services (GHOR); Red Cross
(SIGMA teams)
Public order and
traffic management
Police department
Taking care of the
population
Municipality
3.3 Informational Requirements of Risk and Emergency
Management
To compare information needs in flood risk and emergency
management, the risk components were used to structure the
information needs within flood emergency management. The
informational requirements of the fire department are worked
out in more detail.
The interviewed experts stressed that it is very important to
have information about the actual situation and actual
consequences of the event. They often made a distinction
between information that exists prior to the disaster and
information that is or should be obtained during the disaster.
Based on this time aspect, the information for emergency
response was divided into three categories. In addition to the
static and simulated information as distinguished in flood risk
management, a third category was added: dynamic information.
Information created or obtained during the disaster is denoted
as dynamic information. Table 4 gives an overview of the
information needs for the processes which fire department is
responsible for during a flood. A more complete list can be
found in Diehl et al. (2006) and Snoeren (2006). Spatial
information related to the physical and social processes that can
affect hazards and vulnerability were not mentioned as
information needs//needed and therefore not mentioned in the
overview table.
Table 4: Information needs for the fire brigade in case of floods
Examples of information needs H
aza
rds
Static information: Flood prone areas. Simulated information: Estimates of actual flood probabilities
and expected effects and consequences such as potential water
depths and velocity. Dynamic information: Incident information such as scale of the
flood and water depths; Meteorological information such as
wind direction and speed, precipitation (rain/snow).
Ex
po
sure
Static information: Information about citizens in the area exposed such as total number of inhabitants; Vulnerable
objects such as drinking-water supply; Buildings
characteristics such as high/low-rise building (shelter), building material (strength), cables and pipes.
Simulated information: Damage and number of victims for a
particular flooding scenario. Dynamic information: Victims: trapped people, people in need;
Damage: property damage, unstable buildings and infrastructure.
Res
ista
nce
cap
aci
ty
Static information: Probability of failure of dikes and other
hydraulic structures such as sluices.
Simulated information: Simulation of dike breaches or failure of hydraulic structures.
Dynamic information: Actual probability of the failure of dikes
and other hydraulic structures.
Ad
ap
tiv
e
cap
aci
ty
Static information: The extent of flood proofing measures or
the flood compatibility of the use of the ground floor of buildings.
Simulated information: The effect of adaptive measures on
potential flood damage and potential number of victims. Dynamic information: The actual extent of adaptive measures
taken in an area through temporal flood proofing, sand bags, or
preventive evacuation of people
Co
pin
g c
ap
aci
ty
Static information: Capacity of emergency units such as hospitals; Capacity of people to get to a safe location;
Possibilities for shelter; Infrastructure and Borders
information; Recourses such as water sources/water collection or sandbags; Information for context and orientation such as
accessibility maps for buildings Simulated information:
Capacity of emergency units, people and resources Dynamic information: Actual capacity of emergency units,
possibilities for shelter; Accessibility: in- and out-routes, traffic
direction, blocked or possibly blocked roads.
Rec
o
ver
y
cap
a
city
Static information: - Simulated information: -
Dynamic information: Actual damage
aTo train response activities, the dynamic information is
often simulated.
The International Archives of the Photogrammetry, Remote Sensing and Spatial Information Sciences, Volume XL-8, 2014ISPRS Technical Commission VIII Symposium, 09 – 12 December 2014, Hyderabad, India
This contribution has been peer-reviewed. doi:10.5194/isprsarchives-XL-8-147-2014
149
4. INDIAN FLOOD MANAGEMENT
4.1 History
After the Policy Statement of 1954 and Supplementary
Statement of 1956, High Level Committee on Flood Control-
1957, Ministers’ Committee on Floods-1964 was the important
initiatives taken by the GOI. The GOI set up the National Flood
Commission / Rashtriya Barh Ayog (RBA) in 1976 to study in
depth the approach towards programmes of flood control
measures. The RBA, which submitted its report in 1980, looked
into the problem of floods in the whole of the country in a most
comprehensive manner taking into account various past
committees recommendations and the status of implementation
thereof. Implementation of 207 recommendations from the
report has been reviewed from time to time. The latest one was
by the Experts’ Committee under the Chairmanship of
Shri. R. Rangachari former Member, CWC in 2003 which
noted the slow implementation and identified 40
recommendations, which need to be followed (NDMA
Guidelines, 2008).
4.2 Institutional Framework
Being constitutional provisions, state has the primary
responsibility for Flood Management (NDMA Guidelines,
2008; Planning Commission). Laws have been enacted by
many states having provisions to deal with matters related to
flood control works. Central government initiative includes the
enactment of the National Disaster Management Act,
December 2005 and setting up of the NDMA. The National
Executive Committee (NEC) with the Secretary of GOI of the
ministry or department having administrative control of the
subject of the DM as the Chairman and Secretaries of other
ministries concerned and the Chief of the Integrated Defence
Staff to the Chairman Chiefs of the Staff Committee (CISC) as
Members, will assist the NDMA (NDMA Guidelines, 2008).
Other Central Government mechanisms are Brahmaputra
Board, Farakka Barrage Project Authority (Flood
Management).
State Disaster Management Authorities (SDMAs) and State
Executive Committees (SECs) need to be set up by state
governments to perform similar functions at the state level. It
has been proposed to set up River Basin Organisations to deal
with the management of water resources at river basin level. A
National Flood Management Institute (NFMI) is also proposed
to set up at an appropriate location in one of the flood prone
states (NDMA Guidelines, 2008).
NDMA has dedicated Flood Management guidelines. The aim
of the Guidelines is to minimize vulnerability to floods and
consequent loss of lives, livelihood systems, property and
damage to infrastructure and public utilities.
Guidelines propose the following activities:
Phase I
These activities include identification and marking of flood
prone areas on maps, preparation of close contour and flood
vulnerability maps, formulating plans for expansion and
modernisation of flood forecasting and warning systems,
identification of priority flood protection and drainage
improvement works, identification of reservoirs for review and
modification of operation manuals and rule curves and
undertaking special studies on problems of river erosion.
Phase II
These include implementation of the schemes for expansion
and modernization of the flood forecasting and warning
network, execution of flood protection and drainage
improvement schemes, modification and adoption of revised
reservoir operation manuals, for real-time collection of hydro-
meteorological data on rivers in Nepal, Bhutan and China.
Phase III
Implementation of activities, which include construction of
dams and catchment area treatment (CAT) works in India as
well as neighboring countries. Recurring Activities include
inspection of dams, embankments and other structural
measures, execution of restoration and strengthening works and
expansion and modernization of flood forecasting and warning
systems, are to be taken on a regular basis.
The Guidelines also mention the following Indian
achievements in respect of Flood management:
Structural Measures
Since 1954, 33,928 km of new embankments and 38,809 km of
drainage channels have been constructed in the country. In
addition, 2,450 town protection works have been completed
and 4,721 villages have been raised above flood levels. Barring
occasional breaches in embankments, these works have given
reasonable protection to an area of about 18.22 million
hectares.
Non-structural Measures
The MOWR and CWC had circulated in 1975, the draft bill for
flood plain zoning regulations to the state governments for
enactment and enforcement. The CWC has established a flood
forecasting system comprising 175 stations on all major
interstate rivers and is implementing the scheme for its
modernisation and expansion.
Some identified gaps by the guidelines are:
Non-availability of close contour maps and digital
elevation models of flood prone areas as impediments
to make reliable forecasts.
Flood forecasting and warning (FF and W) network
of the CWC, though developed on scientific basis,
does not cover all the flood prone rivers and rivulets.
Very few river basins have been covered with
automatic sensors for observations and telemetry
system for communication of data.
Flood plain zoning regulations have not been enacted
and enforced by most of the states,
There is also a lack of inflow forecasting systems for
the reservoirs.
4.3 Flood Forecasting System of Central Water
Commission
The work of flood forecasting and warning in India is entrusted
with the Central Water Commission (CWC). Flood Forecasting
and flood warning in India was commenced in a small way in
the year 1958 with the establishment of a unit in the Central
Water Commission (CWC), New Delhi, for flood forecasting
for the river Yamuna at Delhi. Presently, there are 878
Hydrological and Hydro-meteorological sites being operated by
CWC across the country covering 20 river basins for gauge,
discharge, sediment & water quality observations. The
formulation of a forecast requires effective means of real time
data communication network from the forecasting stations
The International Archives of the Photogrammetry, Remote Sensing and Spatial Information Sciences, Volume XL-8, 2014ISPRS Technical Commission VIII Symposium, 09 – 12 December 2014, Hyderabad, India
This contribution has been peer-reviewed. doi:10.5194/isprsarchives-XL-8-147-2014
150
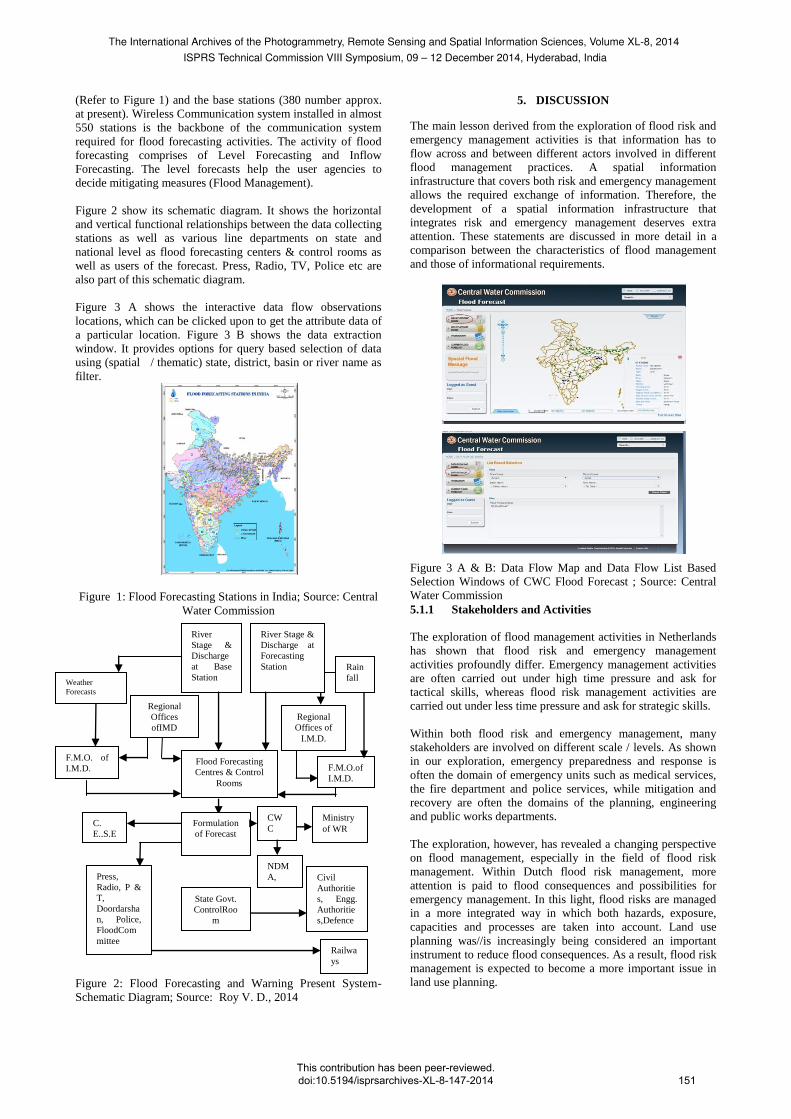
(Refer to Figure 1) and the base stations (380 number approx.
at present). Wireless Communication system installed in almost
550 stations is the backbone of the communication system
required for flood forecasting activities. The activity of flood
forecasting comprises of Level Forecasting and Inflow
Forecasting. The level forecasts help the user agencies to
decide mitigating measures (Flood Management).
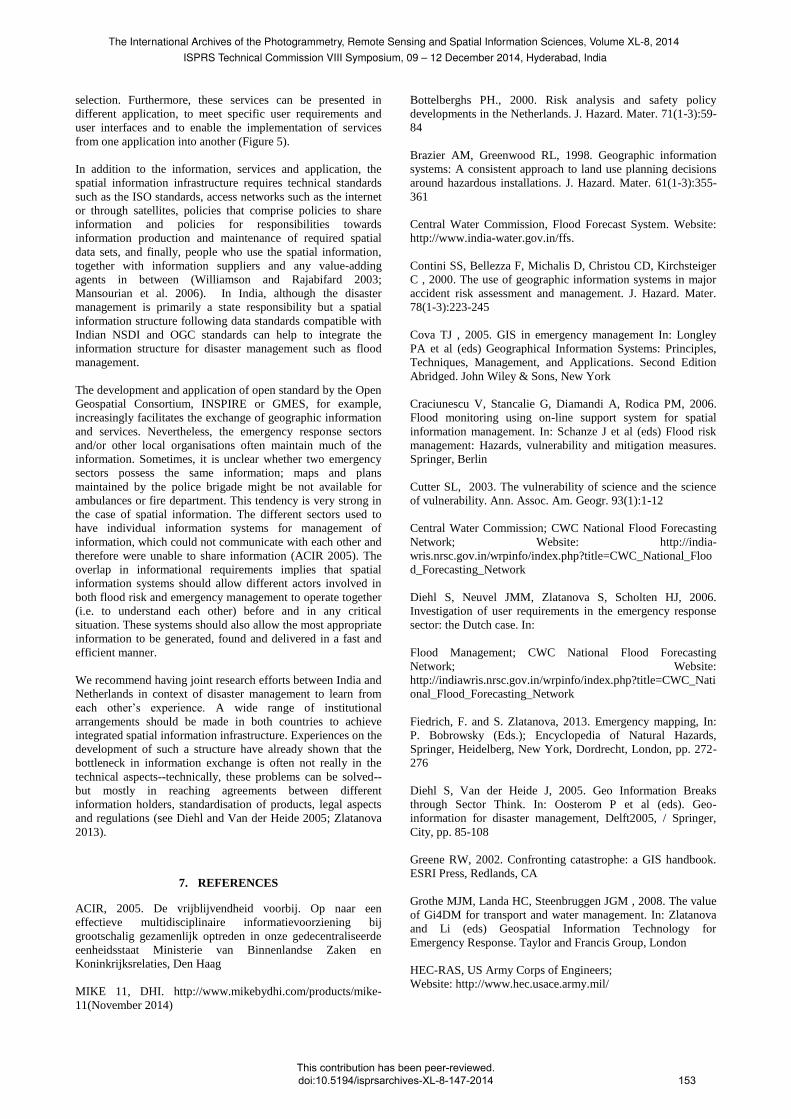
Figure 2 show its schematic diagram. It shows the horizontal
and vertical functional relationships between the data collecting
stations as well as various line departments on state and
national level as flood forecasting centers & control rooms as
well as users of the forecast. Press, Radio, TV, Police etc are
also part of this schematic diagram.
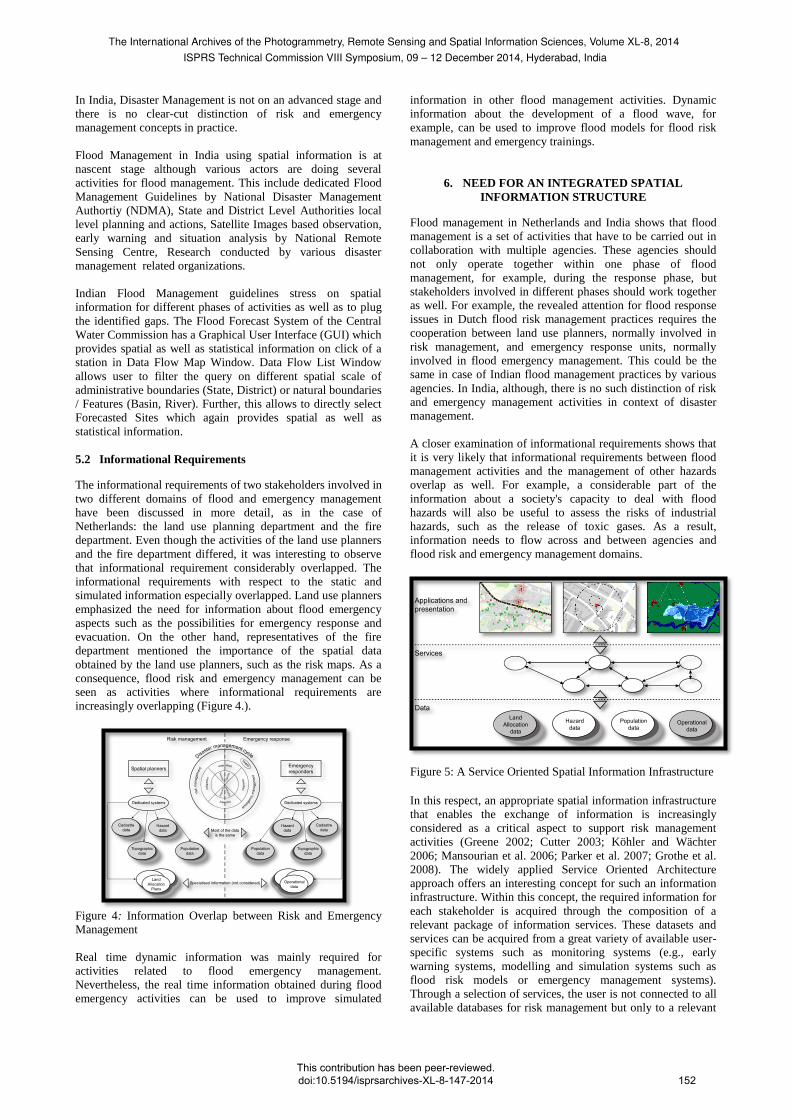
Figure 3 A shows the interactive data flow observations
locations, which can be clicked upon to get the attribute data of
a particular location. Figure 3 B shows the data extraction
window. It provides options for query based selection of data
using (spatial / thematic) state, district, basin or river name as
filter.
Figure 1: Flood Forecasting Stations in India; Source: Central
Water Commission
Figure 2: Flood Forecasting and Warning Present System-
Schematic Diagram; Source: Roy V. D., 2014
5. DISCUSSION
The main lesson derived from the exploration of flood risk and
emergency management activities is that information has to
flow across and between different actors involved in different
flood management practices. A spatial information
infrastructure that covers both risk and emergency management
allows the required exchange of information. Therefore, the
development of a spatial information infrastructure that
integrates risk and emergency management deserves extra
attention. These statements are discussed in more detail in a
comparison between the characteristics of flood management
and those of informational requirements.
Figure 3 A & B: Data Flow Map and Data Flow List Based
Selection Windows of CWC Flood Forecast ; Source: Central
Water Commission 5.1.1 Stakeholders and Activities
The exploration of flood management activities in Netherlands
has shown that flood risk and emergency management
activities profoundly differ. Emergency management activities
are often carried out under high time pressure and ask for
tactical skills, whereas flood risk management activities are
carried out under less time pressure and ask for strategic skills.
Within both flood risk and emergency management, many
stakeholders are involved on different scale / levels. As shown
in our exploration, emergency preparedness and response is
often the domain of emergency units such as medical services,
the fire department and police services, while mitigation and
recovery are often the domains of the planning, engineering
and public works departments.
The exploration, however, has revealed a changing perspective
on flood management, especially in the field of flood risk
management. Within Dutch flood risk management, more
attention is paid to flood consequences and possibilities for
emergency management. In this light, flood risks are managed
in a more integrated way in which both hazards, exposure,
capacities and processes are taken into account. Land use
planning was//is increasingly being considered an important
instrument to reduce flood consequences. As a result, flood risk
management is expected to become a more important issue in
land use planning.
Railwa
ys
NDM
A,
NIDM
Press,
Radio, P &
T,
Doordarsha
n, Police,
FloodCom
mittee
Civil
Authoritie
s, Engg.
Authoritie
s,Defence
Industries,
State Govt.
ControlRoo
m
Formulation
of Forecast
C.
E.,S.E
.
CW
C
HQ
Ministry
of WR
F.M.O. of
I.M.D. Flood Forecasting
Centres & Control
Rooms
F.M.O.of
I.M.D.
Weather
Forecasts
River
Stage &
Discharge
at Base
Station
River Stage &
Discharge at
Forecasting
Station
Regional
Offices
ofIMD
Rain
fall
Regional
Offices of
I.M.D.
The International Archives of the Photogrammetry, Remote Sensing and Spatial Information Sciences, Volume XL-8, 2014ISPRS Technical Commission VIII Symposium, 09 – 12 December 2014, Hyderabad, India
This contribution has been peer-reviewed. doi:10.5194/isprsarchives-XL-8-147-2014
151
In India, Disaster Management is not on an advanced stage and
there is no clear-cut distinction of risk and emergency
management concepts in practice.
Flood Management in India using spatial information is at
nascent stage although various actors are doing several
activities for flood management. This include dedicated Flood
Management Guidelines by National Disaster Management
Authortiy (NDMA), State and District Level Authorities local
level planning and actions, Satellite Images based observation,
early warning and situation analysis by National Remote
Sensing Centre, Research conducted by various disaster
management related organizations.
Indian Flood Management guidelines stress on spatial
information for different phases of activities as well as to plug
the identified gaps. The Flood Forecast System of the Central
Water Commission has a Graphical User Interface (GUI) which
provides spatial as well as statistical information on click of a
station in Data Flow Map Window. Data Flow List Window
allows user to filter the query on different spatial scale of
administrative boundaries (State, District) or natural boundaries
/ Features (Basin, River). Further, this allows to directly select
Forecasted Sites which again provides spatial as well as
statistical information.
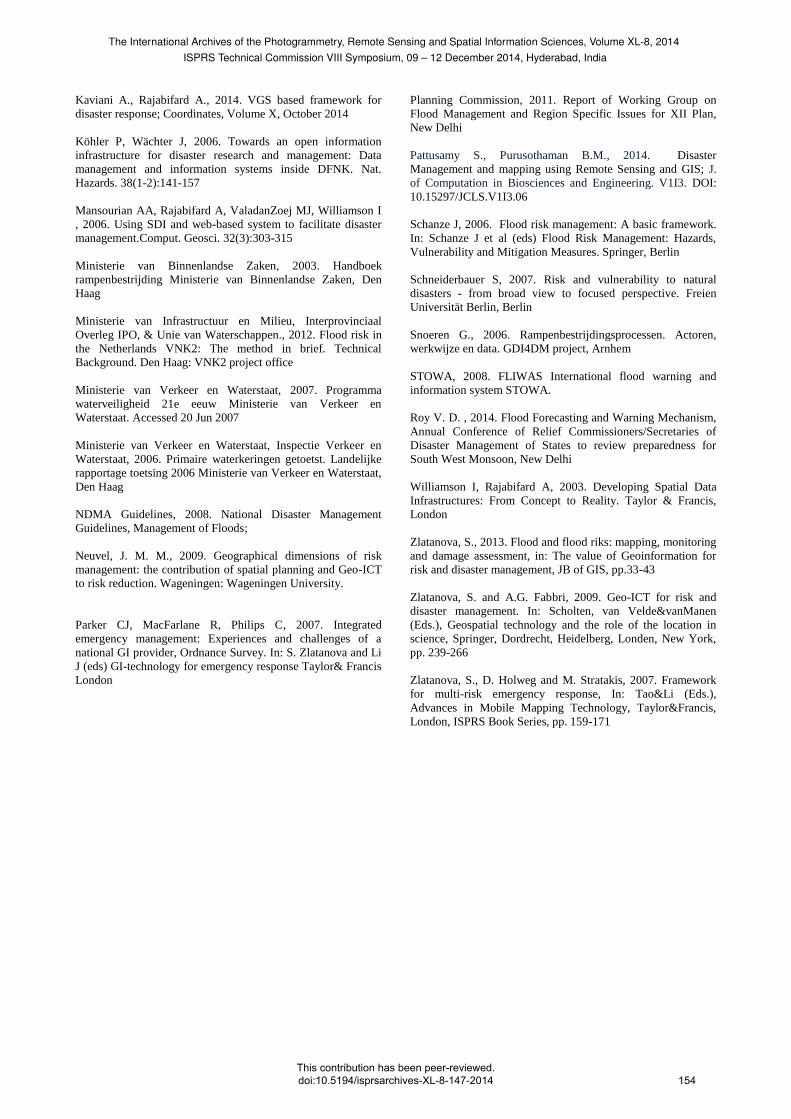
5.2 Informational Requirements
The informational requirements of two stakeholders involved in
two different domains of flood and emergency management
have been discussed in more detail, as in the case of
Netherlands: the land use planning department and the fire
department. Even though the activities of the land use planners
and the fire department differed, it was interesting to observe
that informational requirement considerably overlapped. The
informational requirements with respect to the static and
simulated information especially overlapped. Land use planners
emphasized the need for information about flood emergency
aspects such as the possibilities for emergency response and
evacuation. On the other hand, representatives of the fire
department mentioned the importance of the spatial data
obtained by the land use planners, such as the risk maps. As a
consequence, flood risk and emergency management can be
seen as activities where informational requirements are
increasingly overlapping (Figure 4.).
Figure 4: Information Overlap between Risk and Emergency
Management
Real time dynamic information was mainly required for
activities related to flood emergency management.
Nevertheless, the real time information obtained during flood
emergency activities can be used to improve simulated
information in other flood management activities. Dynamic
information about the development of a flood wave, for
example, can be used to improve flood models for flood risk
management and emergency trainings.
6. NEED FOR AN INTEGRATED SPATIAL
INFORMATION STRUCTURE
Flood management in Netherlands and India shows that flood
management is a set of activities that have to be carried out in
collaboration with multiple agencies. These agencies should
not only operate together within one phase of flood
management, for example, during the response phase, but
stakeholders involved in different phases should work together
as well. For example, the revealed attention for flood response
issues in Dutch flood risk management practices requires the
cooperation between land use planners, normally involved in
risk management, and emergency response units, normally
involved in flood emergency management. This could be the
same in case of Indian flood management practices by various
agencies. In India, although, there is no such distinction of risk
and emergency management activities in context of disaster
management.
A closer examination of informational requirements shows that
it is very likely that informational requirements between flood
management activities and the management of other hazards
overlap as well. For example, a considerable part of the
information about a society's capacity to deal with flood
hazards will also be useful to assess the risks of industrial
hazards, such as the release of toxic gases. As a result,
information needs to flow across and between agencies and
flood risk and emergency management domains.
Figure 5: A Service Oriented Spatial Information Infrastructure
In this respect, an appropriate spatial information infrastructure
that enables the exchange of information is increasingly
considered as a critical aspect to support risk management
activities (Greene 2002; Cutter 2003; Köhler and Wächter
2006; Mansourian et al. 2006; Parker et al. 2007; Grothe et al.
2008). The widely applied Service Oriented Architecture
approach offers an interesting concept for such an information
infrastructure. Within this concept, the required information for
each stakeholder is acquired through the composition of a
relevant package of information services. These datasets and
services can be acquired from a great variety of available user-
specific systems such as monitoring systems (e.g., early
warning systems, modelling and simulation systems such as
flood risk models or emergency management systems).
Through a selection of services, the user is not connected to all
available databases for risk management but only to a relevant
The International Archives of the Photogrammetry, Remote Sensing and Spatial Information Sciences, Volume XL-8, 2014ISPRS Technical Commission VIII Symposium, 09 – 12 December 2014, Hyderabad, India
This contribution has been peer-reviewed. doi:10.5194/isprsarchives-XL-8-147-2014
152
selection. Furthermore, these services can be presented in
different application, to meet specific user requirements and
user interfaces and to enable the implementation of services
from one application into another (Figure 5).
In addition to the information, services and application, the
spatial information infrastructure requires technical standards
such as the ISO standards, access networks such as the internet
or through satellites, policies that comprise policies to share
information and policies for responsibilities towards
information production and maintenance of required spatial
data sets, and finally, people who use the spatial information,
together with information suppliers and any value-adding
agents in between (Williamson and Rajabifard 2003;
Mansourian et al. 2006). In India, although the disaster
management is primarily a state responsibility but a spatial
information structure following data standards compatible with
Indian NSDI and OGC standards can help to integrate the
information structure for disaster management such as flood
management.
The development and application of open standard by the Open
Geospatial Consortium, INSPIRE or GMES, for example,
increasingly facilitates the exchange of geographic information
and services. Nevertheless, the emergency response sectors
and/or other local organisations often maintain much of the
information. Sometimes, it is unclear whether two emergency
sectors possess the same information; maps and plans
maintained by the police brigade might be not available for
ambulances or fire department. This tendency is very strong in
the case of spatial information. The different sectors used to
have individual information systems for management of
information, which could not communicate with each other and
therefore were unable to share information (ACIR 2005). The
overlap in informational requirements implies that spatial
information systems should allow different actors involved in
both flood risk and emergency management to operate together
(i.e. to understand each other) before and in any critical
situation. These systems should also allow the most appropriate
information to be generated, found and delivered in a fast and
efficient manner.
We recommend having joint research efforts between India and
Netherlands in context of disaster management to learn from
each other’s experience. A wide range of institutional
arrangements should be made in both countries to achieve
integrated spatial information infrastructure. Experiences on the
development of such a structure have already shown that the
bottleneck in information exchange is often not really in the
technical aspects--technically, these problems can be solved--
but mostly in reaching agreements between different
information holders, standardisation of products, legal aspects
and regulations (see Diehl and Van der Heide 2005; Zlatanova
2013).
7. REFERENCES
ACIR, 2005. De vrijblijvendheid voorbij. Op naar een
effectieve multidisciplinaire informatievoorziening bij
grootschalig gezamenlijk optreden in onze gedecentraliseerde
eenheidsstaat Ministerie van Binnenlandse Zaken en
Koninkrijksrelaties, Den Haag
MIKE 11, DHI. http://www.mikebydhi.com/products/mike-
11(November 2014)
Bottelberghs PH., 2000. Risk analysis and safety policy
developments in the Netherlands. J. Hazard. Mater. 71(1-3):59-
84
Brazier AM, Greenwood RL, 1998. Geographic information
systems: A consistent approach to land use planning decisions
around hazardous installations. J. Hazard. Mater. 61(1-3):355-
361
Central Water Commission, Flood Forecast System. Website:
http://www.india-water.gov.in/ffs.
Contini SS, Bellezza F, Michalis D, Christou CD, Kirchsteiger
C , 2000. The use of geographic information systems in major
accident risk assessment and management. J. Hazard. Mater.
78(1-3):223-245
Cova TJ , 2005. GIS in emergency management In: Longley
PA et al (eds) Geographical Information Systems: Principles,
Techniques, Management, and Applications. Second Edition
Abridged. John Wiley & Sons, New York
Craciunescu V, Stancalie G, Diamandi A, Rodica PM, 2006.
Flood monitoring using on-line support system for spatial
information management. In: Schanze J et al (eds) Flood risk
management: Hazards, vulnerability and mitigation measures.
Springer, Berlin
Cutter SL, 2003. The vulnerability of science and the science
of vulnerability. Ann. Assoc. Am. Geogr. 93(1):1-12
Central Water Commission; CWC National Flood Forecasting
Network; Website: http://india-
wris.nrsc.gov.in/wrpinfo/index.php?title=CWC_National_Floo
d_Forecasting_Network
Diehl S, Neuvel JMM, Zlatanova S, Scholten HJ, 2006.
Investigation of user requirements in the emergency response
sector: the Dutch case. In:
Flood Management; CWC National Flood Forecasting
Network; Website:
http://indiawris.nrsc.gov.in/wrpinfo/index.php?title=CWC_Nati
onal_Flood_Forecasting_Network
Fiedrich, F. and S. Zlatanova, 2013. Emergency mapping, In:
P. Bobrowsky (Eds.); Encyclopedia of Natural Hazards,
Springer, Heidelberg, New York, Dordrecht, London, pp. 272-
276
Diehl S, Van der Heide J, 2005. Geo Information Breaks
through Sector Think. In: Oosterom P et al (eds). Geo-
information for disaster management, Delft2005, / Springer,
City, pp. 85-108
Greene RW, 2002. Confronting catastrophe: a GIS handbook.
ESRI Press, Redlands, CA
Grothe MJM, Landa HC, Steenbruggen JGM , 2008. The value
of Gi4DM for transport and water management. In: Zlatanova
and Li (eds) Geospatial Information Technology for
Emergency Response. Taylor and Francis Group, London
HEC-RAS, US Army Corps of Engineers;
Website: http://www.hec.usace.army.mil/
The International Archives of the Photogrammetry, Remote Sensing and Spatial Information Sciences, Volume XL-8, 2014ISPRS Technical Commission VIII Symposium, 09 – 12 December 2014, Hyderabad, India
This contribution has been peer-reviewed. doi:10.5194/isprsarchives-XL-8-147-2014
153
Kaviani A., Rajabifard A., 2014. VGS based framework for
disaster response; Coordinates, Volume X, October 2014
Köhler P, Wächter J, 2006. Towards an open information
infrastructure for disaster research and management: Data
management and information systems inside DFNK. Nat.
Hazards. 38(1-2):141-157
Mansourian AA, Rajabifard A, ValadanZoej MJ, Williamson I
, 2006. Using SDI and web-based system to facilitate disaster
management.Comput. Geosci. 32(3):303-315
Ministerie van Binnenlandse Zaken, 2003. Handboek
rampenbestrijding Ministerie van Binnenlandse Zaken, Den
Haag
Ministerie van Infrastructuur en Milieu, Interprovinciaal
Overleg IPO, & Unie van Waterschappen., 2012. Flood risk in
the Netherlands VNK2: The method in brief. Technical
Background. Den Haag: VNK2 project office
Ministerie van Verkeer en Waterstaat, 2007. Programma
waterveiligheid 21e eeuw Ministerie van Verkeer en
Waterstaat. Accessed 20 Jun 2007
Ministerie van Verkeer en Waterstaat, Inspectie Verkeer en
Waterstaat, 2006. Primaire waterkeringen getoetst. Landelijke
rapportage toetsing 2006 Ministerie van Verkeer en Waterstaat,
Den Haag
NDMA Guidelines, 2008. National Disaster Management
Guidelines, Management of Floods;
Neuvel, J. M. M., 2009. Geographical dimensions of risk
management: the contribution of spatial planning and Geo-ICT
to risk reduction. Wageningen: Wageningen University.
Parker CJ, MacFarlane R, Philips C, 2007. Integrated
emergency management: Experiences and challenges of a
national GI provider, Ordnance Survey. In: S. Zlatanova and Li
J (eds) GI-technology for emergency response Taylor& Francis
London
Planning Commission, 2011. Report of Working Group on
Flood Management and Region Specific Issues for XII Plan,
New Delhi
Pattusamy S., Purusothaman B.M., 2014. Disaster
Management and mapping using Remote Sensing and GIS; J.
of Computation in Biosciences and Engineering. V1I3. DOI:
10.15297/JCLS.V1I3.06
Schanze J, 2006. Flood risk management: A basic framework.
In: Schanze J et al (eds) Flood Risk Management: Hazards,
Vulnerability and Mitigation Measures. Springer, Berlin
Schneiderbauer S, 2007. Risk and vulnerability to natural
disasters - from broad view to focused perspective. Freien
Universität Berlin, Berlin
Snoeren G., 2006. Rampenbestrijdingsprocessen. Actoren,
werkwijze en data. GDI4DM project, Arnhem
STOWA, 2008. FLIWAS International flood warning and
information system STOWA.
Roy V. D. , 2014. Flood Forecasting and Warning Mechanism,
Annual Conference of Relief Commissioners/Secretaries of
Disaster Management of States to review preparedness for
South West Monsoon, New Delhi
Williamson I, Rajabifard A, 2003. Developing Spatial Data
Infrastructures: From Concept to Reality. Taylor & Francis,
London
Zlatanova, S., 2013. Flood and flood riks: mapping, monitoring
and damage assessment, in: The value of Geoinformation for
risk and disaster management, JB of GIS, pp.33-43
Zlatanova, S. and A.G. Fabbri, 2009. Geo-ICT for risk and
disaster management. In: Scholten, van Velde&vanManen
(Eds.), Geospatial technology and the role of the location in
science, Springer, Dordrecht, Heidelberg, Londen, New York,
pp. 239-266
Zlatanova, S., D. Holweg and M. Stratakis, 2007. Framework
for multi-risk emergency response, In: Tao&Li (Eds.),
Advances in Mobile Mapping Technology, Taylor&Francis,
London, ISPRS Book Series, pp. 159-171
The International Archives of the Photogrammetry, Remote Sensing and Spatial Information Sciences, Volume XL-8, 2014ISPRS Technical Commission VIII Symposium, 09 – 12 December 2014, Hyderabad, India
This contribution has been peer-reviewed. doi:10.5194/isprsarchives-XL-8-147-2014
154


![Flood vulnerability assessment and disaster risk reduction ...article.aascit.org/file/pdf/9240730.pdf · holistic approaches for flood disaster management [5]. ... risk or vulnerable](https://static.fdocuments.in/doc/165x107/5ac177b17f8b9ad73f8cef17/flood-vulnerability-assessment-and-disaster-risk-reduction-approaches-for-flood.jpg)