Environmental Economic Accounting Water Resource Accounting for South Africa
i
THE WORLD BANK
SECTOR POLICY AND RESEARCH STAFF
ENVIRONMENT DEPARTMENT
INTEGRATED ENVIRONMENTAL AND
ECONOMIC ACCOUNTING
A CASE STUDY FOR MEXICO
JAN VAN TONGEREN & STEFAN SCHWEINFESTUN STATISTICAL OFFICE
ERNST LUTZTHE WORLD BANK
MARIA GOMEZ LUNA & FRANCISCO GUILLEN MARTININSTITUTO NACIONAL DE ESTADISTICA, GEOGRAFIA Y INFORMATICA
December 1991
Environment Working Paper No. 50
This paper has been prepared for internal use. The views and interpretationsherein are those of the author(s) and should not be attributed to the 'World Bank,to its affiliated organizations or to any individual acting on their behalf.
Pub
lic D
iscl
osur
e A
utho
rized
Pub
lic D
iscl
osur
e A
utho
rized
Pub
lic D
iscl
osur
e A
utho
rized
Pub
lic D
iscl
osur
e A
utho
rized

Jan van Tongeren is Chief of the National Accounts and Classifications Branch in theUnited Nations Statistical Office (UNSO). Ernst Lutz is Senior Economist in the EnvironmentalPolicy and Research Division of the World Bank. Stefan Schweinfest is StatistiLian in theNational Accounts Section of UNSO. Maria Gomez Luna is Director of the National Accountsand Economic Statistics Department of the Instituto Nacional de Estadistica, Geografica yInformatica (INEGI) in Mexico. Francisco Guillen Martin is Sub-Director of the NationalAccounts and Economic Statistics Department of INEGI. The paper reports on findings that areparticularly significant in the context of the overall work program of the Environmental Policy andResearch Division at the World Bank and the United Nations Statistical Office. The authors aregrateful to Sweder van Wijnbergen and Mohan Munasinghe for supporting this work, and to DaleJorgensen and Michael Ward for valuable comments. Also, the authors would like to thankHector de Alzua Romo, Jaime Rodriguez Carranza, Joel Villegas Tovar, J. Dulce Ma. MartinezMoreno, Fernando Perez Conde, Gerardo Calderon Fierros, Alma Morales Lozado, HildaMartinez Diego, and Silvia Jaime Leija from INEGI for valuable assista.we. Finally, the authorswould like to thank the World Bank's Research Committee and UNDP's Mexico Program forproviding funding for the study.
Departmental Working Papers arc not formal publications of the World Bank. Theypresent preliminary and unpolished results of country analysis or research that are circulated toencourage discussion and comment; citation and the use of such a paper should take account ofits provisional character. The findings interpretations, and conclusions expressed in this paper areentirely those of the authors and should not be attributed in any manner to the World Bank, toits affiliated organization, or to members of its Board of Executive Directors or the countries theyrepresent.
Because of the informality and to present the results of research with the least possibledelay, the typescript has not been prepared in accordance with the procedures appropriate toformal printed texts, and the World Bank accepts no responsibility for errors.
ABSTRACT
This paper presents the results of a case study carried out in 1990 and 1991 jointly byUNSO, the World Bank, and the National Institute of Statistics, Geography, and Informatics(INEGI) in Mexico, with the objective of integrating and linking environmental and economicinformation and to explore whether environmentally-adjusted national product aggregates forMexico can be derived. This work was carried out within the overall analytical frameworkdeveloped in UNSC s Draft Handbook on Environmental Accounting. Given that environmentaland economic information has traditionally been collected by different agencies, a special effortwas made to establish contacts between INEGI, the Urban and Environment Ministry (;EDUE),and other relevant agencies with data and expertise in these areas.
The analysis took as a starting point the standard System of National Accounts for Mexico(Sistema de Cuentas Nacionales de Mexico - SCNM). Economic information from the SCNMwas reformatted, and subsequently the following areas of environmental concern were integrated:(a) oil depletion, (b) degradation of environmental assets, and (c) deforestation and land use.The resulting system is termed System of Economic and Environmental Accounts for Mexico(Sistema de Cuentas Economicas y Ecologicas de Mexico - SCEEM). The analytical data used inthis case study refers to 1985, a year for which detailed input-output information was available,which facilitated the development of the SCNM to the SCEEM. The case study work consistedof four main areas, as described below.
First, the standard analysis of SCNM, which derives the GDP was expanded to includeproduced asset balances. Depreciation of those assets was estimated, which then was deductedfrom the GDP to arrive at the (standard) NDP. Second, oil depletion concerns were addressedand the assets forests and groundwater were analyzed. Depletion of oil represents an economiccost (so-called user cost) that needs to be subtracted from gross product along with othercorrections to arrive at the adjusted net product Additional finds of oil re,erves contribute tocapital accumulation (but without being reflected in the flow accounts). Third. degradationconcerns were considered, covering not only air and water pollution, but also soil erosion, groundwater use and th, deposit of solid wastes. Degradation affects the quality of non-produced assets(e.g. water, air). The linkage between these and the economy is complex. In general, degradationaffects more immediately the quality of life than economic production. Fourth, land use concernsand deforestation were included in the accounting framework. Forests are essentially a renewableresource. But if they are depleted over and above the maximum sustainable yield, a depletioncost also needs to be calculated.
Accounting for depletion and degradation in physical terms is an important first step,which can indicate how traditional economic aggregates are affected. H-wever, for an integratedeconomic and environmental analysis, it is essential that environmental variables be expressed inthe same monetary anits as the economic variables. This requires valuation. There are threeapproaches used in valuing the natural assets and changes therein. The first method calculatesthe value of stocks of assets as the sum of discounted values of future income streams, and thevalue of changes in the stock of natural assets is based on the changes in future income streamsas a consequence of additions to the reserves of natural assets, or depletions. The secondapproach calculates the user cost of depletion such as by the El Serafy method. The third type ofvaluation, which is only used for valuing quality changes in the natural assets, is based on the costof avoiding such changes (avoidance cost approach). These general criteria translate into morespecific methods for each of the natural resources and environmental concerns covered in theSCEEM.
- II -

GDP for 1985 is 47,391 million pesos. Depreciation of produced capital is 5,331 millionpesos. Therefore, NDP is 42,060 million pesos. Two Environmentally-Adjusted net DomesticProducts (EDPs) are calculated. EDPI is derived by deducting from NDP the environmental usesrelated to depletion, deforestation and land use; it is estimated to be 39,662, i.e. about 94% of theof the traditional NDP. EDP2 is obtained by further deducting the cost of degradation, and isestimated to be 36,448 million pesos, i.e. about 87% of NDP.
In terms of the shares of final consumption and capital accumulation in the various netproducts, the results are as follows. Final consumption is 83% of the traditional NDP and netcapital formation is 11%. When changing to EDPI, final consumption increases to 88% of EDPIand net capital accumulation is less than 6%. Net accumulation of economic assets would benearly 12% of EDP1, but the effect of this increase is eliminated because a large part of the netaccumulation in economic assets is directly taken from the environment (the environmental capitalis reduced by 6% of EDP1). When extending the analysis to EDP2, final consumption is furtherincreased to nearly 96%, and net capital accumulation becomes a negative -2%, which is the netresult of an increase in net accumulation of economic assets to nearly 13% of EDP2 and adecrease of environmental capital which amounts to -15% of EDP2.
While the macro results presented above are interesting, they do not provide theinformation that would be needed for operational governme . policies. Therefore, in the presentstudy, not only the macro effects have been identified but efforts have also been made to identifythe depletion and degradation caused by different sectors. The sectoral analysis focuses on threeelements, i.e. value added, the use of economic assets including produced as well as non-producedassets, and also on the environmental protection expenses made by different sectors.
In reviewing the results of this pilot study, one needs to keep their tentative nature inmind. First, a number of environmental and resource concerns were not covered (e.g.biodiversity, ecosystem services, fisheries, marine environment, historical monuments). Second,the work represents only an initial pilot effort. The main emphasis in the first stage of developingthe SCEEM was on identifying the relationship between different economic aggregates andenvironmentally adjusted aggregates. There was less emphasis on the quantitative accuracy of theenvironmental adjustments. Follow-up studies, to be undertaken by INEGI and others, areintended to improve the accuracy of data or estimates in selected areas, and also to provideanalyses for other years, so that the effects of environmental adjustments on growth can bedetermined.
- Ill -
INTEGRATED ENVIRONMENTAL AND ECONOMIC ACCOUNTINGA CASE STUDY FOR MEXICO
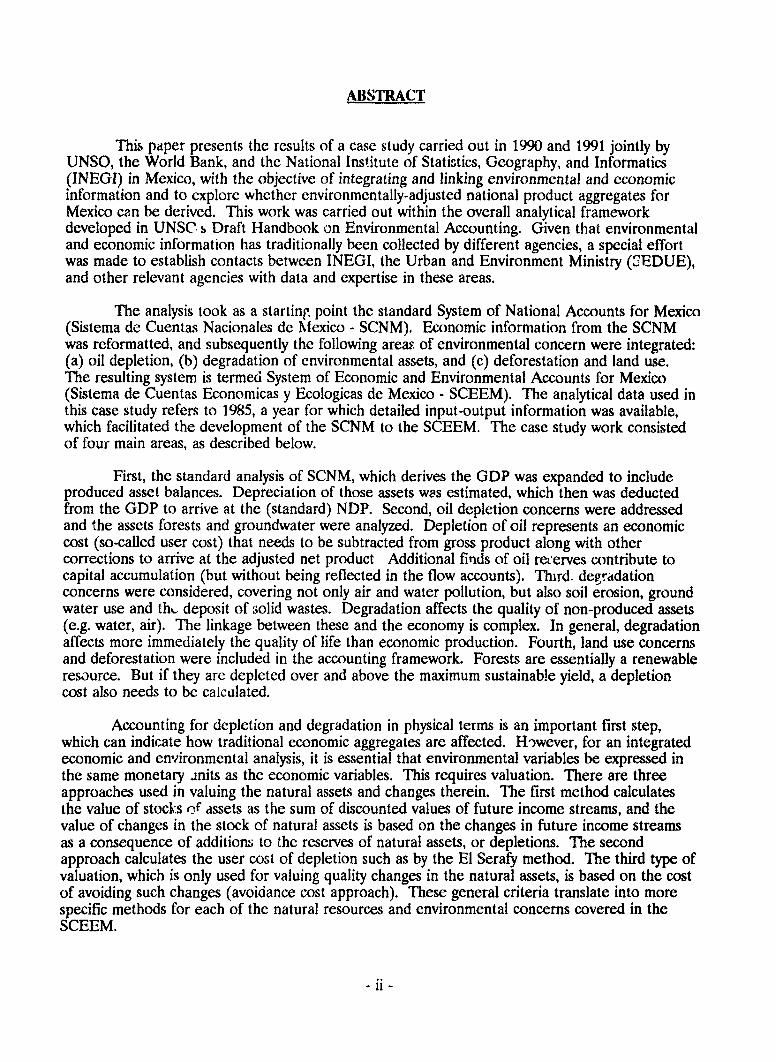
Table of Contents
I. INTRODUCTION ................................................ ...... 1
A. General Orientation of the Pilot Project .............................. 2
II. ENVIRONMENTAL CONCERNS ADDRESSED AND MEASURED ................ 3
A. Environmental Concerns Addressed ................................. 3B. Measurement and Valuation of Environmental Impacts .................... 5
1. D ata sources ............................................... 52. V aluation .................................................. 6
III. ACCOUNTING FOR ENVIRONMENTAL IMPACTS ON ECONOMIC ACTIVITIES .. 7
A. Macro Analysis .............................................. 8
1. Sistema de Cuentas Nacionales de Mexico (SCNM) ............. ... 82. Sistema de Cuentas Ecologicas e Economicas de Mexico (SCEEM) ...... 11
a. Conceptual Framework of SCEEM ....................... 11b. SCEEM Applied to Environmental Concerns ................ 14
(1) Oil Extraction ............................... 14(2) Deforestation and Land Use ...................... 16(3) Degradation ................................ 18
c. Comparison between SCNM and SCEEM AggregatesAnalysis in Monetary Terms ......................... 18(1) EDP1 ........................... ......... 18(2) EDP2 ................. ................... 22(3) Comparative Analysis of EDP1 and EDP2 ............ 24
B. Analysis by Economic Activities ................................... 25
1. Comparison of SCNM and SCEEM Aggregates by Economic Activities ... 25
(a) Value added ................................ 25(b) Capital Stock and Capital Accumulation .............. 27
2. Comparative Analysis of Performance and Growth in SCNM andSCEEM . .......................................... 29
IV. REFERENCES .................................................. 33
- iv -

INTEGRATED ENVIRONMENTAL AND ECONOMIC ACCOUNTING
A CASE STUDY FOR MEXICO
I. INTRODUCTION
The present report includes the conclusions of a joint project carried out in 1990/91 by theUN Statistical Office, the World Bank and the Mexican "Instituto Nacional de Estadistica,Geografia e Informatica" (INEGI), with partial funding from UNDP, to compile, on anexperimental basis, environmentally adjusted economic aggregates for Mexico. The aggregateswere to be developed within an analytical framework of environmental accounts linked to thenational accounts of Mexico, and based on concepts elaborated in the UNSO's Draft Handbookon Environmental Accounting (United Nations, 1990).
This paper, summaries and analyses the quantitative results of the data compiled. TheAnnexes present a detailed account of data sources and valuation methods and include thequantitative results of the project in considerable detail.'
This paper covers the following topics. In Section L.A information is given on theorientation and organizational context of the work on environmental accounting in Mexico.Section II of the paper deals with the environmental concerns that are addressed. Section II.Aincludes a description of the environmental concerns, distinguishing between three concerns, i.e.oil extraction, deforestation and land use, and degradation concerns. Section II.B summarizes foreach of the concerns, the data sources of physical environmental indicators that are compiled inorder to measure the impact of the concerns, the adjustments that are made to these jata inorder to use them for integrated economic-environmental analysis, and the principles of valuationapplied in order to arrive at monetary valuation of the environmental impacts. More details ondata sources, compilation methods and valuation are presented in the Annexes of the report.Section III describes and analyzes the effects of incorporating data into an accounting frameworkfor joint economic-environmental analysis, called Sistema de Cuentas Economicas y Ecologicas deMexico (SCEEM). SCEEM is introduced in this section in a gradual manner. It starts in SectionII.A.1 with a presentation of the traditional Mexican national accounts framework for economicanalysis, called the Sistema de Cuentas Nacionales de Mexico (SCNM), and extends SCNM toSCEEM in Section II.A.2, successively integrating in he analysis the resource balances inphysical terms that reflect oil extraction (Section III.A.2.b.(1)), deforestation and land use(Section III.A.2.b.(2)), and degradation concerns (Section III.A.2.b.(3)), and applying thevaluations developed in Section II.B.2 and in the Annexes, to arrive at an SCEEM macro analysisin monetary terms which permits a comparison of SCNM and SCEEM aggregates (SectionIII.A.2.c.). In Section III.B the macro aggregates in monetary terms are broken down by
' Since the annexes are voluminous, they are not included as a part of this paper. However, theycan be obtained by writing to the Bank's Environment Department (Room S-3049) or the UnitedNations Statistical Office.
-1-

economic activities which permits comparative evaluation of environmental impacts and use ofnatural resources by different economic activities in Mexico.
The analytical data presented in the tables throughout the paper refer to 1985. In thatyear in which a detailed input-output table for Mexico was compiled, which facilitates theadaptation of SCNM to the integrated economic and environmental analysis of SCEEM.
A. General Orientation of the Pilot Project
There has been much discussion in Mexico about environmental concerns and a variety ofstudies have been carried out to quantify the impacts on production and the quality of life."Public opinion and politicians in Mexico are aware that many of the environmental concerns arelinked to economic activities and that environmental impacts can be mitigated through acombination of incentives and regulations affecting economic activities. In order to assess theeconomic ramifications of environmental interventions, there is a need to link economic analysiswith analysis of cnvironmental impacts. Such linkage makes it possible to determine in whicheconomic activities environmental regulations would be most effective from an environmentalpoint of view and at the same time be optimal from an economic point of view. The developmentof such a linkage between economic and environmental accounting was an important objective ofthis pilot study.
One of the difficulties encountered in developing a joint economic-environmental analysiswas the separation between different disciplines which deal with economic analysis and withanalysis of environmental impacts. In Mexico, as in many other countries, the differentorientations of economic and environmental analysis are not only reflected in different disciplinesand experts supporting those disciplines, but are also represented by different institutions. Inpreparing government policies in fields related to the present study, the two disciplines are mainlyrepresented by INEGI, which has developed macro economic accounts that are used by thegovernment in economic policy making, and SEDUE, which is the focal point in the governmentfor environmental policy making. The first step in implementing the project in Mexico was toestablish the necessary contacts between experts in economic accounting in INEGI and resourceaccounting in SEDUE and other Mexican institutions dealing with natural resources.
An accounting framework was developed which could be used as the quantitativeinstrument through which environmental data analyzed by SEDUE and other Mexicaninstitutions, and macro economic data elaborated by INEGI, could be linked. The jointeconomic-environmental accounting framework SCEEM is based on the System of EconomicEnvironmental Accounts (SEEA)'. SEEA was adapted to the Mexican circumstances andrequirements, such that economic accounts included in SCNM and compiled by INEGI, and
2) For example the recent report "Mexico in Transition: Towards a New Rate for the PublicSector" (World Bank Report No. 8770-ME, May 22, 1991) discusses environmental policy issues inconsiderable details.
) SEEA is the accounting framework that is included in the Draft Handbook on EnvironmentalAccounting which is being developed by a consultant to the United Nations Statistical Office. In theremaining text, reference will be made either to SEEA or the Handbook.
-2-

resource balances known by experts from SEDUE and other Mexican institutions working in thearea of natural resources, were separately identified. This facilitated discussion and furtherreconciliation of common concepts, valuations, etc., and also made it possible to confront availableeconomic and environmental data sets, which were used in the past for separate analyses, and usethem in a joint analysis to bring out the interactions between economic activities andenvironmental effects. Furthermore, within the resource balances of SCEEM, a distinction wasmade between different resource balances representing different environrme-ntal concerns, so thatthe quantitative interactions between economic activities and each of those environmentalconcerns could be separately assessed.
In line with the orientation of SEEA, SCEEM was compiled in an integrated manner, withmuch emphasis on identifying, quantifying and establishing the relation between theenvironmental effects on dffernt macro economic aggregates and less emphasis on quantitativeaccuracy of the environmental aijustments. The reason for this emphasis is our belief that firstthe orientation of the integrated environmental-economic analysis should be established, thusintegrating expertise, concepts and data, and only at a later stage when there is commonunderstanding of concepts and format of such integrated analysis, data improvements can beattempted, which would not only lead to improved accuracy of isolated data, but would also leadto improvements in the integrated analysis.
The development of SCEEM in its present format should be considered as a feasibilitystudy aimed at integrating economic and environmental data bases and analyses. Onceaccomplished, it is necessary to carry out further studies which would improve the reliability of thedata and develop more detailed data sets with a similar orientation. For instance, aftercompletion of the environmental project in Mexico, detailed studies may be carried out withregard to soil erosion caused by agricultural production or with regard to air and water pollutioncaused by economic activities in the Federal District of Mexico. In such studies, economic andenvironmental data would have to be compiled in the same classification detail and on the basis ofcompilation methods that are compatible in terms of valuation, estimation procedures, etc.
Improvement of data for integrated environmental and economic analysis should not bethe only objective of future activities in environmental accounting, though. There should be alsomuch emphasis on further developing the rudimentary analyses of environmental impacts ongrowth and performance, which are presented in Sections III.A.2.c and III.B.2 of the paper. Onlythrough such improvements of the analytical tools would the improved data have an impact onpolicy making through the replacement of traditional economic analyses by integrated analysesthat are based on environmentally adjusted aggregates.
II. ENVIRONMENTAL CONCERNS ADDRESSED AND MEASURED
A. ENVIRONMENTAL CONCERNS ADDRESSED
The environmental concerns examined as part of the project activities deal withquantitative and qualitative effects on natural resources. They are grouped together in thepresent report in three main groups: oil extraction concerns, deforestation and land use concern,
-3-

and thirdly the degradation concerns. The first two groups are also called the depletion and landuse concerns.
The oil depletion concern is dealing with the quantitative exhaustion of a natural resourcewhich is an important source of revenues for the Mexican economy. It is reflected in oilextraction and findings of new oil reserves. The traditional economic aggregates do not take intoaccoun. any allowance for depletion which constitutes a loss of future revenues; in other words,the oil resources are considered as free goods in traditional economic analysis. The oil depletionaspect is analyzed separately from environmental impacts i.e. the air and water pollution causedby oil extraction and the subsequent oil refining activities; these environmental impacts, whichaffect the quality of natural resources (air, water), are dealt with under the degradation concerndescribed below.
The deforestation and land use concerns deal with two aspects of deforestation. Theseinclude the loss of timber as a result of commercial and non-commercial logging at a speedbeyond the capacity of nature to replace it through natural growth, and the transfer ofunexploited forest areas to uses in economic activities, either in the form of agricultural land, landused for holding cattle or land transferred for the purpose of urbanization. The transfer of landalso effects the practice of cultivation which is sometimes carried out by burning forests fortemporary cultivation and abandoning the land after a few harvests. Both the logging of timberand the transfer of forest areas to economic uses generally involve not only the exhaustion ofdepletable resources --timber and forest land --, but also the destruction of these naturalresources as eco-systems. While the latter loss of the forest as an eco-system is anenvironmentally critical concern, it is not dealt with under the deforestation and land use concernas defined here, which solely deals with the quantitative reduction of two natural resources, i.e.timber and forest land.
The degradation concerns do not deal with the quantitative exhaustion of naturalresources, but rather with the qualitative degradation of the eco-system. They include in thepresent study the contamination of air and water through the generation and deposit of residuals,and also the environmental impact of leaving garbage and solid wastes behind as a result ofproduction, including domestic production activities of households. Also covered under thedegradation concerns are land erosion and ground water loss.
In further analysis of the impacts of the three types of environmental concerns in SectionIII, it has been assumed that the quantitative depletion and land use concerns of oil extraction,deforestation and land use presented above have an immediate impact on the productive andincome generating capacity of the Mexican economy. The depletion of oil and the loss of treesimmediately affects the future income generating capacity of the oil extraction and loggingactivities. Also land transferred from the environment to economic activities in agriculture,livestock holding, and for purposes of urbanization will have an immediate (in this -ase positive)impact on the income generating capacity of economic activities. The qualitative degradationconcerns, on the other hand, have almost immediate effects on fhe velfare of the population andlong run effects on the productive and income generating capacity. The effects are on the qualityof life through effects of air, water and solid waste pollution on health, through the effects of landerosion on the quality of recreational areas, and through ground water loss which immediatelyaffects households in their consumptive activities. Ultimately, the degradation concerns will havean impact on production, either through health effects of workers in the production processes orthrough secondary effects on growth of products in agriculture, fishing and forestry which in turnaffects the generation of net product in these economic activities. These secondary effects onproduction are, however, more difficult to identify and analyze because many effects -- and not
-4-

only environmental ones --may operate together, and time lags of the effects on production maybe very considerable.
The distinction between immediate effects on production and the long-run effects onproduction through primary effects on well-being, does not entirely coincide with the distinctionbetween tie two groups of concerns. Oil depletion may also have a long run effects through theair and water pollution caused by oil extraction activities. Deforestation may have severe long runeffects, as the loss of the eco-systems may affect the productivity, particularly in agriculture, andthrough health effects the productivity of workers in ofher industries, and in general may have adeteriorating effect on the quality of life. On the ottier hand, some of the degradation Jffectssuch as land erosion and ground water loss may have immediate effects on productivity,particularly in agriculture.
B. Measurement and Valuation of Environmental Impacts
1. Data sources
The compilation of additional data on physical indicators with regard to balances ofnatural assets was accompanied by an extension of the present SCNM to include asset balances ofproduced assets as well. The information used to extend the SCNM in this manner took as apoint of departure the SCNM data regarding gross capital formation. Additional information wasobtained from the Economic Census 1986, supplemented by data from the Census of Commerceand Services 1980, and the Survey of Capital Formation in the Enterprise Sector, both carried outin 1980 by the Banco de Mexico.
A variety of data sources were used for compiling physical indicators that reflect the threetypes of environmental concerns mentioned above. They are summarized below and described indetail in the Annexes.
With regard to oil, information on proven reserves of oil is obtained from publishedinformation by the publicly controlled Mexican Petroleum Company PEMEX. Annual extractiondata are also obtained from this source. New discoveries are not published but obtained as aresidual from the published data on oil deposits and oil extraction.
Information on the (opening and closing) stock of forest resources was obtained from theNational Forest Inventory, a report prepared by the Secretaria de Agricultura y RecursosHidraulicos. The report included information on land surface covered by forests expressed inhectares and also data on the volume of trees in cubic meters. There was no detailed informationon the type of trees. The same Secretaria de Agricultura and Recursos Hidraulicos also compileda Regional Inventory of the Use of Land, w;,iich provided information on land use in general andnot only for forest areas. Information on changes in the use of land were obtained on the basisof assumptions which are based on studies about the relation between increases in the use of landand the corresponding growth of agricultural production, growth of production in cattle farmingand growth of urban centers. As a result of these assumptions, decreases in the forest area overtime could be calculated.
Data regarding the degradation concerns were compiled with regard to land erosion, airand water pollution, ground water use, and the generation of solid wastes.
Land erosion was estimated on the basis of the General Ecology Report elaborated by theComision Nacional de Ecologia. The report identifies areas with very severe, severe and
-5-

moderate land erosion and presents an average erosion per hectare (27.54 ton/ha) at the nationallevel. The information on erosion/ha was applied to the areas used for agriculture, cattle farmingand forestry and thus national totals in tons were derived and allocated to the three economicactivities mentioned. Reconditioning of soil, resulting in the elimination of some of the soilerosion, was deducted from soil erosion in agriculture.
The main source of information on air pollution were reports resulting from a long termprogram carried out by the Federal District of Mexico, called the "Programa Integral Contra laContaminacion Atmosferica (1989). Based on the results of this project, contaminationcoefficients could be calculated for five types of contaminants, i.e. sulfur dioxide, nitrogen oxide,hydrocarbons, carbon monoxide and full suspended particles The contamination coefficientsrelated the emission of these substances to the number of motor vehicles, the output of the oilref'ning industry, the output of electricity plants and output of other manufacturing industries.The coefficients were used to calculate national totals for each of the contaminants, based on thetotal number of vehicles in Mexico and the output of a variety of industries causing air pollution.
The extent of water pollution was measured in terms of biochemical demand of oxygen(DBO). This is an effective measure because additional oxygen is needed in order to break downexcess of organic substances found in the water. The sources of information were private studies.Contamination coefficients expressed in DBO's were estimated for a variety of industrial sectorsand also per capita to cover water pollution by households. Application of the coefficients tooutput in each industry and total population provided national totals on DBO's.
Information on ground water resources was obtained from a variety of reports, but themain one was the General Ecology Report prepared by the Comision Nacional de Ecologia. Theuse of ground water was estimated on the basis of water used per capita and water used per unitof industrial production in a number of industries including agriculture, cattle farming, andelectricity production. The reduction in the ground water resources would be the differencebetween this use and what is annually replenished through precipitation.
The generation of solid wastes was only calculated for the household sector; industrialwastes were not covered. The main source of information was the General Ecology Reportprepared by the Comision Nacional de Ecologia which provided information on the daily averagegeneration of solid wastes at the national level (.693 kg) and at the Federal District level (.987kg). The report distinguishes between different solid residues, which are grouped together in thepreparation of data between biodegradable and non-biodegradable. This information was usedtogether with population data to arrive at a national level of solid waste generation byhouseholds.
2. Valuation
As will be shown below in Section III, environmental accounts in physical terms can giveindications of the direction in which environmental cost and capital would affect the traditionaleconomic aggregates. However, for an integrated analysis, it is essential that environmentalvariables be expressed in the same monetary units as the economic variables.
There are two types of criteria used in valuing the natural assets and changes therein.The first type calculates the value of stocks of assets as the sum of discounted values of futureincome streams and the value of changes in the stock of natural assets is based on the changes infuture income streams as a consequence of additions to the reserves of natural assets, ordepletions. The second type of valuation, which is only used for valuing quality changes in thenatural assets, is based on the cost of avoiding such changes. These general criteria translate intomore specific methods for each of the natural resources and environmental concerns covered inSCEEM.
-6-
For exploitation of oil and timber reserves, two alternative valuation methods are used.The first one is the net rent method as developed in projects carried out by the World ResourcesInstitute projects (Repetto 1989) and the second one is the method developed by El Serafy(1989), which is based on the calculation of a depletion allowance. The net rent methodcalculates the value of natural resources in the ground as the difference between the market valueof lumber and oil and the cost it takes (including a normal profit) to extract this resource forcommercial exploitation. The net rent value is calculated scparately for opening and closingstocks as well as for changes in those stocks as a result of depletions and additions.
The method developed by El Serafy values the natural resource as a function of the sumof the discounted values of future income streams that are generated by it. It assumes that a partof operating surplus of mining and forestry would have to be reserved for re-investment(depletion allowance) in order to assure that the sum of the discounted income streams (coveringnet operating surplus and compensation of employees) over the limited life of the naturalresources would be equal to the sum of discounted income streams over an infinite period,obtained if net product was reduced by the depletion allowance, and the depletion allowancewere re-irvested. The amount of the depletion allowance per unit of production is obtained as aresult of these assumptions. The values based on the net rent and El Serafy methods have theirown economic meaning and are therefore used in combination in the integrated analysis ofSection III.A.2.c(2).
The value of land is generally based on the sum of the discounted value of future incomestreams in the different economic activities in which land is used. It is calculated separately forforest land, land used in agriculture, land used for holding of livestock and land used for urbanneeds. In each type of economic activity the value per ha of land is based on the sum of thediscounted values of net value added per year per ha of land. In the case of forest land, the valueof the land is based on net value added in forestry. Only forest land as an environmental assethas been given an economic value; other land not used for economic purposes other than forestland has not been valued. Revaluation of land within the same activity between the beginningand end of the period is not taken into account, only changes in the value of land whentransferred from one activity to another.
All types of degradation have been valued on the basis of avoidance cost per unit ofcontaminant or other unit of degradation. In the case of land e-osion this cost is valued as thecost of fertilizer to maintain the productivity of the land as it was before erosion took place. Forground water loss, the cost was assumed to be equal to what it would cost to re-inject water intounderground water reservoirs. The cost of water and air pollution was estimated on the basis ofthe cost it would take to reduce such pollution to acceptable levels.
III. ACCOUNTING FOR ENVIRONMENTAL IMPACTS ON ECONOMIC ACTIVITIES
The aim of the work on environmental accounting is to reflect in quantitative format theeffects of environmental concerns in existing economic analysis. In order for the integratedenvironmental and economic analysis to have maximum effect, the existing analysis taken as apoint of departure, should be the one that is frequently used as a basis for government policydecisions and furthermore includes a maximum number of variables in which environmentalimpacts could be incorporated. The analysis which best fits these conditions in the Mexican caseis input-output analysis which is based in Mexico on the highly developed data base of SCNM. It
-7-

is convenient to take SCNM as point of departure when developing SCEEM, as the SCNM database and its analytical features are easily understood by both users and producers of such statisticsin Mexico, where in the past extensive use has been made of input-output data and analyses forpolicy purposes. By structuring SCEEM in a manner similar to SCNM, both producers and uscrsof SCNM can easily compare the data base of SCNM with the expanded data set of SCEEM andcan thus appreciate how aggregates of SCNM change when redefined in SCEEM. Also, foranalytical users it would be casy to see how the SCEEM analysis would differ from the analysisthat is traditionally carried out in the context of SCNM.
The present section starts in Section A with a macro analysis of the economic andenvironmental data, followed in Section B by a similar analysis in which separate economicactivities are identified.
A. MCRO ANALYSIS
1. "Sistemw de Cueas Neonwles de MexicoW (SCNM)
Table I1.1A.1 is a simplified presentation of the present national accounts of Mexico(SCNM). With help of this table some basic features of SCNM can be described.
Behind the present national accounts of Mexico, i.e. SCNM, there is a very simpleanalytical model, which serves a variety of analyses. The simple model includes a supply and useidentity and production functions.
ENVIRONMENTAL ACCOUNTS MEXICOSupply/use Tables & Balance Sheets
Table 111.1.1: Mexico I/O Scheme (SCNM)(billion, Mexican pesos)
Economic Activities
Final ProducedProduction Rest of World Consumption Capital
Economic Supply P MTotal 75,706,918 4,897,328
Economic Uses Ci Ex C ITotal 28,315,216 7,305,293 34,948,897 10,034,840
Gross Product Y47,391,702
The supply and use identity can be written as
P+M= Ci+C+I+Ex (i)
in which:
P = productionM = imports
-8-

Ci= intermediate consumptionC final consumptionI = gross capital formation (or investment)Ex= exports
A second identity defines gross product or value added (Y) as the difference betweenproduction and intermediate consumption, i.e.
Y = P - Ci (ii)
When substituting this income definition into the first identity, a third identity is derivedwhich links gross product and expenditures:
Y = C + I + (Ex - M) (iii)
The supply and use identity (i) is represented in Table 111.1.1 as the identity between thetotals of the second and third row, i.e. 75707(P)+4897(M) =28315(Ci)+34949(C)+ 10035(I)+7305(Ex)."
The product identity (ii) is shown in column (1) as the difference between total economicsupply or output (P) minus total economic uses or intermediate consumption (Ci); i.e. grossproduct (Y) is 47392(Y)=75706(P)-28315(Ci).
The third product -expenditure identity (iii) is not immediately obvious from thepresentation of the table; it is reflected in the identity between Y on the one hand and the sumof C, I and (Ex-M) on the other, i.e. 47391(Y)=34949(C)+10035(I)+[7305(Ex)-4897(M)].
For ease of presentetion, the last three digits of the figures presented in the tables are omittedin the text.
-9-

ENVIRONMENTAL ACCOUNTS MEXICOSupply/use Tables & Balances Sheets
Table 111.1.2: Enlarged I/O Scheme with Produced Asset Balances(billion, Mexican pesos)
Economic Activities
Final ProducedProduction Rest of World Consumption Capital
(1) (2) (3) (4)
Opening Assets Ko. p. ccProd. Assets 111,162,310
Economic Supply P MTotal 75,706,918 4,897,328
Economic Uses Ci Ex C ITotal 28,315,216 7,305,293 34,948,897 10,034,840
Depreciation Depr. -Depr.5,331,186 (5,331,186)
Net Product Yn In42,060,516 4,703,654
Revaluation Rev. p. ecProd. Assets
Closing Assets K1. p. ccProd. Assets 115,865,965
The first step in deriving SCEEM, in which asset balances of environmental assets ornatural resources play an important role, is to expand SCNM with the corresponding assetbalances of produced assets, which are not regularly compiled in Mexico, but which form anintegral part of the SNA. This expansion of SCNM, which is represented in Table 111.1.2, changesthe input-output scheme from one that can only be used for static analysis of the input-outputtype to a dynamic input-output model in which capital output ratios can be identified and used inanalysis of growth. The extended scheme of Table 111.1.2 includes three additional elements ascompared to the scheme of Table III.1.1, i.e.
KO(P,) = opening stock of produced assetsKi(pi) = closing stock of produced assetsDepr = depreciation
The three elements are used to define the additional asset balance identity, whichexplains the relation between the opening and closing stocks of produced assets (Kl(P,). K0(P.))on the basis of changes in produced capital. Further changes are reflected in (net) product and(net) capital formation. Both were defined gross in Table III.1.1 and are replaced by net versionsafter deduction of depreciation in Table 111.1.2.
The asset balance presented in the last column of the table has the following format:
KI., = KO.e + (I-Depr) + Rev,
- 10-

One element, Rev ,, standing for revaluation of produced economic assets is added forthe purpose of completeness. However, in Table 111.1.2 no value has been entered for thiselement as revaluation of produced assets is not taken into account in the additional data thatwere compiled. The asset balance in monetary units, as presented in Table 111.1.2 therefore takesthe following quantitative format:
115866(K1.,j)= 111 162(K0,)+ [ 10035(I)-5331(Depr)]
As one of the elements which explains the change in the value of produced assets isdepreciation, incorporation of depreciation is an essential element of changing the static i/o modelof SCNM to a dynamic one. The incorporation of asset balances in the expanded version ofSCNM is therefore accompanied by a corresponding change from using gross product (Y) inTable 111.1.1 to net product (Yn) in Table 111.1.2, and this changes the national accounts identitypresented above as follows (page 11):
Yn = C + In + (Ex - M)
in which Yn and In are net product and capital formation concepts from which depreciation hasbeen deducted.
2. Sistena de Qens Ecologces e Economices de Memio (SCEM)
a. Conceptual Framework of SCEEM
SCEEM takes SCNM as point of departure in its design, while introducing a number ofmodifications. It includes a wider asset boundary, covering not only produced assets, but alsonon-produced natural or environmental assets. Based on the wider asset boundary, SCEEMincludes imputations for additional expenditure items which are related to depletion anddegradation of non-produced assets. Furthermore, taking into account the imputed items,SCEEM incorporates modified concepts of net product or value added, which are derived bydeducting not only the traditional cost items, but also imputed items which correspond toenvironmental cost of depletion and degradation. Finally, SCEEM changes the concept of capitalformation as used in the traditional analysis of SCNM and introduces a new concept of capitalaccumulation which takes into account not only changes in produced assets as a result ofproduction and depreciation of such assets, but also changes in the stock of non-produced assetsresulting from new finds of non-produced assets and deteriorations of non-produced assets as aconsequence of economic activities.
The modified features of SCEEM can be easily appreciated from the presentation ofTable 111.2. They can be compared with the features of the traditional SCNM which is identifiedby the shaded areas in the table.
SCEEM in Table 111.2 includes two additional columns for the incorporation of assetbalances of non-produced assets alongside those of the produced assets that were included inSCNM. ine first additional column refers to non-produced assets that are directly "used" ineconomic activities together with produced assets; both groups are labeled economic assets. Thesecond additional column refers to assets that are only "affected" by economic activities--so-calledenvironmental assets. Economic assets are used as production factors in the generation of output,and production analysis requires that fu!l balances including stocks of economic assets areavailable. Environmental assets are not considered as production factors in this sense; theircontribution to the generation of output is not fully understood and/or perceived in existinganalysis and this is generally reflected in the non-availability of information on asset balancesincluding data on stocks of those assets.
- 11 -

In the case of Mexico, oil reserves and land used in agriculture, livestock management andurbanization are treated as non-produced economic assets, while water (including ground water),air, soil (lost through erosion) and also all forests will be dealt with as environmental assets.Forests are included as environmental assets because it was not possible to distinguish in the databetween virgin forests and forests that are used for commercial logging and which should havebeen treated as an economic asset in the same manner as oil. Both ground water and soil aretreated as non-produced environmental assets either because their contribution as a productionfactor to the generation of output is n.ot sufficiently clear (ground water) and/or because no assetbalances could be obtained from available data (soil).
Corresponding to the incorporation of a wider asset boundary in SCEEM, additional costare incorporated which reflect the use and/or deterioration of non-produced assets as a result ofeconomic activities. In Table 111.2 two types of imputed costs are represented. The first type(Cid,) are imputed costs related to depletion and losses reflecting deterioration of land that istransferred from the environment to economic activities, and the second type of imputed cost(Cide,) covers the deterioration of the environmental assets as a consequence of economicactivities. For purposes of this pilot study, the cost of depletion includes the cost of depleting oil,timber and ground water reserves. The imputed cost of land use refers to the trees --representing the eco-system -- that are lost as a consequence of transfer of forest land toagricultural land, land used for holiing of cattle and land used for the purposes of urbanization.The imputed cost referred to as cost of degradation includes the cost of air and water pollution,the cost associated with solid waste materials, and also the cost of land erosion and ground waterloss.
Following the introduction of imputed cost items in SCEEM, two modified net productconcepts are introduced, called Environmentally adjusted net Domestic Product I and 2 (EDPIand EDP2). EDPI -- or what is represented in the table as Ynl -- is derived by deducting fromNDP in SCNM the environmental uses related to depletion and land use, i.e.
Yn1 = Yn - Cid,,
and EDP2 -- or Yn2 -- is obtained by further deducting the cost of degradation, i.e.
Yn2 = Yn - (Cidepl + CIdeg)
- 12 -

ENVIRONMENTAL ACCOUNTS MEXICOSupply/use Tables & Balance Sheets
Table 111.2: Sistema De Cuentas Economicas De Mexico (SCEEM)Basic Structure
Economic Activities
Production Rest Final Economic Assets Non-prod.
World ump- Produced Non-prod.tion Assets Assets
Opening Assets Ko.p.ec Ko.np.ec Ko.np.env
EconomicSupply P M
Economic Uses Ci Ex C I
Depreciation Dept Depr.
Net DomesticProd. (NDP) Yn In
Environment -I.np.envUses: I.np.ec
Depletion andLand UseConcerns Ci.depl -Dpl.np.ec -Dpl.np.env
Env. Adj. Net -IAn.envlProd. Yn1 IAn.ecl
DegradationConcerns Ci.degr -Degr.np,env
Env. Adj. NetProd. Yn2 IAn.ec2 -LAn.env2
(=IAn.ecl)
Revaluation Rev.p.ec Rev.np.ec Rev.np.env
Closing Assets Kl.p.ec _Kl.np.ec Kl.np.env
There are two reasons why a distinction is made between EDP1 and EDP2. The first isthat the valuation of depletion cost and the cost of land use as summarized above is directlylinked to the market value of the assets that are depleted or transferred to economic use. On theother hand, imputations for the cost of degradation are much less close to market valuations andtherefore much more controversial elements in the analysis. A related reason is that the cost ofdepletion and land use taken into account in the calculation of EDP1 relates to the use ofeconomic assets, whereas in the derivation of the EDP2 not only the cost of depletion of non-produced economic assets is taken into -account, but also the cost of affecting non-producedenvironmental assets such as air, water (including ground water loss) and soil (soil erosion).
- 13 -

Another feature of SCEEM which is different from SCNM is in the introduction of twonew concepts of net capital accumulation. One such concept refers to net accumulation ofeconomic assets (IAn,) and another to net accumulation of environmental assets (IAn,,).
Net accumulation of economic assets is defined as the change in the productivecapacity, i.e. capital used in production, including not only produced assets, butalso non-produced economic assets. Net accumulation of environmental assets isthe net change in the quantity and quality of environmental assets as a result ofeconomic activities.
The enlarged concept of net accumulation of economic assets includes net capitalformation and two additional elements related to non-produced economic assets, including anelement representing "investments" in non-produced assets, which result from the transfer ofenvironmental assets to economic activities (I ), and another element representing the depletionof non-produced economic assets (Deplp..). n the case of Mexico, the "investment" elementincludes the transfer of land and mineral reserves to use in economic activities, while thedepletion element refers to the depletion of oil. Depletion of timber and ground water is notincluded in net accumulation of economic assets, as timber and ground water are not treated aseconomic assets (see above page 11 but rather as environmental assets. Also excluded from netaccumulation of economic assets is revaluation of produced assets (RevPX), non-producedeconomic assets (Rev,,,,) and non-produced environmental assets (Rev.W).
The table distinguishes between net accumulation of economic and environmental assetsrelated to Yn1 and Yn2, which are defined as follows:
IAn, = IAn, = In + (In.C - Deplp.eC)
IAn,, = -(Inp.env + Depl., )IAn,,, = -(Inp.env + Depl,,. + Degr,,)
When approaching Ynl and Yn2 from the expenditure side, while using the abovedefinitions of 1AnC and LAnn,, the following identities hold:
Yn1 = C + (IAn,, - LAn,,) + (Ex-M)Yn2 = C + (IAn2. - IAn,,,) + (Ex-M)
Both identities show clearly the change in the traditional national accounts identity, af.erincorporation of environmental assets. Net accumulation of economic assets (IAn) is only partlyreflected in Yn. An important component of net accumulation of economic assets is directlybased on the transfer of environmental assets to economic activities; and this is reflected in anegative entry for IAn.
b. SCEEM Applied to Environmental Concerns
The conceptual scheme explained above is applied below to the three environmentalconcerns separately.
(1) Oil Extraction
The incorporation of the oil extraction concern in Table 111.3.1 is very simple. It includesonly two elements of environmental uses, i.e oil depletion and new finds of oil, both of which areexpressed in physical terms. Oil depletion (1265 million barrels) is shown as an extraenvironmental cost (C &) and a reduction in the value of non-produced economic assets(Deplt,..). New finds o oil (415 million barrels) is presented as an addition to non-producedeconomic assets (Inp.,) and as a reduction in the quantity of environmental assets
- 14 -

ENVIRONMENTAL ACCOUNTS MEXICOSLpply/use Tables & Balance Sheets
Table 111.3.1: Enlarged 110 Scheme with Asset Balances (billion, Mexico pesos)
and Adjustments for Net Changes in Oil Reserves (physical units)
Economic Activities
Environ-
Economic Assets ment Physical
Production Rest of Final Unit of
World Consumption Produced Non-prod. Non-prod. Measure-
Assets Economic Env. Assets ment
Assets
Opening Assets Ko.p.ec Ko.np.ec Ko.np.env
Prod. Asset 111.162310
Oil 71.750 mil. barrels
Economic Supply P MT3tal 75,706,918 4,897.328
Economic Uses CI Ex C ITotal 28.315,216 7,305.293 34,948.891 10,034,840
Depreciation Depr -Depr
5.331,186 (5.331.186)
Environmental Uses:
Oil Extraction Concerns Ci.depl -DepI.npecOil Depletion 1265 (1.265) mil. barrels
I.np.ec -l.np.envNew Finds of Oil 415 (415) mil. barrels
Net Product: EDPI Ynl IAnl.ec IAnl.env
Closing Assets Kl.p.ec KI.np.ec Ko.np.env
Prod. Assets 115,965,965
OL I 70,900 mil. barrels
As a result of the incorporation of these two elements, there are changes in EDP1 ascompared to NDP, and in net accumulation of economic assets as compared to net capitalformation of SCNM in Tables III.1.1 and 2. Even though th' environmental uses are in physicalterms, it is easy to see the direction in which these macro aggregates would change. EDP1 (Ynl)would decrease with the amount of oil extracted (C,) and net accumulation would change as aresult of the difference between what is extracted (Depla,,) and the new finds of oil reserves(L,.). The difference between the decrease of Yn1 and net accumulation of economic assetswould be the decrease in non-produced environmental assets (oil reserves) that are transferredfrom the environment to economic uses (-, ).
The asset balances of oil are presented in the column for non-produced economic assets,which show the following quantitative relation between closing and opening assets of oil in termsof million of barrels
K1 Pe = KO ., - (Depl, - I .e)70900 = 71750 -( 126 - 415)
- 15 -

(2) Defoestation and Land Use
The concern of deforestation and land use is represented in Table 111.3.2. It includesthree separate elements of environmental uses, i.e. the logging of trees as part of the forestryactivity (7626 thousand cubic meters), the transfer of forest land to economic activities inagriculture, livestock holding and urbanization (277589 ha), and finally the losses in terms of treesresulting from the transfer of land from the environment to economic uses (35474 thousand cubicmeters).
The cost of logging of trees is presented as intermediate cost of production (C,) and asforests are treated as environmental assets (see above page 11), a counterpart reduction in non-produced environmental capital (DepL,,.). The transfer of forest land to economic uses isreflected in an increase in non-produced economic capital (I,,.) and a decrease in non-producedenvironmental capital (-InP.,,,). The transfer losses resulting from this transfer of land are shownas intermediate cost of the activity (i.e the construction industry, which is responsible for theoutput called "improvements to land"), which carries out the preparation of land for economic use(C,,,) and a reduction in environmental capital (-Depl,,P.,,).
EDP1 (Y,,) is reduced as a result of logging cost and losses of trees due to the transfer ofland to economic uses. Net accumulation of economic assets (IAn,,) as compared to net capitalformation though, is increased with the amount of forest land transferred to economic uses. Thedifference between the reduction in Yn1 and the change in net accumulation of economic assetsas compared with net capital formation, is entirely reflected in losses of environmental capital aspresented in the column of the environment (-IAn,.,).
The asset balances that are affected by the deforestation and land use concerns are thosefor land in economic uses, which is presented in the column for non-produced economic assets,forest land which is included in the column for environmental assets, and timber which is alsopresented in this column. The three asset balances in quantitative form are as follows:
Kle = KO + I140019157= T5974159 + 277589
land used for econonic purposes (hectares)
K1 * = KOn enw - I55800943 = W785S2- 277589 forest land (hectares)
K1 , = K0n ,m - Depil..K0i68 = 3p125268 - 7626+55474)
trees lost (thousand cubic meters)
- 16 -

ENVIRONMENTAL ACCOUNTS MEXICO
Supply/use Tables & Balance Sheets
Table I1I.3.2 Enlarged 1/O Scheme with Asset Balances (bti0on, Meco pescm)and Adjustments for Changes in Land Use and Deforwstation (physical units)
Economic Activities
Envimn-
xonomi e Assets tent Physical
Productiou Rest of Final Unit of
World Consumption Produced Non-prod. Non-prod. Mear
Assets Econ. Enm. Assets mn
Assets
Opening Assets Ko.p.ec Ko.np.ec Ko.np.env
Prod. Asset 111,162,310
Timber 3,125,268 thou. cu. m
Land 139,741.568 $6,078,532 hectares
Economic Supply P M
Total 75.706.918 4,897,328
Economic Uses Ci Ex C I
Total 28,315.216 7,305,293 34,948.897 10,034.840
Depreciation Depr -Depr
5.331,186 (5.331,186)
Environmental Uses:
Deforestation Concerns Ci.depl -Depl.np.env
Logging 7,626 (7,626) thou. cu. m
Forest Land Transfer to I.np.ec -I.np.env
ec. uses 277,589 (277,589) hectares
-Depl.np.env
Transfer losses 35.474 (35,474) thou. cu. m
Net Product: EDPI YnI IAn1ec -1An1.env
Closing Assets KI.p.ec KI.np.ec Ko.np.env
Prd. Assets 115,865.965
Timber 3,082,168 thou. cu. m
Land 140,019,157 55,800,943 hectares
- 17 -

(3) Degradation
Table 111.3.3 incorporates the effects of degradation. These include soil erosion in terms o. tons of soillust, solid waste materials resulting from household activities -- also in tons -- , ground water used .n terms ofthousand cubic meters, water pollution in terms of the Bio-chemical Demand for Oxygen (DBO) used by natureto destroy the foreign substances in the water, and finally air pollution in terms of tons of various chemicals thatare emitted by industrial production processes. The cost of degradation is presented as environmental cost ofproduction (Ci&), with counterpart entries in the column for the environment, representing the deterioration ofenvironmental capital (-Degr,,).
The effect of including these environmental uses is to lower EDP2 (Yn2) in comparison with NDP (Yn)included in the traditional SCNM. There is no effect on net accumulation, as all degradation effects arerecorded as affecting non-produced environmental capital (see Section II.A). The difference between thenegative effect on Yn2 and no effect on net accumulation of economic assets as compared to net capitalformation is entirely reflected in the degradation effects reducing the quality of environmental capital (-Degr.,)presented in the column of the environment.
c. Comparison between SCNM and SCEEM Aggregates and Analyses, in Monetary Terms
In order to overcome some of the limitations of the above analysis in physical terms, a parallel d.iaiysis inmonetary terms is presented below. The monetary values are derived by applying the valuations as described inSection II.B.2 in general terms and presented in the Annexes in more detail.
The monetary analysis is presented in two tables. Table 111.4.1 includes the monetary valuation of thedepletion and land use concerns, including oil extraction, deforestation and land use concerns. The table arrivesat a concept of EDP1 (Ynl)as defined earlier in Table 1II.2. Table III.4.2 presents a similar analysis in monetaryterms for the degradation effects which are added in this table to the monetary valuation of the depletion effects.After incorporation of both effects in the latter table, the concept of EDP2 (Yn2) is obtained.
(1) EDP]
Table 111.4.1 reflects in monetary terms the same environmental effects as presented in tables 111.3.1 and111.3.2. By applying valuations to the elements of the depletion concerns related to oil, deforestation and landuse presented in those tables in physical terms, estimates are obtained for EDP1 and also for net accumulationof economic assets (IAn,,) and environmental assets (-IAn). The net product and corresponding expenditureitems are presented on the line for EDP1. As different values have been used for opening and closing stocksand flow items, revaluation elements (Rev,,,. & Rev,,,.) have been incorporated additionally in the table.
The national accounts identity without environmental adjustments, which was in Table 11.1.2 formulatedas:
Yn = C + In + (Ex - M) or,in quantitative terms:42060516=34948897+4703654+(7305293-4897328)
changes in Table 111.4.1 to:
Ynl = C + (IAn, - IAn,,,,) + (Ex-M)or 39662772=34948897+(24245455-21939545)+(7305293-4897328)
The elements in the above expression that have changed are net product and net accumulation. All otherelements are unaffected.
- 18 -

ENVIRONMENTAL ACCOUNTS MEXICOSupply/use Tables & Balance Sheets
Table 111.3.3: Enlarged 1/O Scheme with Asset Balances (billion, Maico peso)and Adjustments for Degradation of Air, Water and Land (physical units)
Economic ActvilesEnviron-
Economic Assets ment Physical
Production Rest of Final Unit of
World Consumption Produced Non-prod. Non-prod. Measure-
Assets Econ. Env. Assets meat
Assets
Opening Assets Ko.p.ec Ko.np.ec Ko.np.envProd. Asset 111,162,310LandWaterAir
Economic Supply P MTotal 75,706,918 4.897,328
Economic Uses Ci Ex CTotal 28,315,216 7,305.293 34.948,897 10,034.840
Depreciation Depr -Depr5.331.186 (5,331186)
Environmental Uses:Degradation Concerns Cidepl -Degr.np.env
LandSoil Erosion 420.992,059 420,992,059 tonsSolid Wastes 18,'28,157 -18,228,157 tons
WaterGround Water Use 2,456 .2,456 thou.cu.mWater Pollution 2,359,275 .2,359,275 tons DBO
AirSulfur Dioxide 6,646,070 .6,646,070 tons
Nitrog. Oxides 1,804,408 -1,804,408 tonsHydrocarbons 2,383,030 -2,383,030 tons
Carbon Monoxide 17,967,872 .17,967,872 tons
Suspended Particles 477,529 477,529 tons
Net Product: EDP2 Yn2 IAn2.ec (=LAn1.ec) *IAnL.env
Closing Assets KI.p.ec KI.np.ec Ko.np.env
Prod. Assets 115,865,965LandWaterAir _ _ _ _ _ _ _ _ _ _ _ _ __ _ _ _
The table includes revaluations for oil, timber and land. The revaluations for oil andtimber are residuals obtained as the difference between the value of closing minus opening stocksand the net changes due to new finds and depletions, which are all valued separately. Therevaluation of oil and timber therefore includes two elements: the first one refers to the change in
- 19 -

the value of resources remaining between the opening and closing balance sheets, and the secondelement reflects the revaluation of the extracted oil or timber between the opening balance sheetand the moment of extraction.
The revaluation for land used in economic activities is negative. The reason is that land istransferred at its value as forest land, which is derived as the sum of discounted revenues accruingif all timber would )c harvested for purposes of lumbering; this value was estimated to be 38.15million pesos per ha. Once incorporated in the column for non-produced economic assets at thisvalue, the land is then revalued to the value per ha of its use in economic activities. In mostinstances this value was much lower than the value per ha of forest land (agriculture: 2.64 mill.pesos/ha; livestock holding: 1.99 mill. pesos/ha); forest land that was changed to waste land afteruse in shifting agricultural cultivation was assumed to have no value after this use. In the case ofurbanized land, the value was higher, i.e. 75.50 mill. pesos/ha. As a result of these generally lowerland values in economic uses, the revaluation element (-18290) is negative in Table 111.4.1.
The valuation used for oil and timber in Table III.4.1 is the net rent value, i.e the marketvalue minus cost including a normal profit. An alternative value proposed by El Serafy (1989)suggests that both oil and timber be valued as the sum of discounted values of depletionallowances which would be needed to secure a continuous income stream (after deduction of thedepletion allowance) even after the natural resource has been depleted. Both for oil and timberthe depletion allowance is much lower than the net rent. For oil the net rent is 1162 pesosMex./barrel and the depletion allowance is only 160 pesos Mex./barrel; for timber the net rent is21.527 pesos Mex./cubic meter, while the depletion allowance is only 1.46 pesos/ cubic meter. Ifthese much lower valuations would be applied to the extraction of oil and timber, the cost ofdepletion would be much lower and thus EDP1 would be higher. The quantitative result of thesealternative valuations as presented in Table III.4.1. supplement, shows that EDP1 would increasefrom 39662772 to 41795147, and the element of revaluation due to extraction would becorrespondingly decreased with the same amount from 84820456 to 82688082.'
) The large differences between the two valuations are due to the long period in which oil andtimber would be available. Several questions may be asked with regard to the alternative valuation.Would it indeed be feasible to find in a country like Mexico alternative investment potential thatwould be able to absorb the depletion allowances of oil and timber production. If that were the case,why would oil and timber not be exploited more rapidly? However, if resources were exploited morerapidly, prices of the products (oil and timber) may drop as a result of increased supply, andalternative investment possibilities may be reduced, which would result in lower interest rates. Thiswould mean, that in the long run, the net rent method and the El Serafy method proposed by ElSerafy (1989) may result in similar valuations.
- 20-

ENVIRONMENTAL ACCOUNTS MEXICOSupply/use Tables & Balance Sheets
Table 111.4.1: Enlarged 110 Scheme with Asset Balances and Adjustmentsfor Oil Depletion, Land Use and Deforestation
(billion, Mexico pesos)
Economic ActivitiesEnviron-
Economic Assets mentProduction Rest of Final
World Consumption Produced Non-prod. Non,prod.Assets Econ. Assets Env. Assets
Opening Assets Ko.p.ec Ko.np.ec Ko.np.en.
Prod. Asset 111,162,310
Timber 46,988,404
Oil 66.584,000
Land 339,259,491 1,483,758,406
Economic Supply P M
Total 75,706,918 4,897,328
Economic Uses Ci Ex C I
Total 28,315,216 7,305,293 34,948,897 10,034,840
Depreciation Depr -Depr
5,331,186 (5,331,186)
Environmental Uses:
Oil Extraction Concerns Ci.dept -Depl.np.ec
Oil Depletion 1,469,930 -1,469.930
New Finds of Oil I.np.ec -I.np.env
482,320 -482,230
Deforestation Concerns
Logging 164,165 -Depl.np.env-164,165
Forest Land Transf.
to ec. uses I.np.ec -. np.env
20,529,501 -20,529,501
Transfer Losses 763,649 -Depl.np.env-763,649
Net Product: EDPI YnI Ex - M C IAn2.ec: 24,245,455 -lAnl.env
39,662,772 2,407,965 34,948,897 -21,939,545
Revaluation Rev.p.ec Rev.np.ec Rev.np.env.
Prod. AssetsTimber 32,368,256
Oil 52,452,200
Land -18,290,522
Closing Assets Kl.p.ec K1 np.ec Ko.p,ec
Prod. Assets 115,865,965
Timber 78,428,847
Oil 118,048,500
Land 341,498,470 1,463,228,905

(2) EDP2 Table 111.4.1, Supplement
Tabl 1114.2presntsthe ameEDP and Asset Balances AlternativelyTable III.4.2 presents the sameVaudothBsiofNtRndegradation elements as were included in and A Dpetio AllowanTable 111.3.3 in physical terms. Theelements are valued along the lines as (billion, Mexico pesos)described above in Section II.B.2, usingvaluations which are presented in thetables in the Annex for each of the Opening Stockdegradation concerns. All counterparts of Timber 46,988,404the degradation cost presented as CId,& Ir Oil 66,584,000the column for production are included inthe column for the environment. None of Oilthe degradation therefore affects net New Finds of Oil 482,230accumulation of economic assets: the only Depletioneffects are on net accumulation of Valued on Basis of:environmental assets (IAn.). Net R2nt (1,469,930)
The revised national accounts Depletion Allowance (202,400)identity is presented in the row of netproduct, i.e. Timber, Net Reduction
Valued on Basis of;Yn2 = C + (IAn,. - IAnu) + (Ex-M) Net Rent (927,814)
or 36448314=34890558+(24245455- Depletion Allowance (62,969)25095664) +(7305293-4897328) Adj. to EDP1 2,132,375
which is different in a number of respects EDP1 39,27from the traditional identity in SCNMdefined in Table 111.1.2 as Revaluation, Based on
Yn = C + Ia + (Ex - M) or, Depletion Allowance 82,688,082in quantitative Net Rent 84,840,456terms:420605 16=34948897+4703654 +(730 Adj. to Revaluation (2,132,375)5293A4897328)
Closing StocksNet capital accumulation of Timber 78,428,847
economic assets minus that of Oil 118,048,500environmental assets is negative ascompared to a positive value for capitalformation in economic accounting, andthis results in a much lower value for Yn2 as compared to Yn. It should furthermore be notedthat in the derivation of Yn2, an additional deduction has been made for environmental servicesprodvced by the government in the form of sanitation services. They are treated as intermediateconsumption of (domestic) household production activities. As these expenditures (58339) aredealt with as final expenditures in SCNM, this treatment lowers final consumption (C) from34948897 (in Table 111.1.2) to 34890558 and correspondingly reduces Yn2 further as comparedwith its value in previous tables.
- 22 -

Table IIL4.2- Enlarged 1/O Scheme with Asset Balances including Adjustmentsfor Degradation and Environmental Protection Expenditures
(billion, Mexican peso)
Economic ActiMties Environment
Production Rest of Final Economic Assets Non-producedWorld Consump- Env. Assets
dion Non-prod.Produced Econ.Capital Assets
Opening Assets Ko.np.ec Ko.np.ec Ko.np.envProduced Assets 111,162,310 46,988,404TimberOil 66,584,00Land 339,259,491 1,483,758,406WaterAir
Economic Supply P MTotal 75,706,918 4,897,328
Economic Uses Ci Ex C I I ITotal 28,315,216 7,305,293 34,948,897 10,034,840
of which: Env. P.envp P.envpProtect. services
Industry 92.855 291,385Households 58,339
Depreciation Depr -Dept5,331,186 I -5,331,186
Environ. Uses Ci.depl Lap.ec -Depl.ap.envOil Extraction, Deforest. -Depl.np.ec& Land Use Concerns(total) 2,397,744 19,541,801 -21,939,545
Degrad. Concerns Ci.degr. -Degr.np.env.LandSoil Erosion 448,880 -448,880Solid Wastes 197,269 -197,269
WaterGround Water Use 191,568 -191,568Water Pollution 662,456 -662,456
AirSulfur Dioxide 234,792 .234,792Nitrog. Oxides 137,442 -137,442Hydrocarbons 127,409 -127,409Carbon Monoxide 1,072,826 .1,072,826Suspended Particles 83,427 -83,477
Sub-total Degradation 3,156,119 -3,156,119
Net Product: EDP 2 Yn2 Ex - M C IAn.ec2 (-IAn.ecl) *IAn.eav236,448314 2,407,965 34,890,556 24,245,455 -25,095,664
Degradation Rev.p.ec Rev.np.ec Rev.np.envProduced AssetsTimber 32,388,256Oil 52,452,200Land -18290,522
Closing Assets Kl.p.ec Kl.p.ec Kl.p.ecProduced Assets 115,865,965Timber 78,428,847Oil 118,048,500Land 341,498,410 1,463,228,905WaterAir
-23-

The incorporation of values for output of environmental protection services in the table,permits to compare those with the corresponding degradation effects. From the macropresentation in Table 111.4.2 it can be observed that the total value of environmental protectionservices (151194=92855+58339) is only 5% of the total value of environmental degradation cost(3156119). It is questionable, however, how to interpret these figures, as it is not certain whetherthe degradation effects measured are gross, i.e. beforc the protection services were carried out, orare net values after incorporation of the effects of these services. Given the manner in which thedegradation effects are estimated, however, it is more likely that at least some of the effectsmeasured are gross effects and that therefore there is some double counting, because the cost ofenvironmental protection services and the degradation they try to eliminate are deducted at thesame time to arrive at EDP2.
(3) Comparative Analysis of EDP1 & EDP2
The analysis presented above is summarized in Table 111.5 below. The table shows indramatic form, how changes in net product from NDP to EDP1 and EDP2 would haveconsequences for analysis. In the case of NDP, the table shows that final consumption is 83% ofNDP and net capital formation is 11%. When changing to EDPI, final consumption increases to88% of EDPI and net capital accumulation is less than 6%. It is true that net accumulation ofeconomic assets would be nearly 12% of EDP1, but the effect of this increase is eliminatedbecause a large part of the net accumulation in economic assets is directly taken from theenvironment (the environmental capital is reduced by 6% of EDP1). When extending theanalysis to EDP2, final consumption is further increased to nearly 96% and net capitalaccumulation becomes a negative -2%, which is the net result of an increase in net accumulationof economic assets to nearly 13% of EDP2 and a decrease of environmental capital whichamounts to -15% of EDP2.
Table 111.5: Comparative Analysi of Expenditure Distributionof NDP, EDP1 and EDP2
NDP % Distr. EDPI % Distr. EDP2 % Distr.
I Expend. Expend. Expead.
Net Product/Expenditure 42,060,516 39,662,772 36,448,314
Final Consumption 34,948,897 83.09 34,948,897 88.12 34,890,558 95.73
Capital Accumulation, Net 4,703,654 11.18 2,305,910 5.81 -850,209 -2.33
Economic Assets 4,703,654 11.18 4,703,654 11.86 4,703,654 12.90Environmental Assets -2,397,744 -6.05 -5,553,863 -15.24
Exports-Imports 2,407,965 5.73 2,407,965 6.07 2,407,965 6.61
- 24 -

B. ANALYSIS BY ECONOMIC ACTIVITIES
1. Comparison of SCNM and SCEEM Aggregates by Economic Activities
The analysis above of environmental impacts on economic aggregates has been carried outin macro format, showing how main aggregates of net product are affected by the incorporation ofdepletion and degradation effects, how net capital formation changes into a concept of netaccumulation which refers to all economic assets, produced as well as non-produced, and finallyhow final consumption and net product are affected by a different treatment of environmentalexpenditures that are included in final consumption of SCNM. While such macro analysis isuseful, it does not provide the information that would be needed for operational governmentpolicies. Therefore below, the analysis has been extended to identify the depletion anddegradation effects by economic activities and determine the sectors which are using the economicassets in their production processes. The sectoral analysis focuses on three elements, i.e. valueadded, balances of economic assets including produced as well as non-produced assets, and alsothe environmental protection expenses made by different sectors. The quantitative results of thisstudy are reflected in Tables 111.6.1 and 111.6.2.
(a) Value added
Table 111.6.1 presents a breakdown of the production data by economic activities, includingnot only the traditional output and intermediate consumption components, but also the values ofdepletion, degradation and land use effects. Environmental protection expenditures are alsoidentified in the table for each industry and (domestic) household production activities, andpresented as "of which" items that are reflected in the output and intermediate consumptionfigures of each industry. The net product concepts -- NDP, EDPl and EDP2 -- have beenidentified in each of the three sections of the table: NDP is calculated first, followed by EDP1after incorporation of the depletion and land use effects, and then EDP2 is calculated afterincorporation of the degradation effects. The environmental uses presented are the same as inTables 111.4.1 and 4.2; the totals for the national economy between the present table and theprevious two tables coincide.
An additional economic activity called household production activities is introduced inorder to allocate the environmental impacts of household consumption. This column will not onlyinclude the environmental impacts of household consumption, but also the environmentalexpenses made by households. The environmental protection expenses made by government onbehalf of households, which are treated in SCNM as final consumption and thus added to NDP,are deducted in the table for the calculation of EDP2 in the same manner as this was done inTable 111.4.2 above.
The oil concern presented .n the table only covers oil depletion which is recorded asenvironmental cost of the oil industry. New finds of oil are not dealt with in this part of thetable, as they are treated as net accumulation of economic assets with a counterpart negativeentry for net accumulation of environmental assets. The oil industry includes only extraction andnot refining.
- 25 -

Table 111.6.1: Bmakdon o( Prod:Dio ta by Econmc Aciites_ _ ~~~(bln, M0ican pesos)_ _ _ _ _ _ _ _ _
m 1 1 1 Transpot, Other usold ToalFarming Faing, Other Marnuac- Eectric, C ~osuc Trade. Stge & Scrvis Gove~nara Pto on Productaanand Foreuy Hunting Ou MiRMng tuudag a Water tion Ht4es & cona . (-~Iug Servces Activities ActiviicsElt-dg etc. estaurait tion Gav~ement
____W __ 3,241,866 2~28.331 U83.943 249,551 1,901,465 900,951 25,874.013 90798 4 862 16.014.145 4,596.322 12.637004 2.016522 0 75,799773Eä~ u*=ca
w619,948 1.0n,947 _ 35,676 94.512 229,920 354,982 14,805,379 451,937 2,827,735 2.707.691 1,431,195 3.180,714 664,435 28,408,071
Protection sevics767 12,555 4,155 5,162 68,747 1.469 92,855
Housch~id1 58.339 58.339
lDepeciati-o 261,074 171.435 22,05 20,097 200,091 138,686 2,285,025 139.029 351,550 231.712 761,207 764,701 3.774 5.3.16
N1N0? (Ya) 2~360,844 1,j09,949 225,462 134.942 1,473,454 407,283 8,783,609 329,832 1,7t8,577 13,074,742 2,403,920 8,691,589 1.3313 42.00.51Efnvit~an- Use: Cdepl
Oi Canrnsoiu Depet" 1,469,930 1.469,930O New Fuis of oil
Dere. CarnsWoods 164,165terest Land Tnsf.36.6
Lo c.ds 164.165Transfer lsse 137,87 517,983 53,602 myn f 763.649
EDI (Ytl) 2,M2.157 591.966 61>27 134942_ 1,524 407,283 8.783.609, 329,832 1.664,975 13,074,742 2403,920 8,693,589 1.293,936 0 39.662.772D ~s
Ci. degr
LandSm E~osion 107,709 250,701 98,470 448.8WSolsdmWastes
197.269 197.269WaterG ~ound Water use 86,582 830 14,173 1,204 280 23,453 67,046 191,568Wager Potllon 424.849 237,607 662,456Pit
SD 6,709 12,275 197.697 13,602 3M87 623 234,792Ntg 3,164 11.629 48,394 56,901 1,515 15,839 137,442Hyd- ~ 21,795 11,299 580 54,726 32 38,976 127,409C MO 40,384 4,992 3.222 613,876 139 410.223 3,072,826Suspeaded Par. 2,592 9,464 59,537 5.918 2,153 3.813 83,477EDP2 (Yn2) 2,028,866 340,435 -29,173 134,942 73,I20 407,283 8,294.927 19.28 1,664,975 13,074.742 1,658,898 8,683,582 1,272.483 1.029.735 36,44,334

The deforestation concern includes two elements, i.e. logging and transfer losses due tothe transfer of environmental land to economic uses. The depletion cost of logging is allocated tothe forestry industry. Reforestation is assumed to be the result of forestry activities and thereforededucted from trees lost through logging of timber in forestry. The transfer losses are allocatedto agriculture and animal farming and breeding, insofar they concern the losses due to transfer ofenvironmental land to these economic activities. Losses allocated to agriculture also includelosses due to forest fires and losses of trees due to the conversion of forest land into waste land;allocation of these losses to agriculture is based on the assumption that these losses are caused,for example, by shifting cultivation. Transfer losses due to the transfer of land for urbanizationpurposes is allocated to the construction industry, as this industry includes all the cost related toconstruction for purposes of urbanization.
Soil erosion is only identified for agriculture, animal farming and breeding, and forforestry. Ground water use is only measured for agriculture, animal farming and breeding,manufacturing, other services, government services and household production (i.e. consumption)activities.
Air and water pollution are mainly allocated to the oil industry, manufacturing, electricityproduction, transport, other services and household production activities. Solid wastes areassumed to be only generated by households in their capacity as consumers. Therefore allenvironmental impacts of solid wastes have been allocated to the column for householdproduction activities.
(b) Capital Stock and Capital Accumulation
The balances of economic assets by economic activities are presented in Table 111.6.2.The rows of the table include, for each sector, asset balances for produced assets and relevantnon-produced assets. The table distinguishes between fixed assets and stocks. For the fixedassets, the asset balances include as columns the opening and closing stocks, gross fixed capitalformation, consumption of fixed capital and net accumulation of economic, non-produced fixedassets. The closing balance of fixed assets is equal to the opening balance plus gross fixed capitalformation, minus consumption of fixed capital plus net accumulation of non-produced economicassets. For stocks, the asset balances also include the opening and closing stocks as well asseparate columns for changes in stocks of produced assets and non-produced assets. In thissection of the table, closing stocks are equal to opening stocks plus changes in stocks of producedand non-produced assets.
The table refers exclusively to economic assets that are used in production and thuscontribute directly to the generation of output and value added. The non-produced economicassets included in the fixed asset section of the table refer only to land used for agriculture,animal farming and breeding and land used for purposes of urbanization. The non-producedeconomic assets included in the stock section of the table cover only oil reserves. Other non-produced assets, such as standing timber, forest land and also air and water are not included inthe table as these are treated as non-produced environmental assets.
Non-produced assets specified by industry are land used in agriculture and animal farming,and oil reserves depleted by the oil industry. Land used for purposes of urbanization is allocatedto a group of industries together which include all except agriculture and animal farming, forestry,and oil and other mining.
- 27 -

Table 1l.6.2 Balance Sheets for Produce and on producal Economic Assets. Classiftil by Economic Activiles(Million, MVXICAA PCss)
Net Capital Acumalation (iocludiai revaluation) Changes in StocksopenlygConcept Balance Fiued Produced Ascet cloi Balaac Opcning Baloe Closing BalanceAssets Non Produced Fixed Assets Stocks Produced Ases Non Prodvod StocksOsass Facd C*p Consumption of Assets Econosc Asscasformasto Foaod Capital
TotalProduced Aacts 103,156,227 9,048,296 5.331,186 106,873,338 8.006,083 986.544 892.627Non-produced Asacts 339,259,491 2.238,979 341.498,470 66,584.000 51.464,500 118,048,500
Agricultureproduced Assets 5.559.424 398,062 261,074 5,696,412 61,472 -16,448 45,024Non-produced Assets Land Use 91,575,665 95,790 91,671,455
Amnal Farming and BroodingProduced Assets 3.797,518 280.611 171,435 3,909,994 155,676 80.981 236.57Non-produced Asase Land Use 207.572,243 434,336 208,00,579
Forcstry: Produced Assets 485,614 34,771 228,805 497,580 79% 8.82) 9,o7* Fashing: Produced Assets 427,951 10,642 20,097 434.496 38,916 7,774 46,700PX E-racton of Crude Ol & Gas
Produced Asseset 5,235,811 167.754 200,091 5,20l,474 246,185 26,583 272,768Non-produced Assetsa OilNew Findings: Oil
482.230Depetion. Oil 1.469.930Revaluation ut Reserves
52.452.200Sub-lotal 66,5M.000 51.4<4,500 118 048.500
Minings (excluding Oil)Produced Assets .388,660 962.285 138,686 1.346.259 125,276 6,325 131.401
Sub-total Other Industries:Produced Assets 86.261.250 8,040,171 4,516,998 '89,784,423 7.377.752 872,708 8.250,4,0Masnufacturnat 21,863,054 2,202,818 2.280,025 21,780,847 4,755,565 398,318 5,1513.882Constructon 3.172.062 570,380 353,550 3,190.892 313,403 25,017 338.440Elec., Gas and Water 7,321,S40 1,184,763 119,029 8,387,274 64,573 4,266 68,dwTrade, staurant & Hotls 12,680,012 1.184.119 237,712 13,632,419 1,949,790 386,695 231,48 ,Communicaton adn TramsP 21,974,698 1,609,092 761,207 22.822,583 98.164 19,468 I 7.32Services 19,249,884 1,28,998 764,701 .9,774,181 196,258 38,923 235.181Public Admin. and Defense 3.774No 40,311,582 1,708,853 41,820436
a-produced Asacts: Land Use
* The tloing balan of fixed maets n00orsca a deductioa for consumption of fixed assets for goiermat assets, even though no stocks of assets are measured for the government swor.

The balances of produced assets by economic activities were especially compiled for thepurposes of the present analysis in order to be able to determine the total stock of produced aswell as non-produced assets used in production. Opening and closing balances of produced fixedassets and stocks are obtained for all sectors, except for the government sector (publicadministration and defense).
Two revaluation elements are incorporated implicitly. The first one refers to revaluationof land when it is transferred from the environment (forest land) to economic uses. Contrary towhat was done Table 111.4.1 where land transferred was valued as forest land, land transferred toeconomic uses is valued in Table 111.6.2 at its value in economic uses (in agriculture, livestockholding and urbanization). Therefore, any change in its value from forest land to land used foreconomic purposes is not explicitly presented in the table but included with net accumulation ofnon-produced economic assets. The other revaluation element concerning oil is explicitlyincluded in the stock section of the table as changes in stocks of non-produced assets.
2. Comparative Analysis of Performance and Growth in SCNM and SCEEM
The information on value added and capital balances by activities can be used to assesseach sectors' performance and growth potential, using alternatively estimates that are linked toNDP, EDPI and EDP2. This is done in Tables 111.6.3 and 111.6.4 below. Table 111.6.3 has threesections, i.e. one presenting alternative distributions of NDP. EDPI and EDP2 by economicactivities, a second section comparing the distribution of capital when using NDP or EDPI, and athird section comparing capital output ratios between the three types of concepts. Table 111.6.4compares the environmental protection expenses made by each sector with the correspondingvalues of degradation effects.
The first section of Table 111.6.3 shows that there is a considerable change in thedistribution of value added when environmental uses are incorporated. The sectoral contributionsnegatively affected are those of animal farming , forestry. and oil: The contribution of animalfarming drops from 2.64% for NDP to 1.49% for EDP and to .93% for EDP2; the contribution offorestry drops from .54% through .15% to a negative contribution of -.08%; the oil sector'scontribution drops from 3.50% through 0.00% to a negative -.20%. There are three sectors'contributions that increase or remain the same in the case of EDP1 and decrease again whendegradation effects are taken into account for EDP2: The first sector is agriculture whosecontribution remains the same between NDP and EDPI (i.e. 5.61%) and decreases in the case ofEDP2 to 5.57%; the contribution of electricity, gas and water increases from .78% to .83% in thecase of EDPI and decreases to only .05% when also degradation effects are taken into accountfor EDP2; transport, storage and communication is the other sector whose contribution increasesfrom 5.72% to 6.06% for EDPI and then decreases to 4.55% in the case of EDP2. On the otherhand, the manufacturing contribution increases from 20.88% of NDP to 22.15% of EDP1 and22.76% of EDP2, and the same applies to construction (4.09% of NDP, 4.20% of EDPI, 4.57%of EDP2) and there are minor increases for services, which are generally less depleting ordegrading.
The second section of the table shows the changes in the distribution of capital betweensectors, first including only produced assets (CAP), which is compatible with the concept of NDP,and then including produced as well as non-produced economic assets (CAPI), which iscompatible with the concept of EDP1. CAP and CAP refer to average stock of capital betweenopening and closing stock, including changes in the closing stock due to revaluation. Only aCAP1 concept compatible with EDP1 is used. as there is no change in the stock of economicassets between EDP1 and EDP2. The changes in the capital distribution are particularly dramaticfor agriculture whose capital contribution increases from 5.00% to 23.77%, animal farming where
- 29 -
the increases is from 3.57% to 51.74%, and for oil where it changes from 4.83% to 23.89%. Theincrease is matched by a dramatic decrease in the capital contribution of other industries whichdrops from 84.43% to 33.42% in spite of the land used for urbanization, which is included in thiscategory.
The considerable changes in the value added contributions to net product and capitalparticipations of each sector between NDP, EDP1 and EDP2, result in equally drastic changes inthe third section of the table which examines the output/capital ratios, that are an indication ofproductivity in each sector. For agriculture (41.56% to 2.28%); animal farming (27.42% to .28%),forestry (45.38% to 12.34%) and oil (26.86% to 0.00%) there are considerable reductions, and forother industries there are minor reductions (37.93% to 26.49%). For the economy as a whole,this results in a reduction of the output capital ratio from 37.05% to 9.69%.
When comparing in Table 111.6.4 the current and capital expenses by each industry onenvironmental protection services with the imputed value of degradation effects, there are alsolarge differences. The average value of environmental protection expenses as a percentage of thetotal value of degradation effects for the economy as a whole is 23.26%. The percentage forindividual indutries is very high--i.e. more than 100%--for other mining and for electricity, gasand water. It is very low--i.e. less than 5%--for agriculture, animal farming and breeding, forestry,manufacturing and transport, storage and communication. Average percentages are found for oil,other services and also for household consumption.
- 30 -

Table 111.63 Net ProdO Oeneatd and Econon Aset Used in Emomic Activt~aComparathe Analysåi Bewen NDP, EDPI and EDP2
(bilgion, Mexican pe~ce)
7~=anpo rI,- OterHoseo~ Tota~ ad Fg~ other Manufa- Elcic, onst~e Trae Storage & Servce GOe¥ men "u-TGWa PMouc~o Producio* n F ty fHuntin, oi Mining turing Oas, fion hotes & Comn~mca- (xcldin Sevices Other Activta Activtcsetct n OvrnCMnt lådlorlca
Net ProdcNDP 2, 4 1,109,949 225,462 134,942 t,47t454 407,3 8 09 3 2 1.718,577 13,074742 403 891 1,348313 36,350,582 42.060,516% D~bu~ S.6 24 0.54 032 3.50 0.97 20.88 0.78 4.09 31.09 5,72 2066 321 8642 10000Ft-r 2,223,1s7 59.966 61,297 134.942 1,524 407,283 8.783,609 329,832 1.664,975 13,074.742 2,403,920 8,691,589 1,293.936 36,242.603 39.662.772%Distrbuhtin 5.61 1.49 0.15 0.34 0.00 1.03 22.5 083 420 32.96 606 2191 326 9138 10000E ion 340,435 -29,173 134.942 -73,120 407>3 8,294927 190 1,664.975 13,074,742 1,658.9 8.685 1272,83 34.668.815 -1,029,735 36,448,314
Used
DC trbuio 5,81,365 4,048,27 49680 476,03 5,479.J 1 ,495,798 26,776,674 7,923,31 3,607,399 35,299,353 22,506,538 39,727,752 Non 95ß838,829 Non- 113,516.025CAP 1 97,304,725 211ß837,664 496,803 476,037 97,795,369 3,495,79238 6.9 3333A 98 78 vibe843 app9ica6e,4000% DIidburoO 23.77 53.74 0.12 0.12 23.89 0.37 3342 40000
OutpnutCapitaIRatios (%)
NDPICAP 43.56 27.42 45.38 28.35 26.86 27.23 32.80 4.36 4764 85.46 30,68 44.06 37.93 3705EDP~ CAPI 2.28 0.28 1235 28.35 0.00 27.23 4.55 26.49 969
Be =A~ ., = --

Ta 4e 11.4 intcral Cmparson Between the Imputcd Cost ot EnCronmm~UDepadation and Envunnoomma Protection Expend,itrea~ m (w4 o, Mca pes) ___
_
Traspo~. Other 1 Husehod Toalnd O0her Manufac- Wecic, ConstrAc. Tkade, Storage & Servic~ Goement Sub-Tota Psdu~so Produco"~% g a Mni sug Gas, 1 oe o 1m - (emluding Services Other Activitie Actvtiestc- 2Water Retaurant tion Governmcn 1Industrie
194.291 251,531 90140 4~ 488,681 310,624 745,022 8,007 21.453 1,573,87 971.3% 3.156,119ErannsenctalProtect. Expend.
C767 12,555 4.155 5,162 68,747 1,469 75378 58.339 251.194TOW X128 6.472 7,320 4 319,522 654 320.180 245.670 582.770lota 3,895 9,027 11.475 5.166 388.269 2,123 395.558 304.009 733.964
Ptec. Ee~nAs % of Egv
Degradaru 431 25.49 Veyigh 5.06 125.00 26.52 AppbcaLe 2513 31.30 2326- - -- - - -- jj

IV. REFERENCES
Ahmad, Y.J., S. El Serafy and E. Lutz (eds.) (1989). Environmental accounting for sustainabledevelopment. Washington, D.C.: The World Bank.
Bartelmus, P. C. Stahmer and J. van Tongeren (1991). Selected Issues in IntegratedEnvironmental-Economic Accounting. International Association for Research in Incomeand Wealth. Special Conference on Environment Accounting, Baden (Austria) May 1991
El Serafy, S. 1989. "The proper calculation of income from dcpletable natural resources". InAhmad, El Serafy and Lutz (1989)
Lutz, E., and M. Munasinghe. "Accounting for the Environment." Finance and Development,Vol. 28, No.1, March 1991, p. 19-21.
Repetto, R. and others k1989). Wasting Assets. Natural Resources in the National IncomeAccounts. World Resources Institute, Washington, June.
United Nations (1990). Revised systr-m of national accounts, preliminary draft chapters(provisional).
United Nations (1990). SNA Handbook on Integrated Environmental and Economic Accounting,Preliminary Draft of Part I: General Concepts. New York October 1990.
World Bank (1991). "Mexico in Transition: Towards a New Role for the Public Sector," ReportNo. 8770-ME, May 22, 1991.
- 33 -