Integrated Distribution Planning Concept Paper - ICMA...Integrated Distribution Planning Concept...
24
Integrated Distribution Planning Concept Paper www.irecusa.org A Proactive Approach for Accommodating High Penetrations of Distributed Generation Resources May 2013
Transcript of Integrated Distribution Planning Concept Paper - ICMA...Integrated Distribution Planning Concept...

Integrated Distribution PlanningConcept Paper
www.irecusa.org
A Proactive Approach for Accommodating High Penetrations of Distributed Generation Resources
May 2013

Integrated Distribution Planning Concept Paper
A Proactive Approach for Accommodating High Penetrations of Distributed Generation Resources
Tim Lindl and Kevin FoxInterstate Renewable Energy Council, Inc.
Abraham Ellis and Robert BroderickSandia National Laboratories
May 2013

IREC enables greater use of clean energy in a sustainable way by (i) introducing regulatory policy innovations that empower consumers and support a transition to a sustainable energy future, (ii) removing technical constraints to distributed energy resource integration, and (iii) developing and coordinating national strategies and policy guidance to provide consistency on these policies centered on best practices and solid research. The scope of IREC’s work includes updating interconnection processes to facilitate deployment of distributed energy resources un-der high deployment scenarios.
This report was prepared as an account of work sponsored by a number of funding sources. No funders make any warranty, express or implied, or assume any legal liability or responsibility for the accuracy, completeness, or usefulness of any information, apparatus, product, or process disclosed. Reference herein to any specific commercial product, process, or service by trade name, trademark, manufacturer, or otherwise does not necessarily constitute or imply its en-dorsement, recommendation, or favoring by IREC or its funders.
Sandia National Laboratories is a multi-program laboratory managed and operated by Sandia Corporation, a wholly owned subsidiary of Lockheed Martin Corporation, for the U.S. De-partment of Energy’s National Nuclear Security Administration under contract DE-AC04-94AL85000.
The authors are grateful to Roger Hill, Steve Steffel, Eran Mahrer, Jennifer Szaro, Michael Sheehan, Joseph Wiedman, Sky Stanfield, Erica Schroeder, and Laurel Passera for their review of this paper.
© Interstate Renewable Energy Council, Inc., May 2013

1Integrated Distribution Planning Concept Paper
PLANNING FOR HIGH PENETRATIONS
In many parts of the country, legislative and regulatory promotion of renewable generation at the distribution-level (“distributed generation” or “DG”) has significantly expanded the installed ca-pacity of DG interconnected to utility distribution systems. It has also greatly increased requests to interconnect DG. In areas with the most robust DG growth, applications to interconnect new generation, particularly solar photovoltaic (PV) generation, have overwhelmed utility intercon-nection processes and caused project delays and, in some cases, prohibitive cost increases. In areas where DG penetration (installed DG capacity relative to customer load) is already high, these delays and increased costs have slowed DG growth and resulted in public criticism of utili-ties’ interconnection processes.
A well-designed interconnection process can contribute significantly to facilitating DG growth. Interconnection processes aim to satisfy the dual objectives of allowing utilities to maintain electric power system safety, reliability and power quality while also providing a transparent, efficient and cost-effective path to interconnect a generator on a predictable timeframe. To balance these objectives, interconnection processes often use penetration-based screening that increases the level of technical review as the DG penetration level on a circuit increases.
Penetration-based screening is broadly used in the United States to quickly review DG intercon-nection requests at lower penetrations, particularly penetrations below 15 percent of customer peak load on a distribution circuit. However, at higher penetrations there is a lack of consensus on how much review is necessary. One approach that has been recently adopted in California and Hawaii is to roughly divide generators on the basis of whether their capacity may exceed 100 percent of minimum customer load on a distribution feeder. A utility will have broad dis-cretion in these states to assess potential impacts to safety, reliability and power quality both above and below this threshold, but below the threshold, it will have less time to assess poten-tial impacts. The Federal Energy Regulatory Commission (FERC) recently issued a Notice of Proposed Rulemaking (NOPR) that would revise the federal Small Generator Interconnection Procedures (SGIP) to mirror the approach used in California and Hawaii.1 One recently released study from the National Renewable Energy Laboratory (NREL), and another study from NREL, the U.S. Department of Energy (DOE), Sandia National Laboratories (Sandia) and the Electric Power Research Institute (EPRI) also support this approach.2
The California and Hawaii processes improve the timeliness, transparency, and cost-effective-ness of interconnecting a generator at higher penetrations, but the processes are still largely re-active, waiting for an application to interconnect a generator before potential impacts to safety, reliability and power quality may be assessed. The reactive nature of this approach means that the hosting capacity of a distribution circuit (the ability to accommodate new DG without up-grading the circuit) is determined after an interconnection request is received, if it is determined at all.
To better facilitate interconnection of high penetrations of DG, some utilities are beginning to consider approaches to proactively study distribution circuits in an effort to determine—in ad-vance—their hosting capacities. These approaches generally use a two-step process. The first

2Integrated Distribution Planning Concept Paper
step utilizes modeling to determine the ability of distribution circuits to host DG. The second step leverages existing distribution system planning efforts to anticipate DG growth. Where anticipated growth exceeds a distribution circuit’s hosting capacity, the utility can identify addi-tional infrastructure that may be necessary to accommodate the anticipated growth. The results of a proactive study inform the processing of subsequent interconnection requests by estimating in advance the level of DG that can be accommodated without impacts. At higher penetration levels, a utility will have foreknowledge of the upgrades that may be required to ensure mainte-nance of safety, reliability and power quality standards.
This paper discusses proactive planning efforts that are being contemplated or implemented by utilities across the United States. Drawing upon these efforts, this paper proposes an Integrated Distribution Planning (IDP) approach to proactive planning for DG growth. IDP leverages existing tools from distribution system planning to estimate the hosting capacity of distribution circuits in advance of a utility studying a particular interconnection request. IDP also analyzes a circuit’s ability to accommodate anticipated DG growth and identifies any potential infrastruc-ture upgrades needed to accommodate that growth.
In addition to introducing the concept of IDP, this paper discusses the ways in which IDP can increase the efficiency and cost-effectiveness of interconnecting DG at high penetrations while maintaining the safety, reliability and power quality of utility distribution systems. It also dis-cusses potential implementation issues. One such issue is cost allocation; specifically, how to allocate the cost of distribution upgrades between generators and possibly even between gen-erators and ratepayers. While we recongize this is an important consideration, cost allocation requires a more thorough examination than would be allowed in this introductory concept paper. Accordingly, we only provide some broad comments on the issue in this paper and hope to ad-dress it in further detail in a follow-up paper.
Figure 1: DG Penetration Relative to Estimated Hosting Capacity
*The two most common estimates of hosting capacity based on customer load are 15% of peak load and 100% of minimum load.
Estimated Hosting Capacity of Line Based on Customer Load*
Installed DG Capacity

3Integrated Distribution Planning Concept Paper
RISING PENETRATIONS STRAIN UTILITY RESOURCES
The success of policies promoting PV resources has caused a high volume of interconnection requests from both small and large PV projects for many utilities. In 2005, utilities and develop-ers installed only 79 Megawatts (MW) of grid-connected PV capacity across the United States. Six years later, the grid-connected solar PV capacity installed in just one year totaled 1,856 MW, over 23 times the cumulative amount installed just six years earlier and more than double the capacity that had been installed the prior year.3 Annual grid-connected PV capacity almost doubled again in 2012 to 3,153 MW (see figure 2 below), which brought the grid-connected PV capacity in the United States to 7,000 MW by the end of that year.4 That is a 4000-percent increase in 7 years.
In 2011, the nation’s most PV-active utilities integrated almost 1,500 MW-ac of new solar capacity, the equivalent of six natural gas power plants.5 Solar Electric Power Association’s (SEPA) 2011 Utility Solar Rankings Report describes the incredible undertaking that intercon-necting all of these new generators can mean, particularly for utilities in states with the highest penetrations of solar:
Utilities are adapting to solar as their fastest growing electricity source. In 2011, utili-ties interconnected over 62,500 PV systems, 89% of which were residential homes, and which was a 38% growth over 2010. Thirteen utilities interconnected more than 1,000 PV systems and 22 interconnected more than 500 systems. To put this in per-spective, about 350 non-solar power plants (> 1 MW) were expected across the entire U.S. in 2011. This annual volume of smaller, distributed solar interconnections is un-like anything the utility industry has previously managed, and conservative forecasts indicate that this number will grow to more than 150,000 interconnections in 2015.6
Figure 2: Annual Installed Grid-Connected PV Capacity

4Integrated Distribution Planning Concept Paper
This increase in interconnection requests has resulted in higher PV penetrations on many utility distribution systems.7 Continued robust growth in PV markets will inevitably result in more areas with high penetrations of PV resources. Although most utilities do not publish informa-tion about penetration levels on their distribution feeders, several regions of the country are clearly experiencing high penetrations due to the sheer volume and concentration of DG that has interconnected or is requesting interconnection. In Hawaii, for example, 20 percent of the distribution circuits are already above 15 percent of peak load, a common benchmark for high penetration.8
It is also clear that these high-penetration solar regions have expanded beyond just California and Hawaii, and are now moving into Eastern states. In 2008, 93 percent of the nation’s total an-nual solar capacity was installed in the Western region. By 2011, however, Western states held only 61 percent of the nation’s annual installed solar capacity, and only two California utilities were among the top ten for Cumulative Solar Watts-per-Customer (see figure 3).9 Pepco, Inc., (Pepco) the parent company of Atlantic City Electric, the utility for many parts of southern New Jersey, has closed five of its distribution circuits to new generation because the circuits have reached operating voltage limits on account of high penetration.10
As penetration levels rise, the need to take a closer look at the impacts of these generators, in the form of detailed interconnection studies, also rises. A detailed study frequently requires an upfront fee, can take months to complete, and can result in high upgrade costs.11 In addition, waiting for a study to be completed can cause delay for other applicants that may be seeking to interconnect to the same circuit but have to wait for the prior applicant to complete the process before they can move forward.
Members of the solar industry have identified the increased need for detailed studies as a market barrier to future development.12 As penetration levels increase, the combination of study costs, uncertainty, delays and upgrade costs can undermine otherwise positive project economics, es-pecially for small projects. In localized areas, the cost of a large upgrade, such as replacing the conductors on a distribution feeder, can prove so burdensome for a single project, or group of projects, that neither the project nor the upgrade is completed. The problem is accentuated in areas with serial interconnection queues, where a large upgrade not only deters the current
Figure 3: Cumulative Solar Watts-per-Customer
2011 2010 Utility Watts (AC)
1 Not Ranked Vineland Municipal Electric (NJ) 991.2
2 5 Maui Electric Co. (HI) 209.3
3 66 Blue Ridge Mountain EMC (GA) 194.7
4 11 Atlantic City Electric (NJ) 185
5 2 Kauai Island Utility Co-op (HI) 179.1
6 18 Arizona Public Service - APS (AZ) 176.3
7 1 Southern California Edison (CA) 151.9
8 117 Fayetteville Public Utilities (TN) 150.1
9 9 Hawaiian Electric Co. (HI) 148.5
10 6 Pacific Gas & Electric (CA) 146.2

5Integrated Distribution Planning Concept Paper
project but also those projects behind it in the queue. The result is an interconnection upgrade bottleneck in high-penetration areas of the distribution system that eventually stymies DG de-velopment.
It is easy to understand the challenges that arise for the solar industry from the combination of increasing interconnection requests and more detailed studies. Less obvious are the difficulties that arise for utilities. Detailed studies can deplete utility resources as interconnection queues outpace the utility’s ability to process requests. Even in places where group study processes allow for the concurrent interconnection of large numbers of projects, detailed studies can over-whelm utility resources and require the use of outside consultants, which can increase intercon-nection timelines due to the additional time for information exchange between the consultant and the utility.13 Timelines for studies performed by external engineers are also dependent on those engineers’ availability, and delays can result.14
Utilities have recently become the target of public criticism where interconnection processes have been unable to keep pace with customers’ choices to install DG. A recent article in Busi-nessweek calls a common penetration screen, the 15 percent of peak load screen, a market obstacle for solar energy in the United States.15 Another example is a resolution passed by the County of Hawaii, the governing body of the island that shares the State’s name.16 The resolu-tion encourages the Hawaii Public Utilities Commission to change Hawaii Electric Light Com-pany’s (HELCO’s) existing interconnection process to allow higher levels of penetration before detailed study is required.17 The Hawaii resolution and Businessweek article demonstrate how, in high penetration areas, the public has become critical of interconnection processes that appear to limit customers’ ability to install DG.
PENETRATION SCREENS ARE NOT SUFFICIENT
Penetration screens can be helpful in achieving the dual objectives of an effective interconnec-tion process: on the one hand maintaining the safety, reliability and power quality of electric power systems while on the other hand providing a transparent, efficient and cost-effective path to interconnection. From a technical standpoint, the risk of unintentional islanding, voltage deviations, protection miscoordination, and other negative impacts, increase as the capacity of installed DG on a circuit rises.18 Penetration screens serve as a gatekeeper in the interconnection process, increasing the level of review that is needed as DG penetration rises.19
The federal SGIP and many state interconnection procedures allow interconnections to be expe-dited when penetration is less than 15 percent of peak load on a distribution feeder, so long as a number of additional technical screens that assess potential impacts are also passed.20 If all of the “initial review” screens are passed, an interconnection can be approved in as little as 10 to 20 business days.
There is presently no consensus on what level of review is needed for penetrations above 15 per-cent of peak load. There is, however, a growing recognition that DG capacity relative to mini-mum load is a more relevant consideration at higher penetrations than DG capacity relative to peak load. For example, utilities in Hawaii and California recently agreed to incorporate a 100 percent of minimum load threshold into their supplemental review processes.21 In California, if a generator fails the 15 percent of peak load screen during initial review, it will be required to

6Integrated Distribution Planning Concept Paper
undergo supplemental review.22 If it is determined that the aggregate generating capacity is less than 100 percent of minimum load (daytime minimum load for PV systems), a generator may be allowed to interconnect without detailed study.23 If the generating capacity exceeds 100 percent of minimum load, the generator will likely require detailed study.24
In Hawaii, a similar process has been proposed that would require detailed study only when aggregate generation reaches 100 percent of minimum load, 75 percent of minimum load, or 15 percent of peak load, depending on the data available for the circuit in question.25 Similarly, FERC’s recent NOPR would revise the federal SGIP to reflect the approaches used in California and Hawaii, making detailed study more likely only above 100% of minimum load.26 As we noted earlier, two studies, one from NREL and the other from NREL, DOE, Sandia and EPRI, support the use of a daytime minimum load screen for PV at high penetration levels.27
Although penetration screens may be helpful in determining the level of review that is generally appropriate for interconnecting generators at different penetration levels, they do not provide much guidance regarding the ability of the local distribution system to accommodate a specific proposed generator at a specific point of interconnection. The ability of a distribution circuit to accommodate a generating facility without upgrades can vary significantly depending on the configuration of the local circuit and the generating facility type, size and location on the circuit. In locations that are experiencing high DG penetrations, many utilities are increasingly looking to determine the ability of existing circuits to host additional DG interconnections in an effort to expedite the review of interconnection applications.
INNOVATIVE RESPONSES TO HIGH PENETRATION
In recent years, a number of states and utilities have taken steps to streamline interconnection procedures to accommodate high DG deployment. The states of Massachusetts, California, Ha-waii, and Pepco, the parent company of utilities in New Jersey, Delaware, and Maryland, are leading the way to a more comprehensive understanding of the characteristics of the distribution system and its ability to host DG prior to interconnection requests being submitted.
Massachusetts
Observing that legislative and regulatory changes in the Commonwealth had markedly increased the number of requests to interconnect to the Commonwealth’s distribution systems,28 the Mas-sachusetts Department of Public Utilities (DPU) initiated two proceedings in the past few years to find ways to accommodate this growth. In March 2013, the DPU issued an order adopting certain recommendations from a collaborative stakeholder process to improve to Massachusetts’ interconnection procedures.29 The order adopts a number of revisions that reduce interconnec-tion timelines, increase the transparency of the technical review screens the Massachusetts utili-ties apply, and improve the supplemental review process to allow more projects to qualify for expedited interconnection.30
The DPU also opened an inquiry to study the “modernization” of the Commonwealth’s distri-bution system “over the short, medium and long term.”31 While focused on smart grid tech-nologies, the order initiating the inquiry stresses the importance of studying and monitoring the impacts of DG on the distribution system. Stakeholders are considering how “the modern grid

7Integrated Distribution Planning Concept Paper
… should be capable of fully integrating new distributed technologies.”32 Part of that task will include proposing regulatory changes to facilitate “grid modernization” that can integrate DG “in a strategic and cost-effective manner.”33
California
A first step to streamlining interconnection in California was completed in September 2012 when the California Public Utilities Commission adopted a fourteen-party settlement agreement fundamentally redesigning Rule 21, California’s distribution-level interconnection tariff.34 The settlement, which includes as parties the State’s three investor-owned utilities, revises substan-tial portions of Rule 21’s expedited and supplemental review processes with the aim of improv-ing efficiency, cost-effectiveness and transparency for developers.35 The decision adopting the settlement concluded the first phase of a two-phase proceeding aimed at resolving the viscosity and opacity in the State’s interconnection queues and procedures.36
The second phase of the Rule 21 proceeding builds on other California initiatives to take a more holistic view of DG in the context of distribution planning. State law already requires California utilities to incorporate DG into utility distribution system planning and operations.37 In addition, a number of regulatory proceedings since 2003 have worked to integrate DG into California’s distribution system planning proceedings with the aim of deferring investment in distribution system infrastructure; however, these programs have largely remained unimplemented.38
An innovative proposal in the second phase of the Rule 21 proceeding would use interconnec-tion costs and timelines to incentivize DG siting in places that would defer distribution system investments. The proposal, one of a handful in the proceeding, relies on the principle that stra-tegically located DG can “defer transformer and transmission line upgrades, extend equipment maintenance intervals, reduce electrical line, losses, and improve distribution system reliability, all with cost savings to utilities.”39 The proposal uses a series of metrics and distribution system characteristics to define low-cost areas to interconnect that are likely to have high value in terms of deferring investments in distribution infrastructure.40 If a project’s point of interconnection is in an area that meets the low-cost, high-value criteria, it will be able to interconnect to the distribution system for a fixed fee, regardless of any costs the project is assigned as part of an interconnection study.41
A recently published Southern California Edison Company (SCE) report also emphasizes the importance of implementing California’s DG goals with strategic locational considerations.42 The report analyzes the system-wide distribution and interconnection costs of DG installations in SCE’s service territory and concludes that these costs decrease substantially if projects are sited in more urban areas where the distribution system is stiffer.43 The report advocates “ap-propriate incentives for developers to interconnect in preferred areas.”44 It also calls for further study of the SCE distribution and transmission systems in order to more precisely determine DG installation costs and to create location information to guide developers towards areas with lower costs to interconnect.45
An on-going EPRI study, funded by the California Solar Initiative, is exploring methodologies to more quickly and accurately determine the hosting capacity for PV generation on individual distribution feeders.46 The study is in response to the increased pressure on California’s utilities

8Integrated Distribution Planning Concept Paper
to accommodate higher levels of DG and, at the same time, expedite the interconnection pro-cess.47 It examines a wide range of PV deployment scenarios and penetration levels on Cali-fornia feeders in order to determine the level at which utility operations are impacted.48 EPRI is building detailed distribution models to evaluate impacts of PV on the distribution system as part of the study.49 Preliminary results show that establishing a minimum hosting capacity, below which no impacts are anticipated regardless of a project’s size or location, and maximum hosting capacity, above which there are impacts regardless of a project’s size or location, may be a better approach than using proxy screens, such as 15% of peak load.50 EPRI hopes to use its study results to develop new interconnection screens that can reduce both interconnection study time and costs.51
Pepco and New Jersey, Delaware and Maryland
Pepco is in the early stages of implementing a program to completely model its distribution system in response to high DG penetration levels. The utility has over 7,200 interconnected DG resources, and numerous distribution feeders in its New Jersey service territory have ex-perienced high penetrations of solar DG.52 High penetration has even resulted in the company closing five of its feeders to further solar DG development.53 Initially, the deluge of PV system applications in its service territories caused the utility problems in meeting the timeframes in its interconnection procedures.54 Pepco recognized that with increased penetration it needed to find a better way to plan for DG resources and to invest in the development of an advance load flow program.55
Pepco will utilize the advanced load flow model to conduct detailed DG impact studies. The Pepco approach will develop a model that includes both active and pending interconnection requests in its queue.56 It will then use time series models to show the impacts of those genera-tors on the distribution system, identifying constraints based on voltage impacts, reverse flow, protection concerns and other criteria.57 The time series models will be based on historical Su-pervisory Control and Data Acquisition (SCADA) information as well as time series models of solar and other generation sources.58
The program will provide stakeholders a faster response to the questions of what is the hosting capacity at a project’s location and what upgrades are needed.59 The program can also be used in high penetration studies.60 Pepco anticipates interconnection assessments for DG will eventu-ally be “semi-automated” such that developers and utility engineers will know the impact of a proposed facility within days of the facility submitting a complete and valid interconnection re-quest rather than weeks or months.61 Where design of major upgrades and engineering estimates are needed, response will still take longer than a few days.62 Pepco’s program will also allow the utility to consider mitigation strategies on both the customer and utility side of the point of interconnection.63
Hawaii
Customers in many parts of the Hawaiian Electric Company’s (HECO’s) service territory are already unable to interconnect DG due to high penetration levels, and the associated detailed study fees and upgrade costs.64 In May 2012, the Hawaii Public Utilities Commission issued an order asking stakeholders to find ways to use PV system data to enhance the interconnection

9Integrated Distribution Planning Concept Paper
screening process and increase DG penetration.65 In March 2013, a collaborative stakeholder effort, including members of the PV industry and HECO, culminated in a unanimously sup-ported “Proactive Approach” proposal to plan for high penetrations of DG.66
The Proactive Approach utilizes what is essentially a four-step process to integrate HECO’s in-terconnection and annual distribution planning functions in a forward-looking manner.67 Dur-ing its annual distribution planning effort, the HECO utilities will:
1. Determine likely DG growth on its distribution system over one year, using its exist-ing interconnection queue, along with other data points, to establish a reasonable fore-cast of anticipated DG development; 2. Study the aggregate generation of existing facilities and the hosting capacity of ex-isting equipment on the distribution system, to determine the precise available capacity for additional DG. 3. Assess whether the hosting capacity of existing equipment can accommodate the anticipated DG growth; and4. Proactively plan distribution system upgrades in areas where DG growth outpaces the distribution equipment’s hosting capacity.68
The aim of the approach is to identify opportunities where infrastructure upgrades can accom-modate both DG and load such that a greater number of generators and customers can benefit from system upgrades.69
To achieve these ends, HECO will employ enhanced tools for modeling DG to inform distri-bution-level planning and operations.70 Those models will leverage PV production data, which members of the PV industry have voluntarily made available to HECO. The models will also use a network of HECO PV field monitors.71 When the utility identifies additional needs for monitoring data to populate its models, it will look to deploy additional utility field monitors or engage developers and customers to facilitate any necessary cooperation to gather owner- or customer-collected data.72
The Hawaii Public Utilities Commission has not yet formally adopted the proposal.73 However, once approved, the HECO companies hope to implement the Proactive Approach in high-pri-ority areas in 2013, with the aim to apply the approach to the entire distribution system by the end of 2015.74
INTEGRATED DISTRIBUTION PLANNING
As the above examples illustrate, utilities in high penetration areas are increasingly looking to gain a better understanding of the amount of DG that can be accommodated without costly upgrades. These examples demonstrate the potential for more proactive interconnection and distribution planning to improve interconnection timelines, increase cost certainty and allow utilities to respond more efficiently to requests to interconnect DG.
Using these examples as a guide, this section looks to generalize and combine features of these efforts into a comprehensive approach, which we call Integrated Distribution Planning (IDP). IDP determines the hosting capacity of existing distribution circuits and identifies potential
10Integrated Distribution Planning Concept Paper
upgrades that may be needed to accommodate anticipated DG growth. IDP will allow utilities to process interconnection applications more efficiently without any reduction in the utility’s ability to maintain safety, reliability and power quality.
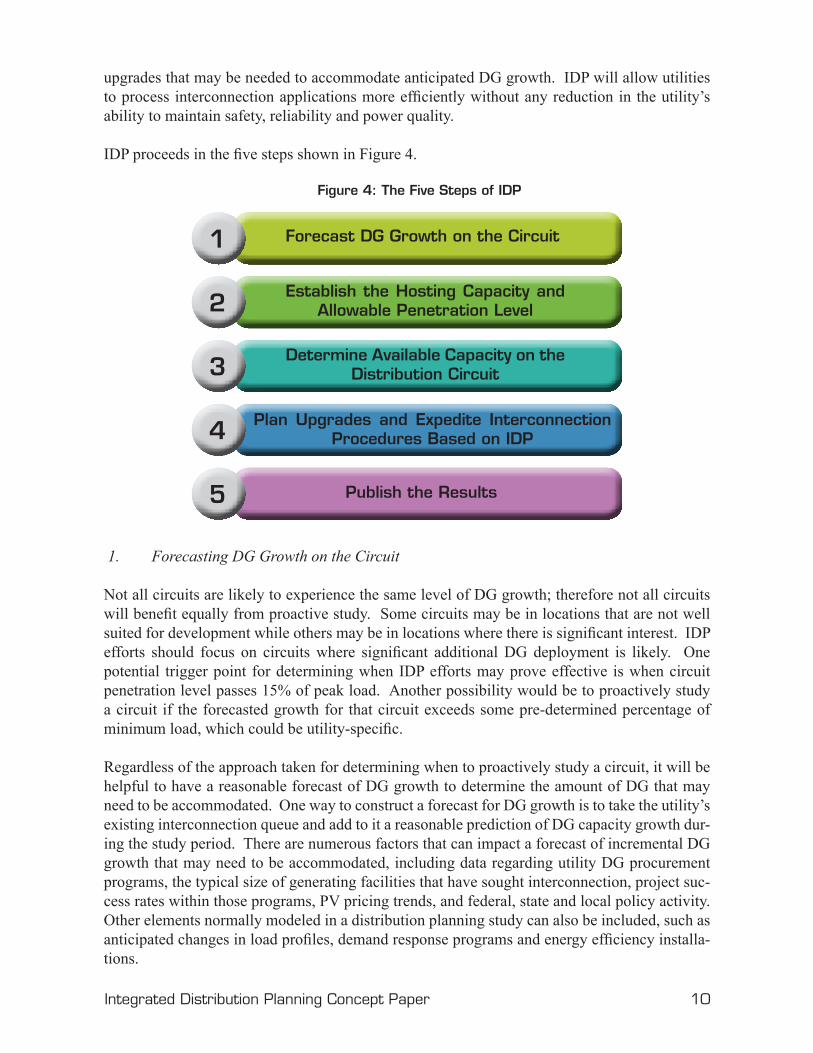
IDP proceeds in the five steps shown in Figure 4.
1. Forecasting DG Growth on the Circuit
Not all circuits are likely to experience the same level of DG growth; therefore not all circuits will benefit equally from proactive study. Some circuits may be in locations that are not well suited for development while others may be in locations where there is significant interest. IDP efforts should focus on circuits where significant additional DG deployment is likely. One potential trigger point for determining when IDP efforts may prove effective is when circuit penetration level passes 15% of peak load. Another possibility would be to proactively study a circuit if the forecasted growth for that circuit exceeds some pre-determined percentage of minimum load, which could be utility-specific.
Regardless of the approach taken for determining when to proactively study a circuit, it will be helpful to have a reasonable forecast of DG growth to determine the amount of DG that may need to be accommodated. One way to construct a forecast for DG growth is to take the utility’s existing interconnection queue and add to it a reasonable prediction of DG capacity growth dur-ing the study period. There are numerous factors that can impact a forecast of incremental DG growth that may need to be accommodated, including data regarding utility DG procurement programs, the typical size of generating facilities that have sought interconnection, project suc-cess rates within those programs, PV pricing trends, and federal, state and local policy activity. Other elements normally modeled in a distribution planning study can also be included, such as anticipated changes in load profiles, demand response programs and energy efficiency installa-tions.
Figure 4: The Five Steps of IDP
Forecast DG Growth on the Circuit1
Establish the Hosting Capacity and Allowable Penetration Level2
Determine Available Capacity on the Distribution Circuit3
Plan Upgrades and Expedite Interconnection Procedures Based on IDP4
Publish the Results5

11Integrated Distribution Planning Concept Paper
2. Establishing the Hosting Capacity and Allowable Penetration Level
The hosting capacity of a distribution circuit is the maximum amount of generation the circuit can host without upgrades while maintaining safety, reliability and power quality. There are many factors that affect a circuit’s hosting capacity, including circuit characteristics and the size and location of proposed facilities. Without these details, it is difficult to pinpoint exact host-ing capacity. Nonetheless, a proactive circuit study can identify circuit characteristics that may need to be modified if forecasted levels of DG growth materialize. That will allow estimates of hosting capacity to be made on the distribution circuits, which builds confidence within the utility that system impacts are unlikely for generators of certain types and sizes.75
The estimate of hosting capacity should reveal the allowable penetration levels that may be accommodated without the need for distribution upgrades. With this approach, allowable pen-etration levels will be more closely related to the actual engineering limits of the infrastructure being studied, and therefore will establish a more precise alternative to using the simple rules of thumb that are incorporated into interconnection processes. The penetration levels will show the amount of generation allowable on a circuit up to the circuit’s hosting capacity, and genera-tors of certain types and sizes that are below the allowable penetration level should be able to interconnect simply and quickly without detailed study or even supplemental review.
3. Determining Available Capacity on the Distribution Circuit
Once the hosting capacity and allowable penetration levels are established, the utility can de-termine the remaining capacity available on a distribution circuit, that is, the known maximum MW value of DG that can be connected before an upgrade is required (see figure 5). This num-ber may need to be differentiated by generator types, sizes and locations. This metric reveals a circuit’s remaining ability to absorb new projects before upgrades will be needed, signaling to utilities and developers where these circuits exist.
Figure 5: Forecasted Generation is Less than Infrastructure’s Hosting Capacity
Hosting Capacity
Existing Generation
Forecasted Generation

12Integrated Distribution Planning Concept Paper
4. Planning Upgrades and Expediting Interconnection Procedures Based on IDP
Forecasted DG development may push penetration levels past the hosting capacity, meaning anticipated DG growth will consume all available capacity. Through IDP, the utility can identify the technical factor limiting the hosting capacity of the circuit. That is, the utility may be able to determine whether interconnecting DG beyond the hosting capacity requires a major upgrade, such as replacing a transformer, or a relatively minor change, such as changing local settings on protection or control devices. This data can be used in two ways. First, it can be used on an aggregate level as an input to inform the remainder of the utility’s distribution planning effort, giving the utility the opportunity to identify and prioritize the possible upgrades to distribution infrastructure that would be required to accommodate anticipated DG growth (see figure 6). Second, it can be used on a project-by-project basis to inform the interconnection screens and procedures that are applied to each facility individually.
5. Publishing the Results
Ideally, a utility will publish the available capacity and nature of the upgrades needed for the distribution infrastructure studied, and the location and timing of any planned upgrades that would affect hosting capacity. These results can be made public through a website, provided in response to requests from project developers, or included in utility locational value maps, de-pending on the confidentiality and critical infrastructure considerations that apply to the utility.
Figure 6: Forecasted Generation Exceeds Infrastructure’s Hosting Capacity
Forecasted Generation
Existing Generation
Hosting Capacity

13Integrated Distribution Planning Concept Paper
THE BENEFITS OF ADVANCED PLANNING FOR HIGH PENETRATIONS
IDP may provide a number of benefits to utilities and developers, including more efficient plan-ning, improved interconnection timelines, and reduced interconnection costs. This section in-troduces these benefits.
Optimal Distribution System Planning
IDP allows utilities to proactively plan more efficient and cost-effective upgrades. For example, a utility can determine where a small fix in a strategic location can benefit a number of genera-tors. It also allows the utility to consider upgrades that can be shared between interconnecting projects, across any number of distribution feeders or a network, or between load and gen-eration. The result is upgrade costs can be spread more evenly among the parties that benefit. Moreover, the upgrades can be planned more efficiently, where electrically related projects and load can share the cost of an upgrade that benefits both. These cost allocation options are at the core of interconnection policy, and are discussed further below.
Improved Interconnection Timelines
IDP will allow a utility to measure penetration levels and hosting capacity in a particular area, and use this information to more efficiently evaluate interconnection requests during the ini-tial or supplemental review study phases. Better knowledge of the existing penetration levels and available capacity allows utilities to replace proxy interconnection screens, such as the 15 percent of peak load penetration screen, with screens tailored to the distribution infrastructure itself. For example, certain projects will pass Hawaii’s new proposed penetration screen in supplemental review if aggregate generation on a circuit falls below the hosting capacity deter-mined through the Proactive Approach.76 Better screens allow the utility to interconnect more projects using expedited interconnection procedures, such as fast track and supplemental review, and with more confidence than that derived from proxy screens. In turn, IDP will reduce the workload on utility engineers and make it easier for a utility to meet interconnection timelines.
Proactive planning will also allow a utility to determine potential upgrades for projects in a par-ticular area before a utility studies those projects, meaning shorter timelines for projects that fail fast track and supplemental review. In California and Hawaii, IDP will complement new “Quick Review” features that are embedded in interconnection procedures. Rule 21 in California gives utilities discretion to avoid pushing projects into detailed study when a project fails a screen, allowing the utility to determine with a quick review of the failed screen a solution to address the issue.77 Hawaii has proposed a similar process.78 Through IDP, a utility will know many upgrade requirements in advance of applying the interconnection screens. Thus, when a genera-tor fails a fast track or supplemental review screen in an area that has undergone IDP, the utility may already know the upgrade needed without having to conduct further study.
Finally, some utilities contract with independent consultants to conduct supplemental review and detailed interconnection studies. A utility’s ability to meet interconnection timelines, there-fore, depends on the availability of consultants with an intimate knowledge of the utility’s dis-tribution system. A reduction in the need for detailed studies may reduce the need for outside consultants and result in a better ability to meet timelines.

14Integrated Distribution Planning Concept Paper
Cost Reductions for Both Developers and Utilities
The decreased need for detailed studies resulting from IDP may provide cost advantages for util-ities. Without a means to accommodate increased distribution-level interconnection requests, a utility will see the need for detailed studies increase as DG penetrations increase. Detailed studies require utility engineers to intensively investigate the impact of interconnecting gen-erators on existing facilities, load and distribution infrastructure. Streamlining interconnection through IDP will allow more projects to avoid detailed study, which will reduce the engineering resources utilities must expend or procure to study each applicant.
IDP also provides cost benefits for developers. High penetrations are indicative of a likelihood of needed upgrades, which are frequently funded by project developers. For wholesale proj-ects, a database of feeder penetrations and available interconnection capacity can be valuable to developers looking for low-cost places to interconnect. For developers with little choice about where to interconnect, such as on-site generators, IDP can set expectations regarding the poten-tial for upgrade costs and, therefore, reduce investment risk through increased cost certainty.
POTENTIAL IMPLEMENTATION ISSUES
A number of issues may arise in implementing an IDP framework. This section introduces some of those issues and discusses potential solutions.
Data
The implementation of IDP allows a utility to estimate the hosting capacity, existing DG pen-etration, and needed upgrades for a studied system. The tools to establish these metrics include access to distribution system modeling that can include DG, specifications on the physical limi-tations of utility infrastructure, methodologies and data to measure minimum load, access to DG output data, and a system to store and manage both minimum load and output data. While at first blush the development of these tools appears cost prohibitive, a number of solutions may already exist, or are in development, to allow IDP to go forward in a cost-effective manner.
Distribution system planning already requires utilities to model the physical limitations of equip-ment in relation to load patterns. There are numerous different types of models employed to de-termine the upgrades required to accommodate changes in load, some of which may be adapted to include DG. In Hawaii, HECO plans to continue to utilize its existing distribution system planning software to model DG and implement the Proactive Approach. On the other hand, Pepco invested in developing a new advanced load flow model with a DG impact assessment tool to model its entire distribution and transmission system. Both experiences suggest that a number of different tools are now, or will soon be, able to model DG for the purposes of IDP.
Currently, few utilities collect enough information to measure minimum load at the feeder level. However, it is not strictly necessary for a utility to install additional load monitoring equipment on all distribution circuits in order to implement IDP. Methodologies exist to estimate minimum loads with levels of accuracy sufficient for planning, including the use of standard load profiles for various customer classes, which many utilities maintain and update on an annual basis.79

15Integrated Distribution Planning Concept Paper
Other modeling methods are also available for calculating or estimating minimum load that may be similar to methods used for determining peak load levels of circuits. If a reasonable method to estimate minimum load data is unavailable, utilities can target high penetration areas first for the installation of monitoring equipment and later expand to other areas of the distribution system.
Output data from DG facilities are also needed to populate utility power flow models. As more utilities install SCADA systems and roll out smart grid features there will be an increasing amount of historical data available. Pepco’s time series models will be based on historical SCADA, solar and customer-use data.80 EPRI’s study validates its modeling using data obtained from EPRI-provided monitoring equipment at existing PV facilities and one-second PV produc-tion data from selected distribution circuits via field monitoring.81 HECO’s Proactive Approach will use a combination of historical SCADA data, data from utility field monitors and produc-tion data that has been voluntarily offered by members of the PV industry.82
The Hawaii solution is worth noting. Historical data can go a long way towards building a utility’s understanding of DG’s impacts on a circuit, validating its modeling of those impacts, and greatly improving the accuracy of measurements to establish penetration levels and hosting capacity. Normally, a suggestion to share data with utilities in real time causes developers to wince since it is frequently associated with SCADA, which is frequently, although erroneously, associated with allowing a utility to control the output of a solar facility. Further, the provi-sion of real time or one-to-five second production data can be very costly due to the fiber optic or cellular equipment needed for near-instantaneous communication. However, the approach in Hawaii shows that useful data can be historical, does not need to be SCADA quality, can be communicated using existing Internet connections, and can be anywhere from 2-second to 15-minute data. Moreover, an informal IREC survey of inverter manufacturers, data monitor-ing companies and solar developers confirms that many companies across the country already record data for customers that would be useful to utilities and can be communicated for low cost.83 The solution to a perceived lack of data, it seems, is simply cooperation between utilities and the PV industry.
Another related issue is the significant technical challenge surrounding the utility’s ability to store and manage large amounts of data. However, the HECO and Pepco approaches suggest that this issue can also be addressed.
Building Upgrades and Allocating Costs to Projects
Two key issues that will need to be addressed when implementing IDP is how distribution upgrade costs will be allocated and whether utilities should install upgrades before an intercon-necting generator that will need that upgrade is proposed. The necessary solutions will vary for different utilities and states, given each jurisdiction’s existing policy for cost allocation of both interconnection upgrades and distribution system planning upgrades. However, it should be noted that utilities and regulators have long wrestled with the issue of allocating infrastructure upgrade costs between load and generation, and it is likely that established approaches on that issue could be applied to IDP.
Two such approaches may be especially useful in this context. The first approach allocates costs

16Integrated Distribution Planning Concept Paper
of service to the class of customers that benefits from the capital improvements. This approach could be applied to customers that install DG to serve onsite electrical needs, such as small net-metered systems (less than 10 kW), which are typically installed by the residential class of customers. Such projects will likely avoid upgrade costs because the upgrades necessary to ac-commodate them are also likely to benefit, and therefore be shared by, the full rate class. For ex-ample, when performing a distribution planning study, small-scale generators with widespread distribution look very similar to a highly effective energy efficiency program that decreases the load on the circuit. This reduction in load reduces the growth rates on distribution circuits and may allow for the postponement of capital upgrades, which is a net benefit. Similar arguments can be made for larger systems connected on commercial customer sites that are non-exporting.
The second approach allocates costs to the customers who caused those costs to be incurred. This principle could impact other classes of interconnecting DG, typically MW-scale, wholesale DG plants that are discrete systems seeking new services to interconnect and are not net-metered systems behind an existing service. Thus, cost causality could apply to this class of DG just as it would for a new load seeking to receive service from the utility. Under this second principle, the cost for the upgrades identified through the IDP process would be assigned to all DG in the “study group” based on each facility’s contribution to the need for an upgrade.
With regard to completing upgrades in advance, the IDP process contains a level of uncertainty regarding the amount of DG growth that may ultimately seek interconnection. Thus, it is pos-sible that upgrades could be planned and built for DG projects that do not come to fruition, po-tentially leaving utilities unable to recover the costs of those upgrades. However, general utility planning principles exist that can shed light on potential solutions. Utilities already contend with right-sizing issues when planning for load. Load anticipated during distribution planning may not appear for any number of reasons dealing with economic pressures and planned devel-opment. Mechanisms and planning methodologies that currently exist to prevent over-building a distribution system on account of a lack of anticipated load could be applied to similar risks related to IDP, at least with regard to small net-metered systems and larger non-exporting sys-tems where costs are allocated to members of an appropriate rate class. Because most distribu-tion planning processes are conducted annually, forecasts can be revised frequently. Such an approach would require a sufficient and clear indication from regulators to utilities that invest-ments made on behalf of anticipated DG would qualify for cost recovery in the same manner as investments made on behalf of load.
While these existing approaches are helpful as a starting point, cost allocation requires a more thorough exploration. We expect to supplement the broad concepts discussed above with fur-ther detail in a follow-up paper.
CONCLUSION
The success of programs to encourage distribution-level resources is quickly overwhelming existing utility interconnection procedures. The proactive modeling and planning approaches within IDP leverage existing tools to allow utilities flexibility and foresight in accommodating high penetrations. As the amount of DG on distribution circuits increases, IDP allows utilities to continue to apply technically rigorous interconnection screens without sacrificing efficiency, transparency and economy.

Integrated Distribution Planning Concept Paper
17
Endnotes 1 Federal Energy Regulatory Commission, Notice of Proposed Rulemaking re Small
Generator Interconnection Agreements and Procedures, 142 FERC ¶ 61,049, Docket No. RM13-2-000, (January 17, 2013) (“FERC NOPR”).
2 Michael Coddington, Barry Mather, and Benjamin Kropski, National Renewable Energy Laboratory, Kevin Lynn and Alvin Razon, U.S. Department of Energy, Abraham Ellis and Roger Hill, Sandia National Laboratories, Tom Key, Kristen Nicole, and Jeff Smith, Electric Power Research Institute, Updating Interconnection Screens for PV System Integration, pp. 9-11 (January 2012) (“Interconnection Screens Report”); Kevin Fox, et al., Updating Small Generator Interconnection Procedures for New Market Conditions, pp. 22-24 (Dec. 2012) (“Updating Small Generator Interconnection Procedures”).
3 Solar Energy Industries Association Petition for Rulemaking to Update Small Generator Interconnection Rules and Procedures for Solar Electric Generation, FERC Docket No. RM12-10-000, p. 6 (February 16, 2012) (“SEIA Petition”).
4 Larry Sherwood, Interstate Renewable Energy Council, U.S. Solar Market Trends 2011, p. 5 (July 2012) (“Solar Market Trends”).
5 Becky Campbell & Mike Taylor, 2011 SEPA Utility Solar Rankings, p. 7 (“Utility Solar Rankings”) (May 2012).
6 Id. at p. 6. 7 See, e.g., PJM Interconnection, L.L.C., FERC Docket No. ER12-1177-000, Transmittal
Letter, p. 1 (February 29, 2012) (“[PJM] hereby submits modifications to its Open Access Transmission Tariff (“PJM Tariff”) to implement interconnection queue process reforms that are intended to relieve bottlenecks in the interconnection queue and provide for greater certainty and transparency.”); Cal. Independent System Operator Corp., FERC Docket No. ER11-1830-000, Transmittal Letter, p. 2 (October 19, 2010) (“[S]ince 2008, the ISO has experienced a large and rapidly increasing volume of small generator interconnection requests, to a level which has made it impossible for the ISO to study these projects serially under the method within the timelines of the current [SGIP]”); So. Cal. Edison Co., Docket No. ER11-2977-000, Transmittal Letter, p. 3 (March 1, 2011); Pacific Gas & Electric Co., FERC Docket No. ER11-3004-000, Transmittal Letter, p. 4 (March 2, 2011) (“Like the CAISO, PG&E has similarly experienced a dramatic increase in the number of small generator interconnection requests to interconnect with PG&E’s distribution system. These requests, which are processed through PG&E’s WDT SGIP, have also arisen as a result of California’s RPS requirements. Currently, PG&E has a backlog of over 170 interconnection requests for small generators.”); Photon Magazine, Uncharted Territory, Hawaii’s solar industry struggles with its own success, table on p. 25 (September 2012) (“Photon”); California Public Utilities Commission, Order Instituting Rulemaking 11-09-011, pp. 3-4 (Sept. 27, 2011) (addressing reforms to California’s Rule 21 to accommodate increasingly large numbers of interconnection requests to the distribution grid from exporting and wholesale generators).
8 Photon at p. 25. 9 Utility Solar Rankings at pp. 14, 22. The value of the metrics in Figure 3 is to point out
which utilities are seeing growth in renewables, not to identify utilities with congested distribution circuits.
10 Steve Steffel, Pepco Holdings, Inc., Advanced Modeling and Analysis, EUCI Presentation at Denver, CO (Nov.15, 2012) (“Pepco Presentation”).

Integrated Distribution Planning Concept Paper
18
11 See, e.g., California Public Utilities Commission, Decision No. 12-09-018, Attachment A
to Attachment A, Revised Rule 21 § E.2.c (Sep. 20, 2012) (“Revised Rule 21”) (setting study deposits for facilities 5 MW or less at $10,000 for a System Impact Study and $15,000 for a Facilities Study and for facilities above 5 MW at $50,000 plus $1,000 per MW, up to a maximum of $250,000); Hawaiian Electric Company Tariff Rule 14H, Appendix III § 4(e) (Dec. 20, 2011) (setting a 150-day timeframe for detailed study) (“Rule 14H”).
12 See SEIA Petition at p. 9. 13 See Rule 14H, Appendix III § 4(d) (allowing the Hawaiian Electric Company to contract
with outside consultants in order to conduct an Interconnection Requirements Study); Pepco Presentation.
14 Pepco Presentation. 15 Ken Wells, Solar Energy is Ready. The US Isn’t, Businessweek (Oct. 25, 2012). 16 County of Hawaii, Resolution 277-12 (July 18, 2012). 17 Id. 18 Interconnection Screens Report at pp. 2-5; see also Southern California Edison Company,
The Impact of Localized Energy Resources on Southern California Edison’s Transmission and Distribution System, pp. 11-14 (May 2012) (“SCE DG Study”).
19 Interconnection Screens Report at p. 2; see, e.g., Federal Energy Regulatory Commission, Small Generator Interconnection Procedures § 2.2.1.2 (“SGIP”) (requiring further study once penetration reaches 15 percent of peak load), app’d in Standardization of Small Generator Interconnection Agreements and Procedures, Order No. 2006, FERC Stats. & Regs. ¶ 31,180, at p. 18 (¶45) (May 12, 2005), order on reh’g., Order No. 2006-A, FERC Stats. & Regs. ¶ 31,196 (Nov. 22, 2005), order on reh’g, Order No. 2006-B, FERC Stats. & Regs. ¶ 31,221 (July 20, 2006) (“FERC Order No. 2006”); California Public Utilities Commission, Decision No. 12-09-018 (“CPUC D.12-09-018”), Attachment A to Attachment A, Revised Rule 21 § G.1.m (Sep. 20, 2012) (“Revised Rule 21”) (hereinafter, the engineering screens in Section G of the Revised Rule 21 are referred to by the title of the screen, e.g., “Rule 21 Screen M” for the Revised Rule 21 § G.1.m to which this note refers.); Massachusetts Standards for Interconnecting Distributed Generation, Appendix B, Figure 1 (applying as the penetration screen a threshold of 7.5 percent of circuit annual peak load.); New Jersey Interconnection Procedures, N.J.A.C. § 14:8-5.5(f) (Setting the aggregate generation capacity at “10 percent (or 15 percent for solar electric generation) of the total circuit annual peak load.”). Rule 14H, Appendix III § 2, Screen 4 (hereinafter, the engineering screens in Section 2 of Rule 14H are referred to by the title of the screens, e.g., “Rule 14H Screen 4” for the screen to which this note refers.).
20 SGIP § 2.2.1.2; see, e.g., Rule 21 Screen M and Rule 14H Screen 4. 21 Motion for Approval of Settlement Agreement Revising Distribution Level
Interconnection Rules and Regulations, California Public Utilities Commission, R.11-09-011, p. 5 (Mar. 16, 2012) (“Motion to Adopt Rule 21 Settlement”); Reliability Standards Working Group Independent Facilitator's Submittal and Final Report, Hawaii Public Utilities Commission, Docket 2011-0206, Attachment 4, PV-DG Subgroup Rule 14H Sections 2-3 Recommendation, Screen 12 (March 25, 2013) (“Rule 14H Recommendation”).
22 Rule 21 Screen M; Rule 14H Screen 4.

Integrated Distribution Planning Concept Paper
19
23 Rule 21 Screen N; Supplemental Review Screens O and P ensure an interconnection does
not raise potential power quality, voltage, safety or reliability concerns that require detailed study.
24 Rule 21 Screen N. If a generator fails Screen N, a quick review of the failed screen may allow interconnection to occur without detailed study. See Rule 21 § G.2.
25 Rule 14H Recommendation, Screen 12. 26 FERC NOPR at pp. 23-27. 27 See Interconnection Screens Report at pp. 9-11; Updating Small Generator
Interconnection Procedures at pp. 22-24. 28 Order Opening Investigation by the Department of Public Utilities on its own Motion into
Distributed Generation Interconnection, Massachusetts Department of Public Utilities, Docket 11-75, p. 2 (September 28, 2011) (“Massachusetts Investigation Order”).
29 Massachusetts Department of Public Utilities, Order on the Distributed Generation Working Group’s Redlined Tariff and Non-Tariff Recommendations, D.P.U. 11-75-E (Mar. 13, 2013) (“Massachusetts Interconnection Order”).
30 Massachusetts Interconnection Order at pp. 29-39; Massachusetts Distributed Generation Working Group, Proposed Changes to the Uniform Standards for Interconnecting Distributed Generation in Massachusetts, p. 8 (September 14, 2012).
31 Massachusetts Investigation Order at p. 5. 32 Id. at p. 7. 33 Id. at pp. 5, 7 34 CPUC D.12-09-018 at p. 3. 35 Motion to Adopt Rule 21 Settlement at p. 5. 36 See CPUC D.12-09-018 at pp. 11-12. 37 See Cal. Pub. Util. Code § 353.5 (“Each electrical corporation, as part of its distribution
planning process, shall consider nonutility owned distributed energy resources as a possible alternative to investments in its distribution system in order to ensure reliable electric service at the lowest possible cost.”).
38 See California Public Utilities Commission, Orders Instituting Rulemakings 99-10-025 and R.04-04-003 (Oct. 1999 and Apr. 2004); Shaping A California Distributed Energy Resources Procurement, Draft PIER Consultant Report for the California Energy Commission, Proceeding CEC-500-2005-062-D, p. 2-1 (April 2005). In 2003, the CPUC ordered California’s utilities to incorporate into their distribution planning processes a DG procurement program to evaluate alternatives to distribution system upgrades, although there is little evidence of the utilities implementing the program. California Public Utilities Commission, Decision 03-02-068, Rulemaking 99-10-025, ordering paragraphs 1-3, p. 72 (Feb. 27, 2003). A Southern California Edison Company Request for Offers to place DG resources in areas that would defer distribution upgrades, issued nine years after the CPUC’s Order, is currently stalled. See http://www.sce.com/b-db/distributed-generation-solutions.htm.
39 T. Hoff, Pacific Energy Group & D.S. Shugar, Pacific Gas & Electric Company, The Value of Grid-Support Photovoltaics in Reducing Distribution System Losses, IEEE Transactions on Energy Conversions (Sep. 1995).

Integrated Distribution Planning Concept Paper
20
40 Comments of the Interstate Renewable Energy Council, Inc., on Amended Scoping Memo
and Ruling Requesting Comments, Rulemaking 11-09-011, p. 4 (Oct. 25, 2012) (“IREC Comments”). According to the proposal, a low-cost, high-value area is one less than 2.5 miles from a substation, on a distribution system main circuit, where a system will not cause the circuit’s thermal capacity to be exceeded, and where a system will not cause backfeed. IREC Comments at p. 4.
41 IREC Comments at p. 5. Under the proposal, any project that is under 2 MW will be interconnected for a fixed fee if it is sited in a low-cost, high-value area. IREC Comments at p. 4. If a facility is greater than 2 MW, it will qualify for fixed fee interconnection if it is interconnecting in a location with the same characteristics as those under 2 MW, and is also connecting to a main circuit that is greater than 600 amps. IREC Comments at p. 4. A balancing account will deal with instances where actual interconnections costs exceed or fall short of the fixed interconnection fee. IREC Comments at p. 5. The utilities will use an average cost approach derived from data from existing interconnections in low-cost areas to come up with the fixed fee. IREC Comments at p. 5. They will update that average as necessary. IREC Comments at p. 5.
42 SCE DG Study at p. 34. 43 See id. at pp. 18-19, 33-34. 44 Id. at p. 34. 45 Id. at p. 35. 46 Resolution E-4470, California Public Utilities Commission, p. 10 (Mar. 8, 2012) (“CSI
Resolution”); Jeff Smith, Electric Power Research Institute, Alternative Screening Methods PV Hosting Capacity in Distribution Systems, U.S. Department of Energy High Penetration Solar Forum (Feb. 14, 2013) (“EPRI Presentation”).
47 Id. 48 Id. 49 Id. 50 Id. 51 CSI Resolution at 10; EPRI Presentation. 52 Pepco Presentation. 53 Id. 54 Id. 55 Id. 56 Id. 57 Id. 58 Id. 59 Id. 60 Id. 61 Id. 62 Id. 63 Id.

Integrated Distribution Planning Concept Paper
21
64 Photon at pp. 24-25. 65 Hawaii Public Utilities Commission, Order No. 30371 Relating to Various Matter in
RSWG Process, Docket 2011-0206, at p. 14 (May 4, 2012). 66 Hawaii Public Utilities Commission, Reliability Standards Working Group Independent
Facilitator's Submittal and Final Report, Docket 2011-0206, Attachment 4, PV-DG Subgroup Summary of Proposal for Proactive Review Approach, (March 25, 2013) (“Proactive Approach Summary”).
67 Id. 68 Id. 69 Id. 70 Reliability Standards Working Group Independent Facilitator's Submittal and Final
Report, Hawaii Public Utilities Commission, Docket 2011-0206, Attachment 4, Distributed Photovoltaic Monitoring, (March 25, 2013) (“Hawaii PV Monitoring Report”).
71 Id. 72 Id. 73 See Reliability Standards Working Group Independent Facilitator's Submittal and Final
Report, Hawaii Public Utilities Commission, Docket 2011-0206 (March 25, 2013). 74 Proactive Approach Summary. 75 EPRI Presentation. 76 Rule 14H Recommendation, Screen 12 (“If minimum load data is not available and must
be calculated or estimated, Screen 12 defaults to the higher of either 75% of the estimated/calculated minimum load or a percentage of minimum load predetermined and posted by the utility for that feeder.”).
77 Rule 21 § G.2. 78 Rule 14H, Appendix III §§ 2(d), 3(c). 79 Interconnection Screens Report, p. 7. 80 Pepco Presentation. 81 EPRI Presentation. 82 Hawaii PV Monitoring Report. 83 IREC conducted informal telephone and e-mail surveys from June through August 2012
with the following companies and organizations: Itron, Inc., SMA, RevoluSun, Rising Sun Solar, and Solar City.