INTEGRATED DISEASE SURVEILLANCE AND RESPONSE · Integrated Disease Surveillance and Response ......
98
THE UNITED REPUBLIC OF TANZANIA MINISTRY OF HEALTH . NOVEMBER 2004 INTEGRATED DISEASE SURVEILLANCE AND RESPONSE Training Modules for Health Facilities Particip ant Manual
Transcript of INTEGRATED DISEASE SURVEILLANCE AND RESPONSE · Integrated Disease Surveillance and Response ......
THE UNITED REPUBLIC OF TANZANIA
MINISTRY OF HEALTH
.
NOVEMBER 2004
INTEGRATED DISEASE
SURVEILLANCE AND RESPONSE Training Modules for
Health Facilities Participant Manual
Centres for Disease Control and Prevention
Change Project
Ministry of Health
National Institute for Medical Research
Partners for Health Partners for Health Reform plus
Integrated Disease Surveillance and Response (IDSR) in Tanzania is being implemented for the Ministry of Health in 12 districts through a collaboration of the following USAID-funded partners: Centers for Disease Control and Prevention(CDC), Change Project, Partners for Health Reform plus, Ministry of Health and National Institute for Medical Research.
List of contributors
National Institute for Medical Research (NIMR)
Peter K.L Mmbuji Leonard E.G. Mboera William M. Krekamoo Janneth Maridadi-Mghamba Susan F. Rumisha Elizabeth H. Shayo Kesheni P. Senkoro Jumanne M. Mayoka Emaya A. Kapange Andrew Kajeguka Debora M.M. Bulemo
Ministry of Health
Ahmed Seha Raphael Kalinga Amos Mwakilasa Vincent Mgaya Theopista Mbago Robert Mdoe Anna Nswilla Elias Martin Mohamed A Mohamed
Centre for Development of Health, Arusha (CEDHA)
Ben Mboya Melkiory Masatu
World Health Organization � Tanzania
Mohamed Amri
Partners for Health Reform-plus (PHRplus)
Kathryn Banke Lynne Franco Debbie Gueye Margaret Morehouse Kathleen Novak Hirshini Patel Stephanie Posner Chris Tetteh Paul Richardson
CHANGE Project
Rebecca Fields Eileen Hanlon Ann Jimerson Julia Rosenbaum Mark Weeks
TRG
Graeme Frelick Fred Rosensweig
Centers for Disease Control and Prevention (CDC)
Kathy Cavallaro Jeanette St. Pierre
USAID Mission/Tanzania
Patrick Swai
Acknowledgements
We would like to express our sincere gratitude to the WHO/AFRO whose strategy, techincal guidelines and self administered training modules formed the foundation upon which materials were built. Appreciation is also extended to the regions and districts with whom we have worked for their continuous work and feedback in defining roles and responsibilities around which the modules are organized. We would like to thank the Regional Health Management Teams of Arusha/Manyara, Mtwara, Rukwa, Mwanza, Ruvuma, Dodoma, Kagera na Tabora together with Council Health Management Teams of Babati, Mbulu, Masasi, Nkasi, Sumbawanga Rural, Mwanza Urban, Tunduru, Dodoma Rural, Mpwapwa, Muleba, Igunga na Tabora Urban. We thank Ministry of Health-Tanzania especially the IDSR “ Task Force” for supervising the implementation of activities of IDSR in the 12 chosen districts. We also acknowledge Zonal Training Centres for their technical assistance in preparing the training modules. Lastly we express our gratitude to USAID for the financial support which enabled this work to be completed.
Table of Contents
Module 1: Introduction to the Workshop............................................................................ 1 Module 2: Introduction to IDSR ........................................................................................... 8 Module 3: Detect and Record Priority Diseases Using Standard Case Definitions...... 15 Module 4: Report Priority Diseases .................................................................................. 28 Module 5: Analyse and Interpret Data for Action............................................................. 44 Module 6: Investigate and Respond to Outbreaks/Epidemics....................................... .65 Module 7: Successful Community Relations for Surveillance ...................................... .77 Module 8: Application Planning ........................................................................................ 83 Module 9: Evaluation and Workshop Closure.................................................................. 87 Annex 1: Glossary of key terminologies used in Facility level training ....................... 92
1
Task 1-1
Introductions Please state:
• Your name • The health facility where you work • How long you have worked with your health
facility • Your designation • One thing you hope to learn during the
workshop
2
Individual Task Think about the disease surveillance and response activities at your health centre, dispensary or hospital Please identify and write down on a piece of paper:
• one thing you feel your facility is doing well
• one thing you feel your facility could be doing more effectively
You have 5 minutes
Task 1-2
3
In your trio (in threes)
• Reintroduce yourselves, if necessary.
• Each person shares with the others what he/she wrote.
• See if there are any commonalities.
• Have one person ready to make a brief summary for the whole group.
You have 15 minutes
Task 1-3
4
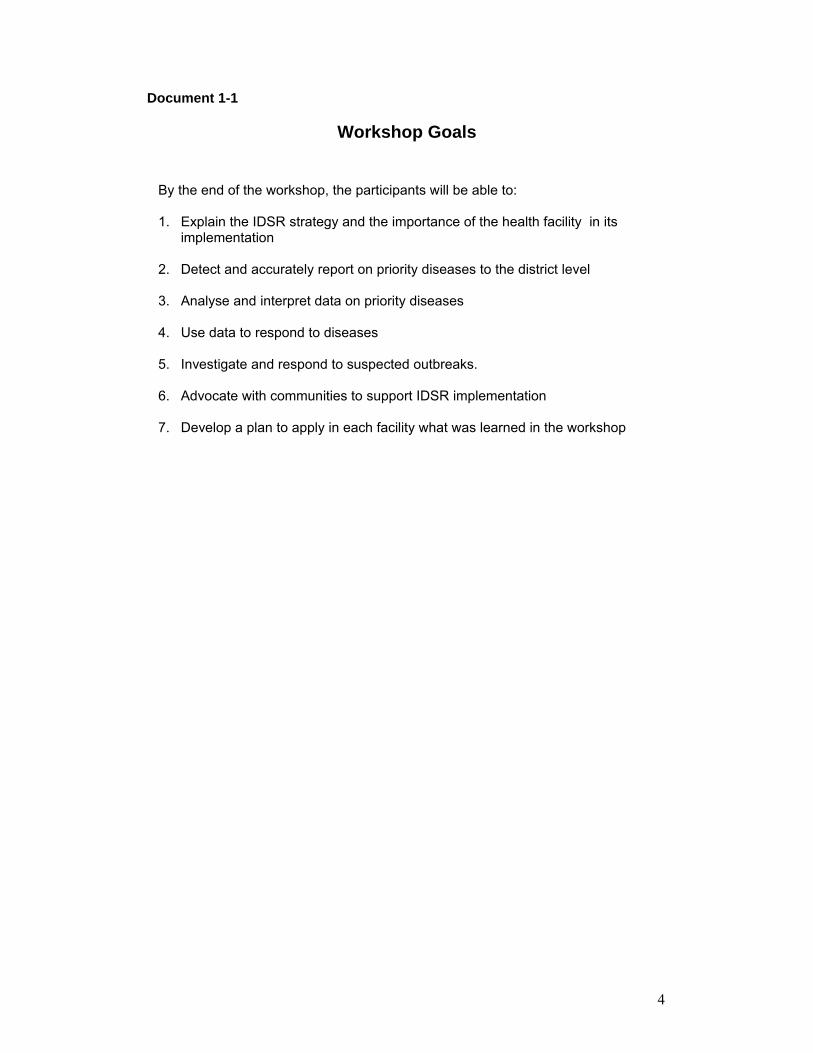
Document 1-1
Workshop Goals
By the end of the workshop, the participants will be able to: 1. Explain the IDSR strategy and the importance of the health facility in its
implementation 2. Detect and accurately report on priority diseases to the district level
3. Analyse and interpret data on priority diseases 4. Use data to respond to diseases 5. Investigate and respond to suspected outbreaks. 6. Advocate with communities to support IDSR implementation
7. Develop a plan to apply in each facility what was learned in the workshop
5
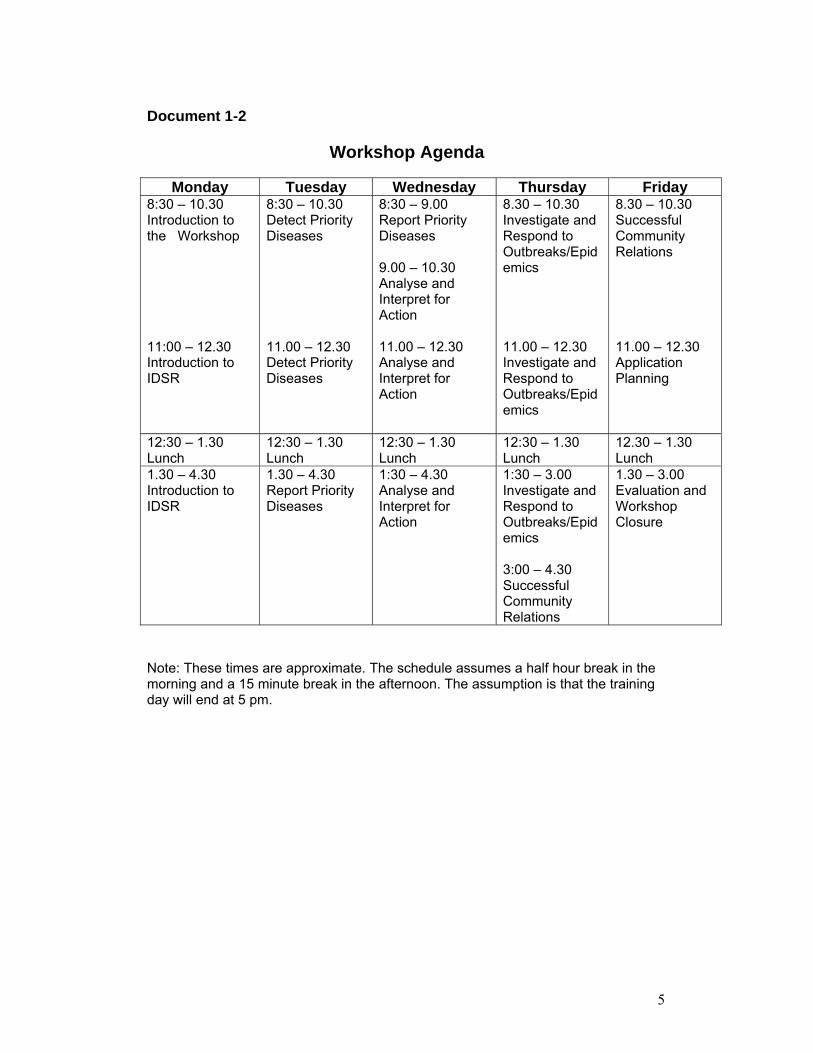
Document 1-2
Workshop Agenda
Monday Tuesday Wednesday Thursday Friday 8:30 � 10.30 Introduction to the Workshop 11:00 � 12.30 Introduction to IDSR
8:30 � 10.30 Detect Priority Diseases 11.00 � 12.30 Detect Priority Diseases
8:30 � 9.00 Report Priority Diseases 9.00 � 10.30 Analyse and Interpret for Action 11.00 � 12.30 Analyse and Interpret for Action
8.30 � 10.30 Investigate and Respond to Outbreaks/Epidemics 11.00 � 12.30 Investigate and Respond to Outbreaks/Epidemics
8.30 � 10.30 Successful Community Relations 11.00 � 12.30 Application Planning
12:30 � 1.30 Lunch
12:30 � 1.30 Lunch
12:30 � 1.30 Lunch
12:30 � 1.30 Lunch
12.30 � 1.30 Lunch
1.30 � 4.30 Introduction to IDSR
1.30 � 4.30 Report Priority Diseases
1:30 � 4.30 Analyse and Interpret for Action
1:30 � 3.00 Investigate and Respond to Outbreaks/Epidemics 3:00 � 4.30 Successful Community Relations
1.30 � 3.00 Evaluation and Workshop Closure
Note: These times are approximate. The schedule assumes a half hour break in the morning and a 15 minute break in the afternoon. The assumption is that the training day will end at 5 pm.
6
Document 1-3
Working Norms
• Active participation and full attention • Openness to new or different ideas • Active listening • Balanced participation; giving everyone a chance to participate • Keep time • Turn cell phones off during sessions

7
Document 1-4 Pre-Test
To be provided by Facilitators
8
Document 2-1
Module 2 Objectives
By the end of this session, participants will be able to:
Explain the IDSR strategy for improving surveillance in Tanzania Describe how surveillance data helps in understanding local public health
issues Explain the benefits and uses of surveillance in their community Discuss the facility�s role in carrying out the IDSR strategy
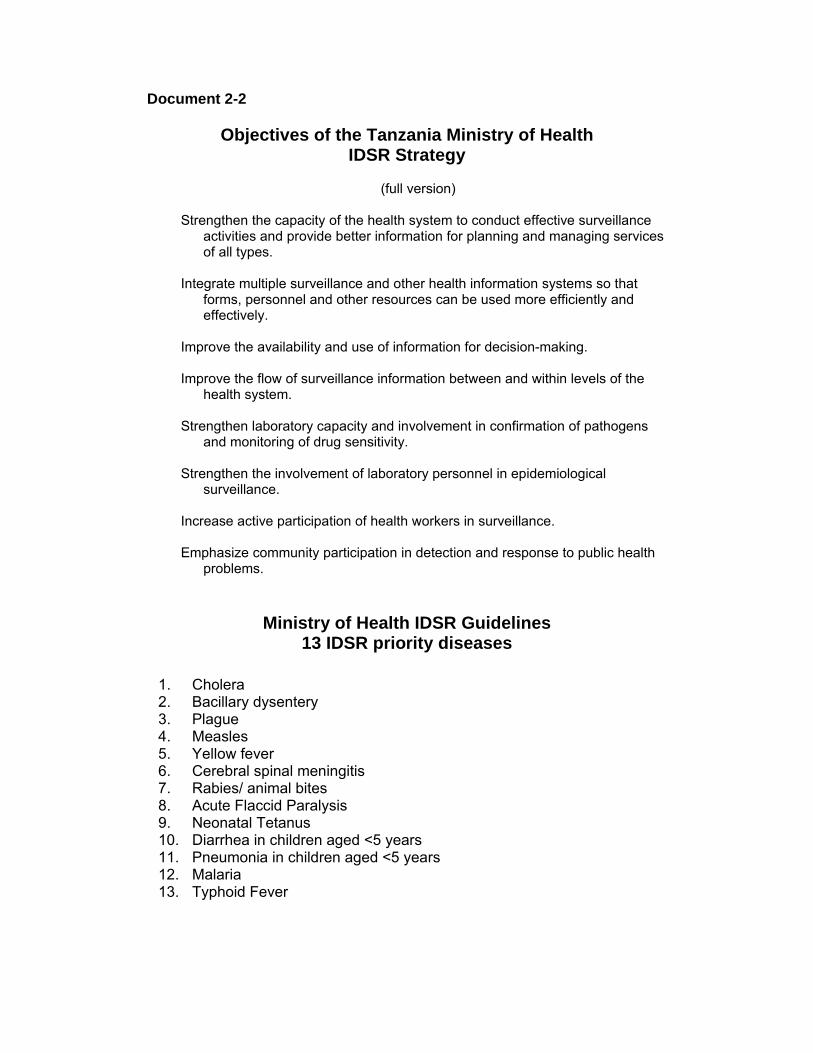
Document 2-2
Objectives of the Tanzania Ministry of Health IDSR Strategy
(full version)
Strengthen the capacity of the health system to conduct effective surveillance
activities and provide better information for planning and managing services of all types.
Integrate multiple surveillance and other health information systems so that
forms, personnel and other resources can be used more efficiently and effectively.
Improve the availability and use of information for decision-making. Improve the flow of surveillance information between and within levels of the
health system. Strengthen laboratory capacity and involvement in confirmation of pathogens
and monitoring of drug sensitivity. Strengthen the involvement of laboratory personnel in epidemiological
surveillance. Increase active participation of health workers in surveillance. Emphasize community participation in detection and response to public health
problems.
Ministry of Health IDSR Guidelines 13 IDSR priority diseases
1. Cholera 2. Bacillary dysentery 3. Plague 4. Measles 5. Yellow fever 6. Cerebral spinal meningitis 7. Rabies/ animal bites 8. Acute Flaccid Paralysis 9. Neonatal Tetanus 10. Diarrhea in children aged <5 years 11. Pneumonia in children aged <5 years 12. Malaria 13. Typhoid Fever
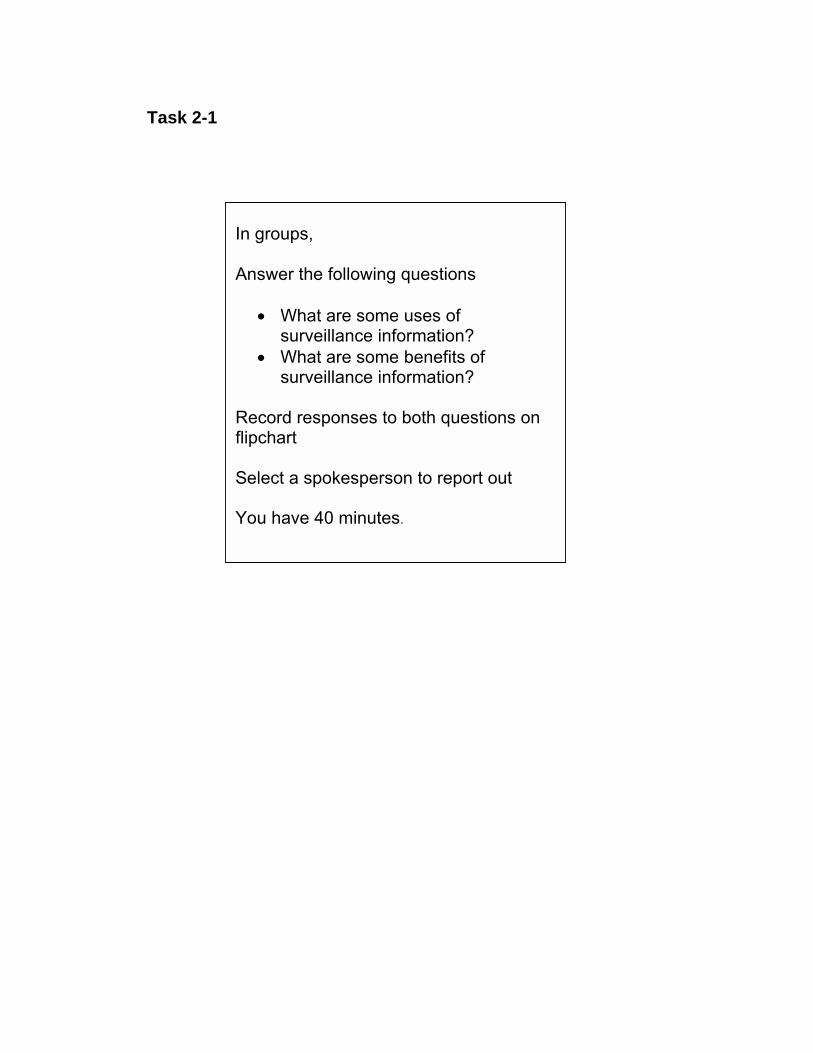
Task 2-1
In groups, Answer the following questions
• What are some uses of surveillance information?
• What are some benefits of surveillance information?
Record responses to both questions on flipchart Select a spokesperson to report out You have 40 minutes.
11
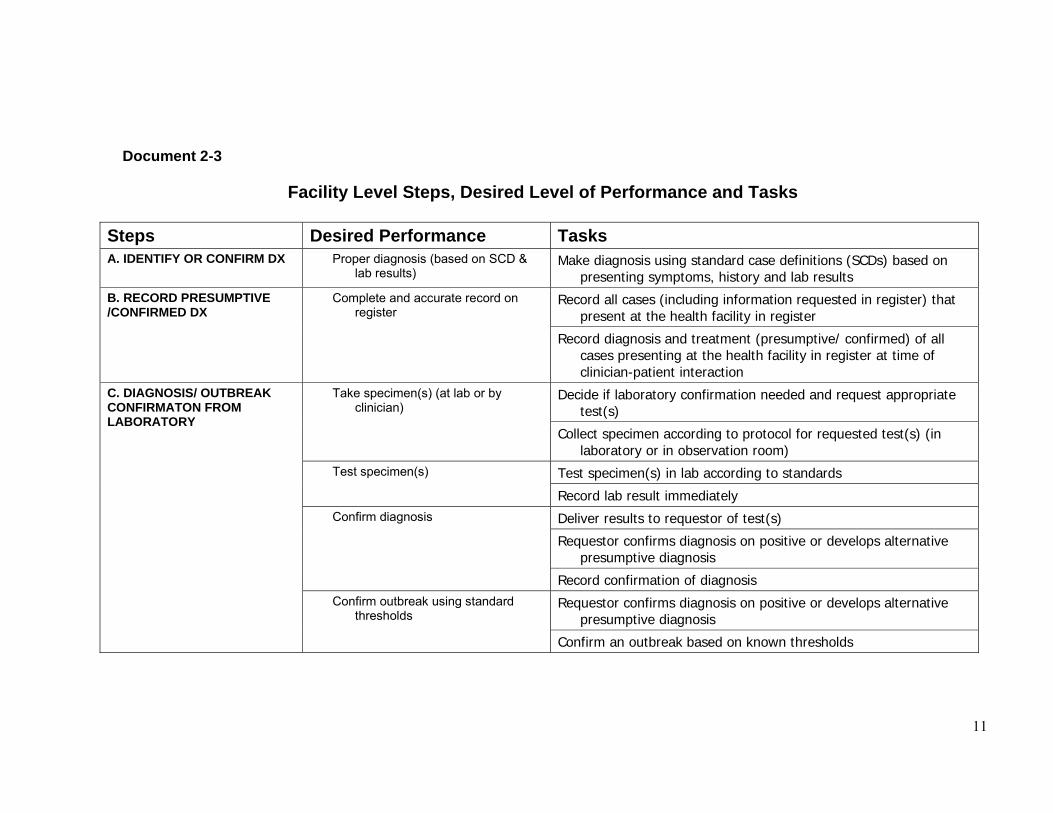
Document 2-3
Facility Level Steps, Desired Level of Performance and Tasks
Steps Desired Performance Tasks A. IDENTIFY OR CONFIRM DX Proper diagnosis (based on SCD &
lab results) Make diagnosis using standard case definitions (SCDs) based on
presenting symptoms, history and lab results
Record all cases (including information requested in register) that present at the health facility in register
B. RECORD PRESUMPTIVE /CONFIRMED DX
Complete and accurate record on register
Record diagnosis and treatment (presumptive/ confirmed) of all cases presenting at the health facility in register at time of clinician-patient interaction
Decide if laboratory confirmation needed and request appropriate test(s)
Take specimen(s) (at lab or by clinician)
Collect specimen according to protocol for requested test(s) (in laboratory or in observation room)
Test specimen(s) in lab according to standards Test specimen(s)
Record lab result immediately
Deliver results to requestor of test(s)
Requestor confirms diagnosis on positive or develops alternative presumptive diagnosis
Confirm diagnosis
Record confirmation of diagnosis
Requestor confirms diagnosis on positive or develops alternative presumptive diagnosis
C. DIAGNOSIS/ OUTBREAK CONFIRMATON FROM LABORATORY
Confirm outbreak using standard thresholds
Confirm an outbreak based on known thresholds
12
Manage treatment of case according to protocol for presumptive /confirmed diagnosis
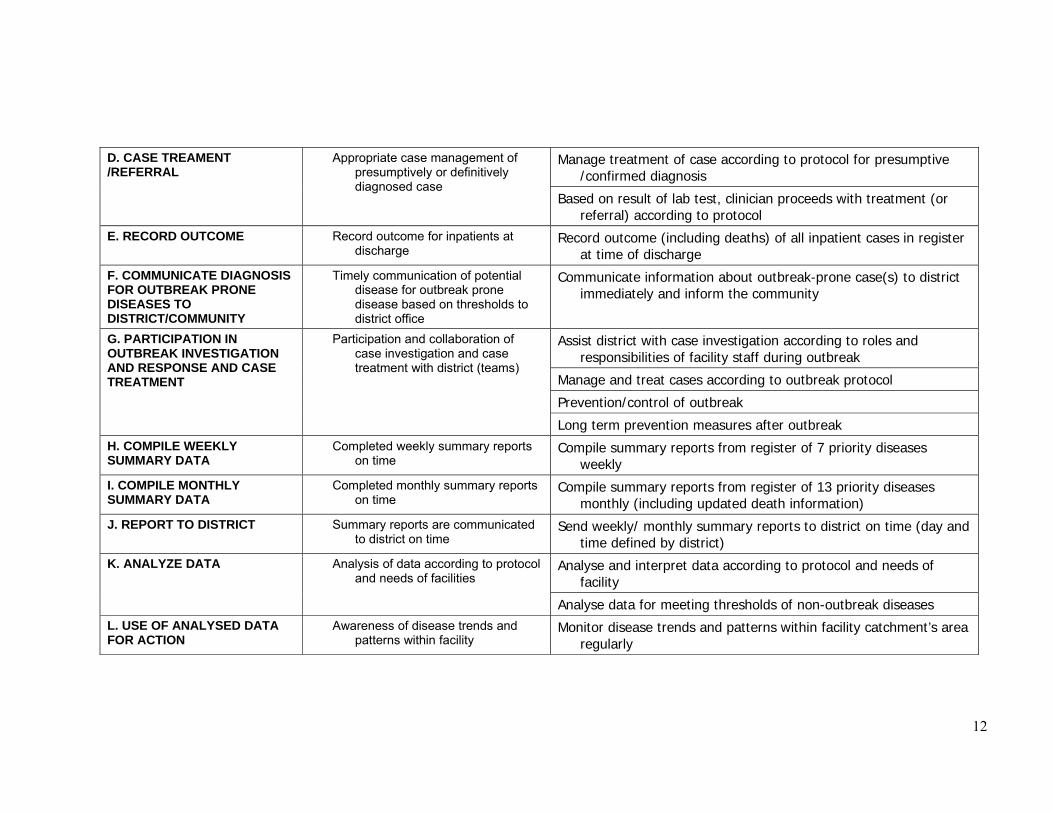
D. CASE TREAMENT /REFERRAL
Appropriate case management of presumptively or definitively diagnosed case
Based on result of lab test, clinician proceeds with treatment (or referral) according to protocol
E. RECORD OUTCOME Record outcome for inpatients at discharge
Record outcome (including deaths) of all inpatient cases in register at time of discharge
F. COMMUNICATE DIAGNOSIS FOR OUTBREAK PRONE DISEASES TO DISTRICT/COMMUNITY
Timely communication of potential disease for outbreak prone disease based on thresholds to district office
Communicate information about outbreak-prone case(s) to district immediately and inform the community
Assist district with case investigation according to roles and responsibilities of facility staff during outbreak
Manage and treat cases according to outbreak protocol
Prevention/control of outbreak
G. PARTICIPATION IN OUTBREAK INVESTIGATION AND RESPONSE AND CASE TREATMENT
Participation and collaboration of case investigation and case treatment with district (teams)
Long term prevention measures after outbreak H. COMPILE WEEKLY SUMMARY DATA
Completed weekly summary reports on time
Compile summary reports from register of 7 priority diseases weekly
I. COMPILE MONTHLY SUMMARY DATA
Completed monthly summary reports on time
Compile summary reports from register of 13 priority diseases monthly (including updated death information)
J. REPORT TO DISTRICT Summary reports are communicated to district on time
Send weekly/ monthly summary reports to district on time (day and time defined by district)
Analyse and interpret data according to protocol and needs of facility
K. ANALYZE DATA Analysis of data according to protocol and needs of facilities
Analyse data for meeting thresholds of non-outbreak diseases L. USE OF ANALYSED DATA FOR ACTION
Awareness of disease trends and patterns within facility
Monitor disease trends and patterns within facility catchment’s area regularly
13
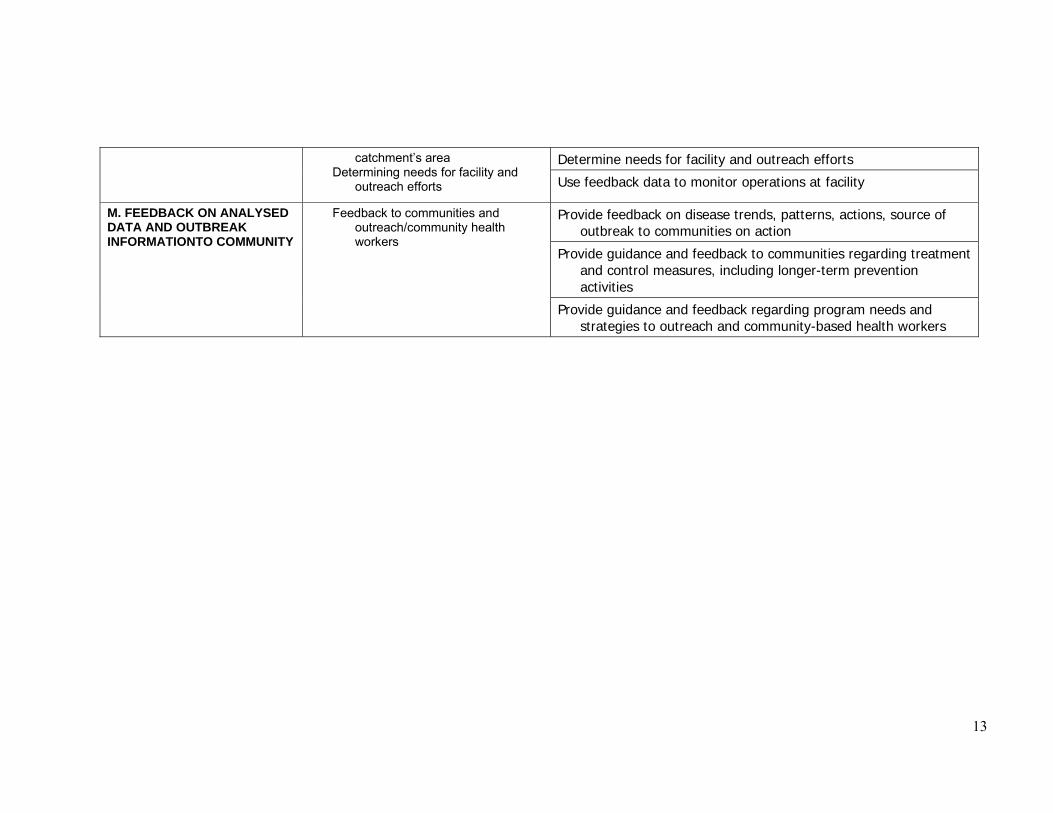
Determine needs for facility and outreach efforts catchment�s area Determining needs for facility and
outreach efforts Use feedback data to monitor operations at facility
Provide feedback on disease trends, patterns, actions, source of outbreak to communities on action
Provide guidance and feedback to communities regarding treatment and control measures, including longer-term prevention activities
M. FEEDBACK ON ANALYSED DATA AND OUTBREAK INFORMATIONTO COMMUNITY
Feedback to communities and outreach/community health workers
Provide guidance and feedback regarding program needs and strategies to outreach and community-based health workers
14
Document 2-4
Application Planning Please take a few minutes to think through and respond to the following questions. These questions are intended to help you think about how this module applies to your work. 1. What do you need to clarify regarding your facility�s role in IDSR implementation?
Is there anyone in particular that you need to discuss your role with? 2. What do you expect to be the main challenges in carrying out your IDSR
responsibilities? What can you do to overcome those challenges?
15
Document 3-1
Module 3 Objectives
After completing this module, participants will be able to:
Apply standard case definitions correctly to 13 IDSR priority diseases (+TB and AIDS and viral hemorrhagic fever)
Consistently record presumptive diagnoses from standard case definitions in
facility register(s) Describe the epidemic/action thresholds for each of the priority diseases Become conversant with the case investigation form
16
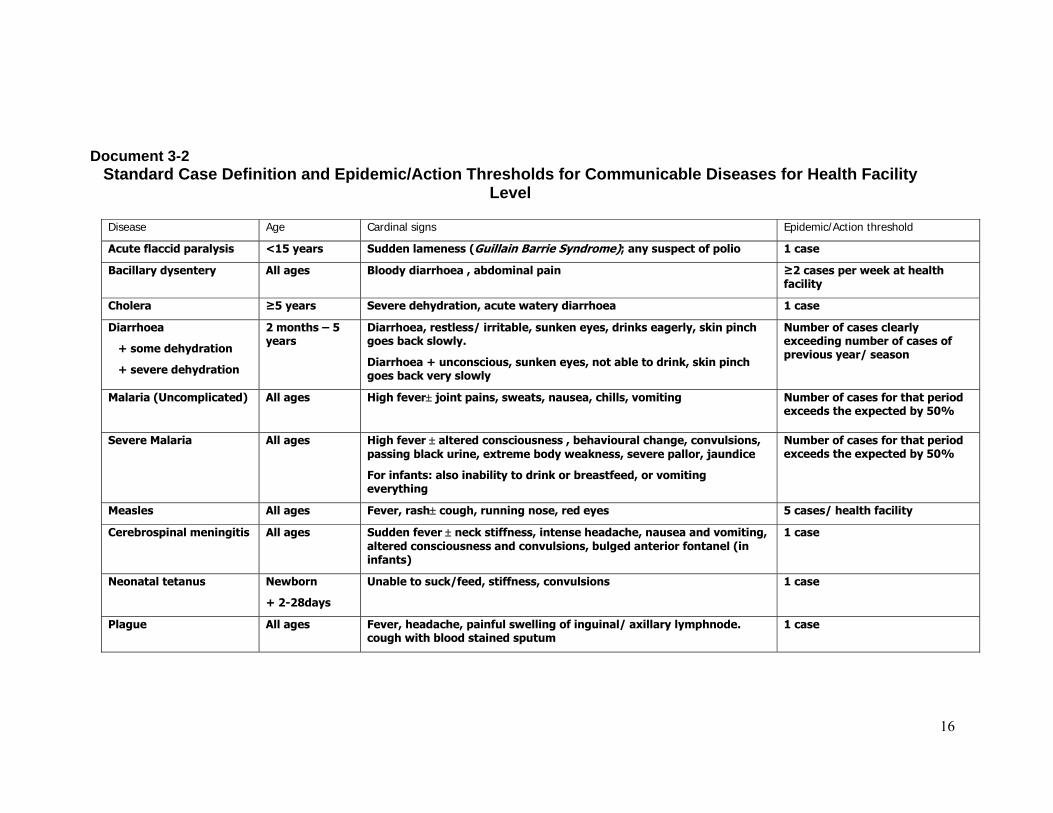
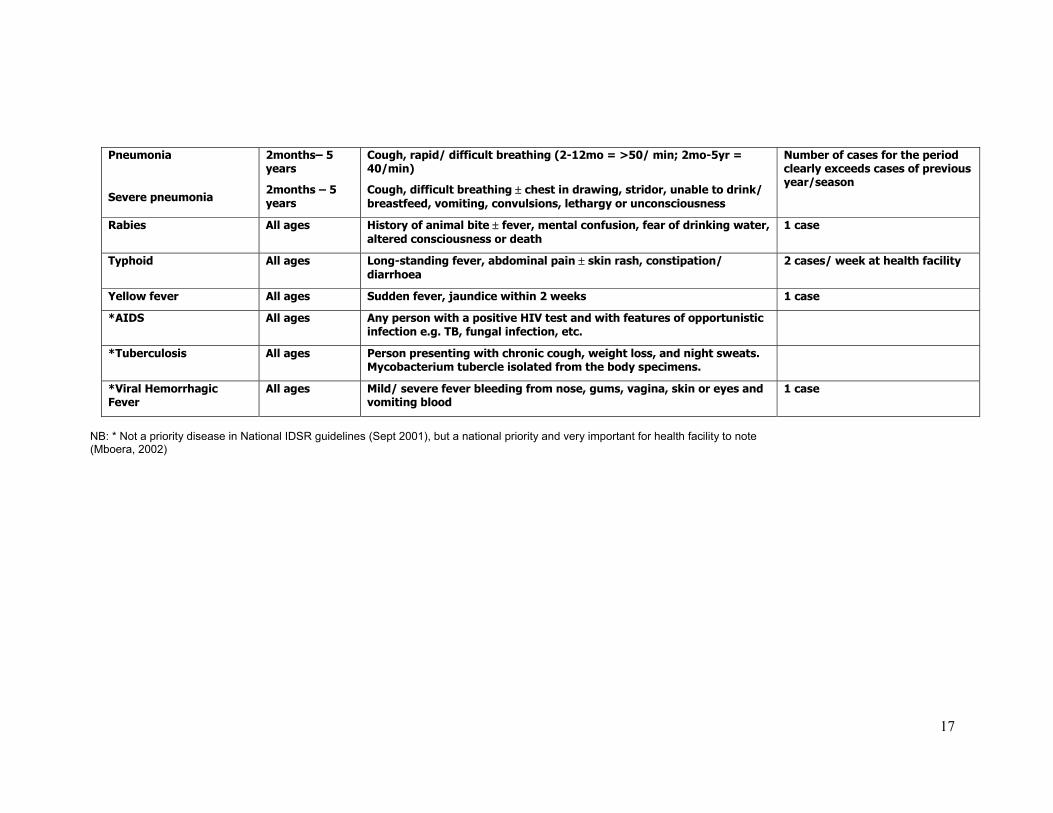
Document 3-2 Standard Case Definition and Epidemic/Action Thresholds for Communicable Diseases for Health Facility
Level
Disease Age Cardinal signs Epidemic/Action threshold
Acute flaccid paralysis <15 years Sudden lameness (Guillain Barrie Syndrome); any suspect of polio 1 case
Bacillary dysentery All ages Bloody diarrhoea , abdominal pain ≥2 cases per week at health facility
Cholera ≥5 years Severe dehydration, acute watery diarrhoea 1 case
Diarrhoea
+ some dehydration
+ severe dehydration
2 months � 5 years
Diarrhoea, restless/ irritable, sunken eyes, drinks eagerly, skin pinch goes back slowly.
Diarrhoea + unconscious, sunken eyes, not able to drink, skin pinch goes back very slowly
Number of cases clearly exceeding number of cases of previous year/ season
Malaria (Uncomplicated)
All ages High fever± joint pains, sweats, nausea, chills, vomiting Number of cases for that period exceeds the expected by 50%
Severe Malaria All ages High fever ± altered consciousness , behavioural change, convulsions, passing black urine, extreme body weakness, severe pallor, jaundice
For infants: also inability to drink or breastfeed, or vomiting everything
Number of cases for that period exceeds the expected by 50%
Measles All ages Fever, rash± cough, running nose, red eyes 5 cases/ health facility
Cerebrospinal meningitis All ages Sudden fever ± neck stiffness, intense headache, nausea and vomiting, altered consciousness and convulsions, bulged anterior fontanel (in infants)
1 case
Neonatal tetanus Newborn
+ 2-28days
Unable to suck/feed, stiffness, convulsions 1 case
Plague All ages Fever, headache, painful swelling of inguinal/ axillary lymphnode. cough with blood stained sputum
1 case
17
Pneumonia
Severe pneumonia
2months� 5 years
2months � 5 years
Cough, rapid/ difficult breathing (2-12mo = >50/ min; 2mo-5yr = 40/min)
Cough, difficult breathing ± chest in drawing, stridor, unable to drink/ breastfeed, vomiting, convulsions, lethargy or unconsciousness
Number of cases for the period clearly exceeds cases of previous year/season
Rabies All ages History of animal bite ± fever, mental confusion, fear of drinking water, altered consciousness or death
1 case
Typhoid All ages Long-standing fever, abdominal pain ± skin rash, constipation/ diarrhoea
2 cases/ week at health facility
Yellow fever All ages Sudden fever, jaundice within 2 weeks 1 case
*AIDS All ages Any person with a positive HIV test and with features of opportunistic infection e.g. TB, fungal infection, etc.
*Tuberculosis All ages Person presenting with chronic cough, weight loss, and night sweats. Mycobacterium tubercle isolated from the body specimens.
*Viral Hemorrhagic Fever
All ages Mild/ severe fever bleeding from nose, gums, vagina, skin or eyes and vomiting blood
1 case
NB: * Not a priority disease in National IDSR guidelines (Sept 2001), but a national priority and very important for health facility to note (Mboera, 2002)
18
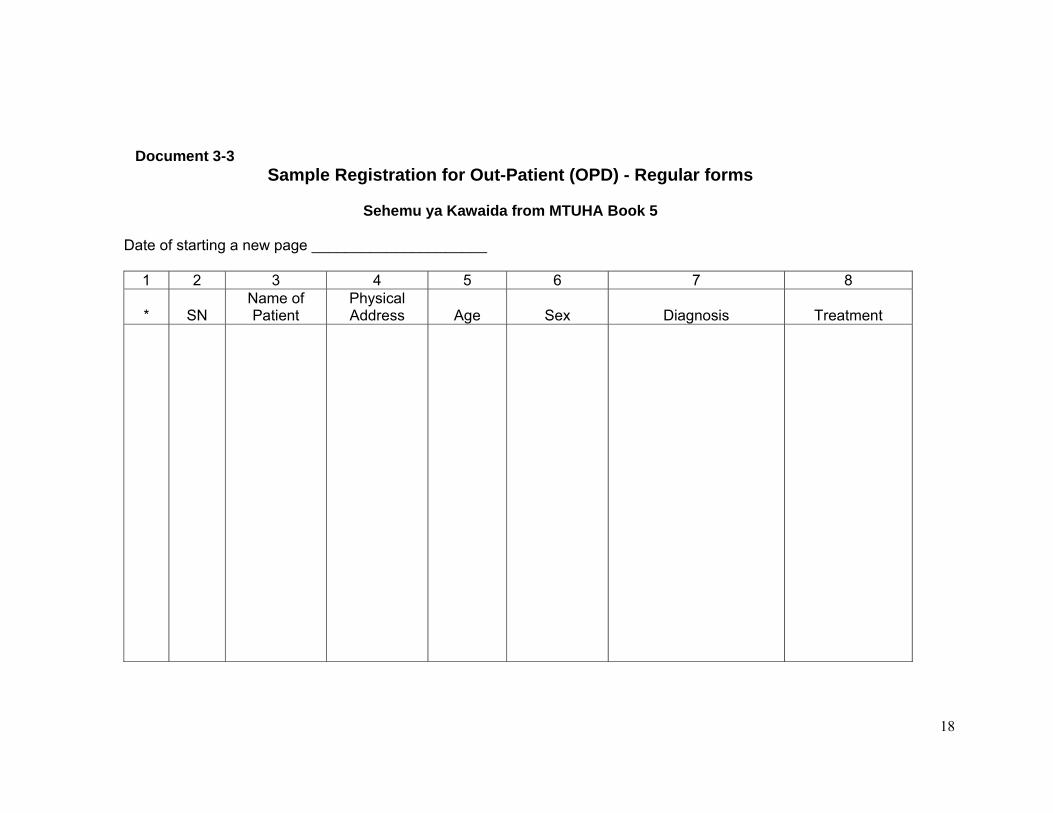
Document 3-3 Sample Registration for Out-Patient (OPD) - Regular forms
Sehemu ya Kawaida from MTUHA Book 5
Date of starting a new page _____________________
1 2 3 4 5 6 7 8 *
SN
Name of Patient
Physical Address
Age
Sex
Diagnosis
Treatment
19
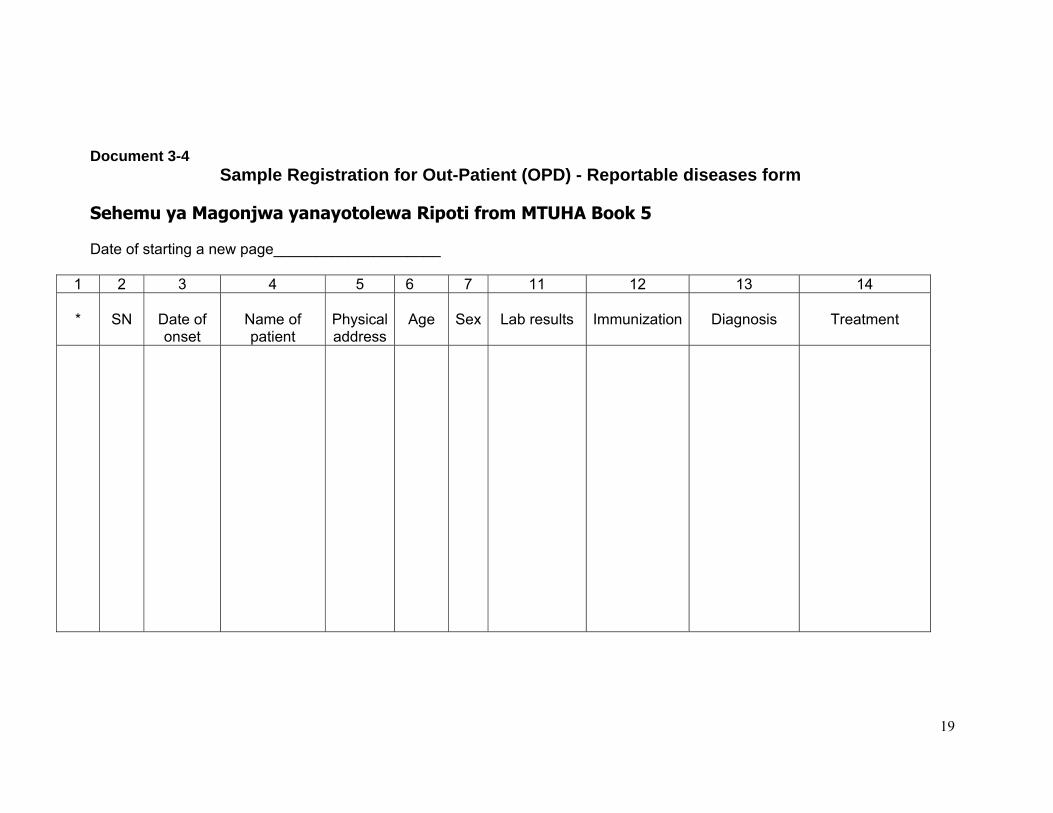
Document 3-4 Sample Registration for Out-Patient (OPD) - Reportable diseases form
Sehemu ya Magonjwa yanayotolewa Ripoti from MTUHA Book 5 Date of starting a new page____________________
1 2 3 4 5 6 7 11 12 13 14 *
SN
Date of onset
Name of patient
Physical address
Age
Sex
Lab results
Immunization
Diagnosis
Treatment
20
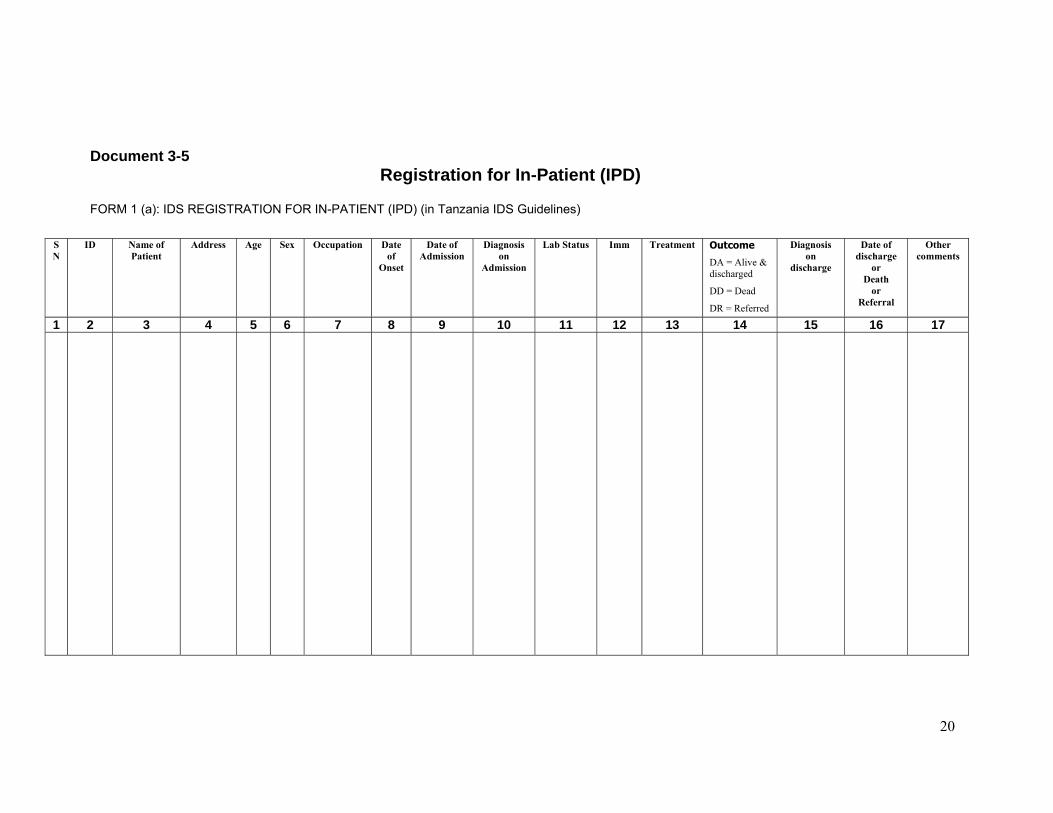
Document 3-5 Registration for In-Patient (IPD)
FORM 1 (a): IDS REGISTRATION FOR IN-PATIENT (IPD) (in Tanzania IDS Guidelines)
SN
ID Name of Patient
Address Age Sex Occupation Date of
Onset
Date of Admission
Diagnosis on
Admission
Lab Status Imm Treatment Outcome
DA = Alive & discharged
DD = Dead
DR = Referred
Diagnosis on
discharge
Date of discharge
or Death
or Referral
Other comments
1 2 3 4 5 6 7 8 9 10 11 12 13 14 15 16 17
21
Task 3-1
In pairs: • Using the SCD table (Doc 3-2) in your
manual, complete the �Suspected disease/syndrome� column of the sample register (Doc 3-6). Use only IDSR diseases.
• Note that the first three rows have been
completed as examples. Take 20 minutes
22
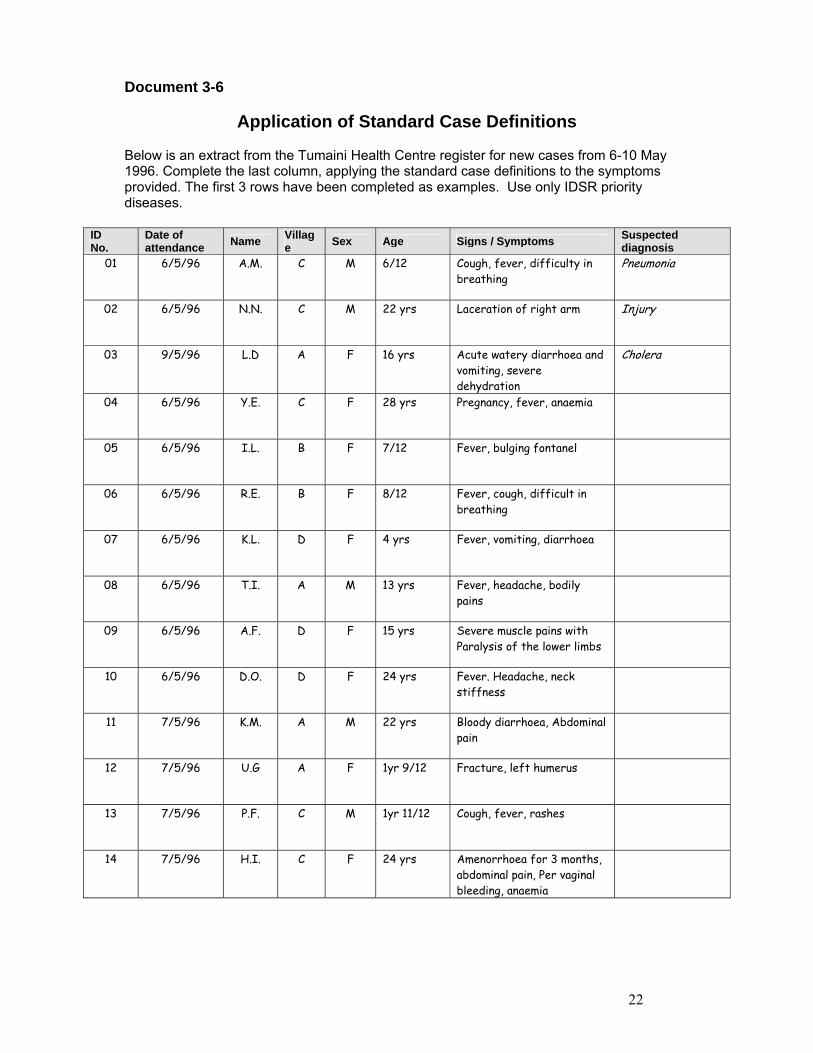
Document 3-6
Application of Standard Case Definitions Below is an extract from the Tumaini Health Centre register for new cases from 6-10 May 1996. Complete the last column, applying the standard case definitions to the symptoms provided. The first 3 rows have been completed as examples. Use only IDSR priority diseases.
ID No.
Date of attendance Name Villag
e Sex Age Signs / Symptoms Suspected diagnosis
01 6/5/96 A.M. C M 6/12 Cough, fever, difficulty in breathing
Pneumonia
02 6/5/96 N.N. C M 22 yrs Laceration of right arm Injury
03 9/5/96 L.D A F 16 yrs Acute watery diarrhoea and vomiting, severe dehydration
Cholera
04 6/5/96 Y.E. C F 28 yrs Pregnancy, fever, anaemia
05 6/5/96 I.L. B F 7/12 Fever, bulging fontanel
06 6/5/96 R.E. B F 8/12 Fever, cough, difficult in breathing
07 6/5/96 K.L. D F 4 yrs Fever, vomiting, diarrhoea
08 6/5/96 T.I. A M 13 yrs Fever, headache, bodily pains
09 6/5/96 A.F. D F 15 yrs Severe muscle pains with Paralysis of the lower limbs
10 6/5/96 D.O. D F 24 yrs Fever. Headache, neck stiffness
11 7/5/96 K.M. A M 22 yrs Bloody diarrhoea, Abdominal pain
12 7/5/96 U.G A F 1yr 9/12 Fracture, left humerus
13 7/5/96 P.F. C M 1yr 11/12 Cough, fever, rashes
14 7/5/96 H.I. C F 24 yrs Amenorrhoea for 3 months, abdominal pain, Per vaginal bleeding, anaemia
23
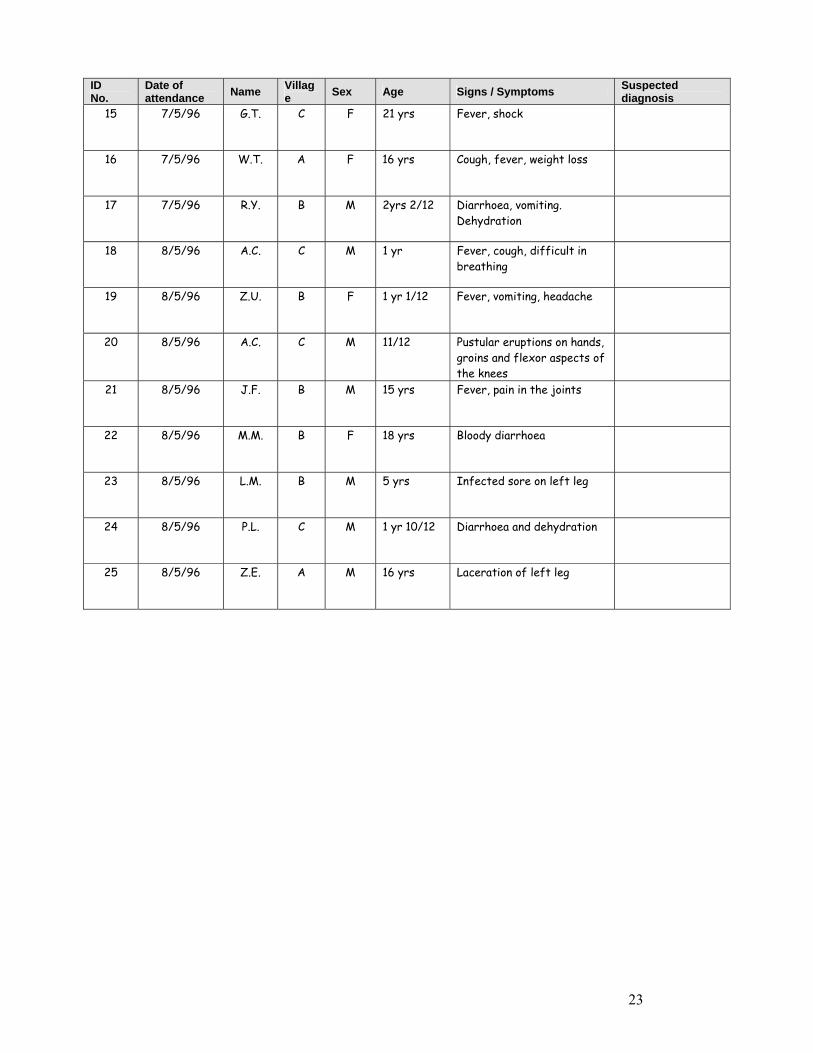
ID No.
Date of attendance Name Villag
e Sex Age Signs / Symptoms Suspected diagnosis
15 7/5/96 G.T. C F 21 yrs Fever, shock
16 7/5/96 W.T. A F 16 yrs Cough, fever, weight loss
17 7/5/96 R.Y. B M 2yrs 2/12 Diarrhoea, vomiting. Dehydration
18 8/5/96 A.C. C M 1 yr Fever, cough, difficult in breathing
19 8/5/96 Z.U. B F 1 yr 1/12 Fever, vomiting, headache
20 8/5/96 A.C. C M 11/12 Pustular eruptions on hands, groins and flexor aspects of the knees
21 8/5/96 J.F. B M 15 yrs Fever, pain in the joints
22 8/5/96 M.M. B F 18 yrs Bloody diarrhoea
23 8/5/96 L.M. B M 5 yrs Infected sore on left leg
24 8/5/96 P.L. C M 1 yr 10/12 Diarrhoea and dehydration
25 8/5/96 Z.E. A M 16 yrs Laceration of left leg
24
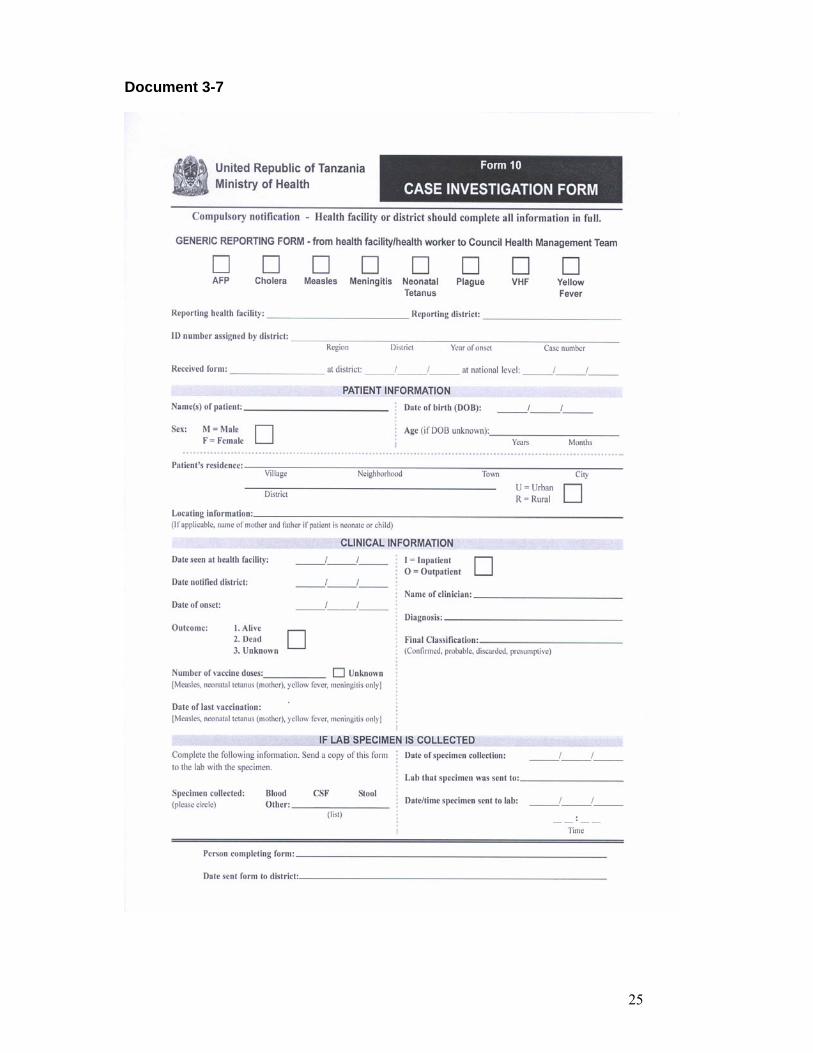
Document 3-7
Case investigation form
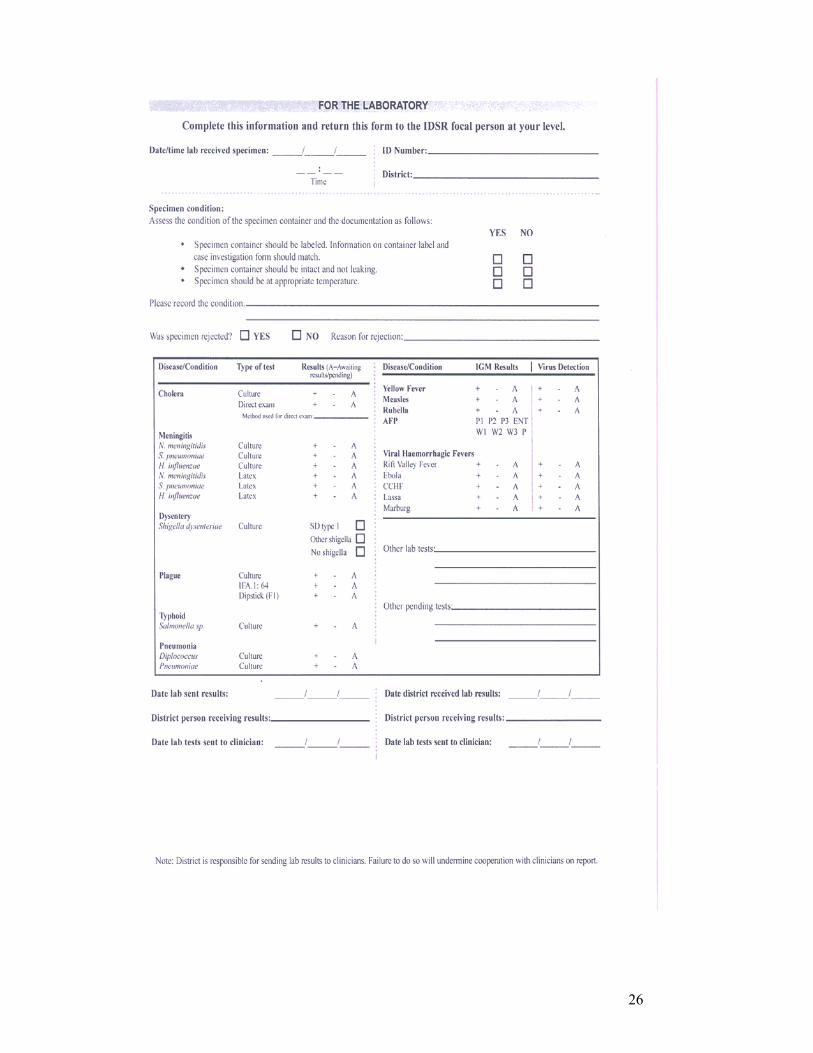
The sample form on the next page has two sections. The top half is where information is recorded about the individual case. It provides information that can be used to plan a more detailed case investigation. The bottom half of the form is a laboratory transmittal slip. It contains spaces where laboratory results and information about the timeliness of the laboratory testing should be recorded. After the health facility or district staff complete the top part of the form, a copy of it can be made and included with the specimen, if a specimen has been collected, when it is sent to the laboratory.
25
Document 3-7
26
27
Document 3-8
Application Planning Please take a few minutes to think through and respond to the following questions. These questions are intended to help you think about how this module applies to your work.
1. What do you need to do in order to improve the use of standard case definitions in your facility?
2. What do you expect will be the biggest difficulties in improving the recording of (presumptive) diagnoses in facility registers? What can you do to overcome those challenges?
28
Document 4-1 Module 4 Objectives
By the end of this module, participants will be able to:
Explain the benefits of sharing information to all levels Identify the correct report forms to use Fill out correctly IDSR weekly and monthly report forms. Report information to the district in a timely, complete, and accurate manner
29
Task 4-1
In small groups
• For the level assigned to your group, develop a list of benefits of sharing information.
• Take the point of view of the people at that
level. Record your response on the flipchart. Take 25 minutes
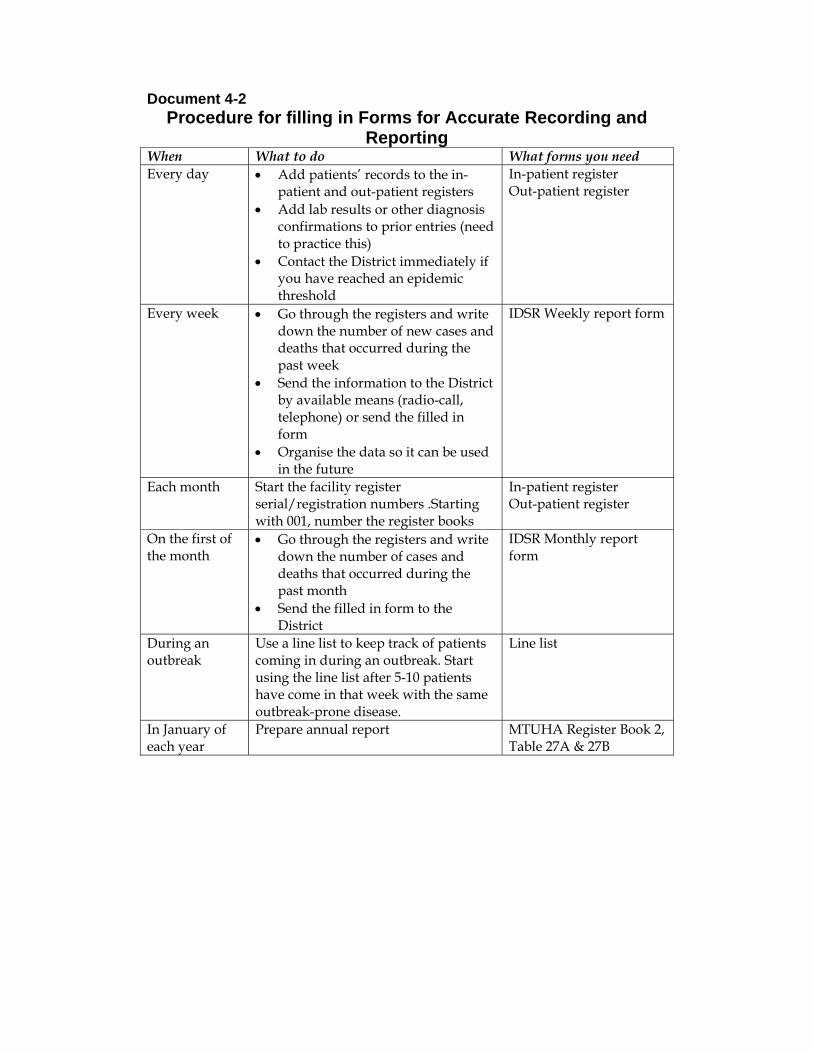
Document 4-2 Procedure for filling in Forms for Accurate Recording and
Reporting When What to do What forms you need Every day • Add patients� records to the in-
patient and out-patient registers • Add lab results or other diagnosis
confirmations to prior entries (need to practice this)
• Contact the District immediately if you have reached an epidemic threshold
In-patient register Out-patient register
Every week • Go through the registers and write down the number of new cases and deaths that occurred during the past week
• Send the information to the District by available means (radio-call, telephone) or send the filled in form
• Organise the data so it can be used in the future
IDSR Weekly report form
Each month Start the facility register serial/registration numbers .Starting with 001, number the register books
In-patient register Out-patient register
On the first of the month
• Go through the registers and write down the number of cases and deaths that occurred during the past month
• Send the filled in form to the District
IDSR Monthly report form
During an outbreak
Use a line list to keep track of patients coming in during an outbreak. Start using the line list after 5-10 patients have come in that week with the same outbreak-prone disease.
Line list
In January of each year
Prepare annual report MTUHA Register Book 2, Table 27A & 27B
31
Documents 4-3
IDSR Form 3(b) IDSR Weekly form for reported new cases/deaths to be sent to District
level (to be reported to district level)
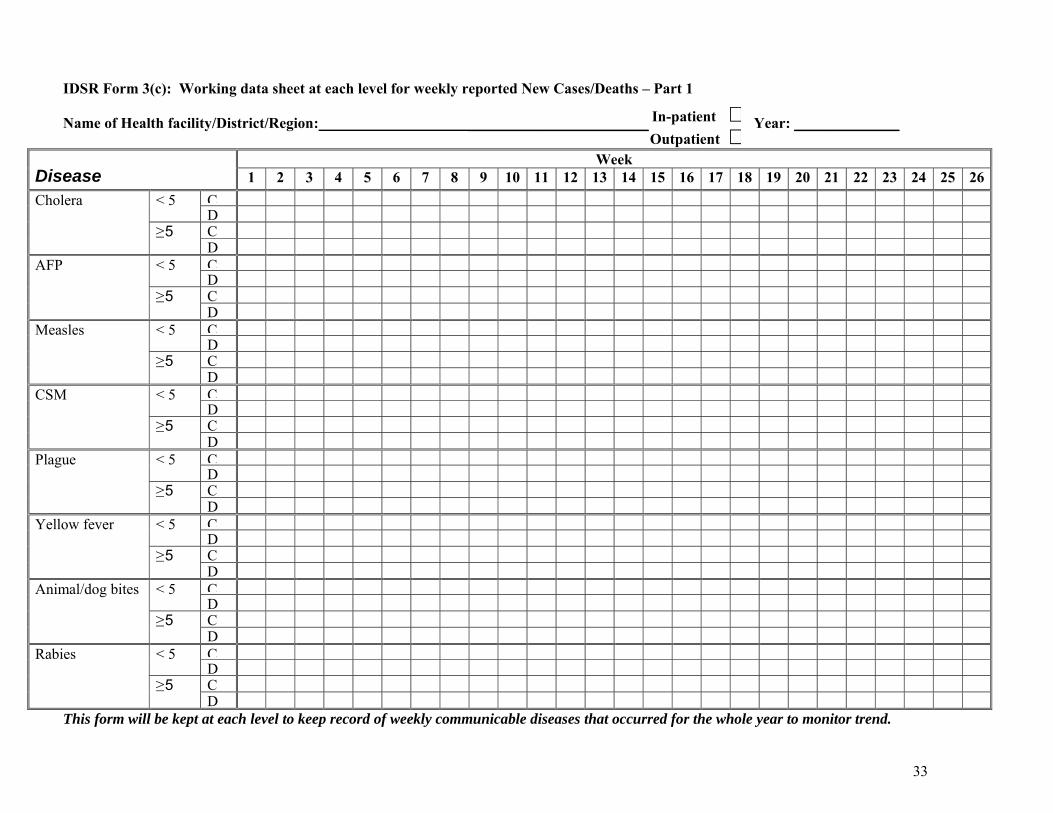
IDSR Form 3(c): IDSR Working data sheet at each level for weekly reported New
Cases/Deaths (to be maintained at the facility)
(on next pages)
32
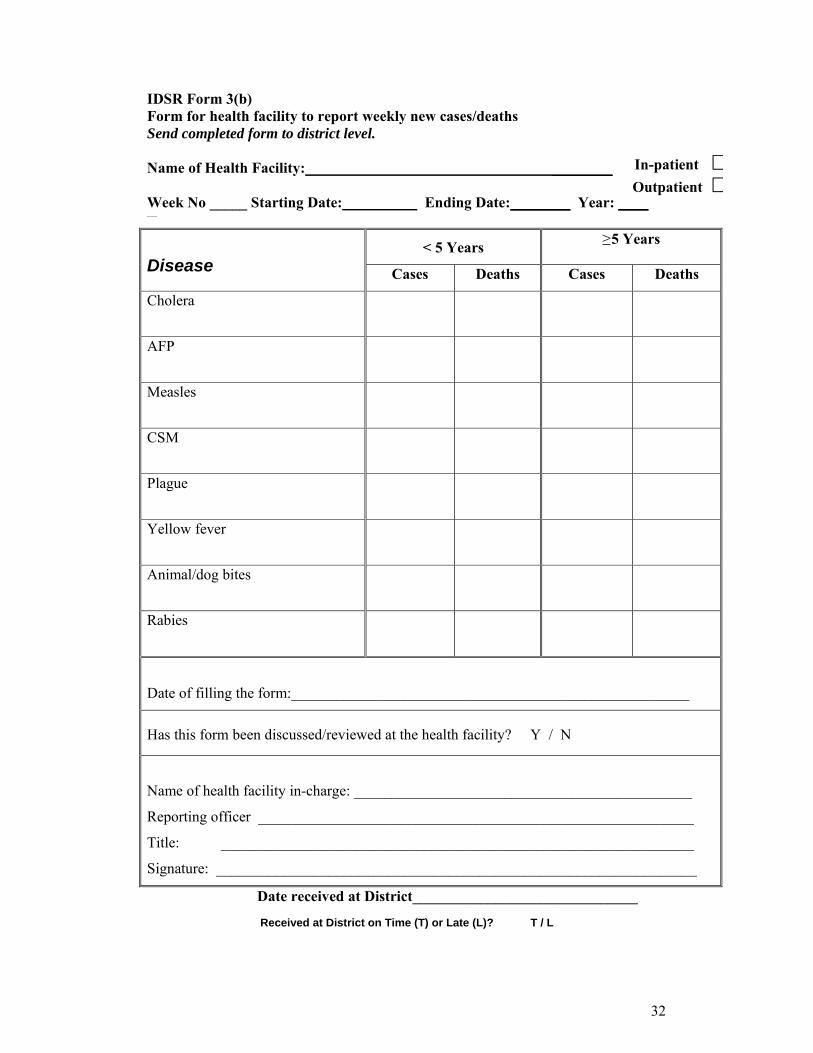
IDSR Form 3(b) Form for health facility to report weekly new cases/deaths Send completed form to district level. Name of Health Facility: ________
Week No _____ Starting Date: Ending Date:________ Year: ____ ____
< 5 Years ≥ 5 Years Disease Cases Deaths Cases Deaths
Cholera
AFP
Measles
CSM
Plague
Yellow fever
Animal/dog bites
Rabies
Date of filling the form:_____________________________________________________
Has this form been discussed/reviewed at the health facility? Y / N
Name of health facility in-charge: _____________________________________________
Reporting officer __________________________________________________________
Title: _______________________________________________________________
Signature: ________________________________________________________________
Date received at District______________________________
Received at District on Time (T) or Late (L)? T / L
In-patient $Outpatient $
33
IDSR Form 3(c): Working data sheet at each level for weekly reported New Cases/Deaths � Part 1 Name of Health facility/District/Region: ________________________ Year: ______________
Week Disease 1 2 3 4 5 6 7 8 9 10 11 12 13 14 15 16 17 18 19 20 21 22 23 24 25 26
C< 5 D C
Cholera
≥ 5 D
C< 5 D C
AFP
≥ 5 D
C< 5 D C
Measles
≥ 5 D
C< 5 D C
CSM
≥ 5 D
C< 5 D C
Plague
≥ 5 D
C< 5 D C
Yellow fever
≥ 5 D
C< 5 D C
Animal/dog bites
≥ 5 D
C< 5 D C
Rabies
≥ 5 D
This form will be kept at each level to keep record of weekly communicable diseases that occurred for the whole year to monitor trend.
In-patient $Outpatient $
34
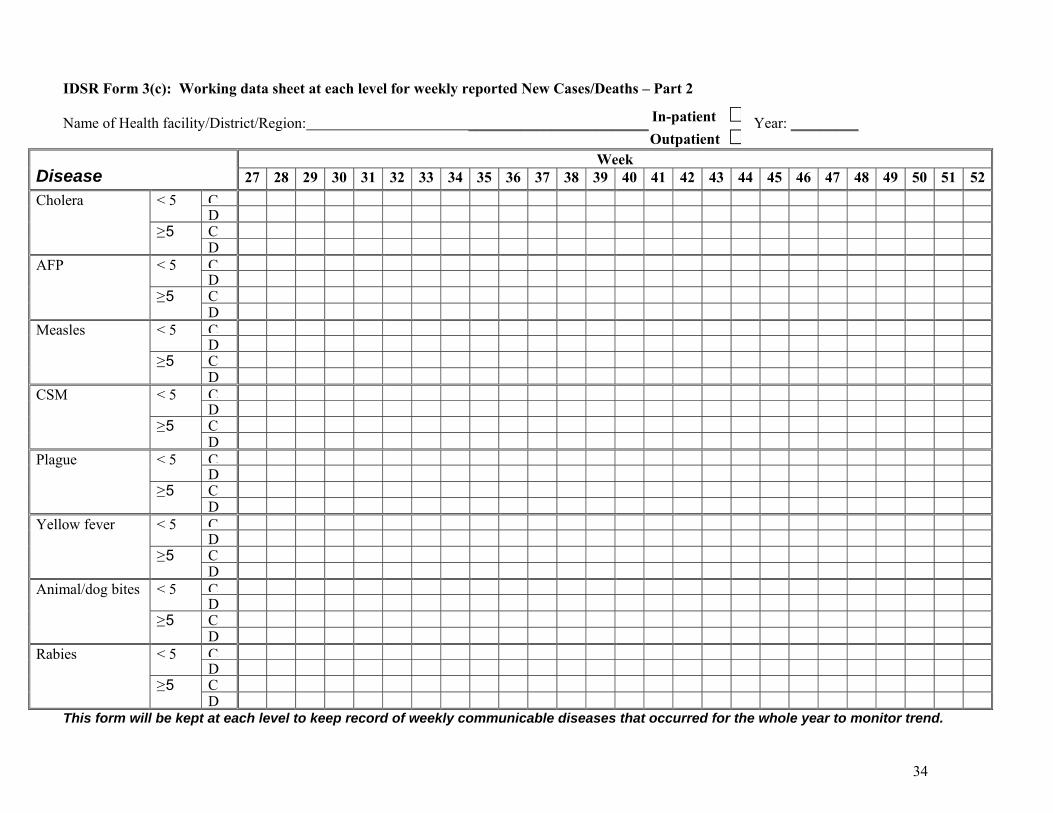
IDSR Form 3(c): Working data sheet at each level for weekly reported New Cases/Deaths � Part 2 Name of Health facility/District/Region: ________________________ Year: _________
Week Disease 27 28 29 30 31 32 33 34 35 36 37 38 39 40 41 42 43 44 45 46 47 48 49 50 51 52
C< 5 D C
Cholera
≥ 5 D
C< 5 D C
AFP
≥ 5 D
C< 5 D C
Measles
≥ 5 D
C< 5 D C
CSM
≥ 5 D
C< 5 D C
Plague
≥ 5 D
C< 5 D C
Yellow fever
≥ 5 D
C< 5 D C
Animal/dog bites
≥ 5 D
C< 5 D C
Rabies
≥ 5 D
This form will be kept at each level to keep record of weekly communicable diseases that occurred for the whole year to monitor trend.
In-patient $Outpatient $
35
Document 4-4
IDSR Form 2(b)
IDSR Form for health facility to sum up monthly data for in-patient and
out-patient Send this form to district level
Form 2(a) Monthly working data sheet for in/out-patients.
Keep this form at the facility level
(on next page)
36
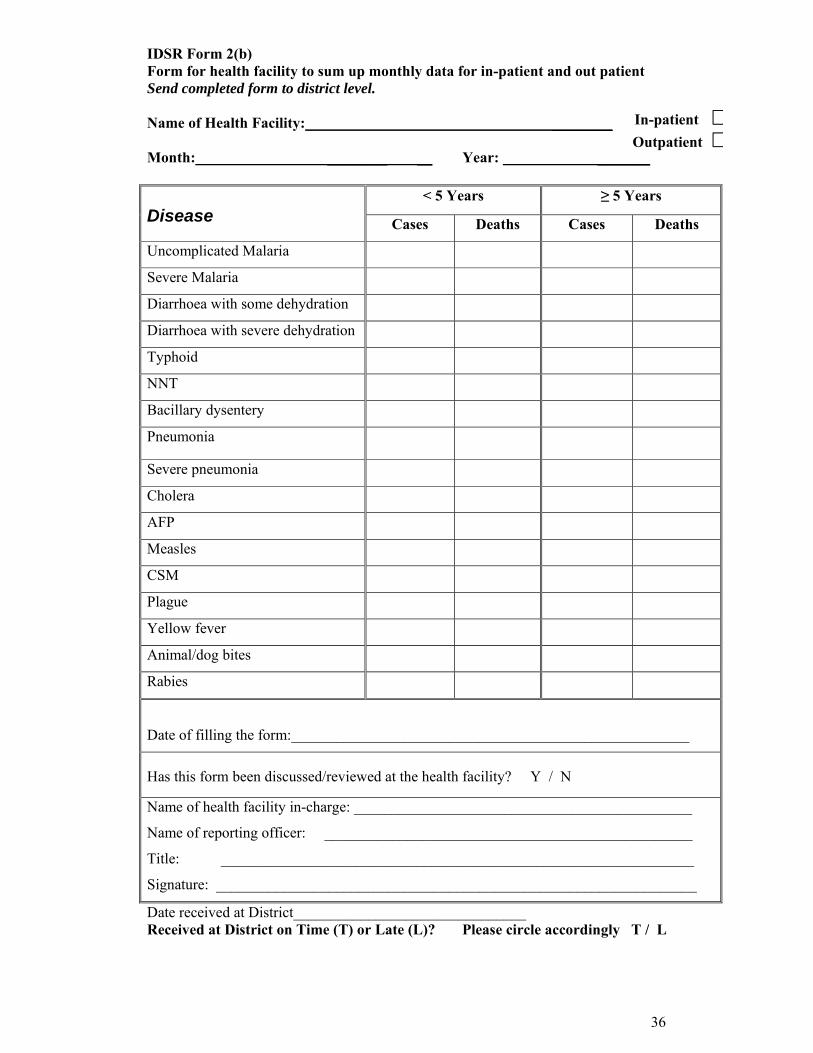
IDSR Form 2(b) Form for health facility to sum up monthly data for in-patient and out patient Send completed form to district level. Name of Health Facility: ________
Month: ________ __ Year: _______
< 5 Years ≥ 5 Years Disease Cases Deaths Cases Deaths
Uncomplicated Malaria
Severe Malaria
Diarrhoea with some dehydration
Diarrhoea with severe dehydration
Typhoid
NNT
Bacillary dysentery
Pneumonia
Severe pneumonia
Cholera
AFP
Measles
CSM
Plague
Yellow fever
Animal/dog bites
Rabies
Date of filling the form:_____________________________________________________
Has this form been discussed/reviewed at the health facility? Y / N
Name of health facility in-charge: _____________________________________________
Name of reporting officer: _________________________________________________
Title: _______________________________________________________________
Signature: ________________________________________________________________
Date received at District_______________________________ Received at District on Time (T) or Late (L)? Please circle accordingly T / L
In-patient $Outpatient $
37
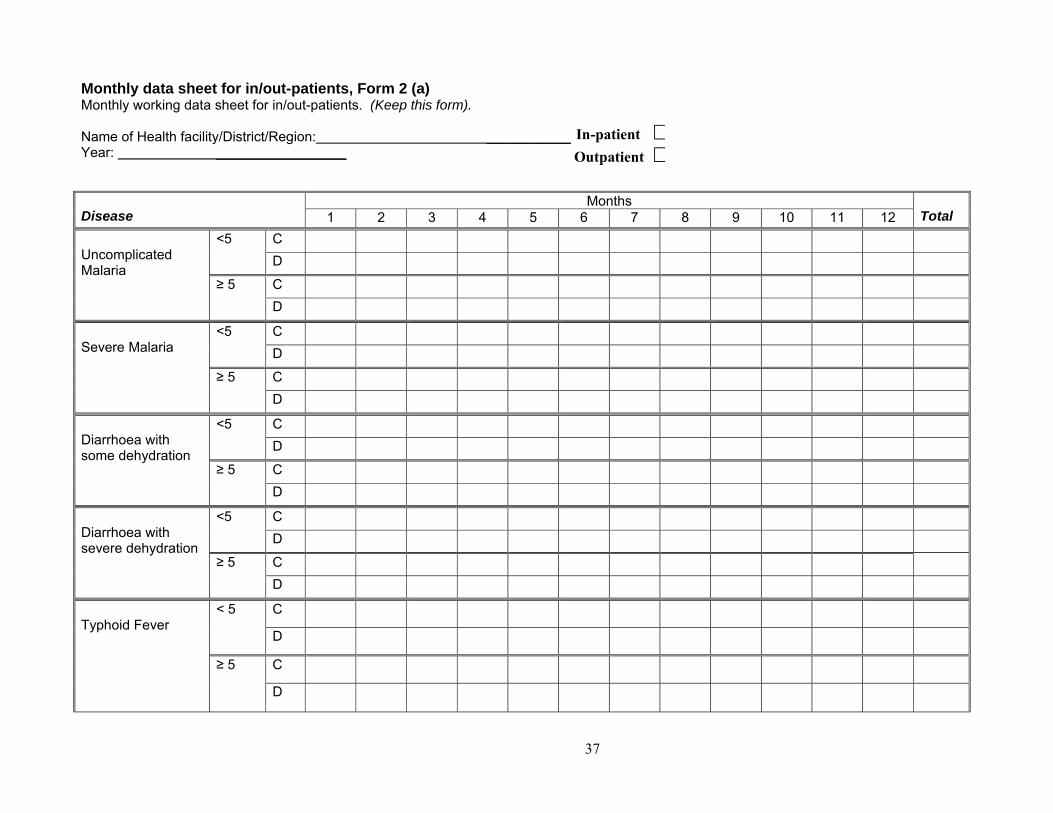
Monthly data sheet for in/out-patients, Form 2 (a) Monthly working data sheet for in/out-patients. (Keep this form). Name of Health facility/District/Region: ___________ Year: _________________
Months Disease 1 2 3 4 5 6 7 8 9 10 11 12 Total
C <5 D
C
Uncomplicated Malaria ≥ 5
D
C <5 D
C
Severe Malaria
≥ 5 D
C <5 D
C
Diarrhoea with some dehydration
≥ 5 D
C <5 D
C
Diarrhoea with severe dehydration
≥ 5 D
C < 5
D
C
Typhoid Fever
≥ 5
D
In-patient $Outpatient $
38
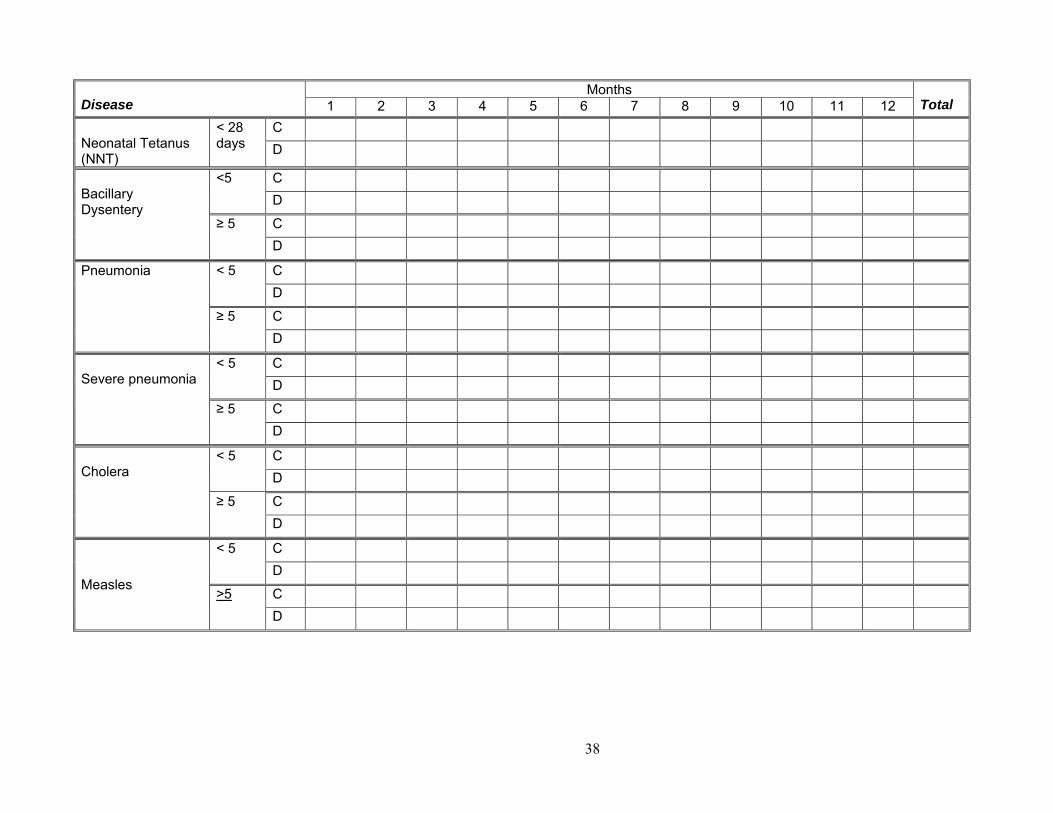
Months Disease 1 2 3 4 5 6 7 8 9 10 11 12 Total
C Neonatal Tetanus (NNT)
< 28 days D
C <5 D
C
Bacillary Dysentery
≥ 5 D
C < 5 D
C
Pneumonia
≥ 5 D
C < 5 D
C
Severe pneumonia
≥ 5 D
C < 5 D
C
Cholera
≥ 5 D
C < 5 D
Measles C
>5 D
39
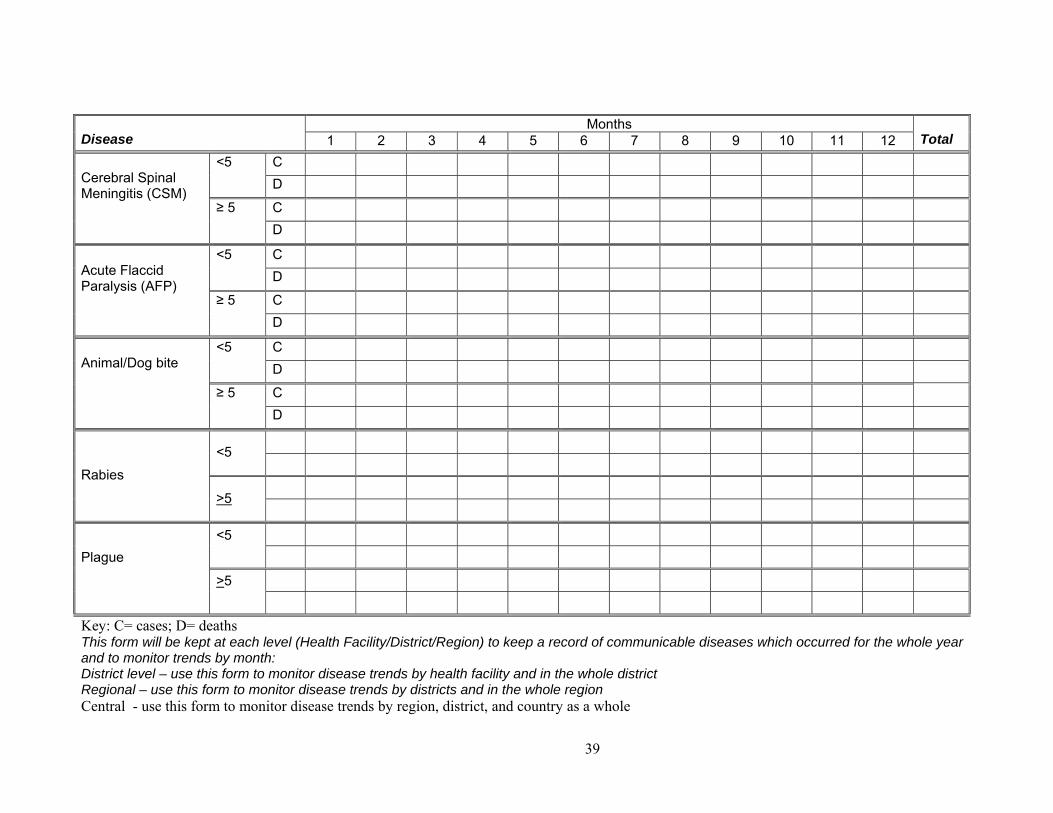
Months Disease 1 2 3 4 5 6 7 8 9 10 11 12 Total
C <5 D
C
Cerebral Spinal Meningitis (CSM) ≥ 5
D
C <5 D
C
Acute Flaccid Paralysis (AFP) ≥ 5
D
C <5 D
C
Animal/Dog bite
≥ 5 D
<5
Rabies
>5
<5
Plague
>5
Key: C= cases; D= deaths This form will be kept at each level (Health Facility/District/Region) to keep a record of communicable diseases which occurred for the whole year and to monitor trends by month: District level – use this form to monitor disease trends by health facility and in the whole district Regional – use this form to monitor disease trends by districts and in the whole region Central - use this form to monitor disease trends by region, district, and country as a whole
40
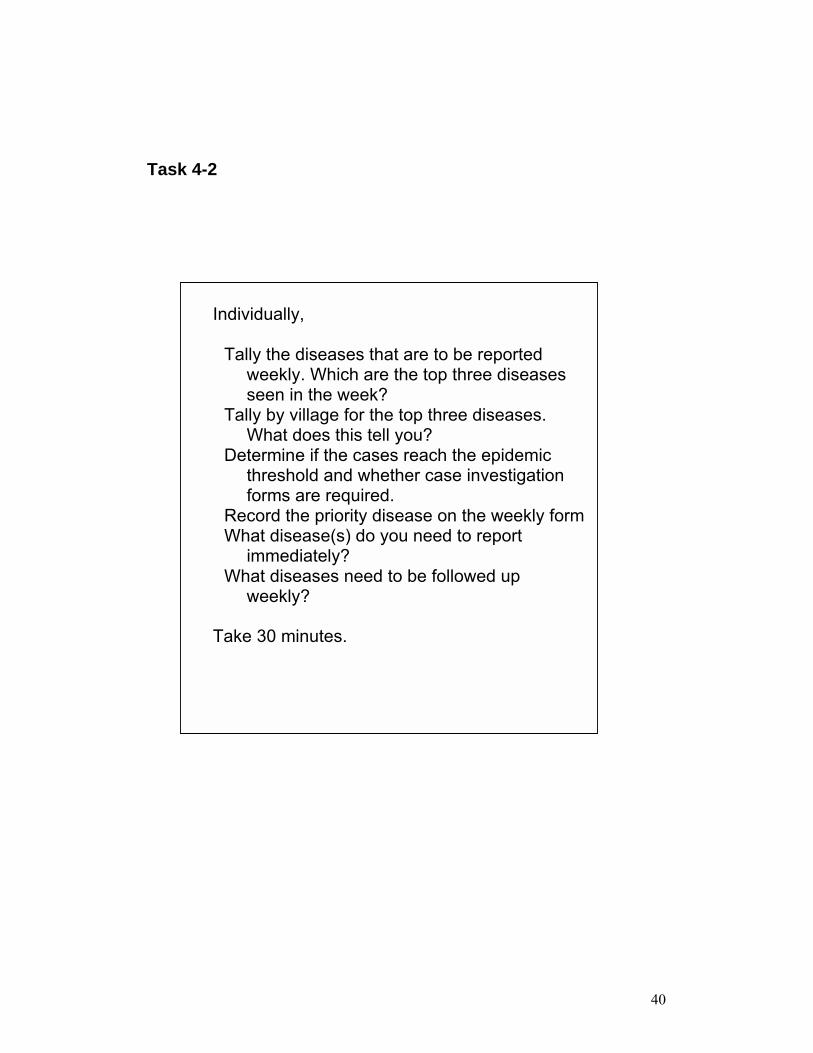
Task 4-2
Individually,
Tally the diseases that are to be reported weekly. Which are the top three diseases seen in the week?
Tally by village for the top three diseases. What does this tell you?
Determine if the cases reach the epidemic threshold and whether case investigation forms are required.
Record the priority disease on the weekly form What disease(s) do you need to report
immediately? What diseases need to be followed up
weekly? Take 30 minutes.
41
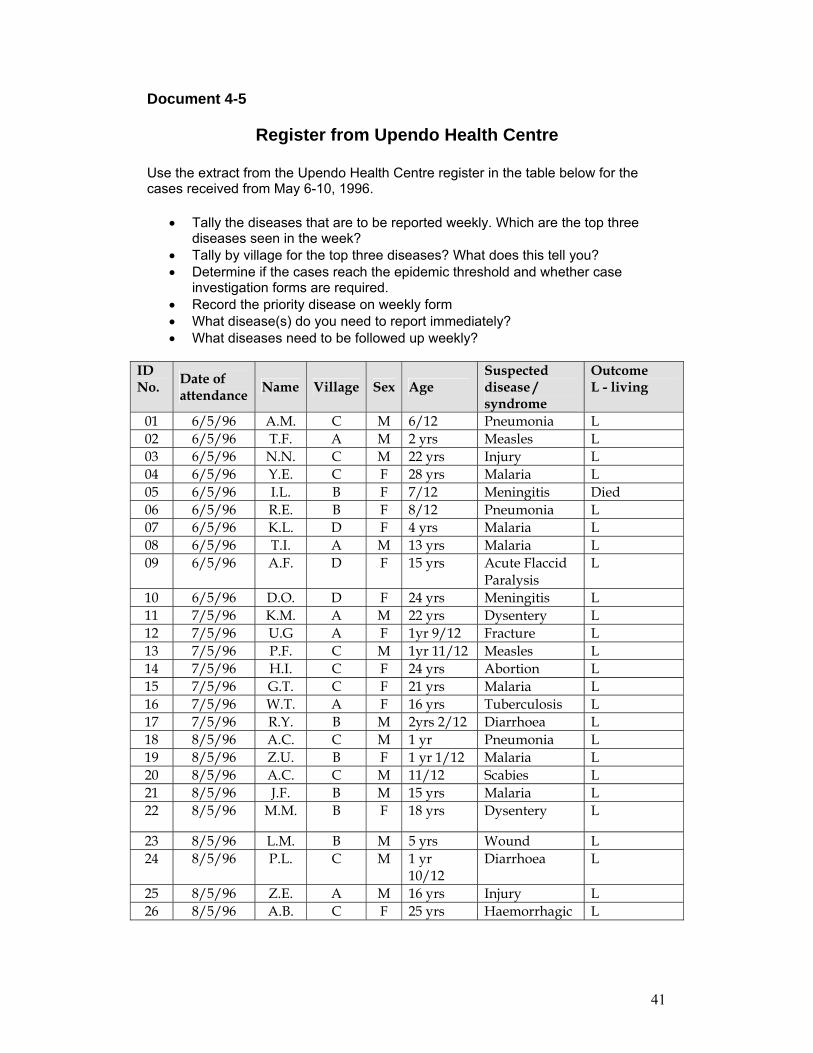
Document 4-5
Register from Upendo Health Centre
Use the extract from the Upendo Health Centre register in the table below for the cases received from May 6-10, 1996.
• Tally the diseases that are to be reported weekly. Which are the top three diseases seen in the week?
• Tally by village for the top three diseases? What does this tell you? • Determine if the cases reach the epidemic threshold and whether case
investigation forms are required. • Record the priority disease on weekly form • What disease(s) do you need to report immediately? • What diseases need to be followed up weekly?
ID No. Date of
attendance Name Village Sex Age Suspected disease / syndrome
Outcome L - living
01 6/5/96 A.M. C M 6/12 Pneumonia L 02 6/5/96 T.F. A M 2 yrs Measles L 03 6/5/96 N.N. C M 22 yrs Injury L 04 6/5/96 Y.E. C F 28 yrs Malaria L 05 6/5/96 I.L. B F 7/12 Meningitis Died 06 6/5/96 R.E. B F 8/12 Pneumonia L 07 6/5/96 K.L. D F 4 yrs Malaria L 08 6/5/96 T.I. A M 13 yrs Malaria L 09 6/5/96 A.F. D F 15 yrs Acute Flaccid
Paralysis L
10 6/5/96 D.O. D F 24 yrs Meningitis L 11 7/5/96 K.M. A M 22 yrs Dysentery L 12 7/5/96 U.G A F 1yr 9/12 Fracture L 13 7/5/96 P.F. C M 1yr 11/12 Measles L 14 7/5/96 H.I. C F 24 yrs Abortion L 15 7/5/96 G.T. C F 21 yrs Malaria L 16 7/5/96 W.T. A F 16 yrs Tuberculosis L 17 7/5/96 R.Y. B M 2yrs 2/12 Diarrhoea L 18 8/5/96 A.C. C M 1 yr Pneumonia L 19 8/5/96 Z.U. B F 1 yr 1/12 Malaria L 20 8/5/96 A.C. C M 11/12 Scabies L 21 8/5/96 J.F. B M 15 yrs Malaria L 22 8/5/96 M.M. B F 18 yrs Dysentery L
23 8/5/96 L.M. B M 5 yrs Wound L 24 8/5/96 P.L. C M 1 yr
10/12 Diarrhoea L
25 8/5/96 Z.E. A M 16 yrs Injury L 26 8/5/96 A.B. C F 25 yrs Haemorrhagic L
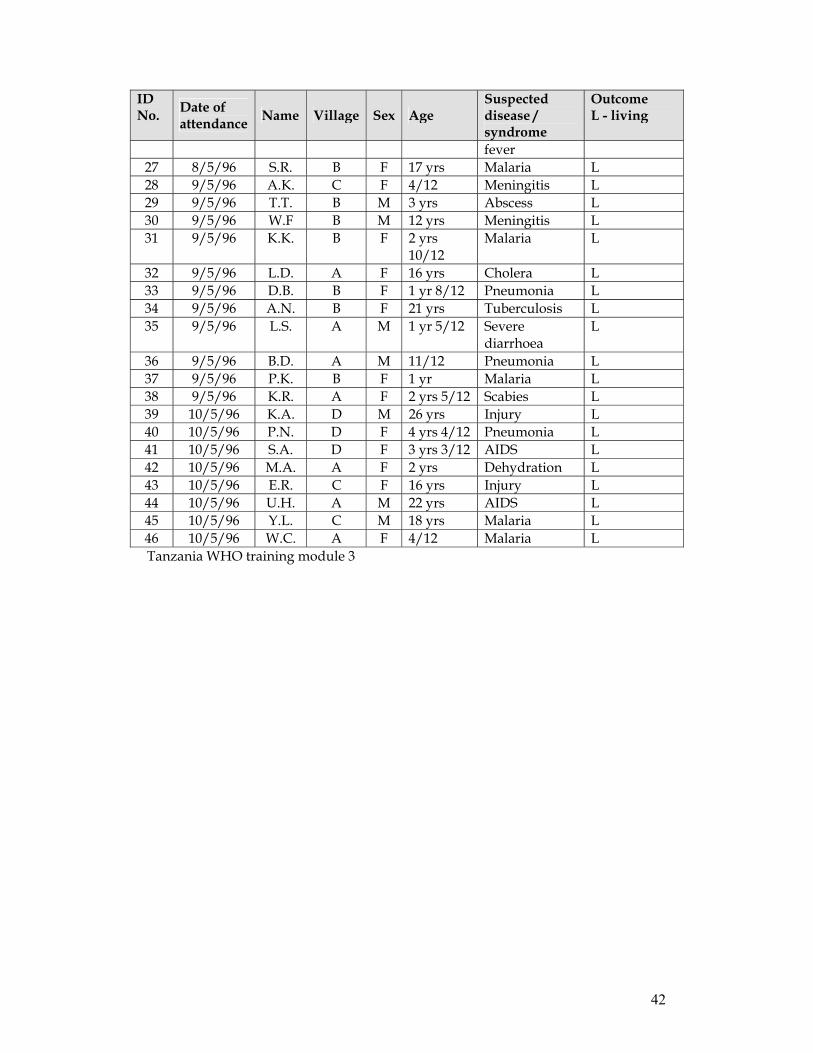
42
ID No. Date of
attendance Name Village Sex Age Suspected disease / syndrome
Outcome L - living
fever 27 8/5/96 S.R. B F 17 yrs Malaria L 28 9/5/96 A.K. C F 4/12 Meningitis L 29 9/5/96 T.T. B M 3 yrs Abscess L 30 9/5/96 W.F B M 12 yrs Meningitis L 31 9/5/96 K.K. B F 2 yrs
10/12 Malaria L
32 9/5/96 L.D. A F 16 yrs Cholera L 33 9/5/96 D.B. B F 1 yr 8/12 Pneumonia L 34 9/5/96 A.N. B F 21 yrs Tuberculosis L 35 9/5/96 L.S. A M 1 yr 5/12 Severe
diarrhoea L
36 9/5/96 B.D. A M 11/12 Pneumonia L 37 9/5/96 P.K. B F 1 yr Malaria L 38 9/5/96 K.R. A F 2 yrs 5/12 Scabies L 39 10/5/96 K.A. D M 26 yrs Injury L 40 10/5/96 P.N. D F 4 yrs 4/12 Pneumonia L 41 10/5/96 S.A. D F 3 yrs 3/12 AIDS L 42 10/5/96 M.A. A F 2 yrs Dehydration L 43 10/5/96 E.R. C F 16 yrs Injury L 44 10/5/96 U.H. A M 22 yrs AIDS L 45 10/5/96 Y.L. C M 18 yrs Malaria L 46 10/5/96 W.C. A F 4/12 Malaria L Tanzania WHO training module 3
43
Document 4-6
Application Planning Please take a few minutes to think through and respond to the following questions. These questions are intended to help you think about how this module applies to your work.
1. What specific actions do you need to take to improve IDSR compilation and reporting in your facility?
2. What specific actions do you need to take in your facility to improve your reporting to the district? Who is responsible for these actions?
44
Document 5-1
Module 5 Objectives
By the end of this module, participants will be able to:
Describe why analysis is important Use some key types of analysis Practice some key analyses, interpret them and develop actions (for diseases
common to the health facility) Describe various important analyses for diseases commonly seen at the health
facility
45
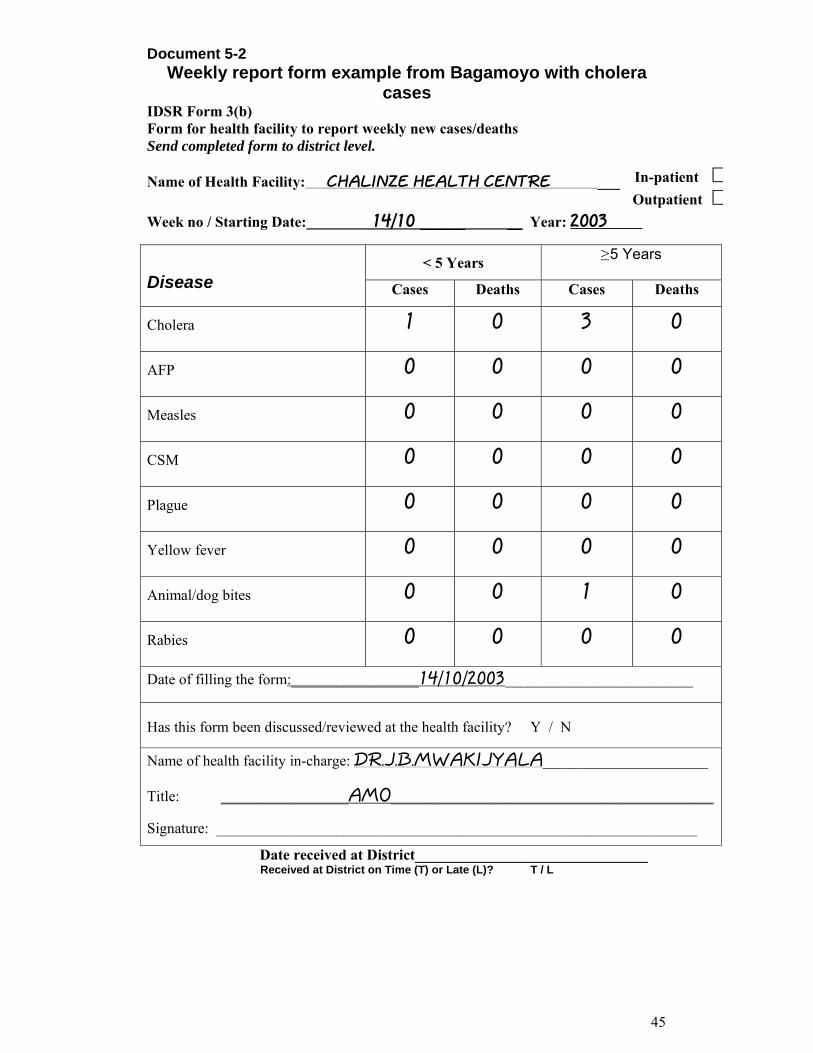
Document 5-2 Weekly report form example from Bagamoyo with cholera
cases IDSR Form 3(b) Form for health facility to report weekly new cases/deaths Send completed form to district level. Name of Health Facility: CHALINZE HEALTH CENTRE ___
Week no / Starting Date: 14/10 ______ __ Year: 2003
< 5 Years ≥ 5 Years Disease Cases Deaths Cases Deaths
Cholera 1 0 3 0
AFP 0 0 0 0
Measles 0 0 0 0
CSM 0 0 0 0
Plague 0 0 0 0
Yellow fever 0 0 0 0
Animal/dog bites 0 0 1 0
Rabies 0 0 0 0
Date of filling the form:_________________14/10/2003_________________________
Has this form been discussed/reviewed at the health facility? Y / N
Name of health facility in-charge: DR.J.B.MWAKIJYALA______________________
Title: _________________AMO___________________________________________
Signature: ________________________________________________________________
Date received at District_______________________________ Received at District on Time (T) or Late (L)? T / L
In-patient $Outpatient $
46
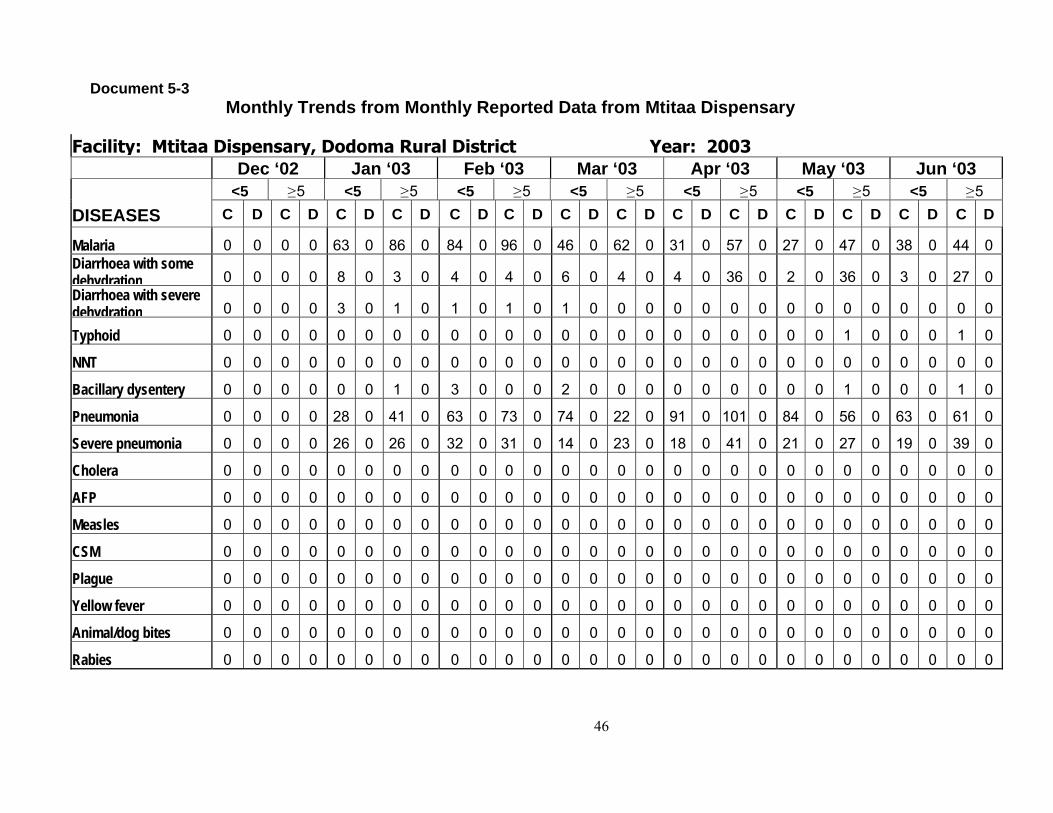
Document 5-3 Monthly Trends from Monthly Reported Data from Mtitaa Dispensary
Facility: Mtitaa Dispensary, Dodoma Rural District Year: 2003
Dec ‘02 Jan ‘03 Feb ‘03 Mar ‘03 Apr ‘03 May ‘03 Jun ‘03 <5 ≥ 5 <5 ≥ 5 <5 ≥ 5 <5 ≥ 5 <5 ≥ 5 <5 ≥ 5 <5 ≥ 5
DISEASES C D C D C D C D C D C D C D C D C D C D C D C D C D C D
Malaria 0 0 0 0 63 0 86 0 84 0 96 0 46 0 62 0 31 0 57 0 27 0 47 0 38 0 44 0 Diarrhoea with some dehydration 0 0 0 0 8 0 3 0 4 0 4 0 6 0 4 0 4 0 36 0 2 0 36 0 3 0 27 0 Diarrhoea with severe dehydration 0 0 0 0 3 0 1 0 1 0 1 0 1 0 0 0 0 0 0 0 0 0 0 0 0 0 0 0
Typhoid 0 0 0 0 0 0 0 0 0 0 0 0 0 0 0 0 0 0 0 0 0 0 1 0 0 0 1 0
NNT 0 0 0 0 0 0 0 0 0 0 0 0 0 0 0 0 0 0 0 0 0 0 0 0 0 0 0 0
Bacillary dysentery 0 0 0 0 0 0 1 0 3 0 0 0 2 0 0 0 0 0 0 0 0 0 1 0 0 0 1 0
Pneumonia 0 0 0 0 28 0 41 0 63 0 73 0 74 0 22 0 91 0 101 0 84 0 56 0 63 0 61 0
Severe pneumonia 0 0 0 0 26 0 26 0 32 0 31 0 14 0 23 0 18 0 41 0 21 0 27 0 19 0 39 0
Cholera 0 0 0 0 0 0 0 0 0 0 0 0 0 0 0 0 0 0 0 0 0 0 0 0 0 0 0 0
AFP 0 0 0 0 0 0 0 0 0 0 0 0 0 0 0 0 0 0 0 0 0 0 0 0 0 0 0 0
Measles 0 0 0 0 0 0 0 0 0 0 0 0 0 0 0 0 0 0 0 0 0 0 0 0 0 0 0 0
CSM 0 0 0 0 0 0 0 0 0 0 0 0 0 0 0 0 0 0 0 0 0 0 0 0 0 0 0 0
Plague 0 0 0 0 0 0 0 0 0 0 0 0 0 0 0 0 0 0 0 0 0 0 0 0 0 0 0 0
Yellow fever 0 0 0 0 0 0 0 0 0 0 0 0 0 0 0 0 0 0 0 0 0 0 0 0 0 0 0 0
Animal/dog bites 0 0 0 0 0 0 0 0 0 0 0 0 0 0 0 0 0 0 0 0 0 0 0 0 0 0 0 0
Rabies 0 0 0 0 0 0 0 0 0 0 0 0 0 0 0 0 0 0 0 0 0 0 0 0 0 0 0 0
47
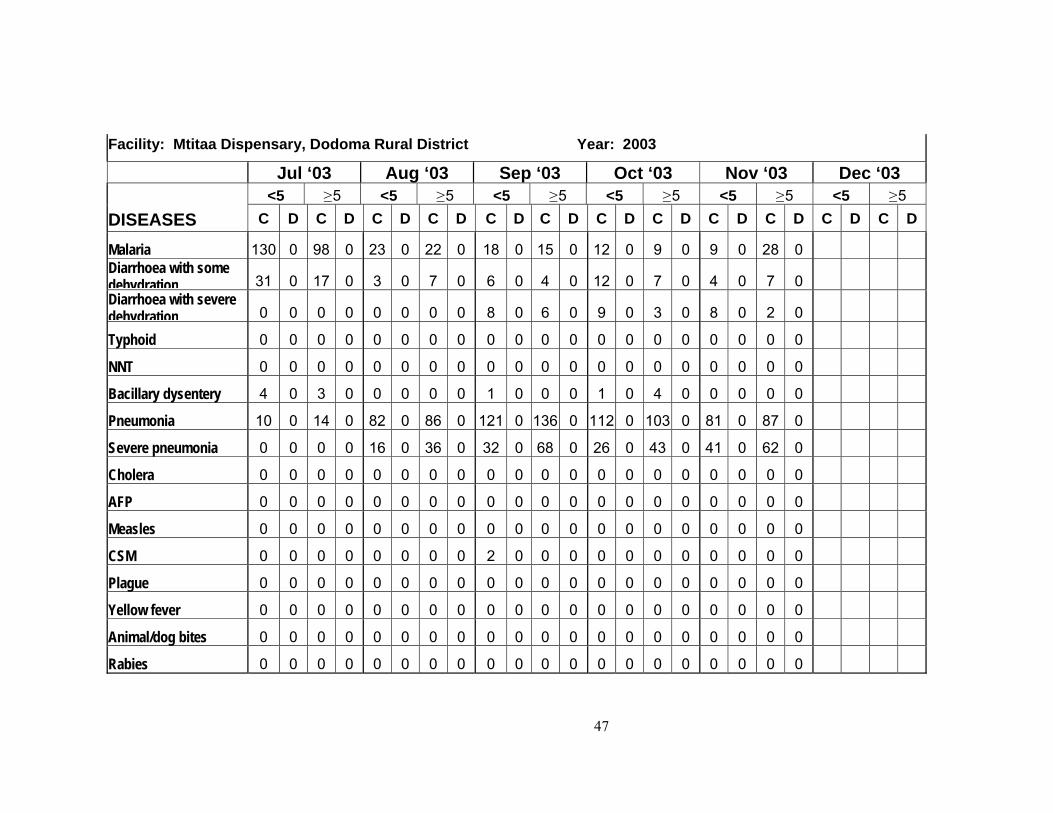
Facility: Mtitaa Dispensary, Dodoma Rural District Year: 2003
Jul ‘03 Aug ‘03 Sep ‘03 Oct ‘03 Nov ‘03 Dec ‘03 <5 ≥ 5 <5 ≥ 5 <5 ≥ 5 <5 ≥ 5 <5 ≥ 5 <5 ≥ 5
DISEASES C D C D C D C D C D C D C D C D C D C D C D C D
Malaria 130 0 98 0 23 0 22 0 18 0 15 0 12 0 9 0 9 0 28 0 Diarrhoea with some dehydration 31 0 17 0 3 0 7 0 6 0 4 0 12 0 7 0 4 0 7 0 Diarrhoea with severe dehydration 0 0 0 0 0 0 0 0 8 0 6 0 9 0 3 0 8 0 2 0
Typhoid 0 0 0 0 0 0 0 0 0 0 0 0 0 0 0 0 0 0 0 0
NNT 0 0 0 0 0 0 0 0 0 0 0 0 0 0 0 0 0 0 0 0
Bacillary dysentery 4 0 3 0 0 0 0 0 1 0 0 0 1 0 4 0 0 0 0 0
Pneumonia 10 0 14 0 82 0 86 0 121 0 136 0 112 0 103 0 81 0 87 0
Severe pneumonia 0 0 0 0 16 0 36 0 32 0 68 0 26 0 43 0 41 0 62 0
Cholera 0 0 0 0 0 0 0 0 0 0 0 0 0 0 0 0 0 0 0 0
AFP 0 0 0 0 0 0 0 0 0 0 0 0 0 0 0 0 0 0 0 0
Measles 0 0 0 0 0 0 0 0 0 0 0 0 0 0 0 0 0 0 0 0
CSM 0 0 0 0 0 0 0 0 2 0 0 0 0 0 0 0 0 0 0 0
Plague 0 0 0 0 0 0 0 0 0 0 0 0 0 0 0 0 0 0 0 0
Yellow fever 0 0 0 0 0 0 0 0 0 0 0 0 0 0 0 0 0 0 0 0
Animal/dog bites 0 0 0 0 0 0 0 0 0 0 0 0 0 0 0 0 0 0 0 0
Rabies 0 0 0 0 0 0 0 0 0 0 0 0 0 0 0 0 0 0 0 0
48
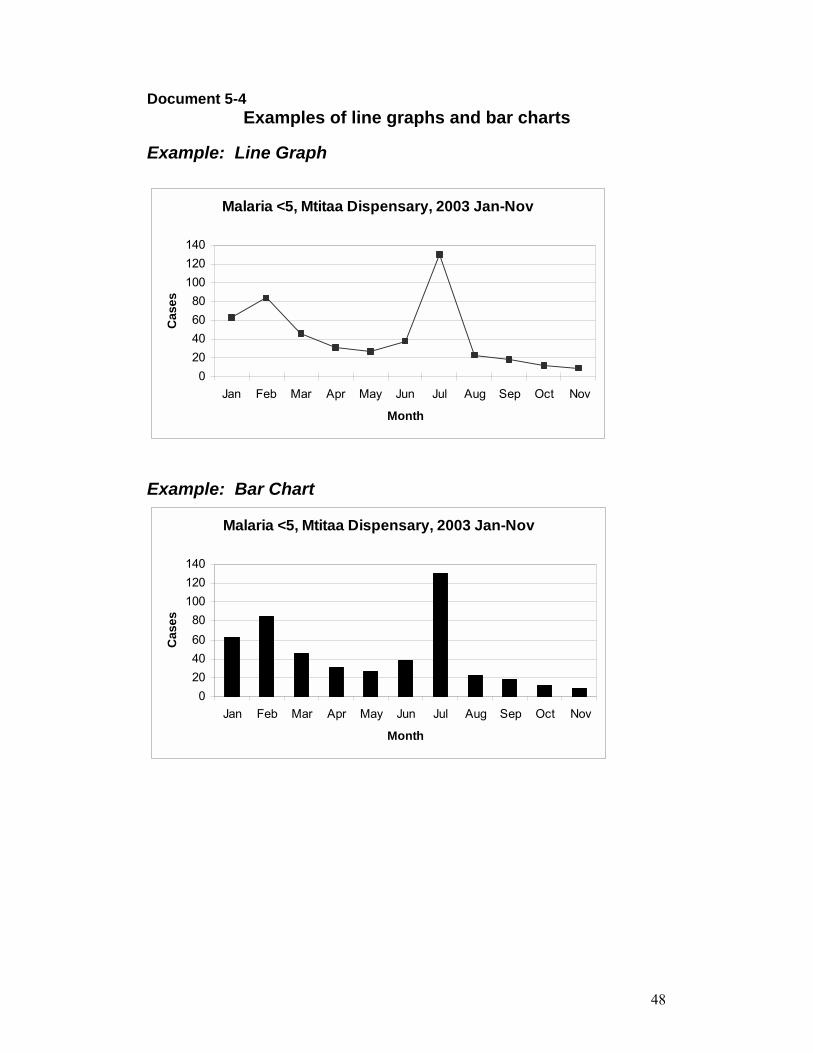
Document 5-4 Examples of line graphs and bar charts
Example: Line Graph
Malaria <5, Mtitaa Dispensary, 2003 Jan-Nov
020406080
100120140
Jan Feb Mar Apr May Jun Jul Aug Sep Oct Nov
Month
Cas
es
Example: Bar Chart
Malaria <5, Mtitaa Dispensary, 2003 Jan-Nov
020406080
100120140
Jan Feb Mar Apr May Jun Jul Aug Sep Oct Nov
Month
Cas
es
49
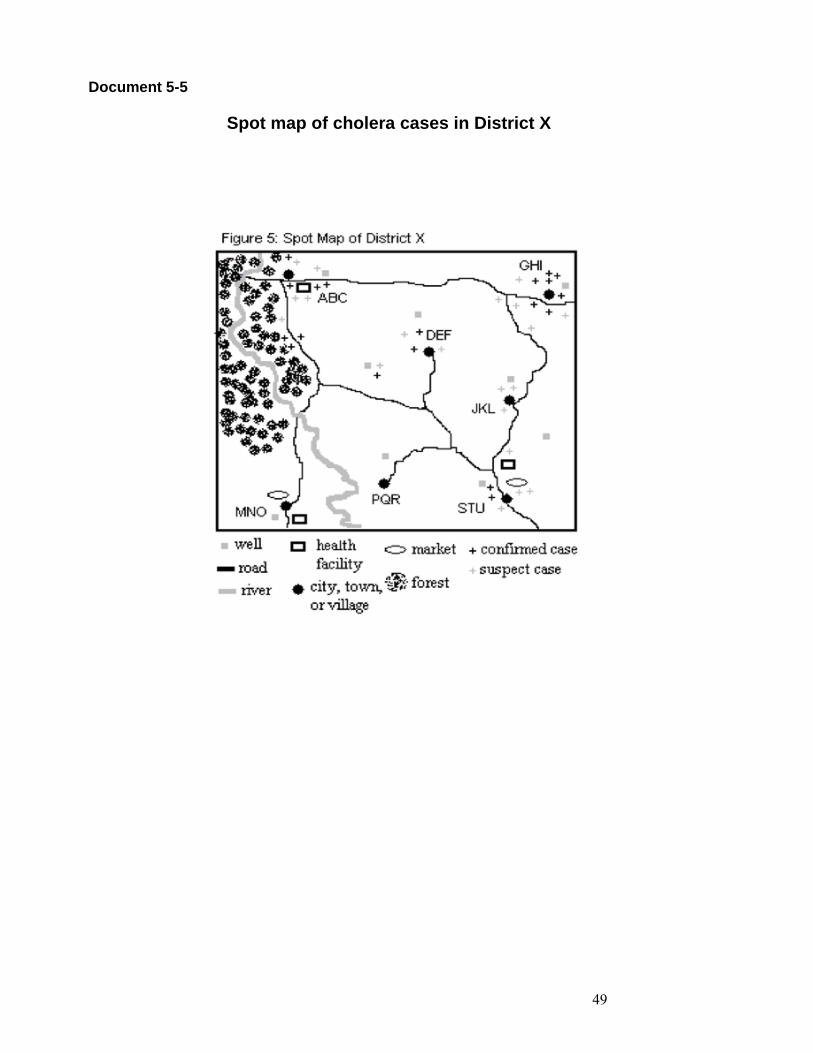
Document 5-5
Spot map of cholera cases in District X
50
Task 5-1
Individually For the Mtitaa Dispensary 1. Graph the existing number of cases of severe and non-
severe pneumonia in children aged <5 years for the last year (Jan-Nov 2003):
• Review the data table and select the appropriate data
• Plot the data for pneumonia and severe pneumonia
on the blank grid
• Connect the points they have plotted (first the pneumonia points and then the severe pneumonia points)
2. Look at the trends to observe seasonal variation and
disease incidence trends 3. Interpret the data and draw conclusions, considering
the points on the next flip chart � Interpreting the Data You have 30 minutes to work individually
51
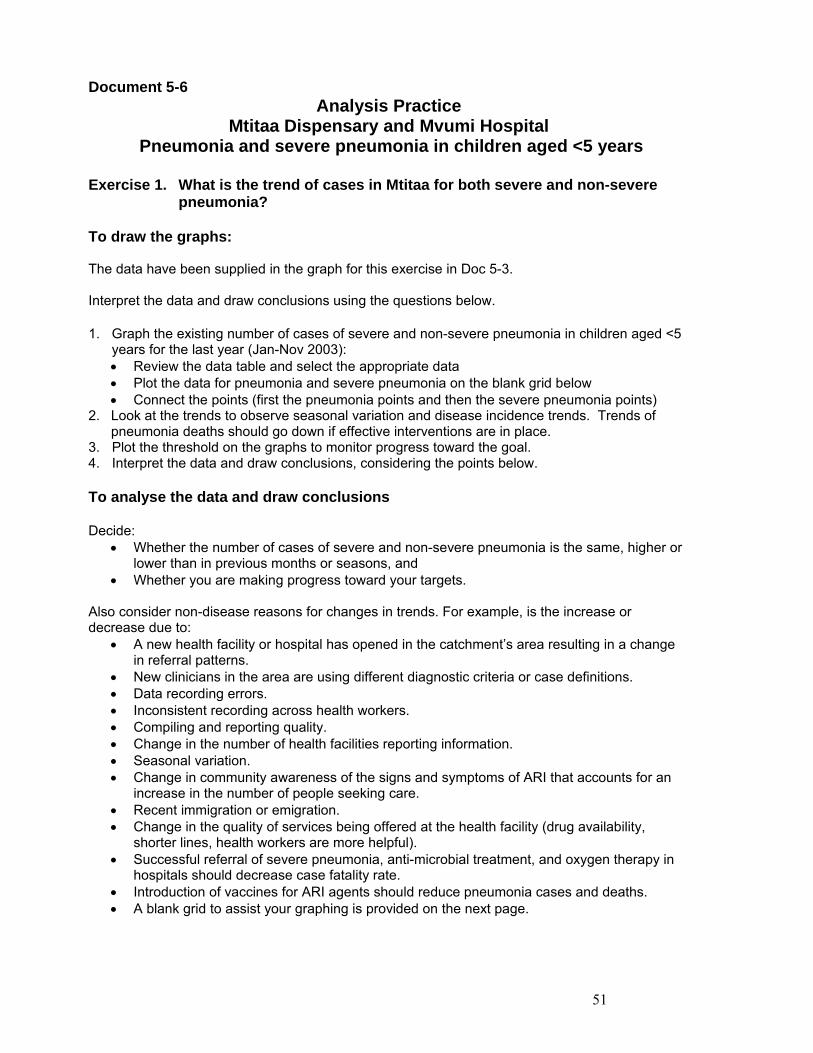
Document 5-6 Analysis Practice
Mtitaa Dispensary and Mvumi Hospital Pneumonia and severe pneumonia in children aged <5 years
Exercise 1. What is the trend of cases in Mtitaa for both severe and non-severe
pneumonia?
To draw the graphs: The data have been supplied in the graph for this exercise in Doc 5-3. Interpret the data and draw conclusions using the questions below. 1. Graph the existing number of cases of severe and non-severe pneumonia in children aged <5
years for the last year (Jan-Nov 2003): • Review the data table and select the appropriate data • Plot the data for pneumonia and severe pneumonia on the blank grid below • Connect the points (first the pneumonia points and then the severe pneumonia points)
2. Look at the trends to observe seasonal variation and disease incidence trends. Trends of pneumonia deaths should go down if effective interventions are in place.
3. Plot the threshold on the graphs to monitor progress toward the goal. 4. Interpret the data and draw conclusions, considering the points below. To analyse the data and draw conclusions Decide:
• Whether the number of cases of severe and non-severe pneumonia is the same, higher or lower than in previous months or seasons, and
• Whether you are making progress toward your targets. Also consider non-disease reasons for changes in trends. For example, is the increase or decrease due to:
• A new health facility or hospital has opened in the catchment�s area resulting in a change in referral patterns.
• New clinicians in the area are using different diagnostic criteria or case definitions. • Data recording errors. • Inconsistent recording across health workers. • Compiling and reporting quality. • Change in the number of health facilities reporting information. • Seasonal variation. • Change in community awareness of the signs and symptoms of ARI that accounts for an
increase in the number of people seeking care. • Recent immigration or emigration. • Change in the quality of services being offered at the health facility (drug availability,
shorter lines, health workers are more helpful). • Successful referral of severe pneumonia, anti-microbial treatment, and oxygen therapy in
hospitals should decrease case fatality rate. • Introduction of vaccines for ARI agents should reduce pneumonia cases and deaths. • A blank grid to assist your graphing is provided on the next page.
52
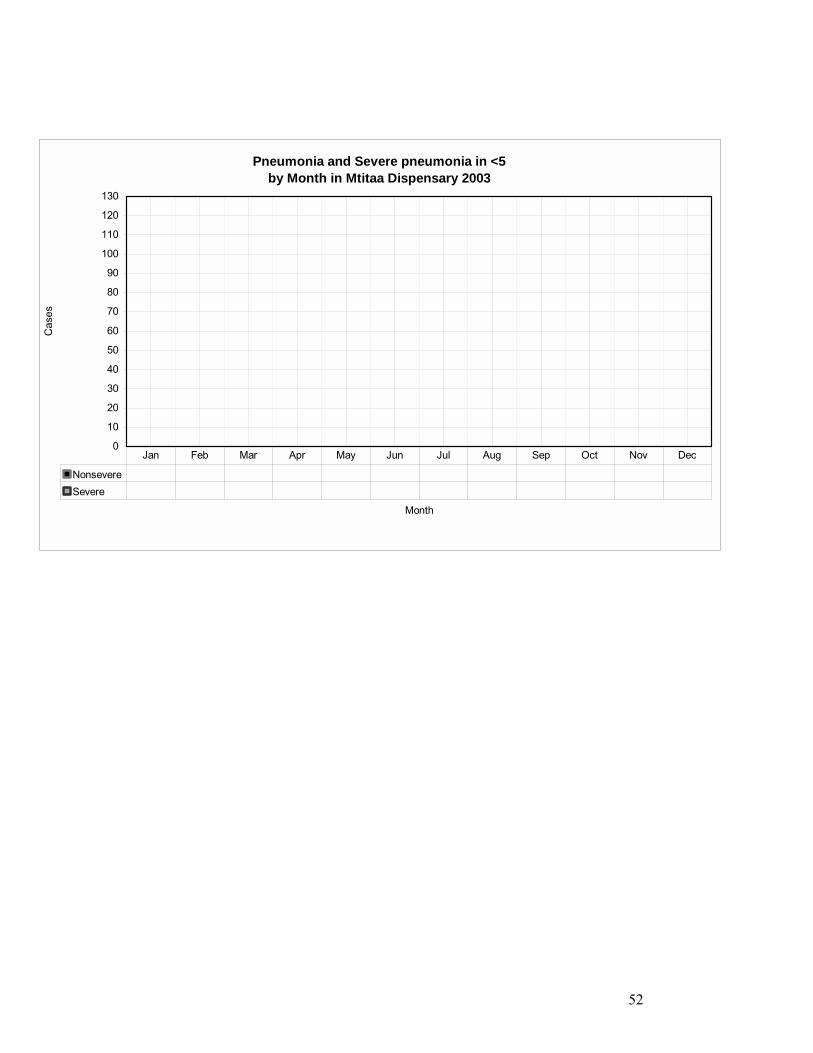
Pneumonia and Severe pneumonia in <5 by Month in Mtitaa Dispensary 2003
0
10
20
30
40
50
60
70
80
90
100
110
120
130
Month
Cas
es
NonsevereSevere
Jan Feb Mar Apr May Jun Jul Aug Sep Oct Nov Dec
53
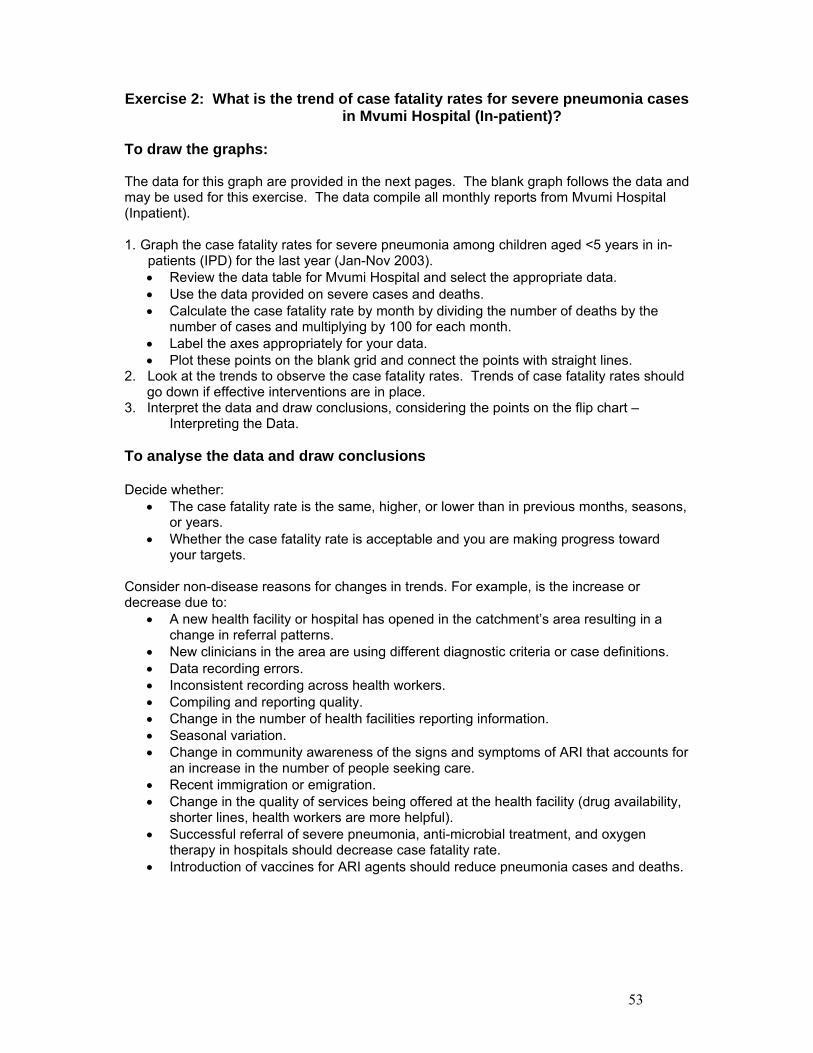
Exercise 2: What is the trend of case fatality rates for severe pneumonia cases in Mvumi Hospital (In-patient)?
To draw the graphs: The data for this graph are provided in the next pages. The blank graph follows the data and may be used for this exercise. The data compile all monthly reports from Mvumi Hospital (Inpatient). 1. Graph the case fatality rates for severe pneumonia among children aged <5 years in in-
patients (IPD) for the last year (Jan-Nov 2003). • Review the data table for Mvumi Hospital and select the appropriate data. • Use the data provided on severe cases and deaths. • Calculate the case fatality rate by month by dividing the number of deaths by the
number of cases and multiplying by 100 for each month. • Label the axes appropriately for your data. • Plot these points on the blank grid and connect the points with straight lines.
2. Look at the trends to observe the case fatality rates. Trends of case fatality rates should go down if effective interventions are in place.
3. Interpret the data and draw conclusions, considering the points on the flip chart � Interpreting the Data.
To analyse the data and draw conclusions Decide whether:
• The case fatality rate is the same, higher, or lower than in previous months, seasons, or years.
• Whether the case fatality rate is acceptable and you are making progress toward your targets.
Consider non-disease reasons for changes in trends. For example, is the increase or decrease due to:
• A new health facility or hospital has opened in the catchment�s area resulting in a change in referral patterns.
• New clinicians in the area are using different diagnostic criteria or case definitions. • Data recording errors. • Inconsistent recording across health workers. • Compiling and reporting quality. • Change in the number of health facilities reporting information. • Seasonal variation. • Change in community awareness of the signs and symptoms of ARI that accounts for
an increase in the number of people seeking care. • Recent immigration or emigration. • Change in the quality of services being offered at the health facility (drug availability,
shorter lines, health workers are more helpful). • Successful referral of severe pneumonia, anti-microbial treatment, and oxygen
therapy in hospitals should decrease case fatality rate. • Introduction of vaccines for ARI agents should reduce pneumonia cases and deaths.
54
Task 5-2
In small groups • Share your individual interpretations and
conclusions (Question 4). • Try to reach agreement on the key conclusions • Determine what follow-up action or further analysis
in needed regarding the pneumonia cases Record your key conclusions and follow up actions onflipchart You have 40 minutes Select a spokesperson to report out
55
Task 5-3
Individually For Mvumi Hospital 1. Graph the case fatality rates for severe pneumonia among
children aged <5 years in in-patients (IPD) for the last year (Jan-Nov 2003).
• Review the data table for Mvumi Hospital and select the
appropriate data. • Use the data provided on severe cases and deaths. • Calculate the case fatality rate by month by dividing the
number of deaths by the number of cases and multiplying by 100 for each month.
• Label the axes appropriately for your data. • Plot these points on the blank grid and connect the points
with straight lines.
2. Look at the trends to observe the case fatality rates. Trends of case fatality rates should go down if effective interventions are in place.
3. Interpret the data and draw conclusions, considering the points
on the next flipchart � Interpreting the Data. You have 30 minutes to work individually
56
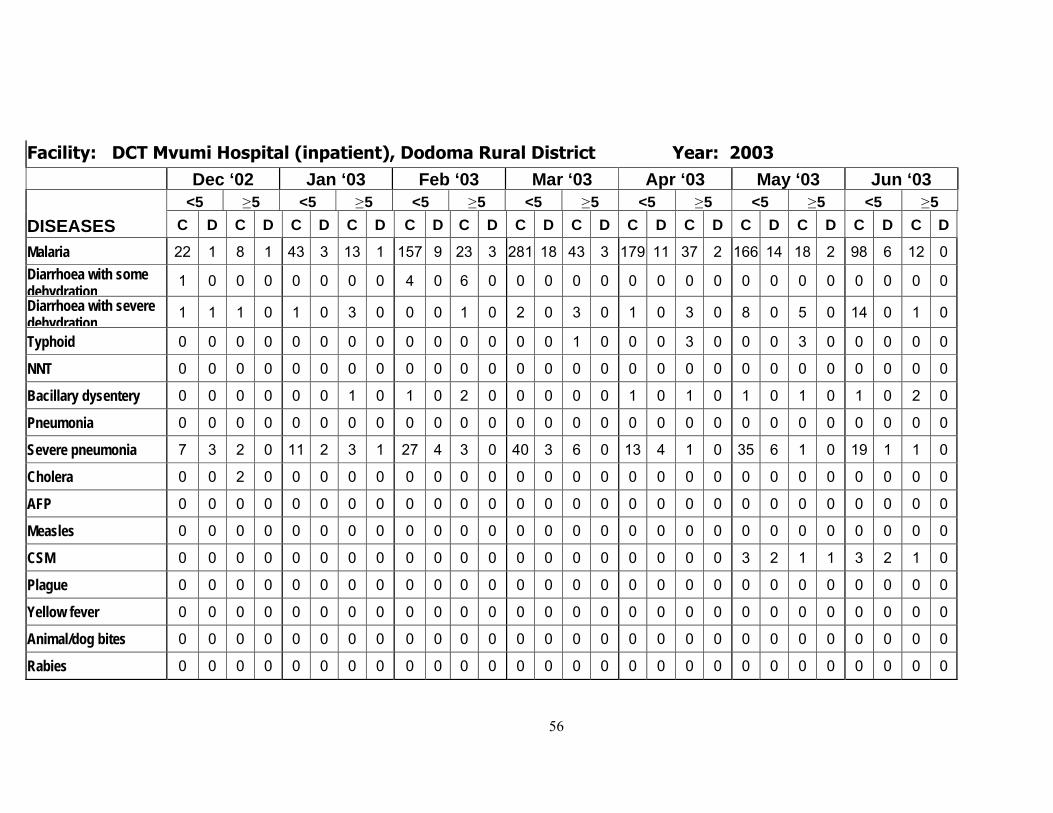
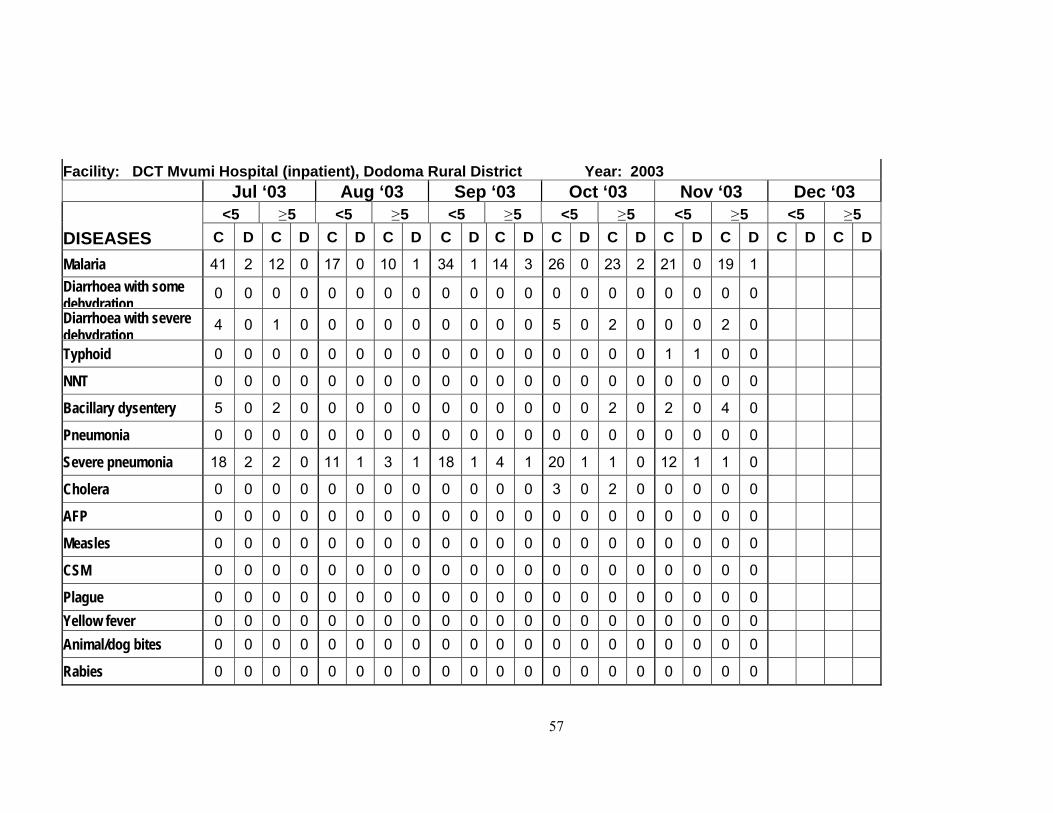
Facility: DCT Mvumi Hospital (inpatient), Dodoma Rural District Year: 2003
Dec ‘02 Jan ‘03 Feb ‘03 Mar ‘03 Apr ‘03 May ‘03 Jun ‘03 <5 ≥ 5 <5 ≥ 5 <5 ≥ 5 <5 ≥ 5 <5 ≥ 5 <5 ≥ 5 <5 ≥ 5
DISEASES C D C D C D C D C D C D C D C D C D C D C D C D C D C D
Malaria 22 1 8 1 43 3 13 1 157 9 23 3 281 18 43 3 179 11 37 2 166 14 18 2 98 6 12 0 Diarrhoea with some dehydration
1 0 0 0 0 0 0 0 4 0 6 0 0 0 0 0 0 0 0 0 0 0 0 0 0 0 0 0
Diarrhoea with severe dehydration
1 1 1 0 1 0 3 0 0 0 1 0 2 0 3 0 1 0 3 0 8 0 5 0 14 0 1 0
Typhoid 0 0 0 0 0 0 0 0 0 0 0 0 0 0 1 0 0 0 3 0 0 0 3 0 0 0 0 0
NNT 0 0 0 0 0 0 0 0 0 0 0 0 0 0 0 0 0 0 0 0 0 0 0 0 0 0 0 0
Bacillary dysentery 0 0 0 0 0 0 1 0 1 0 2 0 0 0 0 0 1 0 1 0 1 0 1 0 1 0 2 0
Pneumonia 0 0 0 0 0 0 0 0 0 0 0 0 0 0 0 0 0 0 0 0 0 0 0 0 0 0 0 0
Severe pneumonia 7 3 2 0 11 2 3 1 27 4 3 0 40 3 6 0 13 4 1 0 35 6 1 0 19 1 1 0
Cholera 0 0 2 0 0 0 0 0 0 0 0 0 0 0 0 0 0 0 0 0 0 0 0 0 0 0 0 0
AFP 0 0 0 0 0 0 0 0 0 0 0 0 0 0 0 0 0 0 0 0 0 0 0 0 0 0 0 0
Measles 0 0 0 0 0 0 0 0 0 0 0 0 0 0 0 0 0 0 0 0 0 0 0 0 0 0 0 0
CSM 0 0 0 0 0 0 0 0 0 0 0 0 0 0 0 0 0 0 0 0 3 2 1 1 3 2 1 0
Plague 0 0 0 0 0 0 0 0 0 0 0 0 0 0 0 0 0 0 0 0 0 0 0 0 0 0 0 0
Yellow fever 0 0 0 0 0 0 0 0 0 0 0 0 0 0 0 0 0 0 0 0 0 0 0 0 0 0 0 0
Animal/dog bites 0 0 0 0 0 0 0 0 0 0 0 0 0 0 0 0 0 0 0 0 0 0 0 0 0 0 0 0
Rabies 0 0 0 0 0 0 0 0 0 0 0 0 0 0 0 0 0 0 0 0 0 0 0 0 0 0 0 0
57
Facility: DCT Mvumi Hospital (inpatient), Dodoma Rural District Year: 2003 Jul ‘03 Aug ‘03 Sep ‘03 Oct ‘03 Nov ‘03 Dec ‘03
<5 ≥ 5 <5 ≥ 5 <5 ≥ 5 <5 ≥ 5 <5 ≥ 5 <5 ≥ 5 DISEASES C D C D C D C D C D C D C D C D C D C D C D C D
Malaria 41 2 12 0 17 0 10 1 34 1 14 3 26 0 23 2 21 0 19 1 Diarrhoea with some dehydration
0 0 0 0 0 0 0 0 0 0 0 0 0 0 0 0 0 0 0 0 Diarrhoea with severe dehydration
4 0 1 0 0 0 0 0 0 0 0 0 5 0 2 0 0 0 2 0
Typhoid 0 0 0 0 0 0 0 0 0 0 0 0 0 0 0 0 1 1 0 0
NNT 0 0 0 0 0 0 0 0 0 0 0 0 0 0 0 0 0 0 0 0
Bacillary dysentery 5 0 2 0 0 0 0 0 0 0 0 0 0 0 2 0 2 0 4 0
Pneumonia 0 0 0 0 0 0 0 0 0 0 0 0 0 0 0 0 0 0 0 0
Severe pneumonia 18 2 2 0 11 1 3 1 18 1 4 1 20 1 1 0 12 1 1 0
Cholera 0 0 0 0 0 0 0 0 0 0 0 0 3 0 2 0 0 0 0 0
AFP 0 0 0 0 0 0 0 0 0 0 0 0 0 0 0 0 0 0 0 0
Measles 0 0 0 0 0 0 0 0 0 0 0 0 0 0 0 0 0 0 0 0
CSM 0 0 0 0 0 0 0 0 0 0 0 0 0 0 0 0 0 0 0 0
Plague 0 0 0 0 0 0 0 0 0 0 0 0 0 0 0 0 0 0 0 0 Yellow fever 0 0 0 0 0 0 0 0 0 0 0 0 0 0 0 0 0 0 0 0 Animal/dog bites 0 0 0 0 0 0 0 0 0 0 0 0 0 0 0 0 0 0 0 0
Rabies 0 0 0 0 0 0 0 0 0 0 0 0 0 0 0 0 0 0 0 0
58
Case Fatality Rate for Pneumonia cases at DCT Mvumi Hospital (Inpatient)
0
5
10
15
20
25
30
35
40
45
Cases 7 11 27 40 13 35 19 18 11 18 20 12Deaths 3 2 4 3 4 6 1 2 1 1 1 1CSF 43 18 15 8 31 17 5 11 9 6 5 8
Dec Jan Feb Mar Apr May Jun Jul Aug Sep Oct Nov
59
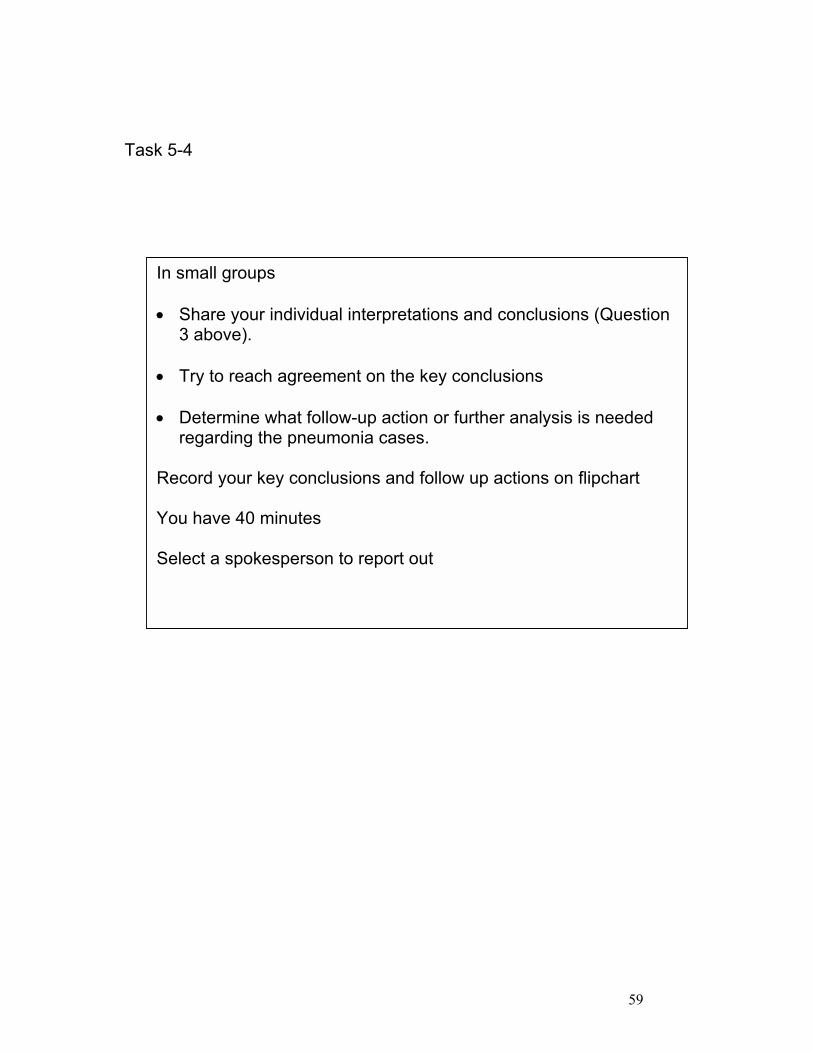
Task 5-4
In small groups • Share your individual interpretations and conclusions (Question
3 above). • Try to reach agreement on the key conclusions • Determine what follow-up action or further analysis is needed
regarding the pneumonia cases. Record your key conclusions and follow up actions on flipchart You have 40 minutes Select a spokesperson to report out
60
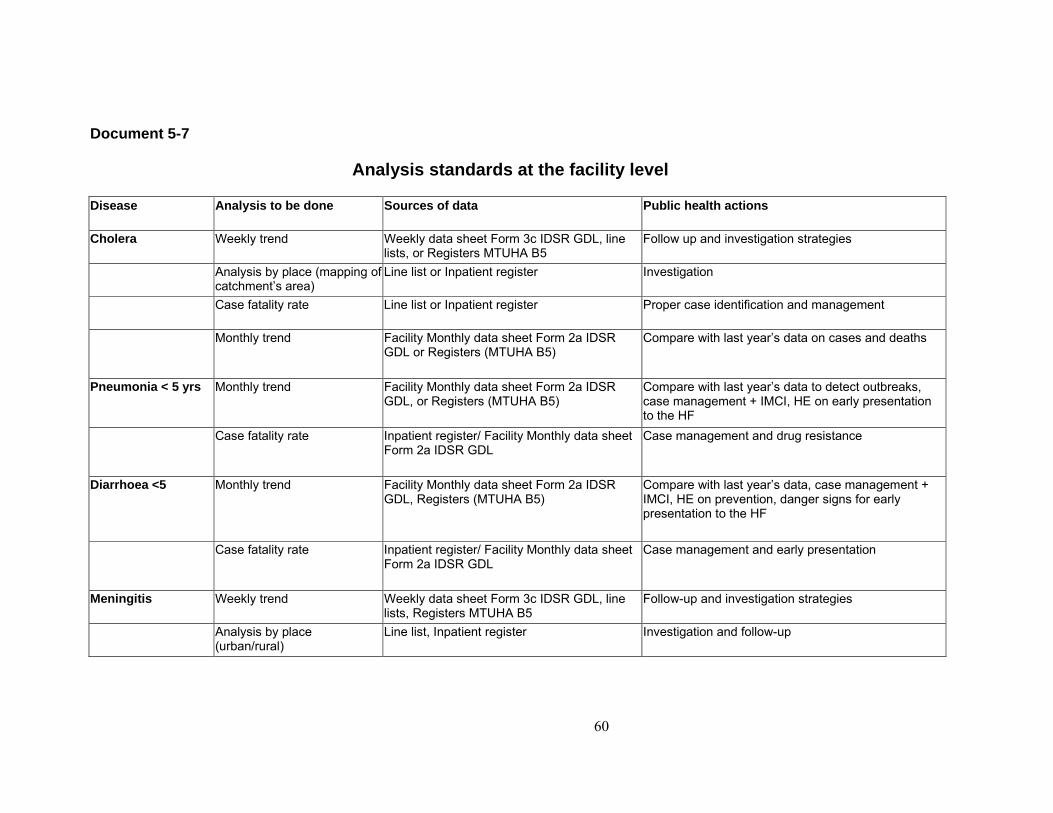
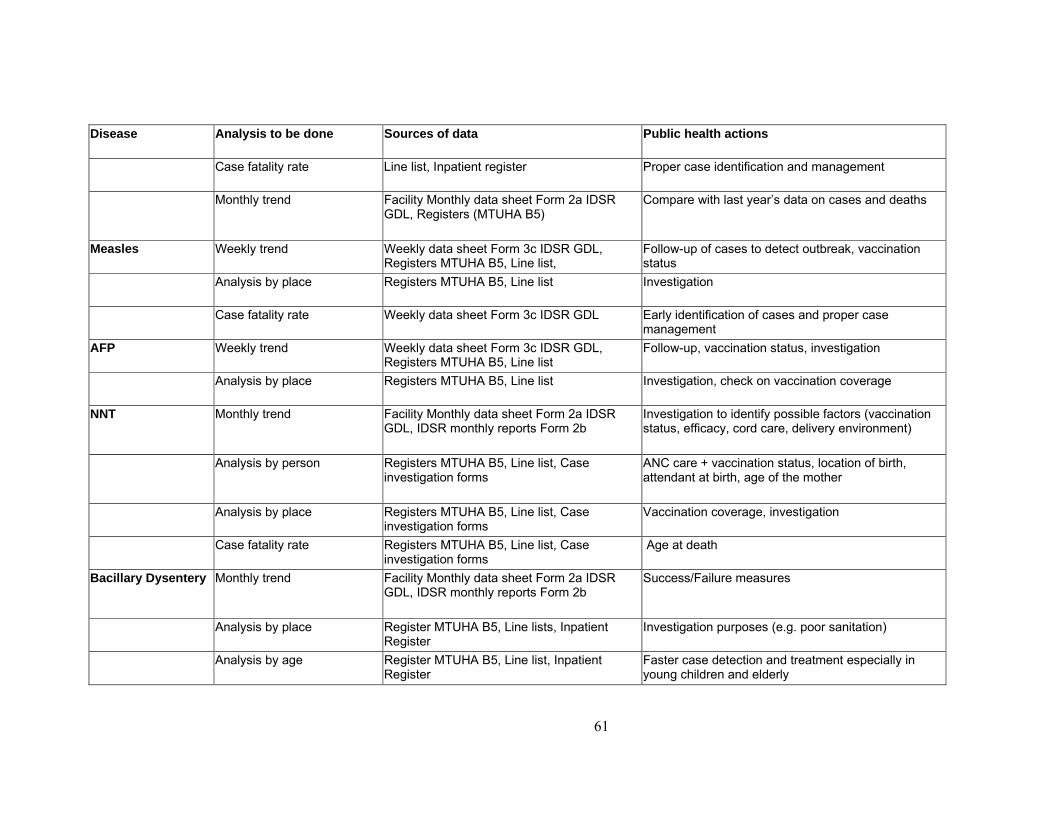
Document 5-7
Analysis standards at the facility level Disease Analysis to be done Sources of data Public health actions
Cholera Weekly trend Weekly data sheet Form 3c IDSR GDL, line lists, or Registers MTUHA B5
Follow up and investigation strategies
Analysis by place (mapping of catchment�s area)
Line list or Inpatient register Investigation
Case fatality rate Line list or Inpatient register Proper case identification and management
Monthly trend Facility Monthly data sheet Form 2a IDSR GDL or Registers (MTUHA B5)
Compare with last year�s data on cases and deaths
Pneumonia < 5 yrs Monthly trend Facility Monthly data sheet Form 2a IDSR GDL, or Registers (MTUHA B5)
Compare with last year�s data to detect outbreaks, case management + IMCI, HE on early presentation to the HF
Case fatality rate Inpatient register/ Facility Monthly data sheet Form 2a IDSR GDL
Case management and drug resistance
Diarrhoea <5 Monthly trend Facility Monthly data sheet Form 2a IDSR GDL, Registers (MTUHA B5)
Compare with last year�s data, case management + IMCI, HE on prevention, danger signs for early presentation to the HF
Case fatality rate Inpatient register/ Facility Monthly data sheet Form 2a IDSR GDL
Case management and early presentation
Meningitis Weekly trend Weekly data sheet Form 3c IDSR GDL, line lists, Registers MTUHA B5
Follow-up and investigation strategies
Analysis by place (urban/rural)
Line list, Inpatient register Investigation and follow-up
61
Disease Analysis to be done Sources of data Public health actions
Case fatality rate Line list, Inpatient register Proper case identification and management
Monthly trend Facility Monthly data sheet Form 2a IDSR GDL, Registers (MTUHA B5)
Compare with last year�s data on cases and deaths
Measles Weekly trend Weekly data sheet Form 3c IDSR GDL, Registers MTUHA B5, Line list,
Follow-up of cases to detect outbreak, vaccination status
Analysis by place Registers MTUHA B5, Line list Investigation
Case fatality rate Weekly data sheet Form 3c IDSR GDL Early identification of cases and proper case management
AFP Weekly trend Weekly data sheet Form 3c IDSR GDL, Registers MTUHA B5, Line list
Follow-up, vaccination status, investigation
Analysis by place Registers MTUHA B5, Line list Investigation, check on vaccination coverage
NNT Monthly trend Facility Monthly data sheet Form 2a IDSR GDL, IDSR monthly reports Form 2b
Investigation to identify possible factors (vaccination status, efficacy, cord care, delivery environment)
Analysis by person Registers MTUHA B5, Line list, Case investigation forms
ANC care + vaccination status, location of birth, attendant at birth, age of the mother
Analysis by place Registers MTUHA B5, Line list, Case investigation forms
Vaccination coverage, investigation
Case fatality rate Registers MTUHA B5, Line list, Case investigation forms
Age at death
Bacillary Dysentery Monthly trend Facility Monthly data sheet Form 2a IDSR GDL, IDSR monthly reports Form 2b
Success/Failure measures
Analysis by place Register MTUHA B5, Line lists, Inpatient Register
Investigation purposes (e.g. poor sanitation)
Analysis by age Register MTUHA B5, Line list, Inpatient Register
Faster case detection and treatment especially in young children and elderly
62
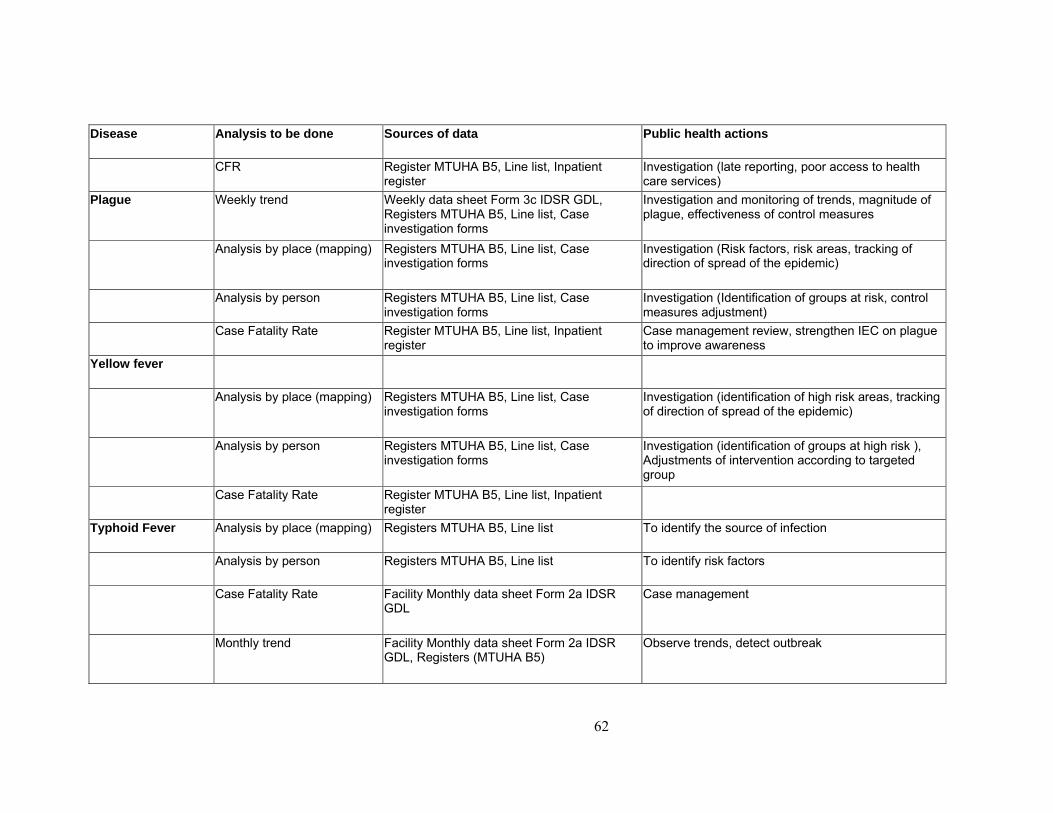
Disease Analysis to be done Sources of data Public health actions
CFR Register MTUHA B5, Line list, Inpatient register
Investigation (late reporting, poor access to health care services)
Plague Weekly trend Weekly data sheet Form 3c IDSR GDL, Registers MTUHA B5, Line list, Case investigation forms
Investigation and monitoring of trends, magnitude of plague, effectiveness of control measures
Analysis by place (mapping) Registers MTUHA B5, Line list, Case investigation forms
Investigation (Risk factors, risk areas, tracking of direction of spread of the epidemic)
Analysis by person Registers MTUHA B5, Line list, Case investigation forms
Investigation (Identification of groups at risk, control measures adjustment)
Case Fatality Rate Register MTUHA B5, Line list, Inpatient register
Case management review, strengthen IEC on plague to improve awareness
Yellow fever
Analysis by place (mapping) Registers MTUHA B5, Line list, Case investigation forms
Investigation (identification of high risk areas, tracking of direction of spread of the epidemic)
Analysis by person Registers MTUHA B5, Line list, Case investigation forms
Investigation (identification of groups at high risk ), Adjustments of intervention according to targeted group
Case Fatality Rate Register MTUHA B5, Line list, Inpatient register
Typhoid Fever Analysis by place (mapping) Registers MTUHA B5, Line list To identify the source of infection
Analysis by person Registers MTUHA B5, Line list To identify risk factors
Case Fatality Rate Facility Monthly data sheet Form 2a IDSR GDL
Case management
Monthly trend Facility Monthly data sheet Form 2a IDSR GDL, Registers (MTUHA B5)
Observe trends, detect outbreak
63
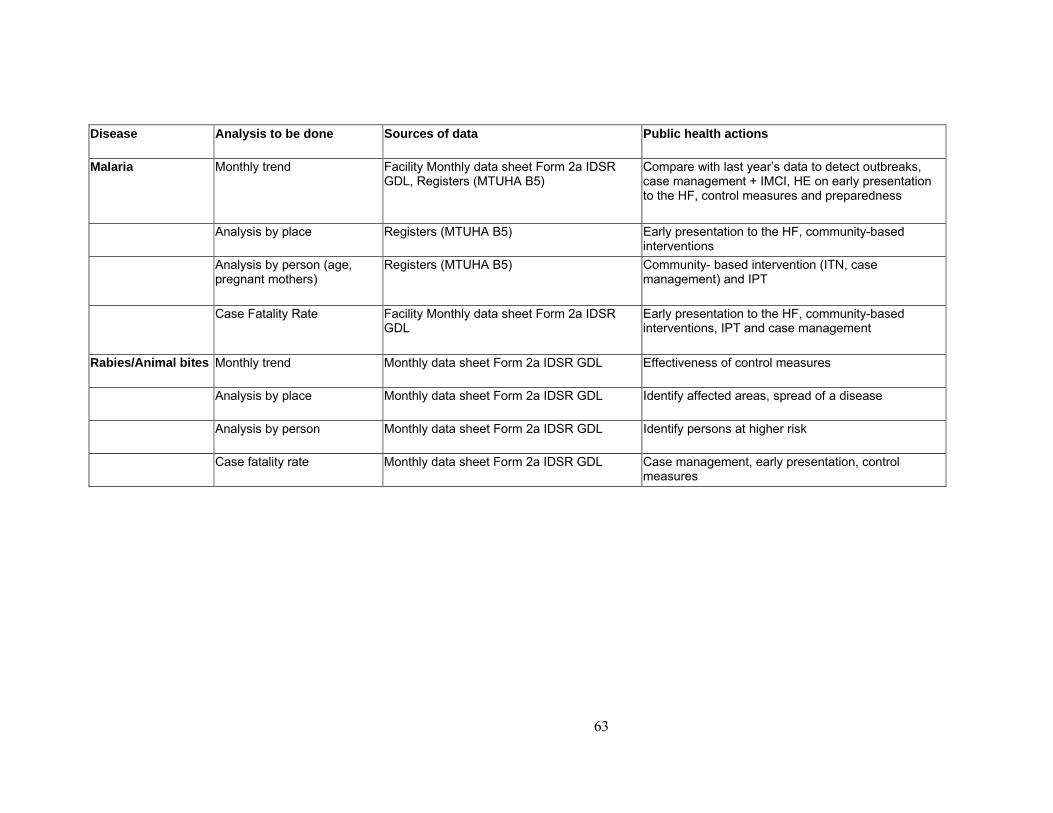
Disease Analysis to be done Sources of data Public health actions
Malaria Monthly trend Facility Monthly data sheet Form 2a IDSR GDL, Registers (MTUHA B5)
Compare with last year�s data to detect outbreaks, case management + IMCI, HE on early presentation to the HF, control measures and preparedness
Analysis by place Registers (MTUHA B5) Early presentation to the HF, community-based interventions
Analysis by person (age, pregnant mothers)
Registers (MTUHA B5) Community- based intervention (ITN, case management) and IPT
Case Fatality Rate Facility Monthly data sheet Form 2a IDSR GDL
Early presentation to the HF, community-based interventions, IPT and case management
Rabies/Animal bites Monthly trend Monthly data sheet Form 2a IDSR GDL Effectiveness of control measures
Analysis by place Monthly data sheet Form 2a IDSR GDL Identify affected areas, spread of a disease
Analysis by person Monthly data sheet Form 2a IDSR GDL Identify persons at higher risk
Case fatality rate Monthly data sheet Form 2a IDSR GDL Case management, early presentation, control measures
64
Document 5-8
Application Planning Please take a few minutes to think through and respond to the following questions. These questions are intended to help you think about how this module applies to your work.
1. What are the obstacles to improving the analysis and interpretation of data in your facility?
2. What specific actions do you need to take to improve your analysis and interpretation of data?
Individually Facility
65
Document 6-1
Module 6 Objectives
By the end of this module, participants will be able to:
Define what is an outbreak Describe why outbreaks need investigation and what are the components of an
outbreak investigation Describe the facility level�s role in outbreak investigation and response. Conduct a simple investigation of an outbreak/epidemic
66
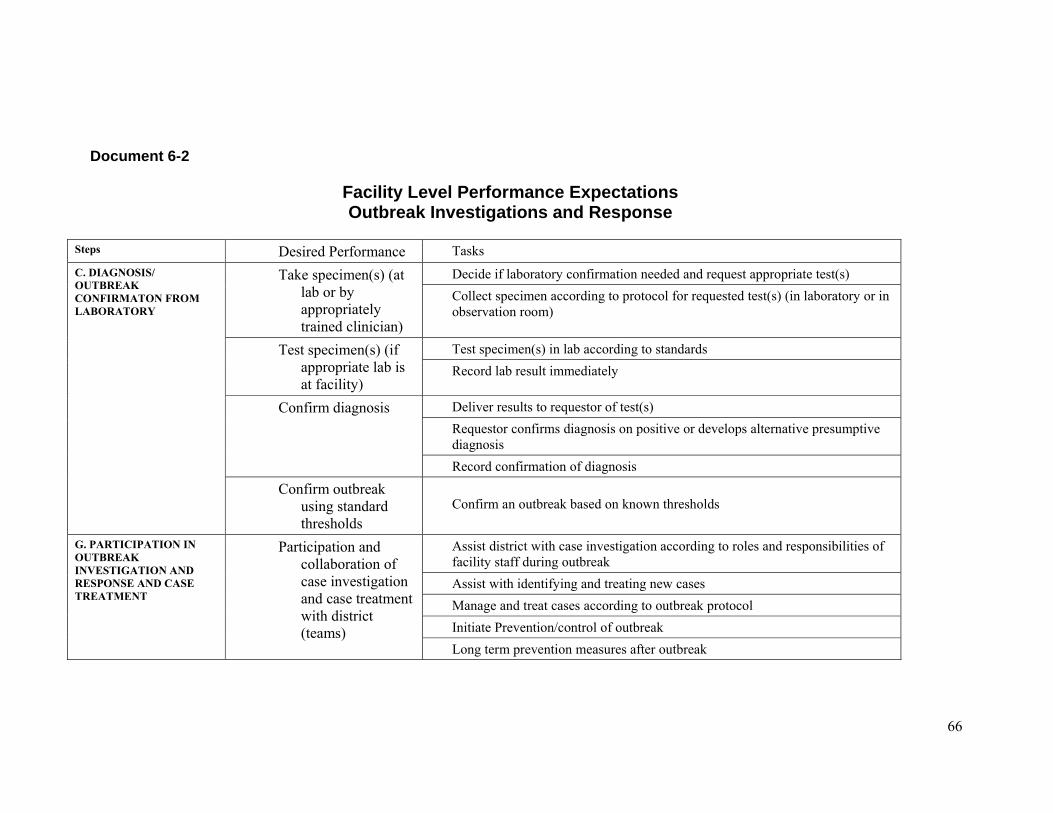
Document 6-2
Facility Level Performance Expectations Outbreak Investigations and Response
Steps Desired Performance Tasks
Decide if laboratory confirmation needed and request appropriate test(s) Take specimen(s) (at lab or by appropriately trained clinician)
Collect specimen according to protocol for requested test(s) (in laboratory or in observation room)
Test specimen(s) in lab according to standards Test specimen(s) (if appropriate lab is at facility)
Record lab result immediately
Deliver results to requestor of test(s) Requestor confirms diagnosis on positive or develops alternative presumptive diagnosis
Confirm diagnosis
Record confirmation of diagnosis
C. DIAGNOSIS/ OUTBREAK CONFIRMATON FROM LABORATORY
Confirm outbreak using standard thresholds
Confirm an outbreak based on known thresholds
Assist district with case investigation according to roles and responsibilities of facility staff during outbreak Assist with identifying and treating new cases Manage and treat cases according to outbreak protocol Initiate Prevention/control of outbreak
G. PARTICIPATION IN OUTBREAK INVESTIGATION AND RESPONSE AND CASE TREATMENT
Participation and collaboration of case investigation and case treatment with district (teams)
Long term prevention measures after outbreak
67
Document 6-3
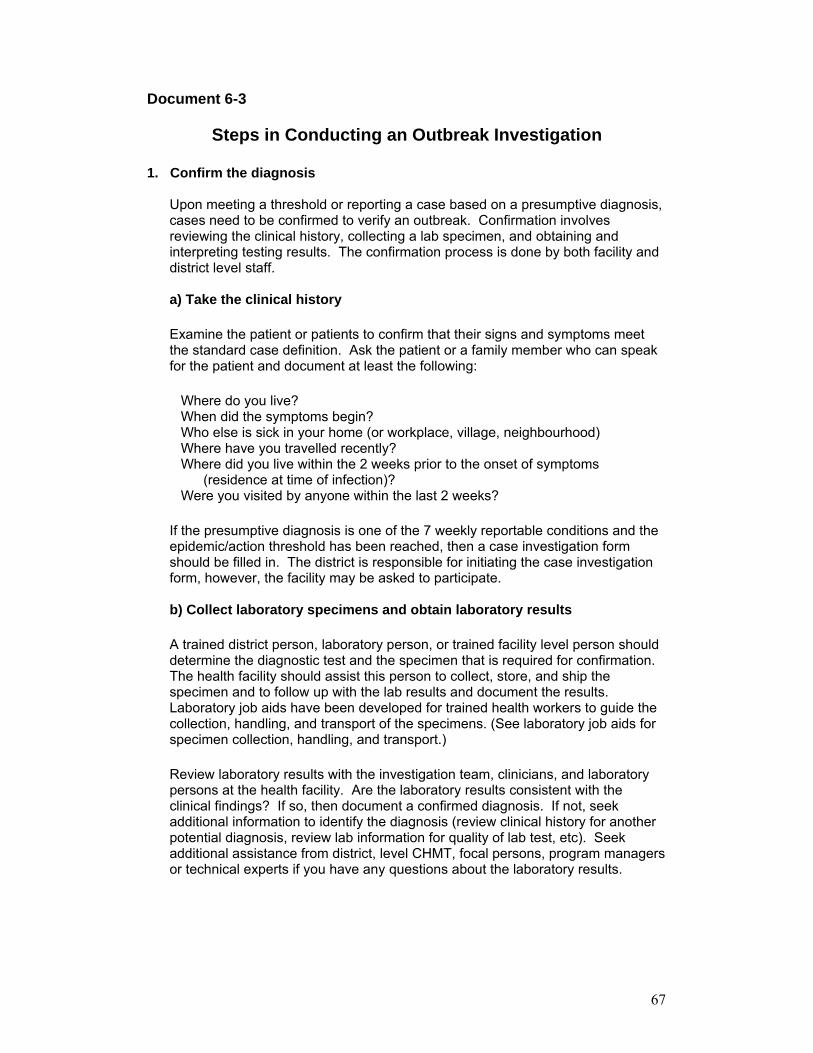
Steps in Conducting an Outbreak Investigation
1. Confirm the diagnosis Upon meeting a threshold or reporting a case based on a presumptive diagnosis, cases need to be confirmed to verify an outbreak. Confirmation involves reviewing the clinical history, collecting a lab specimen, and obtaining and interpreting testing results. The confirmation process is done by both facility and district level staff.
a) Take the clinical history
Examine the patient or patients to confirm that their signs and symptoms meet the standard case definition. Ask the patient or a family member who can speak for the patient and document at least the following:
Where do you live? When did the symptoms begin? Who else is sick in your home (or workplace, village, neighbourhood) Where have you travelled recently? Where did you live within the 2 weeks prior to the onset of symptoms
(residence at time of infection)? Were you visited by anyone within the last 2 weeks?
If the presumptive diagnosis is one of the 7 weekly reportable conditions and the epidemic/action threshold has been reached, then a case investigation form should be filled in. The district is responsible for initiating the case investigation form, however, the facility may be asked to participate.
b) Collect laboratory specimens and obtain laboratory results
A trained district person, laboratory person, or trained facility level person should determine the diagnostic test and the specimen that is required for confirmation. The health facility should assist this person to collect, store, and ship the specimen and to follow up with the lab results and document the results. Laboratory job aids have been developed for trained health workers to guide the collection, handling, and transport of the specimens. (See laboratory job aids for specimen collection, handling, and transport.)
Review laboratory results with the investigation team, clinicians, and laboratory persons at the health facility. Are the laboratory results consistent with the clinical findings? If so, then document a confirmed diagnosis. If not, seek additional information to identify the diagnosis (review clinical history for another potential diagnosis, review lab information for quality of lab test, etc). Seek additional assistance from district, level CHMT, focal persons, program managers or technical experts if you have any questions about the laboratory results.
68
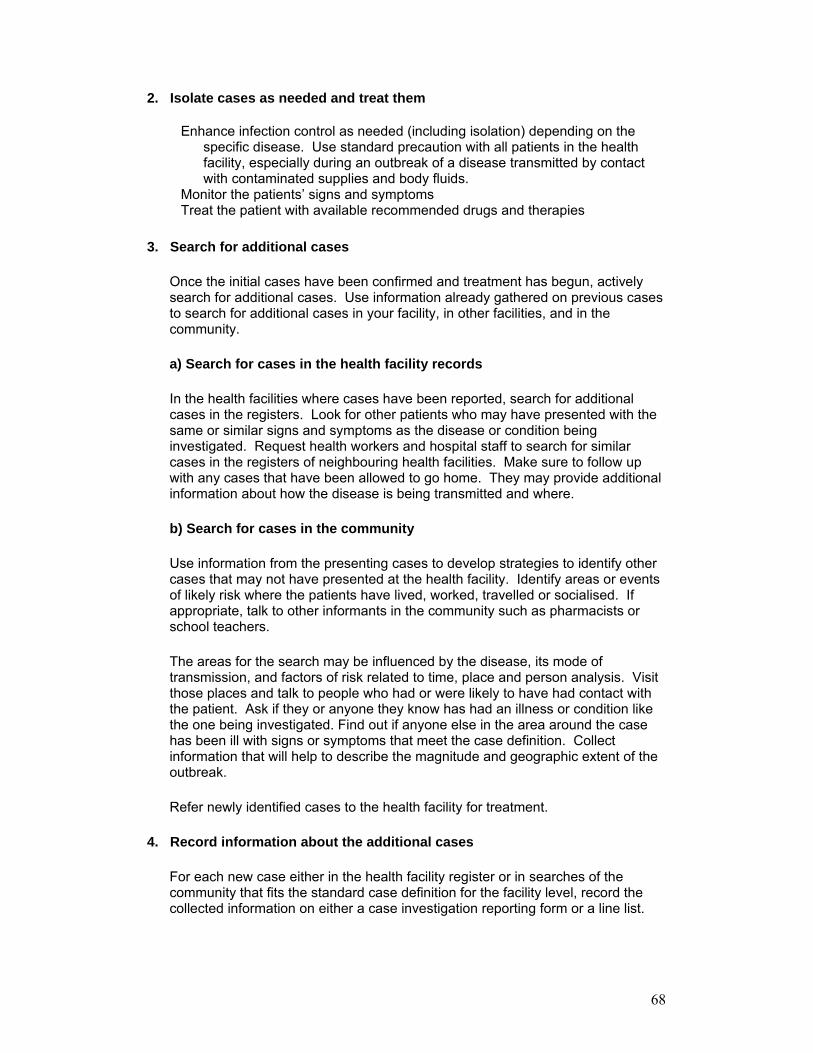
2. Isolate cases as needed and treat them
Enhance infection control as needed (including isolation) depending on the specific disease. Use standard precaution with all patients in the health facility, especially during an outbreak of a disease transmitted by contact with contaminated supplies and body fluids.
Monitor the patients� signs and symptoms Treat the patient with available recommended drugs and therapies
3. Search for additional cases
Once the initial cases have been confirmed and treatment has begun, actively search for additional cases. Use information already gathered on previous cases to search for additional cases in your facility, in other facilities, and in the community.
a) Search for cases in the health facility records
In the health facilities where cases have been reported, search for additional cases in the registers. Look for other patients who may have presented with the same or similar signs and symptoms as the disease or condition being investigated. Request health workers and hospital staff to search for similar cases in the registers of neighbouring health facilities. Make sure to follow up with any cases that have been allowed to go home. They may provide additional information about how the disease is being transmitted and where.
b) Search for cases in the community
Use information from the presenting cases to develop strategies to identify other cases that may not have presented at the health facility. Identify areas or events of likely risk where the patients have lived, worked, travelled or socialised. If appropriate, talk to other informants in the community such as pharmacists or school teachers.
The areas for the search may be influenced by the disease, its mode of transmission, and factors of risk related to time, place and person analysis. Visit those places and talk to people who had or were likely to have had contact with the patient. Ask if they or anyone they know has had an illness or condition like the one being investigated. Find out if anyone else in the area around the case has been ill with signs or symptoms that meet the case definition. Collect information that will help to describe the magnitude and geographic extent of the outbreak.
Refer newly identified cases to the health facility for treatment.
4. Record information about the additional cases
For each new case either in the health facility register or in searches of the community that fits the standard case definition for the facility level, record the collected information on either a case investigation reporting form or a line list.
69
a) Assist district with recording information on a case investigation form
Assist the district with recording information on a case investigation form for at least the first five to ten patients. Also record information on a case investigation form for all those from which laboratory specimens will be taken.
b) Record information about additional cases on a line list
When more than five cases have been identified, and the required number of laboratory specimens has been collected, record any additional cases of the same disease on a line list. A line list helps to organise the information during an epidemic. The responsibility of line lists is a combined function of the district and the facility together. In some cases, the district may be responsible (e.g. a treatment camp) where as in others the facility may be asked to keep the line list (e.g. in an isolation ward). Line list forms are available for cholera and measles in their respective guidelines. A line list should include at least the following information on all patients.
name of the patient residence (village) date of onset of illness or date first seen at the facility age sex immunisation status for vaccine-preventable diseases (children and TT status
for mothers) laboratory test status and result outcome (survived, still in the hospital, referred or died)
5. Participate in analysis, and interpretation of outbreak investigation
information, and participate in the decision regarding appropriate response activities
With district analyse information, interpret information from case investigation, and use information to decide on appropriate response activities and actions.
70
Task 6-1
Individually,
• Read the case study (Doc 6-4) and answer the questions at the end.
Take 35 minutes
71
Task 6-2
In small groups,
• Share your individual answers and agree on a group response
• You do not have to record your response
on a flipchart
• Instead, designate one person to record the group�s response on paper.
Take 50 minutes
72
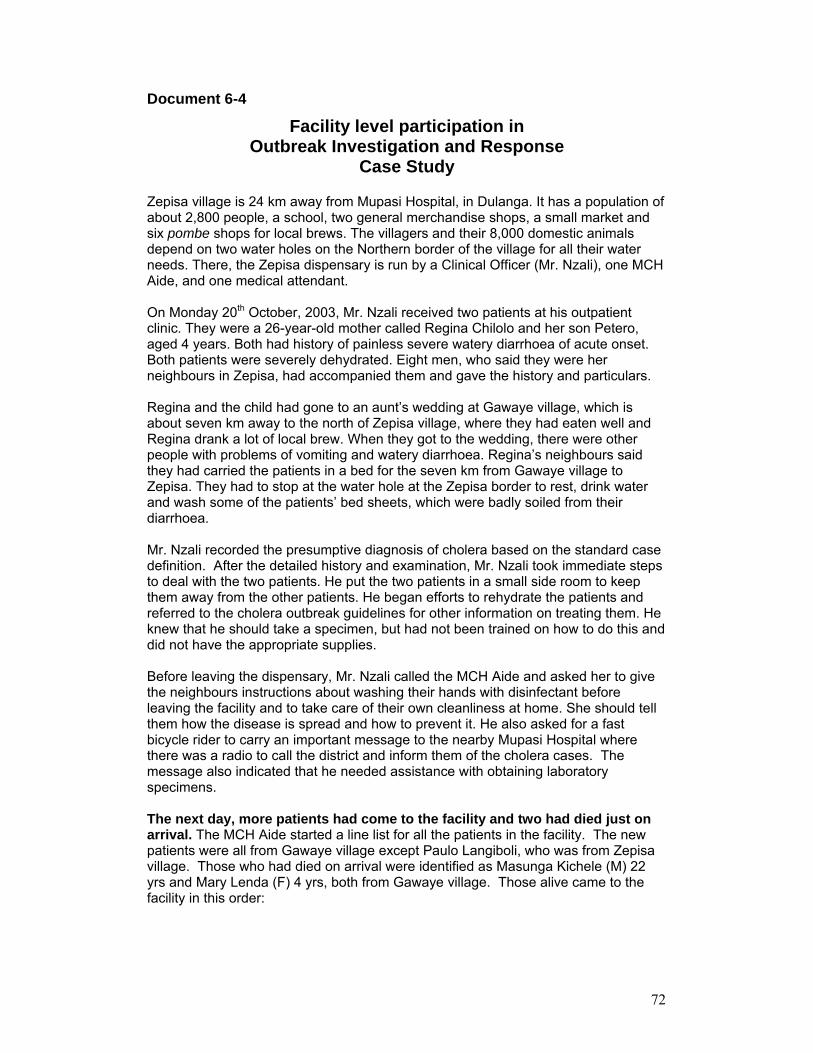
Document 6-4
Facility level participation in Outbreak Investigation and Response
Case Study Zepisa village is 24 km away from Mupasi Hospital, in Dulanga. It has a population of about 2,800 people, a school, two general merchandise shops, a small market and six pombe shops for local brews. The villagers and their 8,000 domestic animals depend on two water holes on the Northern border of the village for all their water needs. There, the Zepisa dispensary is run by a Clinical Officer (Mr. Nzali), one MCH Aide, and one medical attendant. On Monday 20th October, 2003, Mr. Nzali received two patients at his outpatient clinic. They were a 26-year-old mother called Regina Chilolo and her son Petero, aged 4 years. Both had history of painless severe watery diarrhoea of acute onset. Both patients were severely dehydrated. Eight men, who said they were her neighbours in Zepisa, had accompanied them and gave the history and particulars.
Regina and the child had gone to an aunt�s wedding at Gawaye village, which is about seven km away to the north of Zepisa village, where they had eaten well and Regina drank a lot of local brew. When they got to the wedding, there were other people with problems of vomiting and watery diarrhoea. Regina�s neighbours said they had carried the patients in a bed for the seven km from Gawaye village to Zepisa. They had to stop at the water hole at the Zepisa border to rest, drink water and wash some of the patients� bed sheets, which were badly soiled from their diarrhoea. Mr. Nzali recorded the presumptive diagnosis of cholera based on the standard case definition. After the detailed history and examination, Mr. Nzali took immediate steps to deal with the two patients. He put the two patients in a small side room to keep them away from the other patients. He began efforts to rehydrate the patients and referred to the cholera outbreak guidelines for other information on treating them. He knew that he should take a specimen, but had not been trained on how to do this and did not have the appropriate supplies. Before leaving the dispensary, Mr. Nzali called the MCH Aide and asked her to give the neighbours instructions about washing their hands with disinfectant before leaving the facility and to take care of their own cleanliness at home. She should tell them how the disease is spread and how to prevent it. He also asked for a fast bicycle rider to carry an important message to the nearby Mupasi Hospital where there was a radio to call the district and inform them of the cholera cases. The message also indicated that he needed assistance with obtaining laboratory specimens. The next day, more patients had come to the facility and two had died just on arrival. The MCH Aide started a line list for all the patients in the facility. The new patients were all from Gawaye village except Paulo Langiboli, who was from Zepisa village. Those who had died on arrival were identified as Masunga Kichele (M) 22 yrs and Mary Lenda (F) 4 yrs, both from Gawaye village. Those alive came to the facility in this order:
73
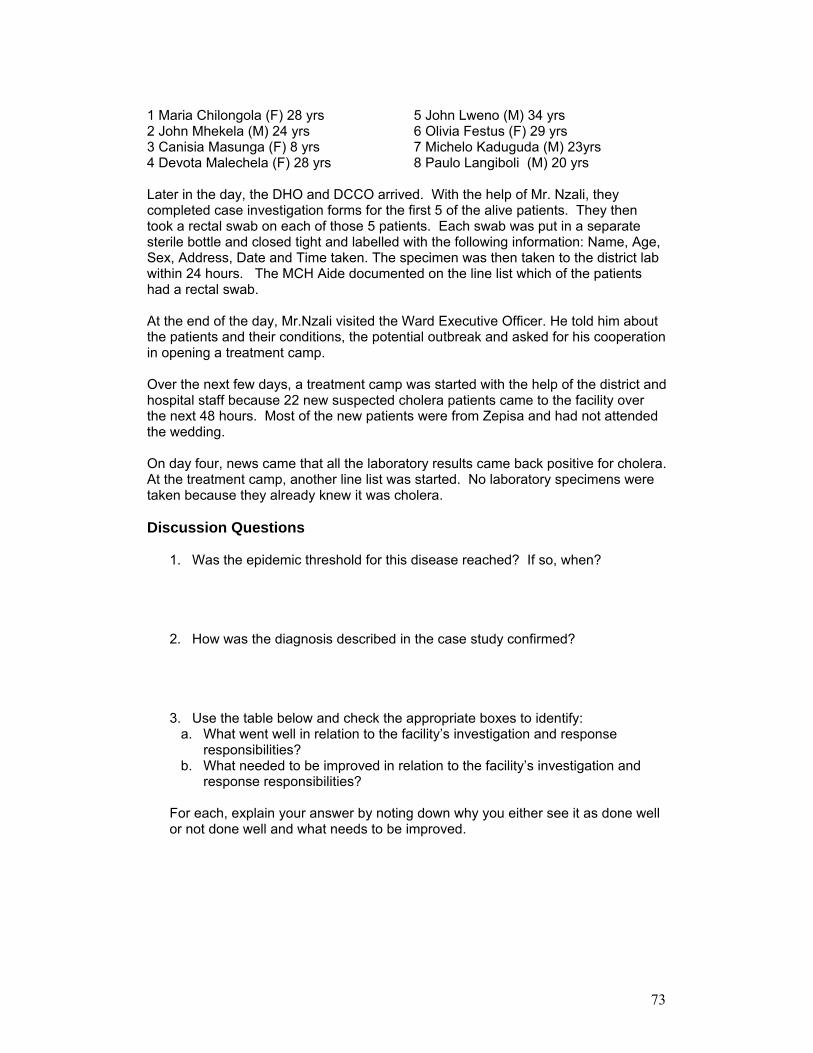
1 Maria Chilongola (F) 28 yrs 2 John Mhekela (M) 24 yrs 3 Canisia Masunga (F) 8 yrs 4 Devota Malechela (F) 28 yrs
5 John Lweno (M) 34 yrs 6 Olivia Festus (F) 29 yrs 7 Michelo Kaduguda (M) 23yrs 8 Paulo Langiboli (M) 20 yrs
Later in the day, the DHO and DCCO arrived. With the help of Mr. Nzali, they completed case investigation forms for the first 5 of the alive patients. They then took a rectal swab on each of those 5 patients. Each swab was put in a separate sterile bottle and closed tight and labelled with the following information: Name, Age, Sex, Address, Date and Time taken. The specimen was then taken to the district lab within 24 hours. The MCH Aide documented on the line list which of the patients had a rectal swab. At the end of the day, Mr.Nzali visited the Ward Executive Officer. He told him about the patients and their conditions, the potential outbreak and asked for his cooperation in opening a treatment camp. Over the next few days, a treatment camp was started with the help of the district and hospital staff because 22 new suspected cholera patients came to the facility over the next 48 hours. Most of the new patients were from Zepisa and had not attended the wedding. On day four, news came that all the laboratory results came back positive for cholera. At the treatment camp, another line list was started. No laboratory specimens were taken because they already knew it was cholera. Discussion Questions
1. Was the epidemic threshold for this disease reached? If so, when?
2. How was the diagnosis described in the case study confirmed?
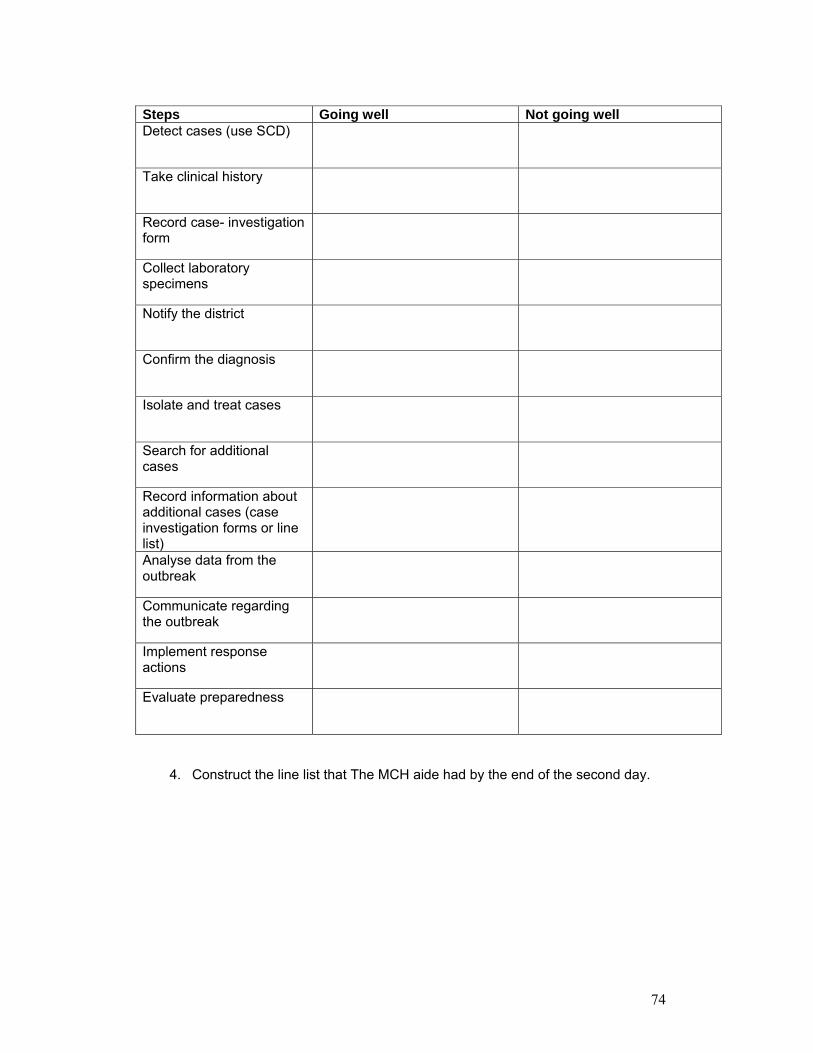
3. Use the table below and check the appropriate boxes to identify:
a. What went well in relation to the facility�s investigation and response responsibilities?
b. What needed to be improved in relation to the facility�s investigation and response responsibilities?
For each, explain your answer by noting down why you either see it as done well or not done well and what needs to be improved.
74
Steps Going well Not going well Detect cases (use SCD)
Take clinical history
Record case- investigation form
Collect laboratory specimens
Notify the district
Confirm the diagnosis
Isolate and treat cases
Search for additional cases
Record information about additional cases (case investigation forms or line list)
Analyse data from the outbreak
Communicate regarding the outbreak
Implement response actions
Evaluate preparedness
4. Construct the line list that The MCH aide had by the end of the second day.
75
5. How should Mr Nzali have searched for additional cases?
6. Was the public health response adequate? If yes, why? If no, why not?
7. What would you have done differently given what you have learned about outbreak investigations?
76
Document 6-5
Application Planning
Please take a few minutes to think through and respond to the following questions. These questions are intended to help you think about how this module applies to your work. 1. What specific actions do you need to take to do a better job of outbreak
investigation and response? 2. Whose help do you need to do a better job?
77
Document 7-1
Module 7 Objectives
By the end of this module, participants will be able to:
• Define the benefits of communication for surveillance
• Identify the key actors and actions for improving linkages outside the health care system
• Practice effective communication skills
78
Document 7-2
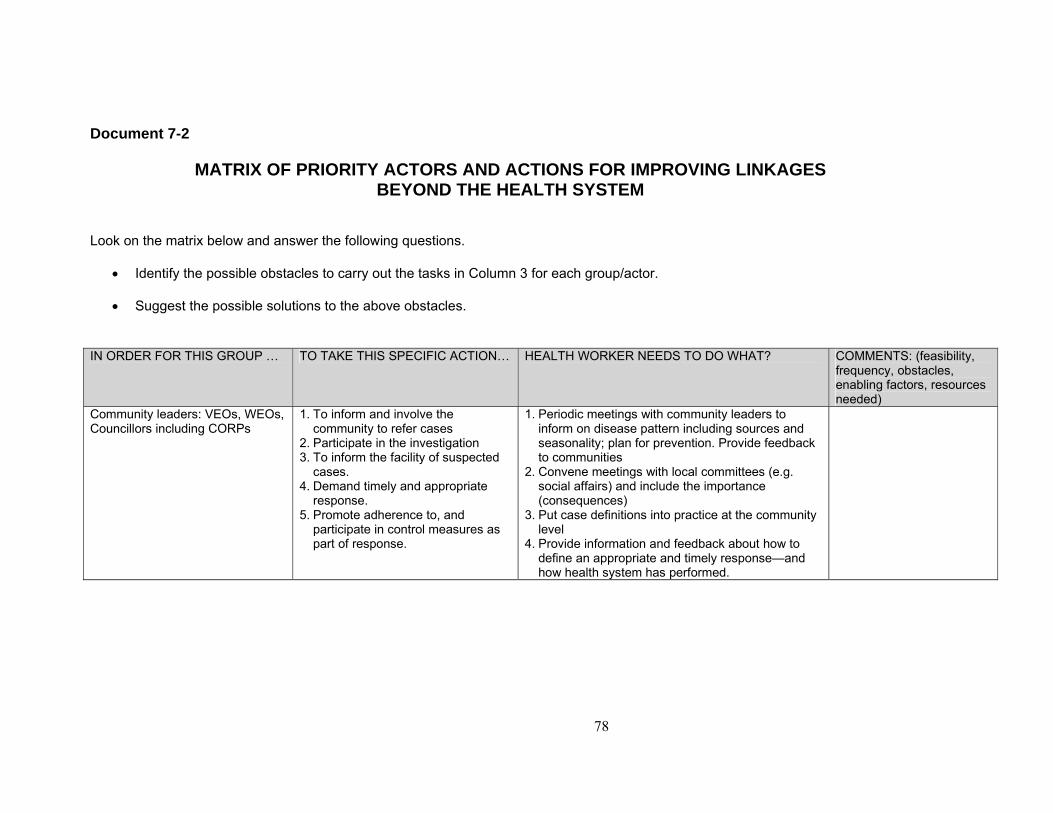
MATRIX OF PRIORITY ACTORS AND ACTIONS FOR IMPROVING LINKAGES BEYOND THE HEALTH SYSTEM
Look on the matrix below and answer the following questions.
• Identify the possible obstacles to carry out the tasks in Column 3 for each group/actor.
• Suggest the possible solutions to the above obstacles.
IN ORDER FOR THIS GROUP � TO TAKE THIS SPECIFIC ACTION� HEALTH WORKER NEEDS TO DO WHAT? COMMENTS: (feasibility,
frequency, obstacles, enabling factors, resources needed)
Community leaders: VEOs, WEOs, Councillors including CORPs
1. To inform and involve the community to refer cases
2. Participate in the investigation 3. To inform the facility of suspected
cases. 4. Demand timely and appropriate
response. 5. Promote adherence to, and
participate in control measures as part of response.
1. Periodic meetings with community leaders to inform on disease pattern including sources and seasonality; plan for prevention. Provide feedback to communities
2. Convene meetings with local committees (e.g. social affairs) and include the importance (consequences)
3. Put case definitions into practice at the community level
4. Provide information and feedback about how to define an appropriate and timely response�and how health system has performed.
79
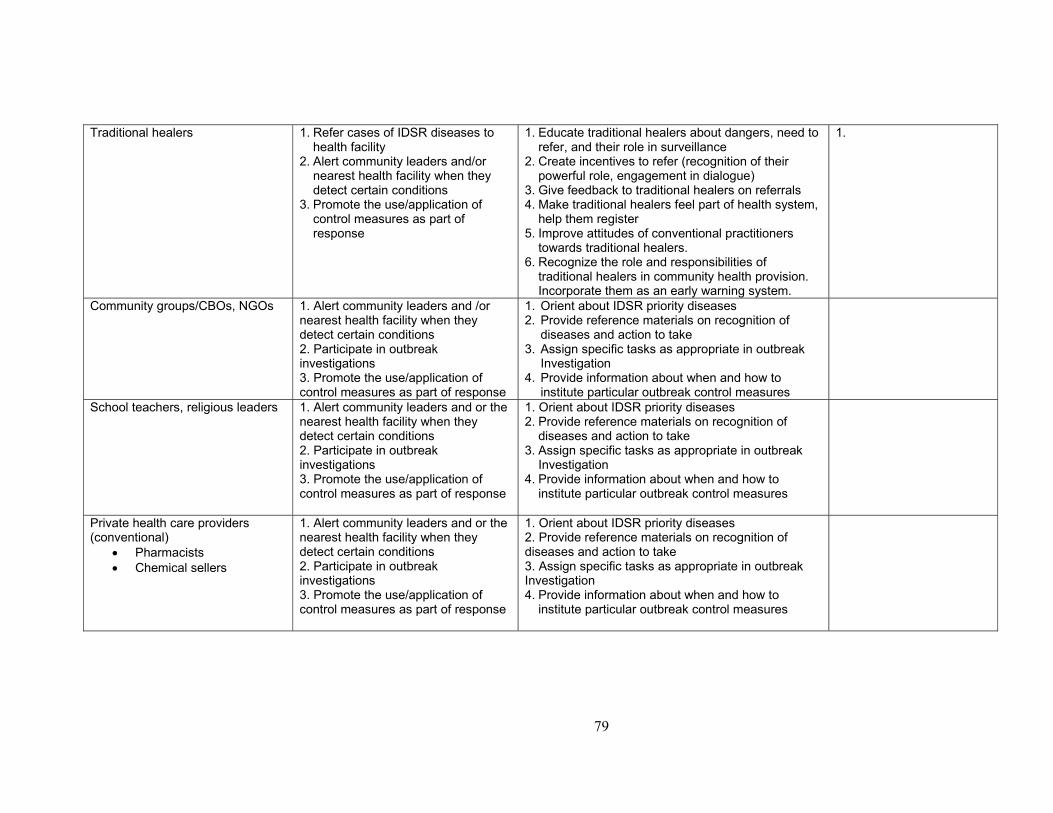
Traditional healers 1. Refer cases of IDSR diseases to health facility
2. Alert community leaders and/or nearest health facility when they detect certain conditions
3. Promote the use/application of control measures as part of response
1. Educate traditional healers about dangers, need to refer, and their role in surveillance
2. Create incentives to refer (recognition of their powerful role, engagement in dialogue)
3. Give feedback to traditional healers on referrals 4. Make traditional healers feel part of health system,
help them register 5. Improve attitudes of conventional practitioners
towards traditional healers. 6. Recognize the role and responsibilities of
traditional healers in community health provision. Incorporate them as an early warning system.
1.
Community groups/CBOs, NGOs 1. Alert community leaders and /or nearest health facility when they detect certain conditions 2. Participate in outbreak investigations 3. Promote the use/application of control measures as part of response
1. Orient about IDSR priority diseases 2. Provide reference materials on recognition of
diseases and action to take 3. Assign specific tasks as appropriate in outbreak
Investigation 4. Provide information about when and how to
institute particular outbreak control measures
School teachers, religious leaders 1. Alert community leaders and or the nearest health facility when they detect certain conditions 2. Participate in outbreak investigations 3. Promote the use/application of control measures as part of response
1. Orient about IDSR priority diseases 2. Provide reference materials on recognition of
diseases and action to take 3. Assign specific tasks as appropriate in outbreak
Investigation 4. Provide information about when and how to
institute particular outbreak control measures
Private health care providers (conventional)
• Pharmacists • Chemical sellers
1. Alert community leaders and or the nearest health facility when they detect certain conditions 2. Participate in outbreak investigations 3. Promote the use/application of control measures as part of response
1. Orient about IDSR priority diseases 2. Provide reference materials on recognition of diseases and action to take 3. Assign specific tasks as appropriate in outbreak Investigation 4. Provide information about when and how to
institute particular outbreak control measures
80
Document 7-3 Good Communication
• Sending and receiving messages: A key to good communication is having a 2-way system. This means
listening for the community�s concerns and responding, as well as informing.
• Regular: Provide your community with regular updates on the community�s health
status. Don�t wait until there is bad news: review past outbreaks for signs of future ones; provide reassurance that all is well; inform the community when an investigation may take place; listen to hear their concerns.
• Factual: Use your surveillance data and prevention information to improve your
communications • Appropriate: Give priority to information that is relevant to the people you are
communicating with or addresses their concerns. Don�t overburden people with information that is not relevant to them, or ignore their concerns.
• Action-oriented: Give practical prevention and referral advice that people can use.
81
Task 7-1
In small groups
• Agree on three key messages to communicate at the community meeting
• Stress the benefits • Agree on two members of the group to
make the presentation Take 30 minutes to prepare
82
Document 7-4
Application Planning Please take a few minutes to think through and respond to the following questions. These questions are intended to help you think about how this module applies to your work.
1. What specific actions do you need to take to improve your communication with your community?
2. Specifically, which specific groups (e.g. traditional healers, school teachers, etc.) do you need to communicate more effectively with?
83
Document 8-1
Module 8 Objective
By the end of the session, participants will:
Develop a plan to apply what was learned in the workshop
84
Task 8-1
In your facility teams:
• Review what we have covered in the workshop and agree on the main activities related to IDSR implementation that need to be carried out when you return to your facility
• Be sure to focus on areas that need to be
strengthened or improved • Develop a practical and realistic action plan for the
next 6-12 months that includes the following:
- implementation tasks - identification of persons responsible
- resource requirements
- timing
Use the planning format provided You have 40 minutes
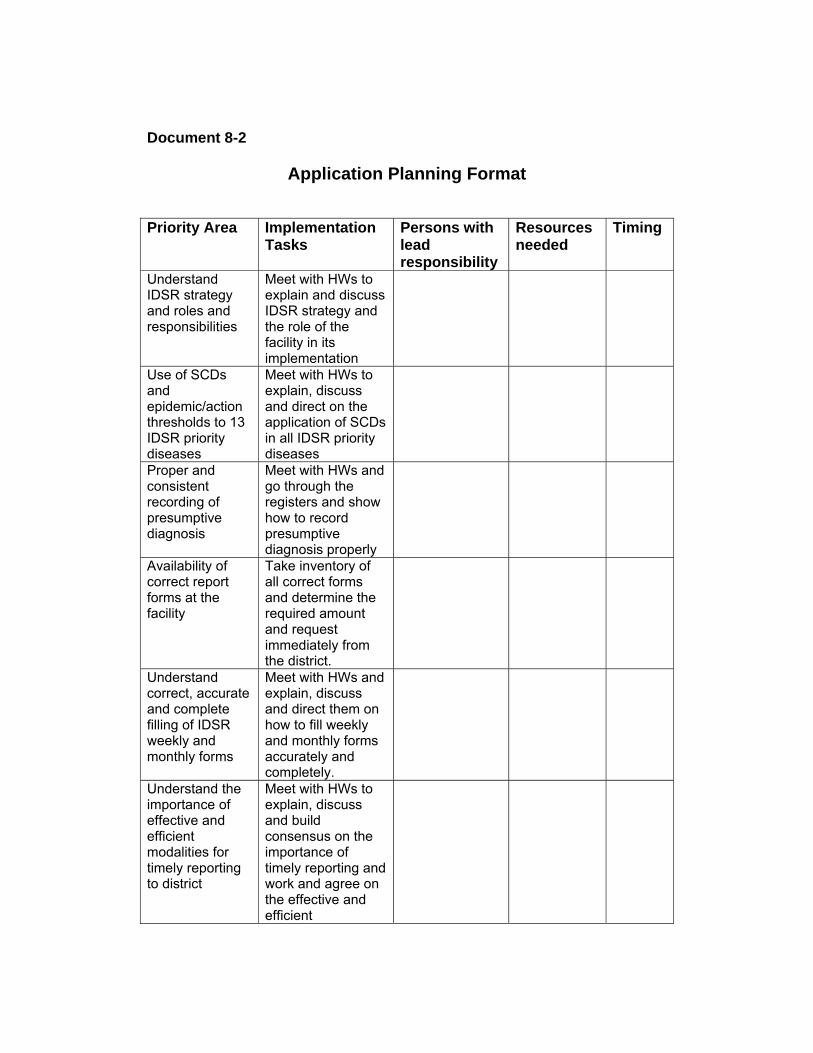
Document 8-2
Application Planning Format Priority Area Implementation
Tasks Persons with lead responsibility
Resources needed
Timing
Understand IDSR strategy and roles and responsibilities
Meet with HWs to explain and discuss IDSR strategy and the role of the facility in its implementation
Use of SCDs and epidemic/action thresholds to 13 IDSR priority diseases
Meet with HWs to explain, discuss and direct on the application of SCDs in all IDSR priority diseases
Proper and consistent recording of presumptive diagnosis
Meet with HWs and go through the registers and show how to record presumptive diagnosis properly
Availability of correct report forms at the facility
Take inventory of all correct forms and determine the required amount and request immediately from the district.
Understand correct, accurate and complete filling of IDSR weekly and monthly forms
Meet with HWs and explain, discuss and direct them on how to fill weekly and monthly forms accurately and completely.
Understand the importance of effective and efficient modalities for timely reporting to district
Meet with HWs to explain, discuss and build consensus on the importance of timely reporting and work and agree on the effective and efficient
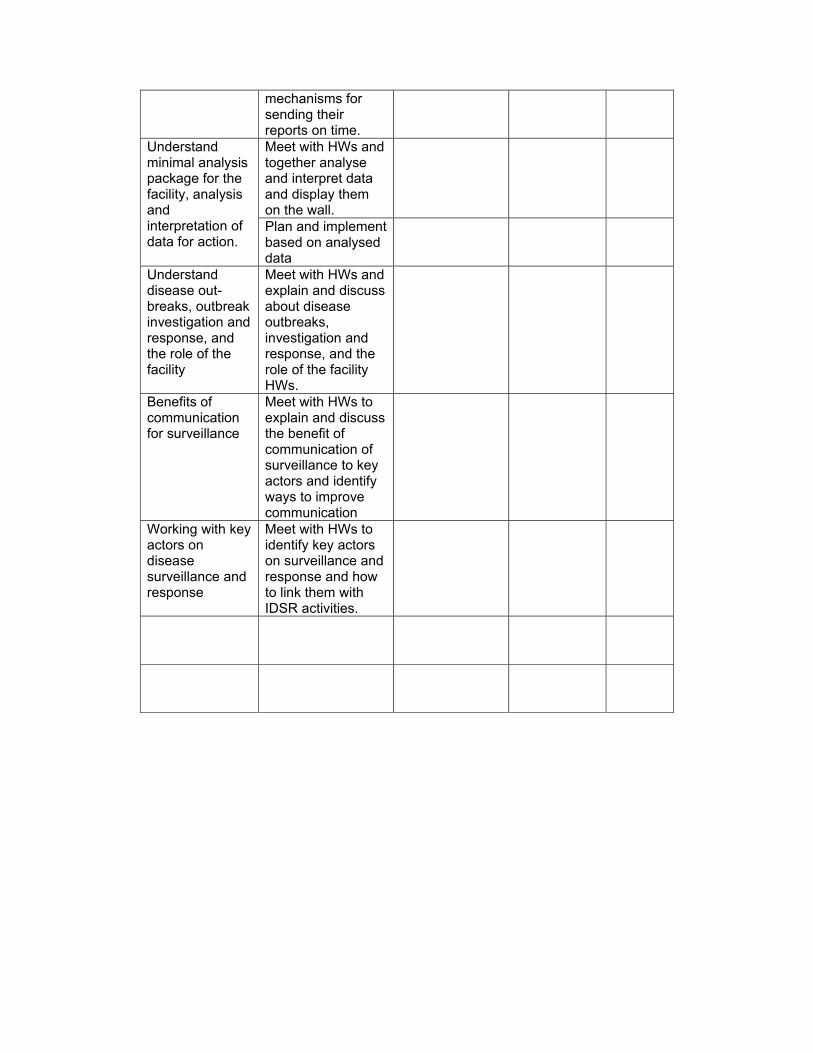
mechanisms for sending their reports on time. Meet with HWs and together analyse and interpret data and display them on the wall.
Understand minimal analysis package for the facility, analysis and interpretation of data for action.
Plan and implement based on analysed data
Understand disease out-breaks, outbreak investigation and response, and the role of the facility
Meet with HWs and explain and discuss about disease outbreaks, investigation and response, and the role of the facility HWs.
Benefits of communication for surveillance
Meet with HWs to explain and discuss the benefit of communication of surveillance to key actors and identify ways to improve communication
Working with key actors on disease surveillance and response
Meet with HWs to identify key actors on surveillance and response and how to link them with IDSR activities.
87
Document 9-1 Post Test
Facilitators will provide
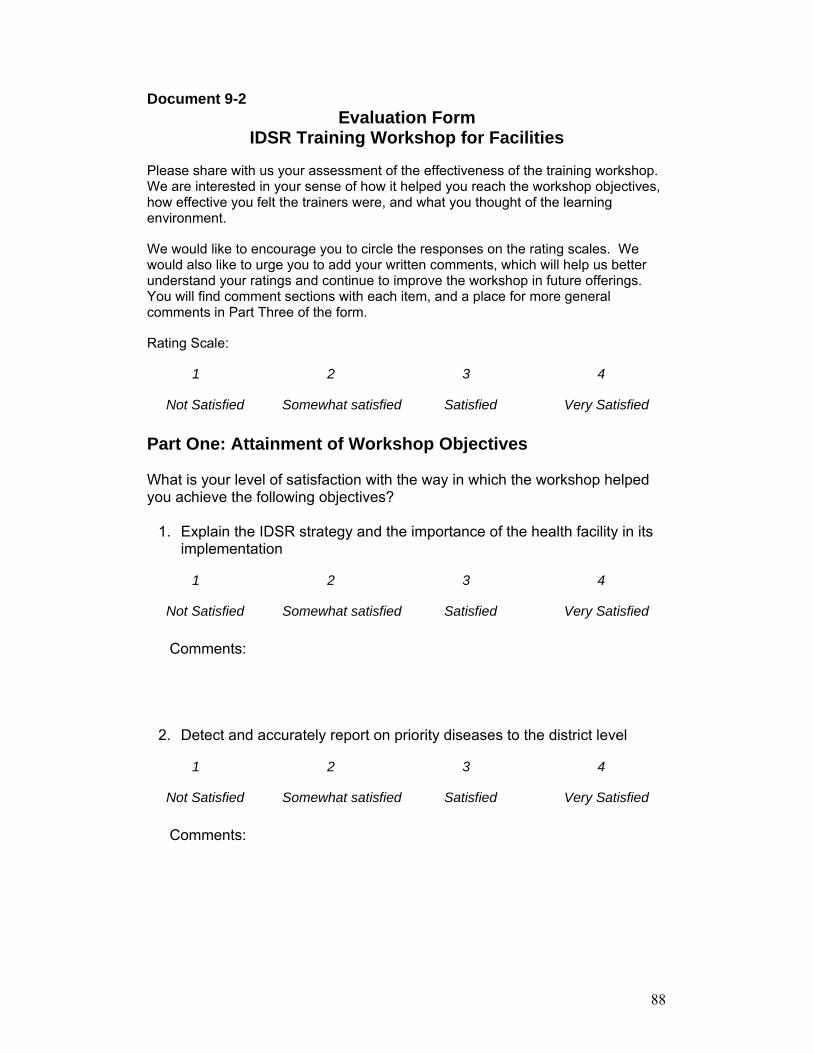
88
Document 9-2 Evaluation Form
IDSR Training Workshop for Facilities
Please share with us your assessment of the effectiveness of the training workshop. We are interested in your sense of how it helped you reach the workshop objectives, how effective you felt the trainers were, and what you thought of the learning environment.
We would like to encourage you to circle the responses on the rating scales. We would also like to urge you to add your written comments, which will help us better understand your ratings and continue to improve the workshop in future offerings. You will find comment sections with each item, and a place for more general comments in Part Three of the form.
Rating Scale:
1 2 3 4
Not Satisfied Somewhat satisfied Satisfied Very Satisfied
Part One: Attainment of Workshop Objectives
What is your level of satisfaction with the way in which the workshop helped you achieve the following objectives?
1. Explain the IDSR strategy and the importance of the health facility in its
implementation
1 2 3 4
Not Satisfied Somewhat satisfied Satisfied Very Satisfied
Comments:
2. Detect and accurately report on priority diseases to the district level
1 2 3 4
Not Satisfied Somewhat satisfied Satisfied Very Satisfied
Comments:
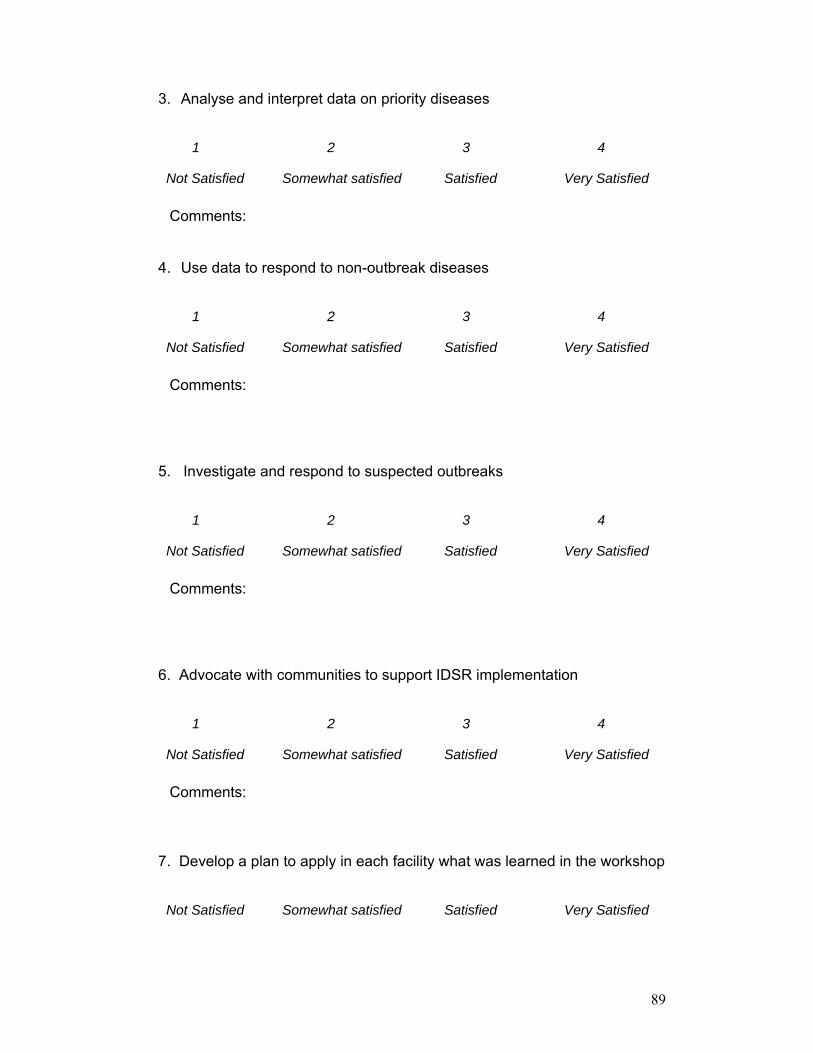
89
3. Analyse and interpret data on priority diseases
1 2 3 4
Not Satisfied Somewhat satisfied Satisfied Very Satisfied
Comments:
4. Use data to respond to non-outbreak diseases
1 2 3 4
Not Satisfied Somewhat satisfied Satisfied Very Satisfied
Comments:
5. Investigate and respond to suspected outbreaks
1 2 3 4
Not Satisfied Somewhat satisfied Satisfied Very Satisfied
Comments:
6. Advocate with communities to support IDSR implementation
1 2 3 4
Not Satisfied Somewhat satisfied Satisfied Very Satisfied
Comments:
7. Develop a plan to apply in each facility what was learned in the workshop
Not Satisfied Somewhat satisfied Satisfied Very Satisfied
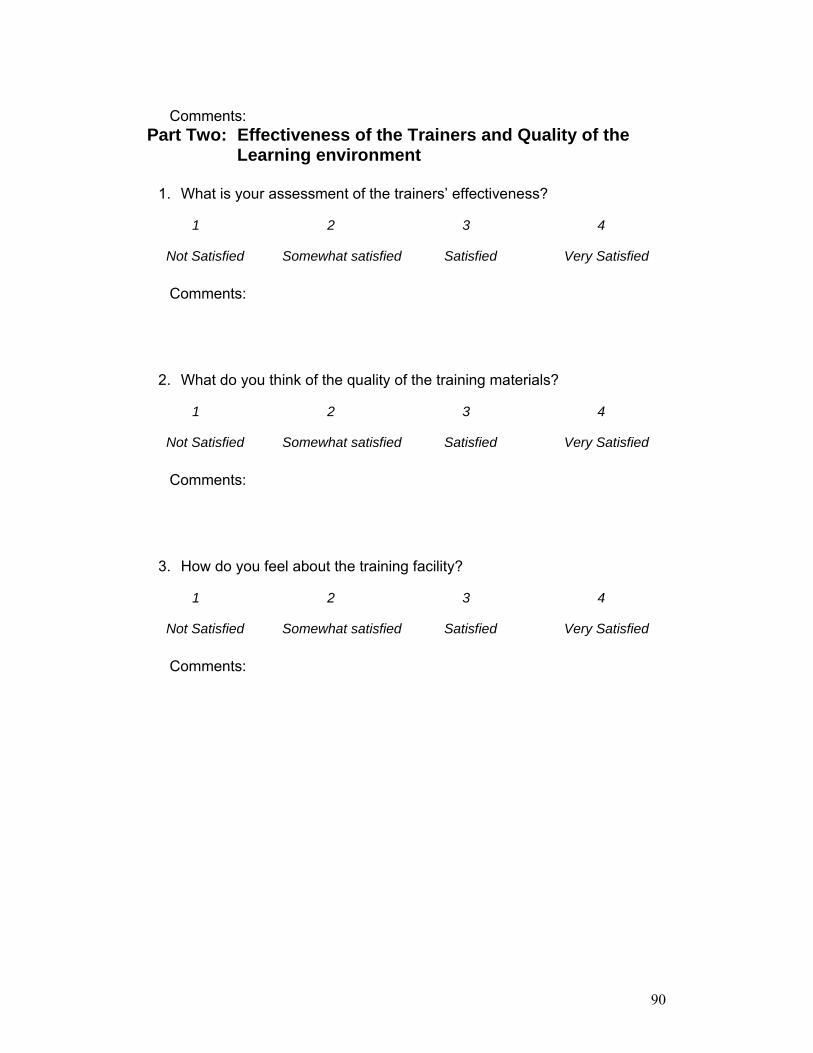
90
Comments:
Part Two: Effectiveness of the Trainers and Quality of the Learning environment
1. What is your assessment of the trainers� effectiveness?
1 2 3 4
Not Satisfied Somewhat satisfied Satisfied Very Satisfied
Comments:
2. What do you think of the quality of the training materials?
1 2 3 4
Not Satisfied Somewhat satisfied Satisfied Very Satisfied
Comments:
3. How do you feel about the training facility?
1 2 3 4
Not Satisfied Somewhat satisfied Satisfied Very Satisfied
Comments:
91
Part Three: Overall Assessment
1. What are the 2-3 things you liked the most about this training workshop?
2. What are some ideas of ways the workshop could be improved in the future?
THANK YOU FOR TAKING THE TIME TO GIVE US FEEDBACK
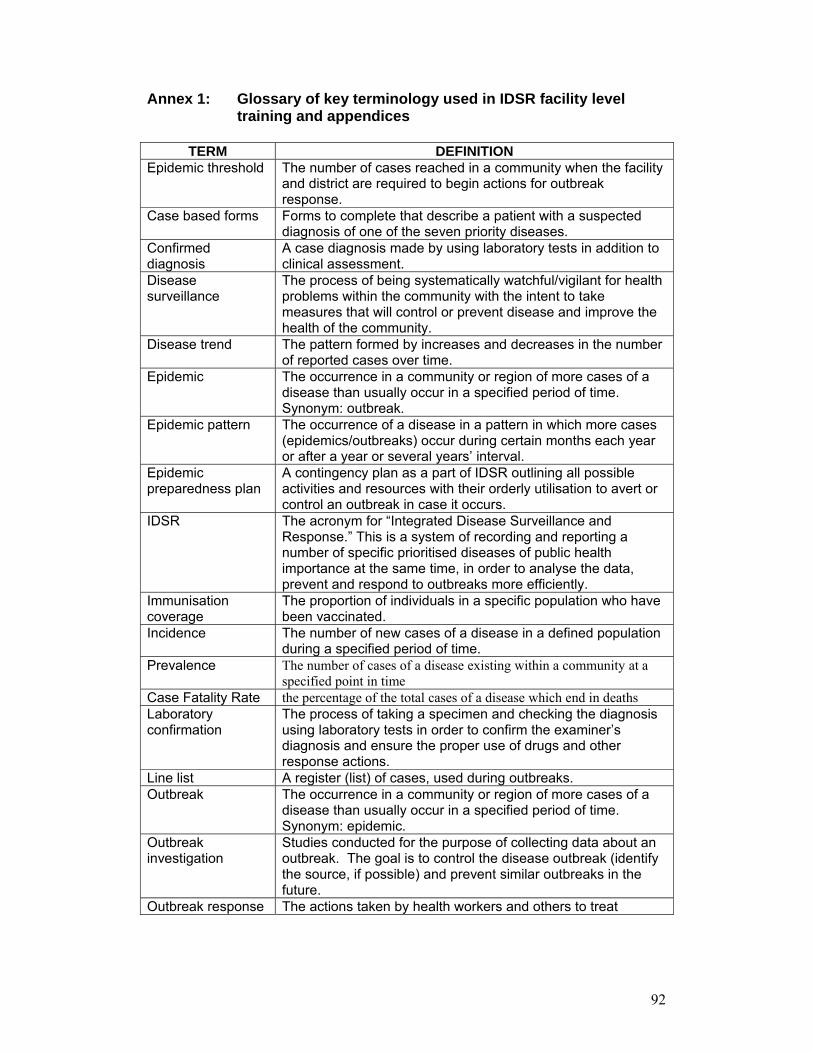
92
Annex 1: Glossary of key terminology used in IDSR facility level training and appendices
TERM DEFINITION
Epidemic threshold The number of cases reached in a community when the facility and district are required to begin actions for outbreak response.
Case based forms Forms to complete that describe a patient with a suspected diagnosis of one of the seven priority diseases.
Confirmed diagnosis
A case diagnosis made by using laboratory tests in addition to clinical assessment.
Disease surveillance
The process of being systematically watchful/vigilant for health problems within the community with the intent to take measures that will control or prevent disease and improve the health of the community.
Disease trend
The pattern formed by increases and decreases in the number of reported cases over time.
Epidemic The occurrence in a community or region of more cases of a disease than usually occur in a specified period of time. Synonym: outbreak.
Epidemic pattern The occurrence of a disease in a pattern in which more cases (epidemics/outbreaks) occur during certain months each year or after a year or several years� interval.
Epidemic preparedness plan
A contingency plan as a part of IDSR outlining all possible activities and resources with their orderly utilisation to avert or control an outbreak in case it occurs.
IDSR The acronym for �Integrated Disease Surveillance and Response.� This is a system of recording and reporting a number of specific prioritised diseases of public health importance at the same time, in order to analyse the data, prevent and respond to outbreaks more efficiently.
Immunisation coverage
The proportion of individuals in a specific population who have been vaccinated.
Incidence
The number of new cases of a disease in a defined population during a specified period of time.
Prevalence The number of cases of a disease existing within a community at a specified point in time
Case Fatality Rate the percentage of the total cases of a disease which end in deaths Laboratory confirmation
The process of taking a specimen and checking the diagnosis using laboratory tests in order to confirm the examiner�s diagnosis and ensure the proper use of drugs and other response actions.
Line list A register (list) of cases, used during outbreaks. Outbreak The occurrence in a community or region of more cases of a
disease than usually occur in a specified period of time. Synonym: epidemic.
Outbreak investigation
Studies conducted for the purpose of collecting data about an outbreak. The goal is to control the disease outbreak (identify the source, if possible) and prevent similar outbreaks in the future.
Outbreak response The actions taken by health workers and others to treat
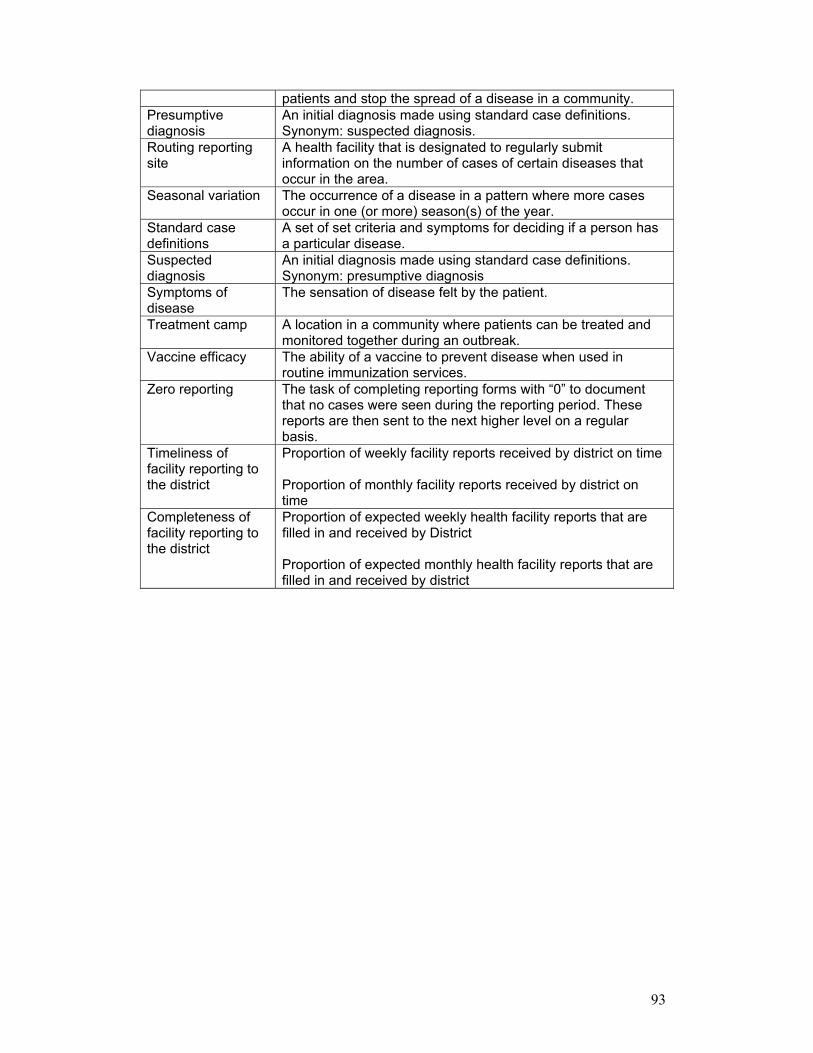
93
patients and stop the spread of a disease in a community. Presumptive diagnosis
An initial diagnosis made using standard case definitions. Synonym: suspected diagnosis.
Routing reporting site
A health facility that is designated to regularly submit information on the number of cases of certain diseases that occur in the area.
Seasonal variation The occurrence of a disease in a pattern where more cases occur in one (or more) season(s) of the year.
Standard case definitions
A set of set criteria and symptoms for deciding if a person has a particular disease.
Suspected diagnosis
An initial diagnosis made using standard case definitions. Synonym: presumptive diagnosis
Symptoms of disease
The sensation of disease felt by the patient.
Treatment camp A location in a community where patients can be treated and monitored together during an outbreak.
Vaccine efficacy The ability of a vaccine to prevent disease when used in routine immunization services.
Zero reporting The task of completing reporting forms with �0� to document that no cases were seen during the reporting period. These reports are then sent to the next higher level on a regular basis.
Timeliness of facility reporting to the district
Proportion of weekly facility reports received by district on time Proportion of monthly facility reports received by district on time
Completeness of facility reporting to the district
Proportion of expected weekly health facility reports that are filled in and received by District Proportion of expected monthly health facility reports that are filled in and received by district