Integrated Combined Heat and Power System Dispatch Considering Electrical and Thermal ... ·...
17
energies Article Integrated Combined Heat and Power System Dispatch Considering Electrical and Thermal Energy Storage Rongxiang Yuan, Jun Ye *, Jiazhi Lei and Timing Li School of Electrical Engineering, Wuhan University, Wuhan 430072, China; [email protected] (R.Y.); [email protected] (J.L.); [email protected] (T.L.) * Correspondence: [email protected]; Tel.: +86-187-7107-8083 Academic Editor: Brian Agnew Received: 5 April 2016; Accepted: 8 June 2016; Published: 20 June 2016 Abstract: Wind power has achieved great development in Northern China, but abundant wind power is dissipated, rather than utilized, due to inflexible electricity production of combined heat and power (CHP) units. In this paper, an integrated CHP system consisting of CHP units, wind power plants, and condensing power plants is investigated to decouple the power and heat production on both the power supply side and heat supply side, by incorporating electrical energy storage (EES) and thermal energy storage (TES). Then the integrated CHP system dispatch (ICHPSD) model is formulated to reach the target of reducing wind power curtailment and primary energy consumption. Finally, the feasibility and effectiveness of the proposed ICHPSD model are verified by the six-bus system, and the simulation results show that EES has a better effect on wind power integration than TES. The annual net benefits by incorporating EES and TES increase with increasing wind penetration, but they gradually approach saturation. Introducing both EES and TES can largely increase the amount of wind power integration and improve the operation efficiency of the system. Keywords: combined heat and power; thermal energy storage; electrical energy storage; dispatch 1. Introduction The targets of reducing fossil fuel consumption and greenhouse gas emission are driving China to vigorously develop renewable energy [1]. Among the various forms of renewable energy, wind power is deemed as the most promising one due to its economic viability and technical maturity. In China it has become the third largest electricity provider following coal-fired power and hydropower [2]. By the end of 2014, the cumulative installed capacity of wind energy in China reached 96.4 GW, accounting for about 26% of the global total [3]. Moreover, the large technically-exploitable potential of 1400 GW onshore wind energy and 600 GW offshore wind energy has been estimated in China [4]. However, wind energy curtailment always occurs due to the inflexible electricity production of CHP units. CHP units are widely used in the north of China and some European countries, such as Germany and Denmark [5]. With a much higher efficiency in energy utilization compared with separated generation of heat and power, it represents one of the promising technologies for a reduction in primary energy consumption and greenhouse gas emission. CHP is characterized by the coupled production of heat and power and operates with the “thermal load-following” strategy, in which the heat power produced by the plant is conditional by the users’ thermal demand [6], thus having a constrained adjustment ability of electricity generation, which is a barrier to accommodate more wind power [7]. Improving the flexibility of CHP will significantly benefit for the wind power integration. Introducing EES to store the curtailed wind energy is a straightforward way [8–10]. Among the EES Energies 2016, 9, 474; doi:10.3390/en9060474 www.mdpi.com/journal/energies
Transcript of Integrated Combined Heat and Power System Dispatch Considering Electrical and Thermal ... ·...
energies
Article
Integrated Combined Heat and Power SystemDispatch Considering Electrical andThermal Energy Storage
Rongxiang Yuan, Jun Ye *, Jiazhi Lei and Timing Li
School of Electrical Engineering, Wuhan University, Wuhan 430072, China;[email protected] (R.Y.); [email protected] (J.L.); [email protected] (T.L.)* Correspondence: [email protected]; Tel.: +86-187-7107-8083
Academic Editor: Brian AgnewReceived: 5 April 2016; Accepted: 8 June 2016; Published: 20 June 2016
Abstract: Wind power has achieved great development in Northern China, but abundant wind poweris dissipated, rather than utilized, due to inflexible electricity production of combined heat and power(CHP) units. In this paper, an integrated CHP system consisting of CHP units, wind power plants,and condensing power plants is investigated to decouple the power and heat production on both thepower supply side and heat supply side, by incorporating electrical energy storage (EES) and thermalenergy storage (TES). Then the integrated CHP system dispatch (ICHPSD) model is formulated toreach the target of reducing wind power curtailment and primary energy consumption. Finally,the feasibility and effectiveness of the proposed ICHPSD model are verified by the six-bus system,and the simulation results show that EES has a better effect on wind power integration than TES.The annual net benefits by incorporating EES and TES increase with increasing wind penetration,but they gradually approach saturation. Introducing both EES and TES can largely increase theamount of wind power integration and improve the operation efficiency of the system.
Keywords: combined heat and power; thermal energy storage; electrical energy storage; dispatch
1. Introduction
The targets of reducing fossil fuel consumption and greenhouse gas emission are driving China tovigorously develop renewable energy [1]. Among the various forms of renewable energy, wind poweris deemed as the most promising one due to its economic viability and technical maturity. In China ithas become the third largest electricity provider following coal-fired power and hydropower [2]. By theend of 2014, the cumulative installed capacity of wind energy in China reached 96.4 GW, accountingfor about 26% of the global total [3]. Moreover, the large technically-exploitable potential of 1400 GWonshore wind energy and 600 GW offshore wind energy has been estimated in China [4].
However, wind energy curtailment always occurs due to the inflexible electricity production ofCHP units. CHP units are widely used in the north of China and some European countries, suchas Germany and Denmark [5]. With a much higher efficiency in energy utilization compared withseparated generation of heat and power, it represents one of the promising technologies for a reductionin primary energy consumption and greenhouse gas emission. CHP is characterized by the coupledproduction of heat and power and operates with the “thermal load-following” strategy, in which theheat power produced by the plant is conditional by the users’ thermal demand [6], thus having aconstrained adjustment ability of electricity generation, which is a barrier to accommodate more windpower [7].
Improving the flexibility of CHP will significantly benefit for the wind power integration.Introducing EES to store the curtailed wind energy is a straightforward way [8–10]. Among the EES
Energies 2016, 9, 474; doi:10.3390/en9060474 www.mdpi.com/journal/energies

Energies 2016, 9, 474 2 of 17
technologies which are suitable for large-scale applications, conventional battery storage is efficientbut the investment would be very high. Pumped hydro is fit for large-scale applications but it isapplicable only in certain locations [11]. Nowadays, hydrogen storage is emerging as a promisingalternative due to high energy density, clean fuel, and relatively low capital cost [12,13]. Addinghydrogen storage to a CHP system could improve the accommodation of wind power, as well asprimary energy saving, since the wind energy curtailed in off-peak hours could be used to split waterinto hydrogen and oxygen. Hydrogen would be stored and then transformed to electrical energy,when necessary, by various ways.
Thermal energy storage (TES) is another attractive option for wind energy integration. Althoughthermal storage is not directly related with electrical energy production, introducing TES is anefficient solution to relieve the mismatch between heat/power demand and supply, by decouplingthe generation of electricity and heat [14]. The surplus thermal energy is stored during the operatingperiods for a later use when electrical demand is low, leading to a decrease in heat production ofCHP plants, along with a reduction in electricity production, as a result, wind power would be betterintegrated. Under the influence of real-time electricity pricing, a large number of TES units havebeen installed in European countries which have a large percentage of wind power [15]. For example,in Denmark, TES systems have been an important part of its 100% renewable energy system plan [16].
Many studies have been involved in the flexible operation of integrated CHP systems recently.In [17], heat pumps and thermal inertia of buildings and thermal comfort of end users are consideredto increase the wind power integration. In [18], electric boilers and heat storage tanks are compared interms of their performance in reducing wind curtailment and saving energy. [19] explores the energystorage capability of the district heating network to increase the flexibility of integrated CHP system.In [20], individual heat pumps, heat accumulation tanks and passive heat storage in construction havebeen investigated in terms of their potentials in increasing wind power utilization and improvingprimary energy saving. In [21], a CHP-based district heating system with TES is proposed to promotethe utilization of renewable energy over a long period of time.
However, all of these studies optimized the system on the heat supply side. The effect of improvingwind accommodation is limited when heat demand is low. The insufficient adjustments for increasingthe flexibility of the integrated CHP system will occur as heat demand is very high. In this paper,the integrated CHP system in which CHP units are coupled with EES and TES is investigated to exploreits capability to enhance the utilization of wind power. The flexibility of the system is improved onboth the heat supply side and electricity supply side.
This paper is organized as follows. In Section 2, the electrical energy storages, thermal energystorages, and CHP units in the integrated CHP system are modeled. In Section 3, the ICHPSD modelaimed at minimizing the total fuel cost and wind power curtailment is formulated. In Section 4, a casestudy with four scenarios is implemented to demonstrate the performance of the proposed method.Conclusions are presented in Section 5.
2. Integrated CHP System Model
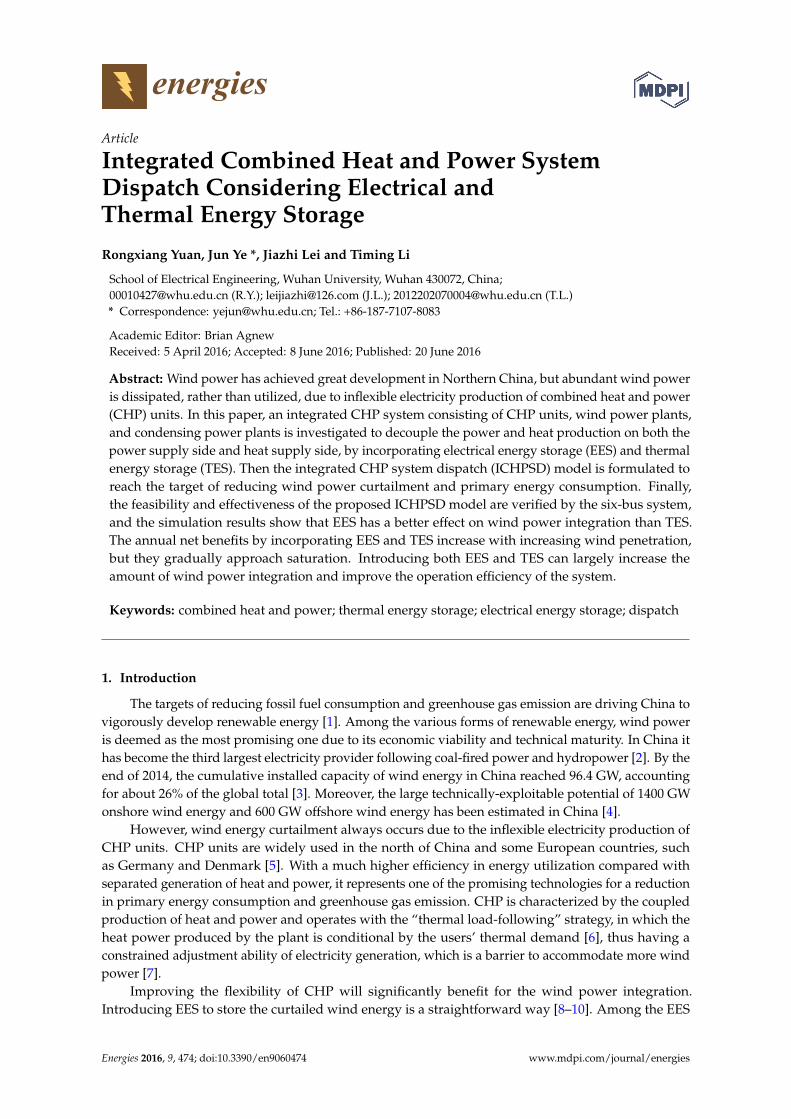
An integrated CHP system consisting of CHP units, wind power plants, condensing power plants,EES, and TES is considered. In this system, heat demand is satisfied by CHP units and TES units,while power demand is satisfied by CHP units, condensing power units, wind power units and EESunits, as shown in Figure 1. In this paper, the heat and power energy in the integrated CHP system areboth assumed to totally self-sufficient. Additionally, it should be pointed out that there may be severalheat regions whose heat demands are satisfied by different groups of CHP units and TES devices.
Energies 2016, 9, 474 3 of 17
Energies 2016, 9, 474 3 of 17
Figure 1. Energy flow in the integrated CHP system.
2.1. Electrical Energy Storage Model
2.1.1. Description of Hydrogen Storage System
The typical hydrogen storage system is composed of an electrolyzer, a compressor, a storage
tank, and a fuel cell, as shown in Figure 2. In the alkaline electrolyzer, water is decomposed into
hydrogen and oxygen by the power input. The water electrolysis takes place between the anode and
the cathode of the electrolyzer. The hydroxyl ions in the electrolyzer are transported to the anode
and are split into water, oxygen gas and electrons. At the same time, the ionized hydrogen ions are
attracted and transported to the cathode and then form hydrogen gas when combined with
external electrons.
Figure 2. Structure of hydrogen storage system.
Then hydrogen gas is compressed by the compressor and stored in the pressurized storage
tank. The fuel cell is used for re‐electrification of hydrogen. It is a device that, like batteries,
transforms chemical energy into electrical energy. The supplied hydrogen to the anode and oxygen
to the cathode is ionized to hydrogen ions and oxygen ions, respectively. They recombine and
produce electrical energy, as well as water and heat, which may be utilized [11].
During the charging process, with a supply of electrical energy to the electrolyzer, the water is
electrolyzed and the produced hydrogen gas is compressed into the storage tank. The electrical
energy is transformed to chemical energy and stored as hydrogen. During the discharging process,
hydrogen is oxidized in the fuel cell and produces electric current. The chemical energy is converted
to electrical energy and delivered to the power system when necessary [22].
2.1.2. Mathematical Model of Hydrogen Storage System
In this paper, a linear model for the charging/discharging model of hydrogen storage system is
proposed based on the model in [23,24]. Both the electrolyzer and compressor consume energy;
therefore, the charging rate of the storage system can be expressed as (1). Through the water
electrolysis, the hydrogen production rate in time step t is shown in Equation (2). The compression
power is defined as Equation (3) and discharging rate of the storage system as Equation (4).
Figure 1. Energy flow in the integrated CHP system.
2.1. Electrical Energy Storage Model
2.1.1. Description of Hydrogen Storage System
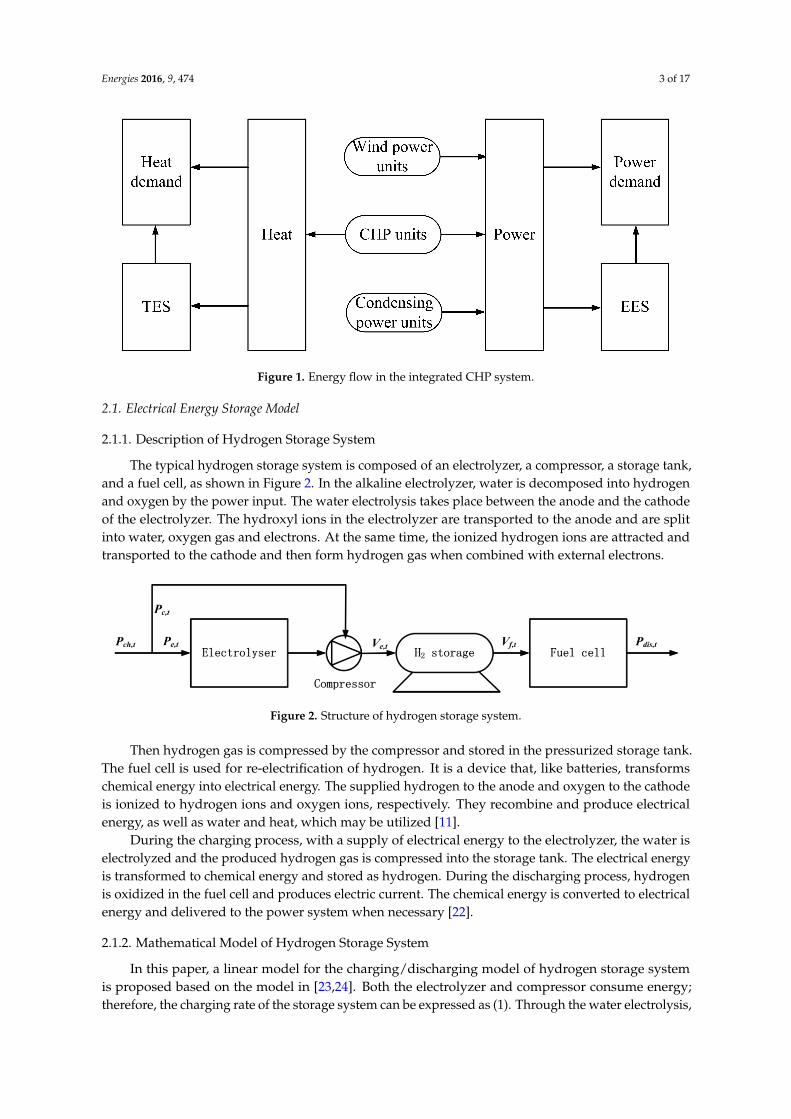
The typical hydrogen storage system is composed of an electrolyzer, a compressor, a storage tank,and a fuel cell, as shown in Figure 2. In the alkaline electrolyzer, water is decomposed into hydrogenand oxygen by the power input. The water electrolysis takes place between the anode and the cathodeof the electrolyzer. The hydroxyl ions in the electrolyzer are transported to the anode and are splitinto water, oxygen gas and electrons. At the same time, the ionized hydrogen ions are attracted andtransported to the cathode and then form hydrogen gas when combined with external electrons.
Energies 2016, 9, 474 3 of 17
Figure 1. Energy flow in the integrated CHP system.
2.1. Electrical Energy Storage Model
2.1.1. Description of Hydrogen Storage System
The typical hydrogen storage system is composed of an electrolyzer, a compressor, a storage
tank, and a fuel cell, as shown in Figure 2. In the alkaline electrolyzer, water is decomposed into
hydrogen and oxygen by the power input. The water electrolysis takes place between the anode and
the cathode of the electrolyzer. The hydroxyl ions in the electrolyzer are transported to the anode
and are split into water, oxygen gas and electrons. At the same time, the ionized hydrogen ions are
attracted and transported to the cathode and then form hydrogen gas when combined with
external electrons.
Figure 2. Structure of hydrogen storage system.
Then hydrogen gas is compressed by the compressor and stored in the pressurized storage
tank. The fuel cell is used for re‐electrification of hydrogen. It is a device that, like batteries,
transforms chemical energy into electrical energy. The supplied hydrogen to the anode and oxygen
to the cathode is ionized to hydrogen ions and oxygen ions, respectively. They recombine and
produce electrical energy, as well as water and heat, which may be utilized [11].
During the charging process, with a supply of electrical energy to the electrolyzer, the water is
electrolyzed and the produced hydrogen gas is compressed into the storage tank. The electrical
energy is transformed to chemical energy and stored as hydrogen. During the discharging process,
hydrogen is oxidized in the fuel cell and produces electric current. The chemical energy is converted
to electrical energy and delivered to the power system when necessary [22].
2.1.2. Mathematical Model of Hydrogen Storage System
In this paper, a linear model for the charging/discharging model of hydrogen storage system is
proposed based on the model in [23,24]. Both the electrolyzer and compressor consume energy;
therefore, the charging rate of the storage system can be expressed as (1). Through the water
electrolysis, the hydrogen production rate in time step t is shown in Equation (2). The compression
power is defined as Equation (3) and discharging rate of the storage system as Equation (4).
Figure 2. Structure of hydrogen storage system.
Then hydrogen gas is compressed by the compressor and stored in the pressurized storage tank.The fuel cell is used for re-electrification of hydrogen. It is a device that, like batteries, transformschemical energy into electrical energy. The supplied hydrogen to the anode and oxygen to the cathodeis ionized to hydrogen ions and oxygen ions, respectively. They recombine and produce electricalenergy, as well as water and heat, which may be utilized [11].
During the charging process, with a supply of electrical energy to the electrolyzer, the water iselectrolyzed and the produced hydrogen gas is compressed into the storage tank. The electrical energyis transformed to chemical energy and stored as hydrogen. During the discharging process, hydrogenis oxidized in the fuel cell and produces electric current. The chemical energy is converted to electricalenergy and delivered to the power system when necessary [22].
2.1.2. Mathematical Model of Hydrogen Storage System
In this paper, a linear model for the charging/discharging model of hydrogen storage systemis proposed based on the model in [23,24]. Both the electrolyzer and compressor consume energy;therefore, the charging rate of the storage system can be expressed as (1). Through the water electrolysis,
Energies 2016, 9, 474 4 of 17
the hydrogen production rate in time step t is shown in Equation (2). The compression power is definedas Equation (3) and discharging rate of the storage system as Equation (4).
Pich,t “ Pi
e,t ` Pic,t (1)
Vie,t “ η
ie ¨
Pie,t
HHV(2)
Pic,t “ SECi
c ¨Vie,t (3)
Pidis,t “ η
if ¨V
if ,t ¨HHV (4)
where Pich,t, Pi
dis,t, Pie,t, Pi
c,t are the charging and discharging rate of the i-th hydrogen storage system,the power input of electrolyzer and the power consumption of compressor, respectively. Vi
e,t and Vif ,t
are the hydrogen production rate of the electrolyzer and the hydrogen consumption rate of the fuelcell. ηi
e, ηif are the overall efficiency of the electrolyzer and fuel cell, respectively. HHV is the higher
heating value of hydrogen. SECic is the specific energy consumption of the compressor.
The relationship between one state of the storage tank and its previous is expressed as:
Sit`1 “ Si
t `Vie,t ´Vi
f ,t (5)
where Sit is the storage level of the hydrogen storage tank at time step t. Summarizing the
Equations (1)–(5), we can deduce the following expression:
Sit`1 “ Si
t ` ηie ¨ P
ich,t{pHHV` SECi
c ¨ ηieq ´ Pi
dis,t{pηif ¨HHVq (6)
Constraints on EES are listed as follows:The storage level in energy storage is constrained to be not more than the capacity of
energy storage:
0 ď Sit ď Si
c (7)
In Equation (7), Sic is the capacity of i-th hydrogen storage tank.
Energy storage charging and discharging rates should be not more than its maximum chargingand discharging rates:
0 ď Pich,t ď Pi
ch,max (8)
0 ď Pidis,t ď Pi
dis,max (9)
where Pich,max and Pi
dis,max represent the maximum charging and discharging rate of i-th electricalenergy storage, respectively.
Energy storage should not be allowed to be charged and discharged at the same time step:
Pich,t ¨ P
idis,t “ 0 (10)
Constraint on energy balance in one energy cycle: the storage level at the finish time step isassumed to be equal to that at the initial time step in one operating cycle:
Si0 “ Si
T (11)
where Si0 and Si
0 are the storage level of hydrogen tank at the initial and finish time step, respectively.
2.2. Thermal Energy Storage Model
Among the various thermal storage styles, heat accumulator is a promising option due to low costand environmental friendliness [25]. This accumulator utilizes the water as the heat storage medium,storing and releasing the heat energy based on the principle that the water with different temperatureis stratified into several layers [18]. A small part of the heat would be lost due to energy exchange with

Energies 2016, 9, 474 5 of 17
external environment [26]. Thus, this kind of loss should be taken into consideration and is assumedto be proportional the previously stored heat [21]. Additionally, the heat charging and dischargingefficiency are also taken into consideration. Then the stored heat energy level at time step t can beexpressed by:
Hit “ η
ith,st ¨ Hi
t´1 `Qich,t ¨ η
ith,ch ´Qi
dis,t{ηith,dis (12)
where Hit and Hi
t´1 are the stored heat level of accumulator at time step t and t´1, respectively. Qich,t
and Qidis,t are the heat charging and discharging rate of heat accumulator at time step t, respectively.
ηith,st, η
ith,ch, ηi
th,dis are the storage efficiency, heat charging, and discharging efficiency of the thermalstorage, respectively.
The constraint on capacity of the TES can be expressed as:
Hit ď Hi
c (13)
where Hic is the capacity of heat storage accumulator.
The constraint on maximum charging and discharging rate of TES:
0 ď Qich,t ď Qi
ch,max (14)
0 ď Qidis,t ď Qi
dis,max (15)
where Qich,max and Qi
dis,max represent the maximum heat charging and discharging power, respectively.The constraint on charging and discharging status of TES:
Qich,t ¨Q
idis,t “ 0 (16)
The stored heat level at the end of last time step is assumed to be equal to that at the initial time:
Hi0 “ Hi
T (17)
where Hi0 and Hi
T are the stored heat level of heat storage tank at the initial time and lasttime, respectively.
2.3. CHP Unit Model
2.3.1. The Heat-Power Feasible Operation Region of CHP Unit
For the back-pressure unit, its power output is proportional to the heat output. In terms ofextraction condensing unit, although its production of electricity and heat are also coupled, it has amore flexible heat-power generation characteristic compared with back-pressure turbine. A typicalheat-power feasible operation region [27] for an extraction condensing CHP unit is shown in Figure 3.The power and heat outputs are constrained in the quadrilateral ABCD. PCHP,max and PCHP,minrepresent the maximum and minimum power output when the CHP acts as a power-only unit,respectively. QCHP,max represents the maximum heat output of CHP.
The heat production constraint for CHP plant is defined as:
0 ď QiCHP,t ď Qi
CHP,max (18)
where QiCHP,t, Qi
CHP,max are the heat output at time step t and the maximum heating rate of i-th CHPplant. According to Figure 3, the power production constraints for CHP plant can be defined asEquations (19)–(21):
PiCHP,t ě Pi
CHP,min ´ kBC ¨QiCHP,t (19)
PiCHP,t ě Ki ` kCD ¨Qi
CHP,t (20)
PiCHP,t ď Pi
CHP,max ´ kAD ¨QiCHP,t (21)

Energies 2016, 9, 474 6 of 17
where PiCHP,t is the power output at time step t of i-th CHP plant; Ki is a constant. kBC, kCD, and kAD
are the slopes of Line BC, CD, and AD, respectively.Energies 2016, 9, 474 6 of 17
Figure 3. The heat‐power feasible operation region of a CHP unit.
The heat production constraint for CHP plant is defined as:
, ,max0 i iCHP t CHPQ Q (18)
where ,iCHP tQ , ,max
iCHPQ are the heat output at time step t and the maximum heating rate of i‐th CHP
plant. According to Figure 3, the power production constraints for CHP plant can be defined as
Equations (19)–(21):
, ,min ,i i iCHP t CHP BC CHP tP P k Q (19)
, ,i i iCHP t CD CHP tP K k Q (20)
, ,max ,i i iCHP t CHP AD CHP tP P k Q (21)
where ,iCHP tP is the power output at time step t of i‐th CHP plant;
iK is a constant. kBC, kCD , and kAD
are the slopes of Line BC, CD, and AD, respectively.
The total hourly fuel cost of a CHP unit can be modeled as a quadratic function of electrical and
thermal energy output, ,iCHP tP and ,
iCHP tQ , respectively [28]:
2 2, , , , , , ,α β δ ε γ μi i i i i i i i i i i i i
CHP t CHP t CHP t CHP t CHP t CHP t CHP tC P P Q Q P Q (22)
where ,iCHP tC is the fuel cost in time step t of i‐th CHP unit; αi ,βi ,δi , εi , γi , and μi are the cost
coefficients of i‐th CHP unit.
2.3.2. The Heat‐Power Feasible Operation Region of CHP Unit when Introducing EES and TES
The heat‐power feasible operation region will expand when introducing EES and TES. The
expanded operation region of a representative 250 MW CHP plant when introducing a 30 MW EES
and 30 MW TES is shown in Figure 4. The black region is the original heat‐power feasible operation
region while the grey region is the expanded region.
When introducing EES to the CHP unit, the equivalent feasible operation region extends
vertically. The lower left and lower right boundaries will move downwards when EES is in the
charging state, while the upper boundary will move upwards when EES is in the discharging state,
as shown in Figure 4c. As a result, the maximum power output could increase 30 MW while the
minimum power output could decrease 30 MW at any given thermal output.
Figure 4b shows the equivalent feasible operation region would expands horizontally. The
lower left boundary will move leftwards when TES is charged, while the lower right and upper
boundaries will move rightwards when the TES is discharged. Adding both EES and TES to the CHP
unit will significantly extend the equivalent heat‐power feasible operation region, as shown in
Figure 4d. It will remarkably increase the flexibility of the CHP plant, leaving large room for wind
power integration.
Figure 3. The heat-power feasible operation region of a CHP unit.
The total hourly fuel cost of a CHP unit can be modeled as a quadratic function of electrical andthermal energy output, Pi
CHP,t and QiCHP,t, respectively [28]:
CiCHP,t “ α
i `βi ¨ PiCHP,t ` δ
i ¨ PiCHP,t
2` εi ¨Qi
CHP,t ` γi ¨Qi
CHP,t2` µi ¨ Pi
CHP,t ¨QiCHP,t (22)
where CiCHP,t is the fuel cost in time step t of i-th CHP unit; αi, βi, δi, εi, γi, and µi are the cost
coefficients of i-th CHP unit.
2.3.2. The Heat-Power Feasible Operation Region of CHP Unit when Introducing EES and TES
The heat-power feasible operation region will expand when introducing EES and TES.The expanded operation region of a representative 250 MW CHP plant when introducing a 30 MW EESand 30 MW TES is shown in Figure 4. The black region is the original heat-power feasible operationregion while the grey region is the expanded region.
When introducing EES to the CHP unit, the equivalent feasible operation region extends vertically.The lower left and lower right boundaries will move downwards when EES is in the charging state,while the upper boundary will move upwards when EES is in the discharging state, as shown inFigure 4c. As a result, the maximum power output could increase 30 MW while the minimum poweroutput could decrease 30 MW at any given thermal output.
Figure 4b shows the equivalent feasible operation region would expands horizontally. The lowerleft boundary will move leftwards when TES is charged, while the lower right and upper boundarieswill move rightwards when the TES is discharged. Adding both EES and TES to the CHP unit willsignificantly extend the equivalent heat-power feasible operation region, as shown in Figure 4d. It willremarkably increase the flexibility of the CHP plant, leaving large room for wind power integration.

Energies 2016, 9, 474 7 of 17Energies 2016, 9, 474 7 of 17
Figure 4. The equivalent heat‐power feasible operation region of a CHP unit (a) without TES or EES;
(b) when coupled with TES; (c) when coupled with EES; and (d) when coupled with both TES and EES.
3. Integrated CHP System Dispatch (ICHPSD) Model
In this section, the ICHPSD model involving wind farms is formulated, where wind farms are
regarded as power units having deterministic outputs. In the optimization model under investigation,
the objective is to minimize the total fuel cost and wind power curtailment in an operating period,
while meeting the constraints in terms of energy balance and the input/output characteristics of the
energy sources. The unit commitment is assumed to be determined the day before.
3.1. Decision Variables
In the dispatch model, the electrical decision variables include power outputs of CHP units
( ,iCHP tP ), condensing power units ( ,
icon tP ), wind power plants ( ,
iw tP ), and EES devices ( ,
ich tP or ,
idis tP )
at time step t. The heat decision variables comprise heat outputs of CHP units ( ,iCHP tQ ) and TES units
( ,ich tQ or ,
idis tQ ).
3.2. The Objective Function of the Dispatch Model
The objective function, considering the total fuel cost of CHP units and condensing power units
as well as a penalty cost on wind power curtailment, is formulated as follow:
, , ,minCHP con w
i i itotal CHP t con t w t
t T i J i J i J
C C C C
(23)
where Ctotal is the total fuel cost of the CHP system, ,iCHP tC , ,
icon tC , ,
iw tC are the fuel cost of i‐th CHP
plant, fuel cost of i‐th condensing power plant, and penalty cost on curtailment of i‐th wind power
plant in time step t, respectively. T is length of the operating horizon; JCHP, Jcon, and Jw are the sets of
Figure 4. The equivalent heat-power feasible operation region of a CHP unit (a) without TES or EES;(b) when coupled with TES; (c) when coupled with EES; and (d) when coupled with both TES and EES.
3. Integrated CHP System Dispatch (ICHPSD) Model
In this section, the ICHPSD model involving wind farms is formulated, where wind farms areregarded as power units having deterministic outputs. In the optimization model under investigation,the objective is to minimize the total fuel cost and wind power curtailment in an operating period,while meeting the constraints in terms of energy balance and the input/output characteristics of theenergy sources. The unit commitment is assumed to be determined the day before.
3.1. Decision Variables
In the dispatch model, the electrical decision variables include power outputs of CHP units(Pi
CHP,t), condensing power units (Picon,t), wind power plants (Pi
w,t), and EES devices (Pich,t or Pi
dis,t) attime step t. The heat decision variables comprise heat outputs of CHP units (Qi
CHP,t) and TES units(Qi
ch,t or Qidis,t).
3.2. The Objective Function of the Dispatch Model
The objective function, considering the total fuel cost of CHP units and condensing power unitsas well as a penalty cost on wind power curtailment, is formulated as follow:
minCtotal “ÿ
tPT
$
&
%
ÿ
iPJCHP
CiCHP,t `
ÿ
iPJcon
Cicon,t `
ÿ
iPJw
Ciw,t
,
.
-
(23)
where Ctotal is the total fuel cost of the CHP system, CiCHP,t, Ci
con,t, Ciw,t are the fuel cost of i-th CHP
plant, fuel cost of i-th condensing power plant, and penalty cost on curtailment of i-th wind powerplant in time step t, respectively. T is length of the operating horizon; JCHP, Jcon, and Jw are the setsof CHP plants, condensing power plants and wind power plants, respectively. Ci
CHP,t is expressed inEquation (5) and the hourly fuel cost of a condensing power unit can be expressed as:
Cicon,t “ α
i `βi ¨ Picon,t ` δ
i ¨ Picon,t
2@t P T, i P Jcon (24)

Energies 2016, 9, 474 8 of 17
where αi, βi, and δi are the cost coefficients of i-th condensing power unit; Picon,t is the power output of
i-th condensing power unit at time step t.The penalty cost on curtailment of i-th wind power plant can be written as:
Ciw,t “ ϕ ¨ pP
iwav,t ´ Pi
w,tq @t P T, i P Jw (25)
where ϕ is the penalty cost coefficient, Piwav,t, Pi
w,t are available wind power and actual power outputof i-th wind power plant at time step t, respectively.
3.3. Constraints for Energy Balances
In this paper, we assume that both electrical and thermal energy are locally consumed. Powerdemand is satisfied by CHP units, condensing power units, wind power units and EESs, while thermaldemand is satisfied only by CHP units and thermal energy storages. Thus, the power and thermalbalance can be expressed in Equations (25) and (26).
ř
iPJCHP
PiCHP,t `
ř
iPJcon
Picon,t `
ř
iPJw
Piw,t ´
ř
iPJEES
Pich,t `
ř
iPJEES
ηiel,dis ¨ P
idis,t “ Pd,t @t P T (26)
ř
iPJCHPXUCHP,j
QiCHP,t ´
ř
iPJTESXUTES,j
Qich,t `
ř
iPJTESXUTES,j
ηith,dis ¨Q
idis,t “ Qd,t,j @t P T (27)
where Pd,t is the power demand in a local area at time step t. Qd,t,j is the thermal demand at time stept in j-th area. UCHP,j, UTES,j are the sets of CHP units and TES units which provide heat energy forj-tharea, respectively.
3.4. Constraints for System Control and Operation
(1) Constraints for thermal and electrical energy output of CHP plants are expressed inEquations (17)–(20).
(2) Constraints for power ramping rate of CHP plants are expressed in Equations (28) and (29).(3) Constraints for power output of condensing power units are expressed in Equations (30).(4) Constraints for power ramping rate of condensing power units are expressed in
Equations (31) and (32).(5) Constraint for power output of wind power in Equation (33) which means the power output
should be smaller than the available wind power.
PiCHP,t ´ Pi
CHP,t´1 ď PiCHP,up @t P T, i P JCHP (28)
PiCHP,t´1 ´ Pi
CHP,t ď PiCHP,down @t P T, i P JCHP (29)
Picon,min ď Pi
con,t ď Picon,max @t P T, i P Jcon (30)
Picon,t ´ Pi
con,t´1 ď Picon,up @t P T, i P Jcon (31)
Picon,t´1 ´ Pi
con,t ď Picon,down @t P T, i P Jcon (32)
Piw,t ď Pi
wav,t @t P T, i P Jw (33)
where PiCHP,up, Pi
CHP,down, Picon,up, Pi
con,down are the ramp-up and ramp-down rates of i-th CHPunit and condensing power unit, respectively.
(6) Constraints for EES device are described in Equations (6)–(11).(7) Constraints for TES device are described in Equations (12)–(17).
4. Case Study
4.1. System Description
The integrated CHP system studied in this paper, aimed at satisfying the electrical and thermalenergy demands of a special area, consists of: (i) one extraction condensing turbine CHP unit; (ii) two

Energies 2016, 9, 474 9 of 17
condensing power plants (G1 and G2); (iii) an EES device; (iv) a TES device; and (v) a wind powerplant. The six-bus integrated CHP system [29] studied in this paper is shown in Figure 5.
To demonstrate the effectiveness and benefits of the proposed model, four different scenarios aretaken into account, as shown in Table 1, where the cross means the corresponding EES or TES device isnot included. In scenario 1, neither the EES device nor the TES device is introduced to the integratedCHP system. In scenario 2 and 3, a 30 MW EES device and a 30 MW TES device, respectively, are addedto the system. In scenario 4, both the 30 MW EES and 30 MW TES are introduced. The storage capacityof EES and TES are both 300 MW.
The simulations were conducted on a computer with two Intel (R) Core (TM) i5 processorsrunning at 2.50 GHz with 4.0 GB of memory. The dispatch model was coded in MATLAB R2014a(manufactured by the MathWorks Inc. in Natick, MA, USA) with the help of YALMIP (a MATLABtoolbox for rapid prototyping of optimization problems) and solved by the CPLEX solver(an optimizermanufactured by IBM WebSphere ILOG).
Energies 2016, 9, 474 9 of 17
(6) Constraints for EES device are described in Equations (6)–(11).
(7) Constraints for TES device are described in Equations (12)–(17).
4. Case Study
4.1. System Description
The integrated CHP system studied in this paper, aimed at satisfying the electrical and thermal
energy demands of a special area, consists of: (i) one extraction condensing turbine CHP unit; (ii) two
condensing power plants (G1 and G2); (iii) an EES device; (iv) a TES device; and (v) a wind power
plant. The six‐bus integrated CHP system [29] studied in this paper is shown in Figure 5.
To demonstrate the effectiveness and benefits of the proposed model, four different scenarios
are taken into account, as shown in Table 1, where the cross means the corresponding EES or TES
device is not included. In scenario 1, neither the EES device nor the TES device is introduced to the
integrated CHP system. In scenario 2 and 3, a 30 MW EES device and a 30 MW TES device,
respectively, are added to the system. In scenario 4, both the 30 MW EES and 30 MW TES are
introduced. The storage capacity of EES and TES are both 300 MW.
The simulations were conducted on a computer with two Intel (R) Core (TM) i5 processors
running at 2.50 GHz with 4.0 GB of memory. The dispatch model was coded in MATLAB R2014a
(manufactured by the MathWorks Inc. in Natick, MA, USA) with the help of YALMIP (a MATLAB
toolbox for rapid prototyping of optimization problems) and solved by the CPLEX solver(an
optimizer manufactured by IBM WebSphere ILOG).
Figure 5. The six‐bus integrated CHP system.
Table 1. Components of the integrated CHP system scenarios.
Scenario Condensing Power Units
CHP Unit Wind Power Unit EES TES G1 G2
1 • • • • × ×
2 • • • • • ×
3 • • • • × •
4 • • • • • •
4.2. Model Input
Main input data of the integrated CHP system are: (i) the original parameters of the CHP plant
and condensing power plants; (ii) hourly thermal and electrical demands; (iii) the input data of
Figure 5. The six-bus integrated CHP system.
Table 1. Components of the integrated CHP system scenarios.
ScenarioCondensing Power Units
CHP Unit Wind Power Unit EES TESG1 G2
1 ‚ ‚ ‚ ‚ ˆ̂̂ ˆ̂̂
2 ‚ ‚ ‚ ‚ ‚ ˆ̂̂
3 ‚ ‚ ‚ ‚ ˆ̂̂ ‚
4 ‚ ‚ ‚ ‚ ‚ ‚
4.2. Model Input
Main input data of the integrated CHP system are: (i) the original parameters of the CHP plantand condensing power plants; (ii) hourly thermal and electrical demands; (iii) the input data ofelectrical and thermal energy storages; and (iv) the forecasted output values of wind power at 24 timepoints. A 24 h operation has been investigated by selecting a typical daily electrical and heat demandprofile in the winter.
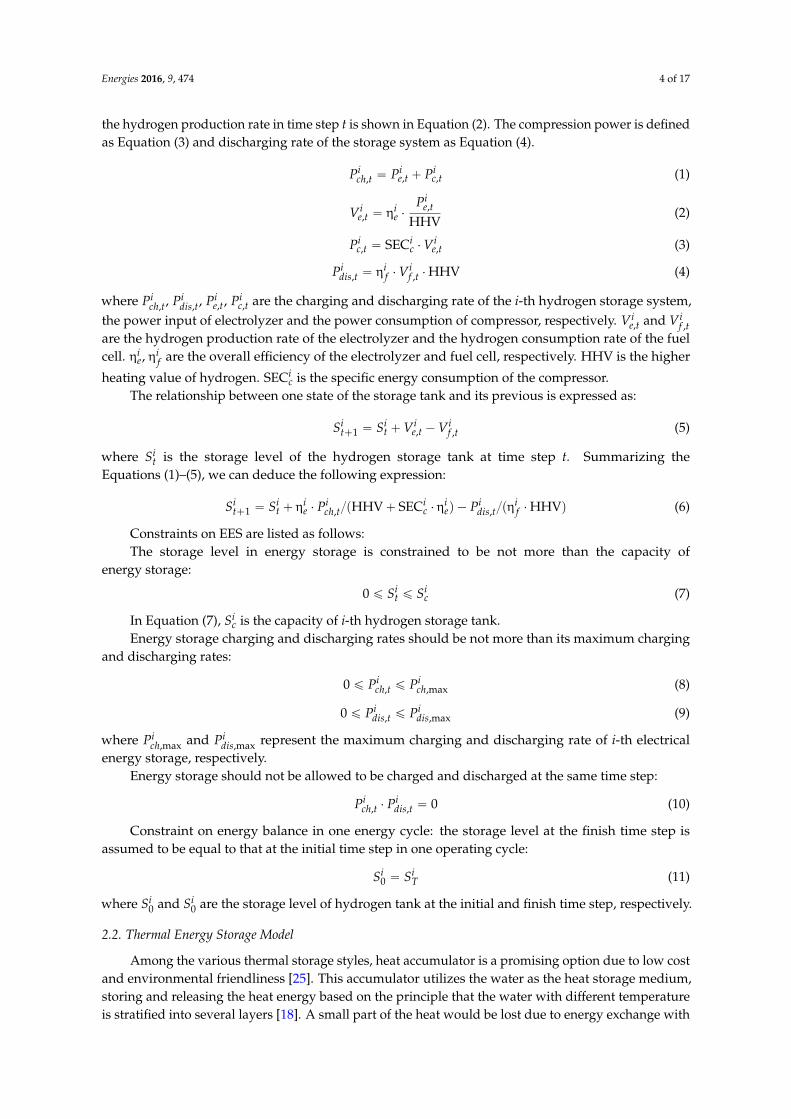
Profiles of electrical and heat demand, as well as forecasted wind power output, are shown inFigure 6. As can be seen from Figure 6a, the electrical demand and wind power output have theopposite peaks, which is in line with the situation in the real power system. The heat demand data isbased on the hourly thermal data in a winter day [30]. The heat load in the morning and evening is
Energies 2016, 9, 474 10 of 17
higher than that in any other time, which is consistent with the living habits of residents. The CHP unitis the cheapest, while G2 is the most expensive one among the three thermal units. The simulations aredesigned for hourly generation dispatch over 24-h period.
Energies 2016, 9, 474 10 of 17
electrical and thermal energy storages; and (iv) the forecasted output values of wind power at 24
time points. A 24 h operation has been investigated by selecting a typical daily electrical and heat
demand profile in the winter.
Profiles of electrical and heat demand, as well as forecasted wind power output, are shown in
Figure 6. As can be seen from Figure 6a, the electrical demand and wind power output have the
opposite peaks, which is in line with the situation in the real power system. The heat demand data is
based on the hourly thermal data in a winter day [30]. The heat load in the morning and evening is
higher than that in any other time, which is consistent with the living habits of residents. The CHP
unit is the cheapest, while G2 is the most expensive one among the three thermal units. The
simulations are designed for hourly generation dispatch over 24‐h period.
Figure 6. Profiles of (a) electrical demand, forecasted wind power output and (b) heat demand.
4.3. Results
4.3.1. The Effect on Reducing Wind Curtailment
The hourly power outputs of each generation within 24 h in the four scenarios are shown in
Figure 7. It can be seen from Figure 7a that wind power is curtailed between 1 o’clock and 7 o’clock.
The reason lies in that the thermal demand is high and, thus, the flexibility of CHP is low within
these hours, leading to limited minimal power output for CHP unit. At the same time, the power
demand is low, which hinders the wind power accommodation. While in other periods, the thermal
demand is lower while the electrical demand is relatively higher and, thus, the power output of CHP
has more adjustment space and wind power can be entirely accommodated.
In Scenario 1, a large amount of wind power is abandoned in off‐peak hours. In Scenario 2, in
off‐peak hours thermal energy storage acts as a heat output source, decreasing the heat and power
Figure 6. Profiles of (a) electrical demand, forecasted wind power output and (b) heat demand.
4.3. Results
4.3.1. The Effect on Reducing Wind Curtailment
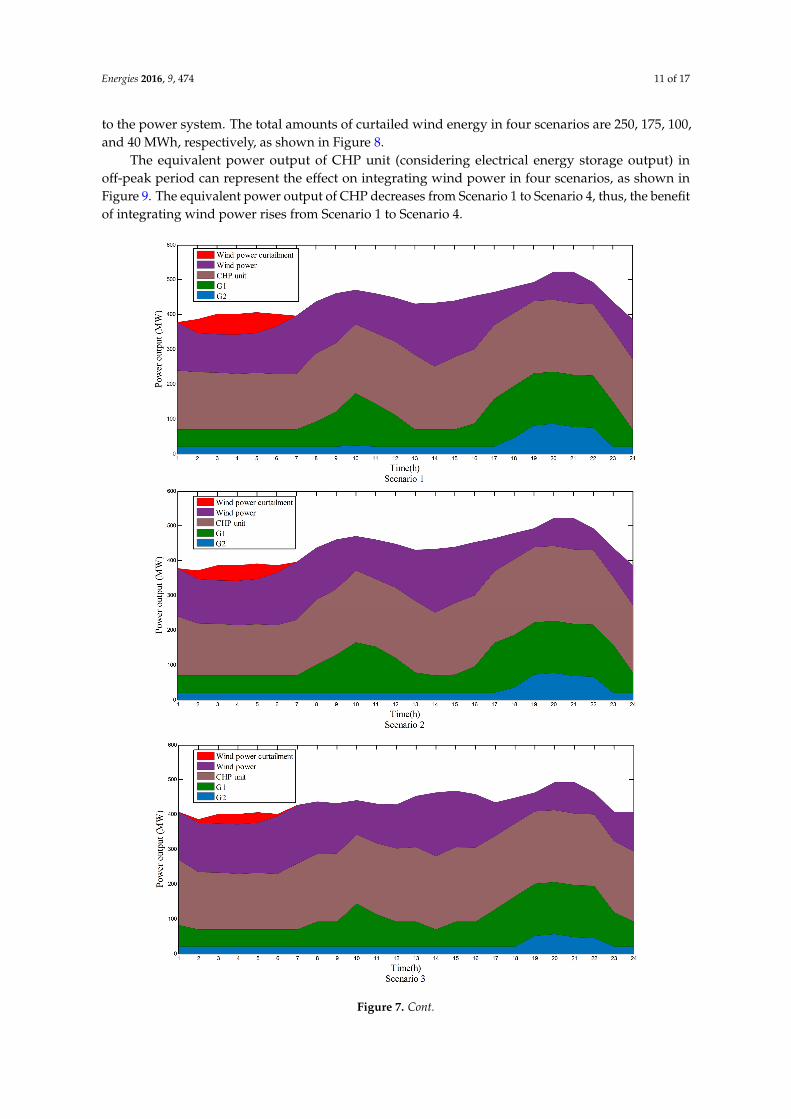
The hourly power outputs of each generation within 24 h in the four scenarios are shown inFigure 7. It can be seen from Figure 7a that wind power is curtailed between 1 o’clock and 7 o’clock.The reason lies in that the thermal demand is high and, thus, the flexibility of CHP is low within thesehours, leading to limited minimal power output for CHP unit. At the same time, the power demand islow, which hinders the wind power accommodation. While in other periods, the thermal demand islower while the electrical demand is relatively higher and, thus, the power output of CHP has moreadjustment space and wind power can be entirely accommodated.
In Scenario 1, a large amount of wind power is abandoned in off-peak hours. In Scenario 2,in off-peak hours thermal energy storage acts as a heat output source, decreasing the heat and poweroutput of CHP unit, thus promoting the wind power integration. In Scenario 3, the surplus windenergy is stored in the electrical energy storage. Comparing Figure 7b,c, the effect on reducing windcurtailment in Scenario 3 is more remarkable than that in scenario 2. In Scenario 4, when introducingboth the thermal and electrical energy storage, a large proportion of wind energy would be integrated
Energies 2016, 9, 474 11 of 17
to the power system. The total amounts of curtailed wind energy in four scenarios are 250, 175, 100,and 40 MWh, respectively, as shown in Figure 8.
The equivalent power output of CHP unit (considering electrical energy storage output) inoff-peak period can represent the effect on integrating wind power in four scenarios, as shown inFigure 9. The equivalent power output of CHP decreases from Scenario 1 to Scenario 4, thus, the benefitof integrating wind power rises from Scenario 1 to Scenario 4.
Energies 2016, 9, 474 11 of 17
output of CHP unit, thus promoting the wind power integration. In Scenario 3, the surplus wind
energy is stored in the electrical energy storage. Comparing Figure 7b,c, the effect on reducing wind
curtailment in Scenario 3 is more remarkable than that in scenario 2. In Scenario 4, when introducing
both the thermal and electrical energy storage, a large proportion of wind energy would be
integrated to the power system. The total amounts of curtailed wind energy in four scenarios are
250, 175, 100, and 40 MWh, respectively, as shown in Figure 8.
The equivalent power output of CHP unit (considering electrical energy storage output) in
off‐peak period can represent the effect on integrating wind power in four scenarios, as shown in
Figure 9. The equivalent power output of CHP decreases from Scenario 1 to Scenario 4, thus, the
benefit of integrating wind power rises from Scenario 1 to Scenario 4.
Figure 7. Cont.

Energies 2016, 9, 474 12 of 17Energies 2016, 9, 474 12 of 17
Figure 7. The power outputs of each generation.
Figure 8. The total amounts of curtailed wind energy within 24 h in four scenarios.
Figure 9. The equivalent power output of CHP unit in off‐peak period.
4.3.2. The Effect on Reducing Operation Cost
The total operation costs from Scenario 1 to Scenario 4 are $196,300, $194,900, $191,100, and
$190,000, respectively. Therefore, the economic margins in Scenario 2 and Scenario 3, compared with
Scenario 1, are $1,400 and $5,200, respectively. Previous study has demonstrated wind integration
margins in Scenario 2 and Scenario 3 are 75 and 150 MWh, respectively. Thus, integrating per MWh
Figure 7. The power outputs of each generation.
Energies 2016, 9, 474 12 of 17
Figure 7. The power outputs of each generation.
Figure 8. The total amounts of curtailed wind energy within 24 h in four scenarios.
Figure 9. The equivalent power output of CHP unit in off‐peak period.
4.3.2. The Effect on Reducing Operation Cost
The total operation costs from Scenario 1 to Scenario 4 are $196,300, $194,900, $191,100, and
$190,000, respectively. Therefore, the economic margins in Scenario 2 and Scenario 3, compared with
Scenario 1, are $1,400 and $5,200, respectively. Previous study has demonstrated wind integration
margins in Scenario 2 and Scenario 3 are 75 and 150 MWh, respectively. Thus, integrating per MWh
Figure 8. The total amounts of curtailed wind energy within 24 h in four scenarios.
Energies 2016, 9, 474 12 of 17
Figure 7. The power outputs of each generation.
Figure 8. The total amounts of curtailed wind energy within 24 h in four scenarios.
Figure 9. The equivalent power output of CHP unit in off‐peak period.
4.3.2. The Effect on Reducing Operation Cost
The total operation costs from Scenario 1 to Scenario 4 are $196,300, $194,900, $191,100, and
$190,000, respectively. Therefore, the economic margins in Scenario 2 and Scenario 3, compared with
Scenario 1, are $1,400 and $5,200, respectively. Previous study has demonstrated wind integration
margins in Scenario 2 and Scenario 3 are 75 and 150 MWh, respectively. Thus, integrating per MWh
Figure 9. The equivalent power output of CHP unit in off-peak period.
Energies 2016, 9, 474 13 of 17
4.3.2. The Effect on Reducing Operation Cost
The total operation costs from Scenario 1 to Scenario 4 are $196,300, $194,900, $191,100,and $190,000, respectively. Therefore, the economic margins in Scenario 2 and Scenario 3, comparedwith Scenario 1, are $1,400 and $5,200, respectively. Previous study has demonstrated wind integrationmargins in Scenario 2 and Scenario 3 are 75 and 150 MWh, respectively. Thus, integrating per MWhwind power can reduce the cost of $18.7 and $34.7 when introducing TES or EES, respectively. Addingboth TES and EES will gain the least operating cost among the four scenarios.
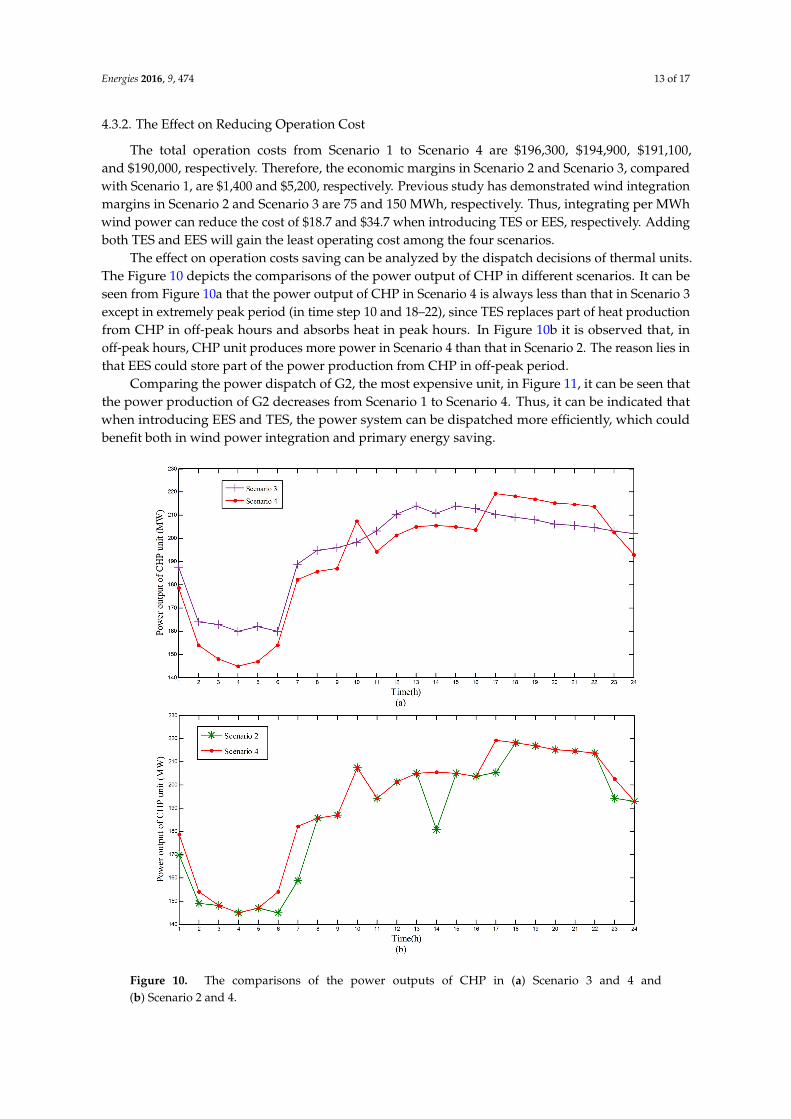
The effect on operation costs saving can be analyzed by the dispatch decisions of thermal units.The Figure 10 depicts the comparisons of the power output of CHP in different scenarios. It can beseen from Figure 10a that the power output of CHP in Scenario 4 is always less than that in Scenario 3except in extremely peak period (in time step 10 and 18–22), since TES replaces part of heat productionfrom CHP in off-peak hours and absorbs heat in peak hours. In Figure 10b it is observed that, inoff-peak hours, CHP unit produces more power in Scenario 4 than that in Scenario 2. The reason lies inthat EES could store part of the power production from CHP in off-peak period.
Comparing the power dispatch of G2, the most expensive unit, in Figure 11, it can be seen thatthe power production of G2 decreases from Scenario 1 to Scenario 4. Thus, it can be indicated thatwhen introducing EES and TES, the power system can be dispatched more efficiently, which couldbenefit both in wind power integration and primary energy saving.
Energies 2016, 9, 474 13 of 17
wind power can reduce the cost of $18.7 and $34.7 when introducing TES or EES, respectively.
Adding both TES and EES will gain the least operating cost among the four scenarios.
The effect on operation costs saving can be analyzed by the dispatch decisions of thermal units.
The Figure 10 depicts the comparisons of the power output of CHP in different scenarios. It can be
seen from Figure 10a that the power output of CHP in Scenario 4 is always less than that in Scenario
3 except in extremely peak period (in time step 10 and 18–22), since TES replaces part of heat
production from CHP in off‐peak hours and absorbs heat in peak hours. In Figure 10b it is observed
that, in off‐peak hours, CHP unit produces more power in Scenario 4 than that in Scenario 2. The
reason lies in that EES could store part of the power production from CHP in off‐peak period.
Comparing the power dispatch of G2, the most expensive unit, in Figure 11, it can be seen that
the power production of G2 decreases from Scenario 1 to Scenario 4. Thus, it can be indicated that
when introducing EES and TES, the power system can be dispatched more efficiently, which could
benefit both in wind power integration and primary energy saving.
Figure 10. The comparisons of the power outputs of CHP in (a) Scenario 3 and 4 and (b) Scenario 2
and 4. Figure 10. The comparisons of the power outputs of CHP in (a) Scenario 3 and 4 and(b) Scenario 2 and 4.

Energies 2016, 9, 474 14 of 17Energies 2016, 9, 474 14 of 17
Figure 11. The power outputs of G2 in four scenarios.
4.3.3. Sensitivity Analysis of Wind Penetration
Wind penetration is a key factor influencing the operating cost and wind integration
performance of the integrated system. Comparisons of curtailed wind energy in the system at
different wind penetration levels in four scenarios are shown in Figure 12.
Figure 12. Wind power curtailment at different wind penetration levels in the four scenarios.
In Scenario 1, wind energy curtailment begins to appear as wind penetration reaches 19.3%.
While in other three scenarios, the corresponding wind penetrations are 22.3%, 24.8%, 27.3%,
respectively. Thus, it is indicated the threshold value of wind curtailment occurrence would be
increased when introducing the energy storages. The trends of wind curtailment are also shown in
Figure 12, demonstrating the different performances in four scenarios, as well as the significant
effectiveness of integrating electrical and thermal energy storage into the integrated CHP system.
With increasing wind penetration, the amount of curtailed wind energy will increase rapidly in all
four scenarios.
4.3.4. Cost‐Benefit Analysis of EES and TES
The cost‐benefit analysis of the integrated CHP system when introducing both EES and TES is
carried out. The investment costs, operation and maintenance (O&M) costs, overall efficiency, and
lifetimes of the EES and TES are shown in Table 2, which are derived from [31,32]. The investment
costs are annualized using a discount rate of 5%. The annual saving costs include operating saving
costs and annualized avoided investment costs of substitute power and heat capacity [32]. The results
are shown in Figure 13 which presents the annual net benefits at different wind penetration levels.
Figure 11. The power outputs of G2 in four scenarios.
4.3.3. Sensitivity Analysis of Wind Penetration
Wind penetration is a key factor influencing the operating cost and wind integration performanceof the integrated system. Comparisons of curtailed wind energy in the system at different windpenetration levels in four scenarios are shown in Figure 12.
Energies 2016, 9, 474 14 of 17
Figure 11. The power outputs of G2 in four scenarios.
4.3.3. Sensitivity Analysis of Wind Penetration
Wind penetration is a key factor influencing the operating cost and wind integration
performance of the integrated system. Comparisons of curtailed wind energy in the system at
different wind penetration levels in four scenarios are shown in Figure 12.
Figure 12. Wind power curtailment at different wind penetration levels in the four scenarios.
In Scenario 1, wind energy curtailment begins to appear as wind penetration reaches 19.3%.
While in other three scenarios, the corresponding wind penetrations are 22.3%, 24.8%, 27.3%,
respectively. Thus, it is indicated the threshold value of wind curtailment occurrence would be
increased when introducing the energy storages. The trends of wind curtailment are also shown in
Figure 12, demonstrating the different performances in four scenarios, as well as the significant
effectiveness of integrating electrical and thermal energy storage into the integrated CHP system.
With increasing wind penetration, the amount of curtailed wind energy will increase rapidly in all
four scenarios.
4.3.4. Cost‐Benefit Analysis of EES and TES
The cost‐benefit analysis of the integrated CHP system when introducing both EES and TES is
carried out. The investment costs, operation and maintenance (O&M) costs, overall efficiency, and
lifetimes of the EES and TES are shown in Table 2, which are derived from [31,32]. The investment
costs are annualized using a discount rate of 5%. The annual saving costs include operating saving
costs and annualized avoided investment costs of substitute power and heat capacity [32]. The results
are shown in Figure 13 which presents the annual net benefits at different wind penetration levels.
Figure 12. Wind power curtailment at different wind penetration levels in the four scenarios.
In Scenario 1, wind energy curtailment begins to appear as wind penetration reaches 19.3%.While in other three scenarios, the corresponding wind penetrations are 22.3%, 24.8%, 27.3%,respectively. Thus, it is indicated the threshold value of wind curtailment occurrence would beincreased when introducing the energy storages. The trends of wind curtailment are also shownin Figure 12, demonstrating the different performances in four scenarios, as well as the significanteffectiveness of integrating electrical and thermal energy storage into the integrated CHP system.With increasing wind penetration, the amount of curtailed wind energy will increase rapidly in allfour scenarios.
4.3.4. Cost-Benefit Analysis of EES and TES
The cost-benefit analysis of the integrated CHP system when introducing both EES and TESis carried out. The investment costs, operation and maintenance (O&M) costs, overall efficiency,and lifetimes of the EES and TES are shown in Table 2, which are derived from [31,32]. The investment
Energies 2016, 9, 474 15 of 17
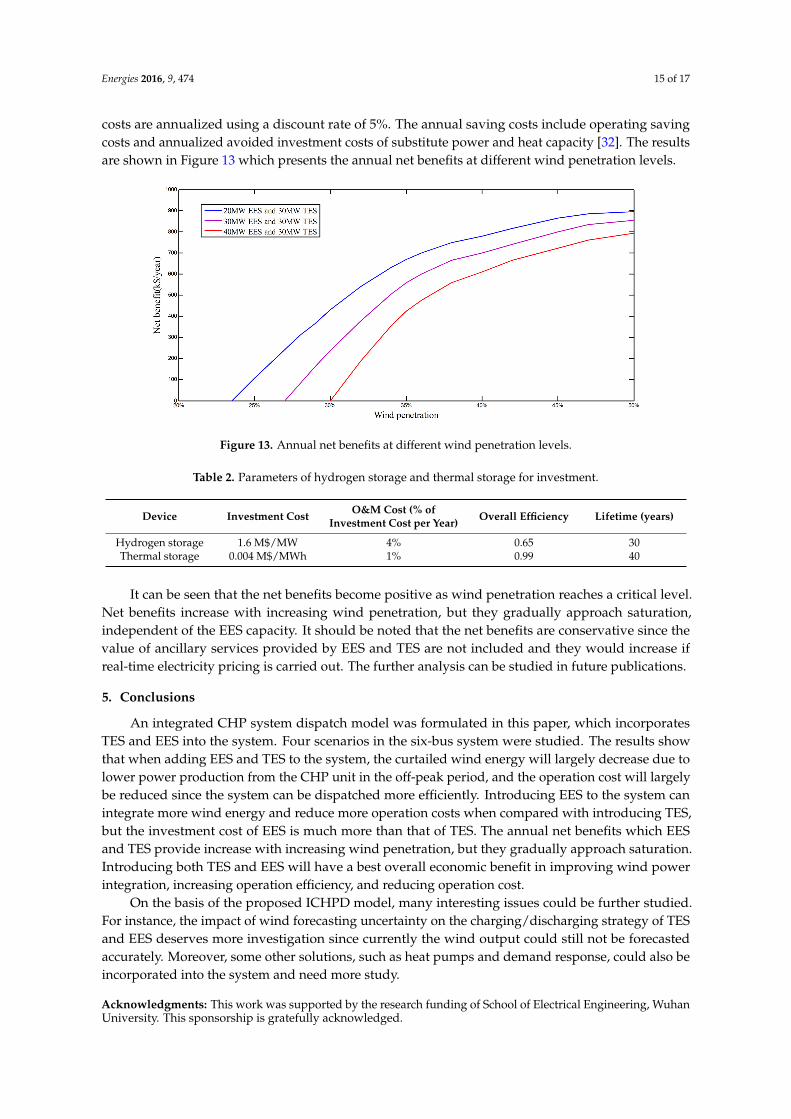
costs are annualized using a discount rate of 5%. The annual saving costs include operating savingcosts and annualized avoided investment costs of substitute power and heat capacity [32]. The resultsare shown in Figure 13 which presents the annual net benefits at different wind penetration levels.Energies 2016, 9, 474 15 of 17
Figure 13. Annual net benefits at different wind penetration levels.
Table 2. Parameters of hydrogen storage and thermal storage for investment.
Device Investment Cost O&MCost (% of
Investment Cost per Year)
Overall
Efficiency
Lifetime
(years)
Hydrogen storage 1.6 M$/MW 4% 0.65 30
Thermal storage 0.004 M$/MWh 1% 0.99 40
It can be seen that the net benefits become positive as wind penetration reaches a critical level.
Net benefits increase with increasing wind penetration, but they gradually approach saturation,
independent of the EES capacity. It should be noted that the net benefits are conservative since the
value of ancillary services provided by EES and TES are not included and they would increase if
real‐time electricity pricing is carried out. The further analysis can be studied in future publications.
5. Conclusions
An integrated CHP system dispatch model was formulated in this paper, which incorporates
TES and EES into the system. Four scenarios in the six‐bus system were studied. The results show
that when adding EES and TES to the system, the curtailed wind energy will largely decrease due to
lower power production from the CHP unit in the off‐peak period, and the operation cost will
largely be reduced since the system can be dispatched more efficiently. Introducing EES to the
system can integrate more wind energy and reduce more operation costs when compared with
introducing TES, but the investment cost of EES is much more than that of TES. The annual net
benefits which EES and TES provide increase with increasing wind penetration, but they gradually
approach saturation. Introducing both TES and EES will have a best overall economic benefit in
improving wind power integration, increasing operation efficiency, and reducing operation cost.
On the basis of the proposed ICHPD model, many interesting issues could be further studied.
For instance, the impact of wind forecasting uncertainty on the charging/discharging strategy of TES
and EES deserves more investigation since currently the wind output could still not be forecasted
accurately. Moreover, some other solutions, such as heat pumps and demand response, could also
be incorporated into the system and need more study.
Acknowledgments: This work was supported by the research funding of School of Electrical Engineering,
Wuhan University. This sponsorship is gratefully acknowledged.
Author Contributions: Rongxiang Yuan proposed the concrete ideas of the proposed optimization model. Jun
Ye performed the simulations and wrote the manuscript. Jiazhi Lei and Timing Li gave some useful
suggestions to the manuscript. Both of the authors revised the manuscript.
Conflicts of Interest: The authors declare no conflict of interest.
Figure 13. Annual net benefits at different wind penetration levels.
Table 2. Parameters of hydrogen storage and thermal storage for investment.
Device Investment Cost O&M Cost (% ofInvestment Cost per Year) Overall Efficiency Lifetime (years)
Hydrogen storage 1.6 M$/MW 4% 0.65 30Thermal storage 0.004 M$/MWh 1% 0.99 40
It can be seen that the net benefits become positive as wind penetration reaches a critical level.Net benefits increase with increasing wind penetration, but they gradually approach saturation,independent of the EES capacity. It should be noted that the net benefits are conservative since thevalue of ancillary services provided by EES and TES are not included and they would increase ifreal-time electricity pricing is carried out. The further analysis can be studied in future publications.
5. Conclusions
An integrated CHP system dispatch model was formulated in this paper, which incorporatesTES and EES into the system. Four scenarios in the six-bus system were studied. The results showthat when adding EES and TES to the system, the curtailed wind energy will largely decrease due tolower power production from the CHP unit in the off-peak period, and the operation cost will largelybe reduced since the system can be dispatched more efficiently. Introducing EES to the system canintegrate more wind energy and reduce more operation costs when compared with introducing TES,but the investment cost of EES is much more than that of TES. The annual net benefits which EESand TES provide increase with increasing wind penetration, but they gradually approach saturation.Introducing both TES and EES will have a best overall economic benefit in improving wind powerintegration, increasing operation efficiency, and reducing operation cost.
On the basis of the proposed ICHPD model, many interesting issues could be further studied.For instance, the impact of wind forecasting uncertainty on the charging/discharging strategy of TESand EES deserves more investigation since currently the wind output could still not be forecastedaccurately. Moreover, some other solutions, such as heat pumps and demand response, could also beincorporated into the system and need more study.
Acknowledgments: This work was supported by the research funding of School of Electrical Engineering, WuhanUniversity. This sponsorship is gratefully acknowledged.

Energies 2016, 9, 474 16 of 17
Author Contributions: Rongxiang Yuan proposed the concrete ideas of the proposed optimization model. Jun Yeperformed the simulations and wrote the manuscript. Jiazhi Lei and Timing Li gave some useful suggestions tothe manuscript. Both of the authors revised the manuscript.
Conflicts of Interest: The authors declare no conflict of interest.
References
1. Zhou, K.; Yang, S.; Shen, C.; Ding, S.; Sun, C. Energy conservation and emission reduction of China’s electricpower industry. Renew. Sustain. Energy Rev. 2015, 45, 10–19. [CrossRef]
2. Feng, Y.; Lin, H.Y.; Ho, S.L.; Yanc, J.H.; Dong, J.N.; Fang, S.H.; Huang, Y.K. Overview of wind powergeneration in China: Status and development. Renew. Sustain. Energy Rev. 2015, 50, 847–858. [CrossRef]
3. Zhao, Z.Y.; Chang, R.D.; Chen, Y.L. What hinder the further development of wind power in China?A socio-technical barrier study. Energ Policy 2016, 88, 465–476. [CrossRef]
4. Zhang, D.; Zhang, X.L.; He, J.K.; Chai, Q.M. Offshore wind energy development in China: Current statusand future perspective. Renew. Sustain. Energy Rev. 2011, 15, 4673–4684. [CrossRef]
5. Nuytten, T.; Claessens, B.; Paredis, K.; Van Bael, J.; Six, D. Flexibility of a combined heat and power systemwith thermal energy storage for district heating. Appl. Energy 2013, 104, 583–591. [CrossRef]
6. Bianchi, M.; De Pascale, A.; Melino, F. Performance analysis of an integrated CHP system with thermal andElectric Energy Storage for residential application. Appl. Energy 2013, 112, 928–938. [CrossRef]
7. Hong, L.X.; Lund, H.; Moller, B. The importance of flexible power plant operation for Jiangsu’s windintegration. Energy 2012, 41, 499–507. [CrossRef]
8. Tan, Z.F.; Li, H.H.; Ju, L.W.; Song, Y.H. An Optimization Model for Large-Scale Wind Power Grid ConnectionConsidering Demand Response and Energy Storage Systems. Energies 2014, 7, 7282–7304. [CrossRef]
9. Yuan, Y.; Zhang, X.S.; Ju, P.; Qian, K.J.; Fu, Z.X. Applications of battery energy storage system for windpower dispatchability purpose. Electr. Power Syst. Res. 2012, 93, 54–60. [CrossRef]
10. Ghofrani, M.; Arabali, A.; Etezadi-Amoli, M.; Fadali, M.S. Energy Storage Application for PerformanceEnhancement of Wind Integration. IEEE Trans. Power Syst. 2013, 28, 4803–4811. [CrossRef]
11. Trifkovic, M.; Sheikhzadeh, M.; Nigim, K.; Daoutidis, P. Modeling and Control of a Renewable HybridEnergy System With Hydrogen Storage. IEEE Trans. Contr. Syst. Tech. 2014, 22, 169–179. [CrossRef]
12. Recalde Melo, D.F.; Chang-Chien, L.R. Synergistic Control Between Hydrogen Storage System and OffshoreWind Farm for Grid Operation. IEEE Trans. Sustain. Energy 2014, 5, 18–27. [CrossRef]
13. Zhao, H.R.; Wu, Q.W.; Hu, S.J.; Xu, H.H.; Rasmussen, C.N. Review of energy storage system for wind powerintegration support. Appl. Energy 2015, 137, 545–553. [CrossRef]
14. Nuytten, T.; Moreno, P.; Vanhoudt, D.; Jespers, L.; Sole, A.; Cabeza, L.F. Comparative analysis of latentthermal energy storage tanks for micro-CHP systems. Appl. Therm. Eng. 2013, 59, 542–549. [CrossRef]
15. Christidis, A.; Koch, C.; Pottel, L.; Tsatsaronis, G. The contribution of heat storage to the profitable operationof combined heat and power plants in liberalized electricity markets. Energy 2012, 41, 75–82. [CrossRef]
16. Lund, H.; Mathiesen, B.V. Energy system analysis of 100% renewable energy systems—The case of Denmarkin years 2030 and 2050. Energy 2009, 34, 524–531. [CrossRef]
17. Yang, Y.L.; Wu, K.; Long, H.Y.; Gao, J.C.; Yan, X.; Kato, T.; Suzuoki, Y. Integrated electricity and heatingdemand-side management for wind power integration in China. Energy 2014, 78, 235–246. [CrossRef]
18. Chen, X.Y.; Kang, C.Q.; O'Malley, M.; Xia, Q. Increasing the Flexibility of Combined Heat and Power forWind Power Integration in China Modeling and Implications. IEEE Trans. Power Syst. 2015, 30, 1848–1857.[CrossRef]
19. Li, Z.G.; Wu, W.C.; Shahidehpour, M.; Wang, J.H.; Zhang, B. Combined Heat and Power Dispatch ConsideringPipeline Energy Storage of District Heating Network. IEEE Trans. Sustain. Energy 2016, 7, 12–22. [CrossRef]
20. Hedegaard, K.; Mathiesen, B.V.; Lund, H.; Heiselberg, P. Wind power integration using individual heatpumps—Analysis of different heat storage options. Energy 2012, 47, 284–293. [CrossRef]
21. Wang, H.C.; Yin, W.S.; Abdollahi, E.; Landelma, R.; Jiao, W.L. Modelling and optimization of CHP baseddistrict heating system with renewable energy production and energy storage. Appl. Energy 2015, 159,401–421. [CrossRef]
22. Agbossou, K.; Kolhe, M.; Hamelin, J.; Bose, T.K. Performance of a stand-alone renewable energy systembased on energy storage as hydrogen. IEEE Trans. Energy Convers. 2004, 19, 633–640. [CrossRef]

Energies 2016, 9, 474 17 of 17
23. Korpas, K.; Holen, A.T. Operation planning of hydrogen storage connected to wind power operating in apower market. IEEE Trans. Energy Convers. 2006, 21, 742–749. [CrossRef]
24. Garcia-Torres, F.; Bordons, C. Optimal Economical Schedule of Hydrogen-Based Microgrids With HybridStorage Using Model Predictive Control. IEEE Trans. Ind. Electron. 2015, 62, 5195–5207. [CrossRef]
25. Bogdan, Z.; Kopjar, D. Improvement of the cogeneration plant economy by using heat accumulator. Energy2006, 31, 2285–2292. [CrossRef]
26. Rezaie, B.; Reddy, B.V.; Rosen, M.A. Energy analysis of thermal energy storages with grid configurations.Appl. Energy 2014, 117, 54–61. [CrossRef]
27. Yazdani, A.; Jayabarathi, T.; Ramesh, V.; Raghunathan, T. Combined heat and power economic dispatchproblem using firefly algorithm. Front. Energy 2013, 7, 133–139. [CrossRef]
28. Khorram, E.; Jaberipour, M. Harmony search algorithm for solving combined heat and power economicdispatch problems. Energy Convers. Manag. 2011, 52, 1550–1554. [CrossRef]
29. Jiang, R.W.; Wang, J.H.; Guan, Y.P. Robust Unit Commitment With Wind Power and Pumped Storage Hydro.IEEE Trans. Power Syst. 2012, 27, 800–810. [CrossRef]
30. Barbieri, E.S.; Melino, F.; Morini, M. Influence of the thermal energy storage on the profitability of micro-CHPsystems for residential building applications. Appl. Energy 2012, 97, 714–722. [CrossRef]
31. Hedegaard, K.; Münster, M. Influence of individual heat pumps on wind power integration—Energy systeminvestments and operation. Energ. Convers. Manag. 2013, 75, 673–684. [CrossRef]
32. Danish Energy Agency. Energinet.dk. Technology Data for Energy Plants–Generation of Electricity and DistrictHeating, Energy Storage and Carrier Generation and Conversion; Danish Energy Agency: Copenhagen,Denmark, 2012.
© 2016 by the authors; licensee MDPI, Basel, Switzerland. This article is an open accessarticle distributed under the terms and conditions of the Creative Commons Attribution(CC-BY) license (http://creativecommons.org/licenses/by/4.0/).