Rockwall PD / Arrest & Incident Report / Fernando Rosales - 10.11.11 Rockwall PD

d i lIntegrated Capital Improvement Planning for a Large Regional Water Provider
PRESENTED BY: SCOTT COLE, P.E.
AWWA ANNUAL CONFERENCE & EXPOSITIONJUNE 24, 2010

Acknowledgments
• Melissa Waltzer, P.E., Freese and Nichols
• Robert McCarthy North Texas Municipal Water District• Robert McCarthy, North Texas Municipal Water District
• Yanbo Li, P.E., North Texas Municipal Water District
NTMWD Pl i D t t• NTMWD Planning Department
• NTMWD Operations Department
• NTMWD Maintenance Department
• NTMWD Engineering Department
• NTMWD Executives
2

Agenda
• Overview of Transmission System
• Overview of Asset Management Components• Overview of Asset Management Components
• Capacity Analysis
C diti d C iti lit A l i• Condition and Criticality Analysis
• Integrated Capital Improvement Program
3

Overview of Transmission System
• Initially established in the 1950s
• Regional Wholesale Water Provider
• Serves approximately 1.6 million people
• Current treatment capacity of 770 MGD
il f• Over 323 miles of pipeline (12” to 96”)
80 d li i t• 80 delivery points
• 19 pump stations4
Agenda
• Overview of Transmission System
• Overview of Asset Management Components• Overview of Asset Management Components
• Capacity Analysis
C diti d C iti lit A l i• Condition and Criticality Analysis
• Integrated Capital Improvement Program
5
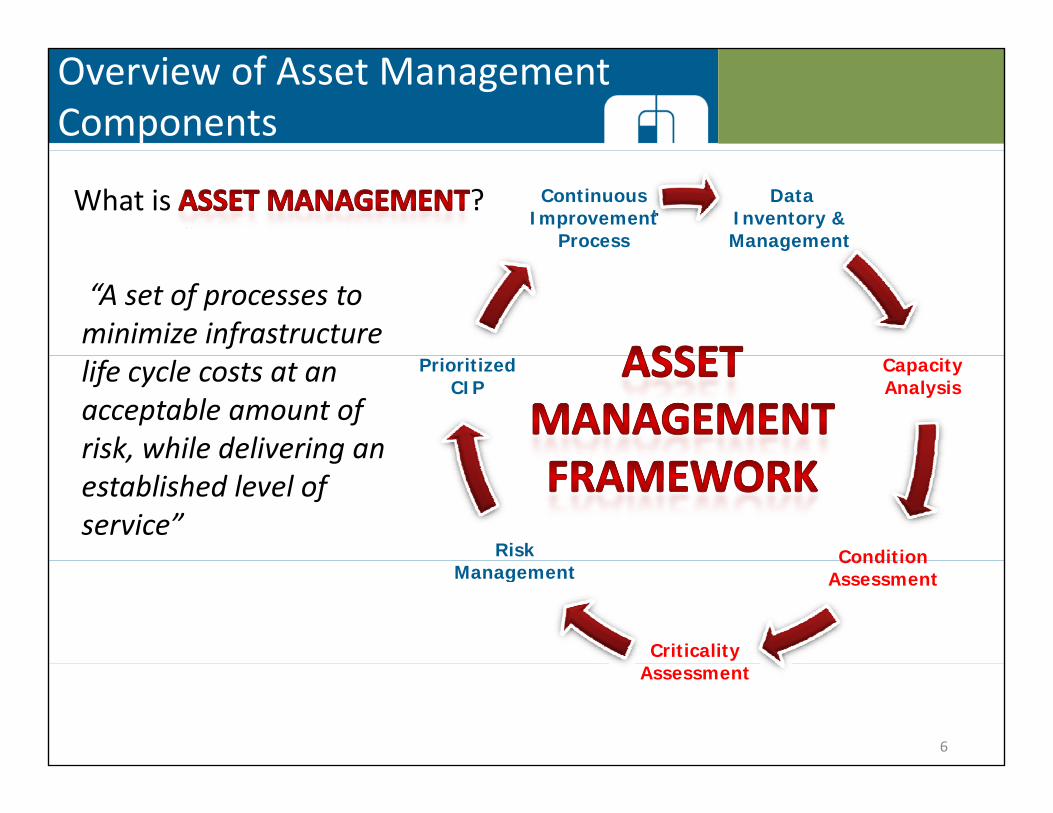
Overview of Asset Management Components
Data Inventory & Management
Continuous Improvement
Process
What is ?
“A set of processes to minimize infrastructure
Capacity Analysis
Prioritized CIP
life cycle costs at an acceptable amount of risk, while delivering an
ConditionRisk
risk, while delivering an established level of service”
Condition Assessment
Criticality
Management
Assessment
6

Risk Based Assessment Planning Process
Review and Inventory of Various Data Sources
GIS SCADA W k O d D t St ff
Condition
GIS ‐ SCADA ‐Work Order Data – Staff Interviews – Maintenance Records
RISK BASED PRIORITIZED CAPITAL
O
Develop Prioritization
Scoring
Analysis
Criticality Analysis
Site Visits/Field
Investigations IMPROVEMENT PLANScoring Criteria
Investigations
Capacity Analysis
Water Model
7
Water Model Development

Risk Based Concept for Infrastructure Renewal Prioritization
Risk = ƒ (Criticality x Condition)ƒ ( y )
What is the Consequence of Asset Failure?
•Loss of service
What is the Likelihood of Asset Failure?•Asset age•Loss of service
•Redundancy•Difficulty of repair
•Asset age•Asset material•Performance of y p
•Damage to property•Public image
asset•Annual maintenance
tcosts
8

Agenda
• Overview of Transmission System
• Overview of Asset Management Components• Overview of Asset Management Components
• Capacity Analysis
C diti d C iti lit A l i• Condition and Criticality Analysis
• Integrated Capital Improvement Program
9

Capacity Analysis
• Model Development
• Performed Model Calibration• Performed Model Calibration
• Developed Demand Projections through 2035
D l d C it l I t P• Developed Capital Improvement Program
10

Treatment Plant Expansions
11

Capacity Based Capital Improvement Program
Estimated CostEstimated CostWater Supply $1,765,355,300
Water Treatment $648,521,137
Distribution System $658,823,560Total $3,072,699,997
12

Agenda
• Overview of Transmission System
• Overview of Asset Management Components• Overview of Asset Management Components
• Capacity Analysis
C diti d C iti lit A l i• Condition and Criticality Analysis
• Integrated Capital Improvement Program
13

Condition Analysis‐ Facility Site Visits• NTMWD Staff
– Planning– Operations– Engineering– Technical Services– Facilities Services
• FNI Staffl– Planning Engineer
– Pump Design Engineer – Electrical Engineer– Civil Engineer– Pipeline Design
EngineerEngineer
14

Condition Analysis‐ Facility Site Visits
15

Condition of Facilities
• Determine the total condition score for each asset and group into five general categories:g p g g
CONDITION ASSESSMENT SCORING DEFINITION
Very Good Sound physical condition. Total Score < 45
GoodGood Acceptable physical condition. 45 ≤ Total Score < 50
Fair Normal wear and tear. 50 ≤ Total Score < 55
Poor F il lik l i h t t di t 55 ≤ T t l S ≤ 60Poor Failure likely in short to medium term. 55 ≤ Total Score ≤ 60Very Poor
Failed or near failure. Total Score > 60Major work or replacement required urgently.
16

Pump Station Condition Summary
Weighted ScoreWallace Street Booster PS 68.8Raw Water PS No. 2 60.8
ll
PUMP STATION PARAMETERS
Parameter Weight (%) Electrical‐MCC, Switch
Very Poor
Apollo PS No. 1 60.8McKinney No. 1 PS 57.8Hailey PS 54.3Shiloh PS No. 2 53.5Shiloh PS No 1 53 0
Electrical MCC, Switch Gear 15Alternate Power (dual power feed or back up generator) 10
Poor
Shiloh PS No. 1 53.0HSPS 1‐1‐ S. Garland 52.8HSPS 1‐1‐ Plano 52.5HSPS 1‐1‐ Allen 52.5Murphy Booster PS 51.3
Mechanical‐ HVAC 5
Mechanical‐ Piping 5
Mechanical‐ Valves 5
Fair
p yApollo PS No. 2 51.3Rockwall PS 50.8HSPS 2‐2 50.5Casa View PS 50.5
Mechanical‐Meters 5
Pumps 15
Motors 15Wylie Rockwall Farmersville PS 47.3HSPS 2‐3 46.5Rockwall No. 1 PS 43.8Forney PS 40.0HSPS 2 1 37 0
Structure‐Walls 5
Structure‐ Roof 5
Structure‐ Foundation 5
Good
VeryHSPS 2‐1 37.0Raw Water PS No. 1 28.8HSPS 3‐1 26.5Raw Water PS No. 3 24.5
Instrumentation 5
SCADA 5
Very Good
17

Criticality of Facilities Overall Criticality Score
HSPS 2‐1 100Plant 3 Clearwell No. 2 85HSPS 2‐3 85RawWater PS No 3 85
Very High Impact
ScorePopulation Served ≥ 200,000 100Population Served 100,000 – 199,999 70
Raw Water PS No. 3 85Apollo Pump Station 70HSPS 2‐2 70HSPS 3‐1 70Shiloh PS No. 2 70RawWater PS No. 2 70
Impact
High Impact
Population Served 25,000 – 99,999 40Population Served < 25,000 10
Raw Water PS No. 2 70Plant 2 Clearwell No. 1 70Plant 2 Clearwell No. 2 70Plant 1 Clearwell No. 1 55Plant 1 Clearwell No. 2 55Plant 3 Clearwell No. 1 55
p
Medium
CRITICALITY PARAMETERS
Parameter Weight (%)
HSPS 1‐1‐ Plano 55McKinney No. 1 PS 55Murphy Booster PS 55Shiloh PS No. 1 55Raw Water PS No. 1 40
ImpactPopulation Served 50
Redundancy 50
Plant 2 Clearwell No. 3 40Casa View PS/GSTs 25HSPS 1‐1‐ S. Garland 25Wylie Rockwall Farmersville PS 25Forney PS/GSTs 10
/
Low Impact
Redundancy Score≥75% of Capacity Lost 10050‐74% of Capacity Lost 70
Hailey PS/GSTs 10HSPS 1‐1‐ Allen 10Rockwall No. 1 PS/GST 10Rockwall PS/Clearwell 10Wallace Street Booster PS 10 18
25‐49% of Capacity Lost 40<25% of Capacity Lost 10

Risk Based Assessment Matrix for Facilities
Very Good Good Fair Poor Very Poor
Casa ViewWallace Street
Condition
Low Impact
Raw Water PS No. 1
WRF PSHSPS 1‐1 S. Garland and
Allen
Casa View PS/GSTs,
Hailey PS/GSTs, Plant No. 2
Clearwell No 3
Booster PS, Rockwall No. 1 GST/PS, Forney
PS/GSTs, RockwallClearwell No. 3
PS/Clearwell
Medium Impact
Plant No. 1 Clearwell No. 1, Plant No. 3
Murphy Booster PS, HSPS 1‐1
Shiloh PS No. 1, McKinney No. 1
PS/GSTs, Plant No.icality
Clearwell No. 1 Plano 1 Clearwell No. 2
High Impact
HSPS 3‐1 HSPS 2‐2Shiloh PS No. 2, Plant No. 2
Clearwell No 1
Raw Water PS No. 2, Apollo PS/GST, Plant No. 2 Clearwell No.
Crit
Clearwell No. 12
Very High Impact
Raw Water PS No. 3, HSPS 2‐1,
Plant No. 3 HSPS 2‐3
Clearwell No. 2
SHORT TERM CRITICAL NEEDS 19

Condition Scoring & Parameter Weighting‐ Pipelines
PROPOSED CONDITION PARAMETERS & WEIGHTING SYSTEM Pipe Age (30%) Pipe Material (15%)
1950 ‐ 1959 = 100 Ductile Iron (DI) = 701960 – 1969 = 801970 1979 60
Pre‐stressed Concrete Cylinder Pipe (PCCP) 701970 ‐ 1979 = 60 (PCCP) = 70
1980 ‐ 1989 = 40 Mortar Coated Steel (MCS) = 401990 ‐ 1999 = 202000 ‐ 2009 = 0
Bar‐wrapped Concrete Cylinder Pipe (BWCCP/RCCP) = 40( / )
Polyurethane Coated Steel (PCS) = 40
Maintenance History on Pipelines and Appurtenances (55%)B d R i / 1000 ftBased on Repairs/ 1000 ft0.65‐0.85 repairs = 1000.35‐0.65 repairs = 600.00‐0.35 repairs = 30p
No Repairs = 0
20

Maintenance History
Pipelines and Appurtenances
21

Condition of Pipelines
• Determine the total condition score for each asset and group total into five general categories:
CONDITION ASSESSMENT SCORING DEFINITION
g p g g
Very Good Sound physical condition. Total Score < 10
dGood Acceptable physical condition. 10≤ Total Score < 20
Fair Normal wear and tear. 20 ≤ Total Score < 40
PPoor Failure likely in short to medium term. 40 ≤ Total Score < 70Very Poor
Failed or near failure. Total Score > 70Major work or replacement required urgently.
22

Condition of Pipelines
• Parameters Used:– Pipe Age p g
– Pipe Material
– Maintenance Hi t Pi liHistory on Pipelines
and Appurtenances
23

Criticality of Pipelines
• Parameters Used:– Population Served p
– Redundancy
– Accessibility
24

Risk Based Assessment Matrix for Pipelines
ConditionVery Good Good Fair Poor Very Poor
Low Impact74 segments (34 946 feet)
99 segments (96 023 feet)
174 segments (170 626 feet)
106 segments (164 252 feet)
16 segments (16 704 feet)(34,946 feet) (96,023 feet) (170,626 feet) (164,252 feet) (16,704 feet)
Medium Impact126 segments (60,628 feet)
128 segments (116,680 feet)
196 segments 142,346 feet)
41 segments (37,579 feet)
15 segments (11,120 feet)
265 segments 74 segments 101 segments 18 segments 1 segmenticality
High Impact265 segments (156,893 feet)
74 segments (37,696 feet)
101 segments (94,309 feet)
18 segments (27,325 feet)
1 segment (2,208 feet)
Very High I t
165 segments (120 509 f t)
194 segments (260 145 f t)
145 segments (135 206 f t)
20 segments (29 811 f t)
3 segments (2 262 f t)
Crit
Impact (120,509 feet) (260,145 feet) (135,206 feet) (29,811 feet) (2,262 feet)
SHORT TERM CRITICAL NEEDS
25

Overall Water Line Score
• Combines criticality and ycondition analysis
26

Agenda
• Overview of Transmission System
• Overview of Asset Management Components• Overview of Asset Management Components
• Capacity Analysis
C diti d C iti lit A l i• Condition and Criticality Analysis
• Integrated Capital Improvement Program
27

Integrated Capital Improvement Program • Identify overlapping projects in both growth and condition/criticality CIPs
28

Integrated Capital Improvement Program
Fiscal Year Cost2010 $968,1672010 $968,1672011 $9,306,6332012 $19,535,033
$2013 $17,051,1672014 $27,852,1332015 $19,583,5670 5 $ 9,583,562016 $23,245,000Total $117,541,700
29

Next Steps
• Expand risk based renewal assessment to treatment systemsystem
• Utilize CIP to determine impact on rates
• Update CIP with 2010 Census data• Update CIP with 2010 Census data
• Allocate CIP funding for major renewal projects
30

Questions?
Contact Information:
Scott Cole, [email protected](817)735 7255
Melissa Waltzer, [email protected](214) 217 2323(817)735‐7255
4055 International Plaza, Suite 200Fort Worth, TX 76109
(214) 217‐23231701 N. Market St., Suite 500
Dallas, Texas 75202
31