intake, Arterial C02, difficulty · FIG. 1C. CATHETER Too Low, riP IN INFERIOR VENA CAVA great...
11
MEASUREMENT OF CARDIAC OUTPUT IN MAN USING THE TECHNIQUE OF CATHETERIZATION OF THE RIGHT AURICLE OR VENTRICLE By A. COURNAND, R. L. RILEY, E. S. BREED, E. DEF. BALDWIN, AND D. W. RICHARDS, JR., WITH THE TECHNICAL ASSISTANCE OF M. S. LESTER AMD M. JONES (From the Department of Medicine of Columbia University, Collge of Physicians and Surgeons, and the Tuberculosis Service, Bellevue Hospital (Columbia University Division), New York City) (Received for publication June 27, 1944) Determination of cardiac output on the basis of the so-called Fick principle requires the measurement of oxygen or of carbon dioxide content of arterial blood, and of mixed venous blood, and the total oxygen intake or carbon dioxide elimination by the lungs, per unit of time. With these values, cardiac output is obtained from either of the following two equations: (a) Cardiac output (ml. per minute) 02 intake, ml. per minute X 100 Arterial 02, volumes per cent -venous 02, volumes per cent (b) Cardiac output (ml. per minute) CO2 output, ml. per minute X 100 Venous C02, volumes per cent - arterial C02, volumes per cent The practical difficulty preventing the ready application of this principle in human subjects has been that of obtaining reliable samples of average or mixed venous blood. With the development of the technique of catheterization of the right heart (1), this difficulty has been largely overcome; and the experience of the last 3 years has led to a procedure for determining cardiac output in man which can be used in almost all forms of disease or injury, with safety and without discomfort to the patient, beyond that attendant upon the insertion of a needle in the femoral artery, and cutting down on a median basilic vein, both under novocaine anes- thesia. In the present paper, this method of cardiac output measurement is described in detail, its validity is discussed, and the results in a group of 33 "normal" hospital control subjects reported. A. Catheterization of the right heart A No. 8 or No. 9 ureteral catheter is used, having a single opening at the tip and a special air-tight adapter at the base for a Luer syringe.' For convenience in manipu- lation, a slight curve is provided in the distal 3 inches of the catheter. A single opening at the tip was found to be preferable to multiple openings. A sufficiently large vein is chosen in the antecubital fossa to ensure easy passage of the catheter. Either arm may be used. This vein should lead into the brachial vein system, not the cephalic. After local novocainization, the vein is exposed, using careful aseptic surgical technique, making as small an incision as feasible. Two No. C silk ligatures are passed under the vein. The distal one is tied with a single knot to prevent back bleeding, when the vein is opened. The proximal ligature is clamped and is used as a sling to pull the vein taut when necessary to occlude its lumen above the point of incision. A transverse nick is then made in the vein wall with a bayonet-bladed scalpel. The proximal lip of the opening is caught in a fine hemostat so that the lumen may be held open while the catheter tip is being introduced. The catheter which has been previously connected to a saline reservoir and standard infusion tubing by a 3-way stopcock, is flushed through and also wiped off with saline. A flow of saline (1 to 2 drops a second) is maintained through the catheter. The tip is then introduced into the vein and pushed up rapidly to the axilla. The catheter should slip in easily, without resistance and without pain or other sensation. All further manipulation is carried out under fluoroscopic control. The arm is held in internal rotation and the patient's head and neck are inclined as far laterally as possible towards the operative side to prevent entrance of the catheter into the internal jugular vein. Any obstruction met at the axilla will usually be overcome by abducting the arm, or by raising the shoulder girdle headwards, while the catheter is withdrawn a little and advanced again. The curve in the distal end of the catheter, as previously described, does not influence the flexibility of the whole system and is helpful in correcting false routes which may be taken by the catheter tip. Of these, the most frequent 1 This catheter has been specially designed and provided by the United States Catheter and Instrument Corpora- tion, Glens Falls, New York. 106
Transcript of intake, Arterial C02, difficulty · FIG. 1C. CATHETER Too Low, riP IN INFERIOR VENA CAVA great...

MEASUREMENTOF CARDIAC OUTPUTIN MANUSING THETECHNIQUEOF CATHETERIZATION OF THE
RIGHT AURICLE ORVENTRICLE
By A. COURNAND,R. L. RILEY, E. S. BREED, E. DEF. BALDWIN, ANDD. W. RICHARDS, JR., WITH THE TECHNICAL ASSISTANCE OF
M. S. LESTERAMD M. JONES(From the Department of Medicine of Columbia University, Collge of Physicians and Surgeons, and
the Tuberculosis Service, Bellevue Hospital (Columbia University Division), New York City)
(Received for publication June 27, 1944)
Determination of cardiac output on the basisof the so-called Fick principle requires themeasurement of oxygen or of carbon dioxidecontent of arterial blood, and of mixed venousblood, and the total oxygen intake or carbondioxide elimination by the lungs, per unit oftime. With these values, cardiac output isobtained from either of the following twoequations:
(a) Cardiac output (ml. per minute)02 intake, ml. per minute
X 100Arterial 02, volumes per cent-venous 02, volumes per cent
(b) Cardiac output (ml. per minute)CO2output, ml. per minute
X 100Venous C02, volumes per cent- arterial C02, volumes per cent
The practical difficulty preventing the readyapplication of this principle in human subjectshas been that of obtaining reliable samples ofaverage or mixed venous blood. With thedevelopment of the technique of catheterizationof the right heart (1), this difficulty has beenlargely overcome; and the experience of the last3 years has led to a procedure for determiningcardiac output in man which can be used inalmost all forms of disease or injury, with safetyand without discomfort to the patient, beyondthat attendant upon the insertion of a needle inthe femoral artery, and cutting down on amedian basilic vein, both under novocaine anes-thesia. In the present paper, this method ofcardiac output measurement is described indetail, its validity is discussed, and the results ina group of 33 "normal" hospital control subjectsreported.
A. Catheterization of the right heartA No. 8 or No. 9 ureteral catheter is used, having a
single opening at the tip and a special air-tight adapter atthe base for a Luer syringe.' For convenience in manipu-lation, a slight curve is provided in the distal 3 inches ofthe catheter. A single opening at the tip was found to bepreferable to multiple openings.
A sufficiently large vein is chosen in the antecubitalfossa to ensure easy passage of the catheter. Either armmay be used. This vein should lead into the brachialvein system, not the cephalic. After local novocainization,the vein is exposed, using careful aseptic surgical technique,making as small an incision as feasible. Two No. C silkligatures are passed under the vein. The distal one istied with a single knot to prevent back bleeding, when thevein is opened. The proximal ligature is clamped and isused as a sling to pull the vein taut when necessary toocclude its lumen above the point of incision.
A transverse nick is then made in the vein wall witha bayonet-bladed scalpel. The proximal lip of the openingis caught in a fine hemostat so that the lumen may be heldopen while the catheter tip is being introduced.
The catheter which has been previously connected to asaline reservoir and standard infusion tubing by a 3-waystopcock, is flushed through and also wiped off with saline.A flow of saline (1 to 2 drops a second) is maintainedthrough the catheter. The tip is then introduced into thevein and pushed up rapidly to the axilla. The cathetershould slip in easily, without resistance and without painor other sensation. All further manipulation is carriedout under fluoroscopic control.
The arm is held in internal rotation and the patient'shead and neck are inclined as far laterally as possibletowards the operative side to prevent entrance of thecatheter into the internal jugular vein. Any obstructionmet at the axilla will usually be overcome by abductingthe arm, or by raising the shoulder girdle headwards,while the catheter is withdrawn a little and advanced again.
The curve in the distal end of the catheter, as previouslydescribed, does not influence the flexibility of the wholesystem and is helpful in correcting false routes which maybe taken by the catheter tip. Of these, the most frequent
1 This catheter has been specially designed and providedby the United States Catheter and Instrument Corpora-tion, Glens Falls, NewYork.
106
CARDIAC OUTPUTBY RIGHT HEART CATHETERIZATION
is passage upward into the internal jugular vein. If theend of the catheter goes into this vein, partial withdrawaland rotation of the curved tip with subsequent reinsertionwill usually direct the catheter downward into the auricle.If slight pain or veno-constriction develops at the pointof introduction of the catheter into the basilic vein, as aresult of withdrawal, rotation, and other manipulation,these are usually overcome by infiltration of the peri-venous tissue with novocaine.
B. Position of catheter in auricle or ventricleWhen the catheter tip has passed beyond the jugular
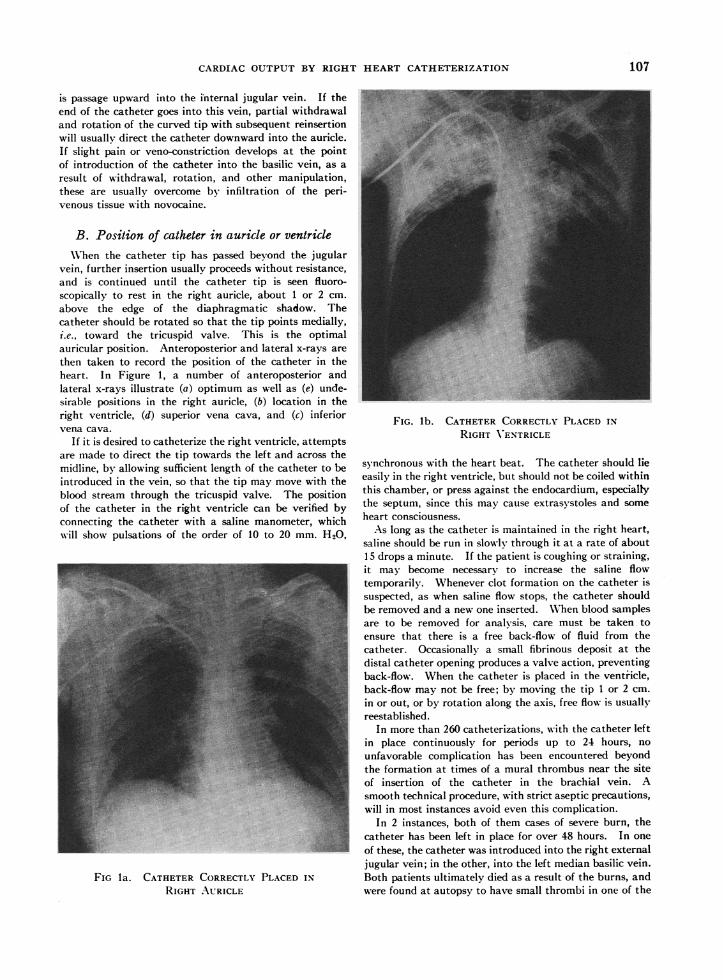
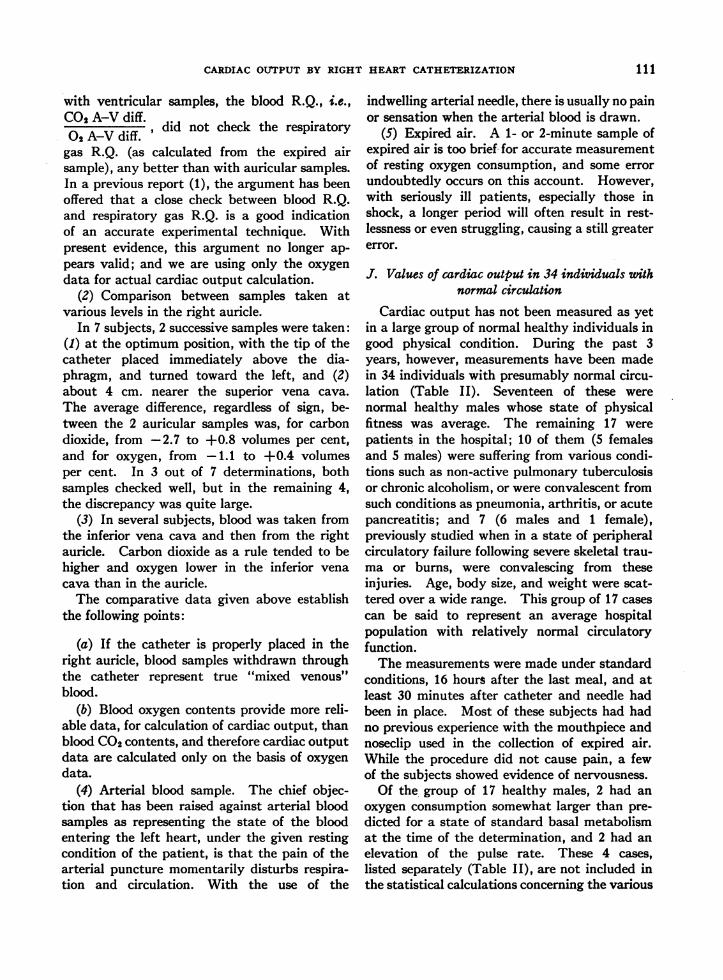
vein, further insertion usually proceeds without resistance,and is continued until the catheter tip is seen fluoro-scopically to rest in the right auricle, about 1 or 2 cm.above the edge of the diaphragmatic shadow. Thecatheter should be rotated so that the tip points medially,i.e., toward the tricuspid valve. This is the optimalauricular position. Anteroposterior and lateral x-rays arethen taken to record the position of the catheter in theheart. In Figure 1, a number of anteroposterior andlateral x-rays illustrate (a) optimum as well as (e) unde-sirable positions in the right auricle, (b) location in theright ventricle, (d) superior vena cava, and (c) inferiorvena cava.
If it is desired to catheterize the right ventricle, attemptsare made to direct the tip towards the left and across themidline, by allowing sufficient length of the catheter to beintroduced in the vein, so that the tip may move with theblood stream through the tricuspid valve. The positionof the catheter in the right ventricle can be verified byconnecting the catheter with a saline manometer, whichwill show pulsations of the order of 10 to 20 mm. H20,
FIG la. CATHETERCORRECTLYPLACED IN
RIGHT AURICLE
FIG. lb. CATHETERCORRECTLYPLACED INRIGHT VENTRICLE
synchronous with the heart beat. The catheter should lieeasily in the right ventricle, but should not be coiled withinthis chamber, or press against the endocardium, especiallythe septum, since this may cause extrasystoles and someheart consciousness.
As long as the catheter is maintained in the right heart,saline should be run in slowly through it at a rate of about15 drops a minute. If the patient is coughing or straining,it may become necessary to increase the saline flowtemporarily. Whenever clot formation on the catheter issuspected, as when saline flow stops, the catheter shouldbe removed and a new one inserted. WVhen blood samplesare to be removed for analysis, care must be taken toensure that there is a free back-flow of fluid from thecatheter. Occasionally a small fibrinous deposit at thedistal catheter opening produces a valve action, preventingback-flow. When the catheter is placed in the ventricle,back-flow may not be free; by moving the tip 1 or 2 cm.in or out, or by rotation along the axis, free flow is usuallyreestablished.
In more than 260 catheterizations, with the catheter leftin place continuously for periods up to 24 hours, nounfavorable complication has been encountered beyondthe formation at times of a mural thrombus near the siteof insertion of the catheter in the brachial vein. Asmooth technical procedure, with strict aseptic precautions,will in most instances avoid even this complication.
In 2 instances, both of them cases of severe burn, thecatheter has been left in place for over 48 hours. In oneof these, the catheter was introduced into the right externaljugular vein; in the other, into the left median basilic vein.Both patients ultimately died as a result of the burns, andwere found at autopsy to have small thrombi in one of the
107

COURNAND,RILEY, BREED, BALDWIN, AND RICHARDS
FIG. 1C. CATHETERToo Low, riP IN INFERIORVENA CAVA
great veins traversed by the catheter. It should be notedthat both were cases where the catheterization was accom-plished only with great difficulty, and with definitecontamination of the surgical field. Under the circum-stances, the catheter afforded the only means of adminis-tering plasma and other fluids. Pathological study of thegross specimen of the auricular and ventricular wall, andserial section, especially of the tricuspid valve, were madein a number of cases; they failed to reveal any damage tothe endocardium or valve leaflets. In 1 of the 2 casesabove described, where the catheter was left in place morethan 48 hours, a small pulmonary infarct was found atautopsy. This was the only instance of ptulmonaryinfarction.
A point of some importance, though not directlyconcerned with cardiac output determination, is that wehave from the beginning endeavored to hold to the principlethat no injections be made through the catheter directlyinto the heart, except for non-irritant fluids such as saline,plasma, or whole blood.
C. Cannulization of the femoral arteryA special form of needle is used for this purpose. This
is a Lindeman-type, in which a medium bevel No. 22needle fits into a No. 19 outer sleeve, with blunt tip.The collar at the base of the needle is soldered about 1.5cm. down the No. 19 shaft, leaving the base of this shaftprojecting backwards free from the collar. When a Luer-lock syringe is attached for sampling, this free segment
goes directly into the end of the syringe, and contaminationfrom blood or blood-clot lying in the needle-collar is thusavoided.
In preparing the patient, the skin over the femoralartery is sterilized, the local region novocainized, and theneedle inserted into the femoral artery, then strapped inplace with adhesive. WVith the usual precautions, espe-cially avoiding flexion of the thigh or motion of the hipjoint, a hematoma rarely develops, and has never been ofany serious consequence.
D. Expired airExpired air is collected and measured in a Tissot
spirometer or Douglas bag. A rubber mouthpiece andnoseclip are usually satisfactory, but it was frequentlyfound necessary to hold the patient's lips tightly aroundthe mouthpiece. The spirometer or Douglas bag is firstwashed out with expired air for a few minutes; the patientbeing thus acquainted with the procedure. This sampleis then discarded.
E. ProcedureA period of at least 30 minutes of absolute quiet,
following insertion of catheter and needle, during whichrespiration and pulse are repeatedly counted, should beprovided before the Fick procedure is started. Expiredair is collected over an accurately measured interval from1 to 2 minutes, or longer if desired, and if the subject isquiet. Fifteen seconds after the start of the expired air
FIG. Id. CATHETERToo HIGH, TiP IN SUPERIORVENA CAVA
108

CARDIAC OUTPUTBY RIGHT HEART CATHETERIZATION
FIG. le. CATHETER TiP IMPROPERLY PLACED, LYINGAGAINST LATERAL AURICULAR WALL
collection, mixed venous blood sampling is begun, followed15 seconds later by arterial blood sampling. Each bloodsample requires about 25 seconds to collect, and thesampling is thus spread out over a considerable part of theair collection period. The importance of the utmost care
in obtaining samples, and in the smooth running of theresearch team, cannot be overemphasized, both for thereliability of the data, and the relaxation and composure,
and maintenance of the "steady state" of the patient.
F. Collection of samples
(1) Mixed venous blood. The saline in the catheter isfirst flushed out by withdrawing 5 to 10 ml. of blood backthrough it in a 20 ml. syringe. A 15 ml. sample of mixedvenous blood is then taken under 5 ml. of oil in anothersyringe. Air contamination is excluded by a tight rubberadapter and a Luer-lock connection. (2) Arterial blood.This is similarly collected in an oil-containing syringeattached directly through Luer-lock connection to theindwelling arterial needle. Both samples are immediatelytransferred after needle connection to iced blood bottlescontaining 10 ml. of oil, previously boiled to remove theair, and crystals of anticoagulant (0.6 mgm. sodium fluorideand 4.5 mgm. neutral potassium oxalate dried in auto-clave). They are stirred slowly to prevent settling of redblood cells, taken directly to the laboratory, and theblood analyzed immediately for oxygen and carbon dioxide.More recently, blood has been collected into a syringe, thewall of which had been previously moistened with one
drop of heparin solution (liquaemin); mercury was used as
a seal and small rubber connections obturated with a
glass rod permit the filling of pipettes after a preliminaryperiod of rotation.
G. Analyses of samplesCarbon dioxide and oxygen contents of mixed venous
blood and arterial blood are done in duplicate on theVan Slyke-Neill apparatus. In addition, in the serieshere reported, oxygen capacity determination, and4pH.measurement, using the glass electrode, were made, inboth arterial and mixed venous blood samples. Expiredair samples were analyzed in the Haldane apparatus, todetermine oxygen intake and carbon dioxide output per
minute.
H. Example of calculationS. B. Age 36 years. WVeight 86 kgm. Body surface area
1.98 sq. m.
Carbon dioxide output, ml. per minute = 211Oxygen intake, ml. per minute = 289
211R.Q. = 0.73
Arterial blood carbon dioxide content, volumes per cent= 45.5
Arterial blood oxygen content, volumes per cent = 19.6Mixed venous blood oxygen content, volumes per cent
= 15.3Mixed venous blood carbon dioxide content, volumes per
cent = 48.7Carbon dioxide arterio-venous difference, volumes per cent
= 3.2Oxygen arterio-venous difference, volumes per cent = 4.3
3.2Blood R.Q. =- = 0.74
4.3Cardiac output from carbon dioxide data, in liters per
211minute =
32 I0= 6.603.2 X 10
Cardiac output from oxygen data, in liters per minute289= 29 = 6.72
4.3 X 10Average cardiac output = 6.66Pulse rate = 104
6.66Stroke volume = -06 = 64
104
Cardiac index (cardiac output in liters per minute persq. m. body surface) = 3.36
Cardiac output per 100 ml. of oxygen intake in liters6.66
X 100 = 2.306.66
Cardiac output per kgm. of weight in ml. = 86 = 77.5As will be indicated below, the cardiac output calculated
from the oxygen data is the more reliable figure.
I. Validity of the method
(1) Comparison between blood from the rightauricle and from the right ventricle.
The fundamental assumption upon which thepresent application of the "direct Fick" principle
109

COURNAND,RILEY, BREED, BALDWIN, AND RICHARDS
TABLE I
Comparison of respiratory gases in blood samples taken successively from right ventricle and right auricle
Right Right Differenceventricular aurictilar ventricular-
Name Diagnosis Date blood blood auiricular Time______________________________ _______________intervalC02 02 C02 02 C02 02
volumes per cent voltunes per cent voluines per cent minutesE. P. Normal 3/18/42 51.6 13.4 52.3 13.5 -0.7 -0.1I. M. Normal 2/ 3/43 52.5 12.0 51.1 13.2 +1.4 -1.2
2/11/43 54.3 10.8 54.1 10.7 +0.2 +0.1 6J. H. Pulm. fibrosis, emphysema 4/27/43 65.1 12.5 63.5 12.3 +1.6 +0.2 5I. AlI. Pulm. tbc., cor pulmonale, arthritis 5/ 4/43 53.7 11.1 53.5 10.9 +0.2 +0.2 3M. MI. Suppurative dis., rt. lung 5/ 7/43 53.0 10.1 52.9 10.1 +0.1 0 3H. Y. Chr. pulm. tbc., fibrosis, emphysema 5/20/43 46.9 15.7 46.7 15.8 +0.2 +0.1 2.5R. S. Arterial hypertension 11/23/43 45.8 15.6 46.3 15.5 -0.5 +0.1
1/13/43 53.9 11.4 53.7 11.3 +0.2 +0.1M. B. Hypertension 1/11/43 66.5 11.6 66.4 11.5 +0.1 +0.1C. B. Hypertension 1/19/43 55.2 6.5 53.5 6.5 +1.7 0F. S. Tricuspid insufficiency 4/15/43 47.0 14.1 48.5 14.0 -1.5 +0.1 2L. S. Arteriosclerotic heart dis. 4/20/43 58.3 16.5 59.9 16.4 -1.6 +0.1 1.5I. WV. Intestinal obstruction 3/ 3/43 79.4 6.9 79.2 7.0 +0.2 -0.1A. S. Gastric hemorrhage 1/ 9/43 52.8 11.9 52.6 11.9 +0.2 0 4B. W. Gastric hemorrhage 1/ 4/43 50.9 7.6 51.4 7.7 -0.5 -0.1 5W. B. Chest injury 3/ 4/43 38.8 9.3 39.3 9.1 -0.5 +0.2 1C. LeC. Head injury 2/13/43 39.8 9.7 39.7 9.6 +0.1 +0.1 5M. M. Compound fracture 10/30/42 42.8 7.4 42.8 6.8 0 +0.6 5S. R. Compound fracture 1/18/43 50.3 14.7 50.7 15.6 -0.4 -0.9 4
1/18/43 49.0 14.9 48.8 14.8 +0.2 +0.1 5J. S. Compound fracture 1/22/43 56.2 10.2 54.1 10.5 +2.1 -0.3 5B. T. Compound fracture 1/26/43 43.9 10.3 43.8 10.1 +0.1 +0.2 3WV. H. Compound fracture 3/15/43 54.5 11.6 54.1 11.3 +0.4 +0.3 2J. O'L. Fractured pelvis 5/13/43 53.5 10.2 53.3 10.4 +0.2 -0.2 2J. MI. Comminuted fracture of the femur 5/19/43 42.6 9.4 44.9 9.6 -2.3 -0.2 3
of determining cardiac output is based, rests uponthe validity of the auricular sample as repre-sentative of true "mixe(d venous" blood. Evi-dence has recently been presented to the effectthat in dogs, right auiricular blood may bedifferent from right ventricular blood (2). Inthis work, however, no mention is made of theexact position of the catheter in the right auricle,or of any x-ray control of this position.
In 22 subjects, samples of blood were takensuccessively within a few minutes' time fromthe right ventricle an(d then, by withdrawingthe catheter a few cm., from the auricle. Theexact location of the tip of the catheter in theauricle was ascertained by fluoroscopy and inmost instances by x-ray films. Table I givesthe results of separate analysis of blood CO2 and02 contents in 22 cases, with differences observedbetween both sets of samples. The averagedifference, regardless of sign, between ventricularand auricular samples was, for carbon dioxide,0.42 volumes per cent, and for oxygen, 0.26volumes per cent. The range of differences for
carbon dioxide was from -0.7 to +2.3 volumesper cent, and for oxygen, from - 1.2 to +0.6volumes per cent. In 19 out of 22 doubledeterminations, the difference between ventric-ular and auricular 02 content was 0.3 volumesper cent or less. In 1 instance, the differencewas +0.6 volumes per cent, ain(l in the 2 re-maining cases where the difference was highest,a repeated determination in the same subject,either the same day or at a later date, providedexcellent checks. In general, the comparison ofoxygen content, in both ventricular and auricularsamples, supports the assumption that the au-ricular sample is trulNr representative of mixedvenous blood. The greater discrepancy betweencarbon dioxide contents of ventricular and au-ricular blood is not unexpected; since it is knownthat blood CO2 values are continually changing,in response to slight alterations in respiratoryor circulatory equilibrium. In one-half of thecases, however, the CO2 content difference be-tween samples is within the error of the tech-nique of gas analysis. I t was observed that
110
CARDIAC OUTPUTBY RIGHT HEART CATHETERIZATION
with ventricular samples, the blood R.Q., i.e.,CO2A-V diff, did not check the respiratory02 A-V duff.
gas R.Q. (as calculated from the expired airsample), any better than with auricular samples.In a previous report (1), the argument has beenoffered that a close check between blood R.Q.and respiratory gas R.Q. is a good indicationof an accurate experimental technique. Withpresent evidence, this argument no longer ap-pears valid; and we are using only the oxygendata for actual cardiac output calculation.
(2) Comparison between samples taken atvarious levels in the right auricle.
In 7 subjects, 2 successive samples were taken:(1) at the optimum position, with the tip of thecatheter placed immediately above the dia-phragm, and turned toward the left, and (2)about 4 cm. nearer the superior vena cava.The average difference, regardless of sign, be-tween the 2 auricular samples was, for carbondioxide, from -2.7 to +0.8 volumes per cent,and for oxygen, from -1.1 to +0.4 volumesper cent. In 3 out of 7 determinations, bothsamples checked well, but in the remaining 4,the discrepancy was quite large.
(3) In several subjects, blood was taken fromthe inferior vena cava and then from the rightauricle. Carbon dioxide as a rule tended to behigher and oxygen lower in the inferior venacava than in the auricle.
The comparative data given above establishthe following points:
(a) If the catheter is properly placed in theright auricle, blood samples withdrawn throughthe catheter represent true "mixed venous"blood.
(b) Blood oxygen contents provide more reli-able data, for calculation of cardiac output, thanblood CO2contents, and therefore cardiac outputdata are calculated only on the basis of oxygendata.
(4) Arterial blood sample. The chief objec-tion that has been raised against arterial bloodsamples as representing the state of the bloodentering the left heart, under the given restingcondition of the patient, is that the pain of thearterial puncture momentarily disturbs respira-tion and circulation. With the use of the
indwelling arterial needle, there is usually no painor sensation when the arterial blood is drawn.
(5) Expired air. A 1- or 2-minute sample ofexpired air is too brief for accurate measurementof resting oxygen consumption, and some errorundoubtedly occurs on this account. However,with seriously ill patients, especially those inshock, a longer period will often result in rest-lessness or even struggling, causing a still greatererror.
J. Values of cardiac output in 34 individuals withnormal circulation
Cardiac output has not been measured as yetin a large group of normal healthy individuals ingood physical condition. During the past 3years, however, measurements have been madein 34 individuals with presumably normal circu-lation (Table II). Seventeen of these werenormal healthy males whose state of physicalfitness was average. The remaining 17 werepatients in the hospital; 10 of them (5 femalesand 5 males) were suffering from various condi-tions such as non-active pulmonary tuberculosisor chronic alcoholism, or were convalescent fromsuch conditions as pneumonia, arthritis, or acutepancreatitis; and 7 (6 males and 1 female),previously studied when in a state of peripheralcirculatory failure following severe skeletal trau-ma or burns, were convalescing from theseinjuries. Age, body size, and weight were scat-tered over a wide range. This group of 17 casescan be said to represent an average hospitalpopulation with relatively normal circulatoryfunction.
The measurements were made under standardconditions, 16 hours after the last meal, and atleast 30 minutes after catheter and needle hadbeen in place. Most of these subjects had hadno previous experience with the mouthpiece andnoseclip used in the collection of expired air.While the procedure did not cause pain, a fewof the subjects showed evidence of nervousness.
Of the group of 17 healthy males, 2 had anoxygen consumption somewhat larger than pre-dicted for a state of standard basal metabolismat the time of the determination, and 2 had anelevation of the pulse rate. These 4 cases,listed separately (Table II), are not included inthe statistical calculations concerning the various
III

112 COURNAND,RILEY, BREED, BALDWIN, AND RICHARDS
TABLE II
Measurements of cardiac output under standard conditions in 34 subjects wvith normal circulation
Oxy- Cardiac outputBody Hemo- gen. ar- _____ Oxy- Ven-
Age sur- Wt. glo- terio- -__-- gen, in- tila- R.Q. Pulse Resp. Commentface bin venous pr take tion rate rate
duff .pevol- L. per mi. ml. per L. per
years sq. m. kgm. grams umes min. per per ml. min. per min. perper cent, sq. m. kgm. sq. M. sq. M.
A. 13 normal males under standard basal conditions
P. H. 52 1.80 68.0 14.8 6.0 2.12 56.5 68 128 3.41 0.83 56 12F. K. 41 1.71 61.0 13.8 4.5 3.55 99.0 98 160 4.38 0.92 61 14W.O'B. 44 1.70' 56.0 14.7 4.9 3.17 96.0 69 155 5.62 0.84 78 17H. W. 37 1.74 61.0 12.7 4.5 3.14 89.5 71 138 4.11 0.89 77 14W.0. B. 49 1.88 71.5 13.4 5.4 2.71 71.5 78 147 4.77 0.82 65 22J. B. 32 1.81 68.0 14.8 4.7 2.91 77.5 81 134 4.17 0.82 65 17J. T. 21 1.82 69.5 14.5 3.5 4.01 104.5 108 151 3.79 0.83 67 1 7H. P. 26 2.02 79.5 14.0 3.5 3.38 86.0 100 118 2.95 0.82 68 14I. M. 44 1.48 49.5 12.4 4.3* 2.93 87.5 85 126 3.23 0.74 51 100. E. 32 1.97 79.0 14.8 3.6* 3.54 88.5 103 127 4.08 0.81 68 18J. P. 35 1.38 42.0 14.0 4.4 2.75 90.5 53 121 3.91 0.79 72 14A. H. 43 1.79 65.0 13.7 4.0* 3.47 96.0 99 139 4.13 0.74 63 18P. McK. 39 1.77 67.0 16.4 5.2 2.86 75.5 74 149 3.86 0.71 68 15
Average 38 1.77 64.5 14.2 4.5 3.12 87.3 84 138 4.04 0.82 66 16Standarddeviation ±-9.1 4±0.19 ±-10.6 ±11.0 ±-0.7 ±40.40 4±13.2 4±17.0 ±413.7 ±-0.64 ±-0.05 ±-7.6 ±-3.02
B. 4 normal males with increased oxygen consumption and/or pulse rate
L. K. 58 1.60 54.5 12.2 5.2 2.99 88.0 44 155 4.88 0.94 108 20 Rapid pulse.J. K. 53 1.35 44.0 13.4 5.3* 3.10 95.5 35 164 8.15 0.83 120 25 Rapid pulse.J. L. 39 1.68 57.0 13.7 4.7 3.99 117.5 70 187 4.84 0.78 96 12 Rapid pulse. Elevated
oxygen -consumption.D. M. 40 2.00 90.0 14.9 4.8* 3.65 81.0 107 175 4.32 0.71 68 15 Elevated oxygen con-
sumption.
Average 48 1.66 61.4 13.6 5.0 3.43 95.5 64 170 5.55 0.82 98 18
C. 11 hospital male patients with normal circulation
J. D. 21 1.79 62.0 14.6 4.4 2.97 86.0 63 131 4.26 0.78 89 22 Afebrile apical tubercu-losis.
N. S. 38 1.67 60.0 12.5 3.6 3.01 83.5 59 109 3.79 1.04 85 14 Afebrile apical tubercu-losis.
S. V. 37 1.52 64.0 14.3 4.4 4.25 100.0 77 186 6.11 0.88 83 18 Rheumatoid arthritis.F. M. 43 1.93 70.5 11.9 3.5* 3.93 107.5 95 137 4.94 0.77 80 16 Chr. alcoholism.
Anemia.W. H. 57 1.62 57.5 9.5 3.8* 4.05 114.0 71 154 6.29 0.81 92 22 Post pneumonia.
Anemia.A. V. 49 1.94 71.0 10.8 4.0 3.91 107.0 100 157 5.71 1.01 76 13 Convalescent-Burns.T. D. 48 1.61 52.0 9.7 4.2* 3.49 108.0 56 147 3.80 0.76 100 12 Convalescent--Skeletal
trauma and anemia.P. Y. 55 1.48 5 1.0 11.9 5.0* 3.93 114.0 48 197 6.60 0.67 120 25 Convalescent-Skeletal
trauma and anemia.J. S. 45 1.74 68.0 11.0 4.6* 3.92 100.0 97 180 3.56 0.70 70 8 Convalescent--Skeletal
trauma and anemia.J. D. 62 1.61 57.0 9.0 5.1 3.44 97.5 63 '176 4.90 0.61 88 18 Convalescent--Skeletal
trauma and anemia.W. Br. 46 1.83 71.0 11.1 4.2 4.03 104.0 80 172 5.32 0.74 92 22 Convalescent-Skeletal
trauma and anemia.
Average 46 1.70 62.2 1 1.5 4.3 3.72 101.9 74 159 5.03 0.80 89 17
D. 6 hospital female patients with normal circulation
D. L. 32 1.54 55.5 12.8 3.6 2.60 72.0 43 112 3.35 0.76 112 18 Afebrlle apical tubercti-losis.
M. Mc. 32 1.43 48.5 11.3 4.2 2.93 84.5 50 123 4.47 0.79 84 18 Afebrile apical tubercu-losis andi anemia.
F. K. 33 1.60 56.0 12.2 4.0* 2.34 67.0 65 94 3.34 0.77 58 12 Minimal tuberculosis.J. C. 56 1.42 47.5 9.9 3.6* 3.32 98.5 59 120 2.81 0.69 80 14 Chr. alcoholism.
Anemia.E. D. 22 1.63 59.5 10.6 4,7* 2.64 72.5 60 124 4.36 0.83 72 18 Convalescet-Anemia.M. M. 48 1.42 42.0 11.9 3.5 4.13 143.0 66 145 4.81 0.73 92 18 Post skeletal trauma.
Convalescent anemia.
Average 37 1.51 51.5 1 1.5 3.9 2.99 89.6 57 120 3.87 0.73 83 16
Averageall 34 42 1.69 -61.0 12.8 4.5 3.32 89.0 73 145 4.51 0.81 82 17cases __ __
*Mixed venous samples from right ventricle,

CARDIAC OUTPUTBY RIGHT HEART CATHETERIZATION
0 tO 20 30 40 50 80
A GE, iRS.
0
G.
wir
5,-
t 4-
a
0Z 3.hi
0
0 go 20
FIG. 2. SCATTER DIAGRAMSSHOWINGCORRELATIONBETWEENCARDIAC INDEX AND AGE, ON THE LEFT;
AND OXYGENARTERIO-VENOUSDIFFERENCE AND AGE, ON THE RIGHT
measurements related to cardiac output underbasal conditions in healthy males. The hospital-ized subjects in the table are separated into 2groups according to sex (Table II).
The data obtained on the 13 normal malesubjects reveal the following: (1) The average
values for 02 arterio-venous difference, and ofcardiac output in liters per minute per squaremeter of body surface are higher than theaccepted figures for these measurements basedon foreign gas methods of cardiac output deter-mination. (2) There is an apparently signifi-cant influence of age upon oxygen arterio-venousdifference and upon cardiac output; this isillustrated in the 2 scatter diagrams of Figure 2.
The data on the hospital patients show: (1) inthe male group, larger average figures for cardiacoutput than in the healthy male group andslightly lower figures for stroke volume, thisincrease associated with faster pulse rate andlarger oxygen consumption with little change inarterio-venous difference; (2) in the female group,
a lower average figure for arterio-venous differ-ence, cardiac index, stroke volume, and oxygen
consumption, with a more rapid pulse rate thanin the healthy male group.
For purposes of comparison, the figures ofcardiac output determinations by the ethyliodide method, carried out on a group of normalindividuals similar to our 13 normal male sub-
TABLE III
Statistics of cardiac output measured by 3 methods in 3 different groups of normal heathy males under basal conditions
Starr ce al. Nylin Coumand ct al. Significance ofEthyl iodide Acetylene "Direct Fick" difference between
21 cases 19 cases 13 cases means in groups:
St. St. St. 1-3 2-3Mean devia- Mean devia- Mean devia- -
tion tion tion P P
Age, years 32.8 4 8.7 39 'i 9.1 >0.05Body surface area, sq. m. 1.84 4: 0.14 1.79 ± 0.15 1.77 ± 0.19 >0.10 >0.10Pulse rate 65 ± 9 71 ±10 66 4 8 >0.10 >0.1002 intake, ml. per min. per sq. m. 130 418 132 414 138 414 >0.10 >0.10O2 arterio-venous diff., volumes per cent 5.5 + 1.4 5.5 i 0.7 4.5 ± 0.7 >0.01<0.02 <0.0004Cardiac output, L. per min. per sq. m. 2.45 A 0.50 2.46 4 0.37 3.12 4 0.40 <0.0004 <0.0004Stroke volume, ml. per beat 72 420 64 ±13 84 17 >0.05 <0.0004
P is the probability that the difference would appear by chance and is expressed as a decimal factor (1.00 is 100per cent probability).
113
i
".S'4.
a
I-
3.30-
g .2-U
00 *
* . : *.
0
* 0.0@
0@0
I I I I I I
30 40
AGE, YRS.
50 60
i.
1.

COURNAND,RILEY, BREED, BALDWIN,, AND RICHARDS
jects, have been taken from published data (3), As the table shows, the 3 groups were similarand a comparable set of figures of cardiac output so far as concerns age, body size, pulse rate, andby the acetylene method (4). The 2 sets of oxygen consumption.figures are compared statistically with our data Cardiac output, however, is significantly largerin Table III. by our direct Fick- technique than by either the
TABLE IV
Repeated measurement of the circultion on two normal individuals at various intervals
Patient I. M. 44 P. H. 54
Date 2-3-43 2-3-43 2-11-43 2-11-43 7-22-43 7-29-43 2-18-41 7-26-43
2 hrs. 2 hrs.later later
0t consumption, ml. per min. per sq. m. 144 126 131 128 115 122 128 115Heart rate 51 51 57 56 64 62 56 56Cardiac index, L. per min. per sq. m. 3.13 2.93 3.28 3.21 3.13 2.85 2.12 2.31Stroke volume, ml. per beat 91 85 84 83 72 68 68 74Arterio-venous difference, ml. per L. blood 4.6* 4.3* 4.0* 4.0* 3.7 4.3 6.0 5.0
* Mixed venous blood sample from the right ventricle.
TABLE V
State of respiratory gases in mixed venous and arterial blood in 33 "hospital norma" subjects.~~~~~~~
COs content pCO, pHs Oxygen saturation
Ar- Mixed Arterio- Ar- Mixed Arterio- Ar- Mixed Arterio- Ar- Mixedterial venous venous terial venous venous terial venous venous terial venousblood blood diff. - blood blood diff. blood blood diff. blood blood
swoums per cext mm. Hg - per centP. H. 50.1 55.0 4.9 41.0 44.8 3.8 7.42 7.39 0.03 96 66.0F. K. 57.2 61.5 4.3 46.0 53;0 7.0 7.42 7.39 0.03 96 72.0W. O'B. 48.8 52.8 4.0 40.0 46.5 6.5 7.42 7.39 0.03 96 71.0H. W. 50.1 54.1 4.0 39.0 44.8 5.8 7.42 7.39 0.03 96 67.0W. 0. B. 48.0 52.6 4.6 38.2 44.8 6.6 7.42 7.39 0.03 96 66.0J. B. 47.6 51.3 3.7 39.0 46.0 7.0 7.42 7.39 0.03 96 72.5J. T. 51.5 54.9 3.4 40.8 46.5 5.7 7.43 7.40 0.03 97 81.0H. P. 48.3 52.7 4.4 39.9 45.8 5.9 7.41 7.39 0.02 96 77.5
I. M. 48.1 52.5 4.4 40.0 47.2 7.2 7.39 7.36 0.03 98 70.40. E. 46.5 49.7 3.2 29.0 33.0 4.0 7.46 7.43 0.03 98 80.0
P. 50.6 53.4 2.8 40.0 44.8 4.8 7.43 7.40 0.03 92 69.0L. K. 45.7 50.5 4.8 36.0 42.8 6.8 7.42 7.39 0.03 96 64.0D. 46.2 49.9 3.7 37.8 44.0 6.2 7.42 7.39 0.03 94 71.0
N. S. 54.3 58.1 3.8 45.8 49.0 3.2 7.39 7.36 0.03 94 72.0J. K. 45.0 50.0 5.0 35.4 41.7 6.3 7.43 7.40 0.03 93 63.0A. H. 51.5 55.4 3.9 40.1 46.2 6.1 7.42 7.40 0.02 98 76.0D. L. 49.2 51.9 2.7 38.9 42.4 3.5 7.43 7.41 0.02 94 73.0M. M. 7.42 7.39 0.03 96 74.5F. K. 48.6 52.9 4.3 38.8 42.9 4.1 7.41 7.39 0.02 97 73.0A. V. 39.7 43.8 4.1 25.0 29.9 4.9 7.52 7.47 0.05 95 68.0T. D. 50.7 53.9 3.2 37.0 42.5 5.5 7.44 7.40 0.04 97 64.0F. M. 52.7 56.8 4.1 94 72.0W. H. 50.6 54.4 3.8 98 69.0
J.C. * 56.9 59.7 2.8 40.2 44.7 4.5 7.46 7.43 0.03 96 69.0L. Mc. 49.8 53.2 3.4 38.9 44.0 5.1 7.42 7.39 0.03 97 70.0E. D. 42.5 47.4 4.9 33.5 39.1 5.6 7.41 7.39 0.02 98 64.5P. Y. 44.5 46.1 2.2 34.4 38.5 4.1 7.43 7.40 0.03 97 63.5J. L. 51.3 54.9 3.6 41.0 47.0 6.0 7.42 7.39 0.03 96 70.0S. V. 49.8 53.8 4.0 40.7 46.4 5.7 7.42 7.39 0.03 95 73.0D. M. 42.0 46.3 4.3 32.0 37.0 5.0 7.46 7.43 0.03 97 73.0
S. S. 53.1 57.1 4.1 38.7 43.9 5.2 7.45 7.43 0.02 97 65.0.D. 50.2 53.5 3.3 38.0 44.0 6.0 7.42 7.39 0.03 96 53.5
W. Br. 51.3 54.4 3.1 40.9 46.0 5.1 7.41 7.38 0.03 94 67.0
Average all 49.1 53.0 3.8 38.2 43.6 5.4 7.43 7.40 0.03 96 69.8cases
114

CARDIAC OtJTPtJT BY RIGHT fl'ART CATHETERIZATION
ethyl iodide or the acetylene methods. Theoxygen arterio-venous difference by the directFick method is correspondingly smaller, thoughthe comparison with the ethyl iodide methodshows here a lesser significance because of thelarge scatter in the latter measurements andtherefore larger standard deviation.
The average cardiac index by the direct Ficktechnique, 3.12 liters per minute per squaremeter body surface, is 26:8 per cent above theaverage by the 2 foreign gas methods. Cardiacoutputs by the direct Fick technique and by theballistocardiograph (5) have recently been com-pared (6), the two measurements being carriedout on the individual subjects practically simul-taneously. The ballistocardiograph gives resultsclosely similar to the ethyl iodide method. Thecomparison showed the average cardiac output(fourteen measurements) by the direct Ficktechnique to be 18.5 per cent higher than bythe ballistocardiograph.
Further comparison of "direct" and "indirect"methods should be made by simultaneous meas-urements on the same individuals.
Two additional points may be mentionedrelative to the reliability of our present tech-niques. (a) In 14 pairs of duplicate determina-tions, each duplicate set carried out within one-half hour, the average deviation from the meanwas 2.6 per cent, with a range from 0.4 to 6.0per cent. (b) On subject I. M., a normal con-trol, 6 separate determinations were made, thefinal 2 being carried out 5 months after the first,and by a different research team (results kindlycommunicated by Dr. Herbert Chasis of NewYork University). The constancy of the find-ings is shown in Table IV. A similar comparisonof results 5 months apart, is given in Table IVfor subject P. H., another normal control. Dr.Chasis also made the second of these determina-tions. This subject had the lowest cardiac indexof all the normal control subjects.
K. State of respiratory gases in mixed venous bloodand arterial blood in 33 normal and
"hospital normal" subjects
In 33 out of the 34 cases previously mentioned,pH. determinations on mixed venous blood andarterial blood samples were made with a glass
electrode, and Rockefeller Institute type ofpotentiometer, in addition to determinations ofCO2and 02 content and 02 capacity. By usingthe Van Slyke et al. and the Dill et al. normo-grams, pCO2 was then calculated. A completepicture of the state of the respiratory gases inmixed venous blood and arterial blood was thusobtained. Direct measurements of simultaneoussamples of arterial and mixed venous blood, innormal subjects, have not previously been re-ported (Table V).
Summary
1. A method of measurement of cardiac outputin man, by the "direct Fick" principle, using thetechnique of catheterization of the right auricleor right ventricle, is described in detail. Thevalidity of the method is discussed.
2. More than 260 catheterizations of the rightheart have been carried out with no unfavorablecomplication other than linear thrombus forma-tion at times near the site of insertion of thecatheter in the brachial vein.
3. In a group of 13 normal healthy males, theaverage cardiac index (cardiac output in litersper minute per square meter of body surface)was 3.12. This figure is 26.8 per cent higherthan the average values for cardiac index fromcomparable groups of normal subjects by theethyl iodide and by the acetylene methods.
4. Measurements of cardiac output and of therespiratory gases in arterial and mixed venousblood are reported on a total of 34 normal and"hospital normal" subjects.
BIBLIOGRAPHY
1. Cournand, A., and Ranges, H. A., Catheterization ofthe right auricle in man. Proc. Soc. Exper. Biol.and Med., 1941, 46, 462.
2. Holt, J. P., and Knoefel, P. K., The oxygen content ofblood in right auricle and right ventricle. Federa-tion Proceedings: American Physiological Society,1944.
3. Starr, I., Jr., Collins, L. H., Jr., and Wood, F. C.,Studies of the basal work and output of the heartin clinical conditions. J. Clin. Invest., 1933, 12, 13.
Starr, I., Jr., Donal, J. S., Margolies, A., Shaw, R.,Collins, L. H., and Gamble, C. J., Studies of theheart and circulation in disease; estimations of basalcardiac output, metabolism, heart size, and blood
1-15

COURNAND,RILEY, BREED, BALDWIN, AND RICHARDS
pressure. in 235 subjects. J. Clin. Invest., 1934,13, 561.
4. Nylin, G., Clinical tests of the function of the heart.Acta Med. Scandinav., 1933, supp. 52, 1.
5. Starr, I., and Schroeder, H. A., Ballistocardiogram.II. Normal standards, abnormalities commonly
found in diseases of the heart and circulation, andtheir significance. J. Clin. Invest., 1940, 19, 437.
6. Cournand, A., Ranges, H. A., and Riley, R. L., Com-parison of results of the normal ballistocardiogramand a direct Fick method in measuring the cardiacoutput in man. J. Clin. Invest., 1942, 21, 287.
116