Int. J. Biosci. - International network for natural … · 2017-12-16 · Int. J. Biosci. 2017...
14
116 Kafom et al. Int. J. Biosci. 2017 RESEARCH PAPER OPEN ACCESS Agro-Ecological areas in Senegal affect the genetic structure of Callosobruchus maculatus F. The major pest of cowpea Ange Choupette Kafom 1 , Daouda Barry 1 , Tofféne Diome 1 , Adiouma G. R. J. Sarr 1 , Mbacké Sembene *1,2 1 Department of Animal Biology, Faculty of Science and Technics, C. A. Diop University, Dakar Fann, Senegal 2 BIOPASS, UMR 022, IRD-CBGP, Dakar Bel-Air, Senegal Key words: C. maculatus, Agroecological areas, Haplotype, Genetic diversity http://dx.doi.org/10.12692/ijb/11.6.116-129 Article published on December 12, 2017 Abstract The objective of this study is to characterizethe structure of populations associated with cowpea in several agro- ecological zones of Senegal, using genetic markers (sequencing) associated with Bayesian approaches such as Appoximated bayesian computation. Portions of the Cytochrome b gene of Callosobruchus maculatus L. were sequenced, using samples from agro-ecological areas in Senegal.Sequences show a rather high degree of polymorphism (hd = 0,920±0,00054; Pi= 0,06±0,00021). Results from genetic diversity analysis reveal a higher value of variable sites, number of mutations, haplotypic diversity, nucleotide diversity and number of nucleotide differences in agro-ecological zones of North Peanut Basin (hd =0.978 ± 0.054 ; Pi=0.13825 ± 0.02291) and Senegal River Valley (hd =1.000 ± 0.052 ; Pi=0.03372 ± 0.00777), areas where cowpea is the most widely cultivated in Senegal.The largest number of mutations (134) is observed in the NBA while the lowest value is obtained from SBA (3). Fst value reveals that the more genetically differentiated populations are those of the SBA and HCSO with a very high Fst value (0.75) whereas the minimum value is encountered between the individuals of the river valley and those South Peanut Basin. Recent studies increasingly highlight the effect of climate change in agro-ecological zones on the structure and dynamics of phytophagous insect populations. * Corresponding Author: Mbacké Sembene [email protected] International Journal of Biosciences | IJB | ISSN: 2220-6655 (Print), 2222-5234 (Online) http://www.innspub.net Vol. 11, No. 6, p. 116-129, 2017
Transcript of Int. J. Biosci. - International network for natural … · 2017-12-16 · Int. J. Biosci. 2017...
116 Kafom et al.
Int. J. Biosci. 2017
RESEARCH PAPER OPEN ACCESS
Agro-Ecological areas in Senegal affect the genetic structure of
Callosobruchus maculatus F. The major pest of cowpea
Ange Choupette Kafom1, Daouda Barry1, Tofféne Diome1, Adiouma G. R. J. Sarr1,
Mbacké Sembene*1,2
1Department of Animal Biology, Faculty of Science and Technics, C. A. Diop University,
Dakar Fann, Senegal
2BIOPASS, UMR 022, IRD-CBGP, Dakar Bel-Air, Senegal
Key words: C. maculatus, Agroecological areas, Haplotype, Genetic diversity
http://dx.doi.org/10.12692/ijb/11.6.116-129 Article published on December 12, 2017
Abstract
The objective of this study is to characterizethe structure of populations associated with cowpea in several agro-
ecological zones of Senegal, using genetic markers (sequencing) associated with Bayesian approaches such as
Appoximated bayesian computation. Portions of the Cytochrome b gene of Callosobruchus maculatus L. were
sequenced, using samples from agro-ecological areas in Senegal.Sequences show a rather high degree of
polymorphism (hd = 0,920±0,00054; Pi= 0,06±0,00021). Results from genetic diversity analysis reveal a
higher value of variable sites, number of mutations, haplotypic diversity, nucleotide diversity and number of
nucleotide differences in agro-ecological zones of North Peanut Basin (hd =0.978 ± 0.054 ; Pi=0.13825 ±
0.02291) and Senegal River Valley (hd =1.000 ± 0.052 ; Pi=0.03372 ± 0.00777), areas where cowpea is the most
widely cultivated in Senegal.The largest number of mutations (134) is observed in the NBA while the lowest value
is obtained from SBA (3). Fst value reveals that the more genetically differentiated populations are those of the
SBA and HCSO with a very high Fst value (0.75) whereas the minimum value is encountered between the
individuals of the river valley and those South Peanut Basin. Recent studies increasingly highlight the effect of
climate change in agro-ecological zones on the structure and dynamics of phytophagous insect populations.
* Corresponding Author: Mbacké Sembene [email protected]
International Journal of Biosciences | IJB |
ISSN: 2220-6655 (Print), 2222-5234 (Online)
http://www.innspub.net
Vol. 11, No. 6, p. 116-129, 2017
117 Kafom et al.
Int. J. Biosci. 2017
Introduction
Among the constraints on cowpea production, insect
pests are the biggest problem for cowpea. Cowpeas
are attacked by a wide spectrum of pests from
germination to harvest. In the very broad range of
these insect pests of cowpea, the Bruchidae beetles
including Callosobruchus maculatus Fabricius are
among the most formidable because their attacks
begin in the field, then to extend to the warehouse
where the population of bruchs can grow quickly. The
most worrying consequence of these attacks is the
qualitative and quantitative reduction of the harvest
in the field or during storage. In fact, the larvae of the
cowpea shrub grow exclusively in the seed by feeding
on the accumulated reserves in the cotyledons.
In this study, we aim to precisely characterize the
structure of populations associated with cowpea in
several agro-ecological zones of Senegal, using genetic
markers (sequencing) associated with Bayesian
approaches such as Appoximat and Bayesian
Computation; Baumont et al., 2002. Population
genetics is a field that allows, through the analysis of
DNA samples resulting from individuals in different
regions of the studied system, to define genetically
distinct populations in a species and to better
understand the evolutionary processes that govern
them. The use of genetic markers is a very effective
way to reveal differences in the genetic composition of
organisms living in an ecosystem and to know the
extent of differentiation caused by various
evolutionary forces between distinct populations
(Leclerc et al., 2006). Delimiting the populations of a
species in space and assessing the degree of
connectivity between them are essential steps in the
development of management scenarios that reflect
the reality of the system and answer the real needs of
people management. When we aim to develop natural
population management plans, it is essential to
delineate the populations of the studied system in
space and time accurately, as well as to assess the
degree of connectivity (i.e. gene flow) between them
(Webster et al., 2002). In fact, individuals of a species
are often grouped naturally in local populations
subjected to different evolutionary processes (natural
selection, mutation, drift and migration) and different
intensities, which generates distinct genetic
compositions for each of the groups. The existence of
populations more or less spatially isolated and
reproductively independent should be considered in
the management scenarios in order to avoid the loss
of local genetic luggage allowing adaptation to specific
conditions (Olver and Shuter, 1995). It is also
important to take into account that several genetically
distinct populations can be more or less connected to
one another by the movement of individuals and
thereby form a metapopulation, in which each
population is influenced by others (Hanski and
Simberloff, 1997). Interactions must be interpreted
both in their ecological context at a given time, and as
the result of past evolution between species involved
co-evolution. A common feature is the inclusion of
spatial-temporal heterogeneity of habitats, because it
plays a major role in modulating selection pressures
and constraints of all kinds (Futuyma, 1998; Hanski,
1999).
The questions discussed in this study can be
organized according to two main axes: A first one,
more descriptive, brings together the questions
relating to the establishment of a genetic
differentiation between weevils living in different
agro-ecological zones of Senegal: how can we detect
and quantify genetic differentiation? At what spatial
scale? How are the different characters involved? A
second axis, more mechanisms-centered, concerns
the questions relating to the relationship between
differentiation and the process of evolution, even of
speciation: are patterns of genetic differentiation
concordant? Can the patterns of spatial variability be
directly related to patterns of temporal variability?
What are the flows of genes and migrants between
individuals in the five geographical areas? In
particular, we will try to test several demographic
scenarios (ABC approaches). These will allow us to
test the hypothesis of the formation of new
geographical races, or even a possible allopatric
speciation. Collectively these researches should allow
better identification of populations of C. maculatus
susceptible to attack cowpea.
118 Kafom et al.
Int. J. Biosci. 2017
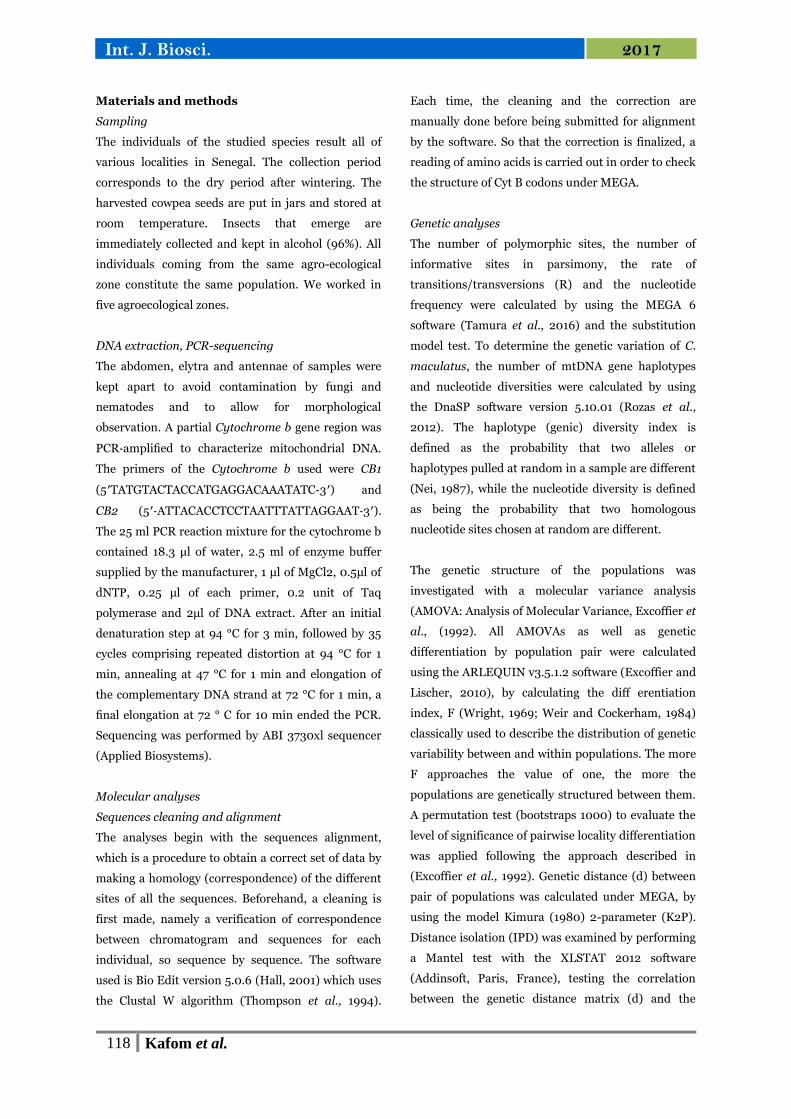
Materials and methods
Sampling
The individuals of the studied species result all of
various localities in Senegal. The collection period
corresponds to the dry period after wintering. The
harvested cowpea seeds are put in jars and stored at
room temperature. Insects that emerge are
immediately collected and kept in alcohol (96%). All
individuals coming from the same agro-ecological
zone constitute the same population. We worked in
five agroecological zones.
DNA extraction, PCR-sequencing
The abdomen, elytra and antennae of samples were
kept apart to avoid contamination by fungi and
nematodes and to allow for morphological
observation. A partial Cytochrome b gene region was
PCR‐amplified to characterize mitochondrial DNA.
The primers of the Cytochrome b used were CB1
(5′TATGTACTACCATGAGGACAAATATC‐3′) and
CB2 (5′‐ATTACACCTCCTAATTTATTAGGAAT‐3′).
The 25 ml PCR reaction mixture for the cytochrome b
contained 18.3 μl of water, 2.5 ml of enzyme buffer
supplied by the manufacturer, 1 μl of MgCl2, 0.5μl of
dNTP, 0.25 μl of each primer, 0.2 unit of Taq
polymerase and 2μl of DNA extract. After an initial
denaturation step at 94 °C for 3 min, followed by 35
cycles comprising repeated distortion at 94 °C for 1
min, annealing at 47 °C for 1 min and elongation of
the complementary DNA strand at 72 °C for 1 min, a
final elongation at 72 ° C for 10 min ended the PCR.
Sequencing was performed by ABI 3730xl sequencer
(Applied Biosystems).
Molecular analyses
Sequences cleaning and alignment
The analyses begin with the sequences alignment,
which is a procedure to obtain a correct set of data by
making a homology (correspondence) of the different
sites of all the sequences. Beforehand, a cleaning is
first made, namely a verification of correspondence
between chromatogram and sequences for each
individual, so sequence by sequence. The software
used is Bio Edit version 5.0.6 (Hall, 2001) which uses
the Clustal W algorithm (Thompson et al., 1994).
Each time, the cleaning and the correction are
manually done before being submitted for alignment
by the software. So that the correction is finalized, a
reading of amino acids is carried out in order to check
the structure of Cyt B codons under MEGA.
Genetic analyses
The number of polymorphic sites, the number of
informative sites in parsimony, the rate of
transitions/transversions (R) and the nucleotide
frequency were calculated by using the MEGA 6
software (Tamura et al., 2016) and the substitution
model test. To determine the genetic variation of C.
maculatus, the number of mtDNA gene haplotypes
and nucleotide diversities were calculated by using
the DnaSP software version 5.10.01 (Rozas et al.,
2012). The haplotype (genic) diversity index is
defined as the probability that two alleles or
haplotypes pulled at random in a sample are different
(Nei, 1987), while the nucleotide diversity is defined
as being the probability that two homologous
nucleotide sites chosen at random are different.
The genetic structure of the populations was
investigated with a molecular variance analysis
(AMOVA: Analysis of Molecular Variance, Excoffier et
al., (1992). All AMOVAs as well as genetic
differentiation by population pair were calculated
using the ARLEQUIN v3.5.1.2 software (Excoffier and
Lischer, 2010), by calculating the diff erentiation
index, F (Wright, 1969; Weir and Cockerham, 1984)
classically used to describe the distribution of genetic
variability between and within populations. The more
F approaches the value of one, the more the
populations are genetically structured between them.
A permutation test (bootstraps 1000) to evaluate the
level of significance of pairwise locality differentiation
was applied following the approach described in
(Excoffier et al., 1992). Genetic distance (d) between
pair of populations was calculated under MEGA, by
using the model Kimura (1980) 2-parameter (K2P).
Distance isolation (IPD) was examined by performing
a Mantel test with the XLSTAT 2012 software
(Addinsoft, Paris, France), testing the correlation
between the genetic distance matrix (d) and the
119 Kafom et al.
Int. J. Biosci. 2017
matrix of the Euclidean geographical distance (in km)
generated in Franson Coord Trans 2.3 (Gps Gate AB,
Johanneshov, Sweden) from the geographical
coordinates of each locality of collection. The Kendall
correlation coefficient was used and the level of
significance was tested based on 50,000 random
permutations.
Phylogenetic relationships between populations of C.
maculatus were estimated by the Bayesian inference
method with the software Mr. Bayes v. 3.1
(Huelsenbeck and Ronquist, 2001). We used the
Akaike Information Criterion (AIC) to estimate the
best evolution model for each sequence game and
selected in Paup and Mr. Modeltest v2.2 (Nylander,
2004). The Templeton algorithm et al. (1992) was
used to estimate haplotypic or allelic networks
relationships. The networks were built using TCS
software version 1.21 (Clement et al., 2000).
The demographic history of C. maculatus was
investigated by calculating the indices of Tajima's D
(Tajima, 1989) and Fu's Fs test (Fu, 1997) and by
analyzing the distribution disparity (mismatch
distribution). The indices of Tajima's D and Fu's Fs
are known to be sensitive to departures balance
mutation-drift due to the changes in population sizes
(eg expansion, bottleneck) and selection (Ramirez-
Soriano et al., 2008). These statistical parameters
were calculated using DnaSP, and the level of
significance was evaluated after 10,000 coalescing
simulations.
Under constant population size conditions, Tajima's
D and Fu's Fs are expected to approach zero, whereas
significantly negative or positive values suggest
sudden population expansions or bottlenecks
respectively. Significantly negative Fs values and non-
negative D values suggest recent demographic
expansion while the opposite suggests selection.
Distribution disparity analyses (mismatch
distribution) compare the observed distribution with
that expected from the number of nucleotide
mismatches between pairs of sequences. The expected
values were built by supposing a constant population
size: a recent fast growth of the population is
characterized by an unimodal distribution while a
multimodal distribution characterizes a population
with a demographic balance (Rogers andHarpending,
1992). The sum of squares of the deviations (SSD)
between the observed and expected distributions as
well as the irregularity index (rg) of the observed
distribution of the non-concordant classes was
calculated as a statistical test under the assumption of
a population in expansion using the ARLEQUIN
software.
Results and discussion
This study aims to characterize genetically
Callosobruchus maculatus ecotypes subservient to
different agroecological zones of Senegal. Insect pests
are the biggest constraint for the production and
preservation of cowpeas. Cowpea, one of the most
parasitized crops in Senegal, is attacked by a wide
spectrum of pests from germination to harvest.
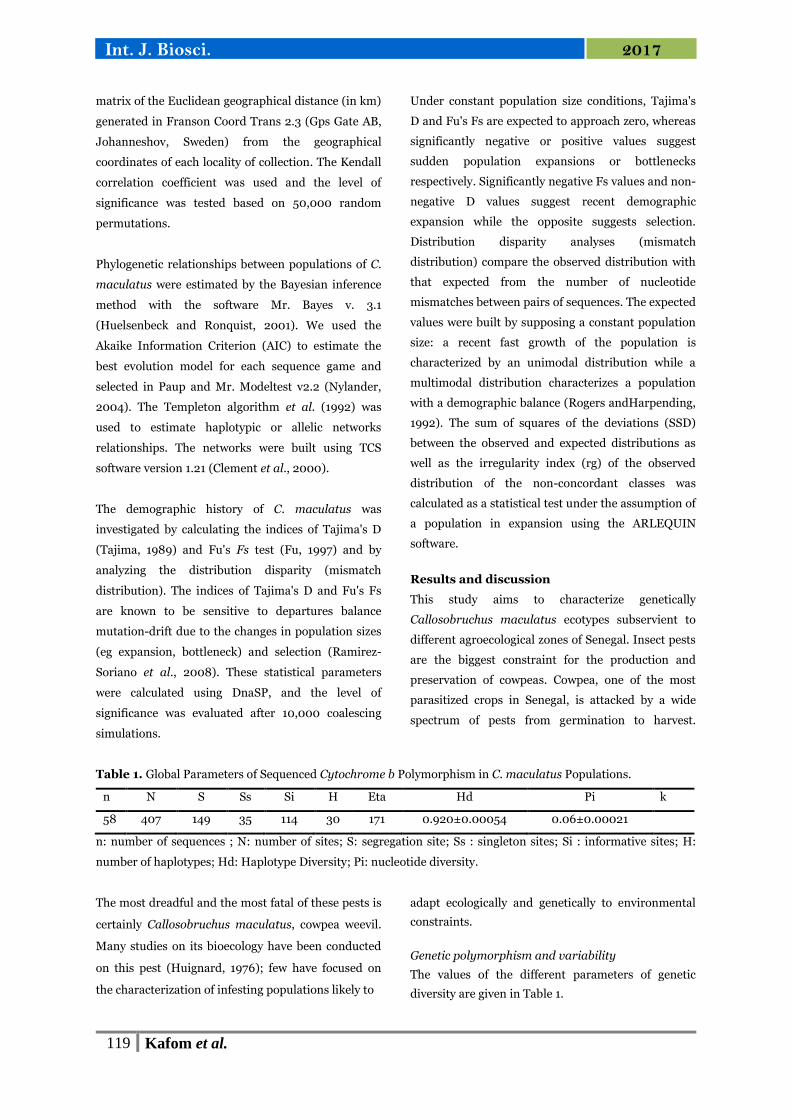
Table 1. Global Parameters of Sequenced Cytochrome b Polymorphism in C. maculatus Populations.
n N S Ss Si H Eta Hd Pi k
58 407 149 35 114 30 171 0.920±0.00054 0.06±0.00021
n: number of sequences ; N: number of sites; S: segregation site; Ss : singleton sites; Si : informative sites; H:
number of haplotypes; Hd: Haplotype Diversity; Pi: nucleotide diversity.
The most dreadful and the most fatal of these pests is
certainly Callosobruchus maculatus, cowpea weevil.
Many studies on its bioecology have been conducted
on this pest (Huignard, 1976); few have focused on
the characterization of infesting populations likely to
adapt ecologically and genetically to environmental
constraints.
Genetic polymorphism and variability
The values of the different parameters of genetic
diversity are given in Table 1.
120 Kafom et al.
Int. J. Biosci. 2017
Cytochrome b (Cytb) is a region located between the
positions 14747 and 15887 of the mitochondrial
genome, a length of 1140 bases in C. maculatus. As
required the encoding of proteins, no insertion,
deletion or stop codon are present in the 58 analyzed
sequences allowing concluding that the sequences
represent mitochondrial DNA and not nuclear
pseudogens.
The length of the C. Maculatus Cyt.b sequences
analyzed in this study is 407 base pairs (bp).
Sequences show a rather high degree of
polymorphism: 149 variable sites among which 35
singleton sites, 114 which are informative in
parsimony. Haplotype diversity (0.920 ± 0.00054),
as well as the nucleotide diversity (0.06007 ±
0.0002113) are positive.
Table 2. Genetic diversity of C. maculatus populations for each agro-ecological zone.
NBA SBA SP VFS HCSO
n 10 10 19 9 10
H 9 3 10 9 3
S 124 3 16 45 6
Eta 134 3 17 46 6
R 56.26 0.6 3.57 13.72 1.36
Hd 0.978 ± 0.054 0.378 ± 0.181 0.906 ± 0.040 1.000 ± 0.052 0.511 ± 0.164
pi 0.13825 ± 0.02291 0.00147 ± 0.00081 0.00879 ± 0.00190 0.03372 ± 0.00777 0.00333 ± 0.00187
K 56.267 0.6 3.579 13.72 1.36
n: number of individuals; H: number of haplotypes; Hd: Haplotype Diversity; Pi: Nucleotide diversity; S:
segregation site; Eta : Total number of mutations.
Table 3. Genetic differentiation (Fst) of C. maculatus populations between agro-ecological zones.
NBA SBA VFS SP HCSO
NBA 0.00000
SBA 0.55698** 0.00000
VFS 0.47479** 0.11783** 0.00000
SP 0.54577** 0.53961** 0.12196* 0.00000
HCSO 0.56662** 0.75677** 0.18342** 0.12754 0.00000
Non-significant values (p> 0.05) are not followed by asterisk; Significant values (p <0.05) are marked with *, very
significant (p <0.01) with **.
The 58 sequences analyzed in this study therefore
represent mitochondrial DNA and not nuclear
pseudogenes. A high level of genetic diversity in C.
maculatus populations is observed with 30
haplotypes found in 58 sequences analyzed. Both
haplotypic diversity and nucleotide diversity are
positive and high in the global population indicating a
large effective stable population signal or an
admixture signal from populations that have been
isolated from each other (Kébé et al., 2017). This
observation has already been made in other
Coleoptera populations subservient to stored and
marketed foodstuffs (Dia et al., 2014).
Table 4. Genetic distance (D) between and within agroecological zones of C. maculatus.
NBA SBA SP VFS HCSO
NBA 0
SBA 0.188 0
SP 0.2 0.02 0
VFS 0.196 0.01 0,023 0
HCSO 0.195 0,011 0,024 0,007 0
121 Kafom et al.
Int. J. Biosci. 2017
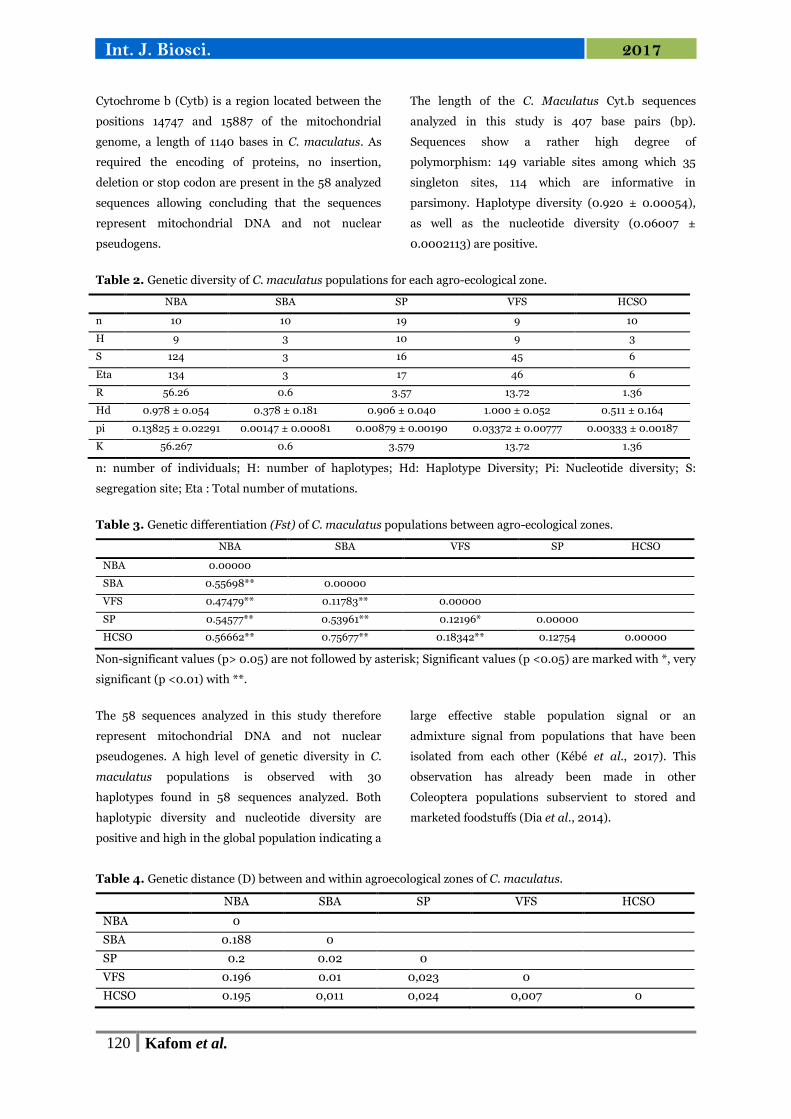
When the results are analyzed according to the
sampling zones, there is a higher value of variable
sites in the agro-ecological zones where cowpea is the
most cultivated in Senegal with respectively 124 in the
North Peanut Basin and 45 in the valley of the
Senegal River (Table 2). The largest number of
mutations (134) is observed in the NBA while the
lowest value is obtained from SBA (3). The haplotypic
diversity of different agro-ecological areas studied
vary between 0.378 ± 0.181 and 0.052 ± 1. It is more
important in the valley of the Senegal River (VFS); the
second largest value of haplotypic diversity (0.978 ±
0.054) is observed in the NBA.
Table 5. Results of the molecular variance test (AMOVA) for populational analysis of C. maculatus between
agroecological zones.
Source of variation Variance % variation
Between agro-ecological zones 7.21381 52.66
Between population of a same
agro-ecological zone
-0.12416 -0.91
Inside a population 6.60897 48.25
Table 6. Demographic parameters of the total population of C. maculatus.
D Tajima = -0.09888
p-value = 0.54500
Fu’s Fs = 0.38068
p-value = 0.41800
R2 = 0.10355
p-value = 0.00000
The nucleotidic diversity gives values fluctuating
between 0.00147 ± 0.00081 and 0.13825 ± 0.02291.
Its greatest value is obtained in the NBA and its
lowest value in the SBA. The average number of
nucleotidic difference k is very high in the NBA
(56.27) and very low in the SBA (0.6).
It is 13.72 in the VFS, 3.58 in the SP zone and 1.36 in
the HCSO. Overall the NBA has a greater genetic
diversity, followed by VFS. The South Peanut Basin
(SBA), where cowpea is not a priority, has the lowest
level of polymorphism.
Table 7. Neutrality indices for agro-ecological zones.
NBA SBA SP VFS HCSO
D Tajima
P-value
-0.05932
0.52900
-0.08644
0.54700
-0.08164
0.54200
-0.06251
0.53100
-0.07088
0.55300
Fu’sFs
P-value
0.27277
0.46200
0.32846
0.45500
0.34658
0.44100
0.26250
0.46100
0.38331
0.45700
R2
P-value
0.16320
0.00000
0.16190
0.00000
0.16388
0.00000
0.16038
0.00000
0.16193
0.00000
The analysis of results based on the zone of sampling
reveals a higher value of variable sites, number of
mutations, haplotypic diversity, nucleotide diversity
and number of nucleotide differences in agro-
ecological zones of North Peanut Basin and Senegal
River Valley, areas where cowpea is the most widely
cultivated in Senegal. These values are often low to
moderate in the other sampled areas. Overall the NBA
has a greater genetic diversity, followed by VFS.
South Peanut Basin (SBA), where cowpea is not a
priority, has the lowest level of polymorphism. The
importance of a genetic diversity of a pest correlated
with the importance of the cultivation of its host plant
has been demonstrated in several studies (Sembène et
al., 2010; Sembène et al., 2008; Kergoat et al., 2005).
This could be explained by the close relationship
between the pest and its plant host which constitutes
its substrate reproduction.
122 Kafom et al.
Int. J. Biosci. 2017
Table 8. Demographic parameters for each agro-ecological zone of C. maculatus.
NBA SBA SP VFS HCSO
SSD 0.0503 4 0.01116 0.01570 0.04009 0.04381
p-value 0.27000 0.51000 0.91000 0.21000 0.51000
Fay and Wu's -0.05164 0.08747 -0.45298 -0.41760 0.19609
P-value 0.34700 0.34500 0.33700 0.35400 0.33600
Raggedness 0.08684 0.08829 0.08916 0.08969 0.08749
P-value 0.00000 0.00000 0.00000 0.00000 0.00000
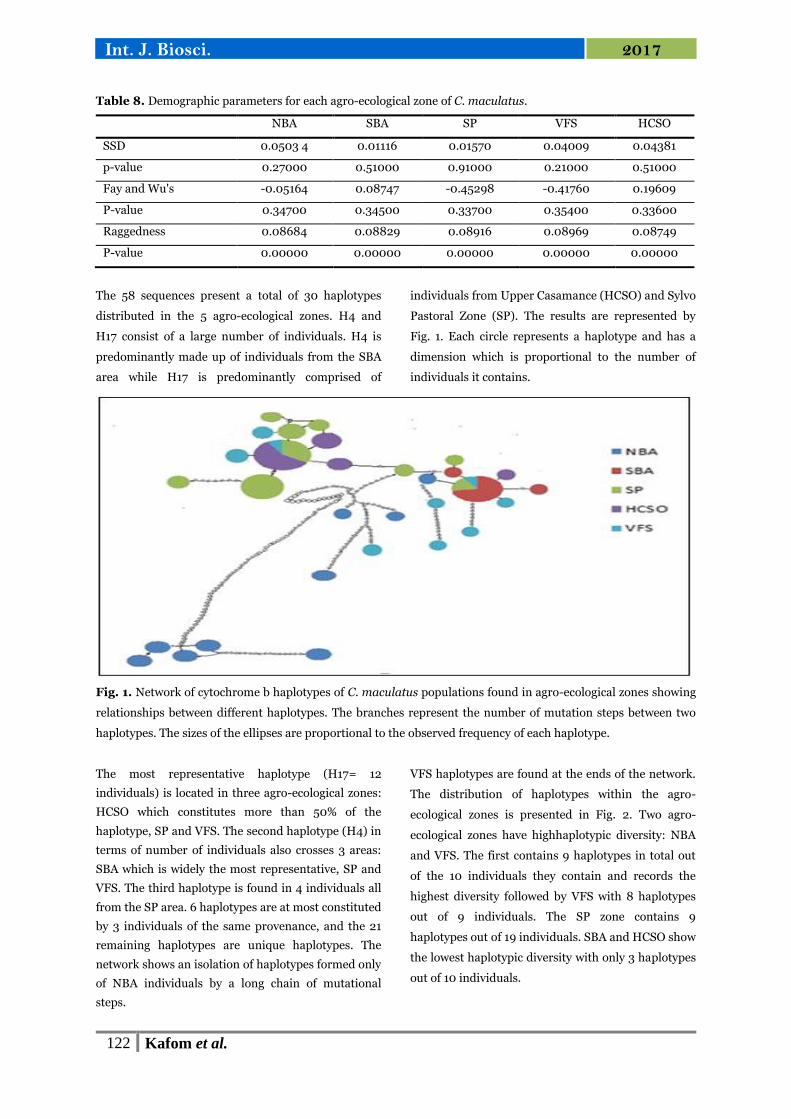
The 58 sequences present a total of 30 haplotypes
distributed in the 5 agro-ecological zones. H4 and
H17 consist of a large number of individuals. H4 is
predominantly made up of individuals from the SBA
area while H17 is predominantly comprised of
individuals from Upper Casamance (HCSO) and Sylvo
Pastoral Zone (SP). The results are represented by
Fig. 1. Each circle represents a haplotype and has a
dimension which is proportional to the number of
individuals it contains.
Fig. 1. Network of cytochrome b haplotypes of C. maculatus populations found in agro-ecological zones showing
relationships between different haplotypes. The branches represent the number of mutation steps between two
haplotypes. The sizes of the ellipses are proportional to the observed frequency of each haplotype.
The most representative haplotype (H17= 12
individuals) is located in three agro-ecological zones:
HCSO which constitutes more than 50% of the
haplotype, SP and VFS. The second haplotype (H4) in
terms of number of individuals also crosses 3 areas:
SBA which is widely the most representative, SP and
VFS. The third haplotype is found in 4 individuals all
from the SP area. 6 haplotypes are at most constituted
by 3 individuals of the same provenance, and the 21
remaining haplotypes are unique haplotypes. The
network shows an isolation of haplotypes formed only
of NBA individuals by a long chain of mutational
steps.
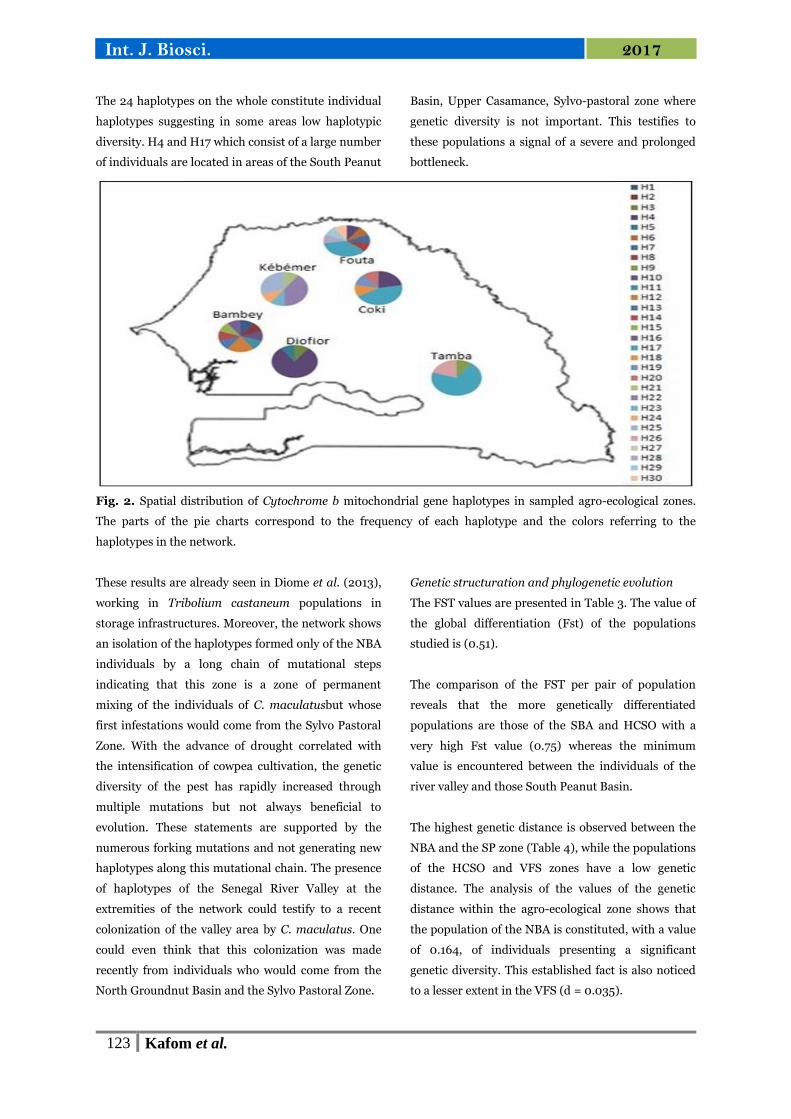
VFS haplotypes are found at the ends of the network.
The distribution of haplotypes within the agro-
ecological zones is presented in Fig. 2. Two agro-
ecological zones have highhaplotypic diversity: NBA
and VFS. The first contains 9 haplotypes in total out
of the 10 individuals they contain and records the
highest diversity followed by VFS with 8 haplotypes
out of 9 individuals. The SP zone contains 9
haplotypes out of 19 individuals. SBA and HCSO show
the lowest haplotypic diversity with only 3 haplotypes
out of 10 individuals.
123 Kafom et al.
Int. J. Biosci. 2017
The 24 haplotypes on the whole constitute individual
haplotypes suggesting in some areas low haplotypic
diversity. H4 and H17 which consist of a large number
of individuals are located in areas of the South Peanut
Basin, Upper Casamance, Sylvo-pastoral zone where
genetic diversity is not important. This testifies to
these populations a signal of a severe and prolonged
bottleneck.
Fig. 2. Spatial distribution of Cytochrome b mitochondrial gene haplotypes in sampled agro-ecological zones.
The parts of the pie charts correspond to the frequency of each haplotype and the colors referring to the
haplotypes in the network.
These results are already seen in Diome et al. (2013),
working in Tribolium castaneum populations in
storage infrastructures. Moreover, the network shows
an isolation of the haplotypes formed only of the NBA
individuals by a long chain of mutational steps
indicating that this zone is a zone of permanent
mixing of the individuals of C. maculatusbut whose
first infestations would come from the Sylvo Pastoral
Zone. With the advance of drought correlated with
the intensification of cowpea cultivation, the genetic
diversity of the pest has rapidly increased through
multiple mutations but not always beneficial to
evolution. These statements are supported by the
numerous forking mutations and not generating new
haplotypes along this mutational chain. The presence
of haplotypes of the Senegal River Valley at the
extremities of the network could testify to a recent
colonization of the valley area by C. maculatus. One
could even think that this colonization was made
recently from individuals who would come from the
North Groundnut Basin and the Sylvo Pastoral Zone.
Genetic structuration and phylogenetic evolution
The FST values are presented in Table 3. The value of
the global differentiation (Fst) of the populations
studied is (0.51).
The comparison of the FST per pair of population
reveals that the more genetically differentiated
populations are those of the SBA and HCSO with a
very high Fst value (0.75) whereas the minimum
value is encountered between the individuals of the
river valley and those South Peanut Basin.
The highest genetic distance is observed between the
NBA and the SP zone (Table 4), while the populations
of the HCSO and VFS zones have a low genetic
distance. The analysis of the values of the genetic
distance within the agro-ecological zone shows that
the population of the NBA is constituted, with a value
of 0.164, of individuals presenting a significant
genetic diversity. This established fact is also noticed
to a lesser extent in the VFS (d = 0.035).
124 Kafom et al.
Int. J. Biosci. 2017
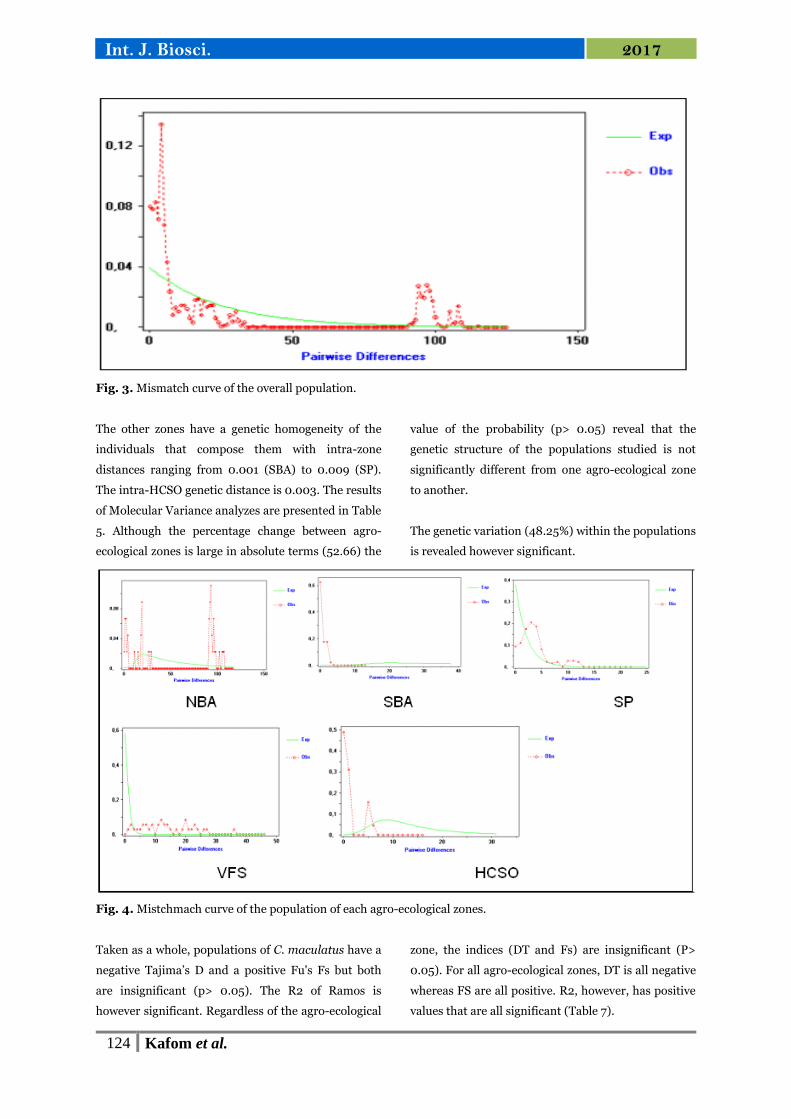
Fig. 3. Mismatch curve of the overall population.
The other zones have a genetic homogeneity of the
individuals that compose them with intra-zone
distances ranging from 0.001 (SBA) to 0.009 (SP).
The intra-HCSO genetic distance is 0.003. The results
of Molecular Variance analyzes are presented in Table
5. Although the percentage change between agro-
ecological zones is large in absolute terms (52.66) the
value of the probability (p> 0.05) reveal that the
genetic structure of the populations studied is not
significantly different from one agro-ecological zone
to another.
The genetic variation (48.25%) within the populations
is revealed however significant.
Fig. 4. Mistchmach curve of the population of each agro-ecological zones.
Taken as a whole, populations of C. maculatus have a
negative Tajima’s D and a positive Fu's Fs but both
are insignificant (p> 0.05). The R2 of Ramos is
however significant. Regardless of the agro-ecological
zone, the indices (DT and Fs) are insignificant (P>
0.05). For all agro-ecological zones, DT is all negative
whereas FS are all positive. R2, however, has positive
values that are all significant (Table 7).
125 Kafom et al.
Int. J. Biosci. 2017
For all the localities, the SSD and the r of Raggedness
are all positive but not significant (Table 8).
Mismatch analysis reveals a multimodal distribution
for all populations studied (Fig. 3 and Fig. 4).
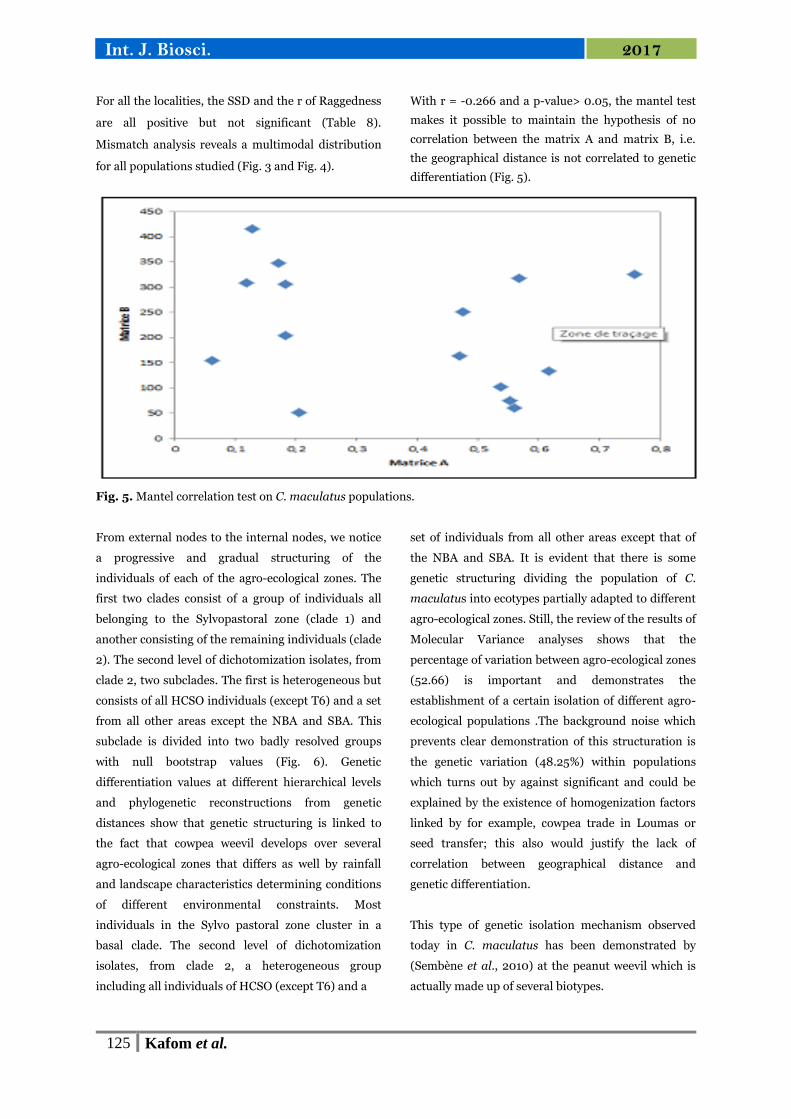
With r = -0.266 and a p-value> 0.05, the mantel test
makes it possible to maintain the hypothesis of no
correlation between the matrix A and matrix B, i.e.
the geographical distance is not correlated to genetic
differentiation (Fig. 5).
Fig. 5. Mantel correlation test on C. maculatus populations.
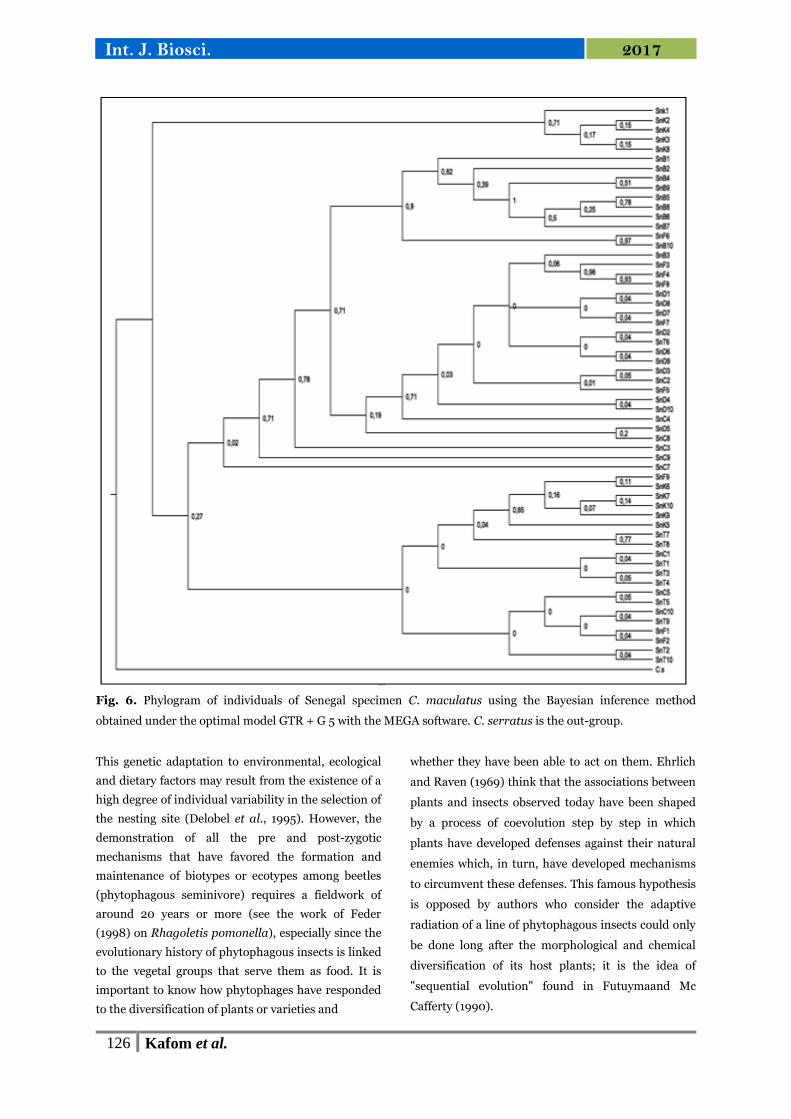
From external nodes to the internal nodes, we notice
a progressive and gradual structuring of the
individuals of each of the agro-ecological zones. The
first two clades consist of a group of individuals all
belonging to the Sylvopastoral zone (clade 1) and
another consisting of the remaining individuals (clade
2). The second level of dichotomization isolates, from
clade 2, two subclades. The first is heterogeneous but
consists of all HCSO individuals (except T6) and a set
from all other areas except the NBA and SBA. This
subclade is divided into two badly resolved groups
with null bootstrap values (Fig. 6). Genetic
differentiation values at different hierarchical levels
and phylogenetic reconstructions from genetic
distances show that genetic structuring is linked to
the fact that cowpea weevil develops over several
agro-ecological zones that differs as well by rainfall
and landscape characteristics determining conditions
of different environmental constraints. Most
individuals in the Sylvo pastoral zone cluster in a
basal clade. The second level of dichotomization
isolates, from clade 2, a heterogeneous group
including all individuals of HCSO (except T6) and a
set of individuals from all other areas except that of
the NBA and SBA. It is evident that there is some
genetic structuring dividing the population of C.
maculatus into ecotypes partially adapted to different
agro-ecological zones. Still, the review of the results of
Molecular Variance analyses shows that the
percentage of variation between agro-ecological zones
(52.66) is important and demonstrates the
establishment of a certain isolation of different agro-
ecological populations .The background noise which
prevents clear demonstration of this structuration is
the genetic variation (48.25%) within populations
which turns out by against significant and could be
explained by the existence of homogenization factors
linked by for example, cowpea trade in Loumas or
seed transfer; this also would justify the lack of
correlation between geographical distance and
genetic differentiation.
This type of genetic isolation mechanism observed
today in C. maculatus has been demonstrated by
(Sembène et al., 2010) at the peanut weevil which is
actually made up of several biotypes.
126 Kafom et al.
Int. J. Biosci. 2017
Fig. 6. Phylogram of individuals of Senegal specimen C. maculatus using the Bayesian inference method
obtained under the optimal model GTR + G 5 with the MEGA software. C. serratus is the out-group.
This genetic adaptation to environmental, ecological
and dietary factors may result from the existence of a
high degree of individual variability in the selection of
the nesting site (Delobel et al., 1995). However, the
demonstration of all the pre and post-zygotic
mechanisms that have favored the formation and
maintenance of biotypes or ecotypes among beetles
(phytophagous seminivore) requires a fieldwork of
around 20 years or more (see the work of Feder
(1998) on Rhagoletis pomonella), especially since the
evolutionary history of phytophagous insects is linked
to the vegetal groups that serve them as food. It is
important to know how phytophages have responded
to the diversification of plants or varieties and
whether they have been able to act on them. Ehrlich
and Raven (1969) think that the associations between
plants and insects observed today have been shaped
by a process of coevolution step by step in which
plants have developed defenses against their natural
enemies which, in turn, have developed mechanisms
to circumvent these defenses. This famous hypothesis
is opposed by authors who consider the adaptive
radiation of a line of phytophagous insects could only
be done long after the morphological and chemical
diversification of its host plants; it is the idea of
"sequential evolution" found in Futuymaand Mc
Cafferty (1990).
127 Kafom et al.
Int. J. Biosci. 2017
According to Bush and Diehl (1982), the formation of
host races or biotypes in a phytophagous insect
involves changes in food preferences and/or nesting
sites, physiological adaptations to the new host,
preferential crosses between partners associated with
each guests. Interactions must be interpreted both in
their ecological framework at a given moment, and as
the result of a past evolution between the species
involved (co-evolution). A common feature is
that spatial and temporal heterogeneity of habitats is
taken into account because it plays a major role in
modulating the selection pressures and constraints of
all kinds (Futuyma, 1998, Hanski, 1999).
The questions that we therefore can ask are the
following: are cultivated varieties are function of
agro-ecological zones? What is the influence of
cowpea varieties in the setting up of genetic
structuring of C. maculatus? However, it must be
added the constant pressure of chemicals on C.
maculatus to protect crops and types of storage
infrastructure that may vary from one area to
another.
In all cases, the results of the neutrality test with the
D of Tajima confirm the hypothesis of a demographic
expansion of populations in all the agro-ecological
zones. This is confirmed by the irregularity indices of
Raggedness and SSD. We thus obtain a multimodal
distribution which confirms the hypothesis of a
population in demographic expansion. These results
confirm those of Kébé (2013) who indicate a rapid
demographic expansion of local populations of C.
maculatus after working on two genes taken
separately.
Conclusion
At the level of evolutionary biology, it is obvious that
differentiation into ecotypes or host races is a
phenomenon widely discussed in phytophagous
insects. Indeed in many cases, it is observed after the
introduction of a new plant. Recent studies, however,
increasingly highlight the effect of climate change and
the characteristics of agro-ecological zones on the
structure and dynamics of phytophagous insect
populations.
Acknowledgements
The authors thank Dr. Fatimata MBAYE for assisting
in the realization of molecular manipulation and
Mame Diarra GUEYE (Master Degree) for the
translation of the document.
References
Beaumont MA, Wenyang Z, David JB. 2002.
Approximate Bayesian Computation in Population
Genetics, Genetics Society of America 162(4), 2025-
2035.
Bush GL, Diehl SR. 1982. Host shifts, genetic
models of sympatric speciation and the origin of
parasitic insect species. 297-305. In: Proceedings 5th
International Symposium on Insect-Plant
Relationships, J. H. Visser and A. K. Minks, eds.
Wageningen. 1982. Pudoc, Wageningen, Netherlands.
Clement M, Posada D, Crandall KA. 2000. TCS:
a computer program to estimate gene genealogies.
Molecular Ecology 9(10), 1657-1660.
Delobel A, Delobel H, Tran M, Sembene M,
Han HS.1995. Observations sur les relations
trophiques entre les bruches du genre Caryedon
(Coléoptère, Bruchidae) et leurs plantes hôtes
sauvages au Sénégal. Bulletin De L'institut
Fondamental D'afrique Noire, Cheick Anta Diop,
Dakar 48(A), 79-88.
Dia CAKM, Diome T, Thiaw C, Diop M,
Sembene M. 2014. Impact of storage infrastructures
and agroecological areas in genetic demographic
evolution of Tribolium castaneum Herbst
(Coleoptera: Tenebrionidae) senegalese populations.
International Journal of Science and Advanced
Technology 4(7), 12-23.
Diome T, Ndong A, Kébé K, Thiaw Cc, Ndiaye
A, Doumma A, Sanon A, Kétoh K, Sembène M.
2013. Effect of agro-ecological zones and contiguous
basin crops of groundnut (Arachis hypogaea) on the
structuring and genetic diversity of Caryedon
serratus (Coleoptera: Chrysomelidae, Bruchinae) in
the sub-region of West Africa. Journal of Asia-Pacific
Entomology 16, 209–217.
http://dx.doi.org/10.12692/ijb/3.9.248-258
128 Kafom et al.
Int. J. Biosci. 2017
Ehrlich PR, Raven PH. 1969. Differentiation of
Populations. Science 165(3899), 1228-1232.
http://dx.doi.org/10.1126/science.165.3899.1228
Excoffier L, Lischer HE. 2010. Arlequin suite ver.
3.5: a new series of programs to perform population
genetics analyses under Linux and Windows.
Molecular Ecology Resource 10(3), 564-567. Epub
2010 Mar 1.
http://dx.doi.org/10.1111/j.1755-0998.2010.02847.x.
Excoffier L, Smouse PE, Quattro JM. 1992.
Analysis of molecular variance inferred from metric
distances among DNA haplotypes: application to
human mitochondrial DNA restriction data. Genetics
131(2), 479-491.
Fu YX. 1997. Statistical tests of neutrality of
mutations against population growth, hitch-hiking,
and background selection. Genetics 147(2), 915-925.
Futuyma DJ. 1998. Evolutionary biology, 3rd ed.
Sinauer Associates, Sunderland. 9-12.
Futuyma DJ, McCafferty SS. 1990. Phylogeny and
the evolution of host plant associations in the leaf
beetle genus Ophraella (coleoptera, chrysomelidae),
Evolution 44(8), 1885-1913.
http://dx.doi.org/10.1111/j.15585646.1990.tb04298.x
Hall T. 2001. Bio-Edit version 5.0.6. Department of
Microbiology, North Carolina State University.
Hanski I. 1999. Metapopulation biology. Oxford
University Press, Oxford.
Hanski I, Simberloff D. 1997. The metapopulation
approach, its history, conceptual domain, and
application to conservation. Dans: Metapopulation
Biology, Genetic and Evolution eds. Hanski, I., Gilpin,
M.E, Academic Press, San Diego, C A, p. 5-26.
Huelsenbeck JP, Ronquist F. 2001. Mrbayes:
Bayesian inference of phylogenetic trees.
Bioinformatics 17(8), 754-755.
Huignard J. 1976. Interactions between the host-
plant and mating upon the reproductive activity of
Acanthoscelides obtectus (Coleoptera: Bruchidae)
from different colombian ecosystems. Oecologica 35
(3), 307-318.
Kébé K. 2013. Diversité génétique, histoire évolutive
et bioécologie de Callosobruchus maculatus F.
(Coleoptera, Bruchinae) ravageur de graines de niébé
(Vigna unguiculata Walp). Thèse de doctorat unique,
Faculté des Sciences et Techniques, Université Cheikh
Anta Diop, Dakar, Sénégal, p. 186.
Kébé K, Alvarez N, Tuda Midori, Arnqvist G,
Fox CW, Sembéne M, Espindola E. 2017. Global
phylogeography of the insect pest Callosobruchus
maculatus (Coleoptera: Bruchinae) relates to the
history of its main host, Vigna unguiculata. Journal
of Biogeography, 1-12.
Kergoat JG, Delobel A, Le Rü B, Silvain JF.
2005. Both host-plant phylogeny and chemestry have
shaped the African seed-beetle radiation. Molecular
Phylogenetics and Evolution 35, 602-611.
https://doi.org/10.1111/j.1558-5646.2007.00038.x
Kimura M. 1980. A simple method for estimating
evolutionary rate of base substitution through
comparative studies of nucleotide sequences. Journal
Molecular Evolution 16(2), 111-120.
Leclerc E, Mailhot Y, Bernatchez L. 2006.
Définition des populations de perchaudes (Perca
flavescens) du fleuve Saint-Laurent au Québec:
Analyse du patron géographique de la variation
génétique et morphologique. MAPAQ, DIT, Rapport
de R-D., 155, p. 22.
Nei M. 1987.Molecular Evolutionary Genetics.
Columbia University Press. New York.
Nylander JAA. 2004. MrModeltest v2.
Evolutionary Biology Centre: Uppsala University
Uppsala, Sweden.
Olver CH, Shuter BJ. 1995. Toward a definition of
conservations principales for fisheries management.
Canadian Journal of Fisheries and Aquatic Sciences
52(7), 1584-1592.
https://doi.org/10.1139/f95-751
129 Kafom et al.
Int. J. Biosci. 2017
Ramirez-Soriano A, Ramos-Onsins SE, Rozas
J, Calafell F, Navarro A. 2008. Statistical power
analysis of neutrality tests under demographic
expansions, contractions and bottlenecks with
recombination. Genetics 179(1), 555-567.
https://doi.org/10.1534/genetics.107.083006
Rogers AR, Harpending H. 1992. Population
growth makes waves in the distribution of pairwise
genetic difference. Molecular Biology and Evolution 9
(3), 552-569.
Rozas J, Librado P, Sánchez-Del Barrio JC,
Messeguer X, Rozas R. 2012. DnaSP Version 5
Help Contents [Help File]. Available with the
program at
http://www.ub.edu/dnasp/
Sembène M, Kébé K, Delobel A, Rasplus JY.
2010. Phylogenetic information reveals the
peculiarity of Caryedon serratus (Coleoptera,
Chrysomelidae, Bruchinae) feeding on Cassia
sieberiana DC (Caesalpinioideae). African Journal of
Biotechnology 9(10), 1470-1480.
Sembène M, Rasplus JY, Silvain JF, Delobel A.
2008. Genetic differentiation insympatric
populations of the groundnut seed beetle, Caryedon
serratus (Coleoptera: Chrysomelidae): new insights
from molecular and ecological data, International
Journal of Tropical Insect Sciences 28(3), 168-177.
https://doi.org/10.1017/S1742758408094484
Tamura K, Stecher G, Peterson D, Filipski A,
Kumar S. 2013. MEGA6: Molecular Evolutionary
Genetics version 6.0. Molecular Biology and
Evolution 30(12), 2725-2729.
https://doi.org/10.1093/molbev/mst197.
Tajima F. 1989. Statistical methods for testing the
neutral mutation hypothesis by DNA polymorphism.
Genetics 123(3), 585-595.
Thompson JD, Higgins DG, Gibson TJ. 1994.
CLUSTAL W: improving the sensitivity of progressive
multiple sequence alignment through sequence
weighting, position specific gap penalties and weight
matrix choice. Nucleic Acids Research 22(22), 4673-
4680.
Webster MS, Marra PP, Haig SM, Beusch S,
Hormes ST. 2002. Links between worlds:
unravelling migratory connectivity. Trends in Ecology
and Evolution 17(2), 76-83.
https://doi.org/10.1098/rspb.2011.1351
Weir BS, Cockerham CC. 1984. Estimating F-
statistics for the analysis of population structure.
Evolution 38(6), 1358-1370.
https://doi.org/10.2307/2408641
Wright S. 1969. Evolution and the Genetics of
Populations: The Theory of Gene Frequencies. The
University of Chicago Press, Chicago, Illinois