InsurTech: The Financing of Innovation, Transformation and ......Profitability in the insurance...
71
InsurTech: The Financing of Innovation, Transformation and Disruption Robert P. Hartwig, Ph.D., CPCU Clinical Associate Professor of Finance, Risk Management & Insurance Director, Center for Risk and Uncertainty Management Darla Moore School of Business ♦ University of South Carolina [email protected] ♦ 803.777.6782 InsurTech Symposium Charlotte, NC June 20, 2018
Transcript of InsurTech: The Financing of Innovation, Transformation and ......Profitability in the insurance...

InsurTech: The Financing of Innovation,
Transformation and Disruption
Robert P. Hartwig, Ph.D., CPCUClinical Associate Professor of Finance, Risk Management & Insurance
Director, Center for Risk and Uncertainty ManagementDarla Moore School of Business ♦ University of South Carolina
[email protected] ♦ 803.777.6782
InsurTech SymposiumCharlotte, NCJune 20, 2018

2
INSURANCE INDUSTRY DISRUPTORS
Technology, Society and the Economy Are All Changing at a Rapid Pace
Insurance Too: But Need to Look at Reality
2

3
The Insurance Industry Value Chain: Under Seige, Ripe for Disruption?
Source: Willis Capital Markets & Advisory; Univ. of South Carolina, RUM Center.
Who owns the data? Where does It flow? Who does the analytics? Who is the capital provider?

4
Hype Cycle for Emerging Technologies, 2017
Source: Gartner.
There’s no question that the hype around
the connected (smart) home than
reality—the same for autonomous
vehicles

Most-Hyped Technologies Impacting Insurers Today, Based on Gartner’s Hype Curve
Autonomous Vehicles
Connected (Smart) Homes
UAVs (Drones)
Blockchain
Machine Learning

6
Media is Obsessed with Driverless Vehicles: Often Predicting the Demise of Auto Insurance
By 2035, it is estimated that 25% of new vehicle
sales could be fully autonomous models
Source: Boston Consulting Group.
Questions Are auto insurers
monitoring these trends? How are they reacting? Will Google or (Amazon)
take over the industry? Will the number of auto
insurers shrink? How will liability shift?

7
Autonomous Vehicles: Will Insurers Drown in the Data?
The average human by 2020 will generate about 1.6GB in data every day
The average autonomous vehicle will process about 4,000GB per day—as much as nearly 2,700 humans
Are insurers ready for this?
Source: Intel

8
The Internet of Things and the Insurance Industry The “Internet of
Things” will create trillions in economic value throughout the global economy by 2025
What opportunities, challenges will this create for insurers?
What are the impact on the insurance industry “value chain”?
What is InsurTech’s Role?Sources: McKinsey Global Institute, The Internet of Things: Mapping the Value Beyond the Hype,
June 2015; Insurance Information Institute.

12
Trends in US Venture Capital Funding
Venture Capital Funding Is Large, Growing and Risky

US Venture Capital Funding (All Sectors),2012 – 2017
Value of Deals ($ Billions)
Source: CB Insights, Venture Capital Funding Report, 2017 accessed 6/15/18 at: https://www.cbinsights.com/research/report/venture-capital-q4-2017/
$33 $36
$59
$77
$61
$72
57865063
4624
5268
5052
5811
$0
$10
$20
$30
$40
$50
$60
$70
$80
$90
2012 2013 2014 2015 2016 20170
1000
2000
3000
4000
5000
6000
7000
Value of Deals Number of Deals
No. of Deals
VC funding across all sectors has been increased in 2017 though the number
of deals fell

US Venture Capital Funding (All Sectors),2016:Q2 – 2018:Q1
Value of Deals ($ Billions)
Source: CB Insights, Venture Capital Report, Q1 2018 accessed 6/15/18 at: https://www.cbinsights.com/research/report/venture-capital-q1-2018/
$18
$15$13
$15
$19$20 $21
$20
1206
1233
1371
13271342
1302
1362
1245
$0
$5
$10
$15
$20
$25
Q2:2016 Q3:2016 Q4:2016 Q1:2017 Q2:2017 Q3:2017 Q4:2017 2018:Q11100
1150
1200
1250
1300
1350
1400
Value of Deals Number of Deals
No. of Deals
VC funding across all sectors has been increasing slowly over the past year, though
the number of deals is down

$5,277.0
$2,476.2
$1,861.9
$527.2
$424.5
$414.7
$358.2
$346.9
$303.8
$253.0
$229.2
$140.2
$7,266.2
$0 $1,000 $2,000 $3,000 $4,000 $5,000 $6,000 $7,000 $8,000
Internet
Healthcare
Mobile & Telecom
Software (non-Internet/mobile)
Computer Hardware & Services)
Automobile & Transportation
Industrial
Consumer Products & Services
Electronics
Financial
Food & Beverage
Business Products & Serv.
Energy & Utilities
Source: Statista.com; Univ. of South Carolina Center for Risk and Uncertainty Management.
Financials ranked 10th in terms of VC investment
column in Q1:2018. Insurance would be a
subset of this.
VC Investment by Industry, 2018:Q1 ($ Mill)Technology Leads the Way—Finance Lags
ROEs in the tech sector are much higher than for insurers. This is one reason why tech
companies are unlikely to be interested in
bearing insurance risk anytime soon

16
Total US Venture Capital Investments and Number of Deals, 1995:Q1 – 2017:Q4
Source: PwC MoneyTree Report at: https://www.pwc.com/us/en/technology/moneytree.html
Is a new dot com bubble building or is an orderly “deflation”
already underway?
The current expansion in VC financing and no. of
deals is less dramatic than during the Tech Bubble, but there are similarities
(profits don’t matter)

17
Start-Up Financings in the US, 2006 – 2018*
First-round financings are down sharply across the board, including InsurTech
One reason: “The Kill Zone” Tech giants (e.g., Google,
Amazon, Microsoft, Facebook) are quick to eliminate competitive threats by copying them or buying them early
VCs are wary of investing if one of the “Giants” is likely to move into same space
Does InsurTech have a “Kill Zone”?
Sources: The Economist,The Future of Tech Startups: Into the Danger Zone,June 2, 2018: https://www.economist.com/business/2018/06/02/american-tech-giants-are-making-life-tough-for-startups

18
The Startup Financing Cycle: Long, Uncertain and Sometimes Desperate Process
Source: PwC MoneyTree Report at: https://www.pwc.com/us/en/technology/moneytree.htmlUniversity of South Carolina, Center for Risk and Uncertainty Management.
“Kill Zone”
19
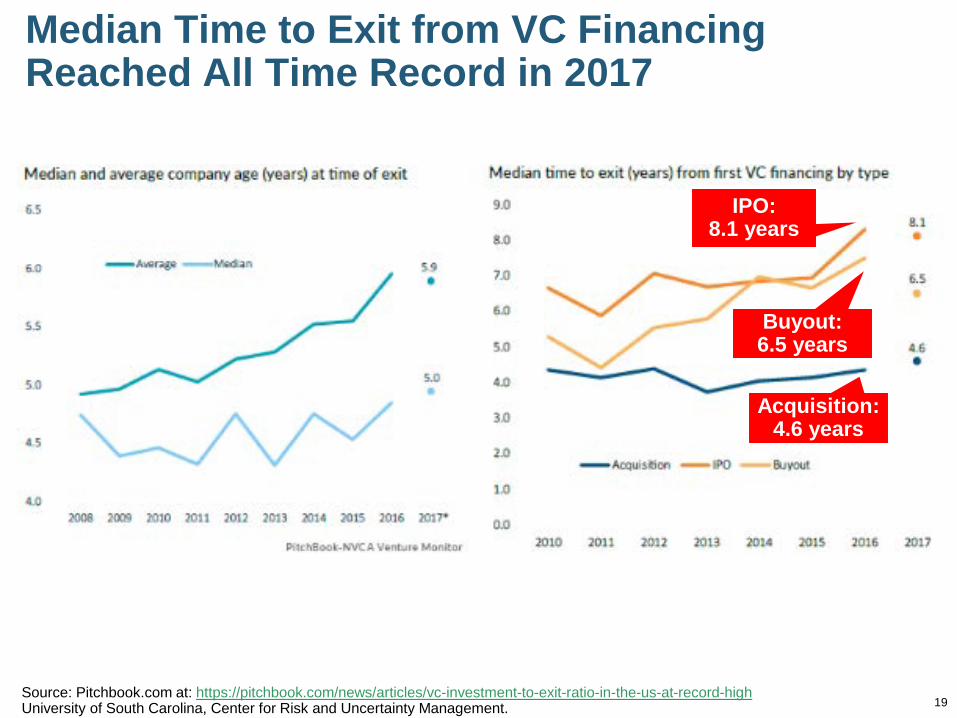
Median Time to Exit from VC Financing Reached All Time Record in 2017
Source: Pitchbook.com at: https://pitchbook.com/news/articles/vc-investment-to-exit-ratio-in-the-us-at-record-highUniversity of South Carolina, Center for Risk and Uncertainty Management.
IPO: 8.1 years
Buyout: 6.5 years
Acquisition: 4.6 years

20
THE STATE OF INSURTECH FUNDING TODAY
Number and Value of Deals Is Increasing in Recent Years, but Has a Plateau Been
Reached?
Insurance Is an Industry that Has Always Been Accepting of Change and Innovation

Number of VC Investors in InsurTech,2012 – 2017
Source: CB Insights,Quarterly InsurTech Briefing,, Q1 2018; USC RUM Center.
53
81
109128
177
217
0
50
100
150
200
250
2013 2013 2014 2015 2016 2017
No. of Investors
The number of VCs investing in InsurTech is up
4-fold since 2012

InsurTech Annual Financing,2011 – 2018:Q1
Value of Deals ($ Millions)
Source: CB Insights,Quarterly InsurTech Briefing,, Q1 2018.
$140$350 $270
$870
$2,670
$2,212
$724
$1,690
66
200
91
4628
122
173
63
$0
$500
$1,000
$1,500
$2,000
$2,500
$3,000
2011 2012 2013 2014 2015 2016 2017 2018:Q1 020406080100120140160180200220
Value of Deals Number of Deals
No. of Deals
Insurance tech deals reached a new record in 2017 with 2018 on
track to set new highs
About 60% of all InsurTech deals in 2017 were at the
early stage

Number of InsurTech Deals: P/C vs L/H2013 – 2018:Q1
Source: CB Insights,Quarterly InsurTech Briefing,, Q1 2018; USC RUM Center.
37
6268
57
81
23
117
3228
121
4356
0
20
40
60
80
100
120
140
2013 2014 2015 2016 2017 2018:Q1
L/H P/C
No. of Deals In recent years, the
majority of InsurTech deals have been P/C-related
Many early InsurTech firms were launched in wake of
2010’s ACA legislation, which created an online marketplace (starting in 2014) for insurance and seemed to create market
opportunities for start-ups (e.g. Oscar)

24
INSURTECH INVESTMENTS BY STAGE
Is the InsurTech Phenomenon Maturing?
Is the Recent Decline in Early Stage Financing the Signaling the End to
Easy Money?

25
InsurTech Investments by Investment Stage
Source: CB Insights,Quarterly InsurTech Briefing,, Q1 2018.
Proportionately less investment at the earliest stage in recent quarters
Is the shrinkage
evidence of InsurTech’sKill Zone?

26
Private Technology Investments by (Re)Insurers, 2013 – 2018:Q1
Source: CB Insights,Quarterly InsurTech Briefing,, Q1 2018.
There are proportionately fewer early-stage tech investments by
(re)insurers in Q1:2018
Is the decline evidence of InsurTech’sKill Zone?

27
InsurTechs Are Focusing on Distribution and Pricing
Source: Panorama by McKinsey, “Insurance Beyond Digital: The Rise of Ecosystems and Platforms,” Jan. 2018.
InsurTech firms across all insurance
segments tend to focus on
Distribution. It is telling that very few InsurTech firms are actually insurers.

5 Reasons Why So Few InsurTech Start-Ups Actual Insurers (Risk Bearers)
1. Barriers to Entry: Starting an actual insurance company requires significant resources in terms of: Capital Technology Regulatory compliance capabilities High customer acquisition costs Human capital (i.e., experienced insurance industry execs)
2. Competition: Both personal and commercial lines of insurance are intensely competitive HHI Values for auto insurance ~900 - 1000 in most states HHI Values for home insurance ~700 in most states DoJ: HHI Values < 1500 not concentrated

Why Are So Few InsurTech Start-Ups Actual Insurers (Risk Bearers)?
3. Margins Are Thin: Profitability in the insurance industry is falling P/C insurance industry ROEs fell for the 4th consecutive year
in 2017 (to 5.0%) and could fall again in 2018 (2.4% in Q1)
4. Overcapitalization: The P/C and Life insurance industries are both over capitalized The p/c insurance industry finished 2017 with a record $753
billion in policyholder surplus (a proxy for capacity)—which is at implies that the industry is overcapitalized by about 1/3

19.9%
19.8%
18.5%
17.1%
9.5%
7.3%
6.1%
4.2%
28.7%
0% 5% 10% 15% 20% 25% 30% 35%
Computer Services
Semiconductors
Information Services
Software (Internet)
Software (Systems & Application)
Health Information & Technology
P/C Insurance
Reinsurance
Life Insurance
*As of January 2018Source: Stern School, NYU accessed 6/18/18 at : http://pages.stern.nyu.edu/~adamodar/New_Home_Page/datafile/roe.html; Univ. of South Carolina Center for Risk and Uncertainty Management.
Low ROEs will keep the number of actual insurance start-ups low—and kill off
many others as well
ROEs: Insurance vs. Technology Sectors—A “Poison Pill”?
ROEs in the tech sector are much higher than for insurers. This is one reason why tech
companies are unlikely to be interested in
bearing insurance risk anytime soon

P/C Industry Net Income After Taxes1991–2018:Q1
2005 ROE= 9.6% 2006 ROE = 12.7% 2007 ROE = 10.9% 2008 ROE = 0.1% 2009 ROE = 5.0% 2010 ROE = 6.6% 2011 ROAS1 = 3.5% 2012 ROAS1 = 5.9% 2013 ROAS1 = 10.2% 2014 ROAS1 = 8.4% 2015 ROAS = 8.4% 2016 ROAS = 6.2% 2017 ROAS =5.0% 2018 ROAS = 2.4%
•ROE figures are GAAP; 1Return on avg. surplus. Excluding Mortgage & Financial Guaranty insurers yields a 8.2% ROAS in 2014, 9.8% ROAS in 2013, 6.2%ROAS in 2012, 4.7% ROAS for 2011, 7.6% for 2010 and 7.4% for 2009; Sources: A.M. Best, ISO.
$14,
178
$5,8
40$1
9,31
6$1
0,87
0 $20,
598
$24,
404 $3
6,81
9$3
0,77
3$2
1,86
5
$3,0
46$3
0,02
9
$62,
496
$3,0
43
$35,
204
$19,
456 $3
3,52
2$6
3,78
4$5
5,87
0$5
6,82
6$4
2,92
4$3
6,12
3$1
7,38
4
$38,
501
$20,
559
$44,
155
$65,
777
-$6,970$2
8,67
2-$10,000
$0
$10,000
$20,000
$30,000
$40,000
$50,000
$60,000
$70,000
$80,000
91 92 93 94 95 96 97 98 99 00 01 02 03 04 05 06 07 08 09 10 11 12 13 14 15 16 17 18*
Net income fell sharply in 2017
as high CAT losses took
their toll
$ Millions

-5%
0%
5%
10%
15%
20%
25%
75 76 77 78 79 80 81 82 83 84 85 86 87 88 89 90 91 92 93 94 95 96 97 98 99 00 01 02 03 04 05 06 07 08 09 10 11 12 13 14 15 16 17 18
Profitability Peaks & Troughs in the P/C Insurance Industry, 1975 – 2018:Q1
Profitability = P/C insurer ROEs. 2011-16 figures are estimates based on ROAS data. Note: Data for 2008-2014 exclude mortgage and financial guaranty insurers.Source: NAIC, ISO, A.M. Best, USC RUM Center.
1977:19.0% 1987:17.3%
1997:11.6% 2006:12.7%
1984: 1.8% 1992: 4.5% 2001: -1.2%
9 Years
ROEs in 2017 plunged to their lowest levels
since 2008.ROE
1975: 2.4%
2013 9.8%
2016 6.2%
2015: 8.4%
2017 5.0%

33
ROE: Property/Casualty Insurance by Major Event, 1987–2018:Q1
Excludes Mortgage & Financial Guarantee in 2008 – 2014. Sources: ISO, Fortune; USC RUM Center.
-5%
0%
5%
10%
15%
20%
87 88 89 90 91 92 93 94 95 96 97 98 99 00 01 02 03 04 05 06 07 08 09 10 11 12 13 14 15 16 17 18*
P/C Profitability Is Influenced Both by
Cyclicality and Volatility
Hugo
Andrew, Iniki
Northridge
Lowest CAT Losses in 15 Years
Sept. 11
Katrina, Rita, Wilma
4 Hurricanes
Financial Crisis*
(Percent)
Record Tornado Losses
Sandy
Low CATs
Harvey, Irma, Maria,
CA Wildfires

34
Policyholder Surplus, 2006:Q4–2018:Q1
Sources: ISO, A.M .Best; Center for Risk and Uncertainty Management, University of South Carolina.
($ Billions)$4
87.1
$496
.6
$512
.8
$521
.8
$478
.5
$455
.6
$437
.1 $463
.0 $490
.8
$511
.5 $540
.7
$530
.5
$544
.8
$559
.2
$559
.1
$538
.6
$550
.3
$567
.8
$583
.5
$586
.9
$607
.7
$614
.0
$624
.4 $653
.4
$671
.6
$673
.9
$675
.2
$674
.2
$673
.7
$676
.3 $700
.9
$717
.0 $752
.5
$734
.1
$662
.0
$570
.7
$566
.5
$505
.0
$515
.6
$517
.9
$400
$450
$500
$550
$600
$650
$700
$750
$800
06:Q
4
07:Q
1
07:Q
2
07:Q
3
07:Q
4
08:Q
1
08:Q
2
08:Q
3
08:Q
4
09:Q
1
09:Q
2
09:Q
3
09:Q
4
10:Q
1
10:Q
2
10:Q
3
10:Q
4
11:Q
1
11:Q
2
11:Q
3
11:Q
4
12:Q
1
12:Q
2
12:Q
3
12:Q
4
13:Q
1
13:Q
2
13:Q
3
13:Q
4
14:Q
1
14:Q
2
14:Q
3
14:Q
4
15:Q
2
15:Q
4
16:Q
1
16:Q
4
17:Q
2
17:Q
4
18:Q
1
Financial Crisis
Surplus (Capacity) as of 12/31/17 reached a new
record of $752.5B despite heavy CAT losses
2010:Q1 data includes $22.5B of paid-in capital from a holding company parent for one insurer’s investment in a non-insurance business .
Drop due to near-record 2011 CAT losses
Capacity/Capital “shocks” typically do not on their own drive a sustained firming of
the pricing environment
The industry is overcapitalized by as much as 1/3, a fact that InsurTechs and
VC need to consider

Why Are So Few InsurTech Start-Ups Actual Insurers (Risk Bearers)?5. Law of Large Numbers: The larger the number of
policyholders (exposure units), the more likely it is that the actual loss equals the expected loss and thus the standard deviation of the mean falls. In economic terms, this means there are economies of scale
in insurance that derive from the pooling of risk Start-ups are not immune to the LLN. All else equal,
incumbents and large insurers will have an advantage over small start-ups For a small start-up insurer to “disrupt” the industry, their
advantages in product design, efficiency, risk assessment, marketing, etc., need to be large enough to overcome the disadvantages of being on the losing end of the LLN
If Actually Bearing Insurance Risks Is So Difficult, What Do InsurTechs Actually DO? Insurance Carriers Since 2013, only 4% of P/C start-ups and 8% of L/H start-
ups were formed as insurance carriers (i.e., risk-bearers)
Distribution Since 2013, 62% of P/C start-ups and 46% of L/H start-
ups have focused on Distribution (i.e., sale of insurance)
Business-to-Business (B2B) Since 2013, 34% of P/C start-ups and 46% of L/H start-
ups have focused on B2B solutions B2B start-ups focus on a wide range of insurer activities
and functions such as analytics, claims, underwriting, IoT and more

37
Composition of Loss and Expense Components for Key P/C Lines*
13.7% 9.8% 12.1% 15.3%8.2% 12.8% 12.8% 6.5%
17.4% 16.5% 17.0% 17.8% 24.9%
62.4%60.1%60.9%64.7%60.0%
12.1%10.4%
0%
20%
40%
60%
80%
100%
120%
All Lines Personal Auto Homeowners Commercial Auto Workers Comp
Loss LAE Commission & Brokerage Expense Other Underwriting Expenses
Percent
*Figures are averages for the 10-year period from 2007-2016.Source: A.M. Best Aggregates and Averages, 2017 Edition; Univ. of South Carolina RUM Center.
Bearing risk is challenging, so few InsurTech start-ups are actual insurers. Instead many
focus on the ~40% of premiums associated with the sale/distribution, claims or underwriting
expenses
39.9% out of 99.9%
38.7% out of
103.4%
39.6% out of
100.5%
42.7% out of
102.8%
46.7% out of
109.1%

38
Personal Lines Distribution Channels, Direct vs. Independent Agents, 1972-2015
Source: Insurance Information Institute; based on data from Conning and A.M. Best.
0%
10%
20%
30%
40%
50%
60%
70%
80%
72 8384 8586 8788 8990 9192 9394 9596 9798 9900 0102 0304 0506 0708 0910 1112 1314 15Direct Independent Agents
Distribution was a target of a number of Dotcom startups way back in the late 1990s,
but agents and insurers have developed many omni-channel operating models since then
which aren’t reflected in the statistics
39
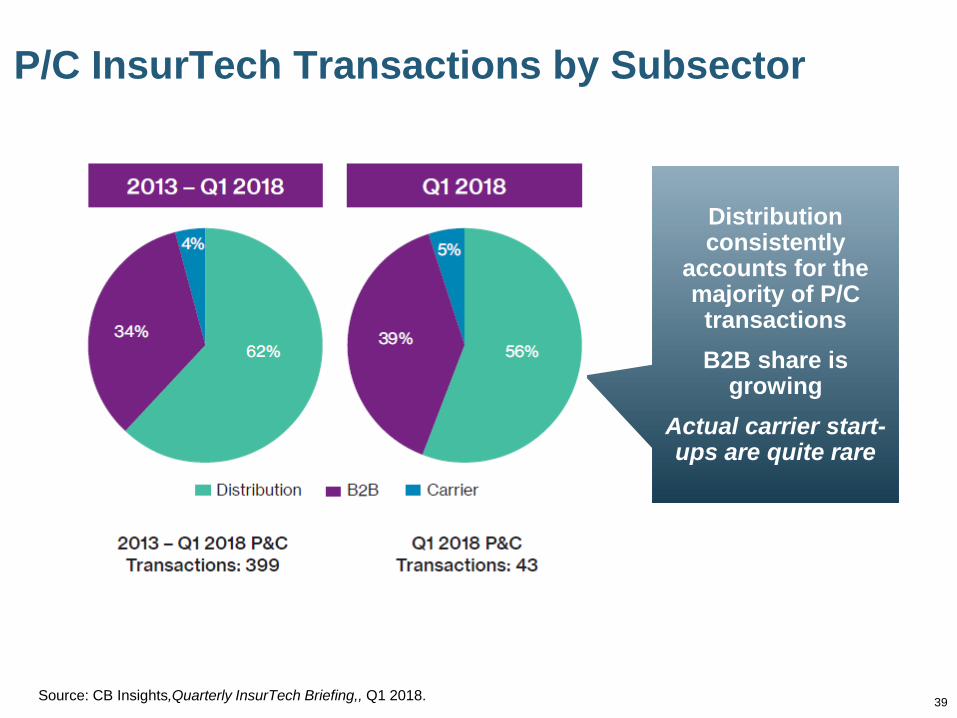
P/C InsurTech Transactions by Subsector
Source: CB Insights,Quarterly InsurTech Briefing,, Q1 2018.
Distribution consistently
accounts for the majority of P/C transactionsB2B share is
growingActual carrier start-ups are quite rare

40
L/H InsurTech Transactions by Subsector
Source: CB Insights,Quarterly InsurTech Briefing,, Q1 2018.
Distribution and B2B account for
roughly equal shares of L/H
transactions since 2013, though that may be changing
B2B share is shrinking
Actual carrier start-ups are quite rare

41
Private Technology Investments by (Re)Insurers, 2013 – 2018:Q1
Source: CB Insights,Quarterly InsurTech Briefing,, Q1 2018.
Tech investments by (re)insurers have been
increasing steadily. Not all investments are
directly related to insurance

42
Top 25 P/C Insurers by Direct Written Premium, 2015
Sources: NAIC from CB Insights at https://www.cbinsights.com/blog/largest-pc-insurers-rank-startup-investments/
Are large P/C insurers more likely to invest in InsurTech start-ups?
43
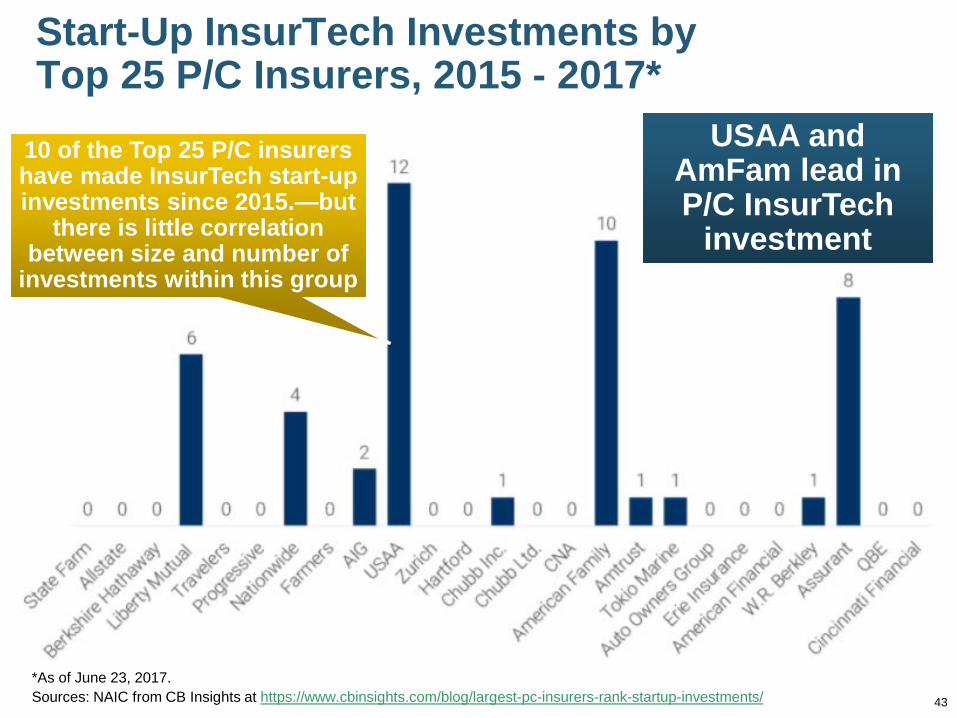
Start-Up InsurTech Investments by Top 25 P/C Insurers, 2015 - 2017*
*As of June 23, 2017.Sources: NAIC from CB Insights at https://www.cbinsights.com/blog/largest-pc-insurers-rank-startup-investments/
USAA and AmFam lead in P/C InsurTech
investment
10 of the Top 25 P/C insurers have made InsurTech start-up investments since 2015.—but
there is little correlation between size and number of
investments within this group

Sample InsurTech Deals: 2018:Q1
Source: CB Insights,Quarterly InsurTech Briefing,, Q1 2018.
Company Insurer DescriptionAmerican Well Allianz Telemedicine, wearable sensorsBetterview Munich Re Drone imagery, data and analysis for
MR’s clientsRoost Erie Smart water/freeze detection products to
HO customersJauntin AIG Pay-as-you-go travel insuranceBunker Chubb Develop new products for small
commercial marketTencent WeSure MetLife Online travel insuranceLyric Axa Airbnb-like service (stays in iconic apts.)Socotra USAA Policy admin service to automate
underwriting, quoting binding Gabi Northwest
MutualHO and auto price comparison platform
Red Balloon Security
American Family
Cyber security for embedded and smart devices, including cars, office equip.

Wide Variety of Investors in InsurTech
Source: CB Insights,Quarterly InsurTech Briefing,, Q1 2018; Univ. of South Carolina, Center for Risk and Uncertainty Management.
Sampling of Traditional VC Investors

Wide Variety of Investors in InsurTech
Source: CB Insights,Quarterly InsurTech Briefing,, Q1 2018; Univ. of South Carolina, Center for Risk and Uncertainty Management.
Sampling of (Re)Insurer Investors
Sampling of Other Corporate VC Investors

47
CASE STUDY 1
The Curious Case of Insurance, IoTand the Smart Home
What Went Wrong?

48
IoT, Smart Home & Insurance In 2014-2015, the integration
of IoT technologies, smart homes and insurance seemed like a sure thing
A number of insurers rushed in to offer discounts to homeowners adopting these technologies on a trial basis
Since then, initiatives have stalled. Why? Consumers unlikely to buy
hundreds of dollars of smart sensors (smoke, water, etc.)
Confusing standards for gear are intimidating for average consumer
Cost/benefit not obviousSource: StaceyOnIot.com, Why insurance firms are stalling on IoT, June 11, 2018.
49
CASE STUDY 2
The Curious Case of Softbank, Masayoshi Son, Silicon Valley—
and Swiss Re
50
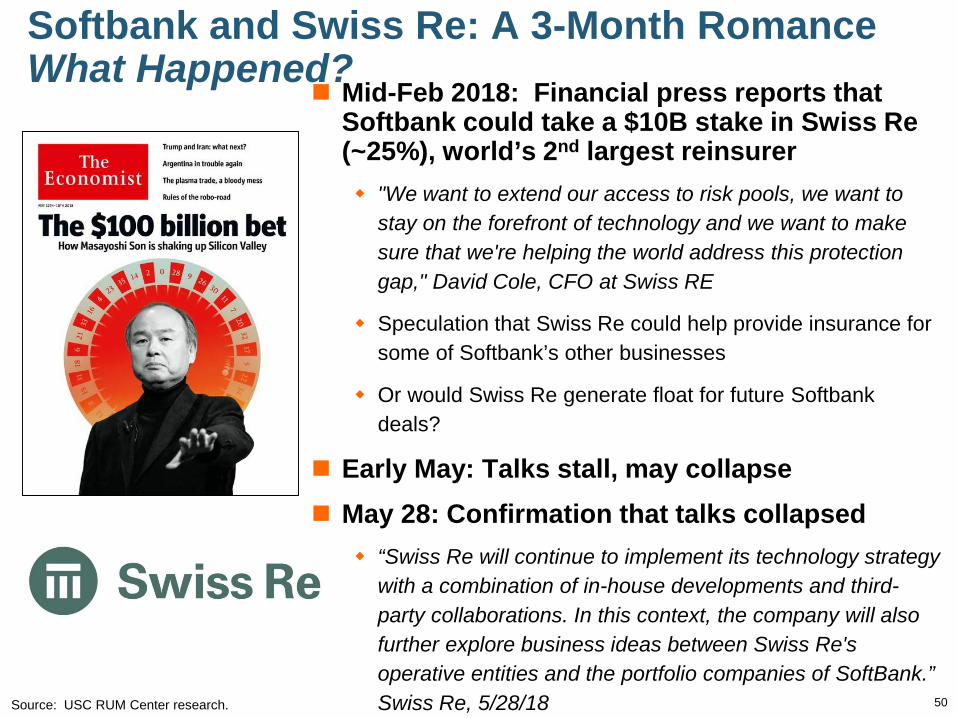
Softbank and Swiss Re: A 3-Month Romance What Happened?
Mid-Feb 2018: Financial press reports that Softbank could take a $10B stake in Swiss Re (~25%), world’s 2nd largest reinsurer "We want to extend our access to risk pools, we want to
stay on the forefront of technology and we want to make sure that we're helping the world address this protection gap," David Cole, CFO at Swiss RE
Speculation that Swiss Re could help provide insurance for some of Softbank’s other businesses
Or would Swiss Re generate float for future Softbank deals?
Early May: Talks stall, may collapse May 28: Confirmation that talks collapsed
“Swiss Re will continue to implement its technology strategy with a combination of in-house developments and third-party collaborations. In this context, the company will also further explore business ideas between Swiss Re'soperative entities and the portfolio companies of SoftBank.” Swiss Re, 5/28/18Source: USC RUM Center research.

51
InsurTech Investors
Who Invests in What—and Why
51
52
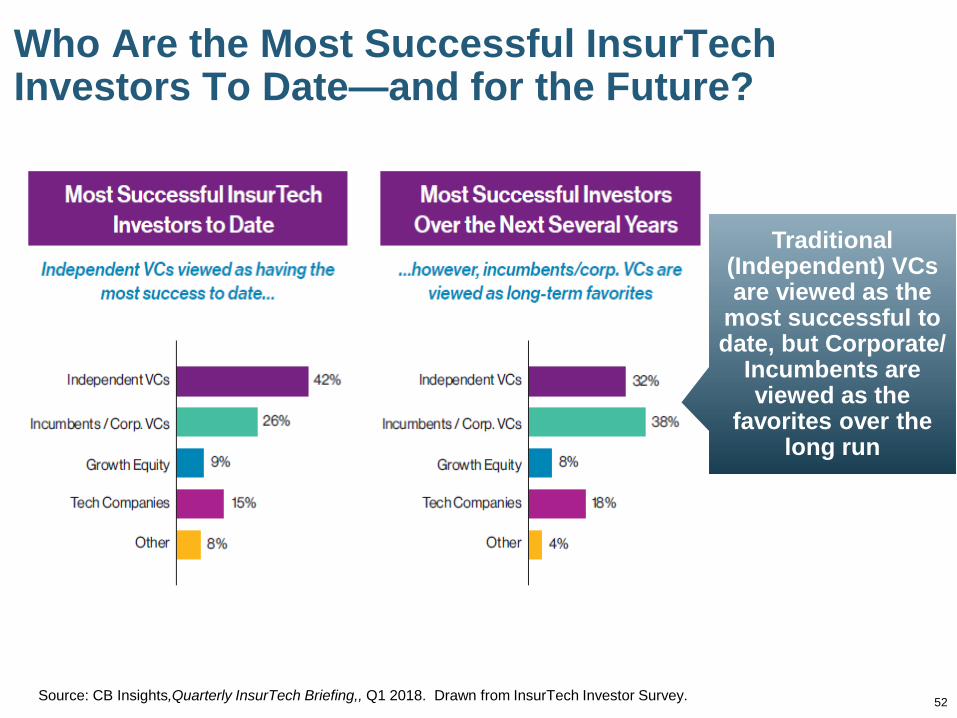
Who Are the Most Successful InsurTech Investors To Date—and for the Future?
Source: CB Insights,Quarterly InsurTech Briefing,, Q1 2018. Drawn from InsurTech Investor Survey.
Traditional (Independent) VCs are viewed as the
most successful to date, but Corporate/
Incumbents are viewed as the
favorites over the long run

53
Who Will Provide the Most Funding to InsurTechs in the Years Ahead?
Source: CB Insights,Quarterly InsurTech Briefing,, Q1 2018. Drawn from InsurTech Investor Survey.
With success comes funding.
Corporate/ Incumbent VCs are expected to be the main provider of
capital to InsurTech firms in the years
ahead
A shift to Corporate/Incumbent VCs funding suggests that “smart money” will play a larger role and that (re)insurers in particular are making focused investments to
suit their own needs

54
InsurTechs Want to Partner with What They Perceive to Be “Smart Money”
Source: CB Insights,Quarterly InsurTech Briefing,, Q1 2018. Drawn from InsurTech Investor Survey.
InsurTechsbelieve
Corporate VCs offer them the best chances for success,
though traditional VCs
will still be necessary to
meet full capital needs

55
How Do Corporate VCs Benefit InsurTechs?
Source: CB Insights,Quarterly InsurTech Briefing,, Q1 2018. Drawn from InsurTech Investor Survey.
InsurTechsbelieve
Corporate VCs add the
greatest value in the area of
Product Development

56
Which InsurTech Segments Are the Primary Focus for VCs?
Source: CB Insights,Quarterly InsurTech Briefing,, Q1 2018. Drawn from InsurTech Investor Survey.
Data & Analytics
followed by Distribution
and Claims are the primary investment
focus of VCs
57
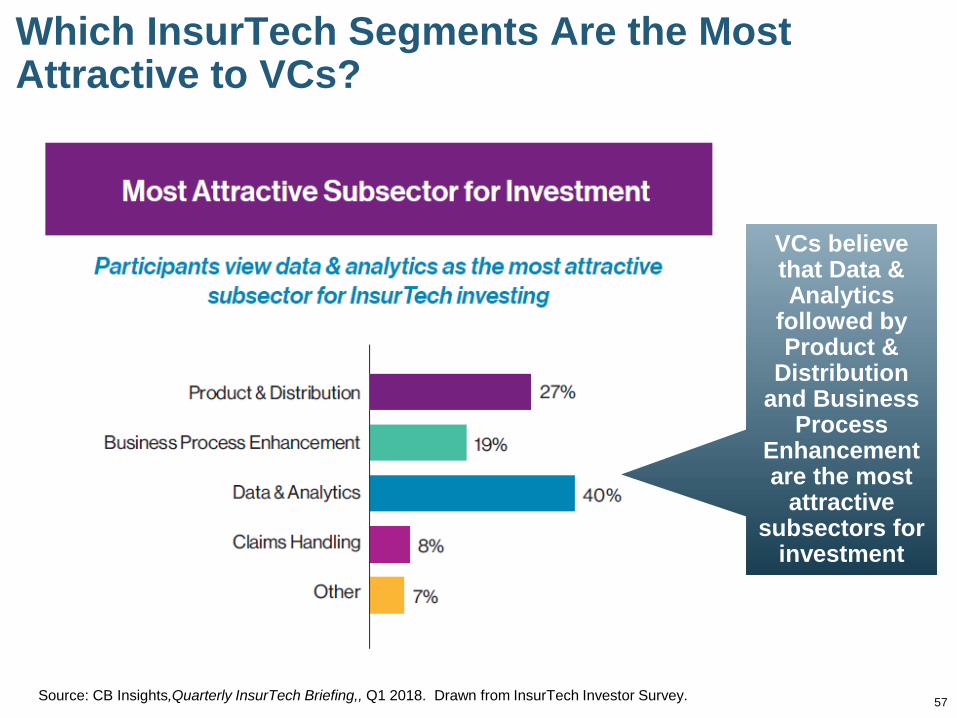
Which InsurTech Segments Are the Most Attractive to VCs?
Source: CB Insights,Quarterly InsurTech Briefing,, Q1 2018. Drawn from InsurTech Investor Survey.
VCs believe that Data & Analytics
followed by Product &
Distribution and Business
Process Enhancement are the most
attractive subsectors for
investment

6 Observations on Venture Capital Investment Patterns, Practices and Preferences1. Actual Risk-Bearing Insurer Start-Ups Are Rare and
Nobody Including VCs Is Clamoring for this to Change Implication: The near-term likelihood of a major tech usurper
invading the traditional P/C or Life insurance industry and bearing actual insurance risk is remote– The economics of such a transaction would likely destroy shareholder
value in the tech firm– Such a transaction would likely be rejected using traditional NPV or
IRR methods
2. Nature of InsurTech Investment Is Far More Complimentary to Insurer Operations than it Is Disruptive Implication: Much of what InsurTechs are doing can viewed as
an outsourcing of tech R&D. Insurers will adopt (acquire) or copy these technology if NPV is positive. – This is a very efficient way to manage tech investments– Options increase, less likely to be stuck with in a tech dead-end

Observation on Venture Capital Investment Patterns, Practices and Preferences
3. InsurTechs Prefer to Partner with “Smart Money” Investors Implication: Over the longer run, (re)insurers/large brokers could
account for the majority of InsurTech deals, along with some of the largest VCs with in-house insurance industry expertise– Increased presence of incumbents suggests a widening “Kill Zone” for
insurance startups
4. InsurTech Start-Ups Go Where (They Think) the Money Is Implication: With ~40% of premium dollar going to something
other than pure losses, it’s easy to see how InsurTechs would be drawn to areas such as Distribution – But these solutions are easily replicated or acquired– Data Analytics, Business Process Enhancement offer ongoing
opportunities to gain competitive and efficiency enhancements
Source: University of South Carolina, Center for Risk and Uncertain Management.

Observation on Venture Capital Investment Patterns, Practices and Preferences5. Valuations Are Likely Inflated: Pain to Come Implication: Over the longer run, (re)insurers/large brokers
could account for the majority of InsurTech deals, along with some of the largest VCs with in-house insurance industry expertise– Increased presence of incumbents suggests a widening “Kill Zone”
for insurance startups
6. “Cool” Ideas Aren’t Enough* Implication: Shift toward practical applications with an
emphasis on measurable results (ROI)– Neither InsurTech firms nor investors have endless time or money
for experimentation
*This point adapted from: PropertyCasualty360.com, InsurTech starups wane, but funds still pour into maturing market, Sam Friedman, April 10, 2018.
Source: University of South Carolina, Center for Risk and Uncertain Management.

61
Are Valuations for InsurTech Firms
The Curious Case of Softbank, Masayoshi Son, Silicon Valley—
and Swiss Re
62
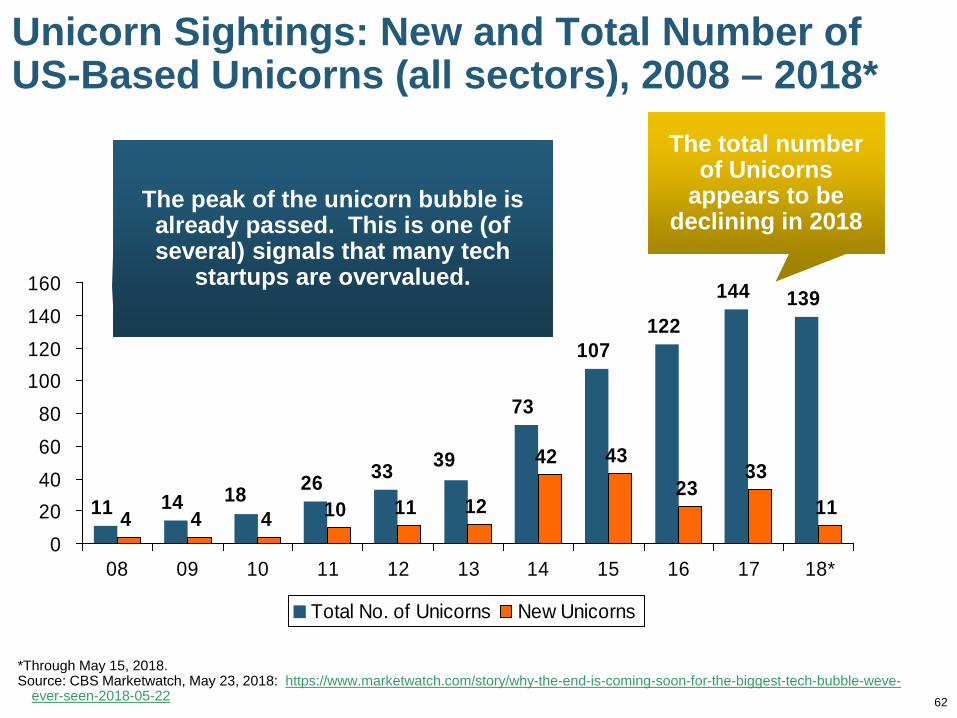
Unicorn Sightings: New and Total Number of US-Based Unicorns (all sectors), 2008 – 2018*
73
107122
144 139
4 4 4 10 11 12
42 4323
331111 14 18 26 33 39
020406080
100120140160
08 09 10 11 12 13 14 15 16 17 18*
Total No. of Unicorns New Unicorns
*Through May 15, 2018.Source: CBS Marketwatch, May 23, 2018: https://www.marketwatch.com/story/why-the-end-is-coming-soon-for-the-biggest-tech-bubble-weve-
ever-seen-2018-05-22
The total number of Unicorns
appears to be declining in 2018
The peak of the unicorn bubble is already passed. This is one (of several) signals that many tech
startups are overvalued.

Unicorn Cash: Cash Raised by Unicorns and Number of VC Funds Closing, 2008 – 2018*
Capital Raised ($ Billions)
*Through May 15, 2018.Source: CNBC.com, May 22, 2018 at https://www.cnbc.com/2018/05/22/tech-bubble-is-larger-than-in-2000-and-the-end-is-coming.html
$1 $1 $1
$6
$2
$14
$18$19
$9
$18
$330
7657
80
72
2777
25 23
10
$0
$2
$4
$6
$8
$10
$12
$14
$16
$18
$20
2008 2009 2010 2011 2012 2013 2014 2015 2016 2017 2018*0
10
20
30
40
50
60
70
80
90
Capital Raised ($B) Number of Funds Closed
No. Closed Funds
Capital raised by unicorns peaked in
2016
Unicorns not only becoming more
rare, they’re ability to raise cash is
stalling

Reasons Why Start-Up Valuations Are Falling and Will Continue to Fall Rising Interest Rates: Low interest rates made risky
investments of every variety more attractive—including tech start-ups. With yields of risk-free and corporate debt rising, VC investments are less attractive
IPO Busts: A number of companies that have gone public (or plan to) have seen their valuations plummet (pre- and post-IPO; e.g., SNAP: $17$14; Blue Apron: $10$3, FitBit: $45$7)
Profits Matter: 76% of companies that went public in 2017 were unprofitable, the highest since 81% at the peak of the dot-com boom in 2000 (Ritter, 2017)
Entrenched Incumbents Are Learning: Sector leaders are learning to quickly copy or adopt new technologies, allowing them to sustain their competitive advantage through disruption
*Through May 15, 2018.Source: CNBC.com, May 22, 2018 at https://www.cnbc.com/2018/05/22/tech-bubble-is-larger-than-in-2000-and-the-end-is-coming.html

65
IPOs with EPS<0 Is at Post Dot-Com Bust High
Source: Initial Public Offerings: Updated Statistics, Jay Ritter, University of Florida, Warrington School of Business. Data as of 1/17/2018 accessed at: https://site.warrington.ufl.edu/ritter/files/2018/01/IPOs2017Statistics_January17_2018.pdf
Proportion of IPO firms with negative profits rivals
Dot-Com era bust

66
INSURTECHSMOST ARE DOOMED TO EXTINCTION
Six Reasons Why Most InsurTech Firms Will Fail
Note: Parts of this section are adapted from: PropertyCasualty360.com, “Hey InsurTechs: Here’s Why You Will Likely Fail,” Karlyn Carnahan,June 8, 2018, accessed at: https://www.propertycasualty360.com/2018/06/08/hey-insurtechs-heres-why-you-will-likely-fail/

67
Why Most InsurTech Firms Will Fail1. Lack of Actual Knowledge of the Insurance Business: There is tremendous advantage to coming in with a fresh eye
and seeing the gaps that insiders have become blind to, but…
Structural nuances and idiosyncrasies of the business are many and are material
Regulatory requirements constitute and an enormous barrier to entry and a found throughout the industry value chain– Sales (licensing requirements, fiduciary/suitability requirements)– Claims (e.g., Fair Claims Handling Acts)– Underwriting (permissible underwriting criteria, rates must not be
“unfairly discriminatory”)– Pricing ultimately needs to reflect underlying risk, cover all
expenses and provide a risk appropriate return on capital) (rates must not be “inadequate or excessive)
Bottom Line: Actual insurance expertise is essential

68
Why Most InsurTech Firms Will Fail2. Lack of Understanding of the Economics of Insurance Insurance is oftentimes a low-margin business
You just can’t charge as much for your product as you might think.
Example: The average combined ratio in both the homeowners’ and personal auto market over the past decade was about 103.
This means that whatever thin profit was earned by the insurer was derived from investment earnings, of which the start-up has little-to-none
Also, if an InsurTech firm has an idea that claims will reduce claim costs but costs $20 per policy to introduce, the financials don’t work unless the cost reductions apply across the entire book of business, not just accounts with claims
Other: Pricing is often cyclical—meaning timing is everything when it comes to a product launch or investment in an InsurTech venture

69
Why Most InsurTech Firms Will Fail3. Investors Don’t Understand the Insurance Industry Smart Money vs. Dumb Money
Smart money comes with investors who understand the business and can help you with connections, advice, and insights to help you cross the hurdles
Dumb money is just money — and often is worse than dumb if the investors don’t understand the sales/pricing cycle and regulatory environment in the insurance industry
Dumb money may push you down a path that isn’t the best for your business because they’re looking for the short term returns and don’t understand that insurance is a longer term game than straight consumer plays
Axiom: If you’re running out of cash, all money looks smart

70
Why Most InsurTech Firms Will Fail4. Failure to Recognize that the Cost-Benefit Analysis Is a
Long-Term Return for an InsurerMany InsurTech firms claim they have an amazing product that
will reduce losses
The carrier has large upfront costs to acquire, implement and rollout the product and then must wait to see how (or if) losses or expenses are actually reduced, probably using a staged rollout.
Bottom Line: It clearly takes time (and money)for there to be a critical mass of benefit to overcome the day one costs. Not every carrier has an appetite for long term CBAs on unproven solutions
71
Why Most InsurTech Firms Will Fail5. Running Out of Cash All startups face the worry of running out of money and the hunt
for VC cash is relentless The insurance industry doesn’t buy quickly. Sales cycles even
on established products can run 18 months or longer.
6. The Product Isn’t All that Novel, Unique or Better All InsurTech start-ups claim to be disruptors Reality Check: Many aren’t (e.g., another online portal for selling
insurance—but with a cool user interface) If you’re placing your bets on buying traffic or Search Engine
Optimization, that bet will soon run outMany apps or ideas are easily and quickly replicated by
incumbents– Remember the “Kill Zone”

72
Summary
InsurTech:The Financing of Innovation,
Transformation and Disruption
72

Summary Increased interest in InsurTech in recent years has sparked
a great deal of interest and innovation in an industry that many feel is chronically behind the time
Successful InsurTech investments are elusive for many reasons—some inherent to VC investing but many inherent to the idiosyncrasies of investing in the insurance industry
Most InsurTech investments are complementary, not “disruptive” in the sense of a threat
InsurTech investment may be at or close to a peak
Startup valuations (in general) are likely stretched
Entrenched incumbants are learning to manage through disruption
Profits Matter!

Thank you for your timeand your attention!
Twitter: twitter.com/bob_hartwigFor a copy of this presentation, email me at [email protected]
74