Insuring African growth Insurance industry analysis - PwC · Insuring African growth Insurance...
56
Insuring African growth Insurance industry analysis www.pwc.co.za/insurance Analysis of major South African insurers’ results for the year ended 31 December 2014 March 2015
Transcript of Insuring African growth Insurance industry analysis - PwC · Insuring African growth Insurance...

Insuring African growthInsurance industry analysis
www.pwc.co.za/insurance
Analysis of major South African insurers’ results for the year ended 31 December 2014
March 2015

Insuring African growth
About this publication
We are pleased to present the fourth edition of PwC’s analysis of major insurers’ results, covering the year ended 31 December 2014. The results are a positive reflection of the financial health of the South African insurance industry in a challenging operating environment. We have also looked at some of the trends affecting the industry across the African continent and how these will affect their expansion into sub-Sahara Africa.
Insurance groups analysed in this publication include:
Long-term insurers• Discovery Holdings Limited (Discovery)
• Liberty Holdings Limited (Liberty)
• MMI Holdings Limited (MMI)
• Old Mutual plc – Emerging Markets Segment (Old Mutual)
• Sanlam Limited (Sanlam)
Short-term insurers• Mutual & Federal Limited (M&F)
• OUTsurance Holdings Limited (OUTsurance)
• Santam Limited (Santam)
• Zurich Insurance Company South Africa Limited (Zurich)
Due to some differences in reporting periods and changes in presentation and accounting policies, the information is not always comparable across insurers. Areas where there are differences are highlighted in Section 8.

PwC
Contents
1Overview of
industry results
02
4Investment
performance
26
7Key industry
statistics
46
2Long-term insurance
06
5Capital and
solvency
30
8Basis of
information provided
50
3Short-term insurance
20
6Progressing into the rest of Africa
32
9Contacts
52

2 Insuring African growth
Overview of industry results

3PwC
1Long-term insurance
Africa is progressively gearing itself towards a brighter future. Economic growth rates remain strong in sub-Saharan African economies. While the continued pressure on South African economic growth is starting to impact local insurers, there is hope in other key sub-Saharan markets that are enjoying strong growth rates.
Economic growth in South Africa in the past year has been weighed down by industrial action, most notably in the mining industry. High energy costs and power interruptions also continue to weaken growth. The reduction in the oil price towards the end of 2014 provided some short-lived respite for struggling consumers. Strong economic data, particularly improving unemployment figures, out of the US bodes well for the future.
The JSE All Share Index closed the year 8% higher and was on average 17% higher than in 2013. The JSE All Bond Index yielded 10%. Despite volatile interest rates in the bond market, 2014 risk discount rates only decreased marginally by about 10 basis points.
Insurers have made significant investments in building capacity to deal with the raft of changing regulations in the South African market. These include binder and outsourcing arrangements, the new solvency regime, Solvency Assessment and Management (SAM), with the comprehensive parallel run currently underway, treating customers fairly (TCF) and the retail distribution review (RDR). In addition, insurers will also have to contend with proposed changes to the four-funds basis of taxation of long-term insurers.
Client centricity remains top of the agenda for many CEOs. Companies are seeking to better understand the needs of their clients, in order to provide fit-for-purpose products. As an example, over the past two years most insurers have made significant mortality and morbidity profits on risk products. Aids loadings previously priced into premiums and valuations because of the uncertainty surrounding the disease are not manifesting in experience. The roll-out of antiretroviral treatments has succeeded in reducing mortality rates.
Key indicators
Group IFRS earnings up 17%
Group return on average equity of 21%
Group embedded value profits up 1%
Value of new business written up 12%
Margin on new business decreases to 2.9%

4 Insuring African growth
Consequently, insurers have started to amend policy benefits on existing contracts and premium rates on new policies issued in line with TCF regulation.
While long-term insurers have benefited from strong investment market performance over the past few years, the outlook in South Africa remains challenging. High levels of unemployment, low GDP growth rates, energy constraints, tax hikes, continued rand deterioration, industrial action and regulatory changes, all continue to weigh down on consumers and growth prospects. Despite these challenges, long-term insurers have been resilient and consistently produced on average a return on equity of around 20%.
Short-term insurance
Key indicators
Group IFRS earnings up 23%
Gross written premiums up 11%
Claims ratio improve to 63%
Underwriting margin increase to 7.6%
Return on average equity of 25%
International solvency margin reduce to 38%
After experiencing a difficult year in 2013, insurance companies improved their performance in 2014. The key ratios analysed in this publication point to the fruition of the selective repricing and efficiency strategies implemented in prior years.
The industry showed significantly improved results. One of the key factors contributing to the much-improved results has been the absence of any major catastrophe events. Two catastrophe events in 2013 alone are estimated to have cost the industry R2.4 billion in claims. The only catastrophe event of note during the 2014 year related to the earthquake experienced in the Gauteng area. OUTsurance has quantified the costs of this event, together with the effects of a weather-related incident in its Australian business, to an amount of R92 million. This compares favourably with the R174 million in catastrophe claims made in 2013.
Catastrophe events of the past few years also pushed insurers to restructure and optimise their reinsurance arrangements. Aon Benfield reported in January 2015 that global supply growth has exceeded actual demand for reinsurance. This confirms the reduction in noteworthy global catastrophe events in 2014.
The corrective actions taken have enabled the companies’ claims ratios to be significantly improved (decreasing from 68% in 2013 to 63% in 2014).Underwriting margins increased from 4.6% to 7.6% due to the reduced claims experience.
Aon Benfield’s report goes on to discuss alternative means by which insurers are seeking to optimise reinsurance due to the high costs involved in obtaining traditional catastrophe cover. Alternative capital currently makes up between 40% and 50% of global catastrophe reinsurance capital, of which catastrophe bonds and
5PwC
Overview of industry results
collateralised reinsurance make up the largest portion of the non-traditional reinsurance market.
The South African industry has benefited from the increased capacity. Reinsurance rates have not hardened in South Africa, despite the catastrophe events of the preceding two years. This has allowed local insurers to be very competitive, as they have been able to lay-off risk to reinsurers fairly cheaply.
Insurers continue to drive efficiencies and reduce costs in their claims handling, while continuing to increase rates to counter the effects that the very competitive market has had on premium levels, especially on personal lines. Their strategy for reducing claims handling costs has focussed on improving the process of assessing fees in order to arrive at a cost-effective and accurate claims estimate.
There is also evidence of insurers moving out of unprofitable business. Various rate increases in some loss areas are now starting to show up in lapses, effectively eliminating some unprofitable business. The major insurers have led the way in this process and this has had a ‘culling’ effect on their books, effectively creating a policyholder base of high-quality customers.
Some companies with growth ambitions are picking up some of the unprofitable book of business from the larger insurers. Consequently, while the smaller companies are showing very good growth, they are also experiencing claims ratios that are not appropriate for generating sustainable growth. The competition within the industry, especially for personal lines business, remains fierce.
Insurers continue to look for growth opportunities in countries outside of South Africa. OUTsurance’s Australian company, Youi, continues to show significant growth. It has also launched a similar company in New Zealand.
Santam and M&F continue to look for growth opportunities in sub-Saharan Africa and Asia. M&F are now the third-largest provider of property and casualty lines insurance following the acquisition of a local insurance company in Kenya.
Locally, there has been significant growth in commercial lines business. Santam alone grew its commercial lines by 15% during the year. It is expected that a lot more focus will be placed on generating growth in this line of business in the coming years. Intense competition has led almost all of the companies analysed to see their personal lines growth stagnate at a level only marginally above the CPI of 5.3%.
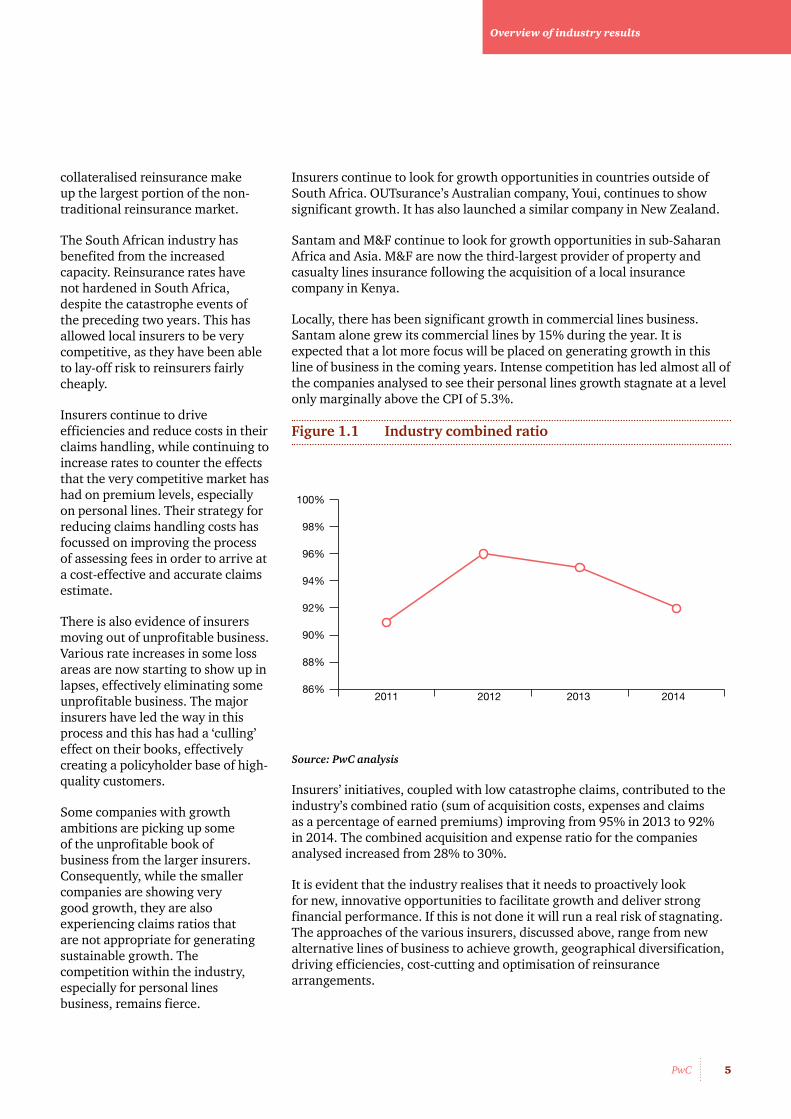
Figure 1.1 Industry combined ratio
Source: PwC analysis
Insurers’ initiatives, coupled with low catastrophe claims, contributed to the industry’s combined ratio (sum of acquisition costs, expenses and claims as a percentage of earned premiums) improving from 95% in 2013 to 92% in 2014. The combined acquisition and expense ratio for the companies analysed increased from 28% to 30%.
It is evident that the industry realises that it needs to proactively look for new, innovative opportunities to facilitate growth and deliver strong financial performance. If this is not done it will run a real risk of stagnating. The approaches of the various insurers, discussed above, range from new alternative lines of business to achieve growth, geographical diversification, driving efficiencies, cost-cutting and optimisation of reinsurance arrangements.
2011 201286%
88%
90%
92%
94%
96%
98%
100%
2013 2014

6 Insuring African growth
Long-term insurance

7PwC
2Group IFRS earnings
Combined IFRS earnings of R28.4 billion were up 17% on 2013. Equity markets closed 8% higher than in 2013. The results benefited from strong average equity market performance, with the average level of the market in 2014 being 17% higher than in 2013. This translated into higher values of assets under management which earned higher asset-based fees.
Equity markets were slightly less volatile than in 2013. However, insurers had to deal with the ongoing volatility in interest rates, particularly in the second half of the year, and emerging market currency fluctuations. Despite the volatile interest rates, 2014 risk discount rates only decreased marginally by about 10 bps.
Long-term insurers continue to manage market risk exposures conservatively and within predetermined ranges. Shareholder investment allocations were consistent with those in the prior year. This is evident in the consistency of earnings over the last three years. Shareholder investment portfolios remain invested in low risk and balanced mandates, eliminating volatility. As a result, insurers have been able to focus more on core operations and writing good quality insurance business.
Discovery posted a 28% return on average equity. This was boosted by the once off earnings impact of taking full ownership of the Prudential UK joint-venture. Old Mutual and Sanlam were at 22%, Liberty at 21%, while MMI was at 12% return on average equity.
Group IFRS earnings
Combined results
2014 Rm
2013 Rm
2012 Rm
2014 vs 2013
Total comprehensive income 28 400 24 239 18 982 17%
Return on average equity 21% 21% 20 %
8 Insuring African growth
Combined group embedded value earnings were close the 2013 levels. This result reflects the robust operating performances by most South African operations in 2014. The results benefited from the positive equity markets but at reduced levels compared to 2013. Most insurers recorded positive
experience variances, except for Old Mutual who suffered persistency losses in their Mass Foundation Cluster. The return on embedded value continued to benefit from strong positive mortality and morbidity experiences and assumption changes.
Embedded value
Combined results
2014 Rm
2013 Rm
2012 Rm
2014 vs 2013
Embedded value 277 111 249 117 220 344 11%
Embedded value earnings 39 427 39 207 38 941 1%
Return on embedded value 16% 18% 20%
Value of new business
Combined results
2014 Rm
2013 Rm
2012 Rm
2014 vs 2013
Present value of new business premiums (PVNBP)
206 447 172 650 152 228 20%
Embedded value of new business (VNB) 5 933 5 318 4 752 12%
Value of new business margin 2.9% 3.1% 3.1% -7%
Average payback period 6.4 years 6.3 years 6.3 years
Combined present values of new business premiums (PVNBP) written by the long-term insurers reflect very good results in a challenging environment. The 20% year-on-year increase is well in excess of CPI of 5.3%. New business volumes were strong in Rand terms.
However, the competitive environment took its toll on the embedded value profit margins achieved on new business written. The VNB margin of 2.9% reduced by 7% compared to 2013. The reduction in margin was more than offset by the significant increase in new business volumes. The combination of strong growth in PVNBP written with a marginal decrease in margins resulted in the overall VNB written increasing by 12%.
Group embedded value
Embedded value of South African new business

9PwC
Long-term insurance
The combined average payback period increased slightly to 6.4 years. This is a calculated crude measure to determine the period over which the majority of the VNB will be earned (PVNBP divided by annual premium equivalent).
Figure 2.1 Industry value of new business (VNB) and VNB margin
Source: PwC analysis
Figure 2.2 Value of new business (VNB) and VNB margin
Source: PwC analysis
Valu
e of
new
bus
ines
s (R
mill
ions
)
VNB m
argin
0
1 000
2 000
3 000
4 000
5 000
6 000
7 000
Discovery VNB
2012 20142013
Liberty VNB
Old Mutual VNB Sanlam VNB VNB margin
MMI VNB
2.5%
2.6%
2.7
2.8%
2.9%
3.0%
3.1%
3.2%
3.3%
Valu
e of
new
bus
ines
s (R
mill
ions
)
VNB m
argin
Value of new business
LibertyDiscovery MMI Old Mutual Sanlam
VNB margin
0
200
400
600
800
1 000
1 200
1 400
1 600
1 800
2 000
2012
2013
2014
2012
2013
2014
2012
2013
2014
2012
2013
2014
2012
2013
2014
0%
1%
2%
3%
4%
5%
6%
7%

10 Insuring African growth
DiscoveryDiscovery grew its PVNBP by 23% to R20.1 billion. The value of new business margin decreased slightly to 6.2%. This can be attributed to the decrease in VNB margin on the higher yielding Discovery Life risk business which reduced from 10.1% to 9.5% in the period.
Discovery’s VNB margin has not yet been significantly impacted by a change in product mix brought about by writing lower-margin investment business. The group has been able to maintain the growth in higher yielding risk business. A change in product mix towards more investment business could see the average VNB margin reduce in future.
Discovery highlighted the impact that enhanced policyholder engagement and smarter application of the Vitality loyalty programme has on lapse and claims experience. The group has seen consistent outperformance against lapse and claims assumptions in recent years. The group indicated that this is achieved by offering initial large discounts to market prices and then rewarding positive behavioural change and driving positive selective lapses by matching price to risk over time. Discovery’s expected payback period has increased to 8.6 years, compared to the industry average of 6.4 years. It would seem Discovery is extending the number of years over which cash flows are projected.
LibertyLiberty’s PVNBP grew strongly by 19% to R44.9 billion. The group was able to maintain the sales momentum of its Evolve single premium product and also grew its distribution sales forces. The group improved its large corporates market penetration and achieved
record single premium sales in the year. The recurring premium business environment was tough, with sales increasing only 3%. Liberty indicated that its new business margin achieved of 2.0% in 2014 was towards the top end of its target range.
Overall, the group embedded value of new business increased by 13% to R914 million. Liberty’s expected payback period is 5.9 years, compared to the industry average of 6.4 years.
MMIMMI’s PVNBP grew by 14% to R42.9 billion. The VNB margin achieved came in at around 1.8% for the third consecutive year. The embedded value of new business written increased by 12% to R775 million.
The Momentum Employee Benefits segment continued the strong new business growth that was seen in the latter half of 2013 and supported the bulk of the group’s growth in PVNBP. The growth was supported by different products, including a good contribution from Guardrisk as the group unlocks growth synergies post the acquisition. Metropolitan Retail, which focuses on the lower to middle-income market segment continues to struggle. For the six months to December 2014, the VNB decreased by 11% and its VNB margin reduced to 4.0% (six months to December 2013: 4.6%). Momentum Retail’s VNB margin reduced to 1.1% in the latter half of 2014 and with lacklustre PVNBP growth of 1% for that period, the VNB also decreased by 13%.
MMI’s expected payback period is 7.7 years, slightly up from the 7.3 years in the preceding two years.

11PwC
Long-term insurance
Old MutualOld Mutual increased its PVNBP by 12%, to R51.7 billion. This accounts for a quarter of the combined PVNBP of all the insurers included in this analysis. Its VNB margin was, however, not sustained in the year under review and decreased from 3.8% to 3.3%. As a result, the value of new business decreased marginally to R1.7 billion in 2014.
The decrease in VNB margin could be attributed to a change in product mix. Old Mutual indicated that new product launches and strong XtraMAX sales contributed to an increase in single premium sales in Retail Affluent business by 29%. Regular premium sales were however down by 6% due to the tough economic environment. Mass foundation cluster sales increased by 11% on the prior year due to a successful launch of the 2-IN-ONE savings product and improved adviser productivity. The group added 255,000 new customers to its fast-growing Mass Foundation market in South Africa. Old Mutual’s expected payback period is 6.7 years.
Old Mutual is targeting to have 10 million customers in the rest of Africa by 2020 compared to 3 million today.
SanlamSanlam’s PVNBP grew by 36% to R46.7 billion in 2014. Sanlam was also not able to maintain its VNB margin. In 2014, the VNB margin reduced from 3.0% to 2.7%. The net result was a VNB increase of 22% to R1.3 billion.
Sanlam Sky, the business unit that targets the lower end of the market, was hit hard by the labour disputes in the Rustenburg area, with VNB decreasing by 1% in 2014. Around 10% of Sanlam Sky’s new business originates from the platinum belt. The termination of the Capitec credit life underwriting agreement with effect from April 2015 may have a negative impact on new business sales going forward.
Sanlam’s expected payback period is 5.3 years.
12 Insuring African growth
Operating experience variances and assumption changes
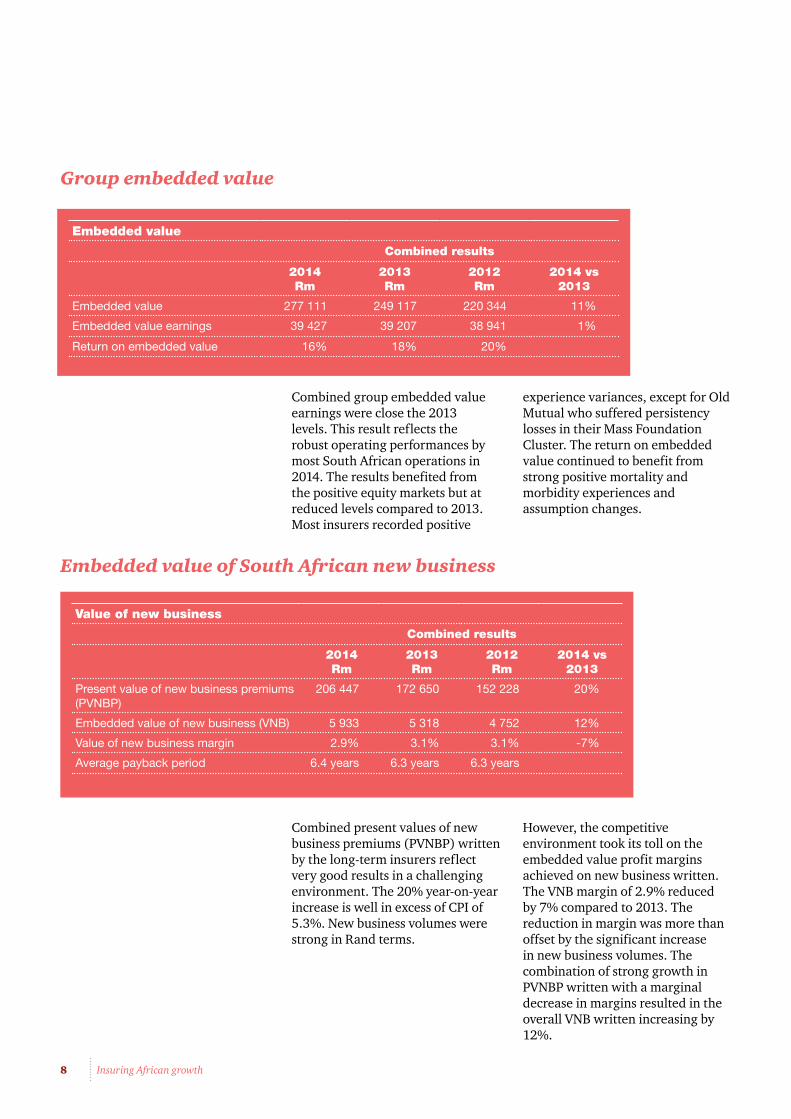
The majority of the industry managed actual expenses within the range of the projected actuarial assumptions set at the end of 2013. Discovery, Liberty and Sanlam were very close to expectations. It appears that Old Mutual may be incurring some expenses that they do not expect to recur. In spite of the expense losses experienced in 2014 and 2013, the expense assumption changes for the future are negligible (see below).
The insurers reported mixed results on their lapse and surrender
assumptions. The tough economic environment may be starting to impact negatively on the persistency of the insurers. Old Mutual experienced worse than expected lapses and surrenders, mostly in their Mass Foundation cluster.
As in the prior year, all insurers profited from better-than-expected mortality and morbidity experience, which contributed approximately 6% to 2014 embedded value earnings. Old Mutual and Sanlam benefited the most from these experience variances.
Assumption changes
Expenses Lapses and surrenders
Mortality and morbidity
2014 Rm
2013 Rm
2014 Rm
2013 Rm
2014 Rm
2013 Rm
Discovery -54 -34 -78 -312 0 0
Liberty 0 -217 -62 0 0 60
MMI 469 276 4 126 158 245
Old Mutual -4 143 -593 -376 1 489 47
Sanlam 32 26 88 13 167 655
Combined 443 194 -641 -549 1 814 1 007
Experience variances
Expenses Lapses and surrenders
Mortality and morbidity
2014 Rm
2013 Rm
2014 Rm
2013 Rm
2014 Rm
2013 Rm
Discovery 12 3 108 328 149 94
Liberty 0 0 119 195 185 155
MMI 100 87 -10 129 469 302
Old Mutual -302 -257 -198 -136 761 604
Sanlam 22 165 -64 211 842 645
Combined -168 -2 -45 727 2 406 1 800

13PwC
Long-term insurance
Discovery strengthened its expense assumptions in 2014. Despite the inflationary pressures in insurance businesses, most insurers managed their increase in cost base within the assumption set for 2014. MMI has capitalised expected expense savings amounting to R469 million. Expense savings of R500 million were targeted at the time of the creation of the MMI group. This appears to have been achieved from synergies following the merger of Momentum and Metropolitan. Old Mutual is expecting lower future expenses, which is in contrast to current-year expense experience variances that showed a loss coming through for the immediate past period.
Discovery, Liberty and Old Mutual strengthened their lapse assumptions to reflect uncertainty around future persistency. Sanlam have been able to maintain their persistency experience in the SA middle income market constant over the past five years. The focus on quality has resulted in a small gain being recognised in 2014. Old Mutual strengthened their persistency assumptions in the Mass Foundation Cluster, which reduced the expected value of VNB on this business.
Following the significant mortality and morbidity experience profits of 2014, the combined industry capitalised expected profits of R1.8 billion in 2014 (R1 billion in 2013). This has been partly attributed to the results of antiretroviral (ARV) medication’s rollout. The insurers’ AIDS risk loading is not materialising and this is reflected in some of the positive experience variances. In line with the spirit of Treating Customers Fairly (TCF) legislation, Old Mutual has amended policy benefits to share some of the mortality profits that are being realised with their existing customers by improving policy benefits. They also reduced the premiums on new funeral policies.

14 Insuring African growth
Sensitivity of value of in-force and value of new business written
Figure 2.3 Value of in-force (VIF) sensitivity
Note: Old Mutual does not provide a comparable sensitivity for the change in risk discount rates as part of its market consisted embedded value (MCEV) information.
Source: PwC analysis
VIF
sens
itivi
ty
-12%
-9%
-6%
-3%
0%
3%
6%
9%
12%
Risk discount rate +1%
Discovery SanlamOld Mutual*MMILiberty
Interest rate environment -1%Expenses -10%Mortality -5%
Lapses -10%
Discovery’s embedded value of in-force business is more sensitive to changes in risk discount rates. This could be indicative of writing more age-rated, increasing premium business, with the consequence that more profit is expected to be realised at later durations compared to the more immediate future. A change in risk discount rates may therefore have a more significant impact on the value of this kind of business.
Liberty and Old Mutual are the least sensitive to decreases in long-term interest rates. Liberty, through LibFin Markets (managing market risk exposures and credit portfolio) and LibFin Investments (shareholder investment portfolio), have kept their sensitivity to long-term interest rates constant. Overall,
a decreasing sensitivity to long-term interests indicates that most of the insurers managed their strategic balance sheet risks, including asset-liability matching and market risk exposures during the year.
Consistent with 2013, MMI, Old Mutual and Sanlam’s VIF are less sensitive to lapse risk. This may be indicative of a larger proportion of older in-force level premium policies which are, as a whole, less sensitive to changes in lapse rates in either direction. Discovery, on the other hand, writes predominantly age-rated, increasing premium business and unlike its main competitors, does not have an existing legacy book of level premium business. This makes the business as a whole more sensitive to lapse assumption changes.
15PwC
Long-term insurance
Discovery is less sensitive to changes in expense inflation. Old Mutual is the most sensitive to changes in expense inflation. This is also the area where they have had the most significant experience variances during the past two years.
Although all insurers are sensitive to changes in mortality and morbidity experience, this is a more stable input than the other assumptions.
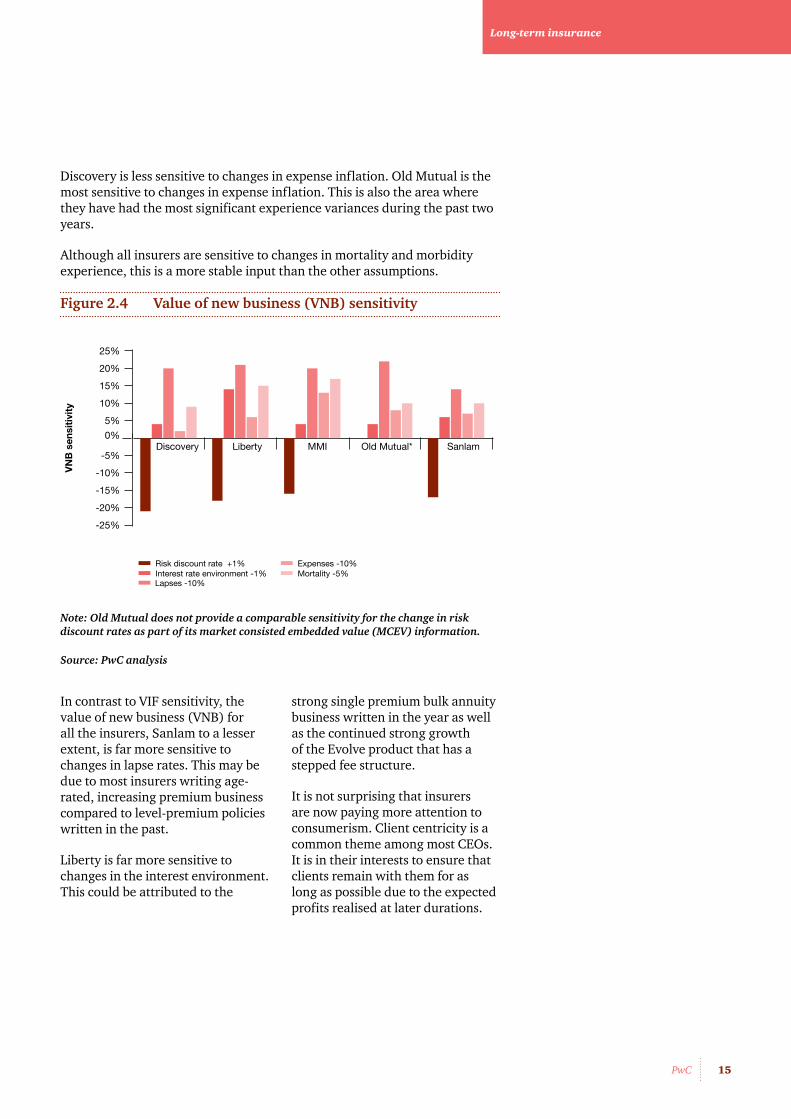
Figure 2.4 Value of new business (VNB) sensitivity
Note: Old Mutual does not provide a comparable sensitivity for the change in risk discount rates as part of its market consisted embedded value (MCEV) information.
Source: PwC analysis
VN
B s
ensi
tivi
ty
-25%
-20%
-15%
-10%
-5%
0%
5%
10%
15%
20%
25%
Risk discount rate +1%
Discovery SanlamOld Mutual*MMILiberty
Interest rate environment -1%Expenses -10%Mortality -5%
Lapses -10%
In contrast to VIF sensitivity, the value of new business (VNB) for all the insurers, Sanlam to a lesser extent, is far more sensitive to changes in lapse rates. This may be due to most insurers writing age-rated, increasing premium business compared to level-premium policies written in the past.
Liberty is far more sensitive to changes in the interest environment. This could be attributed to the
strong single premium bulk annuity business written in the year as well as the continued strong growth of the Evolve product that has a stepped fee structure.
It is not surprising that insurers are now paying more attention to consumerism. Client centricity is a common theme among most CEOs. It is in their interests to ensure that clients remain with them for as long as possible due to the expected profits realised at later durations.
16 Insuring African growth
Costs
Costs Combined results
2014 Rm
2013 Rm
2012 Rm
2014 vs 2013
Acquisition costs 16 917 14 482 12 828 17%
General marketing and administration costs
35 150 31 721 27 848 11%
Annual premium equivalent (APE) 32 086 27 479 24 074 17%
Acquisition costs increased in line with new business volumes. General marketing and administration costs increased in excess of CPI (2014: 5.3%). This continues the trend of life office expenses outpacing inflation since 2010. However, this should be seen against the backdrop of strong business growth over the past number of years. Insurers have to deal with a number of industry developments that ultimately add to the cost of doing business.
These include:
• binder arrangements and outsourcing that became effective in the last two years;
• the new solvency regime namely Solvency Assessment and Management (SAM) including:
• the comprehensive parallel run that is ongoing and with an effective date of 1 January 2016,
• initiatives required to comply with the enhanced governance requirements of SAM;
• the impact of protection of Personal Information Act on business practices
• treating customers fairly initiatives (TCF);
• the retail distribution review (RDR); and
• expenditure to upgrade legacy information technology.
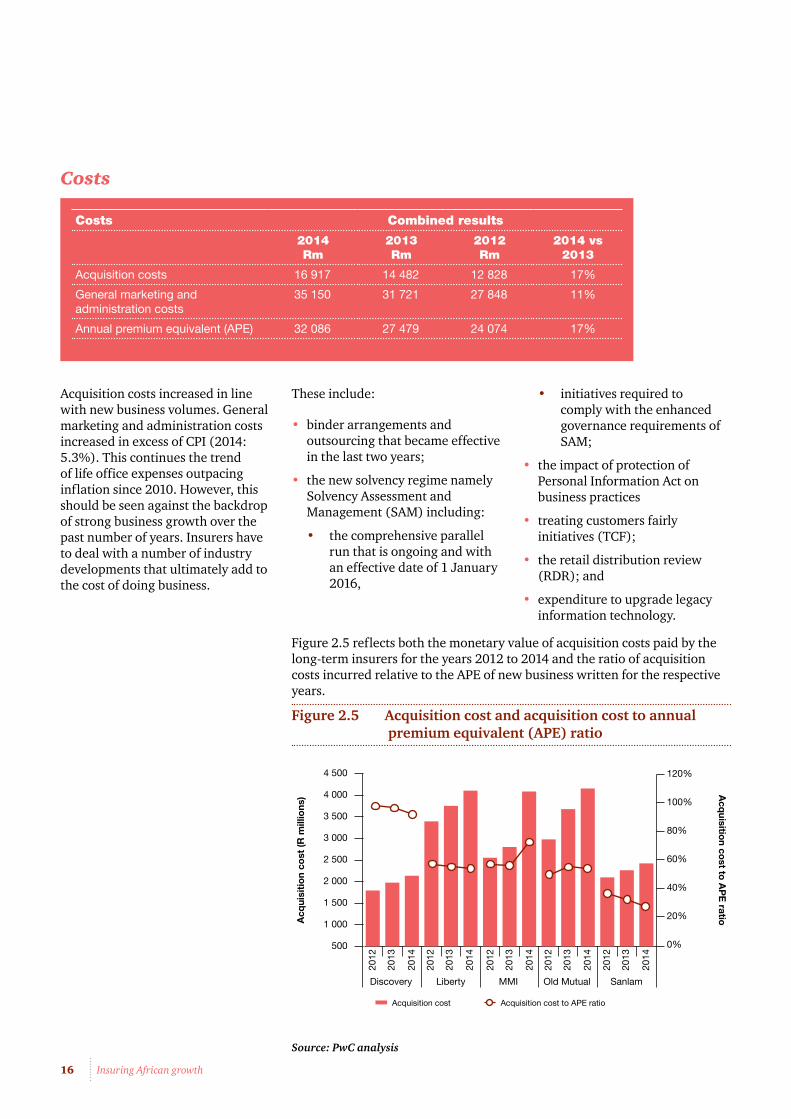
Figure 2.5 reflects both the monetary value of acquisition costs paid by the long-term insurers for the years 2012 to 2014 and the ratio of acquisition costs incurred relative to the APE of new business written for the respective years.
Figure 2.5 Acquisition cost and acquisition cost to annual premium equivalent (APE) ratio
Source: PwC analysis
Acq
uisi
tio
n co
st (R
mill
ions
) Acq
uisition co
st to A
PE
ratio
500
1 000
1 500
2 000
2 500
3 000
3 500
4 000
4 500
2012
2014
2013
2012
2014
2013
2012
2014
2013
2012
2014
2013
2012
2014
2013
Acquisition cost
Discovery Liberty MMI Old Mutual Sanlam
Acquisition cost to APE ratio
0%
20%
40%
60%
80%
100%
120%

17PwC
Long-term insurance
The Financial Services Board (FSB) is in the process of implementing RDR to achieve better outcomes for insurance customers. It is expected that the key FSB proposals for RDR will support the broader objectives of ensuring that distribution models support the TCF outcomes and are applied consistently across all financial subsectors.
Insurers’ new-generation products have been designed with RDR in mind. The acquisition cost to APE ratio has reduced for most companies in 2013 and 2014. The exception is MMI in 2014, but this is the result of the acquisition of Guardrisk and the accounting treatment followed for cell captive business.
Rest of Africa’s contribution
Figure 2.6 Rest of Africa VNB vs South African VNB
Source: PwC Analysis *Sanlam represents the Sanlam Emerging Market segment which includes, in addition to the rest of Africa, 11% for other international countries.
The contribution to the VNB written in the rest of Africa has decreased by 7% over the past year. In the prior two years, the value of new business grew year on year. All the major insurers saw a reduction in the value of new business written in 2014, which was down 22%. The only exception was Sanlam, whose VNB increased by 20% to R280 million.
Africa is still considered a strong growth market. Long-term insurers have indicated that they view Africa as a growth market, both organically as well as through mergers and acquisitions.
R m
illio
ns
Rest of Africa VN
B as a percentageof SA VN
B
0
500
1 000
1500
2 000
2 500
2012
2014
2013
2012
2014
2013
2012
2014
2013
2012
2014
2013
Liberty MMI Old Mutual Sanlam
0%
5%
10%
15%
20%
25%
Embedded value of new business (VNB) SAEmbedded value of new business (VNB) Rest of AfricaRest of Africa VNB as a % of SA VNB

18 Insuring African growth
Overall, the VNB of the rest of African business as a percentage of the value of new business written in South Africa ranged from 3% to 22% for the long-term insurers, and 10% on a combined basis.
Figure 2.7 Rest of Africa VNB margin vs South Africa VNB margin
Source: PwC Analysis * Sanlam represents the Sanlam Emerging Market segment which includes, in addition to the rest of Africa, 11% for other international countries.
The VNB margins at which new business is being written in the rest of Africa continues to be much higher than the average margins achieved in South Africa. This is due to Africa’s product mix, which has more risk products compared to South Africa. In the future, a shift towards more savings products could gradually result in a dilution towards lower VNB margins.
Driving growth through mergers and acquisitions
Most of the large South African insurers have made significant acquisitions in the rest of Africa. This trend will continue as insurers seek to diversify away from the weaker South African economy.
DiscoveryDiscovery has opted not to invest in growth through expansion in the rest of Africa. Discovery has footprints in South Africa, the United Kingdom and China. Additions have occurred and are expected in which Discovery partners with existing insurers in more developed insurance markets to leverage its successful Vitality wellness model. Recent additions include the partnership with Generali in Europe and a recent announcement regarding a possible partnership with a US life insurer.
As reported in the December 2014 results presentation, Discovery now have representation in eight of the 10 largest protection markets internationally and will continue to build and grow its partnerships.
VNB
mar
gin
0%
2%
4%
6%
8%
10%
12%
Rest of African VNB Margin
Liberty MMI Old Mutual Sanlam
2012 20142013 2012 20142013 2012 20142013 2012 20142013
SA VNB Margin

19PwC
Long-term insurance
Liberty Continued expansion of Liberty’s geographical footprint in Africa remains a key focus area as it extends its strategy to 2020. Liberty recently indicated that its focus will be on Kenya and Nigeria. Capital resources have been set aside to invest in these markets as opportunities arise. Standard Bank remains Liberty’s key distribution partner in these markets.
MMIMMI confirmed that growth will continue to come from geographical diversification, increasing its client base and increasing the value extracted from existing clients. This approach is in line with its client-centric strategy.
In October 2014 MMI completed the acquisition of Cannon Assurance Ltd in Kenya. It also entered into a partnership with an India-based financial services group, Aditya Birla Group, in October 2014. In December 2014 MMI also acquired the stockbroking firm Imara SP Reid operating in sub-Saharan Africa.
Old MutualOld Mutual is targeting 10 million customers in the rest of Africa by 2020, up from the three million reported for the 2014 financial year. Much of this will be achieved through acquisitions and organic growth.
Old Mutual recently secured a large public-sector scheme contract in Nigeria, along with the conclusion of the acquisition of Faulu Kenya DTM Ltd in April 2014. This acquisition added 1.1 million new customers.
Growth in Ghana and Nigeria has been achieved through expanding bancassurance relationships by bringing in other banking partners and continuing to build the relationship with Ecobank. Retail distribution capability was improved by employing 226 advisors in addition to the existing 101 advisors.
Old Mutual recently announced the acquisition of a 60.7% share in UAP Holdings in order to expand its footprint in East Africa and Central Africa. UAP has a footprint in Kenya, Uganda, South Sudan, Tanzania, The DRC and Rwanda. UAP Holdings’ product offering complement that of Old Mutual.
SanlamSanlam’s 2014 acquisitions now give it a direct footprint in 10 African countries, Europe, India and Malaysia. The group acquired the following interests in the rest of Africa:
• A 40% shareholding in one of the largest general insurance companies in Ghana, Enterprise Insurance Company Limited, for R237 million;
• A 63% interest in Soras Group Limited, Rwanda’s largest life and non-life insurance company, for R255 million. The country has one of the fastest-growing economies on the continent;
• Extending its interests in the NICO group of insurers (operating in Malawi, Zambia and Uganda); and
• Increasing its indirect stakes in FBN Life in Nigeria and Botswana Insurance Holdings Limited.
Sanlam’s international businesses now contribute 26% to group profit. Given Sanlam’s continuing diversification strategy, the percentage contribution to profit from international business will continue to grow.
Locally, Sanlam has also identified an opportunity to grow its local product offering through a 28.7% strategic stake in Medscheme. Medscheme is currently South Africa’s third-largest medical scheme administrator. Sanlam believes that this will provide growth opportunities through offering insurance products to Medscheme clients and medical aid solutions to insurance clients. The acquisition is yet to be concluded.
The agreement between Sanlam Emerging Markets (SEM) and Santam reported on last year has also seen an expansion in Sanlam’s general insurance footprint in Africa increasing from six in 2013 to 11 at the close of 2014.

20 Insuring African growth
Short-term insurance
21PwC
3Gross written premiums
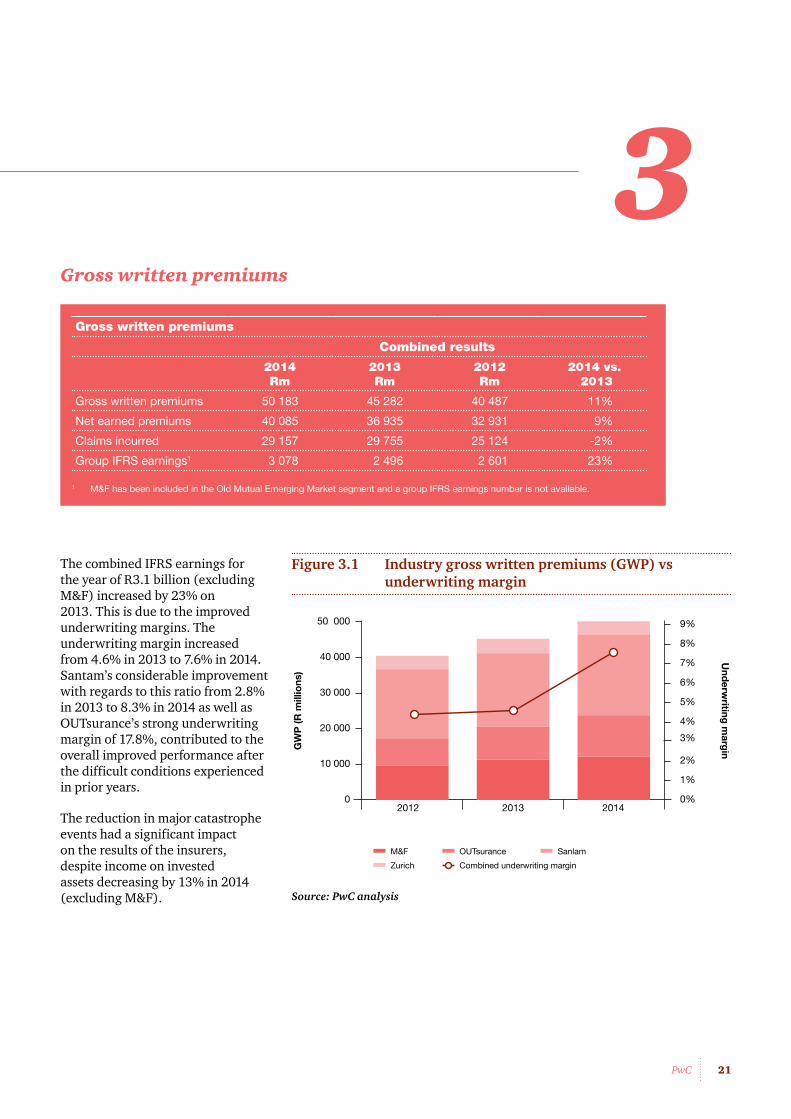
The combined IFRS earnings for the year of R3.1 billion (excluding M&F) increased by 23% on 2013. This is due to the improved underwriting margins. The underwriting margin increased from 4.6% in 2013 to 7.6% in 2014. Santam’s considerable improvement with regards to this ratio from 2.8% in 2013 to 8.3% in 2014 as well as OUTsurance’s strong underwriting margin of 17.8%, contributed to the overall improved performance after the difficult conditions experienced in prior years.
The reduction in major catastrophe events had a significant impact on the results of the insurers, despite income on invested assets decreasing by 13% in 2014 (excluding M&F).
Figure 3.1 Industry gross written premiums (GWP) vs underwriting margin
Source: PwC analysis
GW
P (R
mill
ions
)
Underw
riting margin
0
10 000
20 000
30 000
40 000
50 000
2012 201420130%
1%
2%
3%
4%
5%
6%
7%
8%
9%
M&F OUTsurance
Zurich Combined underwriting margin
Sanlam
Gross written premiums
Combined results
2014 Rm
2013 Rm
2012 Rm
2014 vs. 2013
Gross written premiums 50 183 45 282 40 487 11%
Net earned premiums 40 085 36 935 32 931 9%
Claims incurred 29 157 29 755 25 124 -2%
Group IFRS earnings1 3 078 2 496 2 601 23%
1 M&F has been included in the Old Mutual Emerging Market segment and a group IFRS earnings number is not available.

22 Insuring African growth
Gross written premiums increased by 11% from 2013 to R50.2 billion in 2014. As was the case in 2013, this increase was higher than CPI of 5.3%. This is mainly due to insurers continuing to effect rate increases in order to mitigate rising insurance costs as well as to counter the effects of the previous lean years.
It is interesting to note that OUTsurance’s Australian business (Youi) continues to show significant growth in its gross written premiums. Youi experienced growth of 66% in gross written
premiums for the calendar year ended 31 December 2014. If this is removed from OUTsurance’s results, growth in South Africa would only be 6% for OUTsurance and 7% for the industry overall. This confirms to some extent that the local industry is not really growing by much more than CPI.
Despite this, and the fact that Zurich’s gross written premiums declined by 9%, the local industry has remained stable in terms of its growth, marginally ahead of CPI. Santam has continued to post consistently strong results.
Figure 3.2 Gross written premiums (GWP) vs underwriting margin
Source: PwC analysis
GW
P (R
mill
ions
)
Underw
riting margin
0
5 000
10 000
15 000
20 000
25 000
2012
2014
2013
2012
2014
2013
2012
2014
2013
2012
2014
2013
M&F OUTsurance Santam Zurich
-20%
-10%
0%
10%
20%
30%
40%
Gross written premiums Underwriting margin
23PwC
Short-term insurance
Mutual & Federal (M&F)The company’s gross written premiums increased from R11.3 billion in 2013 to R12.2 billion in 2014. While this increase of 8% is below the industry average of 11%, it is above the CPI of 5.3%. There has been an improvement in the gross written premiums in the property and casualty lines driven by strategic rate increases. The personal lines also showed a turnaround during the year, again influenced by strategic pricing changes made during the period.
OUTsuranceOUTsurance continued to show good growth, with gross written premiums increasing from R9.2 billion in 2013 to R11.6 billion. The growth is largely attributable to Youi increasing gross written premiums by 66%. This trends is envisaged to continue for the foreseeable future, considering the success of the company in Australia and Youi New Zealand becoming fully functional. The weakening of the rand should also continue to add exchange-rate profits upon conversion from the Australian and New Zealand dollars.
The company’s South African business grew in line with inflation by 6%, from R6.3 billion in 2013 to R6.6 billion in 2014.
SantamSantam grew its gross written premiums by 10% to R22.7 billion in 2014. A major factor in the increase was the growth of 15% experienced in its commercial lines. The company’s direct insurance business, MiWay, also contributed significantly, increasing by 15% to R1.5 billion and returning a profit for the first time since its inception.
The company’s personal lines grew at a rate of 6%, in line with the CPI of 5.3%. This is an area of focus for management to continue to find new, innovative ways in which to grow this segment.
ZurichZurich’s gross written premiums decreased from R4.1 billion in 2013 to R3.7 billion in 2014. The company’s rate increases in 2013 resulted in increased gross written premiums as part of the strategy to improve its financial performance. The rate increase in the prior year resulted in a portion of the book moving to other insurance companies. The objective of the company is to remove unprofitable books of business by repricing underperforming books as well as creating sustainable retention policies on the profitable lines.

24 Insuring African growth
Key insurance ratios
The past year was considerably better for the insurance industry. Strategies implemented in prior years to improve performance are beginning to bear fruit. Most of the companies under review improved their claims ratios and the combined claims ratio for the industry decreased from 67.7% in 2013 to 62.5% in 2014, due to a number of factors, including:
• No major catastrophe events in South Africa during the year compared to prior years;
• Companies in the industry driving efficiencies in claims handling processes and managing down claims assessment costs;
• The re-rating of policies in excess of CPI continued during the year, ensuring growth in gross written premiums is maintained;
• Major players in the industry ‘cleaning up’ their books and re-rating unprofitable business; and
• A lot more emphasis being placed on more profitable commercial lines.
Overall, the market’s underwriting margin improved from 4.6% in 2013 to 7.6% in 2014.
M&FThe company significantly improved its claims ratio from 76% in 2013 to 69%. This is as a result of increasing rates during the year and implementing a strategy to reduce claims costs by driving efficiencies. Underwriting margins improved from -4% in 2013 to 2% in 2014.
The company’s direct insurance business, iWyze, has also made good progress, improving its underwriting result from a R136 million loss in 2013 to a loss of R85 million in 2014. This result benefited from the launch of no-claims rewards on the buildings lines product.
OUTsuranceThere were much reduced catastrophe claims in 2014. Catastrophe claims in the latter half of the year were R92 million, R82 million lower than in 2013.
The company also incurred start-up losses of R45 million for Youi New Zealand, which had a negative impact on the profitability of the Australasian business.
Key ratios
Combined results
2014 2013 2012
Claims ratio 62.5% 67.7 % 66.2%
Acquisition cost ratio 9.9% 10.9% 11.5%
Expense ratio 20.0% 16.8% 17.9%
Combined ratio 92.4% 95.4% 95.6%
Underwriting margin 7.6% 4.6% 4.4%
Total 100.0% 100.0% 100.0%

25PwC
Short-term insurance
SantamSantam had a large increase in its underwriting margin in the current year, from 2.8% in 2013 to 8.3% in 2014 above the target range of between 4% and 6%. The main factors driving this increase were gross written premiums, which increased by 10%, and the claims costs, net of reinsurance recoveries, which decreased by 6%.
The underwriting margin was further improved by improvements in the commercial lines, which increased by 126% when compared to the prior year. MiWay also performed well and increased its gross underwriting result, net of CAT recoveries by 194%.
Having taken the above into account, it is important to note that a large portion of the commercial lines has been influenced by the good performance of the crop business with an increase in the net underwriting surplus from -R142 million in 2013 to a positive R251 million in 2014. This result is unlikely to be maintained for this class of business due to the fact that the agricultural sector is experiencing drought in the first portion of 2015.
ZurichAlmost all of Zurich’s key ratios have improved in the current year despite the company still making a reduced underwriting loss. This shows that the new strategies implemented in ‘cleaning up’ its books of business from unprofitable policyholders is bearing fruit.
Key ratios to consider are the decrease in claims ratio from 79% in 2013 to 74% in 2014 as well as the improvement in underwriting margin from -17% in 2013 to -12% in 2014. These ratios are still above the industry average, but should Zurich’s improvement initiatives be sustainable, this will put the company in a good position to continue improving its results.
The companies’ results show they have all had a very strong 2014 and been successful in implementing changes to their business strategies. Reduced catastrophe events have also helped, together with the optimisation of reinsurance arrangements.

26 Insuring African growth
Investment performance

27PwC
4Market performance
Global investment performance was lower than expected, on the back of a cooling global economy. Falling oil prices and political uncertainty in parts of the world were among the factors influencing this investment performance. Following the global economic downturn in 2014, China experienced reduced growth due to weaker demand for its exports. This negatively affected resource-based economies such as South Africa.
Closer to home, while the mining sector showed improvement towards the latter part of the year following longer than expected mining strikes, erratic energy supplies and rising costs continue to impact economic growth. Surprisingly, the JSE All Share Index closed 7.6% higher than in 2013.
The JSE All Bond Index yielded a return of 10% after experiencing significant volatility during the year.
Figure 4.1 JSE All Share Index
Source: McGregor BFA
Figure 4.2 All Bond Index yield
Source: McGregor BFA
36 000
38 000
40 000
42 000
44 000
46 000
48 000
50 000
52 000
54 000
31 D
ec 1
430
Nov
14
31 O
ct 1
430
Sep
t 14
31 A
ug 1
431
Jul
14
30 J
un 1
431
May
14
30 A
pr 1
4
31 M
ar 1
428
Feb
14
31 J
an 1
431
Dec
13
30 N
ov 1
3
31 O
ct 1
330
Sep
t 13
30 A
ug 1
331
Jul
13
30 J
un 1
3
31 M
ay 1
330
Apr
13
31 M
ar 1
328
Feb
13
31 J
an 1
31
Jan
13
Inde
x
JSE ALSI JSE ALSI average
6.5
7.0
7.5
8.0
8.5
9.0
31 D
ec 1
430
Nov
14
31 O
ct 1
430
Sep
t 14
31 A
ug 1
431
Jul
14
30 J
un 1
431
May
14
30 A
pr 1
431
Mar
14
28 F
eb 1
431
Jan
14
31 D
ec 1
330
Nov
13
31 O
ct 1
330
Sep
t 13
31 A
ug 1
3
31 J
ul 1
330
Jun
13
31 M
ay 1
330
Apr
13
31 M
ar 1
328
Feb
13
31 J
an 1
31
Jan
13
Yiel
d
ALBI total return index yield ALBI total return index yield average

28 Insuring African growth
Industry investment performance
The combined invested assets of the long-term insurers grew by 10.4% from R1.77 trillion in 2013 to R1.95 trillion. Total investment income earned amounted to R186.7 billion, representing a return on average investments of 10%. This is reflective of subdued equity market performance in 2014 compared to 2013.
Figure 4.3 Return on invested assets: Long-term insurers
Source: PwC analysis
0%
2%
4%
6%
8%
10%
12%
14%
16%
2013 Return on invested assets
Discovery Liberty MMI Old Mutual Sanlam
2014 Return on invested assets
Long-term insurers Combined results
2014 Rm
2013 Rm
2012 Rm
2014 vs 2013
Total invested assets1 1 955 528 1 771 643 1 533 680 10 %
Income on invested assets 186 761 244 293 215 348 -24%
Return on average invested assets 10.0% 14.9% 15.3%
Short-term insurers Combined results
2014 Rm
2013 Rm
2012 Rm
2014 vs 2013
Total invested assets2 26 597 24 201 22 034 10%
Income on invested assets 1 679 1 932 2 028 -13%
Return on average invested assets 6.6% 8.4% 9.2%
Source: PwC analysis
¹ Invested assets comprise the group financial assets as well as the cash and cash equivalents of the insurers (for Old Mutual the Emerging Market segment information has been used, which for 2014 includes M&F). This includes all policyholder and shareholder assets.
2 Invested assets comprise the group financial assets as well as the cash and cash equivalents of the insurers. It excludes M&F for all years presented as separate segment information is no longer available.

29PwC
Investment performance
DiscoveryDiscovery grew invested assets by 27%, from R39 billion in 2013 to R49 billion. Discovery attributes a part of this growth to an increased take up of its integrated investment products, market momentum and increased advisor support.
LibertyLiberty’s invested assets grew by 8% from R339 billion in 2013 to R365 billion in 2014. Liberty’s shareholder investment portfolio includes a 31% exposure to equities (local and foreign). Other significant categories include cash at 25% and bonds at 23%. Liberty’s shareholder assets allocation remained comparable to that of 2013 showing marginal increases in foreign bonds, cash and property.
MMIMMI’s invested assets grew by 12% from R361 billion in 2013 to R404 billion in 2014. MMI’s shareholder asset allocation remained comparable to that of 2013, with the exception of a reduction in debt securities.
Old MutualOld Mutual’s Emerging Markets invested assets grew by 9% from R546 billion in 2013 to R595 billion.
SanlamSanlam’s invested assets grew by 11.6% from R486 billion in 2013 to R543 billion. No less than 90% of Sanlam’s assets under management outperformed their benchmark on a rolling five-year basis in 2014. Shareholder’ asset allocation remained comparable to that of 2013, with a slight increase in interest-bearing investments.
Figure 4.4 Return on invested assets: Short-term insurers
Source: PwC analysis
Combined invested assets of the short-term insurers (excluding M&F) increased by 10% from R24.2 billion to R26.6 billion. OUTsurance was the main contributor with total invested assets increasing by 24%. This can be attributed to lower dividends paid in order to fund the organic growth of Youi in Australia and New Zealand.
All the short-term insurers’ investment returns reduced by a relatively similar margin from 2013 to 2014. Santam implemented a fence structure on equities to the value of R1.3 billion in February 2015. The fence structure provides 10% downside protection and a 10.9% participation in the upside market movements on those equities. This structure matures in December 2015.
0%
2%
4%
6%
8%
10%
12%
14%
2013 Return on invested assets
OUTsurance Santam Zurich
2014 Return on invested assets
30 Insuring African growth
Capital and solvency Long-term insurance
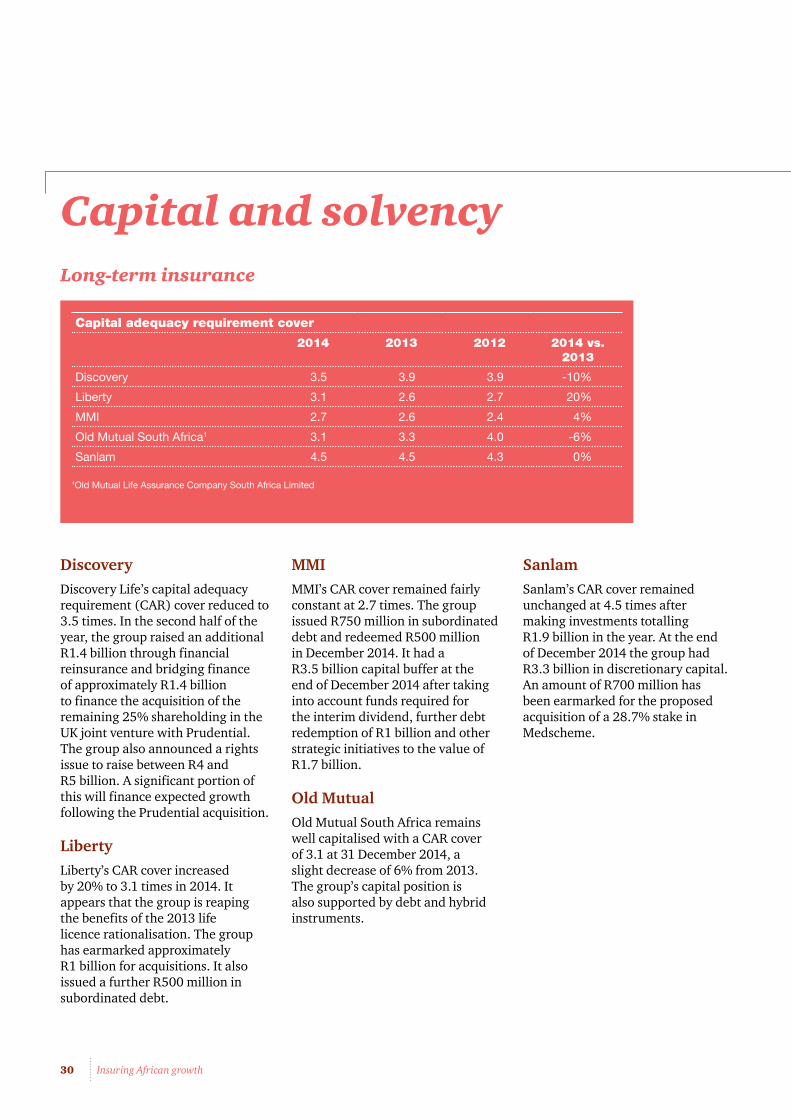
DiscoveryDiscovery Life’s capital adequacy requirement (CAR) cover reduced to 3.5 times. In the second half of the year, the group raised an additional R1.4 billion through financial reinsurance and bridging finance of approximately R1.4 billion to finance the acquisition of the remaining 25% shareholding in the UK joint venture with Prudential. The group also announced a rights issue to raise between R4 and R5 billion. A significant portion of this will finance expected growth following the Prudential acquisition.
LibertyLiberty’s CAR cover increased by 20% to 3.1 times in 2014. It appears that the group is reaping the benefits of the 2013 life licence rationalisation. The group has earmarked approximately R1 billion for acquisitions. It also issued a further R500 million in subordinated debt.
MMIMMI’s CAR cover remained fairly constant at 2.7 times. The group issued R750 million in subordinated debt and redeemed R500 million in December 2014. It had a R3.5 billion capital buffer at the end of December 2014 after taking into account funds required for the interim dividend, further debt redemption of R1 billion and other strategic initiatives to the value of R1.7 billion.
Old MutualOld Mutual South Africa remains well capitalised with a CAR cover of 3.1 at 31 December 2014, a slight decrease of 6% from 2013. The group’s capital position is also supported by debt and hybrid instruments.
Capital adequacy requirement cover
2014 2013 2012 2014 vs. 2013
Discovery 3.5 3.9 3.9 -10%
Liberty 3.1 2.6 2.7 20%
MMI 2.7 2.6 2.4 4%
Old Mutual South Africa1 3.1 3.3 4.0 -6%
Sanlam 4.5 4.5 4.3 0%
1Old Mutual Life Assurance Company South Africa Limited
SanlamSanlam’s CAR cover remained unchanged at 4.5 times after making investments totalling R1.9 billion in the year. At the end of December 2014 the group had R3.3 billion in discretionary capital. An amount of R700 million has been earmarked for the proposed acquisition of a 28.7% stake in Medscheme.
31PwC
5Short-term insurance
International solvency margin
2014 2013 2012 2014 vs 2013
Combined solvency margin 42% 40% 43% -6%
Individual companies M&F OUTsurance Santam Zurich
2014 36% 40% 45% 60%
2013 35% 43% 42% 58%
2012 47% 47% 41% 69%
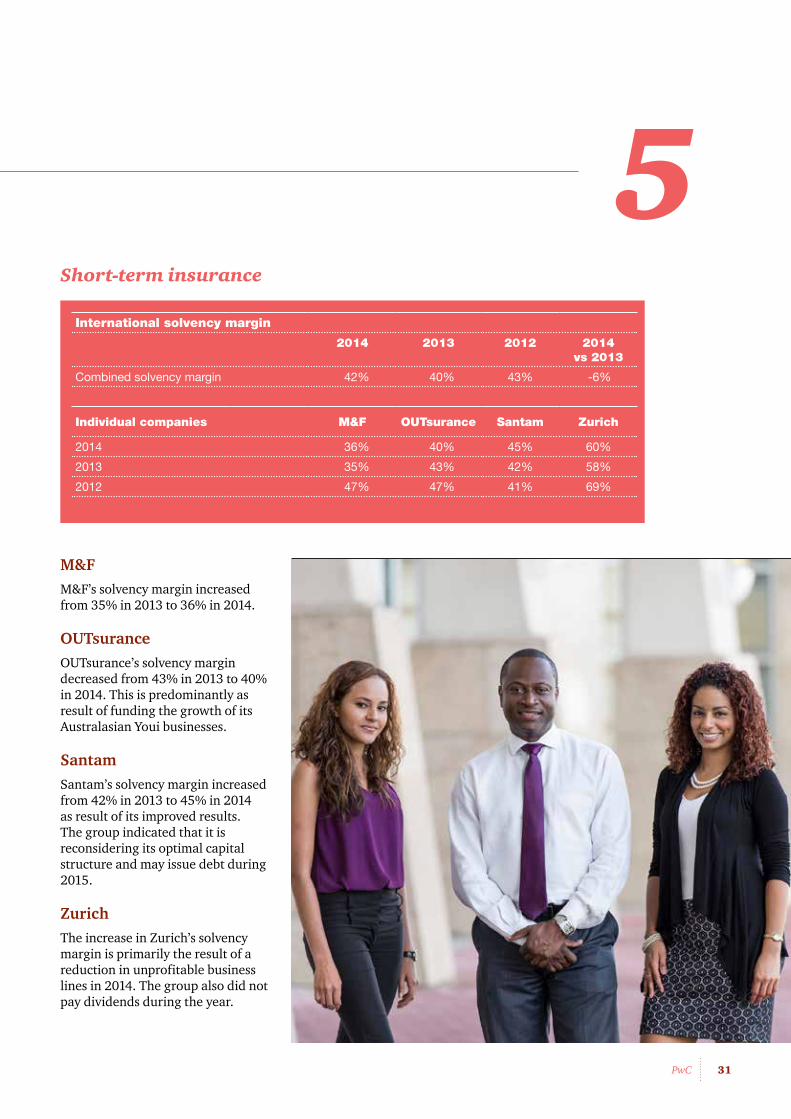
M&FM&F’s solvency margin increased from 35% in 2013 to 36% in 2014.
OUTsuranceOUTsurance’s solvency margin decreased from 43% in 2013 to 40% in 2014. This is predominantly as result of funding the growth of its Australasian Youi businesses.
SantamSantam’s solvency margin increased from 42% in 2013 to 45% in 2014 as result of its improved results. The group indicated that it is reconsidering its optimal capital structure and may issue debt during 2015.
ZurichThe increase in Zurich’s solvency margin is primarily the result of a reduction in unprofitable business lines in 2014. The group also did not pay dividends during the year.

32 Insuring African growth
Progressing into the rest of Africa

33PwC
6Africa is gearing itself towards a brighter future as it takes decisive steps to demolish long-held stereotypes of it as ‘the dark continent’.
Through Africa’s journey to prosperity, new opportunities are being created for insurers. Returns on investment and insurance margins in the rest of Africa are perceived to be higher than in developed markets or South Africa.
The combination of new-found wealth in resources, large infrastructure development projects and youthful growing populations now make Africa an attractive investment destination. Relatively stable democracies and improvements in governance have seen steady economic growth in key markets such as Nigeria and Kenya and the surrounding regions.
GDP growth rates in the 5-7% range are predicted in sub-Saharan Africa for the foreseeable future and much of this growth is being shaped by global megatrends that are affecting African economies and shaping the insurance landscape. These megatrends include:
• Rapid urbanisation;
• Demographic and social change;
• Shifts in global economic power;
• Climate change and resource scarcity; and
• Technological breakthroughs.
Rapid urbanisationAfrican countries are urbanising at an average rate of 4% per annum. It is estimated that the urban population in Africa will increase to 56% by 2050, making it the most rapidly urbanising region in the world.
By 2050:
• Africa will account for almost 24% of the world’s population;
• two in three Africans will be urbanised; and
• 400 million people in Africa will have migrated from rural areas to cities.
Lagos is expected to be the 12th largest city in the world by 20251
and Africa’s workforce will surpass China’s by 20252.
1 Forbes: The world’s fastest growing megacities
2 World Bank
Figure 6.1 Africa’s urban and rural population trends
Mill
ion
s
200
0
400
600
800
1 000
1 200
1 400
1 600
Rural Urban
1950
1970
1990
2010
2042
2050
2046
2038
2034
2014
2018
2020
2026
2030
2006
2002
1998
1994
1986
1982
1978
1974
1966
1962
1958
1954
Source: United Nations Population Division, World Urbanisation Propects, the 2014 revision

34 Insuring African growth
A large number of those urbanising from rural areas are likely to settle in informal settlements initially. The spread of communicable diseases in these areas will remain high as a result of poor water and sanitary infrastructure. Access to healthcare will become an increasing necessity along with the growth in housing and urban infrastructure.
The increasing number of infrastructure development programmes that we are now seeing in East and West Africa is a response to the growing demand for services in urban areas. This will eventually result in an increase in insurable assets and drive positive insurance growth on the continent.
Demographic and social change
Emerging middle classA striking feature of urbanisation is the growth of the African middle class. A recent study by Standard Bank3 on the 11 fastest growing countries in Africa indicates that by 2030, the numbers of middle class households in these countries will increase from 15 million to 40 million.4 The increase in spending power as a result of this will have a direct impact on demand for insurance and savings products.
Figure 6.2: Africa’s growing middle class
Source: Standard Bank, Understanding Africa’s middle class
3 Standard Bank, Rise of the middle class in sub-Saharan Africa (Published 20 August 2014) & Standard Bank Research: Understanding Africa’s Middle Class
4 Angola, Uganda, Nigeria, Ghana, Kenya, Tanzania, Ethiopia, Sudan, South Sudan, Mozambique and Zambia
Total middle-class households
Mill
ions
1990 2000 2014 20300
5
10
15
20
25
30
35
40
45
Total lower middle-class households

35PwC
Progressing into the rest of Africa
Ranking household consumption/income
Annual household consumption (US$ constant, 2005)
Daily household consumption
Low income Under US$5 500 Under US$15
Lower middle class US$5 500 – US$8 500 US$15 – US$23
Middle class US$8 500 – US$42 000 US$23 – US$115
Upper middle class US$42 000 and above US$115 and above
Source: Standard Bank Research
Africa’s young population As urban populations expand rapidly and the patterns of settlement and employment shift, healthcare providers in both public and private sectors need to increase both the range and location of service delivery. This provides an opportunity for the provision of health and other insurance products. However, this will not be without challenges.
Figure 6.3 Age distribution, Africa vs world
Source: United Nations Population Division, World Population Prospects, the 2010 revision
Africa has a young population. This is encouraging for health insurers as younger people tend to be healthier. However, Africa has worrisome unemployment rates to contend with and it is estimated that youth unemployment is twice that of adults. The continent’s fast economic growth may in time address this imbalance and open up opportunities for health and other insurance products.
World
0-140-140-14 15-44 45-55 65+0%
10%
20%
30%
40%
50%
Africa
26%
40%
46%
45%
20%11%
8%4%

36 Insuring African growth
Among 260 African CEOs who were surveyed for PwC’s Africa business agenda 2014 report, two in three CEOs indicated that technological advances, urbanisation and demographic shifts, will impact their business significantly in the next five years.
Figure 6.4 Megatrends impacting society and business
Source: The Africa business agenda, PwC 2014
1st 2nd 3rd
69%Technologicaladvances
67%Urbanisation
63%Demographicshifts41%
23%
5%
31%
22%14%
19%
21%
23%
These megatrends will affect the demand for insurance fundamentally. Demand for life insurance and investment products such as retirement funding should increase. Along the way, insurers will need to build trust in insurance products and educate this new market segment to understand the need for risk cover and savings. Partnerships with mobile phone operators and affinity arrangements such as bancassurance could help speed up the distribution of insurance products to these new entrants.
Today’s young population is far more tech-savvy than the older generation. Africa’s youth is growing up with smartphone technology. Although today’s African insurance market is built on an intermediated distribution model, changes in technology and customer behaviour present opportunities for alternative, quicker distribution channels.

37PwC
Progressing into the rest of Africa
Shifts in global economic power
Infrastructure development
Doing business in Africa remains a challenge as its infrastructure lags behind the rest of the world. It is estimated that only 30% of the African population has access to electricity, compared to 80% worldwide. The economies of many African countries are disadvantaged and challenged by the quality and quantity of the electricity supply. PwC estimates that infrastructure investment will reach US$ 180 billion a year by 2025, citing scarce resources, a shift in global economic power to emerging markets and urbanisation as the main drivers.5
Numerous infrastructure development and investment projects are currently underway across the continent. Ethiopia is building Africa’s largest hydroelectric plant and Kenya is building the world’s largest single geothermal plant.6 The continued improvement of infrastructure will support additional demand for project insurance. Cover could be provided for performance bonds issued to small, medium and micro-enterprises (SMMEs) exporting capital goods and/or services. Insurers with strong balance sheets could make use of opportunities to underwrite project finance facilities against events of default, breach of contract, currency inconvertibility or transfer risk over both the medium and long term.
Insurers will, however, need to build appropriate risk models to be able to analyse the data of each
5 Trends, challenges and future outlook: Capital projects and infrastructure in East Africa, Southern Africa and West Africa, PwC 2014
6 “Power Africa: Annual Report July 2014”, USAID, http://www.usaid.gov/sites/default/files/documents/1860/USAID_PowerAfrica_AR_July2014.pdf
specific country separately and to underwrite appropriately. In Nigeria, for instance, there is an unusually high building collapse incidence rate. In the last 12 years an estimated 30 buildings have collapsed.
IndustrialisationFrom Britain in the 19th century to China in the late 20th century, sustained economic growth has been linked to industrialisation. Chinese investment in African manufacturing amounted to US$4.7 billion in 20107 and 23% of African CEOs surveyed by PwC see China as the most important country for growth prospects in Africa with an expected investment of up to US$1 trillion on the continent over the next decade.
According to the IMF, trade activity between African countries remains poor due to a high proportion of relatively small, landlocked countries. Many countries experience barriers to trade created by physical and human geography8. Africa’s terrain also varies widely from desert to rain forest, which challenges infrastructure, while sparse population densities also present difficulties. As infrastructure development continues, increased industrialisation will make countries more connected, fuelling trade between nations, which will generate demand for transportation insurance.
7 Minister of Commerce, People’s republic of China Press Conference on 17 February 2011
8 IMF, Connecting Africa and Asia – Harry Broadman

38 Insuring African growth
South Africa has been at the forefront of growth in intra-African trade, with investment since 2012 showing a 33% growth rate.9 South Africa’s intra-African investment is accounting for nearly 35% of all direct investment on the continent. This is followed by Kenya with 16% and Nigeria with 11.6%.10 The destination of this investment is also moving away from commodity industries, with nearly a third of all intra-African investment being channelled into financial services.11
Intra-African trade is also resulting in growing diversification of services, manufacturing and infrastructure-related activities. Investment is mainly being driven by high-profile local companies such as Shoprite, Standard Bank (partnering with Liberty through bancassurance), Coca-Cola and MTN (partnering with Old Mutual). South African companies are seeking new growth markets to compensate for lower GDP growth at home.
Such developments are further fuelling mass consumption and the emergence of Africa’s middle-class.
Using purchasing power parity to determine the relative value of different currencies, Africa is expected to grow by 30% over the next five years, compared to 10% in more developed regions12. This trend is likely to see increased spending on household goods, property and motor vehicles and the consequential demand for insurance.
9 Engineering news10 Financial times, the surge in Africa direct
investment (15 May 2014)11 The Economist, African economic growth: the
twilight of the resource curse?12 IHS Global Insight, September 2013
Climate change and resource scarcityNatural resources and commodity pricesNatural resources, especially oil, have for decades been the main source of economic growth in Africa. The continent holds one-third of global mineral reserves, one-tenth of global oil reserves and produces two-thirds of the world’s diamonds13. New discoveries continue to drive bursts of local activity.
In Kenya, for example, it is believed commercial quantities of oil will be produced within six to seven years14. The impact of natural resources on development is well illustrated by the oil and gas discoveries in Mozambique in 2012. The infrastructure required to commercialise these discoveries costs more than double the country’s total GDP. Nevertheless, investors have acted on the opportunity, providing the infrastructure finance necessary to fully exploit these resources and, as a consequence, an entire new city is being developed in the northern province of Cabo Delgado.
PwC’s recent Mine 2014: Realigning Expectation report highlighted the difficulties facing the mining industry. As a result of the global downturn in commodity prices, companies have been facing significant write downs and profit slumps. Such challenges have had a direct impact on African economies, particularly those most dependent on commodity exports as the backbone of their economies.
13 The Economist, African economic growth: The twilight of the resource curse?
14 Business Daily, Kenya to start oil production in six years says IMF (Published: 1 May 2013)

39PwC
Progressing into the rest of Africa
The sharp decline in oil prices is currently threatening the fragile economies of several African countries with Nigeria, Angola, Equatorial Guinea, Gabon, Sudan, Algeria, Libya and Egypt being most affected.15 It is expected that the fall in oil prices will have a 1% negative impact on the continent’s GDP growth in 2015. Growth of 4% is expected, the lowest since 1990.16
Because of the impact of oil price fluctuation, the IMF estimates that non-oil sectors such as construction and retail will have to drive economic growth, supported by high levels of public spending. Figure 6.5 illustrates the projected impact of oil and non-oil activity on GDP growth:
Figure 6.5 Non-oil activity is the main growth driver
Source: National authorities: and IMF staff calculations
Africa’s agriculture industry is beginning to change with African governments increasing their investments in the sector and with world food production needing to rise 40% over the next 30 years, Africa will be an important part of the solution .17 It is estimated that Africa has about 60% of the world’s uncultivated arable land. The continent has about 733 million hectares of arable land accounting for 27.4% of the world’s total.18 The continued industrialisation of agriculture will create greater opportunities for insurers to provide crop and agriculture cover to commercial farmers.
It is estimated that Africa’s current agricultural output of US$300 billion a year, will increase to US$500 billion by 2020 and to US$ 1 trillion by 2050. A recent study by John Deere estimates that almost 600 million hectares of cropland in Africa can be brought into cultivation in an environmentally sustainable way.
15 IPSNews, Falling oil prices threaten fragile African economies (23 December 2014)16 Capital Economist17 Deere, The changing landscape of Africa’s agriculture (3 March 2014)18 Phil Matibe, Africa – the worlds potential food producer (7 November 2011)
Overall GDP
20142013 2015 2016 2018 20192017
-4
-3
-2
-1
0
1
2
3
4
5
6
Oil GDP Non-oil GDP

40 Insuring African growth
Africa’s continued dependence on natural resources will present both opportunities and challenges for insurers and investors across the continent. The risk presented by the economic fragility of commodity exporting countries must be offset by the potential rewards of investment, either directly in helping to exploit new commodity discoveries or in developments aimed at catering to increased consumer demand resulting from the associated economic growth. An increase in economic diversity will begin to mitigate these risks, but this will remain a key consideration for investors and insurers.
Sustainability in insuranceWhile climate change, accelerating urbanisation, infrastructure development and its by-product of higher greenhouse gas emissions will increase the incidence and cost of natural disasters – profoundly affecting the industry – insurers will have to respond to these risks in a socially responsible manner in the way they conduct their business through:
• Helping current policyholders manage climate risk;
• Identifying new markets and opportunities for the sale of insurance products and services; and
• Rewarding low-carbon technologies and behaviours by policyholders.
Figure 6.6 Producing a more stable risk environment
Source: The Insurance Industry’s contribution to a resilient low carbon economy, PwC, ClimateWise and University of Cambridge Institute for Sustainability Leadership, 2014
Facilitated by Lead Author
The Insurance IndusTry’s conTrIbuTIon To a resIlIenTlow carbon economy
ClimateWise Independent Review 2014

41PwC
Progressing into the rest of Africa
On the risk management side, managing these types of risks will require insurers to be more sophisticated in their risk modelling and innovative in structuring risk-sharing and risk transfer deals.
As a result of initiatives to improve African weather forecasting technology, catastrophe modelling will become more sophisticated and use advanced, early-warning technologies to facilitate underwriting in specific, catastrophe-prone areas. Insurers that fail to keep pace with this increasing sophistication might be forced to exit markets or price incorrectly in certain coverage areas, such as those prone to flooding or forest fires.
Technological breakthroughs
The impact of technology on insuranceThe impact of the rise in the use of technology is being felt across Africa. Almost 70% of Africa’s population now have a mobile subscription19 with an estimated 800 million mobile phones in Africa, significant for a continent with 1 billion inhabitants.20 The International Telecommunication Union’s 2014 figures note that 20% of Africans were online by the end of 2014 – up 10% from 2010 and 396% from a decade ago.
Nigeria’s e-commerce market alone generates US$2 million worth of transactions per week. Online services traditionally delivered in a retail setting are also moving online. A recent article by the Harvard Business Review estimates more people have mobile banking
19 Measuring the Information Society Report 2014
20 Kenya Daily: Mobile subscriptions in Africa near the billion mark
accounts than traditional bank accounts in nine countries on the continent – more than double the number in 2012.21
Technology is set to be one of the strongest game changers across many sectors and not least affected will be the design of future insurance products. Technological breakthroughs in driverless cars, for example, will be changing the playing fields dramatically.
Technology will also have a significant impact in the future of insurance distribution. If one considers Africa’s young population, which generally tends to be less worried about retirement savings and life insurance products, this segment of the population has even less desire to meet with insurance agents to discuss complex insurance products. The insurer that can capture this technological shift is likely to win big in this demographic.
Insurance customers are becoming more and more open to the use telematics devices if they help to provide lower premiums and more tailored insurance solutions. Telematics can also provide a wealth of data to insurers on the risk that they underwrite in order to price appropriately.
Technology will also allow insurers to develop deeper and more meaningful relationships with their current and future policyholders. The future growth of insurers will in great part depend on their ability to customise previously generic insurance products and engage on a more personal level with policyholders and technology will take insurers far towards achieving this.
21 HBR, 19 September 2014 – Niti Bhan

42 Insuring African growth
Government policies, the legal and regulatory environment
In addition to the impact of the megatrends discussed above, political and legal factors will also have a significant impact on the insurance industry in Africa. Political risk is well recognised as a constraint on investment in many African countries,22 Sub-Saharan Africa continued to record the largest number of downgrades by ratings agencies in 2014, as economic and political risks have increased.
The picture is mixed across the region with improvements in Southern Africa being offset by weaknesses in parts of West Africa23. Research shows an inverse relationship between political stability and foreign direct investment (FDI) and with improvements in stability, FDIs into Africa increased by 5% to US$50 billion over the past 15 years24.
The perceived difficulty of doing business in Africa is a key challenge that the continent must overcome in order to encourage greater levels of investment. In the latest World Bank Ease of Doing Business rankings released in 2014, 40 of the 60 lowest ranked countries are African, while only four (Mauritius, South Africa, Rwanda and Tunisia) rank within the 60 highest ranked countries. However, the report also noted that countries in sub-Saharan Africa has done more to improve regulation than any other region25.
22 World Investment and Political Risk Report 2013 – World Bank Group
23 Aon political risk map 201524 Standard Bank, Africa remains a bright spot
on global investment landscape (published: 24 June 2014)
25 The Economist, African Economic Growth: The twilight of the resource curse.
CEOs interviewed for PwC’s Africa business agenda 2014 noted the following key challenges facing Africa:
• Building hard infrastructure such as transport, energy and telecoms (especially high-speed internet);
• Building soft infrastructure like education and financial systems;
• Making the business environment more investor-friendly, including through lower tax pressure, higher administrative efficiency and reduced policy uncertainty;
• Improving transparency at all levels;
• Facilitating pan-African operations, including international trade and workforce mobility;
• Providing the required regulation to enable a fair and competitive environment; and
• Reducing complexity, as there is no such thing as one Africa, but numerous market niches.
Despite the improvements in government policy and legal structures, many countries remain difficult environments in which to invest, as demonstrated by the regions’ poor overall position in the World Bank’s Ease of Doing Business Rankings. Many countries also have economic empowerment, indigenisation, local content or partnership conditions for foreign direct investment. These rules may be very restrictive, as in Zimbabwe, or simply complex to navigate, such as in South Africa. These conditions make partnering with existing local partners an important consideration for insurers.

43PwC
Progressing into the rest of AfricaProgress into the rest of Africa
The sophistication of financial services regulations is currently not as developed elsewhere in Africa. However, we are seeing signs of enhanced regulation being considered and implemented. Insurers can use the experience and resources they have developed as part of their SAM and TCF preparation to increase their attractiveness to local insurance players within regions that are considering similar regulatory avenues.

Insurance 2025, and beyond: This time its personal
44 Insuring African growth
It’s 2025 and 18-year-old Themba is about to leave rural Transkei in the Eastern Cape province of South Africa to further his studies in the University of Excellence (UoE). Themba has done extremely well in his matric final examination in 2024 and is excited about his first days at university and his life in a big city.
Themba is armed with the latest TechTab I-Me Pro version 8.4 (TechTab - a revolutionary wearable device) which he received from Insurance Limited after signing up for a new student bank account with Bank Limited. Insurance Limited is a subsidiary of Bank Limited.
In recognition of Themba’s excellent marks and his studies towards scarce skills, Insurance Limited has agreed to offer Themba free funeral cover of up to R5 000 for the duration of his studies. Insurance Limited cares about Themba’s well-being and through the Wellsurance app on his TechTab, Themba receives regular helpful hints and tips to assist him in keeping healthy and active while pursuing his studies.
After completing his postgraduate degree at the end of 2029, Themba’s insurance status with Insurance Limited is already at level 4 (out of 10 levels) due to his continued dedication to his studies and healthy lifestyle. Themba receives his university academic results at the end of each semester through his Wellsurance app and earns a 0.5 increase in his level as he maintains above-average results and appropriate fitness targets. Insurance Limited is linked to Themba’s results through the Wellsurance app.
Themba decides to move to Lagos in Nigeria where he works for a multinational engineering firm that has operations throughout Africa and Europe. Themba is financially ready for the big city after regularly attending the annual Insurance Limited financial literacy breakfast held at his university. He buys his first new car through his BankIt app (from Bank Limited) and receives a loyalty 40% discount on his car insurance premium from Insurance Limited. Bank Limited recognises that Themba is a low-risk credit customer based on his high Insurance Limited status and offers him preferential rates on his home and car finance.
Themba has not forgotten about his parents, who still reside in the rural Transkei. Nor has Insurance Limited, which sends him a message on his new TechTab I-Me Pro version 9.0 offering him funeral cover for his loving parents for as little as R120. This premium is based on information gathered when Themba opened his student bank account with Bank Limited and the monthly transfers he makes to his parent’s joint account. After a few enquiries, Themba accepts the offer together with life cover for himself, which he gets at 15% discount due to his now level-5 status.
Themba cannot imagine his financial life without his TechTab. Through his Wellsurance app and BankIt app (from Bank Limited), he tracks his current spending patterns against his tailor-made projected retirement savings plan provided by Insurance Limited. He does his retirement investment switches through his retirement app and also updates his beneficiaries and other policy information via the app.

Themba’s first baby boy was born in 2033 and after the registration of the birth on the Home Affairs system, Themba is very happy to receive insurance quotes via his TechTab for the baby’s life cover, medical aid and education savings account within three hours of the Home Affairs registration. He trusts Insurance Limited to keep up with his financial needs and appreciates that all quotes he receives are already comparable with market rates and he is confident that he gets the best deals.
Themba has developed a network of friends that are also connected to the Wellsurance app and they regularly share experiences and recommendations on product enhancements on the Insurance Limited’s social network page. On the social page, his friends can see pictures of the Disney World trip that Themba won after tweeting the product enhancement tip of the year.
Themba is always kept up to date with the latest product offerings from Insurance Limited by the interactive catalogues and wealth protection updates he receives on his social media account, which is linked to that of Insurance Limited. Insurance Limited also sends him regular FAQ messages where he can see the top three frequently asked questions and even complaints on his existing products with Insurance Limited and actions taken by the company to address them. The DashApp reminds him of his upcoming events such as policy renewal dates, projected costs for the education for his 12-month-old baby (from 2034) and progress of savings towards those costs, including university costs and policy maturity dates.
Through FinAdvise app, it takes minutes to chat to a financial advisor and he can make appointments via the app too. Bank Limited recognises Themba’s status with Insurance Limited and from their data recognises that Themba is a low risk credit customer and offers him preferential rates on his home and car finance.
Various app messages are received offering Themba financial tips on how to get the best value for money in his home and car purchases. Upon approval of his finance application, Themba receives an insurance quote for his new home and car based on his now Level-6 status with Insurance Limited. He compares it with his friends’ and colleagues’ premiums on social media. Insurance Limited recognises this and offers to match the best quote.
While paying for his appliances and furniture, he receives an insurance quote from Insurance Limited at the till based on the cost of his goods purchased.
Themba’s parents visit him in his new home after being flown in at 30% discount on their air tickets he purchased using his Bank Limited credit card. While travelling back, however, his parents are tragically killed in a car accident. Themba through his Home Affairs Department app is issued with the death certificates. In his grief Themba is somewhat relieved when he receives a notification on his banking app that Insurance Limited has settled the funeral policy payout 24 hours later, without him even having to submit a claim.
Themba fondly remembers all the old stories that his father used to tell him. He recalls his Dad complaining about how time-consuming an insurance claims process was in the old days and how far the insurance world has progressed.

46 Insuring African growth
Key industry statisticsLong-term insurers
R millions Discovery Liberty MMI Old Mutual (Emerging Markets) Sanlam Combined
2014 2013 2012 2014 2013 2012 2014 2013 2012 2014 2013 2012 2014 2013 2012 2014 2013
Group consolidated IFRS earnings
Total comprehensive income attributable to equity holders 5 157 3 161 2 681 3 917 3 908 3 699 2 874 3 021 3 069 7 059 5 119 3 773 9 393 9 030 5 760 28 400 24 239
Equity attributable to equity holders of parent 20 599 16 332 13 706 19 487 17 654 15 410 24 023 24 191 23 066 34 722 28 829 25 709 46 037 40 965 36 556 144 868 127 971
Return on average equity 27.9% 21.0% 39.1% 21.1% 23.6% 26.4% 11.9% 12.8% 14.0% 22.2% 18.8% 14.3% 21.6% 23.3% 16.4% 20.8% 20.8%
Group consolidated embedded value
Group embedded value 45 454 39 782 33 413 40 024 36 067 32 740 39 753 37 388 33 453 55 944 51 472 45 386 95 936 84 409 75 352 277 111 249 118
Group embedded value profit/(losses) 6 551 6 145 5 667 6 031 5 281 5 886 5 472 5 971 5 493 5 790 8 463 7 585 15 583 13 347 14 310 39 427 39 207
Return on group embedded value 16.5% 18.4% 19.9% 16.7% 16.1% 20.8% 14.6% 17.8% 17.8% 11.2% 18.6% 19.1% 18.5% 17.7% 22.5% 15.8% 17.8%
Embedded value of South African new business
Present value of new business premiums (PVNBP) 20 167 16 426 14 040 44 916 37 753 33 510 42 957 37 708 32 646 51 664 46 292 40 661 46 743 34 471 31 371 206 447 172 650
Embedded value of new business (VNB) 1 260 1 028 904 914 806 660 775 691 601 1 702 1 746 1 590 1 282 1 047 997 5 933 5 318
Value of new business margin 6.2% 6.3% 6.4% 2.0% 2.1% 2.0% 1.8% 1.8% 1.8% 3.3% 3.8% 3.9% 2.7% 3.0% 3.2% 2.9% 3.1%
Average payback period (years) 8.6 8.1 7.7 5.9 5.6 5.5 7.7 7.3 7.3 6.7 6.9 6.7 5.3 4.9 5.4 6.4 6.3
Embedded value of Rest of African new business
Embedded value of new business (VNB) N/A N/A N/A 27 33 31 46 58 49 246 320 139 280 234 165 599 645
Value of new business margin N/A N/A N/A 6.5% 9.1% 10.0% 2.4% 3.4% 3.3% 5.5% 7.3% 6.5% 7.4% 7.4% 5.6% 5.7% 6.7%
Present value of new business premiums (PVNBP) N/A N/A N/A 413 363 310 1 898 1 704 1 499 4 463 4 365 2 138 3 797 3 172 2 947 10 571 9 604
Cost management
Acquisition costs 2 139 1 979 1 796 4 109 3 754 3 397 4 088 2 803 2 554 4 157 3 681 2 979 2 424 2 265 2 102 16 917 14 482
General marketing and administration expenses 1 827 1 540 1 499 5 565 5 377 4 897 5 299 4 080 3 603 17 898 16 456 13 869 4 561 4 268 3 980 35 150 31 721
Annualised premium equivalent (APE) 2 337 2 035 1 831 7 570 6 789 5 917 5 606 4 962 4 474 7 731 6 709 6 066 8 842 6 984 5 786 32 086 27 479
Investment performance
Invested assets 48 787 38 512 28 323 365 116 339 308 297 835 404 278 361 379 315 334 594 828 546 274 479 485 542 519 486 170 412 703 1 955 528 1 771 643
Investments 44 129 35 888 26 600 351 131 329 438 287 417 378 269 339 514 294 001 576 396 534 038 466 748 526 260 467 770 396 144 1 876 185 1 706 648
Cash and cash equivalents 4 658 2 624 1 723 13 985 9 870 10 418 26 009 21 865 21 333 18 432 12 236 12 737 16 259 18 400 16 559 79 343 64 995
Income on invested assets 3 492 3 424 2 632 35 070 46 774 44 714 37 471 49 941 43 006 59 346 77 116 67 171 51 382 67 038 57 825 186 761 244 293
Return on average invested assets 8.0% 10.2% 11.0% 10.0% 14.7% 16.3% 9.8% 14.8% 14.7% 10.4% 15.0% 15.1% 10.0% 14.9% 14.9% 10.0% 14.9%
Capital and solvency
Capital adequacy requirement cover 3.5 3.9 3.9 3.1 2.6 2.7 2.7 2.6 2.4 3.1 3.3 4.0 4.5 4.5 4.3

47PwC
7Long-term insurers
R millions Discovery Liberty MMI Old Mutual (Emerging Markets) Sanlam Combined
2014 2013 2012 2014 2013 2012 2014 2013 2012 2014 2013 2012 2014 2013 2012 2014 2013
Group consolidated IFRS earnings
Total comprehensive income attributable to equity holders 5 157 3 161 2 681 3 917 3 908 3 699 2 874 3 021 3 069 7 059 5 119 3 773 9 393 9 030 5 760 28 400 24 239
Equity attributable to equity holders of parent 20 599 16 332 13 706 19 487 17 654 15 410 24 023 24 191 23 066 34 722 28 829 25 709 46 037 40 965 36 556 144 868 127 971
Return on average equity 27.9% 21.0% 39.1% 21.1% 23.6% 26.4% 11.9% 12.8% 14.0% 22.2% 18.8% 14.3% 21.6% 23.3% 16.4% 20.8% 20.8%
Group consolidated embedded value
Group embedded value 45 454 39 782 33 413 40 024 36 067 32 740 39 753 37 388 33 453 55 944 51 472 45 386 95 936 84 409 75 352 277 111 249 118
Group embedded value profit/(losses) 6 551 6 145 5 667 6 031 5 281 5 886 5 472 5 971 5 493 5 790 8 463 7 585 15 583 13 347 14 310 39 427 39 207
Return on group embedded value 16.5% 18.4% 19.9% 16.7% 16.1% 20.8% 14.6% 17.8% 17.8% 11.2% 18.6% 19.1% 18.5% 17.7% 22.5% 15.8% 17.8%
Embedded value of South African new business
Present value of new business premiums (PVNBP) 20 167 16 426 14 040 44 916 37 753 33 510 42 957 37 708 32 646 51 664 46 292 40 661 46 743 34 471 31 371 206 447 172 650
Embedded value of new business (VNB) 1 260 1 028 904 914 806 660 775 691 601 1 702 1 746 1 590 1 282 1 047 997 5 933 5 318
Value of new business margin 6.2% 6.3% 6.4% 2.0% 2.1% 2.0% 1.8% 1.8% 1.8% 3.3% 3.8% 3.9% 2.7% 3.0% 3.2% 2.9% 3.1%
Average payback period (years) 8.6 8.1 7.7 5.9 5.6 5.5 7.7 7.3 7.3 6.7 6.9 6.7 5.3 4.9 5.4 6.4 6.3
Embedded value of Rest of African new business
Embedded value of new business (VNB) N/A N/A N/A 27 33 31 46 58 49 246 320 139 280 234 165 599 645
Value of new business margin N/A N/A N/A 6.5% 9.1% 10.0% 2.4% 3.4% 3.3% 5.5% 7.3% 6.5% 7.4% 7.4% 5.6% 5.7% 6.7%
Present value of new business premiums (PVNBP) N/A N/A N/A 413 363 310 1 898 1 704 1 499 4 463 4 365 2 138 3 797 3 172 2 947 10 571 9 604
Cost management
Acquisition costs 2 139 1 979 1 796 4 109 3 754 3 397 4 088 2 803 2 554 4 157 3 681 2 979 2 424 2 265 2 102 16 917 14 482
General marketing and administration expenses 1 827 1 540 1 499 5 565 5 377 4 897 5 299 4 080 3 603 17 898 16 456 13 869 4 561 4 268 3 980 35 150 31 721
Annualised premium equivalent (APE) 2 337 2 035 1 831 7 570 6 789 5 917 5 606 4 962 4 474 7 731 6 709 6 066 8 842 6 984 5 786 32 086 27 479
Investment performance
Invested assets 48 787 38 512 28 323 365 116 339 308 297 835 404 278 361 379 315 334 594 828 546 274 479 485 542 519 486 170 412 703 1 955 528 1 771 643
Investments 44 129 35 888 26 600 351 131 329 438 287 417 378 269 339 514 294 001 576 396 534 038 466 748 526 260 467 770 396 144 1 876 185 1 706 648
Cash and cash equivalents 4 658 2 624 1 723 13 985 9 870 10 418 26 009 21 865 21 333 18 432 12 236 12 737 16 259 18 400 16 559 79 343 64 995
Income on invested assets 3 492 3 424 2 632 35 070 46 774 44 714 37 471 49 941 43 006 59 346 77 116 67 171 51 382 67 038 57 825 186 761 244 293
Return on average invested assets 8.0% 10.2% 11.0% 10.0% 14.7% 16.3% 9.8% 14.8% 14.7% 10.4% 15.0% 15.1% 10.0% 14.9% 14.9% 10.0% 14.9%
Capital and solvency
Capital adequacy requirement cover 3.5 3.9 3.9 3.1 2.6 2.7 2.7 2.6 2.4 3.1 3.3 4.0 4.5 4.5 4.3
Key industry statistics

48 Insuring African growth
Short-term insurers
R millions M&F OUTsurance Santam Zurich Combined
2014 2013 2012 2014 2013 2012 2014 2013 2012 2014 2013 2012 2014 2013
Revenue
Gross written premiums 12 189 11 315 9 706 11 587 9 252 7 628 22 710 20 631 19 386 3 698 4 085 3 767 50 183 45 282
Movement in unearned premium liability N/A -383 -339 -858 -677 -451 -532 -334 -323 85 -63 7 -1 305 -1 456
Outward reinsurance N/A -2 265 -1 991 -379 -289 -183 -5 075 -3 731 -3 564 -724 -856 -828 -6 178 -7 141
Movement in reinsurance unearned premiums - - - - - - 119 185 127 -3 65 -11 116 250
Net earned premiums 9 457 8 667 7 377 10 350 8 286 6 994 17 222 16 751 15 626 3 056 3 230 2 934 40 085 36 935
Fee and commission income N/A 378 338 - - - 1 119 600 516 100 132 146 1 219 1 110
Expenses
Claims and benefits -6 499 -8 396 -6 310 -5 707 -4 611 -3 719 -14 315 -13 807 -12 167 -2 636 -2 941 -2 928 -29 157 -29 755
Reinsurance recoveries N/A 1 842 950 296 318 187 3 437 2 200 1 488 378 388 725 4 111 4 748
Acquisition costs -1 526 -1 706 -1 470 -30 -20 -69 -2 983 -2 721 -2 540 -652 -692 -586 -5 192 -5 139
Operating and administrative expenses -1 294 -1 163 -1 067 -3 065 -1 829 -2 037 -3 050 -2 562 -2 349 -618 -662 -608 -8 027 -6 215
Key ratios
Claims ratio 68.7% 75.6% 72.7% 52.3% 51.8% 50.5% 63.2% 69.3% 68.3% 73.9% 79.0% 75.1% 62.5% 67.7%
Acquisition cost ratio 16.1% 15.3% 15.3% 0.3% 0.2% 1.0% 10.8% 12.7% 13.0% 18.1% 17.3% 15.0% 9.9% 10.9%
Expense ratio 13.7% 13.4% 14.5% 29.6% 22.1% 29.1% 17.7% 15.3% 15.0% 20.2% 20.5% 20.7% 20.0% 16.8%
Combined ratio 98.5% 104.4% 102.5% 82.2% 74.1% 80.6% 91.7% 97.2% 96.3% 112.2% 116.9% 110.8% 92.4% 95.4%
Underwriting margin 1.5% -4.4% -2.5% 17.8% 25.9% 19.4% 8.3% 2.8% 3.7% -12.2% -16.9% -10.8% 7.6% 4.6%
Investment performance
Invested assets N/A N/A N/A 7 496 6 060 5 256 16 186 15 085 13 902 2 916 3 057 2 876 26 597 24 201
Investments N/A N/A N/A 3 838 3 692 3 553 13 625 12 742 11 431 2 374 2 363 2 264 19 837 18 798
Cash and cash equivalents N/A N/A N/A 3 657 2 368 1 703 2 561 2 343 2 471 542 693 612 6 760 5 404
Income on invested assets N/A N/A N/A 310 342 325 1 093 1 231 1 339 276 359 364 1 679 1 932
Return on average invested assets N/A N/A N/A 4.6% 6.0% 6.1% 7.0% 8.5% 9.8% 9.2% 12.1% 12.1% 6.6% 8.4%
International solvency margin
Equity attributable to equity holders of parent 3 406 3 190 3 594 4 471 3 853 3 527 7 010 6 132 5 509 1 793 1 869 2 020 16 679 15 044
Total comprehensive income attributable to equity holders
N/A 166 65 1 544 1 338 1 510 1 587 1 263 1 050 -53 -105 41 3 078 2 662
Return on average equity N/A -4.9% 1.8% 37.1% 36.3% 43.0% 24.2% 21.7% 18.0% -2.9% -5.4% 2.0% 24.5% 15.7%
International solvency margin 36% 35% 47% 40% 43% 47% 45% 42% 41% 60% 58% 69% 42% 40%

49PwC
Short-term insurers
R millions M&F OUTsurance Santam Zurich Combined
2014 2013 2012 2014 2013 2012 2014 2013 2012 2014 2013 2012 2014 2013
Revenue
Gross written premiums 12 189 11 315 9 706 11 587 9 252 7 628 22 710 20 631 19 386 3 698 4 085 3 767 50 183 45 282
Movement in unearned premium liability N/A -383 -339 -858 -677 -451 -532 -334 -323 85 -63 7 -1 305 -1 456
Outward reinsurance N/A -2 265 -1 991 -379 -289 -183 -5 075 -3 731 -3 564 -724 -856 -828 -6 178 -7 141
Movement in reinsurance unearned premiums - - - - - - 119 185 127 -3 65 -11 116 250
Net earned premiums 9 457 8 667 7 377 10 350 8 286 6 994 17 222 16 751 15 626 3 056 3 230 2 934 40 085 36 935
Fee and commission income N/A 378 338 - - - 1 119 600 516 100 132 146 1 219 1 110
Expenses
Claims and benefits -6 499 -8 396 -6 310 -5 707 -4 611 -3 719 -14 315 -13 807 -12 167 -2 636 -2 941 -2 928 -29 157 -29 755
Reinsurance recoveries N/A 1 842 950 296 318 187 3 437 2 200 1 488 378 388 725 4 111 4 748
Acquisition costs -1 526 -1 706 -1 470 -30 -20 -69 -2 983 -2 721 -2 540 -652 -692 -586 -5 192 -5 139
Operating and administrative expenses -1 294 -1 163 -1 067 -3 065 -1 829 -2 037 -3 050 -2 562 -2 349 -618 -662 -608 -8 027 -6 215
Key ratios
Claims ratio 68.7% 75.6% 72.7% 52.3% 51.8% 50.5% 63.2% 69.3% 68.3% 73.9% 79.0% 75.1% 62.5% 67.7%
Acquisition cost ratio 16.1% 15.3% 15.3% 0.3% 0.2% 1.0% 10.8% 12.7% 13.0% 18.1% 17.3% 15.0% 9.9% 10.9%
Expense ratio 13.7% 13.4% 14.5% 29.6% 22.1% 29.1% 17.7% 15.3% 15.0% 20.2% 20.5% 20.7% 20.0% 16.8%
Combined ratio 98.5% 104.4% 102.5% 82.2% 74.1% 80.6% 91.7% 97.2% 96.3% 112.2% 116.9% 110.8% 92.4% 95.4%
Underwriting margin 1.5% -4.4% -2.5% 17.8% 25.9% 19.4% 8.3% 2.8% 3.7% -12.2% -16.9% -10.8% 7.6% 4.6%
Investment performance
Invested assets N/A N/A N/A 7 496 6 060 5 256 16 186 15 085 13 902 2 916 3 057 2 876 26 597 24 201
Investments N/A N/A N/A 3 838 3 692 3 553 13 625 12 742 11 431 2 374 2 363 2 264 19 837 18 798
Cash and cash equivalents N/A N/A N/A 3 657 2 368 1 703 2 561 2 343 2 471 542 693 612 6 760 5 404
Income on invested assets N/A N/A N/A 310 342 325 1 093 1 231 1 339 276 359 364 1 679 1 932
Return on average invested assets N/A N/A N/A 4.6% 6.0% 6.1% 7.0% 8.5% 9.8% 9.2% 12.1% 12.1% 6.6% 8.4%
International solvency margin
Equity attributable to equity holders of parent 3 406 3 190 3 594 4 471 3 853 3 527 7 010 6 132 5 509 1 793 1 869 2 020 16 679 15 044
Total comprehensive income attributable to equity holders
N/A 166 65 1 544 1 338 1 510 1 587 1 263 1 050 -53 -105 41 3 078 2 662
Return on average equity N/A -4.9% 1.8% 37.1% 36.3% 43.0% 24.2% 21.7% 18.0% -2.9% -5.4% 2.0% 24.5% 15.7%
International solvency margin 36% 35% 47% 40% 43% 47% 45% 42% 41% 60% 58% 69% 42% 40%
Key industry statistics

50 Insuring African growth
Basis of information provided

51PwC
8The aim of this publication is to consider the results of the South African insurance businesses of the companies listed in Section 7 for the calendar year ended 31 December 2014. Where companies have 30 June year ends, the financial information has been reconstituted to reflect the calendar year ended 31 December where possible.
The embedded value information for Discovery represents the Discovery Life and Invest segments and excludes the Health, Vitality, PruHealth and PruProtect segments, which do not represent South African life insurance operations.
Old Mutual changed its segments in 2014. The Emerging Market segment, which primarily included Old Mutual South Africa, but also developing markets in the rest of Africa, Asia and Latin America (for which separate information is not available), now also includes M&F.
Information for Old Mutual and M&F were separated where possible. However, group IFRS earnings and investment performance provides a combined view for Emerging Markets and cannot be separated due to insufficient information being available. The embedded value new business information included in this publication relates to South African business only.
Old Mutual is the only company in this publication that follows the Market Consistent Embedded Value (MCEV) principles as published by the European CFO Forum. The other companies apply the principles set out in APN107 as published by the Actuarial Society of South Africa.
Other pertinent matters to note regarding the information presented:
• Return on average equity has been calculated as total comprehensive income attributable to the equity holders of the parent divided by the average shareholders’ equity (opening equity plus closing equity divide by two).
• The return on average invested assets has been calculated from the information provided by the insurers as income on invested assets divided by the average total invested assets (opening invested assets plus closing invested assets divide by two).
• The return on embedded value is calculated as embedded value earnings divided by the opening embedded value.
• Where companies have classified some of their financial assets as ‘available for sale financial assets’, the fair value gains and losses recognised in ‘other comprehensive income’ have been reclassified in the income statement for companies to be comparable with their peers.
• The international solvency margin has been calculated from the information provided by the short-term insurers as follows: shareholders’ equity divided by gross written premium net of reinsurance. The only exception is Santam, which includes long-term debt as part of share capital for the purposes of this calculation.

52 Insuring African growth
9Contacts
Dewald van den BergInsurance Technical DirectorPwC South Africa+27 11 797 [email protected]
Victor MugutoLong-term Insurance LeaderPwC South Africa+27 11 797 [email protected]
Tom WinterboerFinancial Services LeaderPwC Southern Africa and PwC Africa+27 11 797 [email protected]
Contributors
• Simphiwe Johnson Financial Services Manager
• Marco Minie Financial Services Manager
• Lindsey Ransom Financial Services Assistant Manager
Louis le GrangeFinancial Services Tax DirectorPwC South Africa+27 11 797 4263
Renasha GovenderActuarial, Risk and Quants DirectorPwC South Africa+27 11 797 5479
Tinashe MashokoActuarial, Risk and Quants Associate DirectorPwC South Africa+27 11 797 0983
Other key contacts


The information contained in this publication is provided for general information purposes only, and does not constitute the provision of legal or professional advice in any way. Before making any decision or taking any action, a professional adviser should be consulted. No responsibility for loss to any person acting or refraining from action as a result of any material in this publication can be accepted by the author, copyright owner or publisher.
© 2015 PricewaterhouseCoopers (“PwC”), a South African firm, PwC is part of the PricewaterhouseCoopers International Limited (“PwCIL”) network that consists of separate and independent legal entities that do not act as agents of PwCIL or any other member firm, nor is PwCIL or the separate firms responsible or liable for the acts or omissions of each other in any way. No portion of this document may be reproduced by any process without the written permission of PwC. (15-16605)